During AWS re:Invent 2023, we announced the general availability of Knowledge Bases for Amazon Bedrock. With a knowledge base, you can securely connect foundation models (FMs) in Amazon Bedrock to your company data for Retrieval Augmented Generation (RAG).
In my previous post, I described how Knowledge Bases for Amazon Bedrock manages the end-to-end RAG workflow for you. You specify the location of your data, select an embedding model to convert the data into vector embeddings, and have Amazon Bedrock create a vector store in your AWS account to store the vector data, as shown in the following figure. You can also customize the RAG workflow, for example, by specifying your own custom vector store.
Additional choice for embedding model The embedding model converts your data, such as documents, into vector embeddings. Vector embeddings are numeric representations of text data within your documents. Each embedding aims to capture the semantic or contextual meaning of the data.
Additional choice for vector stores Each vector embedding is put into a vector store, often with additional metadata such as a reference to the original content the embedding was created from. The vector store indexes the stored vector embeddings, which enables quick retrieval of relevant data.
Knowledge Bases gives you a fully managed RAG experience that includes creating a vector store in your account to store the vector data. You can also select a custom vector store from the list of supported options and provide the vector database index name as well as index field and metadata field mappings.
We have made three recent updates to vector stores that I want to highlight: The addition of Amazon Aurora PostgreSQL-Compatible and Pinecone serverless to the list of supported custom vector stores, as well as an update to the existing Amazon OpenSearch Serverless integration that helps to reduce cost for development and testing workloads.
Amazon Aurora PostgreSQL – In addition to vector engine for Amazon OpenSearch Serverless, Pinecone, and Redis Enterprise Cloud, you can now also choose Amazon Aurora PostgreSQL as your vector database for Knowledge Bases.
Aurora is a relational database service that is fully compatible with MySQL and PostgreSQL. This allows existing applications and tools to run without the need for modification. Aurora PostgreSQL supports the open source pgvector extension, which allows it to store, index, and query vector embeddings.
Many of Aurora’s features for general database workloads also apply to vector embedding workloads:
Aurora offers up to 3x the database throughput when compared to open source PostgreSQL, extending to vector operations in Amazon Bedrock.
Aurora Serverless v2 provides elastic scaling of storage and compute capacity based on real-time query load from Amazon Bedrock, ensuring optimal provisioning.
Aurora global database provides low-latency global reads and disaster recovery across multiple AWS Regions.
Blue/green deployments replicate the production database in a synchronized staging environment, allowing modifications without affecting the production environment.
Aurora Optimized Reads on Amazon EC2 R6gd and R6id instances use local storage to enhance read performance and throughput for complex queries and index rebuild operations. With vector workloads that don’t fit into memory, Aurora Optimized Reads can offer up to 9x better query performance over Aurora instances of the same size.
Aurora seamlessly integrates with AWS services such as Secrets Manager, IAM, and RDS Data API, enabling secure connections from Amazon Bedrock to the database and supporting vector operations using SQL.
Pinecone serverless – Pinecone recently introduced Pinecone serverless. If you choose Pinecone as a custom vector store in Knowledge Bases, you can provide either Pinecone or Pinecone serverless configuration details. Both options are supported.
Reduce cost for development and testing workloads in Amazon OpenSearch Serverless When you choose the option to quickly create a new vector store, Amazon Bedrock creates a vector index in Amazon OpenSearch Serverless in your account, removing the need to manage anything yourself.
Since becoming generally available in November, vector engine for Amazon OpenSearch Serverless gives you the choice to disable redundant replicas for development and testing workloads, reducing cost. You can start with just two OpenSearch Compute Units (OCUs), one for indexing and one for search, cutting the costs in half compared to using redundant replicas. Additionally, fractional OCU billing further lowers costs, starting with 0.5 OCUs and scaling up as needed. For development and testing workloads, a minimum of 1 OCU (split between indexing and search) is now sufficient, reducing cost by up to 75 percent compared to the 4 OCUs required for production workloads.
Usability improvement – Redundant replicas disabled is now the default selection when you choose the quick-create workflow in Knowledge Bases for Amazon Bedrock. Optionally, you can create a collection with redundant replicas by selecting Update to production workload.
For more details on vector engine for Amazon OpenSearch Serverless, check out Channy’s post.
Additional choice for FM At runtime, the RAG workflow starts with a user query. Using the embedding model, you create a vector embedding representation of the user’s input prompt. This embedding is then used to query the database for similar vector embeddings to retrieve the most relevant text as the query result. The query result is then added to the original prompt, and the augmented prompt is passed to the FM. The model uses the additional context in the prompt to generate the completion, as shown in the following figure.
Anthropic Claude 2.1 – In addition to Anthropic Claude Instant 1.2 and Claude 2, you can now choose Claude 2.1 for Knowledge Bases. Compared to previous Claude models, Claude 2.1 doubles the supported context window size to 200 K tokens.
Check out the Anthropic Blog to learn more about Claude 2.1.
Now available Knowledge Bases for Amazon Bedrock, including the additional choice in embedding models, vector stores, and FMs, is available in the AWS Regions US East (N. Virginia) and US West (Oregon).
Gupshup is a leading conversational messaging platform, powering over 10 billion messages per month. Across verticals, thousands of large and small businesses in emerging markets use Gupshup to build conversational experiences across marketing, sales, and support. Gupshup’s carrier-grade platform provides a single messaging API for 30+ channels, a rich conversational experience-building tool kit for any use case, and a network of emerging market partnerships across messaging channels, device manufacturers, ISVs, and operators.
Objective
Gupshup wanted to build a messaging analytics platform that provided:
Build a platform to get detailed insights, data, and reports about WhatsApp/SMS campaigns and track the success of every text message sent by the end customers.
Easily gain insight into trends, delivery rates, and speed.
Save time and eliminate unnecessary processes.
About Redshift and some relevant features for the use case
Amazon Redshift is a fully managed, petabyte-scale, massively parallel data warehouse that offers simple operations and high performance. It makes it fast, simple, and cost-effective to analyze all your data using standard SQL and your existing business intelligence (BI) tools. Amazon Redshift extends beyond traditional data warehousing workloads, by integrating with the AWS cloud with features such as querying the data lake with Spectrum, semistructured data ingestion and querying with PartiQL, streaming ingestion from Amazon Kinesis and Amazon MSK, Redshift ML, federated queries to Amazon Aurora and Amazon RDS operational databases, and federated materialized views.
In this use case, Gupshup is heavily relying on Amazon Redshift as their data warehouse to process billions of streaming events every month, performing intricate data-pipeline-like operations on such data and incrementally maintaining a hierarchy of aggregations on top of raw data. They have been enjoying the flexibility and convenience that Amazon Redshift has brought to their business. By leveraging the Amazon Redshift materialized views, Gupshup has been able to dramatically improve query performance on recurring and predictable workloads, such as dashboard queries from Business Intelligence (BI) tools. Additionally, extract, load, and transform (ELT) data processing is sped up and made easier. To store commonly used pre-computations and seamlessly utilize them to reduce latency on ensuing analytical queries, Redshift materialized views feature incremental refresh capability which enables Gupshup to be more agile while using less code. Without writing complicated code for incremental updates, they were able to deliver data latency of roughly 15 minutes for some use cases.
Overall architecture and implementation details with Redshift Materialized views
Gupshup uses a CDC mechanism to extract data from their source systems and persist it in S3 in order to meet these needs. A series of materialized view refreshes are used to calculate metrics, after which the incremental data from S3 is loaded into Redshift. This compiled data is then imported into Aurora PostgreSQL Serverless for operational reporting. The ability of Redshift to incrementally refresh materialized views, enabling it to process massive amounts of data progressively, the capacity for scaling, which utilizes concurrency and elastic resizing for vertical scaling, as well as the RA3 architecture, delivers the separation of storage and compute to scale one without worrying about the other, led Gupshup to make this choice. Gupshup chose Aurora PostgreSQL as the operational reporting layer due to its anticipated increase in concurrency and cost-effectiveness for queries that retrieve only precalculated metrics.
Incremental analytics is the main reason for Gupshup to use Redshift. The diagram shows a simplified version of a typical data processing pipeline where data comes via multiple streams. The streams need to be joined together, then enriched by joining with master data tables. This is followed by series of joins and aggregations. All this needs to be performed in incremental manner, providing 30 minutes of latency.
Gupshup uses Redshift’s incremental materialized view feature to accomplish this. All of the join, enrich, and aggregation statements are written using sql statements. The stream-to-stream joins are performed by ingesting both streams in a table sorted by the key fields. Then an incremental MV aggregates data by the key fields. Redshift then automatically takes care of keeping the MVs refreshed incrementally with incoming data. The incremental view maintenance feature works even for hierarchical aggregations with MVs based on other MVs. This allows Gupshup to build an entire processing pipeline incrementally. It has actually helped Gupshup reduce cycle time during the POC and prototyping phases. Moreover, no separate effort is required to process historical data versus live streaming data.
Apart from incremental analytics, Redshift simplifies a lot of operational aspects. E.g., use the snapshot-restore feature to quickly create a green experimental cluster from an existing blue serving cluster. In case the processing logic changes (which happens quite often in prototyping stages), they need to reprocess all historical data. Gupshup uses Redshift’s elastic scaling feature to temporarily scale the cluster up and then scale it down when done. They also use Redshift to directly power some of their high-concurrency dashboards. For such cases, the concurrency scaling feature of Redshift really comes in handy. Apart from this, they have a lot of in-house data analysts who need to run ad hoc queries on live production data. They use the workload management features of Redshift to make sure their analysts can run queries while ensuring that production queries do not get affected.
Benefits realized with Amazon Redshift
On-Demand Scaling
Ease of use and maintenance with less code
Performance benefits with an incremental MV refresh
Conclusion
Gupshup, an enterprise messaging company, needed a scalable data warehouse solution to analyze billions of events generated each month. They chose Amazon Redshift to build a cloud data warehouse that could handle this scale of data and enable fast analytics.
By combining Redshift’s scalability, snapshots, workload management, and low-operational approach, Gupshup provides data-driven insights in less than 15 minutes analytics refresh rate.
Overall, Redshift’s scalability, performance, ease of management, and cost effectiveness have allowed Gupshup to gain data-driven insights from billions of events in near real-time. A scalable and robust data foundation is enabling Gupshup to build innovative messaging products and a competitive advantage.
The incremental refresh of materialized views feature of Redshift allowed us to be more agile with less code:
For some use cases, we are able to provide data latency of about 15 minutes, without having to write complex code for incremental updates.
The incremental refresh feature is a main differentiating factor that gives Redshift an edge over some of its competitors. I request that you keep improving and enhancing it.
“The incremental refresh of materialized views feature of Redshift allowed us to be more agile with less code”
– Pankaj Bisen, Director of AI and Analytics at Gupshup.
About the Authors
Shabi Abbas Sayed is a Senior Technical Account Manager at AWS. He is passionate about building scalable data warehouses and big data solutions working closely with the customers. He works with large ISVs customers, in helping them build and operate secure, resilient, scalable, and high-performance SaaS applications in the cloud.
Gaurav Singh is a Senior Solutions Architect at AWS, specializing in AI/ML and Generative AI. Based in Pune, India, he focuses on helping customers build, deploy, and migrate ML production workloads to SageMaker at scale. In his spare time, Gaurav loves to explore nature, read, and run.
Happy New Year! Cloud technologies, machine learning, and generative AI have become more accessible, impacting nearly every aspect of our lives. Amazon CTO Dr. Werner Vogels offers four tech predictions for 2024 and beyond:
Generative AI becomes culturally aware
FemTech finally takes off
AI assistants redefine developer productivity
Education evolves to match the speed of technology
To hear insights from AWS and industry thought leaders, grow your skills, and get inspired, watch AWS re:Invent 2023 videos on demand for keynotes, innovation talks, breakout sessions, and AWS Hero guide playlists.
Launches from the last few weeks Since our last week in review on December 18, 2023, I’d like to highlight some launches from year end, as well as last week:
New AWS Canada West (Calgary) Region – We are opening a new and second Region and in Canada, AWS Canada West (Calgary). At the end of 2023, AWS had 33 AWS Regions and 105 Availability Zones (AZs) globally. We preannounced 12 additional AZs in four future Regions in Malaysia, New Zealand, Thailand, and the AWS European Sovereign Cloud. We will share more information on these Regions in 2024. Please stay tuned.
DNS over HTTPS in Amazon Route 53 Resolver – You can use the DNS over HTTPS (DoH) protocol for both inbound and outbound Route 53 Resolver endpoints. As the name suggests, DoH supports HTTP or HTTP/2 over TLS to encrypt the data exchanged for Domain Name System (DNS) resolutions.
Automatic enrollment to Amazon RDS Extended Support – Your MySQL 5.7 and PostgreSQL 11 database instances running on Amazon Aurora and Amazon RDS will be automatically enrolled into Amazon RDS Extended Support starting on February 29, 2024. You can have more control over when you want to upgrade the major version of your database after the community end of life (EoL).
New Amazon CloudWatch Network Monitor – This is a new feature of Amazon CloudWatch that helps monitor network availability and performance between AWS and your on-premises environments. Network Monitor needs zero manual instrumentation and gives you access to real-time network visibility to proactively and quickly identify issues within the AWS network and your own hybrid environment. For more information, read Monitor hybrid connectivity with Amazon CloudWatch Network Monitor.
New WordPress setup on Amazon Lightsail– Set up your WordPress website on Amazon Lightsail with the new workflow to eliminate complexity and time spent configuring your website. The workflow allows you to complete all the necessary steps, including setting up a Secure Sockets Layer (SSL) certificate to secure your website with HTTPS.
Other AWS News Here are some other news items that you may find interesting in the new year:
Book recommendations for AWS customer executives – Plan for the new year and catch up on what others are doing and thinking. AWS Enterprise Strategy team recommends what books are most important for our AWS customer executives to read.
Best practices for scaling AWS CDK adoption with Platform Engineering – A recent evolution in DevOps is the introduction of platform engineering teams to build services, toolchains, and documentation to support workload teams. This blog post introduces strategies and best practices for accelerating CDK adoption within your organization. You can learn how to scale the lessons learned from the pilot project across your organization through platform engineering.
Upcoming AWS Events Check your calendars and sign up for these AWS events in the new year:
AWS at CES 2024 (January 9-12) – AWS will be representing some of the latest cloud services and solutions that are purpose built for the automotive, mobility, transportation, and manufacturing industries. Join us to learn about the latest cloud capabilities across generative AI, software define vehicles, product engineering, sustainability, new digital customer experiences, connected mobility, autonomous driving, and so much more in Amazon Experience Area.
APJ Builders Online Series (January 18) – This online conference is designed for you to learn core AWS concepts, and step-by-step architectural best practices, including demonstrations to help you get started and accelerate your success on AWS.
Today, we are announcing that your MySQL 5.7 and PostgreSQL 11 database instances running on Amazon Aurora and Amazon Relational Database Service (Amazon RDS) will be automatically enrolled into Amazon RDS Extended Support starting on February 29, 2024.
This will help avoid unplanned downtime and compatibility issues that can arise with automatically upgrading to a new major version. This provides you with more control over when you want to upgrade the major version of your database.
This automatic enrollment may mean that you will experience higher charges when RDS Extended Support begins. You can avoid these charges by upgrading your database to a newer DB version before the start of RDS Extended Support.
What is Amazon RDS Extended Support? In September 2023, we announced Amazon RDS Extended Support, which allows you to continue running your database on a major engine version past its RDS end of standard support date on Amazon Aurora or Amazon RDS at an additional cost.
Until community end of life (EoL), the MySQL and PostgreSQL open source communities manage common vulnerabilities and exposures (CVE) identification, patch generation, and bug fixes for the respective engines. The communities release a new minor version every quarter containing these security patches and bug fixes until the database major version reaches community end of life. After the community end of life date, CVE patches or bug fixes are no longer available and the community considers those engines unsupported. For example, MySQL 5.7 and PostgreSQL 11 are no longer supported by the communities as of October and November 2023 respectively. We are grateful to the communities for their continued support of these major versions and a transparent process and timeline for transitioning to the newest major version.
With RDS Extended Support, Amazon Aurora and RDS takes on engineering the critical CVE patches and bug fixes for up to three years beyond a major version’s community EoL. For those 3 years, Amazon Aurora and RDS will work to identify CVEs and bugs in the engine, generate patches and release them to you as quickly as possible. Under RDS Extended Support, we will continue to offer support, such that the open source community’s end of support for an engine’s major version does not leave your applications exposed to critical security vulnerabilities or unresolved bugs.
You might wonder why we are charging for RDS Extended Support rather than providing it as part of the RDS service. It’s because the engineering work for maintaining security and functionality of community EoL engines requires AWS to invest developer resources for critical CVE patches and bug fixes. This is why RDS Extended Support is only charging customers who need the additional flexibility to stay on a version past community EoL.
RDS Extended Support may be useful to help you meet your business requirements for your applications if you have particular dependencies on a specific MySQL or PostgreSQL major version, such as compatibility with certain plugins or custom features. If you are currently running on-premises database servers or self-managed Amazon Elastic Compute Cloud (Amazon EC2) instances, you can migrate to Amazon Aurora MySQL-Compatible Edition, Amazon Aurora PostgreSQL-Compatible Edition, Amazon RDS for MySQL, Amazon RDS for PostgreSQL beyond the community EoL date, and continue to use these versions these versions with RDS Extended Support while benefiting from a managed service. If you need to migrate many databases, you can also utilize RDS Extended Support to split your migration into phases, ensuring a smooth transition without overwhelming IT resources.
In 2024, RDS Extended Support will be available for RDS for MySQL major versions 5.7 and higher, RDS for PostgreSQL major versions 11 and higher, Aurora MySQL-compatible version 2 and higher, and Aurora PostgreSQL-compatible version 11 and higher. For a list of all future supported versions, see Supported MySQL major versions on Amazon RDS and Amazon Aurora major versions in the AWS documentation.
Why are we automatically enrolling all databases to Amazon RDS Extended Support? We had originally informed you that RDS Extended Support would provide the opt-in APIs and console features in December 2023. In that announcement, we said that if you decided not to opt your database in to RDS Extended Support, it would automatically upgrade to a newer engine version starting on March 1, 2024. For example, you would be upgraded from Aurora MySQL 2 or RDS for MySQL 5.7 to Aurora MySQL 3 or RDS for MySQL 8.0 and from Aurora PostgreSQL 11 or RDS for PostgreSQL 11 to Aurora PostgreSQL 15 and RDS for PostgreSQL 15, respectively.
However, we heard lots of feedback from customers that these automatic upgrades may cause their applications to experience breaking changes and other unpredictable behavior between major versions of community DB engines. For example, an unplanned major version upgrade could introduce compatibility issues or downtime if applications are not ready for MySQL 8.0 or PostgreSQL 15.
Automatic enrollment in RDS Extended Support gives you additional time and more control to organize, plan, and test your database upgrades on your own timeline, providing you flexibility on when to transition to new major versions while continuing to receive critical security and bug fixes from AWS.
If you’re worried about increased costs due to automatic enrollment in RDS Extended Support, you can avoid RDS Extended Support and associated charges by upgrading before the end of RDS standard support.
How to upgrade your database to avoid RDS Extended Support charges Although RDS Extended Support helps you schedule your upgrade on your own timeline, sticking with older versions indefinitely means missing out on the best price-performance for your database workload and incurring additional costs from RDS Extended Support.
Major version upgrades may make database changes that are not backward-compatible with existing applications. You should manually modify your database instance to upgrade to the major version. It is strongly recommended that you thoroughly test any major version upgrade on non-production instances before applying it to production to ensure compatibility with your applications. For more information about an in-place upgrade from MySQL 5.7 to 8.0, see the incompatibilities between the two versions, Aurora MySQL in-place major version upgrade, and RDS for MySQL upgrades in the AWS documentation. For the in-place upgrade from PostgreSQL 11 to 15, you can use the pg_upgrade method.
To minimize downtime during upgrades, we recommend using Fully Managed Blue/Green Deployments in Amazon Aurora and Amazon RDS. With just a few steps, you can use Amazon RDS Blue/Green Deployments to create a separate, synchronized, fully managed staging environment that mirrors the production environment. This involves launching a parallel green environment with upper version replicas of your production databases lower version. After validating the green environment, you can shift traffic over to it. Then, the blue environment can be decommissioned. To learn more, see Blue/Green Deployments for Aurora MySQL and Aurora PostgreSQL or Blue/Green Deployments for RDS for MySQL and RDS for PostgreSQL in the AWS documentation. In most cases, Blue/Green Deployments are the best option to reduce downtime, except for limited cases in Amazon Aurora or Amazon RDS.
For more information on performing a major version upgrade in each DB engine, see the following guides in the AWS documentation.
Now available Amazon RDS Extended Support is now available for all customers running Amazon Aurora and Amazon RDS instances using MySQL 5.7, PostgreSQL 11, and higher major versions in AWS Regions, including the AWS GovCloud (US) Regions beyond the end of the standard support date in 2024. You don’t need to opt in to RDS Extended Support, and you get the flexibility to upgrade your databases and continued support for up to 3 years.
Today, we are announcing the preview of Amazon Aurora Limitless Database, a new capability supporting automated horizontal scaling to process millions of write transactions per second and manage petabytes of data in a single Aurora database.
Amazon Aurora read replicas allow you to increase the read capacity of your Aurora cluster beyond the limits of what a single database instance can provide. Now, Aurora Limitless Database scales write throughput and storage capacity of your database beyond the limits of a single Aurora writer instance. The compute and storage capacity that is used for Limitless Database is in addition to and independent of the capacity of your writer and reader instances in the cluster.
With Limitless Database, you can focus on building high-scale applications without having to build and maintain complex solutions for scaling your data across multiple database instances to support your workloads. Aurora Limitless Database scales based on the workload to support write throughput and storage capacity that, until today, would require multiple Aurora writer instances.
The architecture of Amazon Aurora Limitless Database Limitless Database has a two-layer architecture consisting of multiple database nodes, either transaction routers or shards.
Shards are Aurora PostgreSQL DB instances that each store a subset of the data for your database, allowing for parallel processing to achieve higher write throughput. Transaction routers manage the distributed nature of the database and present a single database image to database clients.
Transaction routers maintain metadata about where data is stored, parse incoming SQL commands and send those commands to shards, aggregate data from shards to return a single result to the client, and manage distributed transactions to maintain consistency across the entire distributed database. All the nodes that make up your Limitless Database architecture are contained in a DB shard group. The DB shard group has a separate endpoint where your access your Limitless Database resources.
Getting started with Aurora Limitless Database To get started with a preview of Aurora Limitless Database, you can sign up today and will be invited soon. The preview runs in a new Aurora PostgreSQL cluster with version 15 in the AWS US East (Ohio), US East (N. Virginia), US West (Oregon), Asia Pacific (Tokyo), and Europe (Ireland) Regions.
As part of the creation workflow for an Aurora cluster, choose the Limitless Database compatible version in the Amazon RDS console or the Amazon RDS API. Then you can add a DB shard group and create new Limitless Database tables. You can choose the maximum Aurora capacity units (ACUs).
After the DB shard group is created, you can view its details on the Databases page, including its endpoint.
To use Aurora Limitless Database, you should connect to a DB shard group endpoint, also called the limitless endpoint, using psql or any other connection utility that works with PostgreSQL.
There will be two types of tables that contain your data in Aurora Limitless Database:
Sharded tables – These tables are distributed across multiple shards. Data is split among the shards based on the values of designated columns in the table, called shard keys.
Reference tables – These tables have all their data present on every shard so that join queries can work faster by eliminating unnecessary data movement. They are commonly used for infrequently modified reference data, such as product catalogs and zip codes.
Once you have created a sharded or reference table, you can load massive data into Aurora Limitless Database and manipulate data in those tables using the standard PostgreSQL queries.
Join the preview You can join the preview of Amazon Aurora Limitless Database to be among the first to experience all of this power.
Now generally available: Amazon Aurora MySQL zero-ETL integration with Amazon Redshift Today, we announced the general availability of Amazon Aurora MySQL zero-ETL integration with Amazon Redshift. With this fully managed solution, you no longer need to build and maintain complex data pipelines in order to derive time-sensitive insights from your transactional data to inform critical business decisions.
This zero-ETL integration between Amazon Aurora and Amazon Redshift unlocks opportunities for you to run near real-time analytics and machine learning (ML) on petabytes of transactional data in Amazon Redshift. As this data gets written into Aurora, it will be available in Amazon Redshift within seconds.
It also enables you to run consolidated analytics from multiple Aurora MySQL database clusters in Amazon Redshift to derive holistic insights across many applications or partitions. Amazon Aurora MySQL zero-ETL integration with Amazon Redshift processes over 1 million transactions per minute (an equivalent of 17.5 million insert/update/delete row operations per minute) from multiple Aurora databases and makes them available in Amazon Redshift in less than 15 seconds (p50 latency lag).
Furthermore, you can take advantage of the analytics and built-in ML capabilities of Amazon Redshift, such as materialized views, cross-Region data sharing, and federated access to multiple data stores and data lakes.
Let’s get started In this article, I’ll highlight some steps along with information on how you can get started easily. I will use my existing Amazon Aurora MySQL serverless database and Amazon Redshift data warehouse.
To get started, I need to navigate to Amazon RDS and select Create zero-ETL integration on the Zero-ETL integrations page.
On the Create zero-ETL integration page, I need to follow a few steps to configure the integration for my Amazon Aurora database cluster and my Amazon Redshift data warehouse.
First, I define an identifier for my integration and select Next.
On the next page, I need to select the source database by selecting Browse RDS databases.
Here, I can select my existing database as the source.
The next step asks me the target Amazon Redshift data warehouse. Here, I have the flexibility to choose the Amazon Redshift Serverless or RA3 data warehouse in my account or in different account. I select Browse Redshift data warehouses.
Then, I choose the target data warehouse.
Because Amazon Aurora needs to replicate into the data warehouse, we need to add an additional resource policy and add the Aurora database as an authorized integration source in the Amazon Redshift data warehouse.
I can solve this by manually updating in the Amazon Redshift console or let Amazon RDS fix it for me. I tick the checkbox.
On the next page, it shows me the changes that Amazon RDS will perform for us. I select Continue.
On the next page, I can configure the tags and also the encryption. By default, zero-ETL integration encrypts your data using AWS Key Management Service (AWS KMS), and I have the option to use my own key.
Then, I need to review all the configurations and select Create zero-ETL integration to create the integration.
After a few minutes, my zero-ETL integration is sucessfully created. Then, I switch to Amazon Redshift, and on the Zero-ETL integrations page, I can see that I have my recently created zero-ETL integration.
Since the integration does not yet have a target database inside Amazon Redshift, I need to create one.
Now the integration configuration is complete. On this page, I can see the integration status is active, and there is one table that has been replicated.
For testing, I create a new table in my Amazon Aurora database and insert a record into this table.
Then I switched to the Redshiftquery editor v2 inside Amazon Redshift. Here I can make a connection to the database that I formed as part of the integration. By running a simple query, I can see that my data is already available inside Amazon Redshift.
I found this zero-ETL integration very convenient for two reasons. First, I could unify all data from multiple database clusters together and analyze it in aggregate. Second, within seconds of the transactional data being written into Amazon Aurora MySQL, this zero-ETL integration seamlessly made the data available in Amazon Redshift.
Things to know
Availability – Amazon Aurora zero-ETL integration with Amazon Redshift is available in US East (Ohio), US East (N. Virginia), US West (Oregon), Asia Pacific (Singapore), Asia Pacific (Sydney), Asia Pacific (Tokyo), Europe (Frankfurt), Europe (Ireland), and Europe (Stockholm).
Supported Database Engines – Amazon Aurora zero-ETL Integration with Amazon Redshift currently supports MySQL-compatible editions of Amazon Aurora. Support for Amazon Aurora PostgreSQL-Compatible Edition is a work in progress.
Pricing – Amazon Aurora zero-ETL integration with Amazon Redshift is provided at no additional cost. You pay for existing Amazon Aurora and Amazon Redshift resources used to create and process the change data created as part of a zero-ETL integration.
If you use or plan to use Secure Sockets Layer (SSL) or Transport Layer Security (TLS) with certificate verification to connect to your database instances of Amazon RDS for MySQL, MariaDB, SQL Server, Oracle, PostgreSQL, and Amazon Aurora, it means you should rotate new certificate authority (CA) certificates in both your DB instances and application before the root certificate expires.
Most SSL/TLS certificates (rds-ca-2019) for your DB instances will expire in 2024 after the certificate update in 2020. In December 2022, we released new CA certificates that are valid for 40 years (rds-ca-rsa2048-g1) and 100 years (rds-ca-rsa4096-g1 and rds-ca-ecc384-g1). So, if you rotate your CA certificates, you don’t need to do It again for a long time.
Here is a list of affected Regions and their expiration dates of rds-ca-2019:
Expiration Date
Regions
May 8, 2024
Middle East (Bahrain)
August 22, 2024
US East (Ohio), US East (N. Virginia), US West (N. California), US West (Oregon), Asia Pacific (Mumbai), Asia Pacific (Osaka), Asia Pacific (Seoul), Asia Pacific (Singapore), Asia Pacific (Sydney), Asia Pacific (Tokyo), Canada (Central), Europe (Frankfurt), Europe (Ireland), Europe (London), Europe (Milan), Europe (Paris), Europe (Stockholm), and South America (São Paulo)
September 9, 2024
China (Beijing), China (Ningxia)
October 26, 2024
Africa (Cape Town)
October 28, 2024
Europe (Milan)
Not affected until 2061
Asia Pacific (Hong Kong), Asia Pacific (Hyderabad), Asia Pacific (Jakarta), Asia Pacific (Melbourne), Europe (Spain), Europe (Zurich), Israel (Tel Aviv), Middle East (UAE), AWS GovCloud (US-East), and AWS GovCloud (US-West)
The following steps demonstrate how to rotate your certificates to maintain connectivity from your application to your database instances.
Step 1 – Identify your impacted Amazon RDS resources As I said, you can identify the total number of affected DB instances in the Certificate update page of the Amazon RDS console and see all of your affected DB instances. Note: This page only shows the DB instances for the current Region. If you have DB instances in more than one Region, check the certificate update page in each Region to see all DB instances with old SSL/TLS certificates.
You can also use AWS Command Line Interface (AWS CLI) to call describe-db-instances to find instances that use the expiring CA. The query will show a list of RDS instances in your account and us-east-1 Region.
Step 2 – Updating your database clients and applications Before applying the new certificate on your DB instances, you should update the trust store of any clients and applications that use SSL/TLS and the server certificate to connect. There’s currently no easy method from your DB instances themselves to determine if your applications require certificate verification as a prerequisite to connect. The only option here is to inspect your applications’ source code or configuration files.
Although the DB engine-specific documentation outlines what to look for in most common database connectivity interfaces, we strongly recommend you work with your application developers to determine whether certificate verification is used and the correct way to update the client applications’ SSL/TLS certificates for your specific applications.
To update certificates for your application, you can use the new certificate bundle that contains certificates for both the old and new CA so you can upgrade your application safely and maintain connectivity during the transition period.
For information about checking for SSL/TLS connections and updating applications for each DB engine, see the following topics:
Step 3 – Test CA rotation on a non-production RDS instance If you have updated new certificates in all your trust stores, you should test with a RDS instance in non-production. Do this set up in a development environment with the same database engine and version as your production environment. This test environment should also be deployed with the same code and configurations as production.
To rotate a new certificate in your test database instance, choose Modify for the DB instance that you want to modify in the Amazon RDS console.
In the Connectivity section, choose rds-ca-rsa2048-g1.
Choose Continue to check the summary of modifications. If you want to apply the changes immediately, choose Apply immediately.
To use the AWS CLI to change the CA from rds-ca-2019 to rds-ca-rsa2048-g1 for a DB instance, call the modify-db-instance command and specify the DB instance identifier with the --ca-certificate-identifier option.
This is the same way to rotate new certificates manually in the production database instances. Make sure your application reconnects without any issues using SSL/TLS after the rotation using the trust store or CA certificate bundle you referenced.
When you create a new DB instance, the default CA is still rds-ca-2019 until January 25, 2024, when it will be changed to rds-ca-rsa2048-g1. For setting the new CA to create a new DB instance, you can set up a CA override to ensure all new instance launches use the CA of your choice.
You should do this in all the Regions where you have RDS DB instances.
Step 4 – Safely update your production RDS instances After you’ve completed testing in non production environment, you can start the rotation of your RDS databases CA certificates in your production environment. You can rotate your DB instance manually as shown in Step 3. It’s worth noting that many of the modern engines do not require a restart, but it’s still a good idea to schedule it in your maintenance window.
In the Certificate update page of Step 1, choose the DB instance you want to rotate. By choosing Schedule, you can schedule the certificate rotation for your next maintenance window. By choosing Apply now, you can apply the rotation immediately.
If you choose Schedule, you’re prompted to confirm the certificate rotation. This prompt also states the scheduled window for your update.
After your certificate is updated (either immediately or during the maintenance window), you should ensure that the database and the application continue to work as expected.
Most of modern DB engines do not require restarting your database to update the certificate. If you don’t want to restart the database just for CA update, you can use the --no-certificate-rotation-restart flag in the modify-db-instance command.
To check if your engine requires a restart you can check the SupportsCertificateRotationWithoutRestart field in the output of the describe-db-engine-versions command. You can use this command to see which engines support rotations without restart:
Even if you don’t use SSL/TLS for the database instances, I recommend to rotate your CA. You may need to use SSL/TLS in the future, and some database connectors like the JDBC and ODBC connectors check for a valid cert before connecting and using an expired CA can prevent you from doing that.
To learn about updating your certificate by modifying your DB instance manually, automatic server certificate rotation, and finding a sample script for importing certificates into your trust store, see the Amazon RDS User Guide or the Amazon Aurora User Guide.
Things to Know Here are a couple of important things to know:
Amazon RDS Proxy and Amazon Aurora Serverless use certificates from the AWS Certificate Manager (ACM). If you’re using Amazon RDS Proxy when you rotate your SSL/TLS certificate, you don’t need to update applications that use Amazon RDS Proxy connections. If you’re using Aurora Serverless, rotating your SSL/TLS certificate isn’t required.
Now through January 25, 2024 – new RDS DB instances will have the rds-ca-2919 certificate by default, unless you specify a different CA via the ca-certificate-identifier option on the create-db-instance API; or you specify a default CA override for your account like mentioned in the above section. Starting January 26, 2024 – any new database instances will default to using the rds-ca-rsa2048-g1 certificate. If you wish for new instances to use a different certificate, you can specify which certificate to use with the AWS console or the AWS CLI. For more information, see the create-db-instanceAPI documentation.
Except for Amazon RDS for SQL Server, most modern RDS and Aurora engines support certificate rotation without a database restart in the latest versions. Call describe-db-engine-versions and check for the response field SupportsCertificateRotationWithoutRestart. If this field is set to true, then your instance will not require a database restart for CA update. If set to false, a restart will be required. For more information, see Setting the CA for your database in the AWS documentation.
Your rotated CA signs the DB server certificate, which is installed on each DB instance. The DB server certificate identifies the DB instance as a trusted server. The validity of DB server certificate depends on the DB engine and version either 1 year or 3 year. If your CA supports automatic server certificate rotation, RDS automatically handles the rotation of the DB server certificate too. For more information about DB server certificate rotation, see Automatic server certificate rotation in the AWS documentation.
You can choose to use the 40-year validity certificate (rds-ca-rsa2048-g1) or the 100-year certificates. The expiring CA used by your RDS instance uses the RSA2048 key algorithm and SHA256 signing algorithm. The rds-ca-rsa2048-g1 uses the exact same configuration and therefore is best suited for compatibility. The 100-year certificates (rds-ca-rsa4096-g1 andrds-ca-ecc384-g1) use more secure encryption schemes than rds-ca-rsa2048-g1. If you want to use them, you should test well in pre-production environments to double-check that your database client and server support the necessary encryption schemes in your Region.
Just Do It Now! Even if you have one year left until your certificate expires, you should start planning with your team. Updating SSL/TLS certificate may require restart your DB instance before the expiration date. We strongly recommend that you schedule your applications to be updated before the expiry date and run tests on a staging or pre-production database environment before completing these steps in a production environments. To learn more about updating SSL/TLS certificates, see Amazon RDS User Guide and Amazon Aurora User Guide.
If you don’t use SSL/TLS connections, please note that database security best practices are to use SSL/TLS connectivity and to request certificate verification as part of the connection authentication process. To learn more about using SSL/TLS to encrypt a connection to your DB instance, see Amazon RDS User Guide and Amazon Aurora User Guide.
If you have questions or issues, contact your usual AWS Support by your Support plan.
SQL databases in Amazon Web Services (AWS), using services like Amazon Relational Database Service (Amazon RDS) and Amazon Aurora, offer software architects scalability, automated management, robust security, and cost-efficiency. This combination simplifies database management, improves performance, enhances security, and allows architects to create efficient and scalable software systems.
In this post, we introduce caching strategies and continue with real case studies that use services like Amazon ElastiCache or Amazon MemoryDB in real workloads where customers share the reasoning behind their approaches. It’s very important to understand the context for leveraging a specific solution or pattern, and these resources answer many commonly asked questions.
For software architects and developers, striking the right balance between operational complexity and cost efficiency is a perpetual challenge. Often, provisioning a separate database for each workload is the gold standard, offering unmatched isolation and granular operational controls. However, it’s not always the most cost-effective or operationally manageable approach. Through a real-world success story, we explore how Aurora played a pivotal role in helping VMware Aria Cost, powered by CloudHealth, consolidate a staggering 166 self-managed MySQL databases onto 62 Aurora clusters.
Amazon RDS Blue/Green Deployments revolutionizes the way you handle database updates, ensuring safety and simplicity, often achieving rapid updates in just a minute, with zero data loss. Meanwhile, Amazon RDS Optimized Writes turbocharges write transaction throughput by as much as double, without any additional extra cost. Amazon RDS Optimized Reads steps in to deliver a significant boost to database performance, processing queries up to 50% faster.
Discover how to leverage these capabilities of Amazon RDS in this one-hour video from re:Invent 2022.
In the world of mission-critical workloads, the importance of a robust disaster recovery (DR) strategy cannot be overstated. It’s the lifeline that ensures databases stay operational, even in the face of unexpected events. Discover the intricacies of crafting a dependable, cross-Region DR strategy tailored to Amazon RDS for SQL Server.
In this AWS Developers session, we uncover the best practices for efficiently managing and monitoring these cross-Region read replicas. From proactive monitoring to fine-tuning, you’ll gain the insights needed to keep your DR strategy finely tuned.
Aurora represents a paradigm shift in relational databases, boasting an architecture that decouples computational processes from data storage. It introduces advanced features, such as Global Database and low-latency read replicas, redefining the landscape of database management.
This modern database service excels in performance, scalability, and high availability on a large scale, offering compatibility with both MySQL and PostgreSQL open-source editions. Additionally, it provides an array of developer tools tailored for serverless and machine learning-driven applications.
This re:Invent 2022 session is an in-depth exploration of some of Aurora’s most compelling features, including Aurora Serverless v2 and Global Database. We also share the most recent innovations aimed at enhancing performance, scalability, and security while streamlining operational processes.
Dr. Werner Vogels wrote Farewell EC2-Classic, it’s been swell, celebrating the 17 years of loyal duty of the original version that started what we now know as cloud computing. You can read how it made the process of acquiring compute resources simple, even though the stack running behind the scenes was incredibly complex.
We have come a long way since 2006, and we’re not done innovating for our customers. As celebrated in this year’s AWS Storage Day, Amazon EBS was launched 15 years ago this month. James Hamilton, SVP and distinguished engineer at Amazon, wrote Amazon EBS at 15 Years, about how the service has evolved to handle over 100 trillion I/O operations a day, and transfers over 13 exabytes of data daily.
As Dr. Werner said in his piece, “it’s a reminder that building evolvable systems is a strategy, and revisiting your architectures with an open mind is a must.” Our innovation efforts driven by customer feedback continue today, and this week is no different.
Last Week’s Launches Here are some launches that got my attention:
Renaming Amazon Kinesis Data Analytics to Amazon Managed Service for Apache Flink – You can now use Amazon Managed Service for Apache Flink, a fully managed and serverless service for you to build and run real-time streaming applications using Apache Flink. All your existing running applications in Kinesis Data Analytics will work as-is, without any changes. To learn more, see my blog post.
Extended Support for Amazon Aurora and Amazon RDS – You can now get more time for support, up to three years, for Amazon Aurora and Amazon RDS database instances running MySQL 5.7, PostgreSQL 11, and higher major versions. This e will allow you time to upgrade to a new major version to help you meet your business requirements even after the community ends support for these versions.
Enhanced Starter Template for AWS Step Functions Workflow Studio – You can now use starter templates to streamline the process of creating and prototyping workflows swiftly, plus a new code mode, which enables builders to move easily between design and code authoring views. With the improved authoring experience in Workflow Studio, you can seamlessly alternate between a drag-and-drop visual builder experience or the new code editor so that you can pick your preferred tool to accelerate development.
Email Delivery History for Every Email in Amazon SES – You can now troubleshoot individual email delivery problems, confirm delivery of critical messages, and identify engaged recipients on a granular, single email basis. Email senders can investigate trends in delivery performance and see delivery and engagement status for each email sent using Amazon SES Virtual Deliverability Manager.
Response Streaming through Amazon SageMaker Real-time Inference – You can now continuously stream inference responses back to the client to help you build interactive experiences for various generative AI applications such as chatbots, virtual assistants, and music generators.
Other AWS News Some other updates and news that you might have missed:
AI & Sports: How AWS & the NFL are Changing the Game – Over the last 5 years, AWS has partnered with the National Football League (NFL), helping fans better understand the game, helping broadcasters tell better stories, and helping teams use data to improve operations and player safety. Watch AWS CEO, Adam Selipsky, former NFL All-Pro Larry Fitzgerald, and the NFL Network’s Cynthia Frelund during their earlier livestream discussing the intersection of artificial intelligence and machine learning in sports.
Amazon Bedrock Story from Amazon Science – This is a good article explaining the benefits of using Amazon Bedrock to build and scale generative AI applications with leading foundation models, including Amazon’s Titan FMs, which focus on responsible AI to avoid toxic content.
Amazon EC2 Flexibility Score– This is an open source tool developed by AWS to assess any configuration used to launch instances through an Auto Scaling Group (ASG) against the recommended EC2 best practices. It converts the best practice adoption into a “flexibility score” that can be used to identify, improve, and monitor the configurations.
To learn more open-source news and updates, see this newsletter curated by my colleague Ricardo to bring you the latest open source projects, posts, events, and more.
Upcoming AWS Events Check your calendars and sign up for these AWS events:
AWS re:Invent – Ready to start planning your re:Invent? Browse the session catalog now. Join us to hear the latest from AWS, learn from experts, and connect with the global cloud community.
AWS Global Summits – The last in-person AWS Summit will be held in Johannesburg on Sept. 26.
AWS Community Days– Join a community-led conference run by AWS user group leaders in your region: Aotearoa (Sept. 6), Lebanon (Sept. 9), Munich (Sept. 14), Argentina (Sept. 16), Spain (Sept. 23), and Chile (Sept. 30). Visit the landing page to check out all the upcoming AWS Community Days.
CDK Day – A community-led fully virtual event on Sept. 29 with tracks in English and Spanish about CDK and related projects. Learn more at the website.
The post Archive and Purge Data for Amazon RDS for PostgreSQL and Amazon Aurora with PostgreSQL Compatibility using pg_partman and Amazon S3 proposes data archival as a critical part of data management and shows how to efficiently use PostgreSQL’s native range partition to partition current (hot) data with pg_partman and archive historical (cold) data in Amazon Simple Storage Service (Amazon S3). Customers need a cloud-native automated solution to archive historical data from their databases. Customers want the business logic to be maintained and run from outside the database to reduce the compute load on the database server. This post proposes an automated solution by using AWS Glue for automating the PostgreSQL data archiving and restoration process, thereby streamlining the entire procedure.
AWS Glue is a serverless data integration service that makes it easier to discover, prepare, move, and integrate data from multiple sources for analytics, machine learning (ML), and application development. There is no need to pre-provision, configure, or manage infrastructure. It can also automatically scale resources to meet the requirements of your data processing job, providing a high level of abstraction and convenience. AWS Glue integrates seamlessly with AWS services like Amazon S3, Amazon Relational Database Service (Amazon RDS), Amazon Redshift, Amazon DynamoDB, Amazon Kinesis Data Streams, and Amazon DocumentDB (with MongoDB compatibility) to offer a robust, cloud-native data integration solution.
The features of AWS Glue, which include a scheduler for automating tasks, code generation for ETL (extract, transform, and load) processes, notebook integration for interactive development and debugging, as well as robust security and compliance measures, make it a convenient and cost-effective solution for archival and restoration needs.
Solution overview
The solution combines PostgreSQL’s native range partitioning feature with pg_partman, the Amazon S3 export and import functions in Amazon RDS, and AWS Glue as an automation tool.
The solution involves the following steps:
Provision the required AWS services and workflows using the provided AWS Cloud Development Kit (AWS CDK) project.
Set up your database.
Archive the older table partitions to Amazon S3 and purge them from the database with AWS Glue.
Restore the archived data from Amazon S3 to the database with AWS Glue when there is a business need to reload the older table partitions.
The solution is based on AWS Glue, which takes care of archiving and restoring databases with Availability Zone redundancy. The solution is comprised of the following technical components:
An S3 bucket stores Python scripts and database archives.
An S3 Gateway endpoint allows Amazon RDS and AWS Glue to communicate privately with the Amazon S3.
AWS Glue uses a Secrets Manager interface endpoint to retrieve database secrets from Secrets Manager.
AWS Glue ETL jobs run in either private subnet. They use the S3 endpoint to retrieve Python scripts. The AWS Glue jobs read the database credentials from Secrets Manager to establish JDBC connections to the database.
You can create an AWS Cloud9 environment in one of the private subnets available in your AWS account to set up test data in Amazon RDS. The following diagram illustrates the solution architecture.
Prerequisites
For instructions to set up your environment for implementing the solution proposed in this post, refer to Deploy the application in the GitHub repo.
Provision the required AWS resources using AWS CDK
Complete the following steps to provision the necessary AWS resources:
Clone the repository to a new folder on your local desktop.
Create a virtual environment and install the project dependencies.
The CDK project includes three stacks: vpcstack, dbstack, and gluestack, implemented in the vpc_stack.py, db_stack.py, and glue_stack.py modules, respectively.
These stacks have preconfigured dependencies to simplify the process for you. app.py declares Python modules as a set of nested stacks. It passes a reference from vpcstack to dbstack, and a reference from both vpcstack and dbstack to gluestack.
gluestack reads the following attributes from the parent stacks:
The S3 bucket, VPC, and subnets from vpcstack
The secret, security group, database endpoint, and database name from dbstack
The deployment of the three stacks creates the technical components listed earlier in this post.
Archive the historical table partition to Amazon S3 and purge it from the database with AWS Glue
The “Maintain and Archive” AWS Glue workflow created in the first step consists of two jobs: “Partman run maintenance” and “Archive Cold Tables.”
The “Partman run maintenance” job runs the Partman.run_maintenance_proc() procedure to create new partitions and detach old partitions based on the retention setup in the previous step for the configured table. The “Archive Cold Tables” job identifies the detached old partitions and exports the historical data to an Amazon S3 destination using aws_s3.query_export_to_s3. In the end, the job drops the archived partitions from the database, freeing up storage space. The following screenshot shows the results of running this workflow on demand from the AWS Glue console.
Additionally, you can set up this AWS Glue workflow to be triggered on a schedule, on demand, or with an Amazon EventBridge event. You need to use your business requirement to select the right trigger.
Restore archived data from Amazon S3 to the database
The “Restore from S3” Glue workflow created in the first step consists of one job: “Restore from S3.”
This job initiates the run of the partman.create_partition_time procedure to create a new table partition based on your specified month. It subsequently calls aws_s3.table_import_from_s3 to restore the matched data from Amazon S3 to the newly created table partition.
To start the “Restore from S3” workflow, navigate to the workflow on the AWS Glue console and choose Run.
The following screenshot shows the “Restore from S3” workflow run details.
Validate the results
The solution provided in this post automated the PostgreSQL data archival and restoration process using AWS Glue.
You can use the following steps to confirm that the historical data in the database is successfully archived after running the “Maintain and Archive” AWS Glue workflow:
On the Amazon S3 console, navigate to your S3 bucket.
Confirm the archived data is stored in an S3 object as shown in the following screenshot.
From a psql command line tool, use the \dt command to list the available tables and confirm the archived table ticket_purchase_hist_p2020_01 does not exist in the database.
You can use the following steps to confirm that the archived data is restored to the database successfully after running the “Restore from S3” AWS Glue workflow.
From a psql command line tool, use the \dt command to list the available tables and confirm the archived table ticket_history_hist_p2020_01 is restored to the database.
Clean up
Use the information provided in Cleanup to clean up your test environment created for testing the solution proposed in this post.
Summary
This post showed how to use AWS Glue workflows to automate the archive and restore process in RDS for PostgreSQL database table partitions using Amazon S3 as archive storage. The automation is run on demand but can be set up to be trigged on a recurring schedule. It allows you to define the sequence and dependencies of jobs, track the progress of each workflow job, view run logs, and monitor the overall health and performance of your tasks. Although we used Amazon RDS for PostgreSQL as an example, the same solution works for Amazon Aurora-PostgreSQL Compatible Edition as well. Modernize your database cron jobs using AWS Glue by using this post and the GitHub repo. Gain a high-level understanding of AWS Glue and its components by using the following hands-on workshop.
About the Authors
Anand Komandooru is a Senior Cloud Architect at AWS. He joined AWS Professional Services organization in 2021 and helps customers build cloud-native applications on AWS cloud. He has over 20 years of experience building software and his favorite Amazon leadership principle is “Leaders are right a lot.”
Li Liu is a Senior Database Specialty Architect with the Professional Services team at Amazon Web Services. She helps customers migrate traditional on-premise databases to the AWS Cloud. She specializes in database design, architecture, and performance tuning.
Neil Potter is a Senior Cloud Application Architect at AWS. He works with AWS customers to help them migrate their workloads to the AWS Cloud. He specializes in application modernization and cloud-native design and is based in New Jersey.
Vivek Shrivastava is a Principal Data Architect, Data Lake in AWS Professional Services. He is a big data enthusiast and holds 14 AWS Certifications. He is passionate about helping customers build scalable and high-performance data analytics solutions in the cloud. In his spare time, he loves reading and finds areas for home automation.
As part of my annual tradition to tell you about how AWS makes Prime Day possible, I am happy to be able to share some chart-topping metrics (check out my 2016, 2017, 2019, 2020, 2021, and 2022 posts for a look back).
This year I bought all kinds of stuff for my hobbies including a small drill press, filament for my 3D printer, and irrigation tools. I also bought some very nice Alphablock books for my grandkids. According to our official release, the first day of Prime Day was the single largest sales day ever on Amazon and for independent sellers, with more than 375 million items purchased.
Prime Day by the Numbers As always, Prime Day was powered by AWS. Here are some of the most interesting and/or mind-blowing metrics:
Amazon Elastic Block Store (Amazon EBS) – The Amazon Prime Day event resulted in an incremental 163 petabytes of EBS storage capacity allocated – generating a peak of 15.35 trillion requests and 764 petabytes of data transfer per day. Compared to the previous year, Amazon increased the peak usage on EBS by only 7% Year-over-Year yet delivered +35% more traffic per day due to efficiency efforts including workload optimization using Amazon Elastic Compute Cloud (Amazon EC2) AWS Graviton-based instances. Here’s a visual comparison:
AWS CloudTrail – AWS CloudTrail processed over 830 billion events in support of Prime Day 2023.
Amazon DynamoDB – DynamoDB powers multiple high-traffic Amazon properties and systems including Alexa, the Amazon.com sites, and all Amazon fulfillment centers. Over the course of Prime Day, these sources made trillions of calls to the DynamoDB API. DynamoDB maintained high availability while delivering single-digit millisecond responses and peaking at 126 million requests per second.
Amazon Aurora – On Prime Day, 5,835 database instances running the PostgreSQL-compatible and MySQL-compatible editions of Amazon Aurora processed 318 billion transactions, stored 2,140 terabytes of data, and transferred 836 terabytes of data.
Amazon Simple Email Service (SES) – Amazon SES sent 56% more emails for Amazon.com during Prime Day 2023 vs. 2022, delivering 99.8% of those emails to customers.
Amazon CloudFront – Amazon CloudFront handled a peak load of over 500 million HTTP requests per minute, for a total of over 1 trillion HTTP requests during Prime Day.
Amazon SQS – During Prime Day, Amazon SQS set a new traffic record by processing 86 million messages per second at peak. This is 22% increase from Prime Day of 2022, where SQS supported 70.5M messages/sec.
Amazon Elastic Compute Cloud (EC2) – During Prime Day 2023, Amazon used tens of millions of normalized AWS Graviton-based Amazon EC2 instances, 2.7x more than in 2022, to power over 2,600 services. By using more Graviton-based instances, Amazon was able to get the compute capacity needed while using up to 60% less energy.
Amazon Pinpoint – Amazon Pinpoint sent tens of millions of SMS messages to customers during Prime Day 2023 with a delivery success rate of 98.3%.
Prepare to Scale Every year I reiterate the same message: rigorous preparation is key to the success of Prime Day and our other large-scale events. If you are preparing for a similar chart-topping event of your own, I strongly recommend that you take advantage of AWS Infrastructure Event Management (IEM). As part of an IEM engagement, my colleagues will provide you with architectural and operational guidance that will help you to execute your event with confidence!
Last week, I watched a new episode introducing the Data Center Technician training program offered by AWS to train people with little or no previous technical experience in the skills they need to work in data centers and other information technology (IT) roles. This video reminded me of my first days of cabling and transporting servers in data centers. Remember, there are still people behind cloud computing.
Last Week’s Launches Here are some launches that got my attention:
Amazon FSx for NetApp ONTAP Updates – Jeff Barr introduced Amazon FSx for NetApp ONTAP support for SnapLock, an ONTAP feature that gives you the power to create volumes that provide write once read many (WORM) functionality for regulatory compliance and ransomware protection. In addition, FSx for NetApp ONTAP now supports IPSec encryption of data in transit and two additional monitoring and troubleshooting capabilities that you can use to monitor file system events and diagnose network connectivity.
AWS Lambda detects and stops recursive loops in Lambda functions – In certain scenarios, due to resource misconfiguration or code defects, a processed event might be sent back to the same service or resource that invoked the Lambda function. This can cause an unintended recursive loop and result in unintended usage and costs for customers. With this launch, Lambda will stop recursive invocations between Amazon SQS, Lambda, and Amazon SNS after 16 recursive calls. For more information, refer to our documentation or the launch blog post.
Amazon CloudFront supports for 3072-bit RSA certificates – You can now associate their 3072-bit RSA certificates with CloudFront distributions to enhance communication security between clients and CloudFront edge locations. To get started, associate a 3072-bit RSA certificate with your CloudFront distribution using console or APIs. There are no additional fees associated with this feature. For more information, please refer to the CloudFront Developer Guide.
Running GitHub Actions with AWS CodeBuild – Two weeks ago, AWS CodeBuild started to support GitHub Actions. You can now define GitHub Actions steps directly in the BuildSpec and run them alongside CodeBuild commands. Last week, the AWS DevOps Blog published the blog post about using the Liquibase GitHub Action for deploying changes to an Amazon Aurora database in a private subnet. You can learn how to integrate AWS CodeBuild and nearly 20,000 GitHub Actions developed by the open source community.
Amazon DynamoDB local version 2.0 – You can develop and test applications by running Amazon DynamoDB local in your local development environment without incurring any additional costs. The new 2.0 version allows Java developers to use DynamoDB local to work with Spring Boot 3 and frameworks such as Spring Framework 6 and Micronaut Framework 4 to build modernized, simplified, and lightweight cloud-native applications.
For a full list of AWS announcements, be sure to keep an eye on the What’s New at AWS page.
Open Source Updates Last week, we introduced new open source projects and significant roadmap contributions to the Jupyter community.
Karpenter now supports Windows containers – Karpenter is an open source flexible, high-performance Kubernetes node provisioning and management solution that you can use to quickly scale Amazon EKS clusters. With the launch of version 0.29.0, Karpenter extends the automated node provisioning support to Windows containers running on EKS. Read this blog post for a step-by-step guide on how to get started with Karpenter for Windows node groups.
Updates in Amazon Aurora and Amazon OpenSearch Service – Following the announcement of updates to the PostgreSQL database in May by the open source community, we’ve updated Amazon Aurora PostgreSQL-Compatible Edition to support PostgreSQL 15.3, 14.8, 13.11, 12.15, and 11.20. These releases contain product improvements and bug fixes made by the PostgreSQL community, along with Aurora-specific improvements. You can also run OpenSearch version 2.7 in Amazon OpenSearch Service. With OpenSearch 2.7 (also released in May), we’ve made several improvements to observability, security analytics, index management, and geospatial capabilities in OpenSearch Service.
Upcoming AWS Events Check your calendars and sign up for these AWS events:
AWS Storage Day on August 9 – Join a one-day virtual event that will help you to better understand AWS storage services and make the most of your data. Register today.
AWS Community Days – Join a community-led conference run by AWS user group leaders in your region: Malaysia (July 22), Philippines (July 29-30), Colombia (August 12), and West Africa (August 19).
AWS re:Invent 2023 – Join us to hear the latest from AWS, learn from experts, and connect with the global cloud community. Registration is now open.
Take the AWS Blog Customer Survey We’re focused on improving our content to provide a better customer experience, and we need your feedback to do so. Take our survey to share insights regarding your experience on the AWS Blog.
This survey is hosted by an external company. AWS handles your information as described in the AWS Privacy Notice. AWS will own the data gathered via this survey and will not share the information collected with survey respondents.
That’s all for this week. Check back next Monday for another Week in Review!
In this post, we provide step-by-step guidance on how to get started with near-real time operational analytics using this feature.
Challenges
Customers across industries today are looking to increase revenue and customer engagement by implementing near-real time analytics use cases like personalization strategies, fraud detection, inventory monitoring, and many more. There are two broad approaches to analyzing operational data for these use cases:
Analyze the data in-place in the operational database (e.g. read replicas, federated query, analytics accelerators)
Move the data to a data store optimized for running analytical queries such as a data warehouse
The zero-ETL integration is focused on simplifying the latter approach.
A common pattern for moving data from an operational database to an analytics data warehouse is via extract, transform, and load (ETL), a process of combining data from multiple sources into a large, central repository (data warehouse). ETL pipelines can be expensive to build and complex to manage. With multiple touchpoints, intermittent errors in ETL pipelines can lead to long delays, leaving applications that rely on this data to be available in the data warehouse with stale or missing data, further leading to missed business opportunities.
For customers that need to run unified analytics across data from multiple operational databases, solutions that analyze data in-place may work great for accelerating queries on a single database, but such systems have a limitation of not being able to aggregate data from multiple operational databases.
Zero-ETL
At AWS, we have been making steady progress towards bringing our zero-ETL vision to life. With Aurora zero-ETL integration with Amazon Redshift, you can bring together the transactional data of Aurora with the analytics capabilities of Amazon Redshift. It minimizes the work of building and managing custom ETL pipelines between Aurora and Amazon Redshift. Data engineers can now replicate data from multiple Aurora database clusters into the same or a new Amazon Redshift instance to derive holistic insights across many applications or partitions. Updates in Aurora are automatically and continuously propagated to Amazon Redshift so the data engineers have the most recent information in near-real time. Additionally, the entire system can be serverless and can dynamically scale up and down based on data volume, so there’s no infrastructure to manage.
When you create an Aurora zero-ETL integration with Amazon Redshift, you continue to pay for Aurora and Amazon Redshift usage with existing pricing (including data transfer). The Aurora zero-ETL integration with Amazon Redshift feature is available at no additional cost.
With Aurora zero-ETL integration with Amazon Redshift, the integration replicates data from the source database into the target data warehouse. The data becomes available in Amazon Redshift within seconds, allowing users to use the analytics features of Amazon Redshift and capabilities like data sharing, workload optimization autonomics, concurrency scaling, machine learning, and many more. You can perform real-time transaction processing on data in Aurora while simultaneously using Amazon Redshift for analytics workloads such as reporting and dashboards.
The following diagram illustrates this architecture.
Solution overview
Let’s consider TICKIT, a fictional website where users buy and sell tickets online for sporting events, shows, and concerts. The transactional data from this website is loaded into an Aurora MySQL 3.03.1 (or higher version) database. The company’s business analysts want to generate metrics to identify ticket movement over time, success rates for sellers, and the best-selling events, venues, and seasons. They would like to get these metrics in near-real time using a zero-ETL integration.
The integration is set up between Amazon Aurora MySQL-Compatible Edition 3.03.1 (source) and Amazon Redshift (destination). The transactional data from the source gets refreshed in near-real time on the destination, which processes analytical queries.
You can use either the provisioned or serverless option for both Amazon Aurora MySQL-Compatible Edition as well as Amazon Redshift. For this illustration, we use a provisioned Aurora database and an Amazon Redshift Serverless data warehouse. For the complete list of public preview considerations, please refer to the feature AWS documentation.
The following diagram illustrates the high-level architecture.
The following are the steps needed to set up zero-ETL integration. For complete getting started guides, refer to the following documentation links for Aurora and Amazon Redshift.
Configure the Aurora MySQL source with a customized DB cluster parameter group.
Configure the Amazon Redshift Serverless destination with the required resource policy for its namespace.
Update the Redshift Serverless workgroup to enable case-sensitive identifiers.
Configure the required permissions.
Create the zero-ETL integration.
Create a database from the integration in Amazon Redshift.
Configure the Aurora MySQL source with a customized DB cluster parameter group
To create an Aurora MySQL database, complete the following steps:
On the Amazon RDS console, create a DB cluster parameter group called zero-etl-custom-pg.
Zero-ETL integrations require specific values for the Aurora DB cluster parameters that control binary logging (binlog). For example, enhanced binlog mode must be turned on (aurora_enhanced_binlog=1).
Set the following binlog cluster parameter settings:
binlog_backup=0
binlog_replication_globaldb=0
binlog_format=ROW
aurora_enhanced_binlog=1
binlog_row_metadata=FULL
binlog_row_image=FULL
Choose Save changes.
Choose Databases in the navigation pane, then choose Create database.
For Available versions, choose Aurora MySQL 3.03.1 (or higher).
For Templates, select Production.
For DB cluster identifier, enter zero-etl-source-ams.
Under Instance configuration, select Memory optimized classes and choose a suitable instance size (the default is db.r6g.2xlarge).
Under Additional configuration, for DB cluster parameter group, choose the parameter group you created earlier (zero-etl-custom-pg).
Choose Create database.
In a couple of minutes, it should spin up an Aurora MySQL database as the source for zero-ETL integration.
Configure the Redshift Serverless destination
For our use case, create a Redshift Serverless data warehouse by completing the following steps:
On the Amazon Redshift console, choose Serverless dashboard in the navigation pane.
Choose Create preview workgroup.
For Workgroup name, enter zero-etl-target-rs-wg.
For Namespace, select Create a new namespace and enter zero-etl-target-rs-ns.
Navigate to the namespace zero-etl-target-rs-ns and choose the Resource policy tab.
Choose Add authorized principals.
Enter either the Amazon Resource Name (ARN) of the AWS user or role, or the AWS account ID (IAM principals) that are allowed to create integrations in this namespace.
An account ID is stored as an ARN with root user.
Add an authorized integration source to the namespace and specify the ARN of the Aurora MySQL DB cluster that’s the data source for the zero-ETL integration.
Choose Save changes.
You can get the ARN for the Aurora MySQL source on the Configuration tab as shown in the following screenshot.
Update the Redshift Serverless workgroup to enable case-sensitive identifiers
You can use AWS CloudShell or another interface like Amazon Elastic Compute Cloud (Amazon EC2) with an AWS user configuration that can update the Redshift Serverless parameter group. The following screenshot illustrates how to run this on CloudShell.
The following screenshot shows how to run the update-workgroup command on Amazon EC2.
Configure required permissions
To create a zero-ETL integration, your user or role must have an attached identity-based policy with the appropriate AWS Identity and Access Management (IAM) permissions. The following sample policy allows the associated principal to perform the following actions:
Create zero-ETL integrations for the source Aurora DB cluster.
View and delete all zero-ETL integrations.
Create inbound integrations into the target data warehouse. This permission is not required if the same account owns the Amazon Redshift data warehouse and this account is an authorized principal for that data warehouse. Also note that Amazon Redshift has a different ARN format for provisioned and serverless:
If you see IAM policy warnings for the RDS policy actions, this is expected because the feature is in public preview. These actions will become part of IAM policies when the feature is generally available. It’s safe to proceed.
Attach the policy you created to your IAM user or role permissions.
Create the zero-ETL integration
To create the zero-ETL integration, complete the following steps:
On the Amazon RDS console, choose Zero-ETL integrations in the navigation pane.
Choose Create zero-ETL integration.
For Integration name, enter a name, for example zero-etl-demo.
For Aurora MySQL source cluster, browse and choose the source cluster zero-etl-source-ams.
Under Destination, for Amazon Redshift data warehouse, choose the Redshift Serverless destination namespace (zero-etl-target-rs-ns).
Choose Create zero-ETL integration.
To specify a target Amazon Redshift data warehouse that’s in another AWS account, you must create a role that allows users in the current account to access resources in the target account. For more information, refer to Providing access to an IAM user in another AWS account that you own.
Create a role in the target account with the following permissions:
The role must have the following trust policy, which specifies the target account ID. You can do this by creating a role with a trusted entity as an AWS account ID in another account.
The following screenshot illustrates creating this on the IAM console.
Then while creating the zero-ETL integration, choose the destination account ID and the name of the role you created to proceed further, for Specify a different account option.
You can choose the integration to view the details and monitor its progress. It takes a few minutes to change the status from Creating to Active. The time varies depending on size of the dataset already available in the source.
Create a database from the integration in Amazon Redshift
To create your database, complete the following steps:
On the Redshift Serverless dashboard, navigate to the zero-etl-target-rs-ns namespace.
Choose Query data to open Query Editor v2.
Connect to the preview Redshift Serverless data warehouse by choosing Create connection.
Obtain the integration_id from the svv_integration system table:
select integration_id from svv_integration; ---- copy this result, use in the next sql
Use the integration_id from the previous step to create a new database from the integration:
CREATE DATABASE aurora_zeroetl FROM INTEGRATION '<result from above>';
The integration is now complete, and an entire snapshot of the source will reflect as is in the destination. Ongoing changes will be synced in near-real time.
Analyze the near-real time transactional data
Now we can run analytics on TICKIT’s operational data.
Populate the source TICKIT data
To populate the source data, complete the following steps:
Connect to your Aurora MySQL cluster and create a database/schema for the TICKIT data model, verify that the tables in that schema have a primary key, and initiate the load process:
mysql -h <amazon_aurora_mysql_writer_endpoint> -u admin -p
You can use the script from the following HTML file to create the sample database demodb (using the tickit.db model) in Amazon Aurora MySQL-Compatible edition.
Run the script to create the tickit.db model tables in the demodb database/schema:
Load data from Amazon Simple Storage Service (Amazon S3), record the finish time for change data capture (CDC) validations at destination, and observe how active the integration was.
The following are common errors associated with load from Amazon S3:
For the current version of the Aurora MySQL cluster, we need to set the aws_default_s3_role parameter in the DB cluster parameter group to the role ARN that has the necessary Amazon S3 access permissions.
If you get an error for missing credentials (for example, Error 63985 (HY000): S3 API returned error: Missing Credentials: Cannot instantiate S3 Client), you probably haven’t associated your IAM role to the cluster. In this case, add the intended IAM role to the source Aurora MySQL cluster.
Analyze the source TICKIT data in the destination
On the Redshift Serverless dashboard, open Query Editor v2 using the database you created as part of the integration setup. Use the following code to validate the seed or CDC activity:
SELECT * FROM SYS_INTEGRATION_ACTIVITY;
Choose the cluster or workgroup and database created from integration on the drop-down menu and run tickit.db sample analytic queries.
Monitoring
You can query the following system views and tables in Amazon Redshift to get information about your Aurora zero-ETL integrations with Amazon Redshift:
SVV_INTEGRATION – Provides configuration details for your integrations.
In order to view the integration-related metrics published to Amazon CloudWatch, navigate to Amazon Redshift console. Choose Zero-ETL integrations from left navigation pane and click on the integration links to display activity metrics.
Available metrics on the Redshift console are Integration metrics and table statistics, with table statistics providing details of each table replicated from Aurora MySQL to Amazon Redshift.
Integration metrics contains table replication success/failure counts and lag details:
Clean up
When you delete a zero-ETL integration, Aurora removes it from your Aurora cluster. Your transactional data isn’t deleted from Aurora or Amazon Redshift, but Aurora doesn’t send new data to Amazon Redshift.
To delete a zero-ETL integration, complete the following steps:
On the Amazon RDS console, choose Zero-ETL integrations in the navigation pane.
Select the zero-ETL integration that you want to delete and choose Delete.
To confirm the deletion, choose Delete.
Conclusion
In this post, we showed you how to set up Aurora zero-ETL integration from Amazon Aurora MySQL-Compatible Edition to Amazon Redshift. This minimizes the need to maintain complex data pipelines and enables near-real time analytics on transactional and operational data.
To learn more about Aurora zero-ETL integration with Amazon Redshift, visit documentation for Aurora and Amazon Redshift.
About the Authors
Rohit Vashishtha is a Senior Analytics Specialist Solutions Architect at AWS based in Dallas, Texas. He has 17 years of experience architecting, building, leading, and maintaining big data platforms. Rohit helps customers modernize their analytic workloads using the breadth of AWS services and ensures that customers get the best price/performance with utmost security and data governance.
Vijay Karumajji is a Database Solutions Architect with Amazon Web Services. He works with AWS customers to provide guidance and technical assistance on database projects, helping them improve the value of their solutions when using AWS.
BP Yau is a Sr Partner Solutions Architect at AWS. He is passionate about helping customers architect big data solutions to process data at scale. Before AWS, he helped Amazon.com Supply Chain Optimization Technologies migrate its Oracle data warehouse to Amazon Redshift and build its next generation big data analytics platform using AWS technologies.
Jyoti Aggarwal is a Product Manager on the Amazon Redshift team based in Seattle. She has spent the last 10 years working on multiple products in the data warehouse industry.
Adam Levin is a Product Manager on the Amazon Aurora team based in California. He has spent the last 10 years working on various cloud database services.
A new week has begun. Last week, there was a lot of news related to AWS. I have compiled a few announcements you need to know. Let’s get started right away!
Last Week’s Launches Let’s take a look at some launches from the last week that I want to remind you of:
New Amazon EC2 I4g Instances – Powered by AWS Graviton2 processors, Amazon Elastic Compute Cloud (Amazon EC2) I4g instances improve real-time storage performance up to 2x compared to prior generation storage-optimized instances. Based on AWS Nitro SSDs that are custom-built by AWS and reduce both latency and latency variability, I4g instances are optimized for workloads that perform a high mix of random read/write and require very low I/O latency, such as transactional databases and real-time analytics. To learn more, see Jeff’s post.
Amazon Aurora I/O-Optimized – You can now choose between two storage configurations for Amazon Aurora DB clusters: Aurora Standard or Aurora I/O-Optimized. For applications with low-to-moderate I/Os, Aurora Standard is a cost-effective option.
For applications with high I/Os, Aurora I/O-Optimized provides improved price performance, predictable pricing, and up to 40 percent costs savings. To learn more, see my full blog post.
AWS Management Console Private Access – This is a new security feature that allows you to limit access to the AWS Management Console from your Virtual Private Cloud (VPC) or connected networks to a set of trusted AWS accounts and organizations. It is built on VPC endpoints, which use AWS PrivateLink to establish a private connection between your VPC and the console.
AWS Management Console Private Access is useful when you want to prevent users from signing in to unexpected AWS accounts from within your network. To learn more, see the AWS Management Console getting started guide.
One-Click Security Protection on the Amazon CloudFront Console – You can now secure your web applications and APIs with AWS WAF with a single click on the Amazon CloudFront console. CloudFront handles creating and configuring AWS WAF for you with out-of-the-box protections recommended by AWS and this simple and convenient way to protect applications at the time you create or edit your distribution.
You may continue to select a preconfigured AWS WAF web access control list (ACL) when you prefer to use an existing web ACL. To learn more, see Using AWS WAF to control access to your content in the AWS documentation.
Tracing AWS Lambda SnapStart Functions with AWS X-Ray – You can use AWS X-Ray traces to gain deeper visibility into your function’s performance and execution lifecycle, helping you identify errors and performance bottlenecks for your latency-sensitive Java applications built using SnapStart-enabled functions.
With X-Ray support for SnapStart-enabled functions, you can now see trace data about the restoration of the execution environment and execution of your function code. You can enable X-Ray for Java-based SnapStart-enabled Lambda functions running on Amazon Corretto 11 or 17. To learn more about X-Ray for SnapStart-enabled functions, visit the Lambda Developer Guide or read Marcia’s blog post.
For a full list of AWS announcements, be sure to keep an eye on the What’s New at AWS page.
Open Source Updates Last week, we introduced new open-source projects and significant roadmap contributions to the Jupyter community.
Snapchange – Snapchange is a new open-source project to make fuzzing of a memory snapshot easier using KVM written by Rust. Snapchange enables a target binary to be fuzzed with minimal modifications, providing useful introspection that aids in fuzzing. Snapchange utilizes the features of the Linux kernel’s built-in virtual machine manager known as kernel virtual machine or KVM. To learn more, see the announcement post and GitHub repository.
Cedar – Cedar is a new open-source language for defining permissions as policies, which describes who should have access to what, and evaluating those policies. You can use Cedar to control access to resources such as photos in a photo-sharing app, compute nodes in a microservices cluster, or components in a workflow automation system. Cedar is also authorization-policy language used by the Amazon Verified Permissions, a scalable, fine-grained permissions management and authorization service for custom applications and AWS Verified Access managed services to validate each application request before granting access. To learn more, see the announcement post , Amazon Science blog post and Cedar playground to test sample policies.
Jupyter Community Contributions – We announced new contributions to Jupyter community to democratize generative artificial intelligence (AI) and scale machine learning (ML) workloads. We contributed two Jupyter extensions – Jupyter AI to bring generative AI to Jupyter notebooks and Amazon CodeWhisperer Jupyter extension to generate code suggestions for Python notebooks in JupyterLab. We also contributed three new capabilities to help you scale ML development faster: notebooks scheduling, SageMaker open-source distribution, and Amazon CodeGuru Jupyter extension. To learn more, see the announcement post and Jupyter on AWS.
Upcoming AWS Events Check your calendars and sign up for these AWS-led events:
AWS Serverless Innovation Day on May 17 – Join us for a free full-day virtual event to learn about AWS Serverless technologies and event-driven architectures from customers, experts, and leaders. Marcia outlined the agenda and main topics of this event in her post. You can register on the event page.
AWS Data Insights Day on May 24 – Join us for another virtual event to discover ways to innovate faster and more cost-effectively with data. Whether your data is stored in operational data stores, data lakes, streaming engines, or within your data warehouse, Amazon Redshift helps you achieve the best performance with the lowest spend. This event focuses on customer voices, deep-dive sessions, and best practices of Amazon Redshift. You can register on the event page.
AWS Silicon Innovation Day on June 21 – Join AWS leaders and experts showcasing AWS innovations in custom-designed EC2 chips built for high performance and scale in the cloud. AWS has designed and developed purpose-built silicon specifically for the cloud. You can understand AWS Silicons and how they can use AWS’s unique EC2 chip offerings to their benefit. You can register on the event page.
AWS re:Inforce 2023 – You can still register for AWS re:Inforce, in Anaheim, California, June 13–14.
AWS Community Day – Join community-led conferences driven by AWS user group leaders closest to your city: Chicago (June 15), and Philippines (June 29–30).
Since Amazon Aurora launched in 2014, hundreds of thousands of customers have chosen Aurora to run their most demanding applications. Aurora provides unparalleled high performance and availability at global scale with full MySQL and PostgreSQL compatibility at up to one-tenth the cost of commercial databases.
Many customers benefit from the cost-effectiveness of Aurora’s current simple, pay-per-request pricing for input/output (I/O) usage, removing the need to provision I/Os in advance. Customers also benefit from additional cost-saving innovations such as Amazon Aurora Serverless v2 (ASv2), which provides seamless scaling in fine-grained increments based on the application’s demands. For workloads with spikes in demand, you can save up to 90 percent in costs vs. provisioning capacity for peak load with ASv2.
Today, we are announcing the general availability of Amazon Aurora I/O-Optimized, a new cluster configuration that offers improved price performance and predictable pricing for customers with I/O-intensive applications, such as e-commerce applications, payment processing systems, and more. Aurora I/O-Optimized offers improved performance, increasing throughput and reducing latency to support your most demanding workloads.
You can now confidently predict costs for your most I/O-intensive workloads, with up to 40 percent cost savings when your I/O spend exceeds 25 percent of your current Aurora database spend. If you are using Reserved Instances, you will see even greater cost savings.
Now you have the flexibility to choose between the existing configuration newly called Aurora Standard, which is the existing pay-per-request pricing model that is cost-effective for applications with low-to-moderate I/O usage or the new Aurora I/O-Optimized configuration for I/O-intensive applications.
Getting Started with Aurora I/O-Optimized You can create a new database cluster using the Aurora I/O-Optimized configuration or convert your existing database clusters with a few clicks in the AWS Management Console, AWS Command Line Interface (AWS CLI), or AWS SDKs.
For the Aurora MySQL-Compatible Edition and Aurora PostgreSQL-Compatible Edition, you can choose either the Aurora Standard or Aurora I/O-Optimized configuration.
Aurora I/O-Optimized configuration is available in the latest version of Aurora MySQL version 3.03.1 and higher, Aurora PostgreSQL v15.2 and higher, v14.7 and higher, and v13.10 and higher.
This configuration supports Intel-based Aurora database instance types such as t3, r5, and r6i, Graviton-based database instance types such as t4g, r7g, and x2g, Aurora Serverless v2, Aurora Global Database, on-demand Aurora database instances, and reserved instances.
R7g instances for Amazon Aurora are powered by the latest generation AWS Graviton3 processors, delivering up to 30 percent performance gains and up to 20 percent improved price performance for Aurora, as compared to R6g instances.
In your existing Aurora clusters, you can switch the storage configuration to Aurora I/O-Optimized once every 30 days or switch back to Aurora Standard at any time. You can change the cluster storage configuration only at the cluster level. The change applies to all instances in the cluster.
After changing the configuration, you don’t need to reboot the database instances within the cluster to take advantage of the price-performance benefits of Aurora I/O-Optimized.
Now Available Amazon Aurora I/O-Optimized configuration is now generally available for Amazon Aurora MySQL-Compatible Edition and Aurora PostgreSQL-Compatible Edition in most AWS Regions where Aurora is available, with China (Beijing), China (Ningxia), AWS GovCloud (US-East), and AWS GovCloud (US-West) Regions coming soon.
Aurora is billed differently for the two configurations: Aurora Standard or Aurora I/O-Optimized. The latter doesn’t charge for I/Os, charging a set price for compute and storage relative to the former. For I/O-intensive applications, its price/performance will be better, and you can save up to 40 percent on costs. To see pricing examples, visit the Aurora Pricing page.
With Amazon Relational Database Service (Amazon RDS), you can set up, operate, and scale a relational database in the AWS Cloud. Amazon RDS provides cost-efficient, resizable capacity for an industry-standard relational database and manages common database administration tasks.
If you use Amazon RDS for your workloads, you can now use Amazon GuardDutyRDS Protection to help detect threats to your data stored in Amazon Aurora databases. GuardDuty is a continuous security monitoring service that can help you identify and prioritize potential threats in your AWS environment. By analyzing and profiling RDS login activity to your Aurora databases, GuardDuty can detect threats, such as high severity brute force events, suspicious logins, access from Tor, and access by known threat actors.
In this post, we will provide an overview of how to get started with RDS Protection, dive into its finding types, and walk you through examples of how to investigate and remediate findings.
Overview of RDS Protection
RDS Protection in GuardDuty analyzes and profiles Amazon RDS login activity to identify potential threats to your data stored in Aurora databases by using a combination of threat intelligence and machine learning. At launch, RDS Protection supports Aurora MySQL versions 2.10.2 and 3.2.1 or later and Aurora PostgreSQL versions 10.17, 11.12, 12.7, 13.3, and 14.3 or later. An updated list of the supported engines and versions is available in the GuardDuty documentation. RDS Protection doesn’t require additional infrastructure, and you don’t need to configure, collect, or store RDS logs in your own account. RDS Protection is also designed to have no impact on the performance of your database instances so that you don’t have to worry about compromising performance to better secure your data stored in Amazon RDS.
When RDS Protection detects a suspicious or anomalous login attempt that indicates a potential threat to your database instance, GuardDuty generates a finding with details to help you quickly identify relevant information to assist in remediation. RDS Protection findings include details on both anomalous and normal login activity in addition to information such as database instance details, database user details, action information, and actor information. These findings are available to you in the GuardDuty console, AWS Command Line Interface (AWS CLI), and API, and all GuardDuty findings are sent to Amazon EventBridge and AWS Security Hub, giving you options to respond by sending alerts to chat or ticketing systems, or by using AWS Lambda and AWS Systems Manager for automatic remediation.
Enable RDS Protection
Getting started with RDS Protection is simple, and you can do it with just a few steps in the console. Both new and existing GuardDuty customers can take advantage of the GuardDuty RDS Protection 30-day free trial. You can turn RDS Protection on or off for each of your accounts in supported AWS Regions. If you already use GuardDuty, you will need to enable RDS Protection either in the console or CLI, or through the API. You will have the option to enable it in the account that you are currently in, or if you are using a GuardDuty delegated administrator account (as shown in Figure 1), you can enable it for all accounts in your AWS Organizations organization. You’ll also have the ability to auto-enable. The auto-enable feature helps ensure that RDS Protection is enabled for each new account added to your organization, without the need for you to configure anything in each member account. If you are turning on GuardDuty for the first time, RDS Protection is enabled by default.
After GuardDuty generates a finding, you will need to analyze the finding so that you understand the potential impact to your environment. We recommend that you familiarize yourself with the GuardDuty finding types. Understanding GuardDuty finding types can help you understand the types of activity that GuardDuty is looking for and help you prepare for how to respond if they occur in your environment.
As adversaries become more sophisticated, it becomes even more important for you to align to a common framework to understand the tactics, techniques, and procedures (TTPs) behind an individual event. GuardDuty aligns findings using the MITRE ATT&CK framework, which is a globally-accessible knowledge base of adversary tactics and techniques based on real-world observations. GuardDuty findings have a specific finding format that helps you understand the details of each finding. You can examine the Threat Purpose section of the GuardDuty finding types to see finding types associated with various MITRE ATT&CK tactics, including CredentialAccess and Discovery. This can help you identify and understand the type of activity associated with a finding.
For example, consider two finding types that seem similar: CredentialAccess:RDS/MaliciousIPCaller.SuccessfulLoginand Discovery:RDS/MaliciousIPCaller. The difference between them is the ThreatPurpose aspect, located at the beginning of the finding type. GuardDuty has determined that both are involved with MaliciousIPCaller, and the difference is the intent of the activity associated with each finding. CredentialAccess SuccessfulLogin indicates that there was a successful login to your RDS database from a known malicious IP address. Discovery indicates that a threat actor opened a connection to the database, but didn’t attempt to authenticate. This indicates scanning behavior, but it might not be targeted at RDS instances. For more information, see GuardDuty RDS Protection finding types.
GuardDuty uses threat intelligence and machine learning to continually monitor and identify potential threats in your environment. To understand how to investigate RDS Protection finding types, you need to understand the details of a finding type that are derived from machine learning. As shown in Figure 2, RDS Protection finding types have two sections: one that shows the unusual behavior and one that shows the normal, historical behavior. To determine this, GuardDuty uses machine learning models to evaluate API requests to your account and identify anomalous events that are associated with tactics used by adversaries. The machine learning model tracks various factors of the API request, such as the user that made the request, the location the request was made from, and the specific API that was requested. It also looks at information such as successfulLoginCount, failedLoginCount, and incompleteConnectionCount for anomalies based on login activity. For more information about anomalous activity in GuardDuty findings, see Anomalous behavior.
With RDS Protection, you now have an additional mechanism to gain insight into your Amazon RDS databases across your accounts to continuously monitor for suspicious activity. RDS Protection can alert you to suspicious activity in Amazon RDS, such as a potentially suspicious or anomalous login attempt, unusual pattern in a series of successful, failed, or incomplete login attempts, and unauthorized access to your database instance from a previously unseen internal or external actor. With this new feature, GuardDuty also extends support for finding types that you might already be familiar with that also apply to RDS databases. These finding types include calls to an RDS database API from a Tor node, or calls to an RDS database from a known malicious IP address, which can indicate that there are interactions with your RDS database from sources that are associated with known malicious activity.
Remediate RDS Protection findings
In this section, we describe two RDS Protection findings and how you can investigate and remediate them. Understanding how to remediate these findings can help you maintain the integrity of your database. We share recommendations that focus specifically on security groups, network access control lists (network ACLs), and firewall rules.
The CredentialAccess:RDS/AnomalousBehavior.SuccessfulLogin finding informs you that an anomalous successful login was observed on an RDS database in your AWS environment. It might indicate that a previous unseen user logged in to an RDS database for the first time. A common scenario involves an internal user logging in to a database that is accessed programmatically by applications and not by individual users. A potential malicious actor might have compromised and accessed the role on your RDS database. The default Severity for this finding varies, depending on the anomalous behavior associated with the finding.
Figure 3 shows an example of this finding.
Figure 3: Finding of an anomalous behavior successful login
How to remediate
If the activity is unexpected for the associated database, AWS recommends that you change the password of the associated database user, and review available audit logs for activity that the user performed. Medium and high severity findings might indicate an overly permissive access policy to the database, and user credentials might have been exposed or compromised. We recommend that you place the database in a private virtual private cloud (VPC), and limit the security group rules to allow traffic only from necessary sources. For more information, see Remediating potentially compromised database with successful login events.
We recommend that you take the following steps to remediate this finding:
Remediation step 1: Identify the affected database and user
Identify the affected database and user and confirm whether the behavior is expected or unexpected by looking through the GuardDuty finding details, which provide the name of the affected database instance and the corresponding user details. Use the findings to confirm if the behavior is expected or not—for example, the findings might help you identify a user who logs in to their database instance after a long time has passed; a user who logs in to their database instance only occasionally, such as a financial analyst who logs in each quarter; or a suspicious actor who is involved in a successful login attempt that isn’t authorized and potentially compromises the database instance. Review the IP address of the finding. Public IP addresses might signify overly permissive access if it’s not a known network associated with your account.
Figure 4: Finding with details showing Amazon RDS database instance and user details
If the behavior is unexpected, complete the following steps:
Restrict database instance access for the suspected accounts and the source of the login activity. For more information, see Remediating potentially compromised credentials and Restrict network access. You can identify the user in the RDS DB user details section within the finding panel in the console, or within the resource.rdsDbUserDetails of the findings JSON. These user details include user name, application used, database accessed, SSL version, and authentication method.
The following CLI command is an example of how to revoke access to a user in a MySQL database. If the behavior is unexpected, you can revoke the privileges while you assess if the user is malicious.
REVOKE CONNECTION_ADMIN ON *.* FROM 'fakeadmin'@'%';
You can revoke privileges from the user, but when taking this action, you should make sure that the user isn’t vital to your system and that revoking permissions won’t break your production or development application. The following CLI command is an example of how to revoke privileges from a user:
REVOKE ALL PRIVILEGES ON *.* FROM 'fakeadmin'@'%';
If you know that the user isn’t necessary for your database or application to function, then you can remove the user from the system. To make sure that your security team can run forensics, check your company’s incident response policy. If you need help getting started with incident response, see AWS sample incident response playbooks. The following CLI command is an example of how to remove a user:
DROP USER 'fakeadmin'@'%';
Let’s say that you find the behavior unexpected, but the user turns out to be the application user, and making a change to the database credential will break your application. You can use AWS Systems Manager to help in this scenario, in which the affected RDS user is the account that is tied to your application. In many cases, a password rotation can break your application, depending on how you connect. If you rotate the password without notifying your application, the application might require additional cascading changes. You could lose connectivity to your application because the credentials that your application is using to connect to your database didn’t change, and now you are experiencing an outage that will remain until you update the credentials. Systems Manager can tie into your application code to automatically update the rotated database credentials in your application. For more information, see Rotate Amazon RDS database credentials automatically with AWS Secrets Manager.
The following figure shows a CLI command to get a secret from Secrets Manager — for this example, we assume the secret is compromised.
Figure 5: Example compromised credentials
The following figures shows that we have a new set of credentials that replace our old credentials, as indicated by “CreatedDate”.
Figure 6: Example remediated credentials
Remediation step 3: Assess the impact and determine what information was accessed
To learn how to restrict IP access on a security group, see Control traffic to resources using security groups. You can identify the user in the RDS DB user details section within the finding panel in the console, or within the resource.rdsDbUserDetails of the findings JSON. These user details include user name, application used, database accessed, SSL version, and authentication method.
Remediation step 5: Perform root-cause analysis and determine the steps that potentially led to this activity
Implementing a lessons-learned framework and methodology can help improve your incident response capabilities and also help prevent the incident from recurring. By learning from each incident, you can help avoid repeating the same mistakes, exposures, or misconfigurations, which can both improve your security posture and reduce the time lost to preventable situations. To learn more about post-incident activity, see AWS Security Incident Response Guide.
The CredentialAccess:RDS/AnomalousBehavior.successfulBruteForce finding informs you that an anomalous login occurred that is indicative of a successful brute force event, as observed on an RDS database in your AWS environment. Before the anomalous successful login, a consistent pattern of unusual failed login attempts was observed. This indicates that the user and password associated with the RDS database in your account might have been compromised, and a potentially malicious actor might have accessed the RDS database. The Severity of this finding is high. Figure 7 shows an example of this finding.
Figure 7: Example of an anomalous successful brute force finding
How to remediate
This activity indicates that database credentials might have been exposed or compromised. We recommend that you change the password of the associated database user, and review available audit logs for activity performed by the potentially compromised user. A consistent pattern of unusual failed login attempts indicates an overly permissive access policy to the database, or that the database might also have been publicly exposed. AWS recommends that you place the database in a private VPC, and limit the security group rules to allow traffic only from necessary sources. For more information, see Remediating potentially compromised database with successful login events.
We recommend that you take the following steps to remediate this finding
Remediation step 1: Identify the affected database and user
The generated GuardDuty finding provides the name of the affected database instance and the corresponding user details. For more information, see Finding details.
Figure 8: Finding details showing Amazon RDS database instance and user details
Remediation step 2: Identify the source of the failed login attempts
In the generated GuardDuty finding, you can find the IP address, and if it was a public connection, the ASN organization in the Actor section of the finding panel. An autonomous system is a group of one or more IP prefixes (lists of IP addresses accessible on a network) run by one or more network operators that maintain a single, clearly-defined routing policy. Network operators need autonomous system numbers (ASNs) to control routing within their networks and to exchange routing information with other internet service providers.
Figure 9: Action and actor details related to GuardDuty brute force finding
Remediation step 3: Confirm that the behavior is unexpected
Examine if this activity represents an attempt to gain additional unauthorized access to the database instance as follows:
If the source is internal to your network, examine if an application is misconfigured and attempting a connection repeatedly.
If this is an external actor, examine whether the corresponding database instance is public facing or is misconfigured and thus allowing potential malicious actors to attempt to log in with common user names.
If the behavior is unexpected, complete the following steps:
As discussed previously for the CredentialAccess:RDS/AnomalousBehavior.SuccessfulLogin finding, you can restrict access to the database through credentials or network access:
Remediation step 5: Perform root-cause analysis and determine the steps that potentially led to this activity
By learning from each incident, you can help avoid repeating the same mistakes, exposures, or misconfigurations, which can both improve your security posture and reduce time lost to preventable situations.
Conclusion
In this post, you learned about the new GuardDuty RDS Protection feature and how to understand, operationalize, and respond to the new findings. You can enable this feature through the GuardDuty console, CLI, or APIs to start monitoring your Amazon RDS workloads today.
If you’ve created EventBridge rules to send findings from GuardDuty to a target, make sure that you’ve configured your rules to deliver the newly added findings. After you enable GuardDuty findings, consider creating IR playbooks, doing tabletops and AWS gamedays, and mapping out what you want to automate. For more information, see the AWS Security Incident Response Guide and AWS Incident Response Playbook resources. To gain hands-on experience with different AWS Security services, see AWS Activation Days. The Activation Days workshops begin with hands-on work with different services in sandbox accounts, and then take you through the steps to deploy them across your organization.
To make it more efficient for you to operate securely on AWS, we are committed to continually improving GuardDuty, and we value your feedback. If you have feedback about this post, submit comments in the Comments section below. If you have questions about this post, start a new thread on AWS re:Post or contact AWS Support.
Want more AWS Security news? Follow us on Twitter.
This is a guest blog post co-written with Corey Johnson from Huron.
Having an accurate and up-to-date inventory of all technical assets helps an organization ensure it can keep track of all its resources with metadata information such as their assigned oners, last updated date, used by whom, how frequently and more. It helps engineers, analysts and businesses access the most up-to-date release of the software asset that bring accuracy to the decision-making process. By keeping track of this information, organizations will be able to identify technology gaps, refresh cycles, and expire assets as needed for archival.
In addition, an inventory of all assets is one of the foundational elements of an organization that facilitates the security and compliance team to audit the assets for improving privacy, security posture and mitigate risk to ensure the business operations run smoothly. Organizations may have different ways of maintaining an asset inventory, that may be an Excel spreadsheet or a database with a fully automated system to keep it up-to-date, but with a common objective of keeping it accurate. Even if organizations can follow manual approaches to update the inventory records but it is recommended to build automation, so that it is accurate at any point of time.
The DevOps practices which revolutionized software engineering in the last decade have yet to come to the world of Business Intelligence solutions. Business intelligence tools by their nature use a paradigm of UI driven development with code-first practices being secondary or nonexistent. As the need for applications that can leverage the organizations internal and client data increases, the same DevOps practices (BIOps) can drive and delivery quality insights more reliably
In this post, we walk you through a solution that Huron and manage lifecycle for all Amazon QuickSight resources across the organization by collaborating with AWS Data Lab Resident Architect & AWS Professional Services team.
About Huron
Huron is a global professional services firm that collaborates with clients to put possible into practice by creating sound strategies, optimizing operations, accelerating digital transformation, and empowering businesses and their people to own their future. By embracing diverse perspectives, encouraging new ideas, and challenging the status quo, Huron creates sustainable results for the organizations we serve. To help address its clients’ growing cloud needs, Huron is an AWS Partner.
Use Case Overview
Huron’s Business Intelligence use case represents visualizations as a service, where Huron has core set of visualizations and dashboards available as products for its customers. The products exist in different industry verticals (healthcare, education, commercial) with independent development teams. Huron’s consultants leverage the products to provide insights as part of consulting engagements. The insights from the product help Huron’s consultants accelerate their customer’s transformation. As part of its overall suite of offerings, there are product dashboards that are featured in a software application following a standardized development lifecycle. In addition, these product dashboards may be forked for customer-specific customization to support a consulting engagement while still consuming from Huron’s productized data assets and datasets. In the next stage of the cycle, Huron’s consultants experiment with new data sources and insights that in turn fed back into the product dashboards.
When changes are made to a product analysis, challenges arise when a base reference analysis gets updated because of new feature releases or bug fixes, and all the customer visualizations that are created from it also need to be updated. To maintain the integrity of embedded visualizations, all metadata and lineage must be available to the parent application. This access to the metadata supports the need for updating visuals based on changes as well as automating row and column level security ensuring customer data is properly governed.
In addition, few customers request customizations on top of the base visualizations, for which Huron team needs to create a replica of the base reference and then customize it for the customer. These are maintained by Huron’s in the field consultants rather than the product development team. These customer specific visualizations create operational overhead because they require Huron to keep track of new customer specific visualizations and maintain them for future releases when the product visuals change.
Huron leverages Amazon QuickSight for their Business Intelligence (BI) reporting needs, enabling them to embed visualizations at scale with higher efficiency and lower cost. A large attraction for Huron to adopt QuickSight came from the forward-looking API capabilities that enable and set the foundation for a BIOps culture and technical infrastructure. To address the above requirement, Huron Global Product team decided to build a QuickSight Asset Tracker and QuickSight Asset Deployment Pipeline.
The QuickSight Asset tracker serves as a catalogue of all QuickSight resources (datasets, analysis, templates, dashboards etc.) with its interdependent relationship. It will help;
Create an inventory of all QuickSight resources across all business units
Enable dynamic embedding of visualizations and dashboards based on logged in user
Enable dynamic row and column level security on the dashboards and visualizations based on the logged-in user
Meet compliance and audit requirements of the organization
Maintain the current state of all customer specific QuickSight resources
The solution integrates an AWS CDK based pipeline to deploy QuickSight Assets that:
Supports Infrastructure-as-a-code for QuickSight Asset Deployment and enables rollbacks if required.
Enables separation of development, staging and production environments using QuickSight folders that reduces the burden of multi-account management of QuickSight resources.
Enables a hub-and-spoke model for Data Access in multiple AWS accounts in a data mesh fashion.
The QuickSight Asset Tracker was built as an independent service, which was deployed in a shared AWS service account that integrated Amazon Aurora Serverless PostgreSQL to store metadata information, AWS Lambda as the serverless compute and Amazon API Gateway to provide the REST API layer.
It also integrated AWS CDK and AWS CloudFormation to deploy the product and customer specific QuickSight resources and keep them in consistent and stable state. The metadata of QuickSight resources, created using either AWS console or the AWS CDK based deployment were maintained in Amazon Aurora database through the QuickSight Asset Tracker REST API service.
The CDK based deployment pipeline is triggered via a CI/CD pipeline which performs the following functions:
Takes the ARN of the QuickSight assets (dataset, analysis, etc.)
Describes the asset and dependent resources (if selected)
Creates a copy of the resource in another environment (in this case a QuickSight folder) using CDK
The solution architecture integrated the following AWS services.
Amazon Aurora Serverless integrated as the backend database to store metadata information of all QuickSight resources with customer and product information they are related to.
Amazon QuickSight as the BI service using which visualization and dashboards can be created and embedded into the online applications.
AWS Lambda as the serverless compute service that gets invoked by online applications using Amazon API Gateway service.
Amazon SQS to store customer request messages, so that the AWS CDK based pipeline can read from it for processing.
AWS CodeCommit is integrated to store the AWS CDK deployment scripts and AWS CodeBuild, AWS CloudFormation integrated to deploy the AWS resources using an infrastructure as a code approach.
AWS CloudTrail is integrated to audit user actions and trigger Amazon EventBridge rules when a QuickSight resource is created, updated or deleted, so that the QuickSight Asset Tracker is up-to-date.
Amazon S3 integrated to store metadata information, which is used by AWS CDK based pipeline to deploy the QuickSight resources.
AWS LakeFormation enables cross-account data access in support of the QuickSight Data Mesh
The following provides a high-level view of the solution architecture.
Architecture Walkthrough:
The following provides a detailed walkthrough of the above architecture.
QuickSight Dataset, Template, Analysis, Dashboard and visualization relationships:
Steps 1 to 2 represent QuickSight reference analysis reading data from different data sources that may include Amazon S3, Amazon Athena, Amazon Redshift, Amazon Aurora or any other JDBC based sources.
Step 3 represents QuickSight templates being created from reference analysis when a customer specific visualization needs to be created and step 4.1 to 4.2 represents customer analysis and dashboards being created from the templates.
Steps 7 to 8 represent QuickSight visualizations getting generated from analysis/dashboard and step 6 represents the customer analysis/dashboard/visualizations referring their own customer datasets.
Step 10 represents a new fork being created from the base reference analysis for a specific customer, which will create a new QuickSight template and reference analysis for that customer.
Step 9 represents end users accessing QuickSight visualizations.
Asset Tracker REST API service:
Step 15.2 to 15.4 represents the Asset Tracker service, which is deployed in a shared AWS service account, where Amazon API Gateway provides the REST API layer, which invokes AWS Lambda function to read from or write to backend Aurora database (Aurora Serverless v2 – PostgreSQL engine). The database captures all relationship metadata between QuickSight resources, its owners, assigned customers and products.
Online application – QuickSight asset discovery and creation
Step 15.1 represents the front-end online application reading QuickSight metadata information from the Asset Tracker service to help customers or end users discover visualizations available and be able to dynamically render based on the user login.
Step 11 to 12 represents the online application requesting creation of new QuickSight resources, which pushes requests to Amazon SQS and then AWS Lambda triggers AWS CodeBuild to deploy new QuickSight resources. Step 13.1 and 13.2 represents the CDK based pipeline maintaining the QuickSight resources to keep them in a consistent state. Finally, the AWS CDK stack invokes the Asset Tracker service to update its metadata as represented in step 13.3.
Tracking QuickSight resources created outside of the AWS CDK Stack
Step 14.1 represents users creating QuickSight resources using the AWS Console and step 14.2 represents that activity getting logged into AWS CloudTrail.
Step 14.3 to 14.5 represents triggering EventBridge rule for CloudTrail activities that represents QuickSight resource being created, updated or deleted and then invoke the Asset Tracker REST API to register the QuickSight resource metadata.
Architecture Decisions:
The following are few architecture decisions we took while designing the solution.
Choosing Aurora database for Asset Tracker: We have evaluated Amazon Neptune for the Asset Tracker database as most of the metadata information we capture are primarily maintaining relationship between QuickSight resources. But when we looked at the query patterns, we found the query pattern is always just one level deep to find who is the parent of a specific QuickSight resource and that can be solved with a relational database’s Primary Key / Foreign Key relationship and with simple self-join SQL query. Knowing the query pattern does not require a graph database, we decided to go with Amazon Aurora to keep it simple, so that we can avoid introducing a new database technology and can reduce operational overhead of maintaining it. In future as the use case evolve, we can evaluate the need for a Graph database and plan for integrating it. For Amazon Aurora, we choose Amazon Aurora Serverless as the usage pattern is not consistent to reserve a server capacity and the serverless tech stack will help reduce operational overhead.
Decoupling Asset Tracker as a common REST API service: The Asset Tracker has future scope to be a centralized metadata layer to keep track of all the QuickSight resources across all business units of Huron. So instead of each business unit having its own metadata database, if we build it as a service and deploy it in a shared AWS service account, then we will get benefit from reduced operational overhead, duplicate infrastructure cost and will be able to get a consolidated view of all assets and their integrations. The service provides the ability of applications to consume metadata about the QuickSight assets and then apply their own mapping of security policies to the assets based on their own application data and access control policies.
Central QuickSight account with subfolder for environments: The choice was made to use a central account which reduces developer friction of having multiple accounts with multiple identities, end users having to manage multiple accounts and access to resources. QuickSight folders allow for appropriate permissions for separating “environments”. Furthermore, by using folder-based sharing with QuickSight groups, users with appropriate permissions already have access to the latest versions of QuickSight assets without having to share their individual identities.
The solution included an automated Continuous Integration (CI) and Continuous Deployment (CD) pipeline to deploy the resources from development to staging and then finally to production. The following provides a high-level view of the QuickSight CI/CD deployment strategy.
Aurora Database Tables and Reference Analysis update flow
The following are the database tables integrated to capture the QuickSight resource metadata.
QS_Dataset: This captures metadata of all QuickSight datasets that are integrated in the reference analysis or customer analysis. This includes AWS ARN (Amazon Resource Name), data source type, ID and more.
QS_Template: This table captures metadata of all QuickSight templates, from which customer analysis and dashboards will be created. This includes AWS ARN, parent reference analysis ID, name, version number and more.
QS_Folder: This table captures metadata about QuickSight folders which logically groups different visualizations. This includes AWS ARN, name, and description.
QS_Analysis: This table captures metadata of all QuickSight analysis that includes AWS ARN, name, type, dataset IDs, parent template ID, tags, permissions and more.
QS_Dashboard: This table captures metadata information of QuickSight dashboards that includes AWS ARN, parent template ID, name, dataset IDs, tags, permissions and more.
QS_Folder_Asset_Mapping: This table captures folder to QuickSight asset mapping that includes folder ID, Asset ID, and asset type.
As the solution moves to the next phase of implementation, we plan to introduce additional database tables to capture metadata information about QuickSight sheets and asset mapping to customers and products. We will extend the functionality to support visual based embedding to enable truly integrated customer data experiences where embedded visuals mesh with the native content on a web page.
While explaining the use case, we have highlighted it creates a challenge when a base reference analysis gets updated and we need to track the templates that are inherited from it make sure the change is pushed to the linked customer analysis and dashboards. The following example scenarios explains, how the database tables change when a reference analysis is updated.
Example Scenario: When “reference analysis” is updated with a new release
When a base reference analysis is updated because of a new feature release, then a new QuickSight reference analysis and template needs to be created. Then we need to update all customer analysis and dashboard records to point to the new template ID to form the lineage.
The following sequential steps represent the database changes that needs to happen.
Insert a new record to the “Analysis” table to represent the new reference analysis creation.
Insert a new record to the “Template” table with new reference analysis ID as parent, created in step 1.
Retrieve “Analysis” and “Dashboard” table records that points to previous template ID and then update those records with the new template ID, created in step 2.
How will it enable a more robust embedding experience
The QuickSight asset tracker integration with Huron’s products provide users with a personalized, secure and modern analytics experience. When user’s login through Huron’s online application, it will use logged in user’s information to dynamically identify the products they are mapped to and then render the QuickSight visualizations & dashboards that the user is entitled to see. This will improve user experience, enable granular permission management and will also increase performance.
How AWS collaborated with Huron to help build the solution
AWS team collaborated with Huron team to design and implement the solution. AWS Data Lab Resident Architect collaborated with Huron’s lead architect for initial architecture design that compared different options for integration and deriving tradeoffs between them, before finalizing the final architecture. Then with the help of AWS Professional service engineer, we could build the base solution that can be extended by Huron team to roll it out to all business units and integrate additional reporting features on top of it.
The AWS Data Lab Resident Architect program provides AWS customers with guidance in refining and executing their data strategy and solutions roadmap. Resident Architects are dedicated to customers for 6 months, with opportunities for extension, and help customers (Chief Data Officers, VPs of Data Architecture, and Builders) make informed choices and tradeoffs about accelerating their data and analytics workloads and implementation.
The AWS Professional Services organization is a global team of experts that can help customers realize their desired business outcomes when using the AWS Cloud. The Professional Services team work together with customer’s team and their chosen member of the AWS Partner Network (APN) to execute their enterprise cloud computing initiatives.
Next Steps
Huron has rolled out the solution for one business unit and as a next step we plan to roll it out to all business units, so that the asset tracker service is populated with assets available across all business units of the organization to provide consolidated view.
In addition, Huron will be building a reporting layer on top of the Amazon Aurora asset tracker database, so that the leadership has a way to discover assets by business unit, by owner, created between specific date range or the reports that are not updated since a while.
Once the asset tracker is populated with all QuickSight assets, it will be integrated into the front-end online application that can help end users discover existing assets and request creation of new assets.
Newer QuickSight API’s such as assets-as-a-bundle and assets-as-code further accelerate the capabilities of the service by improving the development velocity and reliability of making changes.
Conclusion
This blog explained how Huron built an Asset Tracker to keep track of all QuickSight resources across the organization. This solution may provide a reference to other organizations who would like to build an inventory of visualization reports, ML models or other technical assets. This solution leveraged Amazon Aurora as the primary database, but if an organization would also like to build a detailed lineage of all the assets to understand how they are interrelated then they can consider integrating Amazon Neptune as an alternate database too.
If you have a similar use case and would like to collaborate with AWS Data Analytics Specialist Architects to brainstorm on the architecture, rapidly prototype it and implement a production ready solution then connect with your AWS Account Manager or AWS Solution Architect to start an engagement with AWS Data Lab team.
About the Authors
Corey Johnson is the Lead Data Architect at Huron, where he leads its data architecture for their Global Products Data and Analytics initiatives.
Sakti Mishra is a Principal Data Analytics Architect at AWS, where he helps customers modernize their data architecture, help define end to end data strategy including data security, accessibility, governance, and more. He is also the author of the book Simplify Big Data Analytics with Amazon EMR. Outside of work, Sakti enjoys learning new technologies, watching movies, and visiting places with family.
Inventory management is a critical function for any business that deals with physical products. The primary challenge businesses face with inventory management is balancing the cost of holding inventory with the need to ensure that products are available when customers demand them.
The consequences of poor inventory management can be severe. Overstocking can lead to increased holding costs and waste, while understocking can result in lost sales, reduced customer satisfaction, and damage to the business’s reputation. Inefficient inventory management can also tie up valuable resources, including capital and warehouse space, and can impact profitability.
Forecasting is another critical component of effective inventory management. Accurately predicting demand for products allows businesses to optimize inventory levels, minimize stockouts, and reduce holding costs. However, forecasting can be a complex process, and inaccurate predictions can lead to missed opportunities and lost revenue.
To address these challenges, businesses need an inventory management and forecasting solution that can provide real-time insights into inventory levels, demand trends, and customer behavior. Such a solution should use the latest technologies, including Internet of Things (IoT) sensors, cloud computing, and machine learning (ML), to provide accurate, timely, and actionable data. By implementing such a solution, businesses can improve their inventory management processes, reduce holding costs, increase revenue, and enhance customer satisfaction.
In this post, we discuss how to streamline inventory management forecasting systems with AWS managed analytics, AI/ML, and database services.
Solution overview
In today’s highly competitive business landscape, it’s essential for retailers to optimize their inventory management processes to maximize profitability and improve customer satisfaction. With the proliferation of IoT devices and the abundance of data generated by them, it has become possible to collect real-time data on inventory levels, customer behavior, and other key metrics.
To take advantage of this data and build an effective inventory management and forecasting solution, retailers can use a range of AWS services. By collecting data from store sensors using AWS IoT Core, ingesting it using AWS Lambda to Amazon Aurora Serverless, and transforming it using AWS Glue from a database to an Amazon Simple Storage Service (Amazon S3) data lake, retailers can gain deep insights into their inventory and customer behavior.
With Amazon Athena, retailers can analyze this data to identify trends, patterns, and anomalies, and use Amazon ElastiCache for customer-facing applications with reduced latency. Additionally, by building a point of sales application on Amazon QuickSight, retailers can embed customer 360 views into the application to provide personalized shopping experiences and drive customer loyalty.
Finally, we can use Amazon SageMaker to build forecasting models that can predict inventory demand and optimize stock levels.
With these AWS services, retailers can build an end-to-end inventory management and forecasting solution that provides real-time insights into inventory levels and customer behavior, enabling them to make informed decisions that drive business growth and customer satisfaction.
The following diagram illustrates a sample architecture.
With the appropriate AWS services, your inventory management and forecasting system can have optimized collection, storage, processing, and analysis of data from multiple sources. The solution includes the following components.
Data ingestion and storage
Retail businesses have event-driven data that requires action from downstream processes. It’s critical for an inventory management application to handle the data ingestion and storage for changing demands.
The data ingestion process is typically triggered by an event such as an order being placed, kicking off the inventory management workflow, which requires actions from backend services. Developers are responsible for the operational overhead of trying to maintain the data ingestion load from an event driven-application.
The volume and velocity of data can change in the retail industry each day. Events like Black Friday or a new campaign can create volatile demand in what is required to process and store the inventory data. Serverless services designed to scale to businesses’ needs help reduce the architectural and operational challenges that are driven from high-demand retail applications.
Understanding the scaling challenges that occur when inventory demand spikes, we can deploy Lambda, a serverless, event-driven compute service, to trigger the data ingestion process. As inventory events occur like purchases or returns, Lambda automatically scales compute resources to meet the volume of incoming data.
After Lambda responds to the inventory action request, the updated data is stored in Aurora Serverless. Aurora Serverless is a serverless relational database that is designed to scale to the application’s needs. When peak loads hit during events like Black Friday, Aurora Serverless deploys only the database capacity necessary to meet the workload.
Inventory management applications have ever-changing demands. Deploying serverless services to handle the ingestion and storage of data will not only optimize cost but also reduce the operational overhead for developers, freeing up bandwidth for other critical business needs.
Data performance
Customer-facing applications require low latency to maintain positive user experiences with microsecond response times. ElastiCache, a fully managed, in-memory database, delivers high-performance data retrieval to users.
In-memory caching provided by ElastiCache is used to improve latency and throughput for read-heavy applications that online retailers experience. By storing critical pieces of data in-memory like commonly accessed product information, the application performance improves. Product information is an ideal candidate for a cached store due to data staying relatively the same.
Functionality is often added to retail applications to retrieve trending products. Trending products can be cycled through the cache dependent on customer access patterns. ElastiCache manages the real-time application data caching, allowing your customers to experience microsecond response times while supporting high-throughput handling of hundreds of millions of operations per second.
Data transformation
Data transformation is essential in inventory management and forecasting solutions for both data analysis around sales and inventory, as well as ML for forecasting. This is because raw data from various sources can contain inconsistencies, errors, and missing values that may distort the analysis and forecast results.
In the inventory management and forecasting solution, AWS Glue is recommended for data transformation. The tool addresses issues such as cleaning, restructuring, and consolidating data into a standard format that can be easily analyzed. As a result of the transformation, businesses can obtain a more precise understanding of inventory, sales trends, and customer behavior, influencing data-driven decisions to optimize inventory management and sales strategies. Furthermore, high-quality data is crucial for ML algorithms to make accurate forecasts.
By transforming data, organizations can enhance the accuracy and dependability of their forecasting models, ultimately leading to improved inventory management and cost savings.
Data analysis
Data analysis has become increasingly important for businesses because it allows leaders to make informed operational decisions. However, analyzing large volumes of data can be a time-consuming and resource-intensive task. This is where Athena come in. With Athena, businesses can easily query historical sales and inventory data stored in S3 data lakes and combine it with real-time transactional data from Aurora Serverless databases.
The federated capabilities of Athena allow businesses to generate insights by combining datasets without the need to build ETL (extract, transform, and load) pipelines, saving time and resources. This enables businesses to quickly gain a comprehensive understanding of their inventory and sales trends, which can be used to optimize inventory management and forecasting, ultimately improving operations and increasing profitability.
With Athena’s ease of use and powerful capabilities, businesses can quickly analyze their data and gain valuable insights, driving growth and success without the need for complex ETL pipelines.
Forecasting
Inventory forecasting is an important aspect of inventory management for businesses that deal with physical products. Accurately predicting demand for products can help optimize inventory levels, reduce costs, and improve customer satisfaction. ML can help simplify and improve inventory forecasting by making more accurate predictions based on historical data.
SageMaker is a powerful ML platform that you can use to build, train, and deploy ML models for a wide range of applications, including inventory forecasting. In this solution, we use SageMaker to build and train an ML model for inventory forecasting, covering the basic concepts of ML, the data preparation process, model training and evaluation, and deploying the model for use in a production environment.
The solution also introduces the concept of hierarchical forecasting, which involves generating coherent forecasts that maintain the relationships within the hierarchy or reconciling incoherent forecasts. The workshop provides a step-by-step process for using the training capabilities of SageMaker to carry out hierarchical forecasting using synthetic retail data and the scikit-hts package. The FBProphet model was used along with bottom-up and top-down hierarchical aggregation and disaggregation methods. We used Amazon SageMaker Experiments to train multiple models, and the best model was picked out of the four trained models.
Although the approach was demonstrated on a synthetic retail dataset, you can use the provided code with any time series dataset that exhibits a similar hierarchical structure.
Security and authentication
The solution takes advantage of the scalability, reliability, and security of AWS services to provide a comprehensive inventory management and forecasting solution that can help businesses optimize their inventory levels, reduce holding costs, increase revenue, and enhance customer satisfaction. By incorporating user authentication with Amazon Cognito and Amazon API Gateway, the solution ensures that the system is secure and accessible only by authorized users.
Next steps
The next step to build an inventory management and forecasting solution on AWS would be to go through the Inventory Management workshop. In the workshop, you will get hands-on with AWS managed analytics, AI/ML, and database services to dive deep into an end-to-end inventory management solution. By the end of the workshop, you will have gone through the configuration and deployment of the critical pieces that make up an inventory management system.
Conclusion
In conclusion, building an inventory management and forecasting solution on AWS can help businesses optimize their inventory levels, reduce holding costs, increase revenue, and enhance customer satisfaction. With AWS services like IoT Core, Lambda, Aurora Serverless, AWS Glue, Athena, ElastiCache, QuickSight, SageMaker, and Amazon Cognito, businesses can use scalable, reliable, and secure technologies to collect, store, process, and analyze data from various sources.
The end-to-end solution is designed for individuals in various roles, such as business users, data engineers, data scientists, and data analysts, who are responsible for comprehending, creating, and overseeing processes related to retail inventory forecasting. Overall, an inventory management and forecasting solution on AWS can provide businesses with the insights and tools they need to make data-driven decisions and stay competitive in a constantly evolving retail landscape.
About the Authors
Jason D’Alba is an AWS Solutions Architect leader focused on databases and enterprise applications, helping customers architect highly available and scalable solutions.
Navnit Shukla is an AWS Specialist Solution Architect, Analytics, and is passionate about helping customers uncover insights from their data. He has been building solutions to help organizations make data-driven decisions.
Vetri Natarajan is a Specialist Solutions Architect for Amazon QuickSight. Vetri has 15 years of experience implementing enterprise business intelligence (BI) solutions and greenfield data products. Vetri specializes in integration of BI solutions with business applications and enable data-driven decisions.
Sindhura Palakodety is a Solutions Architect at AWS. She is passionate about helping customers build enterprise-scale Well-Architected solutions on the AWS platform and specializes in Data Analytics domain.
A new week starts, and Spring is almost here! If you’re curious about AWS news from the previous seven days, I got you covered.
Last Week’s Launches Here are the launches that got my attention last week:
Amazon S3 – Last week there was AWS Pi Day 2023 celebrating 17 years of innovation since Amazon S3 was introduced on March 14, 2006. For the occasion, the team released many new capabilities:
Amazon S3 has also simplified private connectivity from on-premises networks: with private DNS for S3, on-premises applications can use AWS PrivateLink to access S3 over an interface endpoint, while requests from your in-VPC applications access S3 using gateway endpoints.
We released Mountpoint for Amazon S3, a high performance open source file client. Read more in the blog. Note that Mountpoint isn’t a general-purpose networked file system, and comes with some restrictions on file operations.
Amazon Neptune – Now offers a graph summary API to help understand important metadata about property graphs (PG) and resource description framework (RDF) graphs. Neptune added support for Slow Query Logs to help identify queries that need performance tuning.
Amazon OpenSearch Service – The team introduced security analytics that provides new threat monitoring, detection, and alerting features. The service now supports OpenSearchversion 2.5 that adds several new features such as support for Point in Time Search and improvements to observability and geospatial functionality.
AWS Lake Formation and Apache Hive on Amazon EMR – Introduced fine-grained access controls that allow data administrators to define and enforce fine-grained table and column level security for customers accessing data via Apache Hive running on Amazon EMR.
Customers are adopting microservices architecture to build innovative and scalable applications on Amazon Web Services (AWS). These microservices applications are deployed across multiple AWS services, and customers are looking for comprehensive observability solutions that can help them effectively monitor and manage the performance of their applications in real-time.
IBM Instana is a fully automated application performance management (APM) solution, available to customers as a fully managed software as a service (SaaS) solution on AWS. It is specifically designed to help customers address the challenges of monitoring microservices and cloud-native applications in real-time. It uses artificial intelligence and machine learning to provide detailed insights into the health and behavior of applications, allowing developers and IT teams to gain real-time insights into their microservices applications, optimize performance, and quickly identify and troubleshoot issues.
This post explains the capabilities of IBM Instana to automatically collect observability metrics, traces, and events from microservices deployed on AWS cloud, as well as on-premises, to provide full visibility into the performance of individual components and applications as a whole.
IBM Instana solution overview
IBM Instana is designed to be highly scalable and adaptable to changing microservices applications environments. Its architecture (Figure 1) consists of several components that work together to provide comprehensive monitoring for microservices and cloud-native applications.
Instana’s main building blocks are host agents and agent sensors that are deployed in a customer’s AWS account and responsible for collecting, aggregating, and sending detailed monitoring information of applications and AWS services to the Instana SaaS backend.
The Instana SaaS backend services provide several key components, including data collectors, storage services, analytics engines, and user interfaces. It allows customers to process and analyze data in real-time, generate actionable insights, have a comprehensive view of their applications and infrastructure performance, enabling them to quickly identify and resolve issues and improve their overall operations.
Figure 1. IBM Instana architecture on AWS
Monitoring data
Instana monitors and observes microservices and cloud-native applications by collecting beacons, traces, and one-second metrics:
Beacons are small monitoring payloads that are transmitted by a JavaScript agent to the Instana servers, modeling specific events occurring within the lifecycle of a page view of a website; for example, page loading, resource retrieval, and HTTP requests.
Traces are detailed records of the requests and transactions that flow through a microservice architecture. They record the sequence of events that occur when a request is processed, including the services that are involved, the duration of each service, and any errors or exceptions that occur. Instana automatically correlates traces across services to provide a complete view of an entire transaction. This allows for easy identification and diagnosis of performance issues.
Metrics are numerical values that represent the performance and resource utilization of a microservice or infrastructure component. Metrics are collected by Instana Agents and sent to the Instana backend at regular intervals. Instana Agents collect hundreds of different metrics, including (but not limited to) CPU usage, memory usage, network traffic, and disk I/O.
This information is captured by Instana agents and sensors, which also collect application configurations and events, plus discover application building blocks, including clusters, containers, and services.
Once Instana agents are running, they automatically detect applications and services, such as containers running on Amazon EKS, and processes like Nginx, NodeJS, Spring Boot, Postgres, Elasticsearch, or Cassandra. For each component detected, different Instana sensors are automatically downloaded, installed, and configured to monitor the environment.
Instana sensors are small programs that are designed to attach and monitor one specific technology and pass their data to the agent. They are automatically managed, updated, loaded, and unloaded by the host agent.
Instana also provides tracers, which are used with runtimes like Java, .NET, NodeJS, plus others. They modify code execution to capture logs, traces at request level, and send those back to the Instana agent.
With the use of sensors, the host agent collects configuration data and monitors the applications it has detected. The host agent also handles communications with the Instana SaaS backend services. It collects, aggregates and sends logs, traces and records metrics (such as response times, error rates, and resource utilization) every second to the Instana SaaS backend in real-time, using secure and efficient communication protocols.
IBM Instana SaaS
The Instana SaaS backend is the heart of the Instana APM solution and responsible for processing, storing, and analyzing the monitoring data collected from the Instana agents and sensors installed in the customer’s infrastructure.
It consists of several components and services that work together to provide real-time monitoring and analysis of microservices applications, including:
Data collectors: Receive and process data from the Instana agents and sensors, and store it in the Instana backend for further analysis.
Analytics engine: Analyzes the data collected by the agents and sensors to provide insights into the performance and health of the microservices applications.
User interface: Web-based interface that customers use to view and analyze their monitoring data.
Alerting engine: Generates alerts when thresholds or anomalies are detected in the monitoring data.
Data storage: Time-series database that stores the monitoring data collected by the agents and sensors. Allows customers to query and analyze the data in real-time.
Integrations: Integrates with various third-party tools, such as Slack, PagerDuty, and ServiceNow, providing seamless alerting and incident management.
IBM Instana backend: making sense of the situation in real time
The Instana SaaS platform automatically ingests data from agents and continuously updates a dependency map (Figure 2). This map presents every dependency in context, giving users an easy way to understand the interrelationships between application components and services.
This understanding enables users to identify the upstream and downstream impacts of any issue, ensuring that they stay informed about any potential impacts.
Figure 2. An example of an IBM Instana dependency map
Instana traces every request end-to-end without sampling. The traces are analyzed in real-time, providing metrics that make any performance problems immediately visible. In the event of an incident, Instana can illustrate how a single issue can generate a ripple effect and impact a number of directly and indirectly connected services. Using the relationship information from the Dynamic Graph, Instana’s automatic root-cause analysis can precisely aggregate the individual issues into a single incident.
Figure 3. Applications monitoring with IBM Instana
Developers, IT operations, or site reliability engineers (SREs) can access the Instana backend end-user monitoring interface (Figure 3) or end-user monitoring (EUM) interface (Figure 4) to view monitoring data of their workloads. These can be websites, mobile applications, AWS services, and infrastructure levels. From this UI, these personas can access service dashboards that show key performance indicators (KPIs), like response time and error rate.
Figure 4. End-user monitoring with IBM Instana
The following actions demonstrate how an EUM for a JavaScript application, deployed to Amazon S3 can be completed:
Developers inject Instana JavaScript code (Figure 5) into the static website (HTML).
When a user visits the website, the JavaScript agent sends beacons to the Instana backend.
Dashboards show specific events of the website lifecycle, including page loading, JS errors, and HTTP requests.
Teams access Instana UI to check performance matrices. They can configure Smart Alerts with custom alerting policies based on specific metrics and KPIs.
Smart Alerts can send alerts via various channels, such as email, Slack, or IBM Watson AIOps Webhook.
In case of an incident, teams can use Instana to retrieve various performance metrics for root-cause analysis.
Developers can resolve the issues and apply the patch.
Figure 5. IBM Instana EUM JavaScript agent
Instana also offers Smart Alerts (Figure 6) to provide a more intuitive process of managing alerts. With Smart Alerts, customers can automatically generate alerting configurations using relevant KPIs and automatic threshold detection for use cases like website slowness or website errors.
Figure 6. IBM Instana Smart Alerts
Conclusion
In this post, we discussed how IBM Instana provides a comprehensive monitoring solution with the right tools to help you implement a real-time observability and monitoring solution. It allows you to gain insight into your microservices and cloud-native applications, including visibility into AWS services, containers, on-premises infrastructure, and other technologies. Instana can quickly identify and resolve issues before they impact end-users, ensuring that your applications are performing optimally.
As an IT administrator, developer, or business owner, IBM Instana on AWS give a deeper understanding of your applications and help you make data-driven decisions to improve overall performance.
To provide the best experiences, we use technologies like cookies to store and/or access device information. Consenting to these technologies will allow us to process data such as browsing behavior or unique IDs on this site. Not consenting or withdrawing consent, may adversely affect certain features and functions.
Functional
Always active
The technical storage or access is strictly necessary for the legitimate purpose of enabling the use of a specific service explicitly requested by the subscriber or user, or for the sole purpose of carrying out the transmission of a communication over an electronic communications network.
Preferences
The technical storage or access is necessary for the legitimate purpose of storing preferences that are not requested by the subscriber or user.
Statistics
The technical storage or access that is used exclusively for statistical purposes.The technical storage or access that is used exclusively for anonymous statistical purposes. Without a subpoena, voluntary compliance on the part of your Internet Service Provider, or additional records from a third party, information stored or retrieved for this purpose alone cannot usually be used to identify you.
Marketing
The technical storage or access is required to create user profiles to send advertising, or to track the user on a website or across several websites for similar marketing purposes.


 Shabi Abbas Sayed is a Senior Technical Account Manager at AWS. He is passionate about building scalable data warehouses and big data solutions working closely with the customers. He works with large ISVs customers, in helping them build and operate secure, resilient, scalable, and high-performance SaaS applications in the cloud.
 Gaurav Singh is a Senior Solutions Architect at AWS, specializing in AI/ML and Generative AI. Based in Pune, India, he focuses on helping customers build, deploy, and migrate ML production workloads to SageMaker at scale. In his spare time, Gaurav loves to explore nature, read, and run.
 Happy New Year! Cloud technologies, machine learning, and generative AI have become more accessible, impacting nearly every aspect of our lives. Amazon CTO Dr. Werner Vogels offers four tech predictions for 2024 and beyond:


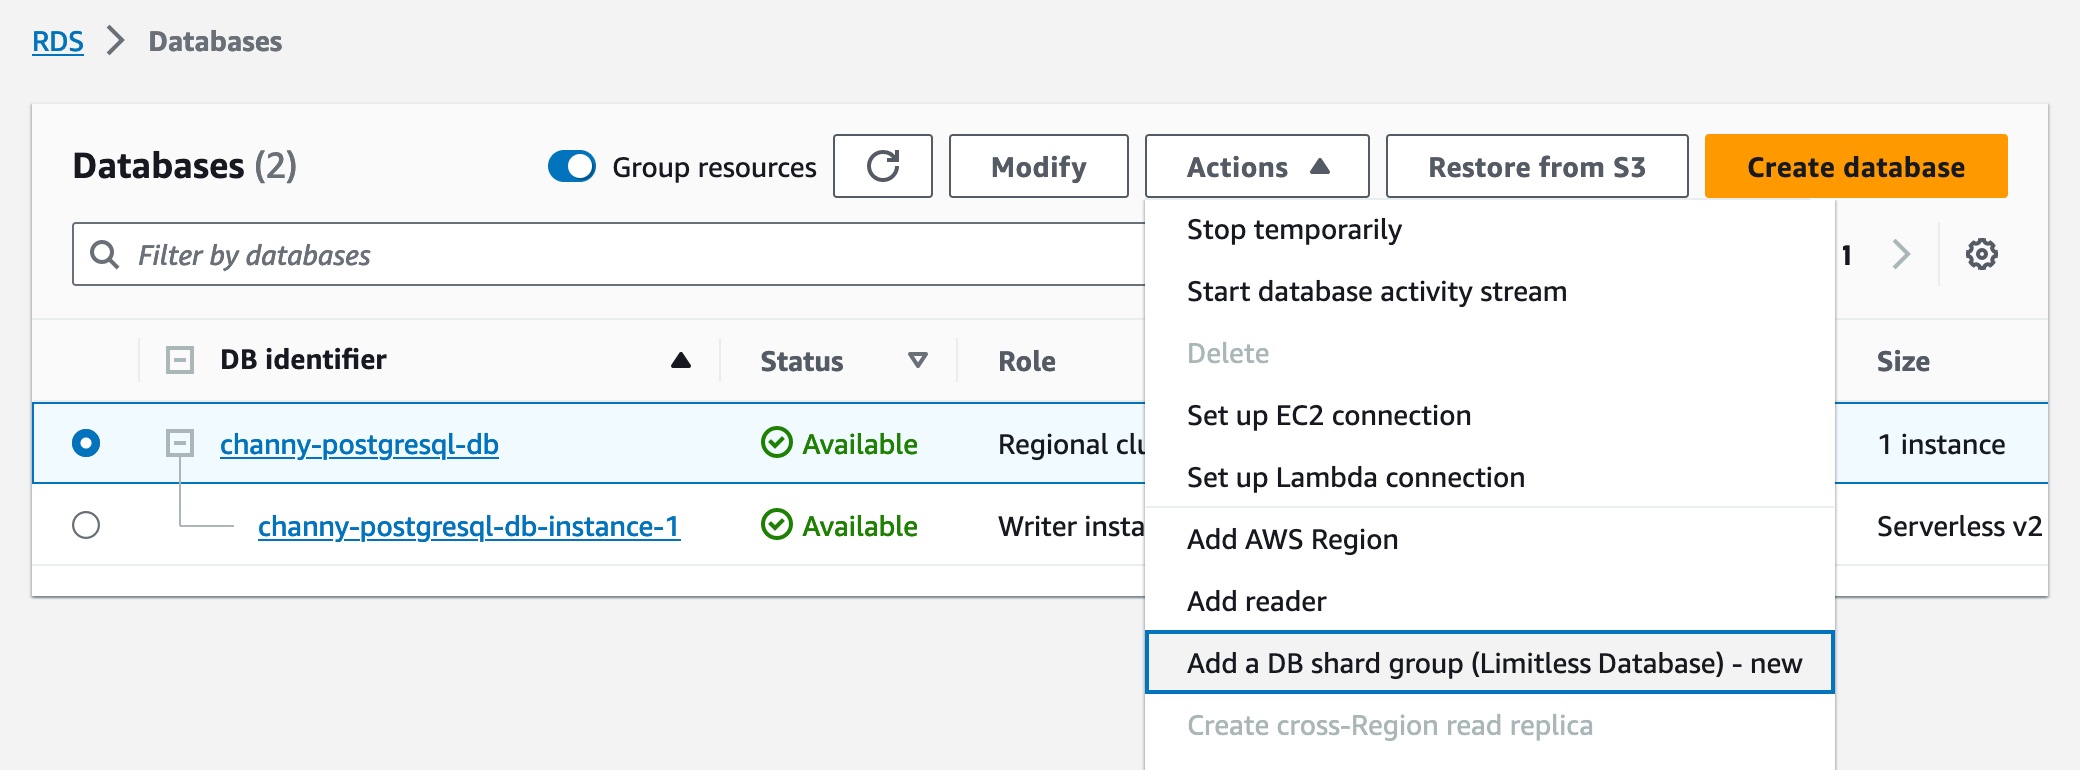
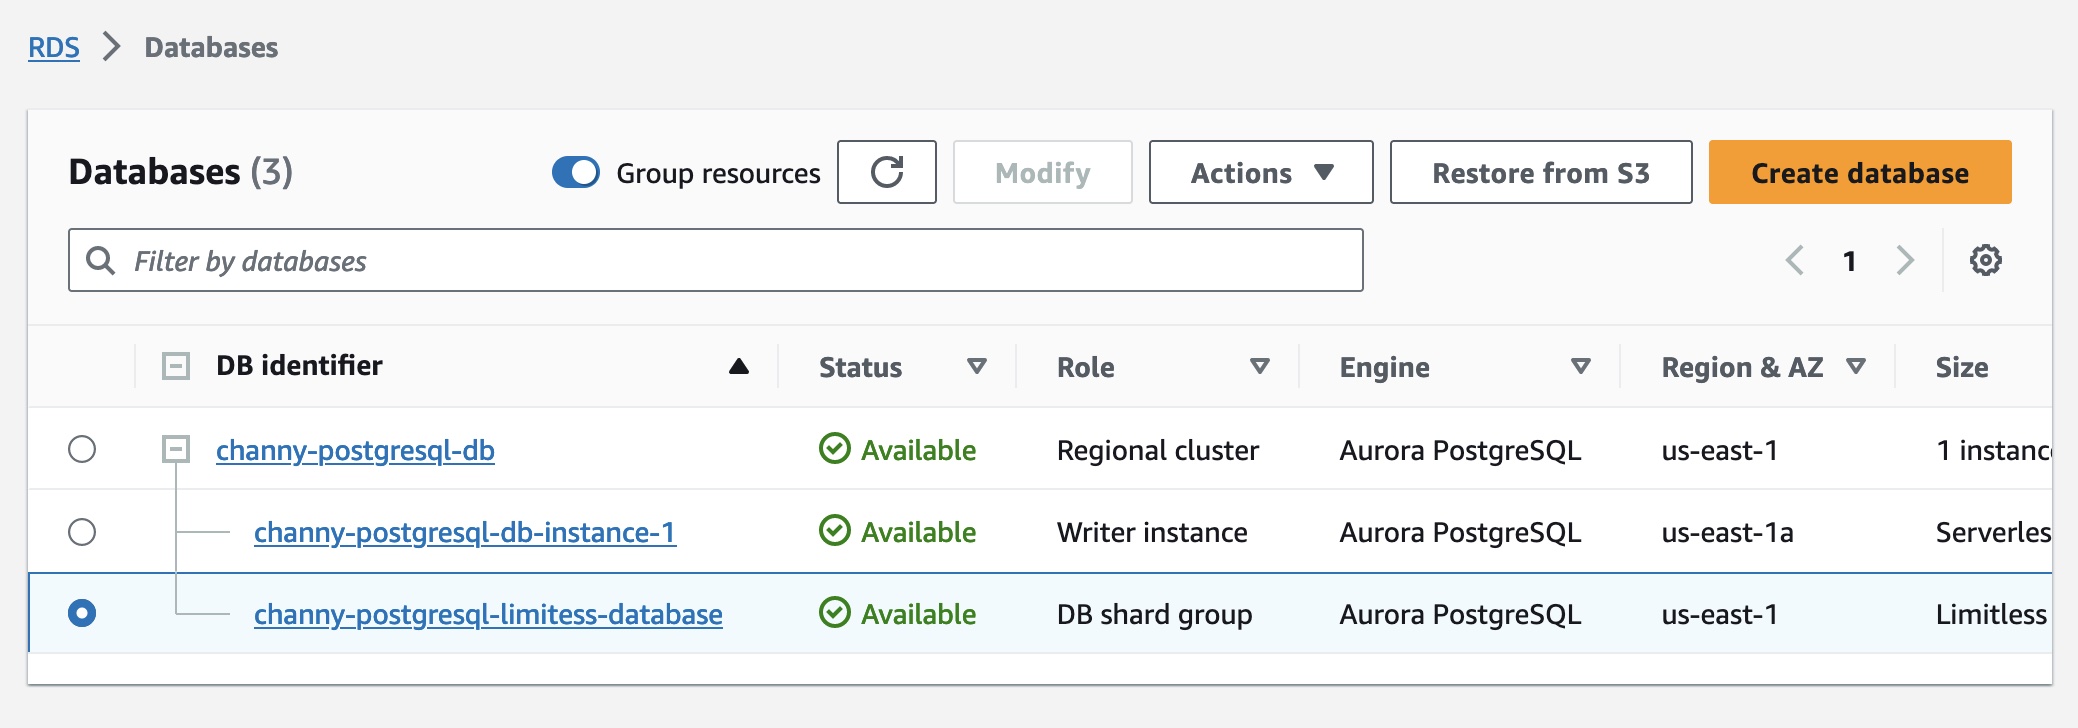


 Don’t be surprised if you have seen the Certificate Update in the


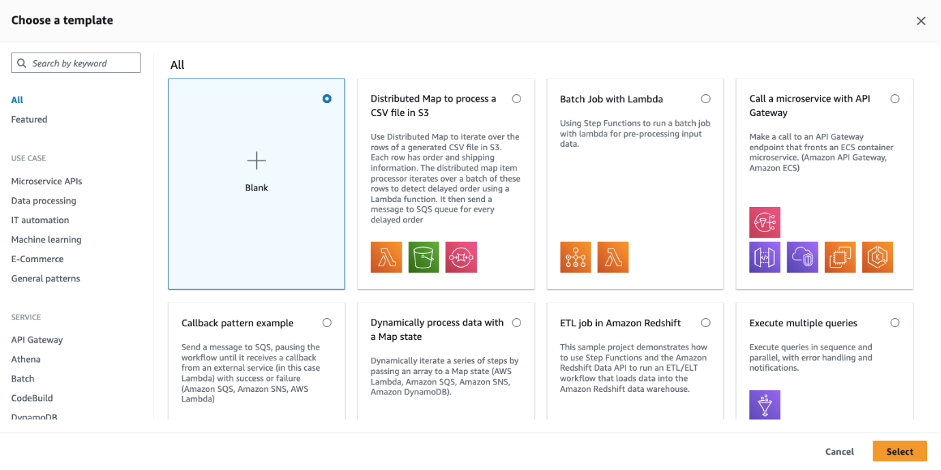


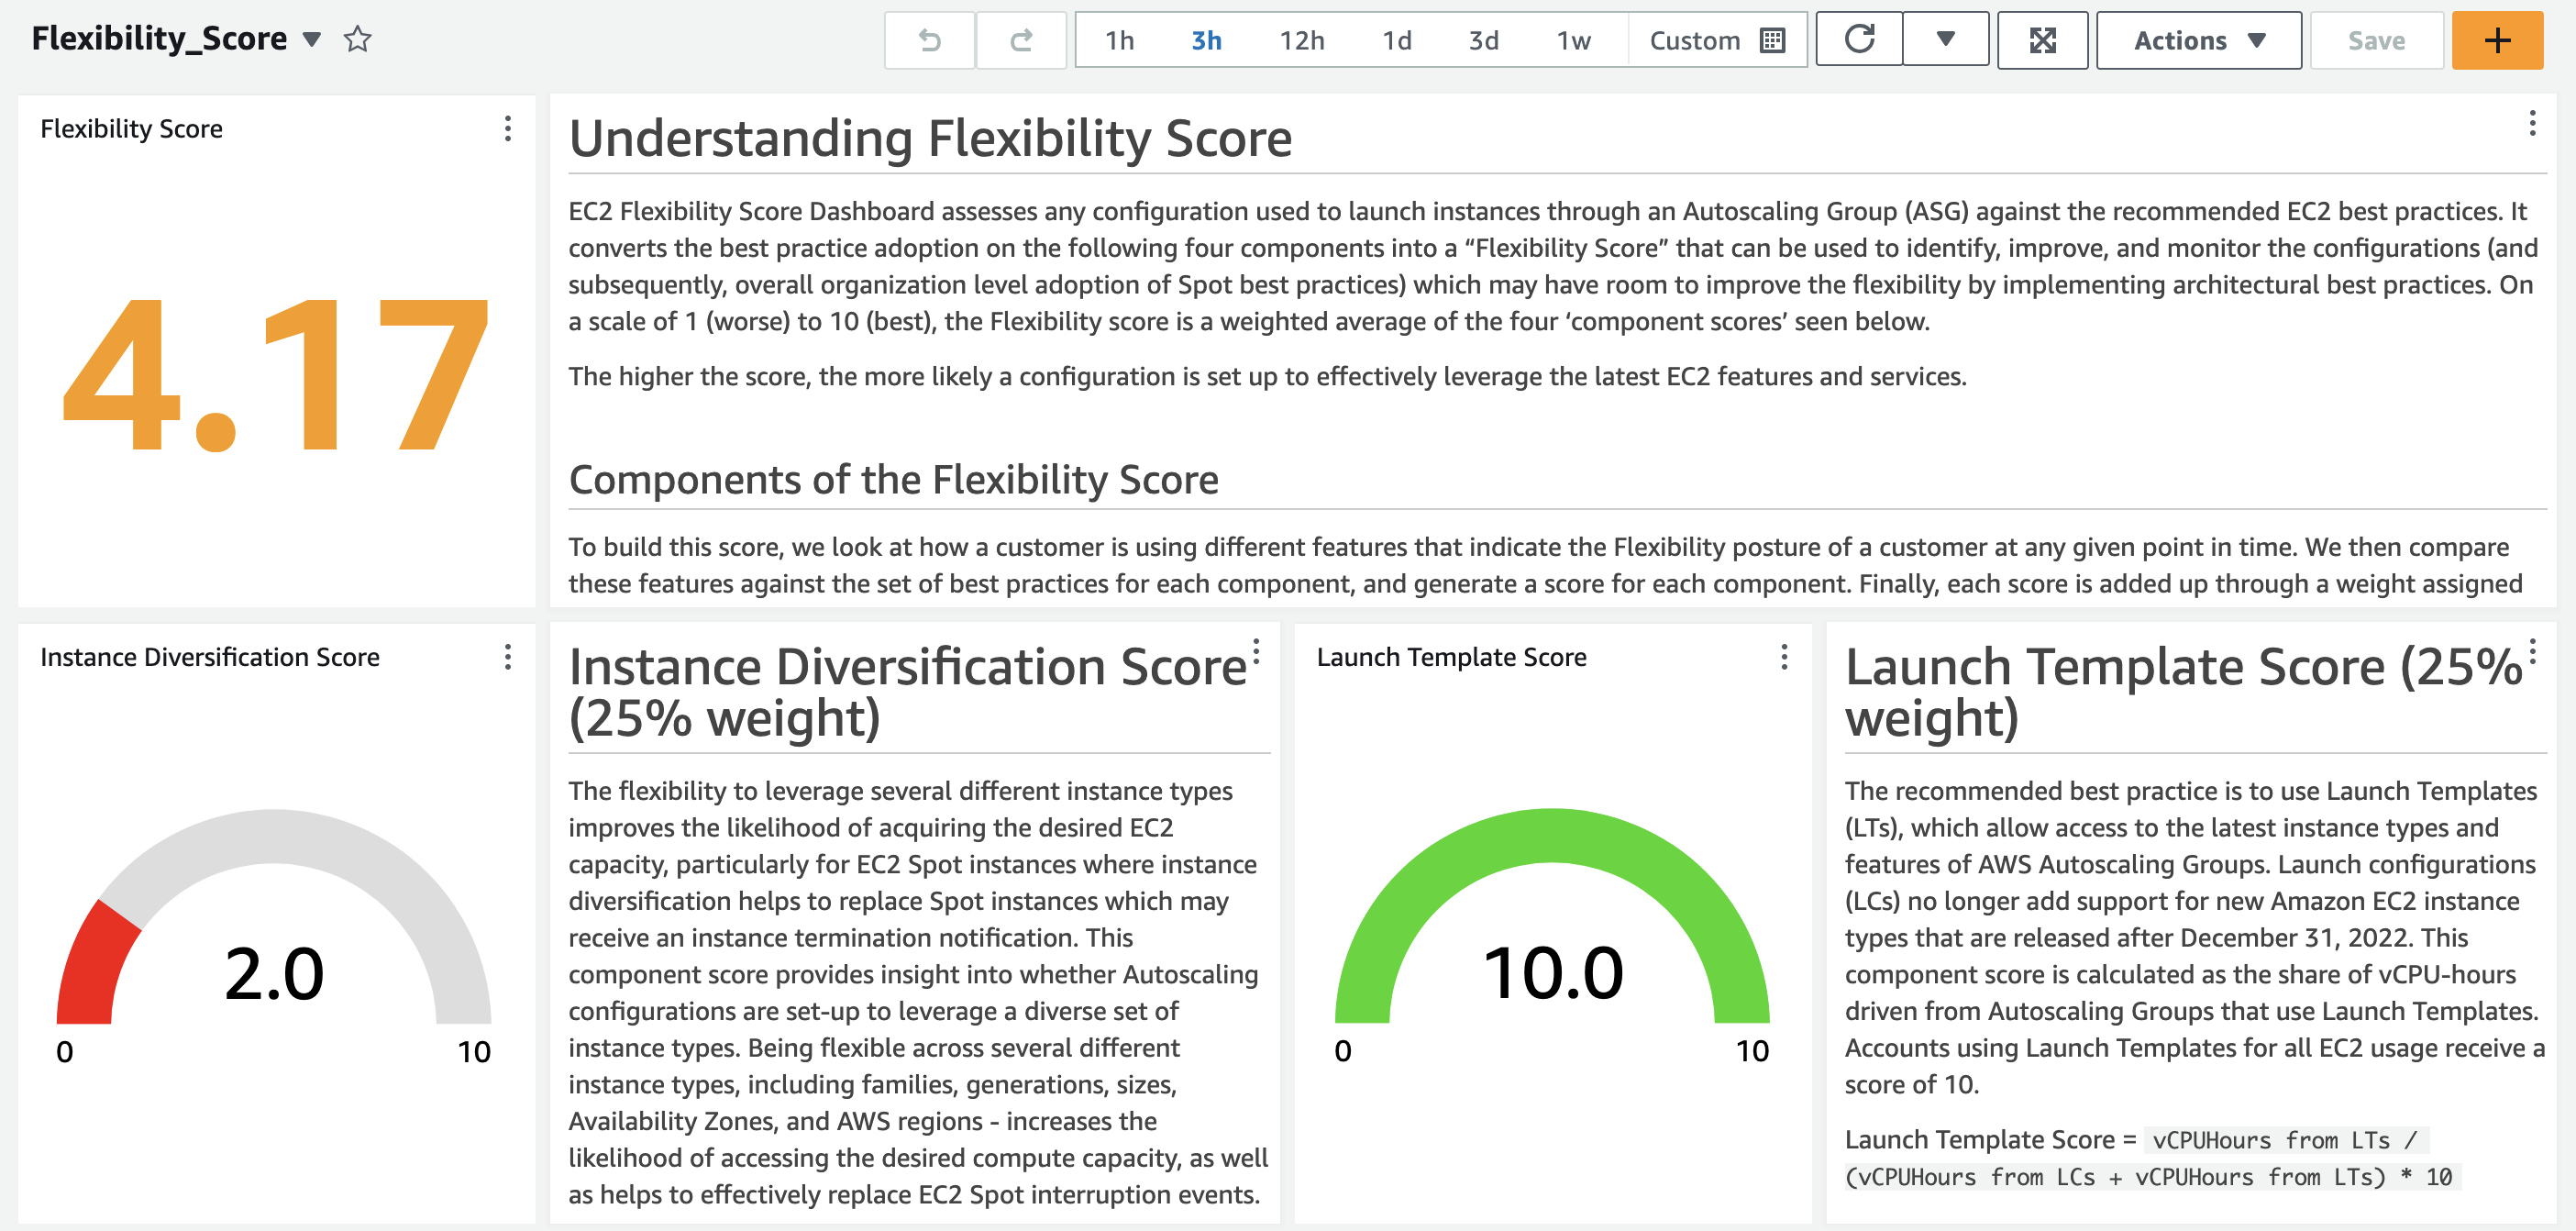


 Anand Komandooru is a Senior Cloud Architect at AWS. He joined AWS Professional Services organization in 2021 and helps customers build cloud-native applications on AWS cloud. He has over 20 years of experience building software and his favorite Amazon leadership principle is “
 Li Liu is a Senior Database Specialty Architect with the Professional Services team at Amazon Web Services. She helps customers migrate traditional on-premise databases to the AWS Cloud. She specializes in database design, architecture, and performance tuning.
 Neil Potter is a Senior Cloud Application Architect at AWS. He works with AWS customers to help them migrate their workloads to the AWS Cloud. He specializes in application modernization and cloud-native design and is based in New Jersey.
 Vivek Shrivastava is a Principal Data Architect, Data Lake in AWS Professional Services. He is a big data enthusiast and holds 14 AWS Certifications. He is passionate about helping customers build scalable and high-performance data analytics solutions in the cloud. In his spare time, he loves reading and finds areas for home automation.

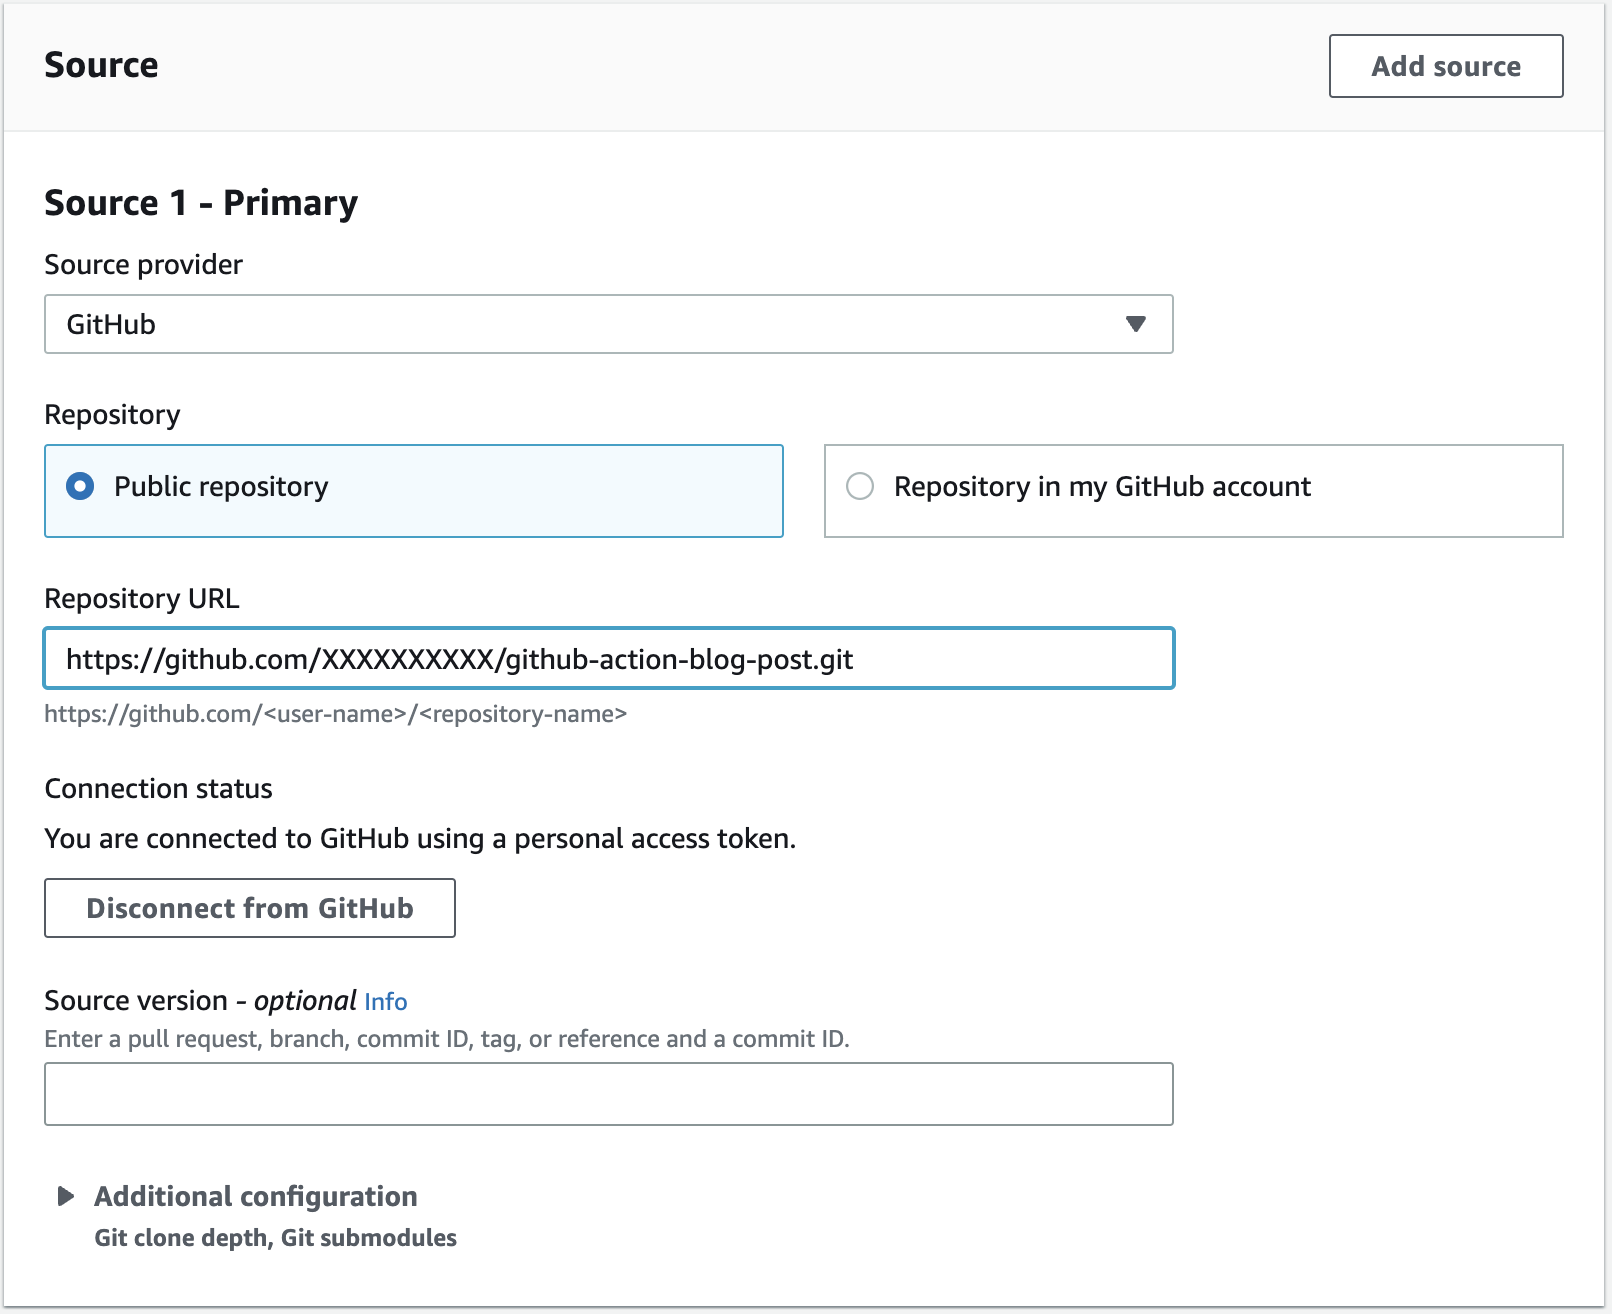


 Rohit Vashishtha is a Senior Analytics Specialist Solutions Architect at AWS based in Dallas, Texas. He has 17 years of experience architecting, building, leading, and maintaining big data platforms. Rohit helps customers modernize their analytic workloads using the breadth of AWS services and ensures that customers get the best price/performance with utmost security and data governance.
 Vijay Karumajji is a Database Solutions Architect with Amazon Web Services. He works with AWS customers to provide guidance and technical assistance on database projects, helping them improve the value of their solutions when using AWS.
 BP Yau is a Sr Partner Solutions Architect at AWS. He is passionate about helping customers architect big data solutions to process data at scale. Before AWS, he helped Amazon.com Supply Chain Optimization Technologies migrate its Oracle data warehouse to Amazon Redshift and build its next generation big data analytics platform using AWS technologies.
 Jyoti Aggarwal is a Product Manager on the Amazon Redshift team based in Seattle. She has spent the last 10 years working on multiple products in the data warehouse industry.
 Adam Levin is a Product Manager on the Amazon Aurora team based in California. He has spent the last 10 years working on various cloud database services.
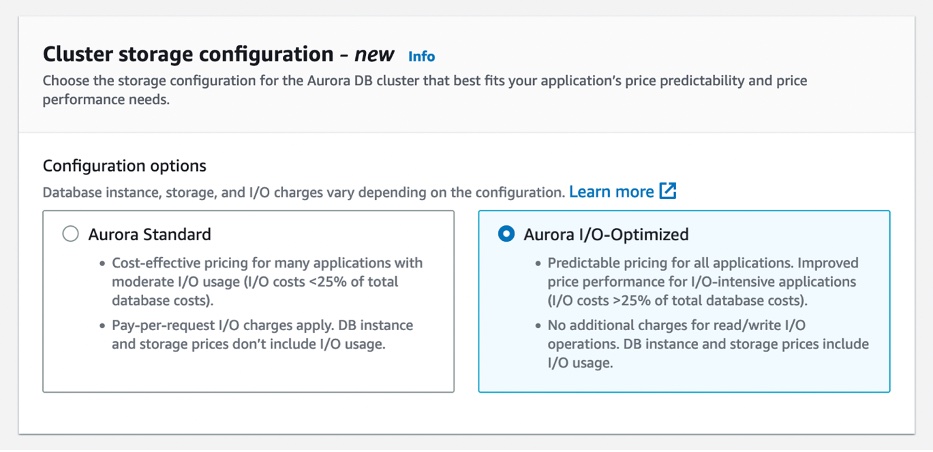

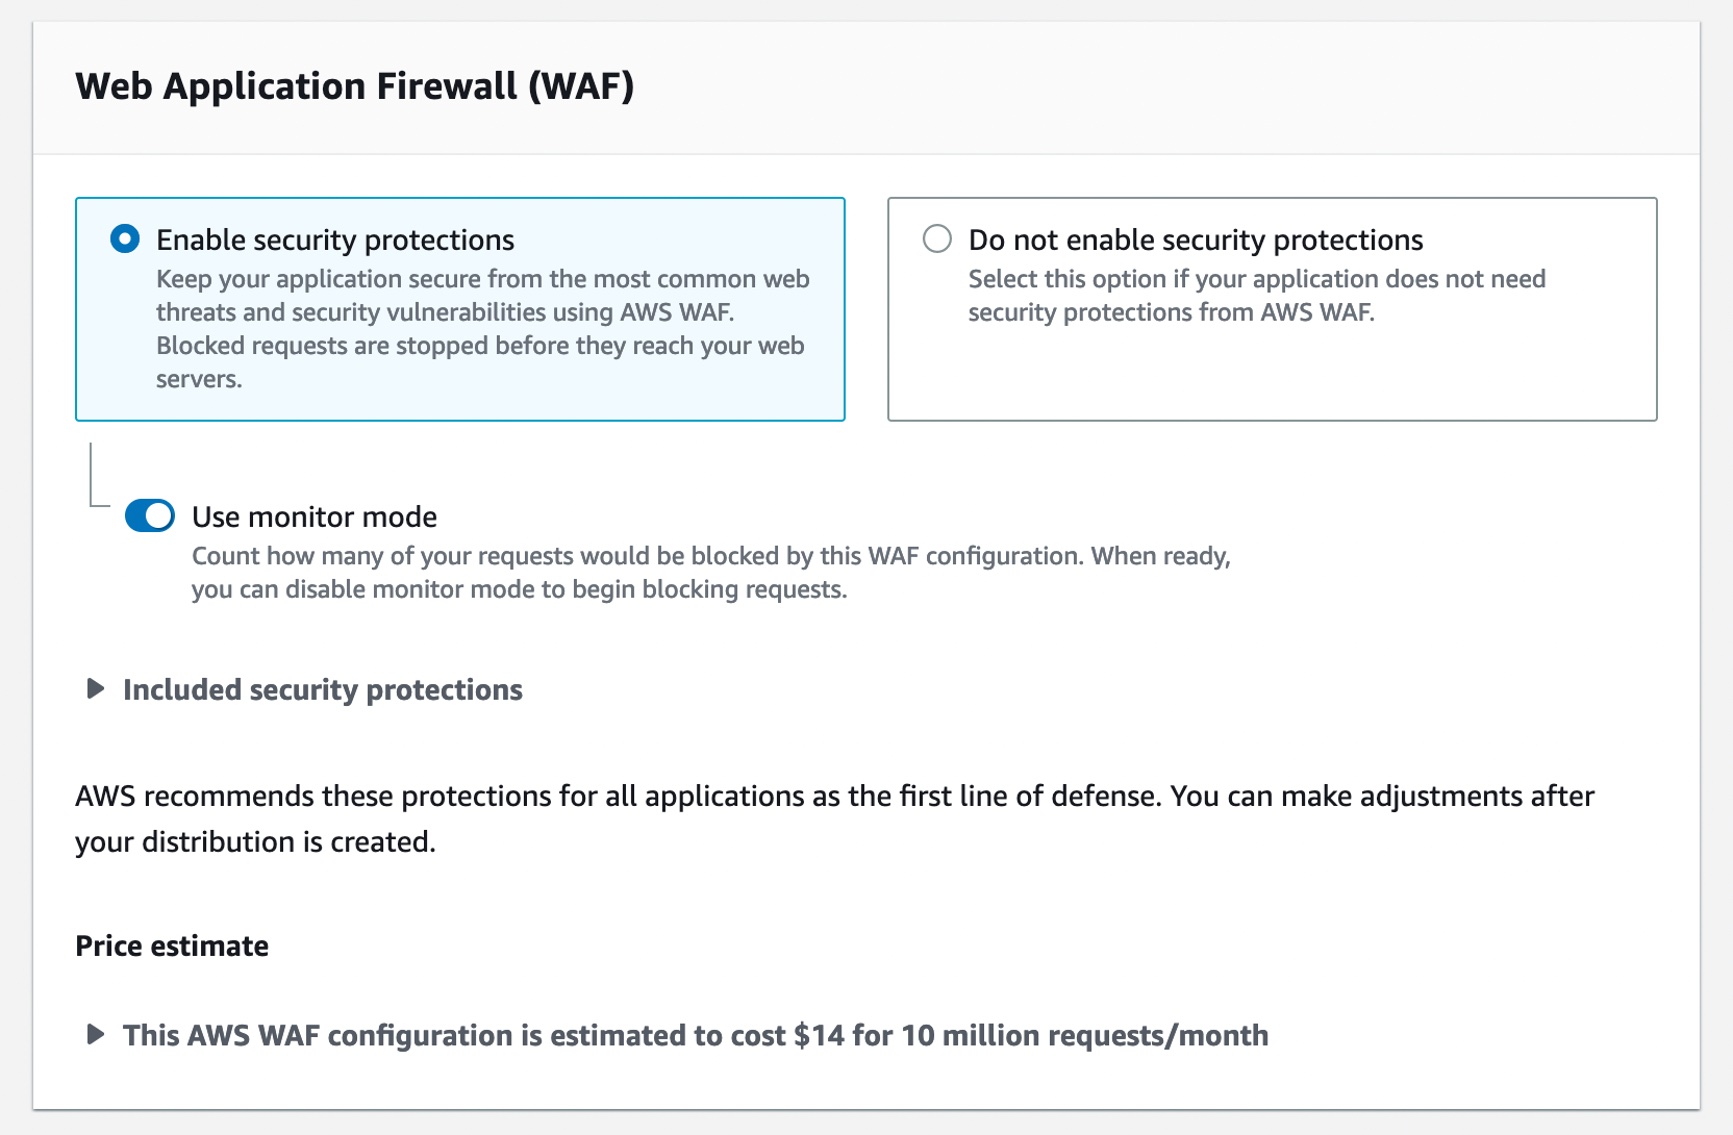
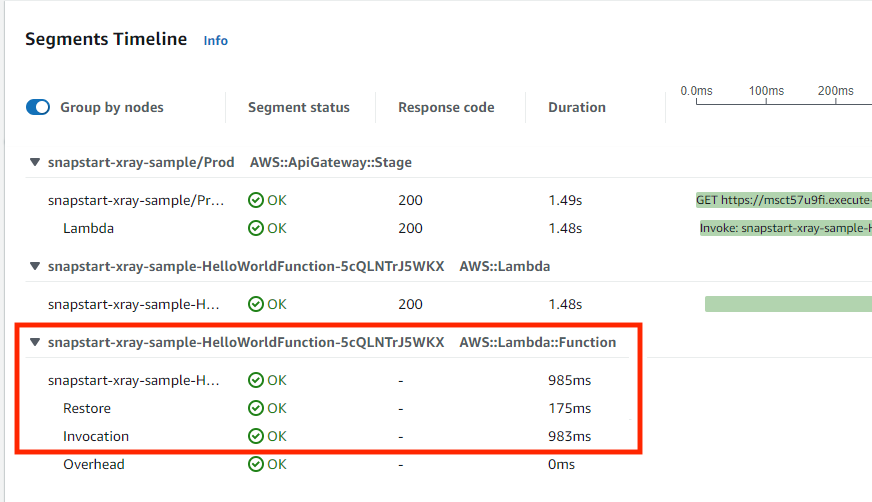

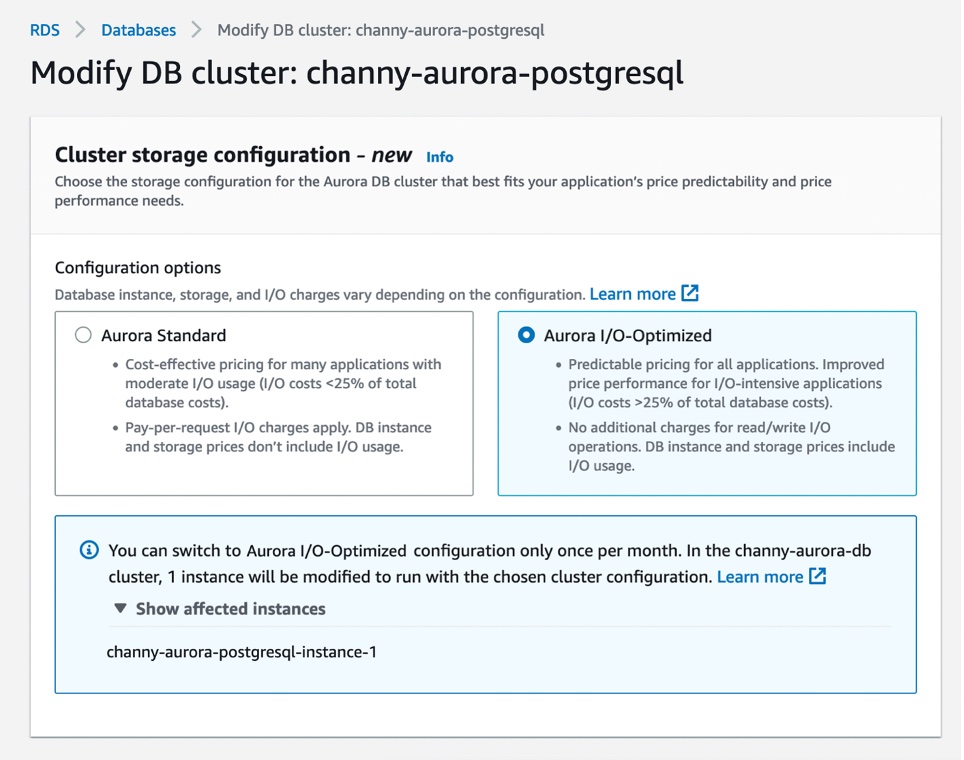


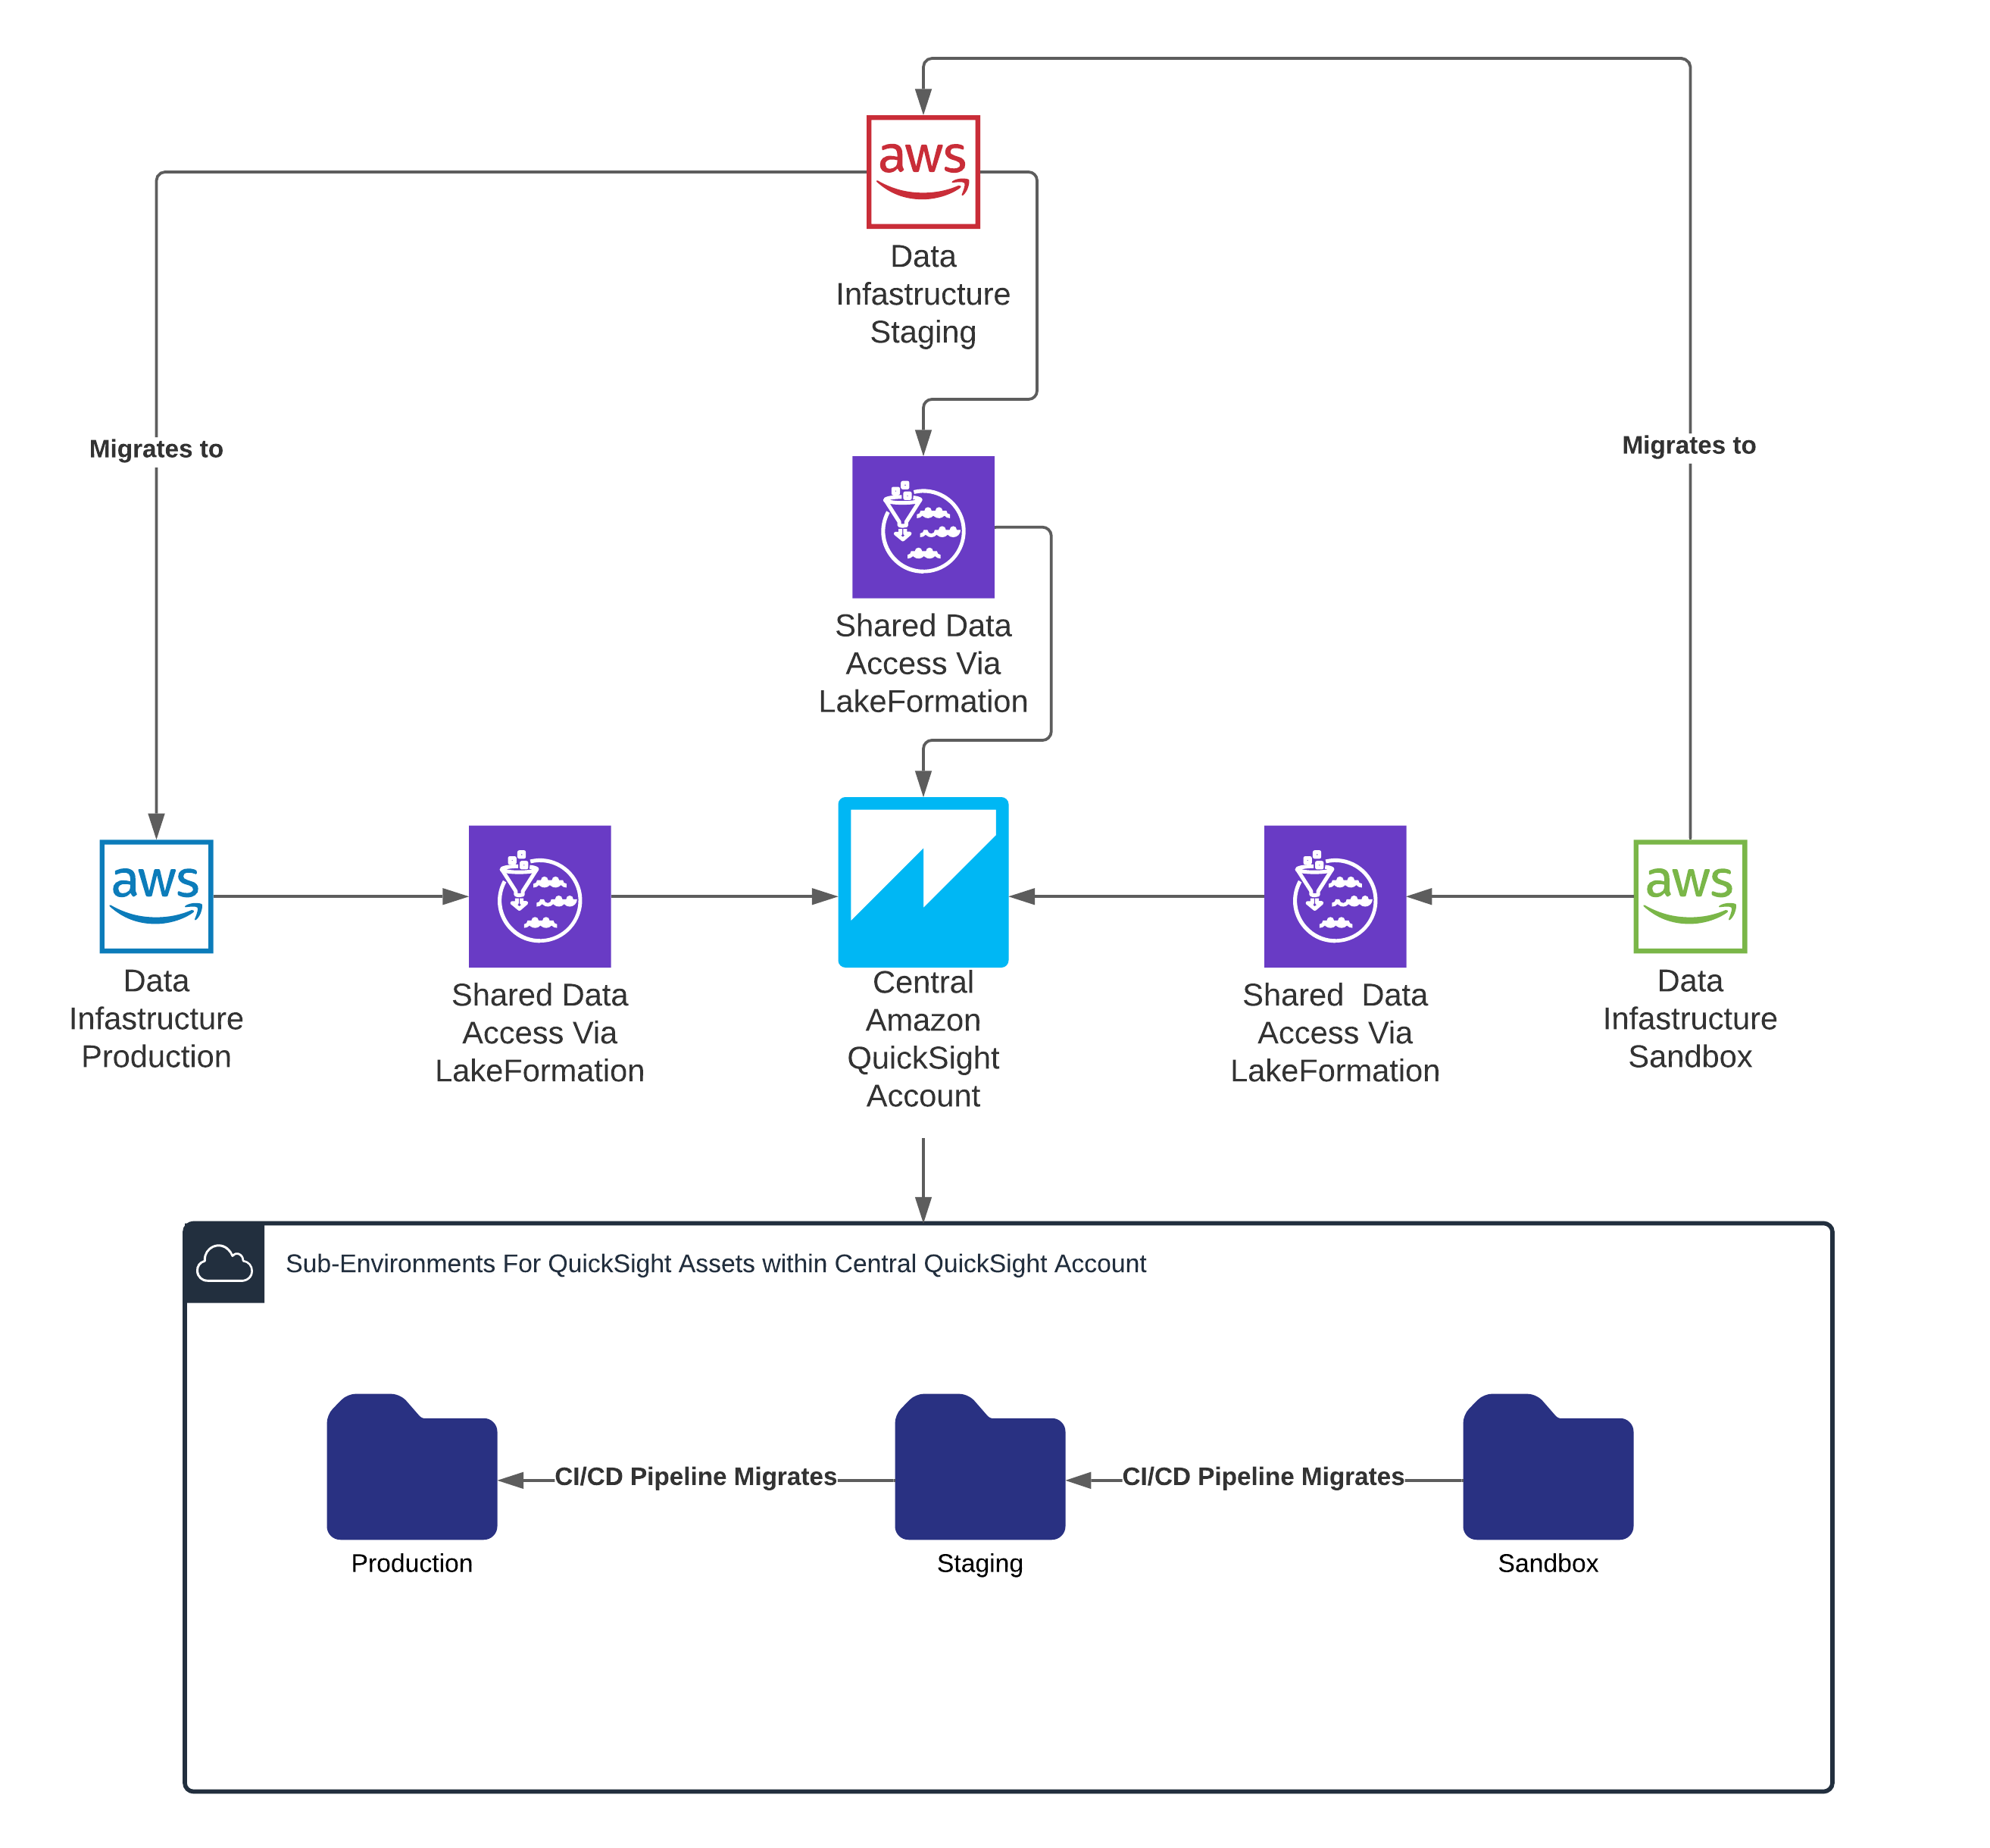
 Corey Johnson is the Lead Data Architect at Huron, where he leads its data architecture for their Global Products Data and Analytics initiatives.
 Sakti Mishra is a Principal Data Analytics Architect at AWS, where he helps customers modernize their data architecture, help define end to end data strategy including data security, accessibility, governance, and more. He is also the author of the book
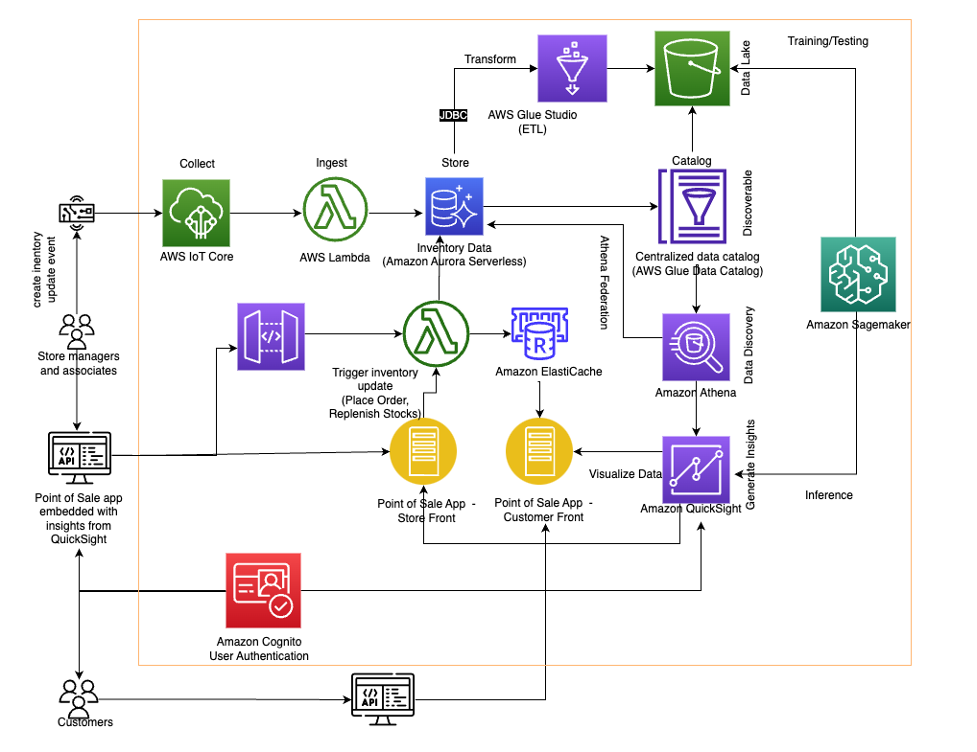
 Jason D’Alba is an AWS Solutions Architect leader focused on databases and enterprise applications, helping customers architect highly available and scalable solutions.
 Navnit Shukla is an AWS Specialist Solution Architect, Analytics, and is passionate about helping customers uncover insights from their data. He has been building solutions to help organizations make data-driven decisions.
 Vetri Natarajan is a Specialist Solutions Architect for Amazon QuickSight. Vetri has 15 years of experience implementing enterprise business intelligence (BI) solutions and greenfield data products. Vetri specializes in integration of BI solutions with business applications and enable data-driven decisions.
 Sindhura Palakodety is a Solutions Architect at AWS. She is passionate about helping customers build enterprise-scale Well-Architected solutions on the AWS platform and specializes in Data Analytics domain.