Post Syndicated from Jorge Fonseca original https://aws.amazon.com/blogs/architecture/invoking-asynchronous-external-apis-with-aws-step-functions/
External vendor APIs can help organizations streamline operations, reduce costs, and provide better services to their customers. But many challenges exist in integrating with third-party services such as security, reliability, and cost.
Organizations must ensure their systems can handle performance issues or downtime. In some cases, calling an external API may have associated costs such as licensing fees. If a contract exists with the external API vendor to adhere to maximum Requests Per Second (RPS), the system needs to adapt accordingly.
In this blog post, we show you how to build an architecture to invoke an external vendor API using AWS Step Functions, with specific guidance on reliability.
This orchestration is applicable to any industry that relies on technology and data benefitting from external vendor API integration. Examples include e-commerce applications for online retailers integrating with third-party payment gateways, shipping carriers, or applications in the healthcare and banking sectors.
Invoking asynchronous external APIs overview
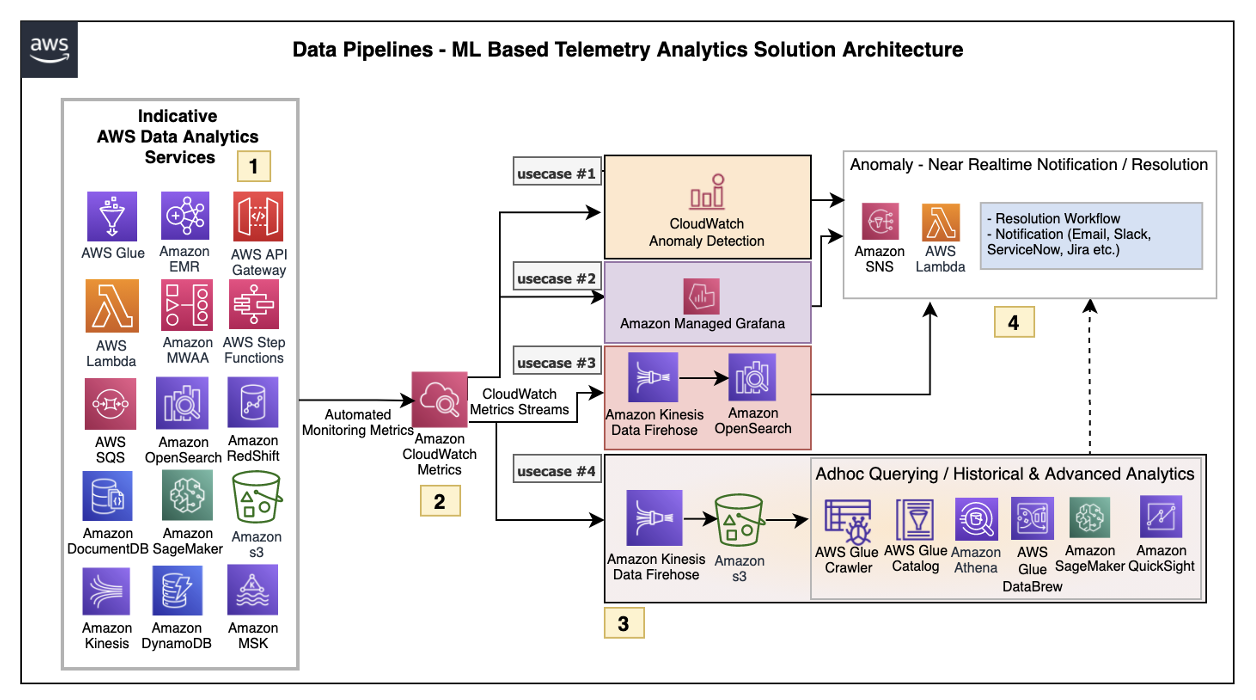
This solution outlines the use of AWS services to build an orchestrator controlling the invocation rate of third-party services that implement the service callback pattern to process long-running jobs. This architecture is also available in the AWS Reference Architecture Diagrams section of the AWS Architecture Center.
As in Figure 1, the architecture gives you the control to feed your calls to an external service according to its maximum RPS contract using Step Functions capabilities. Step Functions pauses main request workflows until you receive a callback from the external system indicating job completion.
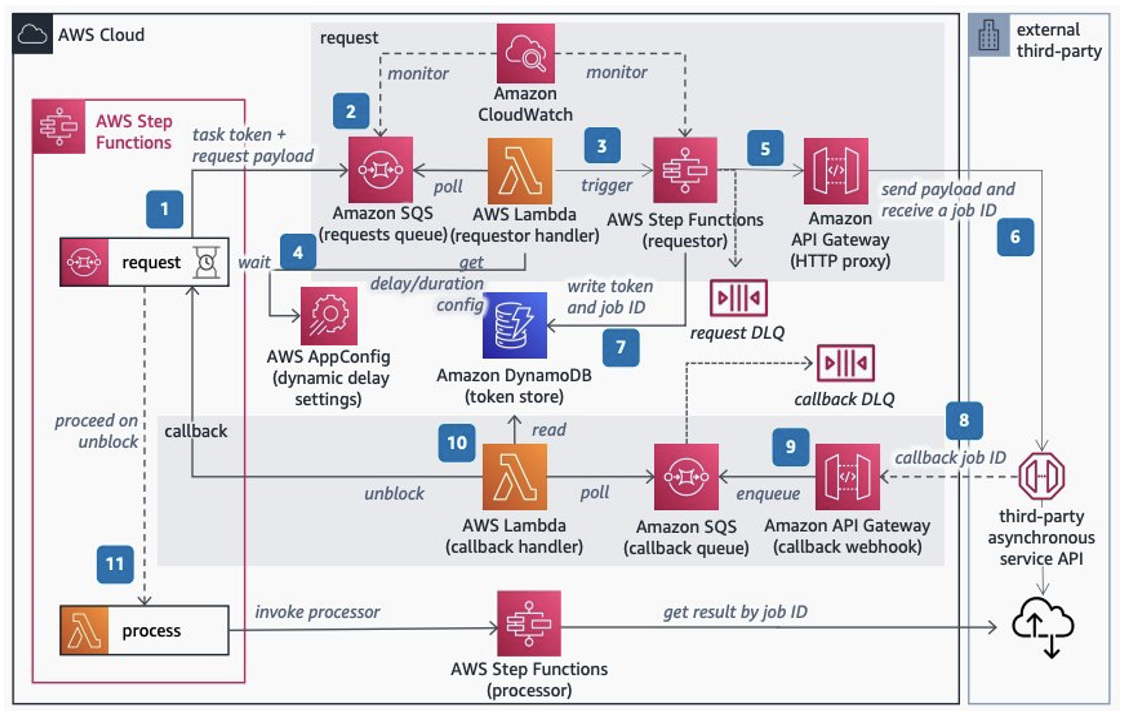
Figure 1. Invoking Asynchronous External APIs architecture
Let’s explore each step.
- Set up Step Functions to handle the lifecycle of long-running requests to the third party. Inside the workflow, add a request step that pauses it using
waitForTaskTokenas a callback to continue. Set a timeout to throw a timeout error if a callback isn’t received. - Send the task token and request payload to an Amazon Simple Queue Service (Amazon SQS) queue. Use Amazon CloudWatch to monitor its length. Consider adjusting the contract with the third-party service if the queue length grows beyond a soft limit determined on the maximum RPS with the third party.
- Use AWS Lambda to poll Amazon SQS and trigger an express Step Functions workflow. Control the invocation rate of Lambda using polling batch size, reserved concurrency, and maximum concurrency, discussed in more detail later in the blog.
- Optionally, add dynamic delay inside Lambda controlled by AWS AppConfig if the system still needs a lower invocation rate to comply with the contracted RPS.
- Step Functions invokes an Amazon API Gateway HTTP proxy API configured with rate limit to comply with the contracted RPS. API Gateway is a safeguard proxy to make sure your system is not breaking the RPS contract while dynamically adjusting the invocation rate parameters.
- Invoke the external third-party asynchronous service API sending the payload consumed from the requests queue and receiving the jobID from the service. Send failed requests to the Dead Letter Queue (DLQ) using Amazon SQS.
- Store the main workflow’s task token and jobID from the third-party service in an Amazon DynamoDB table. This is used as a mapping to correlate the jobID with the task token.
- When the external service completes, receive the completed jobID in a callback webhook endpoint implemented with API Gateway.
- Transform the external callbacks with API Gateway mapping templates, add the payload and jobID to an Amazon SQS queue, and respond immediately to the caller.
- Use Lambda to poll the callback Amazon SQS queue, then query the token stored. Use the token to unblock the waiting workflow by calling
SendTaskSuccessand the callback DLQ to store failed messages. - On the main workflow, pass the jobID to the next step and invoke a Step Functions processor to fetch the third-party results. Finally, process the external service’s results.
Controlling external API invocation rates
To comply with third-party RPS contracts, adopt a mechanism to control your system’s invocation rate. The rate of polling the messages from the request Amazon SQS (or step 3 in the architecture) directly impacts your invocation rate.
Different parameters can be used to control the invocation rate for Lambda with Amazon SQS as its trigger “event source,” such as:
- Batch size: The number of records to send to the function in each batch. For a standard queue, this can be up to 10,000 records. For a first-in, first-out (FIFO) queue, the maximum is 10. Using batch size on its own will not limit the invocation rate. It should be used in conjunction with other parameters such as reserved concurrency or maximum concurrency.
- Batch window: The maximum amount of time to gather records before invoking the function, in seconds. This applies only to standard queues.
- Maximum concurrency: Sets limits on the number of concurrent instances of the function that an Amazon SQS event source can invoke. Maximum concurrency is an event source-level setting.
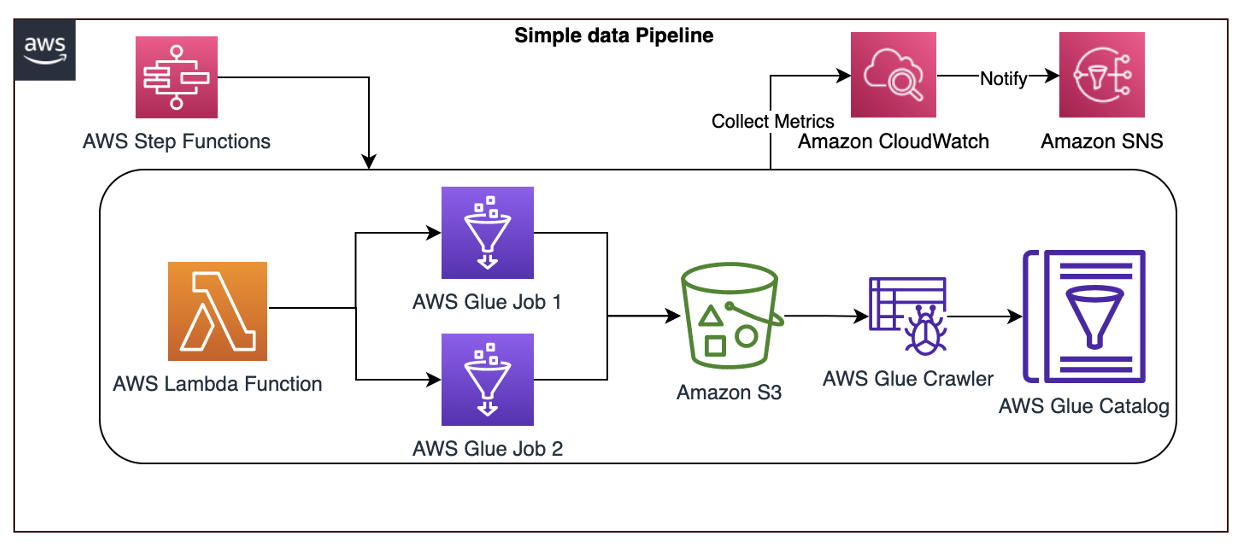
Trigger configuration is shown in Figure 2.

Figure 2. Configuration parameters for triggering Lambda
Other Lambda configuration parameters can also be used to control the invocation rate, such as:
- Reserved concurrency: Guarantees the maximum number of concurrent instances for the function. When a function has reserved concurrency, no other function can use that concurrency. This can be used to limit and reduce the invocation rate.
- Provisioned concurrency: Initializes a requested number of execution environments so that they are prepared to respond immediately to your function’s invocations. Note that configuring provisioned concurrency incurs charges to your AWS account.
These additional Lambda configuration parameters are shown here in Figure 3.

Figure 3. Lambda concurrency configuration options – Reserved and Provisioned
Maximizing your external API architecture
During this architecture implementation, consider some use cases to ensure that you are building a mature orchestrator.
Let’s explore some examples:
- If the external system fails to respond to the API request in step 8, a timeout exception will occur at step 1. A sensible timeout should be configured in the main state machine in step 1. The timeout value should consider the maximum response time of the external system.
The Error handling capabilities in Step Functions section of the AWS Step Functions Developer Guide provides the ability to implement your own logic for different error types. Configure timeout errors using the States.Timeout error state.
- Dynamic delay inside the Lambda function—as mentioned in step 4—should only be used temporarily for burst traffic. If the external party has a very low RPS contract, consider other alternatives to introduce delay.
For example, Amazon EventBridge Scheduler can be used to trigger the Lambda function at regular intervals to consume the messages from Amazon SQS. This avoids costs for the idle/waiting state of your Lambda functions.
Conclusion
This blog post discusses how to build end-to-end orchestration to manage a request’s lifecycle, five different parameters to control invocation rate of third-party services, and throttle calls to external service API per maximum RPS contract.
We also consider use cases on using error handling capabilities in Step Functions and monitor systems with CloudWatch. In addition, this architecture adopts fully managed AWS Serverless services, removing the undifferentiated heavy lifting in building highly available, reliable, secure, and cost-effective systems in AWS.


 .
.