Tag Archives: Amazon CloudWatch

Setup a high availability design for Oracle Data Guard (Fast-Start Failover) using Amazon Route 53

Post Syndicated from Viqash Adwani original https://aws.amazon.com/blogs/architecture/setup-a-high-availability-design-for-oracle-data-guard-fast-start-failover-using-amazon-route-53/

Many customers use Oracle Database deployed on Amazon Elastic Compute Cloud (Amazon EC2) to run their Oracle E-Business Suite applications. They rely on Oracle Data Guard for high availability databases, with a standby database running in a different availability zone. Oracle Data Guard can switch a standby database to the primary role in case a production database becomes unavailable due to planned/unplanned outage.

Oracle E-Business Suite has AutoConfig Database Context files that points to Domain Name System (DNS), like a private IP DNS name or IP address on Amazon EC2. In case of switchover/failover, Database Context files in Oracle E-Business Suite need to be updated. With this solution, database context files do not need to be updated in case of switchover/failover. This is achieved by providing a single DNS name hosted on Amazon Route 53, always pointing to a primary database irrespective of running on any node.

This post demonstrates setting up a Route 53 hosted zone that points to primary and standby databases and will route requests to the database having a primary role. We will setup Route 53 health checks to monitor Amazon CloudWatch alarms, based on Oracle Data Guard Fast-Start Failover (FSFO) logs pushed from Oracle Database using CloudWatch agent.

Prerequisites

Before getting started, you must have the following:

  • Oracle databases running on two separate EC2 instances for 1\Primary and 2\Standby node
  • EC2 instance for 3\Observer node, with either Oracle Client Administrator software or the full Oracle Database software stack
  • Oracle Data Guard configured to maintain standby databases as transactional consistent copy of the primary database
  • Oracle Data Guard Command-Line Interface (DGMGRL) configured with observer process to facilitate FSFO
  • FSFO enabled with observer configuration

Solution overview

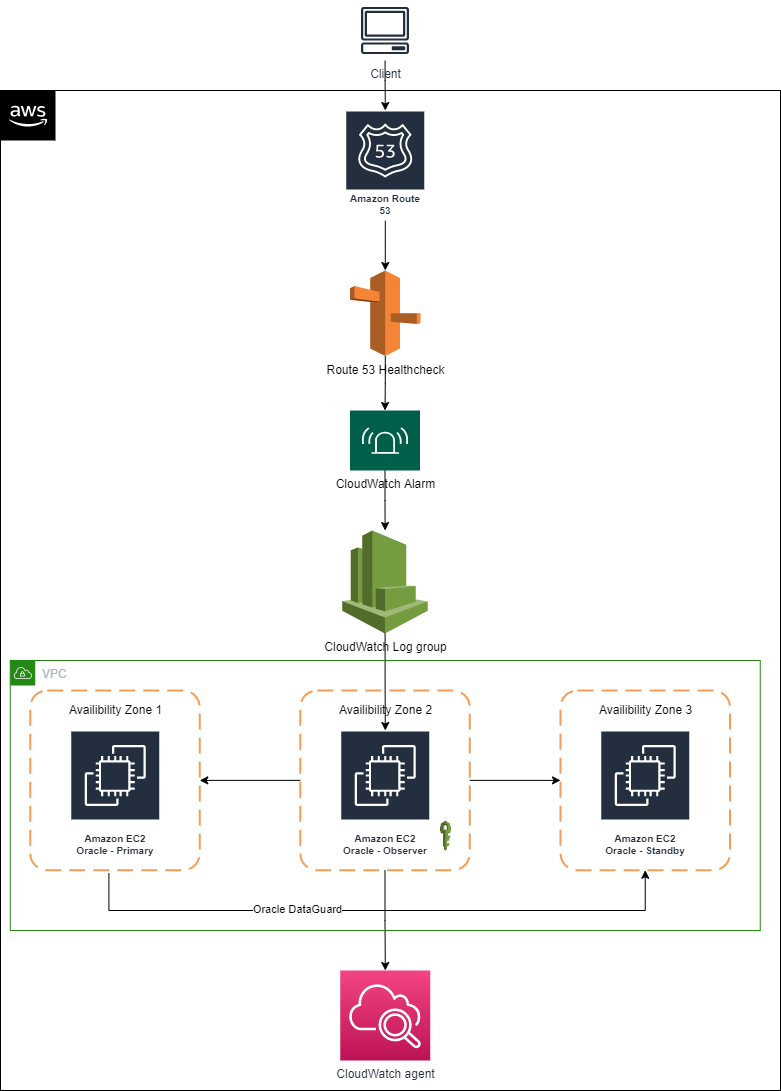
Figure 1 depicts AWS services that are used build an architecture using a single Domain Name System (DNS) and Route 53 to have requests route to the primary database for Oracle Data Guard deployed on EC2 instances.
Using a single DNS and Amazon Route 53 to route requests

Figure 1. Using a single DNS and Amazon Route 53 to route requests

We encourage you to explore these articles prior to launching this architecture:

Architecture components

  • Primary node: An Oracle Data Guard configuration contains one production database (primary database) that functions in the primary role. This is the database that is accessed by most of your applications.
  • Standby node: A standby database is a transactional consistent copy of the primary database. Once created, Oracle Data Guard automatically maintains each standby database by transmitting redo data from the primary database and applying it to the standby database.
  • Observer node: A component of DGMGRL that is configured on a separate server with Oracle Client Interface outside the systems running the Oracle Data Guard configuration, which monitors the availability of the primary database. We recommend it is in a separate availability zone than the primary and standby databases. Should it detect that the primary database is unavailable or the connection cannot be made, it will issue a failover after waiting for the 30 seconds or specified by the FastStartFailoverThreshold property.

Note: This solution was tested on Oracle Database 19c Enterprise Edition Release 19.0.0.0.0 and Oracle Enterprise Linux OL7.5-x86_64. Select the required combination of operating system and database by referring to E-Business Suite Database Certifications. Active Oracle Data Guard configuration is not used in this solution; therefore, the database stays in mount state and unavailable for customer reads. However, this solution can be used with an active Oracle Data Guard configuration as well.

Infrastructure setup

This table details the lab environment and the database instance names used throughout this post.

Database role IP address Instance name Database unique name Database open mode Database port
Primary node 172.31.xx.xx ORCLVIQ orclviq Read write 1522
Secondary node 172.31.xx.xx ORCLVIQ orclviq Mounted 1522
FSFO observer node 172.31.xx.xx
Route 53 hosted zone Dataguardviq.com Dataguardviq.com

Solution implementation

1. IAM policy

To configure the CloudWatch agent on an EC2 instance, create an IAM role via the console, AWS Command Line Interface, or AWS API. By default, an IAM role does not have any privileges and cannot access AWS resources. Before creating an IAM role, create an IAM policy with the permissions required to access CloudWatch logs, specifying the CloudWatch resources you want to monitor or *, which will allow access to CloudWatch logs.

Create the IAM policy using the following JSON and give it a name, like dgpolicy, which grants specific permissions. In this case, the permissions include creating log groups and log streams, inputting log events, and describing log stream for all logs.

{
    "Version": "2012-10-17",
    "Statement": [
        {
            "Action": [
                "logs:DescribeLogGroups",
                "logs:DescribeLogStreams",
                "logs:GetLogEvents",
                "s3:GetBucketLocation"
            ],
            "Effect": "Allow",
            "Resource": "*"
        }
    ]
}

2. IAM role

Create the IAM role (for example, dgrole) and attach the policy created in Step 1.

3. Associate IAM role with Amazon EC2 having FSFO observer node running on it

Associate the IAM role with Amazon EC2 from AWS console:

  1. Open the Amazon EC2 console.
  2. In the navigation pane, choose Instances.
  3. Select the instance, and choose Action, Security, Modify IAM role.
  4. Select the IAM role to attach to your instance; choose Save.

You also can use the associate-iam-instance-profile command to attach the IAM role to the instance by specifying the instance profile:

aws ec2 associate-iam-instance-profile \
    --instance-id i-1234567890lmnopq1 \
    --iam-instance-profile Name=" dgrole"

4. Install CloudWatch log agent on observer node

Install CloudWatch Logs agent on the observer node that already has FSFO log configuration setup on it. After installation is complete, logs will automatically flow from the instance to the log stream you created while installing the agent, as depicted in Figures 2 and 3.

$curl https://s3.amazonaws.com/aws-cloudwatch/downloads/latest/awslogs-agent-setup.py -O
$sudo python ./awslogs-agent-setup.py --region ap-southeast-2

Steps to install Amazon CloudWatch agent

Figure 2. Steps to install Amazon CloudWatch agent

Example of output

Figure 3. Example of output

At this point, FSFO logs are visible in CloudWatch logs. Perform a database switchover to confirm that logs are being published to CloudWatch logs.

5. Create CloudWatch metric filter

Create primary metric filter

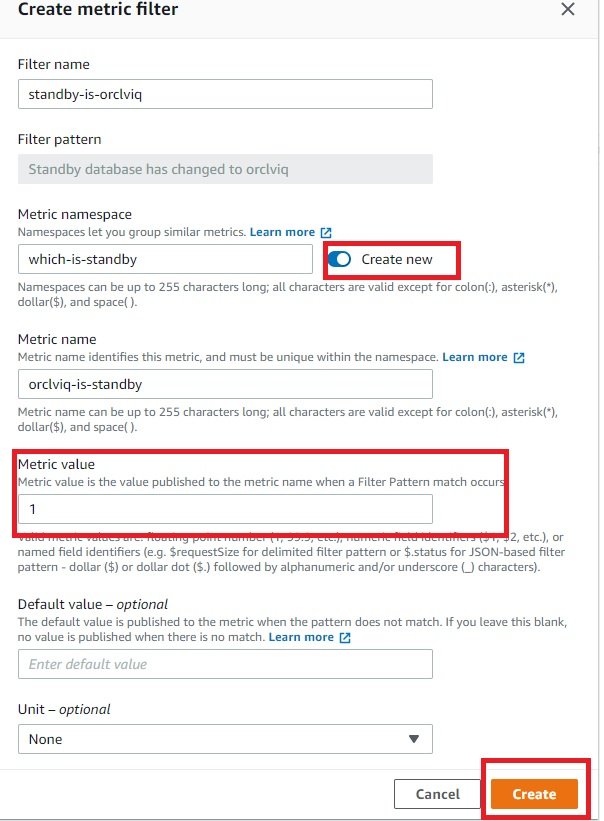
  • Create metric filter on “Standby database has changed to orclviq” and set value to “1”.
  • Open the CloudWatch log group and search for “Standby database has changed to orclviq“. Once results are displayed, “Create Metric Filter” button will appear at top right (as demonstrated in Figure 4).
Amazon CloudWatch log group

Figure 4. Amazon CloudWatch log group

  • Filter name” and “Filter pattern” are filled automatically, as we already filtered that while accessing the CloudWatch log. Create a new name space in the metric, which we will later use in second metric filter. Specify “Metric namespace”, which will also be the same for the second metric filter. “Metric value” is “1”, as detailed in Figure 5.
Amazon CloudWatch metric filter

Figure 5. Amazon CloudWatch metric filter

Create secondary metric filter

  • To create a second metric filter, follow steps to create the primary metric filter but the filter pattern will be “Standby database has changed to orclstd“. The only difference in this step will be setting the “Metric value” to “0”.
  • Verify the metric filter is working and able to find desired entries in the FSFO logs that will decide which instance is the primary database by:
    • Click on one of the metric filters
    • Select log data to test, and choose and EC2 instance ID
    • Testing the pattern to verify if metric filters are working properly
    • Select “Next”
    • Save changes

6. Create a CloudWatch alarm

Create a CloudWatch alarm that will monitor CloudWatch metrics and perform actions based on the value of the metric.

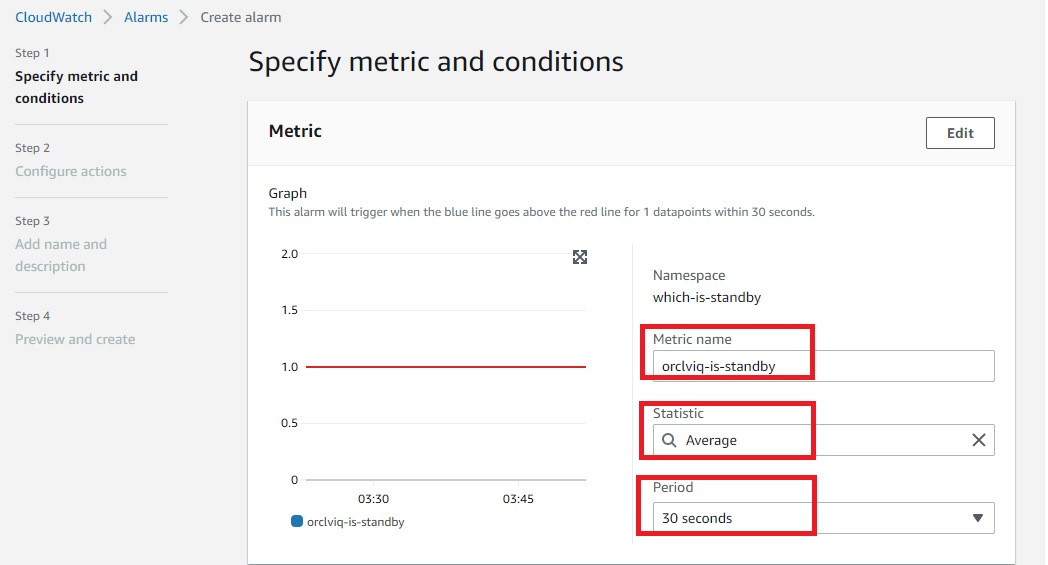
  • Within CloudWatch Alarms section (Step 1), select “Create alarm” and then select “Metric”, as in Figure 6.
  • In Step 2, you can create a new topic and specify the email address where you would like to receive notifications regarding changes in primary or standby database.
  • In Step 3, you can specify the alarm name and optional alarm description.
Amazon CloudWatch alarm

Figure 6. Amazon CloudWatch alarm

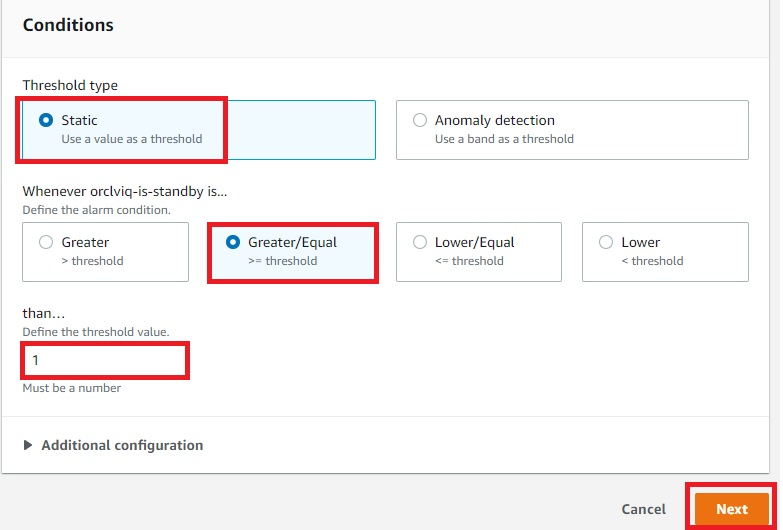
  • To configure Conditions, as detailed in Figure 7, be sure the threshold type is set to “Static”, the alarm condition is “Greater/Equal”, and the threshold value is “1”.
Amazon CloudWatch alarm condition

Figure 7. Amazon CloudWatch alarm condition

  • Figure 8 demonstrates the summary of the ready CloudWatch metrics and configured alarm.  At this point, “orclviq” is the primary database, so the alarm state will be “Insufficient data”. Try to do a switchover and the alarm state should be changed to “In alarm”.
  • Switch it back to original primary before proceeding further
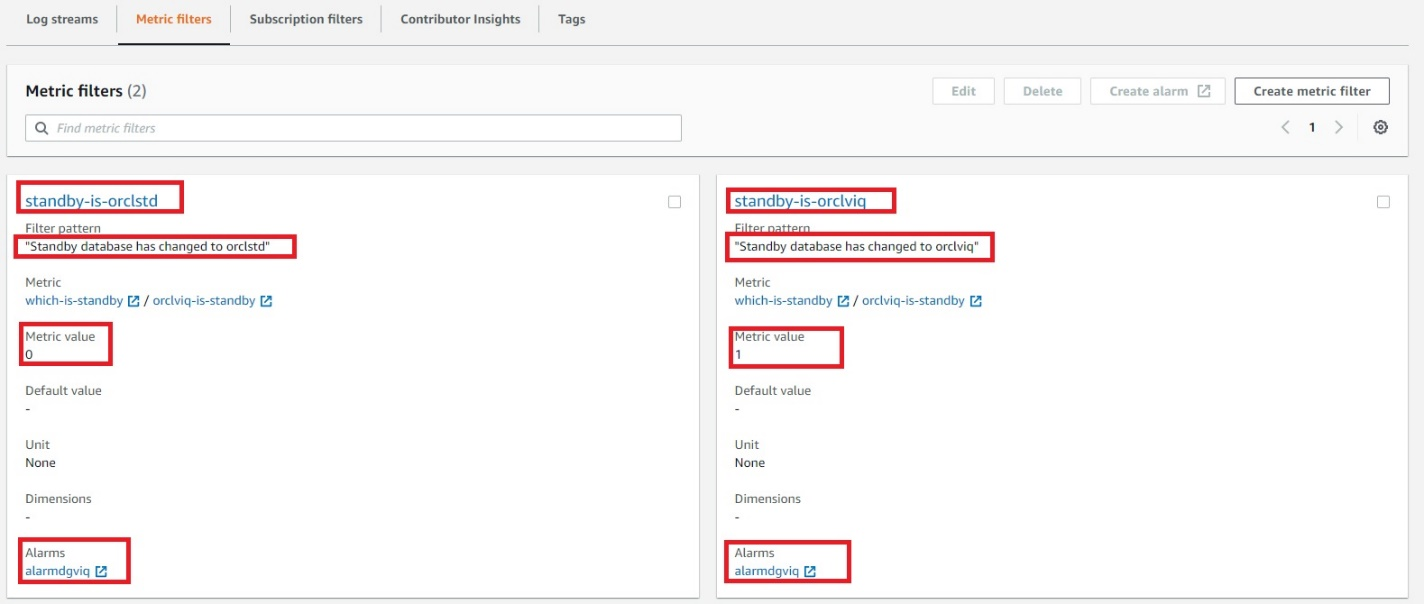
Final view of both metric filters combined

Figure 8. Final view of both metric filters combined

7. Create Route 53 health checks

Creating Route 53 health checks based on the CloudWatch alarm identifies DNS failover. Health checks can be created on public IP directly without creating above metric filters and alarms, but it is unlikely that customers will have a public IP on database servers. Route 53 cannot check the health of an IP address endpoint despite if it is local, private, non-routable, or multi-cast ranges. Therefore, health checks will have to be created on the state of CloudWatch alarm (Figure 9):

  • Within the Route 53 console, select “Configure health check”.
  • Select “State of CloudWatch alarm”, then select the region of your CloudWatch metrics and choose the CloudWatch alarm that was created earlier from the dropdown menu.
  • Skip creating an alarm for health check, as the alarm is already configured for CloudWatch metric filter.
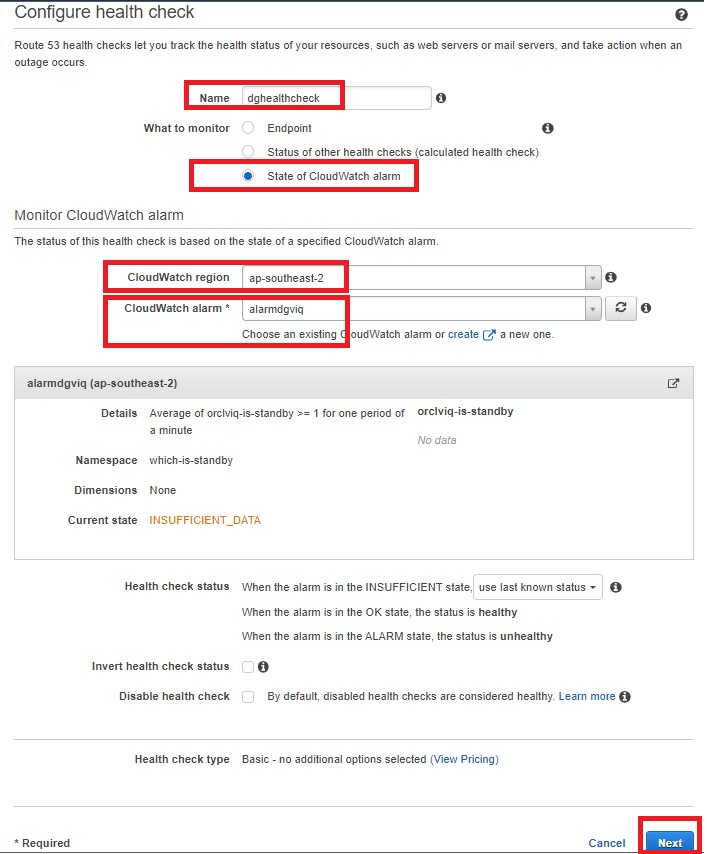
Amazon Route 53 health check parameters

Figure 9. Amazon Route 53 health check parameters

  • The health check is now ready and status will be “Unknown”. It will change to “Healthy”, as it is currently having primary orclviq, which means it’s satisfying “Standby database has changed to orclstd“.
  • At this point, try doing a failover and observe if health check status changes to “Unhealthy”. Switch it back to the original primary before proceeding.
  • The health check should return to “Healthy” state.
  • Check the status of the alarm:
    • OK: the status is healthy
    • ALARM: the status is unhealthy
    • INSUFFICIENT: use last known status

8. Create Route 53 hosted zone

A Route 53 hosted zone in this solution will have failover routing based on records pointing to IP addresses of primary and standby database server. When the Route 53 health check is in an “Unhealthy” state, failover routing kicks in and the hosted zone starts routing requests to the IP address of the standby database server.

  • A Route 53 hosted zone will have records of your primary and standby database instance private IP. Because it is a private hosted zone, it will use the same VPC as the observer node on which we deployed the CloudWatch agent (Figure 10).
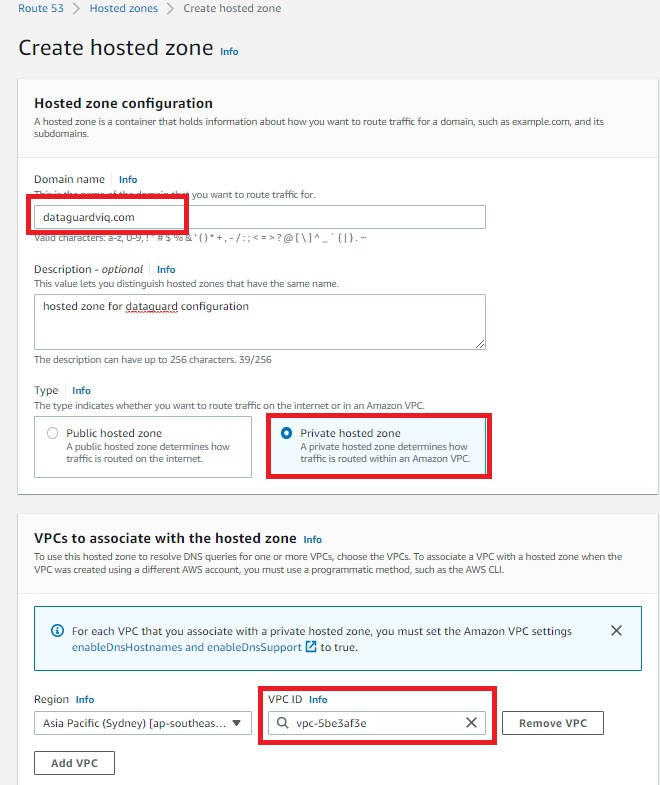
Amazon Route 53 hosted zone

Figure 10. Amazon Route 53 hosted zone

  • Once the Route 53 hosted zone is ready, the last step is to create records by adding private IP addresses of primary and secondary database servers (Figures 11 and 12). Routing policy is set as a failover. That means, if the Route 53 health check fails, the hosted zone does a DNS failover to standby server IP.
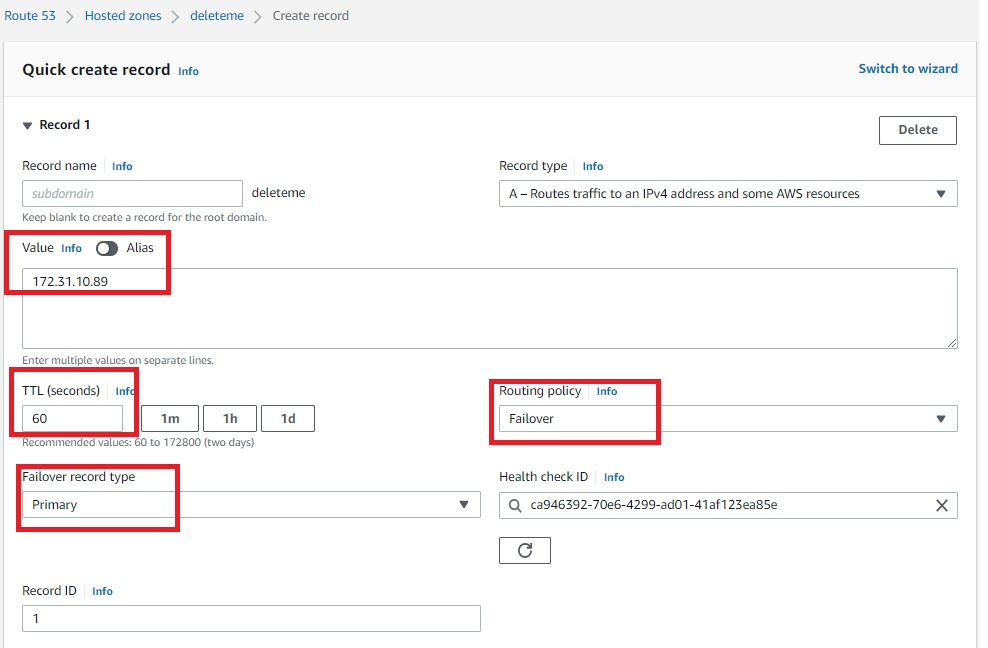
Amazon Route 53 hosted zone record for primary servers
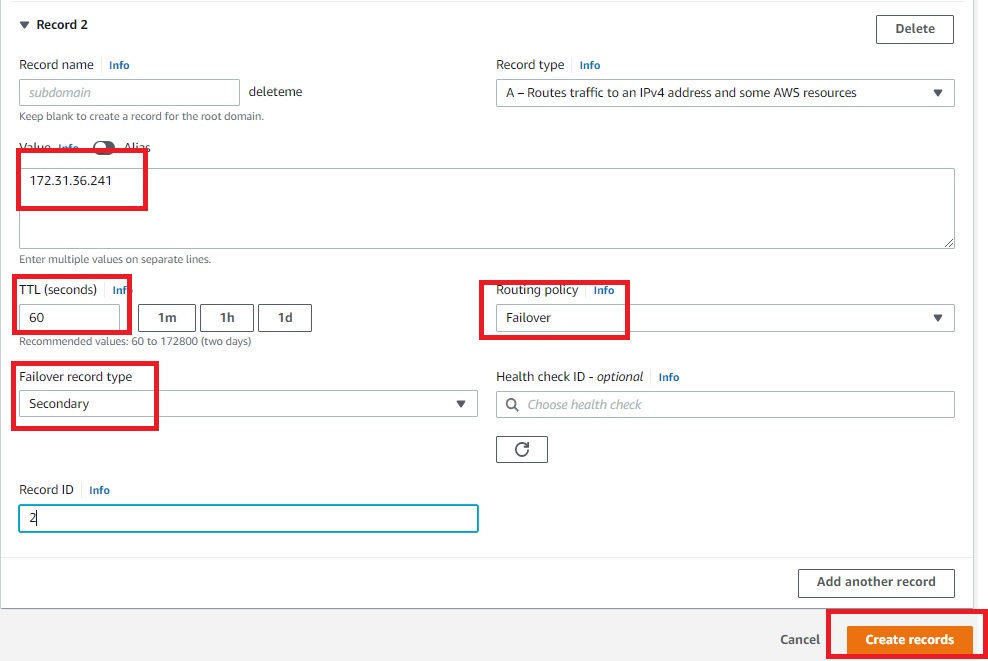
Figure 11. Amazon Route 53 hosted zone record for primary servers

Amazon Route 53 hosted zone record for secondary servers

Figure 12. Amazon Route 53 hosted zone record for secondary servers

Once the records are created, the hosted zone will have an IP address of primary and secondary database servers, as demonstrated in Figure 13.
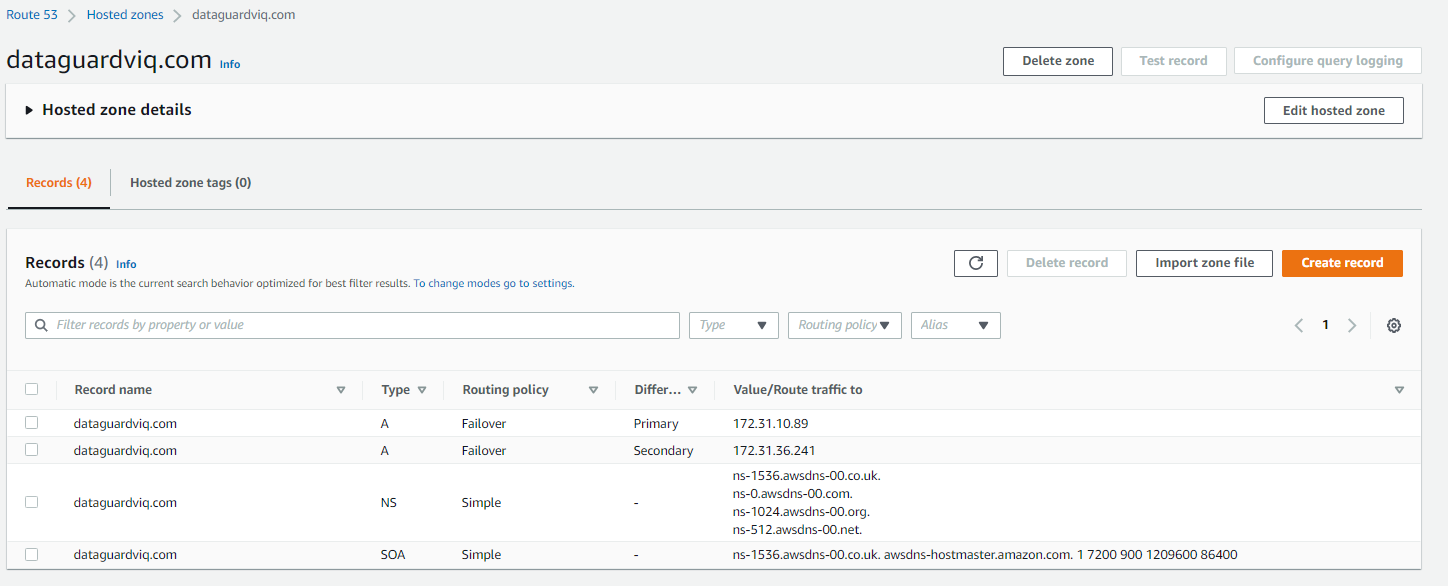
Final view of Amazon Route 53 hosted zone

Figure 13. Final view of Amazon Route 53 hosted zone

Solution testing

To test the solution, do a telnet utility test to evaluate network connectivity on the Route 53 hosted zone that was created. It should display the IP address of the primary database server: 172.31.10.89.

[ec2-user@ip-172-xx-xx-xx ~]$ telnet dataguardviq.com 1522
Trying 172.31.10.89…
Connected to dataguardviq.com.
Escape character is ‘^]’.

Next, perform a switchover or failover of the primary to secondary database server. This can be done with the DGMGRL command “switchover to orclstd”. Output will be:

DGMGRL> switchover to orclstd;
Performing switchover NOW, please wait…
Operation requires a connection to database “orclstd”
Connecting …
Connected to “orclstd”
Connected as SYSDBA.
New primary database “orclstd” is opening…
Oracle Clusterware is restarting database “orclviq” …
Connected to an idle instance.
Connected to “orclviq”
Switchover succeeded, new primary is “orclstd”

Now, the new primary is “orclstd”. In the backend, the Route 53 health check will be initiated and cause a failover. This means the telnet Route 53 hosted zone will give the IP address of the new primary (old secondary), which is 172.31.36.241.

[ec2-user@ip-172-xx-xx-xx ~]$ telnet dataguardviq.com 1522
Trying 172.31.36.241…
Connected to dataguardviq.com.
Escape character is ‘^]’.

Cleanup

To cleanup, remove:

  • Route 53 host zone
  • CloudWatch metric filter
  • CloudWatch alarm
  • CloudWatch agent from observer node
  • IAM role and policy created specifically for this solution

Conclusion

This solution demonstrated how to use a Route 53 hosted zone to route requests to the active primary node for Oracle Data Guard on Amazon EC2.

A multi-dimensional approach helps you proactively prepare for failures, Part 3: Operations and process resiliency

Post Syndicated from Piyali Kamra original https://aws.amazon.com/blogs/architecture/a-multi-dimensional-approach-helps-you-proactively-prepare-for-failures-part-3-operations-and-process-resiliency/

In Part 1 and Part 2 of this series, we discussed how to build application layer and infrastructure layer resiliency.

In Part 3, we explore how to develop resilient applications, and the need to test and break our operational processes and run books. Processes are needed to capture baseline metrics and boundary conditions. Detecting deviations from accepted baselines requires logging, distributed tracing, monitoring, and alerting. Testing automation and rollback are part of continuous integration/continuous deployment (CI/CD) pipelines. Keeping track of network, application, and system health requires automation.

In order to meet recovery time and point objective (RTO and RPO, respectively) requirements of distributed applications, we need automation to implement failover operations across multiple layers. Let’s explore how a distributed system’s operational resiliency needs to be addressed before it goes into production, after it’s live in production, and when a failure happens.

Pattern 1: Standardize and automate AWS account setup

Create processes and automation for onboarding users and providing access to AWS accounts according to their role and business unit, as defined by the organization. Federated access to AWS accounts and organizations simplifies cost management, security implementation, and visibility. Having a strategy for a suitable AWS account structure can reduce the blast radius in case of a compromise.

  1. Have auditing mechanisms in place. AWS CloudTrail monitors compliance, improving security posture, and auditing all the activity records across AWS accounts.
  2. Practice the least privilege security model when setting up access to the CloudTrail audit logs plus network and applications logs. Follow best practices on service control policies and IAM boundaries to help ensure your AWS accounts stay within your organization’s access control policies.
  3. Explore AWS Budgets, AWS Cost Anomaly Detection, and AWS Cost Explorer for cost-optimizing techniques. The AWS Compute Optimizer and Instance Scheduler on AWS resource resizing and auto-shutdown for non-working hours. A Beginner’s Guide to AWS Cost Management explores multiple cost-optimization techniques.
  4. Use AWS CloudFormation and AWS Config to detect infrastructure drift and take corrective actions to make resources compliant, as demonstrated in Figure 1.
Compliance control and drift detection

Figure 1. Compliance control and drift detection

Pattern 2: Documenting knowledge about the distributed system

Document high-level infrastructure and dependency maps.

Define availability characteristics of distributed system. Systems have components with varying RTO and RPO needs. Document application component boundaries and capture dependencies with other infrastructure components, including Domain Name System (DNS), IAM permissions; and access patterns, secrets, and certificates. Discover dependencies through solutions, such as Workload Discovery on AWS, to plan resiliency methods and ensure the order of execution of various steps during failover are correct.

Capture non-functional requirements (NFRs), such as business key performance indicators (KPIs), RTO, and RPO, for your composing services. NFRs are quantifiable and define system availability, reliability, and recoverability requirements. They should include throughput, page-load, and response time requirements. Quantify the RTO and RPO of different components of the distributed system by defining them. The KPIs measure if you are meeting the business objectives. As mentioned in Part 2: Infrastructure layer, RTO and RPO help define the failover and data recovery procedures.

Pattern 3: Define CI/CD pipelines for application code and infrastructure components

Establish a branching strategy. Implement automated checks for version and tagging compliance in feature/sprint/bug fix/hot fix/release candidate branches, according to your organization’s policies. Define appropriate release management processes and responsibility matrices, as demonstrated in Figures 2 and 3.

Test at all levels as part of an automated pipeline. This includes security, unit, and system testing. Create a feedback loop that provides the ability to detect issues and automate rollback in case of production failures, which are indicated by business KPI negative impact and other technical metrics.

Define the release management process

Figure 2. Define the release management process

Sample roles and responsibility matrix

Figure 3. Sample roles and responsibility matrix

Pattern 4: Keep code in a source control repository, regardless of GitOps

Merge requests and configuration changes follow the same process as application software. Just like application code, manage infrastructure as code (IaC) by checking the code into a source control repository, submitting pull requests, scanning code for vulnerabilities, alerting and sending notifications, running validation tests on deployments, and having an approval process.

You can audit your infrastructure drift, design reusable and repeatable patterns, and adhere to your distributed application’s RTO objectives by building your IaC (Figure 4). IaC is crucial for operational resilience.

CI/CD pipeline for deploying IaC

Figure 4. CI/CD pipeline for deploying IaC

Pattern 5: Immutable infrastructure

An immutable deployment pipeline launches a set of new instances running the new application version. You can customize immutability at different levels of granularity depending on which infrastructure part is being rebuilt for new application versions, as in Figure 5.

The more immutable infrastructure components being rebuilt, the more expensive deployments are in both deployment time and actual operational costs. Immutable infrastructure also is easier to rollback.

Different granularity levels of immutable infrastructure

Figure 5. Different granularity levels of immutable infrastructure

Pattern 6: Test early, test often

In a shift-left testing approach, begin testing in the early stages, as demonstrated in Figure 6. This can surface defects that can be resolved in a more time- and cost-effective manner compared with after code is released to production.

Shift-left test strategy

Figure 6. Shift-left test strategy

Continuous testing is an essential part of CI/CD. CI/CD pipelines can implement various levels of testing to reduce the likelihood of defects entering production. Testing can include: unit, functional, regression, load, and chaos.

Continuous testing requires testing and breaking existing boundary conditions, and updating test cases if the boundaries have changed. Test cases should test distributed systems’ idempotency. Chaos testing benefits our incidence response mechanisms for distributed systems that have multiple integration points. By testing our auto scaling and failover mechanisms, chaos testing improves application performance and resiliency.

AWS Fault Injection Simulator (AWS FIS) is a service for chaos testing. An experiment template contains actions, such as StopInstance and StartInstance, along with targets on which the test will be performed. In addition, you can mention stop conditions and check if they triggered the required Amazon CloudWatch alarms, as demonstrated in Figure 7.

AWS Fault Injection Simulator architecture for chaos testing

Figure 7. AWS Fault Injection Simulator architecture for chaos testing

Pattern 7: Providing operational visibility

In production, operational visibility across multiple dimensions is necessary for distributed systems (Figure 8). To identify performance bottlenecks and failures, use AWS X-Ray and other open-source libraries for distributed tracing.

Write application, infrastructure, and security logs to CloudWatch. When metrics breach alarm thresholds, integrate the corresponding alarms with Amazon Simple Notification Service or a third-party incident management system for notification.

Monitoring services, such as Amazon GuardDuty, are used to analyze CloudTrail, virtual private cloud flow logs, DNS logs, and Amazon Elastic Kubernetes Service audit logs to detect security issues. Monitor AWS Health Dashboard for maintenance, end-of-life, and service-level events that could affect your workloads. Follow the AWS Trusted Advisor recommendations to ensure your accounts follow best practices.

Dimensions for operational visibility

Figure 8. Dimensions for operational visibility (click the image to enlarge)

Figure 9 explores various application and infrastructure components integrating with AWS logging and monitoring components for increased problem detection and resolution, which can provide operational visibility.

Tooling architecture to provide operational visibility

Figure 9. Tooling architecture to provide operational visibility

Having an incident response management plan is an important mechanism for providing operational visibility. Successful execution of this requires educating the stakeholders on the AWS shared responsibility model, simulation of anticipated and unanticipated failures, documentation of the distributed system’s KPIs, and continuous iteration. Figure 10 demonstrates the features of a successful incidence response management plan.

An incidence response management plan

Figure 10. An incidence response management plan (click the image to enlarge)

Conclusion

In Part 3, we discussed continuous improvement of our processes by testing and breaking them. In order to understand the baseline level metrics, service-level agreements, and boundary conditions of our system, we need to capture NFRs. Operational capabilities are required to capture deviations from baseline, which is where alerting, logging, and distributed tracing come in. Processes should be defined for automating frequent testing in CI/CD pipelines, detecting network issues, and deploying alternate infrastructure stacks in failover regions based on RTOs and RPOs. Automating failover steps depends on metrics and alarms, and by using chaos testing, we can simulate failover scenarios.

Prepare for failure, and learn from it. Working to maintain resilience is an ongoing task.

Want to learn more?

How Munich Re Automation Solutions Ltd built a digital insurance platform on AWS

Post Syndicated from Sid Singh original https://aws.amazon.com/blogs/architecture/how-munich-re-automation-solutions-ltd-built-a-digital-insurance-platform-on-aws/

Underwriting for life insurance can be quite manual and often time-intensive with lots of re-keying by advisers before underwriting decisions can be made and policies finally issued. In the digital age, people purchasing life insurance want self-service interactions with their prospective insurer. People want speed of transaction with time to cover reduced from days to minutes. While this has been achieved in the general insurance space with online car and home insurance journeys, this is not always the case in the life insurance space. This is where Munich Re Automation Solutions Ltd (MRAS) offers its customers, a competitive edge to shrink the quote-to-fulfilment process using their ALLFINANZ solution.

ALLFINANZ is a cloud-based life insurance and analytics solution to underwrite new life insurance business. It is designed to transform the end consumer’s journey, delivering everything they need to become a policyholder. The core digital services offered to all ALLFINANZ customers include Rulebook Hub, Risk Assessment Interview delivery, Decision Engine, deep analytics (including predictive modeling capabilities), and technical integration services—for example, API integration and SSO integration.

Current state architecture

The ALLFINANZ application began as a traditional three-tier architecture deployed within a datacenter. As MRAS migrated their workload to the AWS cloud, they looked at their regulatory requirements and the technology stack, and decided on the silo model of the multi-tenant SaaS system. Each tenant is provided a dedicated Amazon Virtual Private Cloud (VPC) that holds network and application components, fully isolated from other primary insurers.

As an entry point into the ALLFINANZ environment, MRAS uses Amazon Route 53 to route incoming traffic to the appropriate Amazon VPC. The routing relies on a model where subdomains are assigned to each tenant, for example the subdomain allfinanz.tenant1.munichre.cloud is the subdomain for tenant 1. The diagram below shows the ALLFINANZ architecture. Note: not all links between components are shown here for simplicity.

Current high-level solution architecture for the ALLFINANZ solution

Figure 1. Current high-level solution architecture for the ALLFINANZ solution

  1. The solution uses Route 53 as the DNS service, which provides two entry points to the SaaS solution for MRAS customers:
    • The URL allfinanz.<tenant-id>.munichre.cloud allows user access to the ALLFINANZ Interview Screen (AIS). The AIS can exist as a standalone application, or can be integrated with a customer’s wider digital point-of -sale process.
    • The URL api.allfinanz.<tenant-id>.munichre.cloud is used for accessing the application’s Web services and REST APIs.
  2. Traffic from both entry points flows through the load balancers. While HTTP/S traffic from the application user access entry point flows through an Application Load Balancer (ALB), TCP traffic from the REST API clients flows through a Network Load Balancer (NLB). Transport Layer Security (TLS) termination for user traffic happens at the ALB using certificates provided by the AWS Certificate Manager.  Secure communication over the public network is enforced through TLS validation of the server’s identity.
  3. Unlike application user access traffic, REST API clients use mutual TLS authentication to authenticate a customer’s server. Since NLB doesn’t support mutual TLS, MRAS opted for a solution to pass this traffic to a backend NGINX server for the TLS termination. Mutual TLS is enforced by using self-signed client and server certificates issued by a certificate authority that both the client and the server trust.
  4. Authenticated traffic from ALB and NGINX servers is routed to EC2 instances hosting the application logic. These EC2 instances are hosted in an auto-scaling group spanning two Availability Zones (AZs) to provide high availability and elasticity, therefore, allowing the application to scale to meet fluctuating demand.
  5. Application transactions are persisted in the backend Amazon Relational Database Service MySQL instances. This database layer is configured across multi-AZs, providing high availability and automatic failover.
  6. The application requires the capability to integrate evidence from data sources external to the ALLFINANZ service. This message sharing is enabled through the Amazon MQ managed message broker service for Apache Active MQ.
  7. Amazon CloudWatch is used for end-to-end platform monitoring through logs collection and application and infrastructure metrics and alerts to support ongoing visibility of the health of the application.
  8. Software deployment and associated infrastructure provisioning is automated through infrastructure as code using a combination of Git, Amazon CodeCommit, Ansible, and Terraform.
  9. Amazon GuardDuty continuously monitors the application for malicious activity and delivers detailed security findings for visibility and remediation. GuardDuty also allows MRAS to provide evidence of the application’s strong security posture to meet audit and regulatory requirements.

High availability, resiliency, and security

MRAS deploys their solution across multiple AWS AZs to meet high-availability requirements and ensure operational resiliency. If one AZ has an ongoing event, the solution will remain operational, as there are instances receiving production traffic in another AZ. As described above, this is achieved using ALBs and NLBs to distribute requests to the application subnets across AZs.

The ALLFINANZ solution uses private subnets to segregate core application components and the database storage platform. Security groups provide networking security measures at the elastic network interface level. MRAS restrict access from incoming connection requests to ranges of IP addresses by attaching security groups to the ALBs. Amazon Inspector monitors workloads for software vulnerabilities and unintended network exposure. AWS WAF is integrated with the ALB to protect from SQL injection or cross-site scripting attacks on the application.

Optimizing the existing workload

One of the key benefits of this architecture is that now MRAS can standardize the infrastructure configuration and ensure consistent versioning of the workload across tenants. This makes onboarding new tenants as simple as provisioning another VPC with the same infrastructure footprint.

MRAS are continuing to optimize their architecture iteratively, examining components to modernize to cloud-native components and evolving towards the pool model of multi-tenant SaaS architecture wherever possible. For example, MRAS centralized their per-tenant NAT gateway deployment to a centralized outbound Internet routing design using AWS Transit Gateway, saving approximately 30% on their overall NAT gateway spend.

Conclusion

The AWS global infrastructure has allowed MRAS to serve more than 40 customers in five AWS regions around the world. This solution improves customers’ experience and workload maintainability by standardizing and automating the infrastructure and workload configuration within a SaaS model, compared with multiple versions for the on-premise deployments. SaaS customers are also freed up from the undifferentiated heavy lifting of infrastructure operations, allowing them to focus on their business of underwriting for life insurance.

MRAS used the AWS Well-Architected Framework to assess their architecture and list key recommendations. AWS also offers Well-Architected SaaS Lens and AWS SaaS Factory Program, with a collection of resources to empower and enable insurers at any stage of their SaaS on AWS journey.

Understanding AWS Lambda scaling and throughput

Post Syndicated from Julian Wood original https://aws.amazon.com/blogs/compute/understanding-aws-lambda-scaling-and-throughput/

AWS Lambda provides a serverless compute service that can scale from a single request to hundreds of thousands per second. When designing your application, especially for high load, it helps to understand how Lambda handles scaling and throughput. There are two components to consider: concurrency and transactions per second.

Concurrency of a system is the ability to process more than one task simultaneously. You can measure concurrency at a point in time to view how many tasks the system is doing in parallel. The number of transactions a system can process per second is not the same as concurrency, because a transaction can take more or less than a second to process.

This post shows you how concurrency and transactions per second work within the Lambda lifecycle. It also covers ways to measure, control, and optimize them.

The Lambda runtime environment

Lambda invokes your code in a secure and isolated runtime environment. The following shows the lifecycle of requests to a single function.

First request to invoke your function

First request to invoke your function

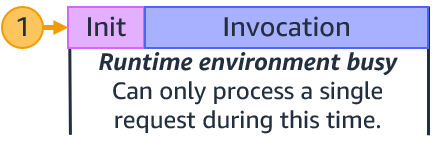
At the first request to invoke your function, Lambda creates a new runtime environment. It then runs the function’s initialization (init) code, which is the code outside the main handler. Lambda then runs the function handler code as the invocation. This receives the event payload and processes your business logic.

Each runtime environment processes a single request at a time. While a single runtime environment is processing a request, it cannot process other requests.

After Lambda finishes processing the request, the runtime environment is ready to process an additional request for the same function. As the initialization code has already run, for request 2, Lambda runs only the function handler code as the invocation.

Lambda ready to process an additional request for the same function

Lambda ready to process an additional request for the same function

If additional requests arrive while processing request 1, Lambda creates new runtime environments. In this example, Lambda creates new runtime environments for requests 2, 3, 4, and 5. It runs the function init and the invocation.

Lambda creating new runtime environments

Lambda creating new runtime environments

When requests arrive, Lambda reuses available runtime environments, and creates new ones if necessary. The following example shows the behavior for additional requests after 1-5.

Lambda reusing runtime environments

Lambda reusing runtime environments

Once request 1 completes, the runtime environment is available to process another request. When request 6 arrives, Lambda re-uses request 1s runtime environment and runs the invocation. This process continues for requests 7 and 8, which reuse the runtime environments from requests 2 and 3. When request 9 arrives, Lambda creates a new runtime environment as there isn’t an existing one available. When request 10 arrives, it reuses the runtime environment freed up after request 4.

The number of runtime environments determines the concurrency. This is the sum of all concurrent requests for currently running functions at a particular point in time. For a single runtime environment, the number of concurrent requests is 1.

Single runtime environment concurrent requests

Single runtime environment concurrent requests

For the example with requests 1–10, the Lambda function concurrency at particular times is the following:

Lambda concurrency at particular times

Lambda concurrency at particular times

time concurrency
t1 3
t2 5
t3 4
t4 6
t5 5
t6 2

When the number of requests decreases, Lambda stops unused runtime environments to free up scaling capacity for other functions.

Invocation duration, concurrency, and transactions per second

The number of transactions Lambda can process per second is the sum of all invokes for that period. If a function takes 1 second to run, and 10 invocations happen concurrently, Lambda creates 10 runtime environments. In this case, Lambda processes 10 requests per second.

Lambda transactions per second for 1 second invocation

Lambda transactions per second for 1 second invocation

If the function duration is halved to 500 ms, the Lambda concurrency remains 10. However, transactions per second are now 20.

Lambda transactions per second for 500 ms second invocation

Lambda transactions per second for 500 ms second invocation

If the function takes 2 seconds to run, during the initial second, transactions per second is 0. However, averaged over time, transactions per second is 5.

You can view concurrency using Amazon CloudWatch metrics. Use the metric name ConcurrentExecutions to view concurrent invocations for all or individual functions.

CloudWatch metrics ConcurrentExecutions

CloudWatch metrics ConcurrentExecutions

You can also estimate concurrent requests from the number of requests per unit of time, in this case seconds, and their average duration, using the formula:

RequestsPerSecond x AvgDurationInSeconds = concurrent requests

If a Lambda function takes an average 500 ms to run, at 100 requests per second, the number of concurrent requests is 50:

100 requests/second x 0.5 sec = 50 concurrent requests

If you half the function duration to 250 ms and the number of requests per second doubles to 200 requests/second, the number of concurrent requests remains the same:

200 requests/second x 0.250 sec = 50 concurrent requests.

Reducing a function’s duration can increase the transactions per second that a function can process. For more information on reducing function duration, watch this re:Invent video.

Scaling quotas

There are two scaling quotas to consider with concurrency. Account concurrency quota and burst concurrency quota.

Account concurrency is the maximum concurrency in a particular Region. This is shared across all functions in an account. The default Regional concurrency quota starts at 1,000, which you can increase with a service ticket.

The burst concurrency quota provides an initial burst of traffic for each function, between 500 and 3000 per minute, depending on the Region.

After this initial burst, functions can scale by another 500 concurrent invocations per minute for all Regions. If you reach the maximum number of concurrent requests, further requests are throttled.

For synchronous invocations, Lambda returns a throttling error (429) to the caller, which must retry the request. With asynchronous and event source mapping invokes, Lambda automatically retries the requests. See Error handling and automatic retries in AWS Lambda for more detail.

A scaling quota example

The following walks through how account and burst concurrency work for an example application.

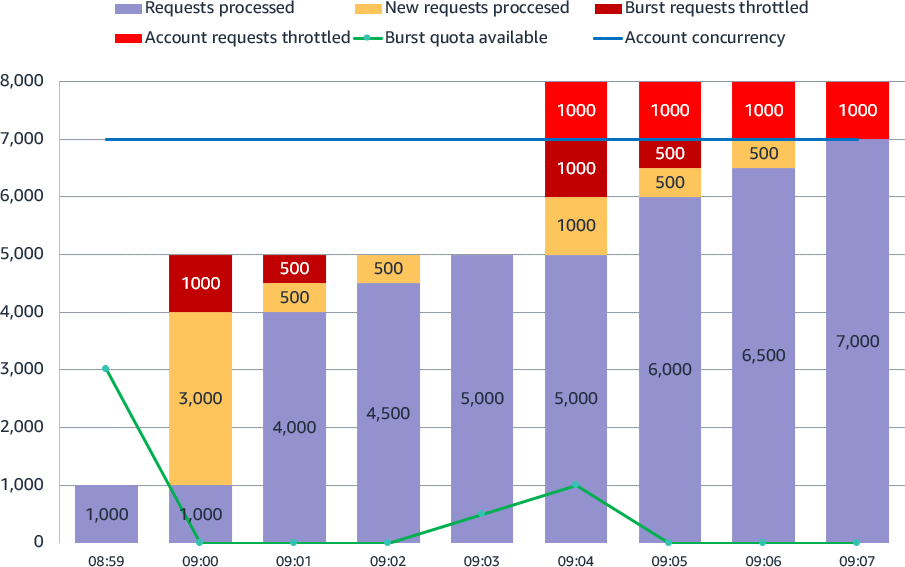
Anticipating handling additional load, the application builders have raised account concurrency to 7,000. There are no other Lambda functions running in this account, so this function can use all available account concurrency.

Lambda account and burst concurrency

Lambda account and burst concurrency

  1. 08:59: The application already has a steady stream of requests, using 1,000 concurrent runtime environments. Each Lambda invocation takes 250 ms, so transactions per second are 4,000.
  2. 09:00: There is a large spike in traffic at 5,000 sustained requests. 1000 requests use the existing runtime environments. Lambda uses the 3,000 available burst concurrency to create new environments to handle the additional load. 1,000 requests are throttled as there is not enough burst concurrency to handle all 5,000 requests. Transactions per second are 16,000.
  3. 09:01: Lambda scales by another 500 concurrent invocations per minute. 500 requests are still throttled. The application can now handle 4,500 concurrent requests.
  4. 09:02: Lambda scales by another 500 concurrent invocations per minute. No requests are throttled. The application can now handle all 5,000 requests.
  5. 09:03: The application continues to handle the sustained 5000 requests. The burst concurrency quota rises to 500.
  6. 09:04: The application sees another spike in traffic, this time unexpected. 3,000 new sustained requests arrive, a combination of 8,000 requests. 5,000 requests use the existing runtime environments. Lambda uses the now available burst concurrency of 1,000 to create new environments to handle the additional load. 1,000 requests are throttled as there is not enough burst concurrency. Another 1,000 requests are throttled as the account concurrency quota has been reached.
  7. 09:05: Lambda scales by another 500 concurrent requests. The application can now handle 6,500 requests. 500 requests are throttled as there is not enough burst concurrency. 1,000 requests are still throttled as the account concurrency quota has been reached.
  8. 09:06: Lambda scales by another 500 concurrent requests. The application can now handle 7,000 requests. 1,000 requests are still throttled as the account concurrency quota has been reached.
  9. 09:07: The application continues to handle the sustained 7,000 requests. 1,000 requests are still throttled as the account concurrency quota has been reached. Transactions per second are 28,000.

Service Quotas is an AWS service that helps you manage your quotas for many AWS services. Along with looking up the values, you can also request a limit increase from the Service Quotas console.

Service Quotas console

Service Quotas console

Reserved concurrency

You can configure a Reserved concurrency setting for your Lambda functions to allocate a maximum concurrency limit for a function. This assigns part of the account concurrency quota to a specific function. This protects and ensures that a function is not throttled and can always scale up to the reserved concurrency value.

It can also help protect downstream resources. If a database or external API can only handle 2 concurrent connections, you can ensure Lambda can’t scale beyond 2 concurrent invokes. This ensures Lambda doesn’t overwhelm the downstream service. You can also use reserved concurrency to avoid race conditions to ensure that your function can only run one concurrent invocation at a time.

Reserved concurrency

Reserved concurrency

You can also set the function concurrency to zero, which stops any function invocations and acts as an off-switch. This can be useful to stop Lambda invocations when you have an issue with a downstream resource. It can give you time to fix the issue before removing or increasing the concurrency to allow invocations to continue.

Provisioned Concurrency

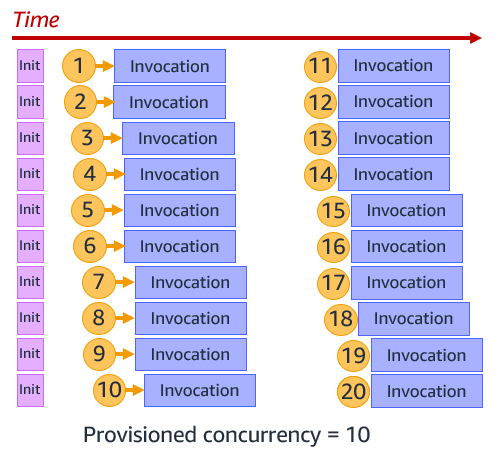
The function initialization process can introduce latency for your applications. You can reduce this latency by configuring Provisioned Concurrency for a function version or alias. This prepares runtime environments in advance, running the function initialization process, so the function is ready to invoke when needed.

This is primarily useful for synchronous requests to ensure you have enough concurrency before an expected traffic spike. You can still burst above this using standard concurrency. The following example shows Provisioned Concurrency configured as 10. Lambda runs the init process for 10 functions, and then when requests arrive, immediately runs the invocation.

Provisioned Concurrency

Provisioned Concurrency

You can use Application Auto Scaling to adjust Provisioned Concurrency automatically based on Lambda’s utilization metric.

Operational metrics

There are CloudWatch metrics available to monitor your account and function concurrency to ensure that your applications can scale as expected. Monitor function Invocations and Duration to understand throughput. Throttles show throttled invocations.

ConcurrentExecutions tracks the total number of runtime environments that are processing events. Ensure this doesn’t reach your account concurrency to avoid account throttling. Use the metric for individual functions to see which are using account concurrency, and also ensure reserved concurrency is not too high. For example, a function may have a reserved concurrency of 2000, but is only using 10.

UnreservedConcurrentExecutions show the number of function invocations without reserved concurrency. This is your available account concurrency buffer.

Use ProvisionedConcurrencyUtilization to ensure you are not paying for Provisioned Concurrency that you are not using. The metric shows the percentage of allocated Provisioned Concurrency in use.

ProvisionedConcurrencySpilloverInvocations show function invocations using standard concurrency, above the configured Provisioned Concurrency value. This may show that you need to increase Provisioned Concurrency.

Conclusion

Lambda provides a highly scalable compute service. Understanding how Lambda scaling and throughput works can help you design your application, especially for high load.

This post explains concurrency and transactions per second. It shows how account and burst concurrency quotas work. You can configure reserved concurrency to ensure that your functions can always scale, and also use it to protect downstream resources. Use Provisioned Concurrency to scale up Lambda in advance of invokes.

For more serverless learning resources, visit Serverless Land.

Simplifying serverless best practices with AWS Lambda Powertools for TypeScript

Post Syndicated from Julian Wood original https://aws.amazon.com/blogs/compute/simplifying-serverless-best-practices-with-aws-lambda-powertools-for-typescript/

This blog post is written by Sara Gerion, Senior Solutions Architect.

Development teams must have a shared understanding of the workloads they own and their expected behaviors to deliver business value fast and with confidence. The AWS Well-Architected Framework and its Serverless Lens provide architectural best practices for designing and operating reliable, secure, efficient, and cost-effective systems in the AWS Cloud.

Developers should design and configure their workloads to emit information about their internal state and current status. This allows engineering teams to ask arbitrary questions about the health of their systems at any time. For example, emitting metrics, logs, and traces with useful contextual information enables situational awareness and allows developers to filter and select only what they need.

Following such practices reduces the number of bugs, accelerates remediation, and speeds up the application lifecycle into production. They can help mitigate deployment risks, offer more accurate production-readiness assessments and enable more informed decisions to deploy systems and changes.

AWS Lambda Powertools for TypeScript

AWS Lambda Powertools provides a suite of utilities for AWS Lambda functions to ease the adoption of serverless best practices. The AWS Hero Yan Cui’s initial implementation of DAZN Lambda Powertools inspired this idea.

Following the community’s adoption of AWS Lambda Powertools for Python and AWS Lambda Powertools for Java, we are excited to announce the general availability of the AWS Lambda Powertools for TypeScript.

AWS Lambda Powertools for TypeScript provides a suite of utilities for Node.js runtimes, which you can use in both JavaScript and TypeScript code bases. The library follows a modular approach similar to the AWS SDK v3 for JavaScript. Each utility is installed as standalone NPM package.

Today, the library is ready for production use with three observability features: distributed tracing (Tracer), structured logging (Logger), and asynchronous business and application metrics (Metrics).

You can instrument your code with Powertools in three different ways:

  • Manually. It provides the most granular control. It’s the most verbose approach, with the added benefit of no additional dependency and no refactoring to TypeScript Classes.
  • Middy middleware. It is the best choice if your existing code base relies on the Middy middleware engine. Powertools offers compatible Middy middleware to make this integration seamless.
  • Method decorator. Use TypeScript method decorators if you prefer writing your business logic using TypeScript Classes. If you aren’t using Classes, this requires the most significant refactoring.

The examples in this blog post use the Middy approach. To follow the examples, ensure that middy is installed:

npm i @middy/core

Logger

Logger provides an opinionated logger with output structured as JSON. Its key features include:

  • Capturing key fields from the Lambda context, cold starts, and structure logging output as JSON.
  • Logging Lambda invocation events when instructed (disabled by default).
  • Printing all the logs only for a percentage of invocations via log sampling (disabled by default).
  • Appending additional keys to structured logs at any point in time.
  • Providing a custom log formatter (Bring Your Own Formatter) to output logs in a structure compatible with your organization’s Logging RFC.

To install, run:

npm install @aws-lambda-powertools/logger

Usage example:

import { Logger, injectLambdaContext } from '@aws-lambda-powertools/logger';
 import middy from '@middy/core';

 const logger = new Logger({
    logLevel: 'INFO',
    serviceName: 'shopping-cart-api',
});

 const lambdaHandler = async (): Promise<void> => {
     logger.info('This is an INFO log with some context');
 };

 export const handler = middy(lambdaHandler)
     .use(injectLambdaContext(logger));

In Amazon CloudWatch, the structured log emitted by your application looks like:

{
     "cold_start": true,
     "function_arn": "arn:aws:lambda:eu-west-1:123456789012:function:shopping-cart-api-lambda-prod-eu-west-1",
     "function_memory_size": 128,
     "function_request_id": "c6af9ac6-7b61-11e6-9a41-93e812345678",
     "function_name": "shopping-cart-api-lambda-prod-eu-west-1",
     "level": "INFO",
     "message": "This is an INFO log with some context",
     "service": "shopping-cart-api",
     "timestamp": "2021-12-12T21:21:08.921Z",
     "xray_trace_id": "abcdef123456abcdef123456abcdef123456"
 }

Logs generated by Powertools can also be ingested and analyzed by any third-party SaaS vendor that supports JSON.

Tracer

Tracer is an opinionated thin wrapper for AWS X-Ray SDK for Node.js.

Its key features include:

  • Auto-capturing cold start and service name as annotations, and responses or full exceptions as metadata.
  • Automatically tracing HTTP(S) clients and generating segments for each request.
  • Supporting tracing functions via decorators, middleware, and manual instrumentation.
  • Supporting tracing AWS SDK v2 and v3 via AWS X-Ray SDK for Node.js.
  • Auto-disable tracing when not running in the Lambda environment.

To install, run:

npm install @aws-lambda-powertools/tracer

Usage example:

import { Tracer, captureLambdaHandler } from '@aws-lambda-powertools/tracer';
 import middy from '@middy/core'; 

 const tracer = new Tracer({
    serviceName: 'shopping-cart-api'
});

 const lambdaHandler = async (): Promise<void> => {
     /* ... Something happens ... */
 };

 export const handler = middy(lambdaHandler)
     .use(captureLambdaHandler(tracer));
AWS X-Ray segments and subsegments emitted by Powertools

AWS X-Ray segments and subsegments emitted by Powertools

Example service map generated with Powertools

Example service map generated with Powertools

Metrics

Metrics create custom metrics asynchronously by logging metrics to standard output following the Amazon CloudWatch Embedded Metric Format (EMF). These metrics can be visualized through CloudWatch dashboards or used to trigger alerts.

Its key features include:

  • Aggregating up to 100 metrics using a single CloudWatch EMF object (large JSON blob).
  • Validating your metrics against common metric definitions mistakes (for example, metric unit, values, max dimensions, max metrics).
  • Metrics are created asynchronously by the CloudWatch service. You do not need any custom stacks, and there is no impact to Lambda function latency.
  • Creating a one-off metric with different dimensions.

To install, run:

npm install @aws-lambda-powertools/metrics

Usage example:

import { Metrics, MetricUnits, logMetrics } from '@aws-lambda-powertools/metrics';
 import middy from '@middy/core';

 const metrics = new Metrics({
    namespace: 'serverlessAirline', 
    serviceName: 'orders'
});

 const lambdaHandler = async (): Promise<void> => {
     metrics.addMetric('successfulBooking', MetricUnits.Count, 1);
 };

 export const handler = middy(lambdaHandler)
     .use(logMetrics(metrics));

In CloudWatch, the custom metric emitted by your application looks like:

{
     "successfulBooking": 1.0,
     "_aws": {
     "Timestamp": 1592234975665,
     "CloudWatchMetrics": [
         {
         "Namespace": "serverlessAirline",
         "Dimensions": [
             [
             "service"
             ]
         ],
         "Metrics": [
             {
             "Name": "successfulBooking",
             "Unit": "Count"
             }
         ]
     },
     "service": "orders"
 }

Serverless TypeScript demo application

The Serverless TypeScript Demo shows how to use Lambda Powertools for TypeScript. You can find instructions on how to deploy and load test this application in the repository.

Serverless TypeScript Demo architecture

Serverless TypeScript Demo architecture

The code for the Get Products Lambda function shows how to use the utilities. The function is instrumented with Logger, Metrics and Tracer to emit observability data.

// blob/main/src/api/get-products.ts
import { APIGatewayProxyEvent, APIGatewayProxyResult} from "aws-lambda";
import { DynamoDbStore } from "../store/dynamodb/dynamodb-store";
import { ProductStore } from "../store/product-store";
import { logger, tracer, metrics } from "../powertools/utilities"
import middy from "@middy/core";
import { captureLambdaHandler } from '@aws-lambda-powertools/tracer';
import { injectLambdaContext } from '@aws-lambda-powertools/logger';
import { logMetrics, MetricUnits } from '@aws-lambda-powertools/metrics';

const store: ProductStore = new DynamoDbStore();
const lambdaHandler = async (event: APIGatewayProxyEvent): Promise<APIGatewayProxyResult> => {

  logger.appendKeys({
    resource_path: event.requestContext.resourcePath
  });

  try {
    const result = await store.getProducts();

    logger.info('Products retrieved', { details: { products: result } });
    metrics.addMetric('productsRetrieved', MetricUnits.Count, 1);

    return {
      statusCode: 200,
      headers: { "content-type": "application/json" },
      body: `{"products":${JSON.stringify(result)}}`,
    };
  } catch (error) {
      logger.error('Unexpected error occurred while trying to retrieve products', error as Error);

      return {
        statusCode: 500,
        headers: { "content-type": "application/json" },
        body: JSON.stringify(error),
      };
  }
};

const handler = middy(lambdaHandler)
    .use(captureLambdaHandler(tracer))
    .use(logMetrics(metrics, { captureColdStartMetric: true }))
    .use(injectLambdaContext(logger, { clearState: true, logEvent: true }));

export {
  handler
};

The Logger utility adds useful context to the application logs. Structuring your logs as JSON allows you to search on your structured data using Amazon CloudWatch Logs Insights. This allows you to filter out the information you don’t need.

For example, use the following query to search for any errors for the serverless-typescript-demo service.

fields resource_path, message, timestamp
| filter service = 'serverless-typescript-demo'
| filter level = 'ERROR'
| sort @timestamp desc
| limit 20
CloudWatch Logs Insights showing errors for the serverless-typescript-demo service.

CloudWatch Logs Insights showing errors for the serverless-typescript-demo service.

The Tracer utility adds custom annotations and metadata during the function invocation, which it sends to AWS X-Ray. Annotations allow you to search for and filter traces by business or application contextual information such as product ID, or cold start.

You can see the duration of the putProduct method and the ColdStart and Service annotations attached to the Lambda handler function.

putProduct trace view

putProduct trace view

The Metrics utility simplifies the creation of complex high-cardinality application data. Including structured data along with your metrics allows you to search or perform additional analysis when needed.

In this example, you can see how many times per second a product is created, deleted, or queried. You could configure alarms based on the metrics.

Metrics view

Metrics view

Code examples

You can use Powertools with many Infrastructure as Code or deployment tools. The project contains source code and supporting files for serverless applications that you can deploy with the AWS Cloud Development Kit (AWS CDK) or AWS Serverless Application Model (AWS SAM).

The AWS CDK lets you build reliable and scalable applications in the cloud with the expressive power of a programming language, including TypeScript. The AWS SAM CLI is that makes it easier to create and manage serverless applications.

You can use the sample applications provided in the GitHub repository to understand how to use the library quickly and experiment in your own AWS environment.

Conclusion

AWS Lambda Powertools for TypeScript can help simplify, accelerate, and scale the adoption of serverless best practices within your team and across your organization.

The library implements best practices recommended as part of the AWS Well-Architected Framework, without you needing to write much custom code.

Since the library relieves the operational burden needed to implement these functionalities, you can focus on the features that matter the most, shortening the Software Development Life Cycle and reducing the Time To Market.

The library helps both individual developers and engineering teams to standardize their organizational best practices. Utilities are designed to be incrementally adoptable for customers at any stage of their serverless journey, from startup to enterprise.

To get started with AWS Lambda Powertools for TypeScript, see the official documentation. For more serverless learning resources, visit Serverless Land.

Automating Amazon EC2-Windows EBS Volumes monitoring and creating alarms

Post Syndicated from Sheila Busser original https://aws.amazon.com/blogs/compute/automating-amazon-ec2-windows-ebs-volumes-monitoring-and-creating-alarms/

This blog post is written by, Santhosh Kumar Adapa, Database Consultant,  AWS WWCO ProServe,  Jeevan Shetty, Database Consultant, AWS WWCO ProServe, and Bhanu Ganesh Gudivada, Consultant  Databases, AWS WWCO ProServe.

Customers who are running fleets of Amazon Elastic Compute Cloud (Amazon EC2) instances use advanced monitoring techniques to observe their operational performance. Capabilities like aggregated and custom dimensions help customers categorize and customize their metrics across server fleets for fast and efficient decision making. Customers require visibility into not only infrastructure metrics (such as CPU and memory), but also disk usage metrics.

Monitoring Amazon EC2-Windows Amazon Elastic Block Store (Amazon EBS) Volumes usage is critical, especially when customers have a large fleet of Amazon EC2 Windows servers running to host their databases and applications in AWS. Generally, we see issues with EC2 instances running out of disk space, and free disk space isn’t a metric that is directly available with Amazon CloudWatch. Amazon CloudWatch agent helps solve this problem. After installing and configuring the CloudWatch agent on your EC2 instance, the agent will send metric data with the disk utilization to CloudWatch. The next step is to create a CloudWatch alarm to monitor the disk utilization metric.

In this post, we showcase the steps to automate the monitoring and creating alarms for EBS volumes attached to Amazon EC2 Windows instances. Alarms are created using AWS Lambda that monitors the free disk space and alerts whenever thresholds are crossed using Amazon Simple Notification Service (Amazon SNS).

Solution overview

To demonstrate the solution we first install and configure the CloudWatch agent in your Amazon EC2 Windows instance, and then the agent will send metric data with the disk utilization to CloudWatch. To monitor the disk on each Amazon EC2 Windows instance, we’ll use two custom Metrics, “FreeStorageSpaceInMB” and “FreeStorageSpaceInPercent”, that are collected by CloudWatch agent and pushed to CloudWatch.

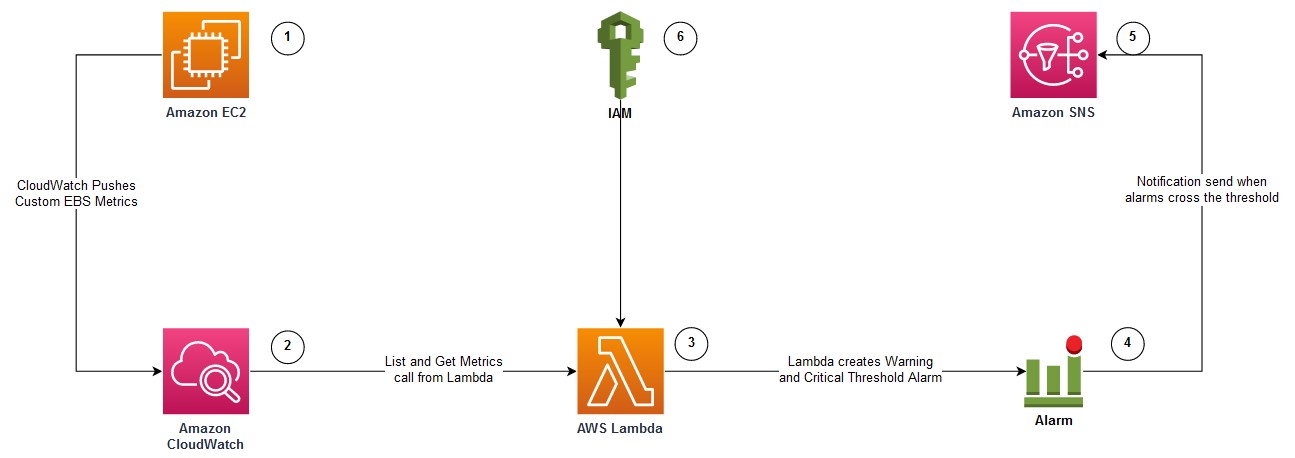
The following diagram illustrates the architecture used in this post:

architecture used in this post

  1. Amazon EC2 Windows instance with attached Amazon EBS Volumes to be monitored for free disk usage. The EC2 instance is configured with Amazon CloudWatch Agent.
  2. CloudWatch agent is configured to monitor the “FreeStorageSpaceInMB” and “FreeStorageSpaceInPercent” metrics, and pushed to AWS CloudWatch.
  3. Lambda function that can be invoked to create CloudWatch alarms for each disk attached to the EC2 instance.
  4. CloudWatch Alarms are created with warnings and critical thresholds based on storage size.
  5. Amazon SNS is used to send alerts when the CloudWatch Alarms crosses the threshold.
  6. AWS Identity and Access Management (IAM) to provide permission to the Lambda function to get Amazon EBS metrics and to create CloudWatch Alarms.

Prerequisites

You will need the following prerequisites:

  • To implement this solution, you must have an Amazon EC2 Windows instance configured with Amazon CloudWatch Agent by following the steps documented in the article – How to monitor Windows and Linux servers and get internal performance metrics.
  • To monitor the “FreeStorageSpaceInMB” and “FreeStorageSpaceInPercent” metrics for Amazon EBS volumes attached to the EC2 instance, the CloudWatch agent configuration JSON should have the following section:
"LogicalDisk": {
	"measurement": [
	{
		"name":"% Free Space",
		"rename":"FreeStorageSpaceInPercent",
		"unit":"Percent"
	},
	{
		"name":"Free Megabytes",
		"rename":"FreeStorageSpaceInMB",
		"unit":"Megabytes"
	}
	],
	"metrics_collection_interval": 10,
	"resources": [
		"*"
	]
},
  1. Amazon EC2 host or bastion host with an IAM role attached that has permissions to create an IAM role, Lambda function, and run Amazon Relational Database Service (Amazon RDS) CLI commands. A Lambda function and an IAM role are created using AWS Serverless Application Model (SAM).

AWS SAM

In this section, we provide the steps to create an IAM role and deploy a Lambda function using AWS SAM.

  1. Log in to the Amazon EC2 host and install the AWS SAM CLI.
  2. Download the source code and deploy it by running the following command:
git clone https://github.com/aws-samples/aws-ec2-windows-ebs-volumes-monitoring

cd aws-ec2-windows-ebs-volumes-monitoring/ebs_volumes_monitoring
sam deploy --guided

3. Provide the following parameters:

    1. Stack Name – Name for the AWS CloudFormation stack.
    2. AWS Region – AWS Region where the stack is being deployed.

The following is the sample output when you run sam deploy –guided with default arguments:

=========================================
Stack Name [ebs-volumes-monitoring]: ebs-volumes-monitoring
AWS Region [us-west-2]:
#Shows you resources changes to be deployed and require a 'Y' to initiate deploy
Confirm changes before deploy [y/N]:
#SAM needs permission to be able to create roles to connect to the resources in your template
Allow SAM CLI IAM role creation [Y/n]:
#Preserves the state of previously provisioned resources when an operation fails
Disable rollback [y/N]:
Save arguments to configuration file [Y/n]:
SAM configuration file [samconfig.toml]:
SAM configuration environment [default]:

In the following sections, we describe the AWS services deployed with AWS SAM.

IAM role

AWS SAM creates an IAM role with policies to describe EC2 instances, as well as List, Get, and Put CloudWatch metrics. Furthermore, it attaches an AWS managed IAM policy called AWSLambdaBasicExecutionRole to the IAM role. This role is attached to the Lambda functions to create Amazon EBS volume alarms for EC2 instances.

Lambda function

AWS SAM also deploys the Lambda function. It uses Python 3.8 and accepts two parameters:

  1. Hostname: Amazon EC2 Windows instance name, or, if we must configure alarms for multiple servers, then you can use a wild card character, such as Instance_name* or Instance_name?
  2. sns_topic_name: ARN of the SNS topic that is used to configure CloudWatch Alarms. Notification is sent to the SNS topic when the Amazon EBS Volume metric crosses the threshold.

Invoking Lambda function

After the SAM deployment is successful, we can invoke the Lambda function with the instance name and the SNS Topic ARN. The Lambda function creates two alarms (Warning and Critical) for every Amazon EBS volume attached to the instance. The Warning and Critical values can be changed in the Lambda code so that there are two different values depending on the size of the disk drive. Furthermore, the alarms are configured to send notifications to the SNS Topic. The following is the sample command to invoke the Lambda function:

aws lambda invoke --function-name ec2-ebs-metric --cli-binary-format raw-in-base64-out \
--payload '{"hostname": "Windows*", "sns_topic_name": "arn:aws:sns:us-west-2:123456789:notify_dba" }' response.json

Verifying CloudWatch Alarms:

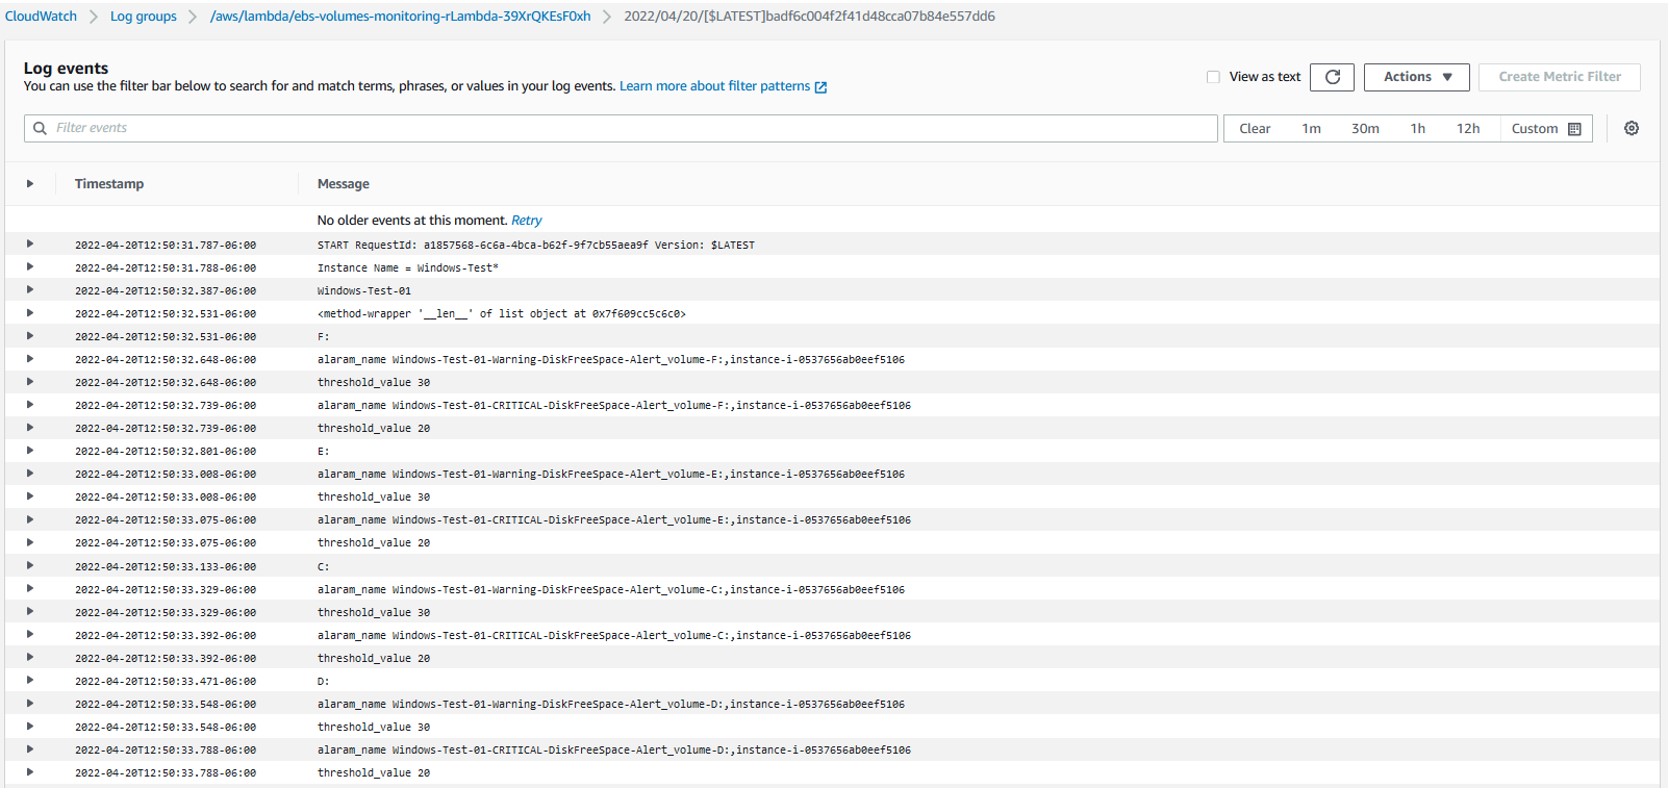
Verify the CloudWatch Alarms that are created in the CloudWatch console. The following screenshot shows the CloudWatch alarms created for an EC2 instance with four disks. There are two alarms (Warning and Critical) created for every disk (four disks in total). Therefore, we see eight CloudWatch alarms.

CloudWatch console alarms

Checking CloudWatch Logs:

After running the Lambda function, to verify the log, go to Lambda Service page, select the Lambda function created, navigate to the Monitor tab, and then select “View logs in CloudWatch”. Then, go to the latest log file to check the CloudWatch log files for any errors.

Checking CloudWatch LogsSelect the latest Log Steam to check the details of the last Lambda function execution.

Log Steam detailsThe log file shows the full details of the Lambda function execution. Furthermore, it shows the CloudWatch alarms configured for each disk, as well as if there are any errors generated during execution.

Log file detailsCleanup

To clean up the resources used in this post, complete the following steps:

  1. Delete the CloudFormation stack by running below command and replacing STACK_NAME with stack name provided in step 3a above, under section “AWS SAM”
sam delete --stack-name STACK_NAME
  1. Confirm the stack has been deleted by running below command. Replace STACK_NAME as mentioned in previous step.
aws cloudformation list-stacks --query "StackSummaries[?contains(StackName,' STACK_NAME ')].StackStatus"
  1. Delete any CloudWatch alarms created by the Lambda function by following the document – Editing or deleting a CloudWatch alarm.

Conclusion

In this post, we demonstrated how the requirement of monitoring Amazon EC2 Windows EBS Volumes usage is critical. In particular, this is essential when customers have a large fleet of Amazon EC2 Windows servers running to host their databases and applications in the cloud. We showcased the process of automating the free disk monitoring using Lambda and notifying through Amazon SNS when disks cross the storage threshold. By implementing such monitoring, customers can prevent issues with EC2 instances running out of disk space thus preventing critical production outages.

Provide any thoughts or questions in the comments section. We also encourage you to explore CloudWatch monitoring and try out additional use cases mentioned in the documentation.

New — Detect and Resolve Issues Quickly with Log Anomaly Detection and Recommendations from Amazon DevOps Guru

Post Syndicated from Donnie Prakoso original https://aws.amazon.com/blogs/aws/new-detect-and-resolve-issues-quickly-with-log-anomaly-detection-and-recommendations-from-amazon-devops-guru/

Today, we are announcing a new feature, Log Anomaly Detection and Recommendations for Amazon DevOps Guru. With this feature, you can find anomalies throughout relevant logs within your app, and get targeted recommendations to resolve issues. Here’s a quick look at this feature:

AWS launched DevOps Guru, a fully managed AIOps platform service, in December 2020 to make it easier for developers and operators to improve applications’ reliability and availability. DevOps Guru minimizes the time needed for issue remediation by using machine learning models based on more than 20 years of operational expertise in building, scaling, and maintaining applications for Amazon.com.

You can use DevOps Guru to identify anomalies such as increased latency, error rates, and resource constraints and then send alerts with a description and actionable recommendations for remediation. You don’t need any prior knowledge in machine learning to use DevOps Guru, and only need to activate it in the DevOps Guru dashboard.

New Feature – Log Anomaly Detection and Recommendations

Observability and monitoring are integral parts of DevOps and modern applications. Applications can generate several types of telemetry, one of which is metrics, to reveal the performance of applications and to help identify issues.

While the metrics analyzed by DevOps Guru today are critical to surfacing issues occurring in applications, it is still challenging to find the root cause of these issues. As applications become more distributed and complex, developers and IT operators need more automation to reduce the time and effort spend detecting, debugging, and resolving operational issues. By sourcing relevant logs in conjunction with metrics, developers can now more effectively monitor and troubleshoot their applications.

With this new Log Anomaly Detection and Recommendations feature, you can get insights along with precise recommendations from application logs without manual effort. This feature delivers contextualized log data of anomaly occurrences and provides actionable insights from recommendations integrated inside the DevOps Guru dashboard.

The Log Anomaly Detection and Recommendations feature is able to detect exception keywords, numerical anomalies, HTTP status codes, data format anomalies, and more. When DevOps Guru identifies anomalies from logs, you will find relevant log samples and deep links to CloudWatch Logs on the DevOps Guru dashboard. These contextualized logs are an important component for DevOps Guru to provide further features, namely targeted recommendations to help faster troubleshooting and issue remediation.

Let’s Get Started!

This new feature consists of two things, “Log Anomaly Detection” and “Recommendations.” Let’s explore further into how we can use this feature to find the root cause of an issue and get recommendations. As an example, we’ll look at my serverless API built using Amazon API Gateway, with AWS Lambda integrated with Amazon DynamoDB. The architecture is shown in the following image:

If it’s your first time using DevOps Guru, you’ll need to enable it by visiting the DevOps Guru dashboard. You can learn more by visiting the Getting Started page.

Since I’ve already enabled DevOps Guru I can go to the Insights page, navigate to the Log groups section, and select the Enable log anomaly detection.

Log Anomaly Detection

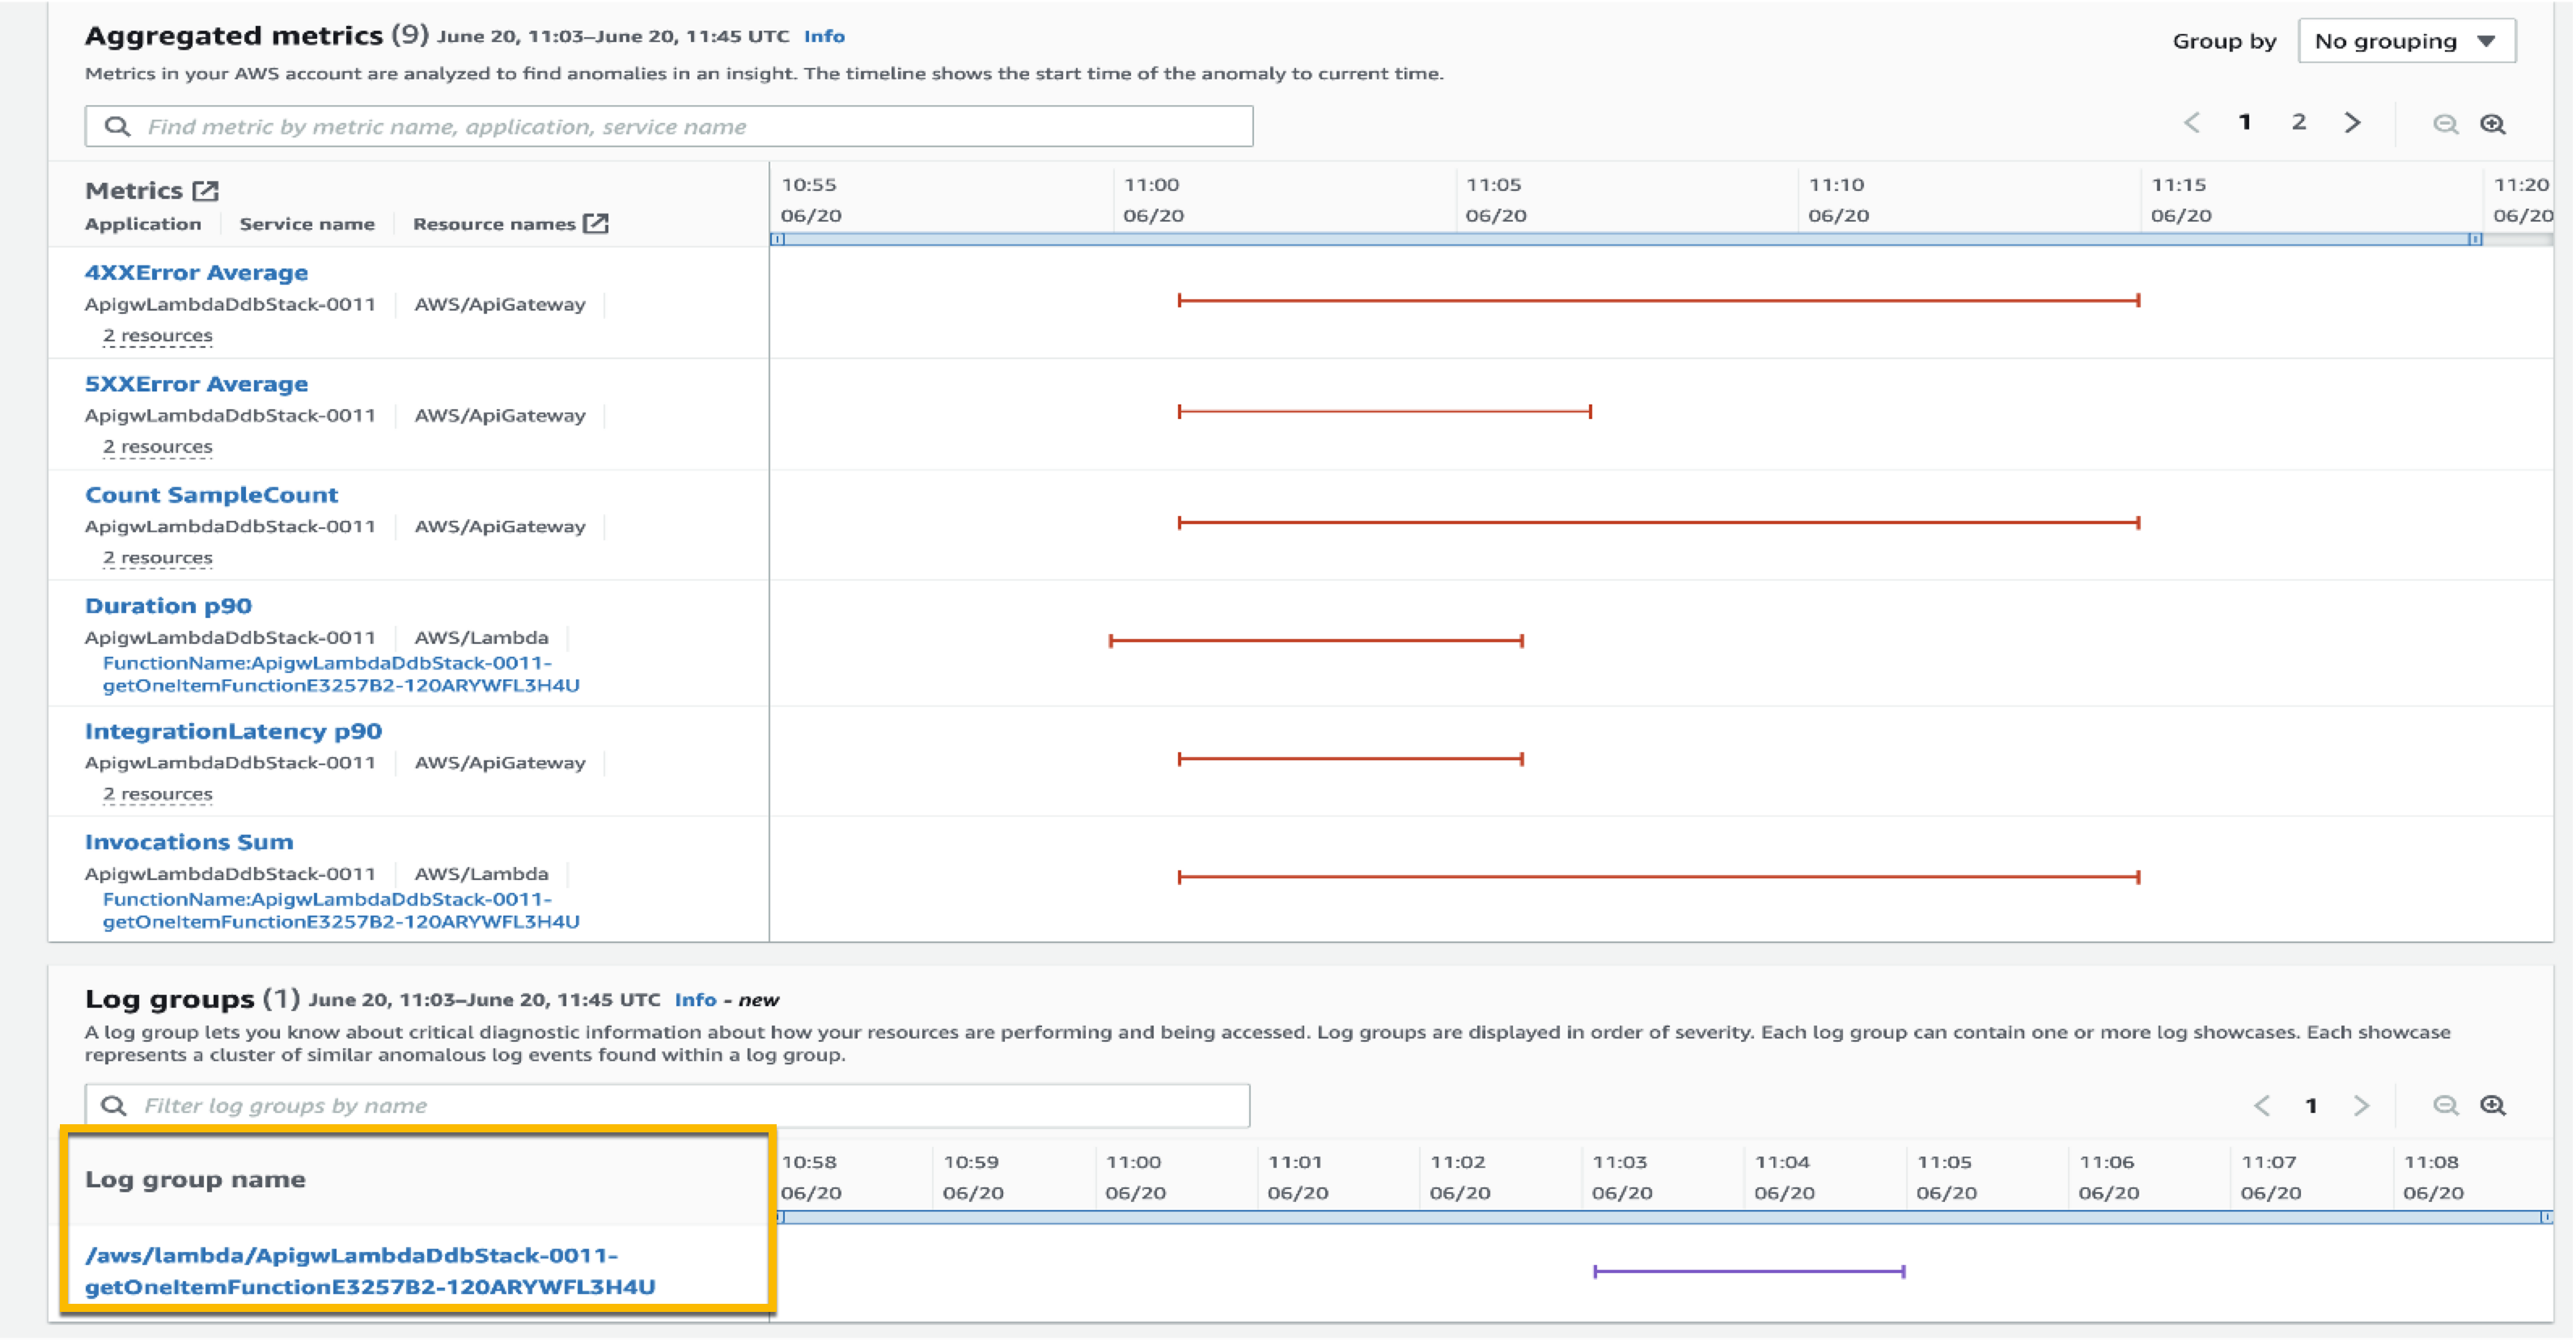
After a few hours, I can visit the DevOps Guru dashboard to check for insights. Here, I get some findings from DevOps Guru, as seen in the following screenshots:

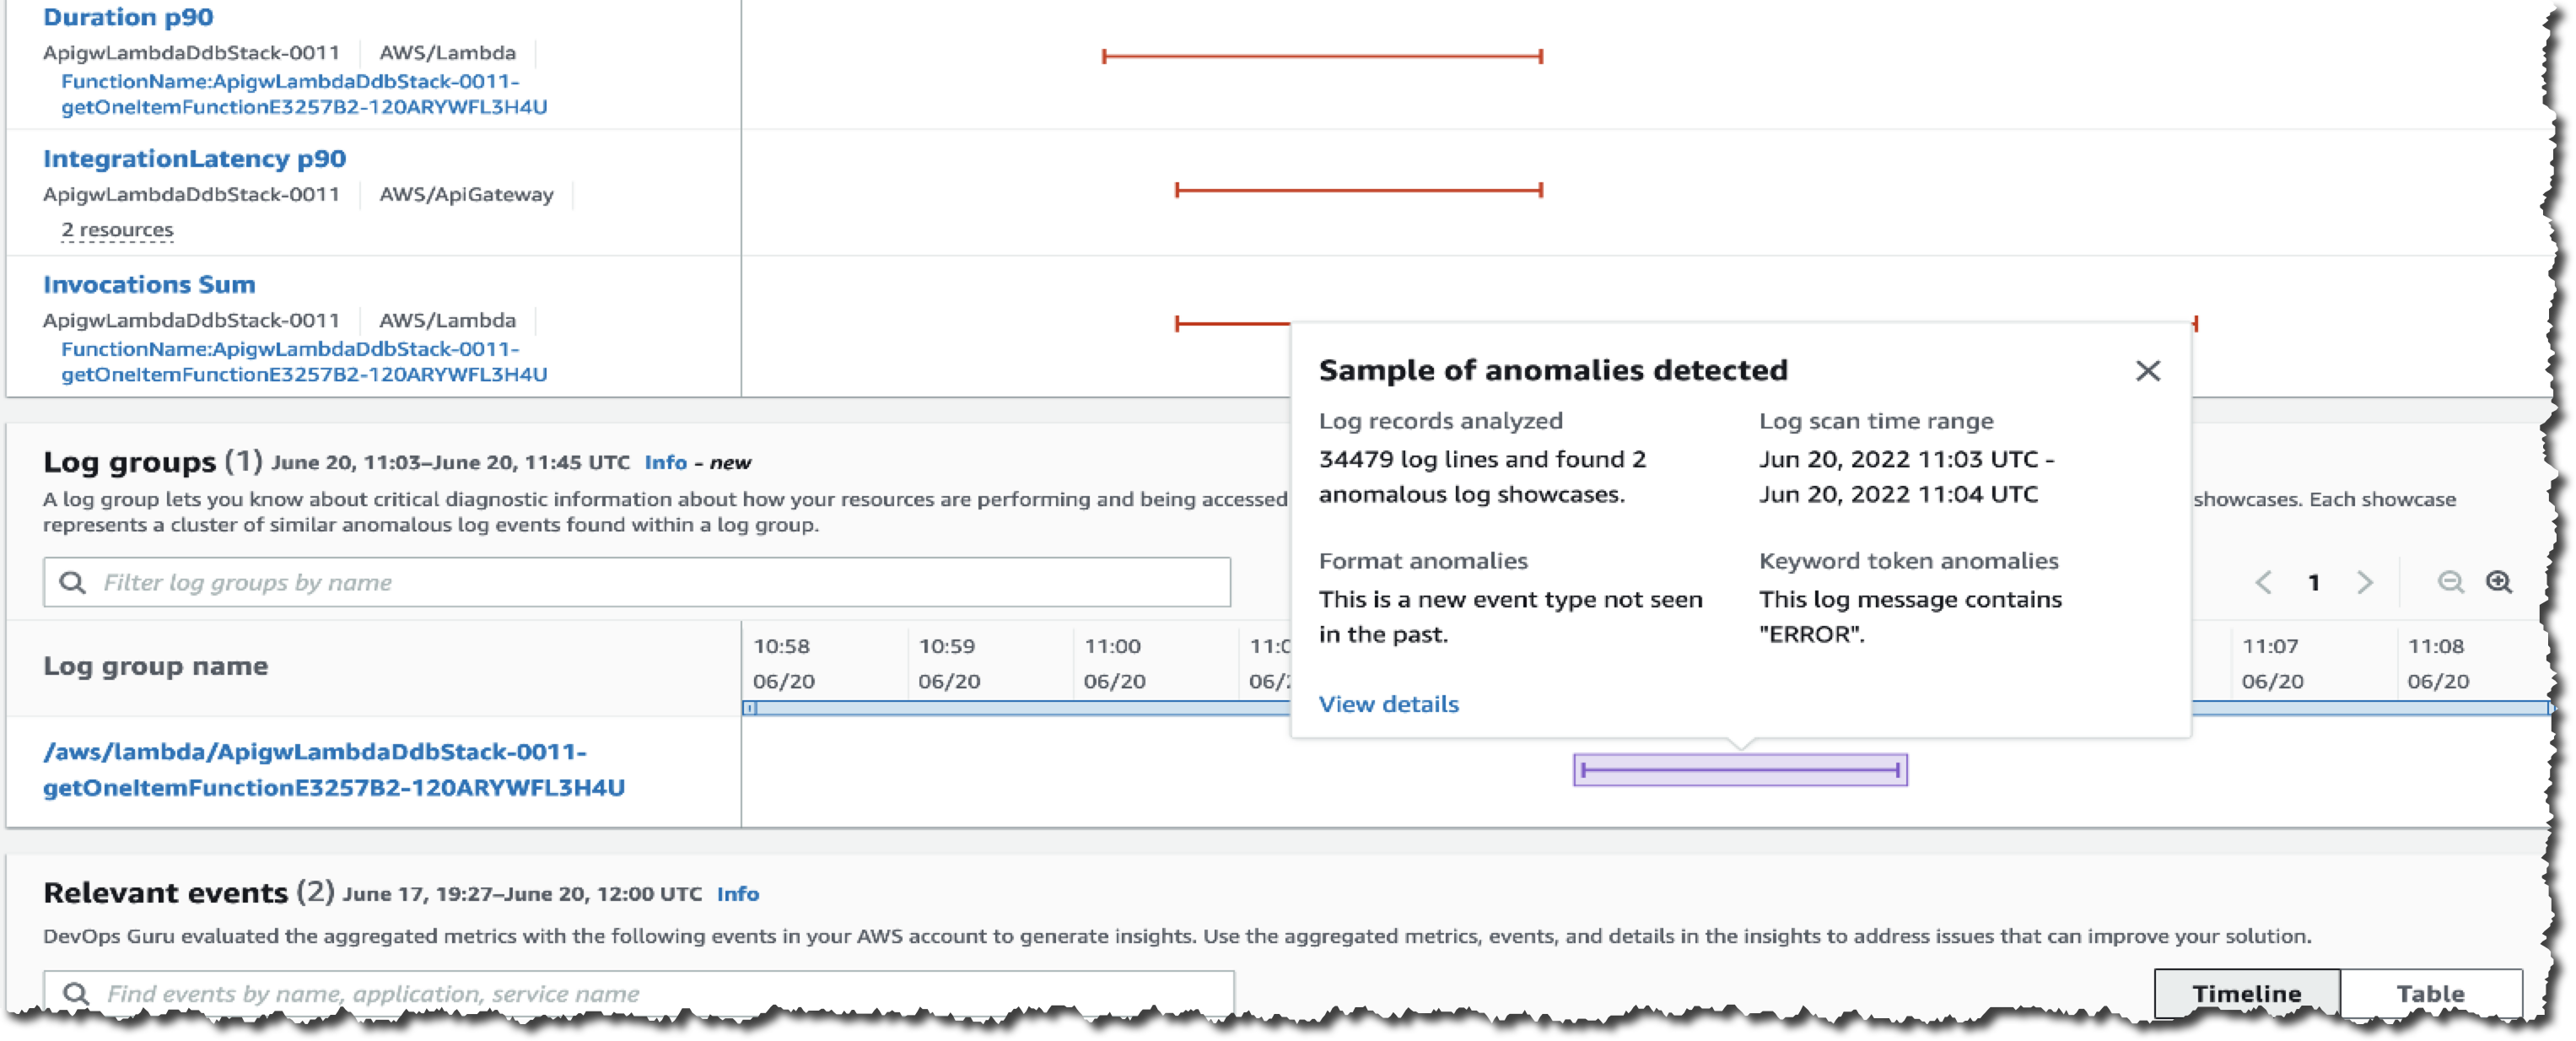
With Log Anomaly Detection, DevOps Guru will show the findings of my serverless API in the Log groups section, as seen in the following screenshot:

I can hover over the anomaly and get a high-level summary of the contextualized enrichment data found in this log group. It also provides me with additional information, including the number of log records analyzed and the log scan time range. From this information, I know these anomalies are new event types that have not been detected in the past with the keyword ERROR.

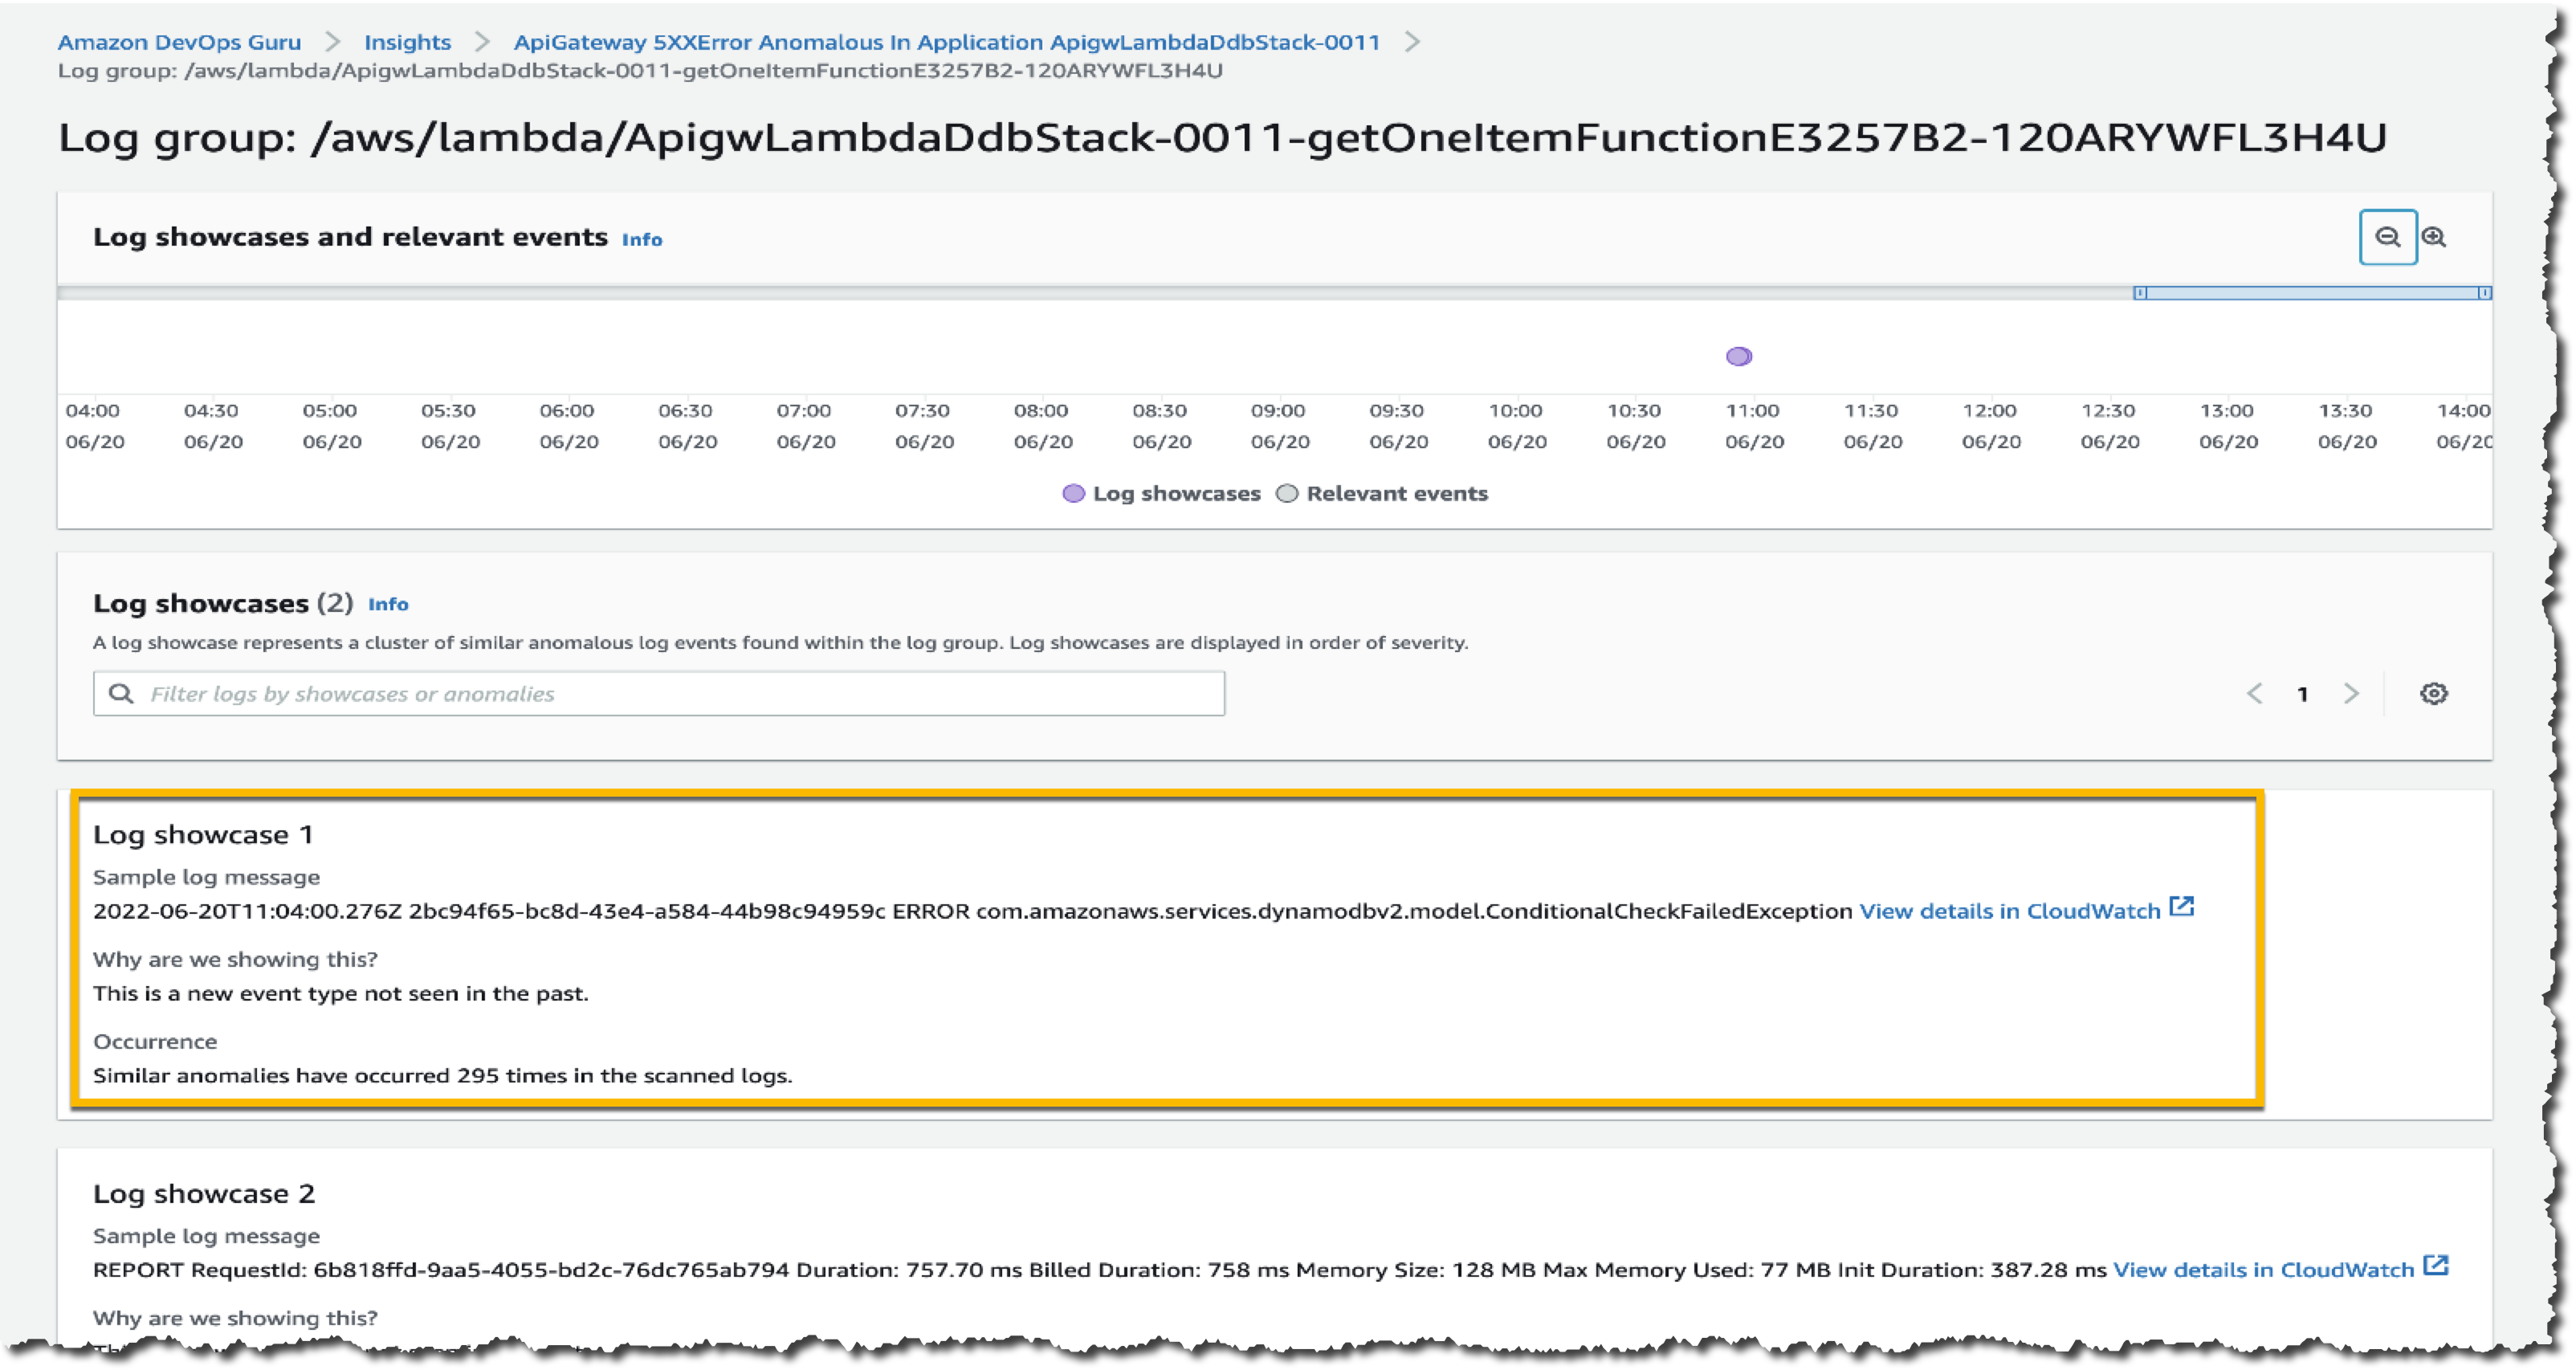
To investigate further, I can select the log group link and go to the Detail page. The graph shows relevant events that might have occurred around these log showcases, which is a helpful context for troubleshooting the root cause. This Detail page includes different showcases, each representing a cluster of similar log events, like exception keywords and numerical anomalies, found in the logs at the time of the anomaly.

Looking at the first log showcase, I noticed a ConditionalCheckFailedException error within the AWS Lambda function. This can occur when AWS Lambda fails to call DynamoDB. From here, I learned that there was an error in the conditional check section, and I reviewed the logic on AWS Lambda. I can also investigate related CloudWatch Logs groups by selecting View details in CloudWatch links.

One thing I want to emphasize here is that DevOps Guru identifies significant events related to application performance and helps me to see the important things I need to focus on by separating the signal from the noise.

Targeted Recommendations

In addition to anomaly detection of logs, this new feature also provides precise recommendations based on the findings in the logs. You can find these recommendations on the Insights page, by scrolling down to find the Recommendations section.

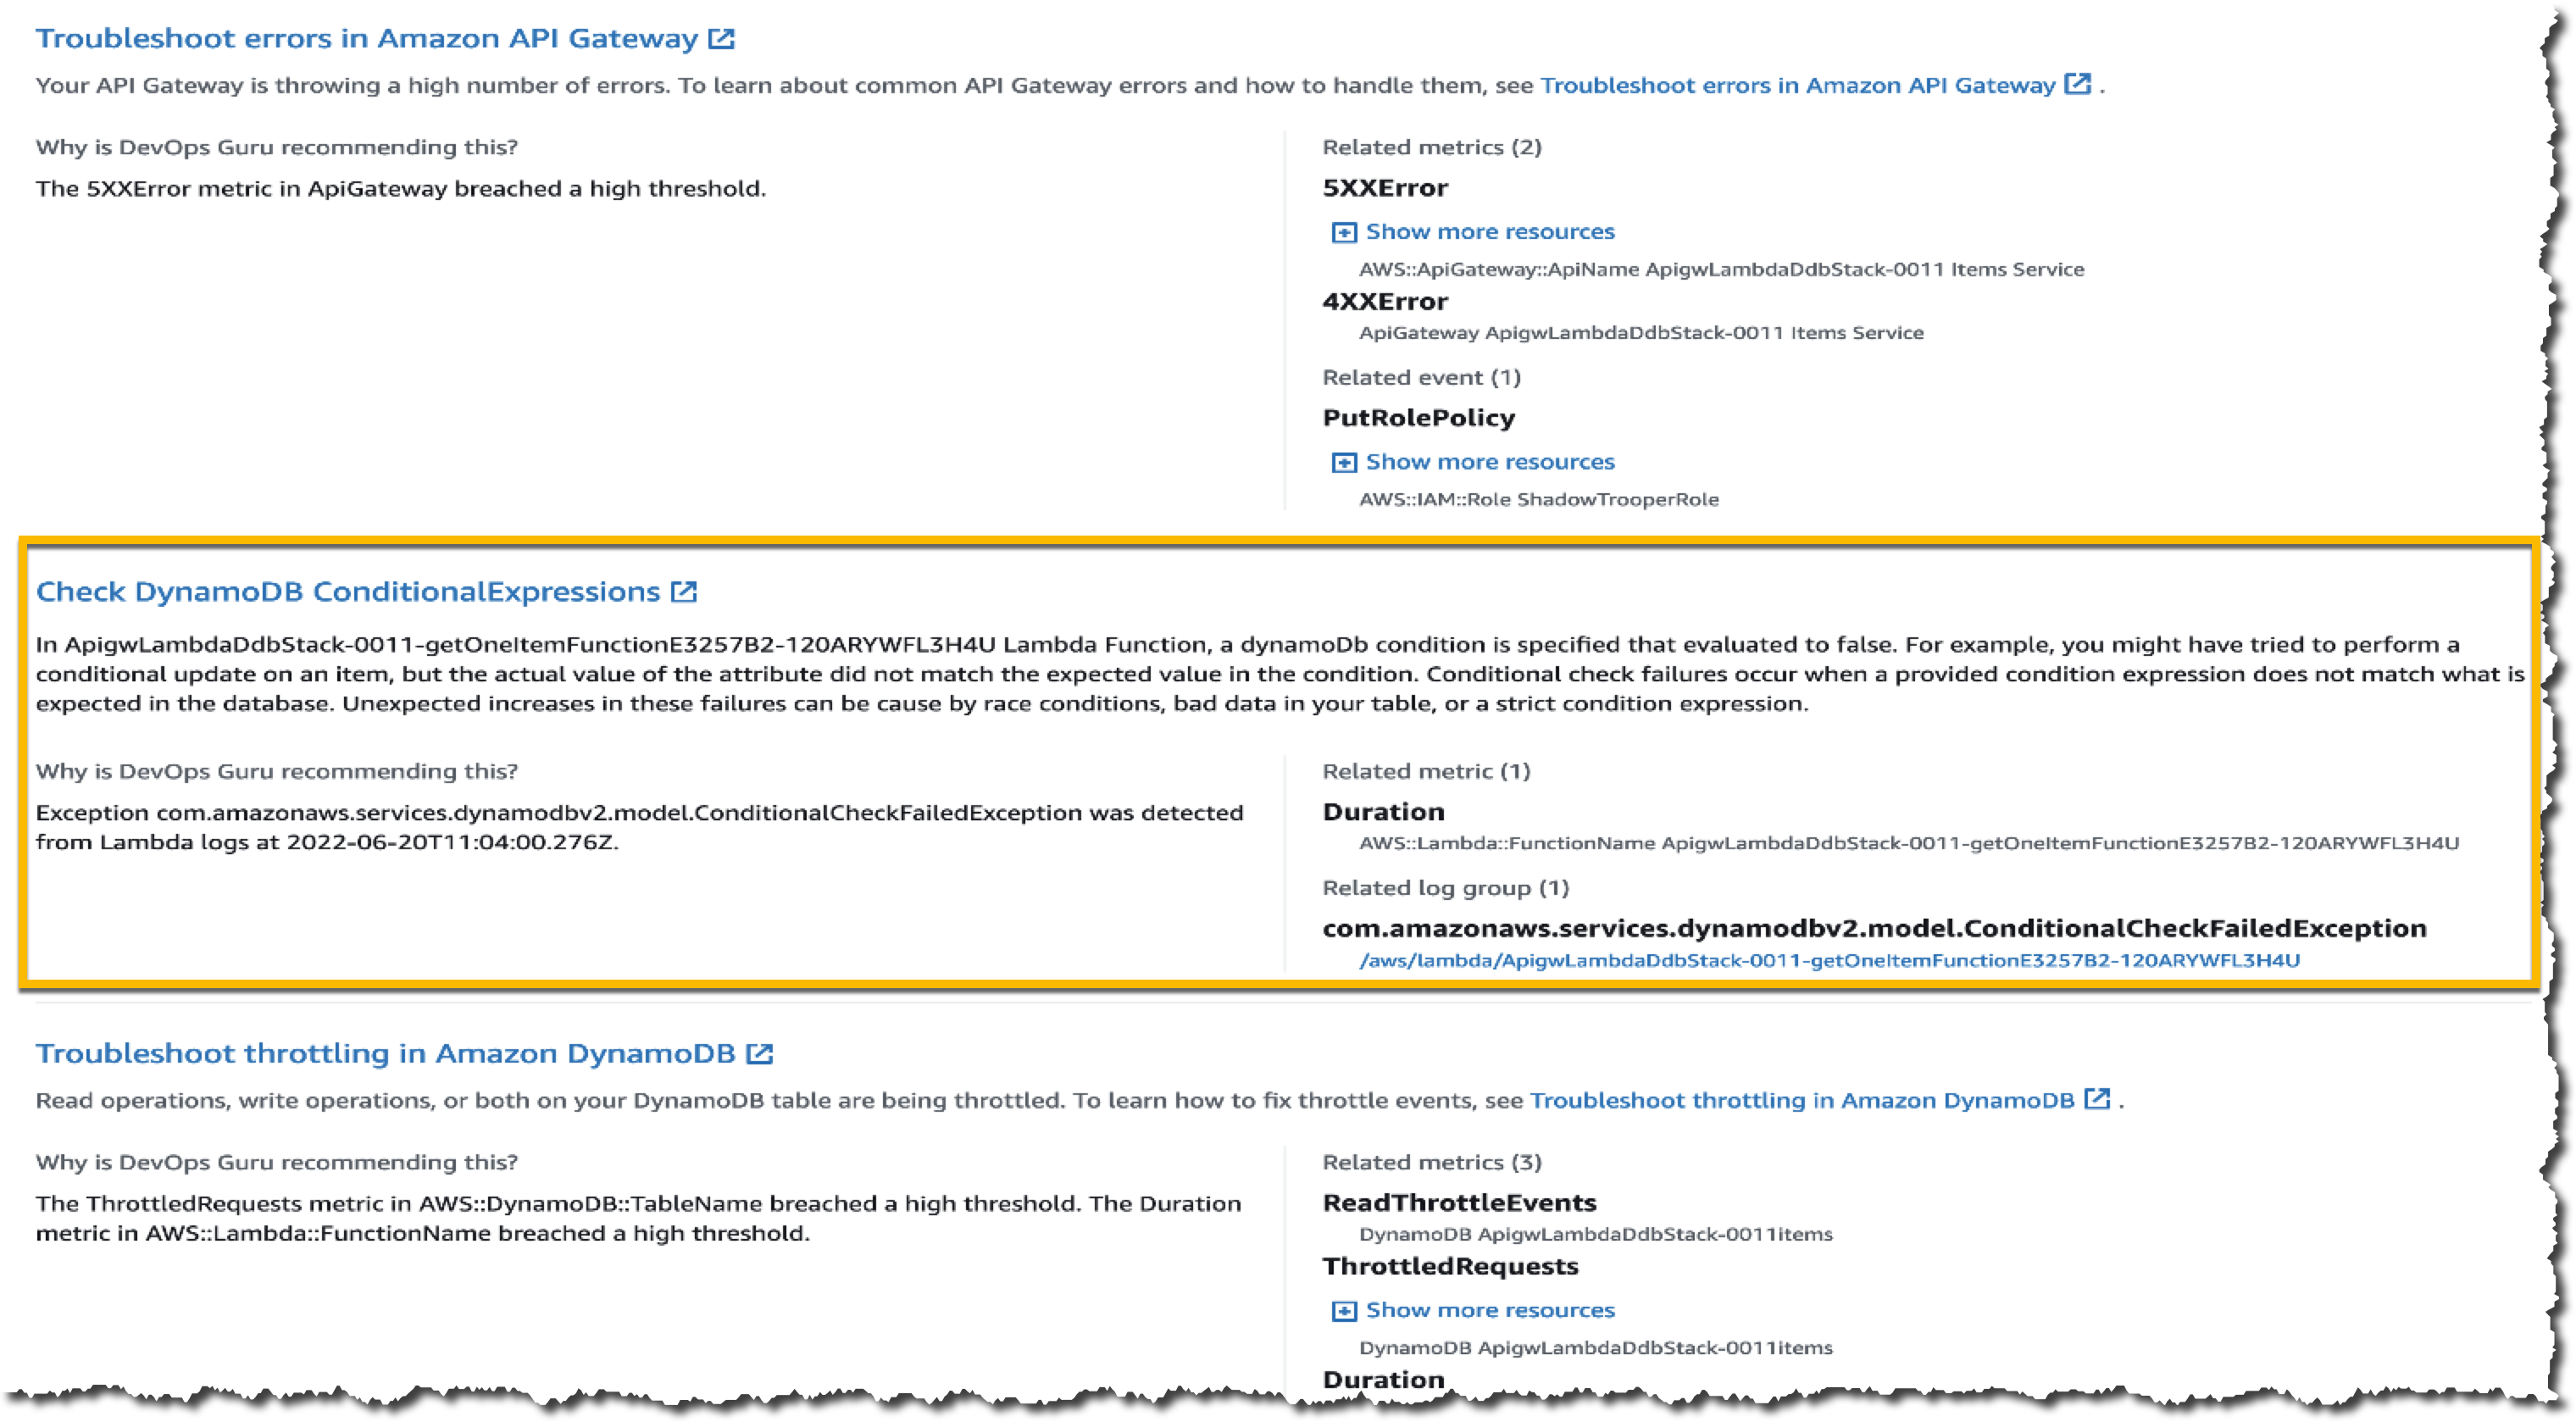
Here, I get some recommendations from DevOps Guru, which make it easier for me to take immediate steps to remediate the issue. One recommendation shown in the following image is Check DynamoDB ConditionalExpression, which relates to an anomaly found in the logs derived from AWS Lambda.

Availability

You can use DevOps Guru Log Anomaly Detection and Recommendations today at no additional charge in all Regions where DevOps Guru is available, US East (Ohio), US East (N. Virginia), US West (Oregon), Asia Pacific (Singapore), Asia Pacific (Sydney), Asia Pacific (Tokyo), Europe (Frankfurt), Europe (Ireland), and Europe (Stockholm).

To learn more, please visit Amazon DevOps Guru web site and technical documentation, and get started today.

Happy building
— Donnie

AWS Week In Review – July 11, 2022

Post Syndicated from Sébastien Stormacq original https://aws.amazon.com/blogs/aws/aws-week-in-review-july-11/

This post is part of our Week in Review series. Check back each week for a quick roundup of interesting news and announcements from AWS!

In France, we know summer has started when you see the Tour de France bike race on TV or in a city nearby. This year, the tour stopped in the city where I live, and I was blocked on my way back home from a customer conference to let the race pass through.

It’s Monday today, so let’s make another tour—a tour of the AWS news, announcements, or blog posts that captured my attention last week. I selected these as being of interest to IT professionals and developers: the doers, the builders that spend their time on the AWS Management Console or in code.

Last Week’s Launches
Here are some launches that got my attention during the previous week:

Amazon EC2 Mac M1 instances are generally available – this new EC2 instance type allows you to deploy Mac mini computers with M1 Apple Silicon running macOS using the same console, API, SDK, or CLI you are used to for interacting with EC2 instances. You can start, stop them, assign a security group or an IAM role, snapshot their EBS volume, and recreate an AMI from it, just like with Linux-based or Windows-based instances. It lets iOS developers create full CI/CD pipelines in the cloud without requiring someone in your team to reinstall various combinations of macOS and Xcode versions on on-prem machines. Some of you had the chance the enter the preview program for EC2 Mac M1 instances when we announced it last December. EC2 Mac M1 instances are now generally available.

AWS IAM Roles Anywhere – this is one of those incremental changes that has the potential to unlock new use cases on the edge or on-prem. AWS IAM Roles Anywhere enables you to use IAM roles for your applications outside of AWS to access AWS APIs securely, the same way that you use IAM roles for workloads on AWS. With IAM Roles Anywhere, you can deliver short-term credentials to your on-premises servers, containers, or other compute platforms. It requires an on-prem Certificate Authority registered as a trusted source in IAM. IAM Roles Anywhere exchanges certificates issued by this CA for a set of short-term AWS credentials limited in scope by the IAM role associated to the session. To make it easy to use, we do provide a CLI-based signing helper tool that can be integrated in your CLI configuration.

A streamlined deployment experience for .NET applications – the new deployment experience focuses on the type of application you want to deploy instead of individual AWS services by providing intelligent compute recommendations. You can find it in the AWS Toolkit for Visual Studio using the new “Publish to AWS” wizard. It is also available via the .NET CLI by installing AWS Deploy Tool for .NET. Together, they help easily transition from a prototyping phase in Visual Studio to automated deployments. The new deployment experience supports ASP.NET Core, Blazor WebAssembly, console applications (such as long-lived message processing services), and tasks that need to run on a schedule.

For a full list of AWS announcements, be sure to keep an eye on the What’s New at AWS page.

Other AWS News
This week, I also learned from these blog posts:

TLS 1.2 to become the minimum TLS protocol level for all AWS API endpointsthis article was published at the end of June, and it deserves more exposure. Starting in June 2022, we will progressively transition all our API endpoints to TLS 1.2 only. The good news is that 95 percent of the API calls we observe are already using TLS 1.2, and only five percent of the applications are impacted. If you have applications developed before 2014 (using a Java JDK before version 8 or .NET before version 4.6.2), it is worth checking your app and updating them to use TLS 1.2. When we detect your application is still using TLS 1.0 or TLS 1.1, we inform you by email and in the AWS Health Dashboard. The blog article goes into detail about how to analyze AWS CloudTrail logs to detect any API call that would not use TLS 1.2.

How to implement automated appointment reminders using Amazon Connect and Amazon Pinpoint this blog post guides you through the steps to implement a system to automatically call your customers to remind them of their appointments. This automated outbound campaign for appointment reminders checked the campaign list against a “do not call” list before making an outbound call. Your customers are able to confirm automatically or reschedule by speaking to an agent. You monitor the results of the calls on a dashboard in near real time using Amazon QuickSight. It provides you with AWS CloudFormation templates for the parts that can be automated and detailed instructions for the manual steps.

Using Amazon CloudWatch metrics math to monitor and scale resources AWS Auto Scaling is one of those capabilities that may look like magic at first glance. It uses metrics to take scale-out or scale-in decisions. Most customers I talk with struggle a bit at first to define the correct combination of metrics that allow them to scale at the right moment. Scaling out too late impacts your customer experience while scaling out too early impacts your budget. This article explains how to use metric math, a way to query multiple Amazon CloudWatch metrics, and use math expressions to create new time series based on these metrics. These math metrics may, in turn, be used to trigger scaling decisions. The typical use case would be to mathematically combine CPU, memory, and network utilization metrics to decide when to scale in or to scale out.

How to use Amazon RDS and Amazon Aurora with a static IP address – in the cloud, it is better to access network resources by referencing their DNS name instead of IP addresses. IP addresses come and go as resources are stopped, restarted, scaled out, or scaled in. However, when integrating with older, more rigid environments, it might happen, for a limited period of time, to authorize access through a static IP address. You have probably heard that scary phrase: “I have to authorize your IP address in my firewall configuration.” This new blog post explains how to do so for Amazon Relational Database Service (Amazon RDS) database. It uses a Network Load Balancer and traffic forwarding at the Linux-kernel level to proxy your actual database server.

Amazon S3 Intelligent-Tiering significantly reduces storage costs – we estimate our customers saved up to $250 millions in storage costs since we launched S3 Intelligent-Tiering in 2018. A recent blog post describes how Amazon Photo, a service that provides unlimited photo storage and 5 GB of video storage to Amazon Prime members in eight marketplaces world-wide, uses S3 Intelligent-Tiering to significantly save on storage costs while storing hundreds of petabytes of content and billions of images and videos on S3.

Upcoming AWS Events
Check your calendars and sign up for these AWS events:

AWS re:Inforce is the premier cloud security conference, July 26-27. This year it is hosted at the Boston Convention and Exhibition Center, Massachusetts, USA. The conference agenda is available and there is still time to register.

AWS Summit Chicago, August 25, at McCormick Place, Chicago, Illinois, USA. You may register now.

AWS Summit Canberra, August 31, at the National Convention Center, Canberra, Australia. Registrations are already open.

That’s all for this week. Check back next Monday for another tour of AWS news and launches!

— seb

Use AWS CloudWatch as a destination for Amazon Redshift Audit logs

Post Syndicated from Nita Shah original https://aws.amazon.com/blogs/big-data/using-aws-cloudwatch-as-destination-for-amazon-redshift-audit-logs/

Amazon Redshift is a fast, scalable, secure, and fully-managed cloud data warehouse that makes it simple and cost-effective to analyze all of your data using standard SQL. Amazon Redshift has comprehensive security capabilities to satisfy the most demanding requirements. To help you to monitor the database for security and troubleshooting purposes, Amazon Redshift logs information about connections and user activities in your database. This process is called database auditing.

Amazon Redshift Audit Logging is good for troubleshooting, monitoring, and security purposes, making it possible to determine suspicious queries by checking the connections and user logs to see who is connecting to the database. It gives information, such as the IP address of the user’s computer, the type of authentication used by the user, or the timestamp of the request. Audit logs make it easy to identify who modified the data. Amazon Redshift logs all of the SQL operations, including connection attempts, queries, and changes to your data warehouse. These logs can be accessed via SQL queries against system tables, saved to a secure Amazon Simple Storage Service (Amazon S3) Amazon location, or exported to Amazon CloudWatch. You can view your Amazon Redshift cluster’s operational metrics on the Amazon Redshift console, use CloudWatch, and query Amazon Redshift system tables directly from your cluster.

This post will walk you through the process of configuring CloudWatch as an audit log destination. It will also show you that the latency of log delivery to either Amazon S3 or CloudWatch is reduced to less than a few minutes using enhanced Amazon Redshift Audit Logging. You can enable audit logging to Amazon CloudWatch via the AWS-Console or AWS CLI & Amazon Redshift API.

Solution overview

Amazon Redshift logs information to two locations-system tables and log files.

  1. System tables: Amazon Redshift logs data to system tables automatically, and history data is available for two to five days based on log usage and available disk space. To extend the log data retention period in system tables, use the Amazon Redshift system object persistence utility from AWS Labs on GitHub. Analyzing logs through system tables requires Amazon Redshift database access and compute resources.
  2. Log files: Audit logging to CloudWatch or to Amazon S3 is an optional process. When you turn on logging on your cluster, you can choose to export audit logs to Amazon CloudWatch or Amazon S3. Once logging is enabled, it captures data from the time audit logging is enabled to the present time. Each logging update is a continuation of the previous logging update. Access to audit log files doesn’t require access to the Amazon Redshift database, and reviewing logs stored in Amazon S3 doesn’t require database computing resources. Audit log files are stored indefinitely in CloudWatch logs or Amazon S3 by default.

Amazon Redshift logs information in the following log files:

  • Connection log – Provides information to monitor users connecting to the database and related connection information. This information might be their IP address.
  • User log – Logs information about changes to database user definitions.
  • User activity log – It tracks information about the types of queries that both the users and the system perform in the database. It’s useful primarily for troubleshooting purposes.

Benefits of enhanced audit logging

For a better customer experience, the existing architecture of the audit logging solution has been improved to make audit logging more consistent across AWS services. This new enhancement will reduce log export latency from hours to minutes with a fine grain of access control. Enhanced audit logging improves the robustness of the existing delivery mechanism, thus reducing the risk of data loss. Enhanced audit logging will let you export logs either to Amazon S3 or to CloudWatch.

The following section will show you how to configure audit logging using CloudWatch and its benefits.

Setting up CloudWatch as a log destination

Using CloudWatch to view logs is a recommended alternative to storing log files in Amazon S3. It’s simple to configure and it may suit your monitoring requirements, especially if you use it already to monitor other services and application.

To set up a CloudWatch as your log destination, complete the following steps:

  1. On the Amazon Redshift console, choose Clusters in the navigation pane.
    This page lists the clusters in your account in the current Region. A subset of properties of each cluster is also displayed.
  2. Choose cluster where you want to configure CloudWatch logs.

  3. Select properties to edit audit logging.
  4. Choose Turn on configure audit logging, and CloudWatch under log export type.
  5. Select save changes.

Analyzing audit log in near real-time

To run SQL commands, we use redshift-query-editor-v2, a web-based tool that you can use to explore, analyze, share, and collaborate on data stored on Amazon Redshift. However, you can use any client tools of your choice to run SQL queries.

Now we’ll run some simple SQLs and analyze the logs in CloudWatch in near real-time.

  1. Run test SQLs to create and drop user.
  2. On the AWS Console, choose CloudWatch under services, and then select Log groups from the right panel.
  3. Select the userlog – user logs created in near real-time in CloudWatch for the test user that we just created and dropped earlier.

Benefits of using CloudWatch as a log destination

  • It’s easy to configure, as it doesn’t require you to modify bucket policies.
  • It’s easy to view logs and search through logs for specific errors, patterns, fields, etc.
  • You can have a centralized log solution across all AWS services.
  • No need to build a custom solution such as AWS Lambda or Amazon Athena to analyze the logs.
  • Logs will appear in near real-time.
  • It has improved log latency from hours to just minutes.
  • By default, log groups are encrypted in CloudWatch and you also have the option to use your own custom key.
  • Fine-granular configuration of what log types to export based on your specific auditing requirements.
  • It lets you export log groups’ logs to Amazon S3 if needed.

Setting up Amazon S3 as a log destination

Although using CloudWatch as a log destination is the recommended approach, you also have the option to use Amazon S3 as a log destination. When the log destination is set up to an Amzon S3 location, enhanced audit logging logs will be checked every 15 minutes and will be exported to Amazon S3. You can configure audit logging on Amazon S3 as a log destination from the console or through the AWS CLI.

Once you save the changes, the Bucket policy will be set as the following using the Amazon Redshift service principal.

For additional details please refer to Amazon Redshift audit logging.

For enabling logging through AWS CLI – db-auditing-cli-api.

Cost

Exporting logs into Amazon S3 can be more cost-efficient, though considering all of the benefits which CloudWatch provides regarding search, real-time access to data, building dashboards from search results, etc., it can better suit those who perform log analysis.

For further details, refer to the following:

Best practices

Amazon Redshift uses the AWS security frameworks to implement industry-leading security in the areas of authentication, access control, auditing, logging, compliance, data protection, and network security. For more information, refer to Security in Amazon Redshift.

Audit logging to CloudWatch or to Amazon S3 is an optional process, but to have the complete picture of your Amazon Redshift usage, we always recommend enabling audit logging, particularly in cases where there are compliance requirements.

Log data is stored indefinitely in CloudWatch Logs or Amazon S3 by default. This may incur high, unexpected costs. We recommend that you configure how long to store log data in a log group or Amazon S3 to balance costs with compliance retention requirements. Apply the right compression to reduce the log file size.

Conclusion

This post demonstrated how to get near real-time Amazon Redshift logs using CloudWatch as a log destination using enhanced audit logging. This new functionality helps make Amazon Redshift Audit logging easier than ever, without the need to implement a custom solution to analyze logs. We also demonstrated how the new enhanced audit logging reduces log latency significantly on Amazon S3 with fine-grained access control compared to the previous version of audit logging.

Unauthorized access is a serious problem for most systems. As an administrator, you can start exporting logs to prevent any future occurrence of things such as system failures, outages, corruption of information, and other security risks.


About the Authors

Nita Shah is an Analytics Specialist Solutions Architect at AWS based out of New York. She has been building data warehouse solutions for over 20 years and specializes in Amazon Redshift. She is focused on helping customers design and build enterprise-scale well-architected analytics and decision support platforms.

Evgenii Rublev is a Software Development Engineer on the Amazon Redshift team. He has worked on building end-to-end applications for over 10 years. He is passionate about innovations in building high-availability and high-performance applications to drive a better customer experience. Outside of work, Evgenii enjoys spending time with his family, traveling, and reading books.

Yanzhu Ji is a Product manager on the Amazon Redshift team. She worked on Amazon Redshift team as a Software Engineer before becoming a Product Manager, she has rich experience of how the customer facing Amazon Redshift features are built from planning to launching, and always treat customers’ requirements as first priority. In personal life, Yanzhu likes painting, photography and playing tennis.

Ryan Liddle is a Software Development Engineer on the Amazon Redshift team. His current focus is on delivering new features and behind the scenes improvements to best service Amazon Redshift customers. On the weekend he enjoys reading, exploring new running trails and discovering local restaurants.

Monitor your Amazon QuickSight deployments using the new Amazon CloudWatch integration

Post Syndicated from Mayank Agarwal original https://aws.amazon.com/blogs/big-data/monitor-your-amazon-quicksight-deployments-using-the-new-amazon-cloudwatch-integration/

Amazon QuickSight is a fully-managed, cloud-native business intelligence (BI) service that makes it easy to connect to your data, create interactive dashboards, and share these with tens of thousands of users, either within the QuickSight interface or embedded in software as a service (SaaS) applications or web portals. With QuickSight providing insights to power your daily decisions, it becomes more important than even for administrators and developers to ensure their QuickSight dashboards and data refreshes are operating smoothly as expected.

We recently announced the availability of QuickSight metrics within Amazon CloudWatch, which enables developers and administrators to monitor the availability and performance of their QuickSight deployments in real time. With the availability of metrics related to dashboard views, visual load times, and data ingestion details into SPICE (the QuickSight in-memory data store), developers and administrators can ensure that end-users of QuickSight deployments have an uninterrupted experience with relevant data. CloudWatch integration is now available in QuickSight Enterprise Edition in all supported Regions. These metrics can be accessed via CloudWatch, and allow QuickSight deployments to be monitored similarly to other application deployments on AWS, with the ability to generate alarms on failures and to slice and dice historical events to view trends and identify optimization opportunities. Metrics are kept for a period of 15 months, allowing them to be used for historical comparison and trend analysis.

Feature overview

QuickSight emits the following metrics to track the performance and availability of dataset ingestions, dashboards, and visuals. In addition to individual asset metrics, QuickSight also emits aggregated metrics to track performance and availability of all dashboards and SPICE ingestions for an account in a Region.

. Metric Description Unit
1 IngestionErrorCount The number of failed ingestions. Count
2 IngestionInvocationCount The number of ingestions initiated. This includes scheduled and manual ingestions that are triggered through either the QuickSight console or through APIs. Count
3 IngestionLatency The time from ingestion initiation to completion. Second
4 IngestionRowCount The number of successful row ingestions. Count
5 DashboardViewCount The number of times that a dashboard has been loaded or viewed. This includes all access patterns such as web, mobile, and embedded. Count
6 DashboardViewLoadTime The time that it takes a dashboard to load. The time is measured starting from the navigation to the dashboard to when all visuals within the view port are rendered. Millisecond
7 VisualLoadTime The time it takes for a QuickSight visual to load, including the round-trip query time from the client to QuickSight and back to the client. Millisecond
8 VisualLoadErrorCount The number of times a QuickSight visual fails to complete a data load. Count

Access QuickSight metrics in CloudWatch

Use the following procedure to access QuickSight metrics in CloudWatch:

  1. Sign in to the AWS account associated with your QuickSight account.
  2. In the upper-left corner of the AWS Console Home, choose Services, and then choose CloudWatch.
  3. On the CloudWatch console, under Metrics in the navigation pane, choose All metrics, and choose QuickSight.
  4. To access individual metrics, choose Dashboard metrics, Visual metrics, and Ingestion metrics.
  5. To access aggregate metrics, choose Aggregate metrics.

Visualize metrics on the CloudWatch console

You can use the CloudWatch console to visualize metric data generated from your QuickSight deployment. For more information, see Graphing metrics.

Create an alarm using CloudWatch console

You can also create a CloudWatch alarm that monitors CloudWatch metrics for your QuickSight assets. CloudWatch automatically sends you a notification when the metric reaches a threshold you specify. For examples, see Using Amazon CloudWatch alarms.

Use case overview

Let’s consider a fictional company, OkTank, which is an independent software vendor (ISV) in the healthcare space. They have an application that is used by different hospitals across different regions of the country to manage their revenue. OkTank has hundreds of hospitals with thousands of healthcare employees accessing their application and has embedded operations related to their business using multiple QuickSight dashboards in their application. In addition, they allow embedded authoring experience to each hospital’s in-house data analysts to build their own dashboards for their BI needs.

All the dashboards are powered by a database cluster, and they have multiple ingestion schedules. Because their QuickSight usage is growing and hospitals’ in-house data analysts are contributing by bringing in more data and their own dashboards, OkTank wants to monitor and make sure they’re providing their readers with a consistent, performant, and uninterrupted experience on QuickSight.

OkTank has some key monitoring needs that they deem critical:

  • Monitoring console – They want a general monitoring console where they can monitor reader engagement in their account, most popular dashboards, and overall visual load performance. They would like to monitor overall ingestion performance in their account.
  • Dashboard adoption and performance – They want to monitor traffic growth with respect to performance to make sure they’re meeting scaling needs.
  • Visual performance and availability – They have some visuals with complex queries and would like to make sure these queries are running fast enough without failures so that their readers have a performant and uninterrupted experience.
  • Ingestion failures – They want to be alerted if any scheduled ingestion fails, so that they can act right away and make sure their readers don’t experience any interruptions.

In the following sections, we discuss how OkTank meets each monitoring need in more detail.

Monitoring console

OkTank wants to have a general monitoring console to look at key KPIs, monitor reader engagement, and make sure their readers are getting a consistent and uninterrupted experience with QuickSight.

To create a monitoring console and add a KPI metric to it, OkTank takes the following steps:

  1. On the CloudWatch console, under Metrics in the navigation pane, choose Dashboards.
  2. Choose Create dashboard.
  3. Enter the dashboard name and choose Create dashboard.
  4. On the blank dashboard landing page, choose either Add a first widget or the plus sign to add a widget.
  5. In the Add widget section, choose Number.

  6. On the Browse tab, choose QuickSight.
  7. Choose Aggregate metrics.
  8. Select DashboardViewCount.
  9. Choose Create widget.
  10. On the options menu of the newly created widget, choose Edit.
  11. Enter the desired widget name.
  12. For Statistic, choose Sum.
  13. For Period, choose 1 day.
  14. Choose Update widget.

With the widget options, OkTank has added more KPIs on the console, such as average dashboard load time across the region during the day and the 10 most popular dashboards with the highest views, and created their monitoring console.

Dashboard adoption and performance

OkTank has some critical dashboards, and they want to monitor adoption of that dashboard and track its loading performance to make sure they can meet scaling needs.

They take the following steps to create a widget:

  1. On the monitoring console, choose the plus sign.
  2. In the Add widget section, choose Line.
  3. In the Add to this dashboard section, choose Metrics.
  4. On the Browse tab, choose QuickSight.
  5. Choose Dashboard metrics.
  6. Choose the DashboardViewCount and DashbordViewLoadTime metrics of the critical dashboard.
  7. Choose Create widget.

The newly created widget shows critical dashboards views and load times in multiple dimensions.

Visual performance and availability

OkTank has some visuals that require them to run complex queries while loading. They want to provide their readers with consistent and uninterrupted experience. In addition, they would like to be alerted in case a query experiences failures when running or takes longer than the desired runtime.

They take the following steps to monitor and set up an alarm:

  1. On the monitoring console, choose the plus sign.
  2. In the Add widget section, choose Line.
  3. In the Add to this dashboard section, choose Metrics.
  4. On the Browse tab, choose QuickSight.
  5. Choose Visual metrics.
  6. Choose the VisualLoadTime metric of the critical visual and configure the time period on the menu above the chart.
  7. To get alerted in case the critical visual fails to load due to query failure, choose the VisualLoadErrorCount metric.

    The newly created widget shows visuals load performance over the selected time frame.
  8. On the Graphed metrics tab, select the VisualLoadErrorCount metric.
  9. On the Actions menu, choose Create alarm.
  10. For Metric name, enter a name.
  11. Confirm that the value for DashboardId matches the dashboard that has the visual.

    In the Conditions section, OkTank wants to be notified when the error count is greater than or equal to 1.
  12. For Threshold type, select Static.
  13. Select Greater/Equal.
  14. Enter 1.
  15. Choose Next.
  16. In the Notification section, choose Select an existing SNS topic or Create a new topic.
  17. If you’re creating a new topic, provide a name for the topic and email addresses of recipients.
  18. Choose Create topic.
  19. Enter an alarm name and optional description.
  20. Choose Next.
  21. Verify the details and choose Create alarm.

The alarm is now available on the CloudWatch console. If the visual fails to load, the VisualLoadErrorCount value becomes 1 or more (depending on the number of times the dashboard is invoked) and the alarm state is set to In alarm.

Choose the alarm to get more details.

You can scroll down for more information about the alarm.

OkTank also receives an email to the email endpoint defined in the Amazon Simple Notification Service (Amazon SNS) topic.

Ingestion failures

OkTank wants to be alerted if any scheduled SPICE data ingestion fails, so that they can act right away and make sure their readers don’t experience any interruptions. This allows the administrator to find out the root cause of the SPICE ingestion failure (for example, an overloaded database instance) and fix it to ensure the latest data is available in the dependent dashboards.

They take the following steps to monitor and set up an alarm:

  1. On the monitoring console, choose the plus sign.
  2. In the Add widget section, choose Line.
  3. In the Add to this dashboard section, choose Metrics.
  4. On the Browse tab, choose QuickSight.
  5. Choose Ingestion metrics.
  6. Choose the IngestionErrorCount metric of the dataset and configure the time period on the menu above the chart.
  7. Follow the same steps as in the previous section to set up an alarm.

When ingestion fails for the dataset, the alarm changes to an In Alarm state and you receive an email notification.

The following screenshot shows an example of the email.

Conclusion

With QuickSight metrics in CloudWatch, QuickSight developers and administrators can observe and respond to the availability and performance of their QuickSight ecosystem in near-real time. They can monitor dataset ingestions, dashboards, and visuals to provide end-users of QuickSight and applications that embed QuickSight dashboards with a consistent, performant, and uninterrupted experience.

Try out QuickSight metrics in Amazon CloudWatch to monitor your Amazon QuickSight deployments, and share your feedback and questions in the comments.


About the Authors

Mayank Agarwal is a product manager for Amazon QuickSight, AWS’ cloud-native, fully managed BI service. He focuses on account administration, governance and developer experience. He started his career as an embedded software engineer developing handheld devices. Prior to QuickSight he was leading engineering teams at Credence ID, developing custom mobile embedded device and web solutions using AWS services that make biometric enrollment and identification fast, intuitive, and cost-effective for Government sector, healthcare and transaction security applications.

Raj Jayaraman is a Senior Specialist Solutions Architect for Amazon QuickSight. Raj focuses on helping customers develop sample dashboards, embed analytics and adopt BI design patterns and best practices.

Capturing GPU Telemetry on the Amazon EC2 Accelerated Computing Instances

Post Syndicated from Sheila Busser original https://aws.amazon.com/blogs/compute/capturing-gpu-telemetry-on-the-amazon-ec2-accelerated-computing-instances/

This post is written by Amr Ragab, Principal Solutions Architect EC2.

AWS is excited to announce the native integration of monitoring GPU metrics through the CloudWatch Agent. Customers can now easily monitor GPU utilization and its memory to scale their workloads more effectively without custom scripts. In this post, we’ll describe how to allow GPU monitoring and integrate it into your Amazon Machine Images (AMI). Furthermore, we’ll extend this to include the monitoring of GPU hardware events utilizing CloudWatch Log Streams. By combining this telemetry into the Amazon CloudWatch Console, customers can have a complete picture of GPU activity across their fleets.

Capturing GPU metrics

There is an extensive list of NVIDIA accelerator metrics that can be captured. Depending on the workload type, it may be unnecessary to capture all of the metrics at all times. The following table breaks down the suggested metrics to collect by workload type. This considers a balance of cost and impactful metrics at scale.

Compute (Machine Learning (ML), High Performance Computing (HPC)) Graphics/Gaming
utilization_gpu
power_draw
utilization_memory
memory_total
memory_used
memory_free
pcie_link_gen_current
pcie_link_width_current
clocks_current_smclocks_current_memory
utilization_gpu
utilization_memory
memory_total
memory_usedmemory_free
pcie_link_gen_current
pcie_link_width_current
encoder_stats_session_count
encoder_stats_average_fps
encoder_stats_average_latency
clocks_current_graphics
clocks_current_memory
clocks_current_video

Moreover, this is supported through custom AMIs that are deployed with managed service offerings, including Amazon Elastic Kubernetes Service (Amazon EKS), Amazon Elastic Container Services (Amazon ECS), and AWS ParallelCluster w/ SLURM for HPC clusters.

The following is an example screenshot from the CloudWatch Console showcasing the telemetry captured for a P4d instance. You can see that we captured the preceding metrics on a per-GPU index. Each Amazon Elastic Compute Cloud (Amazon EC2) P4d instance has 8x A100 GPUs.

Cloudwatch Console

Capturing GPU Xid events

Xid events are a reporting mechanism from GPU hardware vendors that emit notable events from the device to the OS in this case we are capturing the events through the NVRM kernel module. Current GPU architecture requires that the full GPU with protections are passed into the running instance. Thus, most errors that manifest inside of the customer instance aren’t directly visible to the Amazon EC2 virtualization stack. Although some of these errors are benign, others indicate problems with the customer application, the NVIDIA driver, and under rare circumstances a defect in the GPU hardware.

For NVIDIA-based Amazon EC2 instances, these errors will be logged in the system journal with an “NVRM:” regular expression.

These events can be collected and pushed to Amazon CloudWatch Logs as a stream. When an Xid event occurs on the GPU, it will parse the event and push it the log stream for that instance ID in the Region in which the instance is running. The following steps are required to get started capturing those events.

Deployment

We’ll cover the deployment in two different use-cases: 1. You have an existing instance running and you want to start to capture metrics and XID events. 2. You want to build and an AMI and use it within Amazon EC2 or additional services.

I. On a running Amazon EC2 instance

Step 1. Attach an IAM Role to the EC2 instance that has permission to CloudWatch Metrics/Logs. The following is an IAM policy that you can attach to your IAM Role.

{
    "Version": "2012-10-17",
    "Statement": [
        {
            "Sid": "1",
            "Effect": "Allow",
            "Action": [
                "cloudwatch:PutMetricStream",
                "logs:CreateLogDelivery",
                "logs:CreateLogStream",
                "cloudwatch:PutMetricData",
                "logs:UpdateLogDelivery",
                "logs:CreateLogGroup",
                "logs:PutLogEvents",
                "cloudwatch:ListMetrics"
            ],
            "Resource": "*"
        }
    ]
}

Step 2. Connect to a shell on the EC2 instance (through SSM or SSH). Install the CloudWatch Agent following the instructions here. There is support across architectures and distributions.

Step 3. Next, we can create our CloudWatch Agent JSON configuration file. The following JSON snippet will capture the logs from gpuerrors.log and push to CloudWatch Logs. Save the contents of the following JSON snippet to a file on the instance at /opt/aws/amazon-cloudwatch-agent/etc/amazon-cloudwatch-agent.json.

{
     "agent": {
         "run_as_user": "root"
     },
     "metrics": {
         "append_dimensions": {
             "AutoScalingGroupName": "${aws:AutoScalingGroupName}",
             "ImageId": "${aws:ImageId}",
             "InstanceId": "${aws:InstanceId}",
             "InstanceType": "${aws:InstanceType}"
         },
         "aggregation_dimensions": [["InstanceId"]],
         "metrics_collected": {
            "nvidia_gpu": {
                "measurement": [
                    "utilization_gpu",
                    "utilization_memory",
                    "memory_total",
                    "memory_used",
                    "memory_free",
                    "clocks_current_graphics",
                    "clocks_current_sm",
                    "clocks_current_memory"
                ]
            }
         }
     },
     "logs": {
         "logs_collected": {
             "files": {
                 "collect_list": [
                     {
                         "file_path": "/var/log/gpuevent.log",
                         "log_group_name": "/ec2/accelerated/accel-event-log",
                         "log_stream_name": "{instance_id}"
                     }
                 ]
             }
         }
     }
 }

Step 4. To start capturing the logs, restart the aws cloudwatch systemd service.

sudo systemctl restart amazon-cloudwatch-agent.service

At this point, if you navigate to the CloudWatch Console in the Region that the instance is running, – All metrics – CWAgent, you should see a table of metrics similar to the following screenshot.

Cloudwatch Agent Metrics

Step 5. To capture the XID events it’s possible to use the same CloudWatch Log directive used in the preceding image were set the GPU metrics to capture. The JSON following snippet defines that we will stream the log in /var/log/gpuevent.log to CloudWatch.

"logs": {
         "logs_collected": {
             "files": {
                 "collect_list": [
                     {
                         "file_path": "/var/log/gpuevent.log",
                         "log_group_name": "/ec2/accelerated/accel-event-log",
                         "log_stream_name": "{instance_id}"
                     }
                 ]
             }
         }
     }

The GitHub project is an open source reference design for capturing these errors in the CloudWatch agent.

https://github.com/aws-samples/aws-efa-nccl-baseami-pipeline

Step 6. Save the following file as /opt/aws/aws-hwaccel-event-parser.py|.go with the following contents, which will write the Xid errors parsed to /var/log/gpuevent.log:

The code is available in either Python3 or Go (> 1.16).

Golang code of the hwaccel-event-parser: https://github.com/aws-samples/aws-efa-nccl-baseami-pipeline/blob/master/nvidia-efa-ami_base/cloudwatch/nvidia/aws-hwaccel-event-parser.go

Python3 code: https://github.com/aws-samples/aws-efa-nccl-baseami-pipeline/blob/master/nvidia-efa-ami_base/cloudwatch/nvidia/aws-hwaccel-event-parser.py

As you can see from the code, this is a blocking thread, and it will be running during the lifetime of the instance or container.

Step 7. For ease of deployment, you can also create a systemd service (aws-hw-monitor.service), which will run at startup before the CloudWatch agent.

[Unit]
Description=HW Error Monitor
Before=amazon-cloudwatch-agent.service
After=syslog.target network-online.target

[Service]
Type=simple
ExecStart=/opt/aws/cloudwatch/aws-cloudwatch-wrapper.sh
RemainAfterExit=1
TimeoutStartSec=0

[Install]
WantedBy=multi-user.target

Where /opt/aws/cloudwatch/aws-cloudwatch-wrapper.sh is a script which contains:

#!/bin/bash
python3 /opt/aws/aws-hwaccel-event-parser.py &

Finally, enable and start the hw monitor service

sudo systemctl enable aws-hw-monitor.service –now

II. Building an AMI

For convenience, the following repo has what is needed to build the AMI for Amazon EC2, Amazon EKS, Amazon ECS, Amazon Linux 2, and Ubuntu 18.04/20.04 distributions. You must have Packer installed on your machine, and it must be authenticated to make API calls on your behalf to AWS. Generally you need to modify the variables:{} json and execute the packer build.

"variables": {
    "region": "us-east-1",
    "flag": "<flag>",
    "subnet_id": "<subnetid>",
    "security_groupids": "<security_group_id,security_group_id",
    "build_ami": "<buildami>",
    "efa_pkg": "aws-efa-installer-latest.tar.gz",
    "intel_mkl_version": "intel-mkl-2020.0-088",
    "nvidia_version": "510.47.03",
    "cuda_version": "cuda-toolkit-11-6 nvidia-gds-11-6",
    "cudnn_version": "libcudnn8",
    "nccl_version": "v2.12.7-1"
  },

After filling in the variables, check that the packer script is validated.

packer validate nvidia-efa-ml-al2.yml
packer build nvidia-efa-ml-al2.yml

The log group namespace is /ec2/accelerated/accel-event-log. However, you may change this to the namespace of your preference in the CloudWatch Agent config file created earlier.

Navigate to the CloudWatch Console – Logs – Log groups – /ec2/accelerated/accel-event-log. It’s sorted by instance ID, where the instance ID of the latest stream is on top.

CloudWatch Log-events

We can see in the preceding screenshot that an example workload ran on instance i-03a7b66de3198977e, which was a p4d.24xlarge triggered a Xid 63 event. Capturing these events is the first step. Next, we must interpret what these events mean. With each Xid error, there is a number associated with each event. As previously mentioned, these can be hardware errors, driver, and/or application errors. If you’re running on an Amazon EC2 accelerated instance, and after code execution run into one of these errors, contact AWS Support with the instance ID and Xid error. The following is a list of the more common Xid errors that you may encounter.

Xid Error Name Description Action
48 Double Bit ECC error Hardware memory error Contact AWS Support with Xid error and instance ID
74 GPU NVLink error Further SXid errors should also be populated which will inform on the error seen with the NVLink fabric Get information on which links are causing the issue by running nvidia-smi nvlink -e
63 GPU Row Remapping Event Specific to Ampere architecture –- a row bank is pending a memory remap Stop all CUDA processes, and reset the GPU (nvidia-smi -r), and make sure thatensure the remap is cleared in nvidia-smi -q
13 Graphics Engine Exception User application fault , illegal instruction or register Rerun the application with CUDA_LAUNCH_BLOCKING=1 enabled which should determine if it’s a NVIDIA driver or hardware issue
31 GPU memory page fault Illegal memory address access error Rerun the application with CUDA_LAUNCH_BLOCKING=1 enabled which should determine if it’s a NVIDIA driver or hardware issue

A quick way to check for row remapping failures is to run the below command on the instance.

nvidia-smi --query-remapped-
rows=gpu_name,gpu_bus_id,remapped_rows.failure,remapped_rows.pending,remapped_rows.correctable,remapped_rows.uncorrectable --format=csv
gpu_name, gpu_bus_id, remapped_rows.failure, remapped_rows.pending, remapped_rows.correctable, remapped_rows.uncorrectable
NVIDIA A100-SXM4-40GB, 00000000:10:1C.0, 0, 0, 0, 0
NVIDIA A100-SXM4-40GB, 00000000:10:1D.0, 0, 0, 0, 0
NVIDIA A100-SXM4-40GB, 00000000:20:1C.0, 0, 0, 0, 0
NVIDIA A100-SXM4-40GB, 00000000:20:1D.0, 0, 0, 0, 0
NVIDIA A100-SXM4-40GB, 00000000:90:1C.0, 0, 0, 0, 0
NVIDIA A100-SXM4-40GB, 00000000:90:1D.0, 0, 0, 0, 0
NVIDIA A100-SXM4-40GB, 00000000:A0:1C.0, 0, 0, 0, 0
NVIDIA A100-SXM4-40GB, 00000000:A0:1D.0, 0, 0, 0, 0

This isn’t an exhaustive list of Xid events, but it provides some of the more common ones that you may come across as you develop your accelerated workload. You can find a more complete table of events here. Furthermore, if you have questions, you can reach out to AWS Support with the output of the tar ball created by executing the nvidia-bug-report.sh script included with the NVIDIA driver.

Conclusion

Get started with integrating this monitoring into your AMIs if you use custom AMIs specifically for key services, such as Amazon EKS, Amazon ECS, or Amazon EC2 with AWS ParallelCluster. This will help you discover utilization metrics for your accelerated computing workloads. If you have any questions about this post, then reach out to your account team.

Implementing lightweight on-premises API connectivity using inverting traffic proxy

Post Syndicated from Oleksiy Volkov original https://aws.amazon.com/blogs/architecture/implementing-lightweight-on-premises-api-connectivity-using-inverting-traffic-proxy/

This post will explore the use of lightweight application inversion proxy as a solution for multi-point hybrid or multi-cloud, API-level connectivity for cases where AWS Direct Connect or VPN may not be practical. Then, we will present a sample solution and explain how it addresses typical challenges involved in this space.

Defining the issue

Large ISV providers and integration vendors often need to have API-level integration between a central cloud-based system and a number of on-premises APIs. Use cases can range from refactoring/modernization initiatives to interfacing with legacy on-premises applications, which have no direct migration path to the cloud.

The typical approach is to use VPN or Direct Connect, as they can provide significant benefits in terms of latency and security. However, they are not always practical in situations involving multi-source systems deployed by various groups or organizations that may have significant budget, process, or timeline constraints.

Conceptual solution

An option that addresses the connectivity need is an inverting application proxy, which can be deployed as a lightweight executable on an on-premises backend. The locally deployed agent can communicate with the proxy server on AWS using an inverted communication pattern. This means that the agent will establish outbound connection to the proxy, and it will use the connection to receive inbound requests, too. Figure 1 describes a sample architecture using inverting proxy pattern using Amazon API Gateway façade.

Inverting application proxy

Figure 1. Inverting application proxy

The advantages of this approach include ease-of-deployment (drop-in executable agent) and -configuration. As the proxy inverts the direction of application connectivity to originate from on-premises servers, the local firewall does not need to be reconfigured to open additional ports needed for traditional proxy deployment.

Realizing the solution on AWS

We have built a sample traffic routing solution based on the original open-source Inverting Proxy and Agent by Ian Maddox, Jason Cooke, and Omar Janjur. The solution is written in Go and leverages multiple AWS services to provide additional telemetry, security, and discoverability capabilities that address the common needs of enterprise customers.

The solution is comprised of an inverting proxy and a forwarding agent. The inverting proxy is deployed on AWS as a stand-alone executable running on Amazon Elastic Compute Cloud (EC2) and responsible for forwarding traffic to the agent. The agent can be deployed as a binary or container within the target on-premises system.

Upon starting, the agent will establish an outbound connection with the proxy and local sever application. Once established, the proxy will use it in reverse to forward all incoming client requests through the agent and to the backend application. The connection is secured by Transport Layer Security (TLS) to protect communications between client and proxy and between agent and backend application.

This solution uses a unique backend ID and IAM user/role tags to identify different backend servers and control access to proxies. The backend ID is passed as a command-line parameter to the agent. The agent checks the IAM account or IAM role Amazon EC2 is running under for tag “AllowedBackends”. The tag contains coma-separated list of backend IDs that the agent is allowed to access. The connectivity is established only if the provided backend ID matches one of the values in the coma-separated list.

The solution supports native integration with AWS Cloud Map to enable automatic discoverability of remote API endpoints. Upon start and once the IAM access control checks are successfully validated, the agent can register the backend endpoints within AWS Cloud Map using a provided service name and service namespace ID.

Inverting proxy agent can collect telemetry and automatically publish it to Amazon CloudWatch using a custom namespace. This includes HTTP response codes and counts from server application aggregated by the backend ID.

For full list of options, features, and supported configurations, use --help command-line parameter with both agent and proxy executables.

Enabling highly resilient proxy deployment

For production scenarios that require high availability, deploy a pair of inverting proxies connecting to a pair of agents deployed on separate EC2 instances. The entire configuration is then placed behind Application Load Balancer to provide a single point of ingress, load-balancing, and health-checking functionality. Figure 2 demonstrates a highly resilient setup for critical workloads.

Highly resilient deployment diagram for inverting proxy

Figure 2. Highly resilient deployment diagram for inverting proxy

Additionally, for real-life production workloads dealing with sensitive data, we recommend following security and resilience best practices for Amazon EC2.

Deploying and running the solution

The solution includes a simple demo Node.js server application to simulate connectivity with an inverting proxy. A restrictive security group will be used to simulate on-premises data center.

Steps to deployment:

1. Create a “backend” Amazon EC2 server using Linux 2, free-tier AMI. Ensure that Port 443 (inbound port for sample server application) is blocked from external access via appropriate security group.

2. Connect by using SSH into target server run updates.
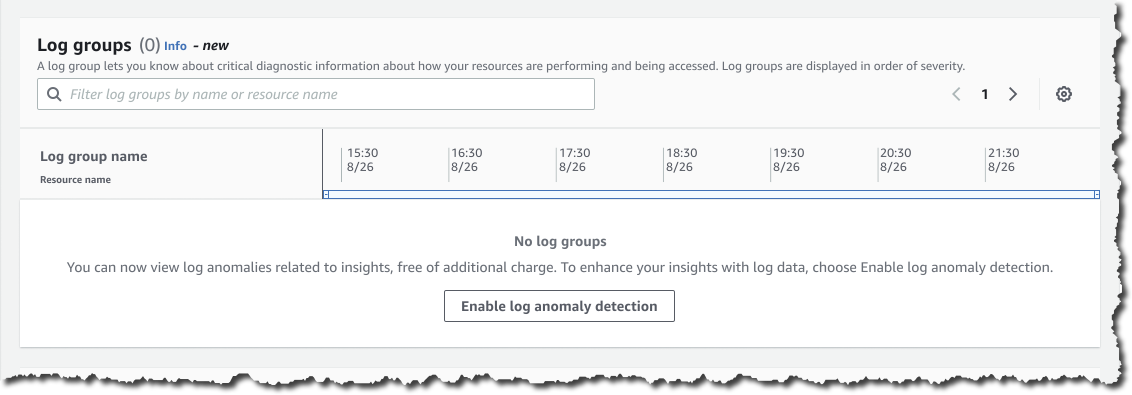
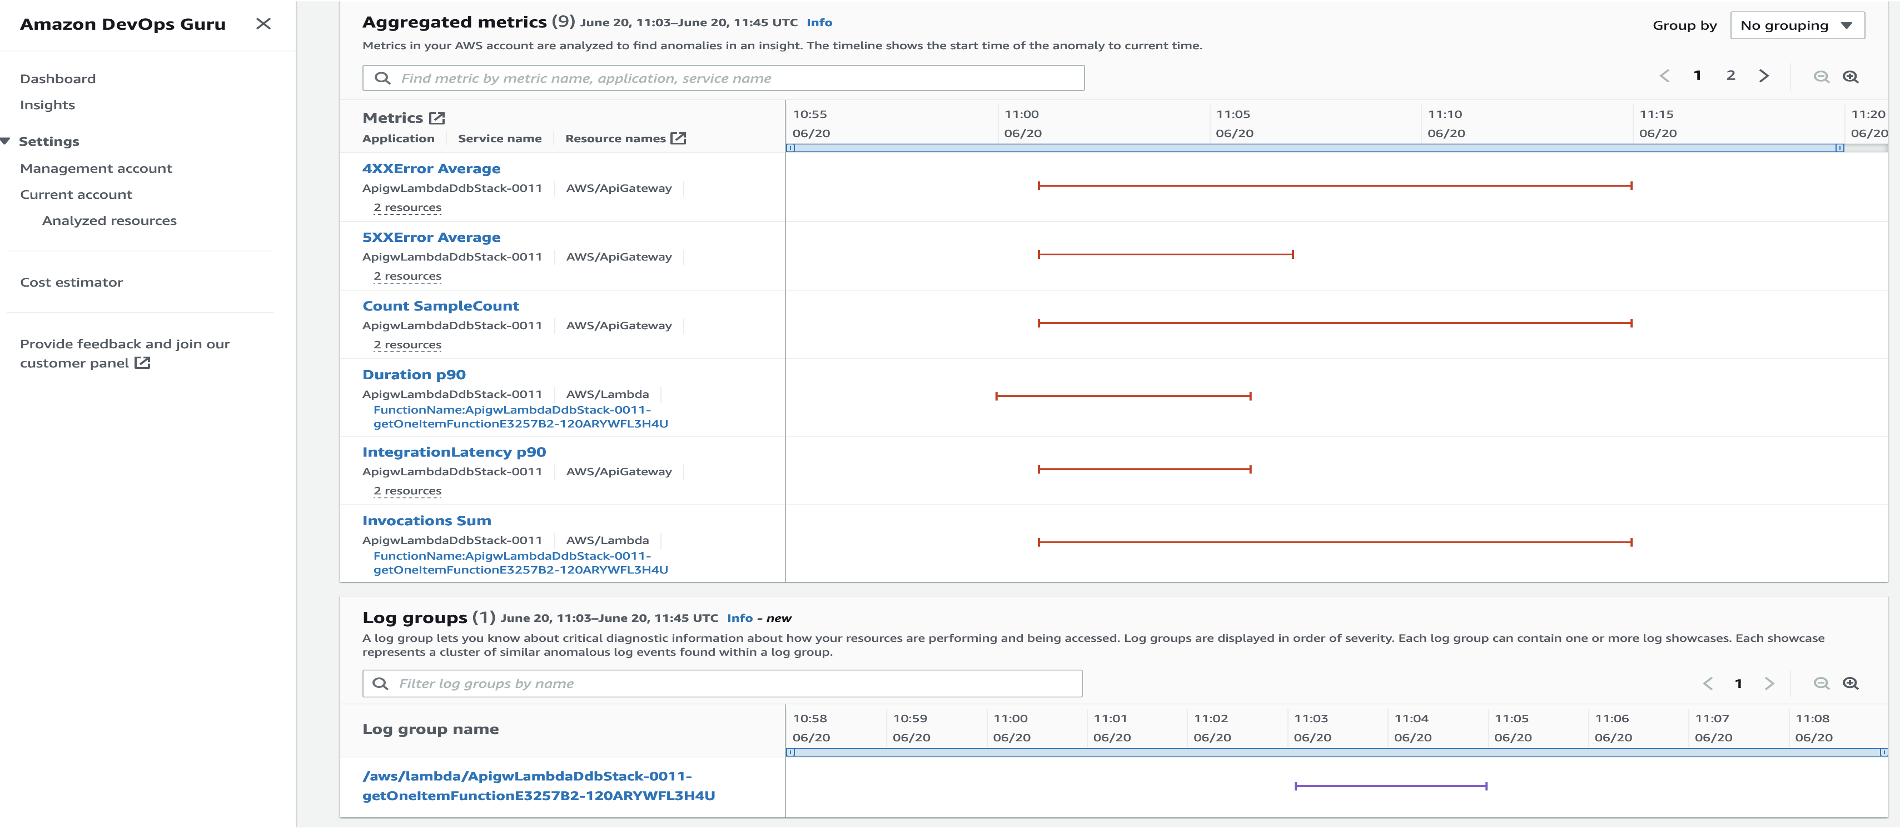
sudo yum update -y

3. Install development tools and dependencies:

sudo yum groupinstall "Development Tools" -y

4. Install Golang:

sudo yum install golang -y

5. Install node.js.

curl -o- https://raw.githubusercontent.com/nvm-sh/nvm/v0.34.0/install.sh | bash

. ~/.nvm/nvm.sh

nvm install 16

6. Clone the inverting proxy GitHub repository to the “backend” EC2 instance.

7. From inverting-proxy folder, build the application by running:

mkdir /home/ec2-user/inverting-proxy/bin

export GOPATH=/home/ec2-user/inverting-proxy/bin

make

8. From /simple-server folder, run the sample appTLS application in the background (see instructions below). Note: to enable SSL you will need to generate encryption key and certificate files (server.crt and server.key) and place them in simple-server folder.

npm install

node appTLS &

Example app listening at https://localhost:443

Confirm that the application is running by using ps -ef | grep node:

ec2-user  1700 30669  0 19:45 pts/0    00:00:00 node appTLS

ec2-user  1708 30669  0 19:45 pts/0    00:00:00 grep --color=auto node

9. For backend Amazon EC2 server, navigate to Amazon EC2 security settings and create an IAM role for the instance. Keep default permissions and add “AllowedBackends” tag with the backend ID as a tag value (the backend ID can be any string that matches the backend ID parameter in Step 13).

10. Create a proxy Amazon EC2 server using Linux AMI in a public subnet and connect by using SSH in an Amazon EC2 once online. Copy the contents of the bin folder from the agent EC2 or clone the repository and follow build instructions above (Steps 2-7).

Note: the agent will be establishing outbound connectivity to the proxy; open the appropriate port (443) in the proxy Amazon EC2 security group. The proxy server needs to be accessible by the backend Amazon EC2 and your client workstation, as you will use your local browser to test the application.

11. To enable TLS encryption on incoming connections to proxy, you will need to generate and upload the certificate and private key (server.crt and server.key) to the bin folder of the proxy deployment.

12. Navigate to /bin folder of the inverting proxy and start the proxy by running:
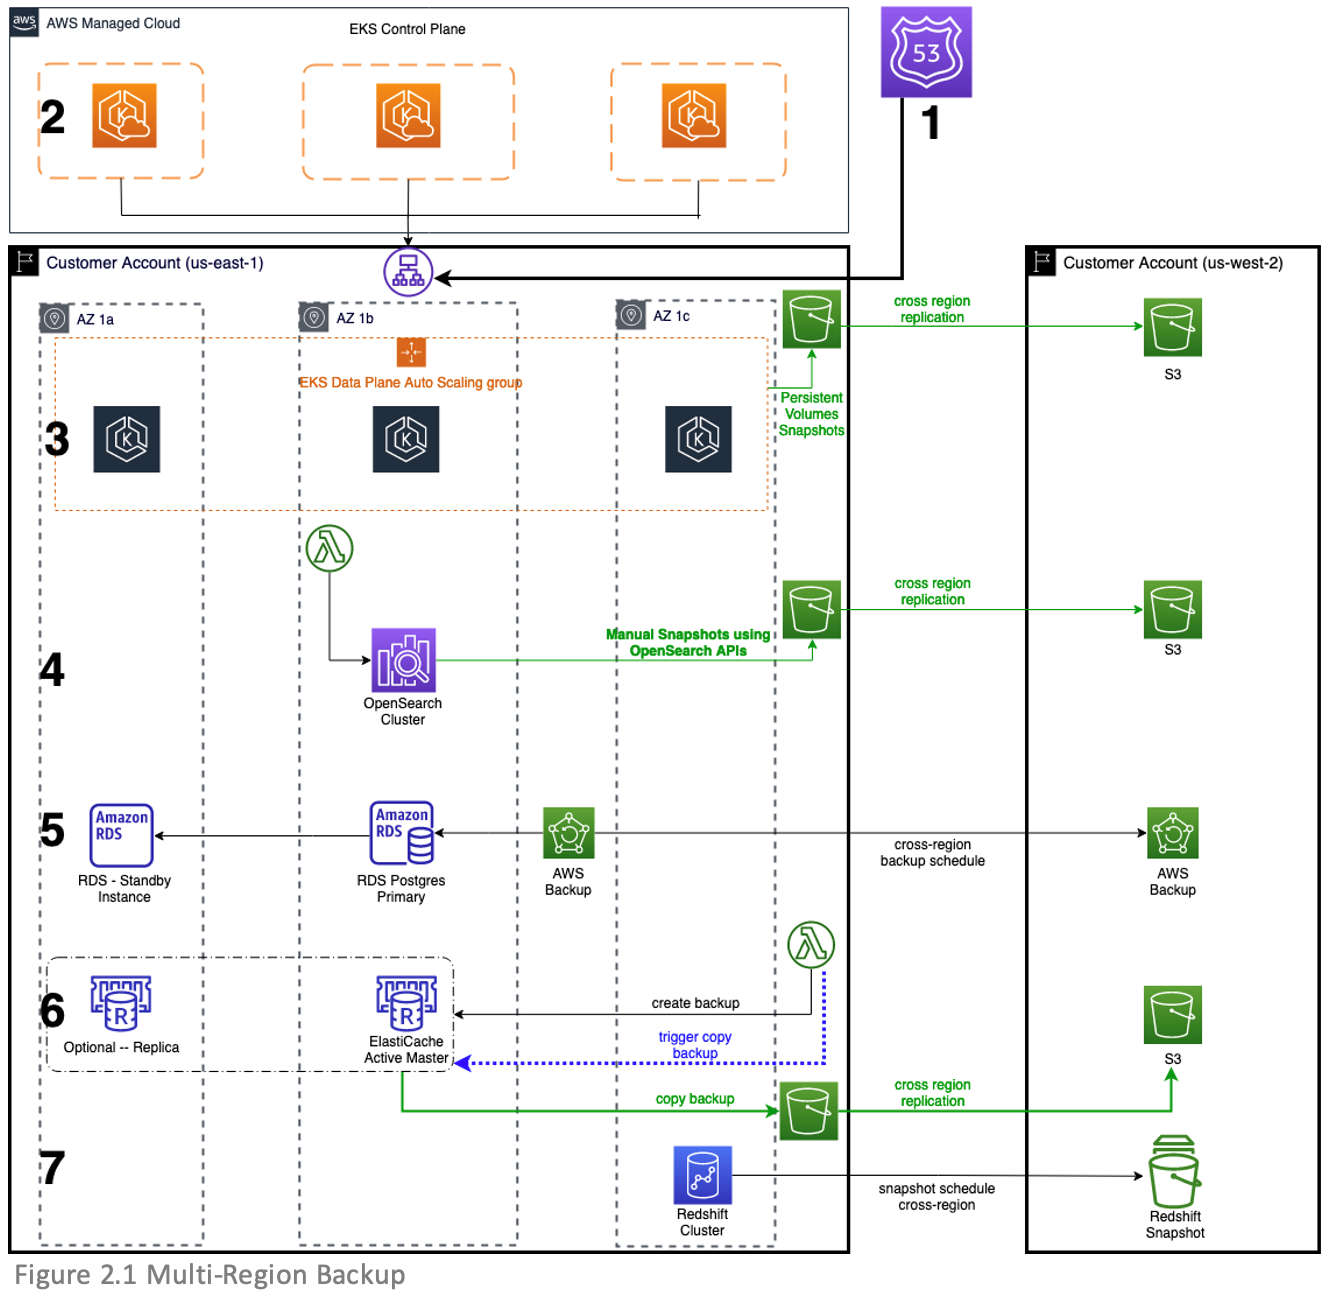
sudo ./proxy –port 443 -tls

2021/12/19 19:56:46 Listening on [::]:443

13. Use the SSH to connect into the backend Amazon EC2 server and configure the inverting proxy agent. Navigate to /bin folder in the cloned repository and run the command below, replacing uppercase strings with the appropriate values. Note: the required trailing slash after the proxy DNS URL.

./proxy-forwarding-agent -proxy https://YOUR_PROXYSERVER_PUBLIC_DNS/ -backend SampleBackend-host localhost:443 -scheme https

14. Use your local browser to navigate to proxy server public DNS name (https://YOUR_PROXYSERVER_PUBLIC_DNS). You should see the following response from your sample backend application:

Hello World!

Conclusion

Inverting proxy is a flexible, lightweight pattern that can be used for routing API traffic in non-trivial hybrid and multi-cloud scenarios that do not require low-latency connectivity. It can also be used for securing existing endpoints, refactoring legacy applications, and enabling visibility into legacy backends. The sample solution we have detailed can be customized to create unique implementations and provides out-of-the-box baseline integration with multiple AWS services.

Disaster recovery with AWS managed services, Part 2: Multi-Region/backup and restore

Post Syndicated from Dhruv Bakshi original https://aws.amazon.com/blogs/architecture/disaster-recovery-with-aws-managed-services-part-ii-multi-region-backup-and-restore/

In part I of this series, we introduced a disaster recovery (DR) concept that uses managed services through a single AWS Region strategy. In part two, we introduce a multi-Region backup and restore approach. With this approach, you can deploy a DR solution in multiple Regions, but it will be associated with longer RPO/RTO. Using a backup and restore strategy will safeguard applications and data against large-scale events as a cost-effective solution, but will result in longer downtimes and greater loss of data in the event of a disaster as compared to other strategies as shown in Figure 1.

DR Strategies

Figure 1. DR Strategies

Implementing the multi-Region/backup and restore strategy

Using multiple Regions ensures resiliency in the most serious, widespread outages. A secondary Region protects workloads against being unable to run within a given Region, because they are wide and geographically dispersed.

Architecture overview

The application diagram presented in Figures 2.1 and 2.2 refers to an application that processes payment transactions, which was modernized to utilize managed services in the AWS Cloud. In this post, we’ll show you which AWS services it uses and how they work to maintain multi-Region/backup and restore strategy.

These figures show how to successfully implement the backup and restore strategy and successfully fail over your workload. The following sections list the components of the example application presented in the figures, which works as follows:

Multi-Region backup

Figure 2.1. Multi-Region backup

Multi-Region restore

Figure 2.2. Multi-Region restore

Route 53

Route 53 health checks monitor the health and performance of your web applications, web servers, and other resources. Health checks are necessary for configuring DNS failover within Route 53. Once an application or resource becomes unhealthy, you’ll need to initiate a manual failover process to create resources in the secondary Region. In our architecture, we use CloudWatch alarms to automate notifications of changes in health status.

Please check out the Creating Disaster Recovery Mechanisms Using Amazon Route 53 blog post for additional DR mechanisms using Amazon Route 53.

Amazon EKS control plane

Amazon Elastic Kubernetes Service (Amazon EKS) automatically scales control plane instances based on load, automatically detects and replaces unhealthy control plane instances, and restarts them across the Availability Zones within the Region as needed. Because on-demand clusters are provisioned in the secondary Region, AWS also manages the control plane the same way.

Amazon EKS data plane

It is a best practice to create worker nodes using Amazon Elastic Compute Cloud (Amazon EC2) Auto Scaling groups instead of creating individual EC2 instances and joining them to the cluster. This is because Amazon EC2 Auto Scaling groups automatically replace any terminated or failed nodes, which ensures that the cluster always has the capacity to run your workload.

The Amazon EKS control plane and data plane will be created on demand in the secondary Region during an outage via Infrastructure-as-a-Code (IaaC) such as AWS CloudFormation, Terraform, etc. You should pre-stage all networking requirements like virtual private cloud (VPC), subnets, route tables, gateways and deploy the Amazon EKS cluster during an outage in the primary Region.

As shown in the Backup and restore your Amazon EKS cluster resources using Velero blog post, you may use a third-party tool like Velero for managing snapshots of persistent volumes. These snapshots can be stored in an Amazon Simple Storage Service (Amazon S3) bucket in the primary Region, which will be replicated to an S3 bucket in another Region via cross-Region replication.

During an outage in the primary Region, you can use the tool in the secondary Region to restore volumes from snapshots in the standby cluster.

OpenSearch Service

For domains running Amazon OpenSearch Service, OpenSearch Service takes hourly automated snapshots and retains up to 336 for 14 days. These snapshots can only be used for cluster recovery within the same Region as the primary OpenSearch cluster.

You can use OpenSearch APIs to create a manual snapshot of an OpenSearch cluster, which can be stored in a registered repository like Amazon S3. You can do this manually or create a scheduled Lambda function based on their RPO, which prompts creation of a manual snapshot that will be stored in an S3 bucket. Amazon S3 cross-Region replication will then automatically and asynchronously copy objects across S3 buckets.

You can restore OpenSearch Service clusters by creating the cluster on demand via CloudFormation and using OpenSearch APIs to restore the snapshot from an S3 bucket.

Amazon RDS Postgres

Amazon Relational Database Service (Amazon RDS) can copy continuous backups cross-Region. You can configure your Amazon RDS database instance to replicate snapshots and transaction logs to a destination Region of your choice.

If a continuous backup rule also specifies a cross-account or cross-Region copy, AWS Backup takes a snapshot of the continuous backup, copies that snapshot to the destination vault, and then deletes the source snapshot. For continuous backup of Amazon RDS, AWS Backup creates a snapshot every 24 hours and stores transaction logs every 5 minutes in-Region. The Backup Frequency setting only applies to cross-Region backups of these continuous backups. Backup Frequency determines how often AWS Backup:

  • Creates a snapshot at that point in time from the existing snapshot plus all transaction logs up to that point
  • Copies snapshots to the other Region(s)
  • Deletes snapshots (because it only was created to be copied)

For more information, refer to the Point-in-time recovery and continuous backup for Amazon RDS with AWS Backup blog post.

ElastiCache

You can export and import backup and copy API calls for Amazon ElastiCache to develop a snapshot and restore strategy in a secondary Region. You can either prompt a manual backup and copy of that backup to S3 bucket or create a pair of Lambda functions to run at a schedule to meet the RPO requirements. The Lambda functions will prompt a manual backup, which creates a .rdb to an S3 bucket. Amazon S3 cross-Region replication will then handle asynchronous copy of the backup to an S3 bucket in a secondary Region.

You can use CloudFormation to create an ElastiCache cluster on demand and use CloudFormation properties such as SnapshotArns and SnapshotName to point to the desired ElastiCache backup stored in Amazon S3 to seed the cluster in the secondary Region.

Amazon Redshift

Amazon Redshift takes automatic, incremental snapshots of your data periodically and saves them to Amazon S3. Additionally, you can take manual snapshots of your data whenever you want.

To precisely control when snapshots are taken, you can create a snapshot schedule and attach it to one or more clusters. You can also configure cross-Region snapshot copy, which will automatically copy all your automated and manual snapshots to another Region.

During an outage, you can create the Amazon Redshift cluster on demand via CloudFormation and use CloudFormation properties such as SnapshotIdentifier to restore the new cluster from that snapshot.

Note: You can add an additional layer of protection to your backups through AWS Backup Vault Lock, S3 Object Lock, and Encrypted Backups.

Conclusion

With greater adoption of managed services within the cloud, there is a need to think of creative ways to implement a cost-effective DR solution. This backup and restore approach offered in this post will lower costs through more lenient RPO/RTO requirements, while providing a solution to utilize AWS managed services.

In the next post, we will discuss a multi-Region active/active strategy for the same application stack illustrated in this post.

Other posts in this series

Related information

Looking for more architecture content? AWS Architecture Center provides reference architecture diagrams, vetted architecture solutions, Well-Architected best practices, patterns, icons, and more!

AWS Week in Review – May 9, 2022

Post Syndicated from Danilo Poccia original https://aws.amazon.com/blogs/aws/aws-week-in-review-may-9-2022/

This post is part of our Week in Review series. Check back each week for a quick roundup of interesting news and announcements from AWS!

Another week starts, and here’s a collection of the most significant AWS news from the previous seven days. This week is also the one-year anniversary of CloudFront Functions. It’s exciting to see what customers have built during this first year.

Last Week’s Launches
Here are some launches that caught my attention last week:

Amazon RDS supports PostgreSQL 14 with three levels of cascaded read replicas – That’s 5 replicas per instance, supporting a maximum of 155 read replicas per source instance with up to 30X more read capacity. You can now build a more robust disaster recovery architecture with the capability to create Single-AZ or Multi-AZ cascaded read replica DB instances in same or cross Region.

Amazon RDS on AWS Outposts storage auto scalingAWS Outposts extends AWS infrastructure, services, APIs, and tools to virtually any datacenter. With Amazon RDS on AWS Outposts, you can deploy managed DB instances in your on-premises environments. Now, you can turn on storage auto scaling when you create or modify DB instances by selecting a checkbox and specifying the maximum database storage size.

Amazon CodeGuru Reviewer suppression of files and folders in code reviews – With CodeGuru Reviewer, you can use automated reasoning and machine learning to detect potential code defects that are difficult to find and get suggestions for improvements. Now, you can prevent CodeGuru Reviewer from generating unwanted findings on certain files like test files, autogenerated files, or files that have not been recently updated.

Amazon EKS console now supports all standard Kubernetes resources to simplify cluster management – To make it easy to visualize and troubleshoot your applications, you can now use the console to see all standard Kubernetes API resource types (such as service resources, configuration and storage resources, authorization resources, policy resources, and more) running on your Amazon EKS cluster. More info in the blog post Introducing Kubernetes Resource View in Amazon EKS console.

AWS AppConfig feature flag Lambda Extension support for Arm/Graviton2 processors – Using AWS AppConfig, you can create feature flags or other dynamic configuration and safely deploy updates. The AWS AppConfig Lambda Extension allows you to access this feature flag and dynamic configuration data in your Lambda functions. You can now use the AWS AppConfig Lambda Extension from Lambda functions using the Arm/Graviton2 architecture.

AWS Serverless Application Model (SAM) CLI now supports enabling AWS X-Ray tracing – With the AWS SAM CLI you can initialize, build, package, test on local and cloud, and deploy serverless applications. With AWS X-Ray, you have an end-to-end view of requests as they travel through your application, making them easier to monitor and troubleshoot. Now, you can enable tracing by simply adding a flag to the sam init command.

Amazon Kinesis Video Streams image extraction – With Amazon Kinesis Video Streams you can capture, process, and store media streams. Now, you can also request images via API calls or configure automatic image generation based on metadata tags in ingested video. For example, you can use this to generate thumbnails for playback applications or to have more data for your machine learning pipelines.

AWS GameKit supports Android, iOS, and MacOS games developed with Unreal Engine – With AWS GameKit, you can build AWS-powered game features directly from the Unreal Editor with just a few clicks. Now, the AWS GameKit plugin for Unreal Engine supports building games for the Win64, MacOS, Android, and iOS platforms.

For a full list of AWS announcements, be sure to keep an eye on the What’s New at AWS page.

Other AWS News
Some other updates you might have missed:

🎂 One-year anniversary of CloudFront Functions – I can’t believe it’s been one year since we launched CloudFront Functions. Now, we have tens of thousands of developers actively using CloudFront Functions, with trillions of invocations per month. You can use CloudFront Functions for HTTP header manipulation, URL rewrites and redirects, cache key manipulations/normalization, access authorization, and more. See some examples in this repo. Let’s see what customers built with CloudFront Functions:

  • CloudFront Functions enables Formula 1 to authenticate users with more than 500K requests per second. The solution is using CloudFront Functions to evaluate if users have access to view the race livestream by validating a token in the request.
  • Cloudinary is a media management company that helps its customers deliver content such as videos and images to users worldwide. For them, Lambda@Edge remains an excellent solution for applications that require heavy compute operations, but lightweight operations that require high scalability can now be run using CloudFront Functions. With CloudFront Functions, Cloudinary and its customers are seeing significantly increased performance. For example, one of Cloudinary’s customers began using CloudFront Functions, and in about two weeks it was seeing 20–30 percent better response times. The customer also estimates that they will see 75 percent cost savings.
  • Based in Japan, DigitalCube is a web hosting provider for WordPress websites. Previously, DigitalCube spent several hours completing each of its update deployments. Now, they can deploy updates across thousands of distributions quickly. Using CloudFront Functions, they’ve reduced update deployment times from 4 hours to 2 minutes. In addition, faster updates and less maintenance work result in better quality throughout DigitalCube’s offerings. It’s now easier for them to test on AWS because they can run tests that affect thousands of distributions without having to scale internally or introduce downtime.
  • Amazon.com is using CloudFront Functions to change the way it delivers static assets to customers globally. CloudFront Functions allows them to experiment with hyper-personalization at scale and optimal latency performance. They have been working closely with the CloudFront team during product development, and they like how it is easy to create, test, and deploy custom code and implement business logic at the edge.

AWS open-source news and updates – A newsletter curated by my colleague Ricardo to bring you the latest open-source projects, posts, events, and more. Read the latest edition here.

Reduce log-storage costs by automating retention settings in Amazon CloudWatch – By default, CloudWatch Logs stores your log data indefinitely. This blog post shows how you can reduce log-storage costs by establishing a log-retention policy and applying it across all of your log groups.

Observability for AWS App Runner VPC networking – With X-Ray support in App runner, you can quickly deploy web applications and APIs at any scale and take advantage of adding tracing without having to manage sidecars or agents. Here’s an example of how you can instrument your applications with the AWS Distro for OpenTelemetry (ADOT).

Upcoming AWS Events
It’s AWS Summits season and here are some virtual and in-person events that might be close to you:

You can now register for re:MARS to get fresh ideas on topics such as machine learning, automation, robotics, and space. The conference will be in person in Las Vegas, June 21–24.

That’s all from me for this week. Come back next Monday for another Week in Review!

Danilo

Detecting data drift using Amazon SageMaker

Post Syndicated from Shibu Nair original https://aws.amazon.com/blogs/architecture/detecting-data-drift-using-amazon-sagemaker/

As companies continue to embrace the cloud and digital transformation, they use historical data in order to identify trends and insights. This data is foundational to power tools, such as data analytics and machine learning (ML), in order to achieve high quality results.

This is a time where major disruptions are not only lasting longer, but also happening more frequently, as discussed in a McKinsey article on risk and resilience. Any disruption—a pandemic, hurricane, or even blocked sailing routes—has a major impact on the patterns of data and can create anomalous behavior.

ML models are dependent on data insights to help plan and support production-ready applications. With any disruptions, data drift can occur. Data drift is unexpected and undocumented changes to data structure, semantics, and/or infrastructure. If there is data drift, the model performance will degrade and no longer provide an accurate guidance. To mitigate the effects of the disruption, data drift needs to be detected and the ML models quickly trained and adjusted accordingly.

This blog post explains how to approach changing data patterns in the age of disruption and how to mitigate its effects on ML models. We also discuss the steps of building a feedback loop to capture the request data in the production environment and create a data pipeline to store the data for profiling and baselining. Then, we explain how Amazon SageMaker Clarify can help detect data drift.

How to detect data drift

There are three stages to detecting data drift: data quality monitoring, model quality monitoring, and drift evaluation (see Figure 1).

Stages in detecting data drift

Figure 1. Stages in detecting data drift

Data quality monitoring establishes a profile of the input data during model training, and then continuously compares incoming data with the profile. Deviations in the data profile signal a drift in the input data.

You can also detect drift through model quality monitoring, which requires capturing actual values that can be compared with the predictions. For example, using weekly demand forecasting, you can compare the forecast quantities one week later with the actual demand. Some use cases can require extra steps to collect actual values. For example, product recommendations may require you to ask a selected group of consumers for their feedback to the recommendation.

SageMaker Clarify provides insights into your trained models, including importance of model features and any biases towards certain segments of the input data. Changes of these attributes between re-trained models also signal drift. Drift evaluation constitutes the monitoring data and mechanisms to detect changes and triggering consequent actions. With Amazon CloudWatch, you can define rules and thresholds that prompt drift notifications.

Figure 2 illustrates a basic architecture with the data sources for training and production (on the left) and the observed data concerning drift (on the right). You can use Amazon SageMaker Data Wrangler, a visual data preparation tool, to clean and normalize your input data for your ML task. You can store the features that you defined for your models in the Amazon SageMaker Feature Store, a fully managed, purpose-built repository to store, update, retrieve, and share ML features.

The white, rectangular boxes in the architecture diagram represent the tasks for detecting data and model drift. You can integrate those tasks into your ML workflow with Amazon SageMaker Pipelines.

Basic architecture on how data drift is detected using Amazon SageMaker

Figure 2. Basic architecture on how data drift is detected using Amazon SageMaker

The drift observation data can be captured in tabular format, such as comma-separated values or Parquet, on Amazon Simple Storage Service (S3) and analyzed with Amazon Athena and Amazon QuickSight.

How to build a feedback loop

The baselining task establishes a data profile from training data. It uses Amazon SageMaker Model Monitor and runs before training or re-training the model. The baseline profile is stored on Amazon S3 to be referenced by the data drift monitoring job.

The data drift monitoring task continuously profiles the input data, compares it with baseline, and the results are captured in CloudWatch. This tasks runs on its own computation resources using Deequ, which checks that the monitoring job does not slow down your ML inference flow and scales with the data. The frequency of running this task can be adjusted to control cost, which can depend on how rapidly you anticipate that the data may change.

The model quality monitoring task computes model performance metrics from actuals and predicted values. The origin of these data points depends on the use case. Demand forecasting use cases naturally capture actuals that can be used to validate past predictions. Other use cases can require extra steps to acquire ground-truth data.

CloudWatch is a monitoring and observability service with which you can define rules to act on deviation in model performance or data drift. With CloudWatch, you can setup alerts to users via e-mail or SMS, and it can automatically start the ML model re-training process.

Run the baseline task on your updated data set before re-training your model. Use the SageMaker model registry to catalog your ML models for production, manage model versions, and control the associate training metrics.

Gaining insight into data and models

SageMaker Clarify provides greater visibility into your training data and models, helping identify and limit bias and explain predictions. For example, the trained models may consider some features more strongly than others when generating predictions. Compare the feature importance and bias between model-provided versions for a better understanding of the changes.

Conclusion

As companies continue to use data analytics and ML to inform daily activity, data drift may become a more common occurrence. Recognizing that drift can have a direct impact on models and production-ready applications, it is important to architect to identify potential data drift and avoid downgrading the models and negatively impacting results. Failure to capture changes in data can result in loss of process confidence, downgraded model accuracy, or a bottom-line impact to the business.

Building a serverless cloud-native EDI solution with AWS

Post Syndicated from Ripunjaya Pattnaik original https://aws.amazon.com/blogs/architecture/building-a-serverless-cloud-native-edi-solution-with-aws/

Electronic data interchange (EDI) is a technology that exchanges information between organizations in a structured digital form based on regulated message formats and standards. EDI has been used in healthcare for decades on the payer side for determination of coverage and benefits verification. There are different standards for exchanging electronic business documents, like American National Standards Institute X12 (ANSI), Electronic Data Interchange for Administration, Commerce and Transport (EDIFACT), and Health Level 7 (HL7).
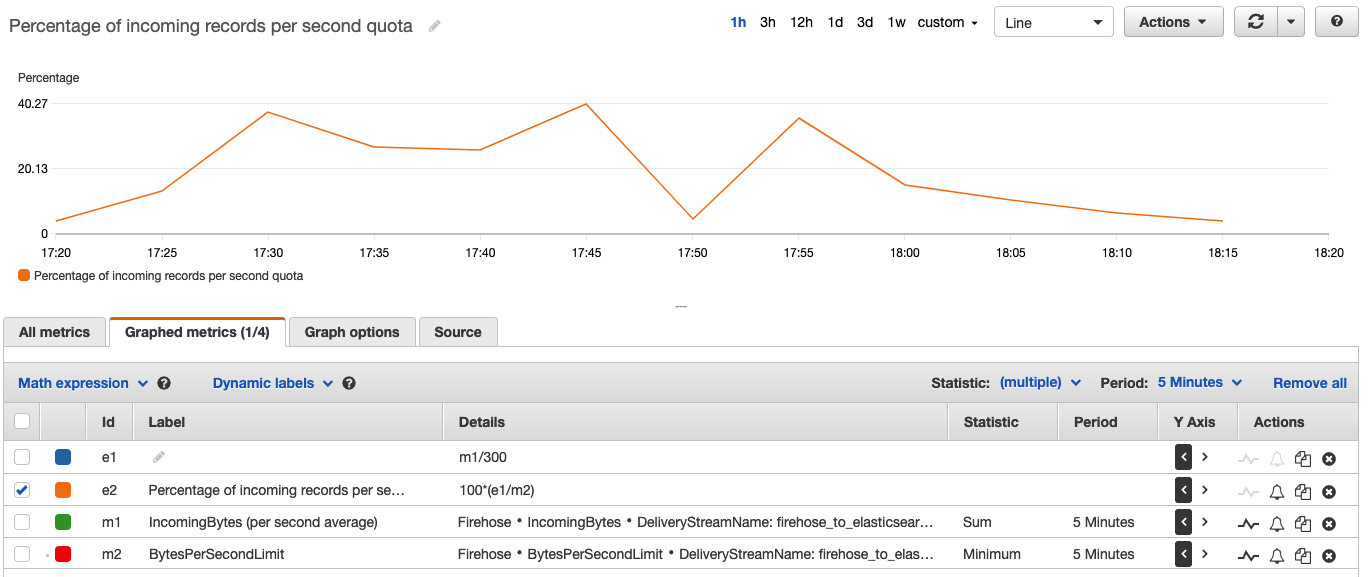
HL7 is the standard to exchange messages between enterprise applications, like a Patient Administration System and a Pathology Laboratory Information. However, HL7 messages are embedded in Health Insurance Portability and Accountability Act (HIPAA) X12 for transactions between enterprises, like hospital and insurance companies.

HIPAA is a federal law that required the creation of national standards to protect sensitive patient health information from being disclosed without the patient’s consent or knowledge. It also mandates healthcare organizations to follow a standardized mechanism of EDI to submit and process insurance claims.

In this blog post, we will discuss how you can build a serverless cloud-native EDI implementation on AWS using the Edifecs XEngine Server.

EDI implementation challenges

Due to its structured format, EDI facilitates the consistency of business information for all participants in the exchange process. The primary EDI software that is used processes the information and then translates it into a more readable format. This can be imported directly and automatically into your integration systems. Figure 1 shows a high-level transaction for a healthcare EDI process.

EDI Transaction Sets exchanges between healthcare provider and payer

Figure 1. EDI Transaction Sets exchanges between healthcare provider and payer

Along with the implementation itself, the following are some of the common challenges encountered in EDI system development:

  1. Scaling. Despite the standard protocols of EDI, the document types and business rules differ across healthcare providers. You must scale the scope of your EDI judiciously to handle a diverse set of data rules with multiple EDI protocols.
  2. Flexibility in EDI integration. As standards evolve, your EDI system development must reflect those changes.
  3. Data volumes and handling bad data. As the volume of data increases, so does the chance for errors. Your storage plans must adjust as well.
  4. Agility. In healthcare, EDI handles business documents promptly, as real-time document delivery is critical.
  5. Compliance. State Medicaid and Medicare rules and compliance can be difficult to manage. HIPAA compliance and CAQH CORE certifications can be difficult to acquire.

Solution overview and architecture data flow

Providers and Payers can send requests as enrollment inquiry, certification request, or claim encounter to one another. This architecture uses these as source data requests coming from the Providers and Payers as flat files (.txt and .csv), Active Message Queues, and API calls (submitters).

The steps for the solution shown in Figure 2 are as follows:

1. Flat, on-premises files are transferred to Amazon Simple Storage Service (S3) buckets using AWS Transfer Family (2).
3. AWS Fargate on Amazon Elastics Container Service (Amazon ECS) runs Python packages to convert the transactions into JSON messages, then queues it on Amazon MQ (4).
5. Java Message Service (JMS) Bridge, which runs Apache Camel on Fargate, pulls the messages from the on-premises messaging systems and queues them on Amazon MQ (6).
7. Fargate also runs programs to call the on-premises API or web services to get the transactions and queues it on Amazon MQ (8).
9. Amazon CloudWatch monitors the queue depth. If queue depth goes beyond a set threshold, CloudWatch sends notifications to the containers through Amazon Simple Notification Service (SNS) (10).
11. Amazon SNS triggers AWS Lambda, which adds tasks to Fargate (12), horizontally scaling it to handle the spike.
13. Fargate runs Python programs to read the messages on Amazon MQ and uses PYX12 packages to convert the JSON messages to EDI file formats, depending on the type of transactions.
14. The container also may queue the EDI requests on different queues, as the solution uses multiple trading partners for these requests.
15. The solution runs Edifecs XEngine Server on Fargate with Docker image. This polls the messages from the queues previously mentioned and converts them to EDI specification by the trading partners that are registered with Edifecs.
16. Python module running on Fargate converts the response from the trading partners to JSON.
17. Fargate sends JSON payload as a POST request using Amazon API Gateway, which updates requestors’ backend systems/databases (12) that are running microservices on Amazon ECS (11).
18. The solution also runs Elastic Load Balancing to balance the load across the Amazon ECS cluster to take care of any spikes.
19. Amazon ECS runs microservices that uses Amazon RDS (20) for domain specific data.

EDI transaction-processing system architecture on AWS

Figure 2. EDI transaction-processing system architecture on AWS

Handling PII/PHI data

The EDI request and response file includes protected health information (PHI)/personal identifiable information (PII) data related to members, claims, and financial transactions. The solution leverages all AWS services that are HIPAA eligible and encrypts data at rest and in-transit. The file transfers are through FTP, and the on-premises request/response files are Pretty Good Privacy (PGP) encrypted. The Amazon S3 buckets are secured through bucket access policies and are AES-256 encrypted.

Amazon ECS tasks that are hosted in Fargate use ephemeral storage that is encrypted with AES-256 encryption, using an encryption key managed by Fargate. User data stored in Amazon MQ is encrypted at rest. Amazon MQ encryption at rest provides enhanced security by encrypting data using encryption keys stored in the AWS Key Management Service. All connections between Amazon MQ brokers use Transport Layer Security to provide encryption in transit. All APIs are accessed through API gateways secured through Amazon Cognito. Only authorized users can access the application.

The architecture provides many benefits to EDI processing:

  • Scalability. Because the solution is highly scalable, it can speed integration of new partner/provider requirements.
  • Compliance. Use the architecture to run sensitive, HIPAA-regulated workloads. If you plan to include PHI (as defined by HIPAA) on AWS services, first accept the AWS Business Associate Addendum (AWS BAA). You can review, accept, and check the status of your AWS BAA through a self-service portal available in AWS Artifact. Any AWS service can be used with a healthcare application, but only services covered by the AWS BAA can be used to store, process, and transmit protected health information under HIPAA.
  • Cost effective. Though serverless cost is calculated by usage, with this architecture you save as your traffic grows.
  • Visibility. Visualize and understand the flow of your EDI processing using Amazon CloudWatch to monitor your databases, queues, and operation portals.
  • Ownership. Gain ownership of your EDI and custom or standard rules for rapid change management and partner onboarding.

Conclusion

In this healthcare use case, we demonstrated how a combination of AWS services can be used to increase efficiency and reduce cost. This architecture provides a scalable, reliable, and secure foundation to develop your EDI solution, while using dependent applications. We established how to simplify complex tasks in order to manage and scale your infrastructure for a high volume of data. Finally, the solution provides for monitoring your workflow, services, and alerts.

For further reading:

Migrating petabytes of data from on-premises file systems to Amazon FSx for Lustre

Post Syndicated from Vimala Pydi original https://aws.amazon.com/blogs/architecture/migrating-petabytes-of-data-from-on-premises-file-systems-to-amazon-fsx-for-lustre/

Many organizations use the Lustre filesystem for Linux-based applications that require petabytes of data and high-performance storage. Lustre file systems are used in machine learning (ML), high performance computing (HPC), big data, and financial analytics. Many such high-performance workloads are being migrated to Amazon Web Services (AWS) to take advantage of the scalability, elasticity, and agility that AWS offers. Amazon FSx for Lustre is a fully managed service that provides cost-effective, high-performance, and scalable storage for Lustre file systems on AWS.

AWS DataSync is an AWS managed service for copying data to and from Amazon FSx for Lustre. It provides high-speed transfer through its use of compression and parallel transfer mechanism and integrates with Amazon CloudWatch for observability.

This blog will show you how to migrate petabytes of data files from on-premises to Amazon FSx for Lustre using AWS DataSync. It will provide an overview of Amazon CloudWatch metrics and logs to help you monitor your data transfer using AWS DataSync and metrics from Amazon FSx for Lustre.

Solution overview for file storage data migration

The high-level architecture diagram in Figure 1 depicts file storage data migration from on-premises data center to Amazon FSx for Lustre using AWS DataSync.

Following are the steps for the migration:

  1. Create an Amazon FSx file system.
  2. Install AWS DataSync agent on premises to connect to AWS DataSync service over secured TLS connection.
  3. Configure source and target locations to create an AWS DataSync task.
  4. Configure and start the AWS DataSync task to migrate the data from on-premises to Amazon FSx for Lustre.
Figure 1. Architecture diagram for transferring files on-premises to Amazon FSx for Lustre using AWS DataSync

Figure 1. Architecture diagram for transferring files on-premises to Amazon FSx for Lustre using AWS DataSync

Prerequisites

Steps for migration

1. Create an Amazon FSx file system

To start the migration, create a Lustre file system in Amazon FSx service and follow the step-by-step guidance provided in Getting started with Amazon FSx for Lustre.

For this blog, a target of ‘Persistent 2’ deployment type FSx for Lustre is selected with a storage capacity of 1.2 TB (Figure 2.)

Figure 2. FSx for Lustre target file system

Figure 2. FSx for Lustre target file system

2. Install AWS DataSync agent on-premises

Follow steps in the article: Getting started with AWS DataSync to get started with the AWS DataSync service. Configure the source system to migrate the file system data using the following steps:

  • Deploy an AWS DataSync agent on-premises on a supported virtual machine or hypervisor (Figure 3.)
  • Configure the AWS DataSync agent from AWS Management Console.
  • Activate the AWS DataSync agent configured from the preceding step.
Figure 3. Create AWS DataSync agent

Figure 3. Create AWS DataSync agent

3. Configure source and destination locations

A DataSync task consists of a pair of locations between which data is transferred. The source location defines the storage system that you want to read from. The destination location defines the storage service that you want to write data to. Here the source location is an on-premises Lustre system and the destination location is the Amazon FSx for Lustre service (Figure 4.)

Figure 4. Configure source and destination location for AWS DataSync task

Figure 4. Configure source and destination location for AWS DataSync task

4. Configure and start task

A task is a set of two locations (source and destination) and a set of options that you use to control the behavior of the task. Create a task with the source and destination locations and choose Start from the Actions menu (Figure 5.)

Figure 5. Start task

Figure 5. Start task

Wait for the task status to change to Running (Figure 6.)

Figure 6. Task status

Figure 6. Task status

To check the details of the task completion, select the task and click on the History tab (Figure 7.) The status should show Success once the task successfully completes the migration.

Figure 7. Task history

Figure 7. Task history

Monitoring the file transfer

Amazon CloudWatch is the AWS native observability service. It collects and processes raw data from AWS services such as Amazon FSx for Lustre and AWS DataSync into readable, near real-time metrics. It provides metrics that you can use to get more visibility into the data transfer. For a full list of CloudWatch metrics for AWS DataSync and Amazon FSx for Lustre, read Monitoring AWS DataSync and Monitoring Amazon FSx for Lustre.

Amazon FSx for Lustre can also provide various metrics, for example, the number of read or write operations using DataReadOperations and DataWriteOperations. To find the total storage available you can check the metric FreeDataStorageCapacity (Figure 8.)

Figure 8. CloudWatch metrics for Amazon FSx for Lustre

Figure 8. CloudWatch metrics for Amazon FSx for Lustre

AWS DataSync metrics such as FilesTransferred, gives the actual number of files or metadata that transferred over the network. BytesTransferred provides the total number of bytes that transferred over the network when the agent reads from the source location to the destination location.

A robust monitoring system can be built by setting up an automated notification process for any errors or issues in the data transfer task. Integrate Amazon CloudWatch in combination with the Amazon Simple Notification Service (SNS). Figure 9 depicts the AWS DataSync logs in Amazon CloudWatch.

Figure 9. AWS DataSync logs in Amazon CloudWatch

Figure 9. AWS DataSync logs in Amazon CloudWatch

You can also gather insights from the logs of the data transfer metrics using CloudWatch Logs Insights. CloudWatch Log Insights enables you to quickly search and query your log data (Figure 10.) You can set a filter metric for error codes and alert the appropriate team.

Figure 10. Amazon CloudWatch Logs Insights for querying logs

Figure 10. Amazon CloudWatch Logs Insights for querying logs

Cleanup

If you are no longer using the resources discussed in this blog, remove the unneeded AWS resources to avoid incurring charges. After finishing the file transfer, clean up resources by deleting the Amazon FSx file system and AWS DataSync objects (DataSync agent, task, source location, and destination location.)

Conclusion

In this post, we demonstrated how we can accelerate migration of Lustre files from on-premises into Amazon FSx for Lustre using AWS DataSync. As a fully managed service, AWS DataSync securely and seamlessly connects to your Amazon FSx for Lustre file system. This makes it possible for you to move millions of files and petabytes of data without the need for deploying or managing infrastructure in the cloud. We walked through different observability metrics with Amazon CloudWatch integration to provide performance metrics, logging, and events. This can further help to speed up critical hybrid cloud storage workflows in industries that must move active files into AWS quickly. This capability is available in Regions where AWS DataSync and Amazon FSx for Lustre are available. For further details on using this cost-effective service, see Amazon FSx for Lustre pricing and AWS DataSync pricing.

For further reading:

More posts for Women’s History Month!

Other ways to participate

Using DevOps Automation to Deploy Lambda APIs across Accounts and Environments

Post Syndicated from Subrahmanyam Madduru original https://aws.amazon.com/blogs/architecture/using-devops-automation-to-deploy-lambda-apis-across-accounts-and-environments/

by Subrahmanyam Madduru – Global Partner Solutions Architect Leader, AWS, Sandipan Chakraborti – Senior AWS Architect, Wipro Limited, Abhishek Gautam – AWS Developer and Solutions Architect, Wipro Limited, Arati Deshmukh – AWS Architect, Infosys

As more and more enterprises adopt serverless technologies to deliver their business capabilities in a more agile manner, it is imperative to automate release processes. Multiple AWS Accounts are needed to separate and isolate workloads in production versus non-production environments. Release automation becomes critical when you have multiple business units within an enterprise, each consisting of a number of AWS accounts that are continuously deploying to production and non-production environments.

As a DevOps best practice, the DevOps engineering team responsible for build-test-deploy in a non-production environment should not release the application and infrastructure code on to both non-production and production environments.  This risks introducing errors in application and infrastructure deployments in production environments. This in turn results in significant rework and delays in delivering functionalities and go-to-market initiatives. Deploying the code in a repeatable fashion while reducing manual error requires automating the entire release process. In this blog, we show how you can build a cross-account code pipeline that automates the releases across different environments using AWS CloudFormation templates and AWS cross-account access.

Cross-account code pipeline enables an AWS Identity & Access Management (IAM) user to assume an IAM Production role using AWS Secure Token Service (Managing AWS STS in an AWS Region – AWS Identity and Access Management) to switch between non-production and production deployments based as required. An automated release pipeline goes through all the release stages from source, to build, to deploy, on non-production AWS Account and then calls STS Assume Role API (cross-account access) to get temporary token and access to AWS Production Account for deployment. This follow the least privilege model for granting role-based access through IAM policies, which ensures the secure automation of the production pipeline release.

Solution Overview

In this blog post, we will show how a cross-account IAM assume role can be used to deploy AWS Lambda Serverless API code into pre-production and production environments. We are building on the process outlined in this blog post: Building a CI/CD pipeline for cross-account deployment of an AWS Lambda API with the Serverless Framework by programmatically automating the deployment of Amazon API Gateway using CloudFormation templates. For this use case, we are assuming a single tenant customer with separate AWS Accounts to isolate pre-production and production workloads.  In Figure 1, we have represented the code pipeline workflow diagramatically for our use case.

Figure 1. AWS cross-account CodePipeline for production and non-production workloads

Figure 1. AWS cross-account AWS CodePipeline for production and non-production workloads

Let us describe the code pipeline workflow in detail for each step noted in the preceding diagram:

  1. An IAM user belonging to the DevOps engineering team logs in to AWS Command-line Interface (AWS CLI) from a local machine using an IAM secret and access key.
  2. Next, the  IAM user assumes the IAM role to the corresponding activities – AWS Code Commit, AWS CodeBuild, AWS CodeDeploy, AWS CodePipeline Execution and deploys the code for pre-production.
  3. A typical AWS CodePipeline comprises of build, test and deploy stages. In the build stage, the AWS CodeBuild service generates the Cloudformation template stack (template-export.yaml) into Amazon S3.
  4. In the deploy stage, AWS CodePipeline uses a CloudFormation template (a yaml file) to deploy the code from an S3 bucket containing the application API endpoints via Amazon API Gateway in the pre-production environment.
  5. The final step in the pipeline workflow is to deploy the application code changes onto the Production environment by assuming STS production IAM role.

Since the AWS CodePipeline is fully automated, we can use the same pipeline by switching between  pre-production and production accounts. These accounts assume the IAM role appropriate to the target environment and deploy the validated build to that environment using CloudFormation templates.

Prerequisites

Here are the pre-requisites before you get started with implementation.

  • A user  with appropriate privileges (for example: Project Admin) in a production AWS account
  • A user with appropriate privileges (for example: Developer Lead) in a pre-production AWS account such as development
  • A CloudFormation template for deploying infrastructure in the pre-production account
  • Ensure your local machine has AWS CLI installed and configured 

Implementation Steps

In this section, we show how you can use AWS CodePipeline to release a serverless API in a secure manner to pre-production and production environments. AWS CloudWatch logging will be used to monitor the events on the AWS CodePipeline.

1. Create Resources in a pre-production account

In this step, we create the required resources such as a code repository, an S3 bucket, and a KMS key in a pre-production environment.

  • Clone the code repository into your CodeCommit. Make necessary changes to index.js and ensure the buildspec.yaml is there to build the artifacts.
    • Using codebase (lambda APIs) as input, you output a CloudFormation template, and environmental configuration JSON files (used for configuring Production and other non-Production environments such as dev, test). The build artifacts are packaged using AWS Serverless Application Model into a zip file and uploads it to an S3 bucket created for storing artifacts. Make note of the repository name as it will be required later.
  • Create an S3 bucket in a Region (Example: us-east-2). This bucket will be used by the pipeline for get and put artifacts. Make a note of the bucket name.
    • Make sure you edit the bucket policy to have your production account ID and the bucket name. Refer to AWS S3 Bucket Policy documentation to make changes to Amazon S3 bucket policies and permissions.
  • Navigate to AWS Key Management Service (KMS) and create a symmetric key.
  • Then create a new secret, configure the KMS key and provide access to development and production account. Make a note of the ARN for the key.

2. Create IAM Roles in the Production Account and required policies

In this step, we create roles and policies required to deploy the code.

{
    "Version": "2012-10-17",
    "Statement": [
      {
        "Effect": "Allow",
        "Action": [
        "kms:DescribeKey",
        "kms:GenerateDataKey*",
        "kms:Encrypt",
        "kms:ReEncrypt*",
        "kms:Decrypt"
      ],
      "Resource": [
        "Your KMS Key ARN you created in Development Account"
      ]
    }
  ]
}

Once you’ve created both policies, attach them to the previously created cross-account role.

3. Create a CloudFormation Deployment role

In this step, you need to create another IAM role, “CloudFormationDeploymentRole” for Application deployment. Then attach the following four policies to it.

Policy 1: For Cloudformation to deploy the application in the Production account

{
  "Version": "2012-10-17",
  "Statement": [
    {
      "Sid": "VisualEditor0",
      "Effect": "Allow",
      "Action": [
        "cloudformation:DetectStackDrift",
        "cloudformation:CancelUpdateStack",
        "cloudformation:DescribeStackResource",
        "cloudformation:CreateChangeSet",
        "cloudformation:ContinueUpdateRollback",
        "cloudformation:DetectStackResourceDrift",
        "cloudformation:DescribeStackEvents",
        "cloudformation:UpdateStack",
        "cloudformation:DescribeChangeSet",
        "cloudformation:ExecuteChangeSet",
        "cloudformation:ListStackResources",
        "cloudformation:SetStackPolicy",
        "cloudformation:ListStacks",
        "cloudformation:DescribeStackResources",
        "cloudformation:DescribePublisher",
        "cloudformation:GetTemplateSummary",
        "cloudformation:DescribeStacks",
        "cloudformation:DescribeStackResourceDrifts",
        "cloudformation:CreateStack",
        "cloudformation:GetTemplate",
        "cloudformation:DeleteStack",
        "cloudformation:TagResource",
        "cloudformation:UntagResource",
        "cloudformation:ListChangeSets",
        "cloudformation:ValidateTemplate"
      ],
      "Resource": "arn:aws:cloudformation:us-east-2:940679525002:stack/DevOps-Automation-API*/*"        }
  ]
}

Policy 2: For Cloudformation to perform required IAM actions

{
  "Version": "2012-10-17",
  "Statement": [
    {
      "Sid": "VisualEditor0",
      "Effect": "Allow",
      "Action": [
        "iam:GetRole",
        "iam:GetPolicy",
        "iam:TagRole",
        "iam:DeletePolicy",
        "iam:CreateRole",
        "iam:DeleteRole",
        "iam:AttachRolePolicy",
        "iam:PutRolePolicy",
        "iam:TagPolicy",
        "iam:CreatePolicy",
        "iam:PassRole",
        "iam:DetachRolePolicy",
        "iam:DeleteRolePolicy"
      ],
      "Resource": "*"
    }
  ]
}

Policy 3: Lambda function service invocation policy

{
  "Version": "2012-10-17",
  "Statement": [
    {
      "Sid": "VisualEditor0",
      "Effect": "Allow",
      "Action": [
        "lambda:CreateFunction",
        "lambda:UpdateFunctionCode",
        "lambda:AddPermission",
        "lambda:InvokeFunction",
        "lambda:GetFunction",
        "lambda:DeleteFunction",
        "lambda:PublishVersion",
        "lambda:CreateAlias"
      ],
      "Resource": "arn:aws:lambda:us-east-2:Your_Production_AccountID:function:SampleApplication*"
    }
  ]
}

Policy 4: API Gateway service invocation policy

{
  "Version": "2012-10-17",
  "Statement": [
    {
      "Sid": "VisualEditor0",
      "Effect": "Allow",
      "Action": [
        "apigateway:DELETE",
        "apigateway:PATCH",
        "apigateway:POST",
        "apigateway:GET"
      ],
      "Resource": [
        "arn:aws:apigateway:*::/restapis/*/deployments/*",
        "arn:aws:apigateway:*::/restapis/*/stages/*",
        "arn:aws:apigateway:*::/clientcertificates",
        "arn:aws:apigateway:*::/restapis/*/models",
        "arn:aws:apigateway:*::/restapis/*/resources/*",
        "arn:aws:apigateway:*::/restapis/*/models/*",
        "arn:aws:apigateway:*::/restapis/*/gatewayresponses/*",
        "arn:aws:apigateway:*::/restapis/*/stages",
        "arn:aws:apigateway:*::/restapis/*/resources",
        "arn:aws:apigateway:*::/restapis/*/gatewayresponses",
        "arn:aws:apigateway:*::/clientcertificates/*",
        "arn:aws:apigateway:*::/account",
        "arn:aws:apigateway:*::/restapis/*/deployments",
        "arn:aws:apigateway:*::/restapis"
      ]
    },
    {
      "Sid": "VisualEditor1",
      "Effect": "Allow",
      "Action": [
        "apigateway:DELETE",
        "apigateway:PATCH",
        "apigateway:POST",
        "apigateway:GET"
      ],
      "Resource": "arn:aws:apigateway:*::/restapis/*/resources/*/methods/*/responses/*"
    },
    {
      "Sid": "VisualEditor2",
      "Effect": "Allow",
      "Action": [
        "apigateway:DELETE",
        "apigateway:PATCH",
        "apigateway:GET"
      ],
      "Resource": "arn:aws:apigateway:*::/restapis/*"
    },
    {
      "Sid": "VisualEditor3",
      "Effect": "Allow",
      "Action": [
        "apigateway:DELETE",
        "apigateway:PATCH",
        "apigateway:GET"
      ],
      "Resource": "arn:aws:apigateway:*::/restapis/*/resources/*/methods/*"
    }
  ]
}

Make sure you also attach the S3 read/write access and KMS policies created in Step-2, to the CloudFormationDeploymentRole.

4. Setup and launch CodePipeline

You can launch the CodePipeline either manually in the AWS console using “Launch Stack” or programmatically via command-line in CLI.

On your local machine go to terminal/ command prompt and launch this command:

aws cloudformation deploy –template-file <Path to pipeline.yaml> –region us-east-2 –stack-name <Name_Of_Your_Stack> –capabilities CAPABILITY_IAM –parameter-overrides ArtifactBucketName=<Your_Artifact_Bucket_Name>  ArtifactEncryptionKeyArn=<Your_KMS_Key_ARN>  ProductionAccountId=<Your_Production_Account_ID>  ApplicationRepositoryName=<Your_Repository_Name> RepositoryBranch=master

If you have configured a profile in AWS CLI,  mention that profile while executing the command:

–profile <your_profile_name>

After launching the pipeline, your serverless API gets deployed in pre-production as well as in the production Accounts. You can check the deployment of your API in production or pre-production Account, by navigating to the API Gateway in the AWS console and looking for your API in the Region where it was deployed.

Figure 2. Check your deployment in pre-production/production environment

Figure 2. Check your deployment in pre-production/production environment

Then select your API and navigate to stages, to view the published API with an endpoint. Then validate your API response by selecting the API link.

Figure 3. Check whether your API is being published in pre-production/production environment

Figure 3. Check whether your API is being published in pre-production/production environment

Alternatively you can also navigate to your APIs by navigating through your deployed application CloudFormation stack and selecting the link for API in the Resources tab.

Cleanup

If you are trying this out in your AWS accounts, make sure to delete all the resources created during this exercise to avoid incurring any AWS charges.

Conclusion

In this blog, we showed how to build a cross-account code pipeline to automate releases across different environments using AWS CloudFormation templates and AWS Cross Account Access. You also learned how serveless APIs can be securely deployed across pre-production and production accounts. This helps enterprises automate release deployments in a repeatable and agile manner, reduce manual errors and deliver business cababilities more quickly.

Creating computing quotas on AWS Outposts rack with EC2 Capacity Reservations sharing

Post Syndicated from Rachel Zheng original https://aws.amazon.com/blogs/compute/creating-computing-quotas-on-aws-outposts-rack-with-ec2-capacity-reservation-sharing/

This post is written by Yi-Kang Wang, Senior Hybrid Specialist SA.

AWS Outposts rack is a fully managed service that delivers the same AWS infrastructure, AWS services, APIs, and tools to virtually any on-premises datacenter or co-location space for a truly consistent hybrid experience. AWS Outposts rack is ideal for workloads that require low latency access to on-premises systems, local data processing, data residency, and migration of applications with local system interdependencies. In addition to these benefits, we have started to see many of you need to share Outposts rack resources across business units and projects within your organization. This blog post will discuss how you can share Outposts rack resources by creating computing quotas on Outposts with Amazon Elastic Compute Cloud (Amazon EC2) Capacity Reservations sharing.

In AWS Regions, you can set up and govern a multi-account AWS environment using AWS Organizations and AWS Control Tower. The natural boundaries of accounts provide some built-in security controls, and AWS provides additional governance tooling to help you achieve your goals of managing a secure and scalable cloud environment. And while Outposts can consistently use organizational structures for security purposes, Outposts introduces another layer to consider in designing that structure. When an Outpost is shared within an Organization, the utilization of the purchased capacity also needs to be managed and tracked within the organization. The account that owns the Outpost resource can use AWS Resource Access Manager (RAM) to create resource shares for member accounts within their organization. An Outposts administrator (admin) can share the ability to launch instances on the Outpost itself, access to the local gateways (LGW) route tables, and/or access to customer-owned IPs (CoIP). Once the Outpost capacity is shared, the admin needs a mechanism to control the usage and prevent over utilization by individual accounts. With the introduction of Capacity Reservations on Outposts, we can now set up a mechanism for computing quotas.

Concept of computing quotas on Outposts rack

In the AWS Regions, Capacity Reservations enable you to reserve compute capacity for your Amazon EC2 instances in a specific Availability Zone for any duration you need. On May 24, 2021, Capacity Reservations were enabled for Outposts rack. It supports not only EC2 but Outposts services running over EC2 instances such as Amazon Elastic Kubernetes (EKS), Amazon Elastic Container Service (ECS) and Amazon EMR. The computing power of above services could be covered in your resource planning as well. For example, you’d like to launch an EKS cluster with two self-managed worker nodes for high availability. You can reserve two instances with Capacity Reservations to secure computing power for the requirement.

Here I’ll describe a method for thinking about resource pools that an admin can use to manage resource allocation. I’ll use three resource pools, that I’ve named reservation pool, bulk and attic, to effectively and extensibly manage the Outpost capacity.

A reservation pool is a resource pool reserved for a specified member account. An admin creates a Capacity Reservation to match member account’s need, and shares the Capacity Reservation with the member account through AWS RAM.

A bulk pool is an unreserved resource pool that is used when member accounts run out of compute capacity such as EC2, EKS, or other services using EC2 as underlay. All compute capacity in the bulk pool can be requested to launch until it is exhausted. Compute capacity that is not under a reservation pool belongs to the bulk pool by default.

An attic is a resource pool created to hold the compute capacity that the admin wouldn’t like to share with member accounts. The compute capacity remains in control by admin, and can be released to the bulk pool when needed. Admin creates a Capacity Reservation for the attic and owns the Capacity Reservation.

The following diagram shows how the admin uses Capacity Reservations with AWS RAM to manage computing quotas for two member accounts on an Outpost equipped with twenty-four m5.xlarge. Here, I’m going to break the idea into several pieces to help you understand easily.

  1. There are three Capacity Reservations created by admin. CR #1 reserves eight m5.xlarge for the attic, CR #2 reserves four m5.xlarge instances for account A and CR #3 reserves six m5.xlarge instances for account B.
  2. The admin shares Capacity Reservation CR #2 and CR #3 with account A and B respectively.
  3. Since eighteen m5.xlarge instances are reserved, the remaining compute capacity in the bulk pool will be six m5.xlarge.
  4. Both Account A and B can continue to launch instances exceeding the amount in their Capacity Reservation, by utilizing the instances available to everyone in the bulk pool.

Concept of defining computing quotas

  1. Once the bulk pool is exhausted, account A and B won’t be able to launch extra instances from the bulk pool.
  2. The admin can release more compute capacity from the attic to refill the bulk pool, or directly share more capacity with CR#2 and CR#3. The following diagram demonstrates how it works.

Concept of refilling bulk pool

Based on this concept, we realize that compute capacity can be securely and efficiently allocated among multiple AWS accounts. Reservation pools allow every member account to have sufficient resources to meet consistent demand. Making the bulk pool empty indirectly sets the maximum quota of each member account. The attic plays as a provider that is able to release compute capacity into the bulk pool for temporary demand. Here are the major benefits of computing quotas.

  • Centralized compute capacity management
  • Reserving minimum compute capacity for consistent demand
  • Resizable bulk pool for temporary demand
  • Limiting maximum compute capacity to avoid resource congestion.

Configuration process

To take you through the process of configuring computing quotas in the AWS console, I have simplified the environment like the following architecture. There are four m5.4xlarge instances in total. An admin account holds two of the m5.4xlarge in the attic, and a member account gets the other two m5.4xlarge for the reservation pool, which results in no extra instance in the bulk pool for temporary demand.

Prerequisites

  • The admin and the member account are within the same AWS Organization.
  • The Outpost ID, LGW and CoIP have been shared with the member account.

Architecture for configuring computing quotas

  1. Creating a Capacity Reservation for the member account

Sign in to AWS console of the admin account and navigate to the AWS Outposts page. Select the Outpost ID you want to share with the member account, choose Actions, and then select Create Capacity Reservation. In this case, reserve two m5.4xlarge instances.

Create a capacity reservation

In the Reservation details, you can terminate the Capacity Reservation by manually enabling or selecting a specific time. The first option of Instance eligibility will automatically count the number of instances against the Capacity Reservation without specifying a reservation ID. To avoid misconfiguration from member accounts, I suggest you select Any instance with matching details in most use cases.

Reservation details

  1. Sharing the Capacity Reservation through AWS RAM

Go to the RAM page, choose Create resource share under Resource shares page. Search and select the Capacity Reservation you just created for the member account.

Specify resource sharing details

Choose a principal that is an AWS ID of the member account.

Choose principals that are allowed to access

  1. Creating a Capacity Reservation for attic

Create a Capacity Reservation like step 1 without sharing with anyone. This reservation will just be owned by the admin account. After that, check Capacity Reservations under the EC2 page, and the two Capacity Reservations there, both with availability of two m5.4xlarge instances.

3.	Creating a Capacity Reservation for attic

  1. Launching EC2 instances

Log in to the member account, select the Outpost ID the admin shared in step 2 then choose Actions and select Launch instance. Follow AWS Outposts User Guide to launch two m5.4xlarge on the Outpost. When the two instances are in Running state, you can see a Capacity Reservation ID on Details page. In this case, it’s cr-0381467c286b3d900.

Create EC2 instances

So far, the member account has run out of two m5.4xlarge instances that the admin reserved for. If you try to launch the third m5.4xlarge instance, the following failure message will show you there is not enough capacity.

Launch status

  1. Allocating more compute capacity in bulk pool

Go back to the admin console, select the Capacity Reservation ID of the attic on EC2 page and choose Edit. Modify the value of Quantity from 2 to 1 and choose Save, which means the admin is going to release one more m5.4xlarge instance from the attic to the bulk pool.

Instance details

  1. Launching more instances from bulk pool

Switch to the member account console, and repeat step 4 but only launch one more m5.4xlarge instance. With the resource release on step 5, the member account successfully gets the third instance. The compute capacity is coming from the bulk pool, so when you check the Details page of the third instance, the Capacity Reservation ID is blank.

6.	Launching more instances from bulk pool

Cleaning up

  1. Terminate the three EC2 instances in the member account.
  2. Unshare the Capacity Reservation in RAM and delete it in the admin account.
  3. Unshare the Outpost ID, LGW and CoIP in RAM to get the Outposts resources back to the admin.

Conclusion

In this blog post, the admin can dynamically adjust compute capacity allocation on Outposts rack for purpose-built member accounts with an AWS Organization. The bulk pool offers an option to fulfill flexibility of resource planning among member accounts if the maximum instance need per member account is unpredictable. By contrast, if resource forecast is feasible, the admin can revise both the reservation pool and the attic to set a hard limit per member account without using the bulk pool. In addition, I only showed you how to create a Capacity Reservation of m5.4xlarge for the member account, but in fact an admin can create multiple Capacity Reservations with various instance types or sizes for a member account to customize the reservation pool. Lastly, if you would like to securely share Amazon S3 on Outposts with your member accounts, check out Amazon S3 on Outposts now supports sharing across multiple accounts to get more details.

Gain insights into your Amazon Kinesis Data Firehose delivery stream using Amazon CloudWatch

Post Syndicated from Alon Gendler original https://aws.amazon.com/blogs/big-data/gain-insights-into-your-amazon-kinesis-data-firehose-delivery-stream-using-amazon-cloudwatch/

The volume of data being generated globally is growing at an ever-increasing pace. Data is generated to support an increasing number of use cases, such as IoT, advertisement, gaming, security monitoring, machine learning (ML), and more. The growth of these use cases drives both volume and velocity of streaming data and requires companies to capture, processes, transform, analyze, and load the data into various data stores in near-real time.

Amazon Kinesis Data Firehose is the easiest way to reliably load streaming data into data lakes, data stores, and analytics services. As the volume of the data you stream into Kinesis Data Firehose grows, you should gain insights and monitor the health of your data ingestion, transformation, and delivery.

In this post, we review the capabilities of using Firehose delivery stream metrics and the Amazon CloudWatch dashboard located on your Kinesis Data Firehose console. These capabilities allow you to create alerts when, for example, if the destination you configured in Kinesis Data Firehose has missing privileges, misconfigurations, or other issues, then Firehose will be able to detect it for you and report it as a failure. Other errors that might also occur are if you configured data transformation using Lambda and your Lambda function invocation failed, or if you have reached the Kinesis Firehose quota limits associated with your AWS account. In these cases, the data delivery from Kinesis Data Firehose to its destination may delay or fail. The CloudWatch alerts described in this post should help identify such cases in a timely manner.

This post also covers the different proactive actions that you can take when alarms are being triggered, such as submitting a request to increase quota or adding exponential backoff to your data producers.

Monitoring the delivery streams and taking these actions makes sure that data is delivered to your destinations without interruptions, enabling your business to gain insights in near-real time.

Monitor data ingestion to Kinesis Data Firehose

You can deliver data from your data producers to Kinesis Data Firehose through Amazon Kinesis Data Streams (as described later in this post), using Kinesis Agent, or directly using the Kinesis Data Firehose API operations PutRecord and PutRecordBatch. When you use Kinesis Data Streams as a data source, Kinesis Data Firehose scales automatically as your Kinesis Data Stream scales. When using the API operations for direct ingestion, you need to check the quota limits associated with your AWS account to avoid API requests throttling. Depending on your data producer behavior, this throttling can cause your data producers to retry the operation, which results in a delay of the data delivery to your destination. This throttling can also result in data loss if your data producers don’t implement a retry mechanism.

To gain deeper insights into Firehose delivery stream usage, we provide additional CloudWatch metrics that help you monitor and proactively scale quota limits: ThrottledRecords, RecordsPerSecondLimit, BytesPerSecondLimit, and PutRequestsPerSecondLimit. You can use the CloudWatch metrics dashboard (on the Monitoring tab on your Kinesis Data Firehose console) to easily visualize current usage and the quota limits.

When ingesting data directly to your delivery stream using PutRecord or PutRecordBatch, you should monitor the ThrottledRecords metric. This metric represents the number of records that were actually throttled because data ingestion exceeded one of the delivery stream limits. Kinesis Data Firehose calculates the throttling rates during the ingestion at a 1-second granularity, but the data ingestion metrics we mentioned are aggregated and emitted to CloudWatch every 5 minutes. Because of that, you can get throttled within that 5-minute window even if the data ingestion metrics don’t show that you reached the limit.

To receive alerts before your data producers are actually throttled, you can use additional CloudWatch metrics to alert you when you’re about to reach one of the delivery stream limits. You can achieve this by using the CloudWatch metrics IncomingRecords, IncomingBytes, and IncomingPutRequests. To check the limits of these metrics, refer to Amazon Kinesis Data Firehose Quota.

You can use the following ingestion metrics and their corresponding limit metrics to create a CloudWatch alarm:

  • RecordsPerSecondLimit – The maximum number of records that can be ingested in a second (IncomingRecords)
  • BytesPerSecondLimit – The maximum volume of data that can be ingested in a second (IncomingBytes)
  • PutRequestsPerSecondLimit – The maximum number of successful PutRecord and PutRecordBatch API requests that can be performed in a second (IncomingPutRequests)

To set up an alarm that alerts you when your ingestion rates are close to a quota, you should look for a percentage relationship between the ingestion rate and its corresponding limit. Because Kinesis Data Firehose emits metrics to CloudWatch every 5 minutes, you need to divide your metric with the 5-minute aggregation period, expressed as seconds (300). For example, to generate an alert when the incoming records per second rate is breaching 80% of your API operations quota, your CloudWatch alarm should be defined as follows:

This gives you a way to proactively understand how close your ingestion rates are to your delivery stream limits, and the flexibility to modify the percentage levels based on your use case. To prevent a throttling bottleneck, you should separately monitor the three delivery stream ingestion rate metrics we discussed.

Define alerts using CloudWatch alarms

You can define CloudWatch alarms manually through the AWS Management Console or by using AWS CloudFormation. In this post we cover both methods, starting with the CloudFormation template.

The following template creates your CloudWatch alarms, which you can review and customize to suit your needs.

During the stack creation process, you provide the Firehose delivery stream name that you want to monitor, and the quota percentage where you want to be notified when it’s being breached, such as 80%. After the stack creation is successful, you have four CloudWatch alarms ready.

To create your CloudWatch alarms manually through the console, complete the following steps:

  1. On the Kinesis Data Firehose console, find your delivery stream.
  2. On the Monitoring tab, choose the more options icon of the metric you want to monitor (for this example, we monitor incoming records per second).
  3. On the options menu, choose View in metrics.

On the CloudWatch console, you can see a graph that represents your current API operations (blue line) and the quota limit (red line).

  1. To create an alarm, choose Math expression.
  2. Select Common and choose Percentage.
  3. For the metric name, enter Percentage of records per second quota.
  4. We use the metric expression 100*(e1/m2), which represents the formula 100*(BytesPerSecond/BytesPerSecondLimit) that was described earlier and reflects how close you are to your maximum in percentage.
  5. Change the expression of the metric e1 from METRICS("m1")/300 to m1/300.

You can also change the Y axis label.

  1. On the Graph options tab, under Left Y Axis, for Label, enter Percentage.
  2. Now that you have the expression to use for the alarm, deselect every other expression and metric on the page.

The only expression selected should be the one you just created. You should now see the desired percentage, as in the following screenshot.

Create a CloudWatch alarm

You have now created an expression on your IncomingRecords and RecordsPerSecond quota, which you can use as a base for the alarm. With this, you can configure the tolerance level that your business use case requires.

  1. Choose the alarm icon next to your expression.
  2. In the Specify metric and conditions section, choose to receive an alert when the alarms breach the 75% limit.
  3. In the Configure actions section, specify how to forward this alarm.

You can forward this alarm to your monitoring systems or to an email address through an Amazon Simple Notification Service (Amazon SNS) topic. For this post, we create a new SNS topic and subscribe [email protected] to it.

Actions you can take when approaching the limits

When you’re getting close to your limits, you can take several different actions, which we describe in this section.

Request a service quota increase

One action you can take when seeing an alert is to request an increase in quota using the Amazon Kinesis Data Firehose Limits form. The three quotas scale proportionally, for example, if you increase the throughput quota in US East (N. Virginia), US West (Oregon), or Europe (Ireland) from 5 MiB/second to 10 MiB/second, the other two quotas increase from 2,000 requests/second to 4,000 requests/second and from 500,000 records/second to 1 million records/second. For more information about the service quota limits by AWS Region, see Amazon Kinesis Data Firehose Quota.

Use the PutRecordBatch API

If you use the API call PutRecord to deliver events to a Firehose data stream and you’re reaching the request/second quota limit, consider using the PutRecordBatch API operation. PutRecordBatch writes multiple data records into a delivery stream in a single call to achieve higher throughput per producer than writing single records, and reduces the amount of requests per second to your delivery stream.

Implement exponential backoff

As we mentioned before, even when you’re monitoring your delivery stream, you can still have bursts in your data stream. This could be caused by sudden spikes in usage of your system or external events like high trading activity in financial markets. To protect the producers from multiple throttled records, you should implement an exponential backoff. Exponential backoff is a commonly used algorithm that you can use to decrease the rate of submitting records to Kinesis Data Firehose when being throttled, so that the producer can slowly retry in order to successfully send the records.

The following are the Kinesis Data Firehose API responses when records are throttled:

  • If you’re using the API operation PutRecord, the returned error from the service is ServiceUnavailableException with HTTP status code 500.
  • If you’re using PutRecordBatch, you should iterate through the RequestResponses array and look for individual PutRecordBatchResponseEntry with ErrorCode 500 and ErrorMessage ServiceUnavailableException. Also make sure to check the value of FailedPutCount in the response even when the API call succeeds.

In both cases, you should use exponential backoff and retry the operation. For more information about implementing exponential backoff, see Error retries and exponential backoff in AWS.

Use Kinesis Data Streams with Kinesis Data Firehose

Kinesis Data Streams is a massively scalable and durable real-time data streaming service. Your data producers can produce data directly to Kinesis Data Streams, and you can configure Kinesis Data Firehose to consume the data from Kinesis Data Streams and deliver it to your destination. When you use Kinesis Data Streams as the source for the Firehose delivery stream, the throughput limits mentioned before don’t apply. You don’t need to worry about throughput limits because Kinesis Data Firehose scales automatically to match the number of shards your Kinesis data stream has.

If you’re attaching a Firehose delivery stream as a consumer to your Kinesis data stream, and you have multiple consumer applications that read data from your Kinesis data stream such as AWS Lambda (see Using AWS Lambda with Amazon Kinesis), make sure that the total consumer applications aren’t breaching the shard’s 2 MB total read rate. This can cause the Kinesis data stream to throttle your consumer applications’ reading throughput, including Kinesis Data Firehose.

If more read capacity is required, some application consumers such as Lambda (see AWS Lambda supports Kinesis Data Streams Enhanced Fan-Out and HTTP/2 for faster streaming) or custom consumers that were developed with the Kinesis Consumer Library can support dedicated throughput from Kinesis Data Streams using enhanced fan-out, which currently isn’t supported by Kinesis Data Firehose. This feature provides these consumer applications isolated connection to the stream with 2 MB/second outbound throughput, so they don’t impact other consumer applications that are reading from the shards.

If you need more ingest capacity, you can easily scale up the number of shards in the stream using the console or the UpdateShardCount API.

Monitor data delivery of Kinesis Data Firehose

In case of network timeouts, missing privileges, or misconfigurations of your delivery stream such as incorrect destination configuration or AWS Key Management Service (AWS KMS) key ARN, the data delivery of your data from Kinesis Data Firehose to its destination may delay or fail. Errors might also occur if you configured data transformation using Lambda and your Lambda function invocation failed.

When Kinesis Data Firehose encounters delivery or processing errors, it retries until the configured retry duration expires. If the retry duration ends and the data hasn’t delivered successfully, Kinesis Data Firehose retains the data internally up to a maximum period of 24 hours. If the issue continues beyond the 24-hour maximum retention period, then Kinesis Data Firehose discards the data, resulting in a data loss.

When such data delivery issues persist, the data freshness metric, which is the age of the oldest record in Kinesis Data Firehose that hasn’t been delivered yet, constantly increases. To be alerted in such cases, you should create a CloudWatch alarm for when the data freshness metric exceeds the threshold of 4 hours. We also recommend setting an alarm to observe the historical p90 of the data freshness metric value. For example, set a certain tolerance level (such as 50% above the observed value) as an alarm threshold to detect data freshness variations.
You should monitor the data freshness metric that is relevant to your Kinesis Data Firehose destination, such as DeliveryToS3.DataFreshness, DeliveryToAmazonOpenSearchService.DataFreshness, DeliveryToSplunk.DataFreshness, or DeliveryToHttpEndpoint.DataFreshness. For more information, see Monitoring Kinesis Data Firehose Using CloudWatch Metrics.

If this alarm is triggered, you should take action to understand the root cause of the data freshness variation. A reason for such a variation could be a change in your Lambda transformation logic or configuration change of Lambda concurrency when using Kinesis Data Firehose data transformation. It could also be a result of change in the configuration parameters, format conversion schema, or ingested record type. For more information, see Data Freshness Metric Increasing or Not Emitted or you can submit a technical support request if needed.

When data delivery fails because of data transformation or an issue at the destination, in some cases you can find detailed failure logs in CloudWatch Logs, which can help you troubleshot the problem.

We also recommend monitoring the data delivery byte rate to your destination (for example, DeliveryToS3.Byte), which must match or exceed your data ingestion byte rate (IncomingBytes) on a sustained average basis to avoid increase of the data freshness metric and possible eventual data loss. If the observed delivery data rates are lower than the ingestion rates, consider tuning bottlenecks such as Lambda concurrency levels or your Lambda transformation logic if used with Kinesis Data Firehose data transformation.

To gain additional insights on the delivery of your data to its destination, we provide CloudWatch metrics you can monitor. For example, you can monitor the number of records delivered to keep track of data ingested into your destinations from Kinesis Data Firehose. For more information and additional metrics per destination, see Monitoring Kinesis Data Firehose Using CloudWatch Metrics.

Conclusion

In this post, we discussed the capabilities of using the Firehose delivery stream metrics and the CloudWatch dashboard located on your Kinesis Data Firehose console. This allows you to gain operational insights into the data ingestion and data delivery of your Firehose deliv­­ery stream, and also create CloudWatch alerts to be notified when one of your thresholds is breached. We also covered the different actions that you can take when these alarms are triggered, such as submitting a request to increase your quota or adding exponential backoff to your data producers.

Monitor your delivery streams and take these actions to make sure that your business data is delivered to your destinations without interruptions, enabling your business to gain insights in near-real time.


About the Author

Alon Gendler is a Startup Solutions Architect Manager at Amazon Web Services. He works with AWS customers to help them solve complex problems and architect secure, resilient, scalable and high performance applications in the cloud. Alon is passionate about Data and helping customers get the most out of it.