Post Syndicated from Danilo Poccia original https://aws.amazon.com/blogs/aws/aws-week-in-review-november-21-2022/
A new week starts, and the News Blog team is getting ready for AWS re:Invent! Many of us will be there next week and it would be great to meet in person. If you’re coming, do you know about PeerTalk? It’s an onsite networking program for re:Invent attendees available through the AWS Events mobile app (which you can get on Google Play or Apple App Store) to help facilitate connections among the re:Invent community.
If you’re not coming to re:Invent, no worries, you can get a free online pass to watch keynotes and leadership sessions.
Last Week’s Launches
It was a busy week for our service teams! Here are the launches that got my attention:
AWS Region in Spain – The AWS Region in Aragón, Spain, is now open. The official name is Europe (Spain), and the API name is eu-south-2.
Amazon Athena – You can now apply AWS Lake Formation fine-grained access control policies with all table and file format supported by Amazon Athena to centrally manage permissions and access data catalog resources in your Amazon Simple Storage Service (Amazon S3) data lake. With fine-grained access control, you can restrict access to data in query results using data filters to achieve column-level, row-level, and cell-level security.
Amazon EventBridge – With these additional filtering capabilities, you can now filter events by suffix, ignore case, and match if at least one condition is true. This makes it easier to write complex rules when building event-driven applications.
AWS Controllers for Kubernetes (ACK) – The ACK for Amazon Elastic Compute Cloud (Amazon EC2) is now generally available and lets you provision and manage EC2 networking resources, such as VPCs, security groups and internet gateways using the Kubernetes API. Also, the ACK for Amazon EMR on EKS is now generally available to allow you to declaratively define and manage EMR on EKS resources such as virtual clusters and job runs as Kubernetes custom resources. Learn more about ACK for Amazon EMR on EKS in this blog post.
Amazon HealthLake – New analytics capabilities make it easier to query, visualize, and build machine learning (ML) models. Now HealthLake transforms customer data into an analytics-ready format in near real-time so that you can query, and use the resulting data to build visualizations or ML models. Also new is Amazon HealthLake Imaging (preview), a new HIPAA-eligible capability that enables you to easily store, access, and analyze medical images at any scale. More on HealthLake Imaging can be found in this blog post.
Amazon RDS – You can now transfer files between Amazon Relational Database Service (RDS) for Oracle and an Amazon Elastic File System (Amazon EFS) file system. You can use this integration to stage files like Oracle Data Pump export files when you import them. You can also use EFS to share a file system between an application and one or more RDS Oracle DB instances to address specific application needs.
Amazon ECS and Amazon EKS – We added centralized logging support for Windows containers to help you easily process and forward container logs to various AWS and third-party destinations such as Amazon CloudWatch, S3, Amazon Kinesis Data Firehose, Datadog, and Splunk. See these blog posts for how to use this new capability with ECS and with EKS.
AWS SAM CLI – You can now use the Serverless Application Model CLI to locally test and debug an AWS Lambda function defined in a Terraform application. You can see a walkthrough in this blog post.
AWS Lambda – Now supports Node.js 18 as both a managed runtime and a container base image, which you can learn more about in this blog post. Also check out this interesting article on why and how you should use AWS SDK for JavaScript V3 with Node.js 18. And last but not least, there is new tooling support to build and deploy native AOT compiled .NET 7 applications to AWS Lambda. With this tooling, you can enable faster application starts and benefit from reduced costs through the faster initialization times and lower memory consumption of native AOT applications. Learn more in this blog post.
AWS Step Functions – Now supports cross-account access for more than 220 AWS services to process data, automate IT and business processes, and build applications across multiple accounts. Learn more in this blog post.
AWS Fargate – Adds the ability to monitor the utilization of the ephemeral storage attached to an Amazon ECS task. You can track the storage utilization with Amazon CloudWatch Container Insights and ECS Task Metadata endpoint.
AWS Proton – Now has a centralized dashboard for all resources deployed and managed by AWS Proton, which you can learn more about in this blog post. You can now also specify custom commands to provision infrastructure from templates. In this way, you can manage templates defined using the AWS Cloud Development Kit (AWS CDK) and other templating and provisioning tools. More on CDK support and AWS CodeBuild provisioning can be found in this blog post.
AWS IAM – You can now use more than one multi-factor authentication (MFA) device for root account users and IAM users in your AWS accounts. More information is available in this post.
Amazon ElastiCache – You can now use IAM authentication to access Redis clusters. With this new capability, IAM users and roles can be associated with ElastiCache for Redis users to manage their cluster access.
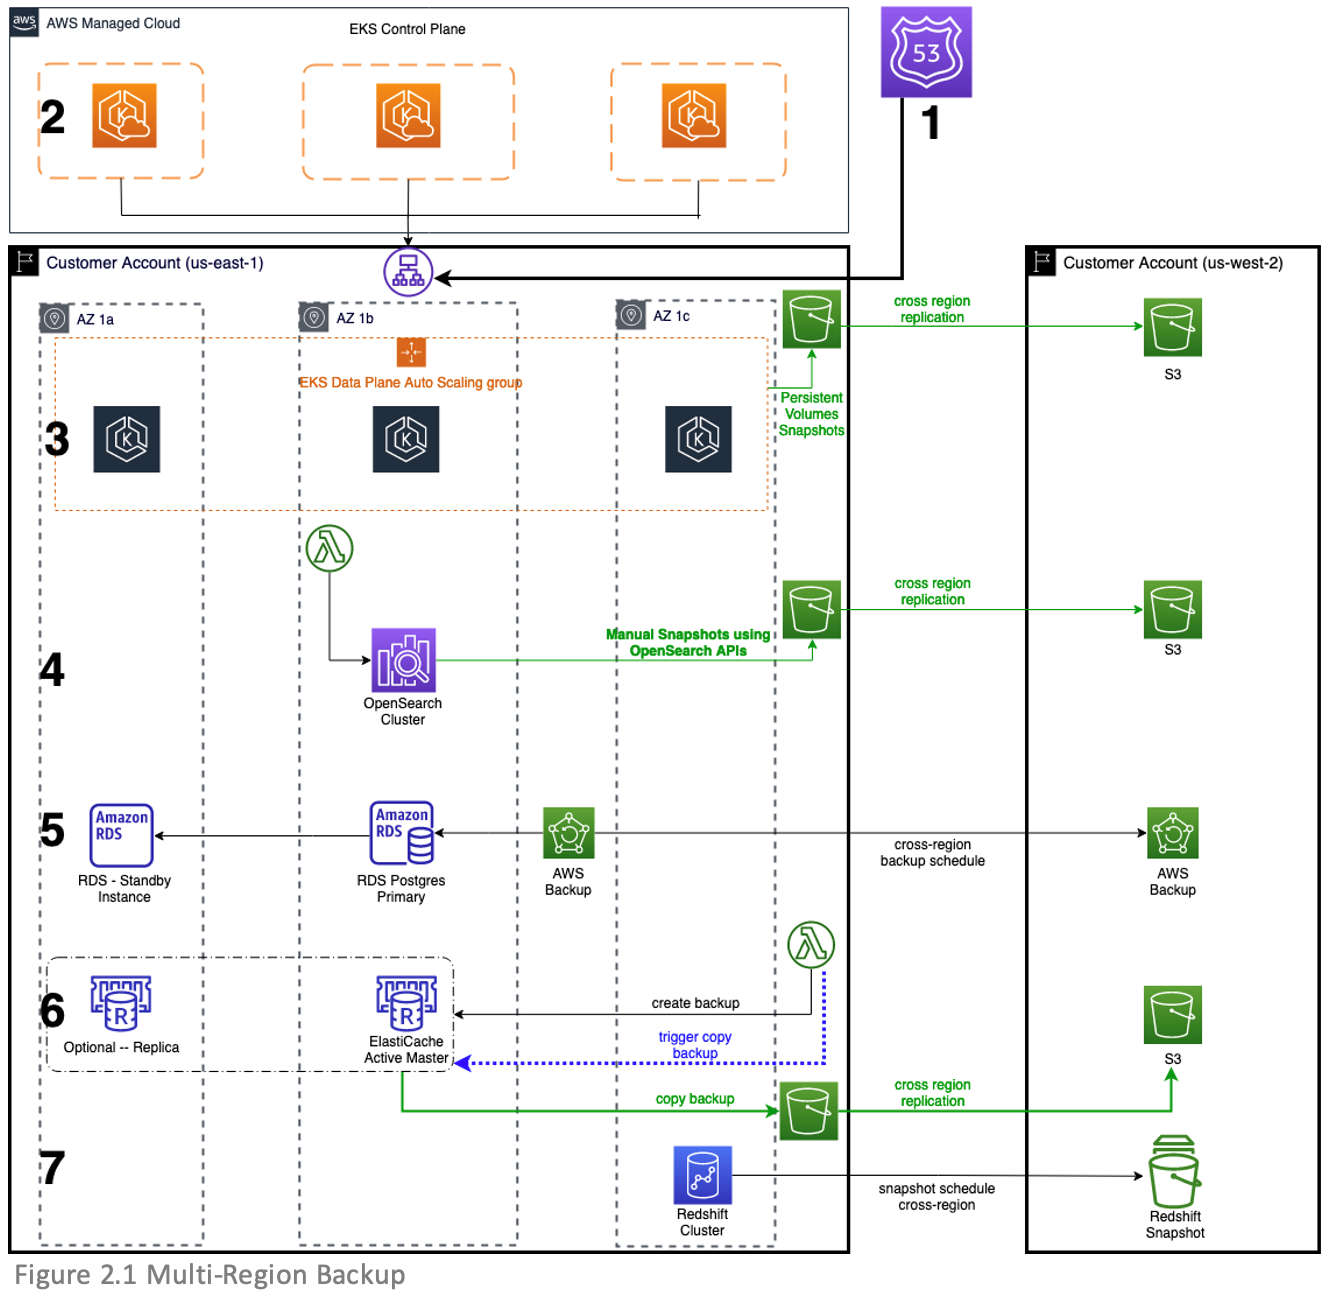
Amazon WorkSpaces – You can now use version 2.0 of the WorkSpaces Streaming Protocol (WSP) host agent that offers significant streaming quality and performance improvements, and you can learn more in this blog post. Also, with Amazon WorkSpaces Multi-Region Resilience, you can implement business continuity solutions that keep users online and productive with less than 30-minute recovery time objective (RTO) in another AWS Region during disruptive events. More on multi-region resilience is available in this post.
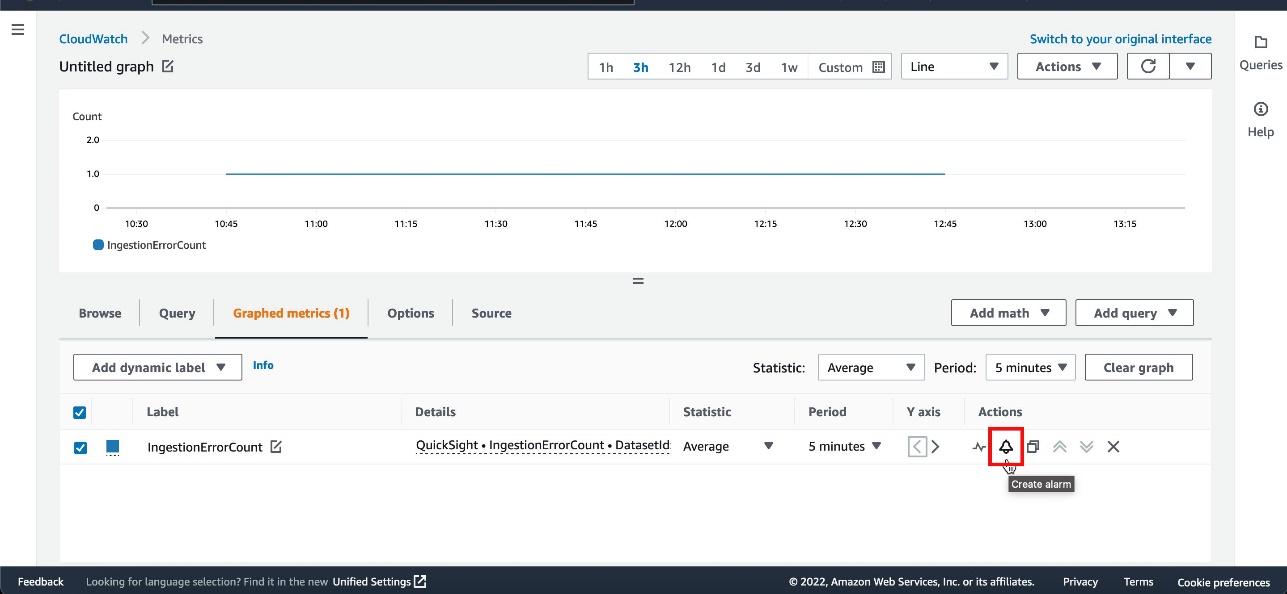
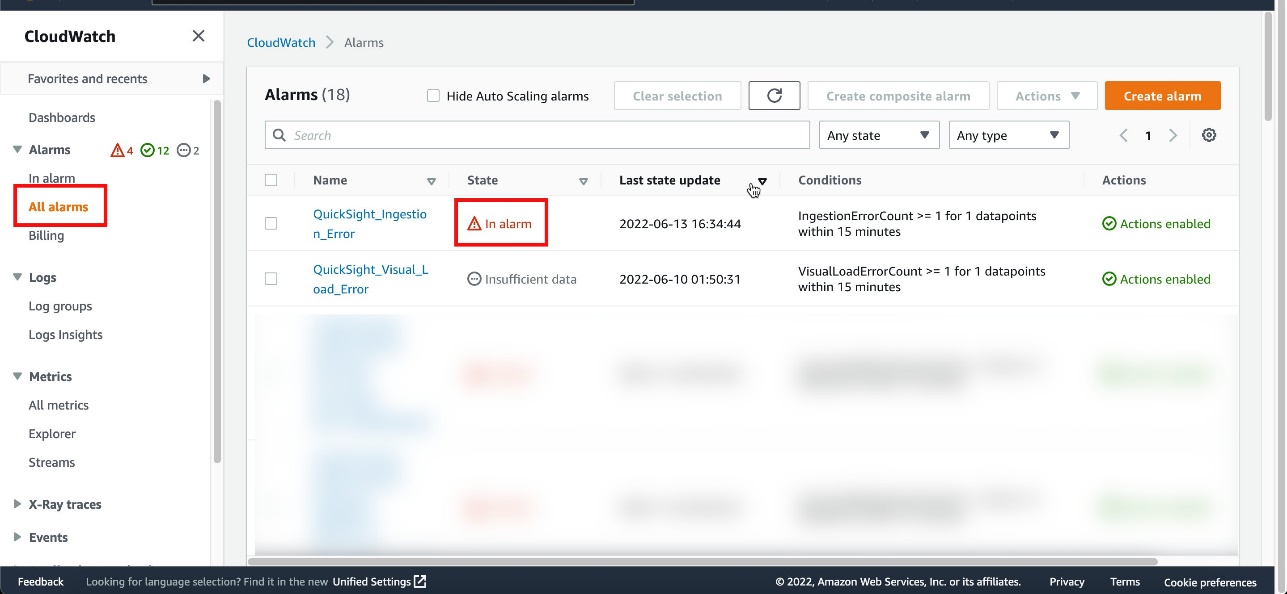
Amazon CloudWatch RUM – You can now send custom events (in addition to predefined events) for better troubleshooting and application specific monitoring. In this way, you can monitor specific functions of your application and troubleshoot end user impacting issues unique to the application components.
AWS AppSync – You can now define GraphQL API resolvers using JavaScript. You can also mix functions written in JavaScript and Velocity Template Language (VTL) inside a single pipeline resolver. To simplify local development of resolvers, AppSync released two new NPM libraries and a new API command. More info can be found in this blog post.
AWS SDK for SAP ABAP – This new SDK makes it easier for ABAP developers to modernize and transform SAP-based business processes and connect to AWS services natively using the SAP ABAP language. Learn more in this blog post.
AWS CloudFormation – CloudFormation can now send event notifications via Amazon EventBridge when you create, update, or delete a stack set.
AWS Console – With the new Applications widget on the Console home, you have one-click access to applications in AWS Systems Manager Application Manager and their resources, code, and related data. From Application Manager, you can view the resources that power your application and your costs using AWS Cost Explorer.
AWS Amplify – Expands Flutter support (developer preview) to Web and Desktop for the API, Analytics, and Storage use cases. You can now build cross-platform Flutter apps with Amplify that target iOS, Android, Web, and Desktop (macOS, Windows, Linux) using a single codebase. Learn more on Flutter Web and Desktop support for AWS Amplify in this post. Amplify Hosting now supports fully managed CI/CD deployments and hosting for server-side rendered (SSR) apps built using Next.js 12 and 13. Learn more in this blog post and see how to deploy a NextJS 13 app with the AWS CDK here.
Amazon SQS – With attribute-based access control (ABAC), you can define permissions based on tags attached to users and AWS resources. With this release, you can now use tags to configure access permissions and policies for SQS queues. More details can be found in this blog.
AWS Well-Architected Framework – The latest version of the Data Analytics Lens is now available. The Data Analytics Lens is a collection of design principles, best practices, and prescriptive guidance to help you running analytics on AWS.
AWS Organizations – You can now manage accounts, organizational units (OUs), and policies within your organization using CloudFormation templates.
For a full list of AWS announcements, be sure to keep an eye on the What’s New at AWS page.
Other AWS News
A few more stuff you might have missed:
Introducing our final AWS Heroes of the year – As the end of 2022 approaches, we are recognizing individuals whose enthusiasm for knowledge-sharing has a real impact with the AWS community. Please meet them here!
The Distributed Computing Manifesto – Werner Vogles, VP & CTO at Amazon.com, shared the Distributed Computing Manifesto, a canonical document from the early days of Amazon that transformed the way we built architectures and highlights the challenges faced at the end of the 20th century.
AWS re:Post – To make this community more accessible globally, we expanded the user experience to support five additional languages. You can now interact with AWS re:Post also using Traditional Chinese, Simplified Chinese, French, Japanese, and Korean.
For AWS open-source news and updates, here’s the latest newsletter curated by Ricardo to bring you the most recent updates on open-source projects, posts, events, and more.
Upcoming AWS Events
As usual, there are many opportunities to meet:
AWS re:Invent – Our yearly event is next week from November 28 to December 2. If you can’t be there in person, get your free online pass to watch live the keynotes and the leadership sessions.
AWS Community Days – AWS Community Day events are community-led conferences to share and learn together. Join us in Sri Lanka (on December 6-7), Dubai, UAE (December 10), Pune, India (December 10), and Ahmedabad, India (December 17).
That’s all from me for this week. Next week we’ll focus on re:Invent, and then we’ll take a short break. We’ll be back with the next Week in Review on December 12!
— Danilo


 One-year anniversary of CloudFront Functions – I can’t believe it’s been