Tag Archives: Analytics

Manage users and group memberships on Amazon QuickSight using SCIM events generated in IAM Identity Center with Azure AD

Post Syndicated from Wakana Vilquin-Sakashita original https://aws.amazon.com/blogs/big-data/manage-users-and-group-memberships-on-amazon-quicksight-using-scim-events-generated-in-iam-identity-center-with-azure-ad/

Amazon QuickSight is cloud-native, scalable business intelligence (BI) service that supports identity federation. AWS Identity and Access Management (IAM) allows organizations to use the identities managed in their enterprise identity provider (IdP) and federate single sign-on (SSO) to QuickSight. As more organizations are building centralized user identity stores with all their applications, including on-premises apps, third-party apps, and applications on AWS, they need a solution to automate user provisioning into these applications and keep their attributes in sync with their centralized user identity store.

When architecting a user repository, some organizations decide to organize their users in groups or use attributes (such as department name), or a combination of both. If your organization uses Microsoft Azure Active Directory (Azure AD) for centralized authentication and utilizes its user attributes to organize the users, you can enable federation across all QuickSight accounts as well as manage users and their group membership in QuickSight using events generated in the AWS platform. This allows system administrators to centrally manage user permissions from Azure AD. Provisioning, updating, and de-provisioning users and groups in QuickSight no longer requires management in two places with this solution. This makes sure that users and groups in QuickSight stay consistent with information in Azure AD through automatic synchronization.

In this post, we walk you through the steps required to configure federated SSO between QuickSight and Azure AD via AWS IAM Identity Center (Successor to AWS Single Sign-On) where automatic provisioning is enabled for Azure AD. We also demonstrate automatic user and group membership update using a System for Cross-domain Identity Management (SCIM) event.

Solution overview

The following diagram illustrates the solution architecture and user flow.

solution architecture and user flow.

In this post, IAM Identity Center provides a central place to bring together administration of users and their access to AWS accounts and cloud applications. Azure AD is the user repository and configured as the external IdP in IAM Identity Center. In this solution, we demonstrate the use of two user attributes (department, jobTitle) specifically in Azure AD. IAM Identity Center supports automatic provisioning (synchronization) of user and group information from Azure AD into IAM Identity Center using the SCIM v2.0 protocol. With this protocol, the attributes from Azure AD are passed along to IAM Identity Center, which inherits the defined attribute for the user’s profile in IAM Identity Center. IAM Identity Center also supports identity federation with SAML (Security Assertion Markup Language) 2.0. This allows IAM Identity Center to authenticate identities using Azure AD. Users can then SSO into applications that support SAML, including QuickSight. The first half of this post focuses on how to configure this end to end (see Sign-In Flow in the diagram).

Next, user information starts to get synchronized between Azure AD and IAM Identity Center via SCIM protocol. You can automate creating a user in QuickSight using an AWS Lambda function triggered by the CreateUser SCIM event originated from IAM Identity Center, which was captured in Amazon EventBridge. In the same Lambda function, you can subsequently update the user’s membership by adding into the specified group (whose name is comprised of two user attributes: department-jobTitle, otherwise create the group if it doesn’t exist yet, prior to adding the membership.

In this post, this automation part is omitted because it would be redundant with the content discussed in the following sections.

This post explores and demonstrates an UpdateUser SCIM event triggered by the user profile update on Azure AD. The event is captured in EventBridge, which invokes a Lambda function to update the group membership in QuickSight (see Update Flow in the diagram). Because a given user is supposed to belong to only one group at a time in this example, the function will replace the user’s current group membership with the new one.

In Part I, you set up SSO to QuickSight from Azure AD via IAM Identity Center (the sign-in flow):

  1. Configure Azure AD as the external IdP in IAM Identity Center.
  2. Add and configure an IAM Identity Center application in Azure AD.
  3. Complete configuration of IAM Identity Center.
  4. Set up SCIM automatic provisioning on both Azure AD and IAM Identity Center, and confirm in IAM Identity Center.
  5. Add and configure a QuickSight application in IAM Identity Center.
  6. Configure a SAML IdP and SAML 2.0 federation IAM role.
  7. Configure attributes in the QuickSight application.
  8. Create a user, group, and group membership manually via the AWS Command Line Interface (AWS CLI) or API.
  9. Verify the configuration by logging in to QuickSight from the IAM Identity Center portal.

In Part II, you set up automation to change group membership upon an SCIM event (the update flow):

  1. Understand SCIM events and event patterns for EventBridge.
  2. Create attribute mapping for the group name.
  3. Create a Lambda function.
  4. Add an EventBridge rule to trigger the event.
  5. Verify the configuration by changing the user attribute value at Azure AD.

Prerequisites

For this walkthrough, you should have the following prerequisites:

  • IAM Identity Center. For instructions, refer to Steps 1–2 in the AWS IAM Identity Center Getting Started guide.
  • A QuickSight account subscription.
  • Basic understanding of IAM and privileges required to create an IAM IdP, roles, and policies.
  • An Azure AD subscription. You need at least one user with the following attributes to be registered in Azure AD:
    • userPrincipalName – Mandatory field for Azure AD user.
    • displayName – Mandatory field for Azure AD user.
    • Mail – Mandatory field for IAM Identity Center to work with QuickSight.
    • jobTitle – Used to allocate user to group
    • department – Used to allocate user to group.
    • givenName – Optional field.
    • surname – Optional field.

Part I: Set up SSO to QuickSight from Azure AD via IAM Identity Center

This section presents the steps to set up the sign-in flow.

Configure an external IdP as Azure AD in IAM Identity Center

To configure your external IdP, complete the following steps:

  1. On the IAM Identity Center console, choose Settings.
  2. Choose Actions on the Identity source tab, then choose Change identity source.
  3. Choose External identity provider, then choose Next.

The IdP metadata is displayed. Keep this browser tab open.

Add and configure an IAM Identity Center application in Azure AD

To set up your IAM Identity Center application, complete the following steps:

  1. Open a new browser tab.
  2. Log in to the Azure AD portal using your Azure administrator credentials.
  3. Under Azure services, choose Azure Active Directory.
  4. In the navigation pane, under Manage, choose Enterprise applications, then choose New application.
  5. In the Browse Azure AD Galley section, search for IAM Identity Center, then choose AWS IAM Identity Center (successor to AWS Single Sign-On).
  6. Enter a name for the application (in this post, we use IIC-QuickSight) and choose Create.
  7. In the Manage section, choose Single sign-on, then choose SAML.
  8. In the Assign users and groups section, choose Assign users and groups.
  9. Choose Add user/group and add at least one user.
  10. Select User as its role.
  11. In the Set up single sign on section, choose Get started.
  12. In the Basic SAML Configuration section, choose Edit, and fill out following parameters and values:
  13. Identifier – The value in the IAM Identity Center issuer URL field.
  14. Reply URL – The value in the IAM Identity Center Assertion Consumer Service (ACS) URL field.
  15. Sign on URL – Leave blank.
  16. Relay State – Leave blank.
  17. Logout URL – Leave blank.
  18. Choose Save.

The configuration should look like the following screenshot.

configuration

  1. In the SAML Certificates section, download the Federation Metadata XML file and the Certificate (Raw) file.
    Federation Metadata XML file and the Certificate (Raw) file

You’re all set with Azure AD SSO configuration at this moment. Later on, you’ll return to this page to configure automated provisioning, so keep this browser tab open.

Complete configuration of IAM Identity Center

Complete your IAM Identity Center configuration with the following steps:

  1. Go back to the browser tab for IAM Identity Center console which you have kept open in previous step.
  2. For IdP SAML metadata under the Identity provider metadata section, choose Choose file.
  3. Choose the previously downloaded metadata file (IIC-QuickSight.xml).
  4. For IdP certificate under the Identity provider metadata section, choose Choose file.
  5. Choose the previously downloaded certificate file (IIC-QuickSight.cer).
  6. Choose Next.
  7. Enter ACCEPT, then choose Change Identity provider source.

Set up SCIM automatic provisioning on both Azure AD and IAM Identity Center

Your provisioning method is still set as Manual (non-SCIM). In this step, we enable automatic provisioning so that IAM Identity Center becomes aware of the users, which allows identity federation to QuickSight.

  1. In the Automatic provisioning section, choose Enable.
    choose Enable
  2. Choose Access token to show your token.
    access token
  3. Go back to the browser tab (Azure AD), which you kept open in Step 1.
  4. In the Manage section, choose Enterprise applications.
  5. Choose IIC-QuickSight, then choose Provisioning.
  6. Choose Automatic in Provisioning Mode and enter the following values:
  7. Tenant URL – The value in the SCIM endpoint field.
  8. Secret Token – The value in the Access token field.
  9. Choose Test Connection.
  10. After the test connection is successfully complete, set Provisioning Status to On.
    set Provisioning Status to On
  11. Choose Save.
  12. Choose Start provisioning to start automatic provisioning using the SCIM protocol.

When provisioning is complete, it will result in propagating one or more users from Azure AD to IAM Identity Center. The following screenshot shows the users that were provisioned in IAM Identity Center.

the users that were provisioned in IAM Identity Center

Note that upon this SCIM provisioning, the users in QuickSight should be created using the Lambda function triggered by the event originated from IAM Identity Center. In this post, we create a user and group membership via the AWS CLI (Step 8).

Add and configure a QuickSight application in IAM Identity Center

In this step, we create a QuickSight application in IAM Identity Center. You also configure an IAM SAML provider, role, and policy for the application to work. Complete the following steps:

  1. On the IAM Identity Center console, on the Applications page, choose Add Application.
  2. For Pre-integrated application under Select an application, enter quicksight.
  3. Select Amazon QuickSight, then choose Next.
  4. Enter a name for Display name, such as Amazon QuickSight.
  5. Choose Download under IAM Identity Center SAML metadata file and save it in your computer.
  6. Leave all other fields as they are, and save the configuration.
  7. Open the application you’ve just created, then choose Assign Users.

The users provisioned via SCIM earlier will be listed.

  1. Choose all of the users to assign to the application.

Configure a SAML IdP and a SAML 2.0 federation IAM role

To set up your IAM SAML IdP for IAM Identity Center and IAM role, complete the following steps:

  1. On the IAM console, in the navigation pane, choose Identity providers, then choose Add provider.
  2. Choose SAML as Provider type, and enter Azure-IIC-QS as Provider name.
  3. Under Metadata document, choose Choose file and upload the metadata file you downloaded earlier.
  4. Choose Add provider to save the configuration.
  5. In the navigation pane, choose Roles, then choose Create role.
  6. For Trusted entity type, select SAML 2.0 federation.
  7. For Choose a SAML 2.0 provider, select the SAML provider that you created, then choose Allow programmatic and AWS Management Console access.
  8. Choose Next.
  9. On the Add Permission page, choose Next.

In this post, we create QuickSight users via an AWS CLI command, therefore we’re not creating any permission policy. However, if the self-provisioning feature in QuickSight is required, the permission policy for the CreateReader, CreateUser, and CreateAdmin actions (depending on the role of the QuickSight users) is required.

  1. On the Name, review, and create page, under Role details, enter qs-reader-azure for the role.
  2. Choose Create role.
  3. Note the ARN of the role.

You use the ARN to configure attributes in your IAM Identity Center application.

Configure attributes in the QuickSight application

To associate the IAM SAML IdP and IAM role to the QuickSight application in IAM Identity Center, complete the following steps:

  1. On the IAM Identity Center console, in the navigation pane, choose Applications.
  2. Select the Amazon QuickSight application, and on the Actions menu, choose Edit attribute mappings.
  3. Choose Add new attribute mapping.
  4. Configure the mappings in the following table.
User attribute in the application Maps to this string value or user attribute in IAM Identity Center
Subject ${user:email}
https://aws.amazon.com/SAML/Attributes/RoleSessionName ${user:email}
https://aws.amazon.com/SAML/Attributes/Role arn:aws:iam::<ACCOUNTID>:role/qs-reader-azure,arn:aws:iam::<ACCOUNTID>:saml-provider/Azure-IIC-QS
https://aws.amazon.com/SAML/Attributes/PrincipalTag:Email ${user:email}

Note the following values:

  • Replace <ACCOUNTID> with your AWS account ID.
  • PrincipalTag:Email is for the email syncing feature for self-provisioning users that need to be enabled on the QuickSight admin page. In this post, don’t enable this feature because we register the user with an AWS CLI command.
  1. Choose Save changes.

Create a user, group, and group membership with the AWS CLI

As described earlier, users and groups in QuickSight are being created manually in this solution. We create them via the following AWS CLI commands.

The first step is to create a user in QuickSight specifying the IAM role created earlier and email address registered in Azure AD. The second step is to create a group with the group name as combined attribute values from Azure AD for the user created in the first step. The third step is to add the user into the group created earlier; member-name indicates the user name created in QuickSight that is comprised of <IAM Role name>/<session name>. See the following code:

aws quicksight register-user \
--aws-account-id <ACCOUNTID> --namespace default \
--identity-type IAM --email <email registered in Azure AD> \
--user-role READER --iam-arn arn:aws:iam::<ACCOUNTID>:role/qs-reader-azure \
--session-name <email registered in Azure AD>

 aws quicksight create-group \
--aws-account-id <ACCOUNTID> --namespace default \
--group-name Marketing-Specialist

 aws quicksight create-group-membership \
--aws-account-id <ACCOUNTID> --namespace default \
--member-name qs-reader-azure/<email registered in Azure AD> \
–-group-name Marketing-Specialist

At this point, the end-to-end configuration of Azure AD, IAM Identity Center, IAM, and QuickSight is complete.

Verify the configuration by logging in to QuickSight from the IAM Identity Center portal

Now you’re ready to log in to QuickSight using the IdP-initiated SSO flow:

  1. Open a new private window in your browser.
  2. Log in to the IAM Identity Center portal (https://d-xxxxxxxxxx.awsapps.com/start).

You’re redirected to the Azure AD login prompt.

  1. Enter your Azure AD credentials.

You’re redirected back to the IAM Identity Center portal.

  1. In the IAM Identity Center portal, choose Amazon QuickSight.

IAM Identity Center portal, choose Amazon QuickSight

You’re automatically redirected to your QuickSight home.
automatically redirected to your QuickSight home

Part II: Automate group membership change upon SCIM events

In this section, we configure the update flow.

Understand the SCIM event and event pattern for EventBridge

When an Azure AD administrator makes any changes to the attributes on the particular user profile, the change will be synced with the user profile in IAM Identity Center via SCIM protocol, and the activity is recorded in an AWS CloudTrail event called UpdateUser by sso-directory.amazonaws.com (IAM Identity Center) as the event source. Similarly, the CreateUser event is recorded when a user is created on Azure AD, and the DisableUser event is for when a user is disabled.

The following screenshot on the  Event history page shows two CreateUser events: one is recorded by IAM Identity Center, and the other one is by QuickSight. In this post, we use the one from IAM Identity Center.

CloudTrail console

In order for EventBridge to be able to handle the flow properly, each event must specify the fields of an event that you want the event pattern to match. The following event pattern is an example of the UpdateUser event generated in IAM Identity Center upon SCIM synchronization:

{
  "source": ["aws.sso-directory"],
  "detail-type": ["AWS API Call via CloudTrail"],
  "detail": {
    "eventSource": ["sso-directory.amazonaws.com"],
    "eventName": ["UpdateUser"]
  }
}

In this post, we demonstrate an automatic update of group membership in QuickSight that is triggered by the UpdateUser SCIM event.

Create attribute mapping for the group name

In order for the Lambda function to manage group membership in QuickSight, it must obtain the two user attributes (department and jobTitle). To make the process simpler, we’re combining two attributes in Azure AD (department, jobTitle) into one attribute in IAM Identity Center (title), using the attribute mappings feature in Azure AD. IAM Identity Center then uses the title attribute as a designated group name for this user.

  1. Log in to the Azure AD console, navigate to Enterprise Applications, IIC-QuickSight, and Provisioning.
  2. Choose Edit attribute mappings.
  3. Under Mappings, choose Provision Azure Active Directory Users.
    Azure AD console, Under mappings
  4. Choose jobTitle from the list of Azure Active Directory Attributes.
  5. Change the following settings:
    1. Mapping TypeExpression
    2. ExpressionJoin("-", [department], [jobTitle])
    3. Target attribute title
      update settings
  6. Choose Save.
  7. You can leave the provisioning page.

The attribute is automatically updated in IAM Identity Center. The updated user profile looks like the following screenshots (Azure AD on the left, IAM Identity Center on the right).

updated user profile
Job related information

Create a Lambda function

Now we create a Lambda function to update QuickSight group membership upon the SCIM event. The core part of the function is to obtain the user’s title attribute value in IAM Identity Center based on the triggered event information, and then to ensure that the user exists in QuickSight. If the group name doesn’t exist yet, it creates the group in QuickSight and then adds the user into the group. Complete the following steps:

  1. On the Lambda console, choose Create function.
  2. For Name, enter UpdateQuickSightUserUponSCIMEvent.
  3. For Runtime, choose Python 3.9.
  4. For Time Out, set to 15 seconds.
  5. For Permissions, create and attach an IAM role that includes the following permissions (the trusted entity (principal) should be lambda.amazonaws.com):
    {
        "Version": "2012-10-17",
        "Statement": [
            {
                "Sid": "MinimalPrivForScimQsBlog",
                "Effect": "Allow",
                "Action": [
                    "identitystore:DescribeUser",
                    "quicksight:RegisterUser",
                    "quicksight:DescribeUser",
                    "quicksight:CreateGroup",
                    "quicksight:DeleteGroup",
                    "quicksight:DescribeGroup",
                    "quicksight:ListUserGroups",
                    "quicksight:CreateGroupMembership",
                    "quicksight:DeleteGroupMembership",
                    "quicksight:DescribeGroupMembership",
                    "logs:CreateLogGroup",
                    "logs:CreateLogStream",
                    "logs:PutLogEvents"
                ],
                "Resource": "*"
            }
        ]
    }

  6. Write Python code using the Boto3 SDK for IdentityStore and QuickSight. The following is the entire sample Python code:
import sys
import boto3
import json
import logging
from time import strftime
from datetime import datetime

# Set logging
logger = logging.getLogger()
logger.setLevel(logging.INFO)

def lambda_handler(event, context):
  '''
  Modify QuickSight group membership upon SCIM event from IAM Identity Center originated from Azure AD.
  It works in this way:
    Azure AD -> SCIM -> Identity Center -> CloudTrail -> EventBridge -> Lambda -> QuickSight
  Note that this is a straightforward sample to show how to update QuickSight group membership upon certain SCIM event.
  For example, it assumes that 1:1 user-to-group assigmnent, only one (combined) SAML attribute, etc. 
  For production, take customer requirements into account and develop your own code.
  '''

  # Setting variables (hard-coded. get dynamically for production code)
  qs_namespace_name = 'default'
  qs_iam_role = 'qs-reader-azure'

  # Obtain account ID and region
  account_id = boto3.client('sts').get_caller_identity()['Account']
  region = boto3.session.Session().region_name

  # Setup clients
  qs = boto3.client('quicksight')
  iic = boto3.client('identitystore')

  # Check boto3 version
  logger.debug(f"## Your boto3 version: {boto3.__version__}")

  # Get user info from event data
  event_json = json.dumps(event)
  logger.debug(f"## Event: {event_json}")
  iic_store_id = event['detail']['requestParameters']['identityStoreId']
  iic_user_id = event['detail']['requestParameters']['userId']  # For UpdateUser event, userId is provided through requestParameters
  logger.info("## Getting user info from Identity Store.")
  try:
    res_iic_describe_user = iic.describe_user(
      IdentityStoreId = iic_store_id,
      UserId = iic_user_id
    )
  except Exception as e:
    logger.error("## Operation failed due to unknown error. Exiting.")
    logger.error(e)
    sys.exit()
  else:
    logger.info(f"## User info retrieval succeeded.")
    azure_user_attribute_title = res_iic_describe_user['Title']
    azure_user_attribute_userprincipalname = res_iic_describe_user['UserName']
    qs_user_name = qs_iam_role + "/" + azure_user_attribute_userprincipalname
    logger.info(f"#### Identity Center user name: {azure_user_attribute_userprincipalname}")
    logger.info(f"#### QuickSight group name desired: {azure_user_attribute_title}")
    logger.debug(f"#### res_iic_describe_user: {json.dumps(res_iic_describe_user)}, which is {type(res_iic_describe_user)}")

  # Exit if user is not present since this function is supposed to be called by UpdateUser event
  try:
    # Get QuickSight user name
    res_qs_describe_user = qs.describe_user(
      UserName = qs_user_name,
      AwsAccountId = account_id,
      Namespace = qs_namespace_name
    )
  except qs.exceptions.ResourceNotFoundException as e:
    logger.error(f"## User {qs_user_name} is not found in QuickSight.")
    logger.error(f"## Make sure the QuickSight user has been created in advance. Exiting.")
    logger.error(e)
    sys.exit()
  except Exception as e:
    logger.error("## Operation failed due to unknown error. Exiting.")
    logger.error(e)
    sys.exit()
  else:
    logger.info(f"## User {qs_user_name} is found in QuickSight.")

  # Remove current membership unless it's the desired one
  qs_new_group = azure_user_attribute_title  # Set "Title" SAML attribute as the desired QuickSight group name
  in_desired_group = False  # Set this flag True when the user is already a member of the desired group
  logger.info(f"## Starting group membership removal.")
  try:
    res_qs_list_user_groups = qs.list_user_groups(
      UserName = qs_user_name,
      AwsAccountId = account_id,
      Namespace = qs_namespace_name
    )
  except Exception as e:
    logger.error("## Operation failed due to unknown error. Exiting.")
    logger.error(e)
    sys.exit()
  else:
    # Skip if the array is empty (user is not member of any groups)
    if not res_qs_list_user_groups['GroupList']:
      logger.info(f"## User {qs_user_name} is not a member of any QuickSight group. Skipping removal.")
    else:
      for grp in res_qs_list_user_groups['GroupList']:
        qs_current_group = grp['GroupName']
        # Retain membership if the new and existing group names match
        if qs_current_group == qs_new_group:
          logger.info(f"## The user {qs_user_name} already belong to the desired group. Skipping removal.")
          in_desired_group = True
        else:
          # Remove all unnecessary memberships
          logger.info(f"## Removing user {qs_user_name} from existing group {qs_current_group}.")
          try:
            res_qs_delete_group_membership = qs.delete_group_membership(
              MemberName = qs_user_name,
              GroupName = qs_current_group,
              AwsAccountId = account_id,
              Namespace = qs_namespace_name
            )
          except Exception as e:
            logger.error(f"## Operation failed due to unknown error. Exiting.")
            logger.error(e)
            sys.exit()
          else:
            logger.info(f"## The user {qs_user_name} has removed from {qs_current_group}.")

  # Create group membership based on IIC attribute "Title"
  logger.info(f"## Starting group membership assignment.")
  if in_desired_group is True:
      logger.info(f"## The user already belongs to the desired one. Skipping assignment.")
  else:
    try:
      logger.info(f"## Checking if the desired group exists.")
      res_qs_describe_group = qs.describe_group(
        GroupName = qs_new_group,
        AwsAccountId = account_id,
        Namespace = qs_namespace_name
      )
    except qs.exceptions.ResourceNotFoundException as e:
      # Create a QuickSight group if not present
      logger.info(f"## Group {qs_new_group} is not present. Creating.")
      today = datetime.now()
      res_qs_create_group = qs.create_group(
        GroupName = qs_new_group,
        Description = 'Automatically created at ' + today.strftime('%Y.%m.%d %H:%M:%S'),
        AwsAccountId = account_id,
        Namespace = qs_namespace_name
      )
    except Exception as e:
      logger.error(f"## Operation failed due to unknown error. Exiting.")
      logger.error(e)
      sys.exit()
    else:
      logger.info(f"## Group {qs_new_group} is found in QuickSight.")

    # Add the user to the desired group
    logger.info("## Modifying group membership based on its latest attributes.")
    logger.info(f"#### QuickSight user name: {qs_user_name}")
    logger.info(f"#### QuickSight group name: {qs_new_group}")
    try: 
      res_qs_create_group_membership = qs.create_group_membership(
        MemberName = qs_user_name,
        GroupName = qs_new_group,
        AwsAccountId = account_id,
        Namespace = qs_namespace_name
    )
    except Exception as e:
      logger.error("## Operation failed due to unknown error. Exiting.")
      logger.error(e)
    else:
      logger.info("## Group membership modification succeeded.")
      qs_group_member_name = res_qs_create_group_membership['GroupMember']['MemberName']
      qs_group_member_arn = res_qs_create_group_membership['GroupMember']['Arn']
      logger.debug("## QuickSight group info:")
      logger.debug(f"#### qs_user_name: {qs_user_name}")
      logger.debug(f"#### qs_group_name: {qs_new_group}")
      logger.debug(f"#### qs_group_member_name: {qs_group_member_name}")
      logger.debug(f"#### qs_group_member_arn: {qs_group_member_arn}")
      logger.debug("## IIC info:")
      logger.debug(f"#### IIC user name: {azure_user_attribute_userprincipalname}")
      logger.debug(f"#### IIC user id: {iic_user_id}")
      logger.debug(f"#### Title: {azure_user_attribute_title}")
      logger.info(f"## User {qs_user_name} has been successfully added to the group {qs_new_group} in {qs_namespace_name} namespace.")
  
  # return response
  return {
    "namespaceName": qs_namespace_name,
    "userName": qs_user_name,
    "groupName": qs_new_group
  }

Note that this Lambda function requires Boto3 1.24.64 or later. If the Boto3 included in the Lambda runtime is older than this, use a Lambda layer to use the latest version of Boto3. For more details, refer to How do I resolve “unknown service”, “parameter validation failed”, and “object has no attribute” errors from a Python (Boto 3) Lambda function.

Add an EventBridge rule to trigger the event

To create an EventBridge rule to invoke the previously created Lambda function, complete the following steps:

  1. On the EventBridge console, create a new rule.
  2. For Name, enter updateQuickSightUponSCIMEvent.
  3. For Event pattern, enter the following code:
    {
      "source": ["aws.sso-directory"],
      "detail-type": ["AWS API Call via CloudTrail"],
      "detail": {
        "eventSource": ["sso-directory.amazonaws.com"],
        "eventName": ["UpdateUser"]
      }
    }

  4. For Targets, choose the Lambda function you created (UpdateQuickSightUserUponSCIMEvent).
  5. Enable the rule.

Verify the configuration by changing a user attribute value at Azure AD

Let’s modify a user’s attribute at Azure AD, and then check if the new group is created and that the user is added into the new one.

  1. Go back to the Azure AD console.
  2. From Manage, click Users.
  3. Choose one of the users you previously used to log in to QuickSight from the IAM Identity Center portal.
  4. Choose Edit properties, then edit the values for Job title and Department.
    Edit Properties
  5. Save the configuration.
  6. From Manage, choose Enterprise application, your application name, and Provisioning.
  7. Choose Stop provisioning and then Start provisioning in sequence.

In Azure AD, the SCIM provisioning interval is fixed to 40 minutes. To get immediate results, we manually stop and start the provisioning.

Provisioning status

  1. Navigate to the QuickSight console.
  2. On the drop-down user name menu, choose Manage QuickSight.
  3. Choose Manage groups.

Now you should find that the new group is created and the user is assigned to this group.

new group is created and the user is assigned to this group

Clean up

When you’re finished with the solution, clean up your environment to minimize cost impact. You may want to delete the following resources:

  • Lambda function
  • Lambda layer
  • IAM role for the Lambda function
  • CloudWatch log group for the Lambda function
  • EventBridge rule
  • QuickSight account
    • Note : There can only be one QuickSight account per AWS account. So your QuickSight account might already be used by other users in your organization. Delete the QuickSight account only if you explicitly set it up to follow this blog and are absolutely sure that it is not being used by any other users.
  • IAM Identity Center instance
  • IAM ID Provider configuration for Azure AD
  • Azure AD instance

Summary

This post provided step-by-step instructions to configure IAM Identity Center SCIM provisioning and SAML 2.0 federation from Azure AD for centralized management of QuickSight users. We also demonstrated automated group membership updates in QuickSight based on user attributes in Azure AD, by using SCIM events generated in IAM Identity Center and setting up automation with EventBridge and Lambda.

With this event-driven approach to provision users and groups in QuickSight, system administrators can have full flexibility in where the various different ways of user management could be expected depending on the organization. It also ensures the consistency of users and groups between QuickSight and Azure AD whenever a user accesses QuickSight.

We are looking forward to hearing any questions or feedback.


About the authors

Takeshi Nakatani is a Principal Bigdata Consultant on Professional Services team in Tokyo. He has 25 years of experience in IT industry, expertised in architecting data infrastructure. On his days off, he can be a rock drummer or a motorcyclyst.

Wakana Vilquin-Sakashita is Specialist Solution Architect for Amazon QuickSight. She works closely with customers to help making sense of the data through visualization. Previously Wakana worked for S&P Global  assisting customers to access data, insights and researches relevant for their business.

AWS Week in Review – March 20, 2023

Post Syndicated from Danilo Poccia original https://aws.amazon.com/blogs/aws/aws-week-in-review-march-20-2023/

This post is part of our Week in Review series. Check back each week for a quick roundup of interesting news and announcements from AWS!

A new week starts, and Spring is almost here! If you’re curious about AWS news from the previous seven days, I got you covered.

Last Week’s Launches
Here are the launches that got my attention last week:

Picture of an S3 bucket and AWS CEO Adam Selipsky.Amazon S3 – Last week there was AWS Pi Day 2023 celebrating 17 years of innovation since Amazon S3 was introduced on March 14, 2006. For the occasion, the team released many new capabilities:

Amazon Linux 2023 – Our new Linux-based operating system is now generally available. Sébastien’s post is full of tips and info.

Application Auto Scaling – Now can use arithmetic operations and mathematical functions to customize the metrics used with Target Tracking policies. You can use it to scale based on your own application-specific metrics. Read how it works with Amazon ECS services.

AWS Data Exchange for Amazon S3 is now generally available – You can now share and find data files directly from S3 buckets, without the need to create or manage copies of the data.

Amazon Neptune – Now offers a graph summary API to help understand important metadata about property graphs (PG) and resource description framework (RDF) graphs. Neptune added support for Slow Query Logs to help identify queries that need performance tuning.

Amazon OpenSearch Service – The team introduced security analytics that provides new threat monitoring, detection, and alerting features. The service now supports OpenSearch version 2.5 that adds several new features such as support for Point in Time Search and improvements to observability and geospatial functionality.

AWS Lake Formation and Apache Hive on Amazon EMR – Introduced fine-grained access controls that allow data administrators to define and enforce fine-grained table and column level security for customers accessing data via Apache Hive running on Amazon EMR.

Amazon EC2 M1 Mac Instances – You can now update guest environments to a specific or the latest macOS version without having to tear down and recreate the existing macOS environments.

AWS Chatbot – Now Integrates With Microsoft Teams to simplify the way you troubleshoot and operate your AWS resources.

Amazon GuardDuty RDS Protection for Amazon Aurora – Now generally available to help profile and monitor access activity to Aurora databases in your AWS account without impacting database performance

AWS Database Migration Service – Now supports validation to ensure that data is migrated accurately to S3 and can now generate an AWS Glue Data Catalog when migrating to S3.

AWS Backup – You can now back up and restore virtual machines running on VMware vSphere 8 and with multiple vNICs.

Amazon Kendra – There are new connectors to index documents and search for information across these new content: Confluence Server, Confluence Cloud, Microsoft SharePoint OnPrem, Microsoft SharePoint Cloud. This post shows how to use the Amazon Kendra connector for Microsoft Teams.

For a full list of AWS announcements, be sure to keep an eye on the What’s New at AWS page.

Other AWS News
A few more blog posts you might have missed:

Example of a geospatial query.Women founders Q&A – We’re talking to six women founders and leaders about how they’re making impacts in their communities, industries, and beyond.

What you missed at that 2023 IMAGINE: Nonprofit conference – Where hundreds of nonprofit leaders, technologists, and innovators gathered to learn and share how AWS can drive a positive impact for people and the planet.

Monitoring load balancers using Amazon CloudWatch anomaly detection alarms – The metrics emitted by load balancers provide crucial and unique insight into service health, service performance, and end-to-end network performance.

Extend geospatial queries in Amazon Athena with user-defined functions (UDFs) and AWS Lambda – Using a solution based on Uber’s Hexagonal Hierarchical Spatial Index (H3) to divide the globe into equally-sized hexagons.

How cities can use transport data to reduce pollution and increase safety – A guest post by Rikesh Shah, outgoing head of open innovation at Transport for London.

For AWS open-source news and updates, here’s the latest newsletter curated by Ricardo to bring you the most recent updates on open-source projects, posts, events, and more.

Upcoming AWS Events
Here are some opportunities to meet:

AWS Public Sector Day 2023 (March 21, London, UK) – An event dedicated to helping public sector organizations use technology to achieve more with less through the current challenging conditions.

Women in Tech at Skills Center Arlington (March 23, VA, USA) – Let’s celebrate the history and legacy of women in tech.

The AWS Summits season is warming up! You can sign up here to know when registration opens in your area.

That’s all from me for this week. Come back next Monday for another Week in Review!

Danilo

Accelerating revenue growth with real-time analytics: Poshmark’s journey

Post Syndicated from Mahesh Pasupuleti original https://aws.amazon.com/blogs/big-data/accelerating-revenue-growth-with-real-time-analytics-poshmarks-journey/

This post was co-written by Mahesh Pasupuleti and Gaurav Shah from Poshmark.

Poshmark is a leading social marketplace for new and secondhand styles for women, men, kids, pets, home, and more. By combining the human connection of physical shopping with the scale, ease, and selection benefits of Ecommerce, Poshmark makes buying and selling simple, social, and sustainable. Its community of more than 80 million registered users across the US, Canada, Australia, and India is driving a more sustainable future for the fashion industry.

An important goal to achieve for any organization is to grow the top line revenue. Top line revenue refers to the total value of sales of an organization’s services or products. The two main approaches organizations employ to increase revenue are to expand geographically to enter new markets and to increase market share within a market by improving customer experience (CX).

Improving CX is a well-known guideline to attract and retain customers and thereby increase the market share. In this post, we share how Poshmark improved CX and accelerated revenue growth by using a real-time analytics solution. We discuss how to create such a solution using Amazon Kinesis Data Streams, Amazon Managed Streaming for Kafka (Amazon MSK), Amazon Kinesis Data Analytics for Apache Flink; the design decisions that went into the architecture; and the observed business benefits by Poshmark.

High-level challenge: The need for real-time analytics

Previous efforts at Poshmark for improving CX through analytics were based on batch processing of analytics data and using it on a daily basis to improve CX. Although these batch analytics-based efforts were successful to some extent, they saw opportunities to improve the customer experience with real-time personalization and security guidance during the customer’s interaction with the Poshmark app. The customer insights gathered from the batch analytics couldn’t be paired with the current customer activities in real time due to the latencies involved in enriching the current activities with the knowledge gained through batch processes. Therefore, the opportunity to provide tailored offers or showcase products based on customers’ preference and behaviors in near-real time, which contributes to a much better customer experience, was missing. Similarly, the opportunity to catch fraud within a second, before checkout, was also missing.

To improve the customer experience, Poshmark decided to invest in building a real-time analytics platform to enable real-time capabilities, as explained further in this post. Poshmark engineers worked closely with AWS architects through the AWS Data Lab program. The AWS Data Lab offers accelerated, joint engineering engagements between customers and AWS technical resources to create tangible deliverables that accelerate data and analytics modernization initiatives. The Design Lab is one half to two day engagement with customer team offering prescriptive guidance to arrive at the optimal solution architecture design before you embark on building the platform.

Designing the solution architecture through the AWS Data Lab process

The business and technical stakeholders from Poshmark and the AWS Data Lab architects discussed near-to-long-term business requirements along with the functional and non-functional capabilities required to decide on the architecture approach. They reviewed the current state architecture and constraints to understand data flow and technical integration points. The joint team discussed the pros and cons of various AWS services that already exist in Poshmark’s current architecture, as well as other AWS services that can meet the requirements.

Poshmark wanted to address the following business use cases via the real-time analytics platform:

  • Sessionization – Poshmark captures both server-side application events and client-side tracking events. They wanted to use these events to identify and analyze user sessions to track behavior.
  • Illegitimate sign-up and sign-in prevention – Poshmark wanted to detect and ban illegitimate sign-up or sign-in events from bots or non-human traffic in real time on the Poshmark application.
  • IP translation – The IP addresses present in events will be translated to city, state, and zip, and enriched with other information to implement near-real-time, location-aware services encompassing security-related functions as well as personalization functions.
  • Anonymization – Poshmark wanted to anonymize events and make the data available for internal users for querying in near-real time.
  • Personalized recommendations – User behavior based on clickstream events can be captured up to the last second before enriching it for personalization and sending it to the model to predict the recommendations.
  • Other use cases – Additional use cases relating to aggregations and machine learning (ML) inference use cases such as authorization to operate, listing spam detection, and avoiding account takeovers (ATOs), among others.

One common pattern identified for these use cases was the need for a central data enrichment pipeline to enrich incoming raw events before event data can be utilized for actual business processing. In the Design Lab, we focused on design for data enrichment pipelines aimed at enriching events with data from static files, dynamic data stores such as databases, APIs, or within the same event stream for the aforementioned streaming use cases. Later in this post, we cover the salient points discussed during the lab around design and architecture.

Batch analytics solution architecture

The following diagram shows the previous architecture at Poshmark. For brevity, only the flow pertaining to the real-time analytics platform is explained.

User interactions on Poshmark web and mobile applications generate server-side events. These events include add to cart, orders, transactions, and more on application servers, and the page view, clicks, and more on tracking servers. Fluentd with an Amazon Kinesis plugin is set up on both the application and tracking servers to send these events to Amazon Kinesis Data Streams. The Fluentd Kinesis plugin aggregates events before sending to Kinesis Data Streams. A single Kinesis data stream is currently set up to capture these events. A random partition key is configured in Fluentd for the events to allow even distribution of events across shards. The event data format is nested JSON. Poshmark maintains the same schema grammar at the first level of JSON for both server-side and client-side server events. The attributes at nested level can differ between server-side and client-side events.

Poshmark receives around 1 billion events per day (100 million per hour during peak hours, 10 million per hour during non-peak hours). The average size of the event record is 1.2 KB.

The data from the Kinesis data stream is consumed by two applications:

  • A Spark streaming application on Amazon EMR is used to write data from the Kinesis data stream to a data lake hosted on Amazon Simple Storage Service (Amazon S3) in a partitioned way. The data from the S3 data lake is used for batch processing and analytics through Amazon EMR and Amazon Redshift.
  • Druid hosted on Amazon Elastic Compute Cloud (Amazon EC2) integrates with the Kinesis data stream for streaming ingestion and allows users to run slice-and-dice OLAP queries. Operational dashboards are hosted on Grafana integrated with Druid.

Desired enhancements to the initial solution

The use cases discussed during the architecture sessions fall into one or more combinations of the following stream processing requirements:

  • Stateless event processing – For example, near-real-time anonymization.
  • External lookup – Looking up a value from external stores. For example, IP address, city, zip, state, or ID.
  • Stateful data processing – Accessing past events or aggregations or ML inferences.

To meet these requirements, the streaming platform is divided into two layers:

  • Central data enrichment – This layer runs enrichments commonly required by downstream streaming applications. This will help avoid replication of the same enrichment logic in each application and enable better operational maintenance. The enrichment should strive for per-record processing in most cases.
  • Specific streaming applications – This layer will house specific streaming applications with respect to use cases and utilize enriched data from the central data enrichment pipeline.

For central data enrichment, we made the following enhancements to the platform:

  • The total latency including ingestion and data enrichment was super critical and should be in the range of double-digit millisecond latency based on the overall latency budget of Poshmark to achieve real-time ML responses to events. The absolute lowest ingestion latency was achieved by Kafka, and the team decided to go with the managed version of Kafka, Amazon MSK.
  • Similarly, low-latency processing of data is also required, and appropriate framework should be considered accordingly.
  • Exactly-once delivery guarantees were required to avoid data duplication resulting in wrong calculations.
  • The enrichment source could be any source such as static files, databases, and APIs and latencies can vary between them. A number of server-side and client-side events are generated when a user interacts with a Poshmark application. As a result, the same information from the enrichment source is required to enrich each event. This frequently accessed information cached in a centralized cache will optimize fetch time.

Design decisions for the new solution

Poshmark made the following design decisions for central data enrichment:

  • Kafka can support double-digit millisecond latency from producer to consumer with appropriate performance tuning. Kafka can provide exactly-once semantics both at producers and consumer applications. AWS provides Kafka as part of its Amazon MSK offering, eliminating the operational overhead of maintaining and running Kafka cluster infrastructure on AWS, thereby allowing you to focus on developing and running Kafka-based applications. Poshmark decided to use Amazon MSK for their streaming ingestion and storage requirements.
  • We also decided to use Flink for streaming data enrichment applications for the following reasons:
    • Flink can provide low-latency processing even at higher throughput with exactly-once guarantees. Spark Structured Streaming on the other hand can provide low latency with low throughput due to microbatch-based processing. Spark Structured Streaming continuous processing is an experimental feature and provides at-least once guarantees.
    • The enrichment requests call to an external store if modeled in a map function (Spark’s map API or Flink’s MapFunction API) will make synchronous calls to the external store. The call will wait for a response from the external store before processing the next event, adding to delays and reducing overall throughput. The asynchronous interaction will allow sending requests and receiving responses concurrently from external stores. This will reduce wait time and improve overall throughput. Flink supports async I/O operators natively, allowing users to use asynchronous request clients with data streams. The API handles the integration with data streams, well as handling order, event time, fault tolerance, and more. Spark Structured Streaming doesn’t provide any such support natively and leaves it to users for custom implementation.
    • Poshmark selected Kinesis Data Analytics for Apache Flink to run the data enrichment application. Kinesis Data Analytics for Apache Flink provides the underlying infrastructure for your Apache Flink applications. It handles core capabilities like provisioning compute resources, parallel computation, automatic scaling, and application backups (implemented as checkpoints and snapshots).
  • An enrichment microservice accompanying Amazon ElastiCache for Redis was set up to abstract access from data enrichment applications. The AsyncFunction in the Flink async I/O operator isn’t multi-threaded and won’t work in a truly asynchronous way if the call is blocked or waiting for a response. The enrichment microservice handles requests and responses asynchronously coming from Flink async I/O operators. The data is also cached in ElastiCache for Redis to improve the latency of the microservice.
  • The Poshmark ML applications are the consumers of this enriched data. The team has built and deployed different ML models over time. These models include a learning to rank algorithm, fraud detection, personalization and recommendations, and online spam filtering. Previously, for deploying each model into production, the Poshmark team had to go through a series of infrastructure setup steps that involved data extraction from real-time sources, building real-time aggregate features from streaming data, storing these features in a low-latency database (Redis) for sub-millisecond inferences, and finally performing inferences via Amazon SageMaker hosted endpoints.
  • We also designed an ML feature storage pipeline that consumes data from the enriched streaming sources (Kinesis or Kafka), generate single-level and aggregated-level features, and ingest these generated features into a feature store repository with a very low latency of less than 80 milliseconds.
  • The ML models are now able to extract the needed features with latency less than 10 milliseconds from the feature repository and perform real-time model inferencing.

Real-time analytics solution architecture

The following diagram illustrates the solution architecture for real-time analytics with Amazon MSK and Kinesis Data Analytics for Apache Flink.

The workflow is as follows:

  1. Users interact on Poshmark’s web or mobile application.
  2. Server-side events are captured on application servers and client-side events are captured on tracking servers. These events are written in the downstream MSK cluster.
  3. The raw events will be ingested into the MSK cluster using the Fluentd plugin to produce data for Kafka.
  4. The enrichment microservice consists of reactive (asynchronous) enrichment lookup APIs fetching data from persistent data stores. ElastiCache for Redis caches frequently accessed data, reducing fetch time for enrichment lookup APIs.
  5. The Flink application running on Kinesis Data Analytics for Apache Flink consumes raw events from Amazon MSK and runs data enrichment on a per-record basis. The Flink data enrichment application uses Flink’s async I/O to read external data from the enrichment lookup store for enriching stream events.
  6. Enriched events are written in the MSK cluster under different enriched events topics.
  7. The existing Spark streaming application consumes from the enriched events topic (or raw events topic) in Amazon MSK and writes the data into an S3 data lake.
  8. Druid streaming ingestion now reads from the enriched events topic or raw events topic in Amazon MSK depending on the requirements.

Enrichment of the captured event data

In this section, we discuss the different steps to enrich the captured event data.

Enrichment processing

Kinesis Data Analytics for Apache Flink provides the underlying infrastructure for the Apache Flink applications. It handles core capabilities like provisioning compute resources, parallel computation, automatic scaling, and application backups (implemented as checkpoints and snapshots). You can use the high-level Flink programming features (such as operators, functions, sources, and sinks) in the same way that you use them when hosting the Flink infrastructure yourself.

Flink on Amazon EMR gives the flexibility to choose your Flink version, installation, configuration, instances, and storage. However, you also have to take care of cluster management and operational requirements such as scaling, application backup, and provisioning.

Enrichment lookup store

The AsyncFunction in the Flink async I/O operator isn’t multi-threaded and won’t work in a truly asynchronous way if the call is blocked or waiting for a response. The enrichment lookup API should handle requests and responses asynchronously coming from Flink async I/O operators. The enrichment lookup API can be hosted on Amazon EC2 or containers such as Amazon Elastic Container Service (Amazon ECS) or Amazon Elastic Kubernetes Service (Amazon EKS).

A number of server-side and client-side events are generated when a user interacts with a Poshmark application. As a result, the same information is required to enrich each event. This frequently accessed information cached in a centralized cache can optimize fetch time. The latency to the centralized cache can be further reduced by hosting the client (enrichment lookup API) and cache server in the same Availability Zone.

Reconciliation in case of pipeline errors

The event enrichment can fail in data enrichment applications for various reasons, such as the external store timing out or missing information in the store. The enriched fields may or may not be critical for downstream streaming applications. You should build your downstream streaming applications considering that these failures can occur and implement a fallback mechanism, for example retrying on-demand enrichment from the application. The failure handling will also be governed by latency tolerance of the application.

The processing of data is based on event time. In some situations, data can arrive late in the platform. Both Flink and Spark allow lateness and watermarks for users to handle late-arriving data by defining thresholds. Late-arriving data beyond the threshold is discarded from processing. It’s possible to get this discarded too-late data in Flink using a side output. There is no such provision in Spark Structured Streaming.

A few streaming applications require their batch counterpart to reconcile data hourly or daily to handle data mismatch or data discrepancy due to late-arriving data or missing data.

Improved customer experience

The new real-time architecture offered the following benefits for an improved customer experience:

  • Anonymization – Poshmark is now able to provide and utilize real-time anonymized data for multiple functions both internally and externally because anonymization happens in real time.
  • Fraud mitigation – Poshmark was previously able to detect and prevent 45% of ATOs with the batch-based solution. With the real-time system, Poshmark is able to prevent 80% of ATOs.
  • Personalization – By providing personalized search results, Poshmark achieved an 8% improvement on clickthrough rates for search. This is a significant increase in the top of the funnel, increasing overall search conversions.

Improvement in these three factors helped end-customers gain confidence in the Poshmark app and website, which in turn enabled customers to increase their interaction with the app and helped accelerate customer engagement and growth.

Conclusion

In this post, we discussed the ingestion of real-time clickstream and log event data into Amazon MSK. We showed how enrichment of the captured data can be performed through Kinesis Data Analytics for Apache Flink. We broke up the enrichment processing into multiple components, such as Kinesis Data Analytics for Apache Flink, the enrichment microservices and the enrichment lookup store, and an enrichment cache. We discussed the downstream applications that used this enriched customer information to perform real-time security checks and offer personalized recommendations to end-users. We also discussed some of the areas that may need attention in case there are failures in the pipeline. Lastly, we showed how Poshmark improved their customer experience and gained market share by implementing this real-time analytics pipeline.


About the authors

Mahesh Pasupuleti is a VP of Data & Machine Learning Engineering at Poshmark. He has helped several startups succeed in different domains, including media streaming, healthcare, the financial sector, and marketplaces. He loves software engineering, building high performance teams, and strategy, and enjoys gardening and playing badminton in his free time.

Gaurav Shah is Director of Data Engineering and ML at Poshmark. He and his team help build data-driven solutions to drive growth at Poshmark.

Raghu Mannam is a Sr. Solutions Architect at AWS in San Francisco. He works closely with late-stage startups, many of which have had recent IPOs. His focus is end-to-end solutioning including security, DevOps automation, resilience, analytics, machine learning, and workload optimization in the cloud.

Deepesh Malviya is Solutions Architect Manager on the AWS Data Lab team. He and his team help customers architect and build data, analytics, and machine learning solutions to accelerate their key initiatives as part of the AWS Data Lab.

Account Security Analytics and Events: better visibility over all domains

Post Syndicated from Radwa Radwan original https://blog.cloudflare.com/account-security-analytics-and-events/

Account Security Analytics and Events: better visibility over all domains

Account Security Analytics and Events: better visibility over all domains

Cloudflare offers many security features like WAF, Bot management, DDoS, Zero Trust, and more! This suite of products are offered in the form of rules to give basic protection against common vulnerability attacks. These rules are usually configured and monitored per domain, which is very simple when we talk about one, two, maybe three domains (or what we call in Cloudflare’s terms, “zones”).

The zone-level overview sometimes is not time efficient

If you’re a Cloudflare customer with tens, hundreds, or even thousands of domains under your control, you’d spend hours going through these domains one by one, monitoring and configuring all security features. We know that’s a pain, especially for our Enterprise customers. That’s why last September we announced the Account WAF, where you can create one security rule and have it applied to the configuration of all your zones at once!

Account WAF makes it easy to deploy security configurations. Following the same philosophy, we want to empower our customers by providing visibility over these configurations, or even better, visibility on all HTTP traffic.

Today, Cloudflare is offering holistic views on the security suite by launching Account Security Analytics and Account Security Events. Now, across all your domains, you can monitor traffic, get insights quicker, and save hours of your time.

How do customers get visibility over security traffic today?

Before today, to view account analytics or events, customers either used to access each zone individually to check the events and analytics dashboards, or used zone GraphQL Analytics API or logs to collect data and send them to their preferred storage provider where they could collect, aggregate, and plot graphs to get insights for all zones under their account — in case ready-made dashboards were not provided.

Introducing Account Security Analytics and Events

Account Security Analytics and Events: better visibility over all domains

The new views are security focused, data-driven dashboards — similar to zone-level views, both have  similar data like: sampled logs and the top filters over many source dimensions (for example, IP addresses, Host, Country, ASN, etc.).

The main difference between them is that Account Security Events focuses on the current configurations on every zone you have, which makes reviewing mitigated requests (rule matches) easy. This step is essential in distinguishing between actual threats from false positives, along with maintaining optimal security configuration.

Part of the Security Events power is showing Events “by service” listing the security-related activity per security feature (for example, WAF, Firewall Rules, API Shield) and Events “by Action” (for example, allow, block, challenge).

On the other hand, Account Security Analytics view shows a wider angle with all HTTP traffic on all zones under the account, whether this traffic is mitigated, i.e., the security configurations took an action to prevent the request from reaching your zone, or not mitigated. This is essential in fine-tuning your security configuration, finding possible false negatives, or onboarding new zones.

The view also provides quick filters or insights of what we think are interesting cases worth exploring for ease of use. Many of the view components are similar to zone level Security Analytics that we introduced recently.

To get to know the components and how they interact, let’s have a look at an actual example.

Analytics walk-through when investigating a spike in traffic

Traffic spikes happen to many customers’ accounts; to investigate the reason behind them, and check what’s missing from the configurations, we recommend starting from Analytics as it shows mitigated and non-mitigated traffic, and to revise the mitigated requests to double check any false positives then Security Events is the go to place. That’s what we’ll do in this walk-through starting with the Analytics, finding a spike, and checking if we need further mitigation action.

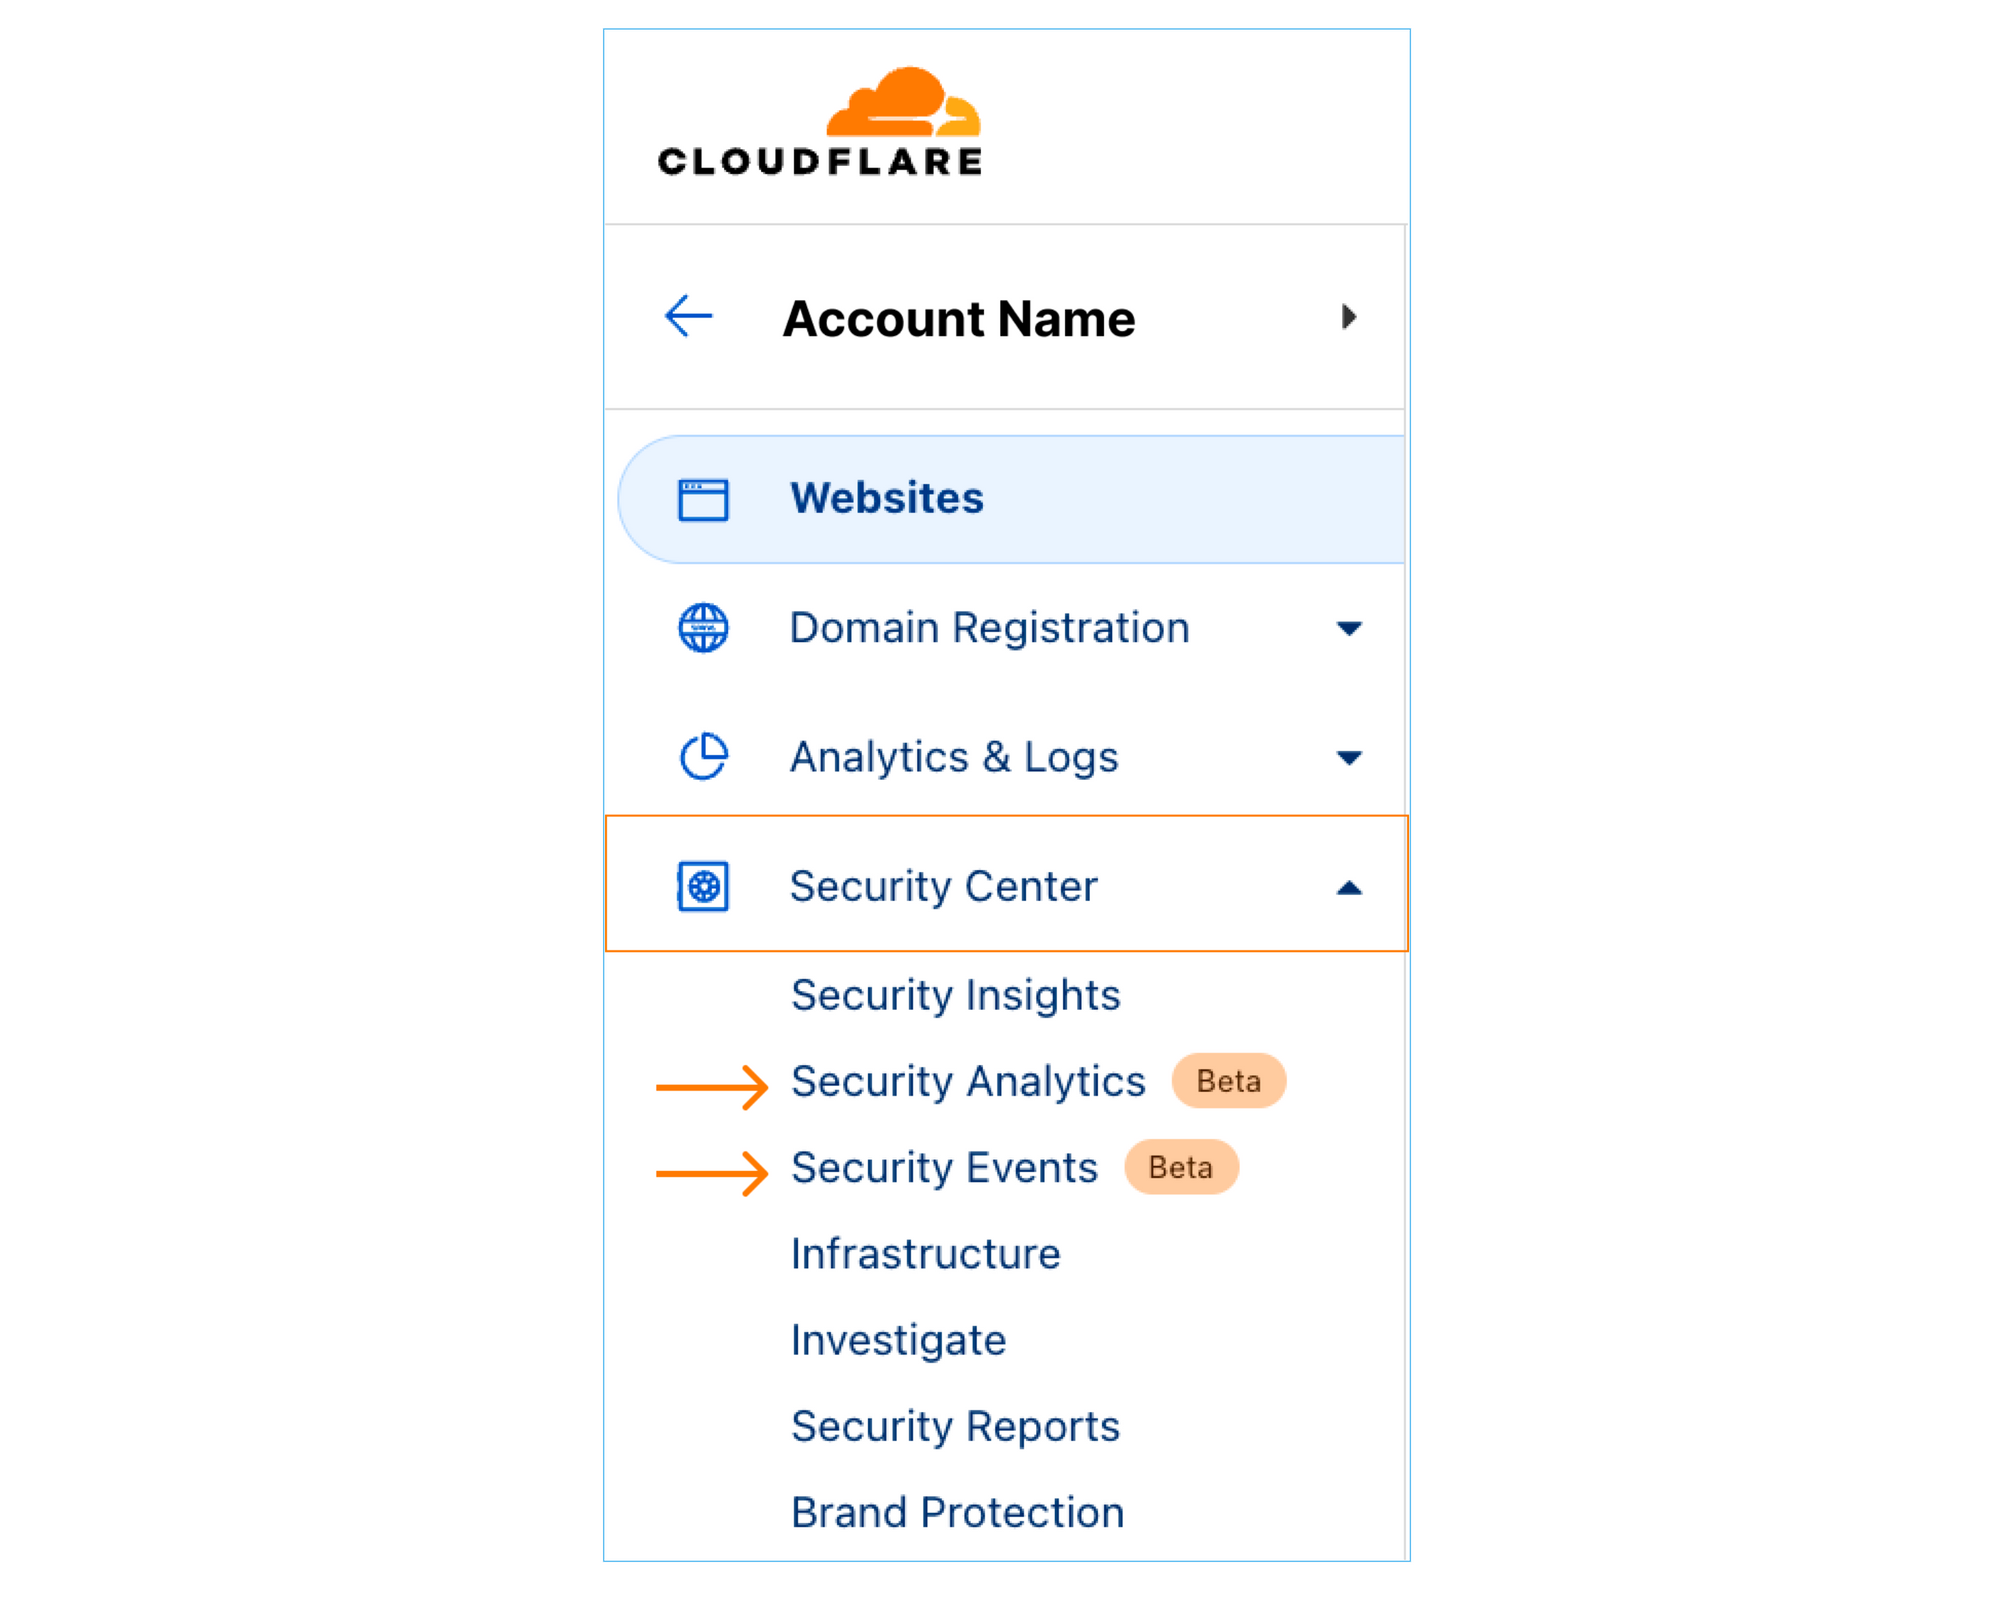
Step 1: To navigate to the new views, sign into the Cloudflare dashboard and select the account you want to monitor. You will find Security Analytics and Security Events in the sidebar under Security Center.

Account Security Analytics and Events: better visibility over all domains

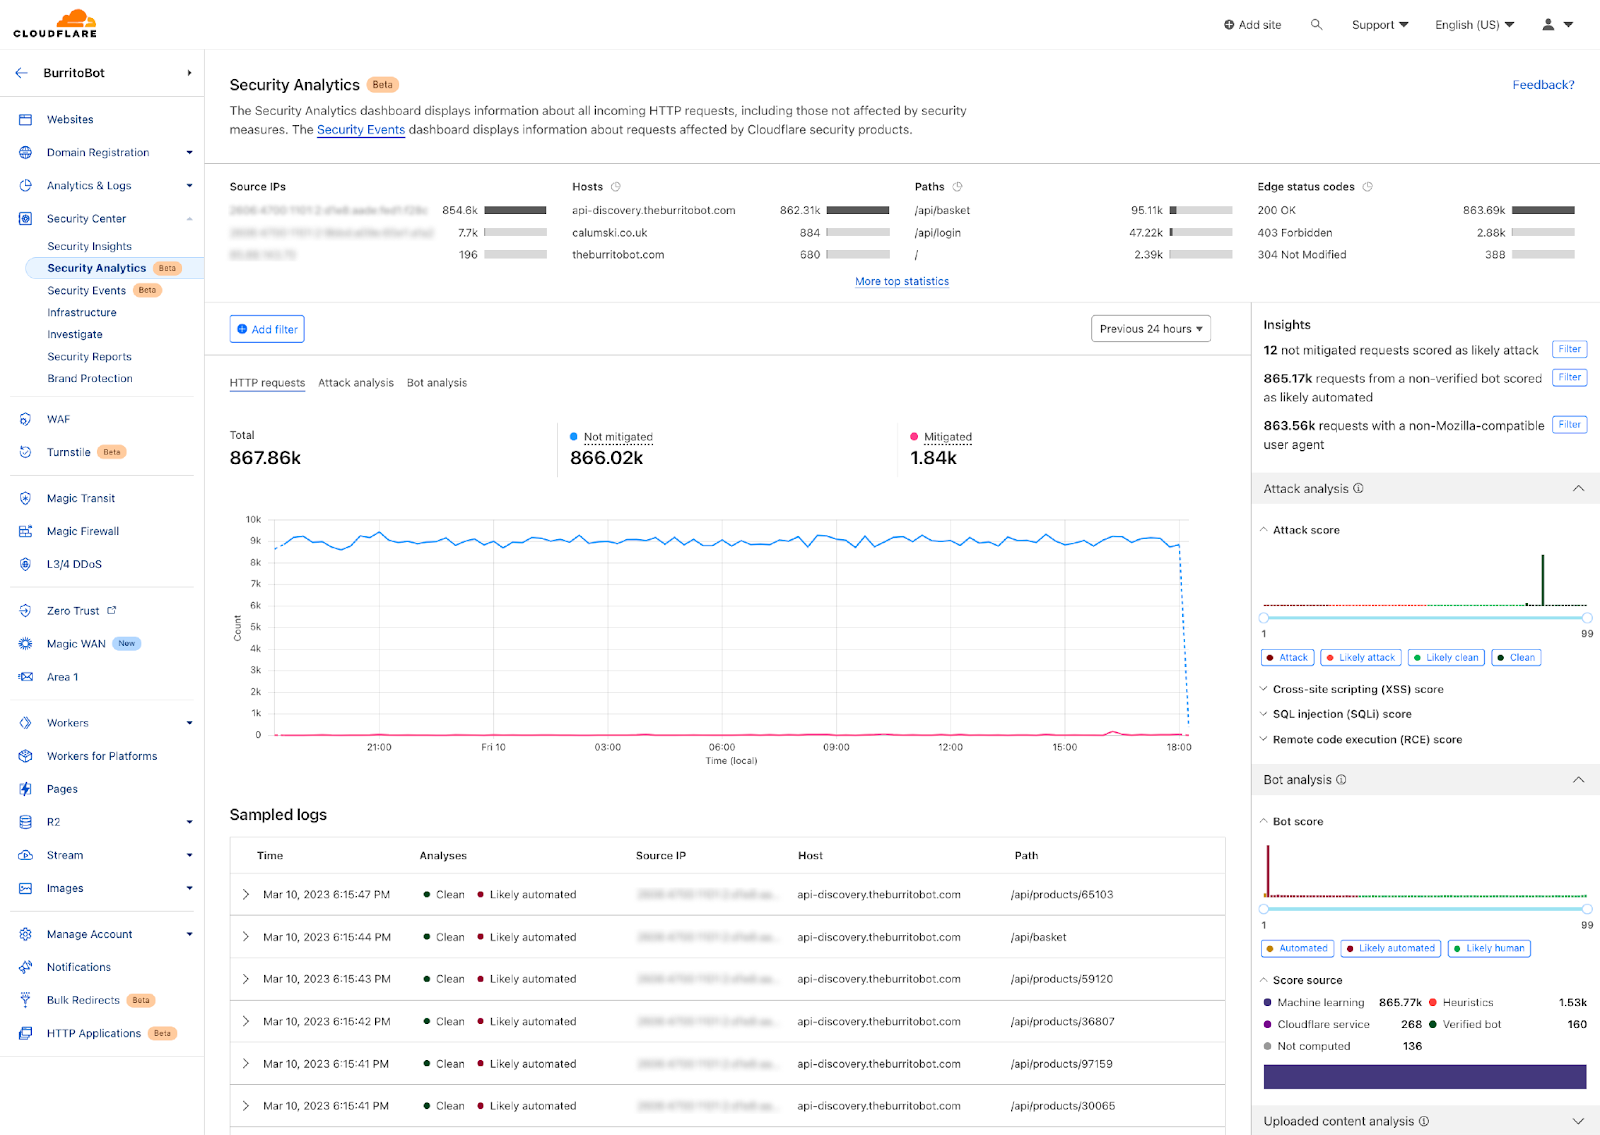
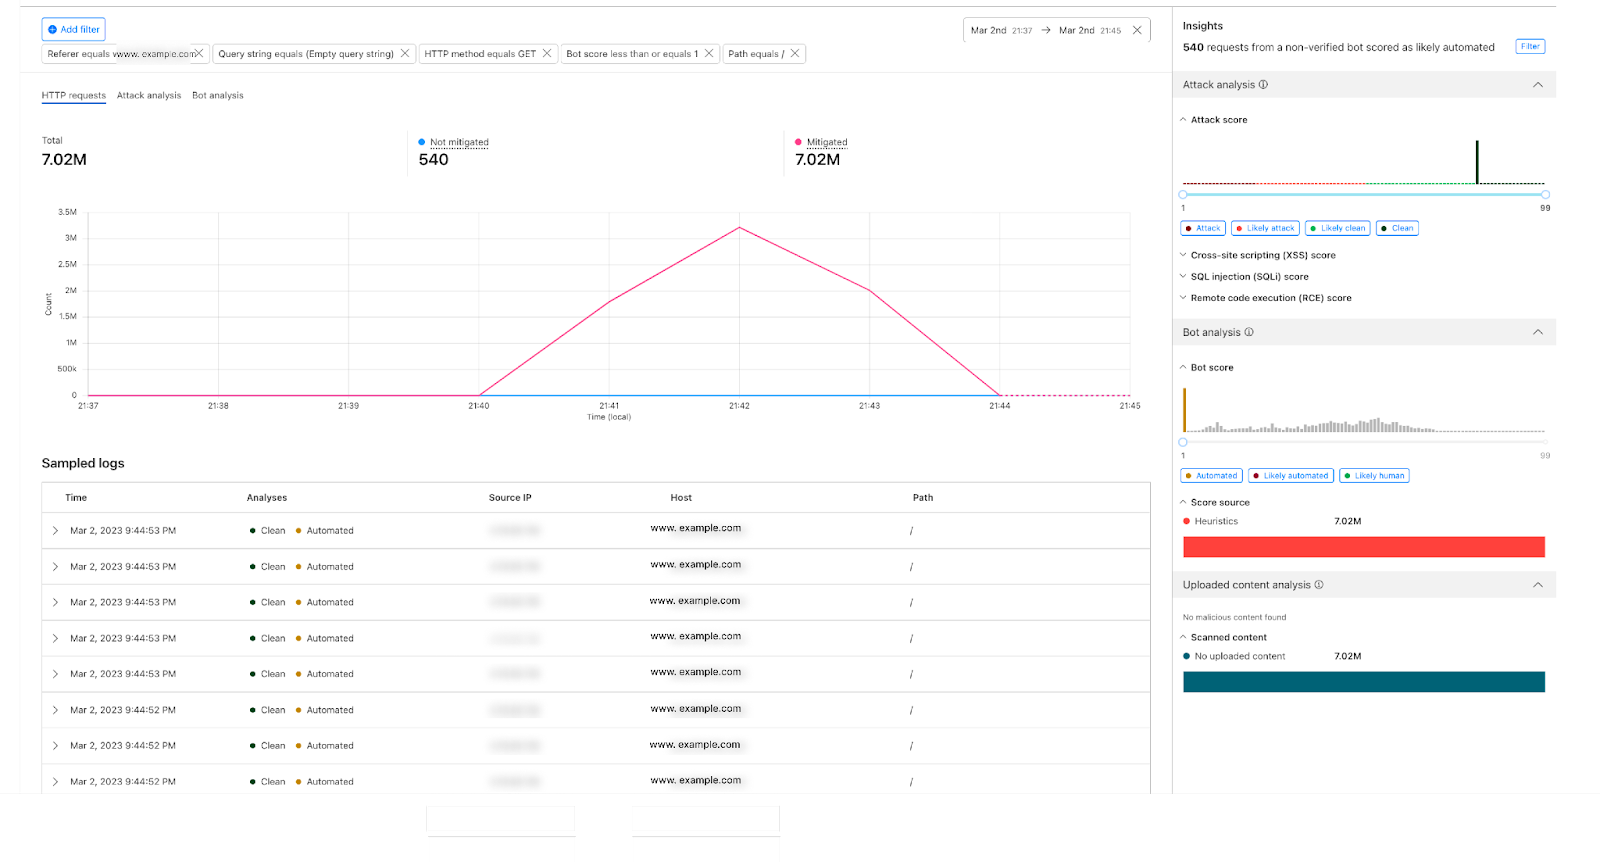
Step 2: In the Analytics dashboard, if you had a big spike in the traffic compared to the usual, there’s a big chance it’s a layer 7 DDoS attack. Once you spot one, zoom into the time interval in the graph.

Zooming into a traffic spike on the timeseries scale

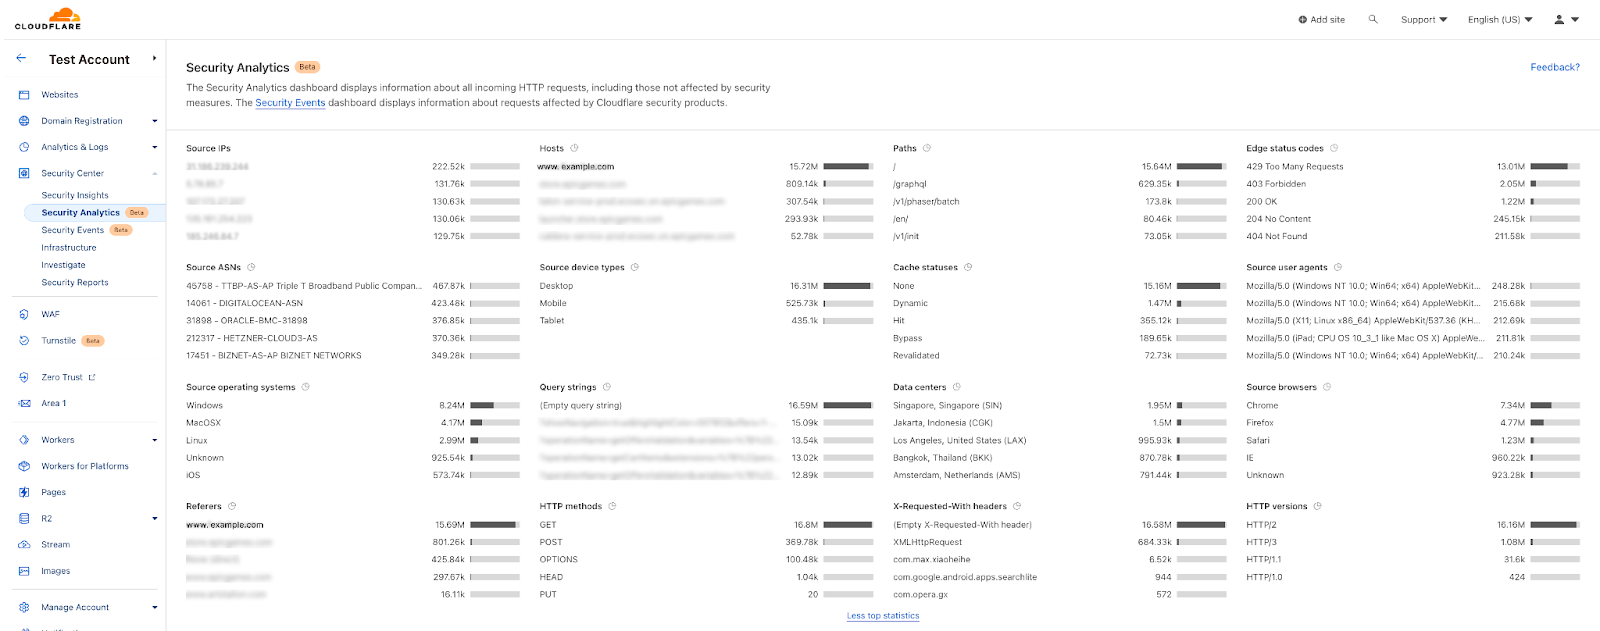
By Expanding the top-Ns on top of the analytics page we can see here many observations:

Account Security Analytics and Events: better visibility over all domains

We can confirm it’s a DDoS attack as the peak of traffic does not come from one single IP address, It’s distributed over multiple source IPs. The “edge status code” indicates that there’s a rate limiting rule applied on this attack and it’s a GET method over HTTP/2.

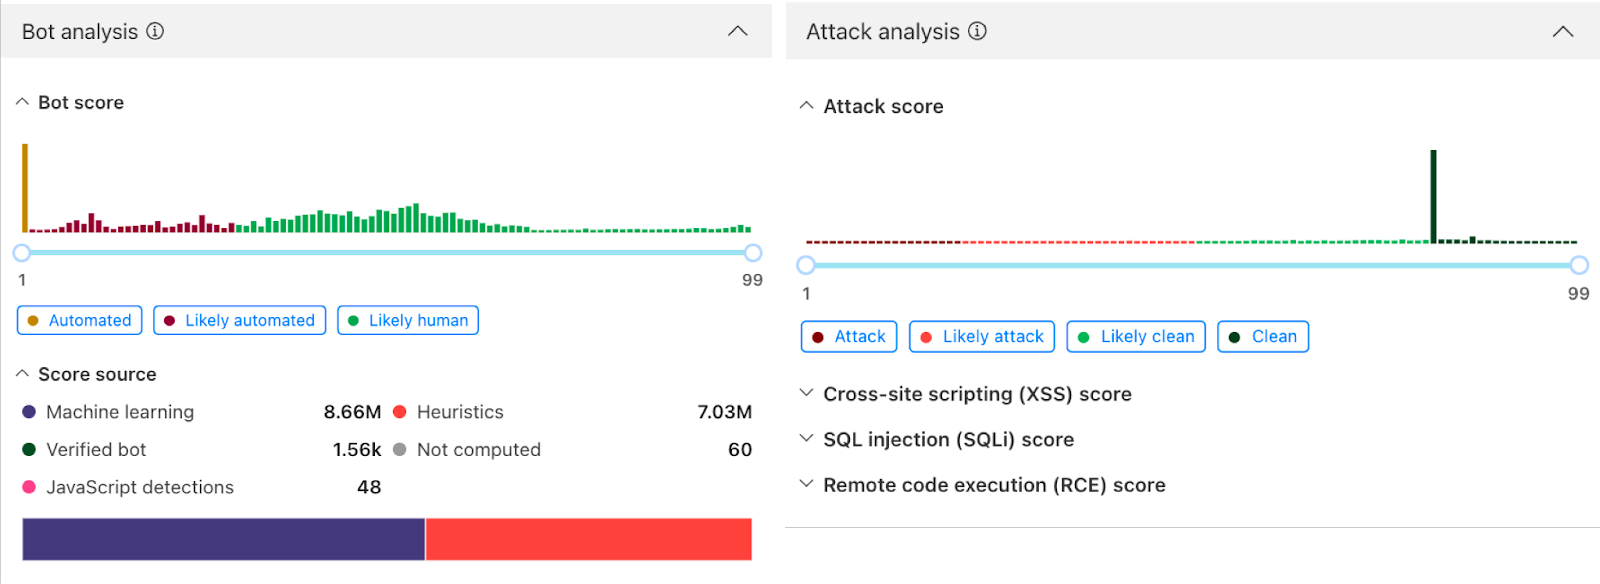
Looking at the right hand side of the analytics we can see “Attack Analysis” indicating that these requests were clean from XSS, SQLi, and common RCE attacks. The Bot Analysis indicates it’s an automated traffic in the Bot Scores distribution; these two products add another layer of intelligence to the investigation process. We can easily deduce here that the attacker is sending clean requests through high volumetric attack from multiple IPs to take the web application down.

Account Security Analytics and Events: better visibility over all domains

Step 3: For this attack we can see we have rules in place to mitigate it, with the visibility we get the freedom to fine tune our configurations to have better security posture, if needed. we can filter on this attack fingerprint, for instance: add a filter on the referer `www.example.com` which is receiving big bulk of the attack requests, add filter on path equals `/`, HTTP method, query string, and a filter on the automated traffic with Bot score, we will see the following:

Account Security Analytics and Events: better visibility over all domains

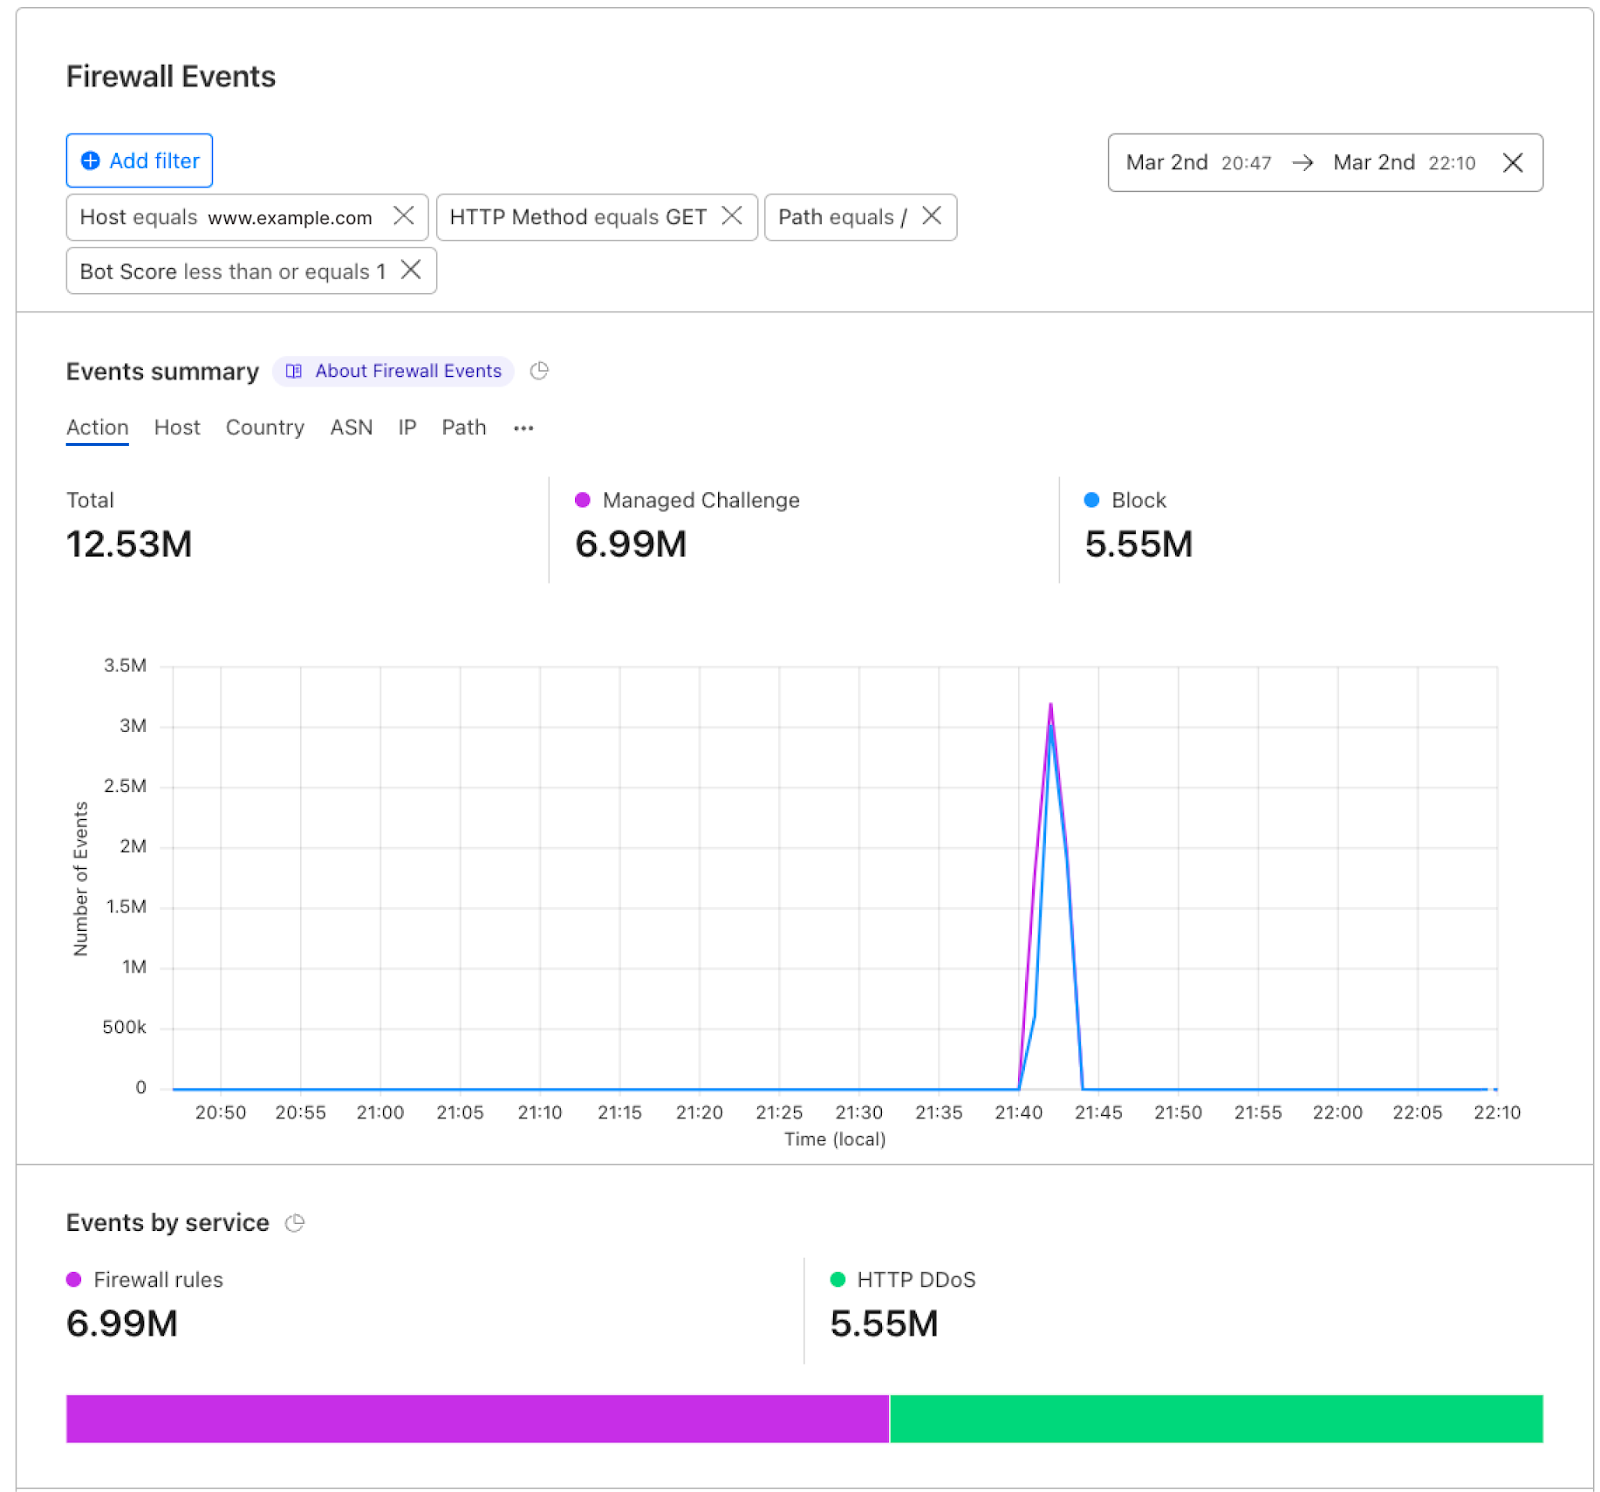
Step 4: Jumping to Security Events to zoom in on our mitigation actions in this case, spike fingerprint is mitigated using two actions: Managed Challenge and Block.

Account Security Analytics and Events: better visibility over all domains

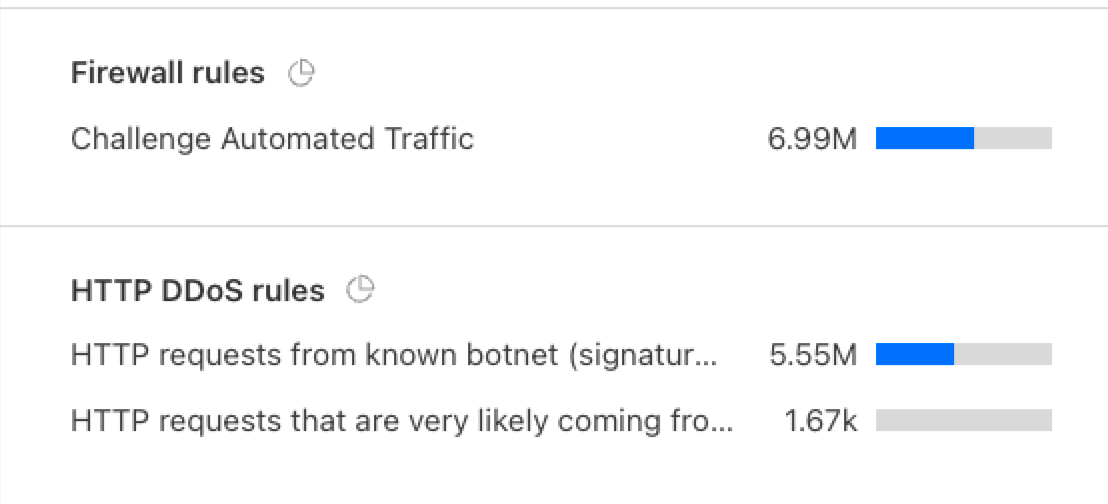
The mitigation happened on: Firewall rules and DDoS configurations, the exact rules are shown in the top events.

Account Security Analytics and Events: better visibility over all domains

Who gets the new views?

Starting this week all our customers on Enterprise plans will have access to Account Security Analytics and Security Events. We recommend having Account Bot Management, WAF Attack Score, and Account WAF to have access to the full visibility and actions.

What’s next?

The new Account Security Analytics and Events encompass metadata generated by the Cloudflare network for all domains in one place. In the upcoming period we will be providing a better experience to save our customers’ time in a simple way. We’re currently in beta, log into the dashboard, check out the views, and let us know your feedback.

Extend geospatial queries in Amazon Athena with UDFs and AWS Lambda

Post Syndicated from John Telford original https://aws.amazon.com/blogs/big-data/extend-geospatial-queries-in-amazon-athena-with-udfs-and-aws-lambda/

Amazon Athena is a serverless and interactive query service that allows you to easily analyze data in Amazon Simple Storage Service (Amazon S3) and 25-plus data sources, including on-premises data sources or other cloud systems using SQL or Python. Athena built-in capabilities include querying for geospatial data; for example, you can count the number of earthquakes in each Californian county. One disadvantage of analyzing at county-level is that it may give you a misleading impression of which parts of California have had the most earthquakes. This is because the counties aren’t equally sized; a county may have had more earthquakes simply because it’s a big county. What if we wanted a hierarchical system that allowed us to zoom in and out to aggregate data over different equally-sized geographic areas?

In this post, we present a solution that uses Uber’s Hexagonal Hierarchical Spatial Index (H3) to divide the globe into equally-sized hexagons. We then use an Athena user-defined function (UDF) to determine which hexagon each historical earthquake occurred in. Because the hexagons are equally-sized, this analysis gives a fair impression of where earthquakes tend to occur.

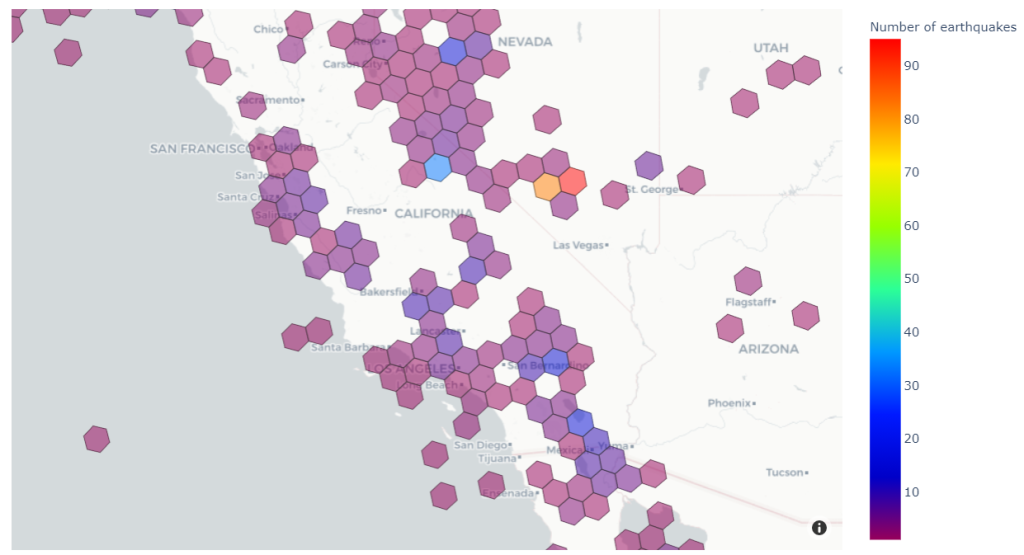
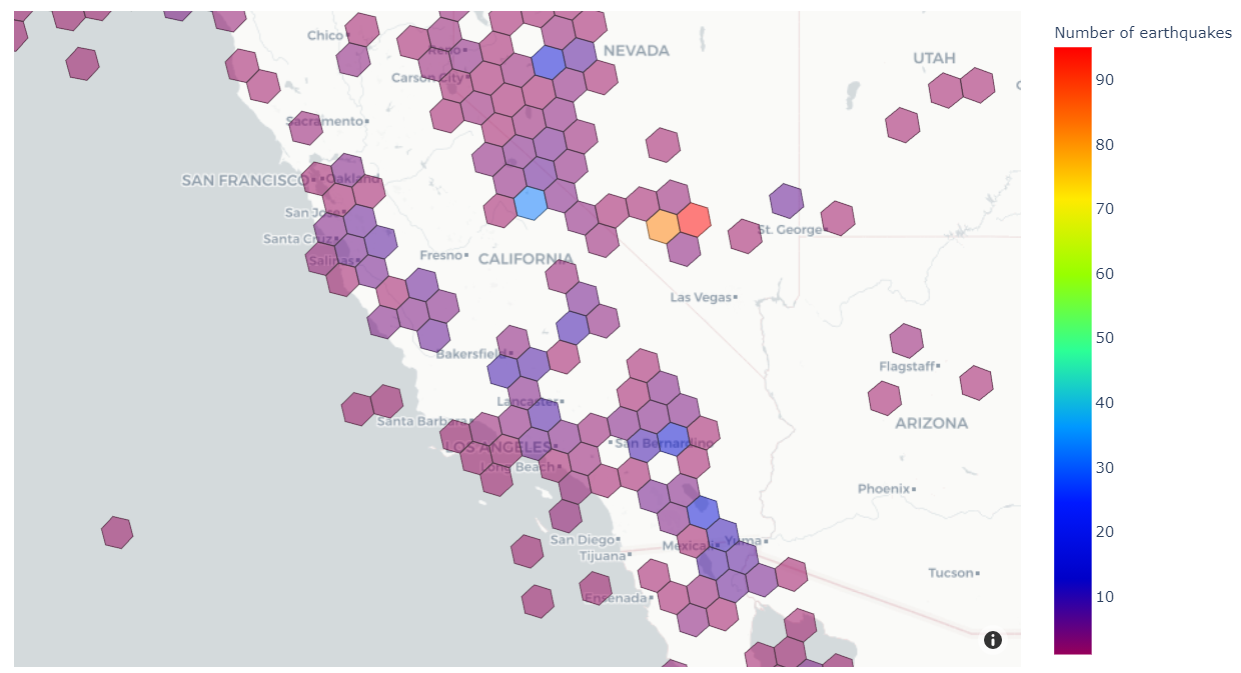
At the end, we’ll produce a visualization like the one below that shows the number of historical earthquakes in different areas of the western US.

H3 divides the globe into equal-sized regular hexagons. The number of hexagons depends on the chosen resolution, which may vary from 0 (122 hexagons, each with edge lengths of about 1,100 km) to 15 (569,707,381,193,162 hexagons, each with edge lengths of about 50 cm). H3 enables analysis at the area level, and each area has the same size and shape.

Solution overview

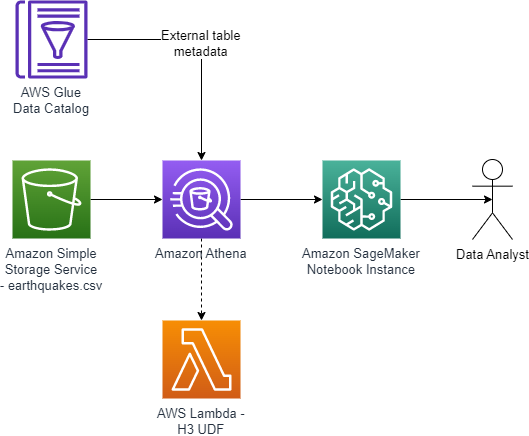
The solution extends Athena’s built-in geospatial capabilities by creating a UDF powered by AWS Lambda. Finally, we use an Amazon SageMaker notebook to run Athena queries that are rendered as a choropleth map. The following diagram illustrates this architecture.

The end-to-end architecture is as follows:

  1. A CSV file of historical earthquakes is uploaded into an S3 bucket.
  2. An AWS Glue external table is created based on the earthquake CSV.
  3. A Lambda function calculates H3 hexagons for parameters (latitude, longitude, resolution). The function is written in Java and can be called as a UDF using queries in Athena.
  4. A SageMaker notebook uses an AWS SDK for pandas package to run a SQL query in Athena, including the UDF.
  5. A Plotly Express package renders a choropleth map of the number of earthquakes in each hexagon.

Prerequisites

For this post, we use Athena to read data in Amazon S3 using the table defined in the AWS Glue Data Catalog associated with our earthquake dataset. In terms of permissions, there are two main requirements:

Configure Amazon S3

The first step is to create an S3 bucket to store the earthquake dataset, as follows:

  1. Download the CSV file of historical earthquakes from GitHub.
  2. On the Amazon S3 console, choose Buckets in the navigation pane.
  3. Choose Create bucket.
  4. For Bucket name, enter a globally unique name for your data bucket.
  5. Choose Create folder, and enter the folder name earthquakes.
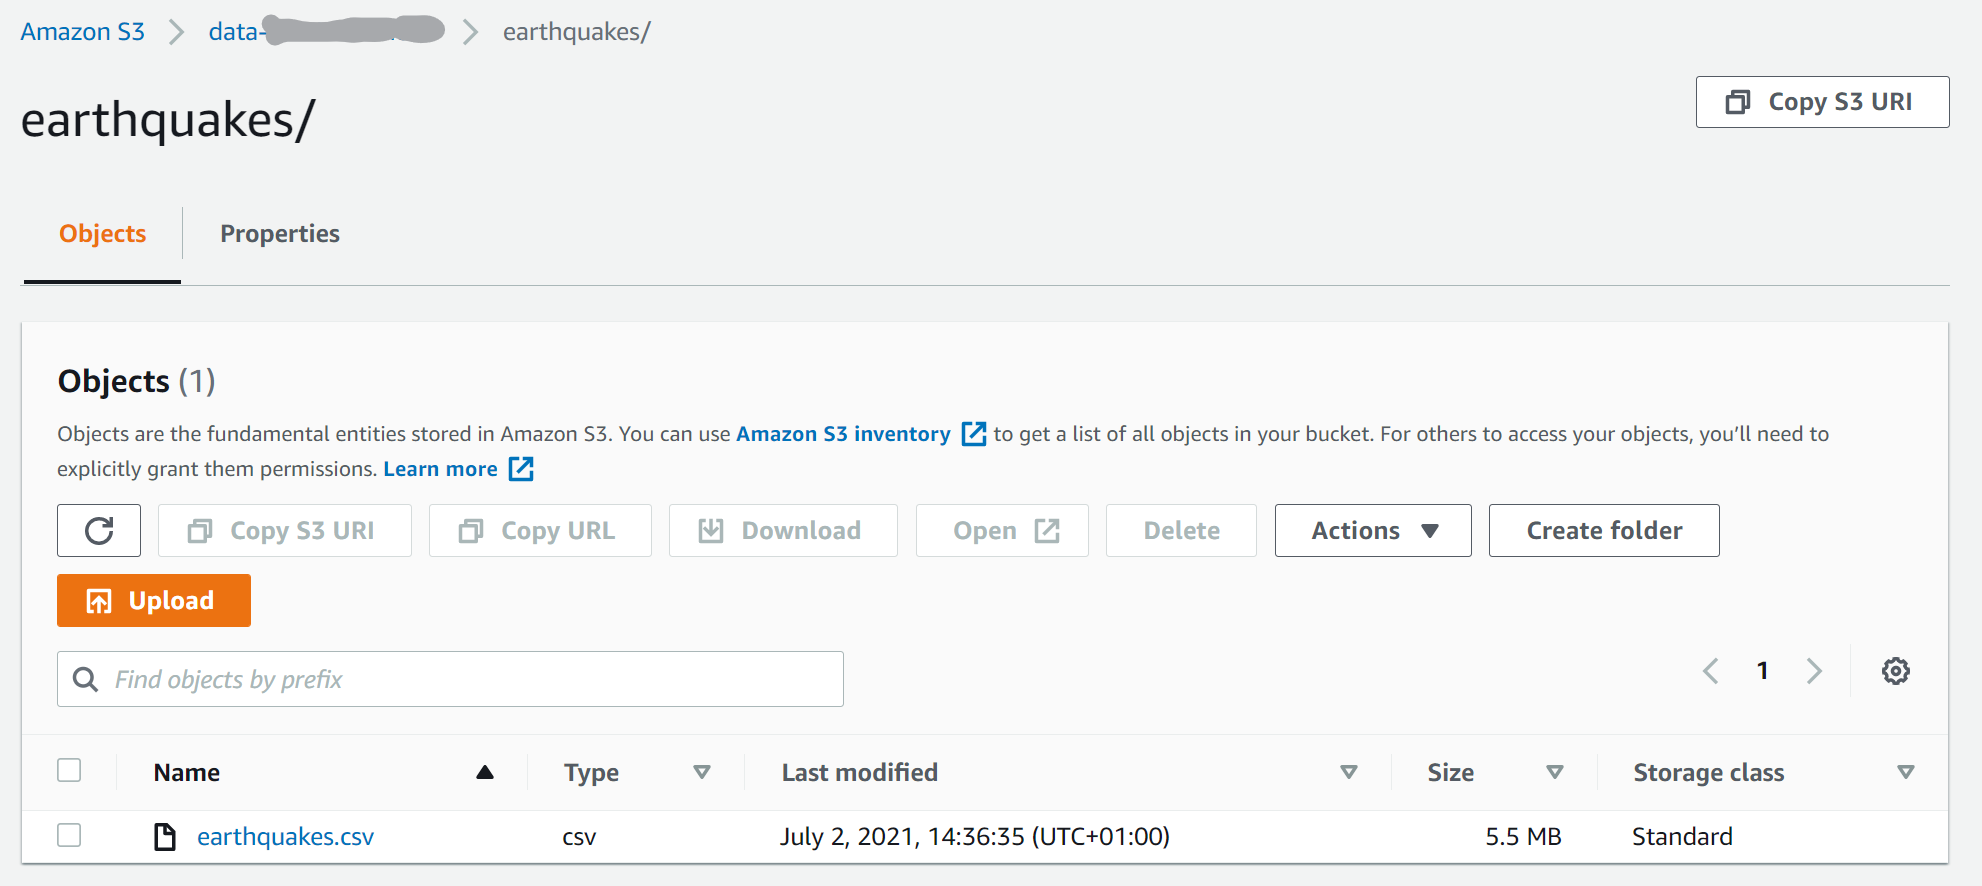
  6. Upload the file to the S3 bucket. In this example, we upload the earthquakes.csv file to the earthquakes prefix.

Create a table in Athena

Navigate to Athena console to create a table. Complete the following steps:

  1. On the Athena console, choose Query editor.
  2. Select your preferred Workgroup using the drop-down menu.
  3. In the SQL editor, use the following code to create a table in the default database:
    CREATE external TABLE earthquakes
    (
      earthquake_date STRING,
      latitude DOUBLE,
      longitude DOUBLE,
      depth DOUBLE,
      magnitude DOUBLE,
      magtype STRING,
      mbstations STRING,
      gap STRING,
      distance STRING,
      rms STRING,
      source STRING,
      eventid STRING
    )
    ROW FORMAT DELIMITED FIELDS TERMINATED BY ','
    STORED AS TEXTFILE LOCATION 's3://<MY-DATA-BUCKET>/earthquakes/';

Create a Lambda function for the Athena UDF

For a thorough explanation on how to build Athena UDFs, see Querying with user defined functions. We use Java 11 and Uber H3 Java binding to build the H3 UDF. We provide the implementation of the UDF on GitHub.

There are several options for deploying a UDF using Lambda. In this example, we use the AWS Management Console. For production deployments, you probably want to use infrastructure as code such as the AWS Cloud Development Kit (AWS CDK). For information about how to use the AWS CDK to deploy the Lambda function, refer to the project code repository. Another possible deployment option is using AWS Serverless Application Repository (SAR).

Deploy the UDF

Deploy the Uber H3 binding UDF using the console as follows:

  1. Go to binary directory in the GitHub repository, and download aws-h3-athena-udf-*.jar to your local desktop.
  2. Create a Lambda function called H3UDF with Runtime set to Java 11 (Corretto), and Architecture set to x86_64.
  3. Upload the aws-h3-athena-udf*.jar file.
  4. Change the handler name to com.aws.athena.udf.h3.H3AthenaHandler.
  5. In the General configuration section, choose Edit to set the memory of the Lambda function to 4096 MB, which is an amount of memory that works for our examples. You may need to set the memory size larger for your use cases.

Use the Lambda function as an Athena UDF

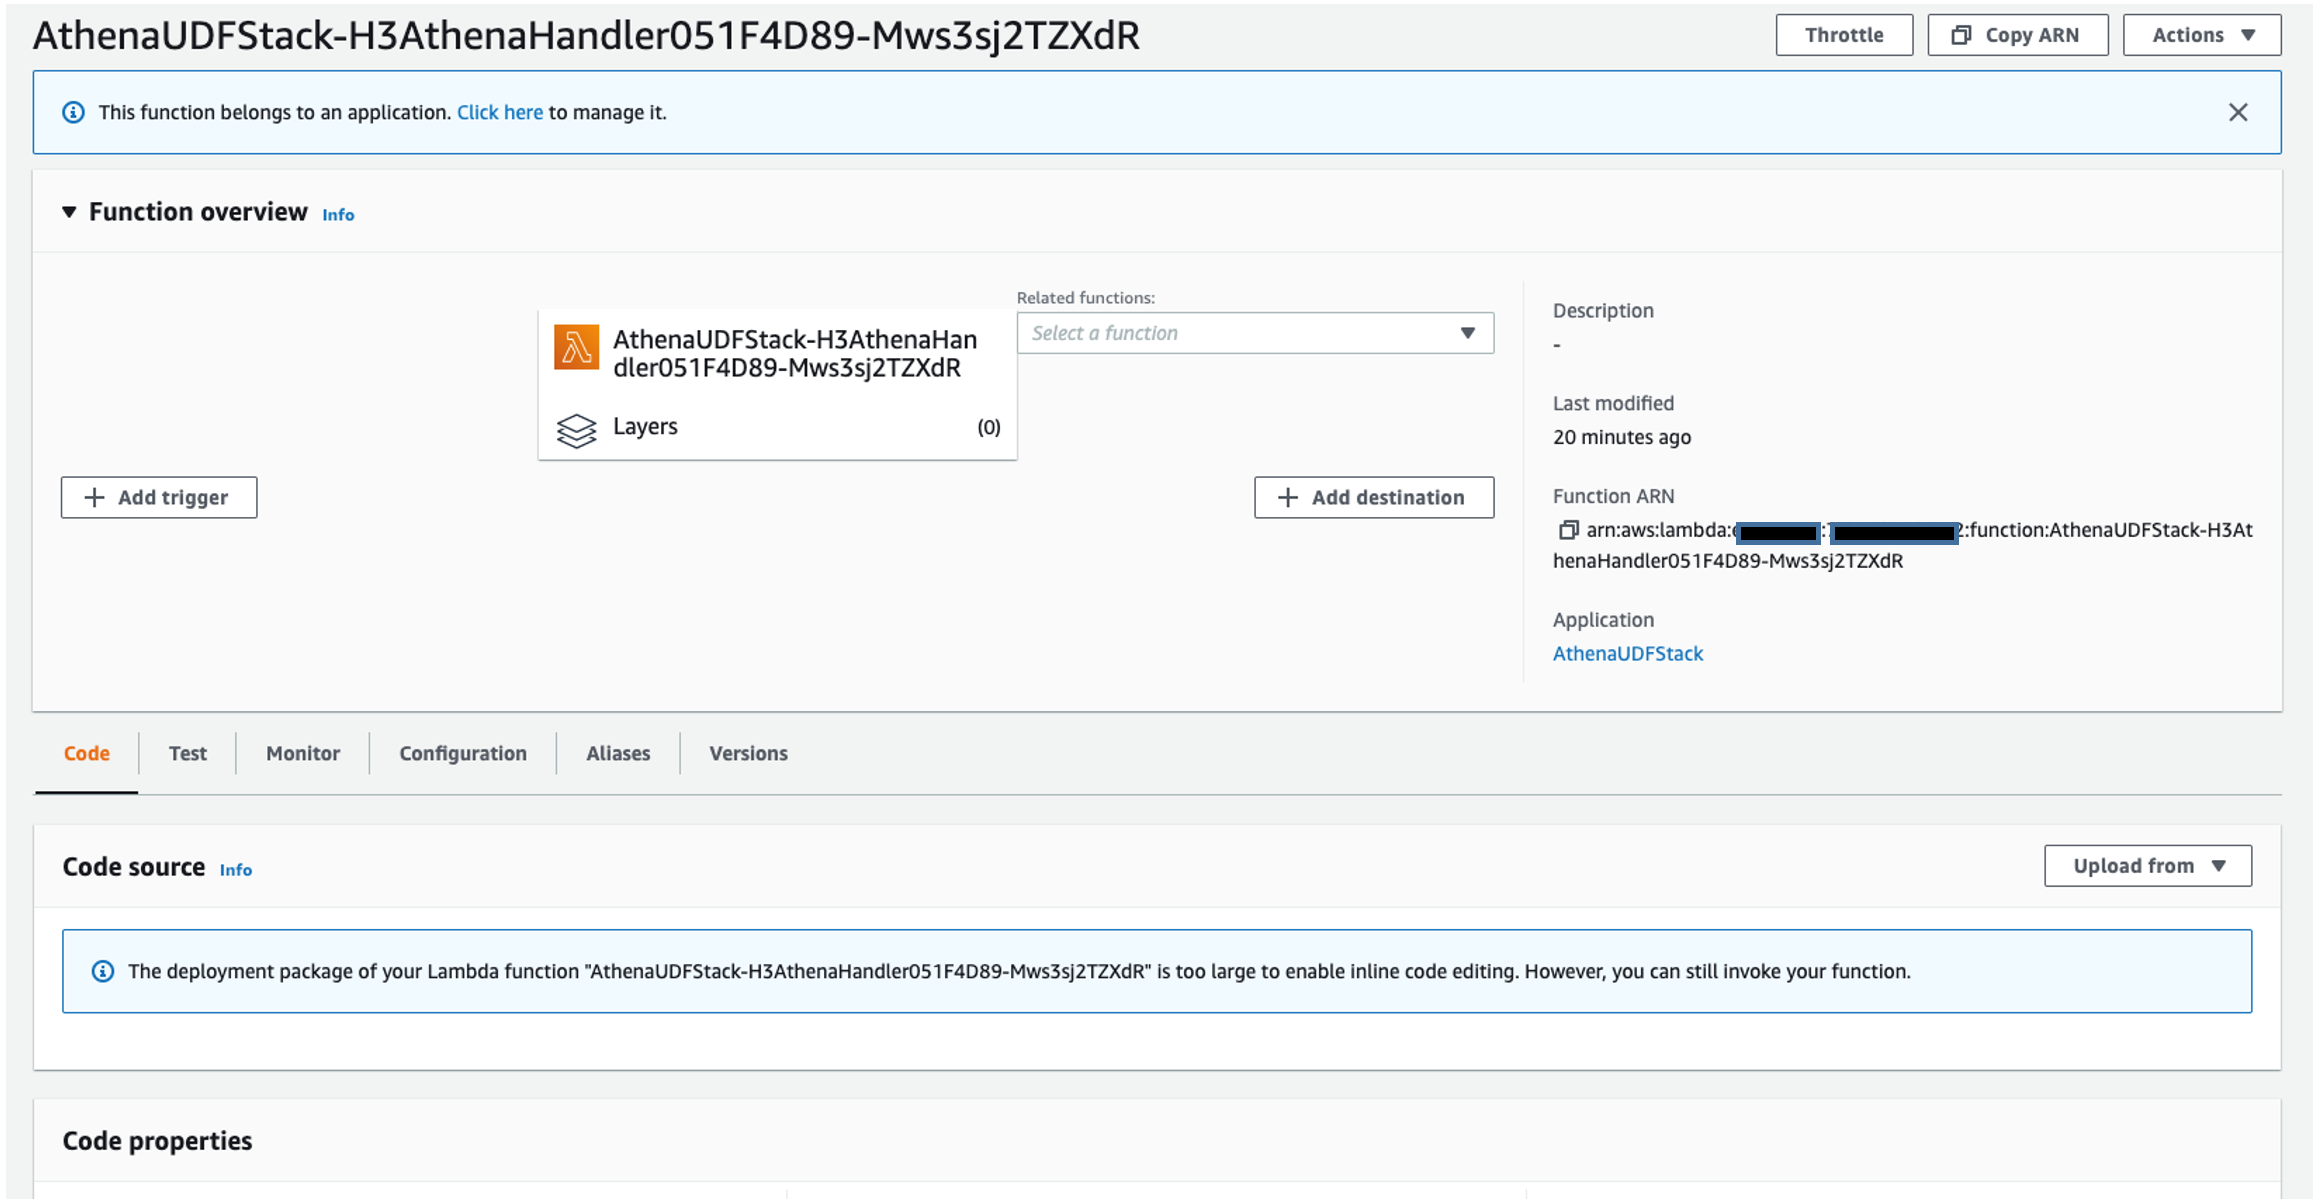
After you create the Lambda function, you’re ready to use it as a UDF. The following screenshot shows the function details.

You can now use the function as an Athena UDF. On the Athena console, run the following command:

USING EXTERNAL FUNCTION lat_lng_to_cell_address(lat DOUBLE, lng DOUBLE, res INTEGER)
RETURNS VARCHAR
LAMBDA '<MY-LAMBDA-ARN>'-- Replace with ARN of your Lambda function.
SELECT *,
       lat_lng_to_cell_address(latitude, longitude, 4) AS h3_cell
FROM earthquakes
WHERE latitude BETWEEN 18 AND 70;

The udf/examples folder in the GitHub repository includes more examples of the Athena queries.

Developing the UDFs

Now that we showed you how to deploy a UDF for Athena using Lambda, let’s dive deeper into how to develop these kinds of UDFs. As explained in Querying with user defined functions, in order to develop a UDF, we first need to implement a class that inherits UserDefinedFunctionHandler. Then we need to implement the functions inside the class that can be used as UDFs of Athena.

We begin the UDF implementation by defining a class H3AthenaHandler that inherits the UserDefinedFunctionHandler. Then we implement functions that act as wrappers of functions defined in the Uber H3 Java binding. We make sure that all the functions defined in the H3 Java binding API are mapped, so that they can be used in Athena as UDFs. For example, we map the lat_lng_to_cell_address function used in the preceding example to the latLngToCell of the H3 Java binding.

On top of the call to the Java binding, many of the functions in the H3AthenaHandler check whether the input parameter is null. The null check is useful because we don’t assume the input to be non-null. In practice, null values for an H3 index or address are not unusual.

The following code shows the implementation of the get_resolution function:

/** Returns the resolution of an index.
     *  @param h3 the H3 index.
     *  @return the resolution. Null when h3 is null.
     *  @throws IllegalArgumentException when index is out of range.
     */
    public Integer get_resolution(Long h3){
        final Integer result;
        if (h3 == null) {
            result = null;
        } else {
            result = h3Core.getResolution(h3);
        }
        return result;
    }

Some H3 API functions such as cellToLatLng return List<Double> of two elements, where the first element is the latitude and the second is longitude. The H3 UDF that we implement provides a function that returns well-known text (WKT) representation. For example, we provide cell_to_lat_lng_wkt, which returns a Point WKT string instead of List<Double>. We can then use the output of cell_to_lat_lng_wkt in combination with the built-in spatial Athena function ST_GeometryFromText as follows:

USING EXTERNAL FUNCTION cell_to_lat_lng_wkt(h3 BIGINT) 
RETURNS VARCHAR
LAMBDA '<MY-LAMBDA-ARN>'
SELECT ST_GeometryFromText(cell_to_lat_lng_wkt(622506764662964223))

Athena UDF only supports scalar data types and does not support nested types. However, some H3 APIs return nested types. For example, the polygonToCells function in H3 takes a List<List<List<GeoCoord>>>. Our implementation of polygon_to_cells UDF receives a Polygon WKT instead. The following shows an example Athena query using this UDF:

-- get all h3 hexagons that cover Toulouse, Nantes, Lille, Paris, Nice 
USING EXTERNAL FUNCTION polygon_to_cells(polygonWKT VARCHAR, res INT)
RETURNS ARRAY(BIGINT)
LAMBDA '<MY-LAMBDA-ARN>'
SELECT polygon_to_cells('POLYGON ((43.604652 1.444209, 47.218371 -1.553621, 50.62925 3.05726, 48.864716 2.349014, 43.6961 7.27178, 3.604652 1.444209))', 2)

Use SageMaker notebooks for visualization

A SageMaker notebook is a managed machine learning compute instance that runs a Jupyter notebook application. In this example, we will use a SageMaker notebook to write and run our code to visualize our results, but if your use case includes Apache Spark then using Amazon Athena for Apache Spark would be a great choice. For advice on security best practices for SageMaker, see Building secure machine learning environments with Amazon SageMaker. You can create your own SageMaker notebook by following these instructions:

  1. On the SageMaker console, choose Notebook in the navigation pane.
  2. Choose Notebook instances.
  3. Choose Create notebook instance.
  4. Enter a name for the notebook instance.
  5. Choose an existing IAM role or create a role that allows you to run SageMaker and grants access to Amazon S3 and Athena.
  6. Choose Create notebook instance.
  7. Wait for the notebook status to change from Creating to InService.
  8. Open the notebook instance by choosing Jupyter or JupyterLab.

Explore the data

We’re now ready to explore the data.

  1. On the Jupyter console, under New, choose Notebook.
  2. On the Select Kernel drop-down menu, choose conda_python3.
  3. Add new cells by choosing the plus sign.
  4. In your first cell, download the following Python modules that aren’t included in the standard SageMaker environment:
    !pip install geojson
    !pip install awswrangler
    !pip install geomet
    !pip install shapely

    GeoJSON is a popular format for storing spatial data in a JSON format. The geojson module allows you to easily read and write GeoJSON data with Python. The second module we install, awswrangler, is the AWS SDK for pandas. This is a very easy way to read data from various AWS data sources into Pandas data frames. We use it to read earthquake data from the Athena table.

  5. Next, we import all the packages that we use to import the data, reshape it, and visualize it:
    from geomet import wkt
    import plotly.express as px
    from shapely.geometry import Polygon, mapping
    import awswrangler as wr
    import pandas as pd
    from shapely.wkt import loads
    import geojson
    import ast

  6. We begin importing our data using the athena.read_sql._query function in AWS SDK for pandas. The Athena query has a subquery that uses the UDF to add a column h3_cell to each row in the earthquakes table, based on the latitude and longitude of the earthquake. The analytic function COUNT is then used to find out the number of earthquakes in each H3 cell. For this visualization, we’re only interested in earthquakes within the US, so we filter out rows in the data frame that are outside the area of interest:
    def run_query(lambda_arn, db, resolution):
        query = f"""USING EXTERNAL FUNCTION cell_to_boundary_wkt(cell VARCHAR)
                        RETURNS ARRAY(VARCHAR)
                        LAMBDA '{lambda_arn}'
                           SELECT h3_cell, cell_to_boundary_wkt(h3_cell) as boundary, quake_count FROM(
                            USING EXTERNAL FUNCTION lat_lng_to_cell_address(lat DOUBLE, lng DOUBLE, res INTEGER)
                             RETURNS VARCHAR
                            LAMBDA '{lambda_arn}'
                        SELECT h3_cell, COUNT(*) AS quake_count
                          FROM
                            (SELECT *,
                               lat_lng_to_cell_address(latitude, longitude, {resolution}) AS h3_cell
                             FROM earthquakes
                             WHERE latitude BETWEEN 18 AND 70        -- For this visualisation, we're only interested in earthquakes within the USA.
                               AND longitude BETWEEN -175 AND -50
                             )
                           GROUP BY h3_cell ORDER BY quake_count DESC) cell_quake_count"""
        return wr.athena.read_sql_query(query, database=db)
    
    lambda_arn = '<MY-LAMBDA-ARN>' # Replace with ARN of your lambda.
    db_name = '<MY-DATABASE-NAME>' # Replace with name of your Glue database.
    earthquakes_df = run_query(lambda_arn=lambda_arn,db=db_name, resolution=4)
    earthquakes_df.head()

    The following screenshot shows our results.

Follow along with the rest of the steps in our Jupyter notebook to see how we analyze and visualize our example with H3 UDF data.

Visualize the results

To visualize our results, we use the Plotly Express module to create a choropleth map of our data. A choropleth map is a type of visualization that is shaded based on quantitative values. This is a great visualization for our use case because we’re shading different regions based on the frequency of earthquakes.

In the resulting visual, we can see the ranges of frequency of earthquakes in different areas of North America. Note, the H3 resolution in this map is lower than in the earlier map, which makes each hexagon cover a larger area of the globe.

Clean up

To avoid incurring extra charges on your account, delete the resources you created:

  1. On the SageMaker console, select the notebook and on the Actions menu, choose Stop.
  2. Wait for the status of the notebook to change to Stopped, then select the notebook again and on the Actions menu, choose Delete.
  3. On the Amazon S3 console, select the bucket you created and choose Empty.
  4. Enter the bucket name and choose Empty.
  5. Select the bucket again and choose Delete.
  6. Enter the bucket name and choose Delete bucket.
  7. On the Lambda console, select the function name and on the Actions menu, choose Delete.

Conclusion

In this post, you saw how to extend functions in Athena for geospatial analysis by adding your own user-defined function. Although we used Uber’s H3 geospatial index in this demonstration, you can bring your own geospatial index for your own custom geospatial analysis.

In this post, we used Athena, Lambda, and SageMaker notebooks to visualize the results of our UDFs in the western US. Code examples are in the h3-udf-for-athena GitHub repo.

As a next step, you can modify the code in this post and customize it for your own needs to gain further insights from your own geographical data. For example, you could visualize other cases such as droughts, flooding, and deforestation.


About the Authors

John Telford is a Senior Consultant at Amazon Web Services. He is a specialist in big data and data warehouses. John has a Computer Science degree from Brunel University.

Anwar Rizal is a Senior Machine Learning consultant based in Paris. He works with AWS customers to develop data and AI solutions to sustainably grow their business.

Pauline Ting is a Data Scientist in the AWS Professional Services team. She supports customers in achieving and accelerating their business outcome by developing sustainable AI/ML solutions. In her spare time, Pauline enjoys traveling, surfing, and trying new dessert places.

Amazon QuickSight helps TalentReef empower its customers to make more informed hiring decisions

Post Syndicated from Alexander Plumb original https://aws.amazon.com/blogs/big-data/amazon-quicksight-helps-talentreef-empower-its-customers-to-make-more-informed-hiring-decisions/

This post is co-written with Alexander Plumb, Product Manager at Mitratech.

TalentReef, now part of Mitratech, is a talent management platform purpose-built for location-based, high-volume hiring. TalentReef was acquired by Mitratech in August 2022 with the goal to combine TalentReef’s best-in-class systems with Mitratech’s expertise, technology, and global platform to ensure their customers’ hiring needs are serviced better and faster than anyone else in the industry.

The TalentReef team are experts in hourly recruiting, onboarding, and hiring, with the mission to help its customers engage with great candidates utilizing an intelligent, easy-to-use single platform. TalentReef differentiates itself from its competitors by not just building features, but creating an entire talent management ecosystem on the idea of eliminating friction and making the hiring and onboarding process as smooth and easy as possible for their customers and applicants.

TalentReef used Amazon QuickSight with the intent of replacing their legacy business intelligence (BI) reporting. The team found QuickSight easy to use and developed two new dashboards that replaced dozens of legacy reports. The response has been overwhelmingly positive, leading to the development of two additional analytics dashboards, Job Postings and Onboarding, both set to be released in the first half of 2023.

The following screenshot shows the Applicant dashboard, which is used internally by TalentReef Customer Solution Managers as well as externally directly by customers embedded within the talent management application. This dashboard provides quick access to their customers’ important metrics. For example, it shows the total number of applicants for all the job postings. It also shows how many applicants are present in the system by position.
full TalentReef dashboard

Providing clarity to customers for hourly workforce hiring

The war for talent is top of mind for those hiring within the hourly workforce. Hiring managers are constantly looking for top talent and trying to understand where they came from, why they are applying, and more. They want to see how their job postings are performing, if there is a drop in any posting, and opportunities to optimize their process. TalentReef’s previous solution wasn’t designed to convey this information, and required manual intervention to extract these hidden insights from multiple reports.

With the new dashboards embedded directly into TalentReef’s customer view, the development team is able to streamline their data ingestion process to ensure up-to-date data is available to their customers within the TalentReef platform. QuickSight features such as forecasts, cross-sheet filtering, and the ability to drill into underlying data allows customers to quickly see the value through different lenses.

Whenever a new feature was rolled out in the previous solution, it wasn’t possible to gauge the impact it had on applicants and new hires because it required a lot of manual work. Development teams had to provide a raw data file to internal users, upon request, to show the value of the new feature, and even then it was limited in how they could show value. With QuickSight, not only are they able to show the value of new features quickly, but they can do so without development intervention.

Data visualization helps business analysts scale client support

The sheer volume of our datasets made gathering insights a slow process. Not only that, but datasets weren’t accessible to a wide audience outside our team, such as partners, program managers, product managers, and so on. As a result, Business Intelligence Engineers (BIEs) spent a lot of time writing ad hoc queries, which then took a long time to run. When the insights were ready, BIEs were tasked with answering questions via manual processes that didn’t scale.

On September 6, 2022, TalentReef launched two new analytics dashboards, Applicant and Hire, which are embedded into their customer application. Since the launch, TalentReef has seen usage increase over 20% and has saved manual internal resources hours of their time putting together insights for their customer base during QBR calls that now can be accessed directly from the dashboards. With TalentReef’s previous tool, reports were unstable and would time out, which required development teams to troubleshoot and repair. Since implementing QuickSight, TalentReef has found efficiencies for both internal resources as well as customer hiring managers, and are confident in the ability to meet the demand of these users.

The following image demonstrates UTM parameters (Urchin Tracking Modules—a tracking device that helps get really specific with the traffic source). This dashboard enables TalentReef’s customer base to understand where their applicants are coming from, so they know where to invest their recruitment dollars (whether the applicants came from indeed.com, or google.com, and so on). This embedded dashboard even allows users to drill further into their data, understanding the name, date, location, and more that the UTM source is tied to.

UTM Parameters

QuickSight has allowed TalentReef to unlock insights that were not previously attainable, or very manual to derive, from their previous reporting tool. An example of this in the following image is the average time to review an application. In the war for talent, minutes can make a difference between finding the individuals needed to fill a position or letting them slip through the cracks. This type of information gives leadership advantage to know where to focus their attention and help win the war for talent in the hourly workforce.

Applicants over time

Unlock the power of applicant and hire data to get insights you never had before!

Our customers have been extremely impressed with our QuickSight dashboards because they provide information that was previously unavailable, without manual effort by development teams. The interactive nature of the QuickSight dashboards allows TalentReef’s customer base to dive deeper into the applicants and hired candidates, for example to understand from where an applicant came from or how an applicant applied to a job posting.

With QuickSight, not only can we visualize applicant and hire data in multiple, meaningful ways for our customer base, but also we can help them see the ROI from additional products they’ve added on to the platform. In the following example, we have a variety of filters that allow clients to see if their sponsorship dollars are returning successful hiring applications, if their add-on of chat apply brings higher application volume, if the applicant came from text to apply, and more.

dashboard controls
Applicant report

Innovating faster with intuitive UI, increasing customer satisfaction

QuickSight enables TalentReef to innovate faster in response to customer feedback. With the intuitive UI and native data lake connections of QuickSight, TalentReef’s product team is able to quickly build visualizations based off the needs and wants of all their customers.

TalentReef’s previous reporting tool required manual efforts from development teams. Enhancements and bug fixes required prioritization against other initiatives and had a higher likelihood of error. With QuickSight, TalentReef was able to set up a data lake that allows dashboards to be built and innovated on by the product team, freeing up development resources to continue on the highest priority. Developers get the data into the data lake, and then the product team pulls in the data into QuickSight and deploys it as needed. This has lead to higher customer satisfaction both internally and externally with the quick turnaround time.

The right people with the right information

In any type of HR space, the right level of data access is key to make sure you aren’t leaving yourself open to compliance issues. Our development team developed a solution that is able to be applied across all QuickSight dashboards using row-level security on the dataset.

TalentReef’s partnership with QuickSight has enabled us to unlock insights that were previously difficult or impossible to attain. We’ve allowed our customer base to know what is happening and why it is happening, and visualize data that is most impactful and important to them.

To learn more about how you can embed customized data visuals, interactive dashboards, and natural language querying into any application, visit Amazon QuickSight Embedded.


About the Authors

Alexander Plumb is a Product Manager at Mitratech. Alexander has been a product leader with over 5 years of experience leading to highly successful product launches that meet customer needs.

Bani Sharma is a Sr Solutions Architect with Amazon Web Services (AWS), based out of Denver, Colorado. As a Solutions Architect, she works with a large number of Small and Medium businesses, and provides technical guidance and solutions on AWS. She has an area of depth in Containers and Modernization. Prior to AWS, Bani worked in various technical roles for a large Telecom provider Dish Networks and worked as a Senior Developer for HSBC Bank Software development.

Brian Klein is a Sr Technical Account Manager with Amazon Web Services (AWS), helping digital native businesses utilize AWS services to bring value to their organizations. Brian has worked with AWS technologies for 9 years, designing and operating production internet-facing workloads, with a focus on security, availability, and resilience while demonstrating operational efficiency.

How SafetyCulture scales unpredictable dbt Cloud workloads in a cost-effective manner with Amazon Redshift

Post Syndicated from Anish Moorjani original https://aws.amazon.com/blogs/big-data/how-safetyculture-scales-unpredictable-dbt-cloud-workloads-in-a-cost-effective-manner-with-amazon-redshift/

This post is co-written by Anish Moorjani, Data Engineer at SafetyCulture.

SafetyCulture is a global technology company that puts the power of continuous improvement into everyone’s hands. Its operations platform unlocks the power of observation at scale, giving leaders visibility and workers a voice in driving quality, efficiency, and safety improvements.

Amazon Redshift is a fully managed data warehouse service that tens of thousands of customers use to manage analytics at scale. Together with price-performance, Amazon Redshift enables you to use your data to acquire new insights for your business and customers while keeping costs low.

In this post, we share the solution SafetyCulture used to scale unpredictable dbt Cloud workloads in a cost-effective manner with Amazon Redshift.

Use case

SafetyCulture runs an Amazon Redshift provisioned cluster to support unpredictable and predictable workloads. A source of unpredictable workloads is dbt Cloud, which SafetyCulture uses to manage data transformations in the form of models. Whenever models are created or modified, a dbt Cloud CI job is triggered to test the models by materializing the models in Amazon Redshift. To balance the needs of unpredictable and predictable workloads, SafetyCulture used Amazon Redshift workload management (WLM) to flexibly manage workload priorities.

With plans for further growth in dbt Cloud workloads, SafetyCulture needed a solution that does the following:

  • Caters for unpredictable workloads in a cost-effective manner
  • Separates unpredictable workloads from predictable workloads to scale compute resources independently
  • Continues to allow models to be created and modified based on production data

Solution overview

The solution SafetyCulture used is comprised of Amazon Redshift Serverless and Amazon Redshift Data Sharing, along with the existing Amazon Redshift provisioned cluster.

Amazon Redshift Serverless caters to unpredictable workloads in a cost-effective manner because compute cost is not incurred when there is no workload. You pay only for what you use. In addition, moving unpredictable workloads into a separate Amazon Redshift data warehouse allows each Amazon Redshift data warehouse to scale resources independently.

Amazon Redshift Data Sharing enables data access across Amazon Redshift data warehouses without having to copy or move data. Therefore, when a workload is moved from one Amazon Redshift data warehouse to another, the workload can continue to access data in the initial Amazon Redshift data warehouse.

The following figure shows the solution and workflow steps:

  1. We create a serverless instance to cater for unpredictable workloads. Refer to Managing Amazon Redshift Serverless using the console for setup steps.
  2. We create a datashare called prod_datashare to allow the serverless instance access to data in the provisioned cluster. Refer to Getting started data sharing using the console for setup steps. Database names are identical to allow queries with full path notation database_name.schema_name.object_name to run seamlessly in both data warehouses.
  3. dbt Cloud connects to the serverless instance and models, created or modified, are tested by being materialized in the default database dev, in either each users’ personal schema or a pull request related schema. Instead of dev, you can use a different database designated for testing. Refer to Connect dbt Cloud to Redshift for setup steps.
  4. You can query materialized models in the serverless instance with materialized models in the provisioned cluster to validate changes. After you validate the changes, you can implement models in the serverless instance in the provisioned cluster.

Outcome

SafetyCulture carried out the steps to create the serverless instance and datashare, with integration to dbt Cloud, with ease. SafetyCulture also successfully ran its dbt project with all seeds, models, and snapshots materialized into the serverless instance via run commands from the dbt Cloud IDE and dbt Cloud CI jobs.

Regarding performance, SafetyCulture observed dbt Cloud workloads completing on average 60% faster in the serverless instance. Better performance could be attributed to two areas:

  • Amazon Redshift Serverless measures compute capacity using Redshift Processing Units (RPUs). Because it costs the same to run 64 RPUs in 10 minutes and 128 RPUs in 5 minutes, having a higher number of RPUs to complete a workload sooner was preferred.
  • With dbt Cloud workloads isolated on the serverless instance, dbt Cloud was configured with more threads to allow materialization of more models at once.

To determine cost, you can perform an estimation. 128 RPUs provides approximately the same amount of memory that an ra3.4xlarge 21-node provisioned cluster provides. In US East (N. Virginia), the cost of running a serverless instance with 128 RPUs is $48 hourly ($0.375 per RPU hour * 128 RPUs). In the same Region, the cost of running an ra3.4xlarge 21-node provisioned cluster on demand is $68.46 hourly ($3.26 per node hour * 21 nodes). Therefore, an accumulated hour of unpredictable workloads on a serverless instance is 29% more cost-effective than an on-demand provisioned cluster. Calculations in this example should be recalculated when performing future cost estimations because prices may change over time.

Learnings

SafetyCulture had two key learnings to better integrate dbt with Amazon Redshift, which can be helpful for similar implementations.

First, when integrating dbt with an Amazon Redshift datashare, configure INCLUDENEW=True to ease management of database objects in a schema:

ALTER DATASHARE datashare_name SET INCLUDENEW = TRUE FOR SCHEMA schema;

For example, assume the model customers.sql is materialized by dbt as the view customers. Next, customers is added to a datashare. When customers.sql is modified and rematerialized by dbt, dbt creates a new view with a temporary name, drops customers, and renames the new view to customers. Although the new view carries the same name, it’s a new database object that wasn’t added to the datashare. Therefore, customers is no longer found in the datashare.

Configuring INCLUDENEW=True allows new database objects to be automatically added to the datashare. An alternative to configuring INCLUDENEW=True and providing more granular control is the use of dbt post-hook.

Second, when integrating dbt with more than one Amazon Redshift data warehouse, define sources with database to aid dbt in evaluating the right database.

For example, assume a dbt project is used across two dbt Cloud environments to isolate production and test workloads. The dbt Cloud environment for production workloads is configured with the default database prod_db and connects to a provisioned cluster. The dbt Cloud environment for test workloads is configured with the default database dev and connects to a serverless instance. In addition, the provisioned cluster contains the table prod_db.raw_data.sales, which is made available to the serverless instance via a datashare as prod_db′.raw_data.sales.

When dbt compiles a model containing the source {{ source('raw_data', 'sales') }}, the source is evaluated as database.raw_data.sales. If database is not defined for sources, dbt sets the database to the configured environment’s default database. Therefore, the dbt Cloud environment connecting to the provisioned cluster evaluates the source as prod_db.raw_data.sales, while the dbt Cloud environment connecting to the serverless instance evaluates the source as dev.raw_data.sales, which is incorrect.

Defining database for sources allows dbt to consistently evaluate the right database across different dbt Cloud environments, because it removes ambiguity.

Conclusion

After testing Amazon Redshift Serverless and Data Sharing, SafetyCulture is satisfied with the result and has started productionalizing the solution.

“The PoC showed the vast potential of Redshift Serverless in our infrastructure,” says Thiago Baldim, Data Engineer Team Lead at SafetyCulture. “We could migrate our pipelines to support Redshift Serverless with simple changes to the standards we were using in our dbt. The outcome provided a clear picture of the potential implementations we could do, decoupling the workload entirely by teams and users and providing the right level of computation power that is fast and reliable.”

Although this post specifically targets unpredictable workloads from dbt Cloud, the solution is also relevant for other unpredictable workloads, including ad hoc queries from dashboards. Start exploring Amazon Redshift Serverless for your unpredictable workloads today.


About the authors

Anish Moorjani is a Data Engineer in the Data and Analytics team at SafetyCulture. He helps SafetyCulture’s analytics infrastructure scale with the exponential increase in the volume and variety of data.

Randy Chng is an Analytics Solutions Architect at Amazon Web Services. He works with customers to accelerate the solution of their key business problems.

How Infomedia built a serverless data pipeline with change data capture using AWS Glue and Apache Hudi

Post Syndicated from Gowtham Dandu original https://aws.amazon.com/blogs/big-data/how-infomedia-built-a-serverless-data-pipeline-with-change-data-capture-using-aws-glue-and-apache-hudi/

This is a guest post co-written with Gowtham Dandu from Infomedia.

Infomedia Ltd (ASX:IFM) is a leading global provider of DaaS and SaaS solutions that empowers the data-driven automotive ecosystem. Infomedia’s solutions help OEMs, NSCs, dealerships and 3rd party partners manage the vehicle and customer lifecycle. They are used by over 250,000 industry professionals, across 50 OEM brands and in 186 countries to create a convenient customer journey, drive dealer efficiencies and grow sales.

In this post, we share how Infomedia built a serverless data pipeline with change data capture (CDC) using AWS Glue and Apache Hudi.

Infomedia was looking to build a cloud-based data platform to take advantage of highly scalable data storage with flexible and cloud-native processing tools to ingest, transform, and deliver datasets to their SaaS applications. The team wanted to set up a serverless architecture with scale-out capabilities that would allow them to optimize time, cost, and performance of the data pipelines and eliminate most of the infrastructure management.

To serve data to their end-users, the team wanted to develop an API interface to retrieve various product attributes on demand. Performance and scalability of both the data pipeline and API endpoint were key success criteria. The data pipeline needed to have sufficient performance to allow for fast turnaround in the event that data issues needed to be corrected. Finally, the API endpoint performance was important for end-user experience and customer satisfaction. When designing the data processing pipeline for the attribute API, the Infomedia team wanted to use a flexible and open-source solution for processing data workloads with minimal operational overhead.

They saw an opportunity to use AWS Glue, which offers a popular open-source big data processing framework, and Apache Spark, in a serverless environment for end-to-end pipeline development and deployment.

Solution overview

The solution involved ingesting data from various third-party sources in different formats, processing to create a semantic layer, and then exposing the processed dataset as a REST API to end-users. The API retrieves data at runtime from an Amazon Aurora PostgreSQL-Compatible Edition database for end-user consumption. To populate the database, the Infomedia team developed a data pipeline using Amazon Simple Storage Service (Amazon S3) for data storage, AWS Glue for data transformations, and Apache Hudi for CDC and record-level updates. They wanted to develop a simple incremental data processing pipeline without having to update the entire database each time the pipeline ran. The Apache Hudi framework allowed the Infomedia team to maintain a golden reference dataset and capture changes so that the downstream database could be incrementally updated in a short timeframe.

To implement this modern data processing solution, Infomedia’s team chose a layered architecture with the following steps:

  1. The raw data originates from various third-party sources and is a collection of flat files with a fixed width column structure. The raw input data is stored in Amazon S3 in JSON format (called the bronze dataset layer).
  2. The raw data is converted to an optimized Parquet format using AWS Glue. The Parquet data is stored in a separate Amazon S3 location and serves as the staging area during the CDC process (called the silver dataset layer). The Parquet format results in improved query performance and cost savings for downstream processing.
  3. AWS Glue reads the Parquet file from the staging area and updates Apache Hudi tables stored in Amazon S3 (the golden dataset layer) as part of incremental data processing. This process helps create mutable datasets on Amazon S3 to store the versioned and latest set of records.
  4. Finally, AWS Glue is used to populate Amazon Aurora PostgreSQL-Compatible Edition with the latest version of the records. This dataset is used to serve the API endpoint. The API itself is a Spring Java application deployed as a Docker container in an Amazon Elastic Container Service (Amazon ECS) AWS Fargate environment.

The following diagram illustrates this architecture.

arch diag

AWS Glue and Apache Hudi overview

AWS Glue is a serverless data integration service that makes it easy to prepare and process data at scale from a wide variety of data sources. With AWS Glue, you can ingest data from multiple data sources, extract and infer schema, populate metadata in a centralized data catalog, and prepare and transform data for analytics and machine learning. AWS Glue has a pay-as-you-go model with no upfront costs, and you only pay for resources that you consume.

Apache Hudi is an open-source data management framework used to simplify incremental data processing and data pipeline development by providing record-level insert, update, upsert, and delete capabilities. It allows you to comply with data privacy laws, manage CDC operations, reinstate late-arriving data, and roll back to a particular point in time. You can use AWS Glue to build a serverless Apache Spark-based data pipeline and take advantage of the AWS Glue native connector for Apache Hudi at no cost to manage CDC operations with record-level insert, updates, and deletes.

Solution benefits

Since the start of Infomedia’s journey with AWS Glue, the Infomedia team has experienced several benefits over the self-managed extract, transform, and load (ETL) tooling. With the horizontal scaling of AWS Glue, they were able to seamlessly scale the compute capacity of their data pipeline workloads by a factor of 5. This allowed them to increase both the volume of records and the number of datasets they could process for downstream consumption. They were also able to take advantage of AWS Glue built-in optimizations, such as pre-filtering using pushdown predicates, which allowed the team to save valuable engineering time tuning the performance of data processing jobs.

In addition, Apache Spark-based AWS Glue enabled developers to author jobs using concise Spark SQL and dataset APIs. This allowed for rapid upskilling of developers who are already familiar with database programming. Because developers are working with higher-level constructs across entire datasets, they spend less time solving for low-level technical implementation details.

Also, the AWS Glue platform has been cost-effective when compared against running self-managed Apache Spark infrastructure. The team did an initial analysis that showed an estimated savings of 70% over running a dedicated Spark EC2 infrastructure for their workload. Furthermore, the AWS Glue Studio job monitoring dashboard provides the Infomedia team with detailed job-level visibility that makes it easy to get a summary of the job runs and understand data processing costs.

Conclusion and next steps

Infomedia will continue to modernize their complex data pipelines using the AWS Glue platform and other AWS Analytics services. Through integration with services such as AWS Lake Formation and the AWS Glue Data Catalog, the Infomedia team plans to maintain reference primary datasets and democratize access to high-value datasets, allowing for further innovation.

If you would like to learn more, please visit AWS Glue and AWS Lake Formation to get started on your data integration journey.


About the Authors

Gowtham Dandu is an Engineering Lead at Infomedia Ltd with a passion for building efficient and effective solutions on the cloud, especially involving data, APIs, and modern SaaS applications. He specializes in building microservices and data platforms that are cost-effective and highly scalable.

Praveen Kumar is a Specialist Solution Architect at AWS with expertise in designing, building, and implementing modern data and analytics platforms using cloud-native services. His areas of interests are serverless technology, streaming applications, and modern cloud data warehouses.
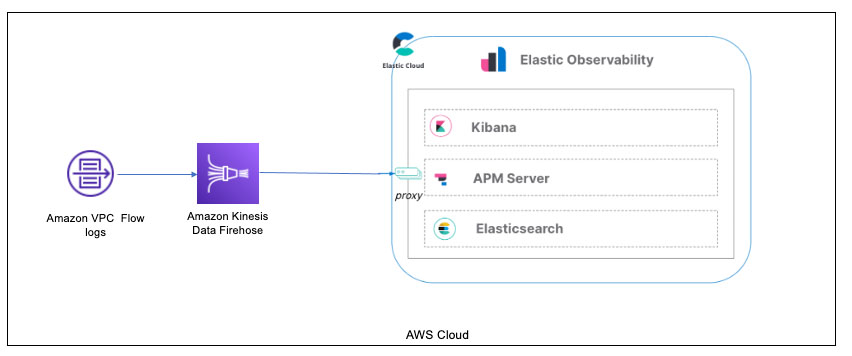
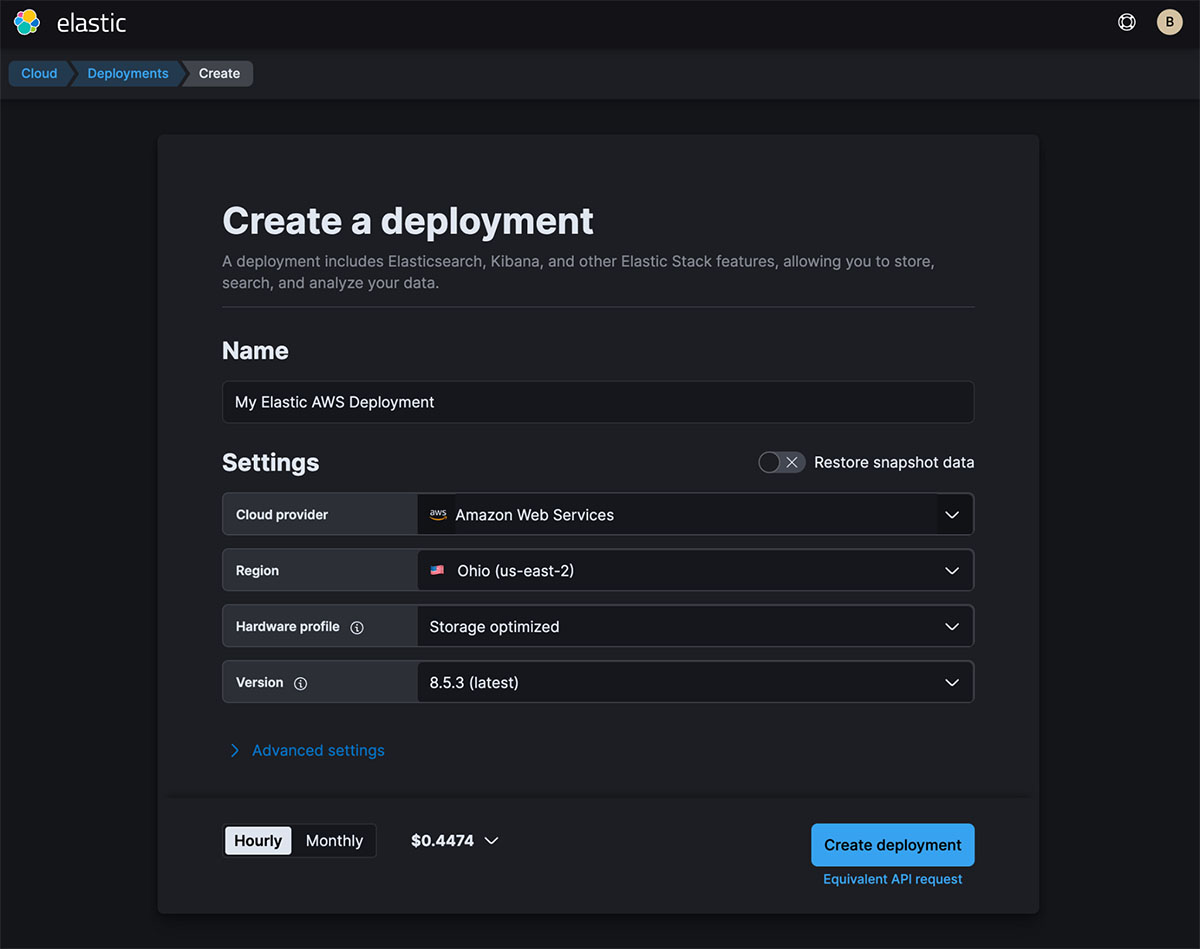
Accelerate data insights with Elastic and Amazon Kinesis Data Firehose

Post Syndicated from Udayasimha Theepireddy original https://aws.amazon.com/blogs/big-data/accelerate-data-insights-with-elastic-and-amazon-kinesis-data-firehose/

This is a guest post co-written with Udayasimha Theepireddy from Elastic.

Processing and analyzing log and Internet of Things (IoT) data can be challenging, especially when dealing with large volumes of real-time data. Elastic and Amazon Kinesis Data Firehose are two powerful tools that can help make this process easier. For example, by using Kinesis Data Firehose to ingest data from IoT devices, you can stream data directly into Elastic for real-time analysis. This can help you identify patterns and anomalies in the data as they happen, allowing you to take action in real time. Additionally, by using Elastic to store and analyze log data, you can quickly search and filter through large volumes of log data to identify issues and troubleshoot problems.

In this post, we explore how to integrate Elastic and Kinesis Data Firehose to streamline log and IoT data processing and analysis. We walk you through a step-by-step example of how to send VPC flow logs to Elastic through Kinesis Data Firehose.

Solution overview

Elastic is an AWS ISV Partner that helps you find information, gain insights, and protect your data when you run on AWS. Elastic offers enterprise search, observability, and security features that are built on a single, flexible technology stack that can be deployed anywhere.

Kinesis Data Firehose is a popular service that delivers streaming data from over 20 AWS services such as AWS IoT Core and Amazon CloudWatch logs to over 15 analytical and observability tools such as Elastic. Kinesis Data Firehose provides a fast and easy way to send your VPC flow logs data to Elastic in minutes without a single line of code and without building or managing your own data ingestion and delivery infrastructure.

VPC flow logs capture the traffic information going to and from your network interfaces in your VPC. With the launch of Kinesis Data Firehose support to Elastic, you can analyze your VPC flow logs with just a few clicks. Kinesis Data Firehose provides a true end-to-end serverless mechanism to deliver your flow logs to Elastic, where you can use Elastic Dashboards to search through those logs, create dashboards, detect anomalies, and send alerts. VPC flow logs help you to answer questions like what percentage of your traffic is getting dropped, and how much traffic is getting generated for specific sources and destinations.

Integrating Elastic and Kinesis Data Firehose is a straightforward process. There are no agents and beats. Simply configure your Firehose delivery stream to send its data to Elastic’s endpoint.

The following diagram depicts this specific configuration of how to ingest VPC flow logs via Kinesis Data Firehose into Elastic.

In the past, users would have to use an AWS Lambda function to transform the incoming data from VPC flow logs into an Amazon Simple Storage Service (Amazon S3) bucket before loading it into Kinesis Data Firehose or create a CloudWatch Logs subscription that sends any incoming log events that match defined filters to the Firehose delivery stream.

With this new integration, you can set up this configuration directly from your VPC flow logs to Kinesis Data Firehose and into Elastic Cloud. (Note that Elastic Cloud must be deployed on AWS.)

Let’s walk through the details of configuring Kinesis Data Firehose and Elastic, and demonstrate ingesting data.

Prerequisites

To set up this demonstration, make sure you have the following prerequisites:

We walk through installing general AWS integration components into the Elastic Cloud deployment to ensure Kinesis Data Firehose connectivity. Refer to the full list of services supported by the Elastic/AWS integration for more information.

Deploy Elastic on AWS

Follow the instructions on the Elastic registration page to get started on Elastic Cloud.

Once logged in to Elastic Cloud, create a deployment on AWS. It’s important to ensure that the deployment is on AWS. The Firehose delivery stream connects specifically to an endpoint that needs to be on AWS.

After you create your deployment, copy the Elasticsearch endpoint to use in a later step.

The endpoint should be an AWS endpoint, such as https://thevaa-cluster-01.es.us-east-1.aws.found.io.

Enable Elastic’s AWS integration

In your deployment’s Elastic Integration section, navigate to the AWS integration and choose Install AWS assets.

Configure a Firehose delivery stream

Create a new delivery stream on the Kinesis Data Firehose console. This is where you provide the endpoint you saved earlier. Refer to the following screenshot for the destination settings, and for more details, refer to Choose Elastic for Your Destination.

In this example, we are pulling in VPC flow logs via the data stream parameter we added (logs-aws.vpcflow-default). The parameter es_datastream_name can be configured with one of the following types of logs:

  • logs-aws.cloudfront_logs-defaultAWS CloudFront logs
  • logs-aws.ec2_logs-defaultAmazon Elastic Compute Cloud (Amazon EC2) logs in CloudWatch
  • logs-aws.elb_logs-defaultElastic Load Balancing logs
  • logs-aws.firewall_logs-defaultAWS Network Firewall logs
  • logs-aws.route53_public_logs-defaultAmazon Route 53 public DNS queries logs
  • logs-aws.route53_resolver_logs-default – Route 53 DNS queries and responses logs
  • logs-aws.s3access-default – Amazon S3 server access log
  • logs-aws.vpcflow-default – VPC flow logs
  • logs-aws.waf-defaultAWS WAF logs

Deploy your application

Follow the instructions on the GitHub repo and instructions in the AWS Three Tier Web Architecture workshop to deploy your application.

After you install the app, get your credentials from AWS to use with Elastic’s AWS integration.

There are several options for credentials:

  • Use access keys directly
  • Use temporary security credentials
  • Use a shared credentials file
  • Use an AWS Identity and Access Management (IAM) role Amazon Resource Name (ARN)

For more details, refer to AWS Credentials and AWS Permissions.

Configure VPC flow logs to send to Kinesis Data Firehose

In the VPC for the application you deployed, you need to configure your VPC flow logs and point them to the Firehose delivery stream.

Validate the VPC flow logs

In the Elastic Observability view of the log streams, you should see the VPC flow logs coming in after a few minutes, as shown in the following screenshot.

Analyze VPC flow logs in Elastic

Now that you have VPC flow logs in Elastic Cloud, how can you analyze them? There are several analyses you can perform on the VPC flow log data:

  • Use Elastic’s Analytics Discover capabilities to manually analyze the data
  • Use Elastic Observability’s anomaly feature to identify anomalies in the logs
  • Use an out-of-the-box dashboard to further analyze the data

Use Elastic’s Analytics Discover to manually analyze data

In Elastic Analytics, you can search and filter your data, get information about the structure of the fields, and display your findings in a visualization. You can also customize and save your searches and place them on a dashboard.

For a complete understanding of Discover and all of Elastic’s Analytics capabilities, refer to Discover.

For VPC flow logs, it’s important to understand the following:

  • How many logs were accepted or rejected
  • Where potential security violations occur (source IPs from outside the VPC)
  • What port is generally being queried

For our example, we filter the logs on the following:

  • Delivery stream nameAWS-3-TIER-APP-VPC-LOGS
  • VPC flow log actionREJECT
  • Time frame – 5 hours
  • VPC network interface – Webserver 1 and Webserver 2 interfaces

We want to see what IP addresses are trying to hit our web servers. From that, we want to understand which IP addresses we’re getting the most REJECT actions from. We simply find the source.ip field and can quickly get a breakdown that shows 185.156.73.54 is the most rejected for the last 3 or more hours we’ve turned on VPC flow logs.

Additionally, we can create a visualization by choosing Visualize. We get the following donut chart, which we can add to a dashboard.

Additionally to IP addresses, we want to also see what port is being hit on our web servers.

We select the destination port field, and the pop-up shows us that port 8081 is being targeted. This port is generally used for the administration of Apache Tomcat. This is a potential security issue, however port 8081 is turned off for outside traffic, hence the REJECT.

Detect anomalies in Elastic Observability logs

In addition to Discover, Elastic Observability provides the ability to detect anomalies on logs using machine learning (ML). The feature has the following options:

  • Log rate – Automatically detects anomalous log entry rates
  • Categorization – Automatically categorizes log messages

For our VPC flow log, we enabled both features. When we look at what was detected for anomalous log entry rates, we get the following results.

Elastic immediately detected a spike in logs when we turned on VPC flow logs for our application. The rate change is being detected because we’re also ingesting VPC flow logs from another application for a couple of days prior to adding the application in this post.

We can drill down into this anomaly with ML and analyze further.

To learn more about the ML analysis you can utilize with your logs, refer to Machine learning.

Because we know that a spike exists, we can also use the Elastic AIOps Labs Explain Log Rate Spikes capability. Additionally, we’ve grouped them to see what is causing some of the spikes.

In the preceding screenshot, we can observe that a specific network interface is sending more VPC log flows than others. We can drill down into this further in Discover.

Use the VPC flow log dashboard

Finally, Elastic also provides an out-of-the-box dashboard to show the top IP addresses hitting your VPC, geographically where they are coming from, the time series of the flows, and a summary of VPC flow log rejects within the time frame.

You can enhance this baseline dashboard with the visualizations you find in Discover, as we discussed earlier.

Conclusion

This post demonstrated how to configure an integration with Kinesis Data Firehose and Elastic for efficient infrastructure monitoring of VPC flow logs in Elastic Kibana dashboards. Elastic offers flexible deployment options on AWS, supporting software as a service (SaaS), AWS Marketplace, and bring your own license (BYOL) deployments. Elastic also provides AWS Marketplace private offers. You have the option to deploy and run the Elastic Stack yourself within your AWS account, either free or with a paid subscription from Elastic. To get started, visit the Kinesis Data Firehose console and specify Elastic as the destination. To learn more, explore the Amazon Kinesis Data Firehose Developer Guide.


About the Authors

Udayasimha Theepireddy is an Elastic Principal Solution Architect, where he works with customers to solve real world technology problems using Elastic and AWS services. He has a strong background in technology, business, and analytics.

Antony Prasad Thevaraj is a Sr. Partner Solutions Architect in Data and Analytics at AWS. He has over 12 years of experience as a Big Data Engineer, and has worked on building complex ETL and ELT pipelines for various business units.

Mostafa Mansour is a Principal Product Manager – Tech at Amazon Web Services where he works on Amazon Kinesis Data Firehose. He specializes in developing intuitive product experiences that solve complex challenges for customers at scale. When he’s not hard at work on Amazon Kinesis Data Firehose, you’ll likely find Mostafa on the squash court, where he loves to take on challengers and perfect his dropshots.

Identify and remediate security threats to your business using security analytics with Amazon OpenSearch Service

Post Syndicated from Kevin Fallis original https://aws.amazon.com/blogs/big-data/identify-and-remediate-security-threats-to-your-business-using-security-analytics-with-amazon-opensearch-service/

Recently, one of the largest wireless carriers in North America revealed that hackers compromised a database of its customer information through unauthorized use of an API and acquired the personal details of millions of individuals, including names, addresses, phone numbers, and account numbers. Once identified, the company halted the malicious activity. However, investigations indicated that the data breach likely occurred months prior to being detected.

With the ever-increasing volume of data that organizations store in the cloud, malicious threats to their business sensitive data and resources will continue to grow alongside their online activity. Adversaries, also known as attackers, continue to use a variety of techniques to breach an organization’s security and compromise their systems, which can cause significant financial losses or damage to reputation or have legal consequences for the affected organization. To mitigate the damage caused, it is critically important for organizations to protect themselves by implementing various security measures and deploying tools to detect and respond to security threats. By being proactive, organizations can significantly reduce the risk of being victimized by cyber adversaries.

Amazon OpenSearch Service is a fully managed and scalable log analytics framework that you can use to ingest, store, and visualize data. You can use OpenSearch Service for a diverse set of data workloads including healthcare data, financial transactions information, application performance data, observability data, and much more. This managed service is valued for its ingest performance, scalability, low query latency, and its ability to analyze large datasets.

Security analytics with OpenSearch Service

Today, OpenSearch Service announces OpenSearch-powered security analytics, which includes features to monitor, analyze, and respond to potential security threats to your critical infrastructure. In this post, we discuss these new features and how to identify and remediate security threats.

Security analytics provide real-time visibility into potential threats across your infrastructure, enabling you to respond to security incidents quickly, thereby reducing the impact of any security breaches. It can also help you meet regulatory compliance requirements and improve your overall security posture.

Security analytics with OpenSearch is designed to gain visibility into a company’s infrastructure, monitor for anomalous activity, help detect potential security threats in real time, and trigger alerts to pre-configured destinations. You can monitor for malicious activity from your security event logs by continuously evaluating out-of-the-box security rules, and review auto generated security findings to aid your investigation. In addition, security analytics can generate automated alerts and send to a preconfigured destination of your choice such as Slack or email.

Security analytics is powered by the open-source OpenSearch project and deployed on OpenSearch Service with OpenSearch version 2.5 or higher. It includes the following key features:

  • Out-of-the-box support for over 2,200 open-source Sigma security rules
  • Support for log sources such as Windows, NetFlow, AWS CloudTrail, DNS, AD/LDAP, and more
  • Detectors that auto generate findings based on the Sigma rules
  • Automated alerts sent to preconfigured destinations
  • A rules editor to create new custom rules or modify existing rules
  • Visualizations to summarize findings and alerts trends

Sigma rules

Sigma is a generic signature format, expressed using YAML (yet another markup language), to describe significant events that occur in your logs in a simple and straightforward way. The format is portable across different SIEM implementations and fosters a community of threat hunters, so that you don’t have to reinvent the wheel if you change your SIEM implementation.

An example of a simple rule to detect the run of C:\Windows\System32\rundll32.exe, one of the most commonly used methods for launching malicious code on a Windows platform, could be the following YAML configuration:

title: Rundll32 execution
description: Detects a rundll32.exe execution
references:
      - https://attack.mitre.org/techniques/T1218/011/
author: Captain Threathunter
date: 2023/03/05
logsource:
    category: process_creation
    product: windows
detection:
    selection:
        winlog-event_data-ProcessName: 'C:\Windows\System32\rundll32.exe'
    condition: selection
level: high
status: test

After you import this rule into the security analytics rules repository and enable it with your detector, it auto generates a security finding when the preceding condition matches an incoming event log.

Security analytics components and concepts

The security analytics offering includes a number of tools and features elemental to its operation. The major components that comprise the plugin are summarized in the following sections.

Log types

OpenSearch supports several types of logs and provides out-of-the-box mappings for each. The log type is specified during the creation of a detector and includes the ability to customize field mappings for that detector. For a log type selected in a detector, security analytics automatically enables a relevant set of rules that run at the configured interval.

Detectors

Detectors are core components that you configure to identify a range of cybersecurity threats for a log type, across your data indexes. Detectors use custom rules and pre-packaged Sigma rules to evaluate events occurring in the system, automatically generating security findings from these events.

Rules

Rules, or threat detection rules, define the conditions applied to ingested log data to identify a security event. Security analytics provides prepackaged, open-source Sigma rules to detect common threats from your logs. Security analytics also supports importing, creating, and customizing rules to meet your requirements. Many rules are also mapped to an ever-growing knowledge base of adversary tactics and techniques maintained by the MITRE ATT&CK organization. You can take advantage of these options using either OpenSearch Dashboards or the APIs.

Findings

Findings are generated every time a detector matches a rule with a log event. Findings don’t necessarily point to imminent threats within the system, but they isolate an event of interest. Because they represent the result of a specific matched condition in a detector rule, findings include a unique combination of select rules, a log type, and a rule severity.

Alerts

When defining a detector, you can specify one or more conditions that trigger an alert. When an event triggers an alert, the system sends a notification to a preferred channel, such as Slack or email. The alert can be triggered when the detector matches one or multiple rules. You can also create a notification message with a customized subject line and message body.

Taking the tool for a test drive

With an understanding of these fundamental concepts, let’s navigate to the security analytics interface in OpenSearch Dashboards. Security analytics also provides a robust set of configuration APIs.

Overview page

After you have logged in to OpenSearch Dashboards and navigate to the security analytics overview page, you’re presented with the current state of the detectors you are monitoring. You can see a summary view comprised of multiple visualizations. The following chart, for example, shows the findings and alerts trend for various log types over a given period of time.

As you scroll down on the summary page, you can review your most recent findings and alerts.

Additionally, you can see a distribution of the most frequently triggered rules across all the active detectors. This can help you detect and investigate different types of malicious activities across log types.

Finally, you can view the status of configured detectors. From this panel, you can also navigate to the create detector workflow.

Creating a detector

In the previous section, we reviewed the overview page. Now, let’s walkthrough the create detector workflow. One of the best things about security analytics are the prepackaged rules. You don’t have to write your own. You can use the prepackaged rules to get up and running quickly! In the following example, we show you how to create a detector with prepackaged rules for your Windows logs.

  1. In the Dashboards navigation pane, under Security Analytics, choose Detectors.
  2. Choose Create Detector to create a new detector.
    1. First, give it a name and a data source to query. The data source can be a pattern or specific index.
    2. When you select a Log type, all matching rules are automatically loaded and enabled by default. In this example, we select Windows logs to help narrow the set of rules applied to this detector. As an optional step, you can choose to selectively enable or disable one or more rules. See an example rules selection panel below.
    3. Specify a schedule to run the rules and select Next.
    4. Configure any necessary field mappings per your rule.
      You have two field mapping sections to optionally review. Default mapped fields provide pre-configured field mappings for the specific log type and enabled rules; you can skip this section unless you need to change the mappings. Additional mappings can be configured in the Pending field mappings section.
  3. Configure the alerts.
    The final step of setting up a detector is to configure the alerts and review your configuration. Note that each detector can generate multiple findings or alerts, and you have the option to customize the alert destination based on a rule match criterion such as severity, tags etc. In this example, we show you how to match a single rule that monitors a password dump to a host file system (QuarksPwDumps Dump File) and send the alert to a destination of your choice.

    1. First, define the name of the alert.
    2. Set up the criticality based on configurations in the rule and select the tags.
    3. Give the alert a severity and select a channel.
      If you need to create a new channel, there is a breadcrumb that sends you to the Notifications feature. You can create additional channels needed.
    4. Review the configuration and Create the detector. Once the detector is active, any time a rule is matched for your incoming logs, it will automatically generate a security finding and alert (if configured).

Configuring custom rules

One of the key capabilities of security analytics is defining custom rules and being able to import rules created by others such as a community of threat hunters.  As mentioned before, security analytics includes over 2200 rules out of the box.  In some cases, you may want to create your own rules.  If you navigate to the Rules page, you have the option to create your own rule.

The rules editor allows you to provide a custom rule that it will automatically validate. Once created, the rule is included in the rules library, helping you to customize your threat hunting needs.

Conclusion

Many organizations struggle with the high cost of commercial alternatives and are required to duplicate their data across multiple systems that generate specific insights. OpenSearch Service security analytics provides an open-source alternative to businesses that seek to reduce the cost of their security products. There is no additional charge for security analytics, and you can customize it to meet the security requirements of your organization. With simple workflows and prepackaged security content, security analytics enables your security teams to detect potential threats quickly while providing the tools to help with security investigations.

To get started, create or upgrade your existing Amazon OpenSearch Service domain to OpenSearch version 2.5. To learn more about security analytics, see documentation.


About the Authors

Kevin Fallis (@AWSCodeWarrior) is an Principal AWS Specialist Search Solutions Architect.  His passion at AWS is to help customers leverage the correct mix of AWS services to achieve success for their business goals. His after-work activities include family, DIY projects, carpentry, playing drums, and all things music.

Jimish Shah is a Senior Product Manager at AWS with 15+ years of experience bringing products to market in log analytics, cybersecurity, and IP video streaming. He’s passionate about launching products that offer delightful customer experiences, and solve complex customer problems. In his free time, he enjoys exploring cafes, hiking, and taking long walks
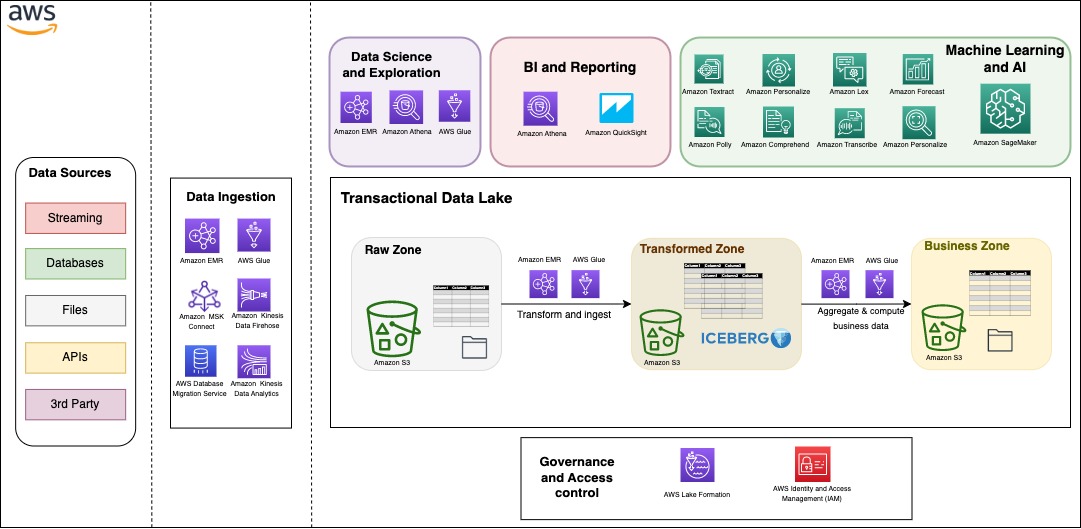
Build a serverless transactional data lake with Apache Iceberg, Amazon EMR Serverless, and Amazon Athena

Post Syndicated from Houssem Chihoub original https://aws.amazon.com/blogs/big-data/build-a-serverless-transactional-data-lake-with-apache-iceberg-amazon-emr-serverless-and-amazon-athena/

Since the deluge of big data over a decade ago, many organizations have learned to build applications to process and analyze petabytes of data. Data lakes have served as a central repository to store structured and unstructured data at any scale and in various formats. However, as data processing at scale solutions grow, organizations need to build more and more features on top of their data lakes. One important feature is to run different workloads such as business intelligence (BI), Machine Learning (ML), Data Science and data exploration, and Change Data Capture (CDC) of transactional data, without having to maintain multiple copies of data. Additionally, the task of maintaining and managing files in the data lake can be tedious and sometimes complex.

Table formats like Apache Iceberg provide solutions to these issues. They enable transactions on top of data lakes and can simplify data storage, management, ingestion, and processing. These transactional data lakes combine features from both the data lake and the data warehouse. You can simplify your data strategy by running multiple workloads and applications on the same data in the same location. However, using these formats requires building, maintaining, and scaling infrastructure and integration connectors that can be time-consuming, challenging, and costly.

In this post, we show how you can build a serverless transactional data lake with Apache Iceberg on Amazon Simple Storage Service (Amazon S3) using Amazon EMR Serverless and Amazon Athena. We provide an example for data ingestion and querying using an ecommerce sales data lake.

Apache Iceberg overview

Iceberg is an open-source table format that brings the power of SQL tables to big data files. It enables ACID transactions on tables, allowing for concurrent data ingestion, updates, and queries, all while using familiar SQL. Iceberg employs internal metadata management that keeps track of data and empowers a set of rich features at scale. It allows you to time travel and roll back to old versions of committed data transactions, control the table’s schema evolution, easily compact data, and employ hidden partitioning for fast queries.

Iceberg manages files on behalf of the user and unlocks use cases such as:

  • Concurrent data ingestion and querying, including streaming and CDC
  • BI and reporting with expressive simple SQL
  • Empowering ML feature stores and training sets
  • Compliance and regulations workloads, such as GDPR find and forget
  • Reinstating late-arriving data, which is dimensions data arriving later than the fact data. For example, the reason for a flight delay may arrive well after the fact that the fligh is delayed.
  • Tracking data changes and rollback

Build your transactional data lake on AWS

You can build your modern data architecture with a scalable data lake that integrates seamlessly with an Amazon Redshift powered cloud warehouse. Moreover, many customers are looking for an architecture where they can combine the benefits of a data lake and a data warehouse in the same storage location. In the following figure, we show a comprehensive architecture that uses the modern data architecture strategy on AWS to build a fully featured transactional data lake. AWS provides flexibility and a wide breadth of features to ingest data, build AI and ML applications, and run analytics workloads without having to focus on the undifferentiated heavy lifting.

Data can be organized into three different zones, as shown in the following figure. The first zone is the raw zone, where data can be captured from the source as is. The transformed zone is an enterprise-wide zone to host cleaned and transformed data in order to serve multiple teams and use cases. Iceberg provides a table format on top of Amazon S3 in this zone to provide ACID transactions, but also to allow seamless file management and provide time travel and rollback capabilities. The business zone stores data specific to business cases and applications aggregated and computed from data in the transformed zone.

One important aspect to a successful data strategy for any organization is data governance. On AWS, you can implement a thorough governance strategy with fine-grained access control to the data lake with AWS Lake Formation.

Serverless architecture overview

In this section, we show you how to ingest and query data in your transactional data lake in a few steps. EMR Serverless is a serverless option that makes it easy for data analysts and engineers to run Spark-based analytics without configuring, managing, and scaling clusters or servers. You can run your Spark applications without having to plan capacity or provision infrastructure, while paying only for your usage. EMR Serverless supports Iceberg natively to create tables and query, merge, and insert data with Spark. In the following architecture diagram, Spark transformation jobs can load data from the raw zone or source, apply the cleaning and transformation logic, and ingest data in the transformed zone on Iceberg tables. Spark code can run instantaneously on an EMR Serverless application, which we demonstrate later in this post.

The Iceberg table is synced with the AWS Glue Data Catalog. The Data Catalog provides a central location to govern and keep track of the schema and metadata. With Iceberg, ingestion, update, and querying processes can benefit from atomicity, snapshot isolation, and managing concurrency to keep a consistent view of data.

Athena is a serverless, interactive analytics service built on open-source frameworks, supporting open-table and file formats. Athena provides a simplified, flexible way to analyze petabytes of data where it lives. To serve BI and reporting analysis, it allows you to build and run queries on Iceberg tables natively and integrates with a variety of BI tools.

Sales data model

Star schema and its variants are very popular for modeling data in data warehouses. They implement one or more fact tables and dimension tables. The fact table stores the main transactional data from the business logic with foreign keys to dimensional tables. Dimension tables hold additional complementary data to enrich the fact table.

In this post, we take the example of sales data from the TPC-DS benchmark. We zoom in on a subset of the schema with the web_sales fact table, as shown in the following figure. It stores numeric values about sales cost, ship cost, tax, and net profit. Additionally, it has foreign keys to dimensional tables like date_dim, time_dim, customer, and item. These dimensional tables store records that give more details. For instance, you can show when a sale took place by which customer for which item.

Dimension-based models have been used extensively to build data warehouses. In the following sections, we show how to implement such a model on top of Iceberg, providing data warehousing features on top of your data lake, and run different workloads in the same location. We provide a complete example of building a serverless architecture with data ingestion using EMR Serverless and Athena using TPC-DS queries.

Prerequisites

For this walkthrough, you should have the following prerequisites:

  • An AWS account
  • Basic knowledge about data management and SQL

Deploy solution resources with AWS CloudFormation

We provide an AWS CloudFormation template to deploy the data lake stack with the following resources:

  • Two S3 buckets: one for scripts and query results, and one for the data lake storage
  • An Athena workgroup
  • An EMR Serverless application
  • An AWS Glue database and tables on external public S3 buckets of TPC-DS data
  • An AWS Glue database for the data lake
  • An AWS Identity and Access Management (IAM) role and polices

Complete the following steps to create your resources:

  1. Launch the CloudFormation stack:

Launch Button

This automatically launches AWS CloudFormation in your AWS account with the CloudFormation template. It prompts you to sign in as needed.

  1. Keep the template settings as is.
  2. Check the I acknowledge that AWS CloudFormation might create IAM resources box.
  3. Choose Submit

When the stack creation is complete, check the Outputs tab of the stack to verify the resources created.

Upload Spark scripts to Amazon S3

Complete the following steps to upload your Spark scripts:

  1. Download the following scripts: ingest-iceberg.py and update-item.py.
  2. On the Amazon S3 console, go to the datalake-resources-<AccountID>-us-east-1 bucket you created earlier.
  3. Create a new folder named scripts.
  4. Upload the two PySpark scripts: ingest-iceberg.py and update-item.py.

Create Iceberg tables and ingest TPC-DS data

To create your Iceberg tables and ingest the data, complete the following steps:

  1. On the Amazon EMR console, choose EMR Serverless in the navigation pane.
  2. Choose Manage applications.
  3. Choose the application datalake-app.

  1. Choose Start application.

Once started, it will provision the pre-initialized capacity as configured at creation (one Spark driver and two Spark executors). The pre-initialized capacity are resources that will be provisioned when you start your application. They can be used instantly when you submit jobs. However, they incur charges even if they’re not used when the application is in a started state. By default, the application is set to stop when idle for 15 minutes.

Now that the EMR application has started, we can submit the Spark ingest job ingest-iceberg.py. The job creates the Iceberg tables and then loads data from the previously created AWS Glue Data Catalog tables on TPC-DS data in an external bucket.

  1. Navigate to the datalake-app.
  2. On the Job runs tab, choose Submit job.

  1. For Name, enter ingest-data.
  2. For Runtime role, choose the IAM role created by the CloudFormation stack.
  3. For Script location, enter the S3 path for your resource bucket (datalake-resource-<####>-us-east-1>scripts>ingest-iceberg.py).

  1. Under Spark properties, choose Edit in text.
  2. Enter the following properties, replacing <BUCKET_NAME> with your data lake bucket name datalake-<####>-us-east-1 (not datalake-resources)
--conf spark.executor.cores=2 --conf spark.executor.memory=4g --conf spark.driver.cores=2 --conf spark.driver.memory=8g --conf spark.executor.instances=2 --conf spark.jars=/usr/share/aws/iceberg/lib/iceberg-spark3-runtime.jar --conf spark.sql.extensions=org.apache.iceberg.spark.extensions.IcebergSparkSessionExtensions --conf spark.sql.catalog.dev.warehouse=s3://<BUCKET_NAME>/warehouse --conf spark.sql.catalog.dev=org.apache.iceberg.spark.SparkCatalog --conf spark.sql.catalog.dev.catalog-impl=org.apache.iceberg.aws.glue.GlueCatalog --conf spark.sql.catalog.glue_catalog.lock-impl=org.apache.iceberg.aws.glue.DynamoLockManager --conf spark.sql.catalog.glue_catalog.lock.table=myIcebergLockTab --conf spark.dynamicAllocation.maxExecutors=8 --conf spark.driver.maxResultSize=1G --conf spark.hadoop.hive.metastore.client.factory.class=com.amazonaws.glue.catalog.metastore.AWSGlueDataCatalogHiveClientFactory

  1. Submit the job.

You can monitor the job progress.

Query Iceberg tables

In this section, we provide examples of data warehouse queries from TPC-DS on the Iceberg tables.

  1. On the Athena console, open the query editor.
  2. For Workgroup, switch to DatalakeWorkgroup.

  1. Choose Acknowledge.

The queries in DatalakeWorkgroup will run on Athena engine version 3.

  1. On the Saved queries tab, choose a query to run on your Iceberg tables.

The following queries are listed:
  • Query3 – Report the total extended sales price per item brand of a specific manufacturer for all sales in a specific month of the year.
  • Query45 – Report the total web sales for customers in specific zip codes, cities, counties, or states, or specific items for a given year and quarter.
  • Query52 – Report the total of extended sales price for all items of a specific brand in a specific year and month.
  • Query6 – List all the states with at least 10 customers who during a given month bought items with the price tag at least 20% higher than the average price of items in the same category.
  • Query75 – For 2 consecutive years, track the sales of items by brand, class, and category.
  • Query86a – Roll up the web sales for a given year by category and class, and rank the sales among peers within the parent. For each group, compute the sum of sales and location with the hierarchy and rank within the group.

These queries are examples of queries used in decision-making and reporting in an organization. You can run them in the order you want. For this post, we start with Query3.

  1. Before you run the query, confirm that Database is set to datalake.

  1. Now you can run the query.

  1. Repeat these steps to run the other queries.

Update the item table

After running the queries, we prepare a batch of updates and inserts of records into the item table.

  1. First, run the following query to count the number of records in the item Iceberg table:
SELECT count(*) FROM "datalake"."item_iceberg";

This should return 102,000 records.

  1. Select item records with a price higher than $90:
SELECT count(*) FROM "datalake"."item_iceberg" WHERE i_current_price > 90.0;

This will return 1,112 records.

The update-item.py job takes these 1,112 records, modifies 11 records to change the name of the brand to Unknown, and changes the remaining 1,101 records’ i_item_id key to flag them as new records. As a result, a batch of 11 updates and 1,101 inserts are merged into the item_iceberg table.

The 11 records to be updated are those with price higher than $90, and the brand name starts with corpnameless.

  1. Run the following query:
SELECT count(*) FROM "datalake"."item_iceberg" WHERE i_current_price > 90.0 AND i_brand LIKE 'corpnameless%';

The result is 11 records. The item_update.py job replaces the brand name with Unknown and merges the batch into the Iceberg table.

Now you can return to the EMR Serverless console and run the job on the EMR Serverless application.

  1. On the application details page, choose Submit job.
  2. For Name, enter update-item-job.
  3. For Runtime role¸ use the same role that you used previously.
  4. For S3 URI, enter the update-item.py script location.

  1. Under Spark properties, choose Edit in text.
  2. Enter the following properties, replacing the <BUCKET-NAME> with your own datalake-<####>-us-east-1:
--conf spark.executor.cores=2 --conf spark.executor.memory=8g --conf spark.driver.cores=4 --conf spark.driver.memory=8g --conf spark.executor.instances=2 --conf spark.jars=/usr/share/aws/iceberg/lib/iceberg-spark3-runtime.jar --conf spark.sql.extensions=org.apache.iceberg.spark.extensions.IcebergSparkSessionExtensions --conf spark.sql.catalog.dev=org.apache.iceberg.spark.SparkCatalog --conf spark.sql.catalog.dev.catalog-impl=org.apache.iceberg.aws.glue.GlueCatalog --conf spark.sql.catalog.glue_catalog.lock-impl=org.apache.iceberg.aws.glue.DynamoLockManager --conf spark.sql.catalog.glue_catalog.lock.table=myIcebergLockTab --conf spark.dynamicAllocation.maxExecutors=4 --conf spark.driver.maxResultSize=1G --conf spark.sql.catalog.dev.warehouse=s3://<BUCKET-NAME>/warehouse --conf spark.hadoop.hive.metastore.client.factory.class=com.amazonaws.glue.catalog.metastore.AWSGlueDataCatalogHiveClientFactory

  1. Then submit the job.

  1. After the job finishes successfully, return to the Athena console and run the following query:
SELECT count(*) FROM "datalake"."item_iceberg";

The returned result is 103,101 = 102,000 + (1,112 – 11). The batch was merged successfully.

Time travel

To run a time travel query, complete the following steps:

  1. Get the timestamp of the job run via the application details page on the EMR Serverless console, or the Spark UI on the History Server, as shown in the following screenshot.

This time could be just minutes before you ran the update Spark job.

  1. Convert the timestamp from the format YYYY/MM/DD hh:mm:ss to YYYY-MM-DDThh:mm:ss.sTZD with time zone. For example, from 2023/02/20 14:40:41 to 2023-02-20 14:40:41.000 UTC.
  2. On the Athena console, run the following query to count the item table records at a time before the update job, replacing <TRAVEL_TIME> with your time:
SELECT count(*) FROM "datalake"."item_iceberg" FOR TIMESTAMP AS OF TIMESTAMP <TRAVEL_TIME>;

The query will give 102,000 as a result, the expected table size before running the update job.

  1. Now you can run a query with a timestamp after the successful run of the update job (for example, 2023-02-20 15:06:00.000 UTC):
SELECT count(*) FROM "datalake"."item_iceberg" FOR TIMESTAMP AS OF TIMESTAMP <TRAVEL_TIME>;

The query will now give 103,101 as the size of the table at that time, after the update job successfully finished.

Additionally, you can query in Athena based on the version ID of a snapshot in Iceberg. However, for more advanced use cases, such as to roll back to a given version or to find version IDs, you can use Iceberg’s SDK or Spark on Amazon EMR.

Clean up

Complete the following steps to clean up your resources:

  1. On the Amazon S3 console, empty your buckets.
  2. On the Athena console, delete the workgroup DatalakeWorkgroup.
  3. On the EMR Studio console, stop the application datalake-app.
  4. On the AWS CloudFormation console, delete the CloudFormation stack.

Conclusion

In this post, we created a serverless transactional data lake with Iceberg tables, EMR Serverless, and Athena. We used TPC-DS sales data with 10 GB data and more than 7 million records in the fact table. We demonstrated how straightforward it is to rely on SQL and Spark to run serverless jobs for data ingestion and upserts. Moreover, we showed how to run complex BI queries directly on Iceberg tables from Athena for reporting.

You can start building your serverless transactional data lake on AWS today, and dive deep into the features and optimizations Iceberg provides to build analytics applications more easily. Iceberg can also help you in the future to improve performance and reduce costs.


About the Author

Houssem is a Specialist Solutions Architect at AWS with a focus on analytics. He is passionate about data and emerging technologies in analytics. He holds a PhD on data management in the cloud. Prior to joining AWS, he worked on several big data projects and published several research papers in international conferences and venues.

Enhance your analytics embedding experience with the new Amazon QuickSight JavaScript SDK

Post Syndicated from Raj Jayaraman original https://aws.amazon.com/blogs/big-data/enhance-your-analytics-embedding-experience-with-the-new-amazon-quicksight-javascript-sdk/

Amazon QuickSight is a fully managed, cloud-native business intelligence (BI) service that makes it easy to connect to your data, create interactive dashboards and reports, and share these with tens of thousands of users, either within QuickSight or embedded in your application or website.

QuickSight recently launched a new major version of its Embedding SDK (v2.0) to improve developer experience when embedding QuickSight in your application or website. The QuickSight SDK v2.0 adds several customization improvements such as an optional preloader and new external hooks for managing undo, redo, print options, and parameters. Additionally, there are major rewrites to deliver developer-focused improvements, including static type checking, enhanced runtime validation, strong consistency in call patterns, and optimized event chaining.

The new SDK supports improved code completion when integrated with IDEs through its adoption of TypeScript and the newly introduced frameOptions and contentOptions, which segment embedding options into parameters unified for all embedding experiences and parameters unique for each embedding experience, respectively. Additionally, SDK v2.0 offers increased visibility by providing new experience-specific information and warnings within the SDK. This increases transparency, and developers can monitor and handle new content states.

The QuickSight SDK v2.0 is modernized by using promises for all actions, so developers can use async and await functions for better event management. Actions are further standardized to return a response for both data requesting and non-data requesting actions, so developers have full visibility to the end-to-end application handshake.

In addition to the new SDK, we are also introducing state persistence for user-based dashboard and console embedding. The GenerateEmbedUrlForRegisteredUser API is updated to support this feature and improves end-user experience and interactivity on embedded content.

SDK Feature overview

The QuickSight SDK v2.0 offers new functionalities along with elevating developers’ experience. The following functionalities have been added in this version:

  • Dashboard undo, redo, and reset actions can now be invoked from the application
  • A loading animation can be added to the dashboard container while the contents of the dashboard are loaded
  • Frame creation, mounting, and failure are communicated as change events that can be used by the application
  • Actions getParameter() values and setParameter() values are unified, eliminating additional data transformations

Using the new SDK

The embed URL obtained using the GenerateEmbedUrlForRegisteredUser or GenerateEmbedUrlForAnonymousUser APIs can be consumed in the application using the embedDashboard experience in SDK v2.0. This method takes two parameters:

  • frameOptions – This is a required parameter, and its properties determine the container options to embed a dashboard:
    • url – The embed URL generated using GenerateEmbedUrlForRegisteredUser or GenerateEmbedUrlForAnonymousUser APIs
    • container – The parent HTMLElement to embed the dashboard
  • contentOptions – This is an optional parameter that controls the dashboard locale and captures events from the SDK.

The following sample code uses the preceding parameters to embed a dashboard:

<html>
    <head>
        <!-- ... -->
        <script src=”https://unpkg.com/[email protected]/dist/quicksight-embedding-js-sdk.min.js"></script>
        <!-- ... -->
        <script>
            (async () => {
                const {
                    createEmbeddingContext,
                } = window.QuickSightEmbedding;
                
                const embeddingContext = await createEmbeddingContext();
                
                const frameOptions = {
                    url: '<YOUR_EMBED_URL>',
                    container: '#your-embed-container'
                };
                
                const contentOptions = {
                    toolbarOptions: {
                        reset: true,
                        undoRedo: true,
                    }
                };
                
                embeddedDashboard = await EmbeddingContext.embedDashboard(frameOptions, contentOptions);                
            })();
        </script>
    </head>
    <body>
        <div id="your-embed-container"></div>
    </body>
</html>

Render a loading animation while the dashboard loads

SDK v2.0 allows an option to render a loading animation in the iFrame container while the dashboard loads. This improves user experience by suggesting resource loading is in progress and where it will appear, and eliminates any perceived latency.

You can enable a loading animation by using the withIframePlaceholder option in the frameOption parameter:

const frameOptions = {
           url: '<YOUR_EMBED_URL>',
            container: '#your-embed-container',            
            withIframePlaceholder: true
}

This option is supported by all embedding experiences.

Monitor changes in SDK code status

SDK v2.0 supports a new callback onChange, which returns eventNames along with corresponding eventCodes to indicate errors, warnings, or information from the SDK.

You can use the events returned by the callback to monitor frame creation status and code status returned by the SDK. For example, if the SDK returns an error when an invalid embed URL is used, you can use a placeholder text or image in place of the embedded experience to notify the user.

The following eventNames and eventCodes are returned as part of the onChange callback when there is a change in the SDK code status.

eventName eventCode
ERROR FRAME_NOT_CREATED: Invoked when the creation of the iframe element failed
NO_BODY: Invoked when there is no body element in the hosting HTML
NO_CONTAINER: Invoked when the experience container is not found
NO_URL: Invoked when no URL is provided in the frameOptions
INVALID_URL: Invoked when the URL provided is not a valid URL for the experience
INFO FRAME_STARTED: Invoked just before the iframe is created
FRAME_MOUNTED: Invoked after the iframe is appended into the experience container
FRAME_LOADED: Invoked after the iframe element emitted the load event
WARN UNRECOGNIZED_CONTENT_OPTIONS: Invoked when the content options for the experience contain unrecognized properties
UNRECOGNIZED_EVENT_TARGET: Invoked when a message with an unrecognized event target is received

See the following code:

const frameOptions = {
            url: '<YOUR_EMBED_URL>',
            container: '#your-embed-container',            
            withIframePlaceholder: true
            onChange: (changeEvent, metadata) => {
                switch (changeEvent.eventName) {
                    case 'ERROR': {
                        document.getElementById("your-embed-container").append('Unable to load Dashboard at this time.');
                        break;
                    }
                }
            }
        }

Monitor interactions in embedded dashboards

Another callback supported by SDK v2.0 is onMessage, which returns information about specific events within an embedded experience. The eventName returned depends on the type of embedding experience used and allows application developers to invoke custom code for specific events.

For example, you can monitor if an embedded dashboard is fully loaded or invoke a custom function that logs the parameter values end-users set or change within the dashboard. Your application can now work seamlessly with SDK v2.0 to track and react to interactions within an embedded experience.

The eventNames returned are specific to the embedding experience used. The following eventNames are for the dashboard embedding experience. For additional eventNames, visit the GitHub repo.

  • CONTENT_LOADED
  • ERROR_OCCURRED
  • PARAMETERS_CHANGED
  • SELECTED_SHEET_CHANGED
  • SIZE_CHANGED
  • MODAL_OPENED

See the following code:

const contentOptions = {
                    onMessage: async (messageEvent, experienceMetadata) => {
                        switch (messageEvent.eventName) {
                            case 'PARAMETERS_CHANGED': {
                                ….. // Custom code
                                break;
                            }
…
}

Initiate dashboard print from the application

The new SDK version supports initiating undo, redo, reset, and print from the parent application, without having to add the native embedded QuickSight navbar. This allows developers flexibility to add custom buttons or application logic to control and invoke these options.

For example, you can add a standalone button in your application that allows end-users to print an embedded dashboard, without showing a print icon or navbar within the embedded frame. This can be done using the initiatePrint action:

embeddedDashboard.initiatePrint();

The following code sample shows a loading animation, SDK code status, and dashboard interaction monitoring, along with initiating dashboard print from the application:

<!DOCTYPE html>
<html lang="en">
  <head>
    <script src=" https://unpkg.com/[email protected]/dist/quicksight-embedding-js-sdk.min.js "></script>
    <title>Embedding demo</title>

    <script>
      $(document).ready(function() {

        var embeddedDashboard;

        document.getElementById("print_button").onclick = function printDashboard() {
            embeddedDashboard.initiatePrint();
        }

        function embedDashboard(embedUrl) {
          const {
            createEmbeddingContext
          } = window.QuickSightEmbedding;
          (async () => {
            const embeddingContext = await createEmbeddingContext();
            const messageHandler = (messageEvent) => {
              switch (messageEvent.eventName) {
                case 'CONTENT_LOADED': {
                  document.getElementById("print_button").style.display="block";
                  break;
                }
                case 'ERROR_OCCURRED': {
                  console.log('Error occurred', messageEvent.message);
                  break;
                }
                case 'PARAMETERS_CHANGED': {
                  // Custom code..
                  break;
                }
              }
            }
            const frameOptions = {
      url: '<YOUR_EMBED_URL>',
              container: document.getElementById("dashboardContainer"),
              width: "100%",
              height: "AutoFit",
              loadingHeight: "200px",
              withIframePlaceholder: true,
              onChange: (changeEvent, metadata) => {
                switch (changeEvent.eventName) {
                  case 'ERROR': {
                    document.getElementById("dashboardContainer").append('Unable to load Dashboard at this time.');
                    break;
                  }
                }
              }
            }
            const contentOptions = {
              locale: "en-US",
              onMessage: messageHandler
            }
            embeddedDashboard = await embeddingContext.embedDashboard(frameOptions, contentOptions);
          })();
        }
      });
    </Script>
  </head>
  <body>
    <div>
       <button type="button" id="print_button" style="display:none;">Print</button> 
    </div>
    <div id="dashboardContainer"></div>
  </body>
</html>

State persistence

In addition to the new SDK, QuickSight now supports state persistence for dashboard and console embedding. State Persistance means when readers slice and dice embedded dashboards with filters, QuickSight will persist filter selection until they return to the dashboard. Readers can pick up where they left off and don’t have to re-select filters.

State persistence is currently supported only for the user-based (not anonymous) dashboard and console embedding experience.

You can enable state persistence using the FeatureConfigurations parameter in the GenerateEmbedUrlForRegisteredUser API. FeatureConfigurations contains StatePersistence structure that can be customized by setting Enabled as true or false.

The API structure is below:

generate-embed-url-for-registered-user
	aws-account-id <value>
	[session-lifetime-in-minutes <value>]
	user-arn <value>
	[cli-input-json | cli-input-yaml]
	[allowed-domains <value>]
	[generate-cli-skeleton <value>]
	experience-configuration <value>
		Dashboard
			InitialDashboardId <value>
			[FeatureConfigurations]
				[StatePersistence]
					Enabled <value>
		QuickSightConsole
			InitialPath <value>
			[FeatureConfigurations]
				[StatePersistence]
					Enabled <value>

The following code disables state persistence for QuickSight console embedding:

aws quicksight generate-embed-url-for-registered-user \
--aws-account-id <AWS_Account_ID> \
--user-arn arn:aws:quicksight:us-east-1:<AWS_Account_ID>:user/<Namespace>/<QuickSight_User_Name>
--experience-configuration '{"QuickSightConsole": {
"InitialPath": "/start/analyses",
"FeatureConfigurations": {"StatePersistence": {"Enabled": false}}}}' \
--region <Region>

The following code enables state persistence for QuickSight dashboard embedding:

aws quicksight generate-embed-url-for-registered-user \
--aws-account-id <AWS_Account_ID> \
--user-arn arn:aws:quicksight:us-east-1:<AWS_Account_ID>:user/<Namespace>/<QuickSight_User_Name>
--experience-configuration '{"Dashboard": {
"InitialDashboardId": “<Dashboard_ID>",
"FeatureConfigurations": {"StatePersistence": {"Enabled": true}}}}' \
--region <Region>

Considerations

Note the following when using these features:

  • For dashboard embedding, state persistence is disabled by default. To enable this feature, set Enabled parameter in StatePersistence to true.
  • For console embedding, state persistence is enabled by default. To disable this feature, set Enabled parameter in StatePersistence to false.

Conclusion

With the latest iteration of the QuickSight Embedding SDK, you can indicate when an embedded experience is loading, monitor and respond to errors from the SDK, observe changes and interactivity, along with invoking undo, redo, reset, and print actions from application code.

Additionally, you can enable state persistence to persist filter selection for readers and allow them to pick up where they left off when revisiting an embedded dashboard.

For more detailed information about the SDK and experience-specific options, visit the GitHub repo.


About the authors

Raj Jayaraman is a Senior Specialist Solutions Architect for Amazon QuickSight. Raj focuses on helping customers develop sample dashboards, embed analytics and adopt BI design patterns and best practices.

Mayank Agarwal is a product manager for Amazon QuickSight, AWS’ cloud-native, fully managed BI service. He focuses on account administration, governance and developer experience. He started his career as an embedded software engineer developing handheld devices. Prior to QuickSight he was leading engineering teams at Credence ID, developing custom mobile embedded device and web solutions using AWS services that make biometric enrollment and identification fast, intuitive, and cost-effective for Government sector, healthcare and transaction security applications.

Rohit Pujari is the Head of Product for Embedded Analytics at QuickSight. He is passionate about shaping the future of infusing data-rich experiences into products and applications we use every day. Rohit brings a wealth of experience in analytics and machine learning from having worked with leading data companies, and their customers. During his free time, you can find him lining up at the local ice cream shop for his second scoop.

Build an end-to-end change data capture with Amazon MSK Connect and AWS Glue Schema Registry

Post Syndicated from Kalyan Janaki original https://aws.amazon.com/blogs/big-data/build-an-end-to-end-change-data-capture-with-amazon-msk-connect-and-aws-glue-schema-registry/

The value of data is time sensitive. Real-time processing makes data-driven decisions accurate and actionable in seconds or minutes instead of hours or days. Change data capture (CDC) refers to the process of identifying and capturing changes made to data in a database and then delivering those changes in real time to a downstream system. Capturing every change from transactions in a source database and moving them to the target in real time keeps the systems synchronized, and helps with real-time analytics use cases and zero-downtime database migrations. The following are a few benefits of CDC:

  • It eliminates the need for bulk load updating and inconvenient batch windows by enabling incremental loading or real-time streaming of data changes into your target repository.
  • It ensures that data in multiple systems stays in sync. This is especially important if you’re making time-sensitive decisions in a high-velocity data environment.

Kafka Connect is an open-source component of Apache Kafka that works as a centralized data hub for simple data integration between databases, key-value stores, search indexes, and file systems. The AWS Glue Schema Registry allows you to centrally discover, control, and evolve data stream schemas. Kafka Connect and Schema Registry integrate to capture schema information from connectors. Kafka Connect provides a mechanism for converting data from the internal data types used by Kafka Connect to data types represented as Avro, Protobuf, or JSON Schema. AvroConverter, ProtobufConverter, and JsonSchemaConverter automatically register schemas generated by Kafka connectors (source) that produce data to Kafka. Connectors (sink) that consume data from Kafka receive schema information in addition to the data for each message. This allows sink connectors to know the structure of the data to provide capabilities like maintaining a database table schema in a data catalog.

The post demonstrates how to build an end-to-end CDC using Amazon MSK Connect, an AWS managed service to deploy and run Kafka Connect applications and AWS Glue Schema Registry, which allows you to centrally discover, control, and evolve data stream schemas.

Solution overview

On the producer side, for this example we choose a MySQL-compatible Amazon Aurora database as the data source, and we have a Debezium MySQL connector to perform CDC. The Debezium connector continuously monitors the databases and pushes row-level changes to a Kafka topic. The connector fetches the schema from the database to serialize the records into a binary form. If the schema doesn’t already exist in the registry, the schema will be registered. If the schema exists but the serializer is using a new version, the schema registry checks the compatibility mode of the schema before updating the schema. In this solution, we use backward compatibility mode. The schema registry returns an error if a new version of the schema is not backward compatible, and we can configure Kafka Connect to send incompatible messages to the dead-letter queue.

On the consumer side, we use an Amazon Simple Storage Service (Amazon S3) sink connector to deserialize the record and store changes to Amazon S3. We build and deploy the Debezium connector and the Amazon S3 sink using MSK Connect.

Example schema

For this post, we use the following schema as the first version of the table:

{ 
    “Database Name”: “sampledatabase”, 
    “Table Name”: “movies”, 
    “Fields”: [
         { 
            “name”: “movie_id”, 
            “type”: “INTEGER” 
         },
         { 
            “name”: “title”, 
            “type”: “STRING” 
         },
         { 
            “name”: “release_year”,
            “type”: “INTEGER” 
         }
     ] 
}

Prerequisites

Before configuring the MSK producer and consumer connectors, we need to first set up a data source, MSK cluster, and new schema registry. We provide an AWS CloudFormation template to generate the supporting resources needed for the solution:

  • A MySQL-compatible Aurora database as the data source. To perform CDC, we turn on binary logging in the DB cluster parameter group.
  • An MSK cluster. To simplify the network connection, we use the same VPC for the Aurora database and the MSK cluster.
  • Two schema registries to handle schemas for message key and message value.
  • One S3 bucket as the data sink.
  • MSK Connect plugins and worker configuration needed for this demo.
  • One Amazon Elastic Compute Cloud (Amazon EC2) instance to run database commands.

To set up resources in your AWS account, complete the following steps in an AWS Region that supports Amazon MSK, MSK Connect, and the AWS Glue Schema Registry:

  1. Choose Launch Stack:
  2. Choose Next.
  3. For Stack name, enter suitable name.
  4. For Database Password, enter the password you want for the database user.
  5. Keep other values as default.
  6. Choose Next.
  7. On the next page, choose Next.
  8. Review the details on the final page and select I acknowledge that AWS CloudFormation might create IAM resources.
  9. Choose Create stack.

Custom plugin for the source and destination connector

A custom plugin is a set of JAR files that contain the implementation of one or more connectors, transforms, or converters. Amazon MSK will install the plugin on the workers of the MSK Connect cluster where the connector is running. As part of this demo, for the source connector we use open-source Debezium MySQL connector JARs, and for the destination connector we use the Confluent community licensed Amazon S3 sink connector JARs. Both the plugins are also added with libraries for Avro Serializers and Deserializers of the AWS Glue Schema Registry. These custom plugins are already created as part of the CloudFormation template deployed in the previous step.

Use the AWS Glue Schema Registry with the Debezium connector on MSK Connect as the MSK producer

We first deploy the source connector using the Debezium MySQL plugin to stream data from an Amazon Aurora MySQL-Compatible Edition database to Amazon MSK. Complete the following steps:

  1. On the Amazon MSK console, in the navigation pane, under MSK Connect, choose Connectors.
  2. Choose Create connector.
  3. Choose Use existing custom plugin and then pick the custom plugin with name starting msk-blog-debezium-source-plugin.
  4. Choose Next.
  5. Enter a suitable name like debezium-mysql-connector and an optional description.
  6. For Apache Kafka cluster, choose MSK cluster and choose the cluster created by the CloudFormation template.
  7. In Connector configuration, delete the default values and use the following configuration key-value pairs and with the appropriate values:
    • name – The name used for the connector.
    • database.hostsname – The CloudFormation output for Database Endpoint.
    • database.user and database.password – The parameters passed in the CloudFormation template.
    • database.history.kafka.bootstrap.servers – The CloudFormation output for Kafka Bootstrap.
    • key.converter.region and value.converter.region – Your Region.
name=<Connector-name>
connector.class=io.debezium.connector.mysql.MySqlConnector
database.hostname=<DBHOST>
database.port=3306
database.user=<DBUSER>
database.password=<DBPASSWORD>
database.server.id=42
database.server.name=db1
table.whitelist=sampledatabase.movies
database.history.kafka.bootstrap.servers=<MSK-BOOTSTRAP>
database.history.kafka.topic=dbhistory.demo1
key.converter=com.amazonaws.services.schemaregistry.kafkaconnect.AWSKafkaAvroConverter
value.converter=com.amazonaws.services.schemaregistry.kafkaconnect.AWSKafkaAvroConverter
key.converter.region=<REGION>
value.converter.region=<REGION>
key.converter.registry.name=msk-connect-blog-keys
value.converter.registry.name=msk-connect-blog-values
key.converter.compatibility=FORWARD
value.converter.compatibility=FORWARD
key.converter.schemaAutoRegistrationEnabled=true
value.converter.schemaAutoRegistrationEnabled=true
transforms=unwrap
transforms.unwrap.type=io.debezium.transforms.ExtractNewRecordState
transforms.unwrap.drop.tombstones=false
transforms.unwrap.delete.handling.mode=rewrite
transforms.unwrap.add.fields=op,source.ts_ms
tasks.max=1

Some of these settings are generic and should be specified for any connector. For example:

  • connector.class is the Java class of the connector
  • tasks.max is the maximum number of tasks that should be created for this connector

Some settings (database.*, transforms.*) are specific to the Debezium MySQL connector. Refer to Debezium MySQL Source Connector Configuration Properties for more information.

Some settings (key.converter.* and value.converter.*) are specific to the Schema Registry. We use the AWSKafkaAvroConverter from the AWS Glue Schema Registry Library as the format converter. To configure AWSKafkaAvroConverter, we use the value of the string constant properties in the AWSSchemaRegistryConstants class:

  • key.converter and value.converter control the format of the data that will be written to Kafka for source connectors or read from Kafka for sink connectors. We use AWSKafkaAvroConverter for Avro format.
  • key.converter.registry.name and value.converter.registry.name define which schema registry to use.
  • key.converter.compatibility and value.converter.compatibility define the compatibility model.

Refer to Using Kafka Connect with AWS Glue Schema Registry for more information.

  1. Next, we configure Connector capacity. We can choose Provisioned and leave other properties as default
  2. For Worker configuration, choose the custom worker configuration with name starting msk-gsr-blog created as part of the CloudFormation template.
  3. For Access permissions, use the AWS Identity and Access Management (IAM) role generated by the CloudFormation template MSKConnectRole.
  4. Choose Next.
  5. For Security, choose the defaults.
  6. Choose Next.
  7. For Log delivery, select Deliver to Amazon CloudWatch Logs and browse for the log group created by the CloudFormation template (msk-connector-logs).
  8. Choose Next.
  9. Review the settings and choose Create connector.

After a few minutes, the connector changes to running status.

Use the AWS Glue Schema Registry with the Confluent S3 sink connector running on MSK Connect as the MSK consumer

We deploy the sink connector using the Confluent S3 sink plugin to stream data from Amazon MSK to Amazon S3. Complete the following steps:

    1. On the Amazon MSK console, in the navigation pane, under MSK Connect, choose Connectors.
    2. Choose Create connector.
    3. Choose Use existing custom plugin and choose the custom plugin with name starting msk-blog-S3sink-plugin.
    4. Choose Next.
    5. Enter a suitable name like s3-sink-connector and an optional description.
    6. For Apache Kafka cluster, choose MSK cluster and select the cluster created by the CloudFormation template.
    7. In Connector configuration, delete the default values provided and use the following configuration key-value pairs with appropriate values:
        • name – The same name used for the connector.
        • s3.bucket.name – The CloudFormation output for Bucket Name.
        • s3.region, key.converter.region, and value.converter.region – Your Region.
name=<CONNERCOR-NAME>
connector.class=io.confluent.connect.s3.S3SinkConnector
s3.bucket.name=<BUCKET-NAME>
key.converter=com.amazonaws.services.schemaregistry.kafkaconnect.AWSKafkaAvroConverter
value.converter=com.amazonaws.services.schemaregistry.kafkaconnect.AWSKafkaAvroConverter
s3.region=<REGION>
storage.class=io.confluent.connect.s3.storage.S3Storage
partitioner.class=io.confluent.connect.storage.partitioner.DefaultPartitioner
format.class=io.confluent.connect.s3.format.parquet.ParquetFormat
flush.size=10
tasks.max=1
key.converter.schemaAutoRegistrationEnabled=true
value.converter.schemaAutoRegistrationEnabled=true
key.converter.region=<REGION>
value.converter.region=<REGION>
value.converter.avroRecordType=GENERIC_RECORD
key.converter.avroRecordType=GENERIC_RECORD
value.converter.compatibility=NONE
key.converter.compatibility=NONE
store.kafka.keys=false
schema.compatibility=NONE
topics=db1.sampledatabase.movies
value.converter.registry.name=msk-connect-blog-values
key.converter.registry.name=msk-connect-blog-keys
store.kafka.headers=false
  1. Next, we configure Connector capacity. We can choose Provisioned and leave other properties as default
  2. For Worker configuration, choose the custom worker configuration with name starting msk-gsr-blog created as part of the CloudFormation template.
  3. For Access permissions, use the IAM role generated by the CloudFormation template MSKConnectRole.
  4. Choose Next.
  5. For Security, choose the defaults.
  6. Choose Next.
  7. For Log delivery, select Deliver to Amazon CloudWatch Logs and browse for the log group created by the CloudFormation template msk-connector-logs.
  8. Choose Next.
  9. Review the settings and choose Create connector.

After a few minutes, the connector is running.

Test the end-to-end CDC log stream

Now that both the Debezium and S3 sink connectors are up and running, complete the following steps to test the end-to-end CDC:

  1. On the Amazon EC2 console, navigate to the Security groups page.
  2. Select the security group ClientInstanceSecurityGroup and choose Edit inbound rules.
  3. Add an inbound rule allowing SSH connection from your local network.
  4. On the Instances page, select the instance ClientInstance and choose Connect.
  5. On the EC2 Instance Connect tab, choose Connect.
  6. Ensure your current working directory is /home/ec2-user and it has the files create_table.sql, alter_table.sql , initial_insert.sql, and insert_data_with_new_column.sql.
  7. Create a table in your MySQL database by running the following command (provide the database host name from the CloudFormation template outputs):
mysql -h <DATABASE-HOST> -u master -p < create_table.sql
  1. When prompted for a password, enter the password from the CloudFormation template parameters.
  2. Insert some sample data into the table with the following command:
mysql -h <DATABASE-HOST> -u master -p < initial_insert.sql
  1. When prompted for a password, enter the password from the CloudFormation template parameters.
  2. On the AWS Glue console, choose Schema registries in the navigation pane, then choose Schemas.
  3. Navigate to db1.sampledatabase.movies version 1 to check the new schema created for the movies table:
{
  "type": "record",
  "name": "Value",
  "namespace": "db1.sampledatabase.movies",
  "fields": [
    {
      "name": "movie_id",
      "type": "int"
    },
    {
      "name": "title",
      "type": "string"
    },
    {
      "name": "release_year",
      "type": "int"
    },
    {
      "name": "__op",
      "type": [
        "null",
        "string"
      ],
      "default": null
    },
    {
      "name": "__source_ts_ms",
      "type": [
        "null",
        "long"
      ],
      "default": null
    },
    {
      "name": "__deleted",
      "type": [
        "null",
        "string"
      ],
      "default": null
    }
  ],
  "connect.name": "db1.sampledatabase.movies.Value"
}

A separate S3 folder is created for each partition of the Kafka topic, and data for the topic is written in that folder.

  1. On the Amazon S3 console, check for data written in Parquet format in the folder for your Kafka topic.

Schema evolution

After the initial schema is defined, applications may need to evolve it over time. When this happens, it’s critical for the downstream consumers to be able to handle data encoded with both the old and the new schema seamlessly. Compatibility modes allow you to control how schemas can or can’t evolve over time. These modes form the contract between applications producing and consuming data. For detailed information about different compatibility modes available in the AWS Glue Schema Registry, refer to AWS Glue Schema Registry. In our example, we use backward combability to ensure consumers can read both the current and previous schema versions. Complete the following steps:

  1. Add a new column to the table by running the following command:
mysql -h <DATABASE-HOST> -u master -p < alter_table.sql
  1. Insert new data into the table by running the following command:
mysql -h <DATABASE-HOST> -u master -p < insert_data_with_new_column.sql
  1. On the AWS Glue console, choose Schema registries in the navigation pane, then choose Schemas.
  2. Navigate to the schema db1.sampledatabase.movies version 2 to check the new version of the schema created for the movies table movies including the country column that you added:
{
  "type": "record",
  "name": "Value",
  "namespace": "db1.sampledatabase.movies",
  "fields": [
    {
      "name": "movie_id",
      "type": "int"
    },
    {
      "name": "title",
      "type": "string"
    },
    {
      "name": "release_year",
      "type": "int"
    },
    {
      "name": "COUNTRY",
      "type": "string"
    },
    {
      "name": "__op",
      "type": [
        "null",
        "string"
      ],
      "default": null
    },
    {
      "name": "__source_ts_ms",
      "type": [
        "null",
        "long"
      ],
      "default": null
    },
    {
      "name": "__deleted",
      "type": [
        "null",
        "string"
      ],
      "default": null
    }
  ],
  "connect.name": "db1.sampledatabase.movies.Value"
}
  1. On the Amazon S3 console, check for data written in Parquet format in the folder for the Kafka topic.

Clean up

To help prevent unwanted charges to your AWS account, delete the AWS resources that you used in this post:

  1. On the Amazon S3 console, navigate to the S3 bucket created by the CloudFormation template.
  2. Select all files and folders and choose Delete.
  3. Enter permanently delete as directed and choose Delete objects.
  4. On the AWS CloudFormation console, delete the stack you created.
  5. Wait for the stack status to change to DELETE_COMPLETE.

Conclusion

This post demonstrated how to use Amazon MSK, MSK Connect, and the AWS Glue Schema Registry to build a CDC log stream and evolve schemas for data streams as business needs change. You can apply this architecture pattern to other data sources with different Kafka connecters. For more information, refer to the MSK Connect examples.


About the Author

Kalyan Janaki is Senior Big Data & Analytics Specialist with Amazon Web Services. He helps customers architect and build highly scalable, performant, and secure cloud-based solutions on AWS.
How gaming companies can use Amazon Redshift Serverless to build scalable analytical applications faster and easier

Post Syndicated from Satesh Sonti original https://aws.amazon.com/blogs/big-data/how-gaming-companies-can-use-amazon-redshift-serverless-to-build-scalable-analytical-applications-faster-and-easier/

This post provides guidance on how to build scalable analytical solutions for gaming industry use cases using Amazon Redshift Serverless. It covers how to use a conceptual, logical architecture for some of the most popular gaming industry use cases like event analysis, in-game purchase recommendations, measuring player satisfaction, telemetry data analysis, and more. This post also discusses the art of the possible with newer innovations in AWS services around streaming, machine learning (ML), data sharing, and serverless capabilities.

Our gaming customers tell us that their key business objectives include the following:

  • Increased revenue from in-app purchases
  • High average revenue per user and lifetime value
  • Improved stickiness with better gaming experience
  • Improved event productivity and high ROI

Our gaming customers also tell us that while building analytics solutions, they want the following:

  • Low-code or no-code model – Out-of-the-box solutions are preferred to building customized solutions.
  • Decoupled and scalable – Serverless, auto scaled, and fully managed services are preferred over manually managed services. Each service should be easily replaceable, enhanced with little or no dependency. Solutions should be flexible to scale up and down.
  • Portability to multiple channels – Solutions should be compatible with most of endpoint channels like PC, mobile, and gaming platforms.
  • Flexible and easy to use – The solutions should provide less restrictive, easy-to-access, and ready-to-use data. They should also provide optimal performance with low or no tuning.

Analytics reference architecture for gaming organizations

In this section, we discuss how gaming organizations can use a data hub architecture to address the analytical needs of an enterprise, which requires the same data at multiple levels of granularity and different formats, and is standardized for faster consumption. A data hub is a center of data exchange that constitutes a hub of data repositories and is supported by data engineering, data governance, security, and monitoring services.

A data hub contains data at multiple levels of granularity and is often not integrated. It differs from a data lake by offering data that is pre-validated and standardized, allowing for simpler consumption by users. Data hubs and data lakes can coexist in an organization, complementing each other. Data hubs are more focused around enabling businesses to consume standardized data quickly and easily. Data lakes are more focused around storing and maintaining all the data in an organization in one place. And unlike data warehouses, which are primarily analytical stores, a data hub is a combination of all types of repositories—analytical, transactional, operational, reference, and data I/O services, along with governance processes. A data warehouse is one of the components in a data hub.

The following diagram is a conceptual analytics data hub reference architecture. This architecture resembles a hub-and-spoke approach. Data repositories represent the hub. External processes are the spokes feeding data to and from the hub. This reference architecture partly combines a data hub and data lake to enable comprehensive analytics services.

Let’s look at the components of the architecture in more detail.

Sources

Data can be loaded from multiple sources, such as systems of record, data generated from applications, operational data stores, enterprise-wide reference data and metadata, data from vendors and partners, machine-generated data, social sources, and web sources. The source data is usually in either structured or semi-structured formats, which are highly and loosely formatted, respectively.

Data inbound

This section consists of components to process and load the data from multiple sources into data repositories. It can be in batch mode, continuous, pub/sub, or any other
custom integration. ETL (extract, transform, and load) technologies, streaming services, APIs, and data exchange interfaces are the core components of this pillar. Unlike ingestion processes, data can be transformed as per business rules before loading. You can apply technical or business data quality rules and load raw data as well. Essentially, it provides the flexibility to get the data into repositories in its most usable form.

Data repositories

This section consists of a group of data stores, which includes data warehouses, transactional or operational data stores, reference data stores, domain data stores housing purpose-built business views, and enterprise datasets (file storage). The file storage component is usually a common component between a data hub and a data lake to avoid data duplication and provide comprehensiveness. Data can also be shared among all these repositories without physically moving with features, such as data sharing and federated queries. However, data copy and duplication are allowed considering various consumption needs in terms of formats and latency.

Data outbound

Data is often consumed using structured queries for analytical needs. Also, datasets are accessed for ML, data exporting, and publishing needs. This section consists of components to query the data, export, exchange, and APIs. In terms of implementation, the same technologies may be used for both inbound and outbound, but the functions are different. However, it’s not mandatory to use the same technologies. These processes aren’t transformation heavy because the data is already standardized and almost ready to consume. The focus is on the ease of consumption and integration with consuming services.

Consumption

This pillar consists of various consumption channels for enterprise analytical needs. It includes business intelligence (BI) users, canned and interactive reports, dashboards, data science workloads, Internet of Things (IoT), web apps, and third-party data consumers. Popular consumption entities in many organizations are queries, reports, and data science workloads. Because there are multiple data stores maintaining data at different granularity and formats to service consumer needs, these consumption components depend on data catalogs for finding the right source.

Data governance

Data governance is key to the success of a data hub reference architecture. It constitutes components like metadata management, data quality, lineage, masking, and stewardship, which are required for organized maintenance of the data hub. Metadata management helps organize the technical and business metadata catalog, and consumers can reference this catalog to know what data is available in which repository and at what granularity, format, owners, refresh frequency, and so on. Along with metadata management, data quality is important to increase confidence for consumers. This includes data cleansing, validation, conformance, and data controls.

Security and monitoring

Users and application access should be controlled at multiple levels. It starts with authentication, then authorizing who and what should be accessed, policy management, encryption, and applying data compliance rules. It also includes monitoring components to log the activity for auditing and analysis.

Analytics data hub solution architecture on AWS

The following reference architecture provides an AWS stack for the solution components.

Let’s look at each component again and the relevant AWS services.

Data inbound services

AWS Glue and Amazon EMR services are ideal for batch processing. They scale automatically and are able to process most of the industry standard data formats. Amazon Kinesis Data Streams, Amazon Kinesis Data Firehose, and Amazon Managed Streaming for Apache Kafka (Amazon MSK) enables you to build streaming process applications. These streaming services integrate well with the Amazon Redshift streaming feature. This helps you process real-time sources, IoT data, and data from online channels. You can also ingest data with third-party tools like Informatica, dbt, and Matallion.

You can build RESTful APIs and WebSocket APIs using Amazon API Gateway and AWS Lambda, which will enable real-time two-way communication with web sources, social, and IoT sources. AWS Data Exchange helps with subscribing to third-party data in AWS Marketplace. Data subscription and access is fully managed with this service. Refer to the respective service documentation for further details.

Data repository services

Amazon Redshift is the recommended data storage service for OLAP (Online Analytical Processing) workloads such as cloud data warehouses, data marts, and other analytical data stores. This service is the core of this reference architecture on AWS and can address most analytical needs out of the box. You can use simple SQL to analyze structured and semi-structured data across data warehouses, data marts, operational databases, and data lakes to deliver the best price performance at any scale. The Amazon Redshift data sharing feature provides instant, granular, and high-performance access without data copies and data movement across multiple Amazon Redshift data warehouses in the same or different AWS accounts, and across Regions.

For ease of use, Amazon Redshift offers a serverless option. Amazon Redshift Serverless automatically provisions and intelligently scales data warehouse capacity to deliver fast performance for even the most demanding and unpredictable workloads, and you pay only for what you use. Just load your data and start querying right away in Amazon Redshift Query Editor or in your favorite BI tool and continue to enjoy the best price performance and familiar SQL features in an easy-to-use, zero administration environment.

Amazon Relational Database Service (Amazon RDS) is a fully managed service for building transactional and operational data stores. You can choose from many popular engines such as MySQL, PostgreSQL, MariaDB, Oracle, and SQL Server. With the Amazon Redshift federated query feature, you can query transactional and operational data in place without moving the data. The federated query feature currently supports Amazon RDS for PostgreSQL, Amazon Aurora PostgreSQL-Compatible Edition, Amazon RDS for MySQL, and Amazon Aurora MySQL-Compatible Edition.

Amazon Simple Storage Service (Amazon S3) is the recommended service for multi-format storage layers in the architecture. It offers industry-leading scalability, data availability, security, and performance. Organizations typically store data in Amazon S3 using open file formats. Open file formats enable analysis of the same Amazon S3 data using multiple processing and consumption layer components. Data in Amazon S3 can be easily queried in place using SQL with Amazon Redshift Spectrum. It helps you query and retrieve structured and semi-structured data from files in Amazon S3 without having to load the data. Multiple Amazon Redshift data warehouses can concurrently query the same datasets in Amazon S3 without the need to make copies of the data for each data warehouse.

Data outbound services

Amazon Redshift comes with the web-based analytics workbench Query Editor V2.0, which helps you run queries, explore data, create SQL notebooks, and collaborate on data with your teams in SQL through a common interface. AWS Transfer Family helps securely transfer files using SFTP, FTPS, FTP, and AS2 protocols. It supports thousands of concurrent users and is a fully managed, low-code service. Similar to inbound processes, you can utilize Amazon API Gateway and AWS Lambda for data pull using the Amazon Redshift Data API. And AWS Data Exchange helps publish your data to third parties for consumption through AWS Marketplace.

Consumption services

Amazon QuickSight is the recommended service for creating reports and dashboards. It enables you to create interactive dashboards, visualizations, and advanced analytics with ML insights. Amazon SageMaker is the ML platform for all your data science workload needs. It helps you build, train, and deploy models consuming the data from repositories in the data hub. You can use Amazon front-end web and mobile services and AWS IoT services to build web, mobile, and IoT endpoint applications to consume data out of the data hub.

Data governance services

The AWS Glue Data Catalog and AWS Lake Formation are the core data governance services AWS currently offers. These services help manage metadata centrally for all the data repositories and manage access controls. They also help with data classification and can automatically handle schema changes. You can use Amazon DataZone to discover and share data at scale across organizational boundaries with built-in governance and access controls. AWS is investing in this space to provide more a unified experience for AWS services. There are many partner products such as Collibra, Alation, Amorphic, Informatica, and more, which you can use as well for data governance functions with AWS services.

Security and monitoring services

AWS Identity and Access Management (AWS IAM) manages identities for AWS services and resources. You can define users, groups, roles, and policies for fine-grained access management of your workforce and workloads. AWS Key Management Service (AWS KMS) manages AWS keys or customer managed keys for your applications. Amazon CloudWatch and AWS CloudTrail help provide monitoring and auditing capabilities. You can collect metrics and events and analyze them for operational efficiency.

In this post, we’ve discussed the most common AWS services for the respective solution components. However, you aren’t limited to only these services. There are many other AWS services for specific use cases that may be more appropriate for your needs than what we discussed here. You can reach to AWS Analytics Solutions Architects for appropriate guidance.

Example architectures for gaming use cases

In this section, we discuss example architectures for two gaming use cases.

Game event analysis

In-game events (also called timed or live events) encourage player engagement through excitement and anticipation. Events entice players to interact with the game, increasing player satisfaction and revenue with in-game purchases. Events have become more and more important, especially as games shift from being static pieces of entertainment to be played as is to offering dynamic and changing content through the use of services that use information to make decisions about game play as the game is being played. This enables games to change as the players play and influence what works and what doesn’t, and gives any game a potentially infinite lifespan.

This capability of in-game events to offer fresh content and activities within a familiar framework is how you keep players engaged and playing for months to years. Players can enjoy new experiences and challenges within the familiar framework or world that they have grown to love.

The following example shows how such an architecture might appear, including changes to support various sections of the process like breaking the data into separate containers to accommodate scalability, charge-back, and ownership.

To fully understand how events are viewed by the players and to make decisions about future events requires information on how the latest event was actually performed. This means gathering a lot of data as the players play to build key performance indicators (KPIs) that measure the effectiveness and player satisfaction with each event. This requires analytics that specifically measure each event and capture, analyze, report on, and measure player experience for each event. These KPIs include the following:

  • Initial user flow interactions – What actions users are taking after they first receive or download an event update in a game. Are there any clear drop-off points or bottlenecks that are turning people off the event?
  • Monetization – When, what, and where users are spending money on in the event, whether it’s buying in-game currencies, answering ads, specials, and so on.
  • Game economy – How can users earn and spend virtual currencies or goods during an event, using in-game money, trades, or barter.
  • In-game activity – Player wins, losses, leveling up, competition wins, or player achievements within the event.
  • User to user interactions – Invitations, gifting, chats (private and group), challenges, and so on during an event.

These are just some of the KPIs and metrics that are key for predictive modeling of events as the game acquires new players while keeping existing users involved, engaged, and playing.

In-game activity analysis

In-game activity analysis essentially looks at any meaningful, purposeful activity the player might show, with the goal of trying to understand what actions are taken, their timing, and outcomes. This includes situational information about the players, including where they are playing (both geographical and cultural), how often, how long, what they undertake on each login, and other activities.

The following example shows how such an architecture might appear, including changes to support various sections of the process like breaking the data into separate warehouses. The multi-cluster warehouse approach helps scale the workload independently, provides flexibility to the implemented charge-back model, and supports decentralized data ownership.

The solution essentially logs information to help understand the behavior of your players, which can lead to insights that increase retention of existing players, and acquisition of new ones. This can provide the ability to do the following:

  • Provide in-game purchase recommendations
  • Measure player trends in the short term and over time
  • Plan events the players will engage in
  • Understand what parts of your game are most successful and which are less so

You can use this understanding to make decisions about future game updates, make in-game purchase recommendations, determine when and how your game economy may need to be balanced, and even allow players to change their character or play as the game progresses by injecting this information and accompanying decisions back into the game.

Conclusion

This reference architecture, while showing examples of only a few analysis types, provides a faster technology path for enabling game analytics applications. The decoupled, hub/spoke approach brings the agility and flexibility to implement different approaches to analytics and understanding the performance of game applications. The purpose-built AWS services described in this architecture provide comprehensive capabilities to easily collect, store, measure, analyze, and report game and event metrics. This helps you efficiently perform in-game analytics, event analysis, measure player satisfaction, and provide tailor-made recommendations to game players, efficiently organize events, and increase retention rates.

Thanks for reading the post. If you have any feedback or questions, please leave them in the comments.


About the authors

Satesh Sonti is a Sr. Analytics Specialist Solutions Architect based out of Atlanta, specialized in building enterprise data platforms, data warehousing, and analytics solutions. He has over 16 years of experience in building data assets and leading complex data platform programs for banking and insurance clients across the globe.

Tanya Rhodes is a Senior Solutions Architect based out of San Francisco, focused on games customers with emphasis on analytics, scaling, and performance enhancement of games and supporting systems. She has over 25 years of experience in enterprise and solutions architecture specializing in very large business organizations across multiple lines of business including games, banking, healthcare, higher education, and state governments.

Push notification engagement metrics tracking

Post Syndicated from Pavlos Ioannou Katidis original https://aws.amazon.com/blogs/messaging-and-targeting/push-notification-engagement-metrics-tracking/

In this blog you will learn how to track and attribute Amazon Pinpoint push notification events for Campaigns and Journeys via API.

Amazon Pinpoint is a multichannel customer engagement platform allowing you to engage with your customers across 6 different channels. Amazon Pinpoint’s push notification channel, can send messages to your mobile app users via Firebase Cloud Messaging (FCM), Apple Push Notification service (APNs), Baidu Cloud Push, Amazon Device Messaging (ADM).

Push notifications is a preferable channel of communication as it notifies your app users even when they are not on your app. This increases app engagement and probability of customers to convert. Additionally, users who download your app but don’t register, can still be targeted and receive your messages.

Using Amazon Pinpoint’s push notification channel you can engage users with highly curated content. The messages can be personalized with customer data stored in Amazon Pinpoint, images, deep links and custom alert sounds – read more here. Amazon Pinpoint Campaigns and Journeys enable marketers to schedule communications, build multichannel experiences and for developers it offers a rich API to send messages. By default, all Amazon Pinpoint accounts are configured to send 25,000 messages per second, which can be increased by requesting a quota increase.

Measuring success of your communications is paramount for optimizing future customer engagements. Amazon Pinpoint push notifications offer the following three events:

  • _opened_notification – This event type indicates that the recipient tapped the notification to open it.
  • _received_foreground – This event type indicates that the recipient received the message as a foreground notification.
  • _received_background – This event type indicates that the recipient received the message as a background notification.

To track the above events from your mobile application, it is recommended using AWS Amplify’s push notification library which is currently available only in React Native.

Solution description

This blog provides an alternative for AWS Amplify for Amazon Pinpoint push notification tracking. Specifically, it utilizes Amazon Pinpoint’s Events API operation, which can be used to record events your customers generate on your mobile or web application. The same API operation can be used to record push notification engagement events.

The Events API operation request body is populated with the Campaign or Journey attributes received via the push notification payload metadata. These attributes help Amazon Pinpoint to attribute the events back to the correct Campaign or Journey

This blog provides examples of campaign, journey & transactional push notification payloads and how to correctly populate the Events API operation. Furthermore it shares an architecture to securely call Amazon Pinpoint’s API from your application’s frontend.

Prerequisites

This post assumes that you already have an Amazon Pinpoint project that is correctly configured to send push notification to your various endpoints using Campaigns or Journeys. Refer to the getting started guide and setting up Amazon Pinpoint mobile push channels for information on how to set up your Amazon Pinpoint project.

You will also need the AWS Mobile SDKs for the respective platform of your apps. The following are the repositories that can be used:

Implementation

The push notification payload received from the application differs between campaign, journey and transactional messages. This blog provides examples for campaign, journey and transactional message payloads as well as how to populate the Amazon Pinpoint Events API request body correctly to report push notification tracking data to Amazon Pinpoint.

Push notification message payload examples:

Campaign payload example:

{
   "pinpoint.openApp":"true",
   "pinpoint.campaign.treatment_id":"0",
   "pinpoint.notification.title":"Message title",
   "pinpoint.notification.body":"Message body",
   "data":"{\"pinpoint\":{\"endpointId\":\"endpoint_id1\",\"userId\":\"user_id1\"}}",
   "pinpoint.campaign.campaign_id":"5befa9dc28b1430cb0469554789e3f99",
   "pinpoint.notification.silentPush":"0",
   "pinpoint.campaign.campaign_activity_id":"613f918c7a4440b69b09c4806d1a9357",
   "receivedAt":"1671009494989",
   "sentAt":"1671009495484"
}

Journey payload example:

{
   "pinpoint.openApp":"true",
   "pinpoint.notification.title":"Message title",
   "pinpoint":{
      "journey":{
         "journey_activity_id":"ibcF4z9lsp",
         "journey_run_id":"5df6dd97f9154cb688afc0b41ab221c3",
         "journey_id":"dc893692ea9848faa76cceef197c5305"
      }
   },
   "pinpoint.notification.body":"Message body",
   "data":"{\"pinpoint\":{\"endpointId\":\"endpoint_id1\",\"userId\":\"user_id1\"}}",
   "pinpoint.notification.silentPush":"0"
}

Transactional payload example:

Note the transactional payload is the same for both messages sent to a push notification token and endpoint-id. Additionally the pinpoint.campaign.campaign_id is always set to _DIRECT.

{
   "pinpoint.openApp":"true",
   "pinpoint.notification.title":"Message title",
   "pinpoint.notification.body":"Message body",
   "pinpoint.campaign.campaign_id":"_DIRECT",
   "pinpoint.notification.silentPush":"0",
   "receivedAt":"1671731433375",
   "sentAt":"1671731433565"
}

Recording push notification events

To record push notification events from your mobile or web application, we will leverage the AWS Mobile SDKs or the Amazon Pinpoint Events API. To prevent inaccurate metrics such as double counting” it is recommended using the appropriate endpoint_id as Pinpoint uses this for de-duplication. Below you can find examples for both Events REST API and put_events AWS Python SDK – Boto3. Visit this page for more information on how to create a signed AWS API request.

Campaign event example – REST API:

Required fields: endpoint_id1, EventType, Timestamp, campaign_id and campaign_activity_id

POST https://pinpoint.us-east-1.amazonaws.com/v1/apps/<Pinpoint-App-id>/events

{
   "BatchItem":{
      "<endpoint_id1>":{
         "Endpoint":{}
       },
      "Events":{
         "<event_id>":{
            "EventType":"_campaign.opened_notification",
            "Timestamp":"2022-12-14T09:50:00.000Z",
            "Attributes":{
               "treatment_id":"0",
               "campaign_id":"5befa9dc28b1430cb0469554789e3f99",
               "campaign_activity_id":"613f918c7a4440b69b09c4806d1a9357"
            }
         }
      }
   }
}

Campaign event example – Python SDK:

Required fields: ApplicationId, endpoint_id, EventType, Timestamp, campaign_id and campaign_activity_id

import boto3 
client = boto3.client("pinpoint")
response = client.put_events(
  ApplicationId = <Pinpoint-App-id>,
  EventsRequest = { 
    "BatchItem": {
      "<event_id>": {
        "Endpoint": {},
        "Events": { 
          "<endpoint_id1>": { 
            "EventType":"_campaign.opened_notification",
            "Timestamp": "2022-12-14T09:50:00.000Z",
            "Attributes": {
              "treatment_id":"0",
              "campaign_id":"5befa9dc28b1430cb0469554789e3f99",
              "campaign_activity_id":"613f918c7a4440b69b09c4806d1a9357"
            }
          }
        }
      }
    }
  }
)
print(response)

Journey event example – REST API:

Required fields: endpoint_id, EventType, Timestamp, journey_id and journey_activity_id

POST https://pinpoint.us-east-1.amazonaws.com/v1/apps/<Pinpoint-App-id>/events

{
   "BatchItem":{
      "<endpoint_id1>":{
         "Endpoint":{}
      },
      "Events":{
         "<event_id>":{
            "EventType":"_journey.opened_notification",
            "Timestamp":"2022-12-14T09:50:00.000Z",
            "Attributes":{
               "journey_id":"5befa9dc28b1430cb0469554789e3f99",
               "journey_activity_id":"613f918c7a4440b69b09c4806d1a9357"
            }
         }
      }
   }
}

Journey event example – Python SDK:

Required fields: ApplicationId, endpoint_id1, EventType, Timestamp, journey_id and journey_activity_id

import boto3 
client = boto3.client("pinpoint")
response = client.put_events(
  ApplicationId = <Pinpoint-App-id>,
  EventsRequest = { 
    "BatchItem": {
      "<endpoint_id1>": {
        "Endpoint": {},
        "Events": { 
          "<event_id>": { 
            "EventType":"_journey.opened_notification",
            "Timestamp": "2022-12-14T09:50:00.000Z",
            "Attributes": {
              "journey_id":"5befa9dc28b1430cb0469554789e3f99",
              "journey_activity_id":"613f918c7a4440b69b09c4806d1a9357"
            }
          }
        }
      }
    }
  }
)
print(response)

Transactional event:

Amazon Pinpoint doesn’t support push notification metrics for transactional messages. Specifically, transactional messages don’t offer a field that can be used to attribute engagement events. These engagement events can still be recorded using the Amazon Pinpoint’s Events API. However, unlike Campaign & Journey events, the transactional push notification message payload doesn’t provide an identifier such as Campaign id or Journey Id that can be used as an Amazon Pinpoint event attribute for data reconciliation purposes.

Next steps

Requests to the Amazon Pinpoint Events API must be signed using AWS Signature version 4. We recommend using the AWS Mobile SDKs which handle request signing on your behalf. You can use the AWS Mobile SDKs with temporary limited-privilege Amazon Cognito credentials. For more information and examples, see Getting credentials.


About the Authors

Franklin Ochieng

Franklin Ochieng

Franklin Ochieng is a senior software engineer at the Amazon Pinpoint team. He has attained over 7 years experience at AWS building highly scalable system that solve complex problems for our customers. Outside of work, Frank enjoys getting out in nature and playing basketball or pool.

Pavlos Ioannou Katidis

Pavlos Ioannou Katidis

Pavlos Ioannou Katidis is an Amazon Pinpoint and Amazon Simple Email Service Senior Specialist Solutions Architect at AWS. He enjoys diving deep into customers’ technical issues and help in designing communication solutions. In his spare time, he enjoys playing tennis, watching crime TV series, playing FPS PC games, and coding personal projects.

Boosting Resiliency with an ML-based Telemetry Analytics Architecture

Post Syndicated from Shibu Nair original https://aws.amazon.com/blogs/architecture/boosting-resiliency-with-an-ml-based-telemetry-analytics-architecture/

Data proliferation has become a norm and as organizations become more data driven, automating data pipelines that enable data ingestion, curation, and processing is vital. Since many organizations have thousands of time-bound, automated, complex pipelines, monitoring their telemetry information is critical. Keeping track of telemetry data helps businesses monitor and recover their pipelines faster which results in better customer experiences.

In our blog post, we explain how you can collect telemetry from your data pipeline jobs and use machine learning (ML) to build a lower- and upper-bound threshold to help operators identify anomalies in near-real time.

The applications of anomaly detection on telemetry data from job pipelines are wide-ranging, including these and more:

  • Detecting abnormal runtimes
  • Detecting jobs running slower than expected
  • Proactive monitoring
  • Notifications

Key tenets of telemetry analytics

There are five key tenets of telemetry analytics, as in Figure 1.

Key tenets of telemetry analytics

Figure 1. Key tenets of telemetry analytics

The key tenets for near real-time telemetry analytics for data pipelines are:

  1. Collecting the metrics
  2. Aggregating the metrics
  3. Identify anomaly
  4. Notify and resolve issues
  5. Persist for compliance reasons, historical trend analysis, and to visualize

This blog post describes how customers can easily implement these steps by using AWS native no-code, low-code (AWS LCNC) solutions.

ML-based telemetry analytics solution architecture

The architecture defined here helps customers incrementally enable features with AWS LCNC solutions by leveraging AWS managed services to avoid the overhead of infrastructure provisioning. Most of the steps are configurations of the features provided by AWS services. This enables customers to make their applications resilient by tracking and resolving anomalies in near real time, as in Figure 2.

ML-based telemetry analytics solution architecture

Figure 2. ML-based telemetry analytics solution architecture

Let’s explore each of the architecture steps in detail.

1. Indicative AWS data analytics services: Choose from a broad range of AWS analytics services, including data movement, data storage, data lakes, big data analytics, log analytics, and streaming analytics to business intelligence, ML, and beyond. This diagram shows a subset of these data analytics services. You may use one or a combination of many, depending on your use case.

2. Amazon CloudWatch metrics for telemetry analytics: Collecting and visualizing real-time logs, metrics, and event data is a key step in any process. CloudWatch helps you accomplish these tasks without any infrastructure provisioning. Almost every AWS data analytics service is integrated with CloudWatch to enable automatic capturing of the detailed metrics needed for telemetry analytics.

3. Near real-time use case examples: Step three presents practical, near real-time use cases that represent a range of real-world applications, one or more of which may apply to your own business needs.

Use case 1: Anomaly detection

CloudWatch provides the functionality to apply anomaly detection for a metric. The key business use case of this feature is to apply statistical and ML algorithms on a per-metrics basis of business critical applications to proactively identify issues and raise alarms.

The focus is on a single set of metrics that will be important for the application’s functioning—for example, AWS Lambda metrics of a 24/7 credit card company’s fraud monitoring application.

Use case 2: Unified metrics using Amazon Managed Grafana

For proper insights into telemetry data, it is important to unify metrics and collaboratively identify and troubleshoot issues in analytical systems. Amazon Managed Grafana helps to visualize, query, and corelate metrics from CloudWatch in near real-time.

For example, Amazon Managed Grafana can be used to monitor container metrics for Amazon EMR running on Amazon Elastic Kubernetes Service (Amazon EKS), which supports processing high-volume data from business critical Internet of Things (IoT) applications like connected factories, offsite refineries, wind farms, and more.

Use case 3: Combined business and metrics data using Amazon OpenSearch Service

Amazon OpenSearch Service provides the capability to perform near real-time, ML-based interactive log analytics, application monitoring, and search by combining business and telemetry data.

As an example, customers can combine AWS CloudTrail logs for AWS logins, Amazon Athena, and Amazon RedShift query access times with employee reference data to detect insider threats.

This log analytics use case architecture integrates into OpenSearch, as in Figure 3.

Log analytics use case architecture overview with OpenSearch

Figure 3. Log analytics use case architecture overview with OpenSearch

Use case 4: ML-based advanced analytics

Using Amazon Simple Storage Service (Amazon S3) as data storage, data lake customers can tap into AWS analytics services such as the AWS Glue Catalog, AWS Glue DataBrew, and Athena for preparing and transforming data, as well as build trend analysis using ML models in Amazon SageMaker. This mechanism helps with performing ML-based advanced analytics to identify and resolve recurring issues.

4. Anomaly resolution: When an alert is generated either by CloudWatch alarm, OpenSearch, or Amazon Managed Grafana, you have the option to act on the alert in near-real time. Amazon Simple Notification Service (Amazon SNS) and Lambda can help build workflows. Lambda also helps integrate with ServiceNow ticket creation, Slack channel notifications, or other ticketing systems.

Simple data pipeline example

Let’s explore another practical example using an architecture that demonstrates how AWS Step Functions orchestrates Lambda, AWS Glue jobs, and crawlers.

To report an anomaly on AWS Glue jobs based on total number of records processed, you can leverage the glue.driver.aggregate.recordsRead CloudWatch metric and set up a CloudWatch alarm based on anomaly detection, Amazon SNS topic for notifications, and Lambda for resolution, as in Figure 4.

AWS Step Functions orchestrating Lamba, AWS Glue jobs, and crawlers

Figure 4. AWS Step Functions orchestrating Lamba, AWS Glue jobs, and crawlers

Here are the steps involved in the architecture proposed:

  • CloudWatch automatically captures the metric glue.driver.aggregate.recordsRead from AWS Glue jobs.
  • Customers set a CloudWatch alarm based on the anomaly detection of glue.driver.aggregate.recordsRead metric and set a notification to Amazon SNS topic.
  • CloudWatch applies a ML algorithm to the metric’s past data and creates a model of metric’s expected values.
  • When the number of records increases significantly, the metric from the CloudWatch anomaly detection model notifies the Amazon SNS topic.
  • Customers can notify an email group and trigger a Lambda function to resolve the issue, or create tickets in their operational monitoring system.
  • Customers can also unify all the AWS Glue metrics using Amazon Managed Grafana. Using Amazon S3, data lake customers can crawl and catalog the data in the AWS Glue catalog and make it available for ad-hoc querying. Amazon SageMaker can be used for custom model training and inferencing.

Conclusion

In this blog post, we covered a recommended architecture to enable near-real time telemetry analytics for data pipelines, anomaly detection, notification, and resolution. This provides resiliency to the customer applications by proactively identifying and resolving issues.

Use Apache Iceberg in a data lake to support incremental data processing

Post Syndicated from Flora Wu original https://aws.amazon.com/blogs/big-data/use-apache-iceberg-in-a-data-lake-to-support-incremental-data-processing/

Apache Iceberg is an open table format for very large analytic datasets, which captures metadata information on the state of datasets as they evolve and change over time. It adds tables to compute engines including Spark, Trino, PrestoDB, Flink, and Hive using a high-performance table format that works just like a SQL table. Iceberg has become very popular for its support for ACID transactions in data lakes and features like schema and partition evolution, time travel, and rollback.

Apache Iceberg integration is supported by AWS analytics services including Amazon EMR, Amazon Athena, and AWS Glue. Amazon EMR can provision clusters with Spark, Hive, Trino, and Flink that can run Iceberg. Starting with Amazon EMR version 6.5.0, you can use Iceberg with your EMR cluster without requiring a bootstrap action. In early 2022, AWS announced general availability of Athena ACID transactions, powered by Apache Iceberg. The recently released Athena query engine version 3 provides better integration with the Iceberg table format. AWS Glue 3.0 and later supports the Apache Iceberg framework for data lakes.

In this post, we discuss what customers want in modern data lakes and how Apache Iceberg helps address customer needs. Then we walk through a solution to build a high-performance and evolving Iceberg data lake on Amazon Simple Storage Service (Amazon S3) and process incremental data by running insert, update, and delete SQL statements. Finally, we show you how to performance tune the process to improve read and write performance.

How Apache Iceberg addresses what customers want in modern data lakes

More and more customers are building data lakes, with structured and unstructured data, to support many users, applications, and analytics tools. There is an increased need for data lakes to support database like features such as ACID transactions, record-level updates and deletes, time travel, and rollback. Apache Iceberg is designed to support these features on cost-effective petabyte-scale data lakes on Amazon S3.

Apache Iceberg addresses customer needs by capturing rich metadata information about the dataset at the time the individual data files are created. There are three layers in the architecture of an Iceberg table: the Iceberg catalog, the metadata layer, and the data layer, as depicted in the following figure (source).

The Iceberg catalog stores the metadata pointer to the current table metadata file. When a select query is reading an Iceberg table, the query engine first goes to the Iceberg catalog, then retrieves the location of the current metadata file. Whenever there is an update to the Iceberg table, a new snapshot of the table is created, and the metadata pointer points to the current table metadata file.

The following is an example Iceberg catalog with AWS Glue implementation. You can see the database name, the location (S3 path) of the Iceberg table, and the metadata location.

The metadata layer has three types of files: the metadata file, manifest list, and manifest file in a hierarchy. At the top of the hierarchy is the metadata file, which stores information about the table’s schema, partition information, and snapshots. The snapshot points to the manifest list. The manifest list has the information about each manifest file that makes up the snapshot, such as location of the manifest file, the partitions it belongs to, and the lower and upper bounds for partition columns for the data files it tracks. The manifest file tracks data files as well as additional details about each file, such as the file format. All three files work in a hierarchy to track the snapshots, schema, partitioning, properties, and data files in an Iceberg table.

The data layer has the individual data files of the Iceberg table. Iceberg supports a wide range of file formats including Parquet, ORC, and Avro. Because the Iceberg table tracks the individual data files instead of only pointing to the partition location with data files, it isolates the writing operations from reading operations. You can write the data files at any time, but only commit the change explicitly, which creates a new version of the snapshot and metadata files.

Solution overview

In this post, we walk you through a solution to build a high-performing Apache Iceberg data lake on Amazon S3; process incremental data with insert, update, and delete SQL statements; and tune the Iceberg table to improve read and write performance. The following diagram illustrates the solution architecture.

To demonstrate this solution, we use the Amazon Customer Reviews dataset in an S3 bucket (s3://amazon-reviews-pds/parquet/). In real use case, it would be raw data stored in your S3 bucket. We can check the data size with the following code in the AWS Command Line Interface (AWS CLI):

//Run this AWS CLI command to check the data size
aws s3 ls --summarize --human-readable --recursive s3://amazon-reviews-pds/parquet

The total object count is 430, and total size is 47.4 GiB.

To set up and test this solution, we complete the following high-level steps:

  1. Set up an S3 bucket in the curated zone to store converted data in Iceberg table format.
  2. Launch an EMR cluster with appropriate configurations for Apache Iceberg.
  3. Create a notebook in EMR Studio.
  4. Configure the Spark session for Apache Iceberg.
  5. Convert data to Iceberg table format and move data to the curated zone.
  6. Run insert, update, and delete queries in Athena to process incremental data.
  7. Carry out performance tuning.

Prerequisites

To follow along with this walkthrough, you must have an AWS account with an AWS Identity and Access Management (IAM) role that has sufficient access to provision the required resources.

Set up the S3 bucket for Iceberg data in the curated zone in your data lake

Choose the Region in which you want to create the S3 bucket and provide a unique name:

s3://iceberg-curated-blog-data

Launch an EMR cluster to run Iceberg jobs using Spark

You can create an EMR cluster from the AWS Management Console, Amazon EMR CLI, or AWS Cloud Development Kit (AWS CDK). For this post, we walk you through how to create an EMR cluster from the console.

  1. On the Amazon EMR console, choose Create cluster.
  2. Choose Advanced options.
  3. For Software Configuration, choose the latest Amazon EMR release. As of January 2023, the latest release is 6.9.0. Iceberg requires release 6.5.0 and above.
  4. Select JupyterEnterpriseGateway and Spark as the software to install.
  5. For Edit software settings, select Enter configuration and enter [{"classification":"iceberg-defaults","properties":{"iceberg.enabled":true}}].
  6. Leave other settings at their default and choose Next.
  7. For Hardware, use the default setting.
  8. Choose Next.
  9. For Cluster name, enter a name. We use iceberg-blog-cluster.
  10. Leave the remaining settings unchanged and choose Next.
  11. Choose Create cluster.

Create a notebook in EMR Studio

We now walk you through how to create a notebook in EMR Studio from the console.

  1. On the IAM console, create an EMR Studio service role.
  2. On the Amazon EMR console, choose EMR Studio.
  3. Choose Get started.

The Get started page appears in a new tab.

  1. Choose Create Studio in the new tab.
  2. Enter a name. We use iceberg-studio.
  3. Choose the same VPC and subnet as those for the EMR cluster, and the default security group.
  4. Choose AWS Identity and Access Management (IAM) for authentication, and choose the EMR Studio service role you just created.
  5. Choose an S3 path for Workspaces backup.
  6. Choose Create Studio.
  7. After the Studio is created, choose the Studio access URL.
  8. On the EMR Studio dashboard, choose Create workspace.
  9. Enter a name for your Workspace. We use iceberg-workspace.
  10. Expand Advanced configuration and choose Attach Workspace to an EMR cluster.
  11. Choose the EMR cluster you created earlier.
  12. Choose Create Workspace.
  13. Choose the Workspace name to open a new tab.

In the navigation pane, there is a notebook that has the same name as the Workspace. In our case, it is iceberg-workspace.

  1. Open the notebook.
  2. When prompted to choose a kernel, choose Spark.

Configure a Spark session for Apache Iceberg

Use the following code, providing your own S3 bucket name:

%%configure -f
{
"conf": {
"spark.sql.catalog.demo": "org.apache.iceberg.spark.SparkCatalog",
"spark.sql.catalog.demo.catalog-impl": "org.apache.iceberg.aws.glue.GlueCatalog",
"spark.sql.catalog.demo.warehouse": "s3://iceberg-curated-blog-data",
"spark.sql.extensions":"org.apache.iceberg.spark.extensions.IcebergSparkSessionExtensions",
"spark.sql.catalog.demo.io-impl":"org.apache.iceberg.aws.s3.S3FileIO"
}
}

This sets the following Spark session configurations:

  • spark.sql.catalog.demo – Registers a Spark catalog named demo, which uses the Iceberg Spark catalog plugin.
  • spark.sql.catalog.demo.catalog-impl – The demo Spark catalog uses AWS Glue as the physical catalog to store Iceberg database and table information.
  • spark.sql.catalog.demo.warehouse – The demo Spark catalog stores all Iceberg metadata and data files under the root path defined by this property: s3://iceberg-curated-blog-data.
  • spark.sql.extensions – Adds support to Iceberg Spark SQL extensions, which allows you to run Iceberg Spark procedures and some Iceberg-only SQL commands (you use this in a later step).
  • spark.sql.catalog.demo.io-impl – Iceberg allows users to write data to Amazon S3 through S3FileIO. The AWS Glue Data Catalog by default uses this FileIO, and other catalogs can load this FileIO using the io-impl catalog property.

Convert data to Iceberg table format

You can use either Spark on Amazon EMR or Athena to load the Iceberg table. In the EMR Studio Workspace notebook Spark session, run the following commands to load the data:

// create a database in AWS Glue named reviews if not exist
spark.sql("CREATE DATABASE IF NOT EXISTS demo.reviews")

// load reviews - this load all the parquet files
val reviews_all_location = "s3://amazon-reviews-pds/parquet/"
val reviews_all = spark.read.parquet(reviews_all_location)

// write reviews data to an Iceberg v2 table
reviews_all.writeTo("demo.reviews.all_reviews").tableProperty("format-version", "2").createOrReplace()

After you run the code, you should find two prefixes created in your data warehouse S3 path (s3://iceberg-curated-blog-data/reviews.db/all_reviews): data and metadata.

Process incremental data using insert, update, and delete SQL statements in Athena

Athena is a serverless query engine that you can use to perform read, write, update, and optimization tasks against Iceberg tables. To demonstrate how the Apache Iceberg data lake format supports incremental data ingestion, we run insert, update, and delete SQL statements on the data lake.

Navigate to the Athena console and choose Query editor. If this is your first time using the Athena query editor, you need to configure the query result location to be the S3 bucket you created earlier. You should be able to see that the table reviews.all_reviews is available for querying. Run the following query to verify that you have loaded the Iceberg table successfully:

select * from reviews.all_reviews limit 5;

Process incremental data by running insert, update, and delete SQL statements:

//Example update statement
update reviews.all_reviews set star_rating=5 where product_category = 'Watches' and star_rating=4

//Example delete statement
delete from reviews.all_reviews where product_category = 'Watches' and star_rating=1

Performance tuning

In this section, we walk through different ways to improve Apache Iceberg read and write performance.

Configure Apache Iceberg table properties

Apache Iceberg is a table format, and it supports table properties to configure table behavior such as read, write, and catalog. You can improve the read and write performance on Iceberg tables by adjusting the table properties.

For example, if you notice that you write too many small files for an Iceberg table, you can config the write file size to write fewer but bigger size files, to help improve query performance.

Property Default Description
write.target-file-size-bytes 536870912 (512 MB) Controls the size of files generated to target about this many bytes

Use the following code to alter the table format:

//Example code to alter table format in EMR Studio Workspace notebook
spark.sql("ALTER TABLE demo.reviews.all_reviews 
SET TBLPROPERTIES ('write_target_data_file_size_bytes'='536870912')")

Partitioning and sorting

To make a query run fast, the less data read the better. Iceberg takes advantage of the rich metadata it captures at write time and facilitates techniques such as scan planning, partitioning, pruning, and column-level stats such as min/max values to skip data files that don’t have match records. We walk you through how query scan planning and partitioning work in Iceberg and how we use them to improve query performance.

Query scan planning

For a given query, the first step in a query engine is scan planning, which is the process to find the files in a table needed for a query. Planning in an Iceberg table is very efficient, because Iceberg’s rich metadata can be used to prune metadata files that aren’t needed, in addition to filtering data files that don’t contain matching data. In our tests, we observed Athena scanned 50% or less data for a given query on an Iceberg table compared to original data before conversion to Iceberg format.

There are two types of filtering:

  • Metadata filtering – Iceberg uses two levels of metadata to track the files in a snapshot: the manifest list and manifest files. It first uses the manifest list, which acts as an index of the manifest files. During planning, Iceberg filters manifests using the partition value range in the manifest list without reading all the manifest files. Then it uses selected manifest files to get data files.
  • Data filtering – After selecting the list of manifest files, Iceberg uses the partition data and column-level stats for each data file stored in manifest files to filter data files. During planning, query predicates are converted to predicates on the partition data and applied first to filter data files. Then, the column stats like column-level value counts, null counts, lower bounds, and upper bounds are used to filter out data files that can’t match the query predicate. By using upper and lower bounds to filter data files at planning time, Iceberg greatly improves query performance.

Partitioning and sorting

Partitioning is a way to group records with the same key column values together in writing. The benefit of partitioning is faster queries that access only part of the data, as explained earlier in query scan planning: data filtering. Iceberg makes partitioning simple by supporting hidden partitioning, in the way that Iceberg produces partition values by taking a column value and optionally transforming it.

In our use case, we first run the following query on the Iceberg table not partitioned. Then we partition the Iceberg table by the category of the reviews, which will be used in the query WHERE condition to filter out records. With partitioning, the query could scan much less data. See the following code:

//Example code in EMR Studio Workspace notebook to create an Iceberg table all_reviews_partitioned partitioned by product_category
reviews_all.writeTo("demo.reviews.all_reviews_partitioned").tableProperty("format-version", "2").partitionedBy($"product_category").createOrReplace()

Run the following select statement on the non-partitioned all_reviews table vs. the partitioned table to see the performance difference:

//Run this query on all_reviews table and the partitioned table for performance testing
select marketplace,customer_id, review_id,product_id,product_title,star_rating from reviews.all_reviews where product_category = 'Watches' and review_date between date('2005-01-01') and date('2005-03-31')

//Run the same select query on partitioned dataset
select marketplace,customer_id, review_id,product_id,product_title,star_rating from reviews.all_reviews_partitioned where product_category = 'Watches' and review_date between date('2005-01-01') and date('2005-03-31')

The following table shows the performance improvement of data partitioning, with about 50% performance improvement and 70% less data scanned.

Dataset Name Non-Partitioned Dataset Partitioned Dataset
Runtime (seconds) 8.20 4.25
Data Scanned (MB) 131.55 33.79

Note that the runtime is the average runtime with multiple runs in our test.

We saw good performance improvement after partitioning. However, this can be further improved by using column-level stats from Iceberg manifest files. In order to use the column-level stats effectively, you want to further sort your records based on the query patterns. Sorting the whole dataset using the columns that are often used in queries will reorder the data in such a way that each data file ends up with a unique range of values for the specific columns. If these columns are used in the query condition, it allows query engines to further skip data files, thereby enabling even faster queries.

Copy-on-write vs. read-on-merge

When implementing update and delete on Iceberg tables in the data lake, there are two approaches defined by the Iceberg table properties:

  • Copy-on-write – With this approach, when there are changes to the Iceberg table, either updates or deletes, the data files associated with the impacted records will be duplicated and updated. The records will be either updated or deleted from the duplicated data files. A new snapshot of the Iceberg table will be created and pointing to the newer version of data files. This makes the overall writes slower. There might be situations that concurrent writes are needed with conflicts so retry has to happen, which increases the write time even more. On the other hand, when reading the data, there is no extra process needed. The query will retrieve data from the latest version of data files.
  • Merge-on-read – With this approach, when there are updates or deletes on the Iceberg table, the existing data files will not be rewritten; instead new delete files will be created to track the changes. For deletes, a new delete file will be created with the deleted records. When reading the Iceberg table, the delete file will be applied to the retrieved data to filter out the delete records. For updates, a new delete file will be created to mark the updated records as deleted. Then a new file will be created for those records but with updated values. When reading the Iceberg table, both the delete and new files will be applied to the retrieved data to reflect the latest changes and produce the correct results. So, for any subsequent queries, an extra step to merge the data files with the delete and new files will happen, which will usually increase the query time. On the other hand, the writes might be faster because there is no need to rewrite the existing data files.

To test the impact of the two approaches, you can run the following code to set the Iceberg table properties:

//Run code to alter Iceberg table property to set copy-on-write and merge-on-read in EMR Studio Workspace notebook
spark.sql(“ALTER TABLE demo.reviews.all_reviews 
SET TBLPROPERTIES (‘write.delete.mode’=’copy-on-write’,’write.update.mode’=’copy-on-write’)”)

Run the update, delete, and select SQL statements in Athena to show the runtime difference for copy-on-write vs. merge-on-read:

//Example update statement
update reviews.all_reviews set star_rating=5 where product_category = ‘Watches’ and star_rating=4

//Example delete statement
delete from reviews.all_reviews where product_category = ‘Watches’ and star_rating=1

//Example select statement
select marketplace,customer_id, review_id,product_id,product_title,star_rating from reviews.all_reviews where product_category = ‘Watches’ and review_date between date(‘2005-01-01’) and date(‘2005-03-31’)

The following table summarizes the query runtimes.

Query Copy-on-Write Merge-on-Read
UPDATE DELETE SELECT UPDATE DELETE SELECT
Runtime (seconds) 66.251 116.174 97.75 10.788 54.941 113.44
Data scanned (MB) 494.06 3.07 137.16 494.06 3.07 137.16

Note that the runtime is the average runtime with multiple runs in our test.

As our test results show, there are always trade-offs in the two approaches. Which approach to use depends on your use cases. In summary, the considerations come down to latency on the read vs. write. You can reference the following table and make the right choice.

. Copy-on-Write Merge-on-Read
Pros Faster reads Faster writes
Cons Expensive writes Higher latency on reads
When to use Good for frequent reads, infrequent updates and deletes or large batch updates Good for tables with frequent updates and deletes

Data compaction

If your data file size is small, you might end up with thousands or millions of files in an Iceberg table. This dramatically increases the I/O operation and slows down the queries. Furthermore, Iceberg tracks each data file in a dataset. More data files lead to more metadata. This in turn increases the overhead and I/O operation on reading metadata files. In order to improve the query performance, it’s recommended to compact small data files to larger data files.

When updating and deleting records in Iceberg table, if the read-on-merge approach is used, you might end up with many small deletes or new data files. Running compaction will combine all these files and create a newer version of the data file. This eliminates the need to reconcile them during reads. It’s recommended to have regular compaction jobs to impact reads as little as possible while still maintaining faster write speed.

Run the following data compaction command, then run the select query from Athena:

//Data compaction 
optimize reviews.all_reviews REWRITE DATA USING BIN_PACK

//Run this query before and after data compaction
select marketplace,customer_id, review_id,product_id,product_title,star_rating from reviews.all_reviews where product_category = 'Watches' and review_date between date('2005-01-01') and date('2005-03-31')

The following table compares the runtime before vs. after data compaction. You can see about 40% performance improvement.

Query Before Data Compaction After Data Compaction
Runtime (seconds) 97.75 32.676 seconds
Data scanned (MB) 137.16 M 189.19 M

Note that the select queries ran on the all_reviews table after update and delete operations, before and after data compaction. The runtime is the average runtime with multiple runs in our test.

Clean up

After you follow the solution walkthrough to perform the use cases, complete the following steps to clean up your resources and avoid further costs:

  1. Drop the AWS Glue tables and database from Athena or run the following code in your notebook:
// DROP the table 
spark.sql("DROP TABLE demo.reviews.all_reviews") 
spark.sql("DROP TABLE demo.reviews.all_reviews_partitioned") 

// DROP the database 
spark.sql("DROP DATABASE demo.reviews")
  1. On the EMR Studio console, choose Workspaces in the navigation pane.
  2. Select the Workspace you created and choose Delete.
  3. On the EMR console, navigate to the Studios page.
  4. Select the Studio you created and choose Delete.
  5. On the EMR console, choose Clusters in the navigation pane.
  6. Select the cluster and choose Terminate.
  7. Delete the S3 bucket and any other resources that you created as part of the prerequisites for this post.

Conclusion

In this post, we introduced the Apache Iceberg framework and how it helps resolve some of the challenges we have in a modern data lake. Then we walked you though a solution to process incremental data in a data lake using Apache Iceberg. Finally, we had a deep dive into performance tuning to improve read and write performance for our use cases.

We hope this post provides some useful information for you to decide whether you want to adopt Apache Iceberg in your data lake solution.


About the Authors

Flora Wu is a Sr. Resident Architect at AWS Data Lab. She helps enterprise customers create data analytics strategies and build solutions to accelerate their businesses outcomes. In her spare time, she enjoys playing tennis, dancing salsa, and traveling.

Daniel Li is a Sr. Solutions Architect at Amazon Web Services. He focuses on helping customers develop, adopt, and implement cloud services and strategy. When not working, he likes spending time outdoors with his family.
Visualize database privileges on Amazon Redshift using Grafana

Post Syndicated from Yota Hamaoka original https://aws.amazon.com/blogs/big-data/visualize-database-privileges-on-amazon-redshift-using-grafana/

Amazon Redshift is a fully managed, petabyte-scale data warehouse service in the cloud. Amazon Redshift enables you to use SQL for analyzing structured and semi-structured data with best price performance along with secure access to the data.

As more users start querying data in a data warehouse, access control is paramount to protect valuable organizational data. Database administrators want to continuously monitor and manage user privileges to maintain proper data access in the data warehouse. Amazon Redshift provides granular access control on the database, schema, table, column, row, and other database objects by granting privileges to roles, groups, and users from a SQL interface. To monitor privileges configured in Amazon Redshift, you can retrieve them by querying system tables.

Although Amazon Redshift provides a broad capability of managing access to database objects, we have heard from customers that they want to visualize and monitor privileges without using a SQL interface. In this post, we introduce predefined dashboards using Grafana which visualizes database privileges without writing SQL. This dashboard will help database administrators to reduce the time spent on database administration and increase the frequency of monitoring cycles.

Database security in Amazon Redshift

Security is the top priority at AWS. Amazon Redshift provides four levels of control:

  • Cluster management
  • Cluster connectivity
  • Database access
  • Temporary database credentials and single sign-on

This post focuses on database access, which relates to user access control against database objects. For more information, see Managing database security.

Amazon Redshift uses the GRANT command to define permissions in the database. For most database objects, GRANT takes three parameters:

  • Identity – The entity you grant access to. This could be a user, role, or group.
  • Object – The type of database object. This could be a database, schema, table or view, column, row, function, procedure, language, datashare, machine leaning (ML) model, and more.
  • Privilege – The type of operation. Examples include CREATE, SELECT, ALTER, DROP, DELETE, and INSERT. The level of privilege depends on the object.

To remove access, use the REVOKE command.

Additionally, Amazon Redshift offers granular access control with the Row-level security (RLS) feature. You can attach or detach RLS policies to identities with the ATTACH RLS POLICY and DETACH RLS POLICY commands, respectively. See RLS policy ownership and management for more details.

Generally, database administrator monitors and reviews the identities, objects, and privileges periodically to ensure proper access is configured. They also need to investigate access configurations if database users face permission errors. These tasks require a SQL interface to query multiple system tables, which can be a repetitive and undifferentiated operation. Therefore, database administrators need a single pane of glass to quickly navigate through identities, objects, and privileges without writing SQL.

Solution overview

The following diagram illustrates the solution architecture and its key components:

  • Amazon Redshift contains database privilege information in system tables.
  • Grafana provides a predefined dashboard to visualize database privileges. The dashboard runs queries against the Amazon Redshift system table via the Amazon Redshift Data API.

Note that the dashboard focuses on visualization. SQL interface is required to configure privileges in Amazon Redshift. You can use query editor v2, a web-based SQL interface which enables users to run SQL commands from a browser.

Prerequisites

Before moving to the next section, you should have the following prerequisites:

While Amazon Managed Grafana controls the plugin version and updates periodically, local Grafana allows user to control the version. Therefore, local Grafana could be an option if you need earlier access for the latest features. Refer to plugin changelog for released features and versions.

Import the dashboards

After you have finished the prerequisites, you should have access to Grafana configured with Amazon Redshift as a data source. Next, import two dashboards for visualization.

  1. In Grafana console, go to the created Redshift data source and click Dashboards
  2. Import the Amazon Redshift Identities and Objects
  3. Go to the data source again and import the Amazon Redshift Privileges

Each dashboard will appear once imported.

Amazon Redshift Identities and Objects dashboard

The Amazon Redshift Identities and Objects dashboard shows identites and database objects in Amazon Redshift, as shown in the following screenshot.

The Identities section shows the detail of each user, role, and group in the source database.

One of the key features in this dashboard is the Role assigned to Role, User section, which uses a node graph panel to visualize the hierarchical structure of roles and users from multiple system tables. This visualization can help administrators quickly examine which roles are inherited to users instead of querying multiple system tables. For more information about role-based access, refer to Role-based access control (RBAC).

Amazon Redshift Privileges dashboard

The Amazon Redshift Privileges dashboard shows privileges defined in Amazon Redshift.

In the Role and Group assigned to User section, open the Role assigned to User panel to list the roles for a specific user. In this panel, you can list and compare roles assigned to multiple users. Use the User drop-down at the top of the dashboard to select users.

The dashboard will refresh immediately and show filtered result for selected users. Following screenshot is the filtered result for user hr1, hr2 and it3.

The Object Privileges section shows the privileges granted for each database object and identity. Note that objects with no privileges granted are not listed here. To show the full list of database objects, use the Amazon Redshift Identities and Objects dashboard.

The Object Privileges (RLS) section contains visualizations for row-level security (RLS). The Policy attachments panel enables you to examine RLS configuration by visualizing relation between of tables, policies, roles and users.

Conclusion

In this post, we introduced a visualization for database privileges of Amazon Redshift using predefined Grafana dashboards. Database administrators can use these dashboards to quickly navigate through identities, objects, and privileges without writing SQL. You can also customize the dashboard to meet your business requirements. The JSON definition file of this dashboard is maintained as part of OSS in the Redshift data source for Grafana GitHub repository.

For more information about the topics described to in this post, refer to the following:


About the author

Yota Hamaoka is an Analytics Solution Architect at Amazon Web Services. He is focused on driving customers to accelerate their analytics journey with Amazon Redshift.

Build a semantic search engine for tabular columns with Transformers and Amazon OpenSearch Service

Post Syndicated from Kachi Odoemene original https://aws.amazon.com/blogs/big-data/build-a-semantic-search-engine-for-tabular-columns-with-transformers-and-amazon-opensearch-service/

Finding similar columns in a data lake has important applications in data cleaning and annotation, schema matching, data discovery, and analytics across multiple data sources. The inability to accurately find and analyze data from disparate sources represents a potential efficiency killer for everyone from data scientists, medical researchers, academics, to financial and government analysts.

Conventional solutions involve lexical keyword search or regular expression matching, which are susceptible to data quality issues such as absent column names or different column naming conventions across diverse datasets (for example, zip_code, zcode, postalcode).

In this post, we demonstrate a solution for searching for similar columns based on column name, column content, or both. The solution uses approximate nearest neighbors algorithms available in Amazon OpenSearch Service to search for semantically similar columns. To facilitate the search, we create features representations (embeddings) for individual columns in the data lake using pre-trained Transformer models from the sentence-transformers library in Amazon SageMaker. Finally, to interact with and visualize results from our solution, we build an interactive Streamlit web application running on AWS Fargate.

We include a code tutorial for you to deploy the resources to run the solution on sample data or your own data.

Solution overview

The following architecture diagram illustrates the two-stage workflow for finding semantically similar columns. The first stage runs an AWS Step Functions workflow that creates embeddings from tabular columns and builds the OpenSearch Service search index. The second stage, or the online inference stage, runs a Streamlit application through Fargate. The web application collects input search queries and retrieves from the OpenSearch Service index the approximate k-most-similar columns to the query.

Solution architecture

Figure 1. Solution architecture

The automated workflow proceeds in the following steps:

  1. The user uploads tabular datasets into an Amazon Simple Storage Service (Amazon S3) bucket, which invokes an AWS Lambda function that initiates the Step Functions workflow.
  2. The workflow begins with an AWS Glue job that converts the CSV files into Apache Parquet data format.
  3. A SageMaker Processing job creates embeddings for each column using pre-trained models or custom column embedding models. The SageMaker Processing job saves the column embeddings for each table in Amazon S3.
  4. A Lambda function creates the OpenSearch Service domain and cluster to index the column embeddings produced in the previous step.
  5. Finally, an interactive Streamlit web application is deployed with Fargate. The web application provides an interface for the user to input queries to search the OpenSearch Service domain for similar columns.

You can download the code tutorial from GitHub to try this solution on sample data or your own data. Instructions on the how to deploy the required resources for this tutorial are available on Github.

Prerequistes

To implement this solution, you need the following:

  • An AWS account.
  • Basic familiarity with AWS services such as the AWS Cloud Development Kit (AWS CDK), Lambda, OpenSearch Service, and SageMaker Processing.
  • A tabular dataset to create the search index. You can bring your own tabular data or download the sample datasets on GitHub.

Build a search index

The first stage builds the column search engine index. The following figure illustrates the Step Functions workflow that runs this stage.

Step functions workflow

Figure 2 – Step functions workflow – multiple embedding models

Datasets

In this post, we build a search index to include over 400 columns from over 25 tabular datasets. The datasets originate from the following public sources:

For the the full list of the tables included in the index, see the code tutorial on GitHub.

You can bring your own tabular dataset to augment the sample data or build your own search index. We include two Lambda functions that initiate the Step Functions workflow to build the search index for individual CSV files or a batch of CSV files, respectively.

Transform CSV to Parquet

Raw CSV files are converted to Parquet data format with AWS Glue. Parquet is a column-oriented format file format preferred in big data analytics that provides efficient compression and encoding. In our experiments, the Parquet data format offered significant reduction in storage size compared to raw CSV files. We also used Parquet as a common data format to convert other data formats (for example JSON and NDJSON) because it supports advanced nested data structures.

Create tabular column embeddings

To extract embeddings for individual table columns in the sample tabular datasets in this post, we use the following pre-trained models from the sentence-transformers library. For additional models, see Pretrained Models.

Model name Dimension Size (MB)
all-MiniLM-L6-v2 384 80
all-distilroberta-v1 768 290
average_word_embeddings_glove.6B.300d 300 420

The SageMaker Processing job runs create_embeddings.py(code) for a single model. For extracting embeddings from multiple models, the workflow runs parallel SageMaker Processing jobs as shown in the Step Functions workflow. We use the model to create two sets of embeddings:

  • column_name_embeddings – Embeddings of column names (headers)
  • column_content_embeddings – Average embedding of all the rows in the column

For more information about the column embedding process, see the code tutorial on GitHub.

An alternative to the SageMaker Processing step is to create a SageMaker batch transform to get column embeddings on large datasets. This would require deploying the model to a SageMaker endpoint. For more information, see Use Batch Transform.

Index embeddings with OpenSearch Service

In the final step of this stage, a Lambda function adds the column embeddings to a OpenSearch Service approximate k-Nearest-Neighbor (kNN) search index. Each model is assigned its own search index. For more information about the approximate kNN search index parameters, see k-NN.

Online inference and semantic search with a web app

The second stage of the workflow runs a Streamlit web application where you can provide inputs and search for semantically similar columns indexed in OpenSearch Service. The application layer uses an Application Load Balancer, Fargate, and Lambda. The application infrastructure is automatically deployed as part of the solution.

The application allows you to provide an input and search for semantically similar column names, column content, or both. Additionally, you can select the embedding model and number of nearest neighbors to return from the search. The application receives inputs, embeds the input with the specified model, and uses kNN search in OpenSearch Service to search indexed column embeddings and find the most similar columns to the given input. The search results displayed include the table names, column names, and similarity scores for the columns identified, as well as the locations of the data in Amazon S3 for further exploration.

The following figure shows an example of the web application. In this example, we searched for columns in our data lake that have similar Column Names (payload type) to district (payload). The application used all-MiniLM-L6-v2 as the embedding model and returned 10 (k) nearest neighbors from our OpenSearch Service index.

The application returned transit_district, city, borough, and location as the four most similar columns based on the data indexed in OpenSearch Service. This example demonstrates the ability of the search approach to identify semantically similar columns across datasets.

Web application user interface

Figure 3: Web application user interface

Clean up

To delete the resources created by the AWS CDK in this tutorial, run the following command:

cdk destroy --all

Conclusion

In this post, we presented an end-to-end workflow for building a semantic search engine for tabular columns.

Get started today on your own data with our code tutorial available on GitHub. If you’d like help accelerating your use of ML in your products and processes, please contact the Amazon Machine Learning Solutions Lab.


About the Authors

Kachi Odoemene is an Applied Scientist at AWS AI. He builds AI/ML solutions to solve business problems for AWS customers.

Taylor McNally is a Deep Learning Architect at Amazon Machine Learning Solutions Lab. He helps customers from various industries build solutions leveraging AI/ML on AWS. He enjoys a good cup of coffee, the outdoors, and time with his family and energetic dog.

Austin Welch is a Data Scientist in the Amazon ML Solutions Lab. He develops custom deep learning models to help AWS public sector customers accelerate their AI and cloud adoption. In his spare time, he enjoys reading, traveling, and jiu-jitsu.

Reduce Amazon EMR cluster costs by up to 19% with new enhancements in Amazon EMR Managed Scaling

Post Syndicated from Sushant Majithia original https://aws.amazon.com/blogs/big-data/reduce-amazon-emr-cluster-costs-by-up-to-19-with-new-enhancements-in-amazon-emr-managed-scaling/

In June 2020, AWS announced the general availability of Amazon EMR Managed Scaling. With EMR Managed Scaling, you specify the minimum and maximum compute limits for your clusters, and Amazon EMR automatically resizes your cluster for optimal performance and resource utilization. EMR Managed Scaling constantly monitors key workload-related metrics and uses an algorithm that optimizes the cluster size for best resource utilization. Given that the feature is completely managed, improvements to the algorithm are immediately realized without needing a version upgrade. Amazon EMR can scale the cluster up during peaks and scale it down gracefully during idle periods, reducing your costs and optimizing cluster capacity for the best performance.

Throughout 2022, we made multiple enhancements to the EMR Managed Scaling algorithm. With these improvements, we observed that for clusters enabled with EMR Managed Scaling, utilization improved by up to 15 percent, and total costs were reduced further by up to 19 percent. Starting mid-December 2022, EMR Managed Scaling enhancements were enabled by default for clusters using Amazon EMR versions 5.34.0 and later and Amazon EMR versions 6.4.0 and later for both new and existing clusters. Further, given that the feature is completely managed, you will get the new optimized Managed Scaling algorithm by default, and no action is needed on your end.

Listed below are some of the key enhancements we enabled for EMR Managed Scaling:

  • Improved cluster utilization with targeted scale-down of your EMR cluster
  • Reduced costs by preventing scale-down of instances that store intermediate shuffle data using Spark Shuffle data awareness
  • Improved cluster utilization and reduce costs with gradual scale-up of your EMR cluster

Customer success stories

How the enhanced EMR Managed Scaling algorithm helped a technology enterprise reduce costs:

To illustrate the cost savings by examples, we looked at an EMR clusters for a technology enterprise, which heavily uses Amazon EMR to process real time billing data between Kafka and S3 using Spark. They run a persistent EMR cluster with EMR version 5.35 and have EMR Managed Scaling turned-on. The following Amazon CloudWatch dashboard shows how starting December 21, the enhanced Managed Scaling algorithm provisioned (total nodes requested) only 70 nodes vs. the previous Managed Scaling algorithm which provisioned 179 nodes for a similar job profile. The lower the number of resources provisioned to run your jobs, the lower the total cost of your EMR cluster.

How the enhanced EMR Managed Scaling algorithm helped an advertising enterprise reduce costs:

We also looked at an EMR cluster for an advertising enterprise, which leverages Amazon EMR for their data analytics strategy and executes their batch ETL jobs using Spark. They run their clusters on EMR version 6.5 and have EMR Managed Scaling turned-on. The following Amazon CloudWatch dashboard shows how starting December 15, the enhanced Managed Scaling algorithm provisioned (total units requested) only 41 nodes vs. the previous Managed Scaling algorithm which provisioned 86 nodes for a similar job profile.

Estimating the cost savings and utilization improvements for your EMR clusters:

Cluster cost savings:

To view estimated cost savings for your EMR cluster with the EMR Managed Scaling enhancements, please follow the steps below:

  • Open the CloudWatch metrics console and, under EMR, search by your ClusterId.
  • From the list of metrics available for EMR, select the following two metrics:
    • Running capacity – Based on the unit type you specified in your Managed Scaling policy, this will be available as either “TotalUnitsRunning” or “TotalNodesRunning” or “TotalVCPURunning
    • Capacity requested by Managed Scaling – Based on the unit type you specified in your Managed Scaling policy, this will be available as either “TotalUnitsRequested” or “TotalNodesRequested” or “TotalVCPURequested
  •  Plot both of the metrics to your CloudWatch dashboard.
  • Select the time frame as the 3 months between November 2022 and January 2023 to view the improvements with the enhanced Managed Scaling algorithm when compared to the previous Managed Scaling algorithm.

Cluster utilization improvements:

To estimate the improvements in your EMR cluster utilization with the EMR Managed Scaling enhancements, please follow the steps below:

  • Open the CloudWatch metrics console and, under EMR, search by your ClusterId.
  • From the list of metrics available for EMR, select the “YARNMemoryAvailablePercentage” metric.
  • To derive memory utilized by YARN, add a math expression such as “Add Math → Start with empty expression”
    • For the new math expression, set Label=Yarn Utilization and set Details=100-YARNMemoryAvailablePercentage.
  • Plot the cluster utilization metric to your CloudWatch dashboard.
  • Select the time frame as the 3 months between November 2022 and January 2023 to view the improvements with the enhanced Managed Scaling algorithm when compared to the previous Managed Scaling algorithm.

What’s next

We will continue to tune the Managed Scaling algorithm with every new EMR release and thereby improve the customer experience when scaling clusters with EMR Managed Scaling.

Conclusion

In this post, we provided an overview of the key enhancement we launched in EMR Managed Scaling. With these enhancements, we observed that the cluster utilization improved by up to 15 percent, and cluster cost was reduced by up to 19 percent. Starting mid-December 2022, these enhancements were enabled by default for EMR clusters using Amazon EMR versions 5.34.0 and later, and Amazon EMR versions 6.4.0 and later. Given that EMR Managed Scaling is a completely managed feature, you will get the new, optimized EMR Managed Scaling algorithm by default, and no action is needed from your end.

To learn more and get started with EMR Managed Scaling, visit the EMR Managed Scaling documentation page.


About the Authors

Sushant Majithia is a Principal Product Manager for EMR at Amazon Web Services.

 Vishal Vyas is a Senior Software Engineer for EMR at Amazon Web Services.

Matthew Liem is a Senior Solution Architecture Manager at AWS.