Tag Archives: AWS Lambda

Query SAP HANA using Athena Federated Query and join with data in your Amazon S3 data lake

Post Syndicated from Navnit Shukla original https://aws.amazon.com/blogs/big-data/query-sap-hana-using-athena-federated-query-and-join-with-data-in-your-amazon-s3-data-lake/

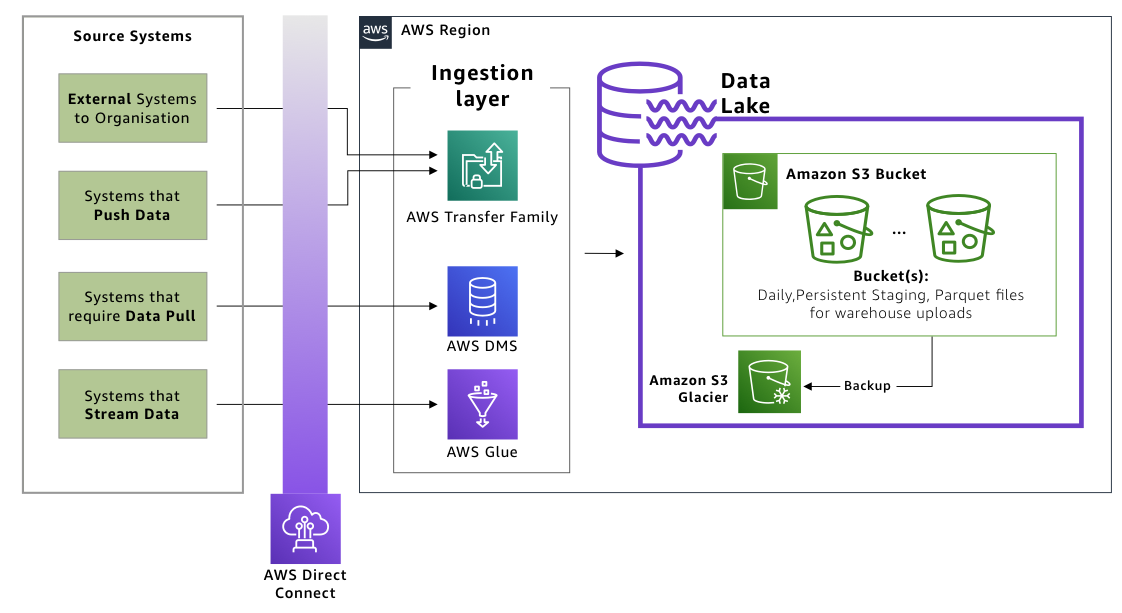
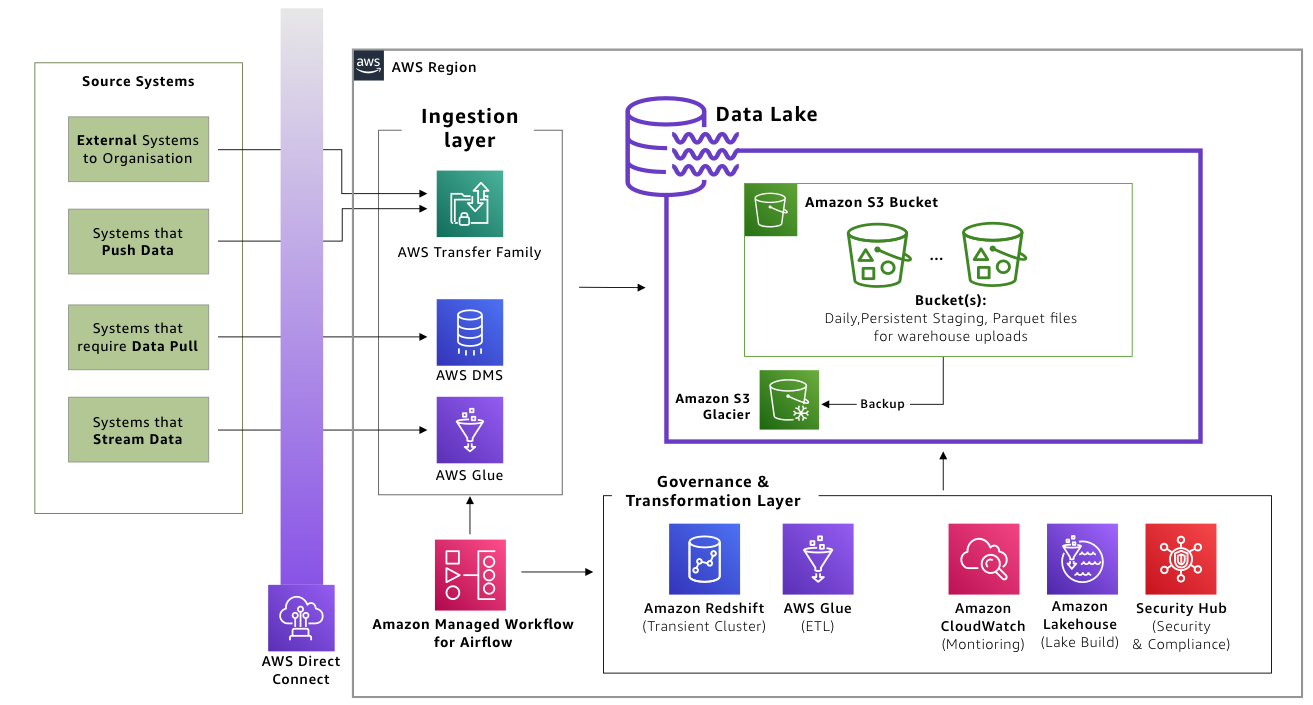
If you use data lakes in Amazon Simple Storage Service (Amazon S3) and use SAP HANA as your transactional data store, you may need to join the data in your data lake with SAP HANA in the cloud, SAP HANA running on Amazon Elastic Compute Cloud (Amazon EC2), or with an on-premises SAP HANA, for example to build a dashboard or create consolidated reporting.

In such use cases, Amazon Athena Federated Query allows you to seamlessly access the data from SAP HANA database without building ETL pipelines to copy or unload the data to the S3 data lake or SAP HANA. This removes the overhead of creating additional extract, transform, and load (ETL) processes and shortens the development cycle.

In this post, we walk you through a step-by-step configuration to set up Amazon Athena Federated Query using AWS Lambda to access data in a SAP HANA database running on AWS.

For this post, we will be using the SAP HANA Athena Federated query connector developed by Trianz. You can deploy the Athena Federated query connector developed by Trianz available in the AWS Serverless Application Repository.

Let’s start with discussing the solution and then detailing the steps involved.

Solution overview

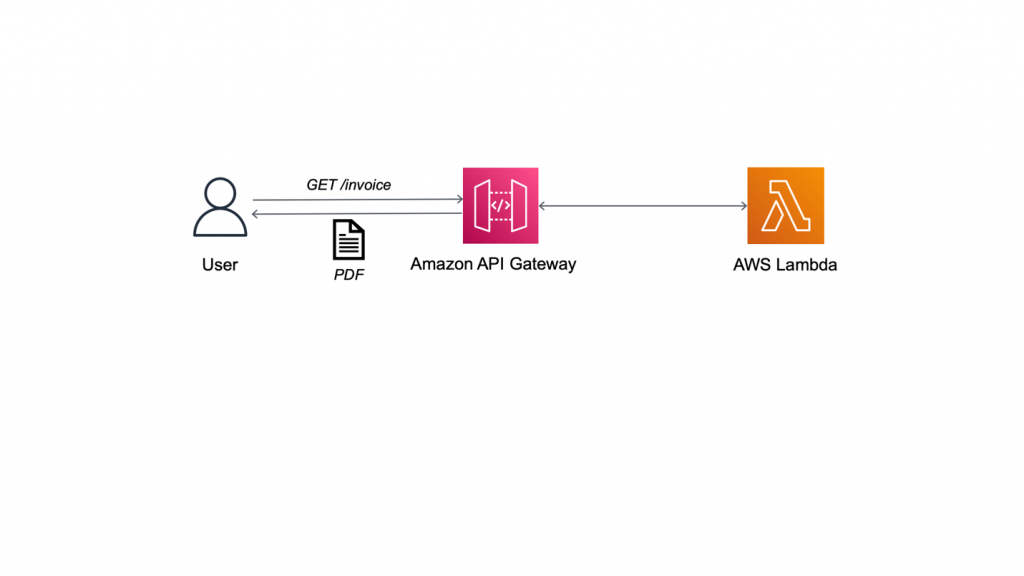
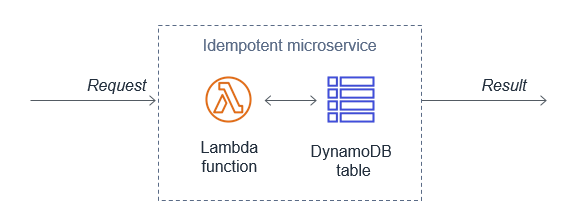
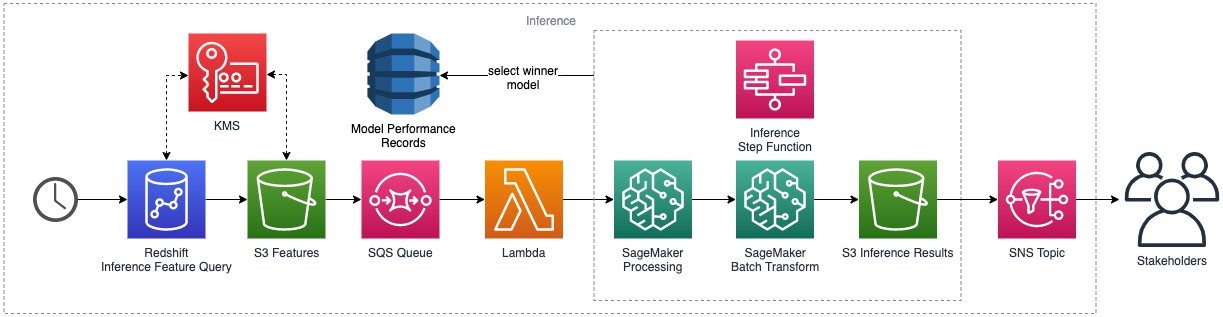
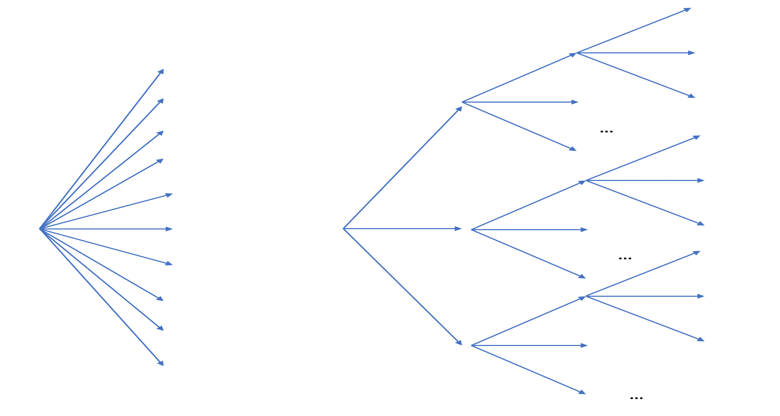
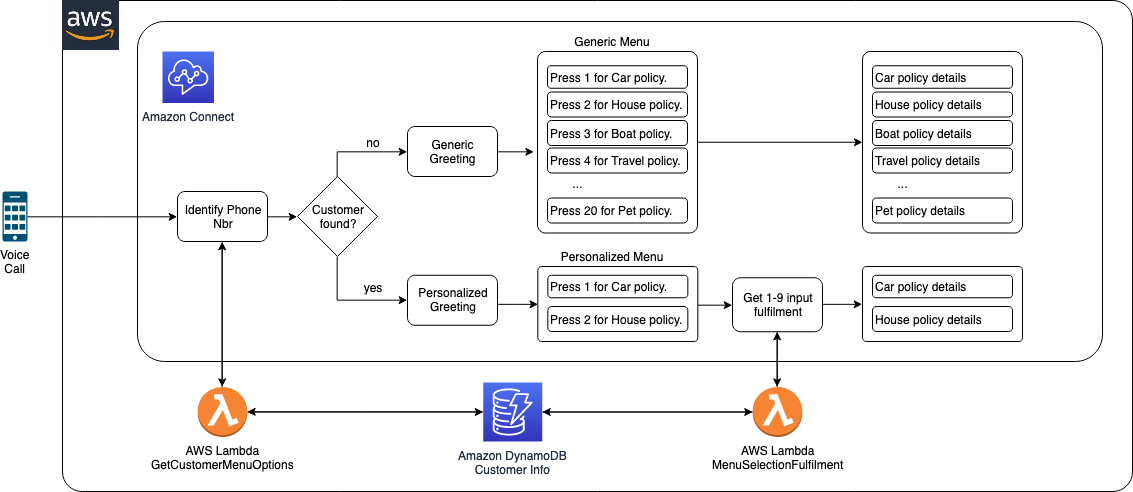
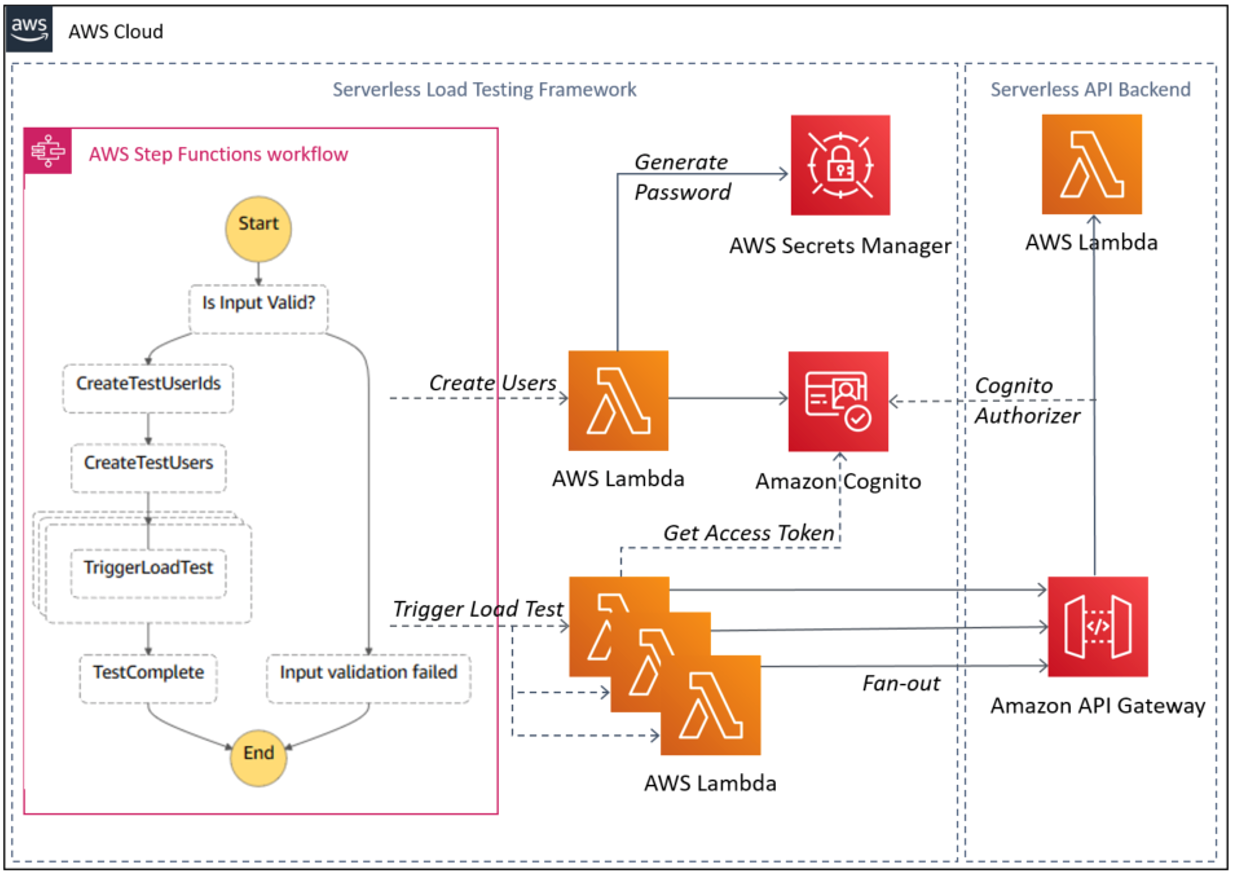
Data federation is the capability to integrate data in another data store using a single interface (Athena). The following diagram depicts how Athena federation works by using Lambda to integrate with a federated data source.

Athena is an interactive query service that makes it easy to analyze data in Amazon S3 using standard SQL. If you have data in sources other than Amazon S3, you can use Athena Federated Query to query the data in place or build pipelines to extract data from multiple data sources and store them in Amazon S3. With Athena Federated Query, you can run SQL queries across data stored in relational, non-relational, object, and custom data sources.

When a federated query is run, Athena identifies the parts of the query that should be routed to the data source connector and executes them with Lambda. The data source connector makes the connection to the source, runs the query, and returns the results to Athena. If the data doesn’t fit into Lambda RAM runtime memory, it spills the data to Amazon S3 and is later accessed by Athena.

Athena uses data source connectors which internally use Lambda to run federated queries. Data source connectors are pre-built and can be deployed from the Athena console or from the Serverless Application Repository. Based on the user submitting the query, connectors can provide or restrict access to specific data elements.

To implement this solution, we complete the following steps:

  1. Create a secret for the SAP HANA instance using AWS Secrets Manager.
  2. Create an S3 bucket and subfolder for Lambda to use.
  3. Configure Athena federation with the SAP HANA instance.
  4. Run federated queries with Athena.

Prerequisites

Before getting started, make sure you have a SAP HANA database up and running on AWS.

Create a secret for the SAP HANA instance

Our first step is to create a secret for the SAP HANA instance with a username and password using Secrets Manager.

  1. On the Secrets Manager console, choose Secrets.
  2. Choose Store a new secret.
  3. Select Other types of secrets.
  4. Set the credentials as key-value pairs (username, password) for your SAP HANA instance.
  5. For Secret name, enter a name for your secret. Use the prefix SAP HANAAFQ so it’s easy to find.
  6. Leave the remaining fields at their defaults and choose Next.
  7. Complete your secret creation.

Setting up your S3 bucket for Lambda

On the Amazon S3 console, create a new S3 bucket and subfolder for Lambda to use

For this post, we have used (Amazon S3 bucket name/folder) athena-accelerator/saphana.

Configure Athena federation with the SAP HANA instance

To configure Athena federation with your SAP HANA instance, complete the following steps:

  1. On the AWS Serverless Application Repository console, choose Available applications.
  2. In the search field, enter TrianzSAPHANAAthenaJDBC.

In the Application settings section, provide the following details:

  1. For Application name, enter TrianzSAPHANAAthenaJDBC.
  2. For SecretNamePrefix, enter trianz-saphana-athena-jdbc.
  3. For SpillBucket, enter Athena-accelerator/saphana.

For JDBCConnectorConfig, use the format saphana://jdbc:sap://{saphana_instance_url}/?${secretname}.

  1. For DisableSpillEncyption, choose False.
  2. For LambdaFunctionName, enter trsaphana.
  3. For SecurityGroupID, use the security group id using which lambda can connect to the SAP HANA

Make sure to apply valid inbound and outbound rules based on your connection.

  1. For SpillPrefix, create a folder under the S3 bucket you created and specify the name (for example, athena-spill).
  2. For Subnetids – Use the subnets using which lambda can connect to SAP HANA instance with comma separation.

Make sure the subnet is in a VPC and has a NAT gateway and internet gateway attached.

  1. Select the I acknowledge check box.
  2. Choose Deploy.

Make sure that the AWS Identity and Access Management (IAM) roles have permissions to access AWS Serverless Application Repository, AWS CloudFormation, Amazon S3, Amazon CloudWatch, Amazon CloudTrail, Secrets Manager, Lambda, and Athena. For more information, see Example IAM Permissions Policies to Allow Athena Federated Query.

Run federated queries with Athena

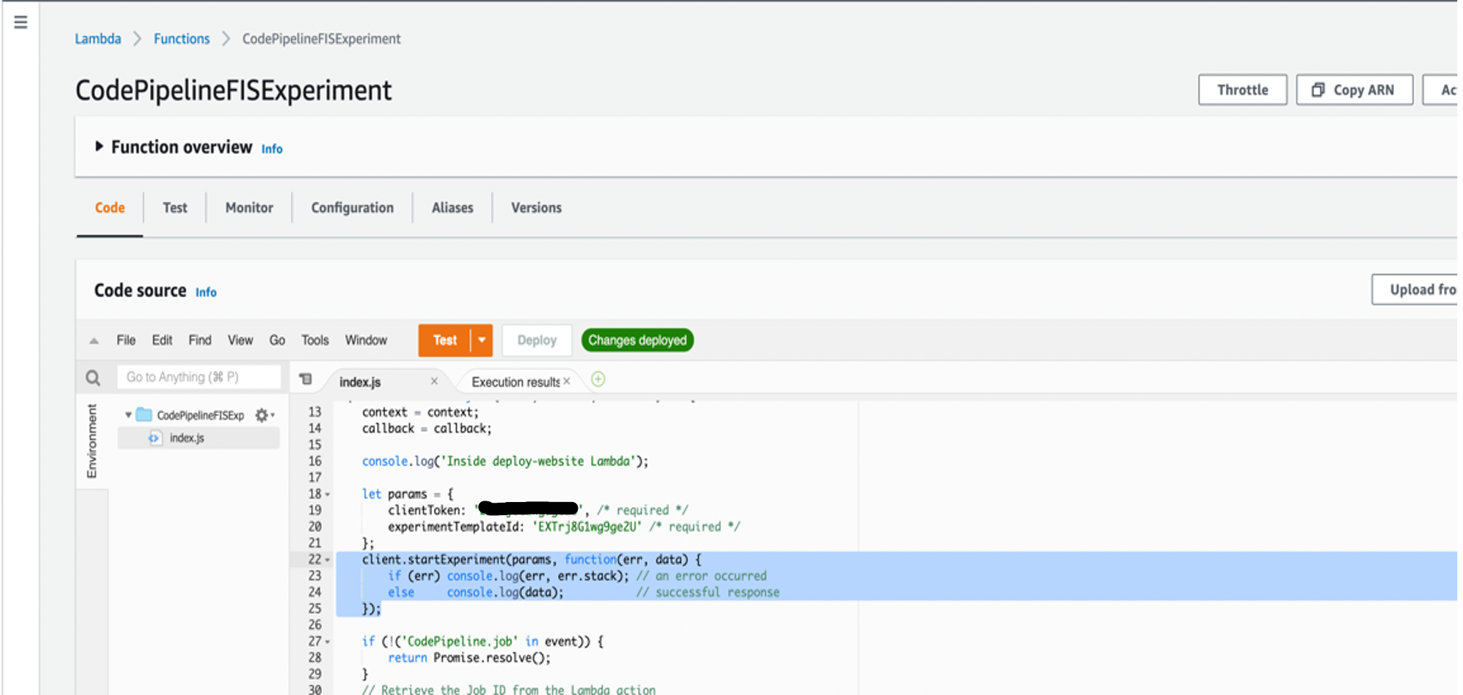
Run your federated queries using lambda:trsaphana to run against tables in the SAP HANA database. trsaphana is the name of lambda function which we have created in step 7 of previous section of this blog.

lambda:trsaphana is a reference data source connector Lambda function using the format lambda:MyLambdaFunctionName. For more information, see Writing Federated Queries.

The following screenshot demonstrates joining the dataset between SAP HANA and the data lake.

Key performance best practice considerations

If you’re considering Athena federation with a SAP HANA database, we recommend the following best practices:

  • Athena federation works great for queries with predicate filtering because the predicates are pushed down to the SAP HANA database. Use filter and limited-range scans in your queries to avoid full table scans.
  • If your SQL query requires returning a large volume of data from the SAP HANA database to Athena (which could lead to query timeouts or slow performance), unload the large tables in your query from SAP HANA to your S3 data lake.
  • Star schema is a commonly used data model in SAP HANA databases. In the star schema model, unload your large fact tables into your S3 data lake and leave the dimension tables in your SAP HANA database. If large dimension tables are contributing to slow performance or query timeouts, unload those tables to your S3 data lake.
  • When you run federated queries, Athena spins up multiple Lambda functions, which causes a spike in database connections. It’s important to monitor the SAP HANA database WLM queue slots to ensure there is no queuing. Additionally, you can use concurrency scaling on your SAP HANA database cluster to benefit from concurrent connections to queue up.

Conclusion

In this post, you learned how to configure and use Athena Federated query with SAP HANA using Lambda. Now you don’t need to wait for all the data in your SAP HANA data warehouse to be unloaded to Amazon S3 and maintained on a day-to-day basis to run your queries.

You can use the best practice considerations outlined in the post to help minimize the data transferred from SAP HANA for better performance. When queries are well-written for Federated query, the performance penalties are negligible.

For more information, see the Athena User Guide and Using Amazon Athena Federated Query.


About the Author

Navnit Shukla is AWS Specialist Solution Architect in Analytics. He is passionate about helping customers uncover insights from their data. He has been building solutions to help organizations make data-driven decisions.

Field Notes: Three Steps to Port Your Containerized Application to AWS Lambda

Post Syndicated from Arthi Jaganathan original https://aws.amazon.com/blogs/architecture/field-notes-three-steps-to-port-your-containerized-application-to-aws-lambda/

AWS Lambda support for container images allows porting containerized web applications to run in a serverless environment. This gives you automatic scaling, built-in high availability, and a pay-for-value billing model so you don’t pay for over-provisioned resources. If you are currently using containers, container image support for AWS Lambda means you can use these benefits without additional upfront engineering efforts to adopt new tooling or development workflows. You can continue to use your team’s familiarity with containers while gaining the benefits from the operational simplicity and cost effectiveness of Serverless computing.

This blog post describes the steps to take a containerized web application and run it on Lambda with only minor changes to the development, packaging, and deployment process. We use Ruby, as an example, but the steps are the same for any programming language.

Overview of solution

The following sample application is a containerized web service that generates PDF invoices. We will migrate this application to run the business logic in a Lambda function, and use Amazon API Gateway to provide a Serverless RESTful web API. API Gateway is a managed service to create and run API operations at scale.

Figure 1: Generating PDF invoice with Lambda

Figure 1: Generating PDF invoice with Lambda

Walkthrough

In this blog post, you will learn how to port the containerized web application to run in a serverless environment using Lambda.

At a high level, you are going to:

  1. Get the containerized application running locally for testing
  2. Port the application to run on Lambda
    1. Create a Lambda function handler
    2. Modify the container image for Lambda
    3. Test the containerized Lambda function locally
  3. Deploy and test on Amazon Web Services (AWS)

Prerequisites

For this walkthrough, you need the following:

1. Get the containerized application running locally for testing

The sample code for this application is available on GitHub. Clone the repository to follow along.

```bash

git clone https://github.com/aws-samples/aws-lambda-containerized-custom-runtime-blog.git

```

1.1. Build the Docker image

Review the Dockerfile in the root of the cloned repository. The Dockerfile uses Bitnami’s Ruby 3.0 image from the Amazon ECR Public Gallery as the base. It follows security best practices by running the application as a non-root user and exposes the invoice generator service on port 4567. Open your terminal and navigate to the folder where you cloned the GitHub repository. Build the Docker image using the following command.

```bash
docker build -t ruby-invoice-generator .
```

1.2 Test locally

Run the application locally using the Docker run command.

```bash
docker run -p 4567:4567 ruby-invoice-generator
```

In a real-world scenario, the order and customer details for the invoice would be passed as POST request body or GET request query string parameters. To keep things simple, we are randomly selecting from a few hard coded values inside lib/utils.rb. Open another terminal, and test invoice creation using the following command.

```bash
curl "http://localhost:4567/invoice" \
  --output invoice.pdf \
  --header 'Accept: application/pdf'
```

This command creates the file invoice.pdf in the folder where you ran the curl command. You can also test the URL directly in a browser. Press Ctrl+C to stop the container. At this point, we know our application works and we are ready to port it to run on Lambda as a container.

2. Port the application to run on Lambda

There is no change to the Lambda operational model and request plane. This means the function handler is still the entry point to application logic when you package a Lambda function as a container image. Also, by moving our business logic to a Lambda function, we get to separate out two concerns and replace the web server code from the container image with an HTTP API powered by API Gateway. You can focus on the business logic in the container with API Gateway acting as a proxy to route requests.

2.1. Create the Lambda function handler

The code for our Lambda function is defined in function.rb, and the handler function from that file will be described shortly. The main difference to note between the original Sintra-powered code and our Lambda handler version is the need to base64 encode the PDF. This is a requirement for returning binary media from API Gateway Lambda proxy integration. API Gateway will automatically decode this to return the PDF file to the client.

```ruby

def self.process(event:, context:)

  self.logger.debug(JSON.generate(event))

  invoice_pdf = Base64.encode64(Invoice.new.generate)

  { 'headers' => { 'Content-Type': 'application/pdf' },

    'statusCode' => 200,

    'body' => invoice_pdf,

    'isBase64Encoded' => true

  }

end

```

If you need a reminder on the basics of Lambda function handlers, review the documentation on writing a Lambda handler in Ruby. This completes the new addition to the development workflow—creating a Lambda function handler as the wrapper for the business logic.

2.2 Modify the container image for Lambda

AWS provides open source base images for Lambda. At this time, these base images are only available for Ruby runtime versions 2.5 and 2.7. But, you can bring any version of your preferred runtime (Ruby 3.0 in this case) by packaging it with your Docker image. We will use Bitnami’s Ruby 3.0 image from the Amazon ECR Public Gallery as the base. Amazon ECR is a fully managed container registry, and it is important to note that Lambda only supports running container images that are stored in Amazon ECR; you can’t upload an arbitrary container image to Lambda directly.

Because the function handler is the entry point to business logic, the Dockerfile CMD must be set to the function handler instead of starting the web server. In our case, because we are using our own base image to bring a custom runtime, there is an additional change we must make. Custom images need the runtime interface client to manage the interaction between the Lambda service and our function’s code.

The runtime interface client is an open-source lightweight interface that receives requests from Lambda, passes the requests to the function handler, and returns the runtime results back to the Lambda service. The following are the relevant changes to the Dockerfile.

```bash

ENTRYPOINT ["aws_lambda_ric"]

CMD [ "function.Billing::InvoiceGenerator.process" ]

```

The Docker command that is implemented when the container runs is: aws_lambda_ric function.Billing::InvoiceGenerator.process.

Refer to Dockerfile.lambda in the cloned repository for the complete code. This image follows best practices for optimizing Lambda container images by using a multi-stage build. The final image uses  tag named 3.0-prod as its base. This does not include development dependencies and helps keep the image size down. Create the Lambda-compatible container image using the following command.

```bash

docker build -f Dockerfile.lambda -t lambda-ruby-invoice-generator .

```

This concludes changes to the Dockerfile. We have introduced a new dependency on the runtime interface client and used it as our container’s entrypoint.

2.3. Test the containerized Lambda function locally

The runtime interface client expects requests from the Lambda Runtime API. But when we test on our local development workstation, we don’t run the Lambda service. So, we need a way to proxy the Runtime API for local testing. Because local testing is an integral part of most development workflows, AWS provides the Lambda runtime interface emulator. The emulator is a lightweight web server running on port 8080 that converts HTTP requests to Lambda-compatible JSON events. The flow for local testing is shown in Figure 2.

Figure 2: Testing the Lambda container image locally

Figure 2: Testing the Lambda container image locally

When we want to perform local testing, the runtime interface emulator becomes the entrypoint. Consequently, the Docker command that is executed when the container runs locally is: aws-lambda-rie aws_lambda_ric function.Billing::InvoiceGenerator.process.

You can package the emulator with the image. The Lambda container image support launch blog documents steps for this approach. However, to keep the image as slim as possible, we recommend that you install it locally, and mount it while running the container instead. Here is the installation command for Linux platforms.

``` bash

mkdir -p
~/.aws-lambda-rie && curl -Lo ~/.aws-lambda-rie/aws-lambda-rie
https://github.com/aws/aws-lambda-runtime-interface-emulator/releases/latest/download/aws-lambda-rie
&& chmod +x ~/.aws-lambda-rie/aws-lambda-rie

```

Use the Docker run command with the appropriate overrides to entrypoint and cmd to start the Lambda container. The emulator is mapped to local port 9000.

```bash

docker run \

  -v ~/.aws-lambda-rie:/aws-lambda \

  -p 9000:8080 \

  -e LOG_LEVEL=DEBUG \

  --entrypoint /aws-lambda/aws-lambda-rie \

  lambda-ruby-invoice-generator \

  /opt/bitnami/ruby/bin/aws_lambda_ric function.Billing::InvoiceGenerator.process

```

Open another terminal and run the curl command below to simulate a Lambda request.

```bash

curl -XPOST "http://localhost:9000/2015-03-31/functions/function/invocations" -d '{}'

```
You will see a JSON output with the base64 encoded value of the invoice for body and isBase64Encoded property set to true. After Lambda is integrated with API Gateway, the API endpoint uses the flag to decode the text before returning the response to the caller. The client will receive the decoded PDF invoice. Push Ctrl+C to stop the container. This concludes changes to the local testing workflow.

3. Deploy and test on AWS

The final step is to deploy the invoice generator service. Set your AWS Region and AWS Account ID as environment variables.

```bash

export AWS_REGION=Region

export AWS_ACCOUNT_ID=account

```

3.1. Push the Docker image to Amazon ECR

Create an Amazon ECR repository for the image.

```bash

ECR_REPOSITORY=`aws ecr create-repository \

  --region $AWS_REGION \

  --repository-name lambda-ruby-invoice-generator \

  --tags Key=Project,Value=lambda-ruby-invoice-generator-blog \

  --query "repository.repositoryName" \

  --output text`

```

Login to Amazon ECR, and push the container image to the newly-created repository.

```bash

aws ecr get-login-password \

  --region $AWS_REGION | docker login \

  --username AWS \

  --password-stdin $AWS_ACCOUNT_ID.dkr.ecr.$AWS_REGION.amazonaws.com


docker tag \

  lambda-ruby-invoice-generator:latest \

  $AWS_ACCOUNT_ID.dkr.ecr.$AWS_REGION.amazonaws.com/$ECR_REPOSITORY:latest


docker push

$AWS_ACCOUNT_ID.dkr.ecr.$AWS_REGION.amazonaws.com/$ECR_REPOSITORY:latest

```

3.2. Create the Lambda function

After the push succeeds, you can create the Lambda function. You need to create a Lambda execution role first and attach the managed IAM policy named AWSLambdaBasicExecutionRole. This gives the function access to Amazon CloudWatch for logging and monitoring.

```bash

LAMBDA_ROLE=`aws iam create-role \

  --region $AWS_REGION \

  --role-name ruby-invoice-generator-lambda-role \

  --assume-role-policy-document file://lambda-role-trust-policy.json \

  --tags Key=Project,Value=lambda-ruby-invoice-generator-blog \

  --query "Role.Arn" \

  --output text`


aws iam attach-role-policy \

  --region $AWS_REGION \

  --role-name ruby-invoice-generator-lambda-role \

  --policy-arn arn:aws:iam::aws:policy/service-role/AWSLambdaBasicExecutionRole


LAMBDA_ARN=`aws lambda create-function \

  --region $AWS_REGION \

  --function-name ruby-invoice-generator \

  --description "[AWS Blog] Lambda Ruby Invoice Generator" \

  --role $LAMBDA_ROLE \

  --package-type Image \

  --code ImageUri=$AWS_ACCOUNT_ID.dkr.ecr.$AWS_REGION.amazonaws.com/$ECR_REPOSITORY:latest \

  --timeout 15 \

  --memory-size 256 \

  --tags Project=lambda-ruby-invoice-generator-blog \

  --query "FunctionArn" \
  --output text`
```

Wait for the function to be ready. Use the following command to verify that the function state is set to Active.

```bash

aws lambda get-function \

  --region $AWS_REGION \

  --function-name ruby-invoice-generator \

  --query "Configuration.State"

```

3.3. Integrate with API Gateway

API Gateway offers two option to create RESTful APIs: HTTP and REST. We will use HTTP API because it offers lower cost and latency when compared to REST API. REST API provides additional features that we don’t need for this demo.

```bash

aws apigatewayv2 create-api \

  --region $AWS_REGION \

  --name invoice-generator-api \

  --protocol-type HTTP \

  --target $LAMBDA_ARN \

  --route-key "GET /invoice" \

  --tags Key=Project,Value=lambda-ruby-invoice-generator-blog \

  --query "{ApiEndpoint: ApiEndpoint, ApiId: ApiId}" \

  --output json

```

Record the ApiEndpoint and ApiId from the earlier command, and substitute them for the placeholders in the following command. You need to update the Lambda resource policy to allow HTTP API to invoke it.

```bash

export API_ENDPOINT="<ApiEndpoint>"

export API_ID="<ApiId>"


aws lambda add-permission \

  --region $AWS_REGION \

  --statement-id invoice-generator-api \

  --action lambda:InvokeFunction \

  --function-name $LAMBDA_ARN \

  --principal apigateway.amazonaws.com \

  --source-arn "arn:aws:execute-api:$AWS_REGION:$AWS_ACCOUNT_ID:$API_ID/*/*/invoice"

```

3.4. Verify the AWS deployment

Use the curl command to generate a PDF invoice.

```bash

curl "$API_ENDPOINT/invoice" \
  --output lambda-invoice.pdf \
  --header 'Accept: application/pdf'

```

This creates the file lambda-invoice.pdf in the local folder. You can also test directly from a browser.

This concludes the final step for porting the containerized invoice web service to Lambda. This deployment workflow is very similar to any other containerized application where you first build the image and then create or update your application to the new image as part of deployment. Only the actual deploy command has changed because we are deploying to Lambda instead of a container platform.

Cleaning up

To avoid incurring future charges, delete the resources. Follow cleanup instructions in the README file on the GitHub repo.

Conclusion

In this blog post, we learned how to port an existing containerized application to Lambda with only minor changes to development, packaging, and testing workflows. For teams with limited time, this accelerates the adoption of Serverless by using container domain knowledge and promoting reuse of existing tooling. We also saw how you can easily bring your own runtime by packaging it in your image and how you can simplify your application by eliminating the web application framework.

For more Serverless learning resources, visit https://serverlessland.com.


Field Notes provides hands-on technical guidance from AWS Solutions Architects, consultants, and technical account managers, based on their experiences in the field solving real-world business problems for customers.


Building well-architected serverless applications: Optimizing application performance – part 1

Post Syndicated from Julian Wood original https://aws.amazon.com/blogs/compute/building-well-architected-serverless-applications-optimizing-application-performance-part-1/

This series of blog posts uses the AWS Well-Architected Tool with the Serverless Lens to help customers build and operate applications using best practices. In each post, I address the serverless-specific questions identified by the Serverless Lens along with the recommended best practices. See the introduction post for a table of contents and explanation of the example application.

PERF 1. Optimizing your serverless application’s performance

Evaluate and optimize your serverless application’s performance based on access patterns, scaling mechanisms, and native integrations. This allows you to continuously gain more value per transaction. You can improve your overall experience and make more efficient use of the platform in terms of both value and resources.

Good practice: Measure and optimize function startup time

Evaluate your AWS Lambda function startup time for both performance and cost.

Take advantage of execution environment reuse to improve the performance of your function.

Lambda invokes your function in a secure and isolated runtime environment, and manages the resources required to run your function. When a function is first invoked, the Lambda service creates an instance of the function to process the event. This is called a cold start. After completion, the function remains available for a period of time to process subsequent events. These are called warm starts.

Lambda functions must contain a handler method in your code that processes events. During a cold start, Lambda runs the function initialization code, which is the code outside the handler, and then runs the handler code. During a warm start, Lambda runs the handler code.

Lambda function cold and warm starts

Lambda function cold and warm starts

Initialize SDK clients, objects, and database connections outside of the function handler so that they are started during the cold start process. These connections then remain during subsequent warm starts, which improves function performance and cost.

Lambda provides a writable local file system available at /tmp. This is local to each function but shared between subsequent invocations within the same execution environment. You can download and cache assets locally in the /tmp folder during the cold start. This data is then available locally by all subsequent warm start invocations, improving performance.

In the serverless airline example used in this series, the confirm booking Lambda function initializes a number of components during the cold start. These include the Lambda Powertools utilities and creating a session to the Amazon DynamoDB table BOOKING_TABLE_NAME.

import boto3
from aws_lambda_powertools import Logger, Metrics, Tracer
from aws_lambda_powertools.metrics import MetricUnit
from botocore.exceptions import ClientError

logger = Logger()
tracer = Tracer()
metrics = Metrics()

session = boto3.Session()
dynamodb = session.resource("dynamodb")
table_name = os.getenv("BOOKING_TABLE_NAME", "undefined")
table = dynamodb.Table(table_name)

Analyze and improve startup time

There are a number of steps you can take to measure and optimize Lambda function initialization time.

You can view the function cold start initialization time using Amazon CloudWatch Logs and AWS X-Ray. A log REPORT line for a cold start includes the Init Duration value. This is the time the initialization code takes to run before the handler.

CloudWatch Logs cold start report line

CloudWatch Logs cold start report line

When X-Ray tracing is enabled for a function, the trace includes the Initialization segment.

X-Ray trace cold start showing initialization segment

X-Ray trace cold start showing initialization segment

A subsequent warm start REPORT line does not include the Init Duration value, and is not present in the X-Ray trace:

CloudWatch Logs warm start report line

CloudWatch Logs warm start report line

X-Ray trace warm start without showing initialization segment

X-Ray trace warm start without showing initialization segment

CloudWatch Logs Insights allows you to search and analyze CloudWatch Logs data over multiple log groups. There are some useful searches to understand cold starts.

Understand cold start percentage over time:

filter @type = "REPORT"
| stats
  sum(strcontains(
    @message,
    "Init Duration"))
  / count(*)
  * 100
  as coldStartPercentage,
  avg(@duration)
  by bin(5m)
Cold start percentage over time

Cold start percentage over time

Cold start count and InitDuration:

filter @type="REPORT" 
| fields @memorySize / 1000000 as memorySize
| filter @message like /(?i)(Init Duration)/
| parse @message /^REPORT.*Init Duration: (?<initDuration>.*) ms.*/
| parse @log /^.*\/aws\/lambda\/(?<functionName>.*)/
| stats count() as coldStarts, median(initDuration) as avgInitDuration, max(initDuration) as maxInitDuration by functionName, memorySize
Cold start count and InitDuration

Cold start count and InitDuration

Once you have measured cold start performance, there are a number of ways to optimize startup time. For Python, you can use the PYTHONPROFILEIMPORTTIME=1 environment variable.

PYTHONPROFILEIMPORTTIME environment variable

PYTHONPROFILEIMPORTTIME environment variable

This shows how long each package import takes to help you understand how packages impact startup time.

Python import time

Python import time

Previously, for the AWS Node.js SDK, you enabled HTTP keep-alive in your code to maintain TCP connections. Enabling keep-alive allows you to avoid setting up a new TCP connection for every request. Since AWS SDK version 2.463.0, you can also set the Lambda function environment variable AWS_NODEJS_CONNECTION_REUSE_ENABLED=1 to make the SDK reuse connections by default.

You can configure Lambda’s provisioned concurrency feature to pre-initialize a requested number of execution environments. This runs the cold start initialization code so that they are prepared to respond immediately to your function’s invocations.

Use Amazon RDS Proxy to pool and share database connections to improve function performance. For additional options for using RDS with Lambda, see the AWS Serverless Hero blog post “How To: Manage RDS Connections from AWS Lambda Serverless Functions”.

Choose frameworks that load quickly on function initialization startup. For example, prefer simpler Java dependency injection frameworks like Dagger or Guice over more complex framework such as Spring. When using the AWS SDK for Java, there are some cold start performance optimization suggestions in the documentation. For further Java performance optimization tips, see the AWS re:Invent session, “Best practices for AWS Lambda and Java”.

To minimize deployment packages, choose lightweight web frameworks optimized for Lambda. For example, use MiddyJS, Lambda API JS, and Python Chalice over Node.js Express, Python Django or Flask.

If your function has many objects and connections, consider splitting the function into multiple, specialized functions. These are individually smaller and have less initialization code. I cover designing smaller, single purpose functions from a security perspective in “Managing application security boundaries – part 2”.

Minimize your deployment package size to only its runtime necessities

Smaller functions also allow you to separate functionality. Only import the libraries and dependencies that are necessary for your application processing. Use code bundling when you can to reduce the impact of file system lookup calls. This also includes deployment package size.

For example, if you only use Amazon DynamoDB in the AWS SDK, instead of importing the entire SDK, you can import an individual service. Compare the following three examples as shown in the Lambda Operator Guide:

// Instead of const AWS = require('aws-sdk'), use: +
const DynamoDB = require('aws-sdk/clients/dynamodb')

// Instead of const AWSXRay = require('aws-xray-sdk'), use: +
const AWSXRay = require('aws-xray-sdk-core')

// Instead of const AWS = AWSXRay.captureAWS(require('aws-sdk')), use: +
const dynamodb = new DynamoDB.DocumentClient() +
AWSXRay.captureAWSClient(dynamodb.service)

In testing, importing the DynamoDB library instead of the entire AWS SDK was 125 ms faster. Importing the X-Ray core library was 5 ms faster than the X-Ray SDK. Similarly, when wrapping a service initialization, preparing a DocumentClient before wrapping showed a 140-ms gain. Version 3 of the AWS SDK for JavaScript supports modular imports, which can further help reduce unused dependencies.

For additional options when for optimizing AWS Node.js SDK imports, see the AWS Serverless Hero blog post.

Conclusion

Evaluate and optimize your serverless application’s performance based on access patterns, scaling mechanisms, and native integrations. You can improve your overall experience and make more efficient use of the platform in terms of both value and resources.

In this post, I cover measuring and optimizing function startup time. I explain cold and warm starts and how to reuse the Lambda execution environment to improve performance. I show a number of ways to analyze and optimize the initialization startup time. I explain how only importing necessary libraries and dependencies increases application performance.

This well-architected question will be continued is part 2 where I look at designing your function to take advantage of concurrency via asynchronous and stream-based invocations. I cover measuring, evaluating, and selecting optimal capacity units.

For more serverless learning resources, visit Serverless Land.

Python 3.9 runtime now available in AWS Lambda

Post Syndicated from James Beswick original https://aws.amazon.com/blogs/compute/python-3-9-runtime-now-available-in-aws-lambda/

You can now use the Python 3.9 runtime to develop your AWS Lambda functions. You can do this in the AWS Management Console, AWS CLI, or AWS SDK, AWS Serverless Application Model (AWS SAM), or AWS Cloud Development Kit (AWS CDK). This post outlines some of the improvements to the Python runtime in version 3.9 and how to use this version in your Lambda functions.

New features and improvements to the Python language

Python 3.9 introduces new features for strings and dictionaries. There are new methods to remove prefixes and suffixes in strings. To remove a prefix, use str.removeprefix(prefix). To remove a suffix, use str.removesuffix(suffix). To learn more, read about PEP 616.

Dictionaries now offer two new operators (| and |=). The first is a union operator for merging dictionaries and the second allows developers to update the contents of a dictionary with another dictionary. To learn more, read about PEP 584.

You can alter the behavior of Python functions by using decorators. Previously, these could only consist of the @ symbol, a name, a dotted name, and an optional single call. Decorators can now consist of any valid expression, as explained in PEP 614.

There are also improvements for time zone handling. The zoneinfo module now supports the IANA time zone database. This can help remove boilerplate and brings improvements for code handling multiple timezones.

While existing Python 3 versions support TLS1.2, Python 3.9 now provides support for TLS1.3. This helps improve the performance of encrypted connections with features such as False Start and Zero Round Trip Time (0-RTT).

For a complete list of updates in Python 3.9, read the launch documentation on the Python website.

Performance improvements in Python 3.9

There are two important performance improvements in Python 3.9 that you can benefit from without making any code changes.

The first impacts code that uses the built-in Python data structures tuple, list, dict, set, or frozenset. In Python 3.9, these internally use the vectorcall protocol, which can make function calls faster by reducing the number of temporary objects used. Second, Python 3.9 uses a new parser that is more performant than previous versions. To learn more, read about PEP 617.

Changes to how Lambda works with the Python runtime

In Python, the presence of an __init__.py file in a directory causes it to be treated as a package. Frequently, __init__.py is an empty file that’s used to ensure that Python identifies the directory as a package. However, it can also contain initialization code for the package. Before Python 3.9, where you provided your Lambda function in a package, Lambda did not run the __init__.py code in the handler’s directory and parent directories during function initialization. From Python 3.9, Lambda now runs this code during the initialization phase. This ensures that imported packages are properly initialized if they make use of __init__.py. Note that __init__.py code is only run when the execution environment is first initialized.

Finally, there is a change to the error response in this new version. When previous Python versions threw errors, the formatting appeared as:

{"errorMessage": "name 'x' is not defined", "errorType": "NameError", "stackTrace": [" File \"/var/task/error_function.py\", line 2, in lambda_handler\n return x + 10\n"]}

From Python 3.9, the error response includes a RequestId:

{"errorMessage": "name 'x' is not defined", "errorType": "NameError", **"requestId"**: "<request id of function invoke>" "stackTrace": [" File \"/var/task/error_function.py\", line 2, in lambda_handler\n return x + 10\n"]}

Using Python 3.9 in Lambda

You can now use the Python 3.9 runtime to develop your AWS Lambda functions. To use this version, specify a runtime parameter value python3.9 when creating or updating Lambda functions. You can see the new version in the Runtime dropdown in the Create function page.

Create function page

To update an existing Lambda function to Python 3.9, navigate to the function in the Lambda console, then choose Edit in the Runtime settings panel. You see the new version in the Runtime dropdown:

Edit runtime settings

In the AWS Serverless Application Model (AWS SAM), set the Runtime attribute to python3.9 to use this version in your application deployments:

AWSTemplateFormatVersion: '2010-09-09'
Transform: AWS::Serverless-2016-10-31
Description: Simple Lambda Function
  
Resources:
  MyFunction:
    Type: AWS::Serverless::Function
    Description: My Python Lambda Function
    Properties:
      CodeUri: my_function/
      Handler: lambda_function.lambda_handler
      Runtime: python3.9

Conclusion

You can now create new functions or upgrade existing Python functions to Python 3.9. Lambda’s support of the Python 3.9 runtime enables you to take advantage of improved performance and new features in this version. Additionally, the Lambda service now runs the __init_.py code before the handler, supports TLS 1.3, and provides enhanced logging for errors.

For more serverless learning resources, visit Serverless Land.

Field Notes: Creating Custom Analytics Dashboards with FireEye Helix and Amazon QuickSight

Post Syndicated from Karish Chowdhury original https://aws.amazon.com/blogs/architecture/field-notes-creating-custom-analytics-dashboards-with-fireeye-helix-and-amazon-quicksight/

FireEye Helix is a security operations platform that allows organizations to take control of any incident from detection to response. FireEye Helix detects security incidents by correlating logs and configuration settings from sources like VPC Flow Logs, AWS CloudTrail, and Security groups.

In this blog post, we will discuss an architecture that allows you to create custom analytics dashboards with Amazon QuickSight. These dashboards are based on the threat detection logs collected by FireEye Helix. We automate this process so that data can be pulled and ingested based on a provided schedule. This approach uses AWS Lambda, and Amazon Simple Storage Service (Amazon S3) in addition to QuickSight.

Architecture Overview

The solution outlines how to ingest the security log data from FireEye Helix to Amazon S3 and create QuickSight visualizations from the log data. With this approach, you need Amazon EventBridge to invoke a Lambda function to connect to the FireEye Helix API. There are two steps to this process:

  1. Download the log data from FireEye Helix and store it in Amazon S3.
  2. Create a visualization Dashboard in QuickSight.

The architecture shown in Figure 1 represents the process we will walk through in this blog post. To implement this solution, you will need the following AWS services and features involved:

Figure 1: Solution architecture

Figure 1: Solution architecture

Prerequisites to implement the solution:

The following items are required to get your environment set up for this walkthrough.

  1. AWS account.
  2. FireEye Helix search alerts API endpoint. This is available under the API documentation in the FireEye Helix console.
  3. FireEye Helix API key. This FireEye community page explains how to generate an API key with appropriate permissions (always follow least privilege principles). This key is used by the Lambda function to periodically fetch alerts.
  4. AWS Secrets Manager secret (to store the FireEye Helix API key). To set it up, follow the steps outlined in the Creating a secret.

Extract the data from FireEye Helix and load it into Amazon S3

You will use the following high-level steps to retrieve the necessary security log data from FireEye Helix and store it on Amazon S3 to make it available for QuickSight.

  1. Establish an AWS Identity and Access Management (IAM) role for the Lambda function. It must have permissions to access Secrets Manager and Amazon S3 so they can retrieve the FireEye Helix API key and store the extracted data, respectively.
  2. Create an Amazon S3 bucket to store the FireEye Helix security log data.
  3. Create a Lambda function that uses the API key from Secrets Manager, calls the FireEye Helix search alerts API to extract FireEye Helix’s threat detection logs, and stores the data in the S3 bucket.
  4. Establish a CloudWatch EventBridge rule to invoke the Lambda function on an automated schedule.

To simplify this deployment, we have developed a CloudFormation template to automate creating the preceding requirements. Follow the below steps to deploy the template:

  • Download the source code from the GitHub repository
  • Navigate to CloudFormation console and select Create Stack
  • Select “Upload a template file” radio button, click on “Choose file” button, and select “helix-dashboard.yaml” file in the downloaded Github repository. Click “Next” to proceed.
  • On “Specify stack details” screen enter the parameters shown in Figure 2.
Figure 2: CloudFormation stack creation with initial parameters

Figure 2: CloudFormation stack creation with initial parameters

The parameters in Figure 2 include:

  • HelixAPISecretName – Enter the Secrets Manager secret name where the FireEye Helix API key is stored.
  • HelixEndpointUrl – Enter the Helix search API endpoint URL.
  • Amazon S3 bucket – Enter the bucket prefix (a random suffix will be added to make it unique).
  • Schedule – Choose the default option that pulls logs once a day, or enter the CloudWatch event schedule expression.

Select the check box next to “I acknowledge that AWS CloudFormation might create IAM resources.” and then press the Create Stack button. After the CloudFormation stack completes, you will have a fully functional process that will retrieve the FireEye Helix security log data and store it on the S3 bucket.

You can also select the Lambda function from the CloudFormation stack outputs to navigate to the Lambda console. Review the following default code, and add any additional transformation logic according to your needs after fetching the results (line 32).

import boto3
from datetime import datetime
import requests
import os

region_name = os.environ['AWS_REGION']
secret_name = os.environ['APIKEY_SECRET_NAME']
bucket_name = os.environ['S3_BUCKET_NAME']
helix_api_url = os.environ['HELIX_ENDPOINT_URL']

def lambda_handler(event, context):

    now = datetime.now()
    # Create a Secrets Manager client to fetch API Key from Secrets Manager
    session = boto3.session.Session()
    client = session.client(
        service_name='secretsmanager',
        region_name=region_name
    )
    apikey = client.get_secret_value(
            SecretId=secret_name
        )['SecretString']
    
    datestr = now.strftime("%B %d, %Y")
    apiheader = {'x-fireeye-api-key': apikey}
    
    try:
        # Call Helix Rest API to fetch the Alerts
        helixalerts = requests.get(
            f'{helix_api_url}?format=csv&query=start:"{datestr}" end:"{datestr}" class=alerts', headers=apiheader)
    
        # Optionally transform the content according to your needs..
        
        # Create a S3 client to upload the CSV file
        s3 = boto3.client('s3')
        path = now.strftime("%Y/%m/%d")+'/alerts-'+now.strftime("%H-%M-%S")+'.csv'
        response = s3.put_object(
            Body=helixalerts.content,
            Bucket=bucket_name,
            Key=path,
        )
        print('S3 upload response:', response)
    except Exception as e:
        print('error while fetching the alerts', e)
        raise e
        
    return {
        'statusCode': 200,
        'body': f'Successfully fetched alerts from Helix and uploaded to {path}'
    }

Creating a visualization in QuickSight

Once the FireEye data is ingested into an S3 bucket, you can start creating custom reports and dashboards using QuickSight. Following is a walkthrough on how to create a visualization in QuickSight based on the data that was ingested from FireEye Helix.

Step 1 – When placing the FireEye data into Amazon S3, ensure you have a clean directory structure so you can partition your data. By partitioning your data, you can restrict the amount of data scanned by each query, thus improving performance and reducing cost. The following is a sample directory structure you could use.

      ssw-fireeye-logs

           2021

               04

               05

The following is an example of what the data will look like after it is ingested from FireEye Helix into your Amazon S3 bucket. In this blog post, we will use the Alert_Desc column to report on the types of common attacks.

Step 2 – Next, you must create a manifest file that will instruct QuickSight how to read the FireEye log files on Amazon S3. The preceding example is a manifest file that instructs QuickSight to recursively search for files in the ssw-fireeye-logs bucket, and can be seen in the URIPrefixes section. The GlobalUploadSettings section informs QuickSight the type and format of files it will read.

"fileLocations": [
	{
		"URIPrefixes": [
			"s3://ssw-fireeye-logs/"
		]
	},
	],
	"globalUploadSettings": {
		"format": "CSV",
		"delimiter": ",",
		"textqalifier": "'",
		"containsHeader": "true"
	}
}

Step 3 – Open Amazon QuickSight. Use the AWS Management Console and search for QuickSight.

Step 4 – Below the QuickSight logo, find and select Datasets.

Step 5 – Push the blue New dataset button.


Step 6 – Now you are on Create a Dataset page which enables you to select a data source you would like QuickSight to ingest. Because we have stored the FireEye Helix data on S3, you should choose the S3 data source.


Step 7 – A pop-up box will appear called New S3 data source. Type a data source name, and upload the manifest file you created. Next, push the Connect button.

Step 8 – You are now directed to the Visualize screen. For this exercise let’s choose a Pie chart, you can find this in the Visual types section by hovering over each icon and reading each tool tip that comes up. Look for the tool tip that says Pie chart. After selecting the Pie Chart visual type, two entries in the Field wells section at the top of the screen will show up called Group/Color and Value. Click the drop down in Group/Color and select the Alert_Desc column. Now click the drop down in Value and also select Alter_Desc column but choose count as an aggregate. This will create an informative visualization of the most common attacks based on the sample data shown previously in Step 1.

Figure 3: Visualization screen in QuickSight

Figure 3: Visualization screen in QuickSight

Clean up

If you created any resources in AWS for this solution, consider removing them and any example resources you deployed. This includes the FireEye Helix API keys, S3 buckets, Lambda functions, and QuickSight visualizations. This helps ensure that there are no unwanted recurring charges. For more information, review how to delete the CloudFormation stack.

Conclusion

This blog post showed you how to ingest security log data from FireEye Helix and store that data in Amazon S3. We also showed you how to create your own visualizations in QuickSight to better understand the overall security posture of your AWS environment. With this solution, you can perform deep analysis and share these insights among different audiences in your organization (such as, operations, security, and executive management).


Field Notes provides hands-on technical guidance from AWS Solutions Architects, consultants, and technical account managers, based on their experiences in the field solving real-world business problems for customers.


Chaos Testing with AWS Fault Injection Simulator and AWS CodePipeline

Post Syndicated from Matt Chastain original https://aws.amazon.com/blogs/architecture/chaos-testing-with-aws-fault-injection-simulator-and-aws-codepipeline/

The COVID-19 pandemic has proven to be the largest stress test of our technology infrastructures in generations. A meteoric increase in internet consumption followed, due in large part to working and schooling from home. The chaotic, early months of the pandemic have clearly demonstrated the value of resiliency in production. How can we better prepare our critical systems for these global events in the future? A more modern approach to testing and validating your application architecture is needed. Chaos engineering has emerged as an innovative approach to solving these types of challenges.

This blog shows an architecture pattern for automating chaos testing as part of your continuous integration/continuous delivery (CI/CD) process. By automating the implementation of chaos experiments inside CI/CD pipelines, complex risks and modeled failure scenarios can be tested against application environments with every deployment. Application teams can use the results of these experiments to prioritize improvements in their architecture. These results will give your team the confidence they need to operate in an unpredictable production environment.

AWS Fault Injection Simulator (FIS) is a managed service that enables you to perform fault injection experiments on your AWS workloads. Fault injection is based on the principles of chaos engineering. These experiments stress an application by creating disruptive events so that you can observe how your application responds. You can then use this information to improve the performance and resiliency of your applications. With AWS FIS, you set up and run experiments that help you create the real-world conditions needed to uncover application issues.

AWS CodePipeline is a fully managed continuous delivery service for fast and reliable application and infrastructure updates. You can use AWS CodePipeline to model and automate your software release processes. Automating your build, test, and release process allows you to quickly test each code change. You can ensure the quality of your application or infrastructure code by running each change through your staging and release process.

Continuous chaos testing

Figure 1. High-level architecture pattern for automating chaos engineering

Figure 1. High-level architecture pattern for automating chaos engineering

Create FIS experiments

Begin with creating an FIS experiment template by configuring one or more actions (action set) to run against the target resources of the application architecture. Here we have created an action to stop Amazon EC2 instances in our Amazon Elastic Container Service (ECS) cluster identified by a tag. Target resources can be identified by resource IDs, filters, or tags. We can also set up the action parameters for running the actions before or after the actions/duration. Additionally, you can set up Amazon CloudWatch alarms to stop running one or more fault experiments once a particular threshold or boundary has been reached. In Increase your e-commerce website reliability using chaos engineering and AWS Fault Injection Simulator, Bastien Leblanc shares how to set up CloudWatch metric thresholds as stop conditions for experiments.

Figure 2. AWS FIS experiment template

Figure 2. AWS FIS experiment template

Author AWS Lambda to initiate FIS experiments

Create/Add a FIS IAM role to the Lambda function in the configuration permissions section. To start a specific FIS experiment, we use the experimentTemplateId parameter in our Lambda code. Refer to the AWS FIS API Reference when writing your Lambda code. When integrating the Lambda function into your pipeline, a new AWS CodePipeline can be created or an existing one can be used. A new pipeline stage is added at the point we initiate our Lambda function (post deployment stage), which launches our FIS experiment.

Figure 3. AWS Lambda function initiating AWS FIS experiment

Figure 3. AWS Lambda function initiating AWS FIS experiment


Figure 4. AWS CodePipeline with AWS FIS experiment stage

Figure 4. AWS CodePipeline with AWS FIS experiment stage

The experimentTemplateId parameter can also be staged as a key/value ‘environment variable’ in your Lambda function configuration. This is useful as it allows you to change your FIS experiment template without having to adjust your function code. You can use the same Lambda function code by dynamically injecting the experimentTemplateId in multiple environments on your way to production.

Verify FIS experiment results on deployed application

By continuously performing fault injection post-deployment in AWS CodePipeline, you learn about complex failure conditions, which you must solve. User experience and availability testing on your application during the runtime of the FIS experiment can be started by a notification rule. In AWS CodePipeline, you can use an Amazon Simple Notification Service (SNS) topic or chatbot integration. CloudWatch Synthetics can be used for those looking to automate experience testing on the candidate application while other FIS experiments are running.

Figure 5. AWS CodePipeline notification rule setting

Figure 5. AWS CodePipeline notification rule setting

Summary

Using AWS CodePipeline to automate chaos engineering experiments on application architecture with AWS FIS is straightforward. Following are some benefits from automating fault injection testing in our CI/CD pipelines:

  • Our team can achieve a higher degree of confidence in meeting the resiliency requirements of our application. We use a more modern approach to testing and automating this experimentation inside our existing CI/CD process with AWS CodePipeline.
  • We know more about the unknown risks to our application. All testing results we receive provide benefit and learning opportunities for our team. We use these results to understand what we do well, where we need to improve, or what we are willing to tolerate based on our application requirements.
  • Continuously evaluating our architectural fitness inside CI/CD allows our team to validate the impact each feature or component iteration has on the resiliency of our application.

However, the sole value of automating chaos testing is not limited to finding, fixing, or documenting the risks that surface in our application. Additional confidence is gained through constantly validating your operational practices, such as alerts and alarms, monitoring, and notifications.

FIS gives you a controlled and repeatable way to reproduce necessary conditions to fine-tune your operational procedures and runbooks. Automating this testing inside a CI/CD pipeline ensures a nearly continuous feedback loop for these operational practices.

Building well-architected serverless applications: Building in resiliency – part 2

Post Syndicated from Julian Wood original https://aws.amazon.com/blogs/compute/building-well-architected-serverless-applications-building-in-resiliency-part-2/

This series of blog posts uses the AWS Well-Architected Tool with the Serverless Lens to help customers build and operate applications using best practices. In each post, I address the serverless-specific questions identified by the Serverless Lens along with the recommended best practices. See the introduction post for a table of contents and explanation of the example application.

Reliability question REL2: How do you build resiliency into your serverless application?

This post continues part 1 of this reliability question. Previously, I cover managing failures using retries, exponential backoff, and jitter. I explain how DLQs can isolate failed messages. I show how to use state machines to orchestrate long running transactions rather than handling these in application code.

Required practice: Manage duplicate and unwanted events

Duplicate events can occur when a request is retried or multiple consumers process the same message from a queue or stream. A duplicate can also happen when a request is sent twice at different time intervals with the same parameters. Design your applications to process multiple identical requests to have the same effect as making a single request.

Idempotency refers to the capacity of an application or component to identify repeated events and prevent duplicated, inconsistent, or lost data. This means that receiving the same event multiple times does not change the result beyond the first time the event was received. An idempotent application can, for example, handle multiple identical refund operations. The first refund operation is processed. Any further refund requests to the same customer with the same payment reference should not be processes again.

When using AWS Lambda, you can make your function idempotent. The function’s code must properly validate input events and identify if the events were processed before. For more information, see “How do I make my Lambda function idempotent?

When processing streaming data, your application must anticipate and appropriately handle processing individual records multiple times. There are two primary reasons why records may be delivered more than once to your Amazon Kinesis Data Streams application: producer retries and consumer retries. For more information, see “Handling Duplicate Records”.

Generate unique attributes to manage duplicate events at the beginning of the transaction

Create, or use an existing unique identifier at the beginning of a transaction to ensure idempotency. These identifiers are also known as idempotency tokens. A number of Lambda triggers include a unique identifier as part of the event:

You can also create your own identifiers. These can be business-specific, such as transaction ID, payment ID, or booking ID. You can use an opaque random alphanumeric string, unique correlation identifiers, or the hash of the content.

A Lambda function, for example can use these identifiers to check whether the event has been previously processed.

Depending on the final destination, duplicate events might write to the same record with the same content instead of generating a duplicate entry. This may therefore not require additional safeguards.

Use an external system to store unique transaction attributes and verify for duplicates

Lambda functions can use Amazon DynamoDB to store and track transactions and idempotency tokens to determine if the transaction has been handled previously. DynamoDB Time to Live (TTL) allows you to define a per-item timestamp to determine when an item is no longer needed. This helps to limit the storage space used. Base the TTL on the event source. For example, the message retention period for SQS.

Using DynamoDB to store idempotent tokens

Using DynamoDB to store idempotent tokens

You can also use DynamoDB conditional writes to ensure a write operation only succeeds if an item attribute meets one of more expected conditions. For example, you can use this to fail a refund operation if a payment reference has already been refunded. This signals to the application that it is a duplicate transaction. The application can then catch this exception and return the same result to the customer as if the refund was processed successfully.

Third-party APIs can also support idempotency directly. For example, Stripe allows you to add an Idempotency-Key: <key> header to the request. Stripe saves the resulting status code and body of the first request made for any given idempotency key, regardless of whether it succeeded or failed. Subsequent requests with the same key return the same result.

Validate events using a pre-defined and agreed upon schema

Implicitly trusting data from clients, external sources, or machines could lead to malformed data being processed. Use a schema to validate your event conforms to what you are expecting. Process the event using the schema within your application code or at the event source when applicable. Events not adhering to your schema should be discarded.

For API Gateway, I cover validating incoming HTTP requests against a schema in “Implementing application workload security – part 1”.

Amazon EventBridge rules match event patterns. EventBridge provides schemas for all events that are generated by AWS services. You can create or upload custom schemas or infer schemas directly from events on an event bus. You can also generate code bindings for event schemas.

SNS supports message filtering. This allows a subscriber to receive a subset of the messages sent to the topic using a filter policy. For more information, see the documentation.

JSON Schema is a tool for validating the structure of JSON documents. There are a number of implementations available.

Best practice: Consider scaling patterns at burst rates

Load testing your serverless application allows you to monitor the performance of an application before it is deployed to production. Serverless applications can be simpler to load test, thanks to the automatic scaling built into many of the services. For more information, see “How to design Serverless Applications for massive scale”.

In addition to your baseline performance, consider evaluating how your workload handles initial burst rates. This ensures that your workload can sustain burst rates while scaling to meet possibly unexpected demand.

Perform load tests using a burst strategy with random intervals of idleness

Perform load tests using a burst of requests for a short period of time. Also introduce burst delays to allow your components to recover from unexpected load. This allows you to future-proof the workload for key events when you do not know peak traffic levels.

There are a number of AWS Marketplace and AWS Partner Network (APN) solutions available for performance testing, including Gatling FrontLine, BlazeMeter, and Apica.

In regulating inbound request rates – part 1, I cover running a performance test suite using Gatling, an open source tool.

Gatling performance results

Gatling performance results

Amazon does have a network stress testing policy that defines which high volume network tests are allowed. Tests that purposefully attempt to overwhelm the target and/or infrastructure are considered distributed denial of service (DDoS) tests and are prohibited. For more information, see “Amazon EC2 Testing Policy”.

Review service account limits with combined utilization across resources

AWS accounts have default quotas, also referred to as limits, for each AWS service. These are generally Region-specific. You can request increases for some limits while other limits cannot be increased. Service Quotas is an AWS service that helps you manage your limits for many AWS services. Along with looking up the values, you can also request a limit increase from the Service Quotas console.

Service Quotas dashboard

Service Quotas dashboard

As these limits are shared within an account, review the combined utilization across resources including the following:

  • Amazon API Gateway: number of requests per second across all APIs. (link)
  • AWS AppSync: throttle rate limits. (link)
  • AWS Lambda: function concurrency reservations and pool capacity to allow other functions to scale. (link)
  • Amazon CloudFront: requests per second per distribution. (link)
  • AWS IoT Core message broker: concurrent requests per second. (link)
  • Amazon EventBridge: API requests and target invocations limit. (link)
  • Amazon Cognito: API limits. (link)
  • Amazon DynamoDB: throughput, indexes, and request rates limits. (link)

Evaluate key metrics to understand how workloads recover from bursts

There are a number of key Amazon CloudWatch metrics to evaluate and alert on to understand whether your workload recovers from bursts.

  • AWS Lambda: Duration, Errors, Throttling, ConcurrentExecutions, UnreservedConcurrentExecutions. (link)
  • Amazon API Gateway: Latency, IntegrationLatency, 5xxError, 4xxError. (link)
  • Application Load Balancer: HTTPCode_ELB_5XX_Count, RejectedConnectionCount, HTTPCode_Target_5XX_Count, UnHealthyHostCount, LambdaInternalError, LambdaUserError. (link)
  • AWS AppSync: 5XX, Latency. (link)
  • Amazon SQS: ApproximateAgeOfOldestMessage. (link)
  • Amazon Kinesis Data Streams: ReadProvisionedThroughputExceeded, WriteProvisionedThroughputExceeded, GetRecords.IteratorAgeMilliseconds, PutRecord.Success, PutRecords.Success (if using Kinesis Producer Library), GetRecords.Success. (link)
  • Amazon SNS: NumberOfNotificationsFailed, NumberOfNotificationsFilteredOut-InvalidAttributes. (link)
  • Amazon Simple Email Service (SES): Rejects, Bounces, Complaints, Rendering Failures. (link)
  • AWS Step Functions: ExecutionThrottled, ExecutionsFailed, ExecutionsTimedOut. (link)
  • Amazon EventBridge: FailedInvocations, ThrottledRules. (link)
  • Amazon S3: 5xxErrors, TotalRequestLatency. (link)
  • Amazon DynamoDB: ReadThrottleEvents, WriteThrottleEvents, SystemErrors, ThrottledRequests, UserErrors. (link)

Conclusion

This post continues from part 1 and looks at managing duplicate and unwanted events with idempotency and an event schema. I cover how to consider scaling patterns at burst rates by managing account limits and show relevant metrics to evaluate

Build resiliency into your workloads. Ensure that applications can withstand partial and intermittent failures across components that may only surface in production. In the next post in the series, I cover the performance efficiency pillar from the Well-Architected Serverless Lens.

For more serverless learning resources, visit Serverless Land.

Classifying Millions of Amazon items with Machine Learning, Part I: Event Driven Architecture

Post Syndicated from Mahmoud Abid original https://aws.amazon.com/blogs/architecture/classifying-millions-of-amazon-items-with-machine-learning-part-i-event-driven-architecture/

As part of AWS Professional Services, we work with customers across different industries to understand their needs and supplement their teams with specialized skills and experience.

Some of our customers are internal teams from the Amazon retail organization who request our help with their initiatives. One of these teams, the Global Environmental Affairs team, identifies the number of electronic products sold. Then they classify these products according to local laws and accurately report this data to regulators. This process covers the products’ end-of-life costs and ensures a high quality of recycling.

These electronic products have classification codes that differ from country to country, and these codes change according to each country’s latest regulations. This poses a complex technical problem. How do we automate our compliance teams’ work to efficiently and accurately classify over three million product classifications every month, in more than 38 countries, while also complying with evolving classification regulations?

To solve this problem, we used Amazon Machine Learning (Amazon ML) capabilities to build a resilient architecture. It ingests and processes data, trains ML models, and predicts (also known as inference workflow) monthly sales data for all countries concurrently.

In this post, we outline how we used AWS Lambda, Amazon EventBridge, and AWS Step Functions to build a scalable and cost-effective solution. We’ll also show you how to keep the data secure while processing it in Amazon ML flows.

Solution overview

Our solution consists of three main parts, which are summarized here and detailed in the following sections:

  1. Training the ML models
  2. Evaluating their performance
  3. Using them to run an inference workflow (in other words, label) the sold items with the correct classification codes

Training the Amazon ML model

For training our Amazon ML model, we use the architecture in Figure 1. It starts with a periodic query against the Amazon.com data warehouse in Amazon Redshift.

Training workflow

Figure 1. Training workflow

  1. A labeled dataset containing pre-recorded classification codes is extracted from Amazon Redshift. This dataset is stored in an Amazon Simple Storage Service (Amazon S3) bucket and split up by country. The data is encrypted at rest with server-side encryption using an AWS Key Management Service (AWS KMS) key. This is also known as server-side encryption with AWS KMS (SSE-KMS). The extraction query uses the AWS KMS key to encrypt the data when storing it in the S3 bucket.
  2. Each time a country’s dataset is uploaded to the S3 bucket, a message is sent to an Amazon Simple Queue Service (Amazon SQS) queue. This prompts a Lambda function. We use Amazon SQS to ensure resiliency. If the Lambda function fails, the message will be tried again automatically. Overall, the message is either processed successfully, or ends up in a dead letter queue that we monitor (not displayed in Figure 1).
  3. If the message is processed successfully, the Lambda function generates necessary input parameters. Then it starts a Step Functions workflow execution for the training process.
  4. The training process involves orchestrating Amazon SageMaker Processing jobs to prepare the data. Once the data is prepared, a hyperparameter optimization job invokes multiple training jobs. These run in parallel with different values from a range of hyperparameters. The model that performs the best is chosen to move forward.
  5. After the model is trained successfully, an EventBridge event is prompted, which will be used to invoke the performance comparison process.

Comparing performance of Amazon ML models

Because Amazon ML models are automatically trained periodically, we want to assess their performance automatically too. Newly created models should perform better than their predecessors. To measure this, we use the flow in Figure 2.

Model performance comparison workflow

Figure 2. Model performance comparison workflow

  1. The flow is activated by the EventBridge event at the end of the training flow.
  2. A Lambda function gathers the necessary input parameters and uses them to start an inference workflow, implemented as a Step Function.
  3. The inference workflow use SageMaker Processing jobs to prepare a new test dataset. It performs predictions using SageMaker Batch Transform jobs with the new model. The test dataset is a labeled subset that was not used in model training. Its prediction gives an unbiased estimation of the model’s performance, proving that the model can generalize.
  4. After the inference workflow is completed and the results are stored on Amazon S3, an EventBridge event is performed, which prompts another Lambda function. This function runs the performance comparison Step Function.
  5. The performance comparison workflow uses a SageMaker Processing job to analyze the inference results and calculate its performance score based on ground truth. For each country, the job compares the performance of the new model with the performance of the last used model to determine which one was best, otherwise known as the “winner model.” The metadata of the winner model is saved in an Amazon DynamoDB table so it can be queried and used in the next production inference job.
  6. At the end of the performance comparison flow, an informational notification is sent to an Amazon Simple Notification Service (Amazon SNS) topic, which will be received by the MLOps team.

Running inference

The inference flow starts with a periodic query against the Amazon.com data warehouse in Amazon Redshift, as shown in Figure 3.

Inference workflow

Figure 3. Inference workflow

  1. As with training, the dataset is extracted from Amazon Redshift, split up by country, and stored in an S3 bucket and encrypted at rest using the AWS KMS key.
  2. Every country dataset upload prompts a message to an SQS queue, which invokes a Lambda function.
  3. The Lambda function gathers necessary input parameters and starts a workflow execution for the inference process. This is the same Step Function we used in the performance comparison. Now it runs against the real dataset instead of the test set.
  4. The inference Step Function orchestrates the data preparation and prediction using the winner model for each country, as stored in the model performance DynamoDB table. The predictions are uploaded back to the S3 bucket to be further consumed for reporting.
  5. Lastly, an Amazon SNS message is sent to signal completion of the inference flow, which will be received by different stakeholders.

Data encryption

One of the key requirements of this solution was to provide least privilege access to all data. To achieve this, we use AWS KMS to encrypt all data as follows:

Restriction of data decryption permissions

Figure 4. Restriction of data decryption permissions

Conclusion

In this post, we outline how we used a serverless architecture to handle the end-to-end flow of data extraction, processing, and storage. We also talk about how we use this data for model training and inference.

With this solution, our customer team onboarded 38 countries and brought 60 Amazon ML models to production to classify 3.3 million items on a monthly basis.

In the next post, we show you how we use AWS Developer Tools to build a comprehensive continuous integration/continuous delivery (CI/CD) pipeline that safeguards the code behind this solution.


CICD on Serverless Applications using AWS CodeArtifact

Post Syndicated from Anand Krishna original https://aws.amazon.com/blogs/devops/cicd-on-serverless-applications-using-aws-codeartifact/

Developing and deploying applications rapidly to users requires a working pipeline that accepts the user code (usually via a Git repository). AWS CodeArtifact was announced in 2020. It’s a secure and scalable artifact management product that easily integrates with other AWS products and services. CodeArtifact allows you to publish, store, and view packages, list package dependencies, and share your application’s packages.

In this post, I will show how we can build a simple DevOps pipeline for a sample JAVA application (JAR file) to be built with Maven.

Solution Overview

We utilize the following AWS services/Tools/Frameworks to set up our continuous integration, continuous deployment (CI/CD) pipeline:

The following diagram illustrates the pipeline architecture and flow:


aws-codeartifact-pipeline


Our pipeline is built on CodePipeline with CodeCommit as the source (CodePipeline Source Stage). This triggers the pipeline via a CloudWatch Events rule. Then the code is fetched from the CodeCommit repository branch (main) and sent to the next pipeline phase. This CodeBuild phase is specifically for compiling, packaging, and publishing the code to CodeArtifact by utilizing a package manager—in this case Maven.

After Maven publishes the code to CodeArtifact, the pipeline asks for a manual approval to be directly approved in the pipeline. It can also optionally trigger an email alert via Amazon Simple Notification Service (Amazon SNS). After approval, the pipeline moves to another CodeBuild phase. This downloads the latest packaged JAR file from a CodeArtifact repository and deploys to the AWS Lambda function.

Clone the Repository

Clone the GitHub repository as follows:

git clone https://github.com/aws-samples/aws-cdk-codeartifact-pipeline-sample.git

Code Deep Dive

After the Git repository is cloned, the directory structure is shown as in the following screenshot :

aws-codeartifact-pipeline-code

Let’s study the files and code to understand how the pipeline is built.

The directory java-events is a sample Java Maven project. Find numerous sample applications on GitHub. For this post, we use the sample application java-events.

To add your own application code, place the pom.xml and settings.xml files in the root directory for the AWS CDK project.

Let’s study the code in the file lib/cdk-pipeline-codeartifact-new-stack.ts of the stack CdkPipelineCodeartifactStack. This is the heart of the AWS CDK code that builds the whole pipeline. The stack does the following:

  • Creates a CodeCommit repository called ca-pipeline-repository.
  • References a CloudFormation template (lib/ca-template.yaml) in the AWS CDK code via the module @aws-cdk/cloudformation-include.
  • Creates a CodeArtifact domain called cdkpipelines-codeartifact.
  • Creates a CodeArtifact repository called cdkpipelines-codeartifact-repository.
  • Creates a CodeBuild project called JarBuild_CodeArtifact. This CodeBuild phase does all of the code compiling, packaging, and publishing to CodeArtifact into a repository called cdkpipelines-codeartifact-repository.
  • Creates a CodeBuild project called JarDeploy_Lambda_Function. This phase fetches the latest artifact from CodeArtifact created in the previous step (cdkpipelines-codeartifact-repository) and deploys to the Lambda function.
  • Finally, creates a pipeline with four phases:
    • Source as CodeCommit (ca-pipeline-repository).
    • CodeBuild project JarBuild_CodeArtifact.
    • A Manual approval Stage.
    • CodeBuild project JarDeploy_Lambda_Function.


CodeArtifact shows the domain-specific and repository-specific connection settings to mention/add in the application’s pom.xml and settings.xml files as below:

aws-codeartifact-repository-connections

Deploy the Pipeline

The AWS CDK code requires the following packages in order to build the CI/CD pipeline:

  • @aws-cdk/core
  • @aws-cdk/aws-codepipeline
  • @aws-cdk/aws-codepipeline-actions
  • @aws-cdk/aws-codecommit
  • @aws-cdk/aws-codebuild
  • @aws-cdk/aws-iam
  • @aws-cdk/cloudformation-include


Install the required AWS CDK packages as below:

npm i @aws-cdk/core @aws-cdk/aws-codepipeline @aws-cdk/aws-codepipeline-actions @aws-cdk/aws-codecommit @aws-cdk/aws-codebuild @aws-cdk/pipelines @aws-cdk/aws-iam @ @aws-cdk/cloudformation-include

Compile the AWS CDK code:

npm run build

Deploy the AWS CDK code:

cdk synth
cdk deploy

After the AWS CDK code is deployed, view the final output on the stack’s detail page on the AWS CloudFormation :

aws-codeartifact-pipeline-cloudformation-stack


How the pipeline works with artifact versions (using SNAPSHOTS)

In this demo, I publish SNAPSHOT to the repository. As per the documentation here and here, a SNAPSHOT refers to the most recent code along a branch. It’s a development version preceding the final release version. Identify a snapshot version of a Maven package by the suffix SNAPSHOT appended to the package version.

The application settings are defined in the pom.xml file. For this post, we define the following:

  • The version to be used, called 1.0-SNAPSHOT.
  • The specific packaging, called jar.
  • The specific project display name, called JavaEvents.
  • The specific group ID, called JavaEvents.

The screenshot below shows the pom.xml settings we utilised in the application:

aws-codeartifact-pipeline-pom-xml


You can’t republish a package asset that already exists with different content, as per the documentation here.

When a Maven snapshot is published, its previous version is preserved in a new version called a build. Each time a Maven snapshot is published, a new build version is created.

When a Maven snapshot is published, its status is set to Published, and the status of the build containing the previous version is set to Unlisted. If you request a snapshot, the version with status Published is returned. This is always the most recent Maven snapshot version.

For example, the image below shows the state when the pipeline is run for the FIRST RUN. The latest version has the status Published and previous builds are marked Unlisted.

aws-codeartifact-repository-package-versions


For all subsequent pipeline runs, multiple Unlisted versions will occur every time the pipeline is run, as all previous versions of a snapshot are maintained in its build versions.

aws-codeartifact-repository-package-versions


Fetching the Latest Code

Retrieve the snapshot from the repository in order to deploy the code to an AWS Lambda Function. I have used AWS CLI to list and fetch the latest asset of package version 1.0-SNAPSHOT.


Listing the latest snapshot

export ListLatestArtifact = `aws codeartifact list-package-version-assets —domain cdkpipelines-codeartifact --domain-owner $Account_Id --repository cdkpipelines-codeartifact-repository --namespace JavaEvents --format maven --package JavaEvents --package-version "1.0-SNAPSHOT"| jq ".assets[].name"|grep jar|sed ’s/“//g’`

NOTE : Please note the dynamic CDK variable $Account_Id which represents AWS Account ID.


Fetching the latest code using Package Version

aws codeartifact get-package-version-asset --domain cdkpipelines-codeartifact --repository cdkpipelines-codeartifact-repository --format maven --package JavaEvents --package-version 1.0-SNAPSHOT --namespace JavaEvents --asset $ListLatestArtifact demooutput

Notice that I’m referring the last code by using variable $ListLatestArtifact. This always fetches the latest code, and demooutput is the outfile of the AWS CLI command where the content (code) is saved.


Testing the Pipeline

Now clone the CodeCommit repository that we created with the following code:

git clone https://git-codecommit.<region>.amazonaws.com/v1/repos/codeartifact-pipeline-repository


Enter the following code to push the code to the CodeCommit repository:

cp -rp cdk-pipeline-codeartifact-new /* ca-pipeline-repository
cd ca-pipeline-repository
git checkout -b main
git add .
git commit -m “testing the pipeline”
git push origin main

Once the code is pushed to Git repository, the pipeline is automatically triggered by Amazon CloudWatch events.

The following screenshots shows the second phase (AWS CodeBuild Phase – JarBuild_CodeArtifact) of the pipeline, wherein the asset is successfully compiled and published to the CodeArtifact repository by Maven:

aws-codeartifact-pipeline-codebuild-jarbuild

aws-codeartifact-pipeline-codebuild-screenshot

aws-codeartifact-pipeline-codebuild-screenshot2


The following screenshots show the last phase (AWS CodeBuild Phase – Deploy-to-Lambda) of the pipeline, wherein the latest asset is successfully pulled and deployed to AWS Lambda Function.

Asset JavaEvents-1.0-20210618.131629-5.jar is the latest snapshot code for the package version 1.0-SNAPSHOT. This is the same asset version code that will be deployed to AWS Lambda Function, as seen in the screenshots below:

aws-codeartifact-pipeline-codebuild-jardeploy

aws-codeartifact-pipeline-codebuild-screenshot-jarbuild

The following screenshot of the pipeline shows a successful run. The code was fetched and deployed to the existing Lambda function (codeartifact-test-function).

aws-codeartifact-pipeline-codepipeline

Cleanup

To clean up, You can either delete the entire stack through the AWS CloudFormation console or use AWS CDK command like below –

cdk destroy

For more information on the AWS CDK commands, please check the here or sample here.

Summary

In this post, I demonstrated how to build a CI/CD pipeline for your serverless application with AWS CodePipeline by utilizing AWS CDK with AWS CodeArtifact. Please check the documentation here for an in-depth explanation regarding other package managers and the getting started guide.

Automating Your Home with Grafana and Siemens Controllers

Post Syndicated from Viktoria Semaan original https://aws.amazon.com/blogs/architecture/automating-your-home-with-grafana-and-siemens-controllers/

Imagine that you have access to a digital twin of your house that allows you to remotely monitor and control different devices inside your home. Forgot to turn off the heater or air conditioning? Didn’t close water faucets? Wondering how long your kids have been watching TV? Wouldn’t it be nice to have all the information from multiple devices in a single place?

Nowadays, many of us have smart things at home, such as thermostats, security cameras, wireless sensors, switches, etc. The problem is that most of these smart things come with different mobile applications. To get a full picture, we end up switching between applications that serve limited needs.

In this blog, we explain how to use Siemens controllers, AWS IoT, and the open-source visualization platform Grafana to quickly build a digital twin of any processes. This includes home automation, industrial applications, security systems, and others. As an example, we will monitor environmental conditions, including temperature and humidity sensors, thermostat settings, light switches, as well as monthly water and energy consumption. We will go through the architecture and steps required to integrate different building components to store data for historical analysis, enable voice control, and create interactive near real-time dashboards showing a digital representation of your house. If you would like to learn more about the solution, we will provide links to all the architecture components and detailed configuration steps.

Smart home automation solution with Siemens LOGO! compact controller

Figure 1. Smart home automation solution with Siemens LOGO! compact controller

Architecture

In this solution overview, we are using a low-cost Siemens LOGO! controller (hardware version 8.3 or higher). This controller supports traditional industrial protocols such as Simatic S7 and Modbus TCP/IP as well as MQTT through the native AWS IoT Core interface. Automation controllers are the brains behind smart systems that allow orchestrating all the devices in your home. This reference architecture can be extended to other devices that support MQTT protocol, have programmatic APIs, or Software Development Kits (SDKs). It could serve as a starting point for building a home automation solution using AWS IoT and Grafana and further customized based on customer needs.

Reference architecture for smart home automation solution

Figure 2. Reference architecture for smart home automation solution

The components of this solution are:

  • The LOGO! controller controls home automation equipment and ingests data to AWS IoT Core.
  • AWS IoT Core collects data at scale and routes messages to multiple AWS services.
  • AWS Lambda is called inside the AWS IoT Core statement to transform the incoming data prior to ingestion.
  • Amazon Timestream stores time series data and optimizes it for fast analytical queries.
  • AWS IoT SiteWise models and stores data from equipment for large scale deployments.
  • Grafana installed on Amazon Elastic Compute Cloud (Amazon EC2) visualizes data in near real-time using interactive dashboards.
  • The Alexa Skills Kit (ASK) allows interaction with devices using voice commands.
Remote monitoring dashboard allows homeowners to view and control conditions

Figure 3. Remote monitoring dashboard allows homeowners to view and control conditions

Solution overview

Step 1: Ingest data to AWS IoT

The IoT-enabled LOGO! controller provides the out-of-box capability to send data to AWS IoT Core service. In a few clicks, you can configure variables and their update frequency to be published to the AWS Cloud. To get started with the LOGO! controller, please refer to Siemens E-learning portal. AWS IoT Core collects and processes messages from remote devices transmitted over the secured MQTT protocol.

The LOGO! controller publishes data to AWS IoT Core in hexadecimal format. The Lambda function converts the data from hexadecimal to the standard decimal numeric system. If your home automation equipment sends data in the standard decimal format, then AWS IoT Core can directly write data to other AWS services without Lambda.

Step 2: Store data in Timestream or AWS IoT SiteWise

The ingested IoT data is saved for historical analysis. Timestream is a serverless time series database service that is optimized for high throughput ingestion and has built-in analytical functions. It is one of the options you can use to store IoT data. Time series is a common data format to observe how things are changing over time and it is suitable for building IoT applications.

AWS IoT SiteWise is an alternative option to store and organize data at scale. It is beneficial for large-scale commercial building automation and management systems, including offices, hotels, and factories. You can structure data by using built-in asset modeling capabilities.

Step 3: Visualize data in Grafana dashboard

Once data is stored, it can be made available to multiple applications. Grafana is a data visualization platform that you can use to monitor data. It supports near real-time visualization with a refresh rate of 5 seconds or higher. You can visualize data from multiple AWS sources (such as AWS IoT SiteWise, Timestream, and Amazon CloudWatch) and other data sources with a single Grafana dashboard. Grafana can be installed on an Amazon Linux system, Windows, macOS, or deployed on Kubernetes (K8S) or Docker containers. For customers who don’t want to manage infrastructure and are interested in developing completely serverless solution, Amazon offers an Amazon Managed Service for Grafana. At the time of writing this post, this service is available in preview with a limited number of supported plugins.

To build Grafana dashboard and retrieve data from Timestream, you can use SQL queries. Timestream query example to retrieve humidity values and timestamps for the past 24 hours:

SELECT measure_value::double as humidity, time FROM "myhome_db"."livingroom" WHERE measure_name='humidity' and time >=ago(1d)

To retrieve data from AWS IoT SiteWise, you can select asset properties from the asset navigation tab, which makes it simple for non-technical users to build dashboards.

Grafana dashboard configuration with AWS IoT SiteWise

Figure 4. Grafana dashboard configuration with AWS IoT SiteWise

One of the common issues of operational dashboards is that it’s hard to get a physical representation by looking at a cluster of multiple readings. To reflect conditions of physical assets, the information from sensors must be overlaid on top of original physical objects. ImageIt Panel Plugin for Grafana allows you to overcome this issue. You can upload a picture of your house or a system and drag sensor readings to their exact locations, thus creating digital representations of physical objects.

Step 4: Control using Alexa

Using the Alexa Skills Kit, you can build voice skills to be used on devices enabled by Alexa globally. Alexa and AWS IoT enables you to create an end-to-end voice-controlled experience without using any additional hardware. Instead, your functions run on the cloud only when you invoke Alexa with voice commands.

The easiest way to build a custom Alexa skill is to use a Lambda function. You can upload the code for your Alexa skill to a Lambda function. The code will execute in response to Alexa voice interactions and send commands to the LOGO! controller.

Conclusion

In this blog, we reviewed how you can create a digital twin of your home automation or industrial systems using Siemens controllers, AWS IoT, and Grafana dashboards. Connecting the LOGO! controller to AWS gives it access to the Internet of Things (IoT) and opens many potential applications such as anomaly detection, predictive maintenance, intrusion detection, and others.

Building well-architected serverless applications: Building in resiliency – part 1

Post Syndicated from Julian Wood original https://aws.amazon.com/blogs/compute/building-well-architected-serverless-applications-building-in-resiliency-part-1/

This series of blog posts uses the AWS Well-Architected Tool with the Serverless Lens to help customers build and operate applications using best practices. In each post, I address the serverless-specific questions identified by the Serverless Lens along with the recommended best practices. See the introduction post for a table of contents and explanation of the example application.

Reliability question REL2: How do you build resiliency into your serverless application?

Evaluate scaling mechanisms for serverless and non-serverless resources to meet customer demand. Build resiliency into your workload to make your serverless application resilient to withstand partial and intermittent failures across components that may only surface in production.

Required practice: Manage transaction, partial, and intermittent failures

Whenever one service or system calls another, there is a chance that failures can happen. Services or systems often don’t fail as a single unit, but rather suffer partial or transient failures. Applications should be designed to handle component failures as part of the architecture. The system should be designed to detect failure and, ideally, automatically heal itself.

Transaction failures can occur when a component is unavailable or under high load. Partial failures can occur when a percentage of requests succeeds, including during batch processing. Intermittent failures might occur when a request fails for a short period of time due to network or other transient issues.

AWS serverless services, including AWS Lambda, are fault-tolerant and designed to handle failures. If a service invokes a Lambda function and there is a service disruption, Lambda invokes the function in a different Availability Zone.

When you invoke a function directly, you determine the strategy for handling errors. You can retry, send the event to a destination or queue for debugging, or ignore the error. Clients such as the AWS Command Line Interface (CLI) and the AWS SDK retry on client timeouts, throttling errors (429), and other errors that are not caused by a bad request.

When you invoke a function indirectly, you must be aware of the retry behavior of the invoker and any service that the request encounters along the way. For more information, see “Error handling and automatic retries in AWS Lambda”. You can configure Maximum Retry Attempts and Maximum Event Age for asynchronous invocations.

When reading from Amazon Kinesis Data Streams and Amazon DynamoDB Streams, Lambda retries the entire batch of items. Retries continue until the records expire or exceed the maximum age that you configure on the event source mapping. You can also configure the event source mapping to split a failed batch into two batches. Retrying with smaller batches isolates bad records and works around timeout issues.

Partial failures can occur in non-atomic operations. PutRecords for Kinesis and BatchWriteItem for DynamoDB return a successful response if at least one record is ingested successfully. Always inspect the response when using such operations and programmatically deal with partial failures.

Use exponential backoff with jitter

The simplest technique for dealing with failures in a networked environment is to retry calls until they succeed. This technique increases the reliability of the application and reduces operational costs for the developer.

However, it is not always safe to retry. A retry can further increase the load on the system being called if the system is already failing due to an overload. To avoid this problem, use backoff. Instead of retrying immediately and aggressively, the client waits some amount of time between tries. The most common pattern is an exponential backoff, which uses exponentially longer wait times between retries. This is typically capped to a maximum delay and number of retries.

If all backoff retries are still happening at the same time, this can still overload a system or cause contention. To avoid this problem, use jitter. Jitter adds some amount of randomness to the backoff to spread the retries around in time. This can help prevent large bursts by spreading out the rate when clients connect. For more information see the Amazon Builders’ Library article “Timeouts, retries, and backoff with jitter” and AWS Architecture blog post “Exponential Backoff And Jitter”.

Exponential backoff and jitter

Exponential backoff and jitter

When your application responds to callers in fail-fast scenarios and when performance is degraded, inform the caller via headers or metadata when they can retry.

Each AWS SDK implements automatic retry logic including exponential backoff. For downstream calls, you can adjust AWS and third-party SDK retries, backoffs, TCP, and HTTP timeouts. This helps you decide when to stop retrying. For more information, see the documentation and troubleshooting steps for Lambda and the AWS SDK.

Use a dead-letter queue mechanism to retain, investigate and retry failed transactions

There are a number of ways to handle message failures including destinations and dead-letter queues.

You can configure Lambda to send records of asynchronous invocations to another destination service. These include Amazon Simple Queue Service (SQS), Amazon Simple Notification Service (SNS), Lambda, and Amazon EventBridge. You can configure separate destinations for events that fail processing and events that are successfully processed. The invocation record contains details about the event, the response, and the reason that the record was sent.

The following example shows a function that sends a record of a successful invocation to an EventBridge event bus. When an event fails all processing attempts, Lambda sends an invocation record to an SQS queue. It includes the function’s response in the invocation record.

AWS Lambda destinations for asynchronous invocation

AWS Lambda destinations for asynchronous invocation

SNS, SQS, Lambda, and EventBridge support dead-letter queues (DLQs). DLQs make your applications more resilient and durable by storing messages or events that can’t be processed correctly into a dedicated SQS queue. This helps you debug your application by isolating the problematic messages to determine why their processing failed. One you have resolved the issue, re-process the failed message. For more information, see “When should I use a dead-letter queue?” There is an example serverless application to redrive the messages from an SQS DLQ back to its source SQS queue.

For Lambda, DLQs provide an alternative to a failure destination. Lambda destinations is preferable for asynchronous invocations.

Good practice: Orchestrate long-running transactions

Long-running transactions can be processed by one or multiple components. Consider implementing the saga pattern using state machines for these types of transactions.

The saga pattern coordinates transactions between multiple microservices as part of a state machine. Each service that performs a transaction publishes an event to trigger the next transaction in the saga. This continues until the transaction chain is complete. If a transaction fails, saga orchestrates a series of compensating transactions that undo the changes that were made by the preceding transactions.

This is preferable to handling complex or long-running transactions within application code. State machines prevent cascading failures and avoid tightly coupling components with orchestrating logic and business logic.

Use a state machine to visualize distributed transactions, and to separate business logic from orchestration logic.

AWS Step Functions lets you coordinate multiple AWS services into serverless workflows via state machines. Within Step Functions, you can set separate retries, backoff rates, max attempts, intervals, and timeouts. These are set for every step of your state machine using a declarative language.

In the serverless airline example used in this series, Step Functions is used to orchestrate the Booking microservice. The ProcessBooking state machine handles all the necessary steps to create bookings, including payment.

Booking service Step Functions state machine

Booking service Step Functions state machine

The state machine uses a combination of service integrations using DynamoDB, SQS, and Lambda functions to coordinate transactions and handle failures.

For example, the Reserve Booking task invokes a Lambda function. The task has retry and error handling configured as part of the task definition.

"Reserve Booking": {
	"Type": "Task",
	"Resource": "${ReserveBooking.Arn}",
	"TimeoutSeconds": 5,
	"Retry": [
		{
			"ErrorEquals": [
				"BookingReservationException"
			],
			"IntervalSeconds": 1,
			"BackoffRate": 2,
			"MaxAttempts": 2
		}
	],
	"Catch": [
		{
			"ErrorEquals": [
				"States.ALL"
			],
			"ResultPath": "$.bookingError",
			"Next": "Cancel Booking"
		}
	],
	"ResultPath": "$.bookingId",
	"Next": "Collect Payment"
},

Step Functions supports direct service integrations, including DynamoDB. The Reserve Flight task directly updates the flightTable without requiring a Lambda function.

"Reserve Flight": {
	"Type": "Task",
	"Resource": "arn:aws:states:::dynamodb:updateItem",
	"Parameters": {
		"TableName.$": "$.flightTable",
		"Key": {
			"id": {
				"S.$": "$.outboundFlightId"
			}
		},
		"UpdateExpression": "SET seatCapacity = seatCapacity - :dec",
		"ExpressionAttributeValues": {
			":dec": {
				"N": "1"
			},
			":noSeat": {
				"N": "0"
			}
		},
		"ConditionExpression": "seatCapacity > :noSeat"
	},

By default, when a state reports an error, Step Functions causes the execution to fail entirely.

Utilize dead-letter queues in response to failed state machine executions

Any state within the Step Functions workflow can encounter runtime errors. These include state machine definition issues, task failures such as Lambda function exceptions, or transient issues such as network connectivity issues. For more information, see “Error handling in Step Functions”.

Use the Step Functions service integration with SQS to send failed transactions to a DLQ as the final step. This adds a higher level of durability within your state machines.

For example, the airline Notify Failed Booking final task catches failed states from four previous steps. It sends the results to the Booking DLQ.

Booking service Step Functions DLQ

Booking service Step Functions DLQ

The message includes the output of the previous failed states for further troubleshooting.

"Booking DLQ": {
	"Type": "Task",
	"Resource": "arn:aws:states:::sqs:sendMessage",
	"Parameters": {
		"QueueUrl": "${BookingsDLQ}",
		"MessageBody.$": "$"
	},
	"ResultPath": "$.deadLetterQueue",
	"Next": "Booking Failed"
},

The Step Functions documentation has more information on calling SQS.

Conclusion

Build resiliency into your workloads. This makes sure that your application can withstand partial and intermittent failures across components that may only surface in production.

In this post, I cover managing failures using retries, exponential backoff, and jitter. I explain how DLQs can isolate failed messages. I show how to use state machines to orchestrate long running transactions rather than handling these in application code.

This well-architected question continues in part 2 where I look at managing duplicate and unwanted events with idempotency and an event schema. I cover how to consider scaling patterns at burst rates by managing account limits and show relevant metrics to evaluate.

For more serverless learning resources, visit Serverless Land.

Expiring Amazon S3 Objects Based on Last Accessed Date to Decrease Costs

Post Syndicated from Hareesh Singireddy original https://aws.amazon.com/blogs/architecture/expiring-amazon-s3-objects-based-on-last-accessed-date-to-decrease-costs/

Organizations are using Amazon Simple Storage Service (S3) for building their data lakes, websites, mobile applications, and enterprise applications. As the number of objects within your S3 bucket increases, you may want to move older objects into lower-cost tiers of Amazon S3. In some cases you may want to delete the objects altogether to further reduce S3 storage costs. A common practice is to use S3 Lifecycle rules to achieve this. These rules can be applied to objects based on their creation date. In certain situations, you may want to keep objects available that are still being accessed, but transition or delete objects that are no longer in use.

In this post, we will demonstrate how you can create custom object expiry rules for Amazon S3 based on the last accessed date of the object. We will first walk through the various features used within the workflow, followed by an architecture diagram outlining the process flow.

Amazon S3 server access logging

S3 Server access logging provides detailed records of the requests that are made to objects in Amazon S3 buckets. Amazon S3 periodically collects access log records, consolidates the records in log files, and then uploads log files to your target bucket as log objects. Each log record consists of information such as bucket name, the operation in the request, and the time at which the request was received. S3 Server Access Log Format provides more details about the format of the log file.

Amazon S3 inventory

Amazon S3 inventory provides a list of your objects and the corresponding metadata on a daily or weekly basis, for an S3 bucket or a shared prefix. The inventory lists are stored as a comma-separated value (CSV) file compressed with GZIP, as an Apache optimized row columnar (ORC) file compressed with ZLIB, or as an Apache Parquet file compressed with Snappy.

Amazon S3 Lifecycle

Amazon S3 Lifecycle policies help you manage your objects through two types of actions, Transition and Expiration. In the architecture shown following in Figure 1, we create an S3 Lifecycle configuration rule that expires objects after ‘x’ days. It has a filter for an object tag of “delete=True”. You can configure the value of ‘x’ based on your requirements.

If you are using an S3 bucket to store short lived objects with unknown access patterns, you might want to keep the objects that are still being accessed, but delete the rest. This will let you retain objects in your S3 bucket even after their expiry date as per the S3 lifecycle rules, while saving you costs by deleting objects that are not needed anymore. The following diagram shows an architecture that considers the last accessed date of the object before deleting S3 objects.

Figure 1. Object expiry architecture flow

Figure 1. Object expiry architecture flow

This architecture uses native S3 features mentioned earlier in combination with other AWS services to achieve the desired outcome.

Here is the architecture flow:

  1. The S3 server access logs capture S3 object requests. These are generated and stored in the target S3 bucket.
  2. An S3 inventory report is generated for the source bucket daily. It is written to the S3 inventory target bucket.
  3. An Amazon EventBridge rule is configured that will initiate an AWS Lambda function once a day, or as desired.
  4. The Lambda function initiates an S3 Batch Operation job to tag objects in the source bucket. These must be expired using the following logic:
    • Capture the number of days (x) configuration from the S3 Lifecycle configuration.
    • Run an Amazon Athena query that will get the list of objects from the S3 inventory report and server access logs. Create a delta list with objects that were created earlier than ‘x’ days, but not accessed during that time.
    • Write a manifest file with the list of these objects to an S3 bucket.
    • Create an S3 Batch operation job that will tag all objects in the manifest file with a tag of “delete=True”.
  5. The Lifecycle rule on the source S3 bucket will expire all objects that were created prior to ‘x’ days. They will have the tag given via the S3 batch operation of “delete=True”.

The preceding architecture is built for fault tolerance. If a particular run fails, all the objects that must be expired will be picked up during the next run. You can configure error handling and automatic retries in your Lambda function. An Amazon Simple Notification Service (SNS) topic will send out a notification in the event of a failure.

Cost considerations

S3 server access logs, S3 inventory lists, and manifest files can accumulate many objects over time. We recommend you configure an S3 Lifecycle policy on the target bucket to periodically delete older objects. Although following the guidelines in this post can decrease some of your costs, S3 requests, S3 inventory, S3 Object Tagging, and Lifecycle transitions also have costs associated with them. Additional details can be found on the S3 pricing page.

Amazon Athena charges you based on the amount of data scanned by each query. But Amazon S3 inventory can also output files in Apache ORC or Apache Parquet format, which can reduce the amount data scanned by Athena. The Athena pricing page would be helpful to review.

AWS Lambda has a free usage tier of 1M free requests per month and 400,000 GB-seconds of compute time per month. However, you are charged based on the number of requests, the amount of memory allocated, and the runtime duration of the function. See more at the Lambda pricing page.

Conclusion

In this blog post, we showed how you can create a custom process to delete objects from your S3 bucket based on the last time the object was accessed. You can use this architecture to customize your object transitions, clean up your S3 buckets for any unnecessary objects, and keep your S3 buckets cost-effective. This architecture can also be used on versioned S3 buckets with some minor modifications.

We hope you found this blog post useful and welcome your feedback!

Read more about queries, rules, and tags:

Insights for CTOs: Part 1 – Building and Operating Cloud Applications

Post Syndicated from Syed Jaffry original https://aws.amazon.com/blogs/architecture/insights-for-ctos-part-1-building-and-operating-cloud-applications/

This 6-part series shares insights gained from various CTOs during their cloud adoption journeys at their respective organizations. This post takes those learnings and summarizes architecture best practices to help you build and operate applications successfully in the cloud. This series will also cover topics on cloud financial management, security, modern data and artificial intelligence (AI), cloud operating models, and strategies for cloud migration.

Optimize cost and performance with AWS services

Your technology costs vs. return on investment (ROI) is likely being constantly evaluated. In the cloud, you “pay as you go.” This means your technology spend is an operational cost rather than capital expenditure, as discussed in Part 3: Cloud economics – OPEX vs. CAPEX.

So, how do you maximize the ROI of your cloud spend? The following sections provide hosting options and to help you choose a hosting model that best suits your needs.

Evaluating your hosting options

EC2 instances and the lift and shift strategy

Using cloud native dynamic provisioning/de-provisioning of Amazon Elastic Compute Cloud (Amazon EC2) instances will help you meet business needs more accurately and optimize compute costs. EC2 instances allow you to use the “lift and shift” migration strategy for your applications. This helps you avoid overhead costs you may incur from upfront capacity planning.

Comparing on-premises vs. cloud infrastructure provisioning

Figure 1. Comparing on-premises vs. cloud infrastructure provisioning

Containerized hosting (with EC2 hosts)

Engineering teams already skilled in containerized hosting have saved additional costs by using Amazon Elastic Kubernetes Service (Amazon EKS) or Amazon Elastic Container Service (Amazon ECS). This is because your unit of deployment is a container instead of an entire instance, and Amazon EKS or Amazon ECS can pack multiple containers into a single instance. Application change management is also less risky because you can leverage Amazon EKS or Amazon ECS built-in orchestration to manage non-disruptive deployments.

Serverless architecture

Use AWS Lambda and AWS Fargate to scale to match unpredictable usage. We have seen AWS software as a service (SaaS) customers build better measures of “cost per user” of an application into their metering systems using serverless. This is because instead of paying for server uptime, you only pay for runtime usage (down to millisecond increments for Lambda) when you run your application.

Further considerations for choosing the right hosting platform

The following table provides considerations for implementing the most cost-effective model for some use cases you may encounter when building your architecture:

Table 1

Building a cloud operating model and managing risk

Building an effective people, governance, and platform capability is summarized in the following sections and discussed in detail in Part 5: Organizing teams to enable effective build/run/manage.

People

If your team only builds applications on virtual machines, asking them to move to the cloud serverless model without sufficiently training them could go poorly. We suggest starting small. Select a handful of applications that have lower risk yet meaningful business value and allow your team to build their cloud “muscles.”

Governance

If your teams don’t have the “muscle memory” to make cloud architecture decisions, build a Cloud Center of Excellence (CCOE) to enforce a consistent approach to building in the cloud. Without this team, managing cost, security, and reliability will be harder. Ask the CCOE team to regularly review the application architecture suitability (cost, performance, resiliency) against changing business conditions. This will help you incrementally evolve architecture as appropriate.

Platform

In a typical on-premises environment, changes are deployed “in-place.” This requires a slow and “involve everyone” approach. Deploying in the cloud replaces the in-place approach with blue/green deployments, as shown in Figure 2.

With this strategy, new application versions can be deployed on new machines (green) running side by side with the old machines (blue). Once the new version is validated, switch traffic to the new (green) machines and they become production. This model reduces risk and increases velocity of change.

AWS blue/green deployment model

Figure 2. AWS blue/green deployment model

Securing your application and infrastructure

Security controls in the cloud are defined and enforced in software, which brings risks and opportunities. If not managed with a robust change management process, software-defined firewall misconfiguration can create unexpected threat vectors.

To avoid this, use cloud native patterns like “infrastructure as code” that express all infrastructure provisioning and configuration as declarative templates (JSON or YAML files). Then apply the same “Git pull request” process to infrastructure change management as you do for your applications to enforce strong governance. Use tools like AWS CloudFormation or AWS Cloud Development Kit (AWS CDK) to implement infrastructure templates into your cloud environment.

Apply a layered security model (“defense in depth”) to your application stack, as shown in Figure 3, to prevent against distributed denial of service (DDoS) and application layer attacks. Part 2: Protecting AWS account, data, and applications provides a detailed discussion on security.

Defense in depth

Figure 3. Defense in depth

Data stores

How many is too many?

In on-premises environments, it is typically difficult to provision a separate database per microservice. As a result, the application or microservice isolation stops at the compute layer, and the database becomes the key shared dependency that slows down change.

The cloud provides API instantiable, fully managed databases like Amazon Relational Database Service (Amazon RDS) (SQL), Amazon DynamoDB (NoSQL), and others. This allows you to isolate your application end to end and create a more resilient architecture. For example, in a cell-based architecture where users are placed into self-contained, isolated application stack “cells,” the “blast radius” of an impact, such as application downtime or user experience degradation, is limited to each cell.

Database engines

Relational databases are typically the default starting point for many organizations. While relational databases offer speed and flexibility to bootstrap a new application, they bring complexity when you need to horizontally scale.

Your application needs will determine whether you use a relational or non-relational database. In the cloud, API instantiated, fully managed databases give you options to closely match your application’s use case. For example, in-memory databases like Amazon ElastiCache reduce latency for website content and key-value databases like DynamoDB provide a horizontally scalable backend for building an ecommerce shopping cart.

Summary

We acknowledge that CTO responsibilities can differ among organizations; however, this blog discusses common key considerations when building and operating an application in the cloud.

Choosing the right application hosting platform depends on your application’s use case and can impact the operational cost of your application in the cloud. Consider the people, governance, and platform aspects carefully because they will influence the success or failure of your cloud adoption. Use lower risk application deployment patterns in the cloud. Managed data stores in the cloud open your choice for data stores beyond relational. In the next post of this series, Part 2: Protecting AWS account, data, and applications, we will explore best practices and principles to apply when thinking about security in the cloud.

Related information

  • Part 2: Protecting AWS account, data and applications
  • Part 3: Cloud economics – OPEX vs CAPEX
  • Part 4: Building a modern data platform for AI
  • Part 5: Organizing teams to enable effective build/run/manage
  • Part 6: Strategies and lessons on migrating workloads to the cloud

Benefits of Modernizing On-premise Analytics with an AWS Lake House

Post Syndicated from Vikas Nambiar original https://aws.amazon.com/blogs/architecture/benefits-of-modernizing-on-premise-analytics-with-an-aws-lake-house/

Organizational analytics systems have shifted from running in the background of IT systems to being critical to an organization’s health.

Analytics systems help businesses make better decisions, but they tend to be complex and are often not agile enough to scale quickly. To help with this, customers upgrade their traditional on-premises online analytic processing (OLAP) databases to hyper converged infrastructure (HCI) solutions. However, these systems incur operational overhead, are limited by proprietary formats, have limited elasticity, and tie customers into costly and inhibiting licensing agreements. These all bind an organization’s growth to the growth of the appliance provider.

In this post, we provide you a reference architecture and show you how an AWS lake house will help you overcome the aforementioned limitations. Our solution provides you the ability to scale, integrate with multiple sources, improve business agility, and help future proof your analytics investment.

High-level architecture for implementing an AWS lake house

Lake house architecture uses a ring of purpose-built data consumers and services centered around a data lake. This approach acknowledges that a one-size-fits-all approach to analytics eventually leads to compromises. These compromises can include agility associated with change management and impact of different business domain reporting requirements on the data from a central platform. As such, simply integrating a data lake with a data warehouse is not sufficient.

Each step in Figure 1 needs to be de-coupled to build a lake house.

Data flow in a lake house

Figure 1. Data flow in a lake house


High-level design for an AWS lake house implementation

Figure 2. High-level design for an AWS lake house implementation

Building a lake house on AWS

These steps summarize building a lake house on AWS:

  1. Identify source system extraction capabilities to define an ingestion layer that loads data into a data lake.
  2. Build data ingestion layer using services that support source systems extraction capabilities.
  3. Build a governance and transformation layer to manipulate data.
  4. Provide capability to consume and visualize information via purpose-built consumption/value layer.

This lake house architecture provides you a de-coupled architecture. Services can be added, removed, and updated independently when new data sources are identified like data sources to enrich data via AWS Data Exchange. This can happen while services in the purpose-built consumption layer address individual business unit requirements.

Building the data ingestion layer

Services in this layer work directly with the source systems based on their supported data extraction patterns. Data is then placed into a data lake.

Figure 3 shows the following services to be included in this layer:

  • AWS Transfer Family for SFTP integrates with source systems to extract data using secure shell (SSH), SFTP, and FTPS/FTP. This service is for systems that support batch transfer modes and have no real-time requirements, such as external data entities.
  • AWS Glue connects to real-time data streams to extract, load, transform, clean, and enrich data.
  • AWS Database Migration Service (AWS DMS) connects and migrates data from relational databases, data warehouses, and NoSQL databases.
Ingestion layer against source systems

Figure 3. Ingestion layer against source systems

Services in this layer are managed services that provide operational excellence by removing patching and upgrade overheads. Being managed services, they will also detect extraction spikes and scale automatically or on-demand based on your specifications.

Building the data lake layer

A data lake built on Amazon Simple Storage Service (Amazon S3) provides the ideal target layer to store, process, and cycle data over time. As the central aspect of the architecture, Amazon S3 allows the data lake to hold multiple data formats and datasets. It can also be integrated with most if not all AWS services and third-party applications.

Figure 4 shows the following services to be included in this layer:

  • Amazon S3 acts as the data lake to hold multiple data formats.
  • Amazon S3 Glacier provides the data archiving and long-term backup storage layer for processed data. It also reduces the amount of data indexed by transformation layer services.
Figure 4. Data lake integrated to ingestion layer

Figure 4. Data lake integrated to ingestion layer

The data lake layer provides 99.999999999% data durability and supports various data formats, allowing you to future proof the data lake. Data lakes on Amazon S3 also integrate with other AWS ecosystem services (for example, AWS Athena for interactive querying or third-party tools running off Amazon Elastic Compute Cloud (Amazon EC2) instances).

Defining the governance and transformation layer

Services in this layer transform raw data in the data lake to a business consumable format, along with providing operational monitoring and governance capabilities.

Figure 5 shows the following services to be included in this layer:

  1. AWS Glue discovers and transforms data, making it available for search and querying.
  2. Amazon Redshift (Transient) functions as an extract, transform, and load (ETL) node using RA3 nodes. RA3 nodes can be paused outside ETL windows. Once paused, Amazon Redshift’s data sharing capability allows for live data sharing for read purposes, which reduces costs to customers. It also allows for creation of separate, smaller read-intensive business intelligence (BI) instances from the larger write-intensive ETL instances required during ETL runs.
  3. Amazon CloudWatch monitors and observes your enabled services. It integrates with existing IT service management and change management systems such as ServiceNow for alerting and monitoring.
  4. AWS Security Hub implements a single security pane by aggregating, organizing, and prioritizing security alerts from services used, such as Amazon GuardDuty, Amazon Inspector, Amazon Macie, AWS Identity and Access Management (IAM) Access Analyzer, AWS Systems Manager, and AWS Firewall Manager.
  5. Amazon Managed Workflows for Apache Airflow (MWAA) sequences your workflow events to ingest, transform, and load data.
  6. Amazon Lake Formation standardizes data lake provisioning.
  7. AWS Lambda runs custom transformation jobs if required, or developed over a period of time that hold custom business logic IP.
Governance and transformation layer prepares data in the lake

Figure 5. Governance and transformation layer prepares data in the lake

This layer provides operational isolation wherein least privilege access control can be implemented to keep operational staff separate from the core services. It also lets you implement custom transformation tasks using Lambda. This allows you to consistently build lakes across all environments and single view of security via AWS Security Hub.

Building the value layer

This layer generates value for your business by provisioning decoupled, purpose-built visualization services, which decouples business units from change management impacts of other units.

Figure 6 shows the following services to be included in this value layer:

  1. Amazon Redshift (BI cluster) acts as the final store for data processed by the governance and transformation layer.
  2. Amazon Elasticsearch Service (Amazon ES) conducts log analytics and provides real-time application and clickstream analysis, including for data from previous layers.
  3. Amazon SageMaker prepares, builds, trains, and deploys machine learning models that provide businesses insights on possible scenarios such as predictive maintenance, churn predictions, demand forecasting, etc.
  4. Amazon QuickSight acts as the visualization layer, allowing business and support resources users to create reports, dashboards accessible across devices and embedded into other business applications, portals, and websites.
Value layer with services for purpose-built consumption

Figure 6. Value layer with services for purpose-built consumption

Conclusion

By using services managed by AWS as a starting point, you can build a data lake house on AWS. This open standard based, pay-as-you-go data lake will help future proof your analytics platform. With the AWS data lake house architecture provided in this post, you can expand your architecture, avoid excessive license costs associated with proprietary software and infrastructure (along with their ongoing support costs). These capabilities are typically unavailable in on-premises OLAP/HCI based data analytics platforms.

Related information

Build a Virtual Waiting Room with Amazon DynamoDB and AWS Lambda at SeatGeek

Post Syndicated from Umesh Kalaspurkar original https://aws.amazon.com/blogs/architecture/build-a-virtual-waiting-room-with-amazon-dynamodb-and-aws-lambda-at-seatgeek/

As retail sales, products, and customers continue to expand online, we’ve seen a trend towards releasing products in limited quantities to larger audiences. Demand of these products can be high, due to limited production capacity, venue capacity limits, or product exclusivity. Providers can then experience spikes in transaction volume, especially when multiple event sales occur simultaneously. This increased traffic and load can negatively impact customer experience and infrastructure.

To enhance the customer experience when releasing tickets to high demand events, SeatGeek has introduced a prioritization and queueing mechanism based on event type, venue, and customer type. For example, Dallas Cowboys’ tickets could have a different priority depending on seat type, or whether it’s a suite or a general admission ticket.

SeatGeek previously used a third-party waiting room solution, but it presented a number of shortcomings:

  • Lack of configuration and customization capabilities
  • More manual process that resulted in limiting the number of concurrent events could be set up
  • Inability to capture custom insights and metrics (for example, how long was the customer waiting in the queue before they dropped?)

Resolving these issues is crucial to improve the customer experience and audience engagement. SeatGeek decided to build a custom solution on AWS, in order to create a more robust system and address these third-party issues.

Virtual Waiting Room overview

Our solution redirects overflow customers waiting to complete their purchase to a separate queue. Personalized content is presented to improve the waiting experience. Public services such as school or voting registration can use this solution for limited spots or time slot management.

Figure 1. User path through a Virtual Waiting Room

Figure 1. User path through a Virtual Waiting Room

During a sale event, all customers begin their purchase journey in the Virtual Waiting Room (see Figure 1). When the sale starts, they will be moved from the Virtual Waiting Room to the ticket selection page. This is referred to as the Protected Zone. Here is where the customer will complete their purchase. The Protected Zone is a group of customized pages that guide the user through the purchasing process.

When the virtual waiting room is enabled, it can operate in three modes: Waiting Room mode, Queueing mode, or a combination of the two.

In Waiting Room mode, any request made to an event ticketing page before the designated start time of sale is routed to a separate screen. This displays the on-sale information and other marketing materials. At the desired time, users are then routed to the event page at a predefined throughput rate. Figure 2 shows a screenshot of the Waiting Room mode:

Figure 2. Waiting Room mode

Figure 2. Waiting Room mode

In Queueing mode, the event can be configured to allow a preset number of concurrent users to access the Protected Zone. Those beyond that preconfigured number wait in a First-In-First-Out (FIFO) queue. Exempt users, such as the event coordinator, can bypass the queue for management and operational visibility.

Figure 3. Queueing mode flow

Figure 3. Queueing mode flow


Figure 4. Queueing mode

Figure 4. Queueing mode

In some cases, the two modes can work together sequentially. This can occur when the Waiting Room mode is used before a sale starts and the Queueing mode takes over to control flow.

Once the customers move to the front of the queue, they are next in line for the Protected Zone. A ticket selection page, shown in Figure 5, must be protected from an overflow of customers, which could result in overselling.

Figure 5. Ticket selection page

Figure 5. Ticket selection page

Virtual Waiting Room implementation

In the following diagram, you can see the AWS services and flow that SeatGeek implemented for the Virtual Waiting Room solution. When a SeatGeek customer requests a protected resource like a concert ticket, a gate keeper application scans to see if the resource has an active waiting room. It also confirms if the configuration rules are satisfied in order to grant the customer access. If the customer isn’t allowed access to the protected resource for whatever reason, then that customer is redirected to the Virtual Waiting Room.

Figure 6. Architecture overview

Figure 6. Architecture overview

SeatGeek built this initial iteration of the gate keeper service on Fastly’s Computer@Edge service to leverage its existing content delivery network (CDN) investment. However, similar functionality could be built using Amazon CloudFront and AWS Lambda@Edge.

The Bouncer, handling the user flow into either the protected zone or the waiting room, consists of 3 components – Amazon API Gateway, AWS Lambda, and a Token Service. The token service is at the heart of the Waiting Room’s core logic. Before a concert event sale goes live at SeatGeek, the number of access tokens generated is equivalent to the number of available tickets. The order of assigning access tokens to customers in the waiting room can be based on FIFO or customer status (VIP customers first). Tokens are allocated when the customer is admitted to the waiting room and expire when tickets are purchased or when the customer exits.

For data storage, SeatGeek uses Amazon DynamoDB to monitor protected resources, tokens, and queues. The key tables are:

  • Protected Zone table: This table contains metadata about available protected zones
  • Counters table: Monitors the number of access tokens issued per minute for a specific protected zone
  • User Connection table: Every time a customer connects to the Amazon API Gateway, a record is created in this table recording their visitor token and connection ID using AWS Lambda
  • Queue table: This is the main table where the visitor token to access token mapping is saved

For analytics, two types of metrics are captured to ensure operational integrity:

  • System metrics: These are built into the AWS runtime infrastructure, and are stored in Amazon CloudWatch. These metrics provide telemetry of each component of the solution: Lambda latency, DynamoDB throttle (read and write), API Gateway connections, and more.
  • Business metrics: These are used to understand previous user behavior to improve infrastructure provisioning and user experiences. SeatGeek uses an AWS Lambda function to capture metrics from data in a DynamoDB stream. It then forwards it to Amazon Timestream for time-based analytics processing. Metrics captured include queue length, waiting time per queue, number of users in the protected zone, and more.

For historical needs, long-lived data can be streamed to tiered data storage options such as Amazon Simple Storage Service (S3). They can then be used later for other purposes, such as auditing and data analysis.

Considerations and enhancements for the Virtual Waiting Room

  • Tokens: We recommend using first-party cookies and token confirmations to track the number of sessions. Use the same token at the same time to stop users from checking out multiple times and cutting in line.
  • DDoS protection: Token and first-party cookies usage must also comply with General Data Protection Regulation (GDPR) and California Consumer Privacy Act (CCPA) guidelines depending on the geographic region. This system is susceptible to DDoS attacks, XSS attacks, and others, like any web-based solution. But these threats can be mitigated by using AWS Shield, a DDoS protection service, and AWS WAF – Web Application Firewall. For more information on DDoS protection, read this security blog post.
  • Marketing: Opportunities to educate the customer about the venue or product(s) while they wait in the Virtual Waiting Room (for example, parking or food options).
  • Alerts: Customers can be alerted via SMS or voice when their turn is up by using Amazon Pinpoint as a marketing communication service.

Conclusion

We have shown how to set up a Virtual Waiting Room for your customers. This can be used to improve the customer experience while they wait to complete their registration or purchase through your website. The solution takes advantage of several AWS services like AWS Lambda, Amazon DynamoDB, and Amazon Timestream.

While this references a retail use case, the waiting room concept can be used whenever throttling access to a specific resource is required. It can be useful during an infrastructure or application outage. You can use it during a load spike, while more resources (EC2 instances) are being launched. To block access to an unreleased feature or product, temporarily place all users in the waiting room and let them in as needed per your own configuration.

Providing a friendly, streamlined, and responsive user experience, even during peak load times, is a valuable way to keep existing customers and gain new ones.

Be mindful that there are costs associated with running these services. To be cost-efficient, see the following pages for details: AWS Lambda, Amazon S3, Amazon DynamoDB, Amazon Timestream.

Building a serverless multiplayer game that scales: Part 2

Post Syndicated from James Beswick original https://aws.amazon.com/blogs/compute/building-a-serverless-multiplayer-game-that-scales-part-2/

This post is written by Vito De Giosa, Sr. Solutions Architect and Tim Bruce, Sr. Solutions Architect, Developer Acceleration.

This series discusses solutions for scaling serverless games, using the Simple Trivia Service, a game that relies on user-generated content. Part 1 describes the overall architecture, how to deploy to your AWS account, and different communications methods.

This post discusses how to scale via automation and asynchronous processes. You can use automation to minimize the need to scale personnel to review player-generated content for acceptability. It also introduces asynchronous processing, which allows you to run non-critical processes in the background and batch data together. This helps to improve resource usage and game performance. Both scaling techniques can also reduce overall spend.

To set up the example, see the instructions in the GitHub repo and the README.md file. This example uses services beyond the AWS Free Tier and incurs charges. Instructions to remove the example application from your account are also in the README.md file.

Technical implementation

Games require a mechanism to support auto-moderated avatars. Specifically, this is an upload process to allow the player to send the content to the game. There is a content moderation process to remove unacceptable content and a messaging process to provide players with a status regarding their content.

Here is the architecture for this feature in Simple Trivia Service, which is combined within the avatar workflow:

Architecture diagram

This architecture processes images uploaded to Amazon S3 and notifies the user of the processing result via HTTP WebPush. This solution uses AWS Serverless services and the Amazon Rekognition moderation API.

Uploading avatars

Players start the process by uploading avatars via the game client. Using presigned URLs, the client allows players to upload images directly to S3 without sharing AWS credentials or exposing the bucket publicly.

The URL embeds all the parameters of the S3 request. It includes a SignatureV4 generated with AWS credentials from the backend allowing S3 to authorize the request.

S3 upload process

  1. The front end retrieves the presigned URL invoking an AWS Lambda function through an Amazon API Gateway HTTP API endpoint.
  2. The front end uses the URL to send a PUT request to S3 with the image.

Processing avatars

After the upload completes, the backend performs a set of activities. These include content moderation, generating the thumbnail variant, and saving the image URL to the player profile. AWS Step Functions orchestrates the workflow by coordinating tasks and integrating with AWS services, such as Lambda and Amazon DynamoDB. Step Functions enables creating workflows without writing code and handles errors, retries, and state management. This enables traffic control to avoid overloading single components when traffic surges.

The avatar processing workflow runs asynchronously. This allows players to play the game without being blocked and enables you to batch the requests. The Step Functions workflow is triggered from an Amazon EventBridge event. When the user uploads an image to S3, an event is published to EventBridge. The event is routed to the avatar processing Step Functions workflow.

The single avatar feature runs in seconds and uses Step Functions Express Workflows, which are ideal for high-volume event-processing use cases. Step Functions can also support longer running processes and manual steps, depending on your requirements.

To keep performance at scale, the solution adopts four strategies. First, it moderates content automatically, requiring no human intervention. This is done via Amazon Rekognition moderation API, which can discover inappropriate content in uploaded avatars. Developers do not need machine learning expertise to use this API. If it identifies unacceptable content, the Step Functions workflow deletes the uploaded picture.

Second, it uses avatar thumbnails on the top navigation bar and on leaderboards. This speeds up page loading and uses less network bandwidth. Image-editing software runs in a Lambda function to modify the uploaded file and store the result in S3 with the original.

Third, it uses Amazon CloudFront as a content delivery network (CDN) with the S3 bucket hosting images. This improves performance by implementing caching and serving static content from locations closer to the player. Additionally, using CloudFront allows you to keep the bucket private and provide greater security for the content stored within S3.

Finally, it stores profile picture URLs in DynamoDB and replicates the thumbnail URL in an Amazon Cognito user attribute named picture. This allows the game to retrieve the avatar URL as part of the login process, saving an HTTP GET request for the player profile.

The last step of the workflow publishes the result via an event to EventBridge for downstream systems to consume. The service routes the event to the notification component to inform the player about the moderation status.

Notifying users of the processing result

The result of the avatar workflow to the player is important but not urgent. Players want to know the result but not impact their gameplay experience. A solution for this challenge is to use HTTP web push. It uses the HTTP protocol and does not require a constant communication channel between backend and front end. This allows players to play games without being blocked or by introducing latency to the game communications channel.

Applications requiring low latency fully bidirectional communication, such as highly interactive multi-player games, typically use WebSockets. This creates a persistent two-way channel for front end and backend to exchange information. The web push mechanism can provide non-urgent data and messages to the player without interrupting the WebSockets channel.

The web push protocol describes how to use a consolidated push service as a broker between the web-client and the backend. It accepts subscriptions from the client and receives push message delivery requests from the backend. Each browser vendor provides a push service implementation that is compliant with the W3C Push API specification and is external to both client and backend.

The web client is typically a browser where a JavaScript application interacts with the push service to subscribe and listen for incoming notifications. The backend is the application that notifies the front end. Here is an overview of the protocol with all the parties involved.

Notification process

  1. A component on the client subscribes to the configured push service by sending an HTTP POST request. The client keeps a background connection waiting for messages.
  2. The push service returns a URL identifying a push resource that the client distributes to backend applications that are allowed to send notifications.
  3. Backend applications request a message delivery by sending an HTTP POST request to the previously distributed URL.
  4. The push service forwards the information to the client.

This approach has four advantages. First, it reduces the effort to manage the reliability of the delivery process by off-loading it to an external and standardized component. Second, it minimizes cost and resource consumption. This is because it doesn’t require the backend to keep a persistent communication channel or compute resources to be constantly available. Third, it keeps complexity to a minimum because it relies on HTTP only without requiring additional technologies. Finally, HTTP web push addresses concepts such as message urgency and time-to-live (TTL) by using a standard.

Serverless HTTP web push

The implementation of the web push protocol requires the following components, per the Push API specification. First, the front end is required to create a push subscription. This is implemented through a service worker, a script running in the origin of the application. The service worker exposes operations to access the push service either creating subscriptions or listening for push events.

Serverless HTTP web push

  1. The client uses the service worker to subscribe to the push service via the Push API.
  2. The push service responds with a payload including a URL, which is the client’s push endpoint. The URL is used to create notification delivery requests.
  3. The browser enriches the subscription with public cryptographic keys, which are used to encrypt messages ensuring confidentiality.
  4. The backend must receive and store the subscription for when a delivery request is made to the push service. This is provided by API Gateway, Lambda, and DynamoDB. API Gateway exposes an HTTP API endpoint that accepts POST requests with the push service subscription as payload. The payload is stored in DynamoDB alongside the player identifier.

This front end code implements the process:

//Once service worker is ready
navigator.serviceWorker.ready
  .then(function (registration) {
    //Retrieve existing subscription or subscribe
    return registration.pushManager.getSubscription()
      .then(async function (subscription) {
        if (subscription) {
          console.log('got subscription!', subscription)
          return subscription;
        }
        /*
         * Using Public key of our backend to make sure only our
         * application backend can send notifications to the returned
         * endpoint
         */
        const convertedVapidKey = self.vapidKey;
        return registration.pushManager.subscribe({
          userVisibleOnly: true,
          applicationServerKey: convertedVapidKey
        });
      });
  }).then(function (subscription) {
    //Distributing the subscription to the application backend
    console.log('register!', subscription);
    const body = JSON.stringify(subscription);
    const parms = {jwt: jwt, playerName: playerName, subscription: body};
    //Call to the API endpoint to save the subscription
    const res = DataService.postPlayerSubscription(parms);
    console.log(res);
  });


Next, the backend reacts to the avatar workflow completed custom event to create a delivery request. This is accomplished with EventBridge and Lambda.

Backend process after avater workflow completed

  1. EventBridge routes the event to a Lambda function.
  2. The function retrieves the player’s agent subscriptions, including push endpoint and encryption keys, from DynamoDB.
  3. The function sends an HTTP POST to the push endpoint with the encrypted message as payload.
  4. When the push service delivers the message, the browser activates the service worker updating local state and displaying the notification.

The push service allows creating delivery requests based on the knowledge of the endpoint and the front end allows the backend to deliver messages by distributing the endpoint. HTTPS provides encryption for data in transit while DynamoDB encrypts all your data at rest to provide confidentiality and security for the endpoint.

Security of WebPush can be further improved by using Voluntary Application Server Identification (VAPID). With WebPush, the clients authenticate messages at delivery time. VAPID allows the push service to perform message authentication on behalf of the web client avoiding denial-of-service risk. Without the additional security of VAPID, any application knowing the push service endpoint might successfully create delivery requests with an invalid payload. This can cause the player’s agent to accept messages from unauthorized services and, possibly, cause a denial-of-service to the client by overloading its capabilities.

VAPID requires backend applications to own a key pair. In Simple Trivia Service, a Lambda function, which is an AWS CloudFormation custom resource, generates the key pair when deploying the stack. It securely saves values in AWS System Manager (SSM) Parameter Store.

Here is a representation of VAPID in action:

VAPID process architecture

  1. The front end specifies which backend the push service can accept messages from. It does this by including the public key from VAPID in the subscription request.
  2. When requesting a message delivery, the backend self-identifies by including the public key and a token signed with the private key in the HTTP Authorization header. If the keys match and the client uses the public key at subscription, the message is sent. If not, the message is blocked by the push service.

The Lambda function that sends delivery requests to the push service reads the key values from SSM. It uses them to generate the Authorization header to include in the request, allowing for successful delivery to the client endpoint.

Conclusion

This post shows how you can add scaling support for a game via automation. The example uses Amazon Rekognition to check images for unacceptable content and uses asynchronous architecture patterns with Step Functions and HTTP WebPush. These scaling approaches can help you to maximize your technical and personnel investments.

For more serverless learning resources, visit Serverless Land.

Field Notes: Build Dynamic IVR Menus with Amazon Connect and AWS Lambda

Post Syndicated from Marius Cealera original https://aws.amazon.com/blogs/architecture/field-notes-build-dynamic-ivr-menus-with-amazon-connect-and-aws-lambda/

This post was co-written by Marius Cealera, Senior Partner Solutions Architect at AWS, and Zdenko Estok, Cloud Architect and DevOps Engineer at Accenture. 

Modern interactive voice response (IVR) systems help customers find answers to their questions through a series of menus, usually relying on the customer to filter and select the right options. Adding more options in these IVR menus and hoping to increase the rate of self-serviced calls can be tempting, but it can also overwhelm customers and lead them to ‘zeroing out’. That is, they select to be transferred to a human agent, defeating the purpose of a self-service solution.

This post provides a technical overview of one of Accenture’s Advanced Customer Engagement (ACE+) solutions, explaining how to build a dynamic IVR menu in Amazon Connect, in combination with AWS Lambda and Amazon DynamoDB. The solution can help the zeroing out problem by providing each customer with a personalized list of menu options. Solutions architects, developers, and contact center administrators will learn how to use Lambda and DynamoDB to build Amazon Connect flows where menu options are customized for every known customer. We have provided code examples to deploy a similar solution.

Overview of solution

“Imagine a situation where a customer navigating a call center IVR needs to choose from many menu options – for example, an insurance company providing a self-service line for customers to check their policies. For dozens of insurance policy variations, the IVR would need a long and complex menu. Chances are that after the third or fourth menu choice the customers will be confused, irritated or may even forget what they are looking for,” says Zdenko Estok, Cloud Architect and Amazon Connect Specialist at Accenture.

“Even splitting the menu in submenus does not completely solve the problem. It is a step in the right direction as it can reduce the total time spent listening to menu options, but it has the potential to grow into a huge tree of choices.”

Figure 1. A static one-layer menu on the left, a three-layer menu on the right

Figure 1. A static one-layer menu on the left, a three-layer menu on the right

One way to solve this issue is by presenting only relevant menu options to customers. This approach significantly reduces the time spent in the IVR menu, leading to a better customer experience. This also minimizes the chance the customer will require transfer to a human agent.

Figure 2. Selectively changing the IVR menu structure based on customer profile

Figure 2. Selectively changing the IVR menu structure based on customer profile

For use cases with a limited number of menu options, the solution can be achieved directly in the Amazon Connect IVR designer through the use of the Check Contact Attributes block. However, this approach can lead to complex and hard to maintain flows for situations where dozens of menu variations are possible. A more scalable solution is to store customer information and menu options in DynamoDB and build the menu dynamically by using a series of Lambda functions (Figure 3).

Consider a customer with the following information stored in a database: phone number, name, and active insurance policies. A dynamic menu implementation will authenticate the user based on the phone number, retrieve the policy information from the database, and build the menu options.

The first Lambda function retrieves the customer’s active policies and builds the personalized greeting and menu selection prompt. The second Lambda function maps the customer’s menu selection to the correct menu path. This is required since the menu is dynamic and the items and ordering are different for different customers. This approach also allows administrators to add or change insurance types and their details, directly in the database, without the need to update the IVR structure. This can be useful when maintaining IVR flows for dozens of products or services.

Figure 3 - IVR flow leveraging dynamically generated menu options.

Figure 3 – IVR flow leveraging dynamically generated menu options.

Walkthrough

Sample code for this solution is provided in this GitHub repo. The code is packaged as a CDK application, allowing the solution to be deployed in minutes. The deployment tasks are as follows:

  1. Deploy the CDK app.
  2. Update Amazon Connect instance settings.
  3. Import the demo flow and data.

Prerequisites

For this walkthrough, you need the following prerequisites:

  • An AWS account.
  • AWS CLI access to the AWS account where you would like to deploy your solution.
  • An Amazon Connect instance. If you do not have an Amazon Connect instance, you can deploy one and claim a phone number with Set up your Amazon Connect instance.

Deploy the CDK application

The resources required for this demo are packaged as a CDK app. Before proceeding, confirm you have CLI access to the AWS account where you would like to deploy your solution.

  1. Open a terminal window and clone the GitHub repository in a directory of your choice:

git clone [email protected]:aws-samples/amazon-connect-dynamic-ivr-menus.git

Navigate to the cdk-app directory and follow the deployment instructions. The default region is usually us-east-1. If you would like to deploy in another Region, you can run:

export AWS_DEFAULT_REGION=eu-central-1

Update Amazon Connect instance settings

You need to update your Amazon Connect instance settings to implement the Lambda functions created by the CDK app.

  1. Log into the AWS console.
  2. Navigate to Services > Amazon Connect. Select your Amazon Connect instance.
  3. Select Contact Flows.
  4. Scroll down to the Lambda section and add getCustomerDetails* and selectionFulfi lment* functions. If the Lambda functions are not listed, return to the Deploy the CDK application section and verify there are no deployment errors.
  5. Select +Add Lambda function.

Import the demo flow

  1. Download the DemoMenu Amazon Connect flow from the flow_archive section of the sample code repository.
  2. Log in to the Amazon Connect console. You can find the Amazon Connect access url for your instance in the AWS Console, under Services > Amazon Connect > (Your Instance Name). The access url will have the following format: https://<your_instance_name>.awsapps.com/connect/login
  3.  Create a new contact flow by selecting ‘Contact Flows’ from the left side menu and then select Create New Contact Flow.
  4.  Select ‘Import Flow(beta)’ from the upper right corner menu and select the DemoMenu file downloaded at step 1.
  5.  Click on the first ‘Invoke Lambda’ block, and verify the getCustomerDetails* Lambda is selected.
  6.  Select the second Invoke Lambda block, and verify the selectionFulfilment*’Lambda is selected.
  7.  Select Publish.
  8.  Associate the new flow with your claimed phone number (phone numbers are listed in the left side menu).

Update the demo data and test

  1. For the demo to work and recognize your phone number, you will need to enter your phone number into the demo customers table.
  2. Navigate to the AWS console and select DynamoDB.
  3. From the left hand side menu select Tables, open the CdkAppStack-policiesDb*table, and navigate to the Items tab. If the table is empty, verify you started the populateDBLamba, as mentioned in the CDK deployment instructions.
  4. Select one of the customers in the table, then select Actions > Duplicate. In the new item, enter your phone number (in international format).
  5. Select Save.
  6. Dial your claimed Connect number. You should hear the menu options based on your database table entry.

Clean up

You can remove all resources provisioned for the CDK app by navigating to the cdk-app directory and running the following command:

cdk destroy

This will not remove your Amazon Connect instance. You can remove it by navigating to the AWS console > Services > Amazon Connect. Find your Connect instance and select Remove.

Conclusion

In this post we showed you how a dynamic IVR menu can be implemented in Amazon Connect. Using a dynamic menu can significantly reduce call durations by helping customers reach relevant content faster in the IVR system, which often leads to improved customer satisfaction. Furthermore, this approach to building IVR menus provides call center administrators with a way to manage menus with dozens or hundreds of branches directly in a backend database, as well as add or update menu options.

Field Notes provides hands-on technical guidance from AWS Solutions Architects, consultants, and technical account managers, based on their experiences in the field solving real-world business problems for customers.

Accelerating Innovation with the Accenture AWS Business Group (AABG)

By working with the Accenture AWS Business Group (AABG), you can learn from the resources, technical expertise, and industry knowledge of two leading innovators, helping you accelerate the pace of innovation to deliver disruptive products and services. The AABG helps customers ideate and innovate cloud solutions with customers through rapid prototype development.

Connect with our team at [email protected] to learn how to use machine learning in your products and services.


Zdenko Estok

Zdenko Estok

Zdenko Estok works as a Cloud Architect and DevOps engineer at Accenture. He works with AABG to develop and implement innovative cloud solutions, and specializes in Infrastructure as Code and Cloud Security. Zdenko likes to bike to the office and enjoys pleasant walks in nature.

Building well-architected serverless applications: Regulating inbound request rates – part 2

Post Syndicated from Julian Wood original https://aws.amazon.com/blogs/compute/building-well-architected-serverless-applications-regulating-inbound-request-rates-part-2/

This series of blog posts uses the AWS Well-Architected Tool with the Serverless Lens to help customers build and operate applications using best practices. In each post, I address the serverless-specific questions identified by the Serverless Lens along with the recommended best practices. See the introduction post for a table of contents and explanation of the example application.

Reliability question REL1: How do you regulate inbound request rates?

This post continues part 1 of this security question. Previously, I cover controlling inbound request rates using throttling. I go through how to use throttling to control steady-rate and burst rate requests. I show some solutions for performance testing to identify the request rates that your workload can sustain before impacting performance.

Good practice: Use, analyze, and enforce API quotas

API quotas limit the maximum number of requests a given API key can submit within a specified time interval. Metering API consumers provides a better understanding of how different consumers use your workload at sustained and burst rates at any point in time. With this information, you can determine fine-grained rate limiting for multiple quota limits. These can be done according to a group of consumer needs, and can adjust their limits on a regular basis.

Segregate API consumers steady-rate requests and their quota into multiple buckets or tiers

Amazon API Gateway usage plans allow your API consumer to access selected APIs at agreed-upon request rates and quotas. These help your consumers meet their business requirements and budget constraints. Create and attach API keys to usage plans to control access to certain API stages. I show how to create usage plans and how to associate them with API keys in “Building well-architected serverless applications: Controlling serverless API access – part 2”.

API key associated with usage plan

API key associated with usage plan

You can extract utilization data from usage plans to analyze API usage on a per-API key basis. In the example, I show how to use usage plans to see how many requests are made.

View API key usage

View API key usage

This allows you to generate billing documents and determine whether your customers need higher or lower limits. Have a mechanism to allow customers to request higher limits preemptively. When customers anticipate greater API usage, they can take action proactively.

API Gateway Lambda authorizers can dynamically associate API keys to a given request. This can be used where you do not control API consumers, or want to associate API keys based on your own criteria. For more information, see the documentation.

You can also visualize usage plans with Amazon QuickSight using enriched API Gateway access logs.

Visualize usage plans with Amazon QuickSight

Visualize usage plans with Amazon QuickSight

Define whether your API consumers are end users or machines

Understanding your API consumers helps you manage how they connect to your API. This helps you define a request access pattern strategy, which can distinguish between end users or machines.

Machine consumers make automated connections to your API, which may require a different access pattern to end users. You may decide to prioritize end user consumers to provide a better experience. Machine consumers may be able to handle request throttling automatically.

Best practice: Use mechanisms to protect non-scalable resources

Limit component throughput by enforcing how many transactions it can accept

AWS Lambda functions can scale faster than traditional resources, such as relational databases and cache systems. Protect your non-scalable resources by ensuring that components that scale quickly do not exceed the throughput of downstream systems. This can prevent system performance degrading. There are a number of ways to achieve this, either directly or via buffer mechanisms such as queues and streams.

For relational databases such as Amazon RDS, you can limit the number of connections per user, in addition to the global maximum number of connections. With Amazon RDS Proxy, your applications can pool and share database connections to improve their ability to scale.

Amazon RDS Proxy

Amazon RDS Proxy

For additional options for using RDS with Lambda, see the AWS Serverless Hero blog post “How To: Manage RDS Connections from AWS Lambda Serverless Functions”.

Cache results and only connect to, and fetch data from databases when needed. This reduces the load on the downstream database. Adjust the maximum number of connections for caching systems. Include a caching expiration mechanism to prevent serving stale records. For more information on caching implementation patterns and considerations, see “Caching Best Practices”.

Lambda provides managed scaling. When a function is first invoked, the Lambda service creates an instance of the function to process the event. This is called a cold start. After completion, the function remains available for a period of time to process subsequent events. These are called warm starts. If other events arrive while the function is busy, Lambda creates more instances of the function to handle these requests concurrently as cold starts. The following example shows 10 events processed in six concurrent requests.

Lambda concurrency

Lambda concurrency

You can control the number of concurrent function invocations to both reserve and limit the maximum concurrency your function can achieve. You can configure reserved concurrency to set the maximum number of concurrent instances for the function. This can protect downstream resources such as a database by ensuring Lambda can only scale up to the number of connections the database can support.

For example, you may have a traditional database or external API that can only support a maximum of 50 concurrent connections. You can set the maximum number of concurrent Lambda functions using the function concurrency settings. Setting the value to 50 ensures that the traditional database or external API is not overwhelmed.

Edit Lambda concurrency

Edit Lambda concurrency

You can also set the Lambda function concurrency to 0, which disables the Lambda function in the event of anomalies.

Another solution to protect downstream resources is to use an intermediate buffer. A buffer can persistently store messages in a stream or queue until a receiver processes them. This helps you control how fast messages are processed, which can protect the load on downstream resources.

Amazon Kinesis Data Streams allows you to collect and process large streams of data records in real time, and can act as a buffer. Streams consist of a set of shards that contain a sequence of data records. When using Lambda to process records, it processes one batch of records at a time from each shard.

Kinesis Data Streams control concurrency at the shard level, meaning that a single shard has a single concurrent invocation. This can reduce downstream calls to non-scalable resources such as a traditional database. Kinesis Data Streams also support batch windows up to 5 minutes and batch record sizes. These can also be used to control how frequent invocations can occur.

To learn how to manage scaling with Kinesis, see the documentation. To learn more how Lambda works with Kinesis, read the blog series “Building serverless applications with streaming data”.

Lambda and Kinesis shards

Lambda and Kinesis shards

Amazon Simple Queue Service (SQS) is a fully managed serverless message queuing service that enables you to decouple and scale microservices. You can offload tasks from one component of your application by sending them to a queue and processing them asynchronously.

SQS can act as a buffer, using a Lambda function to process the messages. Lambda polls the queue and invokes your Lambda function synchronously with an event that contains queue messages. Lambda reads messages in batches and invokes your function once for each batch. When your function successfully processes a batch, Lambda deletes its messages from the queue.

You can protect downstream resources using the Lambda concurrency controls. This limits the number of concurrent Lambda functions that pull messages off the queue. The messages persist in the queue until Lambda can process them. For more information see, “Using AWS Lambda with Amazon SQS

Lambda and SQS

Lambda and SQS

Conclusion

Regulating inbound requests helps you adapt different scaling mechanisms based on customer demand. You can achieve better throughput for your workloads and make them more reliable by controlling requests to a rate that your workload can support.

In this post, I cover using, analyzing, and enforcing API quotas using usage plans and API keys. I show mechanisms to protect non-scalable resources such as using RDS Proxy to protect downstream databases. I show how to control the number of Lambda invocations using concurrency controls to protect downstream resources. I explain how you can use streams and queues as an intermediate buffer to store messages persistently until a receiver processes them.

In the next post in the series, I cover the second reliability question from the Well-Architected Serverless Lens, building resiliency into serverless applications.

For more serverless learning resources, visit Serverless Land.

Synchronize and control your Amazon Redshift clusters maintenance windows

Post Syndicated from Ahmed Gamaleldin original https://aws.amazon.com/blogs/big-data/synchronize-and-control-your-amazon-redshift-clusters-maintenance-windows/

Amazon Redshift is a data warehouse that can expand to exabyte-scale. Today, tens of thousands of AWS customers (including NTT DOCOMO, Finra, and Johnson & Johnson) use Amazon Redshift to run mission-critical business intelligence dashboards, analyze real-time streaming data, and run predictive analytics jobs.

Amazon Redshift powers analytical workloads for Fortune 500 companies, startups, and everything in between. With the constant increase in generated data, Amazon Redshift customers continue to achieve successes in delivering better service to their end-users, improving their products, and running an efficient and effective business. Availability, therefore, is key in continuing to drive customer success, and AWS will use commercially reasonable efforts to make Amazon Redshift available with a Monthly Uptime Percentage for each multi-node cluster, during any monthly billing cycle, of at least 99.9% (our “Service Commitment”).

In this post, we present a solution to help you provide a predictable and repeatable experience to your Amazon Redshift end-users by taking control of recurring Amazon Redshift maintenance windows.

Amazon Redshift maintenance windows

Amazon Redshift periodically performs maintenance to apply fixes, enhancements, and new features to your cluster. This type of maintenance occurs during a 30-minute maintenance window set by default per Region from an 8-hour block on a random day of the week. You should change the scheduled maintenance window according to your business needs by modifying the cluster, either programmatically or by using the Amazon Redshift console. The window must be at least 30 minutes and not longer than 24 hours. For more information, see Managing clusters using the console.

If a maintenance event is scheduled for a given week, it starts during the assigned 30-minute maintenance window. While Amazon Redshift performs maintenance, it terminates any queries or other operations that are in progress. If there are no maintenance tasks to perform during the scheduled maintenance window, your cluster continues to operate normally until the next scheduled maintenance window. Amazon Redshift uses Amazon Simple Notification Service (Amazon SNS) to send notifications of Amazon Redshift events. You enable notifications by creating an Amazon Redshift event subscription. You can create an Amazon Redshift event notification subscription so you can be notified when an event occurs for a given cluster.

When an Amazon Redshift cluster is scheduled for maintenance, you receive an Amazon Redshift “Pending” event, as described in the following table.

Amazon Redshift category Event ID Event severity Description
Pending REDSHIFT-EVENT-2025 INFO Your database for cluster <cluster name> will be updated between <start time> and <end time>. Your cluster will not be accessible. Plan accordingly.
Pending REDSHIFT-EVENT-2026 INFO Your cluster <cluster name> will be updated between <start time> and <end time>. Your cluster will not be accessible. Plan accordingly.

Amazon Redshift also gives you the option to reschedule your cluster’s maintenance window by deferring your upcoming maintenance by up to 45 days. This option is particularly helpful if you want to maximize your cluster uptime by deferring a future maintenance window. For example, if your cluster’s maintenance window is set to Wednesday 8:30–9:00 UTC and you need to have nonstop access to your cluster for the next 2 weeks, you can defer maintenance to a date 2 weeks from now. We don’t perform any maintenance on your cluster when you have specified a deferment.

Deferring a maintenance window doesn’t apply to mandatory Amazon Redshift updates, such as vital security patches. Scheduled maintenance is different from Amazon Redshift mandatory maintenance. If Amazon Redshift needs to update hardware or make other mandatory updates during your period of deferment, we notify you and make the required changes. Your cluster isn’t available during these updates and such maintenance can’t be deferred. If a hardware replacement is required, you receive an event notification through the AWS Management Console and your SNS subscription as a “Pending” item, as shown in the following table.

Amazon Redshift category Event ID Event severity Description
Pending REDSHIFT-EVENT-3601 INFO A node on your cluster <cluster name> will be replaced between <start time> and <end time>. You can’t defer this maintenance. Plan accordingly.
Pending REDSHIFT-EVENT-3602 INFO A node on your cluster <cluster name> is scheduled to be replaced between <start time> and <end time>. Your cluster will not be accessible. Plan accordingly.

Challenge

As the number of the Amazon Redshift clusters you manage for an analytics application grows, the end-user experience becomes highly dependent on recurring maintenance. This means that you want to make sure maintenance windows across all clusters happen at the same time and fall on the same day each month. You want to avoid a situation in which, for example, your five Amazon Redshift clusters are each updated on a different day or week. Ultimately, you want to give your Amazon Redshift end-users an uninterrupted number of days where the clusters aren’t subject to any scheduled maintenance. This gives you the opportunity to announce a scheduled maintenance to your users well ahead of the maintenance date.

Amazon Redshift clusters are scheduled for maintenance depending on several factors, including when a cluster was created and its Region. For example, you may have two clusters on the same Amazon Redshift version that are scheduled for different maintenance windows. Regions implement the Amazon Redshift latest versions and patches at different times. A cluster running in us-east-1 might be scheduled for the same maintenance 1 week before another cluster in eu-west-1. This makes it harder for you to provide your end-users with a predictable maintenance schedule.

To solve this issue, you typically need to frequently check and synchronize the maintenance windows across all your clusters to a specific time, for example sat:06:00-sat:06:30. Additionally, you want to avoid having your clusters scheduled for maintenance at different intervals. For that, you need to defer maintenance across all your clusters to fall on the same exact day. For example, you can defer all maintenance across all clusters to happen 1 month from now regardless of when the cluster was last updated. This way you know that your clusters aren’t scheduled for maintenance for the next 30 days. This gives you enough time to announce the maintenance schedule to your Amazon Redshift users.

Solution overview

Having one day per month when Amazon Redshift scheduled maintenance occurs across all your clusters provides your users with a seamless experience. It gives you control and predictability over when clusters aren’t available. You can announce this maintenance window ahead of time to avoid sudden interruptions.

The following solution deploys an AWS Lambda function (RedshiftMaintenanceSynchronizer) to your AWS account. The function runs on a schedule configurable through an AWS CloudFormation template parameter frequency to run every 6, 12, or 24 hours. This function synchronizes maintenance schedules across all your Amazon Redshift clusters to happen at the same time on the same day. It also gives you the option to defer all future maintenance windows across all clusters by a number of days (deferment days) for up to 45 days. This enables you to provide your users with an uninterrupted number of days when your clusters aren’t subject to maintenance.

We use the following input parameters:

  • Deferment days – The number of days to defer all future scheduled maintenance windows. Amazon Redshift can defer maintenance windows by up to 45 days. The solution adds this number to the date of the last successfully completed maintenance across any of your clusters. The resulting date is the new maintenance date for all your clusters.
  • Frequency – The frequency to run this solution. You can configure it to run every 6, 12, or 24 hours.
  • Day – The preferred day of the week to schedule maintenance windows.
  • Hour – The preferred hour of the day to schedule maintenance windows (24-hour format).
  • Minute – The preferred minute of the hour to schedule maintenance windows.

The Lambda function performs the following steps:

  1. Lists all your Amazon Redshift clusters in the Region.
  2. Updates the maintenance window for all clusters to the same value of the day/hour/minute input parameters from the CloudFormation template.
  3. Checks for the last successfully completed maintenance across all clusters.
  4. Calculates the deferment maintenance date by adding the deferment input parameter to the date of the last successfully completed maintenance. For example, if the deferment parameter is 30 days and the last successful maintenance window completed on July 1, 2020, then the next deferment maintenance date is July 31, 2020.
  5. Defers the next maintenance window across all clusters to the deferment date calculated in the previous step.

Launch the solution

To get started, deploy the cloudFormation template to your AWS account.

  1. For Stack name, enter a name for your stack for easy reference.
  2. For Day, choose the day of week for the maintenance window to occur.
  3. For Hour, choose the hour for the window to start.
  4. For Minute, choose the minute within the hour for the window to start.

Your window should be a time with the least cluster activity and during off-peak work hours.

  1. For Deferment Days, choose the number of days to defer all future scheduled maintenance windows.
  2. For Solution Run Frequency, choose the frequency of 6, 12, or 24 hours.

cloudFormation Template

After the template has successfully deployed, the following resources are available:

  • The RedshiftMaintenanceSync Lambda function. This is a Python 3.8 Lambda function that syncs and defers the maintenance windows across all your Amazon Redshift clusters.

lamda_console

  • The RedshiftMaintenanceSyncEventRule Amazon CloudWatch event rule. This rule triggers on a schedule based on the Frequency input parameter. It triggers the RedshiftMaintenanceSync Lambda function to run the solution logic.

When the Lambda function starts and detects an already available deferment on any of your clusters, it doesn’t attempt to modify the existing deferment, and exits instead.

The solution logs any deferment it performs on any cluster in the associated CloudWatch log group.

Synchronize and defer maintenance windows

To demonstrate this solution, I have two Amazon Redshift clusters with different preferred maintenance windows and scheduled intervals.

Cluster A (see the following screenshot) has a preferred maintenance window set to Friday at 4:30–5:00 PM. It’s scheduled for maintenance in 2 days.

Cluster B has a preferred maintenance window set to Tuesday at 9:45–10:15 AM. It’s scheduled for maintenance in 6 days.

This means that my Amazon Redshift users have a 30-minute interruption twice in the next 2 and 6 days. Also, these interruptions happen at completely different times.

Let’s launch the solution and see how the cluster maintenance windows and scheduling intervals change.

The Lambda function does the following every time it runs:

  1. Lists all the clusters.
  2. Checks if any of the clusters have a deferment enabled and exits if it finds any.
  3. Syncs all preferred maintenance windows across all clusters to fall on the same time and day of week.
  4. Checks for the latest successfully completed maintenance date.
  5. Adds the deferment days to the last maintenance date. This becomes the new deferment date.
  6. Applies the new deferment date to all clusters.

Cluster A’s maintenance window was synced to the input parameters I passed to the CloudFormation template. Additionally, the next maintenance window was deferred until June 21, 2021, 8:06 AM (UTC +02:00).

Cluster B’s maintenance window is also synced to the same value from Cluster A, and the next maintenance window was deferred to the same exact day as Cluster A: June 21, 2021, 8:06 AM (UTC +02:00).

Finally, let’s check the CloudWatch log group to understand what the solution did.

Now both clusters have the same maintenance window and next scheduled maintenance, which is a month from now. In a production scenario, this gives you enough lead time to announce the maintenance window to your Amazon Redshift end-users and provide them with the exact day and time when clusters aren’t available.

Summary

This solution can help you provide a predictable and repeatable experience to your Amazon Redshift end-users by taking control of recurring Amazon Redshift maintenance windows. It enables you to provide your users with an uninterrupted number of days where clusters are always available—barring any scheduled mandatory upgrades. Click here to get started with Amazon Redshift today.


About the Author

Ahmed_Gamaleldin

Ahmed Gamaleldin is a Senior Technical Account Manager (TAM) at Amazon Web Services. Ahmed helps customers run optimized workloads on AWS and make the best out of their cloud journey.

Building well-architected serverless applications: Regulating inbound request rates – part 1

Post Syndicated from Julian Wood original https://aws.amazon.com/blogs/compute/building-well-architected-serverless-applications-regulating-inbound-request-rates-part-1/

This series of blog posts uses the AWS Well-Architected Tool with the Serverless Lens to help customers build and operate applications using best practices. In each post, I address the serverless-specific questions identified by the Serverless Lens along with the recommended best practices. See the introduction post for a table of contents and explanation of the example application.

Reliability question REL1: How do you regulate inbound request rates?

Defining, analyzing, and enforcing inbound request rates helps achieve better throughput. Regulation helps you adapt different scaling mechanisms based on customer demand. By regulating inbound request rates, you can achieve better throughput, and adapt client request submissions to a request rate that your workload can support.

Required practice: Control inbound request rates using throttling

Throttle inbound request rates using steady-rate and burst rate requests

Throttling requests limits the number of requests a client can make during a certain period of time. Throttling allows you to control your API traffic. This helps your backend services maintain their performance and availability levels by limiting the number of requests to actual system throughput.

To prevent your API from being overwhelmed by too many requests, Amazon API Gateway throttles requests to your API. These limits are applied across all clients using the token bucket algorithm. API Gateway sets a limit on a steady-state rate and a burst of request submissions. The algorithm is based on an analogy of filling and emptying a bucket of tokens representing the number of available requests that can be processed.

Each API request removes a token from the bucket. The throttle rate then determines how many requests are allowed per second. The throttle burst determines how many concurrent requests are allowed. I explain the token bucket algorithm in more detail in “Building well-architected serverless applications: Controlling serverless API access – part 2

Token bucket algorithm

Token bucket algorithm

API Gateway limits the steady-state rate and burst requests per second. These are shared across all APIs per Region in an account. For further information on account-level throttling per Region, see the documentation. You can request account-level rate limit increases using the AWS Support Center. For more information, see Amazon API Gateway quotas and important notes.

You can configure your own throttling levels, within the account and Region limits to improve overall performance across all APIs in your account. This restricts the overall request submissions so that they don’t exceed the account-level throttling limits.

You can also configure per-client throttling limits. Usage plans restrict client request submissions to within specified request rates and quotas. These are applied to clients using API keys that are associated with your usage policy as a client identifier. You can add throttling levels per API route, stage, or method that are applied in a specific order.

For more information on API Gateway throttling, see the AWS re:Invent presentation “I didn’t know Amazon API Gateway could do that”.

API Gateway throttling

API Gateway throttling

You can also throttle requests by introducing a buffering layer using Amazon Kinesis Data Stream or Amazon SQS. Kinesis can limit the number of requests at the shard level while SQS can limit at the consumer level. For more information on using SQS as a buffer with Amazon Simple Notification Service (SNS), read “How To: Use SNS and SQS to Distribute and Throttle Events”.

Identify steady-rate and burst rate requests that your workload can sustain at any point in time before performance degraded

Load testing your serverless application allows you to monitor the performance of an application before it is deployed to production. Serverless applications can be simpler to load test, thanks to the automatic scaling built into many of the services. During a load test, you can identify quotas that may act as a limiting factor for the traffic you expect and take action.

Perform load testing for a sustained period of time. Gradually increase the traffic to your API to determine your steady-state rate of requests. Also use a burst strategy with no ramp up to determine the burst rates that your workload can serve without errors or performance degradation. There are a number of AWS Marketplace and AWS Partner Network (APN) solutions available for performance testing, Gatling Frontline, BlazeMeter, and Apica.

In the serverless airline example used in this series, you can run a performance test suite using Gatling, an open source tool.

To deploy the test suite, follow the instructions in the GitHub repository perf-tests directory. Uncomment the deploy.perftest line in the repository Makefile.

Perf-test makefile

Perf-test makefile

Once the file is pushed to GitHub, AWS Amplify Console rebuilds the application, and deploys an AWS CloudFormation stack. You can run the load tests locally, or use an AWS Step Functions state machine to run the setup and Gatling load test simulation.

Performance test using Step Functions

Performance test using Step Functions

The Gatling simulation script uses constantUsersPerSec and rampUsersPerSec to add users for a number of test scenarios. You can use the test to simulate load on the application. Once the tests run, it generates a downloadable report.

Gatling performance results

Gatling performance results

Artillery Community Edition is another open-source tool for testing serverless APIs. You configure the number of requests per second and overall test duration, and it uses a headless Chromium browser to run its test flows. For Artillery, the maximum number of concurrent tests is constrained by your local computing resources and network. To achieve higher throughput, you can use Serverless Artillery, which runs the Artillery package on Lambda functions. As a result, this tool can scale up to a significantly higher number of tests.

For more information on how to use Artillery, see “Load testing a web application’s serverless backend”. This runs tests against APIs in a demo application. For example, one of the tests fetches 50,000 questions per hour. This calls an API Gateway endpoint and tests whether the AWS Lambda function, which queries an Amazon DynamoDB table, can handle the load.

Artillery performance test

Artillery performance test

This is a synchronous API so the performance directly impacts the user’s experience of the application. This test shows that the median response time is 165 ms with a p95 time of 201 ms.

Performance test API results

Performance test API results

Another consideration for API load testing is whether the authentication and authorization service can handle the load. For more information on load testing Amazon Cognito and API Gateway using Step Functions, see “Using serverless to load test Amazon API Gateway with authorization”.

API load testing with authentication and authorization

API load testing with authentication and authorization

Conclusion

Regulating inbound requests helps you adapt different scaling mechanisms based on customer demand. You can achieve better throughput for your workloads and make them more reliable by controlling requests to a rate that your workload can support.

In this post, I cover controlling inbound request rates using throttling. I show how to use throttling to control steady-rate and burst rate requests. I show some solutions for performance testing to identify the request rates that your workload can sustain before performance degradation.

This well-architected question will be continued where I look at using, analyzing, and enforcing API quotas. I cover mechanisms to protect non-scalable resources.

For more serverless learning resources, visit Serverless Land.