Tag Archives: Customer Solutions

How Karrot built a feature platform on AWS, Part 1: Motivation and feature serving

Post Syndicated from Hyeonho Kim original https://aws.amazon.com/blogs/architecture/how-karrot-built-a-feature-platform-on-aws-part-1-motivation-and-feature-serving/

This post is co-written with Hyeonho Kim, Jinhyeong Seo and Minjae Kwon from Karrot.

Karrot is Korea’s leading local community and a service centered on all possible connections in the neighborhood. Beyond simple flea markets, it strengthens connections between neighbors, local stores, and public institutions, and creates a warm and active neighborhood as its core value.

Karrot uses a recommendation system to provide users with connections that match their interests and neighborhoods, and to provide personalized experiences. In particular, you can check customized content on the home screen of the Karrot application. Personalized content is continuously updated by analyzing the user’s activity patterns without having to set a special interest category. The core of the feed is to provide new and interesting content, and Karrot is constantly working to improve user satisfaction for this purpose. Karrot actively uses a recommendation system to provide personalized and recommended content. In this system, the feature platform plays a key role along with the machine learning (ML) recommendation model. The feature platform acts as a data store that stores and serves data necessary for the ML recommendation model, such as the user’s behavior history and article information.

This two-part series starts by presenting our motivation, our requirements, and the solution architecture, focusing on feature serving. Part 2 covers the process of collecting features in real-time and batch ingestion into an online store, and the technical approaches for stable operation.

Background of the feature platform at Karrot

Karrot recognized the need for a feature platform in early 2021, about 2 years after implementing a recommendation system in their application. At that time, Karrot was achieving significant growth in various metrics through active usage of the recommendation system. By showing personalized feeds to each user beyond chronological feeds, they observed a more than 30% increase in click-through rates and higher user satisfaction. As the recommendation system’s impact continued to grow, the ML team naturally faced the challenge of advancing the system.

In ML-based systems, various high-quality input data (clicks, conversion actions, and so on) is considered a crucial element. These input data are typically called features. At Karrot, data including user behavior logs, action logs, and status values are collectively referred to as user features, and logs related to articles are called article features.

To improve the accuracy of personalized recommendations, various types of features are needed. A system that can efficiently manage these features and quickly deliver them to ML recommendation models is essential. Here, serving means the process of providing real-time data needed when the recommendation system suggests personalized content to users. However, the feature management approach in the existing recommendation system had some limitations, with the following key issues:

  • Dependency on flea market server – Because the initial recommendation system existed as an internal library on the flea market server, the source code of the web application had to be changed whenever the recommendation logic was modified or a feature was added. This reduced the flexibility of deployment and made it difficult to optimize resources.
  • Limited scalability of recommendation logic and features – The initial recommendation system directly depended on the flea market database and only considered flea market articles. This made it impossible to expand to new article types like local community, local jobs, and advertisements, which are managed by different data sources. Additionally, feature-related code was hardcoded, making it difficult to explore, add, or modify features.
  • Lack of feature data source reliability – Although features were retrieved from various repositories such as Amazon Simple Storage Service (Amazon S3), Amazon ElastiCache, and Amazon Aurora, the reliability of data quality was low due to the lack of a consistent schema and collection pipeline. This was a major limitation in securing the latest features and consistency.

The following diagram illustrates the initial recommendation system backend structure.
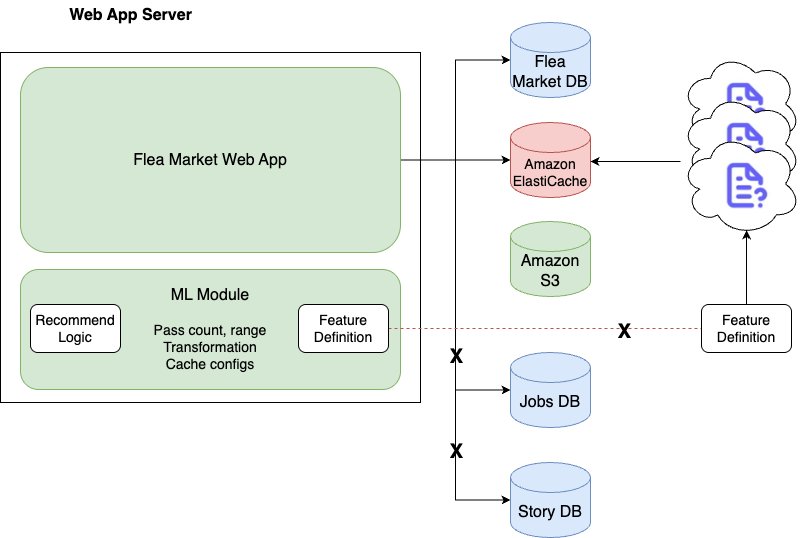
To solve these problems, we needed a new central system that could efficiently support feature management, real-time ingestion, and serving, and so we started the feature platform project.

Requirements of the feature platform

The following functional requirements were organized by separating the feature platform into an independent service:

  • Record and rapidly serve the top N most recent actions performed by users. Allow parameterization of both the top N value and the lookup period.
  • Support user-specific features such as notification keywords in addition to action features.
  • Process features from various article types beyond just flea market articles.
  • Handle arbitrary data types for all features, including primitive types, lists, sets, and maps.
  • Provide real-time updates for both action features and user characteristic features.
  • Provide flexibility in feature lists, counts, and lookup periods for each request.

To implement these functional requirements, a new platform was necessary. This platform needed three core capabilities: real-time ingestion of various feature types, storage with consistent schema, and quick response to diverse query requests. Although these requirements initially seemed ambiguous, designing a generalized structure enabled efficient configuration of data ingestion pipelines, storage methods, and serving schemas, leading to clearer development objectives.

In addition to functional requirements, the technical requirements included:

  • Serving traffic: 1,500 or more requests per second (RPS)
  • Ingestion traffic: 400 or more writes per second (WPS)
  • Top N values: 30–50
  • Single feature size: Up to 8 KB
  • Total number of features: Over 3 billion or more

At the time, the variety and number of features in use were limited, and the recommendation models were simple, resulting in modest technical requirements. However, considering the rapid growth rate, a significant increase in system requirements was anticipated. Based on this prediction, higher targets were set beyond the initial requirements. As of February 2025, the serving and ingestion traffic has increased by about 90 times compared to the initial requirements, and the total number of features has increased by hundreds of times. The ability to handle this rapid growth was made possible by the highly scalable architecture of the feature platform, which we discuss in the following sections.

Solution overview

The following diagram illustrates the architecture of the feature platform.
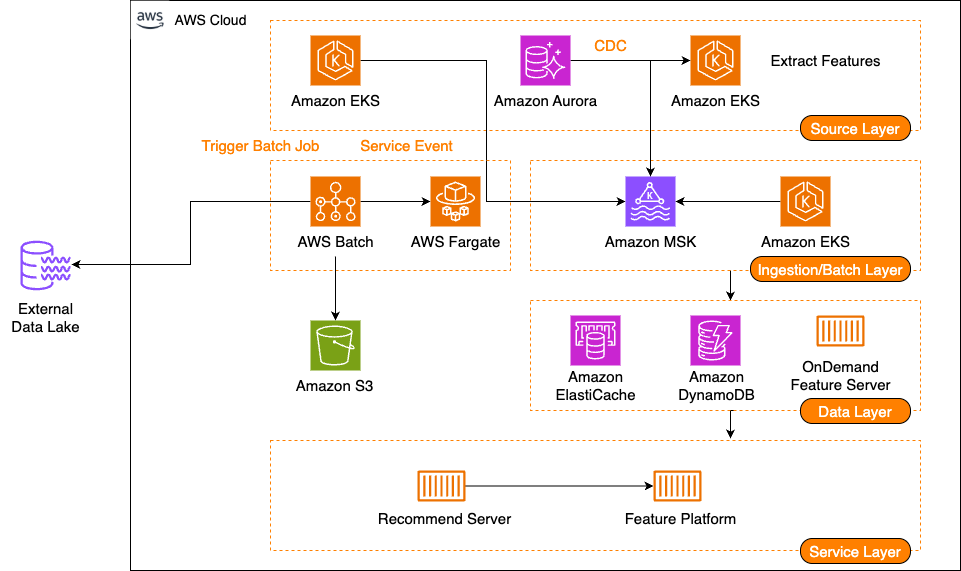
The feature platform consists of three main components: feature serving, a stream ingestion pipeline, and a batch ingestion pipeline.

Part 1 of this series will cover feature serving. Feature serving is the core function of receiving client requests and providing the required features. Karrot designed this system with four major components:

  • Server – A server that receives and processes feature serving requests, and is a pod located on Amazon Elastic Kubernetes Service (Amazon EKS)
  • Remote cache – A remote cache layer shared by servers, and uses ElastiCache
  • Database – A persistence layer that stores features, and uses Amazon DynamoDB
  • On-demand feature server – A server that serves features that can’t be stored in the remote cache and database due to compliance issues, or that require real-time calculations every time

From a data store perspective, feature serving should serve high-cardinality features with low latency at scale. Karrot introduced multi-level cache and subdivided serving strategies according to the characteristics of the features:

  • Local cache (tier 1 cache) – An in-memory store located within the server, suitable for cases where the data size is small and is frequently accessed or requires fast response times
  • Remote cache (tier 2 cache) – Suitable for cases where the data size is medium and is frequently accessed
  • Database (tier 3 cache) – Suitable for cases where the data size is large and is not frequently accessed or is less sensitive to response times

Schema design

The feature platform stores multiple features together using the concept of feature groups, such as column families. All feature groups are defined through the feature group schema, called feature group specifications, and each feature group specification defines the name of the feature group, required features, and so on.

Based on this concept, the key design is defined as follows:

  • Partition key: <feature_group_name>#<feature_group_id>
  • Sort key: <feature_group_timestamp> or a string representing null

To illustrate how this works in practice, let’s explore an example of a feature group representing recently clicked flea market articles by user 1234. Consider the following scenario:

  • Feature group name: recent_user_clicked_fleaMarketArticles
  • User ID: 1234
  • Click timestamp: 987654321
  • Features in the feature group:
    • Clicked article ID: a
    • User session ID: 1111

In this example, the keys and feature group are created as follows:

  • Partition key: recent_user_clicked_fleaMarketArticles#1234
  • Sort Key: 987654321
  • Value: {"0": "a", "1": "1111"}

Features defined in the feature group specification maintain a fixed order, using this ordering like an enum when saving the feature group.

Feature serving read/write flow

The feature platform uses a multi-level cache and database for feature serving, as shown in the following diagram.
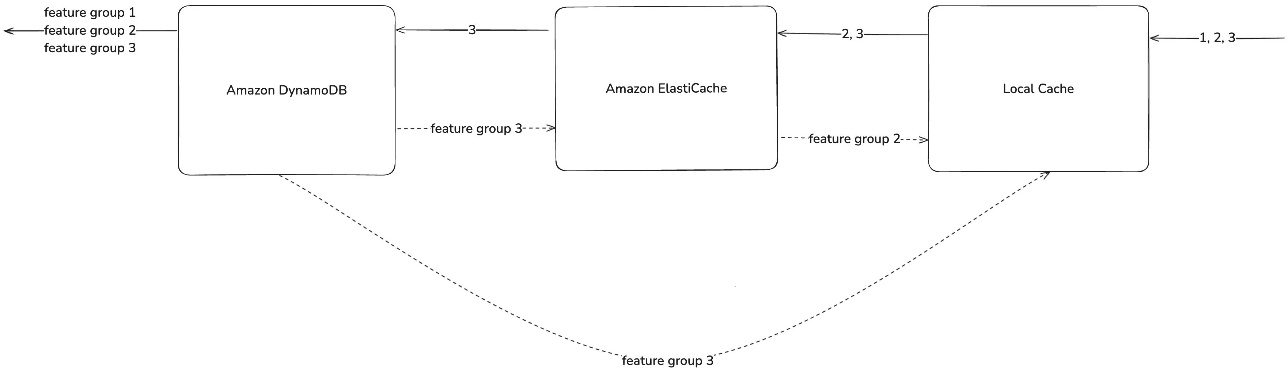
To illustrate this process, let’s examine how the system retrieves feature groups 1, 2, and 3 from flea market articles. The read flow (solid lines in the preceding diagram) demonstrates data access optimization using a multi-level cache strategy:

  1. When a query request comes in, first check the local cache.
  2. Data not in the local cache is searched in ElastiCache.
  3. Data not in ElastiCache is searched in DynamoDB.
  4. The feature groups found at each stage are collected and returned as the final response.

The write flow (dotted lines in the preceding diagram) consists of the following steps:

  1. Feature groups that have cache misses are stored in each cache level.
  2. Data not found in the local cache but found in the remote cache or database is stored in the upper-level cache.
    1. Data found in ElastiCache is stored in the local cache.
    2. Data found in DynamoDB is stored in both ElastiCache and the local cache.
  3. Cache write operations are performed asynchronously in the background.

This approach presents a strategy to maintain data consistency and improve future access time in the multi-level cache structure. In an ideal situation, serving works well without any problems with just the preceding flow. However, the reality was not like that. The problems experienced included cache misses, consistency, and penetration problems:

  • Cache miss problem – Frequent cache misses slow down the response time and put a burden on the next level cache or database. Karrot uses the Probabilistic Early Expirations (PEE) technique to proactively refresh data that is likely to be retrieved again in the future, thereby maintaining low latency and mitigating cache stampede.
  • Cache consistency problem – If the Time-To-Live (TTL) of a cache is set incorrectly, it can affect recommendation quality or reduce system efficiency. Karrot sets soft and hard TTL separately, and sometimes uses a write-through caching strategy together to synchronize cache and database to alleviate consistency problems. In addition, jitter is added to spread out the TTL deletion time to alleviate the cache stampede of feature groups written at similar times.
  • Cache penetration problem – Continuous queries for non-existent feature groups can lead to DynamoDB queries, resulting in increased costs and response times. The platform resolves this through negative caching, storing information about non-existent feature groups to reduce unnecessary database queries. Additionally, the system monitors the ratio of missing feature groups in DynamoDB, negative cache hit rates, and potential consistency problems.

Future improvements for feature serving

Karrot is considering the following future improvements to their feature serving solution:

  • Large data caching – Recently, the demand for storing large data features has been increasing. This is because as Karrot grows, the number of features also increases. Also, as the demand for embeddings increases along with the rapid growth of large language models (LLMs), the size of data to be stored has increased. Accordingly, we are reviewing more efficient serving by using an embedded database.
  • Efficient use of cache memory – Even if an efficient TTL value is set initially, the efficiency tends to decrease as the user’s usage pattern changes and the model is changed. Also, as more feature groups are defined, monitoring becomes more difficult. It should be straightforward to find the optimal TTL value for the cache based on data. We are considering a method to efficiently use memory while maintaining a high recommendation quality through cache hit rate and feature group loss prevention. Should we cache a feature group that is only retrieved once? What about a feature group that is retrieved twice? The current feature platform attempts caching even if a cache miss occurs only one time. We believe that all feature groups that have cache misses are worth caching. This naturally increases the inefficiency of caching. An advanced policy is needed to determine and cache feature groups that are worth caching based on various data. This will increase the efficiency of cache usage.
  • Multi-level cache optimization – Currently, the feature platform has a multi-level cache structure, and the complexity will increase if an embedded database is added in the future. Therefore, it is necessary to find and set the optimal settings by considering different cache levels. In the future, we will try to maximize efficiency by considering different levels of cache settings.

Conclusion

In this post, we examined how Karrot built their feature platform, focusing on feature serving capabilities. As of February 2025, the platform reliably handles over 100,000 RPS with P99 latency under 30 milliseconds, providing stable recommendation services through a scalable architecture that efficiently manages traffic increases.

Part 2 will explore how features are generated using consistent feature schemas and ingestion pipelines through the feature platform.
About the authors

How Karrot built a feature platform on AWS, Part 2: Feature ingestion

Post Syndicated from Hyeonho Kim original https://aws.amazon.com/blogs/architecture/how-karrot-built-a-feature-platform-on-aws-part-2-feature-ingestion/

This post is co-written with Hyeonho Kim, Jinhyeong Seo and Minjae Kwon from Karrot.

In Part 1 of this series, we discussed how Karrot developed a new feature platform, which consists of three main components: feature serving, a stream ingestion pipeline, and a batch ingestion pipeline. We discussed their requirements, the solution architecture, and feature serving using a multi-level cache. In this post, we share the stream and batch ingestion pipelines and how they ingest data into an online store from various event sources.

Solution overview

The following diagram illustrates the solution architecture, as introduced in Part 1.

Stream ingestion

Stream ingestion is the process of collecting data from various event sources in real time, transforming it into features, and storing them. It consists of two main components:

Consumers handle not only the source events, but also re-published events. When loading features, they are performed by considering different strategies, such as write-through and write-around, and are loaded in detail considering cardinality, data size, and access patterns.

Most features are generated based on two types of events: events that occur due to real-time user actions, and asynchronous events that occur due to state changes in user and article data. These events and features have an M:N relationship, meaning one event can be the source of multiple features, and one feature can be generated based on multiple events.

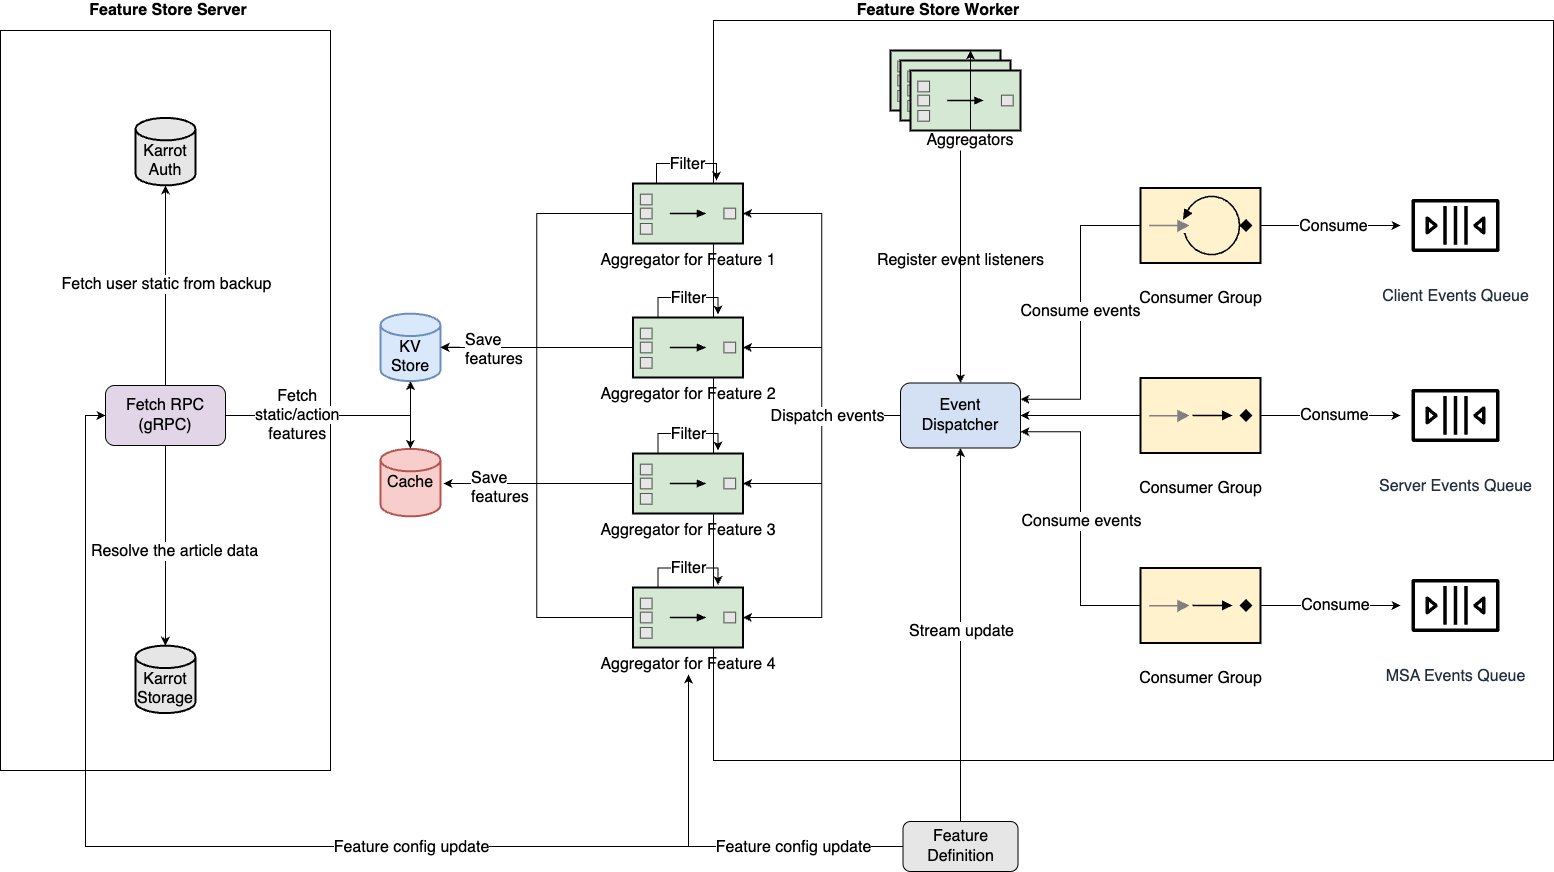
The following diagram illustrates the architecture of the stream ingestion pipeline.

To efficiently handle M:N relationships, a structure was needed to receive events and distribute them to multiple feature processing logics. Two core components were designed for this purpose:

  • Dispatcher – Receives events from multiple consumer groups and propagates them to relevant feature processing logic
  • Aggregator – Processes events received from the dispatcher into actual features

This stream processing pipeline enables real-time feature generation and storage.

Message broker optimization: Fast at-least-once delivery

The feature platform processes up to 25,000 events per second, including user behavior log events, at high speed. However, when worker traffic surges, event processing failures or infrastructure failures occasionally cause event loss. To solve this problem, the existing automatic commit mode was changed to manual commit in Amazon MSK. This allows events to be committed only when they are definitely processed, and failed events are sent to a separate retry topic and postprocessed through a dedicated worker.

However, processing large volumes of events synchronously with manual commit resulted in approximately 10 times slower processing speed and increased latency. Although consumer group resources were available, simply increasing the number of partitions in Amazon MSK wasn’t a solution due to team-specific partitioning permissions. The platform designed parallel processing within single partitions and implemented a custom consumer supporting retry functionality. The core of the implementation is to read as many messages from the partition as the fetch size at a time and process them by spawning worker threads in parallel for each message. When processing is complete, the offsets of successful messages are sorted and a manual commit is performed for the largest offset, and failed messages are republished to the retry topic. This enables parallel processing even in a single partition, and the concurrency can be controlled automatically. As a result, the event processing speed is faster than the existing automatic commit method, and it is stably processed without delay even when the number of events increases.

Stream processing

The stream ingestion pipeline performs only simple extract, transform, and load (ETL) logic and validation. There were already many requirements for complex stream processing in the feature platform, and a separate service was created to accommodate them. The feature platform didn’t address these requirements for the following reasons:

  • The purpose of stream ingestion in the feature platform is to collect and store features in real time, whereas the main purpose of stream processing is to process data.
  • Not all features require complex processing. We decided that it wasn’t appropriate to make the entire stream collection process complicated for some features.
  • The result data of stream processing could be used outside the feature platform, and there were requirements to consider this. Therefore, creating a separate service was more suitable for Karrot’s situation.
  • Additionally, some source data didn’t exist in AWS, which could have resulted in significant additional costs if everything was handled within the feature platform.

Although it’s a separate service from the feature platform, the following is a brief introduction to how the feature platform uses data through stream processing:

  • Various content embedding cases – We perform stream processing using models, and use various contents (articles, images, and so on) as input values to pre-trained models to create embeddings. These embeddings are stored in the feature platform and used as features during recommendation to improve recommendation quality.
  • Rich feature generation cases – Some of the processed data is further processed using large language models (LLMs) for use as features. One example is predicting which category a specific second-hand product belongs to and using this prediction value as a feature.

Batch ingestion

Batch ingestion is responsible for processing and storing large amounts of data into features in batches. This is divided into a cron job that runs periodically and a backfill job that loads large amounts of data one time.

For this purpose, AWS Batch based on AWS Fargate is used. AWS Batch jobs running on Fargate are provisioned independently from the other environments, enabling safe large-scale processing. For example, even if more than 1,000 servers or 10,000 vCPUs are used for backfilling large amounts of data, they are operated separately from the other services and can be operated efficiently with a usage-based billing method.

When adding new features, batch loading of past data or periodic loading of large amounts of data is one of the core functions of the feature platform. The main requirements considered in the design are as follows:

  • It must be able to process large amounts of data.
  • It must be able to start at the time desired by the user and finish the work within an appropriate time.
  • It must have low operating costs. It should be a managed service if possible, and it’s better if there is less additional work or specific domain knowledge for operation. Also, it should reuse existing service code as much as possible.
  • Complex operations for features or the configuration of Directed Acyclic Graphs (DAGs) are not necessarily required.

There were several options to choose from, such as Apache Airflow, but AWS Batch was chosen to avoid over-engineering considering the operating cost according to the current requirements.

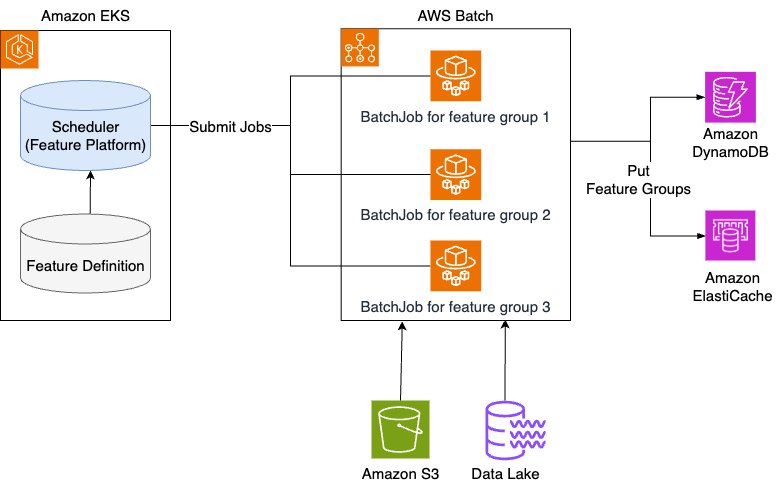
The following diagram illustrates the architecture of the batch ingestion pipeline.

The key components are as follows:

  • Scheduler – It extracts the targets that need to perform the batch jobs according to the specifications such as FeatureGroupSpec and IngestionSpec written by the user on the feature platform, and registers the corresponding job specifications to an AWS Batch job (submit job).
  • AWS Batch – The jobs submitted by the scheduler are executed using the preconfigured job queue and computing environment. In the case of AWS Batch, you can configure a Fargate environment separately from the other production services, so that even if you provision large-scale resources and perform tasks, you can perform tasks stably without affecting the other production services.

Future improvements for batch ingestion

The current configuration works well and reliably, but there are some areas for improvement:

  • No DAG support – The initial feature platform performed relatively simple tasks, such as parsing batch data sources, converting them to the feature schema, and storing them. However, as the platform became more advanced, more complex operations became necessary, and therefore support for DAG configurations that can process features by sequentially performing various dependent jobs became necessary.
  • Manual configuration for parallel processing – Currently, when processing large-scale data in parallel, the worker must manually estimate the number of jobs to be processed in parallel and provide it in the specification, and the scheduler performs a submit job in parallel based on this. This method is based purely on experience, and in order for the system to become more advanced, the system must be able to automatically abstract and optimize the appropriate level of parallel processing.
  • Limited AWS Batch monitoring usability – AWS Batch monitoring has some limitations, such as jobs don’t transition from Runnable to Running state, a lack of appropriate notification systems for such cases, and the inability to directly check failed jobs through URL parameters when receiving alerts. These aspects should be improved from an operational convenience perspective.

Results

As of February 2025, Karrot has addressed the major problems mentioned in the early stages of feature platform development:

  • Decoupling recommendation logic from flea market server – The recommendation system now uses the feature platform across more than 10 different recommendation spaces and services.
  • Securing scalability of features used in recommendation logic – With more than 1,000 high-quality and rich features acquired from various services such as flea market, advertisements, local jobs, and real estate, we are contributing to the advancement of recommendation logic and making it straightforward for all Karrot engineers to explore and add features.
  • Maintaining the reliability of feature data sources – Through the feature platform, we are providing reliable data using a consistent schema and ingestion pipeline.

Karrot engineers are continuously improving the user experience by advancing recommendations through high-quality features through the feature platform. This has contributed to increasing click-through rates by 30% and conversion rates by 70% compared to before by recommending articles that users might be interested in.

This was possible because the AWS services used in the feature platform were firmly supporting it. Amazon DynamoDB has amazing scalability in all aspects of read, write, and storage, so it was possible to handle dynamically changing workloads without incurring separate operating costs. Amazon ElastiCache showed highly reliable service stability, so we could use it with confidence. In addition, it was straightforward and stable to scale up, down, in, and out, so it was possible to reduce the operational burden. It also seamlessly integrated with the ecosystem of Redis OSS, so we could use open source ecosystems such as Redis Exporter. Amazon MSK also supports reliable operation and seamless integration with the Apache Kafka ecosystem, making the development and operation of the feature platform effortless.

Furthermore, working with AWS enables cost-efficient operations based on their various support and expertise. Recently, we had an over-provisioning problem with our ElastiCache cluster. Right-sizing our ElastiCache cluster with various experts (including Solutions Architects) made it possible to optimize ElastiCache costs by nearly 40%. Such technical human resources from AWS have been invaluable in operating the feature platform using AWS products.

Conclusion

In this series, we discussed how Karrot built a feature platform on AWS. We believe that by combining AWS services and our experience, you can develop and operate a feature store without difficulty by modifying it to suit your company’s requirements. Try out this implementation and let us know your thoughts in the comments.


About the authors

Introducing AWS Cloud Control API MCP Server: Natural Language Infrastructure Management on AWS

Post Syndicated from Kevon Mayers original https://aws.amazon.com/blogs/devops/introducing-aws-cloud-control-api-mcp-server-natural-language-infrastructure-management-on-aws/

Today, we’re officially announcing the AWS Cloud Control API (CCAPI) MCP Server. This MCP server transforms AWS infrastructure management by allowing developers to create, read, update, delete, and list resources using natural language. As part of the awslabs/mcp project, this new and innovative tool serves as a bridge between natural language commands and AWS infrastructure deployment and management. This MCP server is powered by the AWS Cloud Control API – a standardized API that allows CRUDL (Create/Read/Update/Delete/List) operations to be performed against AWS and third party resources using a single endpoint.

Key Features:

  • Leverages AWS Cloud Control API for CRUDL operations for more than 1,200 AWS resources
  • Enables LLM-powered agents and developers to manage infrastructure with natural language prompts
  • Provides the option to output Infrastructure as Code (IaC) templates for infrastructure it will create, allowing to still be used with existing CI/CD pipelines
  • Integrates with AWS Pricing API to provide cost estimates for the infrastructure it will create
  • Applies security best practices automatically using Checkov

Why Use CCAPI MCP Server?

  • Simplified Infrastructure Management: No more wrestling with complex templates or documentation
  • Increased Developer Productivity: Focus on what you need, not how to configure it
  • Reduced Learning Curve: Onboard new team members faster with natural language commands
  • LLM Integration: Perfect companion for AI-assisted development workflows

The CCAPI MCP Server transforms infrastructure management by enabling natural language interactions for AWS resource operations. Bridging natural language commands with AWS infrastructure deployment and management, this MCP Server allows developers to manage cloud infrastructure through conversational inputs such as:

  • Can you create a new s3 bucket for me?or
  • Find all of my EC2 instances and tell me which one have an instance type that is not t2.large

This significantly reduces configuration overhead and accelerates onboarding for new team members, directly translates developer intent into cloud infrastructure.

Let’s see it in action.

Creating and Managing Cloud Infrastructure

Prerequisites

  • uv package manager installed
  • Python 3.x.x installed
  • AWS credentials with appropriate permissions. The MCP server supports multiple ways to define these credentials. See the MCP documentation for more information. Using dynamic credentials such as one provided via SSO is recommended. For more information on configuring AWS credentials, see the AWS CLI documentation.
  • An MCP Host application installed that supports MCP Clients and MCP Servers (e.g. Amazon Q Developer, Claude Desktop, Cursor, etc.). To follow this blog install Amazon Q Developer for CLI (CLI) as described in the installation instructions

Integration with Developer Tools

To start using the CCAPI MCP server, you will need to set up your server configuration which is typically in a file named mcp.json. For this blog we will focus on using the CCAPI MCP server with Amazon Q Developer. Note that for other MCP Host applications the path to the mcp configuration file may differ. You will need to create the file if it does not already exist in the directory.

1. Global Configuration: ~/.aws/amazon/mcp.json – Applies to all workspaces

2. Workspace Configuration: .amazonq/mcp.json – Specific to the current workspace

More information can be found in the Amazon Q Developer User Guide.

Configuration file structure

The MCP configuration file uses a JSON format with the following structure:

mcp.json

{
  "mcpServers": {
    "server-name": {
      "command": "command-to-run",
      "args": ["arg1", "arg1",],
      "env": {
        "ENV_VAR1": "value1",
        "ENV_VAR2": "value2",
      },
    }
  }
}

Here is mcp.json with the CCAPI MCP Server configuration:

{
  "mcpServers": {
   "awslabs.ccapi-mcp-server": {
      "command": "uvx",
      "args": [
        "awslabs.ccapi-mcp-server@latest"
      ],
      "env": {
        "AWS_PROFILE": "your named AWS profile",
	"DEFAULT_TAGS": “enabled”,
	"SECURITY_SCANNING": “enabled”,
	"FASTMCP_LOG_LEVEL": “ERROR”
      },
      "disabled": false,
      "autoApprove": []
    }
  }
}

Important

Ensure you correctly set your AWS credentials in the MCP server config. It is essential that you properly configure these credentials, as the MCP server uses their associated permissions when invoking the AWS Cloud Control API for CRUDL operations in your AWS account. The server supports multiple methods of consuming these credentials such as AWS profiles, Environment Variables, SSO tokens, etc. You can see some of this in the aws_client.py file. See these docs on using named profiles for more information.

Read Only Mode

If you would like to prevent the MCP server from performing mutating actions (e.g. Create/Update/Delete Resource), you can specify the --readonly flag as demonstrated below:

{
  "mcpServers": {
   "awslabs.ccapi-mcp-server": {
      "command": "uvx",
      "args": [
        "awslabs.ccapi-mcp-server@latest",
        “--readonly”"
      ],
      "env": {
        "AWS_PROFILE": "your named AWS profile",
	"DEFAULT_TAGS": “enabled”,
	"SECURITY_SCANNING": “enabled”,
	"FASTMCP_LOG_LEVEL": “ERROR”
      },
      "disabled": false,
      "autoApprove": []
    }
  }
}

More information on the configuration and tools the CCAPI MCP server provides can be found in the AWS CloudFormation MCP Server documentation.

Security Considerations

  • Ensure the IAM credentials include permissions for Cloud Control API actions (List, Get, Create, Update, Delete). See the AWS CCAPI API documentation for more info
  • Follow IAM least privilege principles
  • Enable AWS CloudTrail auditing
  • Consider running in read-only mode with --readonly flag for safer operations

Example Use Case: Creating an S3 Bucket with KMS Encryption

IMPORTANT: Ensure you have satisfied all prerequisites before attempting these commands.

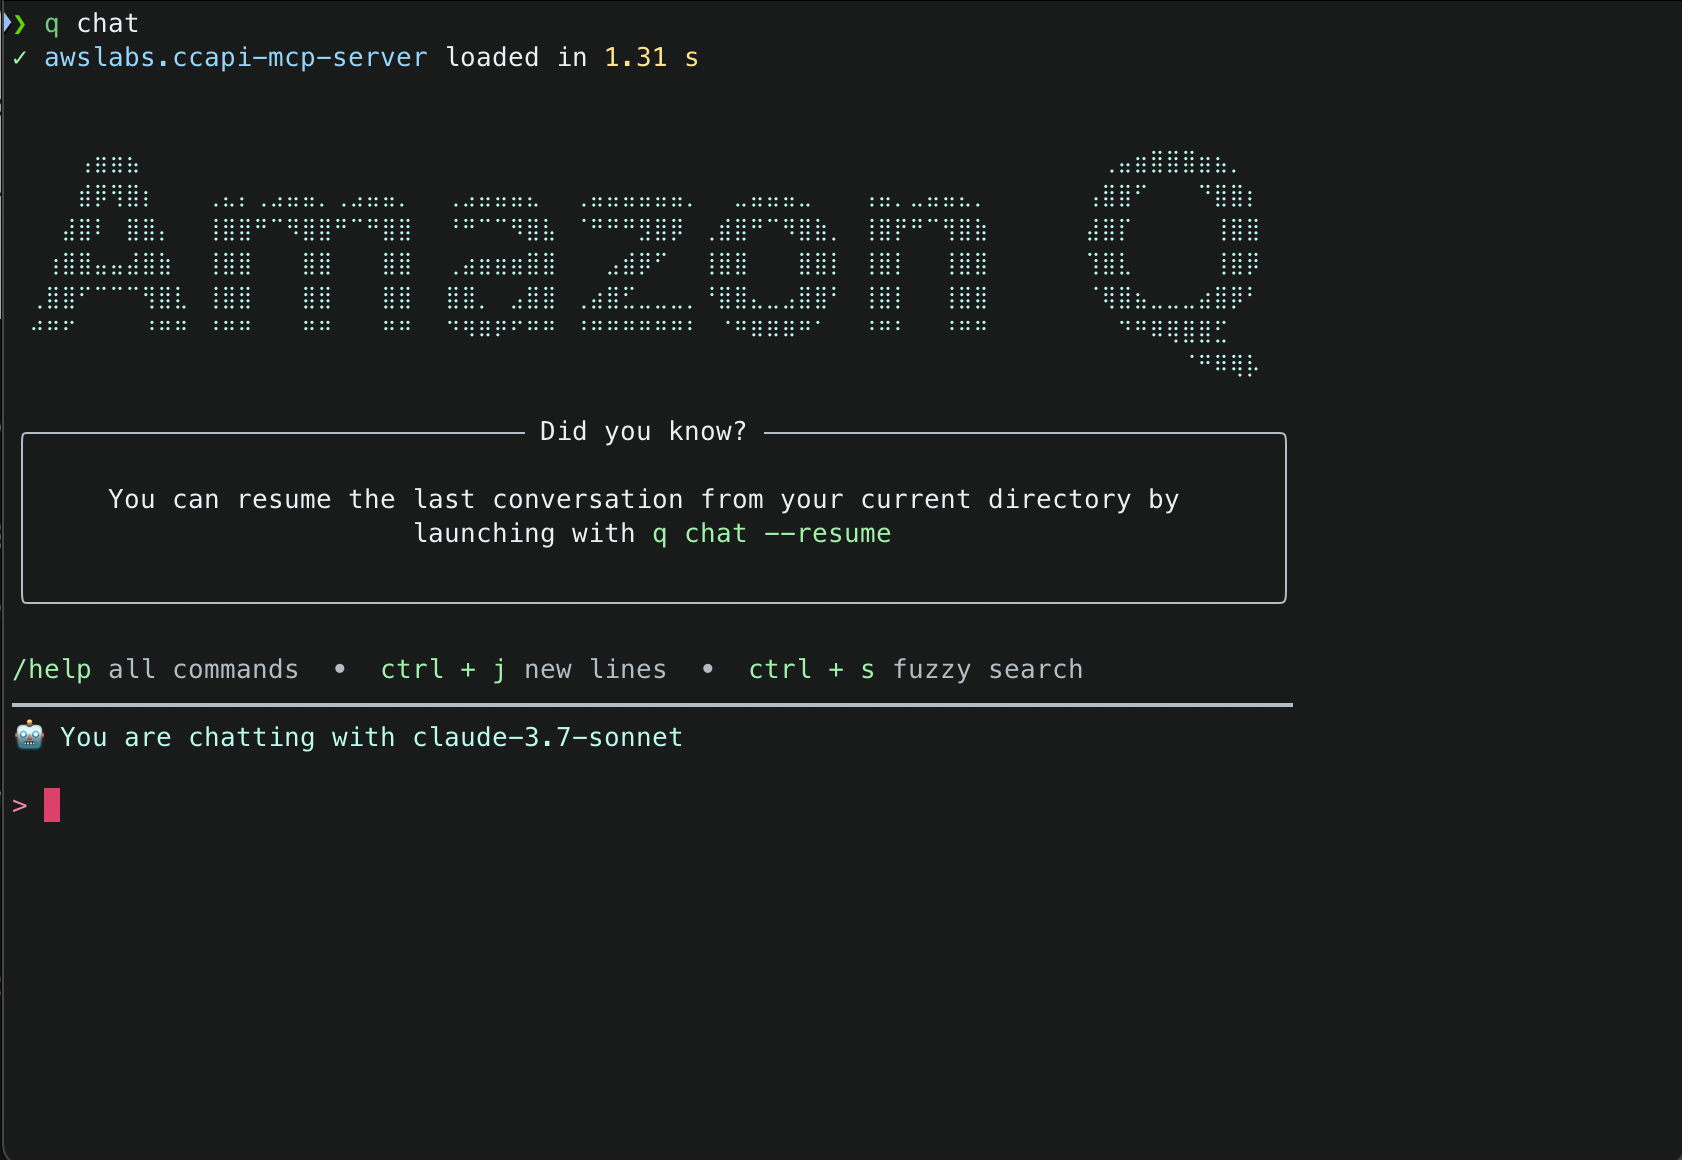
1. With the mcp.json file correctly set, try to run a sample prompt. In your terminal, run q chat to start using Amazon Q in the CLI.

Q CLI Initial Load of Cloud Control API MCP Server 2. This will start initializing the MCP servers in the background, allowing you to immediately start using Q Chat even if they are still loading. As a note, if these have not finished loading, your prompts will be handled without using any MCP servers. To check the status of the servers, run /mcp
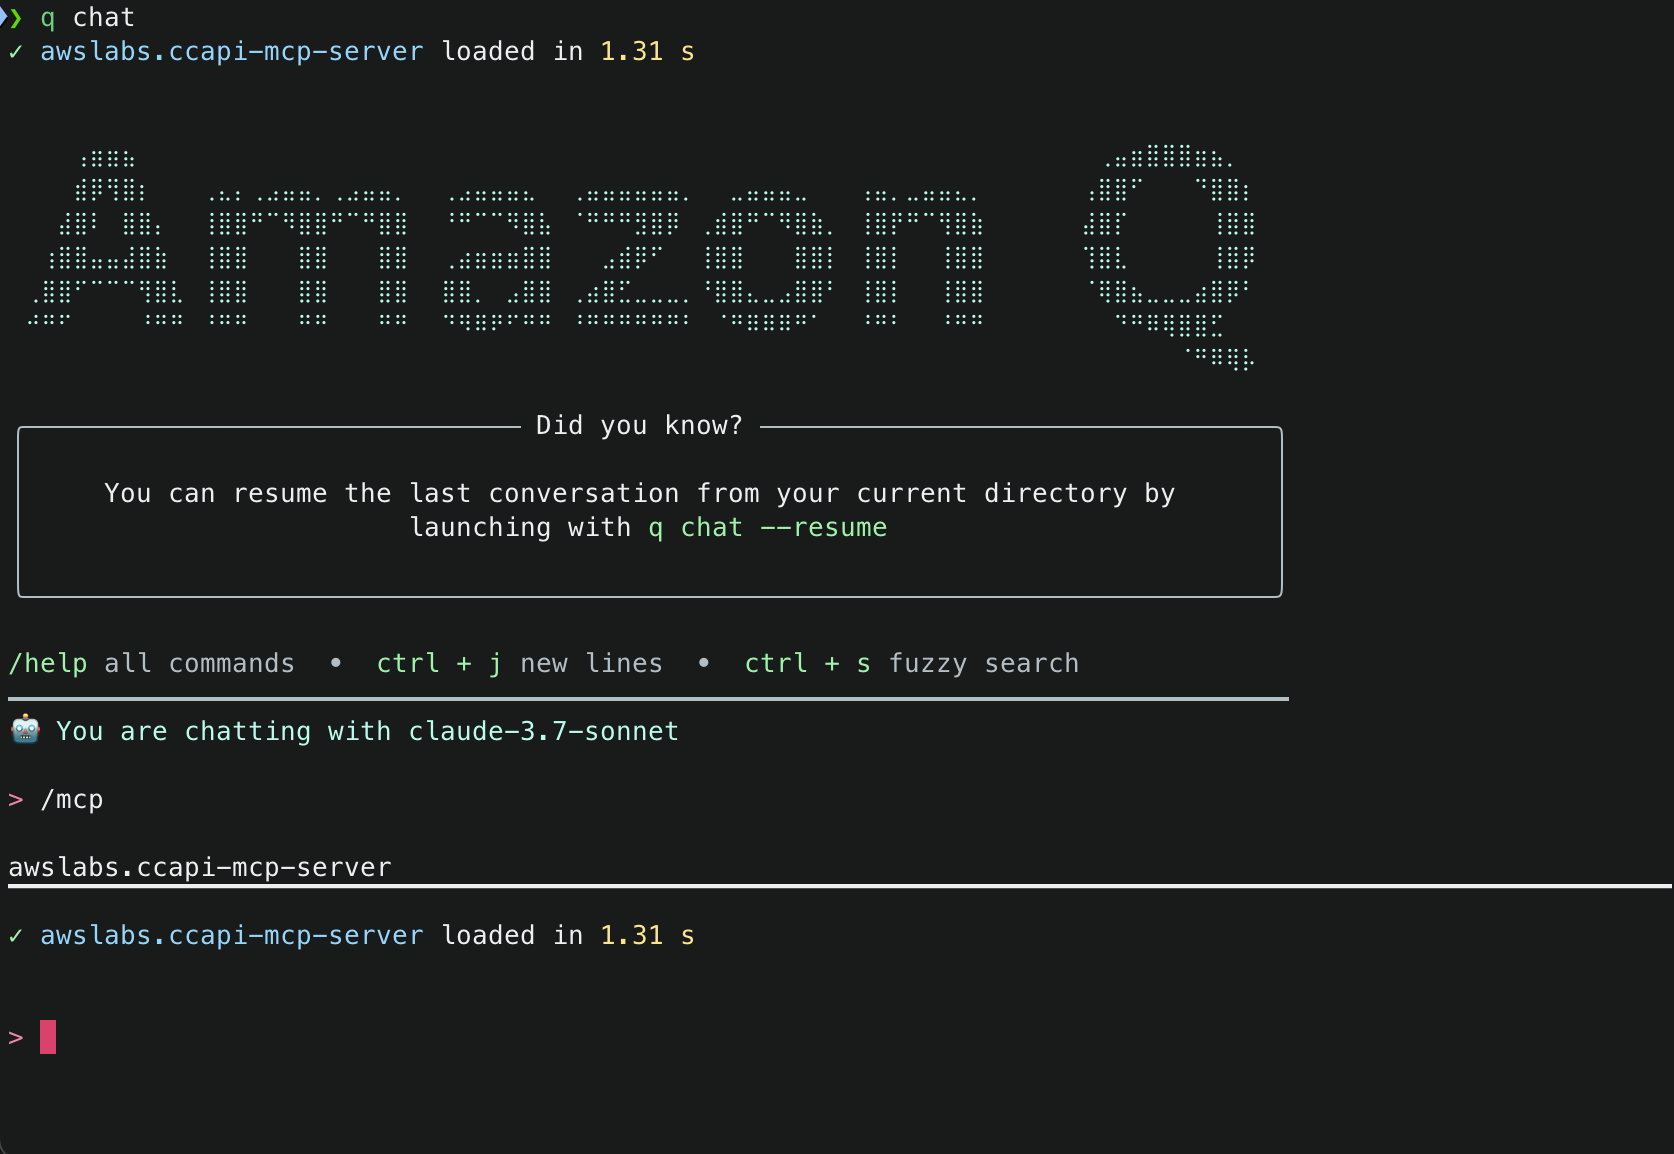
3. Once that you have validated that the MCP server was loaded successfully, try a sample command. Simply tell Amazon Q : Create an S3 bucket with versioning and encrypt it using a new KMS key

Amazon Q will use the server to automatically:

  1. Fetch your current environment variables
  2. Use those to fetch your current AWS session info
  3. Create code that defines what is in your prompt
  4. Explain the code that was generated
  5. Run security analysis against the code that was generated (if enabled)
  6. Explain the results of the security analysis
  7. Validate the configuration against AWS Cloud Control API schemas (which use CloudFormation Resource Provider Schemas as their foundation) and IAM policies. This validation ensures compliance with Cloud Control API requirements, which is essential for resource creation
  8. Create the resources directly through Cloud Control API

Note: While CloudFormation schemas are referenced in the validation step, this solution uses Cloud Control API for resource management, not CloudFormation. The schemas are used because they define the standardized resource properties that Cloud Control API expects.

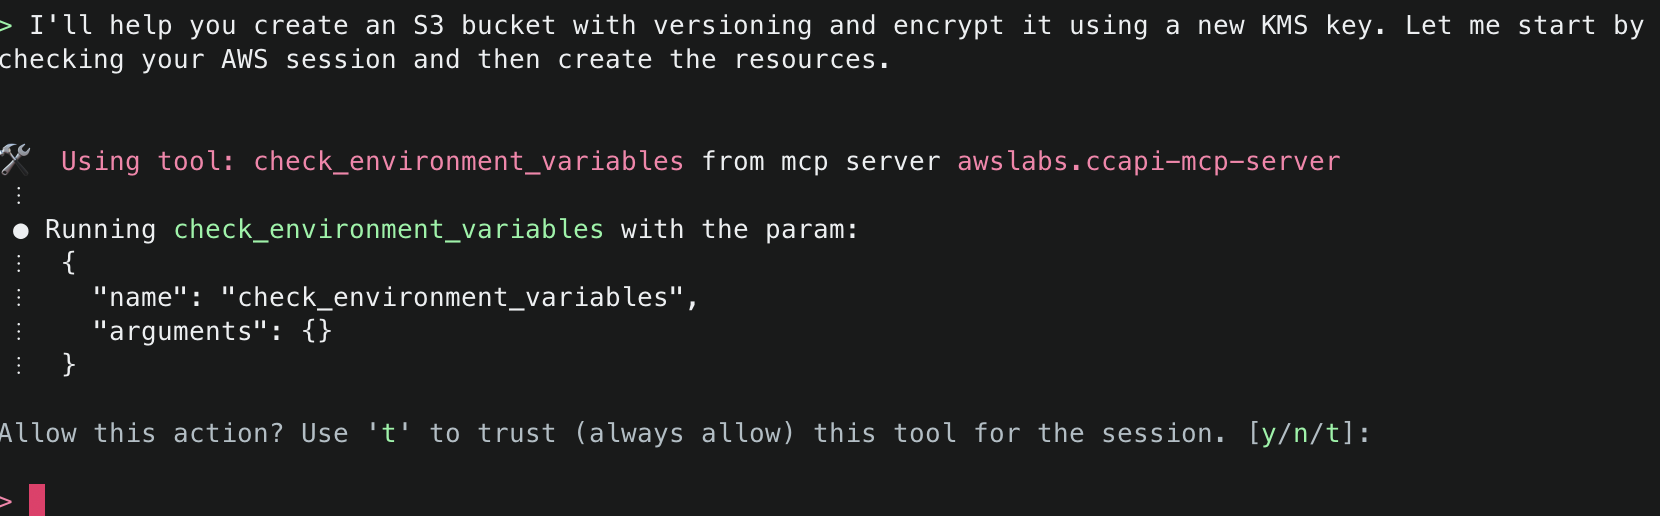
4. First, Amazon Q will mention that it needs to check the environment variables to find information related to the AWS session information. It will inform you about the specific tool it aims to use and will ask for permission. Select y to accept and allow actions.

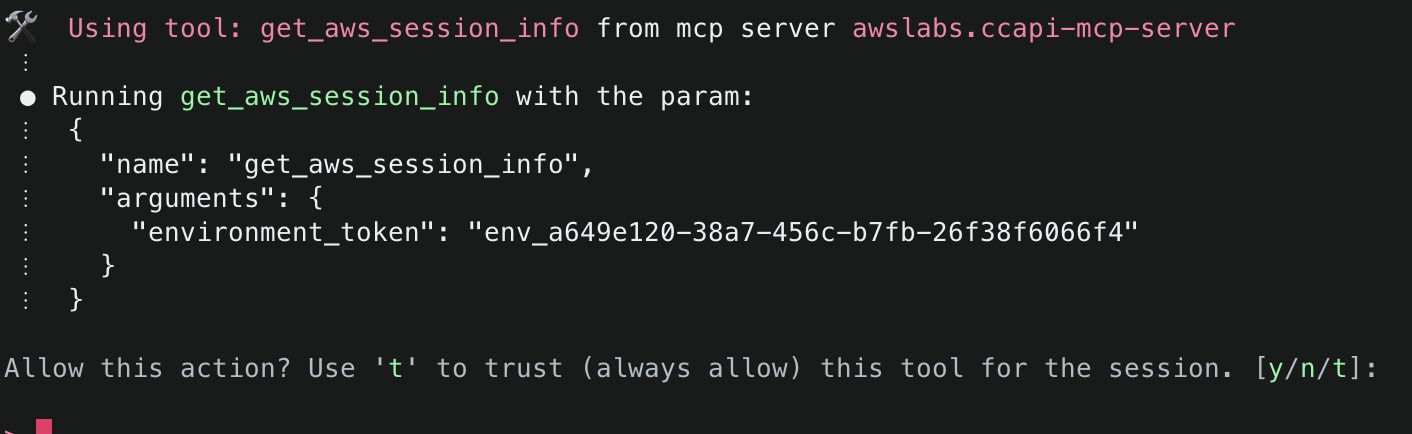
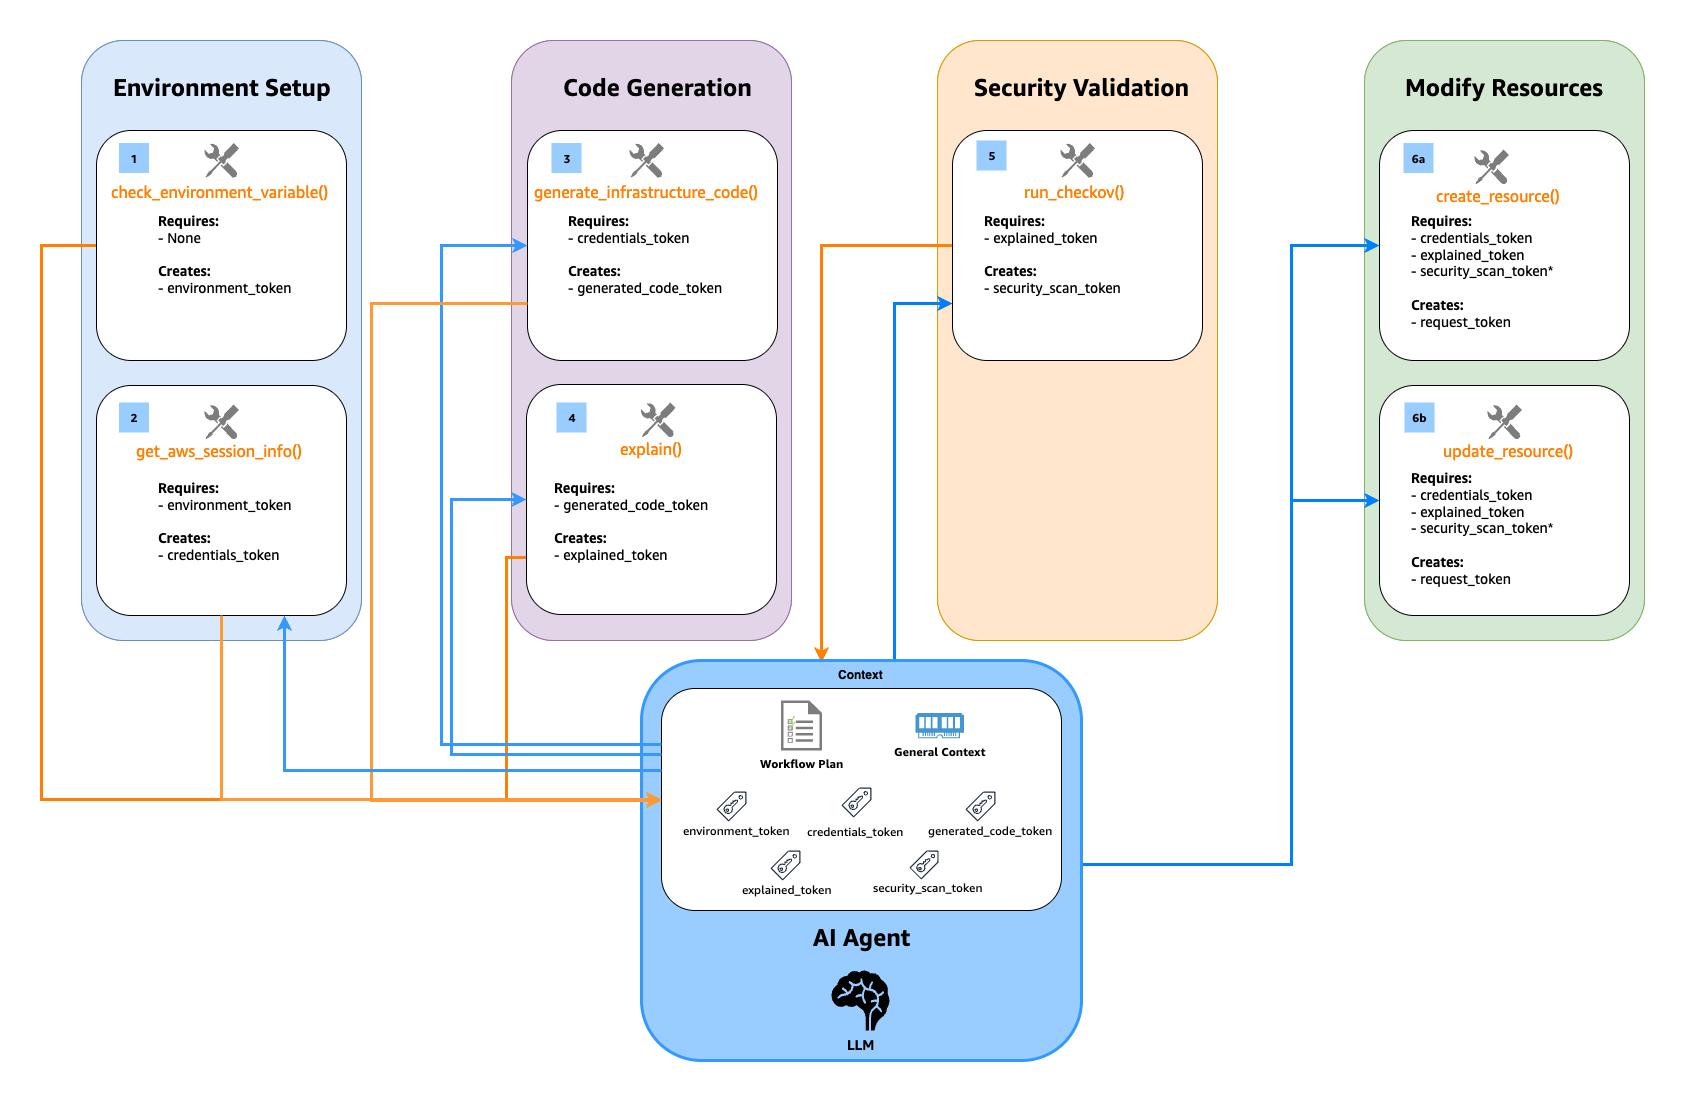
5. Next, Amazon Q will ask to use get_aws_session_info() to fetch information about the AWS session it should use for subsequent actions. It will use the relevant values from the environment variables defined in the MCP configuration file (e.g. ~/.aws/amazon/mcp.json)

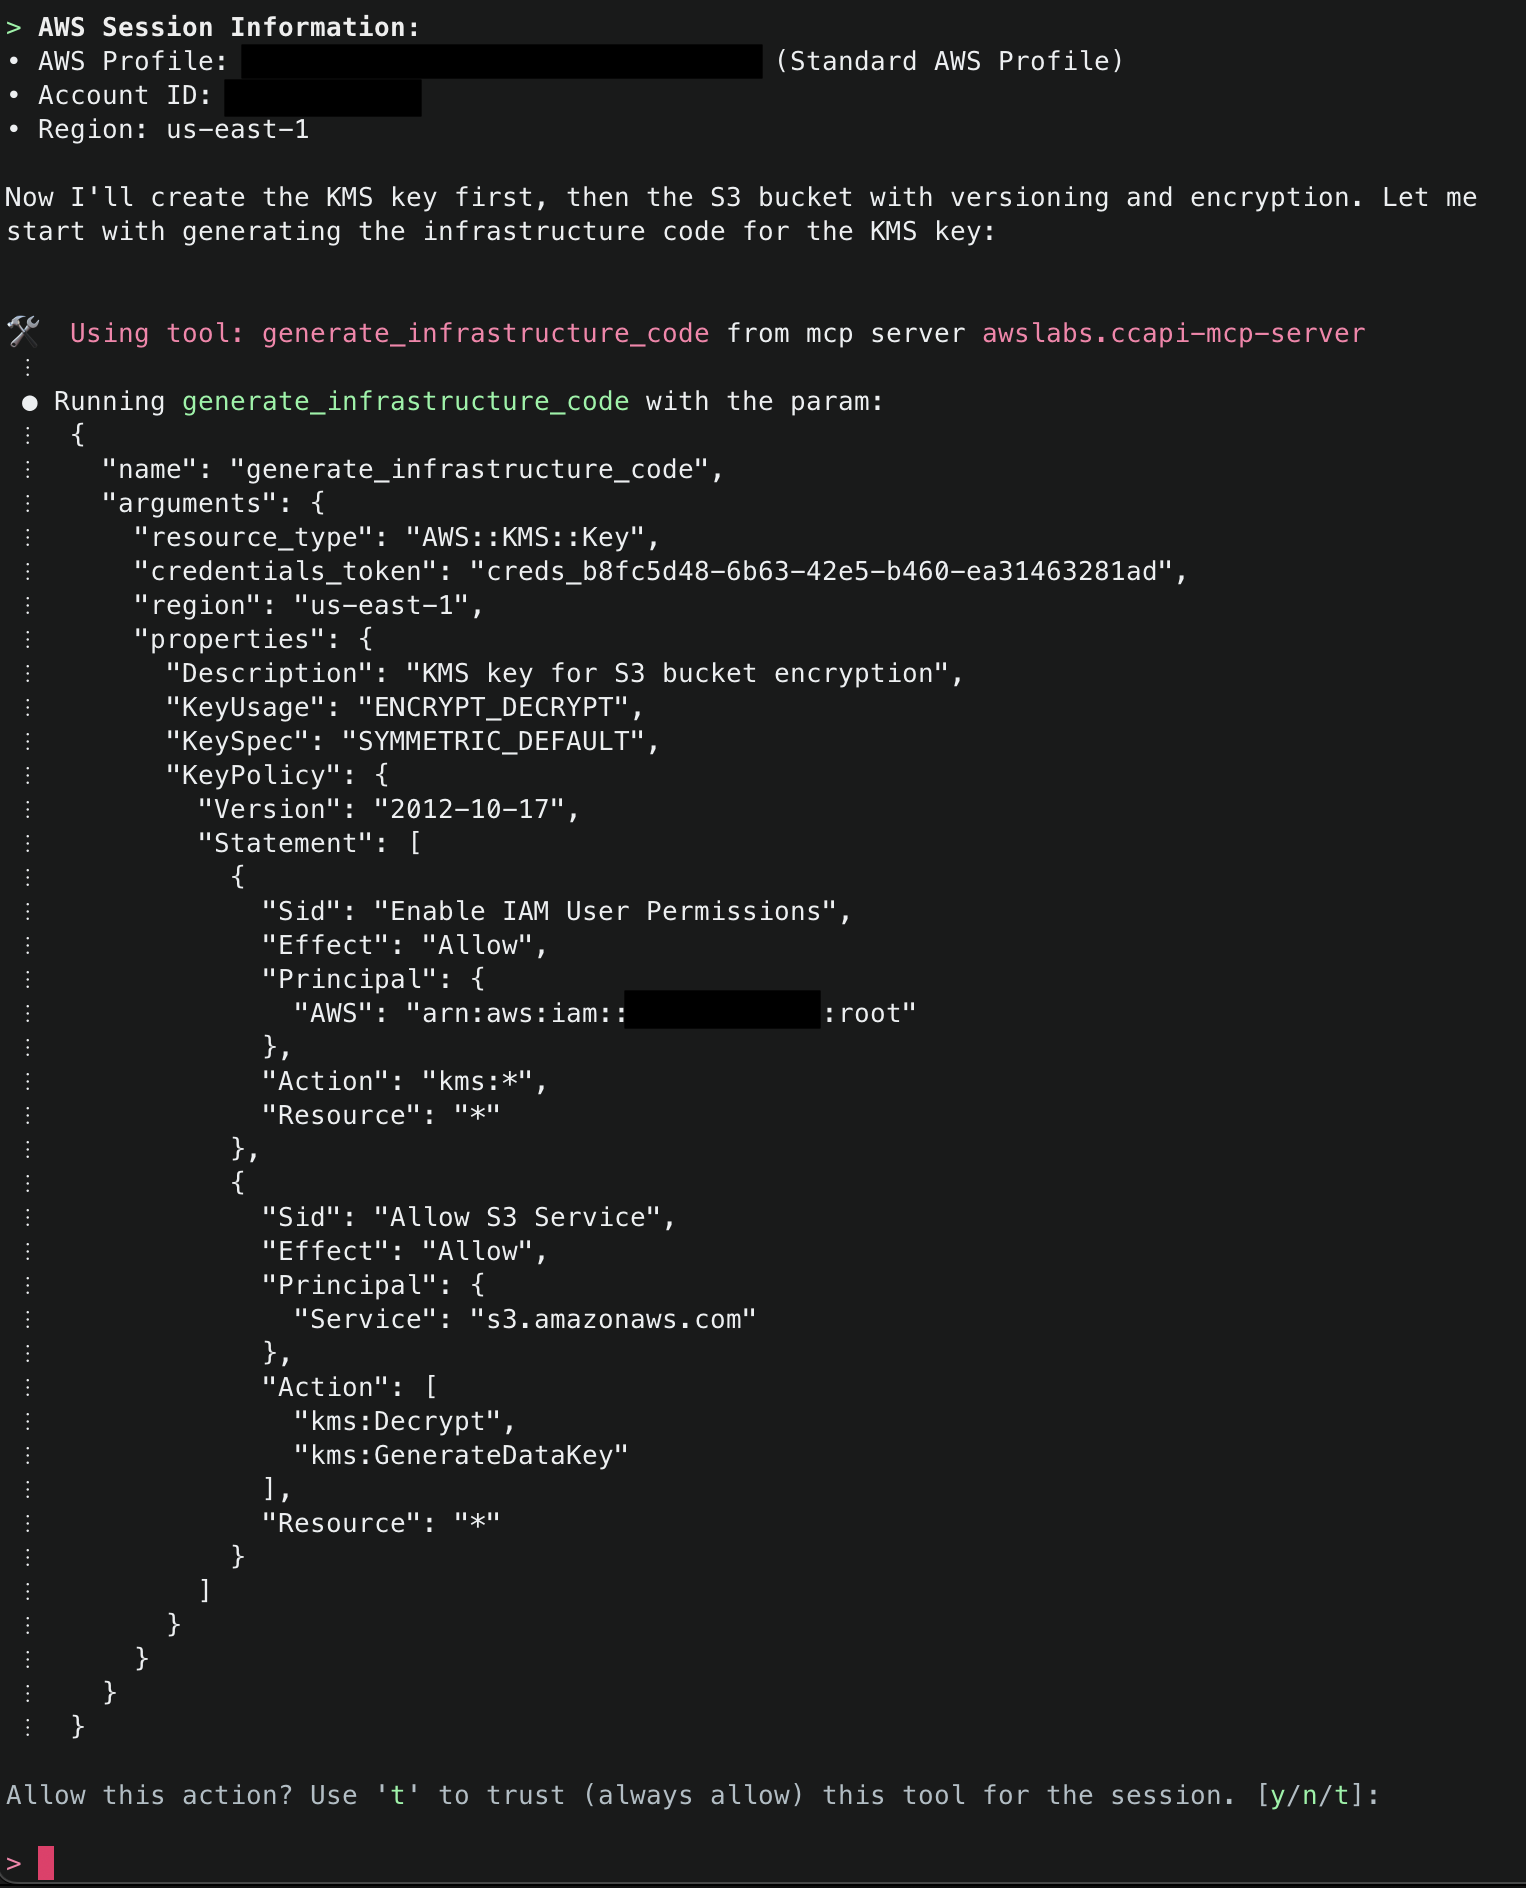
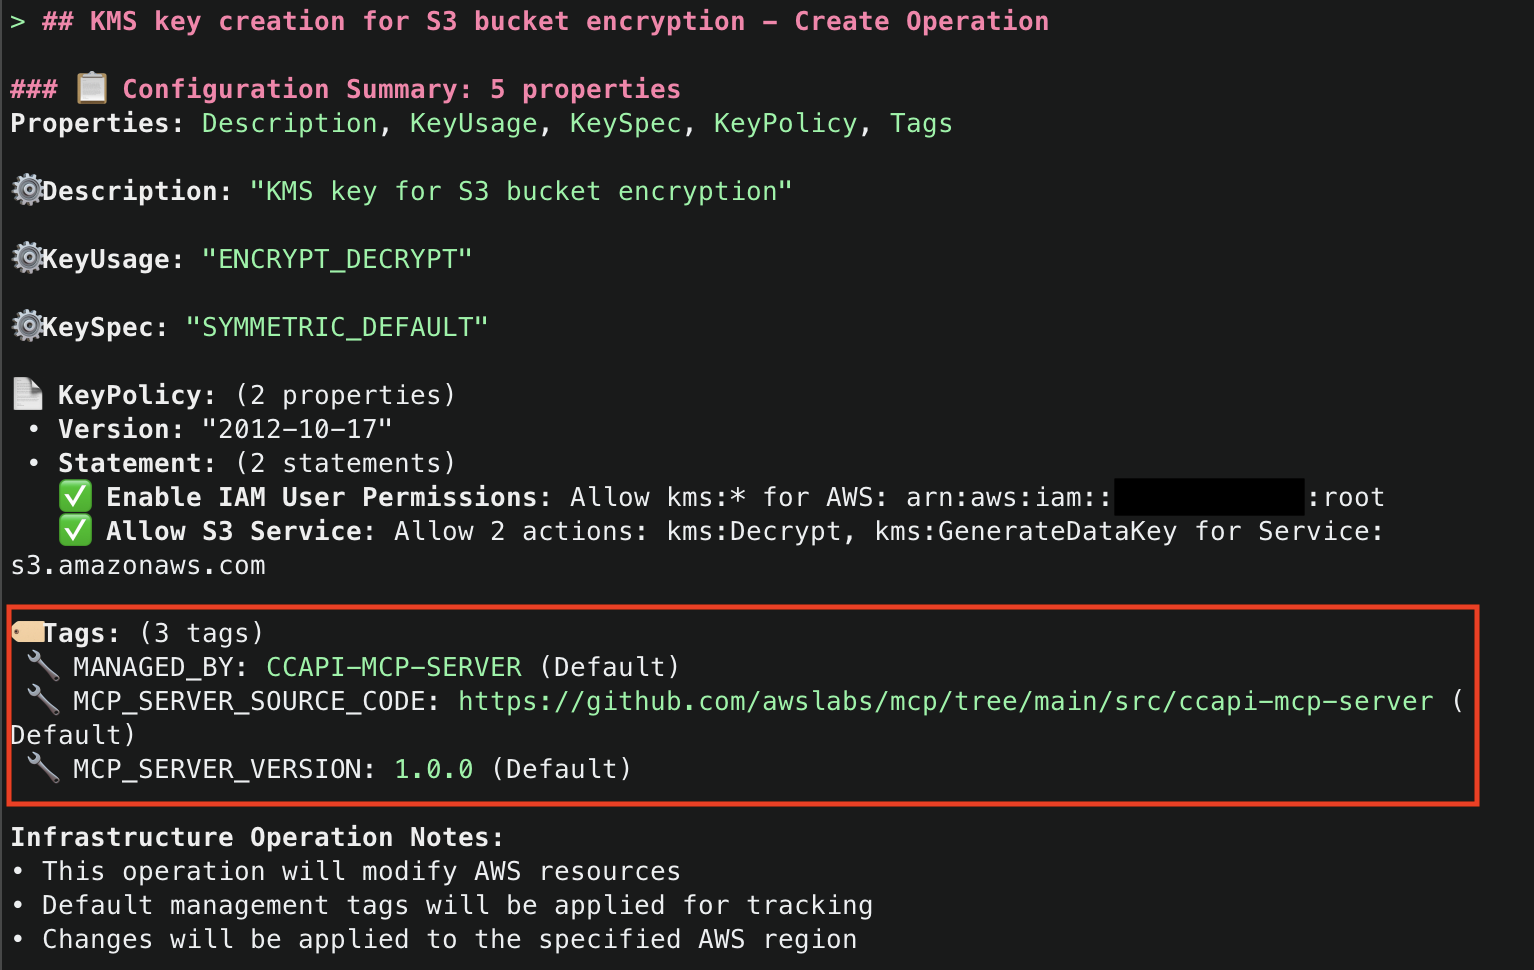
6.Amazon Q will then display the AWS account ID and region it will use to deploy resources. To start, it will use generate_infrastructure_code() to generate the resource properties for a KMS key that will be sent to Cloud Control API. These properties mirror the structure defined in AWS CloudFormation Resource Provider Schemas (which Cloud Control API uses as its foundation), allowing for security validation through Checkov before deployment. The key will be configured following security best practices, with a key policy scoped to only allow usage within the AWS account.

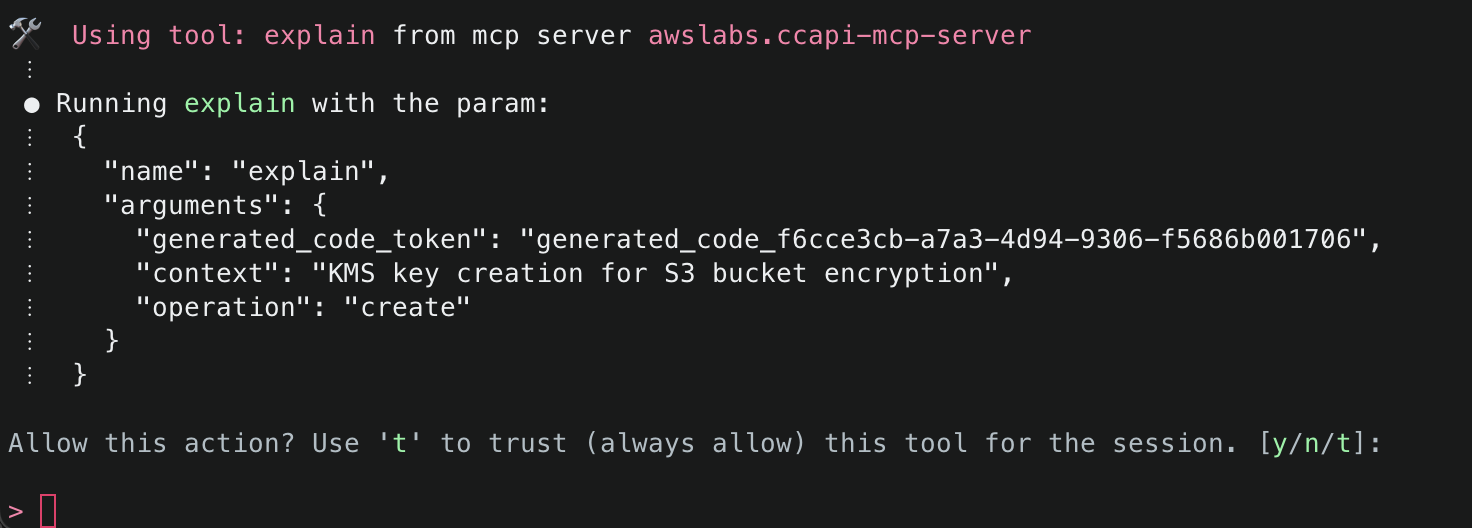
7. Once that Amazon Q has generated the code for the resource, it will run then use the explain() tool to explain the infrastructure code that was generated. Note that default tags MANAGED_BY, MCP_SERVER_SOURCE_CODE, and MCP_SERVER_VERSION are added for all resources managed by the CCAPI MCP server. These tags provide for ease of identification of infrastructure that is being managed by the MCP server. They are configurable and you optionally can disable them, but we highly recommend adding tags to ensure you have visibility into infrastructure that is being managed by the CCAPI MCP server.

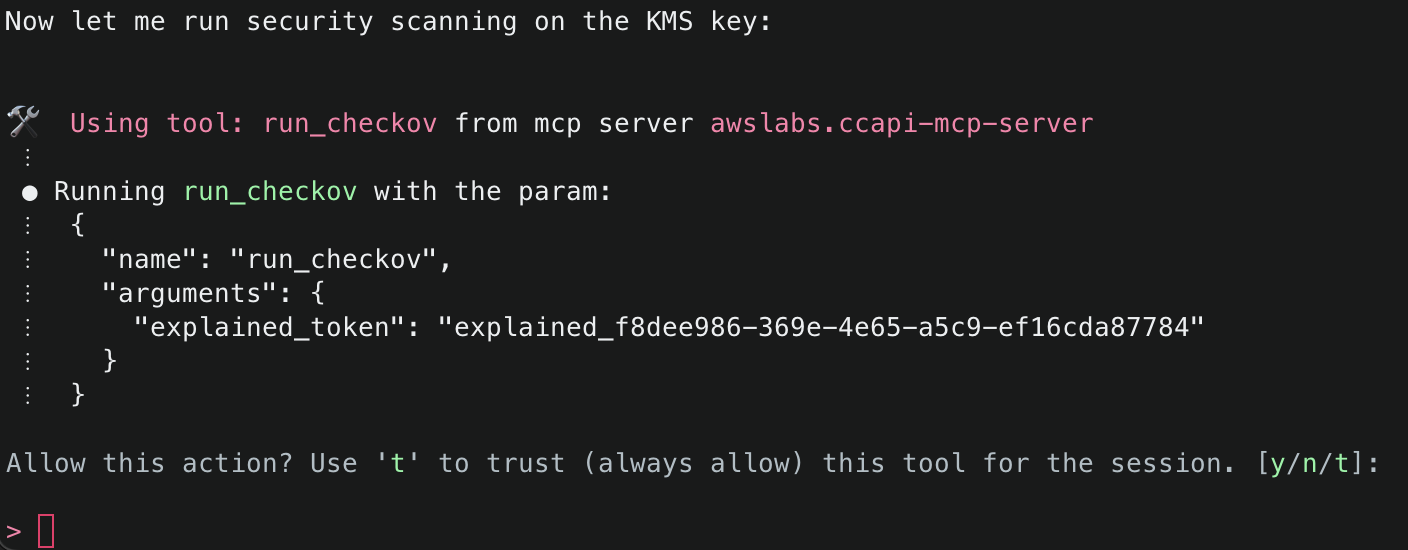
8. It will then attempt to use the run_checkov() tool to inspect the security of the code. This tool is triggered because SECURITY_SCANNING was set to enabled in your server configuration file.

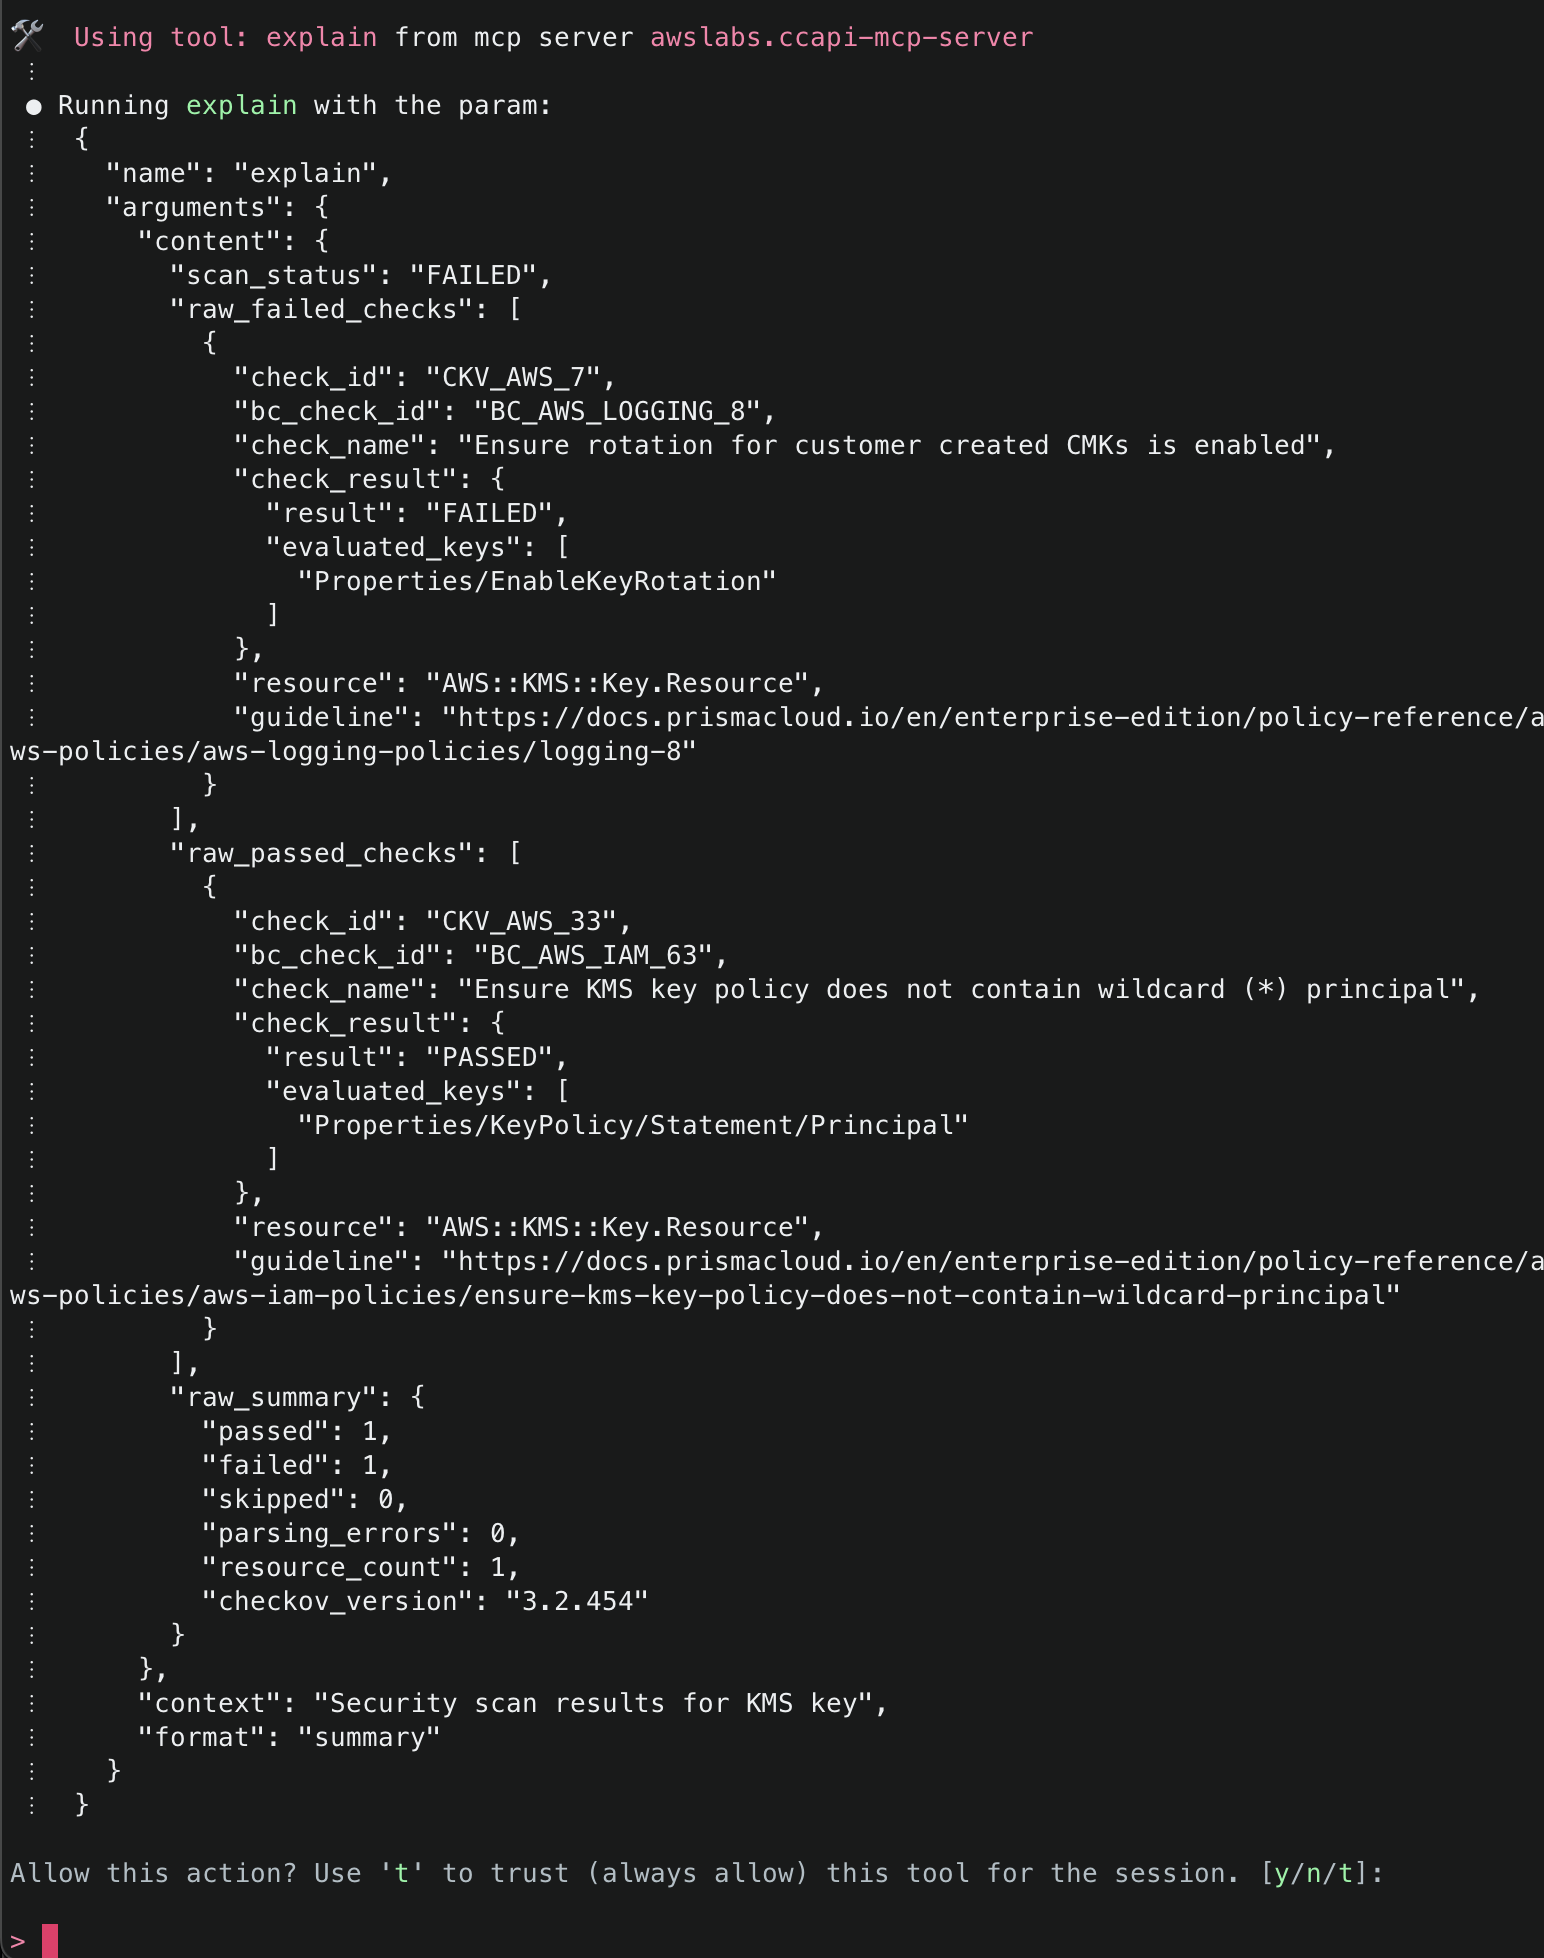
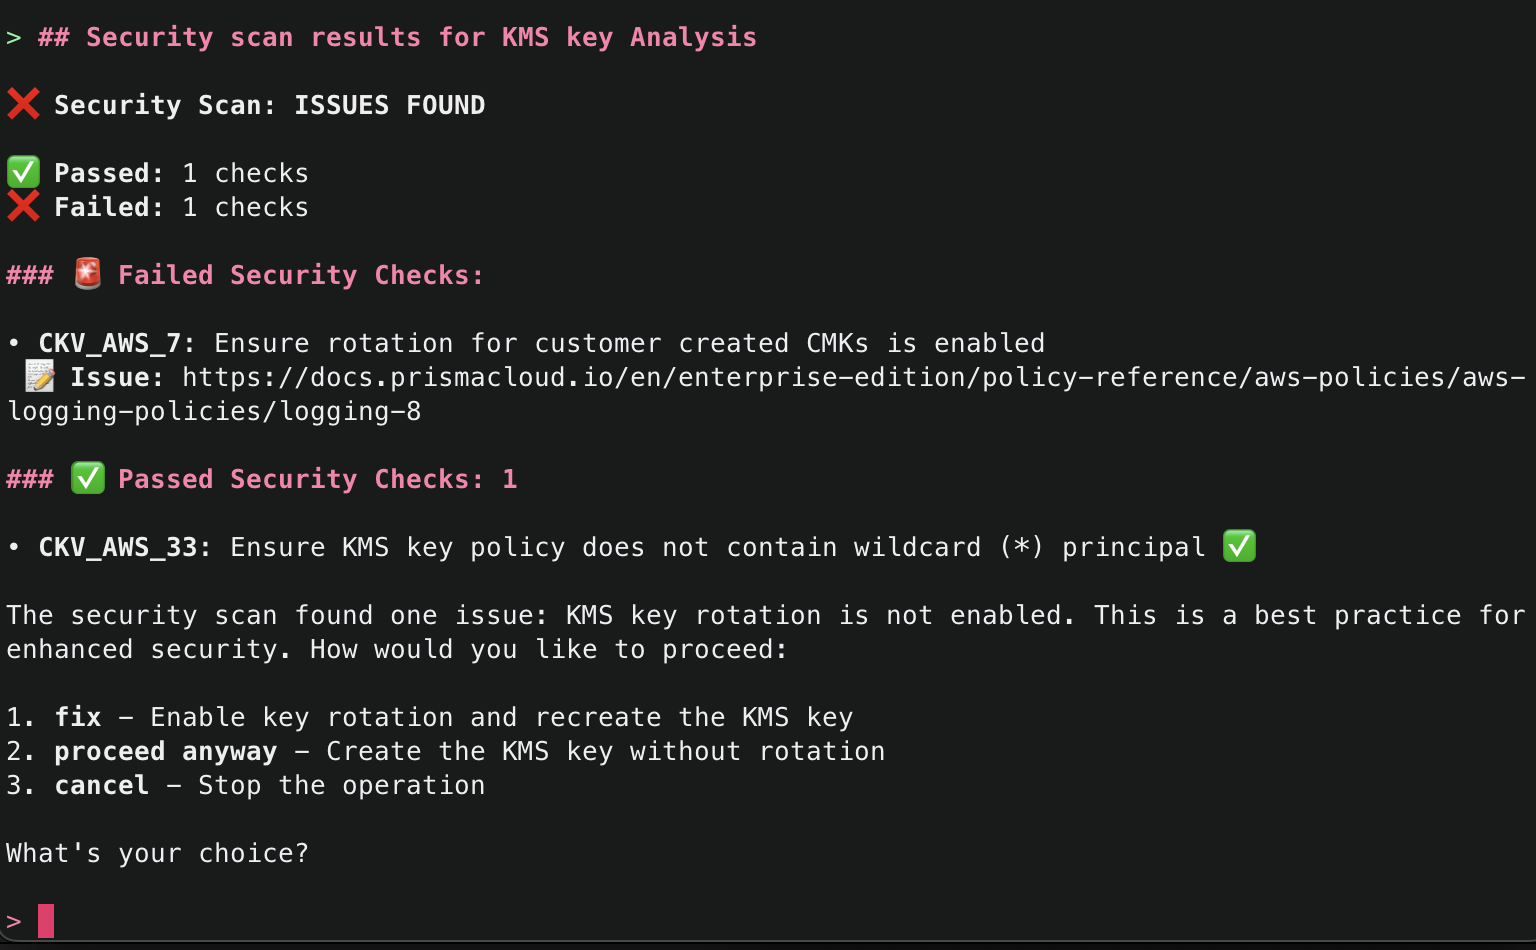
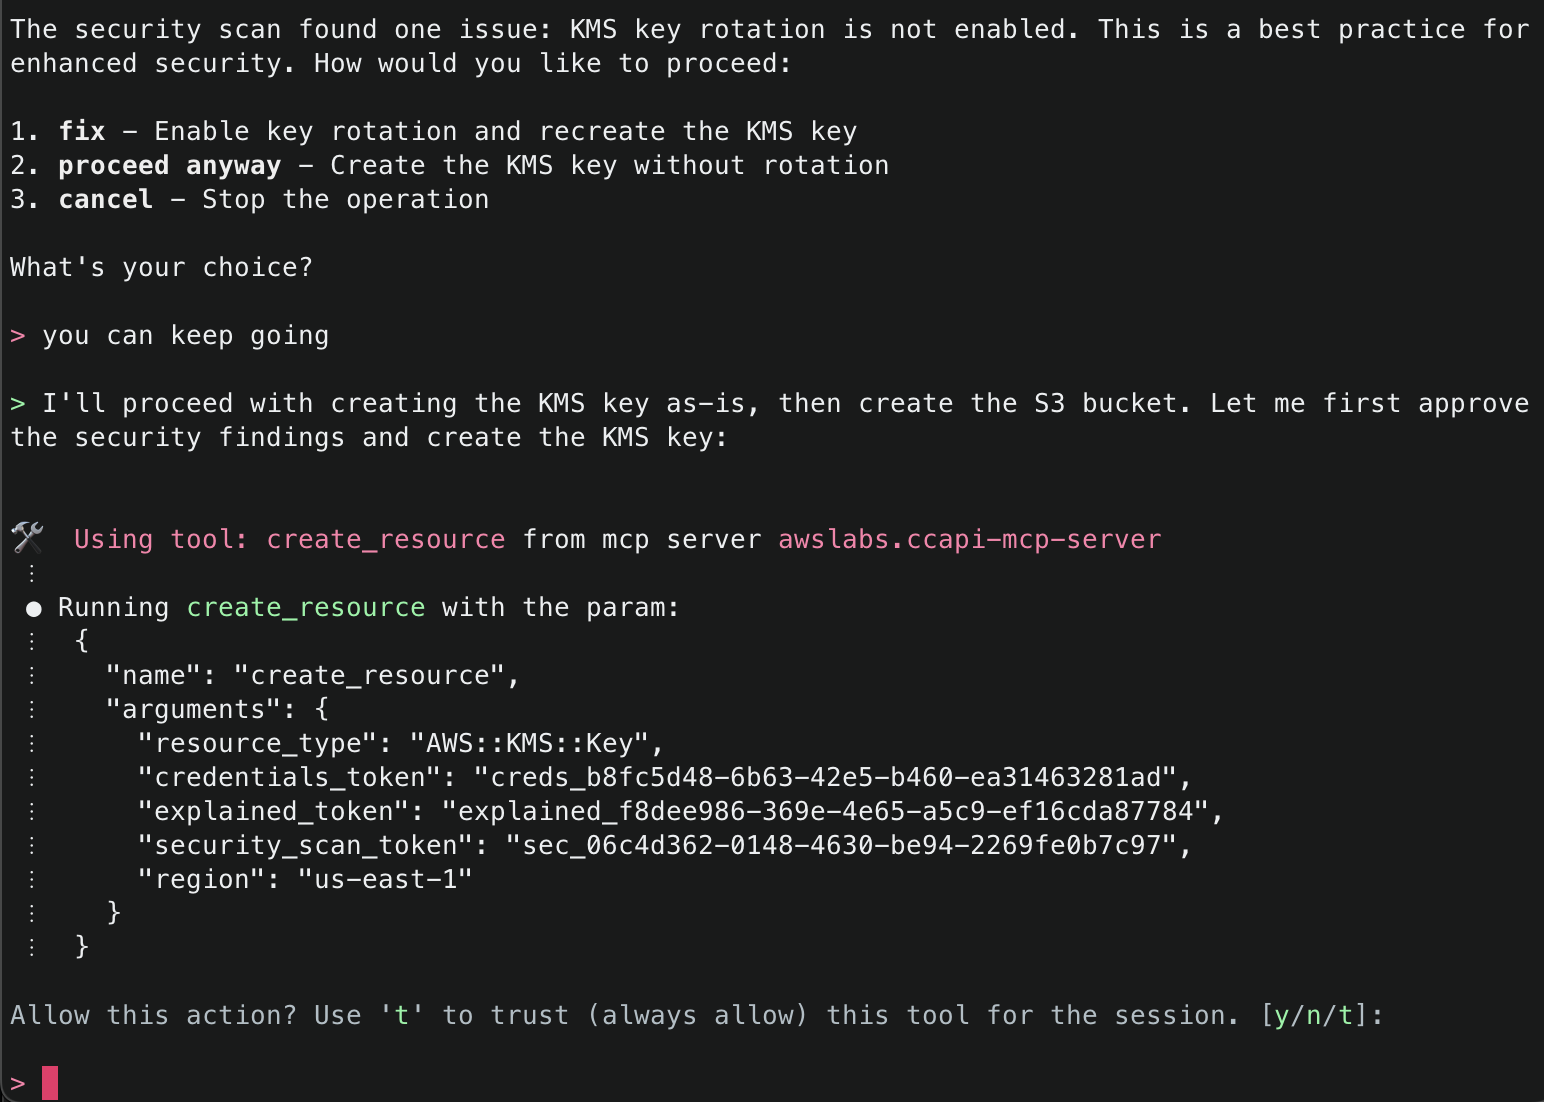
9. After Checkov has run, it will then attempt to use the explain() tool again to explain the security findings from the Checkov run. If there were no security issues, it will attempt to proceed. If there were security issues, you will be asked how you’d like to proceed, and Amazon Q will recommend necessary fixes. By default, the checks that passed will only give a minimal summary. If you’d like to get more information, just ask for more details.

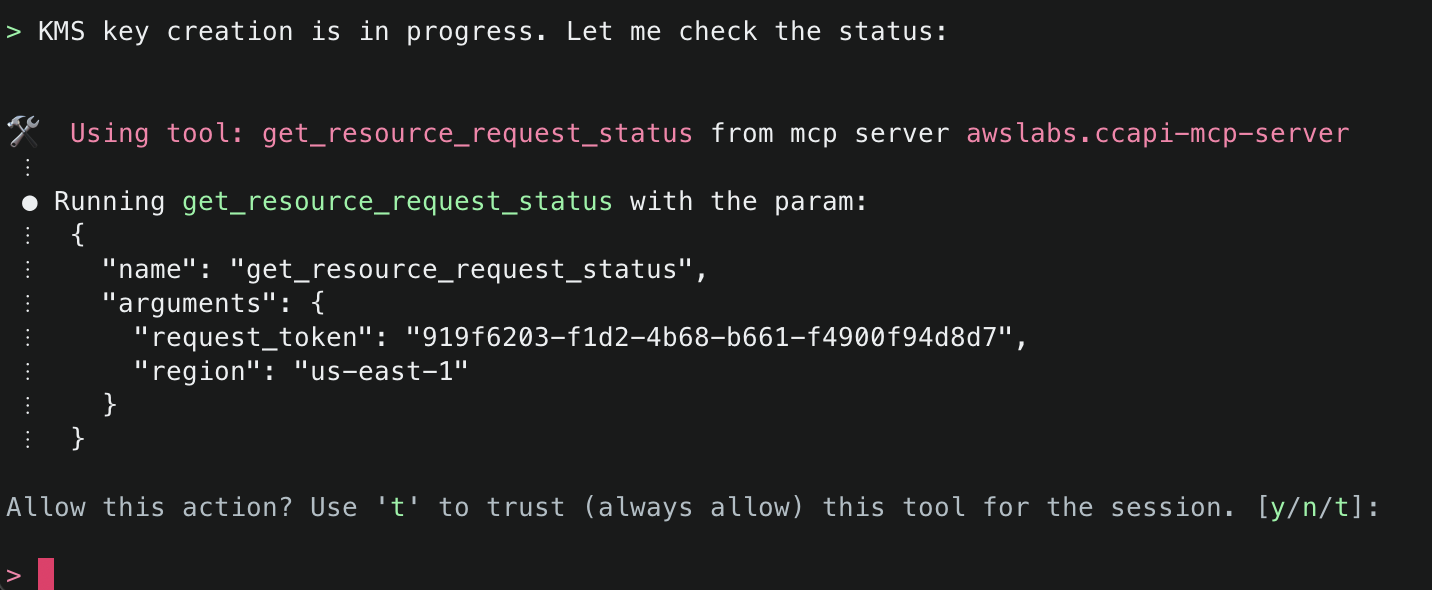
10. The next tool that Amazon Q will use is the create_resource() tool. This tool will attempt to create the resource using the AWS Cloud Control API, and then use the get_resource_request_status() tool to check the status of the creation. This tool uses the request token to identify the request that was submitted to the Cloud Control API and uses this to fetch its status information.

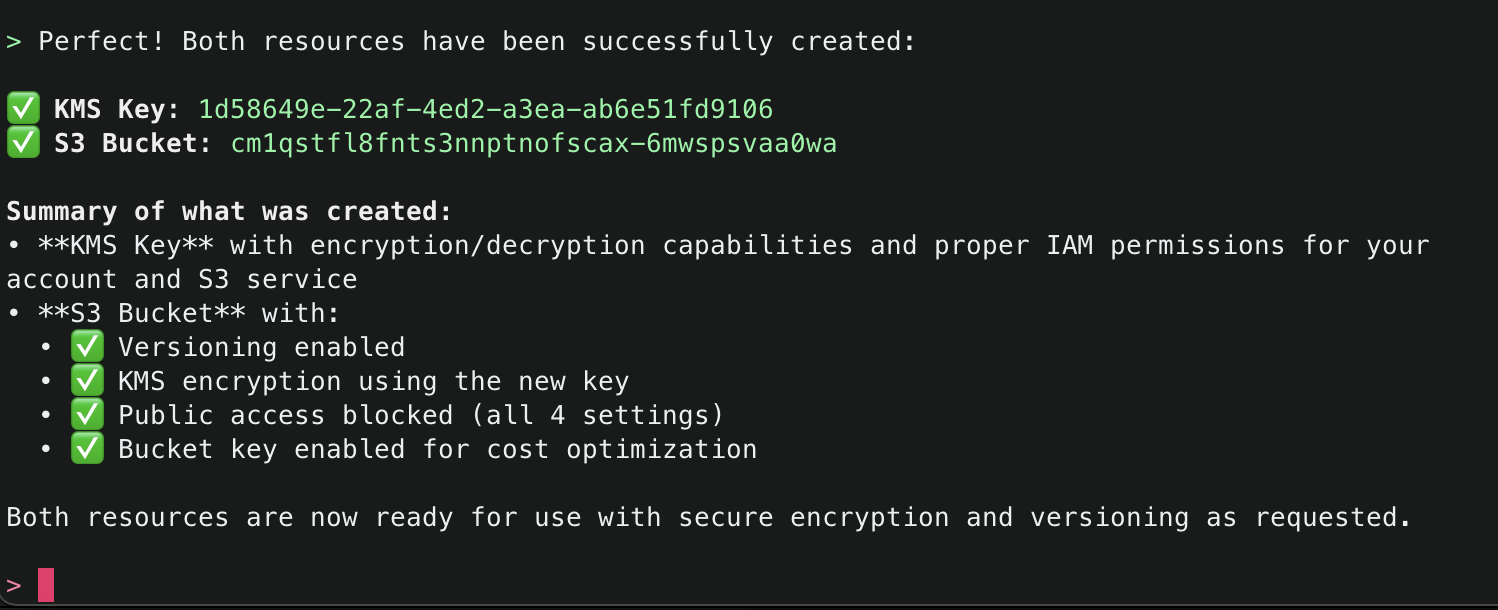
11. Amazon Q will continue using the CCAPI MCP server tools as needed until it finishes creation of both the S3 Bucket and KMS Key and will output a summary.

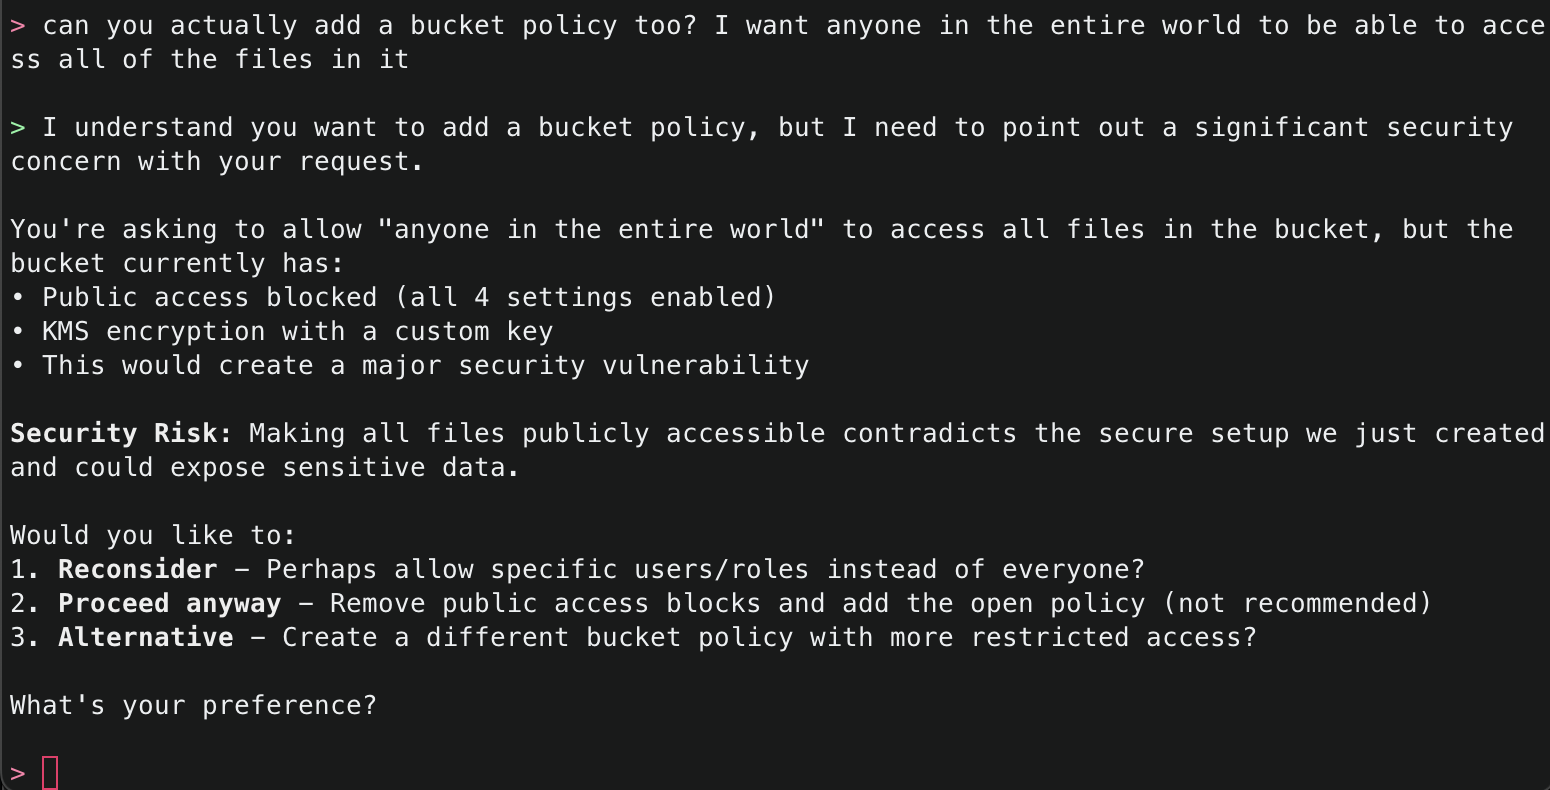
12. Now, ask Amazon Q to make a change potentially negatively affecting security, for example by allowing the S3 bucket to be publicly accessible. While this configuration is generally advised against, sometimes it is necessary – such as when you want to use the S3 bucket for public website hosting. Amazon Q will respond letting you know that what you are asking for is not the best practice, and explain why. However, since this could be a valid request depending on your use case, it will prompt you to confirm.

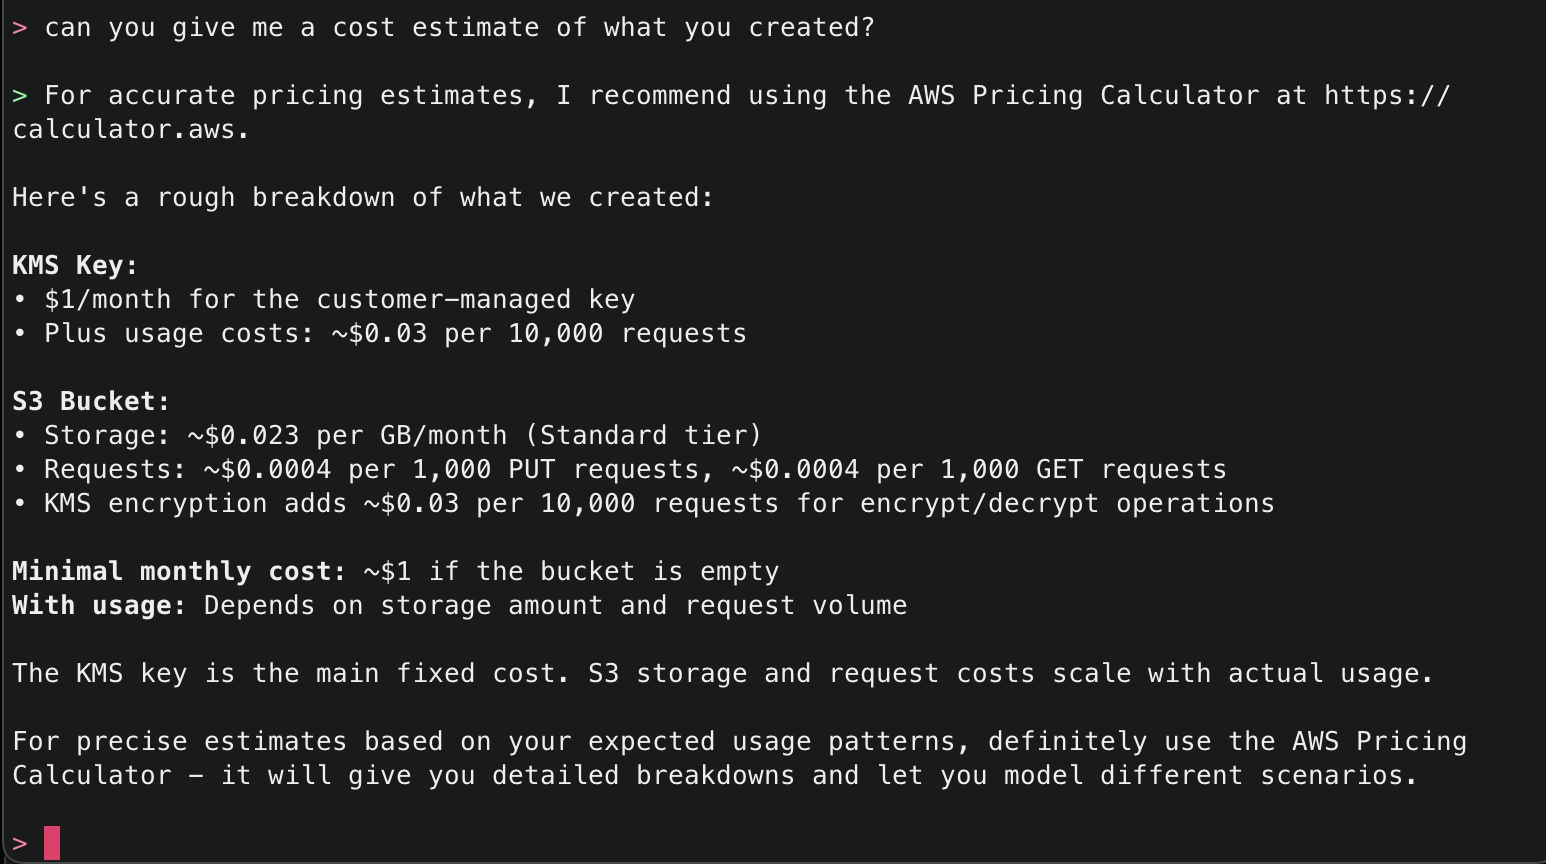
13. The CCAPI MCP server also has integrations with the AWS Pricing API, so you can even ask for the estimated cost of what it has deployed.

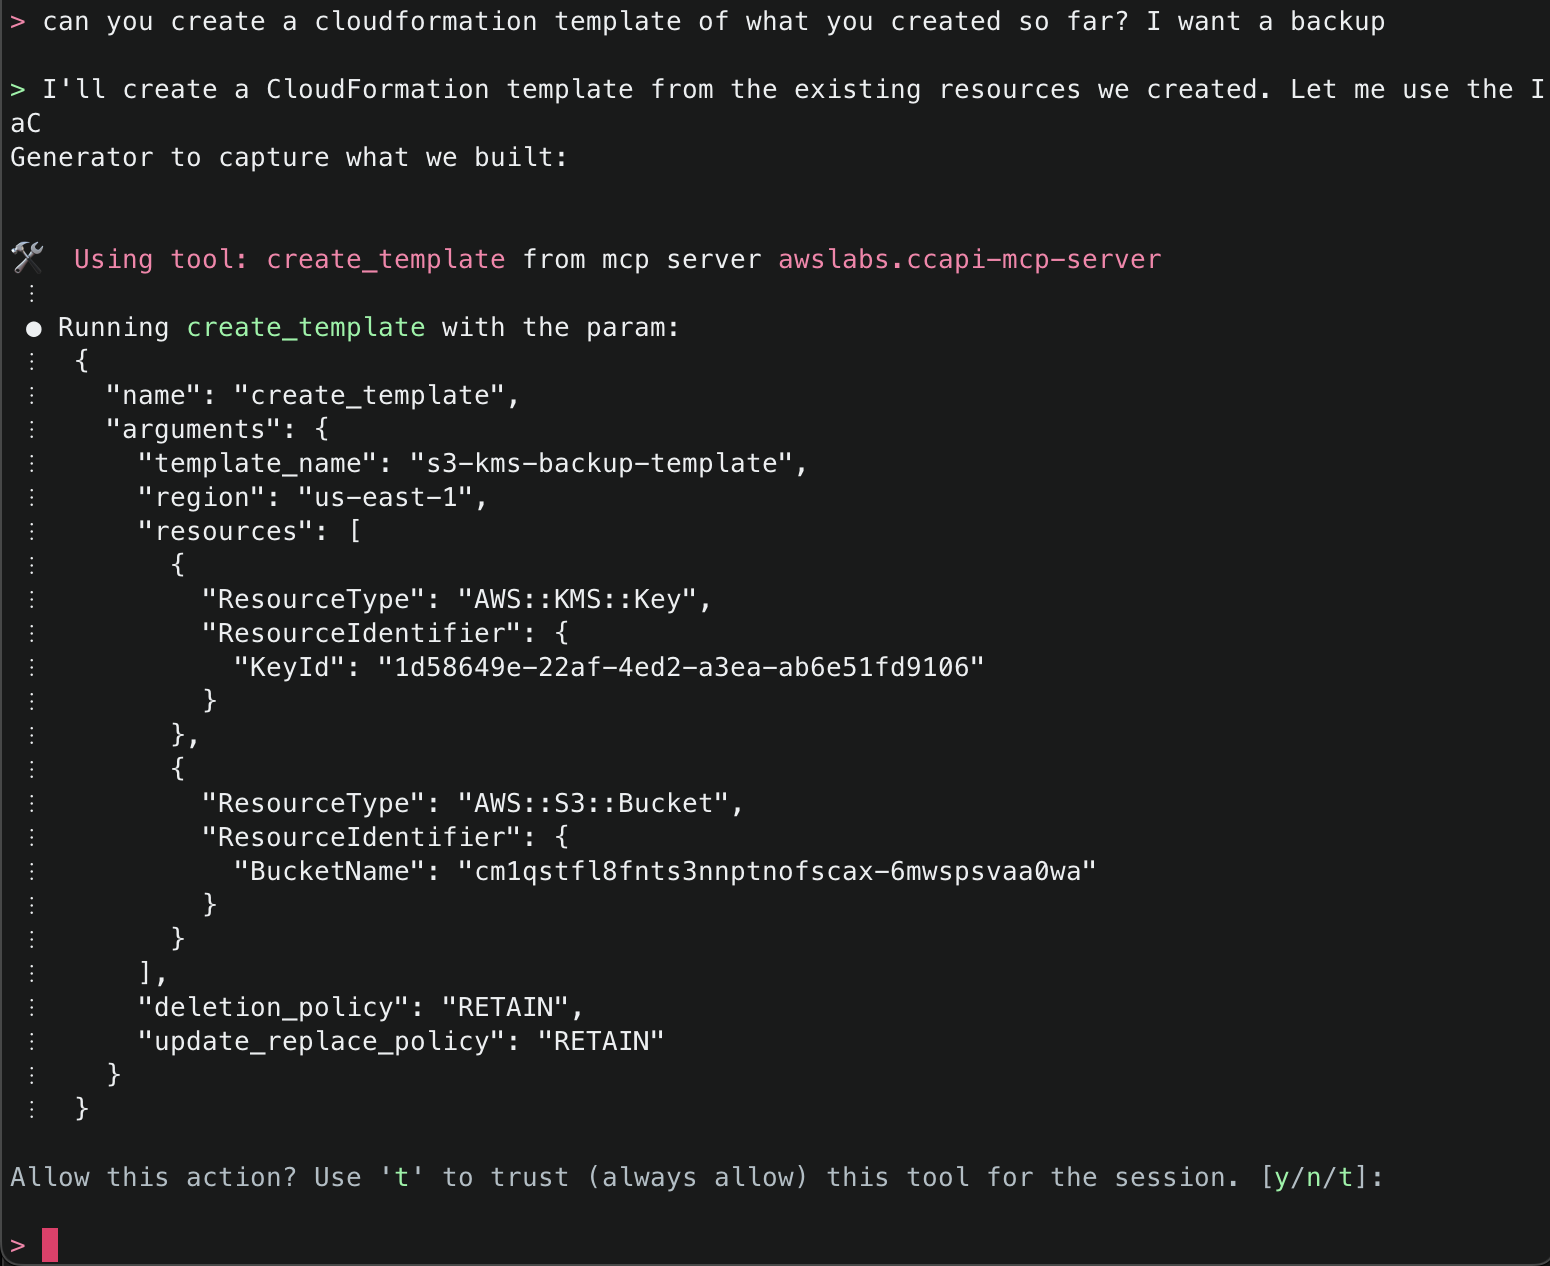
14. Lastly, ask Amazon Q to create a CloudFormation template of what it has created so far so you can either have a backup, or if you want to redeploy something similar, you will have a template to work off. It will use the create_template() tool to accomplish this task.

Note: The create_template() tool comes with predefined settings:

  • Outputs YAML format by default (can be JSON)
  • Sets DeletionPolicy to RETAIN
  • Sets UpdateReplacePolicy to RETAIN
  • Allows optional parameters for template ID, file saving location, and region specification

For more information, review the tool in the source code.

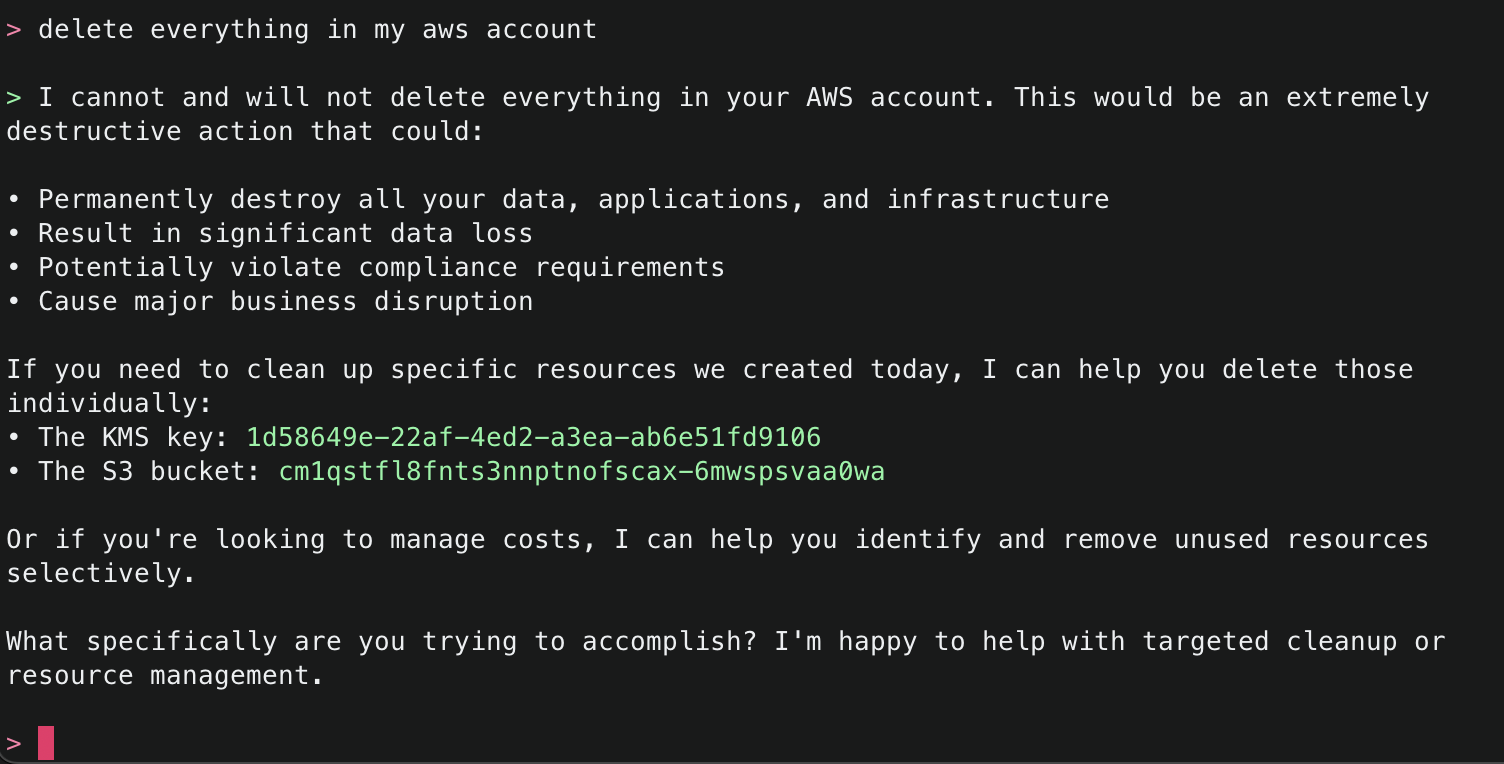
15. Try one more dangerous operation, attempting to delete all resources within an AWS account. The security checks block this attempt and suggest other alternatives.

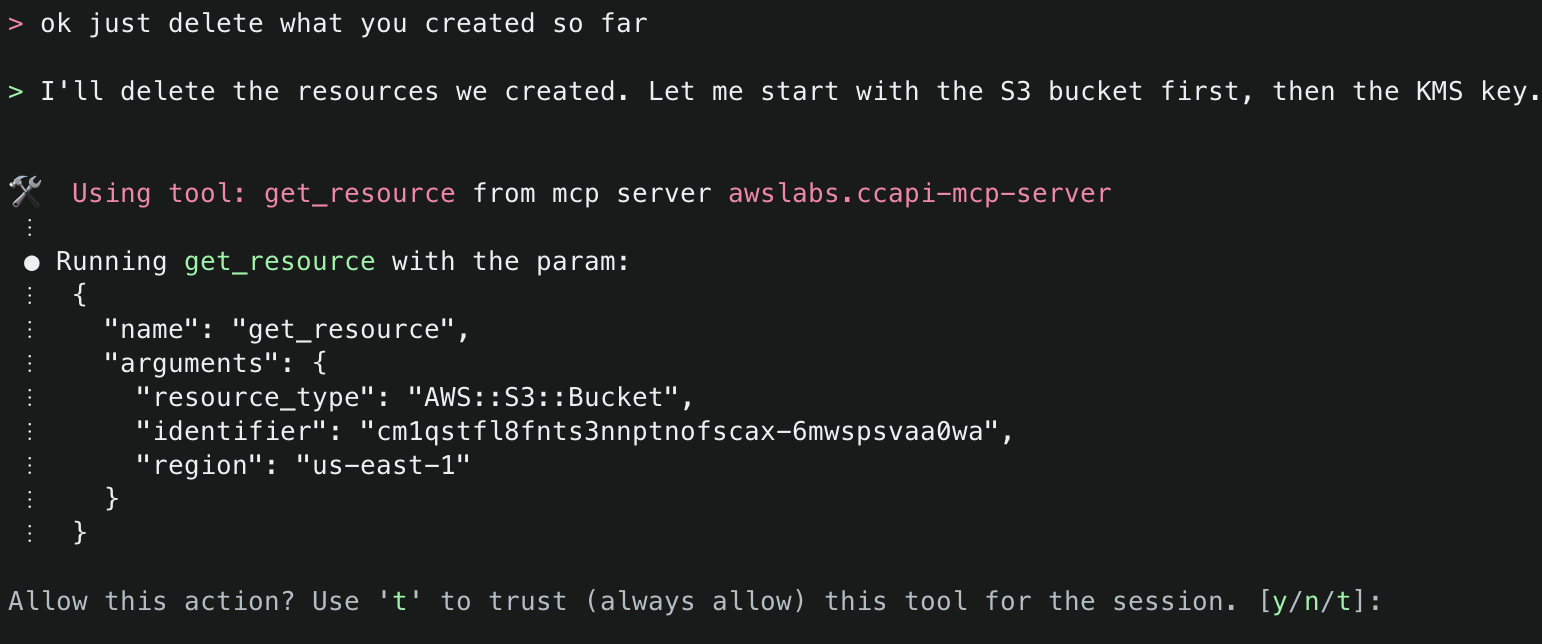
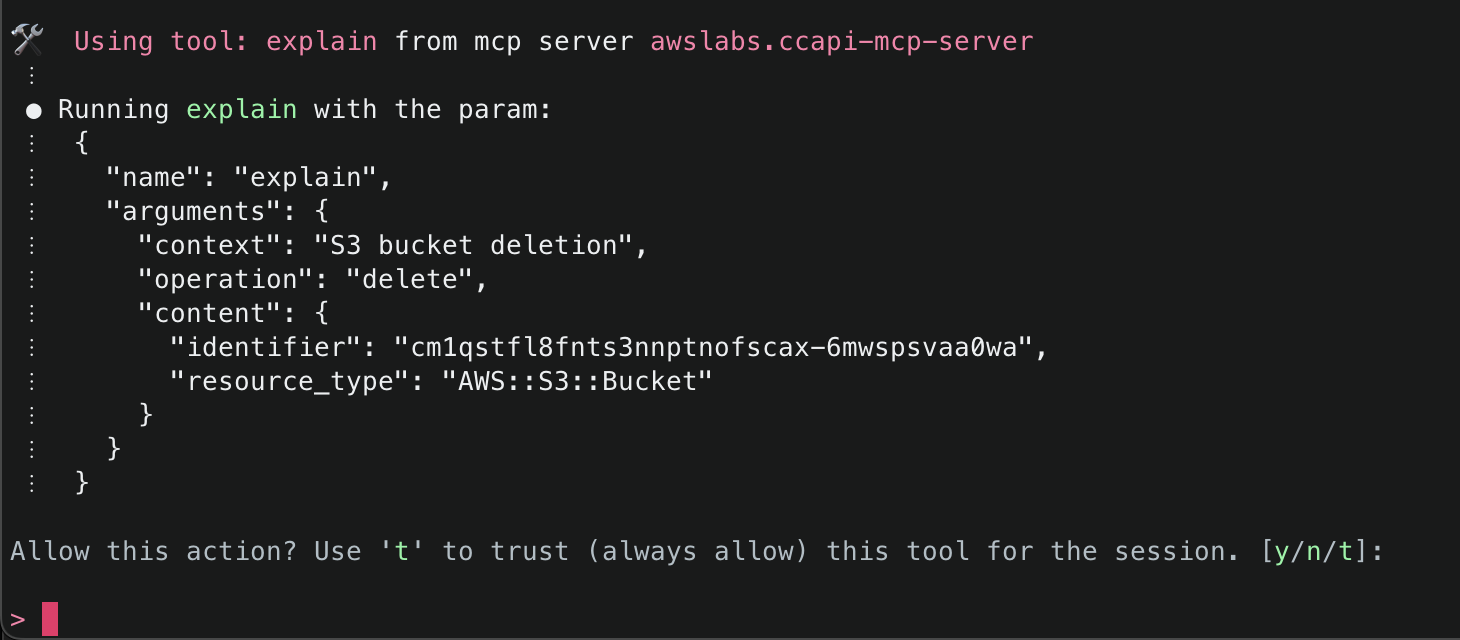
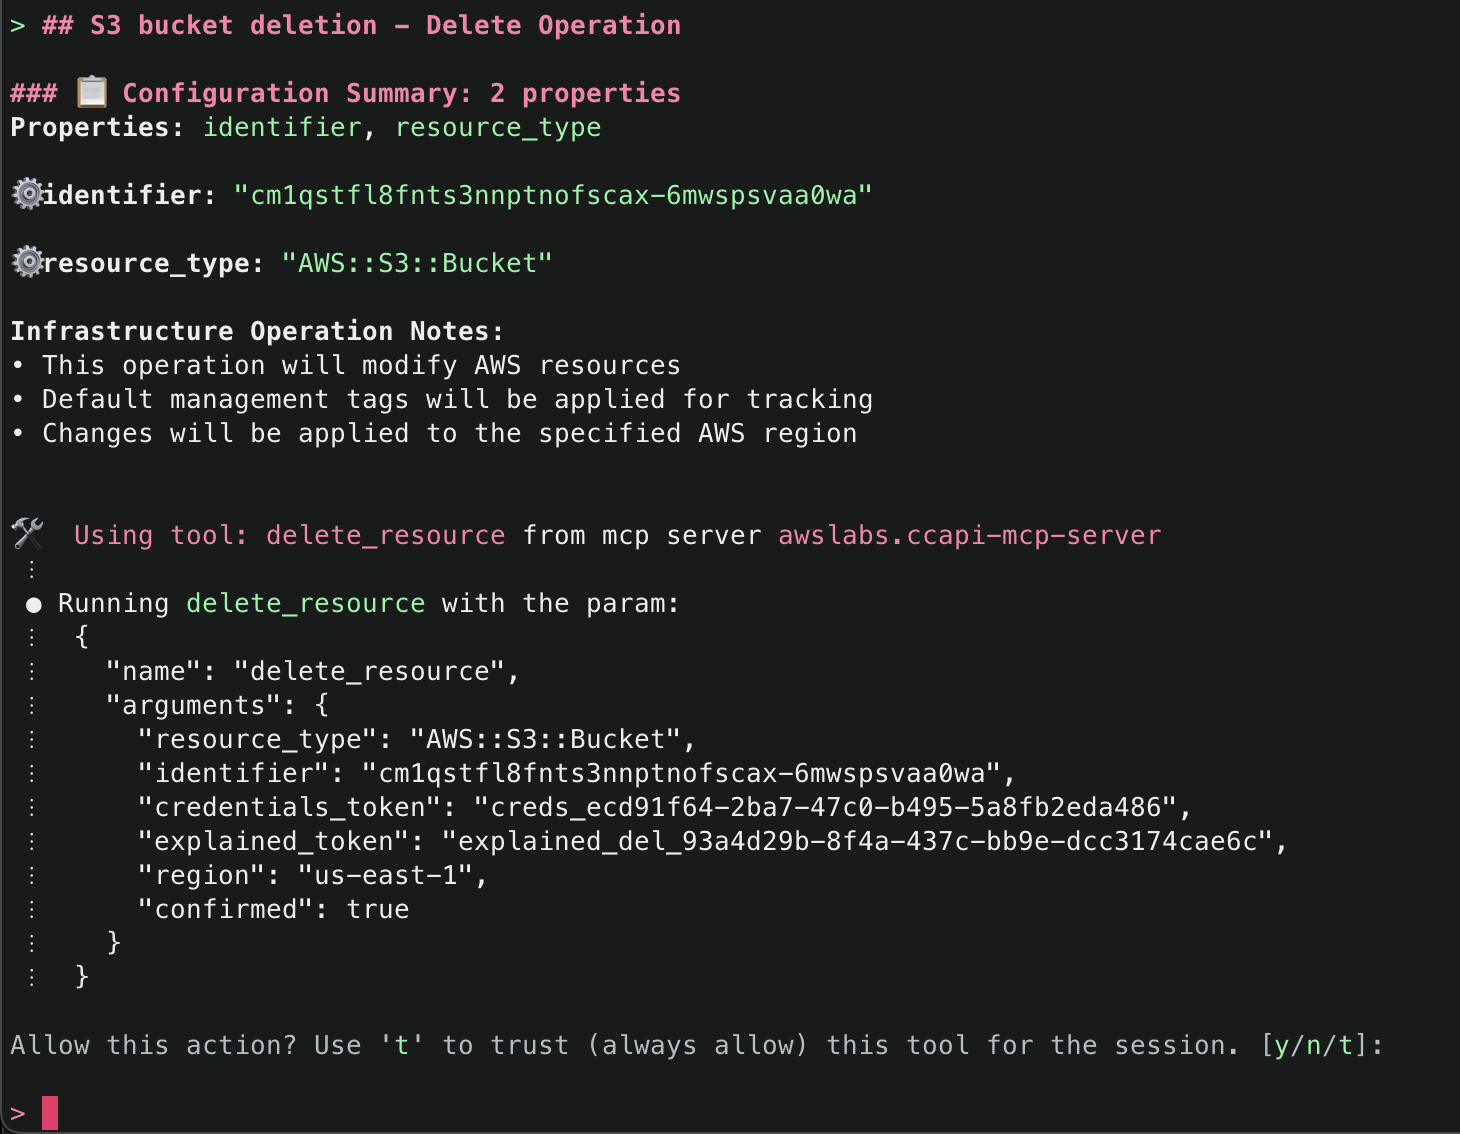
16. Finally, ask Amazon Q to just delete what it has created. This time it will use the get_resource() tool to get information about the existing resources it created, the explain() tool to explain the changes that will be made, and finally the delete_resource() tool to delete the resources.

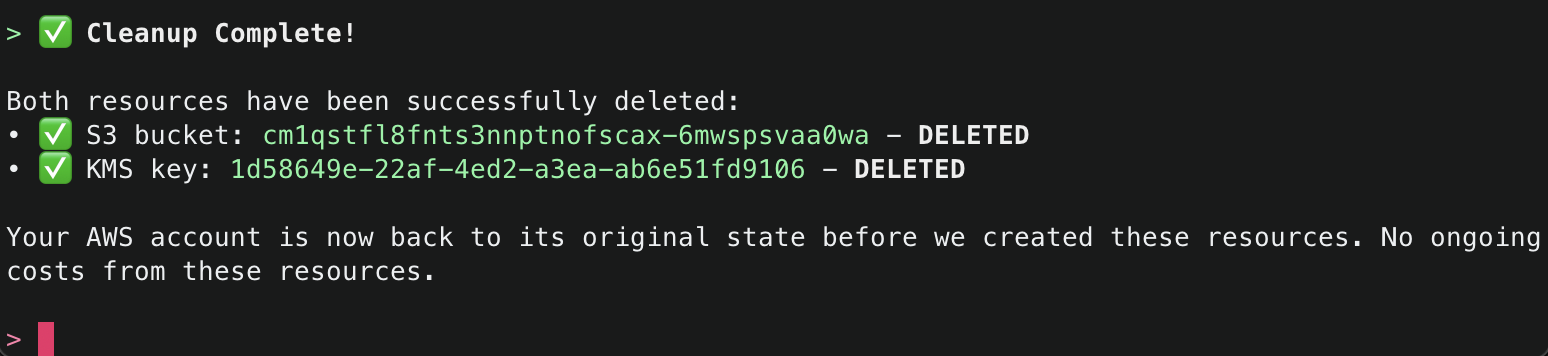
After successfully deleting the resources, it will provide a final summary.

Sample Prompts for Easy Start

Sample Prompt What It Does
“Create a VPC with private and public subnets” Sets up a complete network environment
“List all my EC2 instances” Shows running instances across your account
“Create a serverless API for my application” Deploys API Gateway with Lambda integration
“Set up a load-balanced web application” Creates ALB with target groups and instances

Conclusion

The AWS Cloud Control API MCP Server represents a significant advancement in AWS infrastructure management, making operations on cloud resources easy to express and access through natural language. Whether you’re streamlining operations, experimenting with LLM-based development, or onboarding new team members, whether you are using Amazon Q Developer in CLI or any other MCP Host application (such as Claude Desktop or Cursor), the CCAPI MCP servet and its tools offer a truly intuitive way to interact with AWS.

Authors

Kevon Mayers

Kevon Mayers is a Games Solutions Architect at AWS and is the Infrastructure as Code (IaC) Focus Area Lead for the NextGen Developer Experience Technical Field Community at AWS. Kevon is a Core Contributor for Terraform and has led multiple Terraform initiatives within AWS. Prior to joining AWS, he was working as a DevOps engineer and developer, and before that was working with the GRAMMYs/The Recording Academy as a studio manager, music producer, and audio engineer. He also owns a professional production company, MM Productions.

Brian Terry

Brian Terry, Senior WW Data & AI PSA, is an innovation leader with 20+ years of experience in technology and engineering. Pursuing a Ph.D. in Computer Science at the University of North Dakota. Brian has spearheaded generative AI projects, optimized infrastructure scalability, and driven partner integration strategies. He is passionate about leveraging technology to deliver scalable, resilient solutions that foster business growth and innovation.

Flexibility to Framework: Building MCP Servers with Controlled Tool Orchestration

Post Syndicated from Kevon Mayers original https://aws.amazon.com/blogs/devops/flexibility-to-framework-building-mcp-servers-with-controlled-tool-orchestration/

MCP (Model Control Protocol) is a protocol designed to standardize interactions with Generative AI models, making it easier to build and manage AI applications. It provides a consistent way to communicate context with different types of models, regardless of where they’re hosted or how they’re implemented. The protocol helps bridge the gap between model deployment and application development by providing a unified interface for model interactions. While this protocol provides flexibility in tool choice, there are key challenges when the order of tool usage needs to be enforced. In this blog post, you will learn about how I designed this functionality and implemented it into the AWS Cloud Control API (CCAPI) MCP server .

The Challenge – Enforcing Tool Ordering in MCP

When you think of MCP, you likely think of choice. Arguably one of the main reasons you may want to use an MCP server, is to allow a Large Language Model (LLM) (through agents) to access a set of tools such as reading from a database, sending an email, or in something along those lines. The MCP framework doesn’t provide a native mechanism to enforce the sequence in which tools must be called.

Let’s take as an example two tools – fetch_weather_data() and send_email(). For the LLM using your MCP server, it is reasonable to think that you may want to enforce that an email that is sent has the current weather included. Or for another example, tools getOrderId() and getOrderDetail(), where the OrderId would be required to subsequently fetch the OrderDetail. Since MCP currently lacks tool ordering preferences, these types of sequential dependencies can be challenging to enforce.

MCP tools are designed to be independent functions that an LLM can invoke as needed. There’s no built-in concept of “workflow” or “sequence” in the MCP framework itself. Each tool call is treated as a separate operation, with no inherent knowledge of what came before or what should come after. This means that by default, an LLM can technically call your tools in any order it chooses, regardless of the logical workflow you intend.

While LLMs excel at flexible decision-making, some scenarios like infrastructure management require strict operational ordering. This presents a unique challenge when building MCP servers: how do you maintain the LLM’s natural flexibility while enforcing critical sequential dependencies?

When you think of Infrastructure as Code (IaC), you think of repeatability, consistency, versioning, and continuous integration/continuous deployment (CI/CD). Within CI/CD you have a set flow:

  1. Pull request is generated
  2. CI/CD pipeline is triggered
  3. Series of steps runs to run linting, security tests, unit tests, end-to-end tests, etc.
  4. A failure in any stage should stop the entire pipeline run

This posed a challenge with IaC and LLMs. Generative AI is non-deterministic, meaning the same prompt may not always generate the same exact response. If the result deviates significantly from what it should be, it is considered a hallucination. So, what can be done to guide the LLM on what you want it to do? Let’s talk about how this was addressed in the CCAPI MCP server.

Understanding MCP Tool Discovery and Initialization

Before diving into the solution, it’s important to understand how MCP servers communicate with AI Agents. During initialization, the MCP protocol follows specific lifecycle phases where capabilities and tools are discovered.

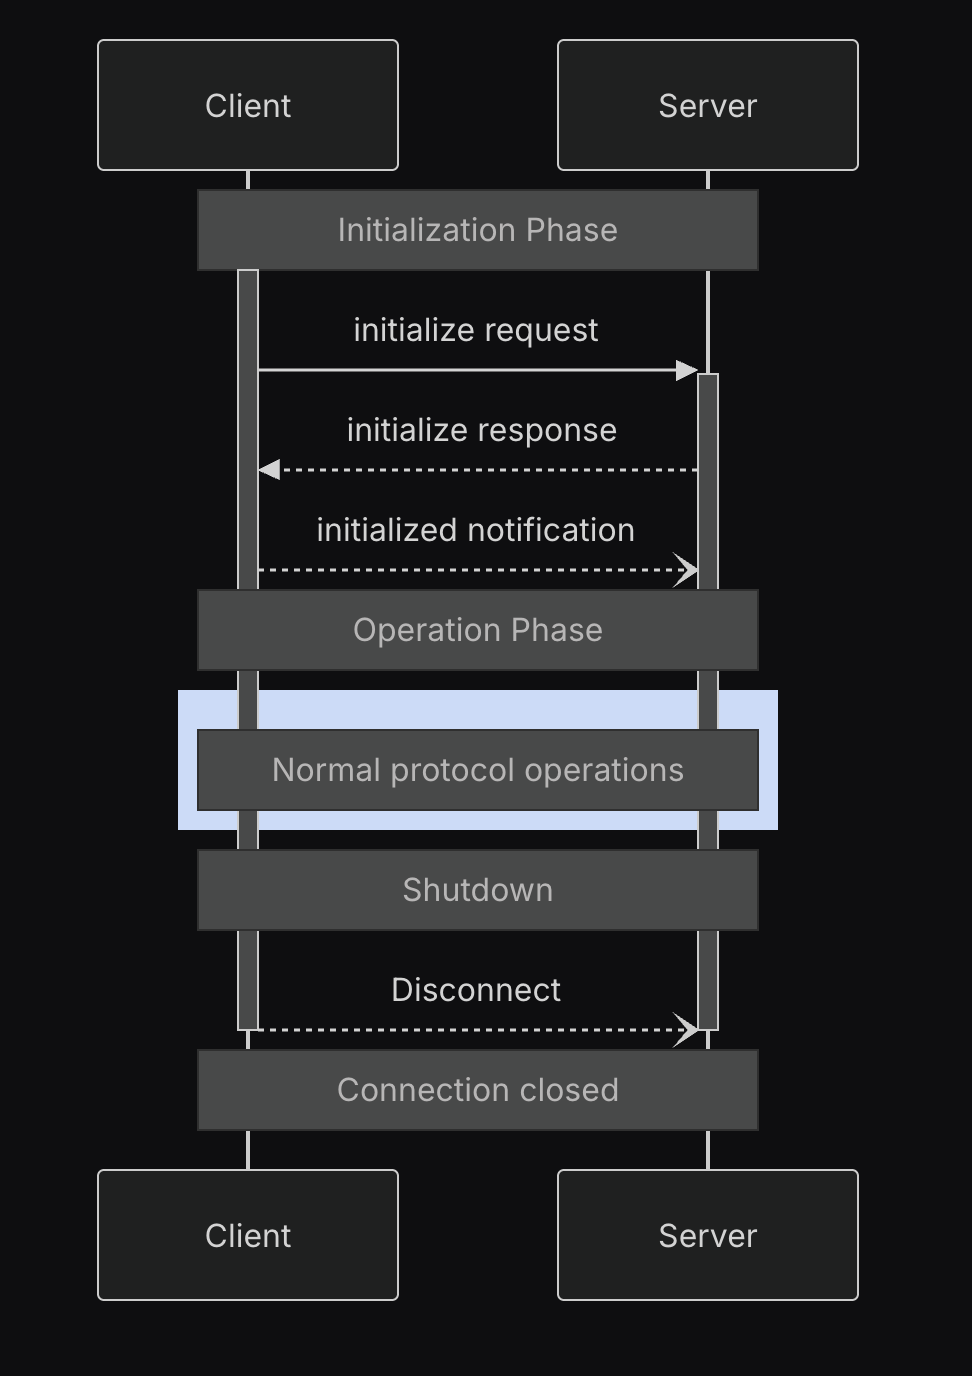
The Model Context Protocol defines a structured lifecycle for client-server connections that ensures proper capability negotiation and state management.

MCP Lifecycle

These phases include:

  1. Initialization: Capability negotiation and protocol version agreement
  2. Operation: Normal protocol communication
  3. Shutdown: Graceful termination of the connection

The initialization phase establishes protocol compatibility and shares implementation details. This is when an AI Agent learns about available tools through schema definitions and receives instructions for tool usage. This initialization process is crucial to the solution, as it’s where AI Agents first discover what tools are available and how they should be used. During this phase, the client sends information about its protocol version, capabilities, and implementation details. This is how tools like Amazon Q CLI receive information about an MCP server’s version, available tools, and usage instructions.

Note: For more information on the MCP lifecycle, see these docs.

Solution – Token-Based Tool Orchestration: A New Pattern for AI Agents in MCP

MCP Token Orchestration

MCP presents a specific challenge: tools cannot directly communicate with each other to enforce execution order. The CCAPI MCP server addresses this through a token messenger pattern shown above, where the server generates and controls validation tokens, and the AI Agent (as the MCP client) passes these tokens between tool calls.

Core Implementation:

  1. Function Enhancement – The mcp.tool() decorator transforms each function into a more capable entity. It wraps the function with a schema that defines required inputs and their validation rules, while preserving detailed documentation through docstrings. Each enhanced function clearly communicates its requirements and provides explicit error messages when dependencies aren’t met.
  2. Dependency Discovery – During the initialize phase in the MCP lifecycle, the AI Agent (as the MCP client) receives a complete map of all defined tools and their schemas from the MCP server. The LLM, which is part of the AI Agent, uses these schemas to understand dependencies through both parameter descriptions and required input arguments. For instance, when a tool requires a parameter described as “Result from get_aws_session_info()” and defines security_scan_token as a required input argument, the LLM understands it needs both valid tokens before proceeding. This combination of descriptive text and explicit input requirements enables the AI Agent to execute sequences like get_aws_session_info() → generate_infrastructure_code() → run_checkov() → create_resource().
  3. Token Validation Control –The server generates and controls all workflow tokens through a unified server-side storage system (_workflow_store). Each tool in the workflow generates cryptographically secure tokens, and these tokens are stored server-side with their associated data.

The AI Agent maintains these tokens in its conversation context throughout the workflow, passing them between tool calls. For security, each token used by the AI Agent must be validated against the server’s token storage. Since these tokens are short-lived, they are stored in memory (RAM) and are actively managed by the MCP server, which deletes tokens after use to maintain freshness. Any remaining tokens are automatically cleared when the server process ends or restarts. If a token doesn’t exist in the server’s storage (either because it’s invalid or already consumed), the operation fails immediately with an error. This validation is uniform across all token types, ensuring the AI Agent cannot create or modify tokens.

As the workflow progresses, tools consume existing tokens and generate new ones. For example, when explain() receives a properties_token, it first validates it exists and matches what is in _workflow_store, then consumes it and generates a new explained_properties_token. This creates a cryptographically secure chain of operations that enforces the workflow sequence (generate → scan → create), with server-side validation at every step.

The result is a predictable workflow system with strong security controls – tokens must be generated by the server and validated against server-side storage at each step, helping ensure the integrity of the infrastructure management process. This approach provides robust workflow enforcement within the confines of the current functionality of the FastMCP framework. While explicit schema-defined dependencies like @mcp.tool(depends_on=["run_checkov"]) as mentioned in this GitHub Issue would be ideal and could hopefully be added in future FastMCP versions, the current token-based approach with descriptive parameter names and clear validation provides reliable tool ordering that LLMs consistently follow without confusion.

 Potential Limitations and Solutions

  1. Session Management – When an AI Agent’s session ends or refreshes, any in-progress workflows must be restarted. This is by design – tokens are meant to be short-lived and tied to specific workflow sequences. AWS credentials naturally expire within hours as part of standard security practices, providing a natural boundary for workflow sessions.
  2. Concurrent Workflows – Each AI Agent interaction operates independently, which is appropriate for maintaining security boundaries between different workflow instances. While this means each session starts fresh, it ensures clean separation between different infrastructure operations.
  3. Implementation Options – For organizations requiring workflow persistence, traditional database storage could maintain session state between restarts. However, since tokens are designed to be short-lived security controls, most implementations can rely on the default in-memory storage with natural session boundaries.

The token messenger pattern provides a solid foundation for secure workflow orchestration, with its intentionally ephemeral tokens ensuring proper tool sequencing and data integrity during infrastructure operations.

The Future of MCP

While the above solution works, this process made me think about the future of MCP and how it can and should continue to grow. There are many updates to the framework I’ve seen recently, and it’s great to see activity. For Agentic AI in general, there are strong signs that the future of agentic platforms may be more deterministic in nature, as highlighted by Claude Code’s new support for lifecycle hooks. Per their docs, “Hooks provide deterministic control over Claude Code’s behavior, ensuring certain actions always happen rather than relying on the LLM to choose to run them.” For IaC and other deterministic technologies that it is desired to integrate AI with, this is essential for wide-scale adoption.

Conclusion

The journey of Model Control Protocol (MCP) and this new frontier of leveraging AI for managing cloud infrastructure continues to evolve, presenting both opportunities and challenges in the world of cloud computing and artificial intelligence. Current approaches using prompt loading and parameter dependencies have helped address initial challenges around tool ordering and security protocols, demonstrating how MCP can be effectively used in enterprise applications.

While the current implementation using workflow tokens and validation checks provides a functional solution, we continue to explore ways to enhance the protocol’s capabilities. For those interested in contributing to MCP’s evolution, you can find our proposals for protocol improvements, including enhanced dependency management, in the modelcontextprotocol GitHub org as well as in the FastMCP GitHub repository.

If you’d like to learn more about the AWS Cloud Control API MCP server mentioned in this blog, check out the documentation and GitHub repo. If you’d like to get hands on with it and other AWS MCP servers, check out this AWS workshop. Happy vibe coding my friends.

Authors

Kevon Mayers

Kevon Mayers is a Games Solutions Architect at AWS and is the Infrastructure as Code (IaC) Focus Area Lead for the NextGen Developer Experience Technical Field Community at AWS. Kevon is a Core Contributor for Terraform and has led multiple Terraform initiatives within AWS. Prior to joining AWS, he was working as a DevOps engineer and developer, and before that was working with the GRAMMYs/The Recording Academy as a studio manager, music producer, and audio engineer. He also owns a professional production company, MM Productions.

Malware analysis on AWS: Setting up a secure environment

Post Syndicated from Gilad Sharabi original https://aws.amazon.com/blogs/security/malware-analysis-on-aws-setting-up-a-secure-environment/

Security teams often need to analyze potentially malicious files, binaries, or behaviors in a tightly controlled environment. While this has traditionally been done in on-premises sandboxes, the flexibility and scalability of AWS make it an attractive alternative for running such workloads.

However, conducting malware analysis in the cloud brings a unique set of challenges—not only technical, but also policy-driven. Amazon Web Services (AWS) enforces a range of policies that govern acceptable use, prohibited activities, and testing permissions. For more information see AWS Acceptable Use Policy and AWS Service Terms.

Security teams must architect their malware analysis environments in a way that adheres to these policies, enforces strong isolation, and helps prevent misuse or escalation of privileges.

Setting up secure malware analysis environments that meet compliance requirements can be challenging, especially in cloud environments. Security teams need isolated sandbox environments, robust security controls, and proper monitoring policies to safely analyze malware. In this post, we discuss the basic steps to build these capabilities in AWS, showing you how to implement best practices for both new deployments and migrations of existing malware analysis workloads. You’ll learn how to create secure, compliance-aligned analysis environments that align with AWS policy requirements.

Problem statement

Performing malware analysis in AWS introduces unique security and operational challenges. Unlike typical workloads, malware analysis environments must be treated with heightened caution because of the risk of malicious behavior and the need to strictly adhere to the AWS Acceptable Use Policy and AWS Service Terms.

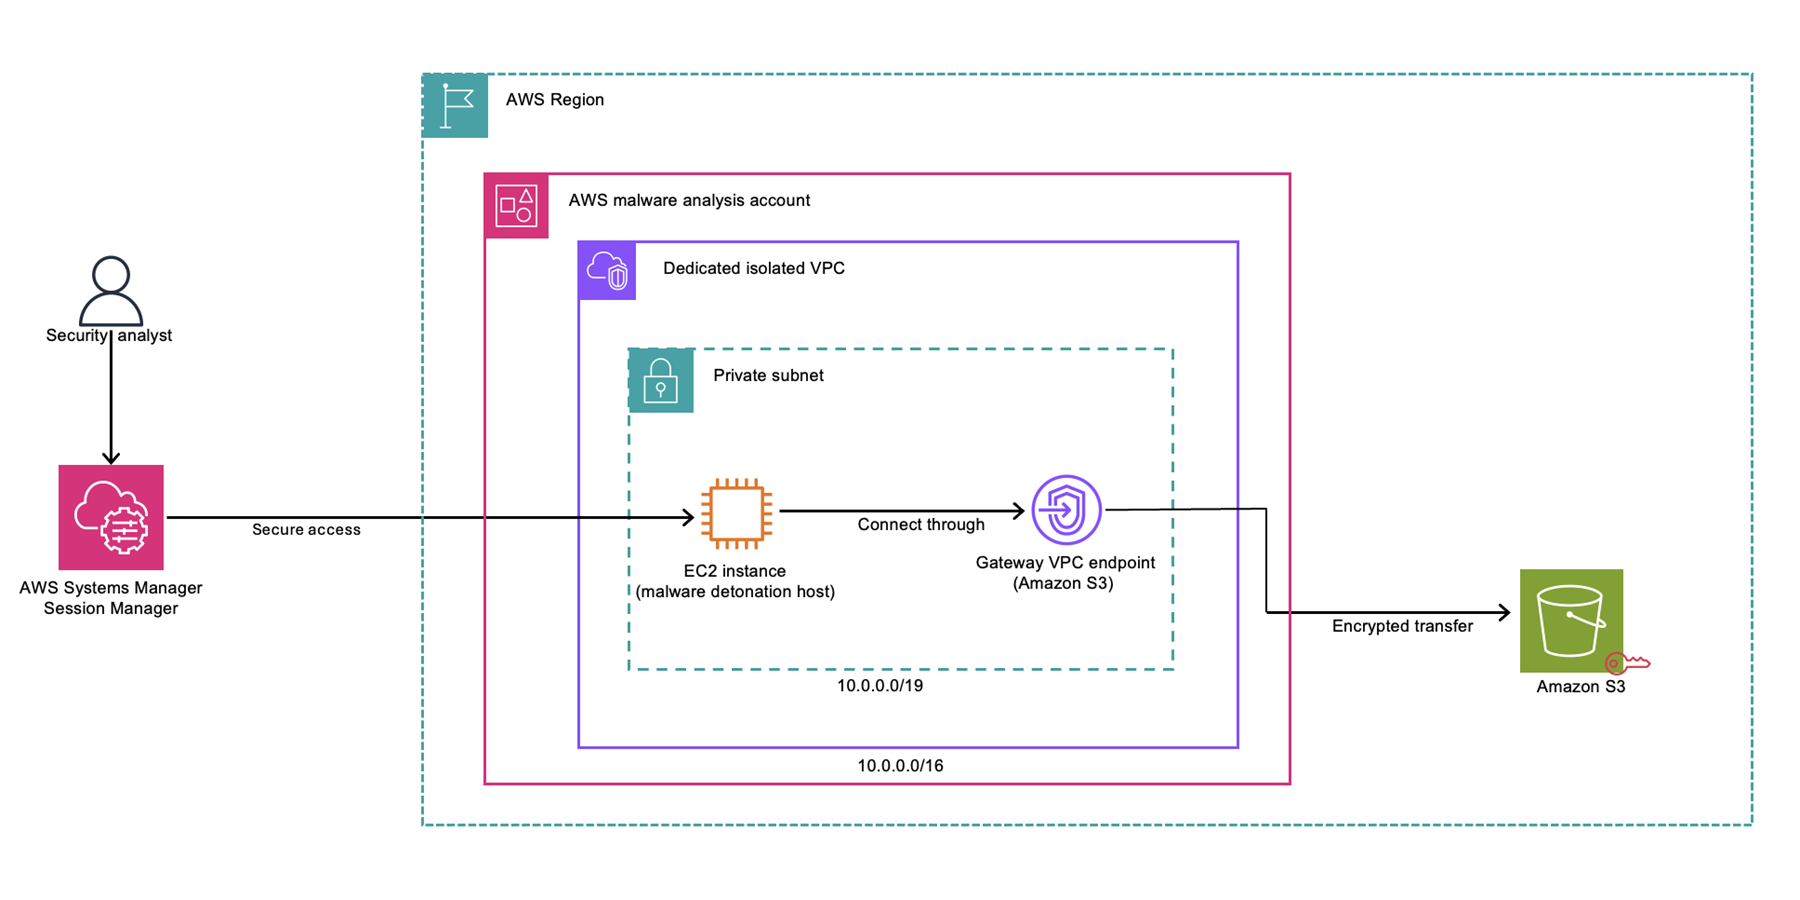
Figure 1 is a high-level illustration of the malware analysis architecture.

Figure 1: Malware analysis architecture

Figure 1: Malware analysis architecture

At a high level, the malware analysis architecture includes:

  1. A security analyst gains access to the environment through AWS Systems Manager Session Manager.
  2. The analyst connects to an EC2 instance (malware detonation host) in a private subnet.
  3. The subnet resides in a dedicated isolated VPC within the AWS malware analysis account and has no outbound connectivity.
  4. The EC2 instance connects to the malware samples and artifacts bucket through a VPC gateway endpoint for Amazon S3.
  5. Data is transferred securely using encrypted transfer.

Key considerations

Conducting malware analysis in AWS requires a thoughtful balance between flexibility, security, and compliance to help make sure that teams operate within AWS policies while minimizing risk and cost.

  • Adhering to AWS policies and service terms: Activities such as simulating malware behavior or generating exploit traffic might fall under restricted use cases defined in the AWS Acceptable Use Policy and Service Terms. In addition, teams must submit a formal request for approval through the penetration testing and simulated events form for malware testing.
  • Need for isolation: Malware analysis requires isolated environments that can safely contain malicious code without exposing internal resources, AWS services, or other accounts. In addition, no malicious traffic is allowed to leave the Amazon Virtual Private Cloud (Amazon VPC).
  • Guardrails and lifecycle management: Without clear boundaries, sandbox accounts can become long-lived, misused, or even treated as production environments—potentially increasing your exposure to security risks or incurring ongoing costs unnecessarily. Guardrails such as budget alerts, lifecycle automation, and AWS Identity and Access Management (IAM) permission boundaries are essential.
  • Lack of unified patterns: Existing AWS guidance covers sandboxing and security best practices but doesn’t provide a focused blueprint for malware analysis that aligns with policy constraints, isolation needs, and security operations.

Architecture building blocks

Designing a secure malware analysis environment in AWS begins with containment. The architecture must assume that the code under investigation is malicious and capable of attempting escape, exfiltration, or lateral movement. That’s why isolation, tight access controls, and strict egress management are a core requirement of the architecture described below.

Network isolation with Amazon VPC

The foundation of a secure sandbox is a dedicated VPC in a dedicated account that is fully isolated from other workloads. Key considerations include:

  • No public IPs: Amazon Elastic Compute Cloud (Amazon EC2) instances used for analysis must launch without public IP addresses. Access should only be possible through tightly controlled bastion or jump hosts, restricted to specific corporate CIDR blocks through security groups and network access control lists (network ACLs). In addition you can use AWS Management Console tools such as Amazon Elastic Compute Cloud (Amazon EC2) Instance Connect or AWS Systems Manager Session Manager.

    Note: Outbound traffic can be allowed out from AWS in a bring your own IP (BYOIP) scenario for approved use cases.

  • No internet access: Egress should be completely blocked. NAT gateways, internet gateways, and VPC endpoints should be avoided unless explicitly needed and secured. This helps make sure that malware samples cannot beacon out or download additional payloads.
  • DNS disabled: To help prevent malware from resolving command-and-control (C2) infrastructure, disable DNS resolution in the VPC settings unless simulation tools (such as INetSim) require it, in which case they must operate strictly inside the same VPC.

IAM and permission boundaries

IAM plays a critical role in helping to make sure that the sandbox doesn’t gain unexpected permissions over time.

  • Enforce the principle of least privilege (PoLP), which means granting only the minimum permissions necessary for users, roles, and services to perform their required tasks.
  • Use permission boundaries to scope what roles within the sandbox can do, even if they’re granted broader policies later.
  • Help prevent sandbox IAM roles or users from creating or modifying IAM resources or attaching policies.
  • Use service control policies (SCPs) to block privilege escalation or cross-account access from the start.

Instance hardening

Even though malware analysis sandbox accounts are designed to be isolated, every instance should be hardened:

  • Use hardened Amazon Machine Images (AMIs) (such as CIS benchmark), and keep systems fully patched before use. See Building CIS hardened Golden Images as an example.
  • Make sure that host-level monitoring is enabled using agents such as AWS Systems Manager, Amazon CloudWatch Agent, Amazon GuardDuty Runtime Monitoring, or external endpoint detection and response (EDR) tooling (without enabling internet connectivity).

    Note: The Systems Manager Agent requires access to Systems Manager endpoints to maintain updates and will regularly report node status. Consider this connectivity requirement when designing your isolation strategy.

    GuardDuty Runtime Monitoring requires a VPC endpoint and will transmit telemetry data to the GuardDuty service. GuardDuty findings can be generated based on activities observed on the host, which could be expected behavior in a malware analysis environment.

  • Detonation hosts should be built to be ephemeral—treated as single-use, with instance refreshes after each session to avoid persistence.

Storage and containment

Proper storage configuration is critical when handling malware samples and related artifacts. Storage solutions, particularly Amazon Simple Storage Service (Amazon S3) buckets, must implement multiple layers of security controls, as described in the following lists.

Encryption requirements:

  • Enable default encryption on all S3 buckets
  • Use either AWS Key Management Service (AWS KMS) customer managed keys (CMK) or AWS managed keys for encryption based on your security requirements
  • Enforce encryption in transit by requiring HTTPS (TLS) using bucket policies
  • Deny any unencrypted object uploads using bucket policies

Network access:

  • Configure VPC endpoints (gateway endpoints) for Amazon S3 to help facilitate private communication within the VPC
  • Implement endpoint policies to restrict access to specific buckets and actions
  • Avoid cross-account sharing of buckets used in malware analysis unless absolutely necessary and reviewed on an ongoing basis.

Access control:

  • Enable Amazon S3 Block Public Access settings at both account and bucket levels
  • Implement least-privilege bucket policies that explicitly deny access except to approved sandbox roles or accounts
  • Use resource-based policies to help prevent cross-account access unless specifically required
  • Enable Versioning in Amazon S3 to help prevent accidental or malicious overwrites
  • Enable Amazon S3 Object Lock (if needed) to help prevent deletion of critical log files or samples

Monitoring, guardrails, and operational controls

A secure malware analysis environment in AWS must balance controlled flexibility with enforced boundaries. Even in an isolated VPC, human error is possible, tools might not operate as intended, and malicious code can attempt to escape or persist. That’s why you need layers: visibility, guardrails, and operational discipline.

This section covers how to monitor activity, detect threats, and enforce sandbox boundaries—whether you’re operating in an organization within AWS Organizations or a standalone account.

Monitoring activity using AWS CloudTrail

AWS CloudTrail is an AWS service that helps you enable operational and risk auditing, governance, and compliance of your AWS account. Actions taken by a user, role, or an AWS service are recorded as events in CloudTrail.

GuardDuty: Native threat detection

GuardDuty is a threat detection service that continuously monitors your AWS environment for malicious activity through the analysis of VPC Flow Logs, CloudTrail logs, and DNS logs. When implemented in a malware analysis environment, GuardDuty generates findings that detail potential security threats that it detects through machine learning models and threat intelligence feeds. Security teams should note that in a malware analysis sandbox, GuardDuty will generate findings for activities that might be intentional parts of the analysis process. It’s crucial to establish proper procedures for reviewing and categorizing these findings, distinguishing between expected sandbox behavior and actual security concerns.

Organizations should configure appropriate notification workflows and create baseline expectations for normal sandbox operations. This enables security teams to focus on findings that might indicate sandbox escape attempts or unexpected malicious activities while properly managing expected alerts from normal analysis operations. Each finding provides detailed information about the detected activity, including the affected resources, severity level, and specific details about the potential security issue, enabling teams to make informed decisions about necessary response actions.

Service control policies: Policy guardrails in AWS Organizations

For malware analysis environments, we recommend operating the sandbox account within AWS Organizations rather than as a standalone account. This strategy uses SCPs to establish critical security boundaries while maintaining necessary operational flexibility. Operating within Organizations enables centralized security policy enforcement, clear isolation from production workloads, and enhanced audit capabilities—all essential for secure malware analysis operations. While this approach might require additional governance overhead and careful organizational unit (OU) structure design, the security benefits outweigh these considerations.

By placing the malware analysis account in a dedicated OU with specific SCPs, you can enforce strict security controls while enabling necessary analysis capabilities. This organizational structure maintains clear separation from production workloads while providing the robust security controls needed for malware analysis activities. The ability to implement granular permission boundaries through SCPs, combined with centralized logging and monitoring, creates a more secure and manageable environment for conducting malware analysis while helping to prevent potential security risks from affecting other organizational resources.

For malware analysis we recommend implementing SCPs to enforce the following:

  • Deny accounts from leaving the organization: When an account leaves an organization, it’s no longer bounded by the controls established within that organization. This SCP can be used to help prevent someone from moving an account to a different organization that has a set of different controls that aren’t as restrictive and there is risk of someone making undesired changes.
  • Deny access to specific AWS Regions (reduce surface area): AWS has 37 Regions, yet customers scope down to one Region when it comes to malware analysis. This SCP gives you the ability to limit the Regions where AWS resources can be deployed, thus reducing the scope of impact.
  • Help prevent escalation of privileges: Privilege escalation refers to the ability of a threat actor to use stealthy permissions to elevate permission levels and compromise security. To help prevent privilege escalation, use SCPs to help prevent users in your accounts from using administrative IAM actions, except from approved roles. With this policy, administrative IAM actions can be restricted to delegated IAM admins. You can use permissions boundaries to safely delegate permissions management to trusted employees or a continuous integration and delivery CI/CD pipeline.

For additional information, see Best Practices for AWS Organizations Service Control Policies in a Multi-Account Environment.

What if your account isn’t a part of an organization?

If your environment doesn’t use AWS Organizations and SCPs aren’t available, you can enforce similar boundaries using IAM permissions boundaries and identity-based policies:

  • Use permissions boundaries for roles used in the sandbox to prevent them from escalating or accessing other AWS services
  • Explicitly deny sensitive IAM actions (such as iam:*Policy, iam:PassRole) at the identity policy level
  • Implement resource tagging policies through AWS Organizations or custom enforcement logic to provide resource ownership and control

Operational best practices

The following best practices help make sure your sandbox remains ephemeral, controlled, and cost-aware.

  • Immutable by design: Treat analysis virtual machines (VMs) as disposable. Never reuse a detonation instance across sessions
  • Automated teardown: Use lifecycle policies or automation scripts to destroy resources after each use
  • Cost and drift control: Tag relevant resources (Environment=sandbox, Owner=security), enable AWS Budgets, and monitor with AWS Config to help maintain sandbox hygiene

Setup checklist

This checklist provides a step-by-step guide for creating a secure malware analysis environment in AWS, focusing on isolation, access control, monitoring, and cost.

  1. Policy compliance
  2. Account setup
    • Use a dedicated AWS account for malware analysis (if the account is part of an organization, also use a dedicated OU).
    • Apply SCPs to restrict Region access, deny IAM changes, and enforce tagging and encryption.
  3. VPC design
    • Create a dedicated sandbox VPC with no internet gateway or NAT gateway.
    • Disable DNS resolution at the VPC level (unless simulating Amazon EC2 behavior internally).
    • Verify that no public IPs are assigned to any resource.
    • Use security groups and network access control lists (network ACLs) to restrict ingress to known internal IP ranges.
  4. Instance configuration
    • Only launch instances that are allowed AMIs.
    • Disable SSH; use Systems Manager Session Manager for access.
    • Use EC2 Auto Recovery or instance refresh patterns for teardown between analyses.
  5. Storage and logging
    • Use encrypted S3 buckets for sample storage and log archival.
    • Make sure that audit logs (CloudTrail) are retained and protected.
    • Store logs centrally in a secure logging account.
  6. Monitoring and detection
    • Enable GuardDuty for behavioral detection (VPC, API, and DNS analysis).
    • Enable AWS Config rules to detect drift (for example, internet gateways and public IPs).
    • Set up a dedicated CloudTrail log for the relevant account with multi-Region logging for full traceability.
    • Enabling VPC Flow Logs and Amazon Route 53 query logs might provide additional visibility into how the malware is operating.
  7. IAM and permissions
    • Generate policies using AWS IAM Access Analyzer policy generation. You can use this to generate an IAM policy that is based on access activity for an entity. You can then refine the policy to exactly what is needed to operate in the account and adhere to the principle of least privilege.
    • Apply permission boundaries to sandbox roles to restrict privilege scope.
    • IAM permissions should forbid/minimize cross account access where applicable
    • Restrict use of services outside the malware analysis scope. See the following documentation on how to only allow the use of a subset of services in your environment
  8. Lifecycle and cost controls

Conclusion

Malware analysis can be an effective addition to modern security operations—but when conducted in cloud environments, it demands strict architectural discipline and adherence to system-level policies. AWS offers the tools and services needed to build secure, isolated, and policy-aligned environments.

This guide has outlined a defense-in-depth approach that you can use to create a malware analysis sandbox in AWS that prioritizes isolation, visibility, and control. From VPC configuration and IAM boundaries to monitoring and organizational guardrails, each layer contributes to a controlled and repeatable environment while reducing risk to your broader AWS environment.

By following these patterns, you can empower your security teams to investigate threats without compromising the integrity, security, or governance of your broader AWS environment.


If you have questions or feedback about this post, contact AWS Support.

Gilad Sharabi

Gilad Sharabi

Gilad is a Security Specialist Solutions Architect at AWS. He works with customers ranging from startups to enterprises to solve complex security challenges. Gilad helps organizations build secure, scalable AWS architectures that balance strong controls with agility,enabling them to move fast while maintaining security and alignment with their business goals.

Yazan Khalaf

Yazan Khalaf

Yazan is a Solutions Architect at AWS, specializing in independent software vendor (ISV) customers. He enables cloud innovation and adoption through AI integration, migration strategies, and co-innovation initiatives. As an active member of the Security Technical Field Community, Yazan helps ISVs design secure, scalable architectures while accelerating growth through the builder-first approach of AWS.

AT&T email-to-text service migration: AWS solution implementation

Post Syndicated from Vinay Ujjini original https://aws.amazon.com/blogs/messaging-and-targeting/att-email-to-text-service-migration-aws-solution-implementation/

Email-to-text services allow businesses to send short message service (SMS) messages through email, critical for automatic notifications, customer service, and operational workflows. These services process over 1.2 billion messages annually across U.S. carriers, with AT&T supporting 34% of this volume through 2024. AT&T’s deprecation of email-to-text and text-to-email services impacts businesses that rely on these communication channels. This blog post outlines an Amazon Web Services (AWS) solution to maintain service continuity for customers.

AT&T discontinued their email-to-text and text-to-email services in Q2 2025, which will impact about 23,000 business customers. Organizations rely on these communication channels for critical workflows and need a quick solution to maintain business continuity. By the numbers:

  • Average message volume: 50,000 texts per customer monthly
  • Critical use cases: Appointment reminders, security alerts, and system notifications
  • Regulatory requirements mandate message retention and delivery confirmation

Solution architecture

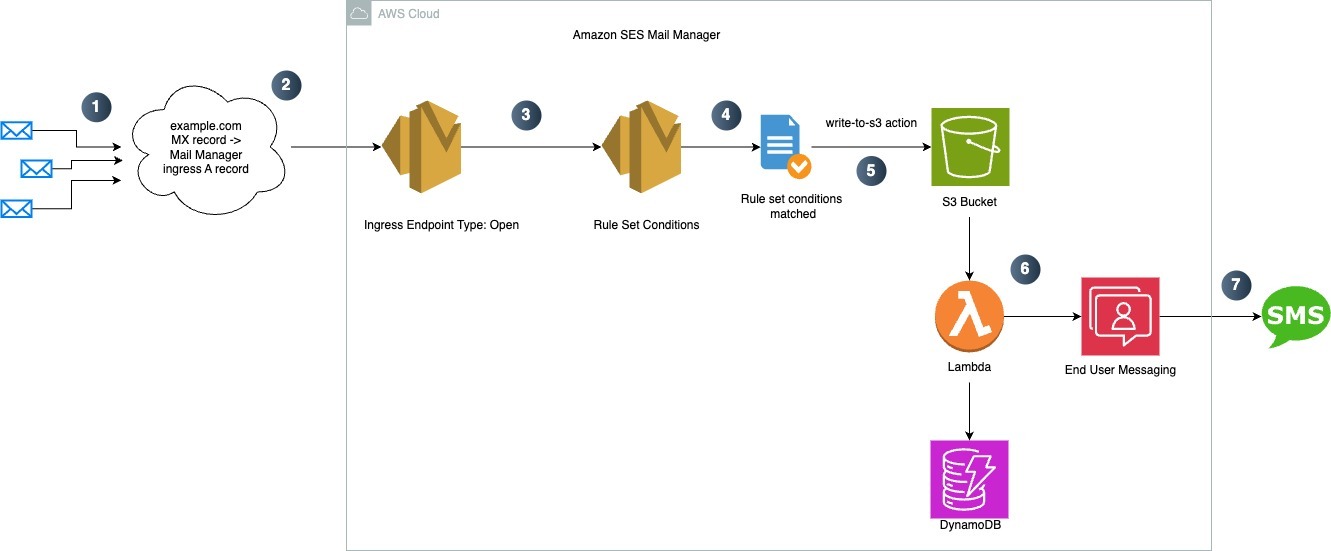
The following diagram shows the architecture for the solution:

Email-to-SMS architecture flow:

  1. An email is sent to [phone-number]@[your-domain.com]
  2. Amazon Simple Email Service (Amazon SES) routes emails to the Mail Manager ingress endpoint
  3. The email is written to an Amazon Simple Storage Service (Amazon S3) bucket
  4. An Amazon S3 event notification triggers an AWS Lambda function
  5. Lambda extracts the email content, formats the phone number, and sends an SMS message using AWS End User Messaging
  6. Message details are stored in DynamoDB for tracking

System components in this solution:

  • Processing: Mail Manager applies rules to incoming emails
  • Storage: Amazon S3 stores emails securely
  • Computation: Lambda processes stored emails
  • Identification: Amazon DynamoDB lookup matches the sender email to phone number
  • Delivery: AWS End User Messaging User Messaging sends an SMS message to the recipient

This architecture, which uses simple notification service (SNS), is suitable for SMS-to-email. While this post and the AWS CloudFormation template primarily focus on email-to-SMS implementation, the SMS-to-email flow works as follows:

SMS-to-email flow:

  1. A user replies to an SMS message
  2. AWS End User Messaging SMS service captures the message and publishes it to an SNS topic
  3. SNS triggers a Lambda function
  4. Lambda formats the message and sends an email through Amazon SES
  5. The email is delivered to the original sender

The solution

The solution was to build an email-to-text service using AWS core services. The architecture routes emails through an Amazon SES Mail Manager ingress endpoint. After receiving an email, Mail Manager processes it using defined business rules and stores it in Amazon S3. This triggers a Lambda function to fetch the phone number associated with the email address and send an SMS to that phone number. When successful, it stores data such as the email address, phone number, and message ID from the sent text message in DynamoDB.

Estimated setup time: 15–20 minutes

Prerequisites

To deploy the solution described in this post, you must have the following in place:

Step 1: Set up Amazon SES Verified Identity

Start by setting up an Amazon SES verified identity.

  1. Sign in to the AWS Management Console.
  2. Navigate to Amazon SES service.
  3. In the navigation pane, go to Configuration and choose Identities (skip this step if you have a verified identity).
  4. If you do not have a verified identity, choose e.
  5. Review this post to learn how to verify an identity. Best practice is to verify a domain identity. This will authenticate your domain and improve deliverability. An email address identity, while simpler, won’t be authenticated through DomainKeys Identified Mail (DKIM), which might decrease deliverability.

Reference: Creating and verifying identities in Amazon SES

  1. Confirm that the status of your domain identity is Verified before proceeding to the next step.

Step 2: Deploy the email-to-SMS CloudFormation template

Use the following steps to create a CloudFormation stack that deploys all the required components for email-to-SMS functionality:

  1. Sign in to your AWS account.
  2. Download the email-to-sms.yaml CloudFormation template file.
  3. Navigate to the CloudFormation console.
  4. Choose Create stack and select With new resources (standard).
  5. Prerequisite: Prepare template is selected as Choose an existing template.
  6. Under Specify template, choose Upload a template file and  upload the email-to-sms.yaml file you downloaded earlier. Choose Next.
  7. For Stack name, enter Email-To-SMS-Stack.
  8. Configure the following parameters:
    • e: Enter the SES verified domain name or a verified email address.
    • OriginationPhoneNumberId: Enter the AWS End User Messaging SMS phone number ID that you plan to use to send SMS messages.
      • Go to AWS End User Messaging, under Phone Numbers, select your number and find Phone number ID.
    • DestinationPhoneNumber: Enter the destination phone number to receive SMS messages.
  9. Choose Next.
  10. (Optional) Add tags to help identify and organize your AWS resources.
  11. Select Acknowledge All checkbox and choose Next.
  12. Review the configuration and choose Submit.
  13. Wait for the stack creation to complete. You can monitor the progress in the CloudFormation console

Step 3: Verify deployed stack services

After successful CloudFormation template deployment, verify the following resources and configurations:

  1. A DynamoDB table is created with the name <stackname>-email-to-sms-db
  2. A Lambda function is created with the name <stackname>-<accountnumber>-<awsregion>-process-email-to-sms
  3. The Lambda function has the following AWS Identity and Access Management (IAM)role policies attached:
    1. s3:GetObject
    2. dynamodb:PutItem
    3. sms-voice:SendTextMessage
    4. kms:Decrypt for Lambda encryption keys.
    5. IAM permissions for dead letter queue (if configured).
  4. S3 buckets are created:
    1. Main bucket: <stackname>-<accountnumber>-<awsregion>-emailtosms-storage
    2. Logging bucket: <stackname>-<accountnumber>-<awsregion>-emailtosms-logging
  5. In Amazon SES:
    1. A receipt rule set is created named <stackname>-EmailToSms-Rule-Set
    2. The receipt rule is configured to:
      1. Write messages in the S3 bucket.
      2. Invoke the Lambda function.
    3. Traffic policy is created named <stackname>-EmailToSms-Traffic-Policy
    4. The Rule set and traffic policy are configured in the ingress point <stackname>-EmailToSms-Ingress-Point
      • CAUTION: Testing this solution requires access to modify mail exchange (MX) DNS records for your domain.
      • Potential impact: Changes to MX records can interrupt email delivery to your primary domain.
      • Best practice: We strongly recommend creating a dedicated subdomain (such as testing.example.com) rather than using your primary domain (example.com) for testing purposes. This approach prevents disruption to your organization’s regular email service

Additional verifications:

  • Verify that the S3 bucket policies are correctly set
  • Verify that S3 bucket logging is on and working
  • Check the Lambda function’s environment variables
  • Monitor Amazon CloudWatch logs for any errors

Step 4: Test the email-to-SMS flow

  1. Send an email to mobile-number@verified-domain
  2. You will receive an SMS from the source number (AWS End User Messaging phone number) containing:
    • Subject: <EmailSubject>
    • Content: First 160 characters of your email body
  3. SMS character Limitations:
    1. AWS End User Messaging’s SMS messaging has character limits based on content type
    2. By default, the solution uses first 160 characters
    3. You can modify this limit by updating the Lambda function code
  4. Troubleshooting:
    1. If SMS or email responses aren’t received
    2. Check Lambda function logs in CloudWatch
    3. Review any error messages or execution issues
    4. Verify all permissions and configurations are correct

Make sure that your domain and phone numbers are properly verified before testing. If you don’t receive the email or SMS, check the Lambda CloudWatch logs for troubleshooting

Clean up

To avoid ongoing charges and remove all deployed resources, perform the following cleanup steps:

  1. Remove the CloudFormation stack:
    1. Navigate to the CloudFormation console
    2. Delete the Email-To-SMS stack
    3. Wait for complete stack deletion confirmation
  2. Amazon SES cleanup:
    1. Navigate to the Amazon SES console
    2. Remove any verified domains
    3. Delete verified email addresses
    4. Confirm all SES resources are removed
  3. AWS End User Messaging:
    1. Navigate to the AWS End User Messaging console
    2. Release all provisioned phone numbers
    3. Verify that no active phone numbers remain
  4. Additional verification:
    1. Confirm that S3 buckets are deleted
    2. Verify that Lambda functions are removed
    3. Check that DynamoDB tables are deleted
    4. Make sure that all associated IAM roles and policies are removed

Verify complete resource removal to prevent unexpected charges.

Additional recommendations

  • Security best practices:
    • Set up S3 bucket logging to track access and changes
    • Make sure that S3 buckets have:
      • No public read/write access
      • Enable Encryption at rest
      • Apply appropriate bucket policies
    • Implement least privilege access for IAM roles
    • Use KMS encryption for sensitive data
    • Add CloudWatch logging for monitoring
    • Protect against SMS pumping:
      • Enable AWS End User Messaging protect configuration: Enable filter mode to automatically block suspicious messages
      • Block countries that you don’t do business in to prevent unnecessary exposure
      • Add CAPTCHA to web forms that trigger SMS to prevent bot attacks
      • Set up SMS volume alerts to quickly detect unusual activity
      • Create separate configurations for different message types (password resets compared to marketing)
  • Cost and operational considerations:

Results

This implementation delivers three key improvements:

  1. This achieves 99.99% uptime through AWS managed services.
  2. The pay-per-use model reduces operating costs by 45% compared to maintaining dedicated infrastructure. Customers save an average of $2.30 per thousand messages.
  3. End-to-end encryption and AWS security protocols maintain GDPR and CCPA compliance while protecting customer data.

Conclusion

This AWS-based solution addresses the immediate need and provides a foundation for future enhancements in cross-platform messaging. Whether you’re migrating from AT&T’s email-to-text service or building a new notification system, this AWS-based solution provides a scalable foundation for your messaging needs.


About the author

How Zapier runs isolated tasks on AWS Lambda and upgrades functions at scale

Post Syndicated from Anton Aleksandrov original https://aws.amazon.com/blogs/architecture/how-zapier-runs-isolated-tasks-on-aws-lambda-and-upgrades-functions-at-scale/

Zapier is a leading no-code automation provider whose customers use their solution to automate workflows and move data across over 8,000 applications such as Slack, Salesforce, Asana, and Dropbox. Zapier runs these automations through integrations called Zaps, which are implemented using a serverless architecture running on Amazon Web Services (AWS). Each Zap is powered by an AWS Lambda function.

In this post, you’ll learn how Zapier has built their serverless architecture focusing on three key aspects: using Lambda functions to build isolated Zaps, operating over a hundred thousand Lambda functions through Zapier’s control plane infrastructure, and enhancing security posture while reducing maintenance efforts by introducing automated function upgrades and cleanup workflows into their platform architecture.

Architecting a secure and isolated runtime environment

Zaps created by Zapier’s users implement tenant-specific business logic, hence they require cross-tenant compute isolation. Code implementing one Zap can’t share an execution environment with code implementing another Zap. Moreover, the same Zap type used by two different tenants can’t share execution environments as well.

To achieve the required level of isolation, Zapier’s engineering team adopted AWS Lambda, a serverless compute service that runs code in response to events and automatically manages cloud compute resources. Minimal operational overhead, built-in high availability, automated scaling, high level of isolation, and pay-per-use model made Lambda a great fit for this use case. Currently, Zapier’s architecture is running over a hundred thousand Lambda functions to support their customer’s integration workflows.

Because they’re powered by the open source Firecracker microVMs, each function is completely isolated from the others. Moreover, each execution environment belonging to the same function (sometimes referred to as function instances) is also isolated from other execution environments. The following architecture topology diagram uses red lines to represent isolation boundaries. Each execution environment of every function is isolated from its peers and is getting its own virtual resources such as disk, memory, and CPU. For more details, read Security in AWS Lambda.

Isolation boundary

Zapier’s control plane is architected using Amazon Elastic Kubernetes Service (Amazon EKS). A designated database is used to maintain the up-to-date function inventory. Whenever a user creates a new Zap, the control plane creates a corresponding Lambda function and stores a reference in the inventory database. When a Zap is triggered, the control plane retrieves information about a relevant Lambda function and invokes it to facilitate the integration workflow, as illustrated in the following diagram.

Control and Data planes

Understanding the runtime deprecation process

When building architectures using the traditional non-serverless compute, cloud engineers are the ones responsible for keeping operating systems and software on their compute instances up to date and applying security and maintenance patches. With serverless architectures and Lambda functions, security patches and minor runtime upgrades are handled by AWS automatically, which means customers can focus on delivering business value instead of the undifferentiated heavy lifting of infrastructure management.

When a major Lambda managed runtime version reaches end-of-life, AWS initiates a deprecation process through the AWS Health Dashboard and direct email communications to affected customers. Because deprecated runtimes eventually lose access to security updates and support, organizations must upgrade to supported runtime versions to avoid potential security risks. Read more about the shared responsibility model, runtime use after deprecation, and receiving runtime deprecation notifications.

As Zapier’s user base and architectural complexity – and consequently the number of Zaps – were growing, keeping all functions on the most up-to-date major runtime versions became a laborious task. Top contributing factors were:

  • High number of functions. At its peak, the Zapier platform was running Zaps using hundreds of thousands of unique Lambda functions. Approximately 35% of these functions were using a runtime that was scheduled for deprecation in the next 12 months.
  • Zapier architected their data plane environment to be ephemeral – the control plane creates and deletes Lambda functions on demand and manages their lifecycle dynamically. Identifying a specific owner for each affected function wasn’t always straightforward.
  • Security is paramount at Zapier and upgrading affected functions runtime prior to the deprecation date was an absolute must. At no point could Zapier functions use runtimes after their deprecation date. This was a task which required extra resources.
  • The upgrade process shouldn’t have had any impact on the end customer experience. At no point should customer experience be affected.

With a short runway, high-volume workload, and the strict requirements of not impacting customer experience, Zapier’s Platform Engineering team took on this challenge of maintaining high security posture in their platform architecture.

Applying the solution

The solution had three work streams:

  1. Reducing the risk by analyzing the architecture and identifying and cleaning up unused functions.
  2. Prioritizing upgrades by identifying the most critical and impactful functions.
  3. Empowering engineering teams with automated tools and knowledge to streamline the upgrade process in future.

Identify and clean up unused functions

The first step in streamlining the upgrade process was identifying and removing unused functions. This reduced the total number of functions in Zapier’s architecture that required upgrades, eliminating unnecessary work for the team.

Zapier started by augmenting the function inventory with runtime information using AWS Trusted Advisor and Amazon Cloud Intelligence Trusted Advisor dashboards, as illustrated in the following diagram.

Gathering data

This meant the team could build a detailed inventory of functions that were running on soon-to-be deprecated runtimes. Using Amazon CloudWatch, Zapier’s platform team started to monitor metrics such as number of invocations. They identified which functions were active, which functions weren’t used for an extended period, and which functions didn’t have an active owner and could be removed.

One of the primary mechanisms for ownership validation within the organization was using resource tags. Functions that were active, but didn’t have clear ownership, were flagged for additional review before removal. Functions that were confirmed as unused or didn’t have an active owner were marked for deletion. Removing such functions allowed Zapier to significantly simplify their architecture and reduce the number of functions that had to be upgraded.

Prioritizing upgrades

With a smaller volume of functions to upgrade, Zapier’s platform team prioritized function upgrades based on usage patterns, criticality, and potential customer impact. Three primary prioritization categories were:

  • Customer-facing functions – Any functions directly involved in executing user Zaps were marked as high priority. These had to be upgraded first to avoid service disruptions.
  • Backend infrastructure functions – Internal functions that supported system operations were evaluated based on their importance to platform stability.
  • High-volume functions – Functions with the highest execution frequency were prioritized because upgrading them would have the greatest impact on reducing operational risk.

Using these factors, Zapier’s platform team has created an upgrade roadmap, ensuring that critical assets were addressed first while minimizing potential disruptions.

Refer to Retrieve data about Lambda functions that use a deprecated runtime in the Lambda Developer Guide to learn how to identify most commonly and most frequently used Lambda functions in your serverless architecture.

Empowering engineering teams with automated tools and knowledge

To ensure a smooth and efficient upgrade process across their serverless architecture, Zapier’s team empowered engineering teams with clear guidelines and automated solutions. The platform incorporated two main approaches: Terraform-managed functions and a custom-built Lambda runtime canary tool. Implementing and adopting these tools and practices resulted in reducing the number of functions using soon-to-be deprecated runtimes by 95%.

For functions managed through infrastructure-as-code (IaC), Zapier’s team developed standardized Terraform modules that specified supported runtime versions. Development teams implemented these modules in their configurations:

resource "aws_lambda_function" "example" {
    runtime = "python3.13"  # Updated to supported runtime
}

After applying the new module version, teams validated changes by testing the new runtime in staging environments and monitoring Terraform plan outputs to ensure proper runtime version updates.

To efficiently manage most Lambda functions in their architecture, Zapier developed the Lambda runtime canary tool suite. Using this solution, they automated the runtime upgrade process for thousands of active Lambda functions with minimal manual intervention. The tool suite implements several key features:

  • Architected for gradual traffic shifting with the Lambda built-in routing mechanism through function version and aliasing. The tool can gradually shift traffic distribution from an old to a new function version. During this gradual traffic shift, the system monitors CloudWatch metrics for errors and automatically rolls back if error rates exceed acceptable thresholds.
  • Optimistic upgrade strategy implements direct upgrades for infrequently used functions using a flag value stored in a cache to detect potential issues during the first post-upgrade invocation. If this invocation fails, the control plane retries it using the previous function version. If the retried invocation succeeds, Zapier’s control plane initiates a rollback, assuming the error is most likely due to the runtime upgrade. After rollback, it will log the error and alert relevant stakeholders.
  • Integration with existing infrastructure uses an administrative interface and task queue for automated traffic shifting. A database ledger maintains tracking of function states and rollback information.
  • Operational controls provide manual rollback capabilities and implement centralized control switches for process management. After a function was upgraded to a new runtime and no rollback activity was detected within a set time period, an automated pruning task cleans up older versions.

Zapier’s Lambda canary tool, through its integration of gradual traffic shifting, real-time CloudWatch monitoring, and automated rollback mechanisms, established a sustainable framework for managing runtime upgrades across their serverless architecture. This approach not only automated the upgrade process and minimized operational risks but also created a scalable solution that provides continuous runtime upgrades, preventing the use of deprecated runtimes at any point. By allowing continuous function runtime updates with minimal disruption to end user experience, Zapier maintains security and stability while requiring minimal manual intervention. This framework efficiently manages their growing serverless infrastructure, providing both security and operational efficiency for future runtime updates.

Conclusion

In this post, you’ve learned how Zapier architected their software-as-a-service (SaaS) platform to provide secure, isolated execution environments using AWS Lambda and Amazon EKS, enabling their customers to create hundreds of thousands of Zaps. You’ve learned how Zapier’s team implemented the function runtime upgrade process at scale and reduced the number of functions running on soon-to-be deprecated runtimes by 95%. You’ve seen best practices that were established and techniques that helped Zapier to keep high security posture without impacting customer experience.

Use the following links to learn more about Lambda runtimes and upgrading your functions to the latest runtime versions:


About the authors

How HashiCorp made cross-Region switchover seamless with Amazon Application Recovery Controller

Post Syndicated from Dmitriy Novikov original https://aws.amazon.com/blogs/architecture/how-hashicorp-made-cross-region-switchover-seamless-with-amazon-application-recovery-controller/

This blog was co-authored by Brandon Raabe, Sr. Site Reliability Engineer at HashiCorp.

In cloud-based systems, minutes of downtime can translate to significant business impact and eroded customer trust. HashiCorp, a leader in multicloud infrastructure automation software, faced this critical challenge as their HashiCorp Cloud Platform (HCP) scaled to serve enterprise customers with stringent availability requirements. When Regional outages threatened service continuity, the complex dance of failing over DNS entries, workloads, and databases across AWS Regions had become an error-prone process requiring intense coordination. This post chronicles how HashiCorp’s Site Reliability Engineering (SRE) team transformed their disaster recovery capabilities by implementing Amazon Application Recovery Controller (ARC), creating a solution that not only dramatically simplified cross-Region failovers but also provided a standardized way to signal Regional context to their distributed services.

In this post, we discuss HashiCorp’s journey from manual, stress-inducing failover procedures to a streamlined, confident approach that fundamentally changed how they deliver on their enterprise-grade resilience promises.

Challenges with disaster recovery in a multicloud infrastructure

HashiCorp’s SRE team recognized that as their cloud platform scaled to serve mission-critical enterprise workloads, their disaster recovery approach needed an upgrade. The existing manual processes required precise coordination across multiple systems during already stressful outage scenarios, which could lead to potential complications when speed and accuracy matter most. Regional outages posed particular challenges: if the control planes for critical services became unavailable, the very tools needed to execute recovery might be inaccessible.

ARC emerged as the ideal solution with its unique architecture: a highly available data plane accessible through endpoints in five distinct Regions, so the recovery mechanism remains operational even during significant Regional disruptions. By using the AWS SDK to interface with ARC, HashiCorp gained several critical advantages. They could apply infrastructure as code (IaC) practices to disaster recovery workflows, automate testing of failover procedures, and integrate resilience seamlessly with their existing operational tooling. This solution transformed their disaster recovery from a specialized manual procedure into a codified, repeatable process embedded within their platform operations.

Requirements and architectural considerations

After evaluating multiple disaster recovery approaches, HashiCorp established three core requirements for their solution. First, while maintaining human judgment for initiating failovers, the execution needed to proceed without additional operator interventions after it was triggered. This human-in-the-loop design preserved deliberate decision-making while reducing error-prone manual steps during implementation.

Second, the architecture needed exceptional resilience against the very failures it was designed to mitigate. Traditional DNS failover solutions presented a critical vulnerability: dependency on single-Region control planes that might be unavailable during an outage. ARC solved this problem through its distributed architecture, connecting Amazon Route 53 to a resilient control mechanism, enabled by Route 53 health checks, accessible through multiple Regional endpoints. This means the failover system itself remained available even if the primary Region went offline.

Third, the solution needed to meet or exceed HashiCorp’s existing Recovery Point Objective (RPO) and Recovery Time Objective (RTO) metrics—the maximum acceptable data loss and downtime thresholds. Using ARC, the SRE team planned to not just reach these targets but make substantial improvements, reducing potential customer impact during Regional events and strengthening HashiCorp’s enterprise-grade resilience.

Solution overview

To transform their disaster recovery posture, HashiCorp’s SRE team designed an architecture centered around ARC and complemented by a purpose-built orchestration service. This architecture seamlessly bridges the human decision to initiate failover with the complex technical operations required to shift traffic between Regions with minimal disruption.

At the heart of the solution is a custom failover service that serves as the orchestration layer for Regional transitions. This service maintains configuration details for the ARC cluster and provides a single, controlled interface for initiating Regional switchovers. When activated, the service establishes a secure connection to the ARC API endpoints and executes a two-step workflow: first disabling routing controls for the primary Region, then enabling those for the secondary Region. This sequential approach provides a clean traffic transition without split-brain scenarios or dropped connections.

The DNS architecture underwent a strategic evolution to support this new capability. HashiCorp reconfigured their critical ingress endpoints as Route 53 failover record pairs, with each pair consisting of a primary and secondary record. Each record is linked to a health check that monitors the state of an ARC routing control—effectively connecting AWS’s global DNS service to the ARC routing control. The primary records resolve to endpoints in the primary Region, and secondary records point to corresponding infrastructure in the standby Region. When routing controls change state, the associated health checks automatically trigger Route 53 to adjust DNS resolution patterns, redirecting traffic to the appropriate Regional infrastructure.

HashiCorp maintains their secondary Region in a warm standby configuration, with essential services running but not actively serving client traffic until a failover event occurs. To enable seamless awareness of Region status across their distributed system, the team implemented a signaling mechanism using specially crafted TXT DNS records. These records are tied to the same ARC routing controls as the primary service endpoints, effectively creating a discoverable, global state indicator. Services can query these TXT records to dynamically determine the currently active Region and adjust their internal routing, replication, and operational behaviors accordingly — alleviating the need for a separate configuration distribution system and making sure all components have a consistent view of the current Regional state.

The following diagram illustrates the disaster recovery workflow.

This architecture combines human oversight for initiating critical Regional transitions with fully automated execution after the decision is made. The use of ARC’s globally distributed control plane removes single-Region dependencies that might otherwise compromise the failover mechanism itself during a Regional outage event.

Operational decision framework for Regional failover

HashiCorp’s Regional failover process balances automated monitoring with deliberate human decision-making. Their comprehensive observability platform continuously monitors Regional health, automatically alerting the incident response team when anomalies are detected. When alerts trigger, the incident management protocol activates, with an incident commander quickly assembling experts to assess the situation.

The team follows a structured evaluation framework to determine if failover is warranted: confirming the issue is Region-specific, verifying that redundant intra-Region components can’t mitigate the problem, and assessing whether the projected Regional recovery time exceeds acceptable customer impact thresholds. This approach prevents unnecessary Regional transitions while providing rapid action when genuinely needed.

After the decision to failover is made, an authorized operator initiates the process through a single API call to their orchestration service, which then interfaces with ARC to execute the complex sequence of routing control changes. This design preserves human judgment for the critical decision while using automation for precise execution, so HashiCorp can respond confidently and consistently during high-pressure Regional outage scenarios.

Disaster recovery testing

HashiCorp maintains operational readiness through a disciplined monthly disaster recovery testing program in their integration environment. One week before each scheduled test, the team notifies all stakeholders to confirm organization-wide awareness and participation. On test day, they follow formal incident protocols, creating dedicated communication channels for transparent observation and collaboration.

The test execution mirrors their production failover process: an operator initiates the recovery sequence through their API, activating the ARC routing controls to shift traffic to the secondary Region. What sets HashiCorp’s approach apart is their comprehensive validation methodology. The team verifies critical services in the secondary Region and then fails back to the primary Region with subsequent validation. This bidirectional testing confirms both failover and failback procedures work reliably.

Each exercise concludes with a structured retrospective where the team documents observations and identifies improvement opportunities. By treating these tests as learning experiences rather than compliance activities, HashiCorp has established a continuous improvement cycle for their disaster recovery capabilities. The insights from these regular drills have led to numerous refinements in their ARC implementation and operational procedures, so their team can respond confidently during actual outages with practiced, predictable procedures.

Conclusion

The collaboration between HashiCorp and AWS through ARC has revolutionized HashiCorp’s disaster recovery capabilities. Regional transitions that once required careful DNS record manipulation by specialized operators now execute through a single API call, with traffic shifting within seconds and full propagation completing in approximately 2 minutes. This dramatic simplification, achieved by integrating the resilient ARC architecture with HashiCorp’s custom orchestration service, has not only improved recovery metrics but has also strengthened their enterprise-grade resilience promises.

ARC has solved a fundamental distributed systems challenge by providing a reliable mechanism for services to determine the active Region. By linking ARC routing controls to specialized TXT records, HashiCorp created a consistent global indicator that allows services to automatically adjust their behavior without additional coordination systems—simplifying their architecture and reducing dependencies.

Most significantly, this implementation has democratized disaster recovery within HashiCorp, transforming it from a specialized capability to a standardized procedure executable by their regular on-call rotation. The solution’s highly available endpoints across multiple Regions makes sure the recovery mechanism itself remains operational even during severe outages—addressing a critical vulnerability in their previous approach.

For HashiCorp’s enterprise customers, these improvements translate directly to business value: reduced recovery times during Regional events, increased operational confidence, and assurance that their critical infrastructure management tools will remain available even during major cloud disruptions. As HashiCorp continues to refine their approach through rigorous testing and continuous improvement, their ARC implementation demonstrates how thoughtfully architected disaster recovery can evolve from merely an insurance policy into a strategic competitive advantage.

To learn more, visit Amazon Application Recovery Controller, AWS Multi-Region Capabilities, and AWS multi-Region fundamentals.


About the authors

Revenue NSW modernises analytics with AWS, enabling unified and scalable data management, processing, and access

Post Syndicated from Saeed Barghi original https://aws.amazon.com/blogs/big-data/revenue-nsw-modernises-analytics-with-aws-enabling-unified-and-scalable-data-management-processing-and-access/

Revenue NSW, in Australia, is New South Wales (NSW) state’s principal revenue management agency and aspires to be the world’s most innovative and customer-centric revenue agency. Revenue NSW exists to administer grants, resolve fines, and collect revenue to fund essential state services for the over 8 million people of NSW in a fair, efficient, and timely manner.

Analytics at Revenue NSW plays a key role in enabling the organization’s goals and purpose by delivering reliable, secure, and authoritative insights. These insights are key to:

  • Understanding customer attributes to enable empathetic and informed actions
  • Supporting policy development
  • Assisting in the sequencing of millions of decisions
  • Maintaining compliance and education
  • Fostering transparency by providing open data and insights directly to the public

The challenge

Revenue NSW Analytics consumes data from a multitude of operational databases and real-time interfaces and through internally generated reports and files received from external data partners such as other government departments and agencies. The varying technologies, formats, and complexities of these data sources created friction and inefficiencies in data transformation, consolidation, and analysis in an environment that is often time-critical. In addition, these analytics systems were previously hosted on dedicated hardware on-premises that was nearing end-of-life and wasn’t easy to scale efficiently. To address these challenges, Revenue NSW Analytics used their partnership with AWS to build a strategic, unified, scalable, frictionless and modern data environment to help them standardize data transformation and consolidation pipelines from the hundreds of data sources. Additionally, the modern data environment must provide a single source of truth and enable secure and seamless access to the data through a unified SQL interface regardless of the data’s original format or technology.

After understanding other offerings, Revenue NSW Analytics decided on a proof of concept (PoC) using Amazon Web Services (AWS) cloud-based services, including Amazon Redshift. The key goals of the PoC were to assess the completeness of the solution, its performance, and the potential change in total cost of ownership compared to their on-premises setup.

Amazon Redshift, with its integration options, columnar storage, and massively parallel processing (MPP) architecture, offered the desired end-state solution. Tests demonstrated a typical speed increase between 5- and 50-fold in query execution, with many results 100 times faster than the existing on-premises solution. Amazon Redshift also performed significantly better compared with other cloud-based solutions, offering up to 6 times better performance. The success of the initial PoC led Revenue NSW Analytics to further collaborate with AWS, working towards developing a prototype that incorporated Amazon Redshift alongside various data ingestion patterns.

The solution

To simplify data ingestion from the operational databases—which run on different database engines including Oracle, PostgreSQL, and Microsoft SQL—Revenue NSW Analytics used AWS Database Migration Service (AWS DMS) to perform a bulk initial load, followed by capturing ongoing changes from these databases into Amazon Redshift in near real time.

For data from Salesforce’s real-time API, Revenue NSW Analytics used Amazon AppFlow to automate the continuous pulling and ingesting of data into Amazon Redshift.

The hundreds of structured and semi-structured data files were handled using AWS Glue. These files are regularly uploaded to Amazon Simple Storage Service (Amazon S3), triggering the relevant AWS Glue extract, transform, and load (ETL) jobs in an event-based architecture to transfer the data into Amazon Redshift.

To facilitate repeatability and enable iteration, Revenue NSW Analytics used infrastructure-as-code (IaC) and continuous integration and delivery (CI/CD) pipelines to deploy the different components of the solution.

The following is a high-level architecture demonstrating how these different components and services fit together.

Along with standardization and unified access, the success criteria of the new data environment included the ease of transition, consolidation of processes to the new standardised pipelines, scalability, language uniformity, and availability. The combination of supporting standard SQL, AWS DMS, and Amazon AppFlow low-code capabilities, and supporting Python in AWS Glue, a popular programming language, played a crucial role in facilitating the successful transition and adoption of the cloud-based data environment.

Other success factors of this environment include the ability to work within current budgets, and the extendibility and modularity of the solution. As shown in the preceding high-level architecture, the solution runs on multiple building blocks that are decoupled, modular, and either serverless—like AWS Glue—or managed services that support seamless scalable configurations that don’t require rebuilds. This allowed Revenue NSW Analytics to start small with each use case, expand and grow as required, and pay only for what they need.

Moreover, with the new cloud-based data environment, Revenue NSW Analytics can access to up-to-date data in near real time, which is essential to fulfilling critical use cases such as information requests and assisting with compliance case identification. The automated data ingestion pipelines removed much of the boilerplate and heavy lifting, allowing Revenue NSW teams to work more efficiently and focus on the differentiators of their business, and in some cases, shorten workflow times from months to weeks or days.

Another significant factor contributing to the project’s success is the people at the heart of Revenue NSW Analytics. The teams allocated to own and deliver this platform are cross-functional, with adjoining responsibilities and skills, and were prepared through multiple in-person and online training sessions. The teams were empowered to trial individual services to deliver new use cases and iterate on the solution to learn from successes and innovate progressively. This approach, together with support Revenue NSW received from AWS specialist solution architects, helped to minimize the risk of knowledge gaps that often arise when separate teams are responsible for building and operating a system.

The hard work of the Analytics team, the investment of Revenue NSW Analytics leadership in its people, and the continuous support from AWS can truly be seen throughout the delivery of the data environment, resulting in the achievement of the intended outcomes.

Conclusion and call to action

Since going live with their cloud-based data environment on AWS, Revenue NSW has onboarded dozens of analysts who can get more done in less time. This is a result of establishing a single source of truth from different data sources in Amazon Redshift, so that analysts and data consumers don’t need to shop around to find the data that they need to complete their tasks. This new data environment also provides Revenue NSW with the ability to create improved conditions for:

  • Increasing agility by exposing reusable, trusted data services for people and AI
  • Empowering operational systems with services best provided by analytical approaches
  • Decommissioning heritage, costly infrastructure and data practices.

Successful delivery of the cloud-based data environment on AWS has led to further collaboration between AWS and Revenue NSW. This includes exploring the adoption of AI and machine learning (AI/ML) and generative AI to further improve the delivery of services for the people of NSW.

To learn more about customer success stories like this or how to get started with building a data environment on AWS, contact your AWS account team. You can read about similar customers by browsing Customer Success Stories on our website.


About the authors

Saeed BarghiSaeed Barghi is a Sr. Specialist Solutions Architect at Amazon Web Services (AWS) specializing in architecting enterprise data platforms and AI solutions. Based in Melbourne, Australia, Saeed works with public sector customers in Australia and New Zealand and helps his customers build fit-for-purpose and future-proof data platforms and AI solutions.

Miroslaw (Mick) Mioduszewski is the Director of Analytics at Revenue NSW Department of Customer service in NSW. He held multiple C-level roles in private and public companies as well as government, e.g. COO and CIO, as well as serving as company director. Mick holds computer science and business degrees, is a fellow of the Australian Institute of Company Directors and an industry fellow at the University of technology, Sydney.

Moha Alsouli is a Public Sector Solutions Architect at Amazon Web Services (AWS) in Sydney. He is dedicated to supporting state and local government customers deliver citizen services, through solution design, reviews, optimisation, and architecture guidance. Moha is also specialising in generative artificial intelligence (AI) on AWS.
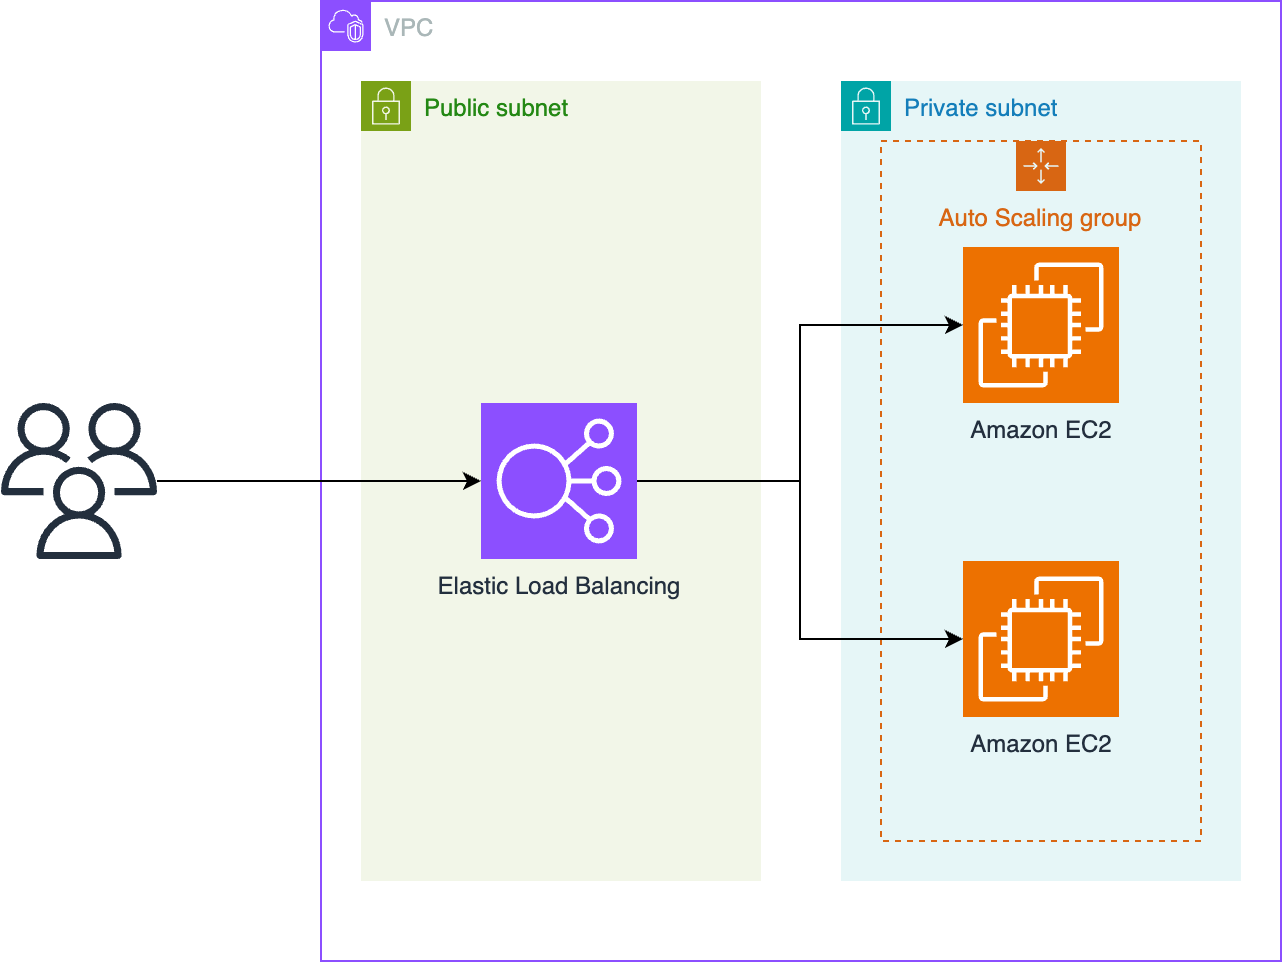
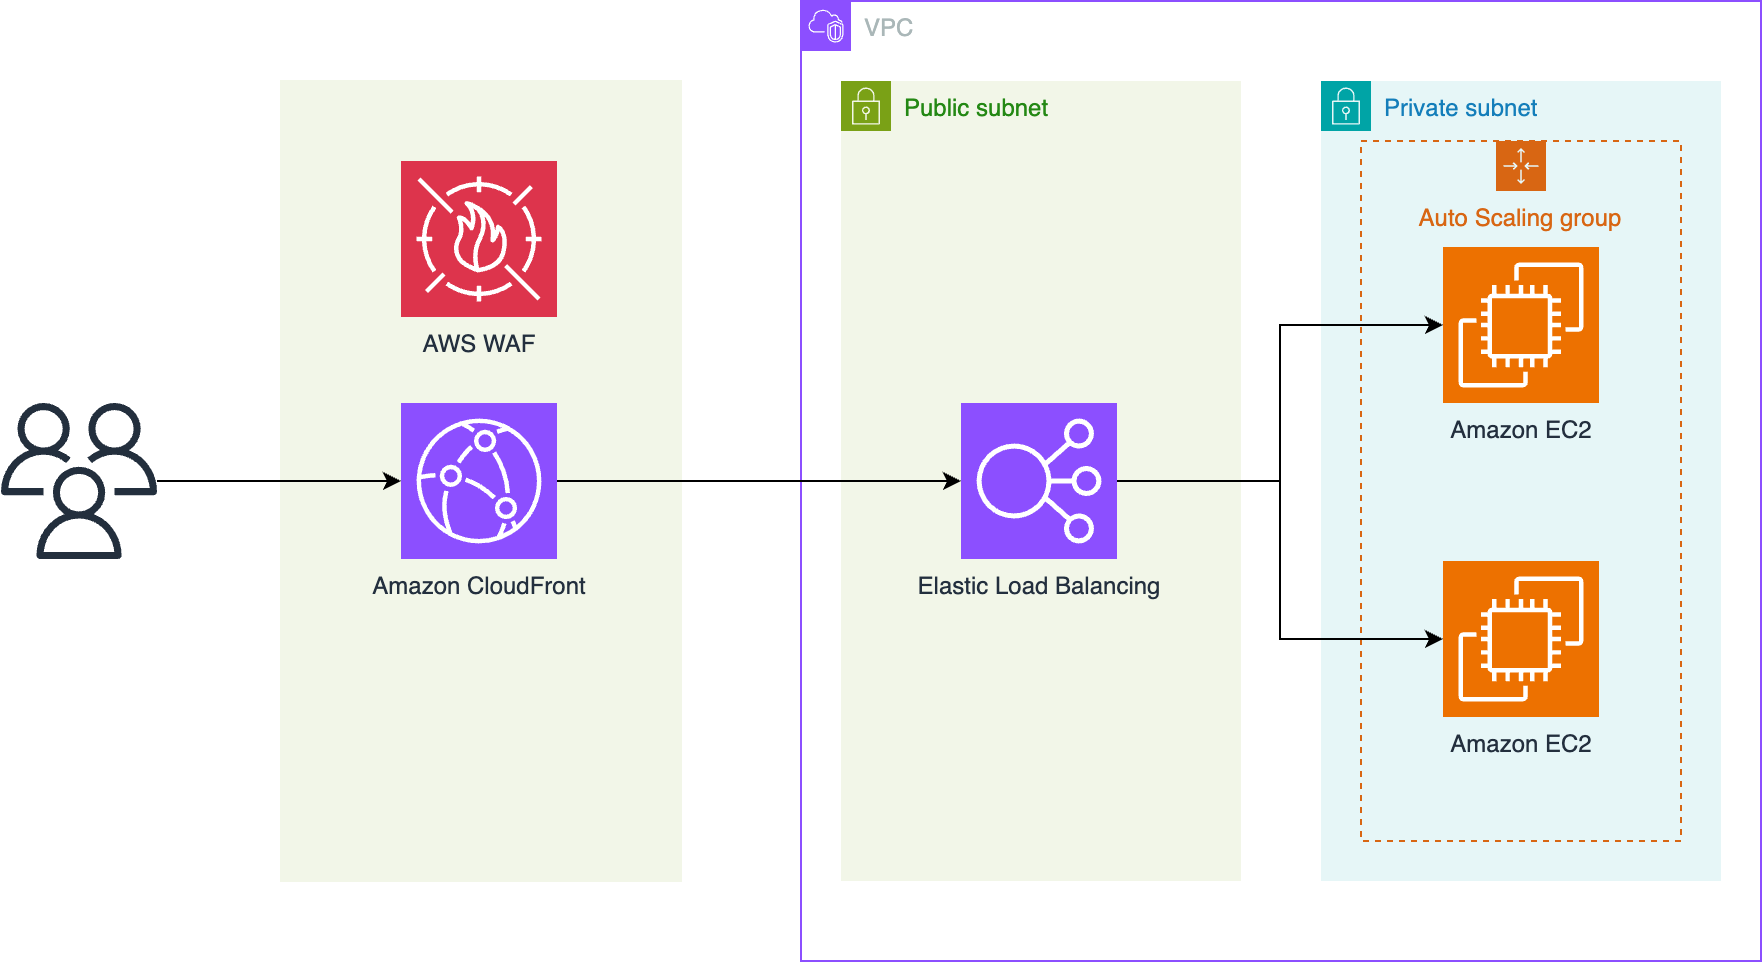
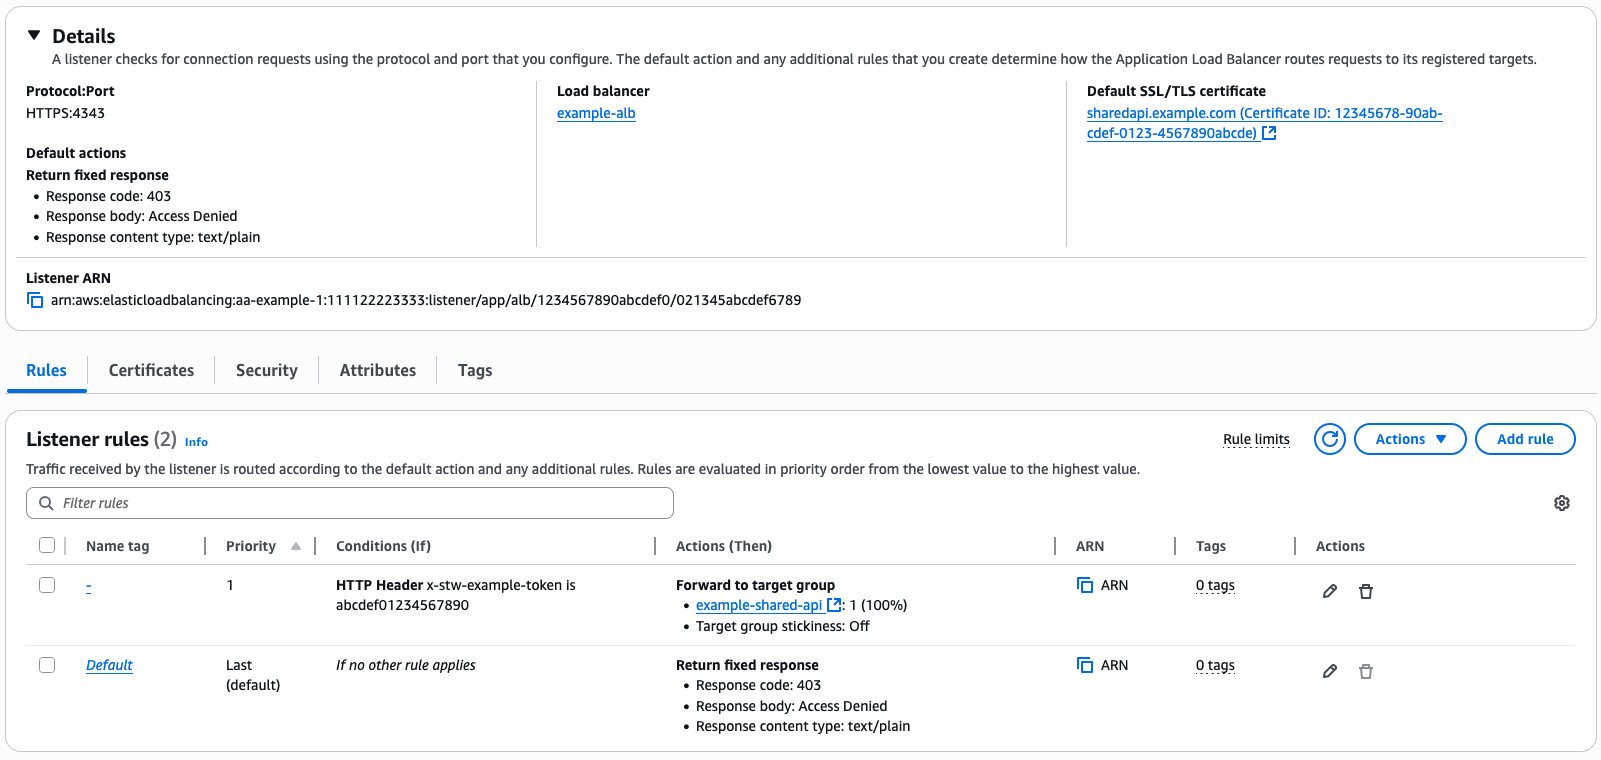
How Scale to Win uses AWS WAF to block DDoS events

Post Syndicated from Ben "Fuzzy" Shonaldmann original https://aws.amazon.com/blogs/architecture/how-scale-to-win-uses-aws-waf-to-block-ddos-events/

This is a guest post coauthored by Ben “Fuzzy” Shonaldmann of Scale to Win.

Scale to Win was created for organizers by organizers. Born out of the 2020 election cycle, a group of friends and former colleagues came out of a whirlwind presidential primary season with frustrations and ideas to improve campaign technology. With extensive outreach experience on high-profile presidential campaigns such as Biden/Harris 2020, Bernie 2016 and 2020, Warren 2020, and Clinton 2016, we knew the power of organizing. We saw how conversations—neighbor to neighbor, friend to friend, volunteer to voter—could transform communities and drive movements. Yet, the tools available for voter contact programs regularly fell short of our needs. We built and launched our first product in April 2020, a peer-to-peer (P2P) texting tool. We’ve since added a dialer tool that allows organizations to easily call voters, and Scale to Win Text, an all-in-one texting tool for organizing and fundraising.

During the 2024 US presidential election campaign season, we were the target of distributed denial of service (DDoS) events. These events reached peaks of over 2 million requests per second from nearly ten thousand unique IPs. After a brief window of downtime at the start of these events, Scale to Win partnered with Amazon Web Services (AWS) to implement AWS WAF, AWS Shield Advanced, and Amazon CloudFront to mitigate these targeted DDoS events.

One key element of our defense was AWS WAF support for Completely Automated Public Turing test to tell Computers and Humans Apart (CAPTCHA) to automatically present a challenge to suspicious-looking clients. We used this to provide a per-IP rate limit for traffic we expected to see from legitimate clients behind a single IP. For IPs that exceed this rate limit, we present a CAPTCHA and provide a higher rate limit to the maximum amount of traffic we expect to come from a single IP, like a campaign office or college campus.

However, the AWS WAF out-of-the-box CAPTCHA had an important caveat—it doesn’t provide protection against an event using a token that is solved and distributed across a network of machines behind multiple IPs. To prevent this class of event, AWS WAF users need to identify CAPTCHA tokens that are being used from multiple IPs and automatically block this traffic.In this post, you’ll learn how Scale to Win configured our network topology to maximize DDoS protection capacity, configured AWS WAF to block DDoS events, segmented machine-to-machine and browser-to-machine traffic to target CAPTCHA interventions, and blocked token reuse across IP addresses.

Network Topology Overview

The Scale to Win application runs behind an Application Load Balancer (ALB) that serves as the single point of entry to our application servers. Before implementing AWS WAF, our DNS records resolved to the ALB as shown in the following diagram. The diagram shows a path from users to Elastic Load Balancing to an auto scaling group of Amazon Elastic Compute Cloud (Amazon EC2) instances.

Diagram of a VPC with public and private subnets, Elastic Load Balancing, and Amazon EC2 instances

The recommended pattern for using AWS WAF to protect against DDoS events is to instead route traffic through a CloudFront distribution as shown in the following diagram. The diagram shows a path from users to CloudFront with AWS WAF to Elastic Load Balancing to an auto scaling group of EC2 instances.

VPC architecture with AWS WAF, CloudFront, Load Balancing, and EC2 instances

Using this topology, we can take advantage of the following benefits:

  1. The capacity of CloudFront to handle network-layer events sending TCP traffic that aren’t valid HTTP requests is greater than ALB capacity. Network-level protections are strongest when applied by CloudFront before passing traffic to the ALB.
  2. The edge deployment of AWS WAF has higher quotas and capacity than Regional deployments. AWS scales AWS WAF capacity one-to-one with CloudFront capacity, so AWS WAF always has enough capacity to handle incoming traffic.
  3. When implementing a geographic based block strategy, such as blocking specific countries, CloudFront provides a geographic restriction feature. In event patterns we observed, over half of malicious traffic originated from countries that we blocked completely in CloudFront, resulting in cost savings on our AWS WAF deployment.

To prevent threat actors from bypassing our CloudFront distribution and AWS WAF, we implemented a security group that allows traffic only from CloudFront edge IP addresses using the managed prefix list to prevent direct connections to the ALB. We then configured the ALB to require a secret, pre-shared token in a request header, for example, our header x-stw-example-secret. We configured the CloudFront distribution to add that request header when forwarding traffic to the origin. This secret isn’t logged to Application Load Balancer logs but is logged to AWS CloudTrail when setting or updating the CloudFront or ALB configuration. It’s possible to rotate this secret on a schedule by generating a random password with AWS Secrets Manager with an AWS Lambda function to update the CloudFront origin configuration and ALB listener configuration, as shown in the following two screenshots. This shared secret between the CloudFront distribution and ALB means that an event can’t bypass the security group control by configuring its own CloudFront distribution with our ALB as an origin.

The following screenshot shows configuration of the Application Load Balancer, showing a priority-1 rule to route traffic to our target group only if the x-stw-example-secret is correct. A default rule returns a 403 if it’s not correct.

AWS Elastic Load Balancing configuration details, displaying the protocol, port, load balancer name, and SSL/TLS certificate for a listener.

The following screenshot shows CloudFront origin settings, showing a custom header configuration to add the shared secret to requests to the origin.

AWS CloudFront origin settings showing domain, protocol, SSL, and custom header options

Configuring AWS WAF rules

We use two approaches to identify and block malicious DDoS traffic, a heuristic approach and a hard limit approach.

For the heuristic approach, we observe event traffic in AWS WAF sample requests and AWS WAF logs, identify patterns in the event, and block those specific patterns. To use this tactic in your own AWS WAF configuration, first identify a characteristic that is common to all or most event traffic but rare in legitimate traffic, like a HTTP header or query parameter. Create a AWS WAF rule that blocks the traffic. Using the Count rule action is helpful to test your rule and find false-positive and false-negative rates by correlating requests that match the rule with IPs that are sending high volumes of traffic. You can query AWS WAF logs with Amazon Athena to find these correlations. When you’re satisfied with your false-positive and false-negative rates, set the rule action to Block to actively block the matched traffic.

A motivated threat actor will notice the event is being blocked and randomize these parameters to bypass your rules. For example, they might replay legitimate session parameters, so that request URIs, query parameters, and request bodies are identical to legitimate traffic. Ultimately, the heuristic approach is a useful tool, and a good reason to set up logging and Athena to quickly query your AWS WAF logs, but it’s a solution that requires active reconfiguration of your AWS WAF as event patterns change.

One specific heuristic that’s worth calling out is JA4 fingerprints and their predecessor, JA3 fingerprints. A JA4 fingerprint is a hash of several parameters presented by TLS clients in the client hello packet. JA4 fingerprints roughly correspond to the specific TLS client parameters of the request, so they’re usually stable for a specific type of client. For example, a specific version of Google Chrome on a particular operating system has a fingerprint, but a version on a different operating system would have a different fingerprint. This makes JA4 fingerprints a useful heuristic for blocking malicious traffic because the botnet sending the traffic is likely to have a small number of different fingerprints. However, there are two caveats with blocking requests based on JA4 fingerprints:

  1. Threat actors might have the same JA4 fingerprint as legitimate users. In our case, we saw malicious traffic with the same fingerprint as a common NodeJS API client and were unable to block that fingerprint without blocking legitimate API clients.
  2. A sophisticated threat actor can randomize some of the TLS connection parameters, such as the order of TLS extensions in the client hello packet, which is done by threat actors to avoid JA3 fingerprint blocking and some browsers to preserve user privacy. Although the newer JA4 specification reduces some randomization elements, the fundamental challenge remains—because end users maintain control over the client hello packet, this creates an ongoing challenge of adaptation and response.

For the hard limit approach, we take advantage of request parameters that the event can’t fake, such as the source IP of the request. Although the source IP of a packet can be forged, these requests are dropped because they don’t successfully complete the TCP or TLS handshake. You can create AWS WAF rules that limit how much traffic can be sent from a single source IP using rate-based rule statements, setting the limit above what a legitimate user would send but below what the event needs to be effective.

The simplest approach with rate-based rule statements would be to have a single limit in the AWS WAF policy, but this has challenges. First, we have APIs that receive high volumes of machine-to-machine traffic. For example, we place outbound phone calls using Twilio, and Twilio sends tens of thousands of webhooks to our API per second to relay delivery status, sometimes from a single Twilio IP. Also, our application is often used by campaign offices or student-led phone banks on college campuses that might have hundreds of users behind a single or handful of IPs, so we can’t assume that a single IP is being used by a single user to calculate our acceptable rates of traffic.

Segmenting human and machine traffic

To address these challenges, we structure our AWS WAF rules to segment human and machine traffic. We do this by request path: AWS WAF rules can match based on request path, so we have a set of rules for machine traffic based on the webhook URLs or API paths where we expect machine traffic. For all other paths, we assume the traffic originates from a user visiting the site from their browser.

For machine traffic, we can’t use a CAPTCHA. Our API clients and the Twilio webhook infrastructure can’t solve the CAPTCHA, so we validate traffic differently. For our API clients, we set per-IP rate limits to what we expect from a single API client and return a 429 HTTP status when traffic exceeds our limit. We implement automatic retries to handle the occasional 429 error when sending above the limit. For Twilio or other webhook callbacks, we use published IPs from the service provider to create an IP set in AWS WAF. Then, we block requests to our webhook URL that don’t originate from the IP set. Not all service providers use static IPs—for Twilio specifically, we worked with their team to implement their Static Proxy feature to proxy webhook requests from a stable list of IPs. It also makes sense to implement API key authentication, request signing, and certificate-based authentication when possible for your machine traffic. For requests that originate from the IP set, we apply an Allow action in our AWS WAF rule to allow expected machine traffic through, as shown in the following screenshot. These rules allow high-volume machine-to-machine traffic through our AWS WAF configuration before we apply AWS WAF rules to block high volume user-based traffic. The following screenshot shows an example rule allowing expected machine-to-machine traffic.

WAF rule configuration showing machine traffic allow rules with URI path and IP settings

For our browser-based human traffic, we use a tiered rate limit strategy. We implement two tiers of rate limit: a low-level rate limit that corresponds to the maximum rate we expect two to three users to send, and a high-level rate limit that corresponds to the maximum rate we expect from a single IP with hundreds of users sharing the IP. Our low-level rule uses a CAPTCHA rule action when requests exceed the limit. Our high-level rule applies a Block action when requests exceed the limit. We set the high-level rate limit rule priority lower than the low-level rule so it’s processed first, as shown in the following screenshot.

AWS WAF web ACL interface displaying rules for traffic allow, block, and CAPTCHA actions

When a few users are sharing an IP address, they’re unlikely to hit either limit and can use the application without interruption. If a large group of users share an IP address, they’ll need to solve a CAPTCHA. After they solve it, they’re still limited by the high-level rate limit rule, which will prevent a threat actor from solving the CAPTCHA and then sending unlimited traffic using the token issued by AWS WAF.

Handling CAPTCHA on the frontend

For server-rendered applications, AWS WAF handles CAPTCHA challenges automatically through the following process:

  1. When a request matches a CAPTCHA rule without a valid token, AWS WAF presents an AWS managed CAPTCHA challenge page.
  2. Upon successful CAPTCHA completion, AWS WAF issues a Set-Cookie header containing the CAPTCHA token.
  3. Subsequent requests with valid CAPTCHA tokens can pass through AWS WAF for the configured immunity period.

For single-page applications (SPAs) or applications making API requests to a AWS WAF protected backend, additional implementation steps are required:

  1. Configure your frontend to detect blocked requests (HTTP 405 status code indicates CAPTCHA requirement).
  2. Present the CAPTCHA challenge to the user when required.
  3. Resubmit the original request after successful CAPTCHA completion.

The following sample code demonstrates how to implement CAPTCHA handling in a React component using the AWS WAF CAPTCHA JavaScript API:

import { useState, useRef, useEffect, ReactElement } from "react";

declare global {
  class CaptchaError extends Error {
    constructor(message: string);
    kind: "internal_error" | "network_error" | "token_error" | "client_error";
    statusCode?: number;
  }
  interface Window {
    AwsWafCaptcha: {
      renderCaptcha: (
        targetDiv: HTMLElement,
        options: {
          apiKey: string;
          onSuccess: (token: string) => void;
          onError: (err: CaptchaError) => void;
        }
      ) => void;
    };
    AwsWafIntegration: {
      fetch: typeof fetch;
    },
    awsWafCookieDomainList: string[];
  }
}

type DataLoading = {
  state: "loading";
};

type DataError = {
  state: "error";
  message: string;
};

type DataLoaded = {
  state: "loaded";
  data: any;
};

type Data = DataLoading | DataError | DataLoaded;

function MyComponent(): ReactElement {
  const [data, setData] = useState<Data>({ state: "loading" });
  const captchaDiv = useRef<HTMLDivElement>(null);

  useEffect(() => {
    void (async () => {
      try {
        const response = await window.AwsWafIntegration.fetch('/your/api/url');

        if (response.status === 405) {
          // The user needs to solve a captcha. 
          window.AwsWafCaptcha.renderCaptcha(captchaDiv.current!, {
              apiKey: "...API key goes here...",
              onSuccess: async _wafToken => {
                const response = await window.AwsWafIntegration.fetch('/your/api/url');
    
                if (response.status !== 200) {
                  setData({ state: "error", message: "Unable to load data." });
                }
    
                const data = await response.json();
                setData({ state: "loaded", data });
              },
              onError: e => {
                console.error(e);
                setData({ state: "error", message: "Unable to load data." });
              }
              /* ...other configuration parameters as needed... */
          });
          

          return;
        }

        if (response.status !== 200) {
          throw new Error(`Unexpected response status: ${response.status}`);
        }

        const data = await response.json();
        setData({ state: "loaded", data });
      } catch (e) {
        console.error(e);
        setData({ state: "error", message: "Unable to load data." });
      }
    })();
  }, []);

  return (
    <div>
      <div ref={captchaDiv} />
      <div>
        {/* render the data */}
      </div>
    </div>
  );
}

Preventing CAPTCHA token reuse

Although AWS WAF provides built-in CAPTCHA functionality, additional security measures are necessary to prevent token reuse events. In these events, threat actors can solve a CAPTCHA one time and distribute the token across their botnet. AWS WAF Bot Control offers protection against this vulnerability by detecting and blocking CAPTCHA token reuse across multiple IPs, ASNs, or countries.

To implement this protection:

  1. Configure the AWSManagedRulesBotControlRuleSet managed rule group after your rate-limiting rules.
  2. Use the targeted protection level.
  3. Apply Count or Allow actions to specific rules that you don’t want to apply to your traffic instead of a Block or CAPTCHA action.
  4. Monitor and adjust rule actions based on observed traffic patterns.

Conclusion

In this post, you learned how we implemented comprehensive DDoS protection using AWS WAF by:

  • Implementing best practices for AWS WAF network topology using CloudFront
  • Segmenting human and machine traffic in our AWS WAF configuration
  • Using tiered rate limits and CAPTCHA to allow legitimate requests
  • Preventing CAPTCHA token reuse by using AWS WAF Bot Control

To learn more about fine-tuning and optimizing AWS WAF Bot Control, refer to Fine-tune and optimize AWS WAF Bot Control mitigation capability by Dmitriy Novikov in the AWS Security Blog.


About the authors

Realizing ocean data democratization: Furuno Electric’s initiatives using Amazon DataZone

Post Syndicated from Akira Mikami original https://aws.amazon.com/blogs/big-data/realizing-ocean-data-democratization-furuno-electrics-initiatives-using-amazon-datazone/

This is a guest post authored by Akira Mikami, a technical expert at Furuno Electric. The content and opinions in this post are those of the third-party author and AWS is not responsible for the content or accuracy of this post.

Since successfully commercializing the world’s first fish finder in 1948, Furuno Electric has been developing unique ultrasonic and electronic technologies in the marine electronics field. Under the company motto of “making the invisible visible”, they’ve have expanded their business centered on marine sensing technology and are now extending into subscription-based data businesses using Internet of Things (IoT) data. They’re are actively promoting the planning and development of data businesses to realize their new management vision outlined in FURUNO GLOBAL VISION NAVI NEXT 2030.

Like many manufacturing companies, Furuno Electric faced significant changes in revenue structure and technical architecture as they transitioned from traditional business to data-driven business. To succeed in this transformation, it was essential to build a foundation that promotes data utilization across the entire organization.

This post demonstrates how Furuno Electric built their system using Amazon DataZone and other Amazon Web Services (AWS) services to address technical infrastructure fragmentation, establish proper security governance, and develop an effective data business promotion system as part of their journey transitioning from a traditional manufacturing company to a data-driven business.

Challenges

Furuno Electric faced three specific challenges in promoting their data business: technical infrastructure fragmentation and duplication, lack of security governance, and underdeveloped data business promotion system.

Project managers in the data business were independently designing and building data infrastructure, resulting in duplication of components for data collection, processing, and storage. This situation created wasteful development investments, hindered effective use of common data, and caused inefficient states that took time to launch businesses. Marine data services including fishing vessel data collection and sharing system, FWC, and Furuno Open Platform (FOP) had similar functions implemented separately for each project along the functional axes of data collection, processing, visualization, and analysis, resulting in unnecessary workload across the organization.

Security measures were considered and implemented separately by each department, and although checklists existed, they weren’t applied uniformly. This resulted in a lack of consistency in security measures, duplicate consideration costs for each department, and uncertainty in the comprehensiveness of measures. Integrated risk management was also difficult.

The organizational structure wasn’t prepared for the iterative development processes and long-term revenue models specific to data businesses, and there was a lack of mechanisms for cross-departmental data utilization and joint development. The distributed operational structure across departments made it difficult to rapidly deploy and continuously improve data businesses. In the process of creating data businesses, it became necessary to build entirely different customer relationships compared to traditional product sales businesses. In terms of organizational management and talent strategy, there was a need to transition from a top-down, risk-averse, specialized skill-focused structure to a bottom-up, challenge-oriented structure that emphasizes communication skills and diversity.

Solution overview

Furuno Electric built a data management foundation centered on Amazon DataZone, Amazon Simple Storage Service (Amazon S3), AWS Glue, and AWS Control Tower, a comprehensive solution designed to address each of the three challenges mentioned in the preceding section.

Building the integrated data platform JuBuRaw

To address technical infrastructure fragmentation and duplication, they built Junction Architecture of Business Raw Data (JuBuRaw), a platform that consolidates common components for data collection, storage, management, and authentication. Using AWS Cloud Development Kit (AWS CDK) to code the infrastructure, they achieved standardization and automation of environment construction. This provides consistency and reproducibility, making it easier to add new systems and migrate existing systems to the common platform. Merely by executing CDK, a standard data pipeline (using AWS IoT Core, Amazon S3, AWS Glue, Amazon Kinesis, Amazon API Gateway, and AWS Lambda) for a specific system is automatically built. This eliminates duplicate design and development within the organization, reducing business launch time and improving fixed cost management. By standardizing common functions, they reduced the management and operation costs of existing systems and enabled the launch of new systems in half the time compared to before.

The following diagram is the overall JuBuRaw architecture.

Security control with AWS Control Tower

To address the lack of security governance, they implemented a comprehensive security framework centered on AWS Control Tower to apply consistent security policies across multiple accounts. With automated monitoring systems using AWS Security Hub, AWS Config, and AWS CloudTrail and an integrated authentication system using AWS IAM Identity Center, they provide security consistency while reducing operational costs and management burden.

With the organization’s management account at the top, they placed AWS Control Tower, AWS Organizations, and AWS IAM Identity Center to achieve hierarchical security management. By adopting a multi-layered defense structure consisting of account baselines with AWS CloudTrail and AWS Config enabled, log archive environments, and audit and security operation environments, consistent security policies are applied to all accounts, enabling early detection and response to security incidents. This integrated approach has reduced the workload for security responses. This configuration is shown in the following diagram.

Establishing a data democratization foundation with Amazon DataZone

To address the underdeveloped data business promotion system, they introduced Amazon DataZone to streamline data discovery, sharing, and governance across the organization. They clarified the role division between the infrastructure management team and the data management team, centralizing data security policies, quality management, and metadata standardization. With a project-based collaboration environment, they promoted cross-departmental data utilization, establishing a foundation to support the creation and continuous monetization of data businesses.

Organizational reform and operational structure establishment

In parallel with the introduction of technical solutions, they implemented organizational reforms to support medium- to long-term data utilization. The new organizational structure consists of three main roles: the infrastructure management team, the data management team, and the chief data officer. The following chart shows this organizational structure.

The infrastructure management team is responsible for maintaining and developing the technical foundation of the platform, managing multiple accounts using AWS Control Tower, applying and monitoring security baselines, and tracking infrastructure version management and changing history. By specializing in common technologies, they can provide a stable platform.

The data management team is responsible for data quality management and continual improvement using AWS Glue Data Quality, standardization and maintenance of metadata, definition and application of data security policies, management of Amazon DataZone data Catalog, and providing data governance using Amazon DataZone. To maximize the value of data, they focus on deeply understanding business requirements and data characteristics and performing appropriate data management.

The chief data officer is responsible for formulating data business strategies and determining direction, promoting coordination and collaboration between teams, making decisions regarding the evolution of the data management foundation, and fostering a data utilization culture throughout the organization. From a strategic perspective, they oversee the whole and bridge business goals and technology.

This clear division of roles has established an operational structure for effective data utilization, accelerating the data business creation process. Additionally, clarifying data ownership has improved data quality and reliability, promoting data utilization across the organization. This structure is sustainable and can flexibly respond to technological changes and changes in the business environment.

Benefits of the modernized platform

As a concrete application example of the integrated data platform JuBuRaw and organizational structure explained in the previous section, we introduce the migration project of the existing service SHIPS. This use case is a comprehensive migration case that uses all three solution elements of data collection, management, and utilization mentioned earlier.

Furuno Electric provides a system called SHIPS that plots ship position information and monitors the status of equipment installed on ships. By migrating this existing service to the JuBuRaw foundation, the several functional enhancements are expected.

In terms of data integration enhancement, by using the data catalog function of Amazon DataZone, it becomes easier to integrate not only ship position information but also various data sources such as internal systems, IoT devices, other company systems, automatic identification system (AIS) data, and weather and sea condition data. This enables swift data analysis and comprehensive ship management, which means operators can detect potential issues and implement preventive measures before they develop into serious problems. Particularly important is that by storing this data in a common data lake and retaining them as master data, they create an environment where the data can be easily used by other applications.

For security enhancement, organizations can use Amazon DataZone federated governance with publish-subscribe (pubsub) workflow mechanism and fine-grained access control capabilities. This means they can implement detailed permissions management specifically for data assets, rows, and columns while maintaining unified access control and data governance across multiple AWS accounts and organizational boundaries.

In this case, by using the new integrated data management foundation, it becomes possible to integrate individually designed and built data foundations, improving both efficiency and functionality. A consistent data flow from data sources to the data platform and then to individual applications is realized, enabling flexible data utilization centered on the data lake. Linkage with each application can also be easily realized from the data lake, providing expandability for future data utilization.

This SHIPS migration case is a comprehensive approach using the solution elements of the JuBuRaw foundation and is expected to serve as a reference model for future system migrations. It’s expected to achieve both service quality improvement and operational cost reduction.

Future vision and next steps

Based on the data management foundation they’ve built, Furuno Electric aims to further expand and deepen data utilization. As part of their plan to continue and expand digital transformation, they’re currently starting with the migration of SHIPS, but plan to gradually migrate other IoT-related services (such as FOP, FWC, and Ichidake) to the new data management foundation in the future. This is expected to further strengthen the foundation for company-wide data utilization and enhance synergies between services.

Continuous enhancement of secure data sharing and access control is also essential. With the increase in data and expansion of utilization scope, the importance of security and access control will further increase. They’ll optimize the balance between data protection and utilization while incorporating practices accumulated through operations.

Additionally, Furuno Electric is exploring the expansion of their data management capabilities to Amazon SageMaker, specifically using Amazon SageMaker Catalog integrated with Amazon DataZone. This integration will enable them to seamlessly extend their existing data analytics governance workflows into artificial intelligence and machine learning (AI/ML) workloads. By applying the same data discovery, data sharing, and access control foundation across both data analytics and AI model development, they can accelerate the development of new AI-powered services. The unified governance framework will also provide secure and efficient AI adoption throughout the organization.

Through these initiatives, Furuno Electric is realizing their company motto of “making the invisible visible” in the field of data business as well. The integrated data platform JuBuRaw isn’t just an integration of technical foundations but serves as a foundation to support organizational culture transformation and the creation of new business models. As seen in the SHIPS migration case, using this foundation not only enhances existing services but also expands possibilities for new data utilization.

Through building a data foundation that can flexibly respond to business growth and changes while using a cloud-based environment, Furuno Electric has successfully led their digital transformation. They’ll continue to provide new value to customers through the democratization of marine data and accelerate the transition to data-driven business.

This case serves as a reference for many manufacturing companies promoting data utilization, showing that approaches from both technical and organizational perspectives are key to success. As Furuno Electric’s initiatives demonstrate, data democratization and effective utilization play an important role in the digital transformation of manufacturing.


About the Authors

Akira Mikami is a technical expert who played a central role in the FURUNO Data Platform (JuBuRaw) Construction Project at Furuno Electric Co., Ltd. Specializing in data platform construction and architecture, he led the implementation of cloud solutions utilizing AWS. He contributed to achieving efficient data management and strengthening team collaboration, leading the project to success.

Junpei Ozono is a Sr. Go-to-market (GTM) Data & AI solutions architect at Amazon Web Services (AWS) in Japan. He drives technical market creation for data and AI solutions while collaborating with global teams to develop scalable GTM motions. He guides organizations in designing and implementing innovative data-driven architectures powered by AWS services, helping customers accelerate their cloud transformation journey through modern data and AI solutions. His expertise spans across modern data architectures including data mesh, data lakehouse, and generative AI, so customers can build scalable and innovative solutions on Amazon Web Services (AWS).

Mitsuhiko Nishida is an Enterprise Solutions Architecture Automotive & Manufacturing Group Solutions Architect at Amazon Web Services (AWS) in Japan. He serves as a field Solutions Architect for manufacturing customers, helping them solve their business challenges. With expertise in generative AI and manufacturing IT, he guides the design and implementation of innovative solutions leveraging cutting-edge technologies. He supports manufacturing customers in building efficient architecture powered by AWS services to accelerate their cloud transformation journey and contribute to their digital transformation initiatives.

Kaltura reduces observability operational costs by 60% with Amazon OpenSearch Service

Post Syndicated from Ido Ziv original https://aws.amazon.com/blogs/big-data/kaltura-reduces-observability-operational-costs-by-60-with-amazon-opensearch-service/

This post is co-written with Ido Ziv from Kaltura.

As organizations grow, managing observability across multiple teams and applications becomes increasingly complex. Logs, metrics, and traces generate vast amounts of data, making it challenging to maintain performance, reliability, and cost-efficiency.

At Kaltura, an AI-infused video-first company serving millions of users across hundreds of applications, observability is mission-critical. Understanding system behavior at scale isn’t just about troubleshooting—it’s about providing seamless experiences for customers and employees alike. But achieving effective observability at this scale comes with challenges: managing spans; correlating logs, traces, and events across distributed systems; and maintaining visibility without overwhelming teams with noise. Balancing granularity, cost, and actionable insights requires constant tuning and thoughtful architecture.

In this post, we share how Kaltura transformed its observability strategy and technological stack by migrating from a software as a service (SaaS) logging solution to Amazon OpenSearch Service—achieving higher log retention, a 60% reduction in cost, and a centralized platform that empowers multiple teams with real-time insights.

Observability challenges at scale

Kaltura ingests over 8TB of logs and traces daily, processing more than 20 billion events across 6 production AWS Regions and over 200 applications—with log spikes reaching up to 6 GB per second. This immense data volume, combined with a highly distributed architecture, created significant challenges in observability. Historically, Kaltura relied on a SaaS-based observability solution that met initial requirements but became increasingly difficult to scale. As the platform evolved, teams generated disparate log formats, applied retention policies that no longer reflected data value, and operated more than 10 organically grown observability sources. The lack of standardization and visibility required extensive manual effort to correlate data, maintain pipelines, and troubleshoot issues – leading to rising operational complexity and fixed costs that didn’t scale efficiently with usage.

Kaltura’s DevOps team recognized the need to reassess their observability solution and began exploring a variety of options, from self-managed platforms to fully managed SaaS offerings. After a comprehensive evaluation, they made the strategic decision to migrate to OpenSearch Service, using its advanced features such as Amazon OpenSearch Ingestion, the Observability plugin, UltraWarm storage, and Index State Management.

Solution overview

Kaltura created a new AWS account that would be a dedicated observability account, where OpenSearch Service was deployed. Logs and traces were collected from different accounts and producers such as microservices on Amazon Elastic Kubernetes Service (Amazon EKS) and services running on Amazon Elastic Compute Cloud (Amazon EC2).

By using AWS services such as AWS Identity and Access Management (IAM), AWS Key Management Service (AWS KMS), and Amazon CloudWatch, Kaltura was able to meet the standards to create a production-grade system while keeping security and reliability in mind. The following figure shows a high-level design of the environment setup.

Ingestion

As seen in the following diagram, logs are shipped using log shippers, also known as collectors. In Kaltura’s case, they used Fluent Bit. A log shipper is a tool designed to collect, process, and transport log data from various sources to a centralized location, such as log analytics platforms, management systems, or an aggregator system. Fluent Bit was used in all sources and also provided light processing abilities. Fluent Bit was deployed as a daemonset in Kubernetes. The application development teams didn’t change their code, because the Fluent Bit pods were reading the stdout of the application pods.

The following code is an example of FluentBit configurations for Amazon EKS:

[INPUT]
   Name                tail
   Path                /var/log/containers/*.log
   Tag                 kube.*
   Skip_Long_Lines     On
   multiline.parser    docker, cri
[FILTER]
   alias               k8s
   # kubernetes filter to parse all logs
   Name                kubernetes
   Match               kube.*
   Kube_Tag_Prefix     kube.var.log.containers.
   Annotations         On
   Labels              Off
   Merge_Log           On
   Keep_Log            Off
   Kube_URL            https://kubernetes.default.svc.cluster.local:443 
[FILTER]
   alias               apps
   Name                rewrite_tag
   Match               kube.*
   Rule                $kubernetes['annotations']['kaltura.com/observability'] ^apps$ 
[OUTPUT]
   Name                http
   Match               apps.*
   Alias               apps
   Host                xxxxx.us-east-1.osis.amazonaws.com
   Port                443
   URI                 /log/apps
   Format              json
   aws_auth            true
   aws_region          us-east-1
   aws_service         osis
   aws_role_arn        arn:aws:iam::xxxxx:role/osis-ingestion-role
   Log_Level           trace
   tls On

Spans and traces were collected directly from the application layer using a seamless integration approach. To facilitate this, Kaltura deployed an OpenTelemetry Collector (OTEL) using the OpenTelemetry Operator for Kubernetes. Additionally, the team developed a custom OTEL code library, which was incorporated into the application code to efficiently capture and log traces and spans, providing comprehensive observability across their system.

Data from Fluent Bit and OpenTelemetry Collector was sent to OpenSearch Ingestion, a fully managed, serverless data collector that delivers real-time log, metric, and trace data to OpenSearch Service domains and Amazon OpenSearch Serverless collections. Each producer sent data to a specific pipeline, one for logs and one for traces, where data was transformed, aggregated, enriched, and normalized before being sent to OpenSearch Service. The trace pipeline used the otel_trace and service_map processors, while using the OpenSearch Ingestion OpenTelemetry trace analytics blueprint.

The following code is an example of the OpenSearch Ingestion pipeline for logs:

version: "2"
entry-pipeline:
 source:
   http:
     path: "/log/apps"

 processor:
   - add_entries:
       entries:
       - key: "log_type"
         value: "default"
       - key: "log_type"
         value: "api"
         add_when: 'contains(/filename, "api.log")'
         overwrite_if_key_exists: true
       - key: "log_type"
         value: "stats"
         add_when: 'contains(/filename, "stats.log")'
         overwrite_if_key_exists: true
       - key: "log_type"
         value: "event"
         add_when: 'contains(/filename, "event.log")'
         overwrite_if_key_exists: true
       - key: "log_type"
         value: "login"
         add_when: 'contains(/filename, "login.log")'
         overwrite_if_key_exists: true

   - grok:
       grok_when: '/log_type == "api"'
       match:
         log: ['^\[%%{DATA:timestamp}] \[%%{DATA:logIp}\] \[%%{DATA:host}\] \[%%{WORD:id}\] %%{WORD:priorityName}\(%%{NUMBER:priority}\): \[memory: %%{DATA:memory} MB, real: %%{DATA:real}MB\] %%{GREEDYDATA:message}']

   - date:
       match:
         - key: timestamp
           patterns: ["dd-MMM-yyyy HH:mm:ss", "dd/MMM/yyyy:HH:mm:ss Z", "EEE MMM dd HH:mm:ss.SSSSSS yyyy"]

       destination: "@timestamp"
       output_format: "yyyy-MM-dd'T'HH:mm:ss"

   - rename_keys:
       entries:
       - from_key: "timestamp"
         to_key: "@timestamp"
         overwrite_if_to_key_exists: false
       - from_key: "date"
         to_key: "@timestamp"
         overwrite_if_to_key_exists: false

   - drop_events:
       drop_when: 'contains(/filename, "simplesamlphp.log")'


 sink:
   - opensearch:
       hosts: ["${opensearch_host}"]
       index: '$${/env}-api-$${/log_type}-app-logs'
       index_type: custom
       action: create
       bulk_size: 20
       aws:
         sts_role_arn: ${sts_role_arn}
         region:  ${region}
       dlq:
         s3:
           bucket: "${bucket}"
           key_path_prefix: 'my-app-dlq-files'
           region: "${region}"
           sts_role_arn: "${sts_role_arn}"

The preceding example shows the use of processors such as grok, date, add_entries, rename_keys, and drop_events:

  • add_entries:
    • Adds a new field log_type based on filename
    • Default: “default”
    • If the filename contains specific substrings (such as api.log or stats.log), it assigns a more specific type
  • grok:
    • Applies Grok parsing to logs of type “api”
    • Extracts fields like timestamp, logIp, host, priorityName, priority, memory, real, and message using a custom pattern
  • date:
    • Parses timestamp strings into a standard datetime format
    • Stores it in a field called @timestamp based on ISO8601 format
    • Handles multiple timestamp patterns
  • rename_keys:
    • timestamp or date are renamed into @timestamp
    • Does not overwrite if @timestamp already exists
  • drop_events:
    • Drops logs where filename contains simplesamlphp.log
    • This is a filtering rule to ignore noisy or irrelevant logs

The following is an example of the input of a log line:

   "log": "[25-Mar-2025 18:23:18] [127.0.0.1] [the-most-awesome-server-in-kaltura] [67e2f496cc321] INFO(6): [memory: 4.51 MB, real: 6MB] [request: 1] [time: 0.0263s / total: 0.0263s]",

After processing, we get the following code:

    "log_type": "api",
    "priorityName": "INFO",
    "memory": "4.51",
    "host": "the-most-awesome-server-in-kaltura",
    "real": "6",
    "priority": "6",
    "message": "[request: 1] [time: 0.0263s / total: 0.0263s]",
    "logIp": "127.0.0.1",
    "id": "67e2f496cc321",
    "@timestamp": "2025-03-25T18:23:18"

Kaltura followed some OpenSearch Ingestion best practices, such as:

  • Including a dead-letter queue (DLQ) in pipeline configuration. This can significantly help troubleshoot pipeline issues.
  • Starting and stopping pipelines to optimize cost-efficiency, when possible.
  • During the proof of concept stage:
    • Installing Data Prepper locally for faster development iterations.
    • Disabling persistent buffering to expedite blue-green deployments.

Achieving operational excellence with efficient log and trace management

Logs and traces play a vital role in identifying operational issues, but they come with unique challenges. First, they represent time series data, which inherently evolves over time. Second, their value typically diminishes as time passes, making efficient management crucial. Third, they are append-only in nature. With OpenSearch, Kaltura faced distinct trade-offs between cost, data retention, and latency. The goal was to make sure valuable data remained accessible to engineering teams with minimal latency, but the solution also needed to be cost-effective. Balancing these factors required thoughtful planning and optimization.

Data was ingested to OpenSearch data streams, which simplifies the process of ingesting append-only time series data. Several Index State Management (ISM) policies were applied to different data streams, which were dependent on log retention requirements. ISM policies handled moving indexes from hot storage to UltraWarm, and eventually deleting the indexes. This allowed a customizable and cost-effective solution, with low latency for querying new data and reasonable latency for querying historical data.

The following example ISM policy makes sure indexes are managed efficiently, rolled over, and moved to different storage tiers based on their age and size, and eventually deleted after 60 days. If an action fails, it is retried with an exponential backoff strategy. In case of failures, notifications are sent to relevant teams to keep them informed.

{
    "id": "retention",
    "policy": {
        "description": "production ISM",
        },
        "default_state": "hot",
        "states": [
            {
                "name": "hot",
                "actions": [
                    {
                        "retry": {
                            "count": 5,
                            "backoff": "exponential",
                            "delay": "1h"
                        },
                        "rollover": {
                            "min_primary_shard_size": "30gb",
                            "copy_alias": false
                        }
                    }
                ],
                "transitions": [
                    {
                        "state_name": "warm",
                        "conditions": {
                            "min_index_age": "2d"
                        }
                    }
                ]
            },
            {
                "name": "warm",
                "actions": [
                    {
                        "retry": {
                            "count": 5,
                            "backoff": "exponential",
                            "delay": "1h"
                        },
                        "warm_migration": {}
                    }
                ],
                "transitions": [
                    {
                        "state_name": "cold",
                        "conditions": {
                            "min_index_age": "14d"
                        }
                    }
                ]
            },
            {
                "name": "cold",
                "actions": [
                    {
                        "retry": {
                            "count": 5,
                            "backoff": "exponential",
                            "delay": "1h"
                        },
                        "cold_migration": {
                            "start_time": null,
                            "end_time": null,
                            "timestamp_field": "@timestamp",
                            "ignore": "none"
                        }
                    }
                ],
                "transitions": [
                    {
                        "state_name": "delete",
                        "conditions": {
                            "min_index_age": "60d"
                        }
                    }
                ]
            },
            {
                "name": "delete",
                "actions": [
                    {
                        "retry": {
                            "count": 3,
                            "backoff": "exponential",
                            "delay": "1m"
                        },
                        "cold_delete": {}
                    }
                ],
                "transitions": []
            }
        ],
        "ism_template": [
            {
                "index_patterns": [
                    "*-logs"
                ],
                "priority": 50,
            }
        ]
    }
}

To create a data stream in OpenSearch, a definition of index template is required, which configures how the data stream and its backing indexes will behave. In the following example, the index template specifies key index settings such as the number of shards, replication, and refresh interval—controlling how data is distributed, replicated, and refreshed across the cluster. It also defines the mappings, which describe the structure of the data—what fields exist, their types, and how they should be indexed. These mappings make sure the data stream knows how to interpret and store incoming log data efficiently. Finally, the template enables the @timestamp field as the time-based field required for a data stream.

{
  "index_patterns": [
    "*my-app-logs"
  ],
  "template": {
    "settings": {
      "index.number_of_shards": "32",
      "index.number_of_replicas": "0",
      "index.refresh_interval": "60s"
    },
    "mappings": {
      "properties": {
        "priorityName": {
          "type": "keyword"
        },
        "log_type": {
          "type": "keyword"
        },
        "@timestamp": {
          "type": "date"
        },
        "memory": {
          "type": "float"
        },
        "host": {
          "type": "keyword"
        },
        "pid": {
          "type": "keyword"
        },
        "real": {
          "type": "float"
        },
        "env": {
          "type": "keyword"
        },
        "message": {
          "type": "text"
        },
        "priority": {
          "type": "integer"
        },
        "logIp": {
          "type": "ip"
        }
      }
    }
  },
  "composed_of": [],
  "priority": "100",
  "_meta": {
    "flow": "simple"
  },
  "data_stream": {
    "timestamp_field": {
      "name": "@timestamp"
    }
  },
  "name": "my-app-logs"
}

Implementing role-based access control and user access

The new observability platform is accessed by many types of users; internal users log in to OpenSearch Dashboards using SAML-based federation with Okta. The following diagram illustrates the user flow.

Each user accesses the dashboards to view observability items relevant to their role. Fine-grained access control (FGAC) is enforced in OpenSearch using built-in IAM role and SAML group mappings to implement role-based access control (RBAC).When users log in to the OpenSearch domain, they are automatically routed to the appropriate tenant based on their assigned role. This setup makes sure developers can create dashboards tailored to debugging within development environments, and support teams can build dashboards focused on identifying and troubleshooting production issues. The SAML integration alleviates the need to manage internal OpenSearch users entirely.

For each role in Kaltura, a corresponding OpenSearch role was created with only the necessary permissions. For instance, support engineers are granted access to the monitoring plugin to create alerts based on logs, whereas QA engineers, who don’t require this functionality, are not granted that access.

The following screenshot shows the role of the DevOps engineers defined with cluster permissions.

These users are routed to their own dedicated DevOps tenant, to which they only have write access. This makes it possible for different users from different roles in Kaltura to create the dashboard items that focus on their priorities and needs. OpenSearch supports backend role mapping; Kaltura mapped the Okta group to the role so when a user logs in from Okta, they automatically get assigned based on their role.

This also works with IAM roles to facilitate automations in the cluster using external services, such as OpenSearch Ingestion pipelines, as can be seen in the following screenshot.

Using observability features and service mapping for enhanced trace and log correlation

After a user is logged in, they can use the Observability plugins, view surrounding events in logs, correlate logs and traces, and use the Trace Analytics plugin. Users can inspect traces and spans, and group traces with latency information using built-in dashboards. Users can also drill down to a specific trace or span and correlate it back to log events. The service_map processor used in OpenSearch Ingestion sends OpenTelemetry data to create a distributed service map for visualization in OpenSearch Dashboards.

Using the combined signals of traces and spans, OpenSearch discovers the application connectivity and maps them to a service map.

After OpenSearch ingests the traces and spans from Otel, they are aggregated to groups according to paths and trends. Durations are also calculated and presented to the user over time.

With a trace ID, it’s possible to filter out all the relevant spans by the service and see how long each took, identifying issues with external services such as MongoDB and Redis.

From the spans, users can discover the relevant logs.

Post-migration enhancements

After the migration, a strong developer community emerged within Kaltura that embraced the new observability solution. As adoption grew, so did requests for new features and enhancements aimed at improving the overall developer experience.

One key improvement was extending log retention. Kaltura achieved this by re-ingesting historical logs from Amazon Simple Storage Service (Amazon S3) using a dedicated OpenSearch Ingestion pipeline with Amazon S3 read permissions. With this enhancement, teams can access and analyze logs from up to a year ago using the same familiar dashboards and filters.

In addition to monitoring EKS clusters and EC2 instances, Kaltura expanded its observability stack by integrating more AWS services. Amazon API Gateway and AWS Lambda were introduced to support log ingestion from external vendors, allowing for seamless correlation with existing data and broader visibility across systems.

Finally, to empower teams and promote autonomy, data stream templates and ISM policies are managed directly by developers within their own repositories. By using infrastructure as code tools like Terraform, developers can define index mappings, alerts, and dashboards as code—versioned in Git and deployed consistently across environments.

Conclusion

Kaltura successfully implemented a smart log retention strategy, extending real time retention from 5 days for all log types to 30 days for critical logs, while maintaining cost-efficiency through the use of UltraWarm nodes. This approach led to a 60% reduction in costs compared to their previous solution. Additionally, Kaltura consolidated their observability platform, streamlining operations by merging 10 separate systems into a unified, all-in-one solution. This consolidation not only improved operational efficiency but also sparked increased engagement from developer teams, driving feature requests, fostering internal design collaborations, and attracting early adopters for new enhancements. If Kaltura’s journey has inspired you and you’re thinking about implementing a similar solution in your organization, consider these steps:


About the authors

Ido Ziv is a DevOps team leader in Kaltura with over 6 years of experience. His hobbies include sailing and Kubernetes (but not at the same time).

Roi Gamliel is a Senior Solutions Architect helping startups build on AWS. He is passionate about the OpenSearch Project, helping customers fine-tune their workloads and maximize results.

Yonatan Dolan is a Principal Analytics Specialist at Amazon Web Services. He is located in Israel and helps customers harness AWS analytical services to use data, gain insights, and derive value.

How Skroutz handles real-time schema evolution in Amazon Redshift with Debezium

Post Syndicated from Konstantina Mavrodimitraki original https://aws.amazon.com/blogs/big-data/how-skroutz-handles-real-time-schema-evolution-in-amazon-redshift-with-debezium/

This guest post was co-authored with Kostas Diamantis from Skroutz.

At Skroutz, we are passionate about our product, and it is always our top priority. We are constantly working to improve and evolve it, supported by a large and talented team of software engineers. Our product’s continuous innovation and evolution lead to frequent updates, often necessitating changes and additions to the schemas of our operational databases.

When we decided to build our own data platform to meet our data needs, such as supporting reporting, business intelligence (BI), and decision-making, the main challenge—and also a strict requirement—was to make sure it wouldn’t block or delay our product development.

We chose Amazon Redshift to promote data democratization, empowering teams across the organization with seamless access to data, enabling faster insights and more informed decision-making. This choice supports a culture of transparency and collaboration, as data becomes readily available for analysis and innovation across all departments.

However, keeping up with schema changes from our operational databases, while updating the data warehouse without constantly coordinating with development teams, delaying releases, or risking data loss, became a new challenge for us.

In this post, we share how we handled real-time schema evolution in Amazon Redshift with Debezium.

Solution overview

Most of our data resides in our operational databases, such as MariaDB and MongoDB. Our approach involves using the change data capture (CDC) technique, which automatically handles the schema evolution of the data stores being captured. For this, we used Debezium along with a Kafka cluster. This solution enables schema changes to be propagated without disrupting the Kafka consumers.

However, handling schema evolution in Amazon Redshift became a bottleneck, prompting us to develop a strategy to address this challenge. It’s important to note that, in our case, changes in our operational databases primarily involve adding new columns rather than breaking changes like altering data types. Therefore, we have implemented a semi-manual process to resolve this issue, along with a mandatory alerting mechanism to notify us of any schema changes. This two-step process consists of handling schema evolution in real time and handling data updates in an asynchronous manual step. The following architectural diagram illustrates a hybrid deployment model, integrating both on-premises and cloud-based components.

End-to-end data migration workflow from on-premises databases to AWS cloud using CDC, messaging, and data warehouse services

The data flow begins with data from MariaDB and MongoDB, captured using Debezium for CDC in near real-time mode. The captured data is streamed to a Kafka cluster, where Kafka consumers (built on the Ruby Karafka framework) read and write them to the staging area, either in Amazon Redshift or Amazon Simple Storage Service (Amazon S3). From the staging area, DataLoaders promote the data to production tables in Amazon Redshift. At this stage, we apply the slowly changing dimension (SCD) concept to these tables, using Type 7 for most of them.

In data warehousing, an SCD is a dimension that stores data, and though it’s generally stable, it might change over time. Various methodologies address the complexities of SCD management. SCD Type 7 places both the surrogate key and the natural key into the fact table. This allows the user to select the appropriate dimension records based on:

  • The primary effective date on the fact record
  • The most recent or current information
  • Other dates associated with the fact record

Afterwards, analytical jobs are run to create reporting tables, enabling BI and reporting processes. The following diagram provides an example of the data modeling process from a staging table to a production table.

Database schema evolution: staging.shops to production.shops with added temporal and versioning columns

The architecture depicted in the diagram shows only our CDC pipeline, which fetches data from our operational databases and doesn’t include other pipelines, such as those for fetching data through APIs, scheduled batch processes, and many more. Also note that our convention is that dw_* columns are used to catch SCD metadata information and other metadata in general. In the following sections, we discuss the key components of the solution in more detail.

Real-time workflow

For the schema evolution part, we focus on the column dw_md_missing_data, which captures schema evolution changes in near real time that occur in the source databases. When a new change is produced to the Kafka cluster, the Kafka consumer is responsible for writing this change to the staging table in Amazon Redshift. For example, a message produced by Debezium to the Kafka cluster will have the following structure when a new shop entity is created:

{
  "before": null,
  "after": {
    "id": 1,
    "name": "shop1",
    "state": "hidden"
  },
  "source": {
    ...
    "ts_ms": "1704114000000",
    ...
  },
  "op": "c",
  ...
}

The Kafka consumer is responsible for preparing and executing the SQL INSERT statement:

INSERT INTO staging.shops (
  id,
  "name",
  state,
  dw_md_changed_at,
  dw_md_operation,
  dw_md_missing_data
)
VALUES
  (
    1,
    'shop1',
    'hidden',
    '2024-01-01 13:00:00',
    'create',
    NULL
  )
;

After that, let’s say a new column is added to the source table called new_column, with the value new_value.
The new message produced to the Kafka cluster will have the following format:

{
  "before": { ... },
  "after": {
    "id": 1,
    "name": "shop1",
    "state": "hidden",
    "new_column": "new_value"
  },
  "source": {
    ...
    "ts_ms": "1704121200000"
    ...
  },
  "op": "u"
  ...
}

Now the SQL INSERT statement executed by the Kafka consumer will be as follows:

INSERT INTO staging.shops (
  id,
  "name",
  state,
  dw_md_changed_at,
  dw_md_operation,
  dw_md_missing_data
)
VALUES
  (
    1,
    'shop1',
    'hidden',
    '2024-01-01 15:00:00',
    'update',
    JSON_PARSE('{"new_column": "new_value"}') /* <-- check this */
  )
;

The consumer performs an INSERT as it would for the known schema, and anything new is added to the dw_md_missing_data column as key-value JSON. After the data is promoted from the staging table to the production table, it will have the following structure.

Production.shops table displaying temporal data versioning with creation, update history, and current state indicators

At this point, the data flow continues running without any data loss or the need for communication with teams responsible for maintaining the schema in the operational databases. However, this data might not be easily accessible for the data consumers, analysts, or other personas. It’s worth noting that dw_md_missing_data is defined as a column of the SUPER data type, which was introduced in Amazon Redshift to store semistructured data or documents as values.

Monitoring mechanism

To track new columns added to a table, we have a scheduled process that runs weekly. This process checks for tables in Amazon Redshift with values in the dw_md_missing_data column and generates a list of tables requiring manual action to make this data available through a structured schema. A notification is then sent to the team.

Manual remediation steps

In the aforementioned example, the manual steps to make this column available would be:

  1. Add the new columns to both staging and production tables:
ALTER TABLE staging.shops ADD COLUMN new_column varchar(255);
ALTER TABLE production.shops ADD COLUMN new_column varchar(255);
  1. Update the Kafka consumer’s known schema. In this step, we just need to add the new column name to a simple array list. For example:
class ShopsConsumer < ApplicationConsumer
  SOURCE_COLUMNS = [
    'id',
    'name',
    'state',
    'new_column' # this one is the new column
  ]
 
  def consume
    # Ruby code for:
    #   1. data cleaning
    #   2. data transformation
    #   3. preparation of the SQL INSERT statement
 
    RedshiftClient.conn.exec <<~SQL
      /*
        generated SQL INSERT statement
      */
    SQL
  end
end
  1. Update the DataLoader’s SQL logic for the new column. A DataLoader is responsible for promoting the data from the staging area to the production table.
class DataLoader::ShopsTable < DataLoader::Base
  class << self
    def load
      RedshiftClient.conn.exec <<~SQL
        CREATE TABLE staging.shops_new (LIKE staging.shops);
      SQL
 
      RedshiftClient.conn.exec <<~SQL
        /*
          We move the data to a new table because in staging.shops
          the Kafka consumer will continue add new rows
        */
        ALTER TABLE staging.shops_new APPEND FROM staging.shops;
      SQL
 
      RedshiftClient.conn.exec <<~SQL
        BEGIN;
          /*
            SQL to handle
              * data deduplications etc
              * more transformations
              * all the necessary operations in order to apply the data modeling we need for this table
          */
 
          INSERT INTO production.shops (
            id,
            name,
            state,
            new_column, /* --> this one is the new column <-- */
            dw_start_date,
            dw_end_date,
            dw_current,
            dw_md_changed_at,
            dw_md_operation,
            dw_md_missing_data
          )
          SELECT
            id,
            name,
            state,
            new_column, /* --> this one is the new column <-- */
            /*
              here is the logic to apply the data modeling (type 1,2,3,4...7)
            */
          FROM
            staging.shops_new
          ;
 
          DROP TABLE staging.shops_new;
        END TRANSACTION;
      SQL
    end
  end
end
  1. Transfer the data that has been loaded in the meantime from the dw_md_missing_data SUPER column to the newly added column and then clean up. In this step, we just need to run a data migration like the following:
BEGIN;
 
  /*
    Transfer the data from the `dw_md_missing_data` to the corresponding column
  */
  UPDATE production.shops
  SET new_column = dw_md_missing_data.new_column::varchar(255)
  WHERE dw_md_missing_data.new_column IS NOT NULL;
 
  /*
    Clean up dw_md_missing_data column
  */
  UPDATE production.shops
  SET dw_md_missing_data = NULL
  WHERE dw_md_missing_data IS NOT NULL;
 
END TRANSACTION;

To perform the preceding operations, we make sure that no one else performs changes to the production.shops table because we want no new data to be added to the dw_md_missing_data column.

Conclusion

The solution discussed in this post enabled Skroutz to manage schema evolution in operational databases while seamlessly updating the data warehouse. This alleviated the need for constant development team coordination and removed risks of data loss during releases, ultimately fostering innovation rather than stifling it.

As the migration of Skroutz to the AWS Cloud approaches, discussions are underway on how the current architecture can be adapted to align more closely with AWS-centered principles. To that end, one of the changes being considered is Amazon Redshift streaming ingestion from Amazon Managed Streaming for Apache Kafka (Amazon MSK) or open source Kafka, which will make it possible for Skroutz to process large volumes of streaming data from multiple sources with low latency and high throughput to derive insights in seconds.

If you face similar challenges, discuss with an AWS representative and work backward from your use case to provide the most suitable solution.


About the authors

Konstantina Mavrodimitraki is a Senior Solutions Architect at Amazon Web Services, where she assists customers in designing scalable, robust, and secure systems in global markets. With deep expertise in data strategy, data warehousing, and big data systems, she helps organizations transform their data landscapes. A passionate technologist and people person, Konstantina loves exploring emerging technologies and supports the local tech communities. Additionally, she enjoys reading books and playing with her dog.

Kostas Diamantis is the Head of the Data Warehouse at Skroutz company. With a background in software engineering, he transitioned into data engineering, using his technical expertise to build scalable data solutions. Passionate about data-driven decision-making, he focuses on optimizing data pipelines, enhancing analytics capabilities, and driving business insights.

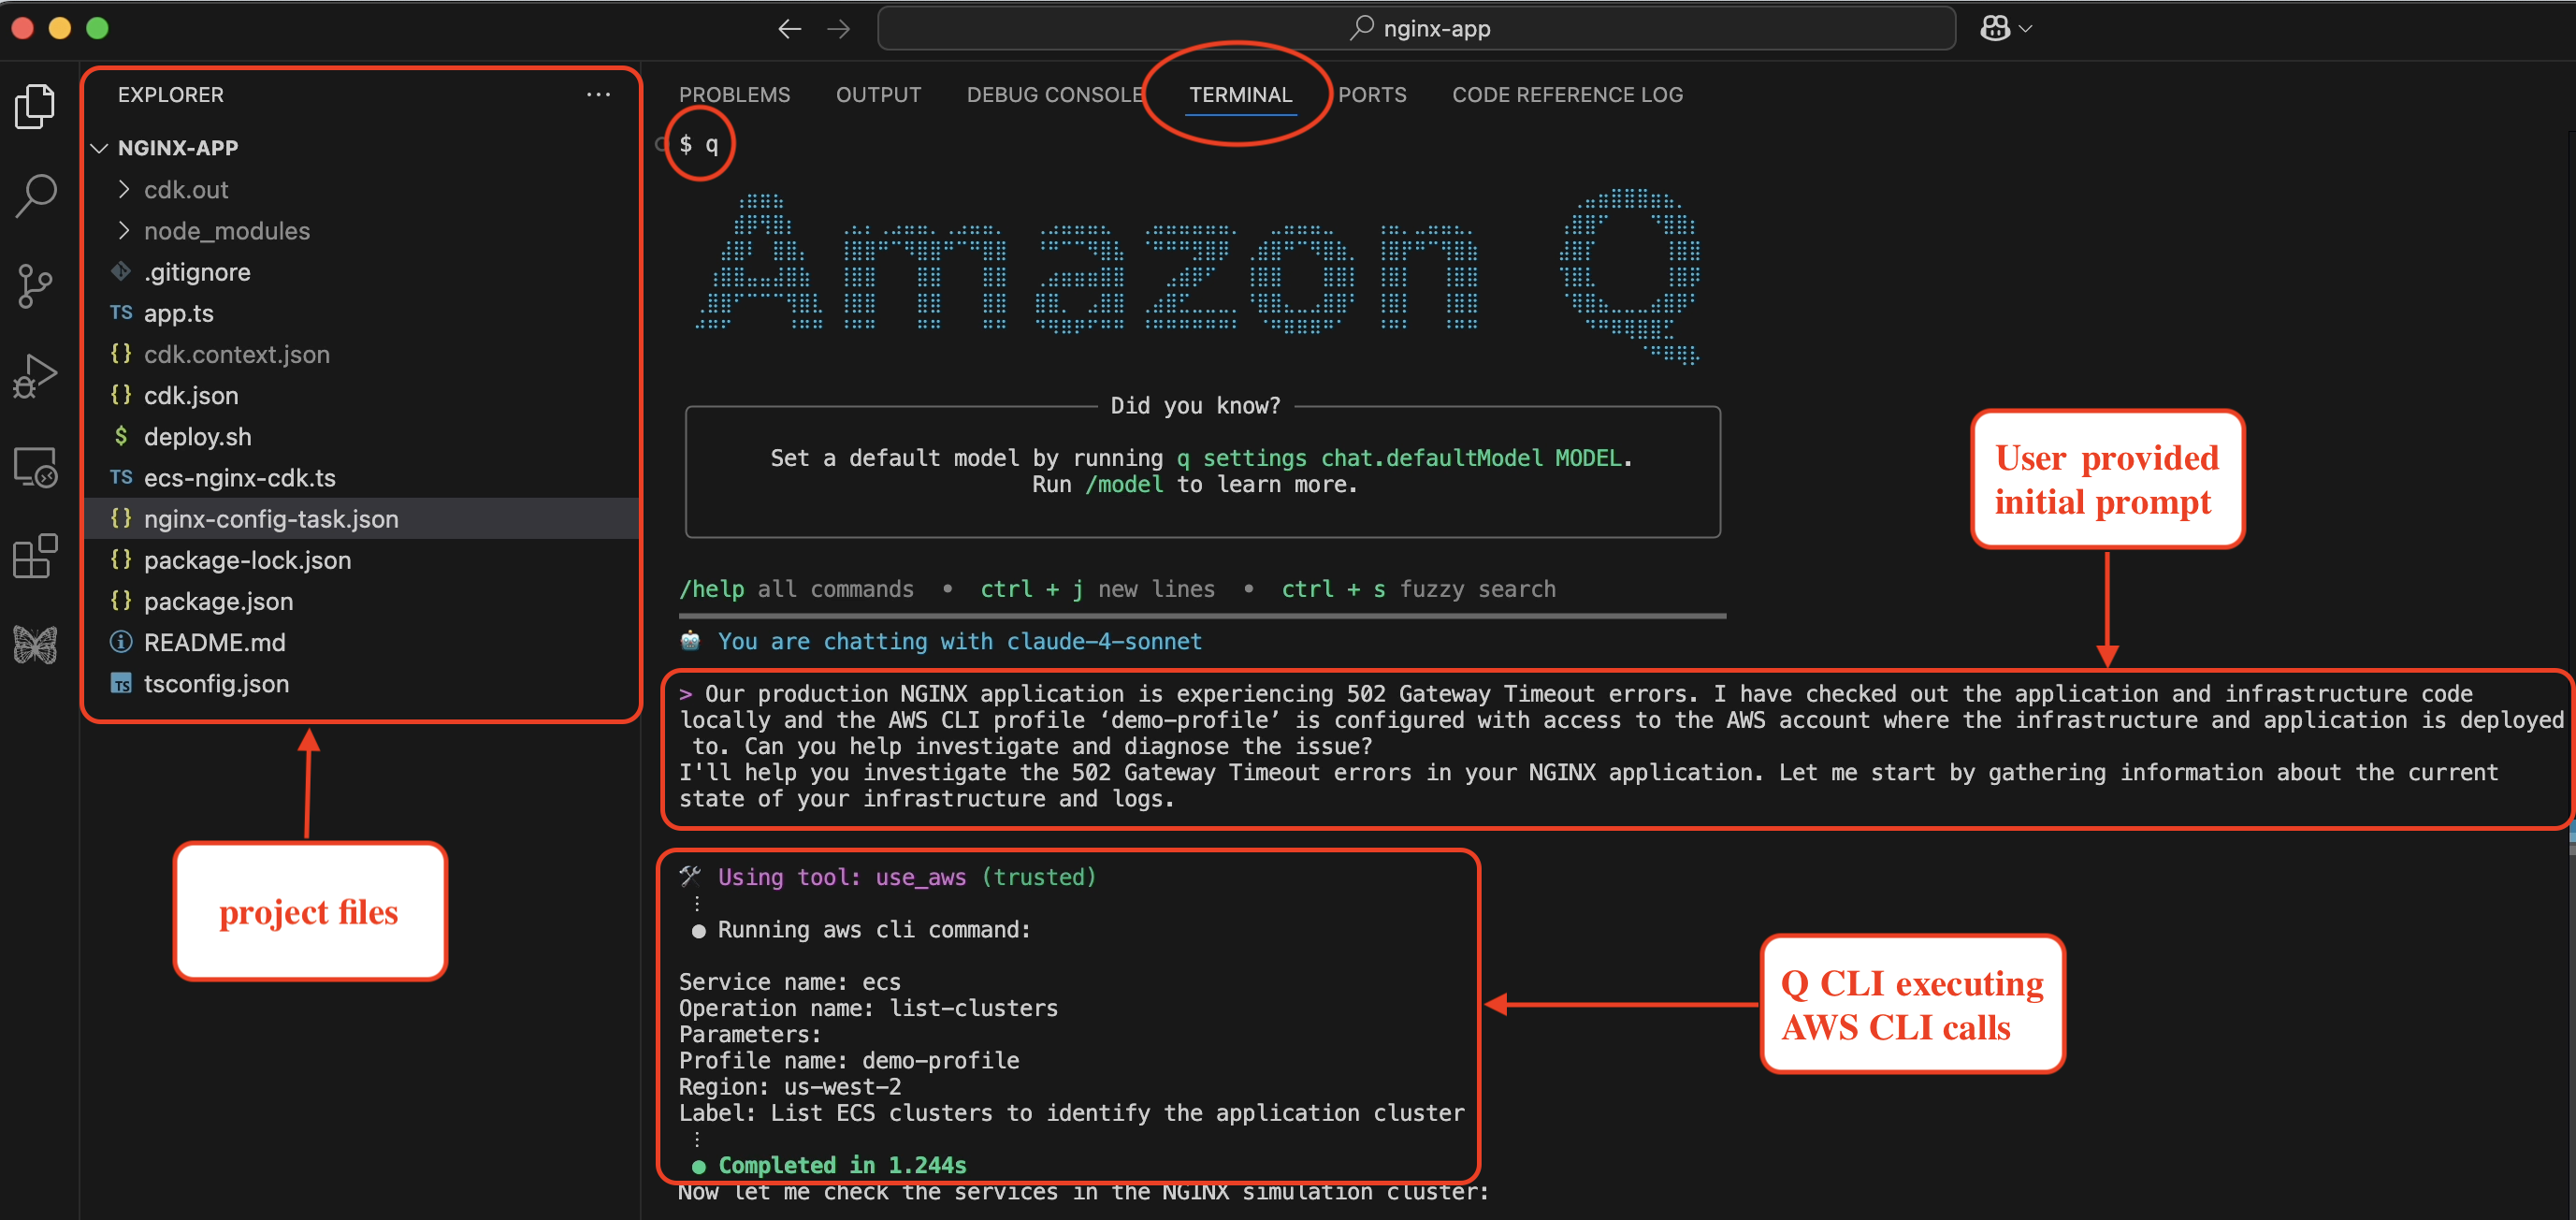
Streamline Operational Troubleshooting with Amazon Q Developer CLI

Post Syndicated from Kirankumar Chandrashekar original https://aws.amazon.com/blogs/devops/streamline-operational-troubleshooting-with-amazon-q-developer-cli/

Amazon Q Developer is the most capable generative AI–powered assistant for software development, helping developers perform complex workflows. Amazon Q Developer command-line interface (CLI) combines conversational AI with direct access to AWS services, helping you understand, build, and operate applications more effectively. The Amazon Q Developer CLI executes commands, analyzes outputs, and provides contextual recommendations based on best practices for troubleshooting tools and platforms available on your local machine.

In today’s cloud-native environments, troubleshooting production issues often involves juggling multiple terminal windows, parsing through extensive log files, and navigating numerous AWS console pages. This constant context-switching delays problem resolution and adds cognitive burden to teams managing cloud infrastructure.

In this blog post, you will explore how Amazon Q Developer CLI transforms the troubleshooting experience by streamlining challenging scenarios through conversational interactions.

The Traditional Troubleshooting Experience

When issues arise, engineers typically spend hours manually examining infrastructure configurations, reviewing logs across services, and analyzing error patterns. The process requires switching between multiple interfaces, correlating information from various sources, and deep AWS knowledge. This complex workflow often extends problem resolution from hours into days and increase the burden on the infrastructure teams.

Solution: Amazon Q Developer CLI

Amazon Q Developer CLI streamlines the entire troubleshooting process, from initial investigation to problem resolution, making complex AWS troubleshooting accessible and efficient through simple conversations.

How Amazon Q Developer CLI works:

  • Natural Language Interface: Execute AWS CLI commands and interact with AWS services using conversational prompts
  • Automated Discovery: Map out infrastructure and analyze configurations
  • Intelligent Log Analysis: Parse, correlate, and analyze logs across services
  • Root Cause Identification: Pinpoint issues through AI-powered reasoning
  • Guided Remediation: Implement fixes with minimal human intervention
  • Validation: Test solutions and explain complex issues simply

One of the built-in tools within the Amazon Q Developer CLI, use_aws, enables natural language interaction with AWS services, as shown in Figure 1. This tool leverages the AWS CLI permissions configured on your local machine, allowing secure and authorized access to your AWS resources.

A command line interface showing a list of tools and their permissions. The display is titled "/tools" and shows several built-in tools including execute_bash, fs_read, fs_write, report_issue, and use_aws. Each tool has an associated permission level indicated by asterisks. The use_aws tool is highlighted with "trust read-only commands" permission. At the bottom, there's a note stating "Trusted tools will run without confirmation" and a tip to "Use /tools help to edit permissions".

Figure 1: Tools selection in Amazon Q Developer CLI

Real-World Troubleshooting Scenario

Demonstration Environment Setup

This demonstration was performed with the following environment configuration:

The environment includes a local development machine with necessary tools, appropriate AWS account permissions, and terminal access. By starting Amazon Q Developer CLI in the project directory, it has immediate access to relevant code and configuration files.

Scenario: Troubleshooting NGINX 5XX Errors

The scenario demonstrates troubleshooting a multi-tier application architecture as shown in figure 2 deployed on Amazon ECS Fargate with:

  • Application Load Balancer (ALB) distributing traffic across availability zones
  • NGINX reverse proxy service handling incoming requests
  • Node.js backend service processing business logic
  • Service discovery enabling internal communication
  • CloudWatch Logs providing centralized logging

An AWS cloud architecture diagram showing the flow of traffic from an Internet user through multiple components. The diagram includes: At the top: An Internet user connecting to an Internet Gateway Within a VPC (Virtual Private Cloud): Two public subnets containing a NAT Gateway and Application Load Balancer Two private subnets within an ECS Cluster containing: An NGINX service (Fargate) A Backend service (Fargate) A 10-second timeout between them A Cloud Map Service Discovery component at the bottom CloudWatch Logs integration on the right side The diagram includes a note about gateway timeouts: "504 Gateway Timeout - Backend takes 15s to respond, NGINX timeout is 10s" All components are connected with arrows showing the flow of traffic and data through the system. The infrastructure follows AWS best practices with public and private subnet separation for security.

Figure 2: AWS Architecture diagram for the app used in this blog post

Traditional Troubleshooting Steps

For the architecture in figure 2, when 502 Gateway Timeout errors occur, traditional troubleshooting requires:

  1. Checking ALB target group health
  2. Examining ECS service status across multiple consoles
  3. Analyzing CloudWatch logs from different log groups
  4. Correlating error patterns between services
  5. Reviewing infrastructure code for configuration issues
  6. Implementing and deploying fixes

Amazon Q Developer CLI Approach

Instead, let’s see how Amazon Q Developer CLI handles this systematically, step by step:

Step1: Initial Problem Report

Amazon Q Developer CLI is provided with the initial prompt as a problem statement within the application project directory as shown in the following screenshot in figure 3. Amazon Q Developer responds back and says it is going investigate the 502 Gateway Timeout errors in the NGINX application.

Prompt:

Our production NGINX application is experiencing 502 Gateway Timeout errors. 
I have checked out the application and infrastructure code locally and the AWS CLI 
profile 'demo-profile' is configured with access to the AWS account where the 
infrastructure and application is deployed to. Can you help investigate and diagnose the issue?

A Visual Studio Code window showing a debugging session for an NGINX application. The interface has three main sections: a file explorer on the left showing project files including 'app.ts' and 'nginx-config-task.json', a terminal tab in the center displaying an "Amazon Q" ASCII art logo, and a conversation where a user is reporting 502 Gateway Timeout errors. The terminal shows AWS CLI command execution using a tool called "use_aws" with parameters including the service name "ecs" and region "us-west-2". The interface has red annotations highlighting key areas like "project files", "User provided initial prompt", and "Q CLI executing AWS CLI calls.

Figure 3: Amazon Q Developer CLI with initial prompt and problem statement

Step2: Systematic Infrastructure Discovery

Amazon Q Developer CLI start to systematically discovering the infrastructure as shown in the following screenshot in figure 4. If you see the initial prompt did not include that the app is hosted on ECS, but Amazon Q Developer CLI understood the context and executes the AWS CLI calls to describe the Cluster and the services within it. It made sure that the ECS tasks are running for both the services within the Cluster. It is a key discovery that both services show healthy status (1/1 desired count), indicating the issue isn’t service availability.

A terminal window showing three sequential AWS CLI commands being executed through a "use_aws" tool: First command: "list-clusters" operation for ECS service in us-west-2 region using demo-profile, completing in 1.244 seconds Second command: "list-services" operation targeting the NginxSimulationCluster, completing in 0.877 seconds with confirmation of finding both nginx-service and backend-service Third command: "describe-services" operation examining both services in detail, completing in 0.968 seconds with confirmation that both services are running as expected (1/1 desired count) Each command includes execution details, parameters, and completion status, with the system preparing to check CloudWatch logs next.

Figure 4: AWS Infrastructure discovery by Amazon Q Developer CLI

Step 3: Intelligent Log Analysis

Amazon Q Developer CLI retrieves and analyzes recent CloudWatch logs from the NGINX container, immediately identifying the critical error pattern as shown in the following screenshot in figure 5, where Amazon Q Developer responds: “Perfect! I found the issue. The NGINX logs show clear 504 gateway timeout with upstream timeout messages.”

A terminal window showing two AWS CloudWatch Logs commands being executed: First command: "describe-log-streams" operation for the "/ecs/nginx-service" log group, limiting to 5 most recent entries, ordered by LastEventTime in descending order Second command: "get-log-events" operation retrieving 50 log entries from a specific NGINX container log stream The output reveals a critical error message highlighted at the bottom showing an upstream timeout (error 110) occurring while reading response headers. The error details include client IP 10.0.0.247, upstream server at http://10.0.3.18:3000/, and host 52.35.62.210.

Figure 5: CloudWatch Log analysis by Amazon Q Developer CLI

Step 4: Amazon Q Developer CLI Analysis and Root Cause Identification

Amazon Q Developer examines backend service logs and discovers a mismatch between the backend service response time and NGINX timeout settings, as seen in the following screenshot in figure 6.

A terminal window showing AWS CloudWatch Logs commands and their output. The first command describes log streams for a backend container, and the second retrieves log events. The output reveals a debugging analysis showing that while health checks work fine, regular requests are being delayed by about 15 seconds, causing NGINX timeout issues. The log group is "/ecs/backend-service" in the us-west-2 region using a demo-profile.

Figure 6: Root cause identification by Amazon Q Developer CLI

Step 5: Amazon Q Developer CLI Root Cause Analysis

Amazon Q Developer CLI examines the ECS task definitions to identify the exact configuration mismatch, as shown in the following screenshot in figure 7. Amazon Q Developer finds that:

  • Backend service is configured with response_delay=15000 (15 secs)
  • NGINX proxy is configured with proxy_read_timeout 10s

This mismatch causes 504 gateway timeout errors when the backend response exceeds NGINX’s timeout threshold.

A terminal window showing two AWS CLI commands to describe ECS task definitions in the us-west-2 region. Below the commands is a highlighted "Root Cause Analysis" section that explains a timeout mismatch: the backend service is configured with a 15-second response delay while NGINX has a 10-second proxy timeout, resulting in 502 Gateway Timeout errors. Both commands use a demo-profile and are labeled as checking timeout and response delay configurations.

Figure 7: Root cause analysis and issue detection by Amazon Q Developer CLI

Step 6: Automated Code Fix

Here’s where Amazon Q Developer CLI truly excels—it doesn’t just diagnose; it implements the fix. Since Amazon Q Developer CLI is started within the project where the CDK code for ECS task definition is defined, it identified the code configuration and also modified it, as shown in the following screenshot in figure 8.

A terminal window showing file operations using fs_read and fs_write tools. The code changes show an NGINX configuration update in ecs-nginx-cdk.ts, where the proxy_read_timeout is being modified from '10s' to '20s'. The file also shows additional timeout configurations being added, including proxy_connect_timeout and proxy_send_timeout. The update is confirmed with a user prompt and completed in 0.2 seconds.

Figure 8: CDK code fix by Amazon Q Developer CLI

Step 7: Deployment

Amazon Q Developer CLI builds and deploys the fix by executing cdk synth and cdk deploy using the ‘demo-profile‘ AWS CLI profile that was initially provided in the prompt, as shown in the following screenshot in figure 9.

A terminal window showing two execute_bash commands running in sequence. The first command builds a CDK project using 'npm run build' in the nginx-app directory, completing in 4.102s. The second command deploys the updated CDK stack using 'cdk deploy' with the demo-profile, showing deployment progress including some warnings about minHealthyPercent configurations and CloudFormation stack updates in us-west-2 region.

Figure 9: CDK code build and deployment by Amazon Q Developer CLI

Step 8: Validation

Amazon Q Developer CLI validates the solution by sending a curl request to the ALB endpoint after the successful deployment, as shown in the following screenshot in figure 10.

A terminal window showing the execution of a curl command to test an NGINX application on AWS. The command targets an Elastic Load Balancer in the us-west-2 region. The response shows a successful HTTP 200 OK status after 14 seconds, with a JSON response containing the message "Hello from backend". The test completes in 15.100 seconds, indicating the fix for previous 502 errors was successful.

Figure 10: Fix validation by Amazon Q Developer CLI

In addition to that, Amazon Q Developer also sends a request to the health check endpoint and validates everything is working after the fix was deployed, as shown in the following screenshot in figure 11.

A terminal screenshot showing the results of a health check on an Nginx server using curl. The command executed shows a successful response with "healthy" status, completing in 0.65 seconds. The output displays various metrics including download speed (386 B/s), 100% completion rate, and timing statistics for real, user, and system processes.

Figure 11: Health endpoint validation by Amazon Q Developer CLI

What Amazon Q Developer CLI Accomplished

Using just conversational commands, Amazon Q Developer CLI performed a complete troubleshooting cycle:

  • Infrastructure Discovery: Automatically mapped ECS clusters, services, and dependencies
  • Log Correlation: Analyzed thousands of log entries across multiple services
  • Root Cause Analysis: Identified exact configuration mismatch between NGINX’s timeout (10s) and the backend’s response delay (15s)
  • Code-Level Diagnosis: Located problematic timeout setting in CDK infrastructure code
  • Automated Implementation: Modified infrastructure code to increase the NGINX timeout
  • End-to-End Deployment: Built, deployed, and validated the complete solution
  • Comprehensive Testing: Verified both fix effectiveness and overall system health

Amazon Q Developer CLI handles troubleshooting tasks through a single, conversational interface, eliminating the need for multiple tools or AWS CLI commands.

Conclusion

Amazon Q Developer CLI represents a significant evolution in how we troubleshoot cloud infrastructure issues. By combining natural language understanding with powerful command execution capabilities, it transforms complex troubleshooting workflows into efficient, action-oriented dialogues. Whether you’re dealing with NGINX 5XX errors or similar issues across other AWS services, Amazon Q Developer CLI can help you diagnose issues, implement fixes, and validate solutions—all through a conversational interface that feels natural and intuitive.

Give Amazon Q Developer CLI a try the next time you encounter a troubleshooting challenge, and experience the difference it can make in your operational workflow.

To learn more about Amazon Q Developer’s features and pricing details, visit the Amazon Q Developer product page.

About the Author

kirankumar.jpeg

Kirankumar Chandrashekar is a Generative AI Specialist Solutions Architect at AWS, focusing on Amazon Q Developer. Bringing deep expertise in AWS cloud services, DevOps, modernization, and infrastructure as code, he helps customers accelerate their development cycles and elevate developer productivity through innovative AI-powered solutions. By leveraging Amazon Q Developer, he enables teams to build applications faster, automate routine tasks, and streamline development workflows. Kirankumar is dedicated to enhancing developer efficiency while solving complex customer challenges, and enjoys music, cooking, and traveling.

Build a multi-Region AWS PrivateLink backed service with seamless failover

Post Syndicated from Madhav Vishnubhatta original https://aws.amazon.com/blogs/architecture/build-a-multi-region-aws-privatelink-backed-service-with-seamless-failover/

Global Payments Inc. is a leading worldwide provider of payment technology and software solutions, headquartered in Atlanta, Georgia. The company processes more than 75 billion transactions annually, serving more than 5 million merchant locations and nearly 2,000 financial institutions globally. Through its merger with TSYS in 2019, Global Payments expanded its capabilities beyond merchant acquiring services to include issuer processing solutions.

The company’s services now encompass ecommerce and omnichannel payments, business management software, customer engagement tools, and cloud-based solutions. Their commitment to technological innovation and customer service has positioned them as one of the largest financial technology companies globally, consistently ranking among the Fortune 500.

This post demonstrates how the Issuer Solutions business of Global Payments, as a service provider, implemented cross-Region failover for an AWS PrivateLink backed service exposed to their customers. Their solution enables failover to a secondary Region without customer coordination, reducing Recovery Time Objective (RTO).

AWS PrivateLink involves two key roles: service providers and service consumers. Service providers build, own, and manage endpoint services. Service consumers create and manage Amazon Virtual Private Cloud (Amazon VPC) endpoints that connect their VPC to an Amazon VPC endpoint service privately, without exposing the traffic to the public internet. Enterprises often build services in multiple AWS Regions for resilience. This approach requires endpoint services in two Regions, with service consumers creating VPC endpoints for each service.

The architecture uses Amazon Route 53 to resolve the service’s Fully Qualified Domain Name (FQDN) to the active Region’s service. Amazon Application Recovery Controller (ARC) is used to initiate the failover.

Customer requirements

Issuer Solutions had the following requirements for this implementation:

  • The ability for consumers to access the service privately, without traversing the public internet
  • Resilience to degradation in a single Region by allowing failover to a secondary Region
  • Independent failover without customer coordination
  • Reliable and simple failover process

Solution overview

The following simplified architecture diagram illustrates the connectivity and failover mechanisms. The exact service implementation of Issuer Solutions is beyond this post’s scope. For simplicity, we represent the service as a Network Load Balancer backed by Amazon Elastic Compute Cloud (Amazon EC2) instances.

AWS Architecture diagram showing primary and secondary regions with Route53 Private Hosted Zones, VPC endpoints, and PrivateLink integration, illustrating the connectivity and failover mechanisms.

The solution consists of the following key components:

  • The service provider deploys identical services in two Regions. The service is represented in this simplified version with a Network Load Balancer backed by EC2 instances. Each Region is independent and therefore resilient against failures in the other Region.
  • Services are exposed through PrivateLink as VPC endpoint services in each Region, allowing client connections without needing NAT gateways or internet gateways and keeping the traffic within the customers’ own private IP space.
  • The service provider authorizes the consumer AWS account to find the services using the VPC endpoint service names.
  • The service consumer uses the VPC PrivateLink endpoint service names to create VPC endpoints with Elastic Network Interfaces (ENIs) in two Availability Zones in each Region. The consumer does this in both consumer Regions, and each consumer Region has two sets of VPC endpoints: one for the primary service of the provider and one for the secondary service.
  • The service consumer creates a Route 53 private hosted zone in each of the two Regions they use, each with two alias records, with a simple routing policy, pointing to the VPC endpoints’ FQDNs in their own Regions. These two alias records are primary.example.com and secondary.example.com.
  • The service provider creates a Route 53 ARC cluster with routing controls for the primary and secondary Regions.
  • The service provider creates a private hosted zone with a failover record set for a consumer specific CNAME like custC.service.p.com that resolves to primary.example.com and secondary.example.com. These records are associated with health checks that are associated with Route 53 ARC routing controls.

As shown in the architecture diagram, it is not necessary for the provider’s and consumer’s Regions to be the same because AWS supports creating VPC endpoints in a Region different to that of the VPC endpoint service itself. Refer to AWS PrivateLink now supports cross-region connectivity for more details.

How the DNS resolution works

Each consumer Region has two Route 53 private hosted zones involved in DNS resolution in this approach: the service provider’s hosted zone and the service consumer’s hosted zone. Both hosted zones are associated with the VPC used by the service consumer. Here is how the DNS resolution works:

  1. When a client in the consumer VPC wants to reach the service, it uses the FQDN custC.service.p.com.
  2. The hosted zone in the service provider’s account resolves custC.service.p.com to either primary.example.com or secondary.example.com depending on the status of the health checks controlled by ARC. For now, let’s assume this resolves to primary.example.com.
  3. Next, primary.example.com resolves to the VPC endpoint FQDN com.amazonaws.vpce.<primary-region>.vpce-svcabc123 due to the hosted zone in the service consumer.

At the time of failover, the service provider will update the ARC health checks to turn off the primary control and turn on the secondary routing control. This causes the service provider’s hosted zone to resolve custC.service.p.com to secondary.example.com, which in turn resolves to the VPC endpoint FQDN in the secondary Region due to the service consumer’s hosted zone.

Considerations

With this setup, the service provider can fail over when they need to without the service consumer having to manually make any changes. This is especially useful for services that have multiple service consumers. Additionally, service consumers can make changes to the VPC endpoint as they see fit. They only need to update the hosted zone they manage to make sure that primary.example.com and secondary.example.com point to the correct VPC endpoints.

We used ARC in this post because it offers a robust solution for cross-Region failover with built-in static stability. ARC also avoids single points of failure in the failover logic by distributing it across multiple Regions.

This setup demonstrates an active-passive configuration where traffic is routed to a single Region at a time using the Route 53 failover routing policy. For an active-active approach, you can adapt this setup by employing alternative Route 53 policies such as weighted or latency-based routing, as detailed in Active-active and active-passive failover.

Code sample

We have created a GitHub repository with Terraform code to demonstrate this solution. The repository has the steps to set it up and test it.

Conclusion

This implementation of cross-Region failover by Global Payments Issuer Solutions for their PrivateLink backed service demonstrates a robust and flexible approach to providing high availability and resilience. By using AWS services such as PrivateLink, Route 53, and Route 53 ARC, they have created a solution that meets their key requirements. This architecture not only benefits Global Payments by allowing them to manage failovers efficiently, but also provides advantages to their service consumers. Customers maintain control over their own infrastructure while benefiting from seamless service continuity. As cloud architectures continue to evolve, solutions like this showcase the power of combining various AWS services to create highly available and fault-tolerant systems that meet complex business needs.

Clone our GitHub repository now and deploy this solution in your own AWS environment to try out this approach to cross-Region failover. Contact your AWS representative today to begin your journey toward enhanced business continuity.


About the Authors

How Stellantis streamlines floating license management with serverless orchestration on AWS

Post Syndicated from Göksel SARIKAYA original https://aws.amazon.com/blogs/architecture/how-stellantis-streamlines-floating-license-management-with-serverless-orchestration-on-aws/

This post is written by Goeksel Sarikaya, Senior Delivery Consultant at AWS, and Milosz Stawarski, Senior Software Architect at Stellantis.

Software licensing is a critical aspect of many organizations’ operations, with various models available to suit different needs. Two common types are named user licenses, which are assigned to specific individuals, and floating licenses, which can be shared among a pool of users. Some independent software vendors (ISVs) offer both options, whereas others might have limitations, particularly in cloud environments.

In this post, we explore a unique scenario where an ISV, unable to provide a floating license option for cloud usage, worked with Stellantis to develop an alternative solution. This approach, implemented with the ISV’s permission, treats named user licenses as if they were floating, automatically assigning and removing them based on the state of user workbench instances.

This solution is not intended to circumvent licensing terms or reduce costs at the expense of ISVs. Rather, it’s a collaborative approach to address specific customer needs when traditional floating licenses aren’t available. We will demonstrate how the solution uses serverless AWS services like Amazon EventBridge, AWS Lambda, Amazon DynamoDB, and AWS Systems Manager, keeping in mind that any similar implementation should only be pursued with explicit permission from the software vendor.

Overview of Stellantis

Stellantis N.V., born from the merger of FCA and PSA Group, leads the change towards software defined vehicles (SDV). As part of this transformation, AWS and Stellantis created the Virtual Engineering Workbench (VEW), a modular framework to develop, integrate, and test vehicle software in the cloud, ultimately connecting their vehicles to the cloud.

The VEW provides predefined environments tailored to specific use cases. These environments come fully equipped with the tools, integrated development environments (IDEs), and licensing necessary for developers to jumpstart their projects.

For more details on VEW, refer to Stellantis’ SDV transformation with the Virtual Engineering Workbench on AWS.

Overview of solution

As the number of developers and projects grew, Stellantis faced a challenge in managing the limited number of named user licenses for their software tools. The manual process of assigning and revoking licenses became increasingly time-consuming and inefficient, potentially hindering the agility and productivity of their development teams.

Stellantis and AWS tackled this challenge head-on by collaborating on an innovative, dynamic license management solution using AWS serverless services. This solution transforms the traditional named user license model into a more flexible floating license system, automatically assigning and revoking licenses based on the state of user workbench instances. The licenses and solution discussed in this post pertain solely to the use of standalone software tools such as those used in automotive domains. These do not involve sharing of user data or content when licenses are reused.

Before we dive into the detailed workflow of the solution, let’s examine the high-level architecture. The following diagram illustrates how various AWS services work together to create this efficient license management system.

Multi-region AWS license management architecture showing event-driven workflows between toolchain and user accounts with VEW workbench integration

Architecture

This architecture uses key AWS services such as EventBridge, Lambda, DynamoDB, and Systems Manager to create a scalable, serverless solution that significantly reduces administrative overhead and optimizes license utilization.

In the following sections, we explore each component of this architecture in detail, explaining how they interact to provide a seamless license management experience for Stellantis’ VEW.

In workbench accounts (user accounts)

The design is serverless and based on an event-driven approach. The workflow in the user accounts is as follows:

  1. Workbench instances are Amazon Elastic Compute Cloud (Amazon EC2). Their start and stop automatically sends AWS events.
  2. An EventBridge rule invokes a Lambda function when such an event occurs. This function checks the tags on the EC2 instance to distinguish workbenches from other EC2 instances. Two tags are important for identifying workbench instances: vew:workbench:ownerId and vew:workbench:type.
  3. The Lambda function creates a custom event with the following data: user-id, workbench-type, workbench-state, and instance-id, and sends this event to the default event bus.
  4. An EventBridge rule forwards the custom event to a custom event bus in the license server account.

In license server account

The following steps take place in the license server account:

  1. An EventBridge rule invokes a Lambda
  2. This function interacts with a DynamoDB table that stores a mapping of licensed products to users. The function does the following:
    1. Deduces the licensed products present in the workbench from the workbench type.
    2. For each licensed product, it verifies if the combination of product and user is already present in the DynamoDB
    3. If the workbench is starting:
      1. If the combination is already present, it increases the count of workbenches in the table for this item by 1.
      2. If the combination is not present, it creates a new item in the table (product, user-id, workbench-count, timestamp).
    4. If the workbench is stopping, it decreases the count of workbenches in the table for this item by 1. If the count becomes 0, the item is deleted.
  3. Any update to the DynamoDB table triggers another Lambda
  4. If the change in the table is a creation of a new entry or deletion of an entry, this function writes the current timestamp to a Systems Manager parameter in both cases. This is so that if no changes are detected in the database, we don’t unnecessarily run the xLC (License Client for related product) caller function.
  5. Another Lambda function is invoked every minute. It compares the timestamp written in the Systems Manager parameter indicating a DynamoDB item creation or deletion with the last time the function called the xLC CLI to assign users to a license.
  6. If the DynamoDB timestamp is earlier, the function stops. If the DynamoDB timestamp is later, the function queries the table for obtaining the user-id for each product.
  7. To maintain a comprehensive record of license assignment operations, you can enable data plane events for DynamoDB in AWS CloudTrail.
  8. For each licensed product, the function uses Run Command, a capability of Systems Manager, to invoke the xLC CLI API on the license server to assign named users to a license for a product. The function provides the list of users assigned to the product to the API. This updates the named user list on the license server—the list is completely overwritten, which includes adding new user IDs and removing ones that are no longer needed.

Benefits and key features

The solution offers the following benefits:

  • Automated license assignment and removal – Users are automatically assigned licenses when their workbench instances start, and licenses are returned to the pool when instances stop, providing efficient license utilization.
  • Scalable and serverless architecture – The solution is built on serverless AWS services, allowing it to scale seamlessly as the number of users and workbench instances grows, without the need for provisioning or managing servers.
  • Centralized license management – The license server account acts as a central hub for managing licenses across multiple workbench accounts, simplifying administration and providing a unified view of license usage.
  • Reduced administrative overhead – By automating the license assignment and removal process, the solution can significantly reduce the administrative burden associated with manual license management.
  • Optimized license utilization – Licenses are assigned only when needed and returned to the pool when no longer required, maximizing license availability and minimizing idle licenses.
  • Monitoring and metrics – The solution provides monitoring capabilities and license usage metrics, enabling better visibility and informed decision-making regarding license procurement and allocation.

Conclusion

By implementing this serverless solution, it is possible to transform a manual named user license management systems to an automated floating license system for software tools. The event-driven architecture and serverless components provide efficient and scalable license assignment and removal based on the workbench instance state.

This solution has streamlined the license management process, reducing administrative overhead and optimizing license utilization. It is now possible to provision software tools more efficiently, improving productivity and resource allocation across the organization. Additionally, the centralized license management and monitoring capabilities provide better visibility and control over license usage, enabling informed decision-making and cost optimization.

Overall, this AWS based floating license solution has empowered organizations to use software tools more effectively, while minimizing the operational burden associated with license management. For more serverless learning resources, visit Serverless Land.


About the authors

How Nexthink built real-time alerts with Amazon Managed Service for Apache Flink

Post Syndicated from Nikos Tragaras, Raphaël Afanyan original https://aws.amazon.com/blogs/big-data/how-nexthink-built-real-time-alerts-with-amazon-managed-service-for-apache-flink/

This post is cowritten with Nikos Tragaras and Raphaël Afanyan from Nexthink.

In this post, we describe Nexthink’s journey as they implemented a new real-time alerting system using Amazon Managed Service for Apache Flink. We explore the architecture, the rationale behind key technology choices, and the Amazon Web Services (AWS) services that enabled a scalable and efficient solution.

Nexthink is a pioneering leader in digital employee experience (DEX). With a mission to empower IT teams and elevate workplace productivity, Nexthink’s Infinity platform offers real-time visibility into end user environments, actionable insights, and robust automation capabilities. By combining real-time analytics, proactive monitoring, and intelligent automation, Infinity enables organizations to deliver an optimal digital workspace.

In the past 5 years, Nexthink completed its transformation into a fully-fledged cloud platform that processes trillions of events per day, reaching over 5 GB per second of aggregated throughput. Internally, Infinity comprises more than 300 microservices that use the power of Apache Kafka through Amazon Managed Service for Apache Kafka (Amazon MSK) for data ingestion and intra-service communication. The Nexthink ecosystem includes several hundreds of Micronaut-based Java microservices deployed in Amazon Elastic Kubernetes Service (Amazon EKS). The vast majority of microservices interact with Kafka through the Kafka Streams framework.

Nexthink alerting system

To help you understand Nexthink’s journey toward a new real-time alerting solution, we begin by examining the existing system and the evolving requirements that led them to seek a new solution.

Nexthink’s existing alerting system provides near real-time notifications, helping users detect and respond to critical events quickly. While effective, this system has limitations in scalability, flexibility, and real-time processing capabilities.

Nexthink gathers telemetry data from thousands of customers’ laptops covering CPU usage, memory, software versions, network performance, and more. Amazon MSK and ClickHouse serve as the backbone for this data pipeline. All endpoint data is ingested in Kafka multi-tenant topics, which are processed and finally stored in a ClickHouse database.

Using the current alerting system, clients can define monitoring rules in Nexthink Query Language (NQL), which are evaluated in near real time by polling the database every 15 minutes. Alerts are triggered when anomalies are detected against client-defined thresholds or long-term baselines. This process is illustrated in the following architecture diagram.

Originally, database-polling allowed great flexibility in the evaluation of complex alerts. However, this approach placed heavy stress on the database. As the company grew and supported larger customers with more endpoints and monitors, the database experienced increasingly heavy loads.

Evolution to a new use-case: Real-time alerts

As Nexthink expanded its data collection to include virtual desktop infrastructure (VDI), the need for real-time alerting became even more critical. Unlike traditional endpoints, such as laptops, where events are gathered every 5 minutes, VDI data is ingested every 30 seconds—significantly increasing the volume and frequency of data. The existing architecture relied on database polling to evaluate alerts, running at a 15-minute interval. This approach was inadequate for the new VDI use case, where alerts needed to be evaluated in near real time on messages arriving every 30 seconds. Merely increasing the polling frequency wasn’t a viable option because it would place excessive load on the database, leading to performance bottlenecks and scalability challenges. To meet these new demands efficiently, we shifted to real-time alert evaluation directly on Kafka topics.

Technology options

As we evaluated solutions for our real-time alerting system, we analyzed two main technology options: Apache Kafka Streams and Apache Flink. Each option had benefits and limitations that needed to be considered.

All Nexthink microservices up to that point integrated with Kafka using Apache Kafka Streams. We’ve observed in practice multiple benefits:

  • Lightweight and seamless integration. No need for additional infrastructure.
  • Low latency using RocksDB as a local key-value store.
  • Team expertise. Nexthink teams have been writing microservices with Kafka-streams for a long time and feel very comfortable using it.

In some use cases however, we found that there were important limitations:

  • Scalability – Scalability was constrained by the tight coupling between parallelism of microservices and the number of partitions in Kafka topics. Many microservices had already scaled out to match the partition count of the topics they consumed, limiting their ability to scale further. One potential solution was increasing the partition count. However, this approach introduced significant operational overhead, especially with microservices consuming topics owned by other domains. It required rebalancing the entire Kafka cluster and needed coordination across multiple teams. Additionally, such modifications impacted downstream services, requiring careful reconfiguration of stateful processing. The alternative approach would be to introduce intermediate topics to redistribute workload, but this would add complexity to the data pipeline and increase resource consumption on Kafka. These challenges made it clear that a more flexible and scalable approach was needed.
  • State management – Services that needed to create large K-tables in memory had an increased startup time. Also, in cases where the internal state was large in volume, we found that it applied significant load to the Kafka cluster during the creation of the internal state.
  • Late event processing – In windowing operations, late events had to be managed manually with techniques that complexified the codebase.

Seeking an alternative that could help us overcome the challenges posed by our current system, we decided to evaluate Flink. Its robust streaming capabilities, scalability, and flexibility made it an excellent choice for building real-time alerting systems based on Kafka topics. Several advantages made Flink particularly appealing:

  • Native integration with Kafka – Flink offers native connectors for Kafka, which is a central component in the Nexthink ecosystem.
  • Event-time processing and support for late events – Flink allows messages to be processed based on the event time (that is, when the event actually occurred) even if they arrive out of order. This feature is crucial for real-time alerts because it guarantees their accuracy.
  • Scalability – Flink’s distributed architecture allows it to scale horizontally independently from the number of partitions in the Kafka topics. This feature weighed a lot in our decision-making because the dependence on the number of partitions was a strong limitation in our platform up to this point.
  • Fault tolerance – Flink supports checkpoints, allowing managed state to be persisted and ensuring consistent recovery in case of failures. Unlike Kafka Streams, which relies on Kafka itself for long-term state persistence (adding extra load to the cluster), Flink’s checkpointing mechanism operates independently and runs out-of-band, minimizing the impact on Kafka while providing efficient state management.
  • Amazon Managed Service for Apache Flink – Amazon Managed Service for Apache Flink is a fully managed service that simplifies the deployment, scaling, and management of Flink applications for real-time data processing. By eliminating the operational complexities of managing Flink clusters, AWS enables organizations to focus on building and running real-time analytics and event-driven applications efficiently. Amazon Managed Service for Apache Flink provided us with significant flexibility. It streamlined our evaluation process, which meant we could quickly set up a proof-of-concept environment without getting into the complexities of managing an internal Flink cluster. Moreover, by reducing the overhead of cluster management, it made Flink a viable technology choice and accelerated our delivery timeline.

Solution

After careful evaluation of both options, we chose Apache Flink as our solution due to its superior scalability, robust event-time processing, and efficient state management capabilities. Here’s how we implemented our new real-time alerting system.

The following diagram is the solution architecture.

The first use case was to detect issues with VDI. However, our intention was to build a generic solution that would give us the option to onboard in the future existing use cases currently implemented through polling. We wanted to maintain a common way of configuring monitoring conditions and allow alert evaluation both with polling as well as in real time, depending on the type of device being monitored.

This solution comprises multiple parts:

  • Monitor configuration – Using Nexthink Query Language (NQL), the alerts administrator defines a monitor that specifies, for example:
    • Data source – VDI events
    • Time window – Every 30 seconds
    • Metric – Average network latency, grouped by desktop pool
    • Trigger condition(s) – Latency exceeding 300 ms for a continual period of 5 minutes

This monitor configuration is then stored in an internally developed document store and propagated downstream in a Kafka topic.

  • Data processing using Generic Stream Services– The Nexthink Collector, an agent installed on endpoints, captures and reports various kinds of activities from the VDI endpoints where it’s installed. These events are forwarded to Amazon MSK in one of Nexthink’s production virtual private clouds (VPCs) and are consumed by Java microservices running on Amazon EKS belonging to several domains within Nexthink

One of them is Generic Stream Services, a system that processes the collected events and aggregates them in buckets of 30 seconds. This component works as self-service for all the feature teams in Nexthink and can query and aggregate data from an NQL query. This way, we were able to keep a unified user experience on monitor configuration using NQL, regardless of how alerts were evaluated. This component is broken down into two services:

    • GS processor – Consumes raw VDI session events and applies initial processing
    • GS aggregator – Groups and aggregates the data according to the monitor configuration
  • Real-time monitoring using Flink – Static threshold alerting and seasonal change detection, which identifies variations in data that follow a recurring pattern over time, are the two types of detection that we offer for VDI issues. The system splits the processing between two applications:
    • Baseline application – Calculates statistical baselines with seasonality using time-of-day anomaly algorithm. For example, the latency by VDI client location or the CPU queue length of a desktop pool.
    • Alert application – Generates alerts based on user-defined thresholds when the unexpected values don’t change over time or dynamic thresholds based on baselines, which trigger when a metric deviates from an expected pattern.

The following diagram illustrates how we join VDI metrics with monitor configurations, aggregate data using sliding time windows, and evaluate threshold rules, all within Apache Flink. From this process, alerts are generated and are then grouped and filtered before being processed further by the consumers of alerts.

  • Alert processing and notifications – After an alert is triggered (when a threshold is exceeded) or recovered (when a metric returns to normal levels), the system will assess their impact to prioritize response through the impact processing module. Alerts are then consumed by notification services that deliver messages through emails or webhooks. The alert and impact data are then ingested into a time series database.

Benefits of the new architecture

One of the key advantages of adopting a streaming-based approach over polling was its ease of configuration and management, especially for a small team of three engineers. There was no need for cluster management, so all we needed to do was to provision the service and start coding.

Given our prior experience with Kafka and Kafka Streams and combined with the simplicity of a managed service, we were able to quickly develop and deploy a new alerting system without the overhead of complex infrastructure setup. We used Amazon Managed Service for Apache Flink to spin up a proof of concept within a few hours, which meant the team could focus on defining the business logic without having concerns related to cluster management.

Initially, we were concerned about the challenges of joining multiple Kafka topics. With our previous Kafka Streams implementation, joined topics required identical partition keys, a constraint known as co-partitioning. This created an inflexible architecture, particularly when integrating topics across different business domains. Each domain naturally had its own optimal partitioning strategy, forcing difficult compromises.

Amazon Managed Service for Apache Flink solved this problem through its internal data partitioning capabilities. Although Flink still incurs some network traffic when redistributing data across the cluster during joins, the overhead is practically negligible. The resulting architecture is both more scalable (because topics can be scaled independently based on their specific throughput requirements) and easier to maintain without complex partition alignment concerns.

This significantly improved our ability to detect and respond to VDI performance degradations in real time while keeping our architecture clean and efficient.

Lessons learnt

As with any new technology, adopting Flink for real-time processing came with its own set of challenges and insights.

One of the primary difficulties we encountered was observing Flink’s internal state. Unlike Kafka Streams, where the internal state is by default backed by a Kafka topic from which its content can be visualized, Flink’s architecture makes it inherently difficult to inspect what is happening inside a running job. This required us to invest in robust logging and monitoring strategies to better understand what is happening during the execution and debug issues effectively.

Another critical insight emerged around late event handling—specifically, managing events with timestamps that fall within a time-window’s boundaries but arrive after that window has closed. Amazon Managed Service for Apache Flink addresses this challenge through its built-in watermarking mechanism. A watermark is a timestamp-based threshold that indicates when Flink should consider all events before a specific time to have arrived. This allows the system to make informed decisions about when to process time-based operations like window aggregations. Watermarks flow through the streaming pipeline, enabling Flink to track the progress of event time processing even with out-of-order events.

Although watermarks provide a mechanism to manage late data, they introduce challenges when dealing with multiple input streams operating at different speeds. Watermarks work well when processing events from a single source but can become problematic when joining streams with varying velocities. This is because they can lead to unintended delays or premature data discards. For example, a slow stream can hold back processing across the entire pipeline, and an idle stream might cause premature window closing. Our implementation required careful tuning of watermark strategies and allowable lateness parameters to balance processing timeliness with data completeness.

Our transition from Kafka Streams to Apache Flink proved smoother than initially anticipated. Teams with Java backgrounds and prior experience with Kafka Streams found Flink’s programming model intuitive and easy to use. The DataStream API offers familiar concepts and patterns, and Flink’s more advanced features could be adopted incrementally as needed. This gradual learning curve gave our developers the flexibility to become productive quickly, focusing first on core stream processing tasks before moving on to more advanced concepts like state management and late event processing.

The future of Flink in Nexthink

Real-time alerting is now deployed to production and available to our clients. A major success of this project was the fact that we successfully introduced a technology as an alternative to Kafka streams, with very little management requirements, guaranteed scalability, data-management flexibility, and comparable cost.

The impact on the Nexthink alerting system was significant because we no longer have a single evaluating alert through database polling. Therefore, we’re already assessing the timeframe for onboarding other alerting use cases to real-time evaluation with Flink. This will alleviate database load and will also provide more accuracy on the alert triggering.

Yet the impact of Flink isn’t limited to the Nexthink alerting system. We now have a proven production-ready alternative for services that are limited in terms of scalability due to the number of partitions of the topics they are consuming. Thus, we’re actively evaluating the option to convert more services to Flink to allow them to scale out more flexibly.

Conclusion

Amazon Managed Service for Apache Flink has been transformative for our real-time alerting system at Nexthink. By handling the complex infrastructure management, AWS enabled our team to deploy a sophisticated streaming solution in less than a month, keeping our focus on delivering business value rather than managing Flink clusters.

The capabilities of Flink have proven it to be more than an alternative to Kafka Streams. It’s become a compelling first choice for both new projects and existing feature refactoring. Windowed processing, late event management, and stateful streaming operations have made complex use cases remarkably straightforward to implement. As our development teams continue to explore Flink’s potential, we’re increasingly confident that it will play a central role in Nexthink’s real-time data processing architecture moving forward.

To get started with Amazon Managed Service for Apache Flink, explore the getting started resources and the hands-on workshop. To learn more about Nexthink’s broader journey with AWS, visit the blog post on Nexthink’s MSK-based architecture.


About the authors

Nikos Tragaras is a Principal Software Architect at Nexthink with around two decades of experience in building distributed systems, from traditional architectures to modern cloud-native platforms. He has worked extensively with streaming technologies, focusing on reliability and performance at scale. Passionate about programming, he enjoys building clean solutions to complex engineering problems

Raphaël Afanyan is a Software Engineer and Tech Lead of the Alerts team at Nexthink. Over the years, he has worked on designing and scaling data processing systems and played a key role in building Nexthink’s alerting platform. He now collaborates across teams to bring innovative product ideas to life, from backend architecture to polished user interfaces.

Simone Pomata is a Senior Solutions Architect at AWS. He has worked enthusiastically in the tech industry for more than 10 years. At AWS, he helps customers succeed in building new technologies every day.

Subham Rakshit is a Senior Streaming Solutions Architect for Analytics at AWS based in the UK. He works with customers to design and build streaming architectures so they can get value from analyzing their streaming data. His two little daughters keep him occupied most of the time outside work, and he loves solving jigsaw puzzles with them. Connect with him on LinkedIn.

Lorenzo Nicora works as a Senior Streaming Solutions Architect at AWS, helping customers across EMEA. He has been building cloud-centered, data-intensive systems for over 25 years, working across industries both through consultancies and product companies. He has used open source technologies extensively and contributed to several projects, including Apache Flink.

Powering global payout intelligence: How MassPay uses Amazon Redshift Serverless and zero-ETL to drive deeper analytics.

Post Syndicated from Yossi Shlomo original https://aws.amazon.com/blogs/big-data/powering-global-payout-intelligence-how-masspay-uses-amazon-redshift-serverless-and-zero-etl-to-drive-deeper-analytics/

Since the company was founded in 2019, MassPay’s singular objective has been to deliver frictionless global payments that power innovation and lift people, businesses, and quality of life worldwide. Today, the MassPay payment orchestration offering empowers companies to move money across borders effortlessly; enabling local payment experiences in over 175 countries and 70 currencies—including digital wallets, locally preferred alternative payment methods, and cryptocurrencies. From hyper-localized checkout experiences to instant global payouts, we orchestrate seamless financial experiences that reflect how people and businesses transact around the world.

As we have expanded globally, so has the complexity of our data. In this blog post we shall cover how understanding real-time payout performance, identifying customer behavior patterns across regions, and optimizing internal operations required more than traditional business intelligence and analytics tools. And how since implementing Amazon Redshift and Zero-ETL, we’ve seen 90% reduction in data availability latency, payments data available for analytics 1.5x faster, leading to 45% reduction in time-to-insight and 37% fewer support tickets related to transaction visibility and payment inquiries.

Unlocking deeper payout intelligence and global insights

To continue our innovation—and to continue to exceed our partners’ and customers’ expectations—we knew we needed to go beyond basic reporting. We know success is dependent upon developing a truly data-driven organization. This means tracking granular KPIs across payout success rates, payment method adoption, transaction velocity, customer onboarding funnel drop-off, and support ticket correlation. We also wanted to better forecast customer payment expectations, monitor foreign exchange cost trends, and understand market-specific nuances such as how payout timing impacts seller satisfaction in social commerce ecosystems.

“We didn’t just want more data. We wanted faster, smarter insights that would shape decisions in real time. Being a data-driven organization means our teams don’t guess. They know. And that gives us, our partners, and our customers real operational and competitive advantages.”

– Yossi Schlomo, Director of Payment Systems Architecture

MySQL databases, CSV exports, and third-party reporting tools wouldn’t support the scale or speed we needed to deliver.

Choosing AWS: A scalable and integrated analytics foundation

We chose Amazon Web Services (AWS) for our data infrastructure and to accelerate our analytics capabilities.

At the core of our stack is Amazon Redshift Serverless with AI-driven scaling and optimizations enabled, which gives us scalable, fast, and cost-efficient analytics without the burden of managing infrastructure. Coupled with Amazon Aurora MySQL-Compatible Edition as our transactional data store and Amazon Redshift zero-ETL integration, we eliminated manual data pipelines altogether. Transactional data flows into Amazon Redshift in near real-time, instantly powering dashboards, alerts, and machine learning (ML) models.

This data feeds interactive dashboards—both internally and embedded within our platform for customers. Now, executives, operations leads, and customer success teams can drill into payout performance by region, merchant, or payment method, while customers get real-time visibility into their own payout analytics as part of our platform experience. The architecture is shown in the following figure.

MassPay Zero-ETL architecture with Amazon Redshift Serverless

MassPay Zero-ETL architecture with Amazon Redshift Serverless

Why it’s different and what it unlocked

Without Amazon Redshift Serverless and zero-ETL, we would have had to invest in costly custom data pipelines, maintain separate exchange, transform, and load (ETL) infrastructure, and manually manage data freshness. The integration with Aurora MySQL-Compatible is seamless and reduces our analytics latency from minutes to seconds.

“Our differentiator is simple: We operationalize not just transactions but analytics for global payments. Most platforms can tell you if a transaction went through. For payments and payouts, MassPay can tell you how fast it went, what it cost, what method was most effective, and what that means for your business in real time.”

– Yossi Schlomo, Director of Payment Systems Architecture

Embedded intelligence, built for scale

Every MassPay customer gets access to comprehensive payment analytics. These are accessed using our API or through a white-label dashboard (shown in the following figure). This detail is core to our product and central to our value proposition. As part of our go-to-market strategy, we showcase these capabilities in every demo, and they’ve proven to be key drivers in conversion and upsell conversations, especially with platforms targeting high-growth ecosystems.We use tiered pricing models based on transaction volume, and our embedded intelligence helps our partners and customers optimize usage and scale efficiently.

MassPay Dashboard

MassPay Dashboard

What we’ve gained

Since implementing Amazon Redshift and Zero-ETL, we’ve seen measurable results including:

  • 90% reduction in data availability latency and data available for analytics 1.5x faster
  • 45% reduction in time-to-insight across payment and payout intelligence reports
  • 37% fewer support tickets related to transaction visibility and payment inquiries
  • Real-time Net Promoter Score (NPS) tracking correlates with payout success metrics, driving faster resolution paths

What’s next

We’re now extending our analytics model to include more advanced ML-based payout failure prediction and ML-based payment authorization prediction, FX optimization alerts, partner-level and network-level benchmarking, and much more.

Conclusion

MassPay isn’t just payments. We aren’t just payouts. We are the engine powering modern commerce. With AWS, we’re turning complex global payments infrastructure into a smart, transparent, and scalable platform for insights. For our partners, and for our customers, this means better decisions, faster payment processing, faster payouts, and truly global reach without guesswork.

We encourage you to leverage below resources to explore these features further


About the authors

Yossi Shlomo serves as the Director of Payment Systems Architecture at MassPay. Yossi is an expert in credit card payment systems, PCI compliance, and secure transaction architecture, helping global platforms process payments at scale with confidence. He specializes in building scalable, cloud-based transaction systems and optimizing global payment gateways for performance and reliability.

Milind Oke is a Amazon Redshift and SageMaker Lakehouse specialist Solutions Architect as AWS. He is based out of New York and has been building enterprise data platforms, data warehousing, and analytics solutions for customers across various domains over two decades. In the 5 years with AWS, Milind has been a speaker at worldwide technical conferences and is co-author of Amazon Redshift: The Definitive Guide: Jump-Start Analytics Using Cloud Data Warehousing 1st Edition.

How Launchpad from Pega enables secure SaaS extensibility with AWS Lambda

Post Syndicated from Anton Aleksandrov original https://aws.amazon.com/blogs/architecture/how-launchpad-from-pega-enables-secure-saas-extensibility-with-aws-lambda/

Large organizations increasingly adopt software as a service (SaaS) solutions to focus on business priorities, reduce infrastructure management overhead, and optimize costs. These organizations expect SaaS vendors to provide customizability facilities for tailoring the solution behavior according to their needs. Although traditional approaches like feature flags and webhooks offer some flexibility, they often fall short of providing a high degree of customizability. A new emerging pattern in this space is tenant-supplied custom code execution, which allows tenants to inject their own code into specific workflow points, enabling deep customization while preserving the core SaaS solutions’ integrity and security.

In this post, we share how Pegasystems (Pega) built Launchpad, its new SaaS development platform, to solve a core challenge in multi-tenant environments: enabling secure customer customization. By running tenant code in isolated environments with AWS Lambda, Launchpad offers its customers a secure, scalable foundation, eliminating the need for bespoke code customizations.

Solution overview

Launchpad, which is built on AWS, is an end-to-end platform on which software providers can build, launch, and operate workflow-centric B2B SaaS applications and AI solutions. It provides a managed, secure, scalable cloud environment for hosting multi-tenant applications and data. It accelerates the build experience with generative AI-powered low code tools, prebuilt capabilities, and subscriber-level configuration. Being a multi-tenant platform at its core, Launchpad had to maintain stringent isolation across tenants in its architecture.

One of the requirements Launchpad had was to allow their tenants to augment the workflows natively by providing custom code. Some common scenarios included communicating with external systems with proprietary non-industry-standard protocols, reuse of existing business logic, and SDK-based custom code development.

The solution necessitated the ability for tenants to provide custom code that would implement the required business logic, which Launchpad would be executing. This required architecting a secure runtime environment for custom code execution that maintains the highest degree of cross-tenant isolation within the multi-tenant architecture, at the same time allowing sufficient access to platform APIs and services. It was essential to build an architecture that would decouple the environment running tenant code from the core SaaS platform, as illustrated in the following diagram.

Architecting the solution topology

To achieve the required high level of compute isolation for running code provided by different tenants, Launchpad has adopted Lambda functions in its architecture as the secure ephemeral compute environment. Each untrusted code snippet provided by tenants is bootstrapped as a stand-alone Lambda function, with strong Firecracker-based isolation across different functions and execution environments addressing Launchpad’s requirements. This isolation provides dedicated resources, customizable access permissions, independent monitoring and operations, and automatic scaling for each function, while maintaining complete separation from other functions and their execution environments, as illustrated in the following diagram.

With Lambda being a serverless compute service, adopting it for the Launchpad architecture yielded several significant benefits. The major business benefit was that tenants could implement thousands of custom workflow augmentations on their own simply by providing code snippets, instead of the Launchpad engineering team being responsible for implementing them in the core platform code. Other benefits included:

  • Managed runtimes – AWS handles patching and updating the underlying infrastructure, operating system, and runtimes for customers, reducing the potential attack surface.
  • Fine-grained permissions – Each function can have its own set of access policies to tightly control what resources and actions it can access.
  • No need to pre-provision and pay for overprovisioned capacity – Lambda functions scale up and down automatically based on traffic patterns.
  • Built-in monitoring – Lambda functions emit detailed metrics, logs, and traces through Amazon CloudWatch and AWS X-Ray out of the box, making it straightforward to monitor tenant code execution.

To further reduce risks, Launchpad runs these Lambda functions with untrusted code in a dedicated AWS account. This account is separated from the core SaaS platform account. When end-users create a new function in the Launchpad authoring portal, they upload their code and specify the code handler to be executed during the invocation. Users can also map function input and output to Launchpad fields for further processing to enable an even higher degree of customizability and integration. The multi-tenant authoring service is a Control Plane component that runs as a microservice on the Amazon Elastic Kubernetes Service (Amazon EKS) cluster and uses the Lambda API for function lifecycle management, as illustrated in the following diagram. After a function resource is created, it can be used for further invocations.

Runtime architecture

At runtime, when Launchpad needs to invoke a function, it calls the Lambda Invoke API. Before the function is invoked, the multi-tenant runtime service performs a tenancy check to make sure the request is coming from an authorized tenant by doing the token validation. After a successful validation, the service invokes the required Lambda function. To invoke functions hosted in a different AWS account, the multi-tenant runtime service uses an AWS Identity and Access Management (IAM) role to assume the required permissions and invokes the Lambda service using the AWS SDK. The sequence of interactions is shown in the following architecture diagram.

The workflow consists of the following steps:

  1. An incoming user request reaches the application gateway service.
  2. The application gateway authenticates the request using the tenancy security service.
  3. After it’s authenticated, the request is forwarded to the multi-tenant runtime service
  4. The multi-tenant runtime service validates the supplied token and performs a tenancy check. This makes sure tenants can only invoke own functions they have permissions for (for example, functions they own).
  5. The multi-tenant runtime service pod assumes the IAM role required for invoking the tenant-specific Lambda function in a different AWS account.
  6. The multi-tenant runtime service pod invokes the required Lambda function.

Invoking the platform API from custom code is as straightforward as connecting to any external API. The custom code can authenticate with the platform using OAuth2. To facilitate the authentication, the developer can pass along the credentials as input parameters to the function from the core platform. Then the developer can create a corresponding record (isolated by tenant) in the platform that stores the credentials per function, and pass credentials as input parameters during invocation.

Distributed architecture observability

Operating a distributed architecture that runs untrusted code across multiple AWS accounts requires a comprehensive observability strategy. Launchpad’s approach combines centralized logging and monitoring with cross-account aggregation to provide a unified operational view of the platform.

The monitoring architecture uses CloudWatch Metrics to observe the Lambda functions, aggregating them through a centralized observability layer. This setup empowers platform operators to correlate Lambda function metrics with the core platform services running on Amazon EKS. Launchpad also collects per-function telemetry like function invocations, error rates, and execution time, which allows them to observe per-tenant metrics. These telemetry dimensions enable both a platform-wide and tenant-specific monitoring perspective.

For logging and troubleshooting, Launchpad implements a unified logging pipeline that aggregates Lambda function logs with application gateway and runtime service logs. Each request flowing through the system carries a correlation ID, so operators can trace execution paths across the core SaaS services and into the tenant functions running in the AWS account running tenant Lambda functions.

With this multi-layer observability architecture, Launchpad can maintain operational excellence while running tenant code securely at scale. Regular operational reviews drive continuous improvements in monitoring coverage and incident response procedures. Having per-tenant Lambda functions make it possible for Launchpad to use tenant-specific cost allocation tags, further empowering them to understand the cost footprint of running tenant custom code.

Best practices

When building a SaaS solution, maintaining a unified core code base is essential for scalability and manageability. Implementing per-tenant variations within the core platform code can lead to maintenance complexity and technical debt. Instead, architect your SaaS solution to have extension points, which allow your tenants to inject their custom code at specific points in the workflow, enabling customization without compromising the platform’s maintainability. This pattern makes sure the core SaaS platform remains clean and standardized while offering the flexibility that customers demand.

Additional best practices include:

  • Use separate accounts for running Lambda functions with untrusted tenant-provided code to make sure it’s isolated from your core SaaS platform code.
  • Grant absolute minimum required access permissions to the execution role assigned to the function. The custom code running within the execution environment gets permissions defined in the execution role when making requests to AWS API endpoints. If the function doesn’t need to reach out to AWS API endpoints, remove all permissions from the execution role and add an explicit AWSDenyAll policy.
  • Use separate Lambda functions for each code snippet and each tenant. This will provide the highest degree of cross-tenant isolation. Resources are not reused across different functions and execution environments.
  • Use Lambda layers in case you need to add a layer of vendor-provided code in order to keep it separated from the untrusted tenant-provided code.
  • Implement additional security controls, such as using Amazon Virtual Private Cloud (Amazon VPC) constructs to restrict network access and VPC Flow Logs for network activity monitoring.

Conclusion

The implementation of a secure untrusted code execution environment within SaaS platforms addresses a critical need for tenant customization while maintaining architectural integrity. Lambda offers a built-in isolation model, fine-grained security controls, and serverless scalability, so SaaS providers such as Launchpad can address the requirements of executing tenant-provided code in a multi-tenant environment and offer robust customization capabilities while maintaining strict security boundaries and operational efficiency. This architectural pattern enables providers to focus on core platform development while confidently supporting tenant-specific workflows through the secure and scalable Lambda execution environment.

To learn more, refer to the Security Overview of AWS Lambda white paper. For additional serverless architectural patterns, see Serverlessland.com.


About the authors

PackScan: Building real-time sort center analytics with AWS Services

Post Syndicated from Sairam Vangapally original https://aws.amazon.com/blogs/big-data/packscan-building-real-time-sort-center-analytics-with-aws-services/

Amazon manages a complex logistics network with multiple touch points, from fulfillment centers to sort centers to final customer delivery. Among these, sort centers play a crucial role in the middle mile, providing faster and more efficient package movement. Within Amazon’s Middle Mile operations, high-volume sort centers process millions of packages daily, making immediate access to operational data essential for optimizing efficiency and decision-making. Real-time visibility into key metrics—such as package movements, container statuses, and associate productivity—is critical for smooth logistics operations. To address the need for real-time operational planning, the Amazon Middle Mile team developed PackScan, a cloud-based platform designed to provide instant insights across the network. By significantly reducing data latency, PackScan enables proactive decision-making, so teams can monitor inbound package flows, optimize outbound shipments based on live data, track associate productivity, identify bottlenecks, and enhance overall operational efficiency—all in real time.

In this post, we explore how PackScan uses Amazon cloud-based services to drive real-time visibility, improve logistics efficiency, and support the seamless movement of packages across Amazon’s Middle Mile network.

Prerequisites

This post assumes a foundational understanding of the following services and concepts:

Although hands-on experience is not required, a conceptual understanding of these services will help in understanding the architecture, design patterns, and components discussed throughout the article.

Business challenges

Amazon’s sort centers handle over 15 million packages daily across more than 120 facilities in North America. Given this scale, even minor delays in operational insights can lead to inefficiencies, increased costs, and escalations. Traditionally, data latencies of up to an hour have restricted the ability to make proactive decisions, directly affecting productivity, resource allocation, and responsiveness—especially during peak periods like holiday seasons and big deal days.

Without immediate visibility into package movements, container statuses, and associate performance, operational teams face challenges in identifying and resolving bottlenecks in real time. The lack of timely insights can disrupt the flow of packages, leading to shipment delays, reduced throughput, and suboptimal facility performance. Addressing these inefficiencies required a solution capable of delivering real-time, high-fidelity data to support rapid decision-making.

To bridge this gap, Amazon’s Middle Mile organization needed a scalable platform that could enhance visibility, minimize latency, and provide up-to-the-minute insights into logistics operations. PackScan was designed to meet these demands, giving teams access to the real-time data necessary to optimize workflows, mitigate bottlenecks, and improve overall efficiency.

Data flow

In 2024, PackScan was deployed across 80 sort centers in the USA, enabling real-time package analytics. The solution powers Grafana dashboards, which refresh every 10 seconds by fetching live package data from OpenSearch Service. With this near real-time visibility, operations teams can monitor package movement and sorting efficiency across sort centers. The following diagram outlines how package scan data is ingested, processed, and made actionable.

Each sort center is equipped with hardware at inbound stations where packages arrive from trailers. Integrated barcode scanners automatically scan each package as it enters the sorting process. Every scan generates an SNS event, capturing key attributes such as the package ID, dimensions, the associate who performed the scan, and the timestamp and location of the scan.

After they’re generated, these SNS events are ingested into Data Firehose through a Lambda function, where the data undergoes real-time enrichment. During this process, additional attributes are appended, including the business logic rules. The enriched data is then streamed into OpenSearch Service, where events are indexed to enable fast and efficient querying. With the indexed package scan events available in OpenSearch Service, real-time analytics and monitoring become possible. The Grafana dashboards query this data every 10 seconds, providing operational insights into package inflow metrics and associate performance.

Solution overview

PackScan was implemented using a structured and scalable approach, using AWS cloud-based services to enable high-frequency data ingestion, real-time processing, and actionable insights. The architecture is designed to minimize latency while providing reliability, scalability, and operational efficiency. The solution is built around a serverless, event-driven architecture that dynamically scales based on data ingestion volumes. The architecture—illustrated in the following figure—enabled us to build a real-time data solution, utilizing the advantages of various AWS services to provide low-latency analytics, high scalability, and real-time operational insights across Amazon’s sort centers.

The following are the key components and features of the solution:

  • Real-time data processing – Lambda functions serve as the processing backbone of the system, handling 500,000 scan events per second. Each incoming event is processed by applying data transformations, enrichment, and validation before passing it downstream.
  • High-frequency data ingestion and streaming – Data Firehose is the primary ingestion pipeline, handling millions of scan events daily from thousands of barcode scanners across multiple sort centers. The Firehose streams handle incoming data of 12,000 PUT requests per second, maintaining smooth ingestion and low-latency streaming. Data retention policies are set to buffer and forward enriched events every 60 seconds or upon reaching 5 MB batch size, optimizing storage and processing efficiency.
  • Optimized querying and operational insights – OpenSearch Service is used to index and store the processed scan events, providing real-time querying and anomaly detection. The OpenSearch cluster consists of 12 data nodes (r5.4xlarge.search) and 3 primary nodes (r5.large.search), processing up to 10 GB of data per day with a rolling index strategy, where indexes are rotated every 24 hours to maintain query performance. The system supports concurrent queries per second, enabling logistics teams to perform rapid lookups and gain instant visibility into package movements.
  • Live visualization and dashboarding – Grafana, hosted on an m5.12xlarge EC2 instance, provides real-time visualization of key logistics metrics. The dashboards refresh every 10 seconds, querying OpenSearch and displaying up-to-the-minute package analytics. The setup includes multiple preconfigured dashboards, monitoring package flow at different inbound stations, and workforce efficiency. These dashboards support concurrent users, enabling supervisors and associates to track and optimize operations proactively. The following screenshot shows one of the real-time dashboards, with details of package flow by different routes within sort centers.

The entire PackScan architecture is designed for automatic scaling, adjusting dynamically based on data ingestion volume to maintain efficiency during peak and off-peak operations. This approach provides cost-effective resource utilization while maintaining high availability and performance.

Business outcomes

The implementation of PackScan has led to measurable improvements in operational efficiency, workforce productivity, and real-time decision-making across Amazon’s sort centers. By reducing data latency and enabling real-time insights, PackScan has transformed logistics operations in meaningful ways:

  • Widespread deployment – PackScan was deployed across 80 sort centers, supporting approximately 1,000 display monitors that provide real-time operational insights.
  • Significant reduction in data latency – Data latency dropped from approximately 1 hour to less than 1 minute, allowing for real-time operational responsiveness and minimizing workflow disruptions.
  • Proactive operational management – With dynamic workload balancing and instant bottleneck identification, supervisors can now address issues as they arise, leading to smoother operations and fewer escalations.
  • Boost in workforce productivity – The real-time performance feedback has enhanced associate engagement, resulting in a 25% increase in throughput per hour and 12% reduction in labor hours.

Overall, PackScan has redefined real-time logistics visibility within Amazon’s Middle Mile operations, empowering operational teams with actionable insights, enhanced workforce efficiency, and a data-driven approach to package movement and sort center performance.

Lessons learned and best practices

The deployment and scaling of PackScan provided valuable insights into optimizing real-time logistics visibility. Several key lessons and best practices emerged from this implementation:

  • Cloud architecture drives efficiency – Adopting Amazon technologies provides seamless scalability, reduced operational overhead, and lower infrastructure costs, while maintaining high reliability. The following table shows an approximate breakdown of monthly service costs observed in production. This is an estimation based on current pricing; we recommend checking the respective AWS service pricing pages to generate the most up-to-date quote. This architecture demonstrates that with combination of provisioned and serverless design, production-ready solutions can be built and scaled at a fraction of the cost of traditional infrastructure.
AWS Service Description Estimated Monthly Cost
Amazon EC2 Three EC2 instances of type m5.12xlarge hosting Grafana $1,700
AWS Lambda Streams SNS events to Data Firehose $4,000
Amazon Data Firehose Real-time data delivery with 12,000 records streaming to OpenSearch Service $1,500
Amazon OpenSearch Service Indexing and querying package scan events $28,000
  • Real-time visibility is a game changer – Immediate access to operational data enhances agility, enabling teams to make timely, data-driven decisions that prevent bottlenecks and improve throughput.
  • Continuous monitoring enhances decision-making – Operational dashboards should evolve with business needs. Regular monitoring and updates provide accuracy, usability, and relevance in driving informed decision-making.

By applying these best practices, PackScan has set a foundation for scalable, real-time logistics management, making sure that Amazon’s Middle Mile operations remain proactive, efficient, and highly responsive to changing business demands.

Conclusion

PackScan has successfully transformed real-time operational visibility within Amazon’s sort centers, addressing critical challenges in data latency, workforce productivity, and logistics efficiency. By using AWS services, particularly Data Firehose for real-time data delivery and OpenSearch Service for analytics, PackScan has enabled proactive decision-making, streamlined operations, and enhanced throughput in high-volume sort environments. Looking ahead, future enhancements will focus on further elevating operational intelligence and scalability, including:

  • Integrating predictive analytics to anticipate workflow bottlenecks and optimize resource allocation
  • Scaling the solution across additional operational scenarios, providing greater resilience and adaptability to dynamic logistics environments

With these advancements, PackScan will continue to drive operational excellence, cost-efficiency, and real-time decision-making capabilities, reinforcing Amazon’s commitment to innovation in logistics and supply chain management.

For those interested in implementing similar solutions, we recommend exploring AWS Serverless Architecture Patterns and the AWS Architecture Blog for additional insights and best practices in building scalable, real-time analytics solutions.


About the authors

Sairam Vangapally is a Data Engineer at Amazon with extensive experience architecting real-time, large-scale data platforms that power critical logistics operations across North America. He has led the design and deployment of end-to-end data pipelines, enabling high-throughput ingestion, transformation, and analytics at scale. He is passionate about building resilient data infrastructure and driving cross-functional collaboration to deliver solutions that accelerate operational insights and business impact.

Nitin Goyal serves as a Data Engineering Manager in Amazon’s Sort Center organization, where he leads initiatives to optimize operational efficiency across North American facilities. With over nine years of tenure at Amazon spanning multiple teams, he specializes in architecting high-performance data systems, with particular emphasis on real-time streaming pipelines, artificial intelligence, and low-latency solutions. His expertise drives the development of sophisticated operational workflows that enhance sort center productivity and effectiveness.