Три основни източника на пари са обособени за осигуряване на луксозния живот на Борислава Йовчева и нейната дъщеря в Испания, а впоследствие и в Италия. Това се установява от обработени…
The 6.4 kernel was released
on June 25 after a nine-week development cycle. By that point, 14,835
non-merge changesets had been pulled into the mainline kernel, a slight
increase from 6.3 (14,424 changesets) but still lower than many other
development cycles. As usual, LWN has taken a look at those changesets,
who contributed them, and what the most active developers were up to.
While there are many variations of spam traps, they all share one thing in common: they are all addresses that should not be receiving mail. According to Spamhaus, an industry leader in anti-spam efforts that many ISPs and email service providers refer to and ingest spam trap listing data from, “A spam trap is an email address traditionally used to expose illegitimate senders who add email addresses to their lists without permission. They effectively identify email marketers with poor permission and list management practices.” (https://www.spamhaus.com/resource-center/spamtraps-fix-the-problem-not-the-symptom/). Having been identified as sending mail to a spam trap, a sender may find that a significant portion of their mail will be blocked until the listing has been addressed and removed.
By following the best practices outlined in this post, starting with ensuring you are only sending high quality mail to those that have explicitly requested it and continue to find value in it, you can reduce the potential of sending to a spam trap and avoiding the negative impacts that event can cause.
Spam traps are secret, on purpose
The owners of spam traps keep them secret and never reveal them; this is by design. If a spam trap were to be identified then those not following best practices could simply filter and remove that address from lists thus defeating their purpose. The creation and use of spam traps is to highlight possible issues with data collection, list management, and list hygiene. A sender who has sent to a spam trap may be tempted to try to locate and delete a specific spam trap or traps but this doesn’t solve the issue and is highly unlikely to succeed.
What impact can sending to a spam trap have
The impact can vary, depending on items such as the type of trap you sent to, how many times you sent to it, and how the spam trap owner handles these events. It might result in an immediate, public listing on an RBL (real-time block list). ISPs and email providers subscribe to various block lists as a means of supplementing their own anti-spam methods and processes and often move to block mail from both domains and IP addresses identified as sending to spam traps. For some senders, a public RBL listing will result in a significant amount of their mail being blocked. As email is typically a vital part of how business today operates, this could be devastating and difficult to manage after the fact.
Types of spam traps
Below are many of the most common types of spam traps, but this is not an exhaustive list.
Classic or Pure Spam traps – Classic spam traps are email addresses that were not created or used by a live person, nor available on any website. In some cases, these are addresses at domains that accept mail to any address before the @ (wildcard domains: e.g., *@example.com).
Seeded Traps – Seeded traps are email addresses that anti-spam organizations and others create and purposely plant in various locations online in non-obvious places. The purpose of this “seeding” is to identify when a sender is scraping addresses across the internet and/or has purchased a list from someone who has. This process highlights senders who are sending mail without consent and may not be honoring requests to unsubscribe.
Recycled email addresses – These were once-valid email addresses and are the kind of trap a sender can send to even if every address on their list was originally confirmed opt-in. Recycled spam traps are often quite old addresses that were no longer in use or abandoned by the original owner. Abandoned for so long, in fact, the provider has repurposed it as a trap to identify senders who have not properly maintained the hygiene of their sending lists. This indicates a sender has not been active in keeping lists up to date and pruning inactive subscribers or bounced emails. Often, as part of repurposing these addresses, the provider will ensure the address will bounce for 12 months or more, indicating to the sender that the address is no longer valid and only moving to listing the spam trap and sender after having given them that grace period.
Typo traps – Email addresses that have a typo in the domain, such as @gmial or @yaho, instead of @gmail or @yahoo respectively. These may also be typos in the username, before the @. These may occur when email addresses are collected offline and entered into a database later, or potentially entered incorrectly by the user themselves and was not confirmed. These traps are quite common, but are not “pure” spam traps and anti-spam organizations typically weigh them with this in mind.
Fake addresses – Registration and shopping cart forms often attract fake email addresses. Perhaps an offer is presented on a site that requires an entry, wherein someone enters submits an address like [email protected], which may very well be a spam trap address.
How to avoid sending to spam traps
The first step to avoiding sending to a spam trap is to ensure you are only sending mail to those that have explicitly requested it. Your subscribers should find value in your mail and should fully expect to receive it. The key is getting permission from those users and meeting those expectations. It is strongly recommended that you implement confirmed opt-in or double opt-in, the process of sending a message to the address provided that contains a link or other mechanism for the subscriber to confirm that they approve of the subscription. If there is no response received, that address should not be sent any further mail.
Do not purchase a sending list from a third party. It should go without saying, considering the first step above, however, some senders may be tempted to “kick start” their sending with every intention to transition to best practices but just want a quick boost. This will often result in excessive bounces, recipients marking mail as spam (known as complaints), and ending up with spam traps on sending lists.
Once you have an established list of recipients, addresses that have confirmed opt-in to your mail and value the content you are sending, you need to look at your list management. You should be tracking user engagement for things such as: has a recipient opened your mail recently, has a recipient clicked through a link in your mail, has that user logged in to your site or service. With this tracking in place you should be regularly, preferably automatically, pruning your sending list of non-engaged subscribers. It isn’t recommended to send mail to subscribers who have not engaged for 6 months or longer.
You should also be consistently addressing and removing bounce and complaint addresses. As noted, some spam traps may bounce for 12 months or more before going “live” as a spam trap, providing senders ample time to remove a no longer valid address. This involves tracking and monitoring your sending, ingesting that data, and acting upon those events.
Make sure all webforms have been secured by means such as adding CAPTCHA, in conjunction with confirmed opt-in to help prevent bots from maliciously submitting addresses to your sending lists.
You should immediately honor any and all unsubscribe requests. These addresses may be used by real individuals, and that user may very well be involved in anti-spam efforts and organizations themselves in some way. By not honoring an unsubscribe request you may be sending mail to someone who takes part in blocking decisions, or you may end up with excessive complaints that also negatively impact your sending reputation.
What to do if you have sent to a spam trap
If you haven’t already put in place the methods and best practices above to avoid sending to a spam trap, you should work to immediately implement them. You should also regularly perform rigorous reviews of your data collection and verification practices, identifying and addressing any potential areas of concern or lists/subscribers that cannot be sourced and verified. Segment your lists into recipient activity such as opens, clicks and forwards, immediately removing unengaged addresses for a lesser time frame than what you should already have in place. You may consider performing a permission pass, a one-time campaign to recipients (specifically those left after segmenting and removing of all non-verifiable addresses and older non-engaged recipients) providing users the opportunity to confirm that they would still like to receive mail from you. Only those that have confirmed their subscription status should be kept on future sending lists.
In conclusion
Implementing these best practices, before you begin sending in bulk, can be key in gaining and maintaining a quality sending reputation and is a vital part of successful marketing for businesses both large and small. These processes can significantly improve ROI, mail list quality and integrity, and reduce the possibility of sending to a spam trap, resulting in the best chance of getting your mail in the inboxes of your subscribers
In this detailed article about academic plagiarism are some interesting details about how to do data forensics on Excel files. It really needs the graphics to understand, so see the description at the link.
(And, yes, an author of a paper on dishonesty is being accused of dishonesty. There’s moreevidence.)
Previously, I wrote about building network load balancers with the maglev scheduler, which we use for ingress into our Kubernetes clusters. At the time of that post we were using Foo-over-UDP encapsulation with virtual interfaces, one for each Internet Protocol version for each worker node.
To reduce operational toil managing the traffic director nodes, we've recently switched to using IP Virtual Server's (IPVS) native support for encapsulation. Much to our surprise, instead of a smooth change, we instead observed significant drops in bandwidth and failing API requests. In this post I'll discuss the impact observed, the multi-week search for the root cause, and the ultimate fix.
Recap and the change
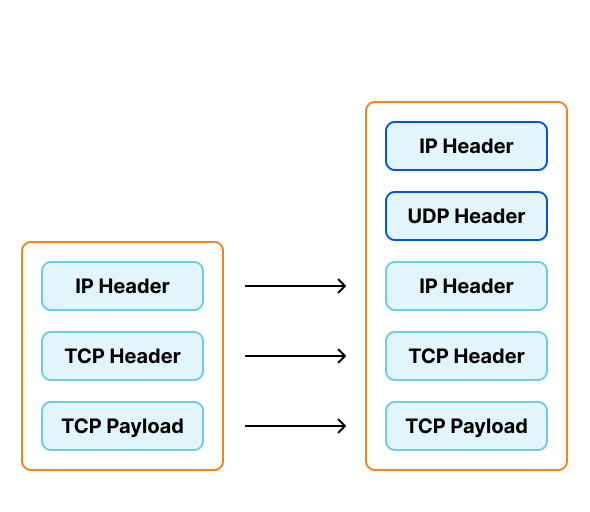
To support our requirements we've been creating virtual interfaces on our traffic directors configured to encapsulate traffic with Foo-Over-UDP (FOU). In this encapsulation new UDP and IP headers are added to the original packet. When the worker node receives this packet, the kernel removes the outer headers and injects the inner packet back into the network stack. Each virtual interface would be assigned a private IP, which would be configured to send traffic to these private IPs in "direct" mode.
This configuration presents several problems for our operations teams.
For example, each Kubernetes worker node needs a separate virtual interface on the traffic director, and each of the interfaces requires their own private IP. The pairs of virtual interfaces and private IPs were only used by this system, but still needed to be tracked in our configuration management system. To ensure the interfaces were created and configured properly on each director we had to run complex health checks, which added to the lag between provisioning a new worker node and the director being ready to send it traffic. Finally, the header for FOU also lacks a way to signal the "next protocol" of the inner packet, requiring a separate virtual interface for IPv4 and IPv6. Each of these problems individually contributed a small amount of toil, but taken together, gave us impetus to find a better alternative.
In the time since we had originally implemented this system, IPVS has added native support for encapsulation. This would allow us to eliminate provisioning virtual interfaces (and their corresponding private IPs), and be able to use newly provisioned workers without delay.
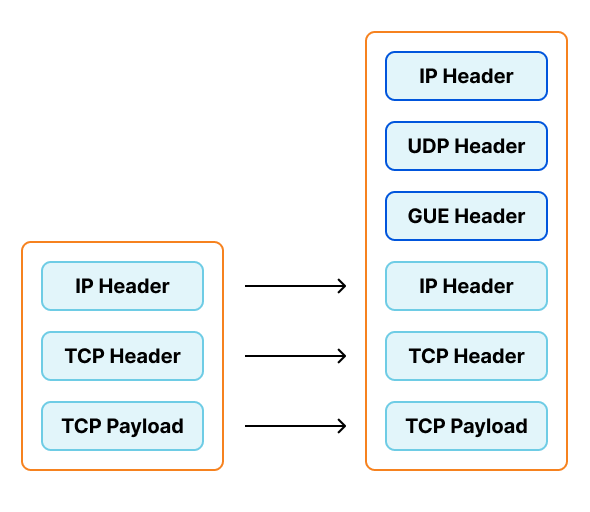
IPVS doesn't support Foo-over-UDP as an encapsulation type. As part of this project we switched to a similar option, Generic UDP Encapsulation (GUE). This encapsulation option does include the "next protocol", allowing one listener on the worker nodes to support both IPv4 and IPv6.
What went wrong?
When we make changes to our Kubernetes clusters, we go through several layers of testing. This change had been deployed to the traffic directors in front of our staging environments, where it had been running for several weeks. However, due to the nature of this bug, the type of traffic to our staging environment did not trigger the underlying bug.
We began a slow rollout of this change to one production cluster, and after a few hours we began observing issues reaching services behind Kubernetes Load Balancers. The behavior observed was very interesting: the vast majority of requests had no issues, but a small percentage of requests corresponding to large HTTP request payloads or gRPC had significant latency. However, large responses had no corresponding latency increase. There was no corresponding increase in latency seen to any requests to our ingress controllers, though we could observe a small drop in overall requests per second.
Through debugging after the incident, we discovered that the traffic directors were dropping packets that exceeded the Internet maximum transmission unit (MTU) of 1500 bytes, despite the packets being smaller than the actual MTU configured in our internal networks. Once dropped, the original host would fragment and resend packets until they were small enough to pass through the traffic directors. Dropping one packet is inconvenient, but unlikely to be noticed. However, when making a request with large payloads it is very likely that all packets would be dropped and need to be individually fragmented and resent.
When every packet is dropped and has to be resent, the network latency can add up to several seconds, exceeding the request timeouts configured by applications. This would cause the request to fail. necessitating retries by applications. As more traffic directors were reconfigured, these retries were less likely to succeed, leading to slower processing and causing the backlog of queued work to increase.
As you can see this small, but consistent, number of dropped packets could cause a domino effect into much larger problems. Once it became clear there was a problem, we reverted traffic directors to their previous configuration, and this quickly restored traffic to previous levels. From this we knew something about the change caused this problem.
Finding the culprit
With the symptoms of the issues identified, we started to try to understand the root cause. Once the root cause was understood, we could come up with a satisfactory solution.
Knowing the packets were larger than the Internet MTU, our first thought was that this was a misconfiguration of the machine in our configuration management tool. However, we found the interface MTUs were all set as expected, and there were no overriding MTUs in the routing table. We also found that sending packets from the director that exceeded the Internet MTU worked fine with no drops.
Cilium has developed a debugging tool pwru, short for "packet, where are you?", that uses eBPF to aid in debugging the kernel networking state. We used pwru in our staging environment and found the location where the packet had been dropped.
This captures tracing data for all packets that reach the traffic director, and saves the trace data to "pwru.log". There are filters built into pwru to select matching packets, but unfortunately they could not be used as the packet was being modified by the encapsulation. Instead, we used grep afterwards to find a matching packet, and then filtered farther based on the pointer in the first column.
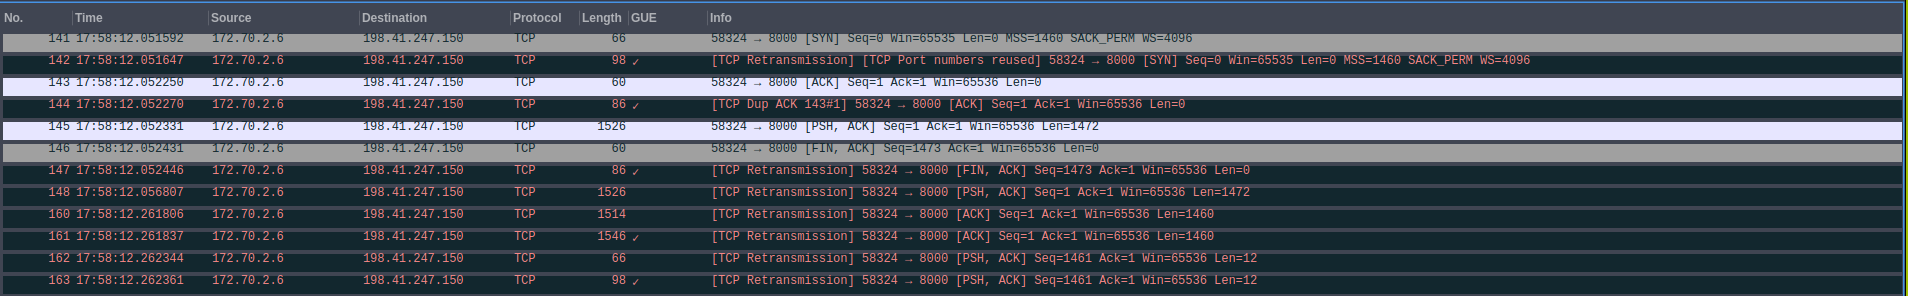
Looking at the lines logged for this packet, we can observe some behavior. We originally received a TCP packet for the load balancer IP. However, when the packet is dropped, it is a UDP packet destined for the worker's IP on the port we use for GUE. We can surmise that the packet was being processed and encapsulated by IPVS, and form a theory it was being dropped on the egress path from the director node. We could also see that when the packet was dropped, the packet was still smaller than the calculated MTU.
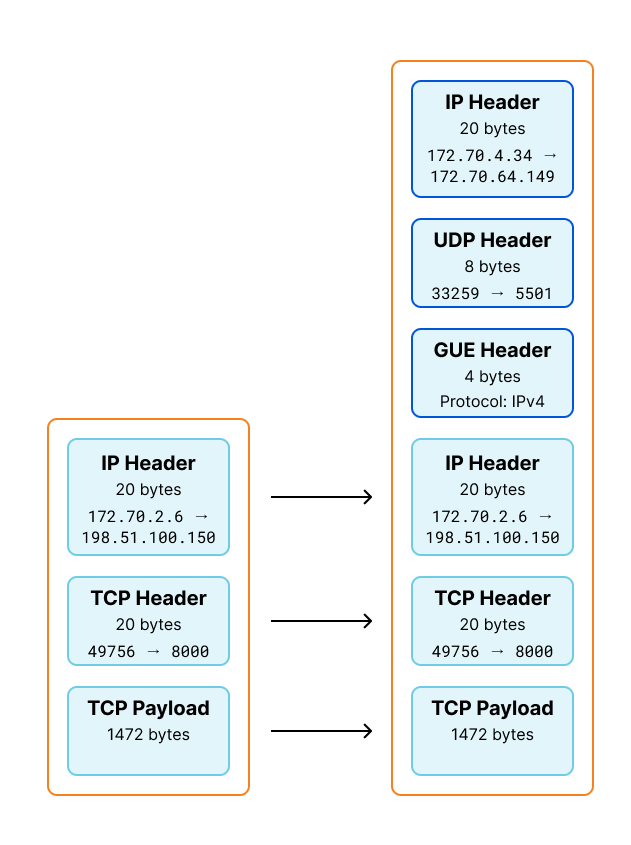
We can visualize this change by applying this information to our GUE encapsulation diagram shown earlier. The byte totals of the encapsulated packet is 1544, matching the length pwru logged entering inet_gso_segment above.
The trace above tells us what kernel functions are entered, but does not tell us if or how the program flow left. This means we don't know in which function kfree_skb_reason was called. Fortunately pwru can print a stacktrace when functions are entered.
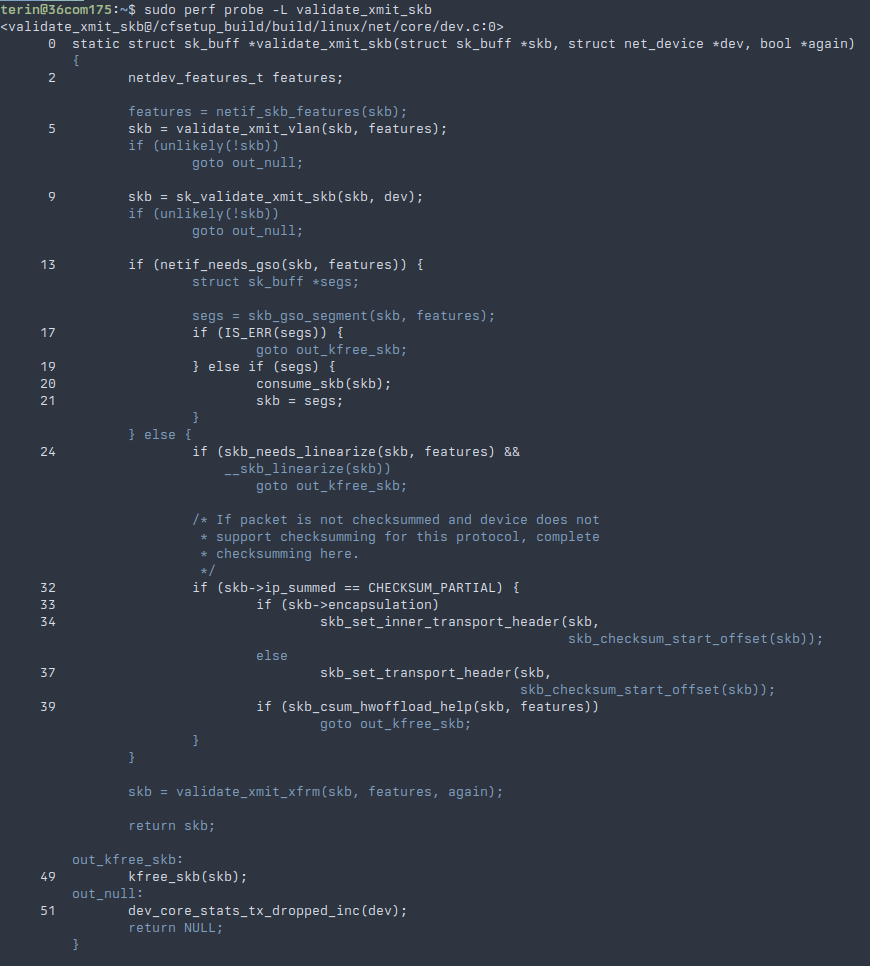
This stacktrace shows that kfree_skb_reason was called from within the validate_xmit_skb function and this is called from ip_vs_tunnel_xmit. However, when looking at the implementation of validate_xmit_skb, we find there are three paths to kfree_skb. How can we determine which path is taken?
In addition to the eBPF support used by pwru, Linux has support for attaching dynamic tracepoints using perf-probe. After installing the kernel source code and debugging symbols, we can ask the kprobe mechanism what lines of validate_xmit_skb we can create a dynamic tracepoint. It prints the line numbers for the line we can attach a tracepoint onto.
Unfortunately, we can't create a tracepoint on the goto lines, but we can attach tracepoints around them, using the context to determine how control flowed through this function. In addition to specifying a line number, additional arguments can be specified to include local variables. The skb variable is a pointer to a structure that represents this packet, which can be logged to separate packets in case more than one is being processed at a time.
Access to these tracepoints could be recorded by using perf-record and providing the tracepoint names given when they were added.
sudo perf record -a -e 'probe:validate_xmit_skb_L17,probe:validate_xmit_skb_L20,probe:validate_xmit_skb_L24,probe:validate_xmit_skb_L32'
The tests can be rerun so some packets are logged, before using perf-script to read the generated "perf.data" file. When inspecting the output file, we found that all the packets that were dropped were coming from the control flow of netif_needs_gso succeeding (that is, from the goto on line 18). We continued to create and record tracepoints, following the failing control flow, until execution reached __skb_udp_tunnel_segment.
When netif_needs_gso returns false, we do not see packet drops and no problems are reported. It returns true when the packet is larger than the maximum segment size (MSS) advertised by our peer in the connection handshake. For IPv4, the MSS is usually 40 bytes smaller than the MTU (though this can be adjusted by the application or system configuration). For most packets the traffic directors see, the MSS is 40 bytes less than the Internet MTU of 1500, or in this case 1460.
The tracepoints in this function showed that control flow was leaving through the error case on line 33: that kernel was unable to allocate memory for the tunnel header. GUE was designed to have a minimal tunnel header, so this seemed suspicious. We updated the probe to also record the calculated tnl_hlen, and reran the tests. To our surprise the value recorded by the probes was "-2". Huh, somehow the encapsulated packet got smaller?
At this point the kernel's behavior was a bit baffling: why would the tunnel header be computed to be a negative number? To answer this question, we added two more probes. The first was added to ip_vs_in_hook, a hook function that is called as packets enter and leave IPVS code. The second probe was added to __dev_queue_xmit, which is called when preparing to ask the hardware device to transmit the packet. To both of these probes we also logged some of the fields of the sk_buff struct by using the "pointer->field" syntax. These fields are offsets into the packet's data for the packet's headers, as well as corresponding offsets for the encapsulated headers.
The mac_header and inner_mac_header are offsets to the packet's layer two header. For Ethernet this includes the MAC addresses for the frame, but also other metadata such as the EtherType field giving the type the next protocol.
The network_header and inner_network_header fields are offsets to the packet's layer three header. For our purposes, this would be the header for IPv4 or IPv6.
The transport_header and inner_transport_header fields are offset to the packet's layer four header, such as TCP, UDP, or ICMP.
When the packet reaches ip_vs_in_hook on the way into IPVS, it only has outer packet headers. This makes sense, as the packet hasn't been encapsulated by IPVS yet. When the same hook is called again as the packet leaves IPVS, we see the encapsulation is already completed. We also find that the outer MAC header and the inner MAC header are at the same offset. Knowing how the tunnel header length is calculated in __skb_udp_tunnel_segment, we can also see where "-2" comes from. The inner_mac_header is at offset 0x44, while the transport_header is at offset 0x46.
When packets pass through network interfaces, the code for the interface reserves some space for the MAC header. For example, on an Ethernet interface some space is reserved for the Ethernet headers. FOU and GUE do not use link-layer addressing like Ethernet so no space is needed to be reserved. When we were using the virtual interfaces with FOU before it was correctly handling this case by setting the inner MAC header offset to the same as the inner network offset, effectively making it zero bytes long.
When using the encapsulation inside IPVS, this was not being accounted for, resulting in the inner MAC header offset being invalid. When packets did not need to be segmented this was a harmless bug. When segmenting, however, the tunnel header size needed to be known to duplicate it to all segmented packets.
I created a patch to correct the MAC header offset in IPVS's encapsulation code. The correction to the inner header offsets needed to be duplicated for IPv4 and IPv6.
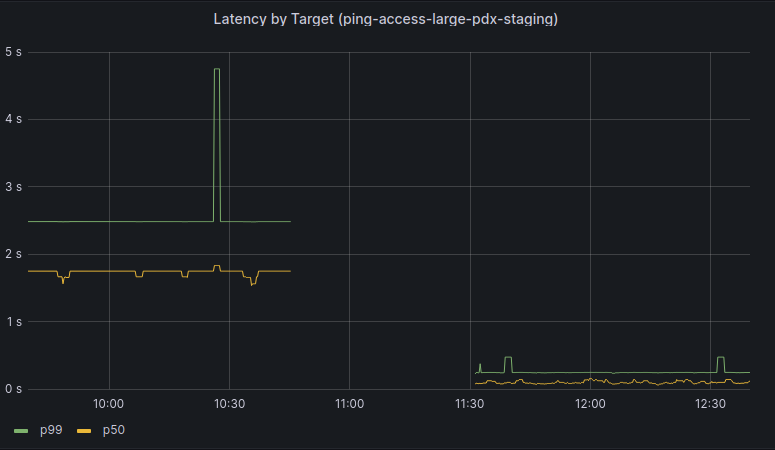
When the patch was included in our kernel and deployed the difference in end-to-end request latency was immediately noticeable. We also no longer observed packet drops for requests with large payloads.
Through this post, we hoped to have provided some insight into the process of investigating networking issues and how to begin debugging issues in the kernel using pwru and kprobe tracepoints. This investigation also led to a Linux kernel patch upstream. It also allowed us to safely roll out IPVS's native encapsulation.
“This week we will help you measure what matters. We’ll help you gain insight into your performance, from Zero Trust and API’s to websites and applications. And finally we’ll help you get faster. Quickly.”.
This week we published five posts on how to measure performance, explaining which metrics and approaches make sense and why. We had a deep dive on the latest Core Web Vital, “Interaction to Next Paint”, what it means and how we can help. There was a post on Time To First Byte (TTFB) and why it isn't a good way to measure good web performance. We also wrote about how to measure Zero Trust performance, and announced the Internet Quality page of Cloudflare Radar – giving everyone the ability to compare Internet connection quality across Internet Service Providers, countries, and more.
We launched new products such as Observatory, Digital Experiencing Monitoring and Timing Insights. These products give an incredible window into how your applications and websites are performing through the eyes of website visitors and your employees.
Finally, we wrote about how we are making it easier than ever for customers to migrate to Cloudflare from legacy vendors via our Turpentine and Descaler programs.
We’re on a mission to be the fastest at everything we do, and to make it simple for our customers to get the best performance.
In case you missed any of the announcements, take a look at the summary and navigation guide below.
Announcing new Constellation features, explaining why it’s the first globally distributed AI platform and why deploying your machine learning tasks in our global network is advantageous.
Describing the technical strategies that have enabled us to expand the number of machine learning features and models, all while substantially reducing the processing time for each HTTP request on our network.
A little less than two years ago, Cloudflare made Orpheus automatically available to all customers for free. Since then, Orpheus has saved 132 billion Internet requests from failing by intelligently routing them around connectivity outages, prevented 50+ Internet incidents from impacting our customers, and made our customer’s origins more reachable to everyone on the Internet. Let’s dive into how Orpheus accomplished these feats over the last year.
How we optimized bot management’s machine learning model execution. To reduce processing latency, we've undertaken a project to rewrite our bot management technology, porting it from Lua to Rust, and applying a number of performance optimizations. This post focuses on optimizations applied to the machine-learning detections within the bot management module, which account for approximately 15% of the latency added by bot detection. By switching away from a garbage collected language, removing memory allocations, and optimizing our parsers, we reduce the P50 latency of the bot management module by 79μs – a 20% reduction.
Cloudflare is the fastest Secure Web Gateway in 42% of testing scenarios, the most of any provider. Cloudflare is 46% faster than Zscaler, 56% faster than Netskope, and 10% faster than Palo Alto for ZTNA, and 64% faster than Zscaler for RBI scenarios.
DEX allows administrators to monitor their WARP Deployment and create predefined application tests. Features include live team & device analytics, server and traceroute tests, Synthetic Application Monitoring, and Fleet Status for real-time insights on WARP deployment.
The speed at which customers are able to move from Zscaler ZIA to Cloudflare Gateway continually gets faster. It usually takes more time to set up a meeting with the right technical administrators than to migrate settings, configurations, lists, policies and more to Cloudflare.
There are many ways to view network performance. However, at Cloudflare we believe the best way to measure performance is to use end-to-end HTTP response measurements. In this blog, we’re going to talk about why end-to-end performance is the most important thing to look at, why other methods like proxy latency and decrypted latency SLAs are insufficient for performance evaluations, and how you can measure your Zero Trust performance like we do.
The new Internet Quality page on Cloudflare Radar provides both country and network (autonomous system) level insight into Internet connection performance (bandwidth) and quality (latency, jitter) over time based on benchmark test data as well as speed.cloudflare.com test results.
A blog post that shares the most recent network performance updates, and tells you about our tools and processes that we use to monitor and improve our network performance.
If you care about the performance of your website or APIs, it’s critical to understand why things are slow. We're introducing new analytics tools to help you understand what is contributing to "Time to First Byte" (TTFB) of Cloudflare and your origin. But wait – maybe you've heard that you should stop worrying about TTFB? Isn't Cloudflare moving away from TTFB as a metric? Read on to understand why there are still situations where TTFB matters.
Time To First Byte (TTFB) is not a good way to measure your websites performance. In this blog we’ll cover what TTFB is a good indicator of, what it's not great for, and what you should be using instead.
On May 10, 2023, Google announced that INP will replace FID in the Core Web Vitals in March 2024. The Core Web Vitals play a role in the Google Search algorithm. Website owners who care about Search Engine Optimization (SEO) should prepare for the change. In this post we outline what INP is, and how you can prepare.
Cloudflare users can now easily monitor website performance using Real User Monitoring (RUM) data along with scheduled tests from different regions in a single dashboard. This will identify any performance issues your website may have. Once we’ve identified any issues, Observatory will highlight customized recommendations to resolve these issues, all with a single click.
Announcing we’re bringing traffic acceleration to customer’s UDP traffic. Now, users can improve the latency of UDP-based applications like video games, voice calls, and video meetings by up to 17%.
Enhancing our support for Brotli compression, enabling end-to-end Brotli compression for web content. Compression plays a vital role in reducing bytes during transfers, ensuring quicker downloads and seamless browsing.
Broadcast live to websites and applications with less than 10 second latency with Low-Latency HTTP Live Streaming (LL-HLS), now in beta with Cloudflare Stream.
Announcing Ricochet for API Gateway, the easiest way for Cloudflare customers to achieve faster API responses through automatic, intelligent API response caching.
Cloudflare Snippets are available in alpha. Snippets are a simple way of executing a small piece of Javascript on select HTTP requests, using the ruleset engine filtering logic.
Relaunching Turpentine, a service for moving away from Varnish Control Language (VCL). Introducing Cloudflare's new Migration Hub. The Migration Hub serves as a one-stop-shop for all migration needs, featuring brand-new migration guides that bring transparency and simplicity to the process.
In this blog, we will explain where the opportunities exist to improve website performance, how to check if a specific site can improve performance, and provide a small JavaScript snippet which can be used with Cloudflare Workers to do this optimization for you.
The Cloudflare dashboard is a single page application that houses all of the UI for our wide portfolio of existing products, as well as the new features we're releasing every day.
With the new architecture powering Workers KV our service will become faster and more scalable than ever. We have significantly reduced cold read probability, and enabled KV to serve over a trillion requests a month.
Kinsta delivers tailored cloud hosting solutions to over 26,000 companies across 128 countries. Learn how they used Workers and Workers KV to improve cache performance and customer performance.
Transferring your domains to a new registrar isn’t something you do every day, and getting any step of the process wrong could mean downtime and disruption. We’ve built a domain transfer checklist to help you quickly and safely transfer your domains to Cloudflare.
More than 162 million fans tuned in to the 2023 Eurovision Song Contest, the first year that non-participating countries could also vote. Cloudflare helped scale and protect the voting application using our rapid DNS infrastructure, CDN, Cloudflare Pages and Turnstile.
Watch on Cloudflare TV
Here's a summary of the Speed Week on Cloudflare TV:
If you missed any of the announcements or want to also view the associated Cloudflare TV segments, where blog authors went through each announcement, you can now watch all the Speed Week videos on Cloudflare TV.
Security updates have been issued by Debian (bind9 and owslib), Fedora (dav1d, dotnet6.0, dotnet7.0, mingw-dbus, vim, and wabt), and SUSE (cloud-init and golang-github-vpenso-prometheus_slurm_exporter).
Most of the stuff in my mailbox the last week has been about
upcoming things for 6.5, and I already have 15 pull requests
pending. I appreciate all you proactive people.
But that’s for tomorrow. Today we’re all busy build-testing the
newest kernel release, and checking that it’s all good. Right?
Не знам дали в седмицата на лятното равноденствие сънищата изглеждат като приказна реалност, но със сигурност реалността добива размерите на трескав кошмар. Кошмар, от който ни Оберон, ни Пък, нито здраво, скептично нашенско ощипване може да ни събуди.
Да не говорим че само при мисълта за 111-метров байрак (турско производство, оказва се), забит и развят от наречените от Георги Господинов „Гинес патриоти“, тръпки ме побиват и ледена пот ме облива. И се сещам за ониричния епиграф от „Политическа зима“ на Ботев: „Дали се зора довърши, или се две нощи смесиха?“
Но с това сънят реалност не свършва и не свършва.
Председателката на СЕМ, журналистка и писателка Соня Момчилова по време на заседание на Съвета защити предаването на Петър Волгин „Политически некоректно“, защото, видите ли, според нея лъжата също имала право на живот… В разговора си с Асен Генов в „Контракоментар“ (апропо – Chapeau! за неговата сдържана настоятелност, но и гъвкавост в доста неловката комуникационна ситуация) същата г-жа Момчилова навъртя километри, за да заобикаля поставените ѝ въпроси. През цялото време журналистката заинатено наричаше лъжите „друга гледна точка“, призоваваше за плурализъм и безпристрастност. Но при все това тя не успя да се задържи във въжделената от нея неутрална позиция и определи като пропаганда както слуховете за здравословното състояние на Путин и неговите двойници, така и клането в Буча. Ей така, в един ред на мисли.
Тази „издънка“, струва ми се, не беше съвсем невинно изпускане и целеше провокация. Е, постигна целта си. Реакциите не закъсняха и Украинското посолство разпространи официално изявление, в което обвини председателката на СЕМ в пропагандна манипулация.
Въпреки виртуозното отбиване на топки, мачът Генов–Момчилова завърши зле за блюстителката на независимата журналистика. И намекът ѝ за Буча, и последвалото ѝ оплитане в кълчищата на, меко казано, безвкусната ѝ Facebook „закачка“ за 30-те пола само усилиха конфуза (или кринджа, ако повече ви харесва)… И оголиха медийните срамотии в лицето на оглавяващата регулаторния им орган.
О, да беше сън този резил… Но не би.
Право в друг кошмар от изминалите няколко седмици дълбае анализът на Светла Енчева – „Бавното демократично проглеждане“. Този път авторката се фокусира върху въпроса защо евроатлантическата интеграция не е възможна без ясно, категорично и умно противопоставяне на неонацистките тенденции, на които ставаме свидетели в последно време.
Емилия Милчева пък отново подхваща темата за Гешев и неговия възможен „достоен exit“, който човекът с пура и каскет сам си поиска. Как би изглеждала една нова партия-на-достойния-изход, оглавена от бившия главен прокурор? Щипка патриотизъм, щипка прозападна реторика, родно брашънце с неонабухвател, яйчица от кокошки зад решетки и… всичко е точно. Дали ще е точно обаче, не е ясно, твърди Емилия, тъй като партийният терен е доста разкалян, а Гешев вече си няма институция да го брани от ветровете по върховете. А по върховете, да цитирам пак култовата Момчилова, и кислородът е кът. Клети Гешев, сал един каскет ти остана!
Но „Да погледнем към Гърция“ ни призовава Александър Нуцов. Само че не в посока плажовете на Халкидики, а към предстоящите парламентарни избори на 25 юни. Приликите между България и Гърция по отношение на ожесточените политически битки и избухващите един след друг скандали са не една и две. Има обаче една основна и основополагаща разлика – избирателната активност в Гърция надхвърля нашата с над 20 процентни пункта. Другата съществена разлика е далеч по-богатата политическа и гражданска култура на гръцките политици и избиратели, което естествено води не само до по-добре разгърнат и представителен политически спектър, но и до по-устойчиви и дълготрайни парламентарни мнозинства и правителства. При всички положения България има полза от стабилна Гърция до себе си, най-малкото заради сферите на взаимен интерес – туризъм, търговия и най-вече енергетика.
Тази седмица научният фокус на „Тоест“ е свързан с историята, настоящето и бъдещето на животоспасяващи операции, в които донори са животните. За това колко близки и далечни сме с шимпанзетата, павианите и прасетата, четете в статията на Анастасия Орманджиева „Ще разчитаме ли на генномодифицирани органи от животни за трансплантации при хора“. Този въпрос, разбира се, повдига ред етични проблеми, все по-актуални днес, когато антропоцентричната ни визия за света търпи критики от различни страни. Сещам се за поне двама писатели, Нобелови лауреати и защитници на животните, които биха имали какво да кажат по този въпрос – Дж. М. Кутси и Олга Токарчук. Може би наивната ми вяра (отломка от вероятно остарялото ми „просвещенско“ образование) е, че тъкмо в пресичането на полетата и дисциплините биха се преодолели дефектите на тясната експертност.
Но все пак да вдигнем очи от екрана и да погледнем през прозореца. И наяве, и насън, лято е и нека да е лято още известно време! За да го задържим по-дълго, изпращаме юни със стихотворението на месеца „Бавно“ от португалската поетеса Мария до Розарио Педрейра, преведено от Мария Георгиева и проф. Цочо Бояджиев. И ви пожелаваме и вие блажено да забавите ход. Но и да не забравяте, че всички тези сцени от средлятната седмица не са „само сънна бъркотия / в мозъчната ви кутия“. И че ако не днес и утре, то все някой недалечен ден „политическата зима“ ще се завърне.
The collective thoughts of the interwebz
Manage Consent
To provide the best experiences, we use technologies like cookies to store and/or access device information. Consenting to these technologies will allow us to process data such as browsing behavior or unique IDs on this site. Not consenting or withdrawing consent, may adversely affect certain features and functions.
Functional
Always active
The technical storage or access is strictly necessary for the legitimate purpose of enabling the use of a specific service explicitly requested by the subscriber or user, or for the sole purpose of carrying out the transmission of a communication over an electronic communications network.
Preferences
The technical storage or access is necessary for the legitimate purpose of storing preferences that are not requested by the subscriber or user.
Statistics
The technical storage or access that is used exclusively for statistical purposes.The technical storage or access that is used exclusively for anonymous statistical purposes. Without a subpoena, voluntary compliance on the part of your Internet Service Provider, or additional records from a third party, information stored or retrieved for this purpose alone cannot usually be used to identify you.
Marketing
The technical storage or access is required to create user profiles to send advertising, or to track the user on a website or across several websites for similar marketing purposes.