Tag Archives: Architecture

Architecting near real-time personalized recommendations with Amazon Personalize

Post Syndicated from Raghavarao Sodabathina original https://aws.amazon.com/blogs/architecture/architecting-near-real-time-personalized-recommendations-with-amazon-personalize/

Delivering personalized customer experiences enables organizations to improve business outcomes such as acquiring and retaining customers, increasing engagement, driving efficiencies, and improving discoverability. Developing an in-house personalization solution can take a lot of time, which increases the time it takes for your business to launch new features and user experiences.

In this post, we show you how to architect near real-time personalized recommendations using Amazon Personalize and AWS purpose-built data services.  We also discuss key considerations and best practices while building near real-time personalized recommendations.

Building personalized recommendations with Amazon Personalize

Amazon Personalize makes it easy for developers to build applications capable of delivering a wide array of personalization experiences, including specific product recommendations, personalized product re-ranking, and customized direct marketing.

Amazon Personalize provisions the necessary infrastructure and manages the entire machine learning (ML) pipeline, including processing the data, identifying features, using the most appropriate algorithms, and training, optimizing, and hosting the models. You receive results through an Application Programming Interface (API) and pay only for what you use, with no minimum fees or upfront commitments.

Figure 1 illustrates the comparison of Amazon Personalize with the ML lifecycle.

Machine learning lifecycle vs. Amazon Personalize

Figure 1. Machine learning lifecycle vs. Amazon Personalize

First, provide the user and items data to Amazon Personalize. In general, there are three steps for building near real-time recommendations with Amazon Personalize:

  1. Data preparation: Preparing data is one of the prerequisites for building accurate ML models and analytics, and it is the most time-consuming part of an ML project. There are three types of data you use for modeling on Amazon Personalize:
    • An Interactions data set captures the activity of your users, also known as events. Examples include items your users click on, purchase, or watch. The events you choose to send are dependent on your business domain. This data set has the strongest signal for personalization, and is the only mandatory data set.
    • An Items data set includes details about your items, such as price point, category information, and other essential information from your catalog. This data set is optional, but very useful for scenarios such as recommending new items.
    • A Users data set includes details about the users, such as their location, age, and other details.
  2. Train the model with Amazon Personalize: Amazon Personalize provides recipes, based on common use cases for training models. A recipe is an Amazon Personalize algorithm prepared for a given use case. Refer to Amazon Personalize recipes for more details. The four types of recipes are:
    • USER_PERSONALIZATION: Recommends items for a user from a catalog. This is often included on a landing page.
    • RELATED_ITEM: Suggests items similar to a selected item on a detail page.
    • PERSONALZIED_RANKING: Re-ranks a list of items for a user within a category or in within search results.
    • USER_SEGMENTATION: Generates segments of users based on item input data. You can use this to create a targeted marketing campaign for particular products by brand.
  3. Get near real-time recommendations: Once your model is trained, a private personalization model is hosted for you. You can then provide recommendations for your users through a private API.

Figure 2 illustrates a high-level overview of Amazon Personalize:

Figure 2. Building recommendations with Amazon Personalize

Figure 2. Building recommendations with Amazon Personalize

Near real-time personalized recommendations reference architecture

Figure 3 illustrates how to architect near real-time personalized recommendations using Amazon Personalize and AWS purpose-built data services.

Reference architecture for near real-time recommendations

Figure 3. Near real-time recommendations reference architecture

Architecture flow:

  1. Data preparation: Start by creating a dataset group, schemas, and datasets representing your items, interactions, and user data.
  2. Train the model: After importing your data, select the recipe matching your use case, and then create a solution to train a model by creating a solution version.
    Once your solution version is ready, you can create a campaign for your solution version. You can create a campaign for every solution version that you want to use for near real-time recommendations.
    In this example architecture, we’re just showing a single solution version and campaign. If you were building out multiple personalization use cases with different recipes, you could create multiple solution versions and campaigns from the same datasets.
  3. Get near real-time recommendations: Once you have a campaign, you can integrate calls to the campaign in your application. This is where calls to the GetRecommendations or GetPersonalizedRanking APIs are made to request near real-time recommendations from Amazon Personalize.
    • The approach you take to integrate recommendations into your application varies based on your architecture but it typically involves encapsulating recommendations in a microservice or AWS Lambda function that is called by your website or mobile application through a RESTful or GraphQL API interface.
    • Near real-time recommendations support the ability to adapt to each user’s evolving interests. This is done by creating an event tracker in Amazon Personalize.
    • An event tracker provides an endpoint that allows you to stream interactions that occur in your application back to Amazon Personalize in near real-time. You do this by using the PutEvents API.
    • Again, the architectural details on how you integrate PutEvents into your application varies, but it typically involves collecting events using a JavaScript library in your website or a native library in your mobile apps, and making API calls to stream them to your backend. AWS provides the AWS Amplify framework that can be integrated into your web and mobile apps to handle this for you.
    • In this example architecture, you can build an event collection pipeline using  Amazon API Gateway, Amazon Kinesis Data Streams, and Lambda to receive and forward interactions to Amazon Personalize.
    • The Event Tracker performs two primary functions. First, it persists all streamed interactions so they will be incorporated into future retraining of your model. This also how Amazon Personalize cold starts new users. When a new user visits your site, Amazon Personalize will recommend popular items. After you stream in an event or two, Amazon Personalize immediately starts adjusting recommendations.

Key considerations and best practices

  1. For all use cases, your interactions data must have a minimum 1000 interaction records from users interacting with items in your catalog. These interactions can be from bulk imports, streamed events, or both, and a minimum 25 unique user IDs with at least two interactions for each.
  2. Metadata fields (user or item) can be used for training, filters, or both.
  3. Amazon Personalize supports the encryption of your imported data. You can specify a role allowing Amazon Personalize to use an AWS Key Management Service (AWS KMS) key to decrypt your data, or use the Amazon Simple Storage Service (Amazon S3) AES-256 server-side default encryption.
  4. You can re-train Amazon Personalize deployments based on how much interaction data you generate on a daily basis. A good rule is to re-train your models once every week or two as needed.
  5. You can apply business rules for personalized recommendations using filters. Refer to Filtering recommendations and user segments for more details.

Conclusion

In this post, we showed you how to build near real-time personalized recommendations using Amazon Personalize and AWS purpose-built data services. With the information in this post, you can now build your own personalized recommendations for your applications.

Read more and get started on building personalized recommendations on AWS:

Why Signeasy chose AWS Serverless to build their SaaS dashboard

Post Syndicated from Venkatramana Ameth Achar original https://aws.amazon.com/blogs/architecture/why-signeasy-chose-aws-serverless-to-build-their-saas-dashboard/

Signeasy is a leading eSignature company that offers an easy-to-use, cross-platform and cloud-based eSignature and document transaction management software as a service (SaaS) solution for businesses. Over 43,000 companies worldwide use Signeasy to digitize and streamline business workflows. In this blog, you will learn why and how Signeasy used AWS Serverless to create a SaaS dashboard for their tenants.

Signeasy’s SaaS tenants asked for an easier way to get insights into tenant usage data on Signeasy’s eSignature platform. To address that, Signeasy built a self-service usage metrics dashboard for their SaaS tenant using AWS Serverless.

Usage reports

What was it like before the self-service dashboard experience? In the past, tenants requested Signeasy to share their usage metrics through support channels or emails. The Signeasy support team compiled the reports and then emailed the report back to the tenant to service the request. This was a repetitive manual task. It involved querying a database, fetching and collating the results into an Excel table to be emailed to the tenant. The turnaround time on these manual reports was eight hours.

The following table illustrates the report format (with example data) that the tenants received through email.

Archives usage reports

Figure 1. Archived usage reports

The design

Signeasy deliberated numerous aspects and arrived at the following design considerations:

  • Enhance tenant experience — Provide the reports to tenants on-demand, using a self-service mechanism.
  • Scalable aggregation queries — The reports ran aggregation queries on usage data within a time range on a relational database management system (RDBMS). Signeasy considered moving to a data store that has the scalability to store and run aggregation queries on millions of records.
  • Agility — Signeasy wanted to build the module in a time-bound manner and deliver it to tenants as quickly as possible.
  • Reduce infrastructure management — The load on the reports infrastructure that stores and processes data increases linearly in relation to the count of usage reports requested. This meant an increase in the undifferentiated heavy lifting of infrastructure management tasks such as capacity management and patching.

With the design considerations and constraints called out, Signeasy began to look for the suitable solution. Signeasy decided to build their usage reports on a serverless architecture. They chose AWS Serverless, because it offers scalable compute and database, application integration capabilities, automatic scaling, and a pay-for-use billing model. This reduces infrastructure management tasks such as capacity provisioning and patching. Refer to the following diagram to see how Signeasy augmented their existing SaaS with self-service usage reports.

Architecture of self-service usage reports

Architecture diagram depicting the data flow of the self-service usage reports

Figure 2. Architecture diagram depicting the data flow of the self-service usage reports

  1. Signeasy’s tenant users log in to the Signeasy portal to authenticate their tenant identity.
  2. The Signeasy portal uses a combination of tenant ID and user ID in JSON Web Tokens (JWT) to distinguish one tenant user from another when storing and processing documents.
  3. The documents are stored in Amazon Simple Storage Service (Amazon S3).
  4. The users’ actions are stored in the transactional database on Amazon Relational Database Service (Amazon RDS).
  5. The user actions are also written as messages into message queue on Amazon Simple Queue Service (Amazon SQS). Signeasy used the queue to loosely couple their existing microservices on Amazon Elastic Kubernetes Service (Amazon EKS) with the new serverless part of the stack.
  6. This allows Signeasy to asynchronously process the messages in Amazon SQS with minimal changes to the existing microservices on EKS.
  7. The messages are processed by a report writer service (Python script) on AWS Lambda and written to the reports database on Amazon Timestream. The reports database on Timestream stores metadata attributes such as user ID and signature document ID, signature document sent, signature request received, document signed, and signature request cancelled or declined, and timestamp of the data point. To view usage reports, the tenant administrators navigate to the Reports section of the Signeasy portal and select Usage Reports.
  8. The usage reports request from the (tenant) Web Client on the browser is an API call to Amazon API Gateway.
  9. API Gateway works as a front door for the backend reports service running on a separate Lambda function.
  10. The reports service on Lambda uses the user ID from login details to query the Amazon Timestream database to generate the report and send it back to the web client through the API Gateway. The report is immediately available for the administrator to view, which is a huge improvement from having to wait for eight hours before this self-service feature was made available to their SaaS tenants.

Following is a mock-up of the Usage Reports dashboard:

A mockup of the Usage Reports page of the Signeasy portal

Figure 3. A mock-up of the Usage Reports page of the Signeasy portal

So, how did AWS Serverless help Signeasy?

Amazon SQS persists messages up to 14 days, and enables retry functionality for message processed in Lambda. Lambda is an event-driven serverless compute service that manages deployment and runs code, with logging and monitoring through Amazon CloudWatch. The integration of API Gateway with Lambda helped Signeasy easily deploy and manage the backend processing logic for the reports service. As usage of the reports grew, Timestream continued to scale, without the need to re-architect their application. Signeasy continued to use SQL to query data within the reports database on Timestream in a cost optimized manner.

Signeasy used AWS Serverless for its functionality without the undifferentiated heavy lifting of infrastructure management tasks such as capacity provisioning and patching. Signeasy’s support team is now more focused on higher-level organizational needs such as customer engagements, quarterly business reviews, and signature and payment related issues instead of managing infrastructure.

Conclusion

  • Going from eight hours to on-demand self-service (0 hours) response time for usage reports is a huge improvement in their SaaS tenant experience.
  • The AWS Serverless services scale out and in to meet customer needs. Signeasy pays only for what they use, and they don’t run compute infrastructure 24/7 in anticipation of requests throughout the day.
  • Signeasy’s support and customer success teams have repurposed their time toward higher value customer engagements vs. capacity, or patch management.
  • Development time for the Usage Reports dashboard was two weeks.

Further reading

Accelerating Well-Architected Framework reviews using integrated AWS Trusted Advisor insights

Post Syndicated from Stephen Salim original https://aws.amazon.com/blogs/architecture/accelerating-well-architected-framework-reviews-using-integrated-aws-trusted-advisor-insights/

In this blog, we will explain how the new AWS Well-Architected integration with AWS Trusted Advisor can give you insights that help you create a flywheel effect to accelerate your cloud optimization. Customers that have the most success in their cloud adoption recognize that optimizing their cloud architecture and operations is not a one-time effort. Optimization is a continuous improvement virtuous cycle based on learning architectural and operational best practices, measuring workloads against these best practices, and implementing improvements based on opportunities recognized from measurement.

Customers can use the AWS Well-Architected Framework to build a “learn, measure, and improve” continuous improvement virtuous cycle (Figure 1). With the AWS Well-Architected Tool, customers can measure their workloads against these AWS best practices to identify improvement opportunities or risks they should address. After customers complete Well-Architected Framework Reviews (WAFRs) they can generate improvement plans with prioritized guidance and resources for improvement. They can also track the improvements made over time using the milestones feature in the Well-Architected Tool.

Continuous optimization of workloads based on AWS best practices

Figure 1. Continuous optimization of workloads based on AWS best practices

Amazon uses the term flywheel to describe a virtuous cycle that has additional drivers to add momentum, which accelerates the cycle and the value it delivers. Figure 2 is the often-referenced Amazon retail flywheel, which shows how Amazon’s focus on customer experience drives growth. It is accelerated by creating a lower cost structure, which allows Amazon to pass lower prices to its customers, improving customer experience and driving faster growth.

Amazon Flywheel concept of scaling growth

Figure 2. The Amazon Flywheel concept of scaling growth

Customers can add momentum to an AWS Well-Architected “learn, measure, and improve” virtuous cycle using tools that give more insights while measuring workloads. Improved insights result in consistent measurements, that are more efficient and more accurate. This accelerates the optimization cycle by reducing the time required to measure workloads. Collecting information on AWS resources using Trusted Advisor checks allows customers to validate if a workload’s state is aligned with AWS best practices. The new AWS Well-Architected Tool integration with AWS Trusted Advisor makes it easier and faster to gain insights during WAFRs. The Trusted Advisor checks that are relevant to a specific set of best practices have been mapped to the corresponding questions in Well-Architected. The new feature now shows the mapped Trusted Advisor checks directly in the Well-Architected Tool. These insights help customers run WAFRs in less time, with more accuracy, creating a flywheel effect (Figure 3).

Insights from AWS Trusted Advisor create acceleration in achieving improved outcomes

Figure 3. Insights from AWS Trusted Advisor create acceleration in achieving improved outcomes

AWS Well-Architected Tool integration with AWS Trusted Advisor: feature example

In the following sections, we detail an example scenario on how to use the integration with Trusted Advisor to gain insights when measuring your workloads.

Enabling the AWS Well-Architected Tool integration with AWS Trusted Advisor

How to enable the new feature in your workload:

  1. Create a new workload in the AWS Well-Architected Console. Refer to the user guide for detailed instructions.

    Optional
    : When defining a workload, within the “Application” section of workload definition, you can now also specify the AWS Service Catalog AppRegistry AWS Resource Name (ARN). This field is to indicate a relationship between the AWS Well-Architected Tool workload and the AWS resources in an AppRegistry Application when performing a Well-Architected Framework Review (Figure 4).

    Application field to select AWS Service Catalog AppRegistry ARN

    Figure 4. Application field to select AWS Service Catalog AppRegistry ARN

    This is another new AWS Well-Architected Tool feature that launched along with the integration with Trusted Advisor feature. You can find out more details about the integration with AWS Service Catalog AppRegistry in the What’s New post and on the feature documentation page. For details on how to create an AWS Service Catalog AppRegistry Application refer to Creating applications.

  2. To enable the integration with Trusted Advisor, after the necessary workload information has been entered, within the “AWS Trusted Advisor” section, tick on “Activate Trusted Advisor” (Figure 5).
    Enabling the Trusted Advisor feature

    Figure 5. Enabling the AWS Trusted Advisor feature

    Optional: Once the workload is created, note the workload ARN. You can find the workload ARN in the Properties section of the workload resource you created (Figure 6). For steps on how to identify your workload, refer to Well-Architected Tool User Guide on viewing a workload.

    AWS Well-Architected Tool showing workload ARN

    Figure 6. AWS Well-Architected Tool showing workload ARN

  3. To collect Trusted Advisor checks from accounts other than the account where the workload you are reviewing exists, you must perform two steps. You need to ensure the account IDs are listed in the workload properties for the workload you are reviewing. You must then create an IAM role in the account from which Trusted Advisor checks will be collected with the following permission and trust relationship (Figures 7 and 8). For more information on how to setup this permission, refer to the feature documentation.
    Permissions needed by AWS Well-Architected Tool to interrogate AWS Trusted Advisor

    Figure 7. Permissions needed by AWS Well-Architected Tool to interrogate AWS Trusted Advisor

    The trust relationship allowing AWS Well-Architected Tool to assume policy on behalf of the workload

    Figure 8. The trust relationship allowing AWS Well-Architected Tool to assume policy on behalf of the workload

Using integration with AWS Trusted Advisor for insights during reviews

Once the feature is enabled, additional insights will be noticeable about the resources in your workload using Trusted Advisor checks. Let’s explore an example question. In this case, we will use Question 9 from the Reliability Pillar, as there are Trusted Advisor checks related to the best practices in it: How do you back up data?

  1. AWS Well-Architected Reliability Question 9 includes best practices that are related to how workload backup is performed to support the ability for the workload to recover from failure. Current findings using Trusted Advisor checks indicates the workload may not be configured based on the “Perform data backup automatically” best practice in the Reliability Pillar (Figure 9).

    "Perform data backup automatically" best practices

    Figure 9. “Perform data backup automatically” best practices

  2. To access Trusted Advisor checks as insights, you can select a question in the Well-Architected Tool (Figure 10). If there are related Trusted Advisor checks available for a question, there will be a “View checks” button like the screenshot below. You can also select the “Trusted Advisor checks” tab.

    Trusted Advisor checks that map to best practices

    Figure 10. AWS Trusted Advisor checks that map to best practices

  3. Trusted Advisor checks are available, which provide insights related to the best practice in the question. You will also notice the state of resources recommendations and the count of resources. Trusted Advisor checks that relate to the best practice “Perform data backup automatically” are displayed. One of the Trusted Advisor checks identified with a x in a circle (denoting “Action recommended”) status is on the Amazon Elastic Block Storage (Amazon EBS) snapshots availability to recover your EBS volume from in the event of disaster (Figure 11).

    AWS Trusted Advisor check for Amazon EBS snapshots with "Action recommended"

    Figure 11. AWS Trusted Advisor check for Amazon EBS snapshots with “Action recommended”

  4. Exploring the Trusted Advisor Console, you can identify the EBS volume ID that has been detected with no snapshot in this us-west-2 region (Figure 12).

    An EBS volume that does not have snapshots

    Figure 12. An EBS volume that does not have snapshots

  5. With the insights from Trusted Advisor, we can quickly determine that the “Perform data backup automatically” best practice is not in place, as we do not have Amazon EBS snapshots enabled. Through the “helpful resources” section, instructions can be found to help automate the snapshot creation of Amazon EBS volume (Figure 13). One method to achieve this is to use AWS Backup.

    Resources with details about best practices, including links to learn more

    Figure 13. Resources with details about best practices, including links to learn more

  6. Using AWS Backup you can define a backup plan to automate snapshots creation of the EBS volume. Using this plan, you adjust the frequency of the backup to help achieve your recovery time objective and recovery point objective (Figure 14). For more information on how to configure EBS volume backup plan, refer to the Developer Guide on creating a backup plan.

    Setup automatic Amazon EBS volume snapshots

    Figure 14. Setup automatic Amazon EBS volume snapshots

  7. Once this improvement is implemented and the related EBS volume snapshot is taken, Trusted Advisor will reflect the changes to the resource (Figure 15).

    Amazon EBS volume with a snapshot

    Figure 15. Amazon EBS volume with a snapshot

  8. The next time we perform a Well-Architected Framework Review on this workload, the related AWS Trusted Advisor Check will show no action required with a check-mark status (Figure 16).
    AWS Trusted Advisor checks that represent improvements that have been implemented

    Figure 16. AWS Trusted Advisor checks that represent improvements that have been implemented

    Optional: For access to the list of Trusted Advisor checks in .csv format, you can click on the “Download check details” button on each question to download the resources that were checked in relation to the specified best practices (Figure 17).

    "Download check details" button

    Figure 17. “Download check details” button

  9. Once implemented, this improvement ensures a means to recover the EBS volume data in the event of disaster. This makes the resources in the workload better aligned to the AWS Reliability Pillar Design principle of “Automatically recover from failure”. To reflect this alignment in the Well-Architected Tool, you can tick on the best practice check items under the related questions (Figure 18).

    A milestone with updated best practices based on improvements that have been implemented

    Figure 18. A milestone with updated best practices based on improvements that have been implemented

  10. Finally, you can create a milestone to capture a point in time state of your workload WAFR. As you continuously optimize with more WAFRs and improvements, the number of high- and medium-risk items identified within each review will decrease. You will notice the continuous optimization of your workload over time, as in Figure 19.

    The history of improvements being made over time

    Figure 19. The history of improvements being made over time

Conclusion

Using the AWS Well-Architected integration with AWS Trusted Advisor, customers have a mechanism to accelerate the “learn, measure, and improve” Well-Architected virtuous cycle, creating an optimization flywheel. We have demonstrated the value of creating acceleration through the insights from Trusted Advisor checks. You now know how to enable the integration with Trusted Advisor and have seen an example of how the insights can accelerate your review cycle. You will notice the improvements you make over time will reflect in the Trusted Advisor checks as you review the milestones for your workloads. Enable this feature on your next Well-Architected Framework Review (WAFR) to measure the impact that data-driven insights from Trusted Advisor can have on reducing the time-to-value for your reviews. For more information consider these additional resources. You can contact your account team for support in running WAFRs or check out the AWS Well-Architected Partner Program to find a partner that can help you run a review. Additionally, running a WAFR with a partner assisting you in remediating risks may also provide funding credits to offset the costs required to make the improvements.

“Perform data backup automatically” is part of the Reliability Pillar of the AWS Well-Architected Framework. AWS Well-Architected is a set of guiding design principles developed by AWS to help organizations build secure, high-performing, resilient, and efficient infrastructure for a variety of applications and workloads. Use the AWS Well-Architected Tool to review your workloads periodically to address important design considerations and ensure that they follow the best practices and guidance of the AWS Well-Architected Framework. For follow up questions or comments, join our growing community on AWS re:Post.


Deploying IBM Cloud Pak for integration on Red Hat OpenShift Service on AWS

Post Syndicated from Eduardo Monich Fronza original https://aws.amazon.com/blogs/architecture/deploying-ibm-cloud-pak-for-integration-on-red-hat-openshift-service-on-aws/

Customers across many industries use IBM integration software, such as IBM MQ, DataPower, API Connect, and App Connect, as the backbone that integrates and orchestrates their business-critical workloads.

These customers often tell Amazon Web Services (AWS), they want to migrate their applications to AWS Cloud, as part of their business strategy: to lower costs, gain agility, and innovate faster.

In this blog, we will explore how customers, who are looking at ways to run IBM software on AWS, can use Red Hat OpenShift Service on AWS (ROSA) to deploy IBM Cloud Pak for Integration (CP4I) with modernized versions of IBM integration products.

As ROSA is a fully managed OpenShift service that is jointly supported by AWS and Red Hat, plus managed by Red Hat site reliability engineers, customers benefit from not having to manage the lifecycle of Red Hat OpenShift Container Platform (OCP) clusters.

This post explains the steps to:

  • Create a ROSA cluster
  • Configure persistent storage
  • Install CP4I and the IBM MQ 9.3 operator

Cloud Pak for integration architecture

In this blog, we are implementing a highly available ROSA cluster with three Availability Zones (AZ), three master nodes, three infrastructure nodes, and three worker nodes.

Review the AWS documentation for Regions and AZs and the regions where ROSA is available to choose the best region for your deployment.

Figure 1 demonstrates the solution’s architecture.

IBM Cloud Pak for Integration on ROSA architecture

Figure 1. IBM Cloud Pak for Integration on ROSA architecture

In our scenario, we are building a public ROSA cluster, with an internet-facing Classic Load Balancer providing access to Ports 80 and 443. Consider using a ROSA private cluster when you are deploying CP4I in your AWS account.

We are using Amazon Elastic File System (Amazon EFS) and Amazon Elastic Block Store (Amazon EBS) for our cluster’s persistent storage. Review the IBM CP4I documentation for information about supported AWS storage options.

Review AWS prerequisites for ROSA and AWS Security best practices in IAM documentation, before deploying CP4I for production workloads, to protect your AWS account and resources.

Cost

You are responsible for the cost of the AWS services used when deploying CP4I in your AWS account. For cost estimates, see the pricing pages for each AWS service you use.

Prerequisites

Before getting started, review the following prerequisites:

Installation steps

To deploy CP4I on ROSA, complete the following steps:

  1. From the AWS ROSA console, click Enable ROSA to active the service on your AWS account (Figure 2).

    Enable ROSA on your AWS account

    Figure 2. Enable ROSA on your AWS account

  2. Create an AWS Cloud9 environment to run your CP4I installation. We used a t3.small instance type.
  3. When it comes up, close the Welcome tab and open a new Terminal tab to install the required packages:
    curl "https://awscli.amazonaws.com/awscli-exe-linux-x86_64.zip" -o "awscliv2.zip"
    unzip awscliv2.zip
    sudo ./aws/install
    wget https://mirror.openshift.com/pub/openshift-v4/clients/rosa/latest/rosa-linux.tar.gz
    sudo tar -xvzf rosa-linux.tar.gz -C /usr/local/bin/
    
    rosa download oc
    sudo tar -xvzf openshift-client-linux.tar.gz -C /usr/local/bin/
    
    sudo yum -y install jq gettext
  4. Ensure the ELB service-linked role exists in your AWS account:
    aws iam get-role --role-name 
    "AWSServiceRoleForElasticLoadBalancing" || aws iam create-service-linked-role --aws-service-name 
    "elasticloadbalancing.amazonaws.com"
  5. Create an IAM policy named cp4i-installer-permissions with the following permissions:
    {
        "Version": "2012-10-17",
        "Statement": [
            {
                "Effect": "Allow",
                "Action": [
                    "autoscaling:*",
                    "cloudformation:*",
                    "cloudwatch:*",
                    "ec2:*",
                    "elasticfilesystem:*",
                    "elasticloadbalancing:*",
                    "events:*",
                    "iam:*",
                    "kms:*",
                    "logs:*",
                    "route53:*",
                    "s3:*",
                    "servicequotas:GetRequestedServiceQuotaChange",
                    "servicequotas:GetServiceQuota",
                    "servicequotas:ListServices",
                    "servicequotas:ListServiceQuotas",
                    "servicequotas:RequestServiceQuotaIncrease",
                    "sts:*",
                    "support:*",
                    "tag:*"
                ],
                "Resource": "*"
            }
        ]
    }
  6. Create an IAM role:
    1. Select AWS service and EC2, then click Next: Permissions.
    2. Select the cp4i-installer-permissions policy, and click Next.
    3. Name it cp4i-installer, and click Create role.
  7. From your AWS Cloud9 IDE, click the grey circle button on the top right, and select Manage EC2 Instance (Figure 3).

    Manage the AWS Cloud9 EC2 instance

    Figure 3. Manage the AWS Cloud9 EC2 instance

  8. On the Amazon EC2 console, select the AWS Cloud9 instance, then choose Actions / Security / Modify IAM Role.
  9. Choose cp4i-installer from the IAM Role drop down, and click Update IAM role (Figure 4).

    Attach the IAM role to your workspace

    Figure 4. Attach the IAM role to your workspace

  10. Update the IAM settings for your AWS Cloud9 workspace:
    aws cloud9 update-environment --environment-id $C9_PID --managed-credentials-action DISABLE
    rm -vf ${HOME}/.aws/credentials
  11. Configure the following environment variables:
    export ACCOUNT_ID=$(aws sts get-caller-identity --output text --query Account)
    export AWS_REGION=$(curl -s 169.254.169.254/latest/dynamic/instance-identity/document | jq -r '.region')
    export ROSA_CLUSTER_NAME=cp4iblog01
  12. Configure the aws cli default region:
    aws configure set default.region ${AWS_REGION}
  13. Navigate to the Red Hat Hybrid Cloud Console, and copy your OpenShift Cluster Manager API Token.
  14. Use the token and log in to your Red Hat account:
    rosa login --token=<your_openshift_api_token>
  15. Verify that your AWS account satisfies the quotas to deploy your cluster:
    rosa verify quota
  16. When deploying ROSA for the first time, create the account-wide roles:
    rosa create account-roles --mode auto --yes
  17. Create your ROSA cluster:
    rosa create cluster --cluster-name $ROSA_CLUSTER_NAME --sts \
      --multi-az \
      --region $AWS_REGION \
      --version 4.10.35 \
      --compute-machine-type m5.4xlarge \
      --compute-nodes 3 \
      --operator-roles-prefix cp4irosa \
      --mode auto --yes \
      --watch
  18. Once your cluster is ready, create a cluster-admin user (it takes approximately 5 minutes):
    rosa create admin --cluster=$ROSA_CLUSTER_NAME
  19. Log in to your cluster using the cluster-admin credentials. You can copy the command from the output of the previous step. For example:
    oc login https://<your_cluster_api_address>:6443 \
      --username cluster-admin \
      --password <your_cluster-admin_password>
  20. Create an IAM policy allowing ROSA to use Amazon EFS:
    cat <<EOF > $PWD/efs-policy.json
    {
      "Version": "2012-10-17",
      "Statement": [
     {
       "Effect": "Allow",
       "Action": [
         "elasticfilesystem:DescribeAccessPoints",
         "elasticfilesystem:DescribeFileSystems"
       ],
       "Resource": "*"
     },
     {
       "Effect": "Allow",
       "Action": [
         "elasticfilesystem:CreateAccessPoint"
       ],
       "Resource": "*",
       "Condition": {
         "StringLike": {
           "aws:RequestTag/efs.csi.aws.com/cluster": "true"
         }
       }
     },
     {
       "Effect": "Allow",
       "Action": "elasticfilesystem:DeleteAccessPoint",
       "Resource": "*",
       "Condition": {
         "StringEquals": {
           "aws:ResourceTag/efs.csi.aws.com/cluster": "true"
         }
       }
     }
      ]
    }
    EOF
    POLICY=$(aws iam create-policy --policy-name "${ROSA_CLUSTER_NAME}-cp4i-efs-csi" --policy-document file://$PWD/efs-policy.json --query 'Policy.Arn' --output text) || POLICY=$(aws iam list-policies --query 'Policies[?PolicyName==`cp4i-efs-csi`].Arn' --output text)
  21. Create an IAM trust policy:
    export OIDC_PROVIDER=$(oc get authentication.config.openshift.io cluster -o json | jq -r .spec.serviceAccountIssuer| sed -e "s/^https:\/\///")
    cat <<EOF > $PWD/TrustPolicy.json
    {
      "Version": "2012-10-17",
      "Statement": [
     {
       "Effect": "Allow",
       "Principal": {
         "Federated": "arn:aws:iam::${ACCOUNT_ID}:oidc-provider/${OIDC_PROVIDER}"
       },
       "Action": "sts:AssumeRoleWithWebIdentity",
       "Condition": {
         "StringEquals": {
           "${OIDC_PROVIDER}:sub": [
             "system:serviceaccount:openshift-cluster-csi-drivers:aws-efs-csi-driver-operator",
             "system:serviceaccount:openshift-cluster-csi-drivers:aws-efs-csi-driver-controller-sa"
           ]
         }
       }
     }
      ]
    }
    EOF
  22. Create an IAM role with the previously created policies:
    ROLE=$(aws iam create-role \
      --role-name "${ROSA_CLUSTER_NAME}-aws-efs-csi-operator" \
      --assume-role-policy-document file://$PWD/TrustPolicy.json \
      --query "Role.Arn" --output text)
    aws iam attach-role-policy \
      --role-name "${ROSA_CLUSTER_NAME}-aws-efs-csi-operator" \
      --policy-arn $POLICY
  23. Create an OpenShift secret to store the AWS access keys:
    cat <<EOF | oc apply -f -
    apiVersion: v1
    kind: Secret
    metadata:
      name: aws-efs-cloud-credentials
      namespace: openshift-cluster-csi-drivers
    stringData:
      credentials: |-
        [default]
        role_arn = $ROLE
        web_identity_token_file = /var/run/secrets/openshift/serviceaccount/token
    EOF
  24. Install the Amazon EFS CSI driver operator:
    cat <<EOF | oc create -f -
    apiVersion: operators.coreos.com/v1
    kind: OperatorGroup
    metadata:
      generateName: openshift-cluster-csi-drivers-
      namespace: openshift-cluster-csi-drivers
    ---
    apiVersion: operators.coreos.com/v1alpha1
    kind: Subscription
    metadata:
      labels:
        operators.coreos.com/aws-efs-csi-driver-operator.openshift-cluster-csi-drivers: ""
      name: aws-efs-csi-driver-operator
      namespace: openshift-cluster-csi-drivers
    spec:
      channel: stable
      installPlanApproval: Automatic
      name: aws-efs-csi-driver-operator
      source: redhat-operators
      sourceNamespace: openshift-marketplace
    EOF
  25. Track the operator installation:
    watch oc get deployment aws-efs-csi-driver-operator \
     -n openshift-cluster-csi-drivers
  26. Install the AWS EFS CSI driver:
    cat <<EOF | oc apply -f -
    apiVersion: operator.openshift.io/v1
    kind: ClusterCSIDriver
    metadata:
      name: efs.csi.aws.com
    spec:
      managementState: Managed
    EOF
  27. Wait until the CSI driver is running:
    watch oc get daemonset aws-efs-csi-driver-node \
     -n openshift-cluster-csi-drivers
  28. Create a rule allowing inbound NFS traffic from your cluster’s VPC Classless Inter-Domain Routing (CIDR):
    NODE=$(oc get nodes --selector=node-role.kubernetes.io/worker -o jsonpath='{.items[0].metadata.name}')
    VPC_ID=$(aws ec2 describe-instances --filters "Name=private-dns-name,Values=$NODE" --query 'Reservations[*].Instances[*].{VpcId:VpcId}' | jq -r '.[0][0].VpcId')
    CIDR=$(aws ec2 describe-vpcs --filters "Name=vpc-id,Values=$VPC_ID" --query 'Vpcs[*].CidrBlock' | jq -r '.[0]')
    SG=$(aws ec2 describe-instances --filters "Name=private-dns-name,Values=$NODE" --query 'Reservations[*].Instances[*].{SecurityGroups:SecurityGroups}' | jq -r '.[0][0].SecurityGroups[0].GroupId')
    aws ec2 authorize-security-group-ingress \
      --group-id $SG \
      --protocol tcp \
      --port 2049 \
      --cidr $CIDR | jq .
  29. Create an Amazon EFS file system:
    EFS_FS_ID=$(aws efs create-file-system --performance-mode generalPurpose --encrypted --region ${AWS_REGION} --tags Key=Name,Value=ibm_cp4i_fs | jq -r '.FileSystemId')
    SUBNETS=($(aws ec2 describe-subnets --filters "Name=vpc-id,Values=${VPC_ID}" "Name=tag:Name,Values=*${ROSA_CLUSTER_NAME}*private*" | jq --raw-output '.Subnets[].SubnetId'))
    for subnet in ${SUBNETS[@]}; do
      aws efs create-mount-target \
        --file-system-id $EFS_FS_ID \
        --subnet-id $subnet \
        --security-groups $SG
    done
  30. Create an Amazon EFS storage class:
    cat <<EOF | oc apply -f -
    kind: StorageClass
    apiVersion: storage.k8s.io/v1
    metadata:
      name: efs-sc
    provisioner: efs.csi.aws.com
    parameters:
      provisioningMode: efs-ap
      fileSystemId: $EFS_FS_ID
      directoryPerms: "750"
      gidRangeStart: "1000"
      gidRangeEnd: "2000"
      basePath: "/ibm_cp4i_rosa_fs"
    EOF
  31. Add the IBM catalog sources to OpenShift:
    cat <<EOF | oc apply -f -
    apiVersion: operators.coreos.com/v1alpha1
    kind: CatalogSource
    metadata:
      name: ibm-operator-catalog
      namespace: openshift-marketplace
    spec:
      displayName: IBM Operator Catalog
      image: 'icr.io/cpopen/ibm-operator-catalog:latest'
      publisher: IBM
      sourceType: grpc
      updateStrategy:
        registryPoll:
          interval: 45m
    EOF
  32. Get the console URL of your ROSA cluster:
    rosa describe cluster --cluster=$ROSA_CLUSTER_NAME | grep Console
  33. Copy your entitlement key from the IBM container software library.
  34. Log in to your ROSA web console, navigate to Workloads > Secrets.
  35. Set the project to openshift-config; locate and click pull-secret (Figure 5).

    Edit the pull-secret entry

    Figure 5. Edit the pull-secret entry

  36. Expand Actions and click Edit Secret.
  37. Scroll to the end of the page, and click Add credentials (Figure 6):
    1. Registry server address: cp.icr.io
    2. Username field: cp
    3. Password: your_ibm_entitlement_key

      Configure your IBM entitlement key secret

      Figure 6. Configure your IBM entitlement key secret


  38. Next, navigate to Operators > OperatorHub. On the OperatorHub page, use the search filter to locate the tile for the operators you plan to install: IBM Cloud Pak for Integration and IBM MQ. Keep all values as default for both installations (Figure 7). For example, IBM Cloud Pak for Integration:

    Figure 7. Install CP4I operators

    Figure 7. Install CP4I operators

  39. Create a namespace for each CP4I workload that will be deployed. In this blog, we’ve created for the platform UI and IBM MQ:
    oc new-project integration
    oc new-project ibm-mq
  40. Review the IBM documentation to select the appropriate license for your deployment.
  41. Deploy the platform UI:
    cat <<EOF | oc apply -f -
    apiVersion: integration.ibm.com/v1beta1
    kind: PlatformNavigator
    metadata:
      name: integration-quickstart
      namespace: integration
    spec:
      license:
        accept: true
        license: L-RJON-CD3JKX
      mqDashboard: true
      replicas: 3  # Number of replica pods, 1 by default, 3 for HA
      storage:
        class: efs-sc
      version: 2022.2.1
    EOF
  42. Track the deployment status, which takes approximately 40 minutes:
    watch oc get platformnavigator -n integration
  43. Create an IBM MQ queue manager instance:
    cat <<EOF | oc apply -f -
    apiVersion: mq.ibm.com/v1beta1
    kind: QueueManager
    metadata:
      name: qmgr-inst01
      namespace: ibm-mq
    spec:
      license:
        accept: true
        license: L-RJON-CD3JKX
        use: NonProduction
      web:
        enabled: true
      template:
        pod:
          containers:
            - env:
                - name: MQSNOAUT
                  value: 'yes'
              name: qmgr
      queueManager:
        resources:
          limits:
            cpu: 500m
          requests:
            cpu: 500m
        availability:
          type: SingleInstance
        storage:
          queueManager:
            type: persistent-claim
            class: gp3
            deleteClaim: true
            size: 2Gi
          defaultClass: gp3
        name: CP4IQMGR
      version: 9.3.0.1-r1
    EOF
  44. Check the status of the queue manager:
    oc describe queuemanager qmgr-inst01 -n ibm-mq

Validation steps

Let’s verify our installation!

  1. Run the commands to retrieve the CP4I URL and administrator password:
    oc describe platformnavigator integration-quickstart \
      -n integration | grep "^.*UI Endpoint" | xargs | cut -d ' ' -f3
    oc get secret platform-auth-idp-credentials \
      -n ibm-common-services -o jsonpath='{.data.admin_password}' \
      | base64 -d && echo
  2. Using the information from the previous step, access your CP4I web console.
  3. Select the option to authenticate with the IBM provided credentials (admin only) to login with your admin password.
  4. From the CP4I console, you can manage users and groups allowed to access the platform, install new operators, and view the components that are installed.
  5. Click qmgr-inst01 in the Messaging widget to bring up your IBM MQ setup (Figure 8).

    CP4I console features

    Figure 8. CP4I console features

  6. In the Welcome to IBM MQ panel, click the CP4IQMGR queue manager. This shows the state, resources, and allows you to configure your instances (Figure 9).

    Queue manager details

    Figure 9. Queue manager details

Congratulations! You have successfully deployed IBM CP4I on Red Hat OpenShift on AWS.

Post installation

Review the following topics, when you are installing CP4I on production environments:

Cleanup

Connect to your Cloud9 workspace, and run the following steps to delete the CP4I installation, including ROSA. This avoids incurring future charges on your AWS account:

EFS_EF_ID=$(aws efs describe-file-systems \
  --query 'FileSystems[?Name==`ibm_cp4i_fs`].FileSystemId' \
  --output text)
MOUNT_TARGETS=$(aws efs describe-mount-targets --file-system-id $EFS_EF_ID --query 'MountTargets[*].MountTargetId' --output text)
for mt in ${MOUNT_TARGETS[@]}; do
  aws efs delete-mount-target --mount-target-id $mt
done
aws efs delete-file-system --file-system-id $EFS_EF_ID

rosa delete cluster -c $ROSA_CLUSTER_NAME --yes --region $AWS_REGION

Monitor your cluster uninstallation logs, run:

rosa logs uninstall -c $ROSA_CLUSTER_NAME --watch

Once the cluster is uninstalled, remove the operator-roles and oidc-provider, as informed in the output of the rosa delete command. For example:

rosa delete operator-roles -c 1vepskr2ms88ki76k870uflun2tjpvfs --mode auto –yes
rosa delete oidc-provider -c 1vepskr2ms88ki76k870uflun2tjpvfs --mode auto --yes

Conclusion

This post explored how to deploy CP4I on AWS ROSA. We also demonstrated how customers can take full advantage of managed OpenShift service, focusing on further modernizing application stacks by using AWS managed services (like ROSA) for their application deployments.

If you are interested in learning more about ROSA, take part in the AWS ROSA Immersion Workshop.

Check out the blog on Running IBM MQ on AWS using High-performance Amazon FSx for NetApp ONTAP to learn how to use Amazon FSx for NetApp ONTAP for distributed storage and high availability with IBM MQ.

For more information and getting started with IBM Cloud Pak deployments, visit the AWS Marketplace for new offerings.

Further reading

Optimize your modern data architecture for sustainability: Part 1 – data ingestion and data lake

Post Syndicated from Sam Mokhtari original https://aws.amazon.com/blogs/architecture/optimize-your-modern-data-architecture-for-sustainability-part-1-data-ingestion-and-data-lake/

The modern data architecture on AWS focuses on integrating a data lake and purpose-built data services to efficiently build analytics workloads, which provide speed and agility at scale. Using the right service for the right purpose not only provides performance gains, but facilitates the right utilization of resources. Review Modern Data Analytics Reference Architecture on AWS, see Figure 1.

In this series of two blog posts, we will cover guidance from the Sustainability Pillar of the AWS Well-Architected Framework on optimizing your modern data architecture for sustainability. Sustainability in the cloud is an ongoing effort focused primarily on energy reduction and efficiency across all components of a workload. This will achieve the maximum benefit from the resources provisioned and minimize the total resources required.

Modern data architecture includes five pillars or capabilities: 1) data ingestion, 2) data lake, 3) unified data governance, 4) data movement, and 5) purpose-built analytics. In the first part of this blog series, we will focus on the data ingestion and data lake pillars of modern data architecture. We’ll discuss tips and best practices that can help you minimize resources and improve utilization.

Modern Data Analytics Reference Architecture on AWS

Figure 1. Modern Data Analytics Reference Architecture on AWS

1. Data ingestion

The data ingestion process in modern data architecture can be broadly divided into two main categories: batch, and real-time ingestion modes.

To improve the data ingestion process, see the following best practices:

Avoid unnecessary data ingestion

Work backwards from your business needs and establish the right datasets you’ll need. Evaluate if you can avoid ingesting data from source systems by using existing publicly available datasets in AWS Data Exchange or Open Data on AWS. Using these cleaned and curated datasets will help you to avoid duplicating the compute and storage resources needed to ingest this data.

Reduce the size of data before ingestion

When you design your data ingestion pipelines, use strategies such as compression, filtering, and aggregation to reduce the size of ingested data. This will permit smaller data sizes to be transferred over network and stored in the data lake.

To extract and ingest data from data sources such as databases, use change data capture (CDC) or date range strategies instead of full-extract ingestion. Use AWS Database Migration Service (DMS) transformation rules to selectively include and exclude the tables (from schema) and columns (from wide tables, for example) for ingestion.

Consider event-driven serverless data ingestion

Adopt an event-driven serverless architecture for your data ingestion so it only provisions resources when work needs to be done. For example, when you use AWS Glue jobs and AWS Step Functions for data ingestion and pre-processing, you pass the responsibility and work of infrastructure optimization to AWS.

2. Data lake

Amazon Simple Storage Service (S3) is an object storage service which customers use to store any type of data for different use cases as a foundation for a data lake. To optimize data lakes on Amazon S3, follow these best practices:

Understand data characteristics

Understand the characteristics, requirements, and access patterns of your workload data in order to optimally choose the right storage tier. You can classify your data into categories shown in Figure 2, based on their key characteristics.

Data Characteristics

Figure 2. Data Characteristics

Adopt sustainable storage options

Based on your workload data characteristics, use the appropriate storage tier to reduce the environmental impact of your workload, as shown in Figure 3.

Storage tiering on Amazon S3

Figure 3. Storage tiering on Amazon S3

Implement data lifecycle policies aligned with your sustainability goals

Based on your data classification information, you can move data to more energy-efficient storage or safely delete it. Manage the lifecycle of all your data automatically using Amazon S3 Lifecycle policies.

Amazon S3 Storage Lens delivers visibility into storage usage, activity trends, and even makes recommendations for improvements. This information can be used to lower the environmental impact of storing information on S3.

Select efficient file formats and compression algorithms

Use efficient file formats such as Parquet, where a columnar format provides opportunities for flexible compression options and encoding schemes. Parquet also enables more efficient aggregation queries, as you can skip over the non-relevant data. Using an efficient way of storage and accessing data is translated into higher performance with fewer resources.

Compress your data to reduce the storage size. Remember, you will need to trade off compression level (storage saved on disk) against the compute effort required to compress and decompress. Choosing the right compression algorithm can be beneficial as well. For instance, ZStandard (zstd) provides a better compression ratio compared with LZ4 or GZip.

Use data partitioning and bucketing

Partitioning and bucketing divides your data and keeps related data together. This can help reduce the amount of data scanned per query, which means less compute resources needed to service the workload.

Track and assess the improvement for environmental sustainability

The best way for customers to evaluate success in optimizing their workloads for sustainability is to use proxy measures and unit of work KPIs. For storage, this is GB per transaction, and for compute, it would be vCPU minutes per transaction. To use proxy measures to optimize workloads for energy efficiency, read Sustainability Well-Architected Lab on Turning the Cost and Usage Report into Efficiency Reports.

In Table 1, we have listed certain metrics to use as a proxy metric to measure specific improvements. These fall under each pillar of modern data architecture covered in this post. This is not an exhaustive list, you could use numerous other metrics to spot inefficiencies. Remember, just tracking one metric may not explain the impact on sustainability. Use an analytical exercise of combining the metric with data, type of attributes, type of workload, and other characteristics.

Pillar Metrics
Data ingestion
Data lake

Table 1. Metrics for the Modern data architecture pillars

Conclusion

In this post, we have provided guidance and best practices to help reduce the environmental impact of the data ingestion and data lake pillars of modern data architecture.

In the next post, we will cover best practices for sustainability for the unified governance, data movement, and purpose-built analytics and insights pillars.

Further reading:

How Wego secured developer connectivity to Amazon Relational Database Service instances

Post Syndicated from Adriaan de Jonge original https://aws.amazon.com/blogs/architecture/how-wego-secured-developer-connectivity-to-amazon-relational-database-service-instances/

How do you securely access Amazon Relational Database Service (Amazon RDS) instances from a developer’s laptop? Online travel marketplace, Wego, shares their journey from bastion hosts in the public subnet to lightweight VPN tunnels on top of Session Manager, a capability of AWS Systems Manager, using temporary access keys.

In this post, we explore how developers get access to allow-listed resources in their virtual private cloud (VPC) directly from their workstation, by tunnelling VPN over secure shell (SSH), which, in turn, is tunneled over Session Manager.

Note: This blog post is not intended as a step-by-step, how-to guide. Commands stated here are for illustrative purposes and may need customization.

Wego’s architecture before starting this journey

In 2021, Wego’s developer connectivity architecture was based on jump hosts in a public subnet, as illustrated in Figure 1.

Original Wego architecture

Figure 1. Original Wego architecture

Figure 1 demonstrates a network architecture with both public and private subnets. The public subnet contains an Amazon Elastic Compute Cloud (Amazon EC2) instance that serves as jump host. The diagram illustrates a VPN tunnel between the developer’s desktop and the VPC.

In Wego’s previous architecture, the jump host was connected to the internet for terminal access through the secure shell (SSH) protocol, which accepts traffic at Port 22. Despite restrictions to the allowed source IP addresses, exposing Port 22 to the internet can increase the likeliness of a security breach; it is possible to spoof (mimic) an allowed IP address and attempt a denial of service attack.

Moving the jump host to a private subnet with Session Manager

Session Manager helps minimize the likeliness of a security breach. Figure 2 demonstrates how Wego moved the jump host from a public subnet to a private subnet. In this architecture, Session Manager serves as the main entry point for incoming network traffic.

Wego's new architecture using Session Manager

Figure 2. Wego’s new architecture using Session Manager

We will explore how developers connect to Amazon RDS directly from their workstation in this architecture.

Tunnel TCP traffic through Session Manager

Session Manager is best known for its terminal access capability, but it can also tunnel TCP connections. This is helpful if you want to access EC2 instances from your local workstation (Figure 3).

Tunneling TCP traffic over Session Manager

Figure 3. Tunneling TCP traffic over Session Manager

Here’s an example command to forward traffic from local host Port 8888 to an EC2 instance:

$ aws ssm start-session --target <instance-id> \
  --document-name AWS-StartPortForwardingSession \
  --parameters '{"portNumber":["8888"], "localPortNumber":["8888"]}'

This assumes the target EC2 instance is configured with AWS Systems Manager connectivity.

Tunnel SSH traffic over Session Manager

SSH is a protocol built on top of TCP; therefore, you can tunnel SSH traffic similarly (Figure 4).

Tunneling SSH traffic over Session Manager

Figure 4. Tunneling SSH traffic over Session Manager

To allow a short-hand notation for SSH over SSM, add the following configuration to the ~/.ssh/config configuration file:

host i-* mi-*
    ProxyCommand sh -c "aws ssm start-session --target %h \
        --document-name AWS-StartSSHSession \
        --parameters 'portNumber=%p'"

You can now connect to the EC2 instance over SSH with the following command:

ssh -i <key-file> <username>@<ec2-instance-id>

For example:

ssh -i my_key ec2-user@i-1234567890abcdef0

Ideally, your key-file is a short-lived credential, as recommended by the AWS Well-Architected Framework, as it narrows the window of opportunity for a security breach. However, it can be tedious to manage short-lived credentials. This is where EC2 Instance Connect comes to the rescue!

Replace SSH keys with EC2 Instance Connect

EC2 Instance Connect is available both on the AWS console and the command line. It makes it easier to work with short-lived keys. On the command line, it allows us to install our own temporary access credentials into a private EC2 instance for the duration of 60 seconds (Figure 5).

Connecting to SSH with temporary keys

Figure 5. Connecting to SSH with temporary keys

Ensure the EC2 instance connect plugin is installed on your workstation:

pip3 install ec2instanceconnectcli

This blog post assumes you are using Amazon Linux on the EC2 instance with all pre-requisites installed. Make sure your IAM role or user has the required permissions.

To generate a temporary SSH key pair, insert:

$ ssh-keygen -t rsa -f my_key
$ ssh-add my_key

To install the public key into the EC2 instance, insert:

$ aws ec2-instance-connect send-ssh-public-key \
  --instance-id <instance-id> \
  --instance-os-user <username> \
  --ssh-public-key <location ssh key public key> \
  --availability-zone <availabilityzone> \
  --region <region>

For example:

$ aws ec2-instance-connect send-ssh-public-key \
  --instance-id i-1234567890abcdef0 \
  --instance-os-user ec2-user \
  --ssh-public-key file://my_key.pub \
  --availability-zone ap-southeast-1b \
  --region ap-southeast-1

Connect to the EC2 instance within 60 seconds and delete the key after use.

Tunneling VPN over SSH, then over Session Manager

In this section, we adopt a third-party, open-source tool that is not supported by AWS, called sshuttle. sshuttle is a transparent proxy server that works as a VPN over SSH. It is based on Python and released under the LGPL 2.1 license. It runs across a wide range of Linux distributions and on macOS (Figure 6).

Tunneling VPN over SSH over Session Manager

Figure 6. Tunneling VPN over SSH over Session Manager

Why do we need to tunnel VPN over SSH, rather than using the earlier TCP over Session Manager? Keep in mind that the developer’s goal is to connect to Amazon RDS, not Amazon EC2. The SSM tunnel only works for connections to EC2 instances, not Amazon RDS.

A lightweight VPN solution, like sshuttle, bridges this gap by allowing you to forward traffic from Amazon EC2 to Amazon RDS. From the developer’s perspective, this works transparently, as if it is regular network traffic.

To install sshuttle, use one of the documented commands:

$ pip3 install sshuttle

To start sshuttle, use the following command pattern:

$ sshuttle -r <username>@<instance-id> <private CIDR range>

For example:

$ sshuttle -r ec2-user@i-1234567890abcdef0 10.0.0.0/16

Make sure the security group for the RDS DB instance allows network access from the jump host. You can now connect directly from the developer’s workstation to the RDS DB instance based on its IP address.

Advantages of this architecture

In this blog post, we layered a VPN over SSH that, in turn, is layered over Session Manager, plus we used temporary SSH keys.

Wego designed this architecture, and it was practical and stable for day-to-day use. They found that this solution runs at lower cost than AWS Client VPN and is sufficient for the use case of developers accessing online development environments.

Wego’s new architecture has a number of advantages, including:

  • More easily connecting to workloads in private and isolated subnets
  • Inbound security group rules are not required for the jump host, as Session Manager is an outbound connection
  • Access attempts are logged in AWS CloudTrail
  • Access control uses standard IAM policies, including tag-based resource access
  • Security groups and network access control lists still apply to “allow” or “deny” traffic to specific destinations
  • SSH keys are installed only temporarily for 60 seconds through EC2 Instance Connect

Conclusion

In this blog post, we explored Wego’s access patterns that can help you reduce your exposure to potential security attacks. Whether you adopt Wego’s full architecture or only adopt intermediary steps (like SSH over Session Manager and EC2 Instance Connect), reducing exposure to the public subnet and shortening the lifetime of access credentials can improve your security posture!

Further reading

What to consider when modernizing APIs with GraphQL on AWS

Post Syndicated from Lewis Tang original https://aws.amazon.com/blogs/architecture/what-to-consider-when-modernizing-apis-with-graphql-on-aws/

In the next few years, companies will build over 500 million new applications, more than has been developed in the previous 40 years combined (see IDC article). API operations enable innovation. They are the “front door” to applications and microservices, and an integral layer in the application stack. In recent years, GraphQL has emerged as a modern API approach. With GraphQL, companies can improve the performance of their applications and the speed in which development teams can build applications. In this post, we will discuss how GraphQL works and how integrating it with AWS services can help you build modern applications. We will explore the options for running GraphQL on AWS.

How GraphQL works

Imagine you have an API frontend implemented with GraphQL for your ecommerce application. As shown in Figure 1, there are different services in your ecommerce system backend that are accessible via different technologies. For example, user profile data is stored in a highly scalable NoSQL table. Orders are accessed through a REST API. The current inventory stock is checked through an AWS Lambda function. And the pricing information is in an SQL database.

How GraphQL works

Figure 1. How GraphQL works

Without using GraphQL, client applications must make multiple separate calls to each one of these services. Because each service is exposed through different API endpoints, the complexity of accessing data from the client side increases significantly. In order to get the data, you have to make multiple calls. In some cases, you might over fetch data as the data source would send you an entire payload including data you might not need. In some other circumstances, you might under fetch data as a single data source would not have all your required data.

A GraphQL API combines the data from all these different services into a single payload that the client defines based on its needs. For example, a smartphone has a smaller screen than a desktop application. A smartphone application might require less data. The data is retrieved from multiple data sources automatically. The client just sees a single constructed payload. This payload might be receiving user profile data from Amazon DynamoDB, or order details from Amazon API Gateway. Or it could involve the injection of specific fields with inventory availability and price data from AWS Lambda and Amazon Aurora.

When modernizing frontend APIs with GraphQL, you can build applications faster because your frontend developers don’t need to wait for backend service teams to create new APIs for integration. GraphQL simplifies data access by interacting with data from multiple data sources using a single API. This reduces the number of API requests and network traffic, which results in improved application performance. Furthermore, GraphQL subscriptions enable two-way communication between the backend and client. It supports publishing updates to data in real time to subscribed clients. You can create engaging applications in real time with use cases such as updating sports scores, bidding statuses, and more.

Options for running GraphQL on AWS

There are two main options for running GraphQL implementation on AWS, fully managed on AWS using AWS AppSync, and self-managed GraphQL.

I. Fully managed using AWS AppSync

The most straightforward way to run GraphQL is by using AWS AppSync, a fully managed service. AWS AppSync handles the heavy lifting of securely connecting to data sources, such as Amazon DynamoDB, and to develop GraphQL APIs. You can write business logic against these data sources by choosing code templates that implement common GraphQL API patterns. Your APIs can also interact with other AWS AppSync functionality such as caching, to improve performance. Use subscriptions to support real-time updates, and client-side data stores to keep offline devices in sync. AWS AppSync will scale automatically to support varied API request loads. You can find more details from the AWS AppSync features page.

AWS AppSync in an ecommerce system implementation

Figure 2. AWS AppSync in an ecommerce system implementation

Let’s take a closer look at this GraphQL implementation with AWS AppSync in an ecommerce system. In Figure 2, a schema is created to define types and capabilities of the desired GraphQL API. You can tie the schema to a Resolver function. The schema can either be created to mirror existing data sources, or AWS AppSync can create tables automatically based the schema definition. You can also use GraphQL features for data discovery without viewing the backend data sources.

After a schema definition is established, an AWS AppSync client can be configured with an operation request, such as a query operation. The client submits the operation request to GraphQL Proxy along with an identity context and credentials. The GraphQL Proxy passes this request to the Resolver, which maps and initiates the request payload against pre-configured AWS data services. These can be an Amazon DynamoDB table for user profile, an AWS Lambda function for inventory service, and more. The Resolver initiates calls to one or all of these services within a single API call. This minimizes CPU cycles and network bandwidth needs. The Resolver then returns the response to the client. Additionally, the client application can change data requirements in code on demand. The AWS AppSync GraphQL API will dynamically map requests for data accordingly, enabling faster prototyping and development.

II. Self-Managed GraphQL

If you want the flexibility of selecting a particular open-source project, you may choose to run your own GraphQL API layer. Apollo, graphql-ruby, Juniper, gqlgen, and Lacinia are some popular GraphQL implementations. You can leverage AWS Lambda or container services such as Amazon Elastic Container Service (ECS) and Amazon Elastic Kubernetes Services (EKS) to run GraphQL open-source implementations. This gives you the ability to fine-tune the operational characteristics of your API.

When running a GraphQL API layer on AWS Lambda, you can take advantage of the serverless benefits of automatic scaling, paying only for what you use, and not having to manage your servers. You can create a private GraphQL API using Amazon ECS, EKS, or AWS Lambda, which can only be accessed from your Amazon Virtual Private Cloud (VPC). With Apollo GraphQL open-source implementation, you can create a Federated GraphQL that allows you to combine GraphQL APIs from multiple microservices into a single API, illustrated in Figure 3. The Apollo GraphQL Federation with AWS AppSync post shows a concrete example of how to integrate an AWS AppSync API with an Apollo Federation gateway. It uses specification-compliant queries and directives.

Apollo GraphQL implementation on AWS Lambda

Figure 3. Apollo GraphQL implementation on AWS Lambda

When choosing self-managed GraphQL implementation, you have to spend time writing non-business logic code to connect data sources. You must implement authorization, authentication, and integrate other common functionalities. This can be caches to improve performance, subscriptions to support real-time updates, and client-side data stores to keep offline devices in sync. Because of these responsibilities, you have less time to focus on the business logic of application.

Similarly, backend development teams and API operators of an open-source GraphQL implementation must provision and maintain their own GraphQL servers. Remember that even with a serverless model, API developers and operators are still responsible for monitoring, performance tuning, and troubleshooting the API platform service.

Conclusion

Modernizing APIs with GraphQL gives your frontend application the ability to fetch just the data that’s needed from multiple data sources with an API call. You can build modern mobile and web applications faster, because GraphQL simplifies API management. You have flexibility to run an open-source GraphQL implementation most closely aligned with your needs on AWS Lambda, Amazon ECS, and Amazon EKS. With AWS AppSync, you can set up GraphQL quickly and increase your development velocity by reducing the amount of non-business API logic code.

Further reading:

How USAA built an Amazon S3 malware scanning solution

Post Syndicated from Jonathan Nguyen original https://aws.amazon.com/blogs/architecture/how-usaa-built-an-amazon-s3-malware-scanning-solution/

United Services Automobile Association (USAA) is a San Antonio-based insurance, financial services, banking, and FinTech company supporting millions of military members and their families. USAA has partnered with Amazon Web Services (AWS) to digitally transform and build multiple USAA solutions that help keep members safe and save members money and time.

Why build a S3 malware scanning solution?

As complex companies’ businesses continue to grow, there may be an increased need for collaboration and interactions with outside vendors. Prior to developing an Amazon Simple Storage Solution (Amazon S3) scanning solution, a security review and approval process for application teams to ingest data into an AWS Organization from external vendors’ AWS accounts may be warranted, to ensure additional threats are not being introduced. This could result in a lengthy review and exception process, and subsequently, could hinder the velocity of application teams’ collaboration with external vendors.

USAA security standards, like those of most companies, require all data from external vendors to be treated as untrusted, and therefore must be scanned by an antivirus or antimalware solution prior to being ingested by downstream processes within the AWS environment. Companies looking to automate the scanning process may want to consider a solution where all incoming external data flow through a demilitarized drop zone to be scanned, and subsequently released to downstream processes if malware and viruses are not detected.

S3 malware scanning solution overview

Dedicated AWS accounts should be provisioned for specific data classifications and used as a demilitarized zone (DMZ) for an untrusted staging area. The solution discussed in this blog uses a dedicated staging AWS account that controls the release of Amazon S3 objects to other AWS accounts within an AWS Organization. AWS accounts within an AWS Organization should follow security best practices in terms of infrastructure, networking, logging, and security. External vendors should explicitly be given limited permissions to appropriate resources in their respective staging S3 bucket.

A staging S3 bucket should have specific resource policies restricting which applications and identity and access management (IAM) principals can interact with S3 objects using object attributes, such as object tags, to determine whether an object has been scanned, and what the results of that scan are. Additional guardrails are implemented using Service Control Policies (SCP) to restrict authorized IAM principals to create or modify S3 object attributes (Figure 1).

Amazon S3 antivirus and antimalware scanning architecture workflow

Figure 1. Amazon S3 antivirus and antimalware scanning architecture workflow

  1. The external vendor copies an object to the staging S3 bucket.
  2. The staging S3 bucket has event notifications configured and generates an event.
  3. The S3 PutObject event is sent to an Object Created Amazon Simple Queue Service (Amazon SQS) queue topic.
  4. An Amazon Elastic Compute Cloud (Amazon EC2) Auto Scaling group is configured to scale based on messages in the Object Created SQS queue.
  5. An antivirus and antimalware scanning service application on the Amazon EC2 instances takes the following actions on objects within the Object Created Amazon SQS queue:
    a. Tag the S3 object with an “In Progress” status.
    b. Get the object from the Staging S3 bucket and stores it in a local ephemeral file system.
    c. Scan the copied object using antivirus or antimalware tool.
    d. Based on the antivirus or antimalware scan results, tag the S3 object with the scan results (for example, No_Malware_Detected vs. Malware_Detected).
    e. Create and publish a payload to the Object Scanned Amazon Simple Notification Service (Amazon SNS) topic, allowing application team filtering.
    f. Delete the message from the Object Created SQS queue.
  6. Application teams are subscribed to the Object Scanned SNS topic with a filter for their application.
  7. For any objects where a virus or malware is detected, a company can use its cyber threat response team to conduct a thorough analysis and take appropriate actions.

USAA built a custom anti-virus and anti-malware scanning application using EC2 instances, using a private, hardened Amazon Machine Image (AMI). For cost-efficacy purposes, the EC2 automatic scaling event can be configured based on Object Created SQS queue depth and Service Level Objective (SLO). A serverless version of an anti-virus and anti-malware solution can be used instead of an EC2 application, depending on your specific use-case and other factors. Some important factors include antivirus and antimalware tool serverless support, resource tuning and configuration requirements, and additional AWS services to manage that could possibly result in a bottleneck. If your enterprise is going with a serverless approach, you can use open-source tools such as ClamAV using Lambda functions.

In the event of an infected object, proper guardrails and response mechanisms need to be in place. USAA teams have developed playbooks to monitor the health and performance of S3 scanning solution, as well as responding to detected virus or malware.

This cloud native, event-driven solution has benefited multiple USAA application teams who have previously requested the ability to ingest data into AWS workloads from teams outside of USAA’s AWS Organization, and allowed additional capabilities and functionality to better serve their members. To enhance this solution even further, USAA’s security team plans to incorporate additional mechanisms to find specific objects that either failed or required additional processing, without having to scan all objects in the buckets. This can be accomplished by including an additional AWS Lambda function and Amazon DynamoDB table to track object metadata as objects get added to the Object Created SQS queue for processing. The metadata could possibly include information such as S3 bucket origin, S3 object key, version ID, scan status, and the original S3 event payload to replay the event into the Object Created SQS queue. The Lambda function primarily ensures the DynamoDB table is kept up to date as objects are processed, as well as handling issues for objects that may need to be reprocessed. The DynamoDB table also has time-to-live (TTL) configured to clear records as they expire from the Staging S3 bucket.

Conclusion

In this post, we reviewed how USAA’s Public Cloud Security team facilitated collaboration and interactions with external vendors and AWS workloads securely by creating a scalable solution to scan S3 objects for virus and malware prior to releasing objects downstream. The solution uses native AWS services and can be utilized for any use-cases requiring antivirus or antimalware capabilities. Because the S3 object scanning solution uses EC2 instances, you can use your existing antivirus or antimalware enterprise tool.

Verify the resilience of your workloads using Chaos Engineering

Post Syndicated from Seth Eliot original https://aws.amazon.com/blogs/architecture/verify-the-resilience-of-your-workloads-using-chaos-engineering/

The following is an early preview of new guidance to be published as part of updates to the AWS Well-Architected content:

Chaos Engineering enables us to find shortcomings before our customers find them and therefore, provides us with the opportunity to create a better customer experience. Chaos Engineering does not introduce chaos into your systems, instead, it finds the chaos that is already there. By definition, chaos experiments should be fail-safe and tolerated by the system. It is therefore key that you use tools that allow for controlled experiments. A controlled experiment has a clear scope of impact, built in rollback mechanisms, and tight integration with monitoring that provides deep insights to the impact of the experiment in real-time. Chaos Engineering allows you to inject real-world cloud provider faults that give you insights on what you need to improve in regards to observability, incident response, and architecture to be resilient against faults that you cannot predict. To help you with this journey, we have adjusted our guidance in the Well-Architected Reliability Pillar, enabling you to build more robust and resilient workloads on AWS.


Well-Architected Reliability best practice: verify the resilience of your workloads using Chaos Engineering

Chaos Engineering provides your teams with capabilities to continuously inject real world disruptions (simulations) in a controlled way at the service provider, infrastructure, workload, and component levels, with minimal to no impact to your customers. It allows your teams to learn from faults and observe, measure, and improve the resilience of your workloads, as well as validate that alerts fire and teams get notified in the case of an event. When run continuously, Chaos Engineering can highlight deficiencies in your workloads that, if left unaddressed, could negatively affect availability and operation.

Chaos Engineering is the discipline of experimenting on a system in order to build confidence in the system’s capability to withstand turbulent conditions in production. – Principles of Chaos Engineering

If a system is able to withstand these disruptions, the chaos experiment should be maintained as an automated regression test. In this way, chaos experiments should be run as part of your software development lifecycle (SDLC) and as part of your CI/CD pipeline.

To ensure that your workload can survive component failure, inject real-world events as part of your experiments. For example, experiment with the loss of EC2 instances or failover of the primary Amazon RDS database instance, and verify that your workload is not impacted (or only minimally impacted). Use a combination of component faults to simulate events that may be caused by a disruption in an Availability Zone.

For application-level faults (such as crashes), you can start with stressors such as memory and CPU exhaustion.

To validate fallback or failover mechanisms for external dependencies due to intermittent network disruptions, your components should simulate such an event by blocking access to the third-party providers for a specified duration that might last from seconds to hours.

Other modes of degradation might cause reduced functionality and slow responses, often resulting in a disruption of your services. Common sources of this type of degradation are increased latency on critical services and unreliable network communication (dropped packets). Experiments with these faults, including networking effects such as latency, dropped messages, and DNS failures, could include the inability to resolve a name, reach the DNS service, or establish connections to dependent services.

Chaos Engineering tools

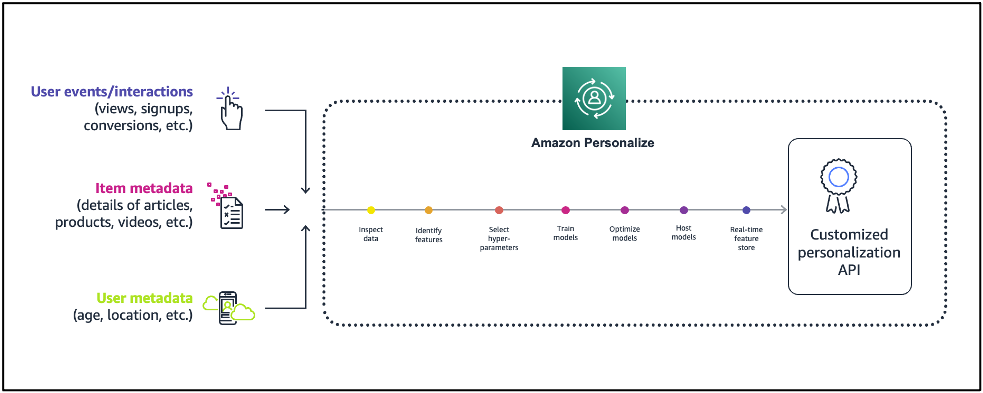
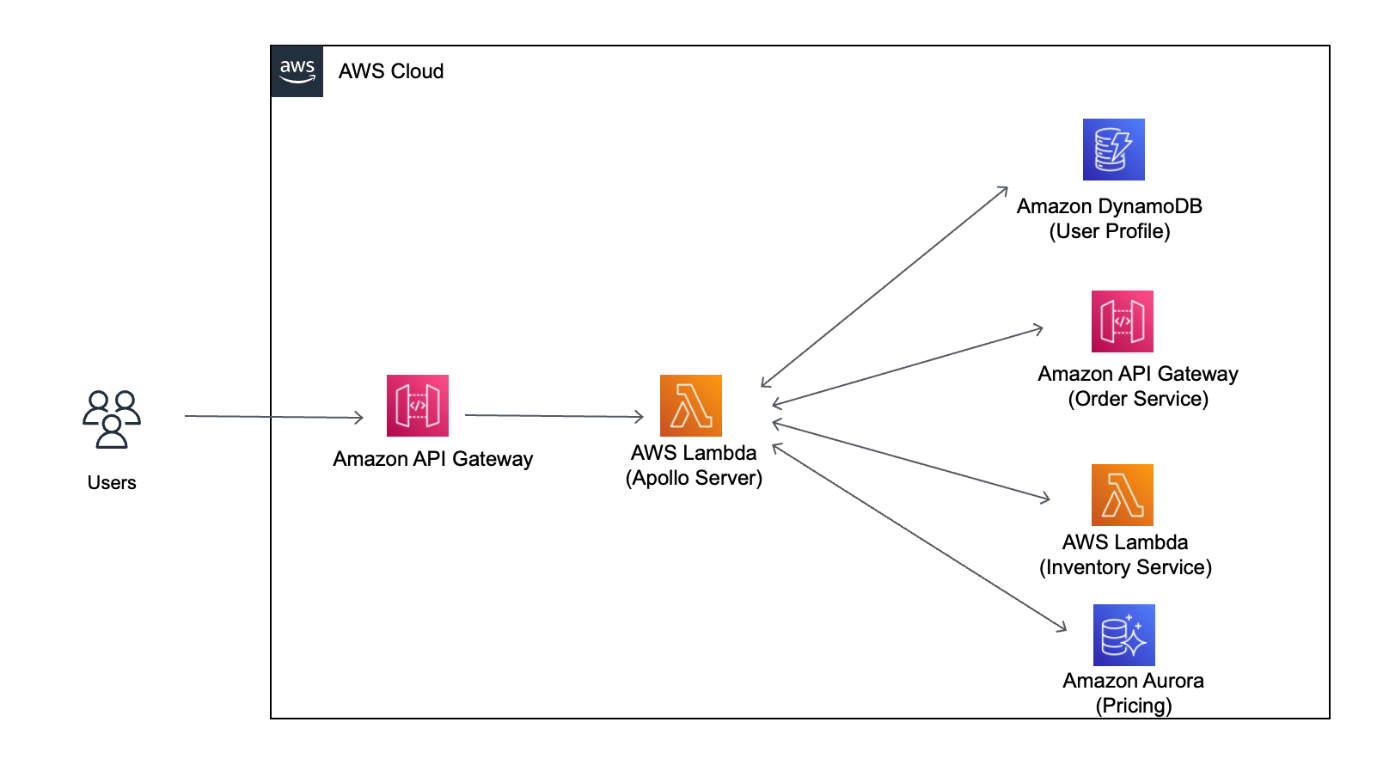
AWS Fault Injection Simulator (AWS FIS) is a fully managed service for running fault injection experiments that can be used as part of your CD pipeline, or outside of the pipeline. AWS FIS is a good choice to use during Chaos Engineering game days. It supports simultaneously introducing faults across different types of resources including Amazon EC2, Amazon ECS, Amazon EKS, and Amazon RDS. These faults include termination of resources, forcing failovers, stressing CPU or memory, throttling, latency, and packet loss. Since it is integrated with Amazon CloudWatch alarms, you can set up stop conditions as guardrails to rollback an experiment if it causes an unexpected impact (Figure 1).

AWS Fault Injection Simulator integrates with AWS resources to enable you to run fault injection experiments for your workloads

Figure 1. AWS Fault Injection Simulator integrates with AWS resources to enable you to run fault injection experiments for your workloads

To expand the scope of faults that can be injected on AWS, AWS FIS integrates with Chaos Mesh and Litmus Chaos, enabling you to coordinate fault injection workflows among multiple tools. For example, you can run a stress test on a pod’s CPU using Chaos Mesh or Litmus faults while terminating a randomly selected percentage of cluster nodes using AWS FIS fault actions.

Implementation steps

1. Determine which faults to use for experiments

Assess the design of your workload for resiliency. Such designs (created using the best practices of the Well-Architected Framework) consider risks based on critical dependencies, past events, known issues, and compliance requirements. List each element of the design intended to maintain resilience and the faults it is designed to mitigate. For more information about creating such lists, see the Operational Readiness Review whitepaper, which guides you on how to create a process to prevent reoccurrence of previous incidents. The Failure Modes & Effects Analysis (FMEA) process provides a framework for performing a component-level analysis of failures and how they impact your workload. FMEA is outlined in more detail in Failure Modes and Continuous Resilience by Adrian Cockcroft.

2. Assign a priority to each fault

To assess priority, consider the frequency of the fault and the impact of failure to the overall workload. It is fine to start with a coarse categorization, such as high, medium, or low, and refine it.

When considering frequency of a given fault, analyze past data for this workload when available. If not available, use data from other workloads running in a similar environment.

When considering impact of a given fault, the larger the scope of the fault, generally the larger the impact. Also consider the workload design and purpose. For example, the ability to access the source data stores is critical for a workload doing data transformation and analysis. In this case, you would prioritize experiments for access faults, as well as throttled access and latency insertion.

Post-incident analyses are a good source of data to understand both frequency and impact of failure modes.

Use the assigned priority to determine which faults to experiment with first and the order with which to develop new fault injection experiments.

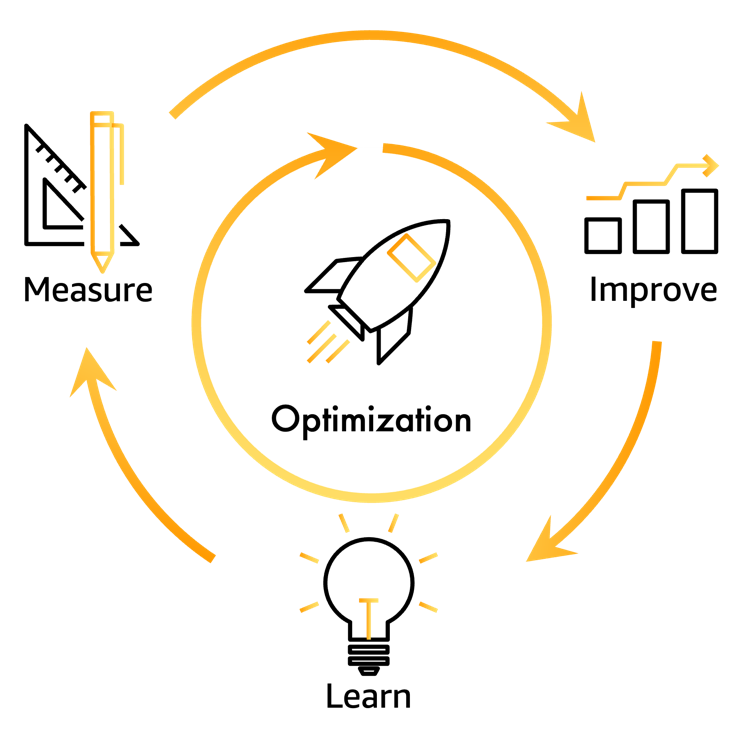
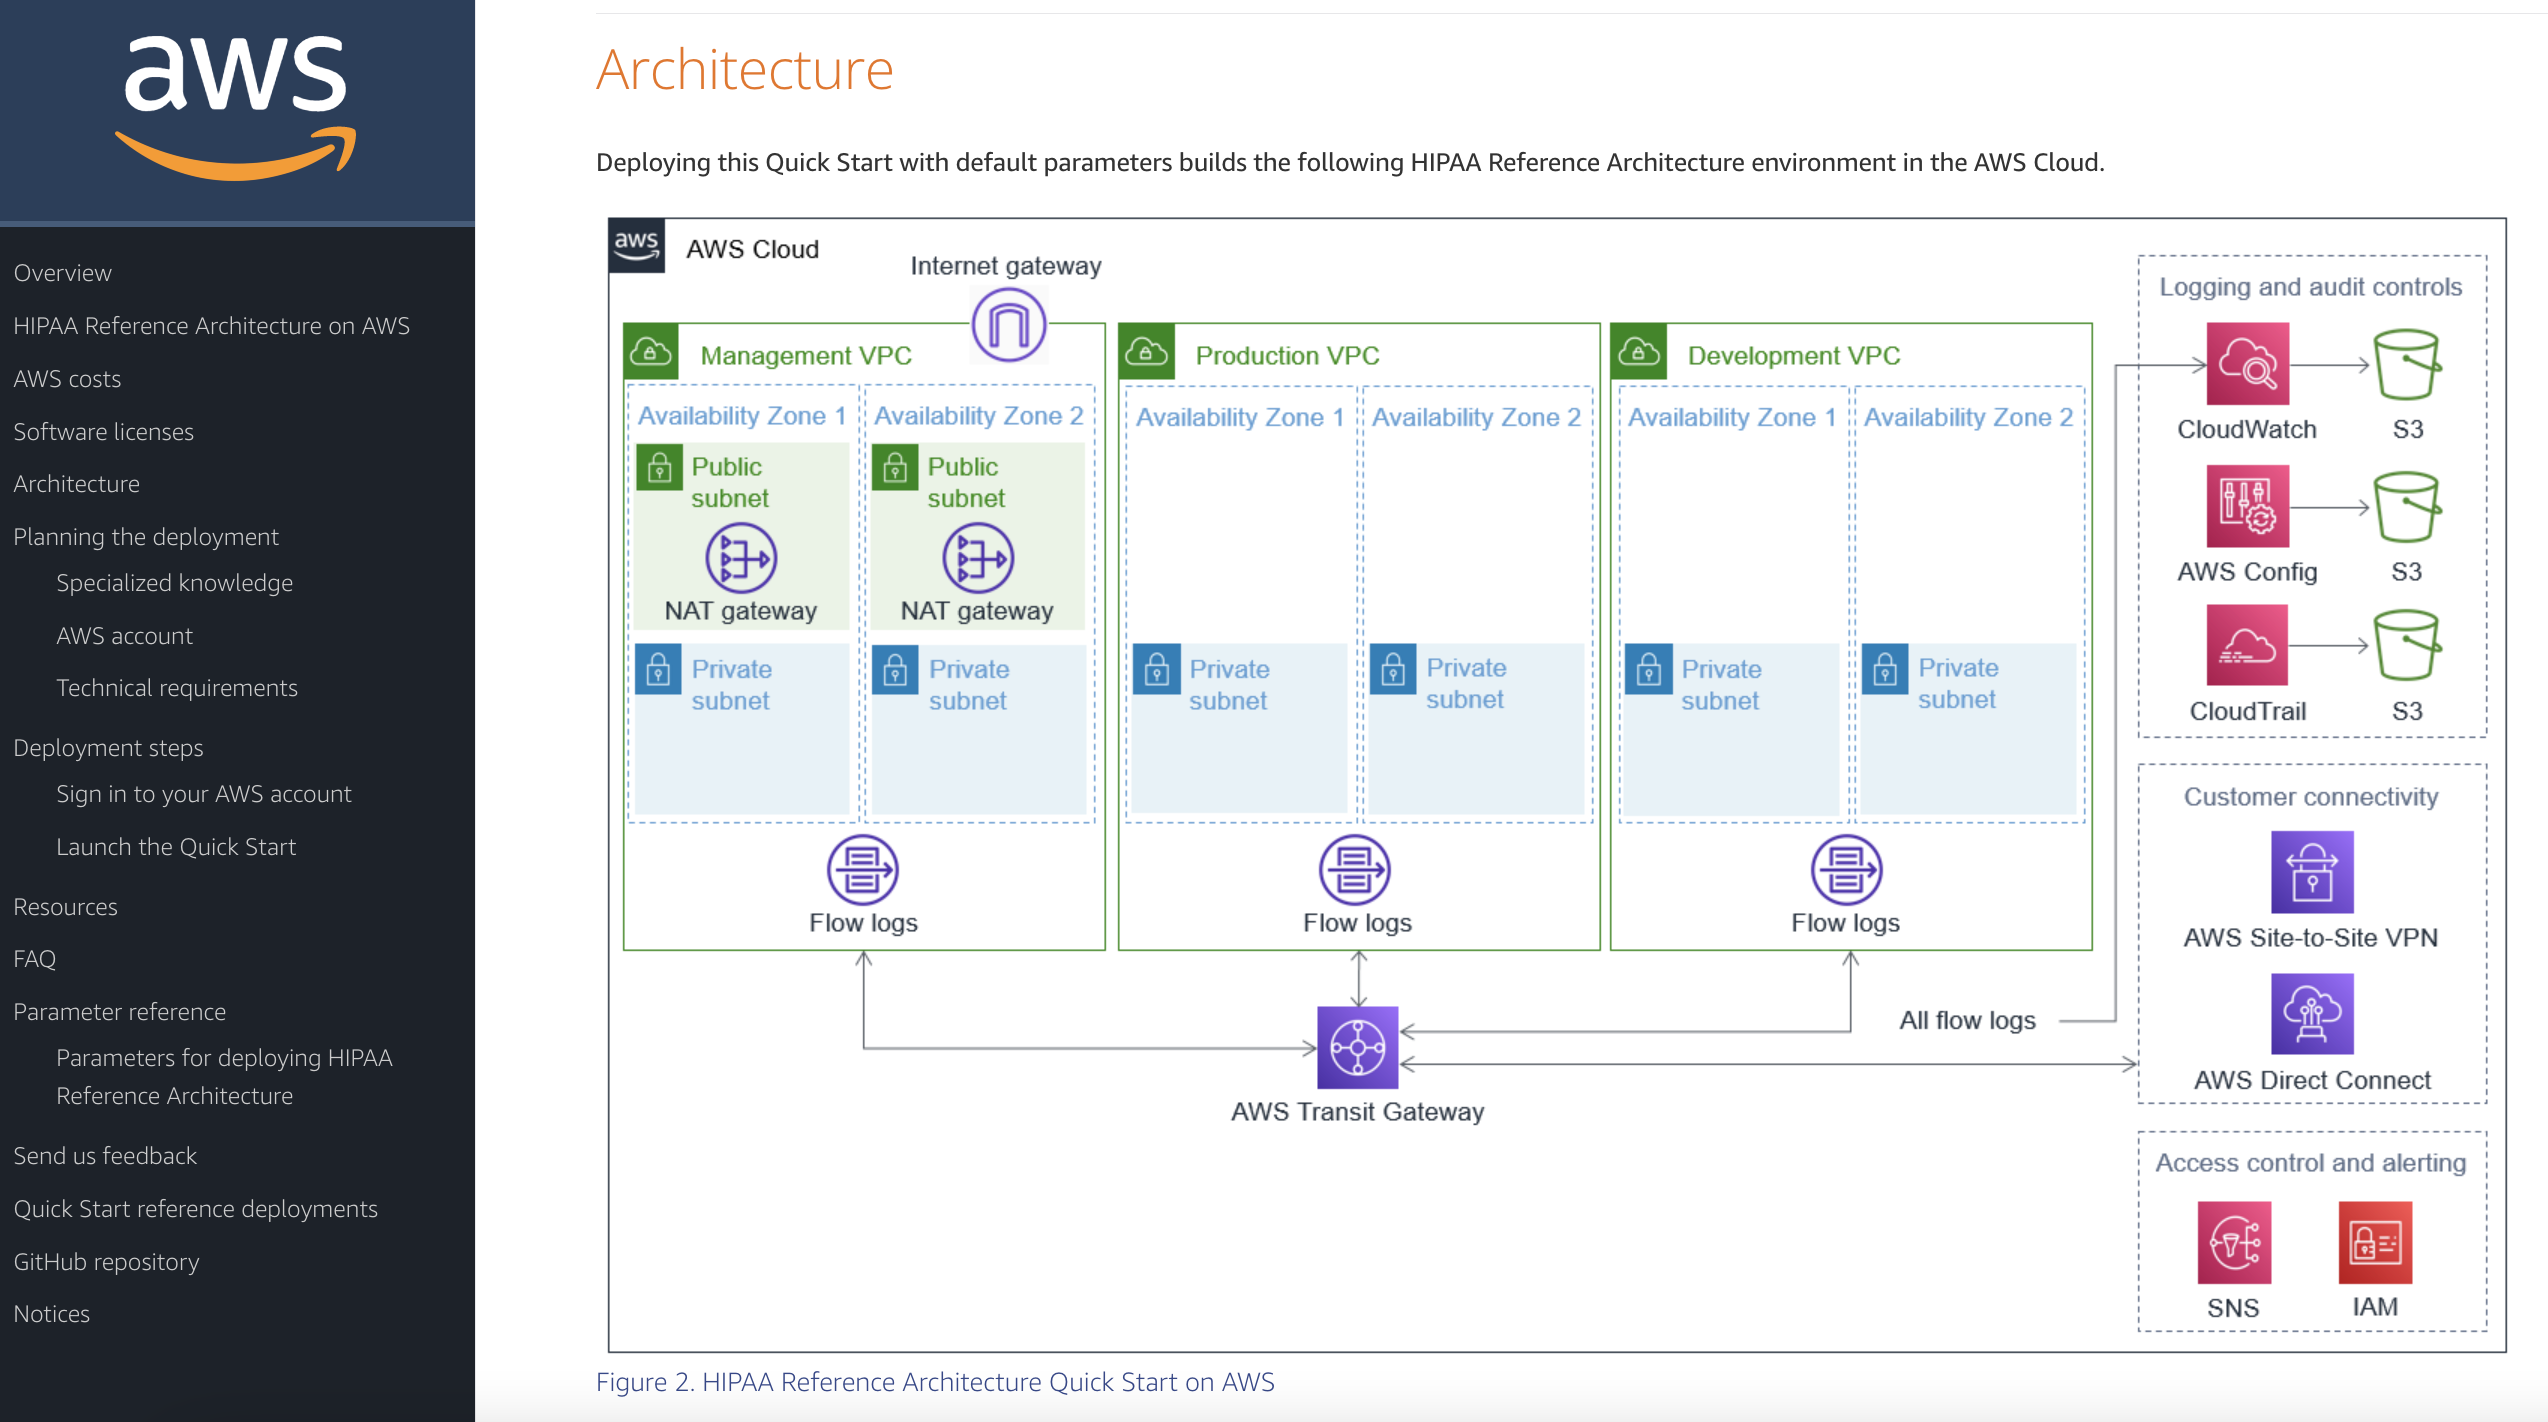
3. For each experiment that you will execute, follow the Chaos Engineering/continuous resilience flywheel (Figure 2)

Chaos Engineering/continuous resilience flywheel, using the scientific method by Adrian Hornsby

Figure 2. Chaos Engineering/continuous resilience flywheel, using the scientific method by Adrian Hornsby

3A. Define steady state as some measurable output of a workload that indicates normal behavior

Your workload exhibits steady state if it is operating reliably and as expected. Therefore, validate that your workload is healthy before defining steady state. Steady state does not necessarily mean that there is no impact to the workload when a fault occurs, as a certain percentage in faults could be within acceptable limits. The steady state is your baseline that you will observe during the experiment, which will highlight anomalies if your hypothesis defined in the next step does not turn out as expected.

For example, a steady state of a payments system can be defined as the processing of 300 transactions per second (TPS) with a 99% success rate and round-trip time of 500 ms.

3B. Form a hypothesis about how the workload will react to the fault

A good hypothesis is based on how the workload is expected to mitigate the fault to maintain the steady state. The hypothesis states that given the fault of a specific type, the system or workload will continue steady state, because the workload was designed with specific mitigations. The specific type of fault and mitigations should be specified in the hypothesis.

The following template can be used for the hypothesis (but other wording is also acceptable):

If [specific fault] occurs the [workload name] workload will [describe mitigating controls] to maintain [business or technical metric].

For example:

  • If 20% of the nodes in the EKS node-group are taken down, the Transaction Create API continues to serve the 99th percentile of requests in under 100 ms (steady state). The EKS nodes will recover within five minutes, and pods will get scheduled and process traffic within eight minutes after the initiation of the experiment. Alerts will fire within three minutes.
  • If a single EC2 instance failure occurs, the order system’s Elastic Load Balancer (ELB) health check will cause the ELB to only send requests to the remaining healthy instances while the EC2 Auto scaling replaces the failed instance, maintaining a less than 0.01% increase in server-side (5xx) errors (steady state).
  • If the primary RDS database instance fails, the supply chain data collection workload will failover and connect to the standby RDS database instance to maintain less than one minute of database read/write errors (steady state).

3C. Run the experiment by injecting the fault

An experiment should, by default, be fail-safe and tolerated by the workload. If you know that the workload will fail, do not run the experiment. Chaos Engineering should be used to find known-unknowns or unknown-unknowns. Known-unknowns are things you are aware of but don’t fully understand, and unknown-unknowns are things you are neither aware of nor fully understand. Experimenting against a workload that you know is broken won’t provide you with new insights. Your experiment should be carefully planned, have a clear scope of impact, and provide a roll back mechanism that can be run in case of unexpected turbulence. If your due diligence shows that your workload should survive the experiment, move forward with running the experiment. There are several options for injecting the faults. For workloads on AWS, AWS FIS provides many pre-defined fault simulations called actions. You can also define custom actions that run in AWS FIS using AWS Systems Manager documents.

We discourage the use of custom scripts for chaos experiments, unless the scripts have the capabilities to understand current state of the workload, are able to emit logs, and provide mechanisms for roll backs and stop conditions where possible.

An effective framework or toolset that supports Chaos Engineering should track the current state of an experiment, emit logs, and provide rollback mechanisms, to support the controlled running of an experiment. Start with an established service like AWS FIS that allows you to run experiments with a clearly defined scope and safety mechanisms that rollback the experiment if the experiment introduces unexpected turbulence. To learn about a wider variety of experiments using AWS FIS, see the Resilient and Well-Architected Apps with Chaos Engineering lab. Also, AWS Resilience Hub will analyze your workload and create experiments that you can choose to implement and run in AWS FIS.

For every experiment, clearly understand its scope and its impact. We recommend that faults should be simulated first on a non-production environment before being run in production.

It is ideal to ultimately run in production under real-world load via canary deployments that spin up both a control and experimental system deployment, where feasible. Running experiments during off-peak times is a good practice to mitigate potential impact when first experimenting in production. Also, if using actual customer traffic poses too much risk, you can run experiments using synthetic traffic on production infrastructure against the control and experimental deployments. When using production is not possible, run experiments in pre-production environments that are as close to production as possible.

You must establish and monitor guardrails to ensure that the experiment does not impact production traffic or other systems beyond acceptable limits. Establish stop conditions to stop an experiment if it reaches a threshold on a guardrail metric that you define. This should include the metrics for steady state for the workload, as well as the metric against the components into which you’re injecting the fault. A synthetic monitor (also known as a “user canary”) is one metric you should usually include as a user proxy. Stop conditions for AWS FIS are supported as part of the experiment template, enabling up to five stop-conditions per template.

One of the Principles of Chaos Engineering is to minimize the scope of the experiment and its impact, specifically “While there must be an allowance for some short-term negative impact, it is the responsibility and obligation of the Chaos Engineer to ensure the fallout from experiments are minimized and contained”. A method to verify the scope and potential impact is to run the experiment in a non-production environment first, verifying that thresholds for stop conditions occur as expected during an experiment and observability is in place to catch an exception, instead of directly experimenting in production.

When running fault injection experiments, verify that all responsible parties are well informed. Communicate with appropriate teams, such as the operations teams, service reliability teams, and customer support, to let them know when experiments will be run and what to expect. Give these teams communication tools to inform those running the experiment if they see any adverse effects.

You must restore the workload and its underlying systems back to the original known-good state. Often, the resilient design of the workload will self-heal. But some fault designs or failed experiments can leave your workload in an unexpected failed state. By the end of the experiment, you must be aware of this and restore the workload and systems. With AWS FIS, you can set a rollback configuration (also called a post action) within the action parameters. A post action returns the target to the state that it was in before the action was run. Whether automated (such as using AWS FIS) or manual, these post actions should be part of a playbook that describes how to detect and handle failures.

3D. Verify the hypothesis

The Principles of Chaos Engineering gives this guidance on how to verify steady state of your workload: “Focus on the measurable output of a system, rather than internal attributes of the system. Measurements of that output over a short period of time constitute a proxy for the system’s steady state. The overall system’s throughput, error rates, latency percentiles, etc. could all be metrics of interest representing steady state behavior. By focusing on systemic behavior patterns during experiments, Chaos verifies that the system does work, rather than trying to validate how it works.”

In our two examples from Step 3B, we include the steady state metrics:

  • Less than 0.01% increase in server-side (5xx) errors
  • Less than 1 minute of database read/write errors

The 5xx errors are a good metric because they are a consequence of the failure mode that a client of the workload will experience directly. The database errors measurement is good as a direct consequence of the fault, but should also be supplemented with a client impact measurement such as failed customer requests or errors surfaced to the client. Additionally, include a synthetic monitor (also known as a “user canary”) on any APIs or URIs directly accessed by the client of your workload.

3E. Improve the workload design for resilience

If steady state was not maintained, then investigate how the workload design can be improved to mitigate the fault, applying the best practices of the AWS Well-Architected Reliability Pillar. Additional guidance and resources can be found in the AWS Builder’s Library, which hosts articles about how to improve your health checks and employ retries with backoff in your application code, among others.

After these changes have been implemented, run the experiment again (shown by the dotted line in Figure 2) to determine their effectiveness. If the verify step indicates the hypothesis holds true, then the workload will be in steady state, and the cycle in Figure 2 continues.

4. Run experiments regularly

A chaos experiment is a cycle, and experiments should be run regularly as part of Chaos Engineering. After a workload meets the experiment’s hypothesis, the experiment should be automated to run continuously as a regression part of your CI/CD pipeline. To learn how to do this, explore this blog on how to run AWS FIS experiments using AWS CodePipeline. This lab on recurrent AWS FIS experiments in a CI/CD pipeline enables you to work hands-on with this.

Fault injection experiments are also a part of game days. Game days simulate a failure or event to verify systems, processes, and team responses. The purpose of game days is to actually perform the actions that the team would perform as if an exceptional event happened.

5. Capture and store experiment results

Results for fault injection experiments must be captured and persisted. Include all necessary data necessary (such as time, workload, and conditions) to be able to later analyze experiment results and trends. Examples of results might include screenshots of dashboards, CSV dumps from your metrics database, or a hand-recorded record of events and observations from the experiment. Experiment logging with AWS FIS can be part of this data capture.


This blog post gives early access to the updated implementation guidance on Chaos Engineering we are publishing as part of updates to the AWS Well-Architected content. Using the implementation steps described in this post, you can begin using Chaos Engineering to verify the resilience of your workloads.

Announcing updates to the AWS Well-Architected Framework

Post Syndicated from Haleh Najafzadeh original https://aws.amazon.com/blogs/architecture/announcing-updates-to-the-aws-well-architected-framework/

We are excited to announce the availability of improved AWS Well-Architected Framework content. In this update, we have made changes across all six pillars of the framework: Operational Excellence, Security, Reliability, Performance Efficiency, Cost Optimization, and Sustainability.

A brief history

The Well-Architected Framework is a collection of best practices that allow customers to evaluate and improve the design, implementation, and operations of their workloads and organizations in the cloud.

In 2012, the first version of the framework was published, leading to the 2015 release of the guidance whitepaper. We added the operational excellence pillar in 2016. The pillar-specific whitepapers and AWS Well-Architected Lenses were released in 2017, and, the following year, the AWS Well-Architected Tool was launched. In 2020, the content for the framework received a major update, more lenses, and API integration with the Well-Architected Tool. The sixth pillar, sustainability, was added in late 2021.

W-A timeline v2

AWS Well-Architected timeline

What’s new

Updates to the Well-Architected content include:

Learn, measure, improve, and iterate

Best practices include regularly reviewing your workloads—even those that have not had major changes. We encourage you to assess your existing workloads as your architecture evolves or business needs change, and create milestones for your workloads as they develop. Use the Well-Architected Framework to guide your design and architecture of new workloads, or of workloads that you are planning on moving to the cloud.

Taking best practices into account early in your process can yield high success rates. In effective organizations, each best practice is considered and prioritized with respect to the goal they are trying to achieve.

AWS Well-Architected helps cloud architects build secure, high-performing, resilient, and efficient infrastructure for a variety of applications and workloads. The Framework is built around six pillars—operational excellence, security, reliability, performance efficiency, cost optimization, and sustainability.

Want to partner with us? Sign up!
Want to work with us? Visit Amazon Careers and search for “AWS Well-Architected” to find opportunities.

How Shiji Group created a global guest profile store on AWS

Post Syndicated from Maximilian Schellhorn original https://aws.amazon.com/blogs/architecture/how-shiji-group-created-a-global-guest-profile-store-on-aws/

Shiji Group provides global software solutions for the hospitality industry. The Shiji Enterprise Platform enables customers to manage large hotel property portfolios using software as a service (SaaS). Among functionalities such as reservations, housekeeping, finance, and integrations with external systems, the guest profile is a key aspect of the system. Besides personal information (such as name and address) and billing details, the guest profile can include room preferences and entertainment options.

A property portfolio can span multiple hotels across the globe, and each hotel location can offer better customer service by consolidating data. Once the guest gives their cross-border data processing consent (CBDPC), profile information can be shared between properties. This provides a centralized and seamless experience for the hotel guest no matter which hotel in the portfolio was chosen.

In the following blog post, you will explore the architecture of the guest profile store that replicates the profile across multiple geographic areas. We will review the single Region design first and its infrastructure components and architectural patterns. We will then show the evolution to a multi-Region architecture.

Single Region architecture with CQRS

The ability to find relevant guest profile data fast is essential in the day-to-day hospitality business. Therefore, the following architecture uses the command query responsibility segregation (CQRS) pattern to provide high scalability and rich full-text search capabilities without sacrificing performance. With CQRS, write requests (commands) are targeting a different service than read requests (queries). This allows systems to store an item (such as a profile) in a search-optimized format for serving reads, while providing a simple schema for writes.

The microservices for the guest profile architecture are operated as containers on Amazon Elastic Kubernetes Service (Amazon EKS). The write model of the guest profile is stored in an Amazon Relational Database Service (Amazon RDS) PostgreSQL database. A separate read model uses Amazon OpenSearch Service. For interservice communication, Shiji runs a self-managed Apache Kafka cluster on Amazon Elastic Compute Cloud (Amazon EC2).

The following diagram provides a walk through the single Region architecture:

Single Region architecture with CQRS

Figure 1. Single Region architecture with CQRS

  1. The front desk employee creates the Guest Profile upon first interaction with the hotel guest (name, address, billing, and room preferences).
  2. The request is routed to the Kong API Management Solution that is running in an Amazon EKS Kubernetes cluster. It acts as the single entry-point to the system. It identifies the type of request by parsing the URL and forwarding write requests to the profile-write-model-service.
  3. The service validates the request. It stores the data and ProfileCreated event in the PostgreSQL database, Amazon RDS.
  4. A change data capture (CDC) mechanism publishes the ProfileCreated event to an Apache Kafka Local Profiles topic.
  5. The profile-read-model-service subscribes to the Local Profiles topic and stores the profile in an optimized read format in Amazon OpenSearch. Whenever the hotel performs a guest profile search, results will now be provided via the profile-read-model-service.

Multi-Region networking setup

Shiji operates in multiple AWS Regions to provide low latency, regulatory requirements, and resilience across the globe. The previously presented single Region architecture can be replicated to multiple AWS Regions (eu-central-1 and ap-southeast-1, for example). Hotels with a given property portfolio that operate in the same Region can reuse the profile store of the Shiji Enterprise Platform. However, hotels that are being operated in a different AWS Region can be interconnected as well.

This is achieved by providing an AWS Transit Gateway in a separate networking account that connects the different Regions with a VPC attachment:

Multi-Region networking setup

Figure 2. Multi-Region networking setup

The account segregation provides an additional layer of flexibility to add further Regions in the future.

Multi-Region event replication

Upon first arrival, guests can choose to sign a cross-border-data processing consent (CBDPC). This permits the hotel to share the profile information globally. If accepted, the profile-write-model-service creates an additional ProfileCreated event that gets published to a GlobalProfilesEU Apache Kafka topic. This topic is accessible for subscribers in the target Region, which replicates relevant profiles into the local database as follows.

A replicator-service in the target Region (ap-souteast-1) is now able to subscribe to the GlobalProfileEU topic in (eu-central-1), via the established network connection from the previous section. It republishes the event to a local ReplicatedProfiles topic that the profile-write-model-service subscribes to and saves to the local database:

Event replication

Figure 3. Event replication

Putting it all together: The multi-Region guest profile store

The following diagram combines all the components from the previous sections. It provides an end-to-end look at the multi-Region guest profile architecture. Due to the event driven nature of the system, the architecture can be extended without changing the initial flow outlined in the single Region design.

Multi-Region guest profile architecture

Figure 4. Multi-Region guest profile architecture

  1. If the hotel guest signed a cross-border data processing consent (CBDPC), the ProfileCreated event will also be published to a Global Profiles topic.
  2. The replicator-service in the target Region (for example, ap-southeast-1) subscribes to the Global Profiles topic of the source Region (for example, eu-central-1). It then publishes the event to its local Replicated Profiles topic.
  3. The profile-write-model-service in the target Region subscribes to the Replicated Profiles topic and records the item in the Amazon RDS PostgreSQL database with information about the source Region. This will initiate the local replication similar to the single Region design, and therefore creates a consistent experience between both Regions.

Conclusion and outlook

In this blog post, we showed how Shiji built a modern multi-Region microservice architecture on AWS. You have learned about patterns such as CQRS, which provide a scalable solution for both read and write traffic. We’ve also shown what is needed to interconnect two physically separated Regions. With cross-border data processing consent (CBDPC), you have seen how the ownership of guest data can be secured and utilized. The single Region architecture already provided a solid baseline for this solution architecture. The event-driven nature of the system permitted us to add additional functionality for the final multi-Region architecture.

The ability to manage a global guest profile within the main system as well as at the property itself is a huge advantage for enterprise hotel companies. It permits hotels to deliver a unified experience to their guests no matter where the guest is within the hotel or on their journey. Food preferences, spa, room, and more, can all be managed from a single guest profile. This centralized information hasn’t been possible within the hotel’s property management system (PMS) until recently.

Visit Shiji Enterprise Platform for more information.

Let’s Architect! Architecting with Amazon DynamoDB

Post Syndicated from Luca Mezzalira original https://aws.amazon.com/blogs/architecture/lets-architect-architecting-with-amazon-dynamodb/

NoSQL databases are an essential part of the technology industry in today’s world. Why are we talking about NoSQL databases? NoSQL databases often allow developers to be in control of the structure of the data, and they are a good fit for big data scenarios and offer fast performance.

In this issue of Let’s Architect!, we explore Amazon DynamoDB capabilities and potential solutions to apply in your architectures. A key strength of DynamoDB is the capability of operating at scale globally; for instance, multiple products built by Amazon are powered by DynamoDB. During Prime Day 2022, the service also maintained high availability while delivering single-digit millisecond responses, peaking at 105.2 million requests-per-second. Let’s start!

Data modeling with DynamoDB

Working with a new database technology means understanding exactly how it works and the best design practices for taking full advantage of its features.

In this video, the key principles for modeling DynamoDB tables are discussed, plus practical patterns to use while defining your data models are explored and how data modeling for NoSQL databases (like DynamoDB) is different from modeling for traditional relational databases.

With this video, you can learn about the main components of DynamoDB, some design considerations that led to its creation, and all the best practices for efficiently using primary keys, secondary keys, and indexes. Peruse the original paper to learn more about DyanamoDB in Dynamo: Amazon’s Highly Available Key-value Store.

Amazon DynamoDB uses partitioning to provide horizontal scalability

Amazon DynamoDB uses partitioning to provide horizontal scalability

Single-table vs. multi-table in Amazon DynamoDB

When considering single-table versus multi-table in DynamoDB, it is all about your application’s needs. It is possible to avoid naïve lifting-and-shifting your relational data model into DynamoDB tables. In this post, you will discover different use cases on when to use single-table compared with multi-table designs, plus understand certain data-modeling principles for DynamoDB.

Use a single-table design to provide materialized joins in Amazon DynamoDB

Use a single-table design to provide materialized joins in Amazon DynamoDB

Optimizing costs on DynamoDB tables

Infrastructure cost is an important dimension for every customer. Despite your role inside an organization, you should monitor opportunities for optimizing costs, when possible.
For this reason, we have created a guide on DynamoDB tables cost-optimization that provides several suggestions for reducing your bill at the end of the month.

Build resilient applications with Amazon DynamoDB global tables: Part 1

When you operate global systems that are spread across multiple AWS regions, dealing with data replication and writes across regions can be a challenge. DynamoDB global tables help by providing the performance of DynamoDB across multiple regions with data synchronization and multi-active database where each replica can be used for both writing and reading data.

Another use case for global tables are resilient applications with the lowest possible recovery time objective (RTO) and recovery point objective (RPO). In this blog series, we show you how to approach such a scenario.

Amazon DynamoDB active-active architecture

Amazon DynamoDB active-active architecture

See you next time!

Thanks for joining our discussion on DynamoDB. See you in a few weeks, when we explore cost optimization!

Other posts in this series

Looking for more architecture content?

AWS Architecture Center provides reference architecture diagrams, vetted architecture solutions, Well-Architected best practices, patterns, icons, and more!

Author Spotlight: Rostislav Markov, Principal Architect in Strategic Industries

Post Syndicated from Elise Chahine original https://aws.amazon.com/blogs/architecture/author-spotlight-rostislav-markov-principal-architect-in-strategic-industries/

The Author Spotlight series pulls back the curtain on some of AWS’s most prolific authors. Read on to find out more about our very own Rostislav Markov’s journey, in his own words!


At Amazon Web Services (AWS), we obsess over customers, and this drives our daily operations. As an architect, I always look for innovative solutions to common problems our AWS users face. One of my favorite things about my work is the opportunity to influence our services roadmap by taking feedback from our customers. Every topic I write about comes from my work with AWS customers and our service teams.

Since joining in 2017, I have worked on projects ranging from Cloud Foundations to migration and modernization, to new development initiatives. I worked with companies in automotive, banking and insurance, chemicals, healthcare and life sciences, manufacturing, media and entertainment. Throughout my journey, I have observed first-hand that every company—big and small—has its own journey to the cloud, and there are always common patterns from one experience to the next. The good news is if you face a challenge, chances are somebody has already experienced the same difficulty and found a solution. This is why I love reading about common patterns in the AWS Architecture Blog.

In 2020, my AWS journey took me from Munich, Germany, to New York, US, where I currently live. I still visit my first AWS customers but, now, in their US offices, and have meanwhile worked with many other companies. After 5 years in AWS, I am still constantly learning about our services and innovative solutions for multiple industry issues. Occasionally, I write about them on the AWS Architecture Blog or present at our public conferences.

One of my favorite moments was 4 years ago at the AWS Summit Berlin. I presented together with Kathleen DeValk, former Chief Architect at Siemens, about IoT at Siemens and designing microservices for very large scale. This year, I was back on stage with Christos Dovas, Head of Cloud-Native Automation at BMW Group, talking about BMW’s journey to DevOps.

Left: Rostislav Markov and Kathleen DeValk / Right: Christos Dovas and Rostislav Markov

What’s on my mind lately

My current focus at work is on modern application principles. I work with AWS customers on elevating their application deployment standards and creating solutions for common enterprise use cases in strategic industries. I look forward to writing more blogs on those and many other topics—stay tuned!

My favorite blog posts

Queue Integration with Third-party Services on AWS

I wrote this blog post in 2021 while working with scientific research teams in healthcare and life sciences. It addresses third-party services that do not natively support AWS APIs and best practices, such as polling, that require a fault-tolerant integration layer.

As Werner Vogels, CTO of Amazon, said at AWS re:Invent in 2019, “Everything fails, all the time.” In this solution, the RunTask API was used to explain how retry and error handling can be added to your application.

Special thanks go to Sam Dengler, former Principal Developer Advocate with the AWS Compute Services team, who helped me find the right focus for this blog post, and from whom I still learn today.

Figure 1. On-premises and AWS queue integration for third-party services using AWS Lambda

On-premises and AWS queue integration for third-party services using AWS Lambda

Save time and effort in assessing your teams’ architectures with pattern-based architecture reviews

This post summarized my lessons working with 500 developers of a global industrial manufacturing company. Their IoT solution had to go live within 6 months, but they did not have prior AWS experience.

By using a pattern-based approach to architecting and building applications, we were able to complete the reviews within 2 weeks and make the architecture reviews fun, inspiring, and a team-based experience.

I have reused this pattern-based development approach on the majority of my projects, including the one I am currently working on: deciding on the V1 AWS design patterns with the data center exits of a large life sciences company. If you are curious and want to learn more, explore the AWS whitepaper on Cloud-Driven Enterprise Transformation on AWS.

Proposed AWS services for use by development teams

Proposed AWS services for use by development teams

Point-in-time restore for Amazon S3 buckets

One of the best things about working with AWS is receiving meaningful customer feedback all the time and having the means to act on it. This blog post is an example of customer feedback in manufacturing, media, and entertainment industries using one of my favorite AWS services—Amazon Simple Storage Service (Amazon S3).

Customers requested a simple way to do point-in-time restoration at the bucket level. My colleague, Gareth Eagar, Senior Solutions Architect, and I worked with the service team to influence the service roadmap and published a solution with this blog post.

I love going back to basics, here with Amazon S3 versioning, and learning more about our foundational services, while having a ton of fun with my colleague along the way.

Point-in-time restore for Amazon S3 buckets

Chaos Engineering in the cloud

Post Syndicated from Laurent Domb original https://aws.amazon.com/blogs/architecture/chaos-engineering-in-the-cloud/

For many years, Chaos Engineering was viewed as a mechanism to help surface the “known-unknowns” (things that we are aware of, but do not fully understand) in our environments or “unknown-unknowns” (things we are neither aware of, nor fully understand).

Using Chaos Engineering, chaos experiments have been conducted on infrastructure, applications, and business processes that identified weaknesses and prevented outages for many organizations; yet, while Chaos Engineering found a home across various industries, like Financial Services, Media and Entertainment, Healthcare, Telecommunication, Hospitality and others, it has been slow in its adoption.

A different perspective on Chaos Engineering

For the last decade, Chaos Engineering had the reputation of being a mechanism to “purposely break things in production”, which stopped many companies from adopting it. The ultimate goal of Chaos Engineering is not about breaking production systems.

Chaos Engineering offers a mechanism that allows your teams to gain deep insights into your workloads by executing controlled chaos experiments that are based on a real-world hypothesis. These experiments have a clear scope that defines the expected impact to the workload and includes a rollback mechanism where there is availability or recovery processes in place to mitigate the failure.

Chaos Engineering drives operational readiness and best practices around how your workloads should be observed, designed, and implemented to survive component failure with minimal to no impact to the end user. Therefore, Chaos Engineering can lead to improved resilience and observability, ultimately improving the end-user’s experience and increasing organizations’ uptime.

The Shared Responsibility Model for resilience

When you build a workload in the Amazon Web Services (AWS) Cloud, we (at AWS) are responsible for the “resilience of the cloud”; this means, we are responsible for the resilience of the services and infrastructure offered on the AWS Cloud. This infrastructure is composed of the hardware, software, networking, and facilities that run AWS Cloud services.

Your responsibility as a customer is the “resilience in the cloud”, meaning your responsibility is determined by the AWS Cloud services that you consume. This determines the amount of configuration work, recovery mechanisms, operational tooling, and observability logic that are needed to make the workload resilient (Figure 1).

AWS Shared Responsibility Model for resilience

Figure 1. AWS Shared Responsibility Model for resilience

Resilience in the cloud

Separation of duties creates interesting challenges in resilience:

  • How can you build workloads that will mitigate enough failure modes to meet your resilience objective, if you are not responsible for operating the underlying services that you rely on?
  • How are your workloads performing if one or more AWS services are impaired, a network disruption occurs, or a natural disaster strikes?

While there is distinct guidance on these questions in the AWS Well-Architected Framework’s Reliability Pillar, one question still remains: can your team/organization simulate a controlled event in pre-production or production that would give them confidence that the observability tooling, incident response, and recovery mechanisms will protect the workload from a disruption with minimal to no customer impact?

If you have been operating in a regulated environment, like the Financial Services industry, Healthcare, or the Federal Government, you can cite that the quarterly/yearly disaster-recovery (DR) exercises and your business continuity plan help with such simulations.

Planned DR exercises have a clear structure and scope: employees know that they have to be ready on a certain date and time, and they will execute the runbooks and playbooks that are hopefully up-to-date on that day. In essence, this validates a failover of a known-state. While DR exercises can provide a high level of confidence that operations will continue in a secondary region without being dependent on any services in the primary site, these exercises do not provide the ability to detect and mitigate the different types of failure modes that may be encountered in a real-world scenario.

Disaster recovery and failure in the real world

For example, in 2012, Hurricane Sandy took down critical infrastructure services when it struck the Northeast US, resulting in power and telecommunication outages on the East Coast. Many companies’ business continuity plans did not account for staff living in zones impacted by natural disaster. Clearly, these individuals would/will not be able to assist during a real-life DR event.

Executing a DR plan quarterly or yearly may not be enough to prepare an organization for real-world events: they can come without notice and in many different flavors, like faulty deployments or configurations, hardware failures, data and state corruption, the inability to connect to a third-party provider, or natural disasters. Most may not require the execution of your DR plan but, instead, challenge observability, high-availability strategy, and incident-response processes.

Chaos Engineering real-world events

How can you prepare for unknown events? Chaos Engineering provides value to your organization by allowing it to get ahead of unexpected disruptions by continuously injecting controlled, real-world disruptions as a scheduled job, in your software development lifecycle, and/or continuous integration and continuous delivery (CI/CD) pipelines at the cloud-provider, infrastructure, workload-component, and process level.

Consider Chaos Engineering a resilience guardian: it gives the confidence, control, and rigor needed to ensure the experiment does not impact the customer, or quickly stop the experiment if it does. Using these mechanisms, your teams can learn from faults in a controlled environment and observe, measure, and improve the workloads’ resilience, plus validate the logs, metrics, and that alarms are in place to notify operators within a predetermined timeframe.

Finding and amending deficiencies

When incorporating Chaos Engineering into your day-to-day operations, workload deficiencies will surface and need to be addressed. Chaos Engineering experiments run in production that surface unexpected behavior will only minimally impact customers, if at all, compared with real-world, unexpected disruptions. Controlled experiments are executed with a clear scope of impact. Experts are present to observe the experiment and automated rollback mechanisms executed. In the worst-case scenario, these experts will get hands-on and remediate the disruption on the spot.

If an experiment surfaces unknown behavior, there is a Correction of Error (COE) analysis. The COE is a process for improving quality by documenting and addressing issues, focusing on identifying and amending root causes.

Using the COE, we can explore the customer interaction with the workload and understand the customer impact. This can provide further insights on what happened during the event and give way to deep dives into the component that caused failure. If the fault is not identifiable, more observability should be added to the workload.

Additionally, incident-response mechanisms are reviewed to validate that a disruption was detected, key stakeholders are notified, and escalations processes begin in the predetermined timeframe. Prioritizing new findings and, based on impact, adding them to the issue back log, and addressing known risks are the keys to successful Chaos Engineering and mitigating future impact to the workload.

Chaos Engineering on AWS

To get started with Chaos Engineering on AWS, AWS Fault Injection Simulator (AWS FIS) was launched in early 2021. AWS FIS is a fully managed service used to run fault injection experiments that simulate real-world AWS faults. This service can be used as part of your CI/CD pipeline or otherwise outside the pipeline via cron jobs.

As demonstrated in Figure 2, AWS FIS can inject faults sequentially or simultaneously, introducing faults across different types of resources, Amazon Elastic Compute Cloud, Amazon Elastic Container Service, Amazon Elastic Kubernetes Service, and Amazon Relational Database Service. Some of these faults include:

  • Termination of resources
  • Forcing failovers
  • Stressing CPU or memory
  • Throttling
  • Latency
  • Packet loss

Since it is integrated with Amazon CloudWatch alarms, you can setup stop conditions as guardrails to rollback an experiment if it causes unexpected impact.

AWS Fault Injection Simulator integrates with AWS resources

Figure 2. AWS Fault Injection Simulator integrates with AWS resources

As Chaos Engineering should provide as much flexibility as possible when it comes to fault injection, AWS FIS integrates with external tools, such as Chaos Toolkit and Chaos Mesh, to expand the scope of failures that can be injected to your workload.

Conclusion

Chaos Engineering is not about breaking systems but rather creating resilient workloads that can survive real-world events with minimal-to-no customer impact, by finding the “known-unknowns” and/or “unknown-unknowns” that can cause such events. Additionally, these mechanisms help improve operational excellence and resilience through developer and observability best practices, allowing you to catch deficiencies before they escalate into large-scale events and therefore improve the customers experience.

If you’d like to know more, please join us at AWS re:Invent 2022, where we will present multiple sessions on Chaos Engineering. Also, explore Chaos Engineering Stories!

Let’s Architect! Architecting in health tech

Post Syndicated from Luca Mezzalira original https://aws.amazon.com/blogs/architecture/lets-architect-architecting-in-health-tech/

Healthcare technology, commonly referred to as “health tech,” is the use of technologies developed for the purpose of improving any and all aspects of the healthcare system. For example, IT tools or software designed to boost hospital/administrative productivity, give insights into new and existing treatments, or improve the overall quality of care.

Also known as “digital health”, health tech uses databases, applications, mobile devices, and wearables to facilitate the delivery, payment, and/or consumption of healthcare. The increased accessibility to these technologies can further increase the development and launch of additional healthcare products.

In this post, we explore how to build and manage health tech architectures using Amazon Web Services (AWS).

HIPAA Reference Architecture on the AWS Cloud

This Quick Start provides guidance for deploying a U.S. Health Insurance Portability and Accountability Act (HIPAA) architecture on the AWS Cloud. Specifically, this aims to help those in the healthcare industry build and implement HIPAA-ready environments that fit with an organization’s larger HIPAA compliance program. It includes AWS CloudFormation templates that are customizable, plus automatically deploy the environment and configure AWS resources.

HIPAA Reference Architecture on the AWS Cloud

Using AppStream 2.0 to Deliver PACS and Image Analysis in Clinical Trials

Amazon AppStream 2.0 is a fully managed, non-persistent desktop and application service for remotely accessing your work. This means that clinical staff can now access the medical applications and data they need from anywhere. Benefits of using AppStream 2.0 include reduced overhead cost. This Architecture Blog post examines how to construct the AWS architecture for an image analysis application used in clinical trials, while keeping cost down. Furthermore, it demonstrates how something seemingly complex can be built with ease using both AWS services and image analysis applications already in place.

Using AppStream 2.0 to Deliver PACS and Image Analysis in Clinical Trials

How fEMR Delivers Cryptographically Secure and Verifiable Medical Data with Amazon QLDB

Data veracity is fundamental. Patient data is confidential, and when a system deals with sensitive data, there needs to be a clear chain of ownership.

This blog post depicts an architecture based on the use of Amazon Quantum Ledger Database (Amazon QLDB), which addresses the need for data integrity and verifiability in healthcare. By using Amazon QLDB, the team can take advantage of an append-only journal to create a verifiable electronic medical record.

Also explored are the challenges architects face while working on these types of systems, as well as considerations about security, operational efficiency, processes for repeatable deployments using infrastructure as code, and data replication across multiple databases. The design choices architects make when developing a system depend on the context; read more about the mental models adopted in this use case.

How fEMR Delivers Cryptographically Secure and Verifiable Medical Data with Amazon QLDB

Service Workbench on AWS

Service Workbench on AWS is a cloud solution that enables IT teams to provide secure, repeatable, and federated control of access to data, tooling, and compute power. Service Workbench can help redirect researchers’ focus from technical duties back to the research itself, by allowing them to automate of the creation of baseline research setups and providing data access. It gives researchers the ability to build research environments in minutes without having to know about cloud infrastructure or wait for research IT to respond. It is fully HIPAA-compliant and allows for secure peer-to-peer collaboration, including with individuals from other institutions.

See you next time!

Thanks for joining our discussion on health tech architectures! See you in two weeks for more architecture best practices and guidance.

Other posts in this series

Looking for more architecture content?

AWS Architecture Center provides reference architecture diagrams, vetted architecture solutions, Well-Architected best practices, patterns, icons, and more!

How Launchmetrics improves fashion brands performance using Amazon EC2 Spot Instances

Post Syndicated from Ivo Pinto original https://aws.amazon.com/blogs/architecture/how-launchmetrics-improves-fashion-brands-performance-using-amazon-ec2-spot-instances/

Launchmetrics offers its Brand Performance Cloud tools and intelligence to help fashion, luxury, and beauty retail executives optimize their global strategy. Launchmetrics initially operated their whole infrastructure on-premises; however, they wanted to scale their data ingestion while simultaneously providing improved and faster insights for their clients. These business needs led them to build their architecture in AWS cloud.

In this blog post, we explain how Launchmetrics’ uses Amazon Web Services (AWS) to crawl the web for online social and print media. Using the data gathered, Launchmetrics is able to provide prescriptive analytics and insights to their clients. As a result, clients can understand their brand’s momentum and interact with their audience, successfully launching their products.

Architecture overview

Launchmetrics’ platform architecture is represented in Figure 1 and composed of three tiers:

  1. Crawl
  2. Data Persistence
  3. Processing
Launchmetrics backend architecture

Figure 1. Launchmetrics backend architecture

The Crawl tier is composed of several Amazon Elastic Compute Cloud (Amazon EC2) Spot Instances launched via Auto Scaling groups. Spot Instances take advantage of unused Amazon EC2 capacity at a discounted rate compared with On-Demand Instances, which are compute instances that are billed per-hour or -second with no long-term commitments. Launchmetrics heavily leverages Spot Instances. The Crawl tier is responsible for retrieving, processing, and storing data from several media sources (represented in Figure 1 with the number 1).

The Data Persistence tier consists of two components: Amazon Kinesis Data Streams and Amazon Simple Queue Service (Amazon SQS). Kinesis Data Streams stores data that the Crawl tier collects, while Amazon SQS stores the metadata of the whole process. In this context, metadata helps Launchmetrics gain insight into when the data is collected and if it has started processing. This is key information if a Spot Instance is interrupted, which we will dive deeper into later.

The third tier, Processing, also makes use of Spot Instances and is responsible for pulling data from the Data Persistence tier (represented in Figure 1 with the number 2). It then applies proprietary algorithms, both analytics and machine learning models, to create consumer insights. These insights are stored in a data layer (not depicted) that consists of an Amazon Aurora cluster and an Amazon OpenSearch Service cluster.

By having this separation of tiers, Launchmetrics is able to use a decoupled architecture, where each component can scale independently and is more reliable. Both the Crawl and the Data Processing tiers use Spot Instances for up to 90% of their capacity.

Data processing using EC2 Spot Instances

When Launchmetrics decided to migrate their workloads to the AWS cloud, Spot Instances were one of the main drivers. As Spot Instances offer large discounts without commitment, Launchmetrics was able to track more than 1200 brands, translating to 1+ billion end users. Daily, this represents tracking upwards of 500k influencer profiles, 8 million documents, and around 70 million social media comments.

Aside from the cost-savings with Spot Instances, Launchmetrics incurred collateral benefits in terms of architecture design: building stateless, decoupled, elastic, and fault-tolerant applications. In turn, their stack architecture became more loosely coupled, as well.

All Launchmetrics Auto Scaling groups have the following configuration:

  • Spot allocation strategy: cost-optimized
  • Capacity rebalance: true
  • Three availability zones
  • A diversified list of instance types

By using Auto Scaling groups, Launchmetrics is able to scale worker instances depending on how many items they have in the SQS queue, increasing the instance efficiency. Data processing workloads like the ones Launchmetrics’ platform have, are an exemplary use of multiple instance types, such as M5, M5a, C5, and C5a. When adopting Spot Instances, Launchmetrics considered other instance types to have access to spare capacity. As a result, Launchmetrics found out that workload’s performance improved, as they use instances with more resources at a lower cost.

By decoupling their data processing workload using SQS queues, processes are stopped when an interruption arrives. As the Auto Scaling group launches a replacement Spot Instance, clients are not impacted and data is not lost. All processes go through a data checkpoint, where a new Spot Instance resumes processing any pending data. Spot Instances have resulted in a reduction of up to 75% of related operational costs.

To increase confidence in their ability to deal with Spot interruptions and service disruptions, Launchmetrics is exploring using AWS Fault Injection Simulator to simulate faults on their architecture, like a Spot interruption. Learn more about how this service works on the AWS Fault Injection Simulator now supports Spot Interruptions launch page.

Reporting data insights

After processing data from different media sources, AWS aided Launchmetrics in producing higher quality data insights, faster: the previous on-premises architecture had a time range of 5-6 minutes to run, whereas the AWS-driven architecture takes less than 1 minute.

This is made possible by elasticity and availability compute capacity that Amazon EC2 provides compared with an on-premises static fleet. Furthermore, offloading some management and operational tasks to AWS by using AWS managed services, such as Amazon Aurora or Amazon OpenSearch Service, Launchmetrics can focus on their core business and improve proprietary solutions rather than use that time in undifferentiated activities.

Building continuous delivery pipelines

Let’s discuss how Launchmetrics makes changes to their software with so many components.

Both of their computing tiers, Crawl and Processing, consist of standalone EC2 instances launched via Auto Scaling groups and EC2 instances that are part of an Amazon Elastic Container Service (Amazon ECS) cluster. Currently, 70% of Launchmetrics workloads are still running with Auto Scaling groups, while 30% are containerized and run on Amazon ECS. This is important because for each of these workload groups, the deployment process is different.

For workloads that run on Auto Scaling groups, they use an AWS CodePipeline to orchestrate the whole process, which includes:

I.  Creating a new Amazon Machine Image (AMI) using AWS CodeBuild
II. Deploying the newly built AMI using Terraform in CodeBuild

For containerized workloads that run on Amazon ECS, Launchmetrics also uses a CodePipeline to orchestrate the process by:

III. Creating a new container image, and storing it in Amazon Elastic Container Registry
IV. Changing the container image in the task definition, and updating the Amazon ECS service using CodeBuild

Conclusion

In this blog post, we explored how Launchmetrics is using EC2 Spot Instances to reduce costs while producing high-quality data insights for their clients. We also demonstrated how decoupling an architecture is important for handling interruptions and why following Spot Instance best practices can grant access to more spare capacity.

Using this architecture, Launchmetrics produced faster, data-driven insights for their clients and increased their capacity to innovate. They are continuing to containerize their applications and are projected to have 100% of their workloads running on Amazon ECS with Spot Instances by the end of 2023.

To learn more about handling EC2 Spot Instance interruptions, visit the AWS Best practices for handling EC2 Spot Instance interruptions blog post. Likewise, if you are interested in learning more about AWS Fault Injection Simulator and how it can benefit your architecture, read Increase your e-commerce website reliability using chaos engineering and AWS Fault Injection Simulator.

How Facteus improved Quantamatics performance by adopting Amazon Aurora Serverless and Amazon EKS

Post Syndicated from Aishwarya Subramaniam original https://aws.amazon.com/blogs/architecture/how-facteus-improved-quantamatics-performance-by-adopting-amazon-aurora-serverless-and-amazon-eks/

Facteus Inc. is a leading provider of actionable insights from sensitive transaction data. Facteus safely transforms raw financial transaction data from legacy technologies into actionable information, without compromising data privacy, through its innovative synthetic data process. Quantamatics is one of Facteus’ core product offering.

Quantamatics accelerates the time it takes a user to go from raw alternative data to insights, by providing a cloud-based, turnkey research platform that handles data from ingestion to analysis. This platform saves the analysts, data researchers, and data scientists time by doing all the preparation and normalization efforts prior to working with the data for insight discovery. The provided cloud environment also allows for easy and flexible analysis of both provided and external data sources. Quantamatics is a SaaS offering with a subscription model that provides access to both the research platform and the associated Facteus datasets.

In June 2021, Facteus re-architected their monolithic Quantamatics application to use microservices. This blog will contrast the before and after states from a performance and management perspective as they migrated from Snowflake to Amazon Aurora Serverless v2 (Postgres) and from Amazon Elastic Compute Cloud (Amazon EC2) to Amazon Elastic Kubernetes Service (Amazon EKS).

A great place to start when evaluating existing workloads for fault tolerance and reliability is the AWS Well-Architected Framework. The Well-Architected Framework is designed to help cloud architects build secure, high-performing, resilient, and efficient infrastructure for their applications. Based on six pillars—operational excellence, security, reliability, performance efficiency, cost optimization, and sustainability—the Framework provides a consistent approach for customers to evaluate architectures, and implement designs that will scale over time.

The AWS Well-Architected Tool,  available at no charge in the AWS Management Console, lets you create self-assessments to identify and correct gaps in your current architecture. Adhering to Well-Architected principles, Facteus adopted managed services, such as Amazon EKS and Amazon Aurora Serverless, as they reduce efforts on provisioning, configuring, scaling, backing up, and so on. Additionally, using managed services helps to save on the overall costs of maintaining the services.

Facteus’ architecture overview

Before

Users can access Quantamatics for their research either through a Jupyter notebook or a Microsoft Excel plugin. Facteus used EC2 instances to directly host the underlying JupyterHub deployments and AWS Elastic Beanstalk to deploy APIs.

The legacy architecture, while cloud-based, had multiple issues that made it ineffective from a maintenance, scalability, and cost perspective (as demonstrated in Figure 1):

  • JupyterHub does not currently support high availability (HA) natively. This meant an EC2 failover would require relatively long unavailability while a replacement EC2 node spun up or potentially double the cost to keep an idle node on standby.
    • Also, with the EC2 instances being specialized, portions of each EC2 instance will remain unused, resulting in unnecessary costs compared to more modern solutions such as Amazon EKS, which can pool and divide up instances in a more granular fashion.
    • Finally, as the EC2 instances were standalone, solutions would need to be set up to both monitor application health and perform the appropriate actions in case of an outage.
  • Although Elastic Beanstalk was a great way to deploy API instances in an HA and scalable way, to completely modernize and remain consistent throughout application to a microservice-based architecture, Facteus migrated their Elastic Beanstalk instances as well, to better utilize the pooled resources.
Cloud-based legacy architecture

Figure 1. Cloud-based legacy architecture

Quantamatics requires a Data Warehouse solution to constantly run behind an API to allow for acceptable request and response times. While Snowflake is a great data warehousing and big data querying solution, Facteus found it expensive for their deployment. The queries that the Quantamatics APIs run are typically not computationally expensive but do end up returning relatively large amounts of data. This makes transferring the results back to the API over the internet a potential bottleneck.

To address these bottlenecks, Facteus re-architected their application into an Amazon EKS based one, backed with Aurora Serverless v2 (Postgres).

The new architecture resolves the previous problems in two ways (Figure 2):

  • By using Aurora Serverless v2 (Postgres) to store and query the datasets used by the API within the same VPC instead of Snowflake, it kept the query run time relatively the same but drastically decreased both the transfer time and the associated costs due to the locality of the database as well as the cost and scalability of Aurora Serverless v2.
  • By switching to Amazon EKS, the underlying EC2 nodes could easily be pooled and more thoroughly utilized across the various deployments, thus reducing costs. Additionally, as the deployments were now containerized, an outage would result in the quick relocation of those containerized apps (pods) to nodes with capacity, thus reducing downtime and cost.
    • As a side benefit with the move to managed nodes on Amazon EKS, this completely removed the node patching overhead, as Amazon EKS safely handles the patching of the underlying nodes with a single command.
    • Amazon EKS monitors and restarts pods automatically, which eliminated the need to set up and manage a solution that monitors pod health and takes the appropriate actions upon failures.
Contemporary architecture with Amazon EKS and Aurora Serverless v2 (Postgres)

Figure 2. Contemporary architecture with Amazon EKS and Aurora Serverless v2 (Postgres)

Auto scaling with Amazon EKS and Aurora Serverless

  • Amazon EKS helped to greatly reduce the overhead of setting up and managing the auto scaling of Quantamatics in two ways:
    • User compute environments could be spun up as isolated pods, with Amazon EKS spinning nodes up and down automatically based on demand.
    • API instances could also be automatically spun up and down based on network throughput metrics queried by Amazon EKS to handle the requests made by users in a timely fashion.
  • Aurora Serverless v2
    • With Aurora Serverless v2, the needed compute capacity of the database automatically scales based on load generated by the corresponding API requests. This both reduced the cost as the load varies heavily throughout the day, reducing the management overhead of handling spinning up and down of read replicas if other solutions were used instead.

Snowflake vs. Aurora Serverless V2 (Postgres) – Quantamatics query performance and cost comparison

The following steps were performed to migrate data from Snowflake to Aurora Serverless v2:

  • Use the Snowflake COPY INTO <location> command to copy the data from the Snowflake database table into one or more files in an S3 bucket.
  • Create tables in Aurora Serverless. Use the create_s3_uri function to load variables.
  • Use the aws_s3.table_import_from_s3 function to import the data file from an Amazon S3 file name prefix.
  • Verify that the information was loaded.

This blog post describes importing data from Amazon S3 to Amazon Aurora PostgreSQL.

Testing strategy: Run the corresponding CLI database utility for each database (snowsql vs psql) from within the VPC. Run the same query on each dataset. Return and write the results as CSV to a local file.
Data set size: ~178,000,000 rows
Result set size: ~418,000 rows

Data source Configuration Results
Snowflake Snowflake: Medium Warehouse (running), AWS based in same Region as APIs

  • Cost: ~$0.01 per query based on credit usage
  • 21.99 seconds run time
  • 3.36 seconds run time, 18.63 seconds transfer time
Aurora Serverless V2(Postgres) Idling on four Aurora Compute Units (ACU)

  • Cost: ~$0.24 an hour
  • Tables and indexes tuned for Quantamatics use cases
  • 7.00 seconds run time
  • 3.58 seconds run time, 3.42 seconds transfer time

Conclusion

The customer was able to achieve similar run times for the given dataset and query, but faster transfer speeds from Aurora Serverless due to the locality of the database. They also realized up to ~40x runtime cost savings by using Aurora Serverless—1,000 queries in Aurora Serverless vs. ~24 queries in Snowflake for the same cost.

Note: These results are specific to Quantamatics use cases where queries are fixed and well-known, and relatively limited in terms of complexity. This allowed the tables and database in Aurora Serverless v2 to be tuned for those specific purposes.

AWS recommends customers review their workloads using the AWS Well-Architected Tool to help ensure that their workloads are performant, secure, and cost-optimized. Well-Architected Framework Reviews are excellent opportunities to work together with your AWS account team and key stakeholders to discuss how modern infrastructure can help you win in the market.

Amazon Personalize customer outreach on your ecommerce platform

Post Syndicated from Sridhar Chevendra original https://aws.amazon.com/blogs/architecture/amazon-personalize-customer-outreach-on-your-ecommerce-platform/

In the past, brick-and-mortar retailers leveraged native marketing and advertisement channels to engage with consumers. They have promoted their products and services through TV commercials, and magazine and newspaper ads. Many of them have started using social media and digital advertisements. Although marketing approaches are beginning to modernize and expand to digital channels, businesses still depend on expensive marketing agencies and inefficient manual processes to measure campaign effectiveness and understand buyer behavior. The recent pandemic has forced many retailers to take their businesses online. Those who are ready to embrace these changes have embarked on a technological and digital transformation to connect to their customers. As a result, they have begun to see greater business success compared to their peers.

Digitizing a business can be a daunting task, due to lack of expertise and high infrastructure costs. By using Amazon Web Services (AWS), retailers are able to quickly deploy their products and services online with minimal overhead. They don’t have to manage their own infrastructure. With AWS, retailers have no upfront costs, have minimal operational overhead, and have access to enterprise-level capabilities that scale elastically, based on their customers’ demands. Retailers can gain a greater understanding of customers’ shopping behaviors and personal preferences. Then, they are able to conduct effective marketing and advertisement campaigns, and develop and measure customer outreach. This results in increased satisfaction, higher retention, and greater customer loyalty. With AWS you can manage your supply chain and directly influence your bottom line.

Building a personalized shopping experience

Let’s dive into the components involved in building this experience. The first step in a retailer’s digital transformation journey is to create an ecommerce platform for their customers. This platform enables the organization to capture their customers’ actions, also referred to as ‘events’. Some examples of events are clicking on the shopping site to browse product categories, searching for a particular product, adding an item to the shopping cart, and purchasing a product. Each of these events gives the organization information about their customer’s intent, which is invaluable in creating a personalized experience for that customer. For instance, if a customer is browsing the “baby products” category, it indicates their interest in that category even if a purchase is not made. These insights are typically difficult to capture in an in-store experience. Online shopping makes gaining this knowledge much more straightforward and scalable.

The proposed solution outlines the use of AWS services to create a digital experience for a retailer and consumers. The three key areas are: 1) capturing customer interactions, 2) making real-time recommendations using AWS managed Artificial Intelligence/Machine Learning (AI/ML) services, and 3) creating an analytics platform to detect patterns and adjust customer outreach campaigns. Figure 1 illustrates the solution architecture.

Digital shopping experience architecture

Figure 1. Digital shopping experience architecture

For this use case, let’s assume that you are the owner of a local pizzeria, and you manage deliveries through an ecommerce platform like Shopify or WooCommerce. We will walk you through how to best serve your customer with a personalized experience based on their preferences.

The proposed solution consists of the following components:

  1. Data collection
  2. Promotion campaigns
  3. Recommendation engine
  4. Data analytics
  5. Customer reachability

Let’s explore each of these components separately.

Data collection with Amazon Kinesis Data Streams

When a customer uses your web/mobile application to order a pizza, the application captures their activity as click-stream ‘events’. These events provide valuable insights about your customers’ behavior. You can use these insights to understand the trends and browsing pattern of prospects who visited your web/mobile app, and use the data collected for creating promotion campaigns. As your business scales, you’ll need a durable system to preserve these events against system failures, and scale based on unpredictable traffic on your platform.

Amazon Kinesis is a Multi-AZ, managed streaming service that provides resiliency, scalability, and durability to capture an unlimited number of events without any additional operational overhead. Using Kinesis producers (Kinesis Agent, Kinesis Producer Library, and the Kinesis API), you can configure applications to capture your customer activity. You can ingest these events from the frontend, and then publish them to Amazon Kinesis Data Streams.

Let us start by setting up Amazon Kinesis Data Streams to capture the real-time sales transactions from the online channels like a portal or mobile app. For this blog post, we have used the Kaggle’s public data set as a reference. Figure 2 illustrates a snapshot of sample data to build personalized recommendations for a customer.

Sample sales transaction data

Figure 2. Sample sales transaction data

Promotion campaigns with AWS Lambda

One way to increase customer conversion is by offering discounts. When the customer adds a pizza to their cart, you want to make sure they are receiving the best deal. Let’s assume that by adding an additional item, your customer will receive the best possible discount. Just by knowing the total cost of added items to the cart, you can provide these relevant promotions to this customer.

For this scenario, the AWS Lambda service polls the Amazon Kinesis Data Streams to read all the events in the stream. It then matches the events based on your criteria of items in the cart. In turn, these events will be processed by the Lambda function. The Lambda function will read your up-to-date promotions stored in Amazon DynamoDB. As an option, caching recent or most popular promotions will improve your application response time, as well as improve the customer experience on your platform. Amazon DynamoDB DAX is an integrated caching for DynamoDB that caches the most recent or popular promotions or items.

For example, when the customer added the items to their shopping cart, Lambda will send promotion details to them based on the purchase amount. This can be for free shipping or discount of a certain percentage. Figure 3 illustrates the snapshot of sample promotions.

Promotions table in DynamoDB

Figure 3. Promotions table in DynamoDB

Recommendations engine with Amazon Personalize

In addition to sharing these promotions with your customer, you may also want to share the recommended add-ons. In order to understand your customer preferences, you must gather historical datasets to determine patterns and generate relevant recommendations. Since web activity consists of millions of events, this would be a daunting task for humans to review, determine the patterns, and make recommendations. And since user preferences change, you need a system that can use all this volume of data and provide accurate predictions.

Amazon Personalize is a managed AI/ML service that will help you to train an ML model based on datasets. It provides an inference point for real-time recommendations prior to having ML experience. Based on the datasets, Amazon Personalize also provides recipes to generate recommendations. As your customers interact on the ecommerce platform, your frontend application calls Amazon Personalize inference endpoints. It then retrieves a set of personalized recommendations based on your customer preferences.

Here is the sample Python code to display the list of available recommenders, and associated recommendations.

import boto3
import json
client = boto3.client('personalize')

# Connect to the personalize runtime for the customer recommendations

recomm_endpoint = boto3.client('personalize-runtime')
response = recomm_endpoint.get_recommendations(itemId='79323P',
  recommenderArn='arn:aws:personalize:us-east-1::recommender/my-items',
  numResults=5)

print(json.dumps(response['itemList'], indent=2))

[
  {
    "itemId": "79323W"
  },
  {
    "itemId": "79323GR"
  },
  {
    "itemId": "79323LP"
  },
  {
  "itemId": "79323B"
  },
  {
    "itemId": "79323G"
  }
]

You can use Amazon Kinesis Data Firehose to read the data near real time from the Amazon Kinesis Data Streams collected the data from the front-end applications. Then you can store this data in Amazon Simple Storage Service (S3). Amazon S3 is peta-byte scale storage help you scale and acts as a repository and single source of truth. We use S3 data as seed data to build a personalized recommendation engine using Amazon Personalize. As your customers interact on the ecommerce platform, call the Amazon Personalize inference endpoint to make personalized recommendations based on user preferences.

Customer reachability with Amazon Pinpoint

If a customer adds products to their cart but never checks out, you may want to send them a reminder. You can set up an email to suggest they re-order after a period of time after their first order. Or you may want to send them promotions based on their preferences. And as your customers’ behavior changes, you probably want to adapt your messaging accordingly.

Your customer may have a communication preference, such as phone, email, SMS, or in-app notifications. If an order has an issue, you can inform the customer as soon as possible using their preferred method of communication, and perhaps follow it up with a discount.

Amazon Pinpoint is a flexible and scalable outbound and inbound marketing communications service. You can add users to Audience Segments, create reusable content templates integrated with Amazon Personalize, and run scheduled campaigns. With Amazon Pinpoint journeys, you can send action or time-based notifications to your users.

The following workflow shown in Figure 4, illustrates customer communication workflow for promotion. A journey is created for a cohort of college students: a “Free Drink” promotion is offered with a new order. You can send this promotion over email. If the student opens the email, you can immediately send them a push notification reminding them to place an order. But if they didn’t open this email, you could wait three days, and follow up with a text message.

Promotion workflow in Amazon Pinpoint

Figure 4. Promotion workflow in Amazon Pinpoint

Data analytics with Amazon Athena and Amazon QuickSight

To understand the effectiveness of your campaigns, you can use S3 data as a source for Amazon Athena. Athena is an interactive query service that analyzes data in Amazon S3 using standard SQL. Athena is serverless, so there is no infrastructure to manage, and you pay only for the queries that you run.

There are different ways to create visualizations in Amazon QuickSight. For instance, you can use Amazon S3 as a data lake. One option is to import your data into SPICE (Super-fast, Parallel, In-memory Calculation Engine) to provide high performance and concurrency. You can also create a direct connection to the underlying data source. For this use case, we choose to import to SPICE, which provides faster visualization in a production setup. Schedule consistent refreshes to help ensure that dashboards are referring to the most current data.

Once your data is imported to your SPICE, review QuickSight’s visualization dashboard. Here, you’ll be able to choose from a wide variety of charts and tables, while adding interactive features like drill downs and filters.

The process following illustrates how to create a customer outreach strategy using ZIP codes, and allocate budgets to the marketing campaigns accordingly. First, we use this sample SQL command that we ran in Athena to query for top 10 pizza providers. The results are shown in Figure 5.

SELECT name, count(*) as total_count FROM "analyticsdemodb"."fooddatauswest2"
group by name
order by total_count desc
limit 10

Athena query results for top 10 pizza providers

Figure 5. Athena query results for top 10 pizza providers

Second, here is the sample SQL command that we ran in Athena to find Total pizza counts by postal code (ZIP code). Figure 6 shows a visualization to help create customer outreach strategy per ZIP codes and budget the marketing campaigns accordingly.

SELECT postalcode, count(*) as total_count FROM "analyticsdemodb"."fooddatauswest2"
where postalcode is not null
group by postalcode
order by total_count desc limit 50;

QuickSight visualization showing pizza orders by zip codes

Figure 6. QuickSight visualization showing pizza orders by zip codes

Conclusion

AWS enables you to build an ecommerce platform and scale your existing business with minimal operational overhead and no upfront costs. You can augment your ecommerce platform by building personalized recommendations and effective marketing campaigns based on your customer needs. The solution approach provided in the blog will help organizations build re-usable architecture pattern and personalization using AWS managed services.

Let’s Architect! Architecting with custom chips and accelerators

Post Syndicated from Luca Mezzalira original https://aws.amazon.com/blogs/architecture/lets-architect-custom-chips-and-accelerators/

It’s hard to imagine a world without computer chips. They are at the heart of the devices that we use to work and play every day. Currently, Amazon Web Services (AWS) is offering customers the next generation of computer chip, with lower cost, higher performance, and a reduced carbon footprint.

This edition of Let’s Architect! focuses on custom computer chips, accelerators, and technologies developed by AWS, such as AWS Nitro System, custom-designed Arm-based AWS Graviton processors that support data-intensive workloads, as well as AWS Trainium, and AWS Inferentia chips optimized for machine learning training and inference.

In this post, we discuss these new AWS technologies, their main characteristics, and how to take advantage of them in your architecture.

Deliver high performance ML inference with AWS Inferentia

As Deep Learning models become increasingly large and complex, the training cost for these models increases, as well as the inference time for serving.

With AWS Inferentia, machine learning practitioners can deploy complex neural-network models that are built and trained on popular frameworks, such as Tensorflow, PyTorch, and MXNet on AWS Inferentia-based Amazon EC2 Inf1 instances.

This video introduces you to the main concepts of AWS Inferentia, a service designed to reduce both cost and latency for inference. To speed up inference, AWS Inferentia: selects and shares a model across multiple chips, places pieces inside the on-chip cache, then streams the data via pipeline for low-latency predictions.

Presenters discuss through the structure of the chip, software considerations, as well as anecdotes from the Amazon Alexa team, who uses AWS Inferentia to serve predictions. If you want to learn more about high throughput coupled with low latency, explore Achieve 12x higher throughput and lowest latency for PyTorch Natural Language Processing applications out-of-the-box on AWS Inferentia on the AWS Machine Learning Blog.

AWS Inferentia shares a model across different chips to speed up inference

AWS Inferentia shares a model across different chips to speed up inference

AWS Lambda Functions Powered by AWS Graviton2 Processor – Run Your Functions on Arm and Get Up to 34% Better Price Performance

AWS Lambda is a serverless, event-driven compute service that enables code to run from virtually any type of application or backend service, without provisioning or managing servers. Lambda uses a high-availability compute infrastructure and performs all of the administration of the compute resources, including server- and operating-system maintenance, capacity-provisioning, and automatic scaling and logging.

AWS Graviton processors are designed to deliver the best price and performance for cloud workloads. AWS Graviton3 processors are the latest in the AWS Graviton processor family and provide up to: 25% increased compute performance, two-times higher floating-point performance, and two-times faster cryptographic workload performance compared with AWS Graviton2 processors. This means you can migrate AWS Lambda functions to Graviton in minutes, plus get as much as 19% improved performance at approximately 20% lower cost (compared with x86).

Comparison between x86 and Arm/Graviton2 results for the AWS Lambda function computing prime numbers

Comparison between x86 and Arm/Graviton2 results for the AWS Lambda function computing prime numbers (click to enlarge)

Powering next-gen Amazon EC2: Deep dive on the Nitro System

The AWS Nitro System is a collection of building-block technologies that includes AWS-built hardware offload and security components. It is powering the next generation of Amazon EC2 instances, with a broadening selection of compute, storage, memory, and networking options.

In this session, dive deep into the Nitro System, reviewing its design and architecture, exploring new innovations to the Nitro platform, and understanding how it allows for fasting innovation and increased security while reducing costs.

Traditionally, hypervisors protect the physical hardware and bios; virtualize the CPU, storage, networking; and provide a rich set of management capabilities. With the AWS Nitro System, AWS breaks apart those functions and offloads them to dedicated hardware and software.

AWS Nitro System separates functions and offloads them to dedicated hardware and software, in place of a traditional hypervisor

AWS Nitro System separates functions and offloads them to dedicated hardware and software, in place of a traditional hypervisor

How Amazon migrated a large ecommerce platform to AWS Graviton

In this re:Invent 2021 session, we learn about the benefits Amazon’s ecommerce Datapath platform has realized with AWS Graviton.

With a range of 25%-40% performance gains across 53,000 Amazon EC2 instances worldwide for Prime Day 2021, the Datapath team is lowering their internal costs with AWS Graviton’s improved price performance. Explore the software updates that were required to achieve this and the testing approach used to optimize and validate the deployments. Finally, learn about the Datapath team’s migration approach that was used for their production deployment.

AWS Graviton2: core components

AWS Graviton2: core components

See you next time!

Thanks for exploring custom computer chips, accelerators, and technologies developed by AWS. Join us in a couple of weeks when we talk more about architectures and the daily challenges faced while working with distributed systems.

Other posts in this series

Looking for more architecture content?

AWS Architecture Center provides reference architecture diagrams, vetted architecture solutions, Well-Architected best practices, patterns, icons, and more!

Maintain visibility over the use of cloud architecture patterns

Post Syndicated from Rostislav Markov original https://aws.amazon.com/blogs/architecture/maintain-visibility-over-the-use-of-cloud-architecture-patterns/

Cloud platform and enterprise architecture teams use architecture patterns to provide guidance for different use cases. Cloud architecture patterns are typically aggregates of multiple Amazon Web Services (AWS) resources, such as Elastic Load Balancing with Amazon Elastic Compute Cloud, or Amazon Relational Database Service with Amazon ElastiCache. In a large organization, cloud platform teams often have limited governance over cloud deployments, and, therefore, lack control or visibility over the actual cloud pattern adoption in their organization.

While having decentralized responsibility for cloud deployments is essential to scale, a lack of visibility or controls leads to inefficiencies, such as proliferation of infrastructure templates, misconfigurations, and insufficient feedback loops to inform cloud platform roadmap.

To address this, we present an integrated approach that allows cloud platform engineers to share and track use of cloud architecture patterns with:

  1. AWS Service Catalog to publish an IT service catalog of codified cloud architecture patterns that are pre-approved for use in the organization.
  2. Amazon QuickSight to track and visualize actual use of service catalog products across the organization.

This solution enables cloud platform teams to maintain visibility into the adoption of cloud architecture patterns in their organization and build a release management process around them.

Publish architectural patterns in your IT service catalog

We use AWS Service Catalog to create portfolios of pre-approved cloud architecture patterns and expose them as self-service to end users. This is accomplished in a shared services AWS account where cloud platform engineers manage the lifecycle of portfolios and publish new products (Figure 1). Cloud platform engineers can publish new versions of products within a portfolio and deprecate older versions, without affecting already-launched resources in end-user AWS accounts. We recommend using organizational sharing to share portfolios with multiple AWS accounts.

Application engineers launch products by referencing the AWS Service Catalog API. Access can be via infrastructure code, like AWS CloudFormation and TerraForm, or an IT service management tool, such as ServiceNow. We recommend using a multi-account setup for application deployments, with an application deployment account hosting the deployment toolchain: in our case, using AWS developer tools.

Although not explicitly depicted, the toolchain can be launched as an AWS Service Catalog product and include pre-populated infrastructure code to bootstrap initial product deployments, as described in the blog post Accelerate deployments on AWS with effective governance.

Launching cloud architecture patterns as AWS Service Catalog products

Figure 1. Launching cloud architecture patterns as AWS Service Catalog products

Track the adoption of cloud architecture patterns

Track the usage of AWS Service Catalog products by analyzing the corresponding AWS CloudTrail logs. The latter can be forwarded to an Amazon EventBridge rule with a filter on the following events: CreateProduct, UpdateProduct, DeleteProduct, ProvisionProduct and TerminateProvisionedProduct.

The logs are generated no matter how you interact with the AWS Service Catalog API, such as through ServiceNow or TerraForm. Once in EventBridge, Amazon Kinesis Data Firehose delivers the events to Amazon Simple Storage Service (Amazon S3) from where QuickSight can access them. Figure 2 depicts the end-to-end flow.

Tracking adoption of AWS Service Catalog products with Amazon QuickSight

Figure 2. Tracking adoption of AWS Service Catalog products with Amazon QuickSight

Depending on your AWS landing zone setup, CloudTrail logs from all relevant AWS accounts and regions need to be forwarded to a central S3 bucket in your shared services account or, otherwise, centralized logging account. Figure 3 provides an overview of this cross-account log aggregation.

Aggregating AWS Service Catalog product logs across AWS accounts

Figure 3. Aggregating AWS Service Catalog product logs across AWS accounts

If your landing zone allows, consider giving permissions to EventBridge in all accounts to write to a central event bus in your shared services AWS account. This avoids having to set up Kinesis Data Firehose delivery streams in all participating AWS accounts and further simplifies the solution (Figure 4).

Aggregating AWS Service Catalog product logs across AWS accounts to a central event bus

Figure 4. Aggregating AWS Service Catalog product logs across AWS accounts to a central event bus

If you are already using an organization trail, you can use Amazon Athena or AWS Lambda to discover the relevant logs in your QuickSight dashboard, without the need to integrate with EventBridge and Kinesis Data Firehose.

Reporting on product adoption can be customized in QuickSight. The S3 bucket storing AWS Service Catalog logs can be defined in QuickSight as datasets, for which you can create an analysis and publish as a dashboard.

In the past, we have reported on the top ten products used in the organization (if relevant, also filtered by product version or time period) and the top accounts in terms of product usage. The following figure offers an example dashboard visualizing product usage by product type and number of times they were provisioned. Note: the counts of provisioned and terminated products differ slightly, as logging was activated after the first products were created and provisioned for demonstration purposes.

Example Amazon QuickSight dashboard tracking AWS Service Catalog product adoption

Figure 5. Example Amazon QuickSight dashboard tracking AWS Service Catalog product adoption

Conclusion

In this blog, we described an integrated approach to track adoption of cloud architecture patterns using AWS Service Catalog and QuickSight. The solution has a number of benefits, including:

  • Building an IT service catalog based on pre-approved architectural patterns
  • Maintaining visibility into the actual use of patterns, including which patterns and versions were deployed in the organizational units’ AWS accounts
  • Compliance with organizational standards, as architectural patterns are codified in the catalog

In our experience, the model may compromise on agility if you enforce a high level of standardization and only allow the use of a few patterns. However, there is the potential for proliferation of products, with many templates differing slightly without a central governance over the catalog. Ideally, cloud platform engineers assume responsibility for the roadmap of service catalog products, with formal intake mechanisms and feedback loops to account for builders’ localization requests.