Tag Archives: Architecture

Author Spotlight: Lewis Tang, Senior Partner Solution Architect in Transformation and Modernization

Post Syndicated from Elise Chahine original https://aws.amazon.com/blogs/architecture/author-spotlight-lewis-tang-senior-partner-solution-architect-in-transformation-and-modernization/

The Author Spotlight series pulls back the curtain on some of AWS’s most prolific authors. Read on to find out more about our very own Lewis Tang’s journey, in his own words!


I have been a Senior Partner Solution Architect since joining Amazon Web Services (AWS) in 2019. What I really enjoy about this role is helping AWS partners build successful businesses with AWS services. Not only does this satisfy the customer need, but it clearly demonstrates what we at Amazon use to drive every decision: customer obsession! At AWS, we are encouraged to pick an area of expertise and dive deep into it. I am passionate about helping AWS customers and partners to plan and drive transformation through cloud adoption: transformation and modernization are my areas of expertise!

Whether it’s an AWS service partner in consulting business or an AWS ISV partner offering software services, building products and winning customer mindshare can be very challenging. To Amazonians, every day is Day 1. Learning with partners about these challenges and collaborating on solving problems are big parts of my daily Day 1.

Prior to joining AWS, I was a transformation architect for close to a decade. I travelled to work with customers throughout Australia, New Zealand, and the ASEAN region on their cloud transformation strategy, cloud governance and management, and to build their cloud foundational capabilities. Learning with customers face-to-face, diving deep into the industry problems, and helping them invent and simplify their business practices taught me how to leverage the power of cloud technology to deliver results. These experiences made me want to pursue this with AWS.

Now, I collaborate with partners at AWS, working backwards from their target business outcomes to identify and implement the solutions that will boost their success rates. I also provide guidance on adopting wide range of AWS services to develop an offering that can scale and solve specific problems in an efficient and cost-effective manner.

Many folks know about the AWS 7Rs migration strategy. What you may not know is I am an enthusiastic practitioner of Replatform and Refactor/Re-architect to modernize business applications. To promote and scale the adoption of modernization best practices, I work with other subject-matter experts in the Application Modernization Technical Field Community to develop thought leadership content and publish whitepapers, blogs, and prescriptive guidance (I share my favorites a little later).

I have recently created a Back to Basics video, which explores multiple patterns of running Microsoft SQL data service on AWS and the automation that these options provide, allowing you to refocus on business innovation.

At events like AWS Global Summits or AWS re:Invent, I receive feedback on these publications and answer questions about application modernization. With partners who are present at these congresses, I am able to provide guidance on building and modernizing their applications with AWS services.

In my role with AWS, I am educated and rewarded daily: I learn a lot from my AWS partners when working with them to integrate AWS services into their intellectual property solutions and tool chains, which helps to accelerate AWS customer application modernization journey. Throughout these experiences, I became a SME of modernization. It’s educational and fulfilling to help builders, customers, and partners solve their most difficult problems.

Lewis’s favorite posts!

What to consider when migrating data warehouse to Amazon Redshift

My very first blog at AWS! Many customers are looking to modernize data warehouses by migrating to Amazon Redshift because their existing data warehouse is not built for today’s data analytics needs (like data types, volume, and velocity).

A data warehouse migration project can be challenging. This post helps you secure a successful delivery of a data warehouse migration project by discussing data warehouse migration strategies and the adoption of an optimal migration process for a presented use case and the best practices of AWS migration tools, such as AWS Schema Conversion Tool.

What to consider when migrating data warehouse to Amazon Redshift

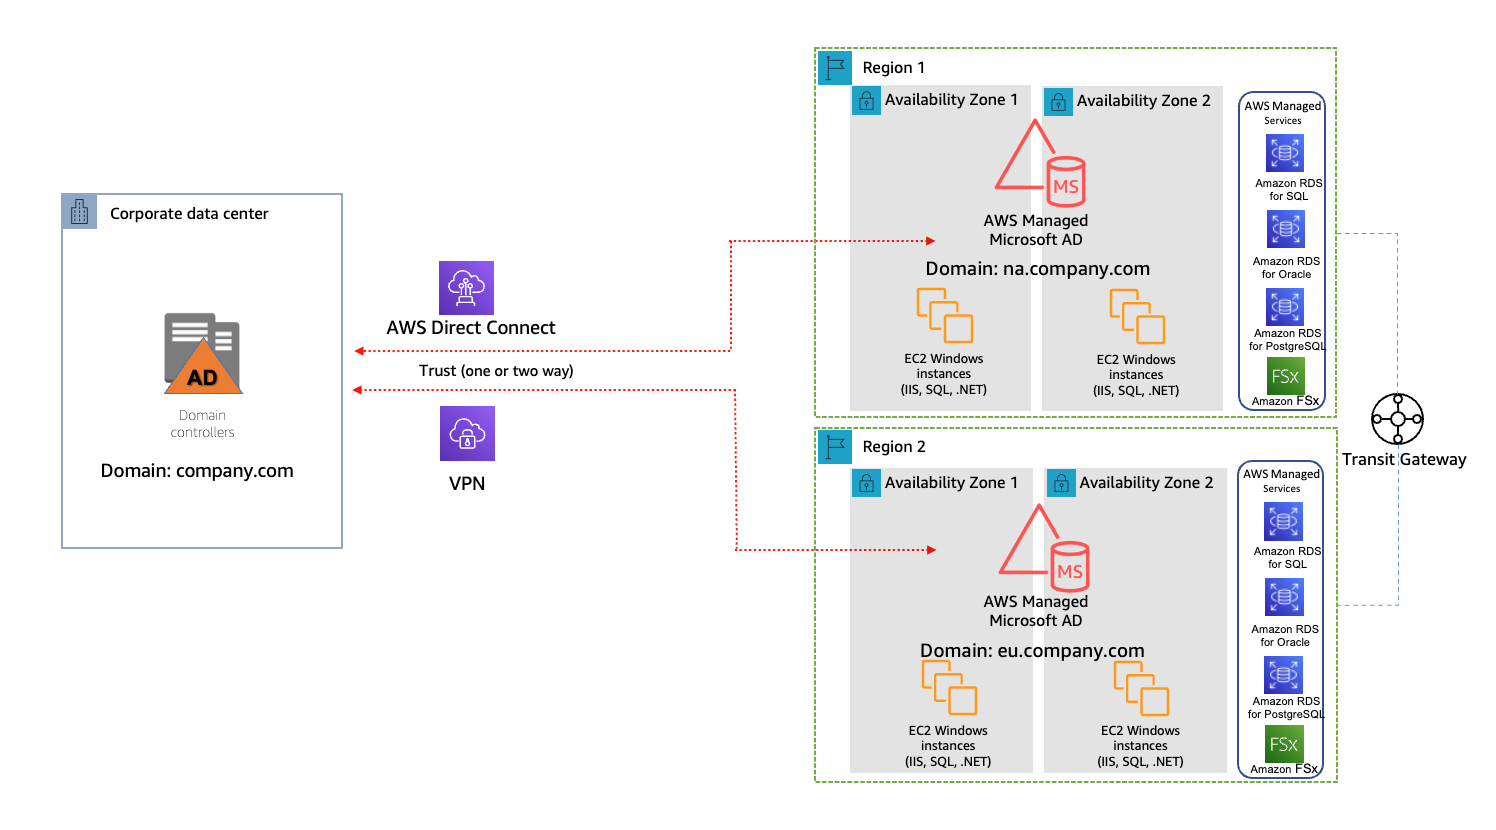
Running hybrid Active Directory service with AWS Managed Microsoft Active Directory

When migrating and modernizing application with AWS, customers often need to have applications on AWS to work with other applications located outside of AWS, such as an on-premise data center. Many of these applications use Microsoft Active Directory (AD) service for authentication, configuration, and management.

In this post, I discuss the benefits of using AWS Managed Microsoft Active Directory service and the design patterns of a hybrid AD service using AWS Managed Microsoft AD.

A single AWS account and multi-region model

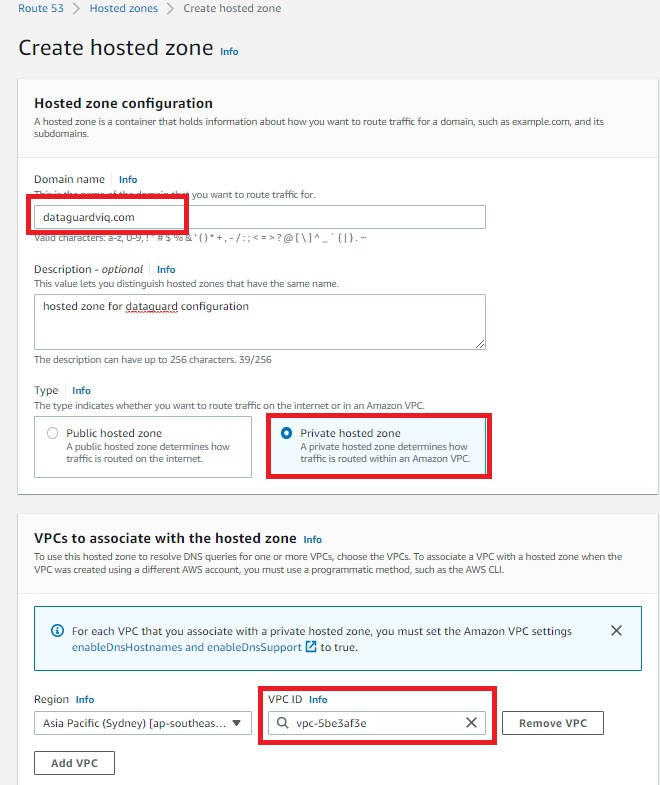
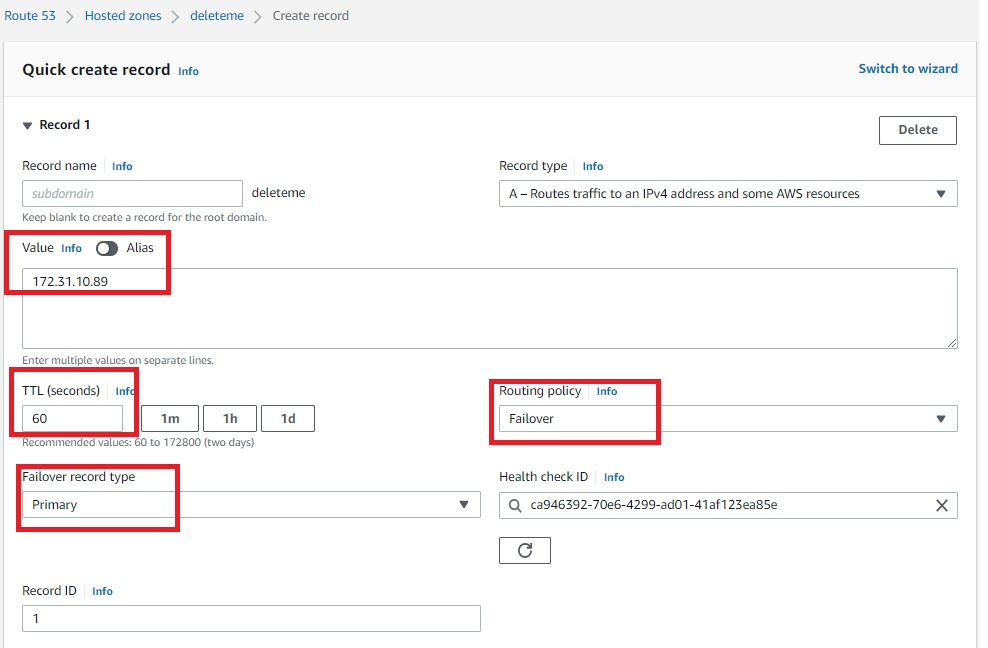
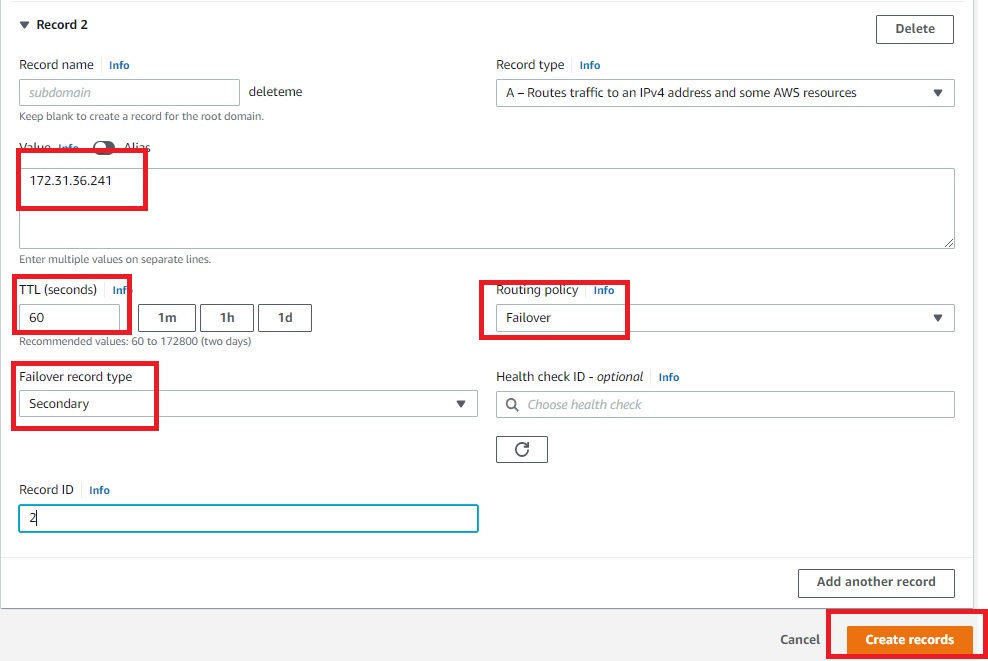
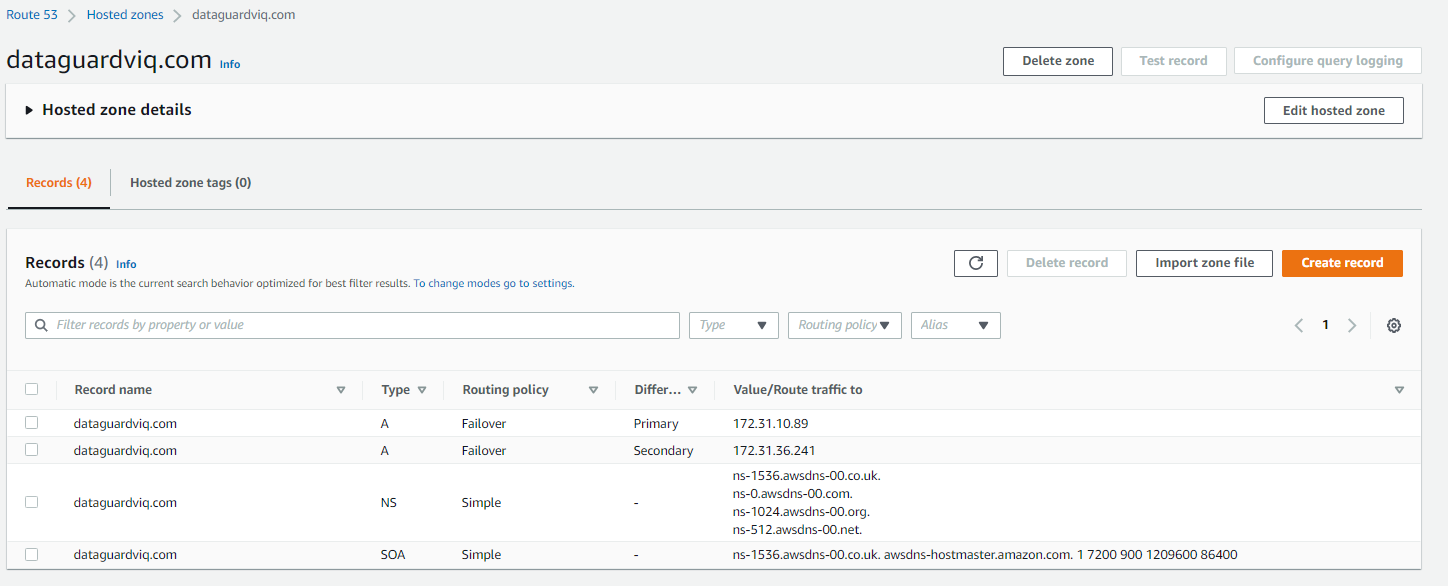
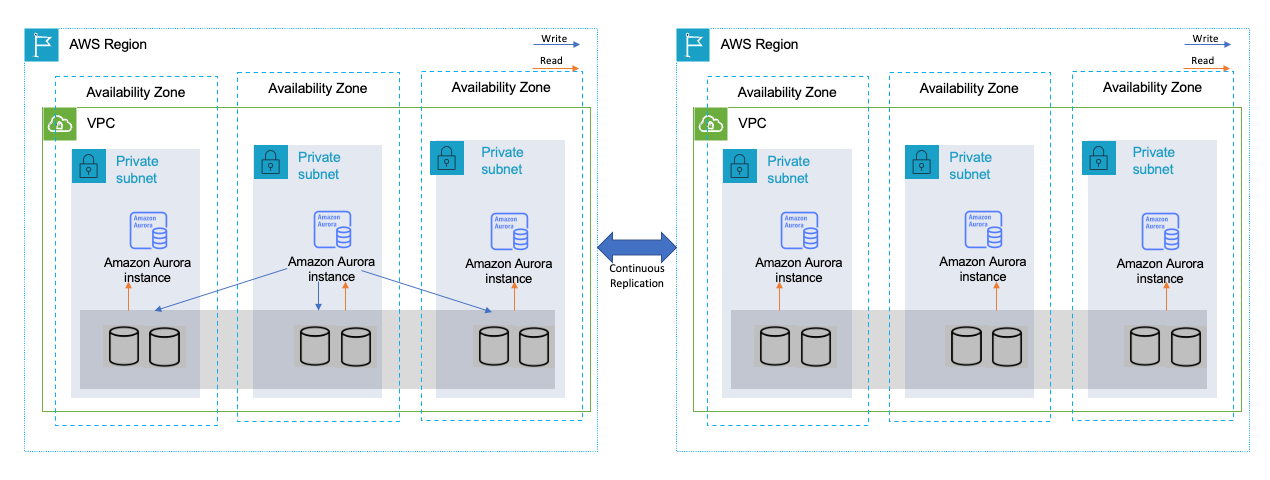
Considerations for modernizing Microsoft SQL database service with high availability on AWS

Microsoft SQL database is a common relational database service. AWS customers often lift-and-shift a Microsoft SQL database to AWS, and they seek guidance on how to architect high-availability database service on Amazon Elastic Compute Cloud (Amazon EC2) in single or multiple AWS region scenario.

In this post, I shared all the options of modernizing Microsoft SQL database service with high availability on AWS, including lift-and-shift to Amazon EC2, replatform with Amazon Relational Database Service, and refactor with Amazon Aurora.

High availability across multiple Regions with Amazon Aurora global databases

Augmentation patterns to modernize a mainframe on AWS

I’ve had pleasure working with an AWS partner on building an AWS-focused mainframe modernization practice. I learned side-by-side with my partner using mainframe modernization use cases. By working with AWS Mainframe Modernization service team and SMEs in Technical Field Community, I published this post to share the design patterns of modernizing a mainframe through building augmentation solutions on AWS. Plus, my partner is building service offerings based on these patterns!

Mainframe data backup and archival augmentation

Strengthening Cloud Governance and Optimizing FinOps with LTI Infinity Ensure

My very first AWS Partner Network blog, co-authored with my AWS partner Larsen and Toubro Infotech (LTI). At AWS, customer obsession is probably everyone’s favorite leadership principle—and, perhaps, it is the best-known leadership principle among AWS customers.

As a partner solution architect, AWS partners—like LTI—are my immediate customers. Nothing excites me more than working with my partner to make a solution better and publish a blog explaining it to all AWS readers!

Strengthening Cloud Governance and Optimizing FinOps with LTI Infinity Ensure

Deploying IBM Cloud Pak for Data on Red Hat OpenShift Service on AWS

Post Syndicated from Eduardo Monich Fronza original https://aws.amazon.com/blogs/architecture/deploying-ibm-cloud-pak-for-data-on-red-hat-openshift-service-on-aws/

Amazon Web Services (AWS) customers who are looking for a more intuitive way to deploy and use IBM Cloud Pak for Data (CP4D) on the AWS Cloud, can now use the Red Hat OpenShift Service on AWS (ROSA).

ROSA is a fully managed service, jointly supported by AWS and Red Hat. It is managed by Red Hat Site Reliability Engineers and provides a pay-as-you-go pricing model, as well as a unified billing experience on AWS.

With this, customers do not manage the lifecycle of Red Hat OpenShift Container Platform clusters. Instead, they are free to focus on developing new solutions and innovating faster, using IBM’s integrated data and artificial intelligence platform on AWS, to differentiate their business and meet their ever-changing enterprise needs.

CP4D can also be deployed from the AWS Marketplace with self-managed OpenShift clusters. This is ideal for customers with requirements, like Red Hat OpenShift Data Foundation software defined storage, or who prefer to manage their OpenShift clusters.

In this post, we discuss how to deploy CP4D on ROSA using IBM-provided Terraform automation.

Cloud Pak for data architecture

Here, we install CP4D in a highly available ROSA cluster across three availability zones (AZs); with three master nodes, three infrastructure nodes, and three worker nodes.

Review the AWS Regions and Availability Zones documentation and the regions where ROSA is available to choose the best region for your deployment.

This is a public ROSA cluster, accessible from the internet via port 443. When deploying CP4D in your AWS account, consider using a private cluster (Figure 1).

IBM Cloud Pak for Data on ROSA

Figure 1. IBM Cloud Pak for Data on ROSA

We are using Amazon Elastic Block Store (Amazon EBS) and Amazon Elastic File System (Amazon EFS) for the cluster’s persistent storage. Review the IBM documentation for information about supported storage options.

Review the AWS prerequisites for ROSA, and follow the Security best practices in IAM documentation to protect your AWS account before deploying CP4D.

Cost

The costs associated with using AWS services when deploying CP4D in your AWS account can be estimated on the pricing pages for the services used.

Prerequisites

This blog assumes familiarity with: CP4D, Terraform, Amazon Elastic Compute Cloud (Amazon EC2), Amazon EBS, Amazon EFS, Amazon Virtual Private Cloud, and AWS Identity and Access Management (IAM).

You will need the following before getting started:

Installation steps

Complete the following steps to deploy CP4D on ROSA:

  1. First, enable ROSA on the AWS account. From the AWS ROSA console, click on Enable ROSA, as in Figure 2.

    Enabling ROSA on your AWS account

    Figure 2. Enabling ROSA on your AWS account

  2. Click on Get started. Redirect to the Red Hat website, where you can register and obtain a Red Hat ROSA token.
  3. Navigate to the AWS IAM console. Create an IAM policy named cp4d-installer-policy and add the following permissions:
    {
        "Version": "2012-10-17",
        "Statement": [
            {
                "Effect": "Allow",
                "Action": [
                    "autoscaling:*",
                    "cloudformation:*",
                    "cloudwatch:*",
                    "ec2:*",
                    "elasticfilesystem:*",
                    "elasticloadbalancing:*",
                    "events:*",
                    "iam:*",
                    "kms:*",
                    "logs:*",
                    "route53:*",
                    "s3:*",
                    "servicequotas:GetRequestedServiceQuotaChange",
                    "servicequotas:GetServiceQuota",
                    "servicequotas:ListServices",
                    "servicequotas:ListServiceQuotas",
                    "servicequotas:RequestServiceQuotaIncrease",
                    "sts:*",
                    "support:*",
                    "tag:*"
                ],
                "Resource": "*"
            }
        ]
    }
  4. Next, let’s create an IAM user from the AWS IAM console, which will be used for the CP4D installation:
    a. Specify a name, like ibm-cp4d-bastion.
    b. Set the credential type to Access key – Programmatic access.
    c. Attach the IAM policy created in Step 3.
    d. Download the .csv credentials file.
  5. From the Amazon EC2 console, create a new EC2 key pair and download the private key.
  6. Launch an Amazon EC2 instance from which the CP4D installer is launched:
    a. Specify a name, like ibm-cp4d-bastion.
    b. Select an instance type, such as t3.medium.
    c. Select the EC2 key pair created in Step 4.
    d. Select the Red Hat Enterprise Linux 8 (HVM), SSD Volume Type for 64-bit (x86) Amazon Machine Image.
    e. Create a security group with an inbound rule that allows connection. Restrict access to your own IP address or an IP range from your organization.
    f. Leave all other values as default.
  7. Connect to the EC2 instance via SSH using its public IP address. The remaining installation steps will be initiated from it.
  8. Install the required packages:
    $ sudo yum update -y
    $ sudo yum install git unzip vim wget httpd-tools python38 -y
    
    $ sudo ln -s /usr/bin/python3 /usr/bin/python
    $ sudo ln -s /usr/bin/pip3 /usr/bin/pip
    $ sudo pip install pyyaml
    
    $ curl "https://awscli.amazonaws.com/awscli-exe-linux-x86_64.zip" -o "awscliv2.zip"
    $ unzip awscliv2.zip
    $ sudo ./aws/install
    
    $ wget "https://github.com/stedolan/jq/releases/download/jq-1.6/jq-linux64"
    $ chmod +x jq-linux64
    $ sudo mv jq-linux64 /usr/local/bin/jq
    
    $ wget "https://mirror.openshift.com/pub/openshift-v4/clients/ocp/4.10.15/openshift-client-linux-4.10.15.tar.gz"
    $ tar -xvf openshift-client-linux-4.10.15.tar.gz
    $ chmod u+x oc kubectl
    $ sudo mv oc /usr/local/bin
    $ sudo mv kubectl /usr/local/bin
    
    $ sudo yum install -y yum-utils
    $ sudo yum-config-manager --add-repo $ https://rpm.releases.hashicorp.com/RHEL/hashicorp.repo
    $ sudo yum -y install terraform
    
    $ sudo subscription-manager repos --enable=rhel-7-server-extras-rpms
    $ sudo yum install -y podman
  9. Configure the AWS CLI with the IAM user credentials from Step 4 and the desired AWS region to install CP4D:
    $ aws configure
    
    AWS Access Key ID [None]: AK****************7Q
    AWS Secret Access Key [None]: vb************************************Fb
    Default region name [None]: eu-west-1
    Default output format [None]: json
  10. Clone the following IBM GitHub repository:
    https://github.com/IBM/cp4d-deployment.git

    $ cd ~/cp4d-deployment/managed-openshift/aws/terraform/
  11. For the purpose of this post, we enabled Watson Machine Learning, Watson Studio, and Db2 OLTP services on CP4D. Use the example in this step to create a Terraform variables file for CP4D installation. Enable CP4D services required for your use case:
    region			= "eu-west-1"
    tenancy			= "default"
    access_key_id 		= "your_AWS_Access_key_id"
    secret_access_key 	= "your_AWS_Secret_access_key"
    
    new_or_existing_vpc_subnet	= "new"
    az				= "multi_zone"
    availability_zone1		= "eu-west-1a"
    availability_zone2 		= "eu-west-1b"
    availability_zone3 		= "eu-west-1c"
    
    vpc_cidr 		= "10.0.0.0/16"
    public_subnet_cidr1 	= "10.0.0.0/20"
    public_subnet_cidr2 	= "10.0.16.0/20"
    public_subnet_cidr3 	= "10.0.32.0/20"
    private_subnet_cidr1 	= "10.0.128.0/20"
    private_subnet_cidr2 	= "10.0.144.0/20"
    private_subnet_cidr3 	= "10.0.160.0/20"
    
    openshift_version 		= "4.10.15"
    cluster_name 			= "your_ROSA_cluster_name"
    rosa_token 			= "your_ROSA_token"
    worker_machine_type 		= "m5.4xlarge"
    worker_machine_count 		= 3
    private_cluster 			= false
    cluster_network_cidr 		= "10.128.0.0/14"
    cluster_network_host_prefix 	= 23
    service_network_cidr 		= "172.30.0.0/16"
    storage_option 			= "efs-ebs" 
    ocs 				= { "enable" : "false", "ocs_instance_type" : "m5.4xlarge" } 
    efs 				= { "enable" : "true" }
    
    accept_cpd_license 		= "accept"
    cpd_external_registry 		= "cp.icr.io"
    cpd_external_username 	= "cp"
    cpd_api_key 			= "your_IBM_API_Key"
    cpd_version 			= "4.5.0"
    cpd_namespace 		= "zen"
    cpd_platform 			= "yes"
    
    watson_knowledge_catalog 	= "no"
    data_virtualization 		= "no"
    analytics_engine 		= "no"
    watson_studio 			= "yes"
    watson_machine_learning 	= "yes"
    watson_ai_openscale 		= "no"
    spss_modeler 			= "no"
    cognos_dashboard_embedded 	= "no"
    datastage 			= "no"
    db2_warehouse 		= "no"
    db2_oltp 			= "yes"
    cognos_analytics 		= "no"
    master_data_management 	= "no"
    decision_optimization 		= "no"
    bigsql 				= "no"
    planning_analytics 		= "no"
    db2_aaservice 			= "no"
    watson_assistant 		= "no"
    watson_discovery 		= "no"
    openpages 			= "no"
    data_management_console 	= "no"
  12. Save your file, and launch the commands below to install CP4D and track progress:
    $ terraform init -input=false
    $ terraform apply --var-file=cp4d-rosa-3az-new-vpc.tfvars \
       -input=false | tee terraform.log
  13. The installation runs for 4 or more hours. Once installation is complete, the output includes (as in Figure 3):
    a. Commands to get the CP4D URL and the admin user password
    b. CP4D admin user
    c. Login command for the ROSA cluster
CP4D installation output

Figure 3. CP4D installation output

Validation steps

Let’s verify the installation!

  1. Log in to your ROSA cluster using your cluster-admin credentials.
    $ oc login https://api.cp4dblog.17e7.p1.openshiftapps.com:6443 --username cluster-admin --password *****-*****-*****-*****
  2. Initiate the following command to get the cluster’s console URL (Figure 4):
    $ oc whoami --show-console

    ROSA console URL

    Figure 4. ROSA console URL

  3. Run the commands in this step to retrieve the CP4D URL and admin user password (Figure 5).
    $ oc extract secret/admin-user-details \
      --keys=initial_admin_password --to=- -n zen
    $ oc get routes -n zen

    Retrieve the CP4D admin user password and URL

    Figure 5. Retrieve the CP4D admin user password and URL

  4. Initiate the following commands to have the CP4D workloads in your ROSA cluster (Figure 6):
    $ oc get pods -n zen
    $ oc get deployments -n zen
    $ oc get svc -n zen 
    $ oc get pods -n ibm-common-services 
    $ oc get deployments -n ibm-common-services
    $ oc get svc -n ibm-common-services
    $ oc get subs -n ibm-common-services

    Checking the CP4D pods running on ROSA

    Figure 6. Checking the CP4D pods running on ROSA

  5. Log in to your CP4D web console using its URL and your admin password.
  6. Expand the navigation menu. Navigate to Services > Services catalog for the available services (Figure 7).

    Navigating to the CP4D services catalog

    Figure 7. Navigating to the CP4D services catalog

  7. Notice that the services set as “enabled” correspond with your Terraform definitions (Figure 8).

    Services enabled in your CP4D catalog

    Figure 8. Services enabled in your CP4D catalog

Congratulations! You have successfully deployed IBM CP4D on Red Hat OpenShift on AWS.

Post installation

Refer to the IBM documentation on setting up services, if you need to enable additional services on CP4D.

When installing CP4D on productive environments, please review the IBM documentation on securing your environment. Also, the Red Hat documentation on setting up identity providers for ROSA is informative. You can also consider enabling auto scaling for your cluster.

Cleanup

Connect to your bastion host, and run the following steps to delete the CP4D installation, including ROSA. This step avoids incurring future charges on your AWS account.

$ cd ~/cp4d-deployment/managed-openshift/aws/terraform/
$ terraform destroy -var-file="cp4d-rosa-3az-new-vpc.tfvars"

If you’ve experienced any failures during the CP4D installation, run these next steps:

$ cd ~/cp4d-deployment/managed-openshift/aws/terraform
$ sudo cp installer-files/rosa /usr/local/bin
$ sudo chmod 755 /usr/local/bin/rosa
$ Cluster_Name=`rosa list clusters -o yaml | grep -w "name:" | cut -d ':' -f2 | xargs`
$ rosa remove cluster --cluster=${Cluster_Name}
$ rosa logs uninstall -c ${Cluster_Name } –watch
$ rosa init --delete-stack
$ terraform destroy -var-file="cp4d-rosa-3az-new-vpc.tfvars"

Conclusion

In summary, we explored how customers can take advantage of a fully managed OpenShift service on AWS to run IBM CP4D. With this implementation, customers can focus on what is important to them, their workloads, and their customers, and less on managing the day-to-day operations of managing OpenShift to run CP4D.

Check out the IBM Cloud Pak for Data Simplifies and Automates How You Turn Data into Insights blog to learn how to use CP4D on AWS to unlock the value of your data.

Additional resources

Choosing an AWS container service to run your modern application

Post Syndicated from Lewis Tang original https://aws.amazon.com/blogs/architecture/choosing-an-aws-container-service-to-run-your-modern-application/

Businesses want to innovate quickly and deliver value even faster. To achieve these goals, the platform needs to enable teams to focus on delivering applications that are reliable, secure, highly available, cost-efficient, and scalable to required sizes.

Consider including containers on AWS in your platform, whether you are trying containers for the first time, spinning out parts of an on-premises solution to microservices in the cloud, or are new to the cloud. Containers can help you achieving a range of business benefits, including increased scalability, agility, flexibility, and cost efficiency.

In this post, we discuss three sets of builder expectations and how AWS container services can help to meet with your application delivery requirements and choose the appropriate container platform service on AWS.

Decrease container platform operations management overhead

If managing a platform is not your business’s strategic focus (for example, if most of your engineers are code developers), it can be preferable to only manage application development.

Amazon Lightsail containers offer a simple way for developers to deploy their containers to the cloud. With a Docker image you provide for your containers, AWS automatically deploys containerized workloads for you.

Lightsail assigns an HTTPS endpoint that is ready to serve your web application running in the cloud container. It automatically sets up a load-balanced Transport Layer Security (TLS) endpoint and takes care of the TLS certificate. This service replaces unresponsive containers for you automatically; by assigning a Domain Name System to your endpoint, Lightsail maintains the old version until the new version is healthy and ready to go live (Figure 1).

Amazon Lightsail containers

Figure 1. Amazon Lightsail containers

Another simple way to build and run your containerized web application in AWS is using AWS App Runner, which provides a fully managed container-native service.

Without orchestrators to configure, build pipelines to set up, or load balancers to optimize, you can bring existing containers or use the integrated container build service to go directly from the code repository to deployed application.

The build service can connect to a GitHub repository, providing a Git push workflow that deploys changes automatically. App Runner orchestration workflow take cares of the build, deployment, and configuration tasks, such as host, runtime patching, monitoring load balancing, and auto scaling (Figure 2). Explore AWS App Runner documentation and workshop for more details about the service.

AWS App Runner

Figure 2. AWS App Runner

When designing an application, you often start with a whiteboard or mental model that has representations of each service and lines for how they interact with each other. When considering an application’s platform architecture, the cloud components are not limited to virtual private cloud (VPC) subnets, load balancers, deployment pipelines, and durable storage for your application’s stateful data. Bringing all underlying cloud components together and making sure the design is well architected can be challenging.

AWS Copilot can provide guided best practices when deploying a microservice architecture that includes multiple services deployed as containers. You can use Copliot to handle cloud component details for you. By providing a container image, Copilot works with App Runner or Amazon Elastic Container Service (Amazon ECS) to provision cloud components, like VPC and having Copilot handle high-availability deployment, load balancer creation, and configuration.

To automate application deployment and new version release, Copilot can create a deployment pipeline so that the latest version of your application is automatically deployed every time you push a new commit to your code repository (as demonstrated in Figure 3).

AWS Copilot pipeline

Figure 3. AWS Copilot pipeline

Full-control application deployment with container orchestration

As business grows, your application portfolio grows. Some applications may require the selection of Microsoft Windows containers or deep customizations on container-resource scheduling, monitoring, and logging. To accommodate this, you need the flexibility of configuring the required underlying container services while still using the efficient container orchestrator to automate the common processes to achieve operation efficiency. This is where Amazon ECS and Amazon Elastic Kubernetes Service (Amazon EKS) can help.

Using Amazon ECS

As demonstrated in Figure 4, Amazon ECS is a highly scalable, high-performance container management service that supports containers and allows you to easily run applications on a managed cluster of Amazon Elastic Compute Cloud instances with Amazon Fargate (a serverless compute engine for containers). With this, you can launch and stop containerized applications and query the complete state of your cluster. You have the ability to access and configure many familiar features, like security groups and Elastic Load Balancing (ELB), by sending simple API calls.

Amazon ECS can be used to schedule container placement across your cluster based on resource needs and availability requirements. You can also integrate your own scheduler or third-party schedulers to meet business- or application-specific requirements.

Amazon ECS using AWS Fargate

Figure 4. Amazon ECS using AWS Fargate

Using Amazon EKS

Amazon EKS is a managed service that can be used to run Kubernetes on AWS, without installing, operating, and maintaining your own Kubernetes control plane or nodes. For many developers who have experience using Kubernetes, running Amazon EKS for application container workload is a preferred option because Amazon EKS provides the flexibility of Kubernetes with the scalability, security and resiliency of being an AWS managed service.

Amazon EKS runs and automatically scales the Kubernetes control plane across multiple AWS availability zones to ensure high availability, as in Figure 5. The control plane instances are automatically scaled based on load. Amazon EKS detects and replaces unhealthy control plane instances and provides automated version updates and patching. Amazon EKS enables developers to run up-to-date versions of the open-source Kubernetes software, the existing or new third-party plugins, and tooling. This means you can more easily migrate any standard Kubernetes application to Amazon EKS without code modification.

Scalability and security are essential to your business-critical workloads. Amazon EKS is integrated with many AWS services, including Amazon Elastic Container Registry for container images, ELB for load distribution, IAM for authentication, and Amazon Virtual Private Cloud for isolation.

Amazon EKS scales Kubernetes across multiple availability zones

Figure 5. Amazon EKS scales Kubernetes across multiple availability zones

Conclusion

To innovate and respond to changes faster, businesses need to build modern applications quickly and manage them efficiently. AWS provides container services to run your most sensitive, secure, and business-critical workloads reliably and to-scale.

With little-to-no prior container experience, developers can use Lightsail containers to run web application container workloads with easy-to-use interface. App Runner simplifies application deployment and management down into one particular service for running web applications. With Copilot, you can get step-by-step best practice guidance when you need to deploy microservice architecture with multiple services deployed as containers. Amazon ECS and Amazon EKS give the flexibility of configuring container workloads while maintaining the application deployment and operational efficiency.

Further reading

Setup a high availability design for Oracle Data Guard (Fast-Start Failover) using Amazon Route 53

Post Syndicated from Viqash Adwani original https://aws.amazon.com/blogs/architecture/setup-a-high-availability-design-for-oracle-data-guard-fast-start-failover-using-amazon-route-53/

Many customers use Oracle Database deployed on Amazon Elastic Compute Cloud (Amazon EC2) to run their Oracle E-Business Suite applications. They rely on Oracle Data Guard for high availability databases, with a standby database running in a different availability zone. Oracle Data Guard can switch a standby database to the primary role in case a production database becomes unavailable due to planned/unplanned outage.

Oracle E-Business Suite has AutoConfig Database Context files that points to Domain Name System (DNS), like a private IP DNS name or IP address on Amazon EC2. In case of switchover/failover, Database Context files in Oracle E-Business Suite need to be updated. With this solution, database context files do not need to be updated in case of switchover/failover. This is achieved by providing a single DNS name hosted on Amazon Route 53, always pointing to a primary database irrespective of running on any node.

This post demonstrates setting up a Route 53 hosted zone that points to primary and standby databases and will route requests to the database having a primary role. We will setup Route 53 health checks to monitor Amazon CloudWatch alarms, based on Oracle Data Guard Fast-Start Failover (FSFO) logs pushed from Oracle Database using CloudWatch agent.

Prerequisites

Before getting started, you must have the following:

  • Oracle databases running on two separate EC2 instances for 1\Primary and 2\Standby node
  • EC2 instance for 3\Observer node, with either Oracle Client Administrator software or the full Oracle Database software stack
  • Oracle Data Guard configured to maintain standby databases as transactional consistent copy of the primary database
  • Oracle Data Guard Command-Line Interface (DGMGRL) configured with observer process to facilitate FSFO
  • FSFO enabled with observer configuration

Solution overview

Figure 1 depicts AWS services that are used build an architecture using a single Domain Name System (DNS) and Route 53 to have requests route to the primary database for Oracle Data Guard deployed on EC2 instances.

Using a single DNS and Amazon Route 53 to route requests

Figure 1. Using a single DNS and Amazon Route 53 to route requests

We encourage you to explore these articles prior to launching this architecture:

Architecture components

  • Primary node: An Oracle Data Guard configuration contains one production database (primary database) that functions in the primary role. This is the database that is accessed by most of your applications.
  • Standby node: A standby database is a transactional consistent copy of the primary database. Once created, Oracle Data Guard automatically maintains each standby database by transmitting redo data from the primary database and applying it to the standby database.
  • Observer node: A component of DGMGRL that is configured on a separate server with Oracle Client Interface outside the systems running the Oracle Data Guard configuration, which monitors the availability of the primary database. We recommend it is in a separate availability zone than the primary and standby databases. Should it detect that the primary database is unavailable or the connection cannot be made, it will issue a failover after waiting for the 30 seconds or specified by the FastStartFailoverThreshold property.

Note: This solution was tested on Oracle Database 19c Enterprise Edition Release 19.0.0.0.0 and Oracle Enterprise Linux OL7.5-x86_64. Select the required combination of operating system and database by referring to E-Business Suite Database Certifications. Active Oracle Data Guard configuration is not used in this solution; therefore, the database stays in mount state and unavailable for customer reads. However, this solution can be used with an active Oracle Data Guard configuration as well.

Infrastructure setup

This table details the lab environment and the database instance names used throughout this post.

Database role IP address Instance name Database unique name Database open mode Database port
Primary node 172.31.xx.xx ORCLVIQ orclviq Read write 1522
Secondary node 172.31.xx.xx ORCLVIQ orclviq Mounted 1522
FSFO observer node 172.31.xx.xx
Route 53 hosted zone Dataguardviq.com Dataguardviq.com

Solution implementation

1. IAM policy

To configure the CloudWatch agent on an EC2 instance, create an IAM role via the console, AWS Command Line Interface, or AWS API. By default, an IAM role does not have any privileges and cannot access AWS resources. Before creating an IAM role, create an IAM policy with the permissions required to access CloudWatch logs, specifying the CloudWatch resources you want to monitor or *, which will allow access to CloudWatch logs.

Create the IAM policy using the following JSON and give it a name, like dgpolicy, which grants specific permissions. In this case, the permissions include creating log groups and log streams, inputting log events, and describing log stream for all logs.

{
    "Version": "2012-10-17",
    "Statement": [
        {
            "Action": [
                "logs:DescribeLogGroups",
                "logs:DescribeLogStreams",
                "logs:GetLogEvents",
                "s3:GetBucketLocation"
            ],
            "Effect": "Allow",
            "Resource": "*"
        }
    ]
}

2. IAM role

Create the IAM role (for example, dgrole) and attach the policy created in Step 1.

3. Associate IAM role with Amazon EC2 having FSFO observer node running on it

Associate the IAM role with Amazon EC2 from AWS console:

  1. Open the Amazon EC2 console.
  2. In the navigation pane, choose Instances.
  3. Select the instance, and choose Action, Security, Modify IAM role.
  4. Select the IAM role to attach to your instance; choose Save.

You also can use the associate-iam-instance-profile command to attach the IAM role to the instance by specifying the instance profile:

aws ec2 associate-iam-instance-profile \
    --instance-id i-1234567890lmnopq1 \
    --iam-instance-profile Name=" dgrole"

4. Install CloudWatch log agent on observer node

Install CloudWatch Logs agent on the observer node that already has FSFO log configuration setup on it. After installation is complete, logs will automatically flow from the instance to the log stream you created while installing the agent, as depicted in Figures 2 and 3.

$curl https://s3.amazonaws.com/aws-cloudwatch/downloads/latest/awslogs-agent-setup.py -O
$sudo python ./awslogs-agent-setup.py --region ap-southeast-2

Steps to install Amazon CloudWatch agent

Figure 2. Steps to install Amazon CloudWatch agent

Example of output

Figure 3. Example of output

At this point, FSFO logs are visible in CloudWatch logs. Perform a database switchover to confirm that logs are being published to CloudWatch logs.

5. Create CloudWatch metric filter

Create primary metric filter

  • Create metric filter on “Standby database has changed to orclviq” and set value to “1”.
  • Open the CloudWatch log group and search for “Standby database has changed to orclviq“. Once results are displayed, “Create Metric Filter” button will appear at top right (as demonstrated in Figure 4).
Amazon CloudWatch log group

Figure 4. Amazon CloudWatch log group

  • Filter name” and “Filter pattern” are filled automatically, as we already filtered that while accessing the CloudWatch log. Create a new name space in the metric, which we will later use in second metric filter. Specify “Metric namespace”, which will also be the same for the second metric filter. “Metric value” is “1”, as detailed in Figure 5.
Amazon CloudWatch metric filter

Figure 5. Amazon CloudWatch metric filter

Create secondary metric filter

  • To create a second metric filter, follow steps to create the primary metric filter but the filter pattern will be “Standby database has changed to orclstd“. The only difference in this step will be setting the “Metric value” to “0”.
  • Verify the metric filter is working and able to find desired entries in the FSFO logs that will decide which instance is the primary database by:
    • Click on one of the metric filters
    • Select log data to test, and choose and EC2 instance ID
    • Testing the pattern to verify if metric filters are working properly
    • Select “Next”
    • Save changes

6. Create a CloudWatch alarm

Create a CloudWatch alarm that will monitor CloudWatch metrics and perform actions based on the value of the metric.

  • Within CloudWatch Alarms section (Step 1), select “Create alarm” and then select “Metric”, as in Figure 6.
  • In Step 2, you can create a new topic and specify the email address where you would like to receive notifications regarding changes in primary or standby database.
  • In Step 3, you can specify the alarm name and optional alarm description.
Amazon CloudWatch alarm

Figure 6. Amazon CloudWatch alarm

  • To configure Conditions, as detailed in Figure 7, be sure the threshold type is set to “Static”, the alarm condition is “Greater/Equal”, and the threshold value is “1”.
Amazon CloudWatch alarm condition

Figure 7. Amazon CloudWatch alarm condition

  • Figure 8 demonstrates the summary of the ready CloudWatch metrics and configured alarm.  At this point, “orclviq” is the primary database, so the alarm state will be “Insufficient data”. Try to do a switchover and the alarm state should be changed to “In alarm”.
  • Switch it back to original primary before proceeding further
Final view of both metric filters combined

Figure 8. Final view of both metric filters combined

7. Create Route 53 health checks

Creating Route 53 health checks based on the CloudWatch alarm identifies DNS failover. Health checks can be created on public IP directly without creating above metric filters and alarms, but it is unlikely that customers will have a public IP on database servers. Route 53 cannot check the health of an IP address endpoint despite if it is local, private, non-routable, or multi-cast ranges. Therefore, health checks will have to be created on the state of CloudWatch alarm (Figure 9):

  • Within the Route 53 console, select “Configure health check”.
  • Select “State of CloudWatch alarm”, then select the region of your CloudWatch metrics and choose the CloudWatch alarm that was created earlier from the dropdown menu.
  • Skip creating an alarm for health check, as the alarm is already configured for CloudWatch metric filter.
Amazon Route 53 health check parameters

Figure 9. Amazon Route 53 health check parameters

  • The health check is now ready and status will be “Unknown”. It will change to “Healthy”, as it is currently having primary orclviq, which means it’s satisfying “Standby database has changed to orclstd“.
  • At this point, try doing a failover and observe if health check status changes to “Unhealthy”. Switch it back to the original primary before proceeding.
  • The health check should return to “Healthy” state.
  • Check the status of the alarm:
    • OK: the status is healthy
    • ALARM: the status is unhealthy
    • INSUFFICIENT: use last known status

8. Create Route 53 hosted zone

A Route 53 hosted zone in this solution will have failover routing based on records pointing to IP addresses of primary and standby database server. When the Route 53 health check is in an “Unhealthy” state, failover routing kicks in and the hosted zone starts routing requests to the IP address of the standby database server.

  • A Route 53 hosted zone will have records of your primary and standby database instance private IP. Because it is a private hosted zone, it will use the same VPC as the observer node on which we deployed the CloudWatch agent (Figure 10).
Amazon Route 53 hosted zone

Figure 10. Amazon Route 53 hosted zone

  • Once the Route 53 hosted zone is ready, the last step is to create records by adding private IP addresses of primary and secondary database servers (Figures 11 and 12). Routing policy is set as a failover. That means, if the Route 53 health check fails, the hosted zone does a DNS failover to standby server IP.
Amazon Route 53 hosted zone record for primary servers

Figure 11. Amazon Route 53 hosted zone record for primary servers

Amazon Route 53 hosted zone record for secondary servers

Figure 12. Amazon Route 53 hosted zone record for secondary servers

Once the records are created, the hosted zone will have an IP address of primary and secondary database servers, as demonstrated in Figure 13.

Final view of Amazon Route 53 hosted zone

Figure 13. Final view of Amazon Route 53 hosted zone

Solution testing

To test the solution, do a telnet utility test to evaluate network connectivity on the Route 53 hosted zone that was created. It should display the IP address of the primary database server: 172.31.10.89.

[ec2-user@ip-172-xx-xx-xx ~]$ telnet dataguardviq.com 1522
Trying 172.31.10.89…
Connected to dataguardviq.com.
Escape character is ‘^]’.

Next, perform a switchover or failover of the primary to secondary database server. This can be done with the DGMGRL command “switchover to orclstd”. Output will be:

DGMGRL> switchover to orclstd;
Performing switchover NOW, please wait…
Operation requires a connection to database “orclstd”
Connecting …
Connected to “orclstd”
Connected as SYSDBA.
New primary database “orclstd” is opening…
Oracle Clusterware is restarting database “orclviq” …
Connected to an idle instance.
Connected to “orclviq”
Switchover succeeded, new primary is “orclstd”

Now, the new primary is “orclstd”. In the backend, the Route 53 health check will be initiated and cause a failover. This means the telnet Route 53 hosted zone will give the IP address of the new primary (old secondary), which is 172.31.36.241.

[ec2-user@ip-172-xx-xx-xx ~]$ telnet dataguardviq.com 1522
Trying 172.31.36.241…
Connected to dataguardviq.com.
Escape character is ‘^]’.

Cleanup

To cleanup, remove:

  • Route 53 host zone
  • CloudWatch metric filter
  • CloudWatch alarm
  • CloudWatch agent from observer node
  • IAM role and policy created specifically for this solution

Conclusion

This solution demonstrated how to use a Route 53 hosted zone to route requests to the active primary node for Oracle Data Guard on Amazon EC2.

Let’s Architect! Modern data architectures

Post Syndicated from Luca Mezzalira original https://aws.amazon.com/blogs/architecture/lets-architect-modern-data-architectures/

With the rapid growth in data coming from data platforms and applications, and the continuous improvements in state-of-the-art machine learning algorithms, data are becoming key assets for companies.

Modern data architectures include data mesh—a recent style that represents a paradigm shift, in which data is treated as a product and data architectures are designed around business domains. This type of approach supports the idea of distributed data, where each business domain focuses on the quality of the data it produces and exposes to the consumers.

In this edition of Let’s Architect!, we focus on data mesh and how it is designed on AWS, plus other approaches to adopt modern architectural patterns.

Design a data mesh architecture using AWS Lake Formation and AWS Glue

Domain Driven Design (DDD) is a software design approach where a solution is divided into domains aligned with business capabilities, software, and organizational boundaries. Unlike software architectures, most data architectures are often designed around technologies rather than business domains.

In this blog, you can learn about data mesh, an architectural pattern that applies the principles of DDD to data architectures. Data are organized into domains and considered the product that each team owns and offers for consumption.

A data mesh design organizes around data domains. Each domain owns multiple data products with their own data and technology stacks

A data mesh design organizes around data domains. Each domain owns multiple data products with their own data and technology stacks

Building Data Mesh Architectures on AWS

In this video, discover how to use the data mesh approach in AWS. Specifically, how to implement certain design patterns for building a data mesh architecture with AWS services in the cloud.

This is a pragmatic presentation to get a quick understanding of data mesh fundamentals, the benefits/challenges, and the AWS services that you can use to build it. This video provides additional context to the aforementioned blog post and includes several examples on the benefits of modern data architectures.

This diagram demonstrates the pattern for sharing data catalogs between producer domains and consumer domains

This diagram demonstrates the pattern for sharing data catalogs between producer domains and consumer domains

Build a modern data architecture on AWS with Amazon AppFlow, AWS Lake Formation, and Amazon Redshift

In this blog, you can learn how to build a modern data strategy using AWS managed services to ingest data from sources like Salesforce. Also discussed is how to automatically create metadata catalogs and share data seamlessly between the data lake and data warehouse, plus creating alerts in the event of an orchestrated data workflow failure.

The second part of the post explains how a data warehouse can be built by using an agile data modeling pattern, as well as how ELT jobs were quickly developed, orchestrated, and configured to perform automated data quality testing.

A data platform architecture and the subcomponents used to build it

A data platform architecture and the subcomponents used to build it

AWS Lake Formation Workshop

With a modern data architecture on AWS, architects and engineers can rapidly build scalable data lakes; use a broad and deep collection of purpose-built data services; and ensure compliance via unified data access, security, and governance. As data mesh is a modern architectural pattern, you can build it using a service like AWS Lake Formation.

Familiarize yourself with new technologies and services by not only learning how they work, but also to building prototypes and projects to gain hands-on experience. This workshop allows builders to become familiar with the features of AWS Lake Formation and its integrations with other AWS services.

A data catalog is a key component in a data mesh architecture. AWS Glue crawlers interact with data stores and other elements to populate the data catalog

A data catalog is a key component in a data mesh architecture. AWS Glue crawlers interact with data stores and other elements to populate the data catalog

See you next time!

Thanks for joining our discussion on data mesh! See you in a couple of weeks when we talk more about architectures and the challenges that we face every day while working with distributed systems.

Other posts in this series

Looking for more architecture content?

AWS Architecture Center provides reference architecture diagrams, vetted architecture solutions, Well-Architected best practices, patterns, icons, and more!

A multi-dimensional approach helps you proactively prepare for failures, Part 3: Operations and process resiliency

Post Syndicated from Piyali Kamra original https://aws.amazon.com/blogs/architecture/a-multi-dimensional-approach-helps-you-proactively-prepare-for-failures-part-3-operations-and-process-resiliency/

In Part 1 and Part 2 of this series, we discussed how to build application layer and infrastructure layer resiliency.

In Part 3, we explore how to develop resilient applications, and the need to test and break our operational processes and run books. Processes are needed to capture baseline metrics and boundary conditions. Detecting deviations from accepted baselines requires logging, distributed tracing, monitoring, and alerting. Testing automation and rollback are part of continuous integration/continuous deployment (CI/CD) pipelines. Keeping track of network, application, and system health requires automation.

In order to meet recovery time and point objective (RTO and RPO, respectively) requirements of distributed applications, we need automation to implement failover operations across multiple layers. Let’s explore how a distributed system’s operational resiliency needs to be addressed before it goes into production, after it’s live in production, and when a failure happens.

Pattern 1: Standardize and automate AWS account setup

Create processes and automation for onboarding users and providing access to AWS accounts according to their role and business unit, as defined by the organization. Federated access to AWS accounts and organizations simplifies cost management, security implementation, and visibility. Having a strategy for a suitable AWS account structure can reduce the blast radius in case of a compromise.

  1. Have auditing mechanisms in place. AWS CloudTrail monitors compliance, improving security posture, and auditing all the activity records across AWS accounts.
  2. Practice the least privilege security model when setting up access to the CloudTrail audit logs plus network and applications logs. Follow best practices on service control policies and IAM boundaries to help ensure your AWS accounts stay within your organization’s access control policies.
  3. Explore AWS Budgets, AWS Cost Anomaly Detection, and AWS Cost Explorer for cost-optimizing techniques. The AWS Compute Optimizer and Instance Scheduler on AWS resource resizing and auto-shutdown for non-working hours. A Beginner’s Guide to AWS Cost Management explores multiple cost-optimization techniques.
  4. Use AWS CloudFormation and AWS Config to detect infrastructure drift and take corrective actions to make resources compliant, as demonstrated in Figure 1.
Compliance control and drift detection

Figure 1. Compliance control and drift detection

Pattern 2: Documenting knowledge about the distributed system

Document high-level infrastructure and dependency maps.

Define availability characteristics of distributed system. Systems have components with varying RTO and RPO needs. Document application component boundaries and capture dependencies with other infrastructure components, including Domain Name System (DNS), IAM permissions; and access patterns, secrets, and certificates. Discover dependencies through solutions, such as Workload Discovery on AWS, to plan resiliency methods and ensure the order of execution of various steps during failover are correct.

Capture non-functional requirements (NFRs), such as business key performance indicators (KPIs), RTO, and RPO, for your composing services. NFRs are quantifiable and define system availability, reliability, and recoverability requirements. They should include throughput, page-load, and response time requirements. Quantify the RTO and RPO of different components of the distributed system by defining them. The KPIs measure if you are meeting the business objectives. As mentioned in Part 2: Infrastructure layer, RTO and RPO help define the failover and data recovery procedures.

Pattern 3: Define CI/CD pipelines for application code and infrastructure components

Establish a branching strategy. Implement automated checks for version and tagging compliance in feature/sprint/bug fix/hot fix/release candidate branches, according to your organization’s policies. Define appropriate release management processes and responsibility matrices, as demonstrated in Figures 2 and 3.

Test at all levels as part of an automated pipeline. This includes security, unit, and system testing. Create a feedback loop that provides the ability to detect issues and automate rollback in case of production failures, which are indicated by business KPI negative impact and other technical metrics.

Define the release management process

Figure 2. Define the release management process

Sample roles and responsibility matrix

Figure 3. Sample roles and responsibility matrix

Pattern 4: Keep code in a source control repository, regardless of GitOps

Merge requests and configuration changes follow the same process as application software. Just like application code, manage infrastructure as code (IaC) by checking the code into a source control repository, submitting pull requests, scanning code for vulnerabilities, alerting and sending notifications, running validation tests on deployments, and having an approval process.

You can audit your infrastructure drift, design reusable and repeatable patterns, and adhere to your distributed application’s RTO objectives by building your IaC (Figure 4). IaC is crucial for operational resilience.

CI/CD pipeline for deploying IaC

Figure 4. CI/CD pipeline for deploying IaC

Pattern 5: Immutable infrastructure

An immutable deployment pipeline launches a set of new instances running the new application version. You can customize immutability at different levels of granularity depending on which infrastructure part is being rebuilt for new application versions, as in Figure 5.

The more immutable infrastructure components being rebuilt, the more expensive deployments are in both deployment time and actual operational costs. Immutable infrastructure also is easier to rollback.

Different granularity levels of immutable infrastructure

Figure 5. Different granularity levels of immutable infrastructure

Pattern 6: Test early, test often

In a shift-left testing approach, begin testing in the early stages, as demonstrated in Figure 6. This can surface defects that can be resolved in a more time- and cost-effective manner compared with after code is released to production.

Shift-left test strategy

Figure 6. Shift-left test strategy

Continuous testing is an essential part of CI/CD. CI/CD pipelines can implement various levels of testing to reduce the likelihood of defects entering production. Testing can include: unit, functional, regression, load, and chaos.

Continuous testing requires testing and breaking existing boundary conditions, and updating test cases if the boundaries have changed. Test cases should test distributed systems’ idempotency. Chaos testing benefits our incidence response mechanisms for distributed systems that have multiple integration points. By testing our auto scaling and failover mechanisms, chaos testing improves application performance and resiliency.

AWS Fault Injection Simulator (AWS FIS) is a service for chaos testing. An experiment template contains actions, such as StopInstance and StartInstance, along with targets on which the test will be performed. In addition, you can mention stop conditions and check if they triggered the required Amazon CloudWatch alarms, as demonstrated in Figure 7.

AWS Fault Injection Simulator architecture for chaos testing

Figure 7. AWS Fault Injection Simulator architecture for chaos testing

Pattern 7: Providing operational visibility

In production, operational visibility across multiple dimensions is necessary for distributed systems (Figure 8). To identify performance bottlenecks and failures, use AWS X-Ray and other open-source libraries for distributed tracing.

Write application, infrastructure, and security logs to CloudWatch. When metrics breach alarm thresholds, integrate the corresponding alarms with Amazon Simple Notification Service or a third-party incident management system for notification.

Monitoring services, such as Amazon GuardDuty, are used to analyze CloudTrail, virtual private cloud flow logs, DNS logs, and Amazon Elastic Kubernetes Service audit logs to detect security issues. Monitor AWS Health Dashboard for maintenance, end-of-life, and service-level events that could affect your workloads. Follow the AWS Trusted Advisor recommendations to ensure your accounts follow best practices.

Dimensions for operational visibility

Figure 8. Dimensions for operational visibility (click the image to enlarge)

Figure 9 explores various application and infrastructure components integrating with AWS logging and monitoring components for increased problem detection and resolution, which can provide operational visibility.

Tooling architecture to provide operational visibility

Figure 9. Tooling architecture to provide operational visibility

Having an incident response management plan is an important mechanism for providing operational visibility. Successful execution of this requires educating the stakeholders on the AWS shared responsibility model, simulation of anticipated and unanticipated failures, documentation of the distributed system’s KPIs, and continuous iteration. Figure 10 demonstrates the features of a successful incidence response management plan.

An incidence response management plan

Figure 10. An incidence response management plan (click the image to enlarge)

Conclusion

In Part 3, we discussed continuous improvement of our processes by testing and breaking them. In order to understand the baseline level metrics, service-level agreements, and boundary conditions of our system, we need to capture NFRs. Operational capabilities are required to capture deviations from baseline, which is where alerting, logging, and distributed tracing come in. Processes should be defined for automating frequent testing in CI/CD pipelines, detecting network issues, and deploying alternate infrastructure stacks in failover regions based on RTOs and RPOs. Automating failover steps depends on metrics and alarms, and by using chaos testing, we can simulate failover scenarios.

Prepare for failure, and learn from it. Working to maintain resilience is an ongoing task.

Want to learn more?

Integrating Salesforce with AWS DynamoDB using Amazon AppFlow bi-directionally

Post Syndicated from Abhijit Vaidya original https://aws.amazon.com/blogs/architecture/integrating-salesforce-with-aws-dynamodb-using-amazon-appflow-bi-directionally/

In this blog post, we demonstrate how to integrate Salesforce Lightning with Amazon DynamoDB by using Amazon AppFlow and Amazon EventBridge services bi-directionally. This is an event-driven, serverless-based microservice, allowing Salesforce users to update configuration data stored in DynamoDB tables without giving AWS account access from AWS Command Line Interface or AWS Management Console.

This architecture describes a contact center application that utilizes DynamoDB database to store configuration data, including holiday data, across different global regions. Updating this data in a table is a manual process, which includes creating a support ticket and waiting for completion of the support request. The architecture herein allows authorized business users to update the configuration data in DynamoDB directly from the Salesforce screen and not relying on manual update process.

Solution overview

As demonstrated in Figure 1, Amazon AppFlow consumes events payload from salesforce and Lambda updates the DynamoDB table after processing the payload. In parallel, a scheduled based flow sends response back to salesforce object as a notification and sends a SNS email notification to users. Contact center application (Amazon Connect) reads data from DynamoDB table.

Architecture overview

Figure 1. Architecture overview

  1. Event (data add or delete) occurring on a particular object in Salesforce is captured by Amazon AppFlow (event-based flow); event payload displays as “Input” in AWS environment.
  2. An EventBridge bus receives the “Input” payload.
  3. The EventBridge bus triggers the AWS Lambda (Lambda-1).
  4. Lambda-1 processes the “Input” payload, then performs a write operation (data add or delete) on a DynamoDB table.
  5. A write operation on the table triggers DynamoDB streams.
  6. DynamoDB stream triggers Lambda (Lambda-2).
  7. Lambda-2 processes the payload from DynamoDB streams. It saves the results in .csv file format, with a “Success” or “Fail” flag. This .csv file is uploaded to an S3 bucket.
  8. A second flow (schedule-based) is configured in Amazon AppFlow. This reads the S3 bucket at a regular interval of time to find new .csv files created by Lambda-2.
  9. A schedule-based flow transfers the .csv file data as an event-status output to the Salesforce object, notifying the user that their event has been successfully handled in DynamoDB table.
  10. In parallel, DynamoDB streams trigger Lambda (Lambda-3), which processes the payload and initiates an Amazon Simple Notification Service (Amazon SNS) notification based on the status of the event request.
  11. Amazon SNS sends an email to the user detailing that the event created in the Salesforce object was successfully completed in DynamoDB table.
  12. If any of the two flows break due to any unforeseen events, their statuses are instantly captured and streamed to an EventBridge bus.
  13. The EventBridge bus triggers Lambda (Lambda-5).
  14. Lambda-5 tries to analyze the error causing failure and tries to get the flow to a working state again. If Lambda-5 fails, it initiates an Amazon SNS email to the solution support team to manually fix the Amazon AppFlow error and get the solution active again.
  15. Meanwhile, whenever an Amazon Connect contact center receives a call, it triggers Lambda (Lambda-4), which holds read-only access to DynamoDB table.
  16. Lambda-4 fetches the data stored by Lambda-1 in DynamoDB table and provides that data to a contact center in Amazon Connect.

Prerequisites

  • An AWS account with permissions to access all the required
  • An active Salesforce account with administration-level permissions set
  • Python 3.X version setup for developing Lambda-1 to -5

Implementation and development

1. Development steps on the Salesforce end

Note: We recommend working with a Salesforce expert. These steps can help initiate the development from Salesforce end.

a. Use the Platform Event feature to allow the data flow from Salesforce environment to AWS environment and then back to Salesforce from AWS environment using Amazon AppFlow.
b. Salesforce Connected Apps and web server flow used for integrating Amazon AppFlow with Salesforce.
c. New permissions set and new integration users are created to restrict the access to custom object.

2. Development steps on the AWS end

a. Create a new connection in Amazon AppFlow with “Salesforce” as the source
The “Client ID” and “Client Secret” of Salesforce Managed Connected App are stored in AWS Secrets Manager, which is encrypted by custom keys generated in AWS Key Management Service.

To setup an Amazon AppFlow connection with Salesforce, a stand-alone Lambda function is created using Python Boto3 API. This creates a connection in Amazon AppFlow using the “Client ID” and “Client Secret” of Salesforce connected app.

For more details regarding setting up the Salesforce connection in Amazon AppFlow, refer to the Amazon AppFlow User Guide.

b. Create new event-based input flow in Amazon AppFlow, using Salesforce as the source with the newly created connection
Select the “Salesforce events” option as per the business use case. For representation in this blog, “Telephony” is chosen as salesforce events. Select Amazon EventBridge as the destination. Create new “partner event source” for successful creation of input flow, as in Figure 2.

Configure an event-based flow in Amazon AppFlow

Figure 2. Configure an event-based flow in Amazon AppFlow

c. Handling large size input flow event payloads
Post successful creation of “Partner event source”, specify the S3 bucket for events that are larger than 256 KB, Amazon AppFlow sends a URL of the S3 object to the event bus instead of the event payload.

d. Configuring details for input flow
Select trigger pattern of input flow as “Run flow on event”, as shown in Figure 3.

Trigger pattern for creating input flow

Figure 3. Trigger pattern for creating input flow

As displayed in Figure 4, we can configure data field mapping, validation rules, and filters with Amazon AppFlow. This enables us to enrich and modify event data before it is sent to the event bus. Post this, input flow create action is complete.

Mapping Salesforce object fields with Amazon EventBridge bus

Figure 4. Mapping Salesforce object fields with Amazon EventBridge bus

e. Associating Amazon AppFlow generated partner event source with the event bus in the Amazon EventBridge dashboard
Before activating the flow, access the Amazon EventBridge console to associate the AppFlow generated partner-event-source with the event bus (Figure 5).

Associating input flow partner event source with the Amazon EventBridge bus

Figure 5. Associating input flow partner event source with the Amazon EventBridge bus

f. Post Amazon EventBridge bus association, activate the input flow
After associating the bus with input flow, navigate back to Amazon AppFlow console and click the “Activate flow” button for the input flow. Once active, input flow is ready to consume the event payload from Salesforce.

g. Amazon EventBridge bus triggering Lambda function
The EventBridge bus receives an event payload from the input flow and triggers Lambda (Lambda-1) to process that raw event payload and write the output results in a designated DynamoDB table. A sample of event input payload is in Figure 6. This payload content depends on the use case for which developer is working.

Input event payload sample from Salesforce

Figure 6. Input event payload sample from Salesforce

Lambda-1 adds the record-ID in the DynamoDB table, which is a unique event ID for each Salesforce event as shown in Figure 7.

Data added in Amazon DynamoDB table by Lambda-1

Figure 7. Data added in Amazon DynamoDB table by Lambda-1

h. Configuring DynamoDB streams
Within “Export and Streams” option in the DynamoDB table, enable the “DynamoDB stream details” and in the trigger section click on “Create trigger” option and select  Lambda-2 and Lambda -3, as detailed in Figure 8.

Configuring Amazon DynamoDB streams

Figure 8. Configuring Amazon DynamoDB streams

Lambda-2 stores the event output results and a success flag value in a .csv file that is created for every unique event; the .csv file is uploaded to an S3 bucket with the file name structure “Salesforce event recorded-event action-timestamp.csv”. For example:

Example 1: “abcd1234-event-created- 2022-05-19-11_23_51.csv” (data added)
Example 2: “abcd1234-event-deleted- 2022-05-19-11_24_50.csv” (data deleted)

i. Create new schedule-based flow (output flow) in Amazon AppFlow
The source is the S3 bucket folder where the .csv file is uploaded by Lambda-2. Select the destination as “Salesforce”, and choose the Salesforce object that is used to create the input flow (Figure 9). Revisit Step b for reference.

Configuring a schedule-based output flow

Figure 9. Configuring a schedule-based output flow

Output flow sends a response back to the same Salesforce object from which data addition/deletion event request was made. This confirms to the user that a data addition/deletion event created in Salesforce was successfully invoked in Dynamo DB table as well.

j. Error handling in output flow
In case output flow fails to write the response back to the Salesforce object, choose the option “Stop the current flow run”.

k. Configuring output flow as a run-on schedule
Output flow is a schedule-based flow that runs at specific time. Within the flow trigger window, select “Run flow on schedule”. Update the other fields, such as “Repeats”, “Every”, “Start date”, and “Starting at” per your specific needs. Within “Transfer mode”, select “Incremental transfer”. Refer to Figure 10.

Trigger pattern for schedule-based output flow

Figure 10. Trigger pattern for schedule-based output flow

l. Amazon AppFlow to Salesforce object mapping for output flow
Select Mapping method as “Manually map fields” and Destination record preference as “Upsert records”, as in Figure 11.

Output Flow will update the event record status in the Salesforce object, with success status flag value in the .csv file based on the unique “Record ID” that every Salesforce event payload contains. Once the field mapping is completed, output flow is active.

Manually mapping data fields with Salesforce

Figure 11. Manually mapping data fields with Salesforce

m. Real-time monitoring and failure handling
In case input/output flow breaks for unforeseen reasons, a rule is configured in EventBridge bus console that invokes Lambda (Lambda-5). Lambda-5 tries to handle the error and reactivate the flow. In case this action fails, Lambda sends an Amazon SNS email to the solution support team informing of the failure in Amazon AppFlow and the cause.

n. Integrating DynamoDB with Amazon Connect
Lambda (Lambda-4) is configured with contact center in Amazon Connect. As the call comes to contact center, Lambda-4 fetches the relevant data from the DynamoDB table. Amazon Connect operates per this data.

Cleanup

To avoid incurring future charges, delete any AWS resources that are no longer needed.

Conclusion

This post demonstrates the approach for developing an event-driven, serverless application that integrates DynamoDB with Salesforce using Amazon AppFlow bi-directionally. The contact center is based in Amazon Connect and functions dependent on the real-time data in a DynamoDB table—without manual intervention. The manual process can take a minimum of 24 hours, but the same action can be automatically completed using a self-service, UI-based form in the user’s Salesforce account.

This solution can be tailored depending on the business or technical requirement, differing how the data is consumed by multiple AWS services.

A multi-dimensional approach helps you proactively prepare for failures, Part 2: Infrastructure layer

Post Syndicated from Piyali Kamra original https://aws.amazon.com/blogs/architecture/a-multi-dimensional-approach-helps-you-proactively-prepare-for-failures-part-2-infrastructure-layer/

Distributed applications resiliency is a cumulative resiliency of applications, infrastructure, and operational processes. Part 1 of this series explored application layer resiliency. In Part 2, we discuss how using Amazon Web Services (AWS) managed services, redundancy, high availability, and infrastructure failover patterns based on recovery time and point objectives (RTO and RPO, respectively) can help in building more resilient infrastructures.

Pattern 1: Recognize high impact/likelihood infrastructure failures

To ensure cloud infrastructure resilience, we need to understand the likelihood and impact of various infrastructure failures, so we can mitigate them. Figure 1 illustrates that most of the failures with high likelihood happen because of operator error or poor deployments.

Automated testing, automated deployments, and solid design patterns can mitigate these failures. There could be datacenter failures—like whole rack failures—but deploying applications using auto scaling and multi-availability zone (multi-AZ) deployment, plus resilient AWS cloud native services, can mitigate the impact.

Likelihood and impact of failure events

Figure 1. Likelihood and impact of failure events

As demonstrated in the Figure 1, infrastructure resiliency is a combination of high availability (HA) and disaster recovery (DR). HA involves increasing the availability of the system by implementing redundancy among the application components and removing single points of failure.

Application layer decisions, like creating stateless applications, make it simpler to implement HA at the infrastructure layer by allowing it to scale using Auto Scaling groups and distributing the redundant applications across multiple AZs.

Pattern 2: Understanding and controlling infrastructure failures

Building a resilient infrastructure requires understanding which infrastructure failures are under control and which ones are not, as demonstrated in Figure 2.

These insights allow us to automate the detection of failures, control them, and employ pro-active patterns, such as static stability, to mitigate the need to scale up the infrastructure by over-provisioning it in advance.

Proactively designing systems in the event of failure

Figure 2. Proactively designing systems in the event of failure

The infrastructure decisions under our control that can increase the infrastructure resiliency of our system, include:

  • AWS services have control and data planes designed for minimum blast radius. Data planes typically have higher availability design goals than control planes and are usually less complex. When implementing recovery or mitigation responses to events that can affect resiliency, using control plane operations can lower the overall resiliency of your architectures. For example, Amazon Route 53 (Route 53) has a data plane designed for a 100% availability SLA. A good fail-over mechanism should rely on the data plane and not the control plane, as explained in Creating Disaster Recovery Mechanisms Using Amazon Route 53.
  • Understanding networking design and routes implemented in a virtual private cloud (VPC) are critical when testing the flow of traffic in our application. Understanding the flow of traffic helps us design better applications and see how one component failure can affect overall ingress/egress traffic. To achieve better network resiliency, it’s important to implement a good subnet strategy and manage our IP addresses to avoid fail-over issues and asymmetric routing in hybrid architectures. Use IP address management tools for established subnet strategies and routing decisions.
  • When designing VPCs and AZs, understanding the service limits, deploying independent routing tables and components in each zone increases availability. For example, highly available NAT gateways are preferred over NAT instances, as noted in the comparison provided in the Amazon VPC documentation.

Pattern 3: Considering different ways of increasing HA at the infrastructure layer

As already detailed, infrastructure resiliency = HA + DR.

Different ways by which system availability can be increased include:

  • Building for redundancy: Redundancy is the duplication of application components to increase the overall availability of the distributed system. After following application layer best practices, we can build auto healing mechanisms at the infrastructure layer.

We can take advantage of auto scaling features and use Amazon CloudWatch metrics and alarms to set up auto scaling triggers and deploy redundant copies of our applications across multiple AZs. This protects workloads from AZ failures, as shown in Figure 3.

Redundancy increases availability

Figure 3. Redundancy increases availability

  • Auto scale your infrastructure: When there are AZ failures, infrastructure auto scaling maintains the desired number of redundant components, which helps maintain the base level application throughput. This way, HA system and manage costs are maintained. Auto scaling uses metrics to scale in and out, appropriately, as shown in Figure 4.
How auto scaling improves availability

Figure 4. How auto scaling improves availability

  • Implement resilient network connectivity patterns: While building highly resilient distributed systems, network access to AWS infrastructure also needs to be highly resilient. While deploying hybrid applications, the capacity needed for hybrid applications to communicate with their cloud native application counterparts is an important consideration in designing the network access using AWS Direct Connect or VPNs.

Testing failover and fallback scenarios helps validate that network paths operate as expected and routes fail over as expected to meet RTO objectives. As the number of connection points between the data center and AWS VPCs increases, a hub and spoke configuration provided by the Direct Connect gateway and transit gateways simplify network topology, testing, and fail over. For more information, visit the AWS Direct Connect Resiliency Recommendations.

  • Whenever possible, use the AWS networking backbone to increase security, resiliency, and lower cost. AWS PrivateLink provides secure access to AWS services and exposes the application’s functionalities and APIs to other business units or partner accounts hosted on AWS.
  • Security appliances need to be set up in HA configuration, so that even if one AZ is unavailable, security inspection can be taken over by the redundant appliances in the other AZs.
  • Think ahead about DNS resolution: DNS is a critical infrastructure component; hybrid DNS resolution should be designed carefully with Route 53 HA inbound and outbound resolver endpoints instead of using self-managed proxies.

Implement a good strategy to share DNS resolver rules across AWS accounts and VPC’s with Resource Access Manager. Network failover tests are an important part of Disaster Recovery and Business Continuity Plans. To learn more, visit Set up integrated DNS resolution for hybrid networks in Amazon Route 53.

Additionally, ELB uses health checks to make sure that requests will route to another component if the underlying traffic application component fails. This improves the distributed system’s availability, as it is the cumulative availability of all different layers in our system. Figure 5 details advantages of some AWS managed services.

AWS managed services help in building resilient infrastructures (click the image to enlarge)

Figure 5. AWS managed services help in building resilient infrastructures (click the image to enlarge)

Pattern 4: Use RTO and RPO requirements to determine the correct failover strategy for your application

Capture RTO and RPO requirements early on to determine solid failover strategies (Figure 6). Disaster recovery strategies within AWS range from low cost and complexity (like backup and restore), to more complex strategies when lower values of RTO and RPO are required.

In pilot light and warm standby, only the primary region receives traffic. Pilot light only critical infrastructure components run in the backup region. Automation is used to check failures in the primary region using health checks and other metrics.

When health checks fail, use a combination of auto scaling groups, automation, and Infrastructure as Code (IaC) for quick deployment of other infrastructure components.

Note: This strategy depends on control plane availability in the secondary region for deploying the resources; keep this point in mind if you don’t have compute pre-provisioned in the secondary region. Carefully consider the business requirements and a distributed system’s application-level characteristics before deciding on a failover strategy. To understand all the factors and complexities involved in each of these disaster recovery strategies refer to disaster recovery options in the cloud.

Relationship between RTO, RPO, cost, data loss, and length of service interruption

Figure 6. Relationship between RTO, RPO, cost, data loss, and length of service interruption

Conclusion

In Part 2 of this series, we discovered that infrastructure resiliency is a combination of HA and DR. It is important to consider likelihood and impact of different failure events on availability requirements. Building in application layer resiliency patterns (Part 1 of this series), along with early discovery of the RTO/RPO requirements, as well as operational and process resiliency of an organization helps in choosing the right managed services and putting in place the appropriate failover strategies for distributed systems.

It’s important to differentiate between normal and abnormal load threshold for applications in order to put automation, alerts, and alarms in place. This allows us to auto scale our infrastructure for normal expected load, plus implement corrective action and automation to root out issues in case of abnormal load. Use IaC for quick failover and test failover processes.

Stay tuned for Part 3, in which we discuss operational resiliency!

Let’s Architect! Architecting for the edge

Post Syndicated from Luca Mezzalira original https://aws.amazon.com/blogs/architecture/lets-architect-architecting-for-the-edge/

Edge computing comprises elements of geography and networking and brings computing closer to the end users of the application.

For example, using a content delivery network (CDN) such as AWS CloudFront can help video streaming providers reduce latency for distributing their material by taking advantage of caching at the edge. Another example might look like an Internet of Things (IoT) solution that helps a company run business logic in remote areas or with low latency.

IoT is a challenging field because there are multiple aspects to consider as architects, like hardware, protocols, networking, and software. All of these aspects must be designed to interact together and be fault tolerant.

In this edition of Let’s Architect!, we share resources that are helpful for teams that are approaching or expanding their workloads for edge computing We cover macro topics such as security, best practices for IoT, patterns for machine learning (ML), and scenarios with strict latency requirements.

Build Machine Learning at the edge applications

In Let’s Architect! Architecting for Machine Learning, we touched on some of the most relevant aspects to consider while putting ML into production. However, in many scenarios, you may also have specific constraints like latency or a lack of connectivity that require you to design a deployment at the edge.

This blog post considers a solution based on ML applied to agriculture, where a reliable connection to the Internet is not always available. You can learn from this scenario, which includes information from model training to deployment, to design your ML workflows for the edge. The solution uses Amazon SageMaker in the cloud to explore, train, package, and deploy the model to AWS IoT Greengrass, which is used for inference at the edge.

 High-level architecture of the components that reside on the farm and how they interact with the cloud environment

High-level architecture of the components that reside on the farm and how they interact with the cloud environment

Security at the edge

Security is one of the fundamental pillars described in the AWS Well-Architected Framework. In all organizations, security is a major concern both for the business and the technical stakeholders. It impacts the products they are building and the perception that customers have.

We covered security in Let’s Architect! Architecting for Security, but we didn’t focus specifically on edge technologies. This whitepaper shows approaches for implementing a security strategy at the edge, with a focus on describing how AWS services can be used. You can learn how to secure workloads designed for content delivery, as well as how to implement network protection to defend against DDoS attacks and protect your IoT solutions.

The AWS Well-Architected Tool is designed to help you review the state of your applications and workloads. It provides a central place for architectural best practices and guidance

The AWS Well-Architected Tool is designed to help you review the state of your applications and workloads. It provides a central place for architectural best practices and guidance

AWS Outposts High Availability Design and Architecture Considerations

AWS Outposts allows companies to run some AWS services on-premises, which may be crucial to comply with strict data residency or low latency requirements. With Outposts, you can deploy servers and racks from AWS directly into your data center.

This whitepaper introduces architectural patterns, anti-patterns, and recommended practices for building highly available systems based on Outposts. You will learn how to manage your Outposts capacity and use networking and data center facility services to set up highly available solutions. Moreover, you can learn from mental models that AWS engineers adopted to consider the different failure modes and the corresponding mitigations, and apply the same models to your architectural challenges.

An Outpost deployed in a customer data center and connected back to its anchor Availability Zone and parent Region

An Outpost deployed in a customer data center and connected back to its anchor Availability Zone and parent Region

AWS IoT Lens

The AWS Well-Architected Lenses are designed for specific industry or technology scenarios. When approaching the IoT domain, the AWS IoT Lens is a key resource to learn the best practices to adopt for IoT. This whitepaper breaks down the IoT workloads into the different subdomains (for example, communication, ingestion) and maps the AWS services for IoT with each specific challenge in the corresponding subdomain.

As architects and developers, we tend to automate and reduce the risk of human errors, so the IoT Lens Checklist is a great resource to review your workloads by following a structured approach.

Workload context checklist from the IoT Lens Checklist

Workload context checklist from the IoT Lens Checklist

See you next time!

Thanks for joining our discussion on architecting for the edge! See you in two weeks when we talk about database architectures on AWS.

Other posts in this series

Looking for more architecture content?

AWS Architecture Center provides reference architecture diagrams, vetted architecture solutions, Well-Architected best practices, patterns, icons, and more!

Extending your SaaS platform with AWS Lambda

Post Syndicated from Hasan Tariq original https://aws.amazon.com/blogs/architecture/extending-your-saas-platform-with-aws-lambda/

Software as a service (SaaS) providers continuously add new features and capabilities to their products to meet their growing customer needs. As enterprises adopt SaaS to reduce the total cost of ownership and focus on business priorities, they expect SaaS providers to enable customization capabilities.

Many SaaS providers allow their customers (tenants) to provide customer-specific code that is triggered as part of various workflows by the SaaS platform. This extensibility model allows customers to customize system behavior and add rich integrations, while allowing SaaS providers to prioritize engineering resources on the core SaaS platform and avoid per-customer customizations.

To simplify experience for enterprise developers to build on SaaS platforms, SaaS providers are offering the ability to host tenant’s code inside the SaaS platform. This blog provides architectural guidance for running custom code on SaaS platforms using AWS serverless technologies and AWS Lambda without the overhead of managing infrastructure on either the SaaS provider or customer side.

Vendor-hosted extensions

With vendor-hosted extensions, the SaaS platform runs the customer code in response to events that occur in the SaaS application. In this model, the heavy-lifting of managing and scaling the code launch environment is the responsibility of the SaaS provider.

To host and run custom code, SaaS providers must consider isolating the environment that runs untrusted custom code from the core SaaS platform, as detailed in Figure 1. This introduces additional challenges to manage security, cost, and utilization.

Distribution of responsibility between Customer and SaaS platform with vendor-hosted extensions

Figure 1. Distribution of responsibility between Customer and SaaS platform with vendor-hosted extensions

Using AWS serverless services to run custom code

Using AWS serverless technologies removes the tasks of infrastructure provisioning and management, as there are no servers to manage, and SaaS providers can take advantage of automatic scaling, high availability, and security, while only paying for value.

Example use case

Let’s take an example of a simple SaaS to-do list application that supports the ability to initiate custom code when a new to-do item is added to the list. This application is used by customers who supply custom code to enrich the content of newly added to-do list items. The requirements for the solution consist of:

  • Custom code provided by each tenant should run in isolation from all other tenants and from the SaaS core product
  • Track each customer’s usage and cost of AWS resources
  • Ability to scale per customer

Solution overview

The SaaS application in Figure 2 is the core application used by customers, and each customer is considered a separate tenant. For the sake of brevity, we assume that the customer code was already stored in an Amazon Simple Storage Service (Amazon S3) bucket as part of the onboarding. When an eligible event is generated in the SaaS application as a result of user action, like a new to-do item added, it gets propagated down to securely launch the associated customer code.

Example use case architecture

Figure 2. Example use case architecture

Walkthrough of custom code run

Let’s detail the initiation flow of custom code when a user adds a new to-do item:

  1. An event is generated in the SaaS application when a user performs an action, like adding a new to-do list item. To extend the SaaS application’s behavior, this event is linked to the custom code. Each event contains a tenant ID and any additional data passed as part of the payload. Each of these events is an “initiation request” for the custom code Lambda function.
  2. Amazon EventBridge is used to decouple the SaaS Application from event processing implementation specifics. EventBridge makes it easier to build event-driven applications at scale and keeps the future prospect of adding additional consumers. In case of unexpected failure in any downstream service, EventBridge retries sending events a set number of times.
  3. EventBridge sends the event to an Amazon Simple Queue Service (Amazon SQS) queue as a message that is subsequently picked up by a Lambda function (Dispatcher) for further routing. Amazon SQS enables decoupling and scaling of microservices and also provides a buffer for the events that are awaiting processing.
  4. The Dispatcher polls the messages from SQS queue and is responsible for routing the events to respective tenants for further processing. The Dispatcher retrieves the tenant ID from the message and performs a lookup in the database (we recommend Amazon DynamoDB for low latency), retrieves tenant SQS Amazon Resource Name (ARN) to determine which queue to route the event. To further improve performance, you can cache the tenant-to-queue mapping.
  5. The tenant SQS queue acts as a message store buffer and is configured as an event source for a Lambda function. Using Amazon SQS as an event source for Lambda is a common pattern.
  6. Lambda executes the code uploaded by the tenant to perform the desired operation. Common utility and management code (including logging and telemetry code) is kept in Lambda layers that get added to every custom code Lambda function provisioned.
  7. After performing the desired operation on data, custom code Lambda returns a value back to the SaaS application. This completes the run cycle.

This architecture allows SaaS applications to create a self-managed queue infrastructure for running custom code for tenants in parallel.

Tenant code upload

The SaaS platform can allow customers to upload code either through a user interface or using a command line interface that the SaaS provider provides to developers to facilitate uploading custom code to the SaaS platform. Uploaded code is saved in the custom code S3 bucket in .zip format that can be used to provision Lambda functions.

Custom code Lambda provisioning

The tenant environment includes a tenant SQS queue and a Lambda function that polls initiation requests from the queue. This Lambda function serves several purposes, including:

  1. It polls messages from the SQS queue and constructs a JSON payload that will be sent an input to custom code.
  2. It “wraps” the custom code provided by the customer using boilerplate code, so that custom code is fully abstracted from the processing implementation specifics. For example, we do not want custom code to know that the payload it is getting is coming from Amazon SQS or be aware of the destination where launch results will be sent.
  3. Once custom code initiation is complete, it sends a notification with launch results back to the SaaS application. This can be done directly via EventBridge or Amazon SQS.
  4. This common code can be shared across tenants and deployed by the SaaS provider, either as a library or as a Lambda layer that gets added to the Lambda function.

Each Lambda function execution environment is fully isolated by using a combination of open-source and proprietary isolation technologies, it helps you to address the risk of cross-contamination. By having a separate Lambda function provisioned per-tenant, you achieve the highest level of isolation and benefit from being able to track per-tenant costs.

Conclusion

In this blog post, we explored the need to extend SaaS platforms using custom code and why AWS serverless technologies—using Lambda and Amazon SQS—can be a good fit to accomplish that. We also looked at a solution architecture that can provide the necessary tenant isolation and is cost-effective for this use case.

For more information on building applications with Lambda, visit Serverless Land. For best practices on building SaaS applications, visit SaaS on AWS.

Sequence Diagrams enrich your understanding of distributed architectures

Post Syndicated from Kevin Hakanson original https://aws.amazon.com/blogs/architecture/sequence-diagrams-enrich-your-understanding-of-distributed-architectures/

Architecture diagrams visually communicate and document the high-level design of a solution. As the level of detail increases, so does the diagram’s size, density, and layout complexity. Using Sequence Diagrams, you can explore additional usage scenarios and enrich your understanding of the distributed architecture while continuing to communicate visually.

This post takes a sample architecture and iteratively builds out a set of Sequence Diagrams. Each diagram adds to the vocabulary and graphical notation of Sequence Diagrams, then shows how the diagram deepened understanding of the architecture. All diagrams in this post were rendered from a text-based domain specific language using a diagrams-as-code tool instead of being drawn with graphical diagramming software.

Sample architecture

The architecture is based on Implementing header-based API Gateway versioning with Amazon CloudFront from the AWS Compute Blog, which uses the AWS Lambda@Edge feature to dynamically route the request to the targeted API version.

Amazon API Gateway is a fully managed service that makes it easier for developers to create, publish, maintain, monitor, and secure APIs at any scale. Amazon CloudFront is a global content delivery network (CDN) service built for high-speed, low-latency performance, security, and developer ease-of-use. Lambda@Edge lets you run functions that customize the content that CloudFront delivers.

The numbered labels in Figure 1 correspond to the following text descriptions:

  1. User sends an HTTP request to CloudFront, including a version header.
  2. CloudFront invokes the Lambda@Edge function for the Origin Request event.
  3. The function matches the header value to data fetched from an Amazon DynamoDB table, then modifies the Host header and path of the request and returns it to CloudFront.
  4. CloudFront routes the HTTP request to the matching API Gateway.

Figure 1 architecture diagram is a free-form mixture between a structure diagram and a behavior diagram. It includes structural aspects from a high-level Deployment Diagram, which depicts network connections between AWS services. It also demonstrates behavioral aspects from a Communication Diagram, which uses messages represented by arrows labeled with chronological numbers.

High-level architecture diagram

Figure 1. High-level architecture diagram

Sequence Diagrams

Sequence Diagrams are part of a subset of behavior diagrams known as interaction diagrams, which emphasis control and data flow. Sequence Diagrams model the ordered logic of usage scenarios in a consistent visual manner and capture detailed behaviors. I use this diagram type for analysis and design purposes and to validate my assumptions about data flows in distributed architectures. Let’s investigate the system use case where the API is called without a header indicating the requested version using a Sequence Diagram.

Examining the system use case

In Figure 2, User, Web Distribution, and Origin Request are each actors or system participants. The parallel vertical lines underneath these participants are lifelines. The horizontal arrows between participants are messages, with the arrowhead indicating message direction. Messages are arranged in time sequence from top to bottom. The dashed lines represent reply messages. The text inside guillemets («like this») indicate a stereotype, which refines the meaning of a model element. The rectangle with the bent upper-right corner is a note containing additional useful information.

Missing accept-version header

Figure 2. Missing accept-version header

The message from User to Web Distribution lacks any HTTP header that indicates the version, which precipitates the choice of Accept-Version for this name. The return message requires a decision about HTTP status code for this error case (400). The interaction with the Origin Request prompts a selection of Lambda runtimes (nodejs14.x) and understanding the programming model for generating an HTTP response for this request.

Designing the interaction

Next, let’s design the interaction when the Accept-Version header is present, but the corresponding value is not found in the Version Mappings table.

Figure 3 adds new notation to the diagram. The rectangle with “opt” in the upper-left corner and bolded text inside square brackets is an interaction fragment. The “opt” indicates this operation is an option based on the constraint (or guard) that “version mappings not cached” is true.

API version not found

Figure 3. API version not found

A DynamoDB scan operation on every request consumes table read capacity. Caching Version Mappings data inside the Lambda@Edge function’s memory optimizes for on-demand capacity mode. The «on-demand» stereotype on the DynamoDB participant succinctly communicates this decision. The “API V3 not found” note on Figure 3 provides clarity to the reader. The HTTP status code for this error case is decided as 404 with a custom description of “API Version Not Found.”

Now, let’s design the interaction where the API version is found and the caller receives a successful response.

Figure 4 is similar to Figure 3 up until the note, which now indicates “API V1 found.” Consulting the documentation for Writing functions for Lambda@Edge, the request event is updated with the HTTP Host header and path for the “API V1” Amazon API Gateway.

API version found

Figure 4. API version found

Instead of three separate diagrams for these individual scenarios, a single, combined diagram can represent the entire set of use cases. Figure 5 includes two new “alt” interaction fragments that represent choices of alternative behaviors.

The first “alt” has a guard of “missing Accept-Version header” mapping to our Figure 2 use case. The “else” guard encompasses the remaining use cases containing a second “alt” splitting where Figure 3 and Figure 4 diverge. That “version not found” guard is the Figure 3 use case returning the 404, while that “else” guard is the Figure 4 success condition. The added notes improve visual clarity.

Header-based API Gateway versioning with CloudFront

Figure 5. Header-based API Gateway versioning with CloudFront

Diagrams as code

After diagrams are created, the next question is where to save them and how to keep them updated. Because diagrams-as-code use text-based files, they can be stored and versioned in the same source control system as application code. Also consider an architectural decision record (ADR) process to document and communicate architecturally significant decisions. Then as application code is updated, team members can revise both the ADR narrative and the text-based diagram source. Up-to-date documentation is important for operationally supporting production deployments, and these diagrams quickly provide a visual understanding of system component interactions.

Conclusion

This post started with a high-level architecture diagram and ended with an additional Sequence Diagram that captures multiple usage scenarios. This improved understanding of the system design across success and error use cases. Focusing on system interactions prior to coding facilitates the interface definition and emergent properties discovery, before thinking in terms of programming language specific constructs and SDKs.

Experiment to see if Sequence Diagrams improve the analysis and design phase of your next project. View additional examples of diagrams-as-code from the AWS Icons for PlantUML GitHub repository. The Workload Discovery on AWS solution can even build detailed architecture diagrams of your workloads based on live data from AWS.

For vetted architecture solutions and reference architecture diagrams, visit the AWS Architecture Center. For more serverless learning resources, visit Serverless Land.

Related information

  • The Unified Modeling Language specification provides the full definition of Sequence Diagrams. This includes notations for additional interaction frame operators, using open arrow heads to represent asynchronous messages, and more.
  • Diagrams were created for this blog post using PlantUML and the AWS Icons for PlantUML. PlantUML integrates with IDEs, wikis, and other external tools. PlantUML is distributed under multiple open-source licenses, allowing local server rendering for diagrams containing sensitive information. AWS Icons for PlantUML include the official AWS Architecture Icons.

Optimizing your AWS Infrastructure for Sustainability, Part IV: Databases

Post Syndicated from Otis Antoniou original https://aws.amazon.com/blogs/architecture/optimizing-your-aws-infrastructure-for-sustainability-part-iv-databases/

In Part I: Compute, Part II: Storage, and Part III: Networking of this series, we introduced strategies to optimize the compute, storage, and networking layers of your AWS architecture for sustainability.

This post, Part IV, focuses on the database layer and proposes recommendations to optimize your databases’ utilization, performance, and queries. These recommendations are based on design principles of AWS Well-Architected Sustainability Pillar.

Optimizing the database layer of your AWS infrastructure

AWS database services

Figure 1. AWS database services

As your application serves more customers, the volume of data stored within your databases will increase. Implementing the recommendations in the following sections will help you use databases resources more efficiently and save costs.

Use managed databases

Usually, customers overestimate the capacity they need to absorb peak traffic, wasting resources and money on unused infrastructure. AWS fully managed database services provide continuous monitoring, which allows you to increase and decrease your database capacity as needed. Additionally, most AWS managed databases use a pay-as-you-go model based on the instance size and storage used.

Managed services shift responsibility to AWS for maintaining high average utilization and sustainability optimization of the deployed hardware. Amazon Relational Database Service (Amazon RDS) reduces your individual contribution compared to maintaining your own databases on Amazon Elastic Compute Cloud (Amazon EC2). In a managed database, AWS continuously monitors your clusters to keep your workloads running with self-healing storage and automated scaling.

AWS offers 15+ purpose-built engines to support diverse data models. For example, if an Internet of Things (IoT) application needs to process large amounts of time series data, Amazon Timestream is designed and optimized for this exact use case.

Rightsize, reduce waste, and choose the right hardware

To see metrics, thresholds, and actions you can take to identify underutilized instances and rightsizing opportunities, Optimizing costs in Amazon RDS provides great guidance. The following table provides additional tools and metrics for you to find unused resources:

Service Metric Source
Amazon RDS DatabaseConnections Amazon CloudWatch
Amazon RDS Idle DB Instances AWS Trusted Advisor
Amazon DynamoDB AccountProvisionedReadCapacityUtilization, AccountProvisionedWriteCapacityUtilization, ConsumedReadCapacityUnits, ConsumedWriteCapacityUnits CloudWatch
Amazon Redshift Underutilized Amazon Redshift Clusters AWS Trusted Advisor
Amazon DocumentDB DatabaseConnections, CPUUtilization, FreeableMemory CloudWatch
Amazon Neptune CPUUtilization, VolumeWriteIOPs, MainRequestQueuePendingRequests CloudWatch
Amazon Keyspaces ProvisionedReadCapacityUnits, ProvisionedWriteCapacityUnits, ConsumedReadCapacityUnits, ConsumedWriteCapacityUnits CloudWatch

These tools will help you identify rightsizing opportunities. However, rightsizing databases can affect your SLAs for query times, so consider this before making changes.

We also suggest:

  • Evaluating if your existing SLAs meet your business needs or if they could be relaxed as an acceptable trade-off to optimize your environment for sustainability.
  • If any of your RDS instances only need to run during business hours, consider shutting them down outside business hours either manually or with Instance Scheduler.
  • Consider using a more power-efficient processor like AWS Graviton-based instances for your databases. Graviton2 delivers 2-3.5 times better CPU performance per watt than any other processor in AWS.

Make sure to choose the right RDS instance type for the type of workload you have. For example, burstable performance instances can deal with spikes that exceed the baseline without the need to overprovision capacity. In terms of storage, Amazon RDS provides three storage types that differ in performance characteristics and price, so you can tailor the storage layer of your database according to your needs.

Use serverless databases

Production databases that experience intermittent, unpredictable, or spiky traffic may be underutilized. To improve efficiency and eliminate excess capacity, scale your infrastructure according to its load.

AWS offers relational and non-relational serverless databases that shut off when not in use, quickly restart, and automatically scale database capacity based on your application’s needs. This reduces your environmental impact because capacity management is automatically optimized. By selecting the best purpose-built database for your workload, you’ll benefit from the scalability and fully-managed experience of serverless database services, as shown in the following table.


Serverless Relational Databases Serverless Non-relational Databases
Amazon Aurora Serverless for an on-demand, autoscaling configuration Amazon DynamoDB (in On-Demand mode) for a fully managed, serverless, key-value NoSQL database
Amazon Redshift Serverless runs and scales data warehouse capacity; you don’t need to set up and manage data warehouse infrastructure Amazon Timestream for a time series database service for IoT and operational applications
Amazon Keyspaces for a scalable, highly available, and managed Apache Cassandra–compatible database service
Amazon Quantum Ledger Database for a fully managed ledger database that provides a transparent, immutable, and cryptographically verifiable transaction log ‎owned by a central trusted authority

Use automated database backups and remove redundant data

Manual Amazon RDS backups, unlike automated backups, take a manual snapshot of your database and do not have a retention period set by default. This means that unless you delete a manual snapshot, it will not be removed automatically. Removing manual snapshots you don’t need will use fewer resources, which will reduce your costs. If you want manual snapshots of RDS, you can set an “expiration” with AWS Backup. To keep long-term snapshots of MariaDB, MySQL, and PostgreSQL data, we recommend exporting snapshot data to Amazon Simple Storage Service (Amazon S3). You can also export specific tables or databases. This way, you can move data to “colder” longer-term archival storage instead of keeping it within your database.

Optimize long running queries

Identify and optimize queries that are resource intensive because they can affect the overall performance of your application. By using the Performance Insights dashboard, specifically the Top Dimensions table, which displays the Top SQL, waits, and hosts, you’ll be able to view and download SQL queries to diagnose and investigate further.

Tuning Amazon RDS for MySQL with Performance Insights and this knowledge center article will help you optimize and tune queries in Amazon RDS for MySQL. The Optimizing and tuning queries in Amazon RDS PostgreSQL based on native and external tools and Improve query performance with parallel queries in Amazon RDS for PostgreSQL and Amazon Aurora PostgreSQL-Compatible Edition blog posts outline how to use native and external tools to optimize and tune Amazon RDS PostgreSQL queries, as well as improve query performance using the parallel query feature.

Improve database performance

You can improve your database performance by monitoring, identifying, and remediating anomalous performance issues. Instead of relying on a database administrator (DBA), AWS offers native tools to continuously monitor and analyze database telemetry, as shown in the following table.

Service CloudWatch Metric Source
Amazon DynamoDB CPUUtilization, FreeStorageSpace CloudWatch
Amazon Redshift CPUUtilization, PercentageDiskSpaceUsed CloudWatch
Amazon Aurora CPUUtilization, FreeLocalStorage Amazon RDS
DynamoDB AccountProvisionedReadCapacityUtilization, AccountProvisionedWriteCapacityUtilization CloudWatch
Amazon ElastiCache CPUUtilization CloudWatch

CloudWatch displays instance-level and account-level usage metrics for Amazon RDS. Create CloudWatch alarms to activate and notify you based on metric value thresholds you specify or when anomalous metric behavior is detected. Enable Enhanced Monitoring real-time metrics for the operating system the DB instance runs on.

Amazon RDS Performance Insights collects performance metrics, such as database load, from each RDS DB instance. This data gives you a granular view of the databases’ activity every second. You can enable Performance Insights without causing downtime, reboot, or failover.

Amazon DevOps Guru for RDS uses the data from Performance Insights, Enhanced Monitoring, and CloudWatch to identify operational issues. It uses machine learning to detect and notify of database-related issues, including resource overutilization or misbehavior of certain SQL queries.

Conclusion

In this blog post, we discussed technology choices, design principles, and recommended actions to optimize and increase efficiency of your databases. As your data grows, it is important to scale your database capacity in line with your user load, remove redundant data, optimize database queries, and optimize database performance. Figure 2 shows an overview of the tools you can use to optimize your databases.

Figure 2. Tools you can use on AWS for optimization purposes

Figure 2. Tools you can use on AWS for optimization

Other blog posts in this series

A multi-dimensional approach helps you proactively prepare for failures, Part 1: Application layer

Post Syndicated from Piyali Kamra original https://aws.amazon.com/blogs/architecture/a-multi-dimensional-approach-helps-you-proactively-prepare-for-failures-part-1-application-layer/

Resiliency of applications surpasses everything else in building customer trust. Because of this, it cannot be an afterthought. Instead of simply reacting to a failure, why not be proactive?

As your system expands, you’ll likely encounter issues that can hinder your ability to scale, like security and cost. So, it’s necessary to think about the correct architectural patterns beforehand to minimize your chances of enduring a failure without a recovery plan.

In this multi-part blog series, we’ll show you how to take a multi-dimensional approach to ensure your applications, infrastructure, and operational processes can detect points of failure and can gracefully react if (and inevitably when) a failure occurs.

In each part of the series, we recommend resiliency architecture patterns and managed services to apply across all layers of your distributed system to create a production-ready, resilient application. This post, Part 1, examines how to create application layer resiliency.

Example use case

To illustrate our recommendations for building an effective distributed system, we’ll consider a simple order payment system. Figure 1 shows our base implementation. The real-time part of the distributed system is built with:

This system is transactional so far, but we need to aggregate and analyze data. We do this using Amazon Simple Queue Service (Amazon SQS), AWS Lambda, AWS Step Functions, Amazon S3, and Amazon Athena. Amazon Kinesis Data Firehose and Amazon Redshift populate the data warehouse via their data pipelines. Amazon QuickSight helps us visualize the data.

Architecture components of a distributed system

Figure 1. Architecture components of a distributed system

Next, let’s look into distributed architectural patterns we could apply to the base implementation to bolster resiliency and common tradeoffs you need to consider for each.

Pattern 1: Microservices

Microservices are building blocks for smaller, domain-specific services. As shown in the Microservices on AWS whitepaper, microservices offer many benefits. They reduce the blast radius of any failure, require smaller teams to manage them, and simplify deployment pipelines to get them into production.

Tradeoffs and their workarounds

If your distributed system is comprised of several smaller services, a failure or inability to respond to failures in one service might affect other services in the chain.

To help with this, consider implementing one or more of the following patterns.

Circuit breaker pattern

Like an electrical circuit breaker, the circuit breaker pattern stops cascading failures. You can implement it as an orchestrator, at an individual microservice level, and/or in a service mesh across multiple services to detect timeouts and track failures across services, which prevents a distributed system from getting overwhelmed.

Retries with exponential backoff and jitter

A common way to handle database timeouts is to implement retries. However, if all the transactions retry at the same interval, it might choke the network bandwidth and throttle the database.

We recommend introducing exponential backoff and jitter to the retries and to introduce an element of randomness in the retry interval.

Let’s see this in action. Consider the backend implementation of the order payment system in our example use case, as shown in Figure 2.

Backend processing of order payment system

Figure 2. Backend processing of order payment system

For incoming orders, the payment process must succeed for the order to be processed. To ensure latency in the payments database writes does not affect the transactions that read from the database for the order processing UI:

  1. Isolate reads and writes with a read-replica
  2. Use an Amazon RDS Proxy to handle connection pools and use throttling to help with preventing database congestion and locking
  3. Introduce exponential backoff to increase the time between subsequent retries of failed requests. Combine this approach with “jitter” to prevent large bursts of retries

Figure 3 compares recovery time with exponential backoff to exponential backoff combined with jitter:

Recovery time graph for exponential backoff with and without jitter

Figure 3. Recovery time graph for exponential backoff with and without jitter

Health checks and feature flags

If you’ve deployed new functionality in production and it doesn’t work as expected, use feature flags to turn it off rather than roll back the deployment. This helps you reduce operational complexity and downtime. See the Automating safe, hands-off deployments article for more information.

The load balancer uses periodic automatic health checks to determine if the backend service is healthy and can serve traffic. Figure 4 shows you where to use shallow and deep health checks:

  • Use shallow health checks to probe for host/local failures on a server resource (for example, liveliness checks).
  • Probing for dependency failures needs a deep health check. Deep health checks will give you a better understanding of the health of the system, but they’re expensive, and a dependency check failure can cause cascading failure throughout the system.
Shallow vs deep health checks

Figure 4. Shallow vs deep health checks

Pattern 2: Saga pattern

A saga pattern keeps your data consistent across microservices when a transaction spans multiple services. It updates each service with a message or event to prompt the service to move to the next transaction step.

For example, in our order payment system, a transaction is considered successful if the payment for that order is processed.

Tradeoffs and their workarounds

The saga pattern is great for long transactions. However, if a step in the process cannot complete, you’ll need compensating transactions in place to undo any changes from previous steps. For example, as shown in Figure 5, if the payment fails, the customer’s order must be canceled.

The saga pattern coordinates transactions across a system of microservices

Figure 5. The saga pattern coordinates transactions across a system of microservices

Consider implementing the following pattern to set up compensating transactions.

Serverless saga pattern with Step Functions

We recommend using a serverless orchestrator in Step Functions to roll back to a previous step in an order. Figure 6 shows the serverless orchestrator and how its lightweight, centralized control service coordinates the flow across microservices. It performs compensating transactions during failure scenarios to ensure that if one microservice fails, the others will not.

Step Functions as serverless orchestrators

Figure 6. Step Functions as serverless orchestrators

Pattern 3: Event-driven architecture

An event-driven architecture uses events to communicate between decoupled services. By decoupling your services, they are only aware of the event router, not each other. This means that your services are interoperable, but if one service has a failure, the rest will keep running. The event router acts as an elastic buffer that will accommodate surges in workloads.

Tradeoffs and their workarounds

An event-driven architecture provides multiple implementation options. Carefully consider your system’s distinct attributes and scaling and performance needs to decide on a suitable approach.

The mind map in Figure 7 shows when to use an event-driven pattern, our recommendations for implementation, tradeoffs and their workarounds, and anti-patterns:

Decision criteria for event-driven architecture pattern

Figure 7. Decision criteria for event-driven architecture pattern (click the image to enlarge)

Pattern 4: Cache pattern

Deploying stateless redundant copies of your application components, along with using distributed caches, can improve the availability of your system. This allows your infrastructure to scale in response to user requests.

Tradeoffs and their workarounds

Caches have multiple configuration options. Carefully consider your system’s distinct attributes and scaling and performance needs to decide on a suitable approach.

The mind map in Figure 8 shows when to use a cache pattern, our recommendations for implementation, tradeoffs and their workarounds, and anti-patterns:

Decision criteria for cache pattern

Figure 8. Decision criteria for cache pattern (click the image to enlarge)

Improving application resiliency with bounded contexts

Loosely coupled services improve availability more than only creating redundant copies of your applications. Figure 9 shows the benefits of a loosely coupled system versus a tightly coupled system.

Relationship between loose coupling and availability

Figure 9. Relationship between loose coupling and availability

Conclusion

In this post, we learned about various architecture patterns and their tradeoffs, and provided recommendations on how to gracefully mitigate failures before they happen.

Distributed systems can use all of these patterns, which helps improve resiliency at the application layer. Applying these patterns, along with the Infrastructure and Operations improvements discussed in parts 2 and 3, will provide frameworks for resilient applications.

Accelerate deployments on AWS with effective governance

Post Syndicated from Rostislav Markov original https://aws.amazon.com/blogs/architecture/accelerate-deployments-on-aws-with-effective-governance/

Amazon Web Services (AWS) users ask how to accelerate their teams’ deployments on AWS while maintaining compliance with security controls. In this blog post, we describe common governance models introduced in mature organizations to manage their teams’ AWS deployments. These models are best used to increase the maturity of your cloud infrastructure deployments.

Governance models for AWS deployments

We distinguish three common models used by mature cloud adopters to manage their infrastructure deployments on AWS. The models differ in what they control: the infrastructure code, deployment toolchain, or provisioned AWS resources. We define the models as follows:

  1. Central pattern library, which offers a repository of curated deployment templates that application teams can re-use with their deployments.
  2. Continuous Integration/Continuous Delivery (CI/CD) as a service, which offers a toolchain standard to be re-used by application teams.
  3. Centrally managed infrastructure, which allows application teams to deploy AWS resources managed by central operations teams.

The decision of how much responsibility you shift to application teams depends on their autonomy, operating model, application type, and rate of change. The three models can be used in tandem to address different use cases and maximize impact. Typically, organizations start by gathering pre-approved deployment templates in a central pattern library.

Model 1: Central pattern library

With this model, cloud platform engineers publish a central pattern library from which teams can reference infrastructure as code templates. Application teams reuse the templates by forking the central repository or by copying the templates into their own repository. Application teams can also manage their own deployment AWS account and pipeline with AWS CodePipeline), as well as the resource-provisioning process, while reusing templates from the central pattern library with a service like AWS CodeCommit. Figure 1 provides an overview of this governance model.

Deployment governance with central pattern library

Figure 1. Deployment governance with central pattern library

The central pattern library represents the least intrusive form of enablement via reusable assets. Application teams appreciate the central pattern library model, as it allows them to maintain autonomy over their deployment process and toolchain. Reusing existing templates speeds up the creation of your teams’ first infrastructure templates and eases policy adherence, such as tagging policies and security controls.

After the reusable templates are in the application team’s repository, incremental updates can be pulled from the central library when the template has been enhanced. This allows teams to pull when they see fit. Changes to the team’s repository will trigger the pipeline to deploy the associated infrastructure code.

With the central pattern library model, application teams need to manage resource configuration and CI/CD toolchain on their own in order to gain the benefits of automated deployments. Model 2 addresses this.

Model 2: CI/CD as a service

In Model 2, application teams launch a governed deployment pipeline from AWS Service Catalog. This includes the infrastructure code needed to run the application and “hello world” source code to show the end-to-end deployment flow.

Cloud platform engineers develop the service catalog portfolio (in this case the CI/CD toolchain). Then, application teams can launch AWS Service Catalog products, which deploy an instance of the pipeline code and populated Git repository (Figure 2).

The pipeline is initiated immediately after the repository is populated, which results in the “hello world” application being deployed to the first environment. The infrastructure code (for example, Amazon Elastic Compute Cloud [Amazon EC2] and AWS Fargate) will be located in the application team’s repository. Incremental updates can be pulled by launching a product update from AWS Service Catalog. This allows application teams to pull when they see fit.

Deployment governance with CI/CD as a service

Figure 2. Deployment governance with CI/CD as a service

This governance model is particularly suitable for mature developer organizations with full-stack responsibility or platform projects, as it provides end-to-end deployment automation to provision resources across multiple teams and AWS accounts. This model also adds security controls over the deployment process.

Since there is little room for teams to adapt the toolchain standard, the model can be perceived as very opinionated. The model expects application teams to manage their own infrastructure. Model 3 addresses this.

Model 3: Centrally managed infrastructure

This model allows application teams to provision resources managed by a central operations team as self-service. Cloud platform engineers publish infrastructure portfolios to AWS Service Catalog with pre-approved configuration by central teams (Figure 3). These portfolios can be shared with all AWS accounts used by application engineers.

Provisioning AWS resources via AWS Service Catalog products ensures resource configuration fulfills central operations requirements. Compared with Model 2, the pre-populated infrastructure templates launch AWS Service Catalog products, as opposed to directly referencing the API of the corresponding AWS service (for example Amazon EC2). This locks down how infrastructure is configured and provisioned.

Deployment governance with centrally managed infrastructure

Figure 3. Deployment governance with centrally managed infrastructure

In our experience, it is essential to manage the variety of AWS Service Catalog products. This avoids proliferation of products with many templates differing slightly. Centrally managed infrastructure propagates an “on-premises” mindset so it should be used only in cases where application teams cannot own the full stack.

Models 2 and 3 can be combined for application engineers to launch both deployment toolchain and resources as AWS Service Catalog products (Figure 4), while also maintaining the opportunity to provision from pre-populated infrastructure templates in the team repository. After the code is in their repository, incremental updates can be pulled by running an update from the provisioned AWS Service Catalog product. This allows the application team to pull an update as needed while avoiding manual deployments of service catalog products.

Using AWS Service Catalog to automate CI/CD and infrastructure resource provisioning

Figure 4. Using AWS Service Catalog to automate CI/CD and infrastructure resource provisioning

Comparing models

The three governance models differ along the following aspects (see Table 1):

  • Governance level: What component is managed centrally by cloud platform engineers?
  • Role of application engineers: What is the responsibility split and operating model?
  • Use case: When is each model applicable?

Table 1. Governance models for managing infrastructure deployments


Model 1: Central pattern library Model 2: CI/CD as a service Model 3: Centrally managed infrastructure
Governance level Centrally defined infrastructure templates Centrally defined deployment toolchain Centrally defined provisioning and management of AWS resources
Role of cloud platform engineers Manage pattern library and policy checks Manage deployment toolchain and stage checks Manage resource provisioning (including CI/CD)
Role of application teams Manage deployment toolchain and resource provisioning Manage resource provisioning Manage application integration
Use case Federated governance with application teams maintaining autonomy over application and infrastructure Platform projects or development organizations with strong preference for pre-defined deployment standards including toolchain Applications without development teams (e.g., “commercial-off-the-shelf”) or with separation of duty (e.g., infrastructure operations teams)

Conclusion

In this blog post, we distinguished three common governance models to manage the deployment of AWS resources. The three models can be used in tandem to address different use cases and maximize impact in your organization. The decision of how much responsibility is shifted to application teams depends on your organizational setup and use case.

Want to learn more?

Coordinating large messages across accounts and Regions with Amazon SNS and SQS

Post Syndicated from Mrudhula Balasubramanyan original https://aws.amazon.com/blogs/architecture/coordinating-large-messages-across-accounts-and-regions-with-amazon-sns-and-sqs/

Many organizations have applications distributed across various business units. Teams in these business units may develop their applications independent of each other to serve their individual business needs. Applications can reside in a single Amazon Web Services (AWS) account or be distributed across multiple accounts. Applications may be deployed to a single AWS Region or span multiple Regions.

Irrespective of how the applications are owned and operated, these applications need to communicate with each other. Within an organization, applications tend to be part of a larger system, therefore, communication and coordination among these individual applications is critical to overall operation.

There are a number of ways to enable coordination among component applications. It can be done either synchronously or asynchronously:

  • Synchronous communication uses a traditional request-response model, in which the applications exchange information in a tightly coupled fashion, introducing multiple points of potential failure.
  • Asynchronous communication uses an event-driven model, in which the applications exchange messages as events or state changes and are loosely coupled. Loose coupling allows applications to evolve independently of each other, increasing scalability and fault-tolerance in the overall system.

Event-driven architectures use a publisher-subscriber model, in which events are emitted by the publisher and consumed by one or more subscribers.

A key consideration when implementing an event-driven architecture is the size of the messages or events that are exchanged. How can you implement an event-driven architecture for large messages, beyond the default maximum of the services? How can you architect messaging and automation of applications across AWS accounts and Regions?

This blog presents architectures for enhancing event-driven models to exchange large messages. These architectures depict how to coordinate applications across AWS accounts and Regions.

Challenge with application coordination

A challenge with application coordination is exchanging large messages. For the purposes of this post, a large message is defined as an event payload between 256 KB and 2 GB. This stems from the fact that Amazon Simple Notification Service (Amazon SNS) and Amazon Simple Queue Service (Amazon SQS) currently have a maximum event payload size of 256 KB. To exchange messages larger than 256 KB, an intermediate data store must be used.

To exchange messages across AWS accounts and Regions, set up the publisher access policy to allow subscriber applications in other accounts and Regions. In the case of large messages, also set up a central data repository and provide access to subscribers.

Figure 1 depicts a basic schematic of applications distributed across accounts communicating asynchronously as part of a larger enterprise application.

Asynchronous communication across applications

Figure 1. Asynchronous communication across applications

Architecture overview

The overview covers two scenarios:

  1. Coordination of applications distributed across AWS accounts and deployed in the same Region
  2. Coordination of applications distributed across AWS accounts and deployed to different Regions

Coordination across accounts and single AWS Region

Figure 2 represents an event-driven architecture, in which applications are distributed across AWS Accounts A, B, and C. The applications are all deployed to the same AWS Region, us-east-1. A single Region simplifies the architecture, so you can focus on application coordination across AWS accounts.

Application coordination across accounts and single AWS Region

Figure 2. Application coordination across accounts and single AWS Region

The application in Account A (Application A) is implemented as an AWS Lambda function. This application communicates with the applications in Accounts B and C. The application in Account B is launched with AWS Step Functions (Application B), and the application in Account C runs on Amazon Elastic Container Service (Application C).

In this scenario, Applications B and C need information from upstream Application A. Application A publishes this information as an event, and Applications B and C subscribe to an SNS topic to receive the events. However, since they are in other accounts, you must define an access policy to control who can access the SNS topic. You can use sample Amazon SNS access policies to craft your own.

If the event payload is in the 256 KB to 2 GB range, you can use Amazon Simple Storage Service (Amazon S3) as the intermediate data store for your payload. Application A uses the Amazon SNS Extended Client Library for Java to upload the payload to an S3 bucket and publish a message to an SNS topic, with a reference to the stored S3 object. The message containing the metadata must be within the SNS maximum message limit of 256 KB. Amazon EventBridge is used for routing events and handling authentication.

The subscriber Applications B and C need to de-reference and retrieve the payloads from Amazon S3. The SQS queue in Account B and Lambda function in Account C subscribe to the SNS topic in Account A. In Account B, a Lambda function is used to poll the SQS queue and read the message with the metadata. The Lambda function uses the Amazon SQS Extended Client Library for Java to retrieve the S3 object referenced in the message.

The Lambda function in Account C uses the Payload Offloading Java Common Library for AWS to get the referenced S3 object.

Once the S3 object is retrieved, the Lambda functions in Accounts B and C process the data and pass on the information to downstream applications.

This architecture uses Amazon SQS and Lambda as subscribers because they provide libraries that support offloading large payloads to Amazon S3. However, you can use any Java-enabled endpoint, such as an HTTPS endpoint that uses Payload Offloading Java Common Library for AWS to de-reference the message content.

Coordination across accounts and multiple AWS Regions

Sometimes applications are spread across AWS Regions, leading to increased latency in coordination. For existing applications, it could take substantive effort to consolidate to a single Region. Hence, asynchronous coordination would be a good fit for this scenario. Figure 3 expands on the architecture presented earlier to include multiple AWS Regions.

Application coordination across accounts and multiple AWS Regions

Figure 3. Application coordination across accounts and multiple AWS Regions

The Lambda function in Account C is in the same Region as the upstream application in Account A, but the Lambda function in Account B is in a different Region. These functions must retrieve the payload from the S3 bucket in Account A.

To provide access, configure the AWS Lambda execution role with the appropriate permissions. Make sure that the S3 bucket policy allows access to the Lambda functions from Accounts B and C.

Considerations

For variable message sizes, you can specify if payloads are always stored in Amazon S3 regardless of their size, which can help simplify the design.

If the application that publishes/subscribes large messages is implemented using the AWS Java SDK, it must be Java 8 or higher. Service-specific client libraries are also available in Python, C#, and Node.js.

An Amazon S3 Multi-Region Access Point can be an alternative to a centralized bucket for the payloads. It has not been explored in this post due to the asynchronous nature of cross-region replication.

In general, retrieval of data across Regions is slower than in the same Region. For faster retrieval, workloads should be run in the same AWS Region.

Conclusion

This post demonstrates how to use event-driven architectures for coordinating applications that need to exchange large messages across AWS accounts and Regions. The messaging and automation are enabled by the Payload Offloading Java Common Library for AWS and use Amazon S3 as the intermediate data store. These components can simplify the solution implementation and improve scalability, fault-tolerance, and performance of your applications.

Ready to get started? Explore SQS Large Message Handling.

Web application access control patterns using AWS services

Post Syndicated from Zili Gao original https://aws.amazon.com/blogs/architecture/web-application-access-control-patterns-using-aws-services/

The web application client-server pattern is widely adopted. The access control allows only authorized clients to access the backend server resources by authenticating the client and providing granular-level access based on who the client is.

This post focuses on three solution architecture patterns that prevent unauthorized clients from gaining access to web application backend servers. There are multiple AWS services applied in these architecture patterns that meet the requirements of different use cases.

OAuth 2.0 authentication code flow

Figure 1 demonstrates the fundamentals to all the architectural patterns discussed in this post. The blog Understanding Amazon Cognito user pool OAuth 2.0 grants describes the details of different OAuth 2.0 grants, which can vary the flow to some extent.

A typical OAuth 2.0 authentication code flow

Figure 1. A typical OAuth 2.0 authentication code flow

The architecture patterns detailed in this post use Amazon Cognito as the authorization server, and Amazon Elastic Compute Cloud instance(s) as resource server. The client can be any front-end application, such as a mobile application, that sends a request to the resource server to access the protected resources.

Pattern 1

Figure 2 is an architecture pattern that offloads the work of authenticating clients to Application Load Balancer (ALB).

Application Load Balancer integration with Amazon Cognito

Figure 2. Application Load Balancer integration with Amazon Cognito

ALB can be used to authenticate clients through the user pool of Amazon Cognito:

  1. The client sends HTTP request to ALB endpoint without authentication-session cookies.
  2. ALB redirects the request to Amazon Cognito authentication endpoint. The client is authenticated by Amazon Cognito.
  3. The client is directed back to the ALB with the authentication code.
  4. The ALB uses the authentication code to obtain the access token from the Amazon Cognito token endpoint and also uses the access token to get client’s user claims from Amazon Cognito UserInfo endpoint.
  5. The ALB prepares the authentication session cookie containing encrypted data and redirects client’s request with the session cookie. The client uses the session cookie for all further requests. The ALB validates the session cookie and decides if the request can be passed through to its targets.
  6. The validated request is forwarded to the backend instances with the ALB adding HTTP headers that contain the data from the access token and user-claims information.
  7. The backend server can use the information in the ALB added headers for granular-level permission control.

The key takeaway of this pattern is that the ALB maintains the whole authentication context by triggering client authentication with Amazon Cognito and prepares the authentication-session cookie for the client. The Amazon Cognito sign-in callback URL points to the ALB, which allows the ALB access to the authentication code.

More details about this pattern can be found in the documentation Authenticate users using an Application Load Balancer.

Pattern 2

The pattern demonstrated in Figure 3 offloads the work of authenticating clients to Amazon API Gateway.

Amazon API Gateway integration with Amazon Cognito

Figure 3. Amazon API Gateway integration with Amazon Cognito

API Gateway can support both REST and HTTP API. API Gateway has integration with Amazon Cognito, whereas it can also have control access to HTTP APIs with a JSON Web Token (JWT) authorizer, which interacts with Amazon Cognito. The ALB can be integrated with API Gateway. The client is responsible for authenticating with Amazon Cognito to obtain the access token.

  1. The client starts authentication with Amazon Cognito to obtain the access token.
  2. The client sends REST API or HTTP API request with a header that contains the access token.
  3. The API Gateway is configured to have:
    • Amazon Cognito user pool as the authorizer to validate the access token in REST API request, or
    • A JWT authorizer, which interacts with the Amazon Cognito user pool to validate the access token in HTTP API request.
  4. After the access token is validated, the REST or HTTP API request is forwarded to the ALB, and:
    • The API Gateway can route HTTP API to private ALB via a VPC endpoint.
    • If a public ALB is used, the API Gateway can route both REST API and HTTP API to the ALB.
  5. API Gateway cannot directly route REST API to a private ALB. It can route to a private Network Load Balancer (NLB) via a VPC endpoint. The private ALB can be configured as the NLB’s target.

The key takeaways of this pattern are:

  • API Gateway has built-in features to integrate Amazon Cognito user pool to authorize REST and/or HTTP API request.
  • An ALB can be configured to only accept the HTTP API requests from the VPC endpoint set by API Gateway.

Pattern 3

Amazon CloudFront is able to trigger AWS Lambda functions deployed at AWS edge locations. This pattern (Figure 4) utilizes a feature of Lambda@Edge, where it can act as an authorizer to validate the client requests that use an access token, which is usually included in HTTP Authorization header.

Using Amazon CloudFront and AWS Lambda@Edge with Amazon Cognito

Figure 4. Using Amazon CloudFront and AWS Lambda@Edge with Amazon Cognito

The client can have an individual authentication flow with Amazon Cognito to obtain the access token before sending the HTTP request.

  1. The client starts authentication with Amazon Cognito to obtain the access token.
  2. The client sends a HTTP request with Authorization header, which contains the access token, to the CloudFront distribution URL.
  3. The CloudFront viewer request event triggers the launch of the function at Lambda@Edge.
  4. The Lambda function extracts the access token from the Authorization header, and validates the access token with Amazon Cognito. If the access token is not valid, the request is denied.
  5. If the access token is validated, the request is authorized and forwarded by CloudFront to the ALB. CloudFront is configured to add a custom header with a value that can only be shared with the ALB.
  6. The ALB sets a listener rule to check if the incoming request has the custom header with the shared value. This makes sure the internet-facing ALB only accepts requests that are forwarded by CloudFront.
  7. To enhance the security, the shared value of the custom header can be stored in AWS Secrets Manager. Secrets Manager can trigger an associated Lambda function to rotate the secret value periodically.
  8. The Lambda function also updates CloudFront for the added custom header and ALB for the shared value in the listener rule.

The key takeaways of this pattern are:

  • By default, CloudFront will remove the authorization header before forwarding the HTTP request to its origin. CloudFront needs to be configured to forward the Authorization header to the origin of the ALB. The backend server uses the access token to apply granular levels of resource access permission.
  • The use of Lambda@Edge requires the function to sit in us-east-1 region.
  • The CloudFront-added custom header’s value is kept as a secret that can only be shared with the ALB.

Conclusion

The architectural patterns discussed in this post are token-based web access control methods that are fully supported by AWS services. The approach offloads the OAuth 2.0 authentication flow from the backend server to AWS services. The services managed by AWS can provide the resilience, scalability, and automated operability for applying access control to a web application.

How to track AWS account metadata within your AWS Organizations

Post Syndicated from Jonathan Nguyen original https://aws.amazon.com/blogs/architecture/how-to-track-aws-account-metadata-within-your-aws-organizations/

United States Automobile Association (USAA) is a San Antonio-based insurance, financial services, banking, and FinTech company supporting millions of military members and their families. USAA has partnered with Amazon Web Services (AWS) to digitally transform and build multiple USAA solutions that help keep members safe and save members’ money and time.

Why build an AWS account metadata solution?

The USAA Cloud Program developed a centralized solution for collecting all AWS account metadata to facilitate core enterprise functions, such as financial management, remediation of vulnerable and insecure configurations, and change release processes for critical application and infrastructure changes.

Companies without centralized metadata solutions may have distributed documents and wikis that contain account metadata, which has to be updated manually. Manually inputting/updating information generally leads to outdated or incorrect metadata and, in addition, requires individuals to reach out to multiple resources and teams to collect specific information.

Solution overview

USAA utilizes AWS Organizations and a series of GitLab projects to create, manage, and baseline all AWS accounts and infrastructure within the organization, including identity and access management, security, and networking components. Within their GitLab projects, each deployment uses a GitLab baseline version that determines what version of the project was provisioned within the AWS account.

During the creation and onboarding of new AWS accounts, which are created for each application team and use-case, there is specific data that is used for tracking and governance purposes, and applied across the enterprise. USAA’s Public Cloud Security team took an opportunity within a hackathon event to develop the solution depicted in Figure 1.

  1. AWS account is created conforming to a naming convention and added to AWS Organizations.

Metadata tracked per AWS account includes:

    • AWS account name
    • Points of contact
    • Line of business (LOB)
    • Cost center #
    • Application ID #
    • Status
    • Cloud governance record #
    • GitLab baseline version
  1. Amazon EventBridge rule invokes AWS Step Functions when new AWS accounts are created.
  2. Step Functions invoke an AWS Lambda function to pull AWS account metadata and load into a centralized Amazon DynamoDB table with Streams enabled to support automation.
  3. A private Amazon API Gateway is exposed to USAA’s internal network, which queries the DynamoDB table and provides AWS account metadata.
Overview of USAA architecture automation workflow to manage AWS account metadata

Figure 1. Overview of USAA architecture automation workflow to manage AWS account metadata

After the solution was deployed, USAA teams leveraged the data in multiple ways:

  1. User interface: a front-end user-interface querying the API Gateway to allow internal users on the USAA network to filter and view metadata for any AWS accounts within AWS Organizations.
  2. Event-driven automation: DynamoDB streams for any changes in the table that would invoke a Lambda function, which would check the most recent version from GitLab and the GitLab baseline version in the AWS account. For any outdated deployments, the Lambda function invokes the CI/CD pipeline for that AWS account to deploy a standardized set of IAM, infrastructure, and security resources and configurations.
  3. Incident response: the Cyber Threat Response team reduces mean-time-to-respond by developing automation to query the API Gateway to append points-of-contact, environment, and AWS account name for custom detections as well as Security Hub and Amazon GuardDuty findings.
  4. Financial management: Internal teams have integrated workflows to their applications to query the API Gateway to return cost center, LOB, and application ID to assist with financial reporting and tracking purposes. This replaces manually reviewing the AWS account metadata from an internal and manually updated wiki page.
  5. Compliance and vulnerability management: automated notification systems were developed to send consolidated reports to points-of-contact listed in the AWS account from the API Gateway to remediate non-compliant resources and configurations.

Conclusion

In this post, we reviewed how USAA enabled core enterprise functions and teams to collect, store, and distribute AWS account metadata by developing a secure and highly scalable serverless application natively in AWS. The solution has been leveraged for multiple use-cases, including internal application teams in USAA’s production AWS environment.

How ERGO built an on-call support solution in a week

Post Syndicated from Sid Singh original https://aws.amazon.com/blogs/architecture/how-ergo-built-an-on-call-support-solution-in-a-week/

ERGO’s Technology & Services S.A. (ET&S) Cloud Solutions Department is a specialist team of cloud engineers who provide technical support for business owners, project managers, and engineering leads. The support team deals with complex issues, such as failed deployments, security vulnerabilities, environment availability, etc.

When an issue arises, it’s categorized as Priority 1 (P1) or Priority 2 (P2). For urgent P1 incidents, users contact the support team directly via phone. For P2 incidents, the workflow sends an issue description to the support team via SMS.

Originally, the SMS and voice forwarding systems were manually updated every Monday. For SMS, an operator manually updated the phone numbers in the system for the assigned support team members. For voice forwarding, support team members used physical phones, which were handed off from engineer to engineer per the support team roster.

These manual processes were time consuming and occasionally error prone. Additionally, with COVID-19 physical distancing measures in place, handing off physical devices was complicated. To keep up with the increasing number of support cases and the growth of their Cloud Solutions Department, ERGO worked with AWS to modernize and automate their manual workflow. We’ll show you how ERGO implemented a production-ready, on-call support solution with SMS and voice features in just one week using Amazon Connect and Amazon Pinpoint.

Automating the SMS on-call system

Let’s look at how we automated the SMS on-call support system, as shown in Figure 1 and summarized as follows:

  1. We use an open-source orchestration tool, Red Hat Ansible Automation Platform (Ansible), as a frontend to run the template “Assign to On-call SMS”.
  2. The template sets the parameter to a subset of support team members who are assigned to support P1/P2 cases. The assignment is based on the on-call shift schedule.
  3. Next, support team members are subscribed to the Amazon Simple Notification Service (Amazon SNS) topic subscriber’s list using an Ansible playbook.

Now the support team will receive SMS alerts.

Assign to on-call SMS workflow

Figure 1. Assign to on-call SMS workflow

Next, we integrated the SMS workflow with our ZIS IT monitoring tool to capture critical events and forward them via SMS to the support team, as shown in Figure 2:

  1. The Amazon Pinpoint phone number is set as the SMS destination in our monitoring tool.
  2. The monitoring tool then sends the SMS to Amazon Pinpoint, where:
    • We extract the messageBody from the payload that Amazon Pinpoint prepared by sending the message to Amazon SNS “Before Processing Message”, which is subscribed by our AWS Lambda function “Extract messageBody”.
    • The extracted message is then sent to Amazon SNS as “After Processing Message”, which uses the Amazon Pinpoint “Two-way SMS” feature to send the SMS to support team members who are assigned to the Amazon SNS topic.
On-call SMS workflow integration with Amazon Pinpoint

Figure 2. On-call SMS workflow integration with Amazon Pinpoint

Also shown in Figure 2, we track our monthly SMS spending using Amazon CloudWatch. The SMSMonthToDateSpentUSD metric shows the amount spent sending SMS messages during the current month.

Why extract the messageBody before sending the SMS to the support team?

Amazon Pinpoint captures SMS from the monitoring tool in JSON format, which includes additional information, such as the origin and destination numbers, the message ID and related data, as shown in the following example:

{

"originationNumber":"+14255550182",

"destinationNumber":"+12125550101",

"messageKeyword":"JOIN",

"messageBody":"EXAMPLE",

"inboundMessageId":"cae173d2-66b9-564c-8309-21f858e9fb84",

"previousPublishedMessageId":"wJalrXUtnFEMI/K7MDENG/bPxRfiCYEXAMPLEKEY"

}

The support team only needs the messageBody, and the JSON format makes it difficult to read on a mobile phone. Therefore, we use a Lambda function for the “messageBody” extraction.

Automating the voice forwarding system

The other half of our on-call solution is voice forwarding. As mentioned in the introduction, we had a physical phone and updated the call forwarding every Monday. This allowed us to forward calls to a single number, but this system had two main problems: it wasn’t scalable and it was prone to human errors.

In our automated system, shown in Figure 3, all calls to the physical phone are forwarded to Amazon Connect, so we do not need to change the number of the phone.

This is how it’s set up:

  • The assigned phone numbers in Amazon Connect are attached to the Contact Flow “ERGO On-call Forwarding Voice”, which starts at the “Entry point” rectangle on the left side of the diagram.
  • In the next step, “Set logging behavior” captures the calling number. This allows us to see the number to return any missed calls.
  • Finally, the set working queue contains routing profiles (in this case, we use a main line and secondary line). The main line has support team members who are assigned to address P1 cases. The secondary line is for managers who will take the call if the support team members are not available.

When a customer is in a queue, the Amazon Connect contact flow tries to route the call to a support team member. If there’s no answer, the service re-routes the call to the next available support team member. After 30 seconds, if there is no answer on the first line (and no other support team members have become available), the service tries the secondary line.

To set this up:

  • Every support team member requires an Amazon Connect account. You can import their data via CSV to automate provisioning.
  • If a support team member is shown as online but does not answer a call, Amazon Connect changes their status to offline. This way, an Amazon Connect admin can see the time and number of the missed call in the Amazon Connect Real-time metrics reports and can return the call when another team member or supervisor is available.
  • Figure 3 shows how Amazon Connect and CloudWatch monitor contact center health metrics like “MissedCalls” and generate alerts via Amazon Simple Notification Service (SNS) to send notifications via email to ensure calls are returned promptly. For more details on this integration pattern, refer to the Monitor and trigger alerts using Amazon CloudWatch for Amazon Connect blog post.
On-call voice forwarding workflow with Amazon Connect

Figure 3. On-call voice forwarding workflow with Amazon Connect

Lessons learned

After creating an Amazon Connect instance, we claimed a phone number to place or receive calls. Requesting phone numbers from Amazon Connect to serve different customers in different countries was the most time intensive part of the setup. Be aware that some countries have regulatory requirements, and this can increase the time and effort required. For example, requesting a German number and a Polish number will require different documents. To save time, we used international toll-free numbers. This allows us to provide support to people in all other countries without the caller incurring additional charges.

To help you with your implementation, you can find the list of ID requirements by country or AWS Region here and AWS support can provide more information.

Conclusion

Using managed services like Amazon Connect and Amazon Pinpoint allowed us to implement a scalable and pay-as-you-go on-call solution for technical support. The new automated setup is a huge improvement over the previous manual and error-prone workflow and enables us to easily onboard customers from new countries.

Looking ahead, we plan to explore using the Amazon Connect APIs to automate the management of an agent’s online/offline status, as well as building a skills-based routing workflow to accommodate a multi-lingual support team. You can read more about AWS Customer Engagement services here.

How Munich Re Automation Solutions Ltd built a digital insurance platform on AWS

Post Syndicated from Sid Singh original https://aws.amazon.com/blogs/architecture/how-munich-re-automation-solutions-ltd-built-a-digital-insurance-platform-on-aws/

Underwriting for life insurance can be quite manual and often time-intensive with lots of re-keying by advisers before underwriting decisions can be made and policies finally issued. In the digital age, people purchasing life insurance want self-service interactions with their prospective insurer. People want speed of transaction with time to cover reduced from days to minutes. While this has been achieved in the general insurance space with online car and home insurance journeys, this is not always the case in the life insurance space. This is where Munich Re Automation Solutions Ltd (MRAS) offers its customers, a competitive edge to shrink the quote-to-fulfilment process using their ALLFINANZ solution.

ALLFINANZ is a cloud-based life insurance and analytics solution to underwrite new life insurance business. It is designed to transform the end consumer’s journey, delivering everything they need to become a policyholder. The core digital services offered to all ALLFINANZ customers include Rulebook Hub, Risk Assessment Interview delivery, Decision Engine, deep analytics (including predictive modeling capabilities), and technical integration services—for example, API integration and SSO integration.

Current state architecture

The ALLFINANZ application began as a traditional three-tier architecture deployed within a datacenter. As MRAS migrated their workload to the AWS cloud, they looked at their regulatory requirements and the technology stack, and decided on the silo model of the multi-tenant SaaS system. Each tenant is provided a dedicated Amazon Virtual Private Cloud (VPC) that holds network and application components, fully isolated from other primary insurers.

As an entry point into the ALLFINANZ environment, MRAS uses Amazon Route 53 to route incoming traffic to the appropriate Amazon VPC. The routing relies on a model where subdomains are assigned to each tenant, for example the subdomain allfinanz.tenant1.munichre.cloud is the subdomain for tenant 1. The diagram below shows the ALLFINANZ architecture. Note: not all links between components are shown here for simplicity.

Current high-level solution architecture for the ALLFINANZ solution

Figure 1. Current high-level solution architecture for the ALLFINANZ solution

  1. The solution uses Route 53 as the DNS service, which provides two entry points to the SaaS solution for MRAS customers:
    • The URL allfinanz.<tenant-id>.munichre.cloud allows user access to the ALLFINANZ Interview Screen (AIS). The AIS can exist as a standalone application, or can be integrated with a customer’s wider digital point-of -sale process.
    • The URL api.allfinanz.<tenant-id>.munichre.cloud is used for accessing the application’s Web services and REST APIs.
  2. Traffic from both entry points flows through the load balancers. While HTTP/S traffic from the application user access entry point flows through an Application Load Balancer (ALB), TCP traffic from the REST API clients flows through a Network Load Balancer (NLB). Transport Layer Security (TLS) termination for user traffic happens at the ALB using certificates provided by the AWS Certificate Manager.  Secure communication over the public network is enforced through TLS validation of the server’s identity.
  3. Unlike application user access traffic, REST API clients use mutual TLS authentication to authenticate a customer’s server. Since NLB doesn’t support mutual TLS, MRAS opted for a solution to pass this traffic to a backend NGINX server for the TLS termination. Mutual TLS is enforced by using self-signed client and server certificates issued by a certificate authority that both the client and the server trust.
  4. Authenticated traffic from ALB and NGINX servers is routed to EC2 instances hosting the application logic. These EC2 instances are hosted in an auto-scaling group spanning two Availability Zones (AZs) to provide high availability and elasticity, therefore, allowing the application to scale to meet fluctuating demand.
  5. Application transactions are persisted in the backend Amazon Relational Database Service MySQL instances. This database layer is configured across multi-AZs, providing high availability and automatic failover.
  6. The application requires the capability to integrate evidence from data sources external to the ALLFINANZ service. This message sharing is enabled through the Amazon MQ managed message broker service for Apache Active MQ.
  7. Amazon CloudWatch is used for end-to-end platform monitoring through logs collection and application and infrastructure metrics and alerts to support ongoing visibility of the health of the application.
  8. Software deployment and associated infrastructure provisioning is automated through infrastructure as code using a combination of Git, Amazon CodeCommit, Ansible, and Terraform.
  9. Amazon GuardDuty continuously monitors the application for malicious activity and delivers detailed security findings for visibility and remediation. GuardDuty also allows MRAS to provide evidence of the application’s strong security posture to meet audit and regulatory requirements.

High availability, resiliency, and security

MRAS deploys their solution across multiple AWS AZs to meet high-availability requirements and ensure operational resiliency. If one AZ has an ongoing event, the solution will remain operational, as there are instances receiving production traffic in another AZ. As described above, this is achieved using ALBs and NLBs to distribute requests to the application subnets across AZs.

The ALLFINANZ solution uses private subnets to segregate core application components and the database storage platform. Security groups provide networking security measures at the elastic network interface level. MRAS restrict access from incoming connection requests to ranges of IP addresses by attaching security groups to the ALBs. Amazon Inspector monitors workloads for software vulnerabilities and unintended network exposure. AWS WAF is integrated with the ALB to protect from SQL injection or cross-site scripting attacks on the application.

Optimizing the existing workload

One of the key benefits of this architecture is that now MRAS can standardize the infrastructure configuration and ensure consistent versioning of the workload across tenants. This makes onboarding new tenants as simple as provisioning another VPC with the same infrastructure footprint.

MRAS are continuing to optimize their architecture iteratively, examining components to modernize to cloud-native components and evolving towards the pool model of multi-tenant SaaS architecture wherever possible. For example, MRAS centralized their per-tenant NAT gateway deployment to a centralized outbound Internet routing design using AWS Transit Gateway, saving approximately 30% on their overall NAT gateway spend.

Conclusion

The AWS global infrastructure has allowed MRAS to serve more than 40 customers in five AWS regions around the world. This solution improves customers’ experience and workload maintainability by standardizing and automating the infrastructure and workload configuration within a SaaS model, compared with multiple versions for the on-premise deployments. SaaS customers are also freed up from the undifferentiated heavy lifting of infrastructure operations, allowing them to focus on their business of underwriting for life insurance.

MRAS used the AWS Well-Architected Framework to assess their architecture and list key recommendations. AWS also offers Well-Architected SaaS Lens and AWS SaaS Factory Program, with a collection of resources to empower and enable insurers at any stage of their SaaS on AWS journey.

Let’s Architect! Designing Well-Architected systems

Post Syndicated from Luca Mezzalira original https://aws.amazon.com/blogs/architecture/lets-architect-designing-well-architected-systems/

Amazon’s CTO Werner Vogels says, “Everything fails, all the time”. This means we should design with failure in mind and assume that something unpredictable could happen.

The AWS Well-Architected Framework is designed to help you prepare your workload for failure. It describes key concepts, design principles, and architectural best practices for designing and running workloads in the cloud. Using this tool regularly will help you gain awareness of the status of your workloads and is in place to improve any workload deployed inside your AWS accounts.

In this edition of Let’s Architect!, we’ve collected solutions and articles that will help you understand the value behind the Well-Architected Framework and how to implement it in your software development lifecycle.

AWS Well-Architected Framework

AWS Well-Architected (AWS WA) helps cloud architects build secure, high-performing, resilient, and efficient infrastructure for a variety of applications and workloads. Built around six pillars—operational excellence, security, reliability, performance efficiency, cost optimization, and sustainability—AWS WA provides a consistent approach for customers and partners to evaluate architectures and implement scalable designs.

The AWS WA Framework includes domain-specific lenses, hands-on labs, and the AWS Well-Architected Tool. The AWS Well-Architected Tool (AWS WA Tool), available at no cost in the AWS Management Console, provides a mechanism for regularly evaluating workloads, identifying high-risk issues, and recording improvements.

The 6 pillars that composes the AWS Well-Architected framework

The 6 pillars that composes the AWS Well-Architected framework

Use templated answers to perform Well-Architected reviews at scale

For larger customers, performing AWS WA reviews often involves a combination of different teams. Coordinating participants from each team in order to perform a review increases the time taken and is expensive. In a large organization, there are often hundreds of AWS accounts where teams can store review documents, which means there is no way to quickly identify risks or spot common issues or trends that could influence improvements.

To address this, this blog post offers a solution to help you perform reviews easier and faster. It allows workload owners to automatically populate their reviews with templated answers to questions in the AWS WA Tool. These answers may be a shared responsibility between an application team and a centralized team such as platform, security, or finance. This way, application teams have fewer questions to answer and centralized team members have fewer reviews to attend, because answers that are common to all workloads are pre-populated in workload reviews. The solution also provides centralized reporting to provide a centralized view of AWS WA reviews conducted across the organization.

The components of the solution and the steps in the workflow

The components of the solution and the steps in the workflow

Machine Learning Lens

Machine learning (ML) is used to solve specific business problems and influence revenue. However, moving from experimentation (where scientists design ML models and explore applications) to a production scenario (where ML is used to generate value for the business) can present some challenges. For example, how do you create repeatable experiments? How do you increase automation in the deployment process? How do you deploy my model and monitor the performance?

This blog post and its companion whitepaper provide best practices based on AWS WA for each phase of putting ML into production, including formulating the problem and approaches for monitoring a model’s performance.

ML lifecycle phases with expanded components

ML lifecycle phases with expanded components

Establishing Feedback Loops Based on the AWS Well-Architected Framework Review

When you perform an AWS WA review using the AWS WA Tool, you’ll answer a set of questions. The tool then provides gives recommendations to improve your workloads.

To apply these recommendations effectively, you must 1) define how you’ll apply them, 2) create systems to define what is monitored and which kind of metrics or logs are required, 3) establish automatic or manual process and for reporting, and 4) improve them through iteration. This process is called a feedback loop.

This blog post shows you how to iteratively improve your overall architecture with feedback loops based on the results of the AWS WA review.

Feedback loop based on the AWS WA review

Feedback loop based on the AWS WA review

See you next time!

Thanks for reading! See you in a couple of weeks when we discuss strategies for running serverless applications on AWS.

Other posts in this series

Looking for more architecture content?

AWS Architecture Center provides reference architecture diagrams, vetted architecture solutions, Well-Architected best practices, patterns, icons, and more!