Post Syndicated from Puneet Babbar original https://aws.amazon.com/blogs/big-data/build-test-and-deploy-etl-solutions-using-aws-glue-and-aws-cdk-based-ci-cd-pipelines/
AWS Glue is a serverless data integration service that makes it easy to discover, prepare, and combine data for analytics, machine learning (ML), and application development. It’s serverless, so there’s no infrastructure to set up or manage.
This post provides a step-by-step guide to build a continuous integration and continuous delivery (CI/CD) pipeline using AWS CodeCommit, AWS CodeBuild, and AWS CodePipeline to define, test, provision, and manage changes of AWS Glue based data pipelines using the AWS Cloud Development Kit (AWS CDK).
The AWS CDK is an open-source software development framework for defining cloud infrastructure as code using familiar programming languages and provisioning it through AWS CloudFormation. It provides you with high-level components called constructs that preconfigure cloud resources with proven defaults, cutting down boilerplate code and allowing for faster development in a safe, repeatable manner.
Solution overview
The solution constructs a CI/CD pipeline with multiple stages. The CI/CD pipeline constructs a data pipeline using COVID-19 Harmonized Data managed by Talend / Stitch. The data pipeline crawls the datasets provided by neherlab from the public Amazon Simple Storage Service (Amazon S3) bucket, exposes the public datasets in the AWS Glue Data Catalog so they’re available for SQL queries using Amazon Athena, performs ETL (extract, transform, and load) transformations to denormalize the datasets to a table, and makes the denormalized table available in the Data Catalog.
The solution is designed as follows:
- A data engineer deploys the initial solution. The solution creates two stacks:
- cdk-covid19-glue-stack-pipeline – This stack creates the CI/CD infrastructure as shown in the architectural diagram (labeled Tool Chain).
- cdk-covid19-glue-stack – The
cdk-covid19-glue-stack-pipeline stack deploys the cdk-covid19-glue-stack stack to create the AWS Glue based data pipeline as shown in the diagram (labeled ETL).
- The data engineer makes changes on
cdk-covid19-glue-stack (when a change in the ETL application is required).
- The data engineer pushes the change to a CodeCommit repository (generated in the
cdk-covid19-glue-stack-pipeline stack).
- The pipeline is automatically triggered by the push, and deploys and updates all the resources in the
cdk-covid19-glue-stack stack.
At the time of publishing of this post, the AWS CDK has two versions of the AWS Glue module: @aws-cdk/aws-glue and @aws-cdk/aws-glue-alpha, containing L1 constructs and L2 constructs, respectively. At this time, the @aws-cdk/aws-glue-alpha module is still in an experimental stage. We use the stable @aws-cdk/aws-glue module for the purpose of this post.
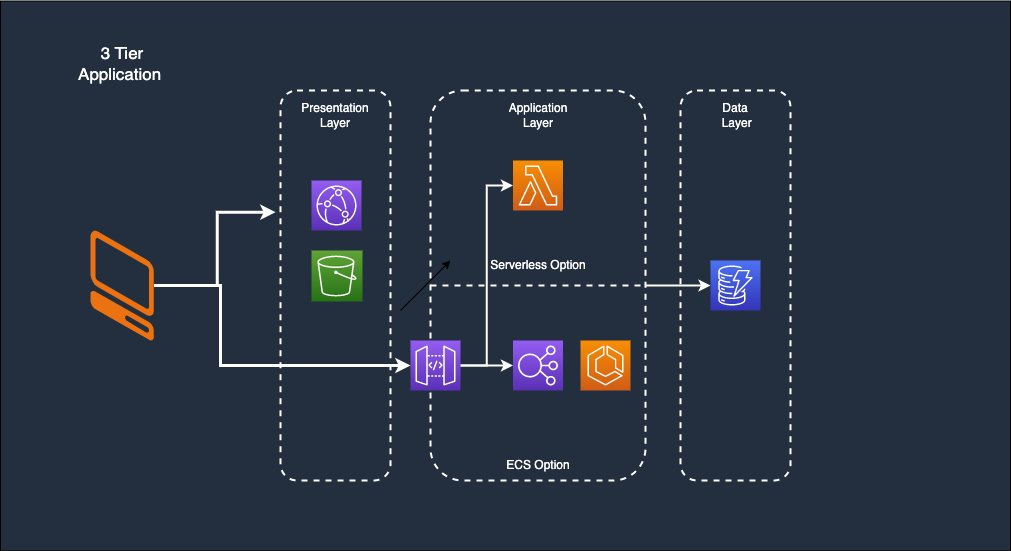
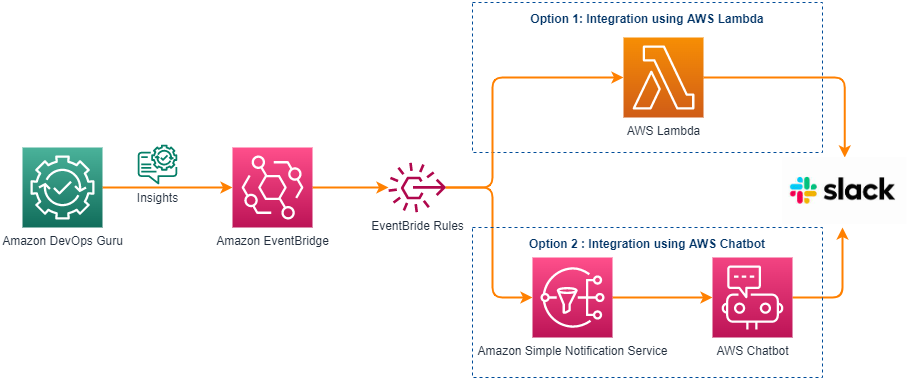
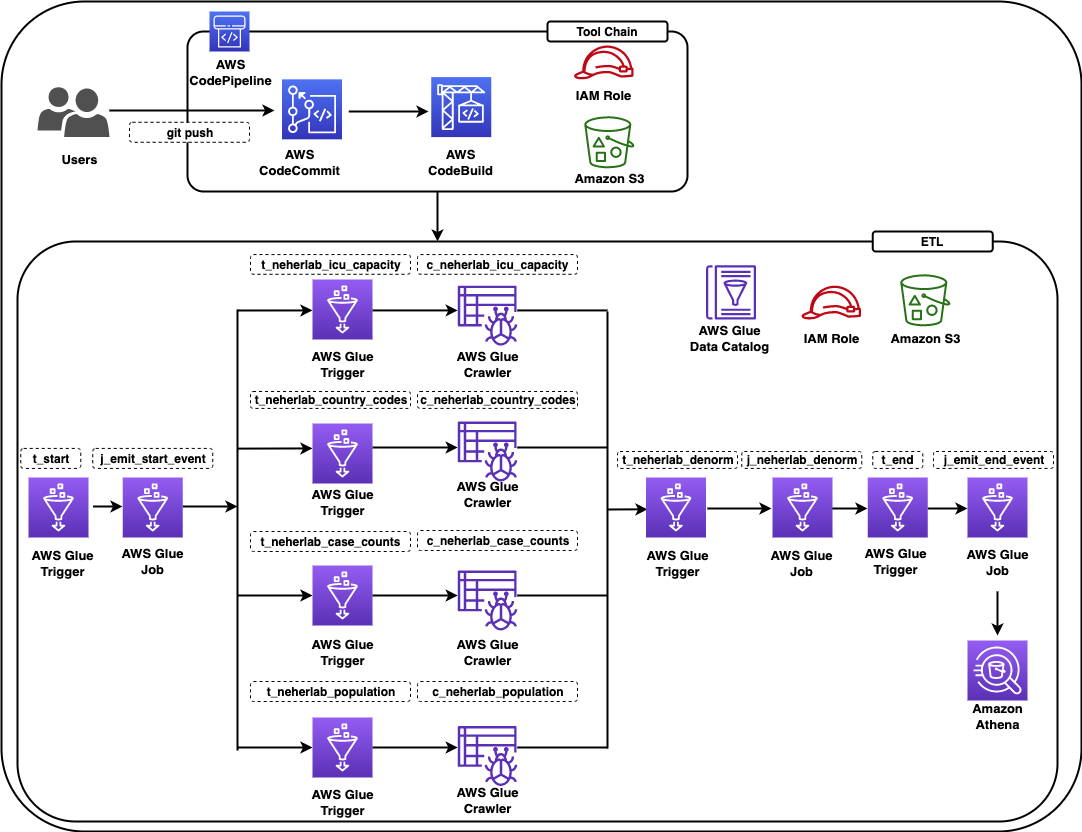
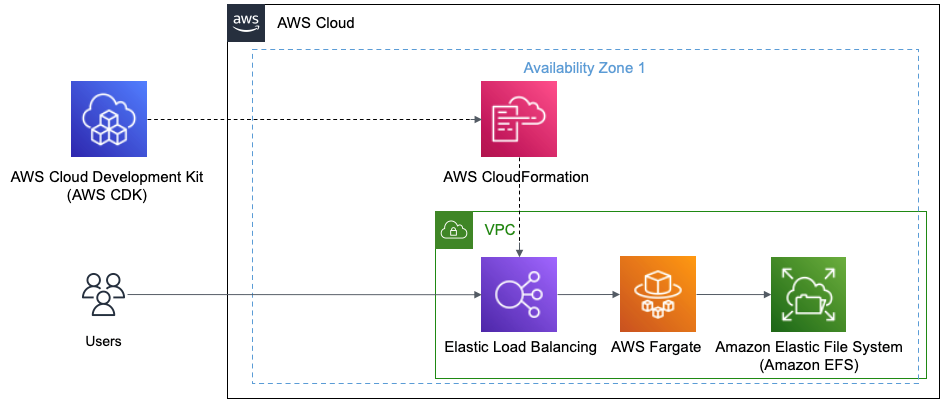
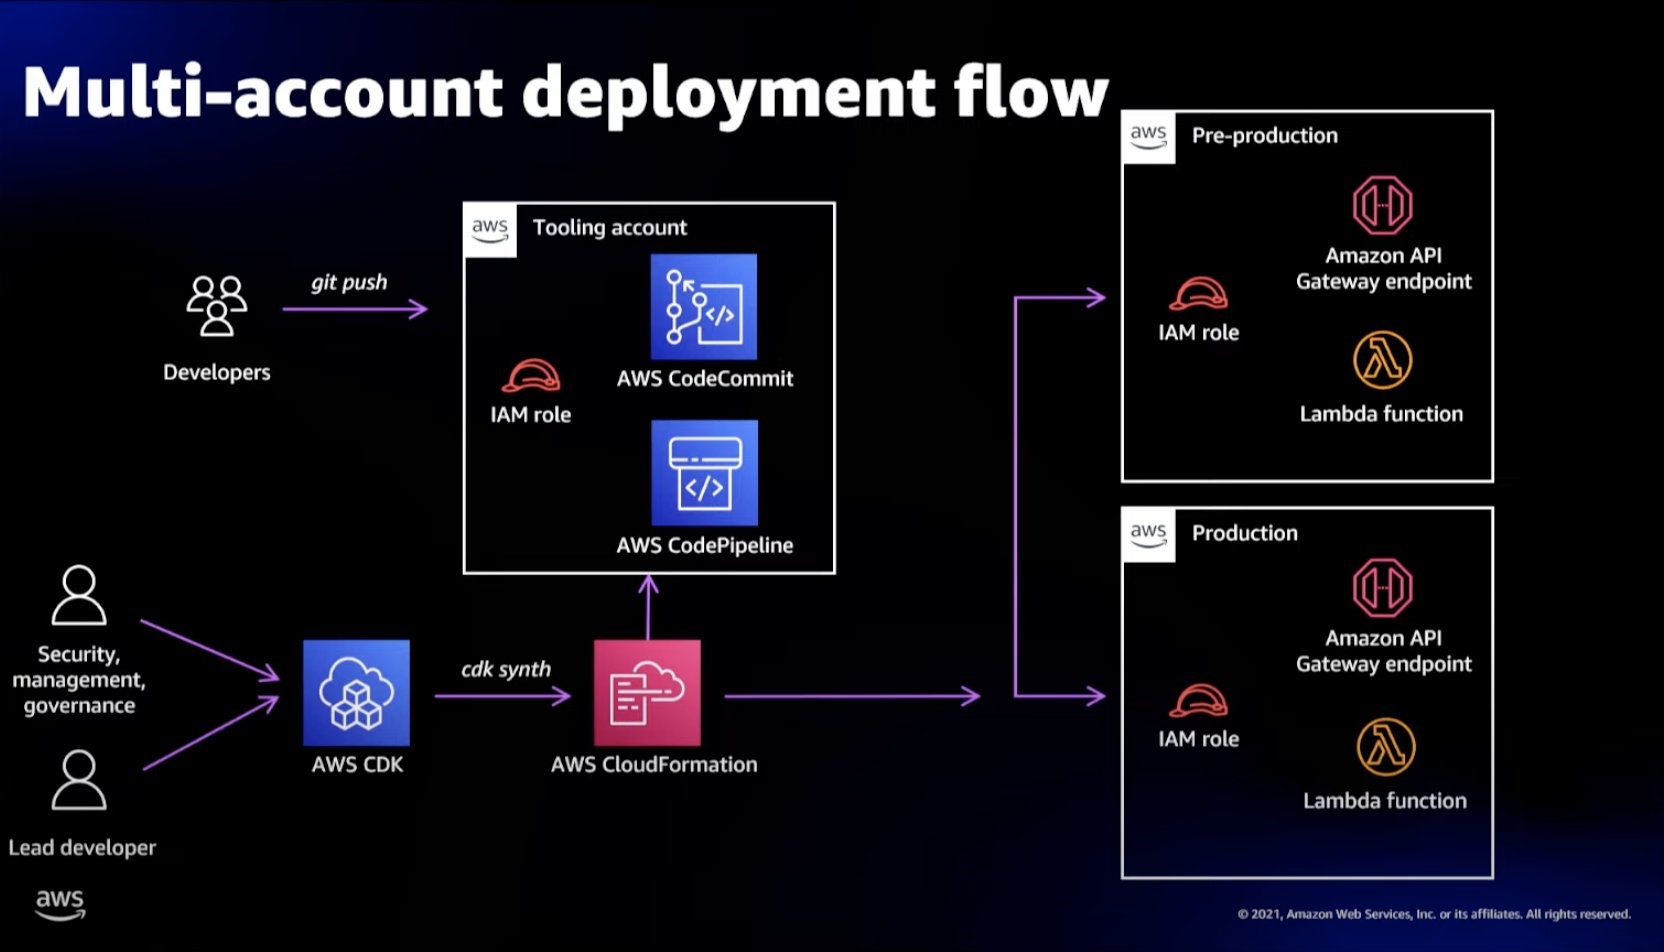
The following diagram shows all the components in the solution.

Figure 1 – Architecture diagram
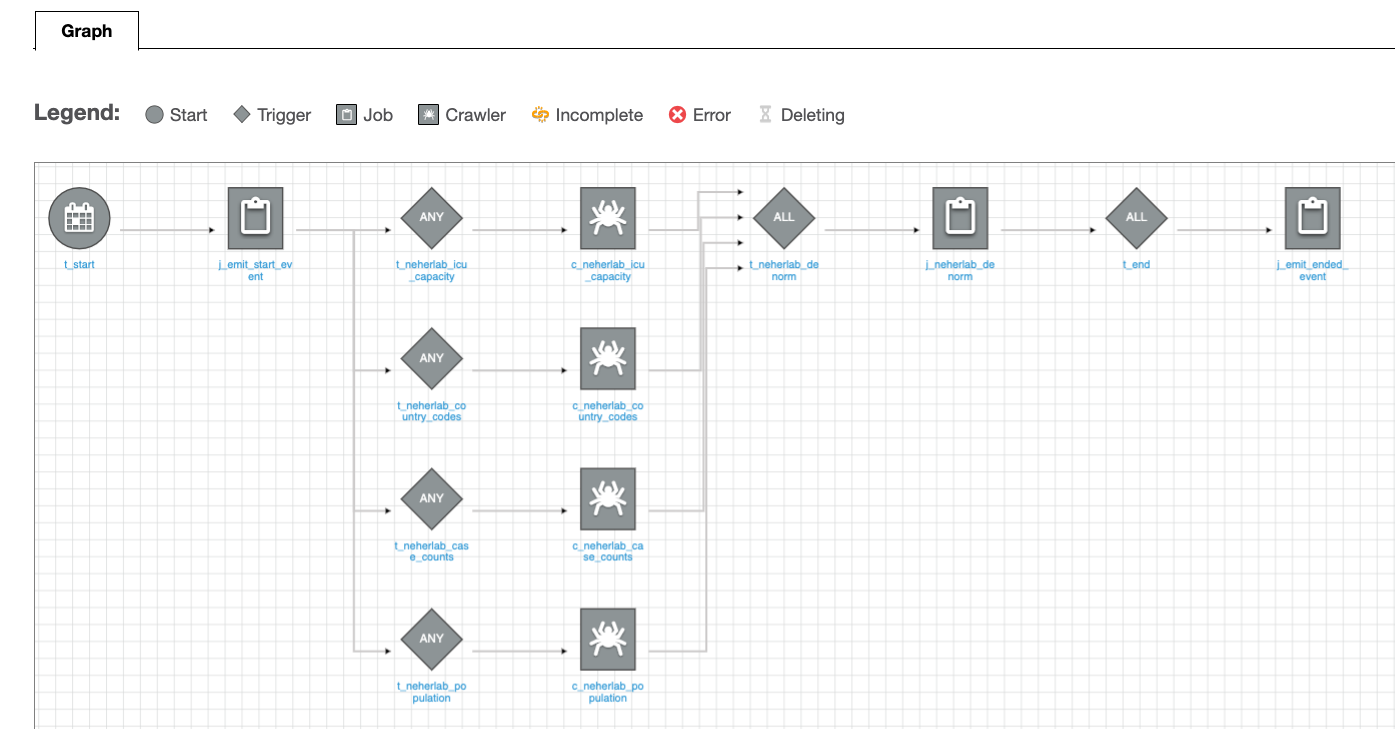
The data pipeline consists of an AWS Glue workflow, triggers, jobs, and crawlers. The AWS Glue job uses an AWS Identity and Access Management (IAM) role with appropriate permissions to read and write data to an S3 bucket. AWS Glue crawlers crawl the data available in the S3 bucket, update the AWS Glue Data Catalog with the metadata, and create tables. You can run SQL queries on these tables using Athena. For ease of identification, we followed the naming convention for triggers to start with t_*, crawlers with c_*, and jobs with j_*. A CI/CD pipeline based on CodeCommit, CodeBuild, and CodePipeline builds, tests and deploys the solution. The complete infrastructure is created using the AWS CDK.
The following table lists the tables created by this solution that you can query using Athena.
| Table Name |
Description |
Dataset Location |
Access |
Location |
neherlab_case_counts |
Total number of cases |
s3://covid19-harmonized-dataset/covid19tos3/neherlab_case_counts/ |
Read |
Public |
neherlab_country_codes |
Country code |
s3://covid19-harmonized-dataset/covid19tos3/neherlab_country_codes/ |
Read |
Public |
neherlab_icu_capacity |
Intensive Care Unit (ICU) capacity |
s3://covid19-harmonized-dataset/covid19tos3/neherlab_icu_capacity/ |
Read |
Public |
neherlab_population |
Population |
s3://covid19-harmonized-dataset/covid19tos3/neherlab_population/ |
Read |
Public |
neherla_denormalized |
Denormalized table that combines all the preceding tables into one table |
s3://<your-S3-bucket-name>/neherlab_denormalized |
Read/Write |
Reader’s AWS account |
Anatomy of the AWS CDK application
In this section, we visit key concepts and anatomy of the AWS CDK application, review the important sections of the code, and discuss how the AWS CDK reduces complexity of the solution as compared to AWS CloudFormation.
An AWS CDK app defines one or more stacks. Stacks (equivalent to CloudFormation stacks) contain constructs, each of which defines one or more concrete AWS resources. Each stack in the AWS CDK app is associated with an environment. An environment is the target AWS account ID and Region into which the stack is intended to be deployed.
In the AWS CDK, the top-most object is the AWS CDK app, which contains multiple stacks vs. the top-level stack in AWS CloudFormation. Given this difference, you can define all the stacks required for the application in the AWS CDK app. In AWS Glue based ETL projects, developers need to define multiple data pipelines by subject area or business logic. In AWS CloudFormation, we can achieve this by writing multiple CloudFormation stacks and often deploy them independently. In some cases, developers write nested stacks, which over time becomes very large and complicated to maintain. In the AWS CDK, all stacks are deployed from the AWS CDK app, increasing modularity of the code and allowing developers to identify all the data pipelines associated with an application easily.
Our AWS CDK application consists of four main files:
- app.py – This is the AWS CDK app and the entry point for the AWS CDK application
- pipeline.py – The
pipeline.py stack, invoked by app.py, creates the CI/CD pipeline
- etl/infrastructure.py – The
etl/infrastructure.py stack, invoked by pipeline.py, creates the AWS Glue based data pipeline
- default-config.yaml – The configuration file contains the AWS account ID and Region.
The AWS CDK application reads the configuration from the default-config.yaml file, sets the environment information (AWS account ID and Region), and invokes the PipelineCDKStack class in pipeline.py. Let’s break down the preceding line and discuss the benefits of this design.
For every application, we want to deploy in pre-production environments and a production environment. The application in all the environments will have different configurations, such as the size of the deployed resources. In the AWS CDK, every stack has a property called env, which defines the stack’s target environment. This property receives the AWS account ID and Region for the given stack.
Lines 26–34 in app.py show the aforementioned details:
# Initiating the CodePipeline stack
PipelineCDKStack(
app,
"PipelineCDKStack",
config=config,
env=env,
stack_name=config["codepipeline"]["pipelineStackName"]
)
The env=env line sets the target AWS account ID and Region for PipelieCDKStack. This design allows an AWS CDK app to be deployed in multiple environments at once and increases the parity of the application in all environment. For our example, if we want to deploy PipelineCDKStack in multiple environments, such as development, test, and production, we simply call the PipelineCDKStack stack after populating the env variable appropriately with the target AWS account ID and Region. This was more difficult in AWS CloudFormation, where developers usually needed to deploy the stack for each environment individually. The AWS CDK also provides features to pass the stage at the command line. We look into this option and usage in the later section.
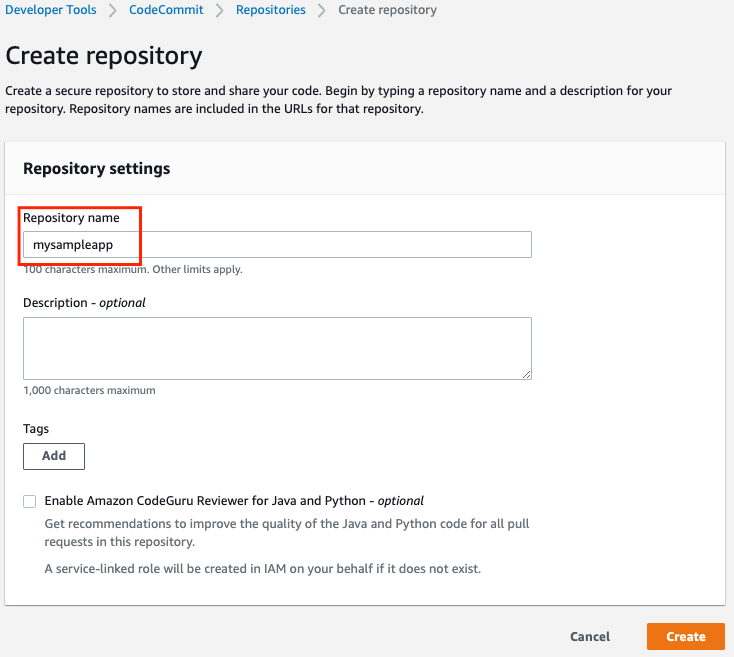
Coming back to the AWS CDK application, the PipelineCDKStack class in pipeline.py uses the aws_cdk.pipeline construct library to create continuous delivery of AWS CDK applications. The AWS CDK provides multiple opinionated construct libraries like aws_cdk.pipeline to reduce boilerplate code from an application. The pipeline.py file creates the CodeCommit repository, populates the repository with the sample code, and creates a pipeline with the necessary AWS CDK stages for CodePipeline to run the CdkGlueBlogStack class from the etl/infrastructure.py file.
Line 99 in pipeline.py invokes the CdkGlueBlogStack class.
The CdkGlueBlogStack class in etl/infrastructure.py creates the crawlers, jobs, database, triggers, and workflow to provision the AWS Glue based data pipeline.
Refer to line 539 for creating a crawler using the CfnCrawler construct, line 564 for creating jobs using the CfnJob construct, and line 168 for creating the workflow using the CfnWorkflow construct. We use the CfnTrigger construct to stitch together multiple triggers to create the workflow. The AWS CDK L1 constructs expose all the available AWS CloudFormation resources and entities using methods from popular programing languages. This allows developers to use popular programing languages to provision resources instead of working with JSON or YAML files in AWS CloudFormation.
Refer to etl/infrastructure.py for additional details.
Walkthrough of the CI/CD pipeline
In this section, we walk through the various stages of the CI/CD pipeline. Refer to CDK Pipelines: Continuous delivery for AWS CDK applications for additional information.
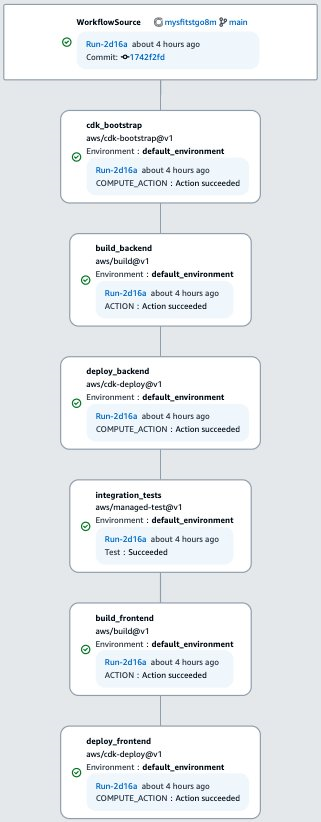
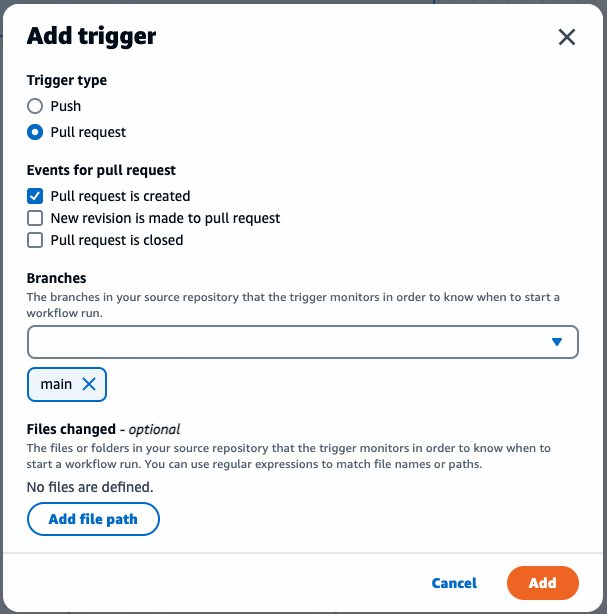
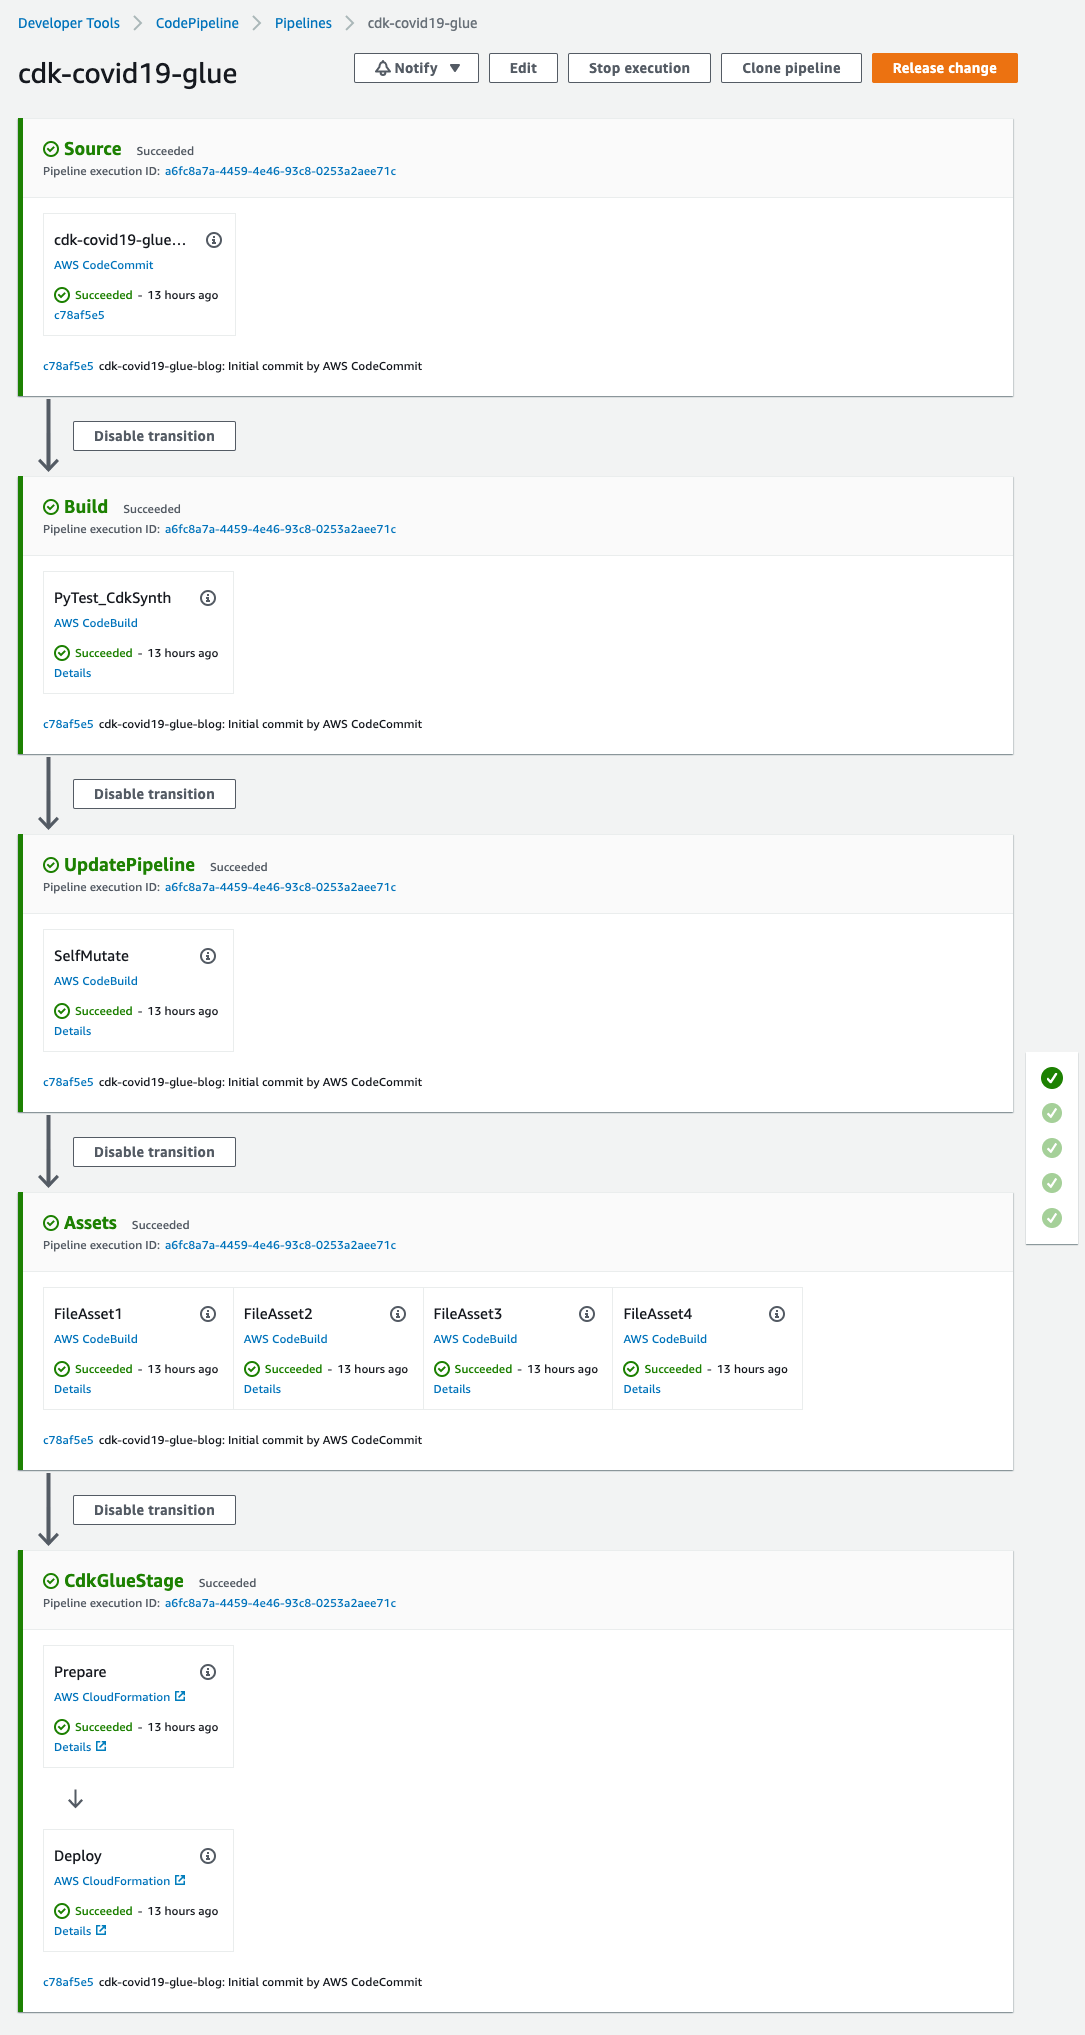
- Source – This stage fetches the source of the AWS CDK app from the CodeCommit repo and triggers the pipeline every time a new commit is made.
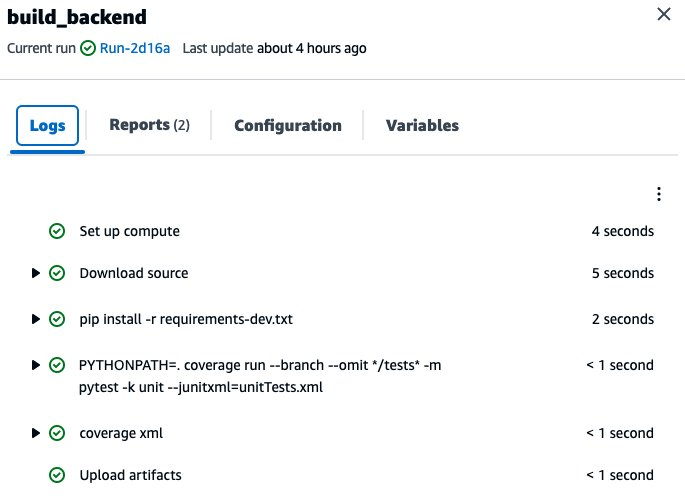
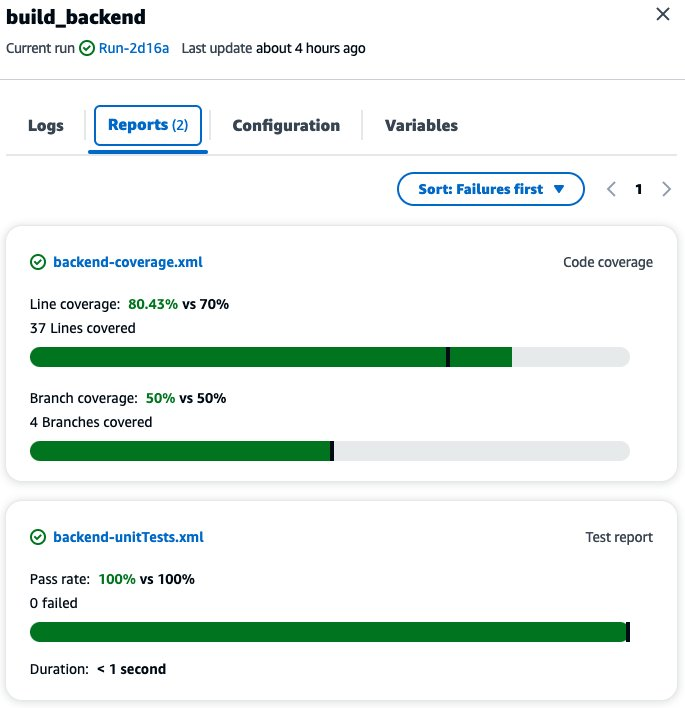
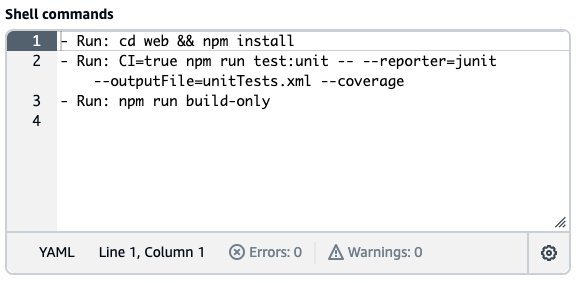
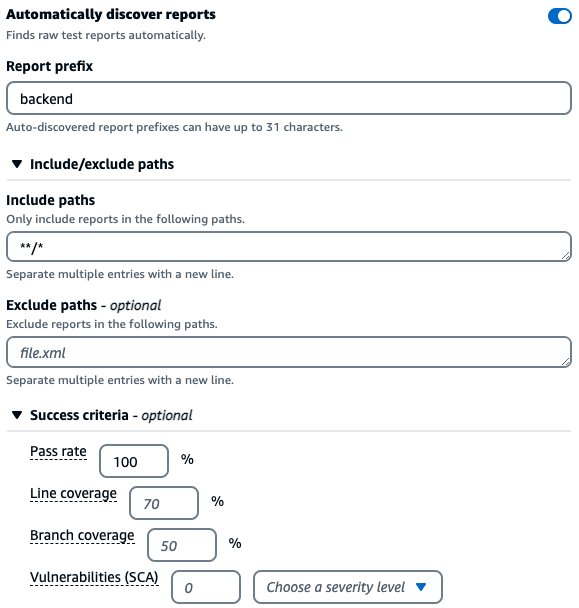
- Build – This stage compiles the code (if necessary), runs the tests, and performs a
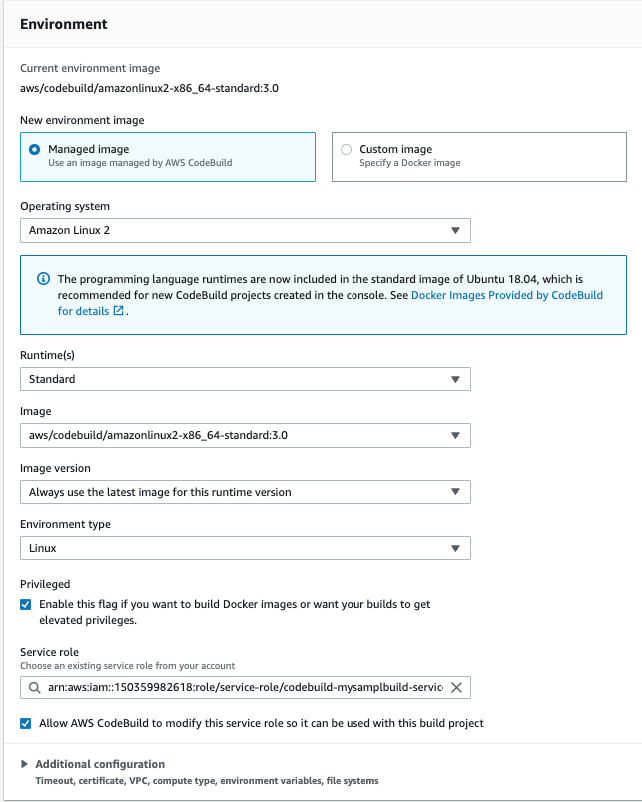
cdk synth. The output of the step is a cloud assembly, which is used to perform all the actions in the rest of the pipeline. The pytest is run using the amazon/aws-glue-libs:glue_libs_3.0.0_image_01 Docker image. This image comes with all the required libraries to run tests for AWS Glue version 3.0 jobs using a Docker container. Refer to Develop and test AWS Glue version 3.0 jobs locally using a Docker container for additional information.
- UpdatePipeline – This stage modifies the pipeline if necessary. For example, if the code is updated to add a new deployment stage to the pipeline or add a new asset to your application, the pipeline is automatically updated to reflect the changes.
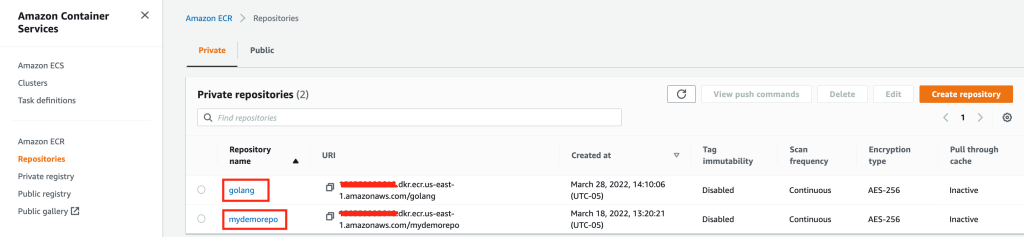
- Assets – This stage prepares and publishes all AWS CDK assets of the app to Amazon S3 and all Docker images to Amazon Elastic Container Registry (Amazon ECR). When the AWS CDK deploys an app that references assets (either directly by the app code or through a library), the AWS CDK CLI first prepares and publishes the assets to Amazon S3 using a CodeBuild job. This AWS Glue solution creates four assets.
- CDKGlueStage – This stage deploys the assets to the AWS account. In this case, the pipeline deploys the AWS CDK template
etl/infrastructure.py to create all the AWS Glue artifacts.
Code
The code can be found at AWS Samples on GitHub.
Prerequisites
This post assumes you have the following:
Deploy the solution
To deploy the solution, complete the following steps:
- Download the source code from the AWS Samples GitHub repository to the client machine:
- Create the virtual environment:
$ cd aws-glue-cdk-cicd
$ python3 -m venv .venv
This step creates a Python virtual environment specific to the project on the client machine. We use a virtual environment in order to isolate the Python environment for this project and not install software globally.
- Activate the virtual environment according to your OS:
- On MacOS and Linux, use the following code:
$ source .venv/bin/activate
-
- On a Windows platform, use the following code:
% .venv\Scripts\activate.bat
After this step, the subsequent steps run within the bounds of the virtual environment on the client machine and interact with the AWS account as needed.
- Install the required dependencies described in requirements.txt to the virtual environment:
$ pip install -r requirements.txt
- Bootstrap the AWS CDK app:
cdk bootstrap
This step populates a given environment (AWS account ID and Region) with resources required by the AWS CDK to perform deployments into the environment. Refer to Bootstrapping for additional information. At this step, you can see the CloudFormation stack CDKToolkit on the AWS CloudFormation console.
- Synthesize the CloudFormation template for the specified stacks:
$ cdk synth # optional if not default (-c stage=default)
You can verify the CloudFormation templates to identify the resources to be deployed in the next step.
- Deploy the AWS resources (CI/CD pipeline and AWS Glue based data pipeline):
$ cdk deploy # optional if not default (-c stage=default)
At this step, you can see CloudFormation stacks cdk-covid19-glue-stack-pipeline and cdk-covid19-glue-stack on the AWS CloudFormation console. The cdk-covid19-glue-stack-pipeline stack gets deployed first, which in turn deploys cdk-covid19-glue-stack to create the AWS Glue pipeline.
Verify the solution
When all the previous steps are complete, you can check for the created artifacts.
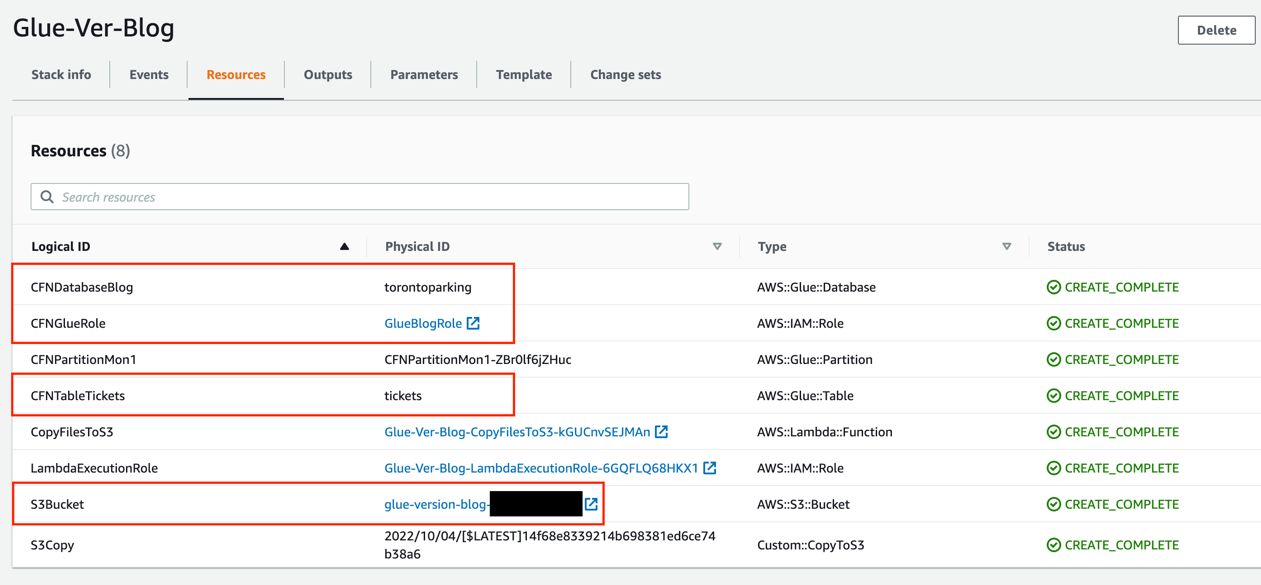
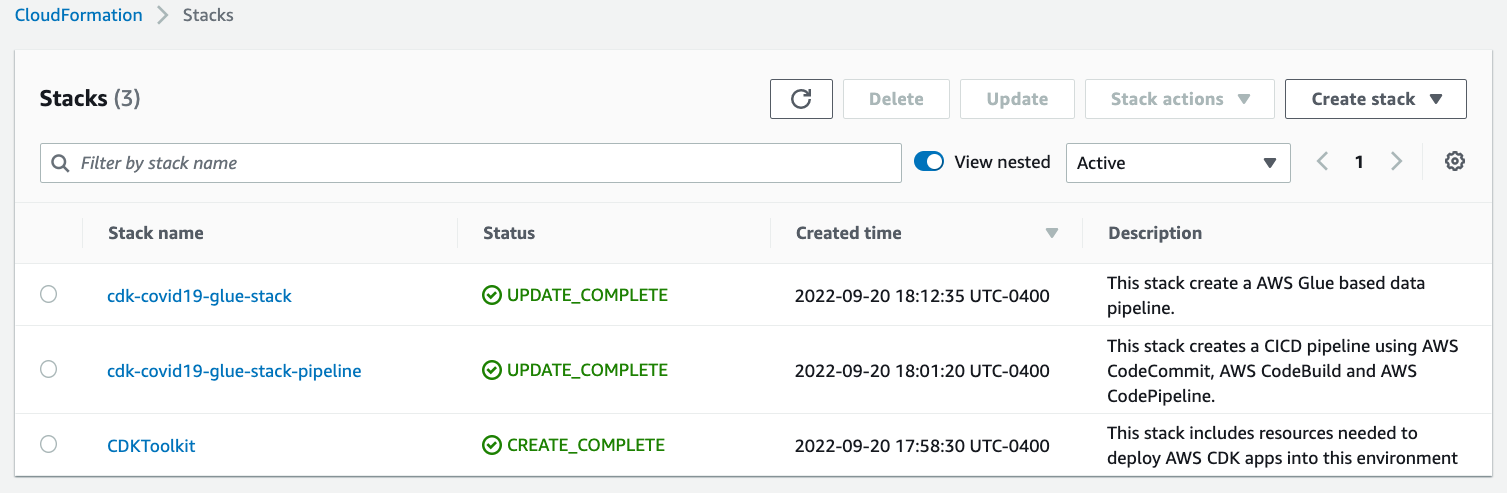
CloudFormation stacks
You can confirm the existence of the stacks on the AWS CloudFormation console. As shown in the following screenshot, the CloudFormation stacks have been created and deployed by cdk bootstrap and cdk deploy.

Figure 2 – AWS CloudFormation stacks
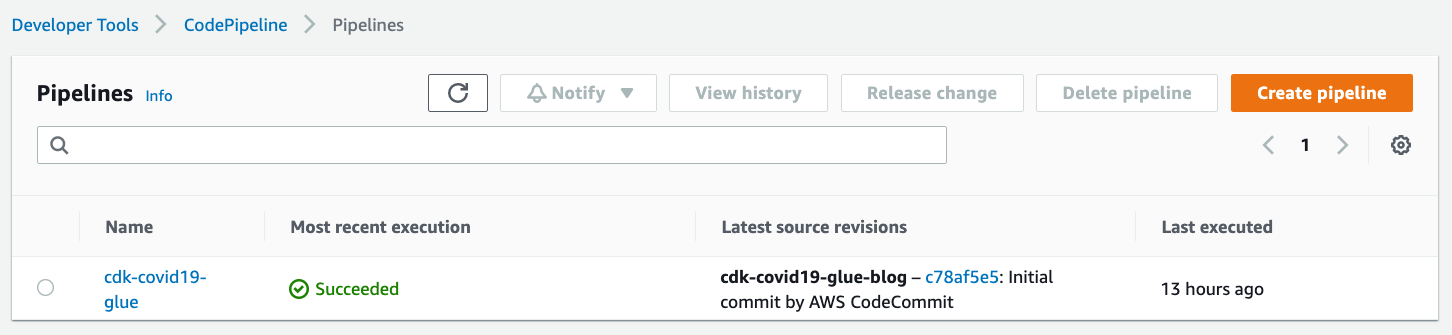
CodePipeline pipeline
On the CodePipeline console, check for the cdk-covid19-glue pipeline.

Figure 3 – AWS CodePipeline summary view
You can open the pipeline for a detailed view.

Figure 4 – AWS CodePipeline detailed view
AWS Glue workflow
To validate the AWS Glue workflow and its components, complete the following steps:
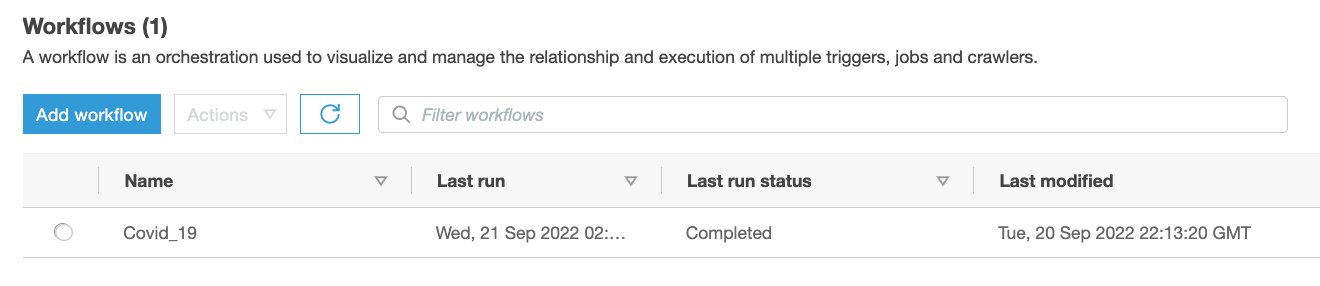
- On the AWS Glue console, choose Workflows in the navigation pane.
- Confirm the presence of the
Covid_19 workflow.

Figure 5 – AWS Glue Workflow summary view
You can select the workflow for a detailed view.

Figure 6 – AWS Glue Workflow detailed view
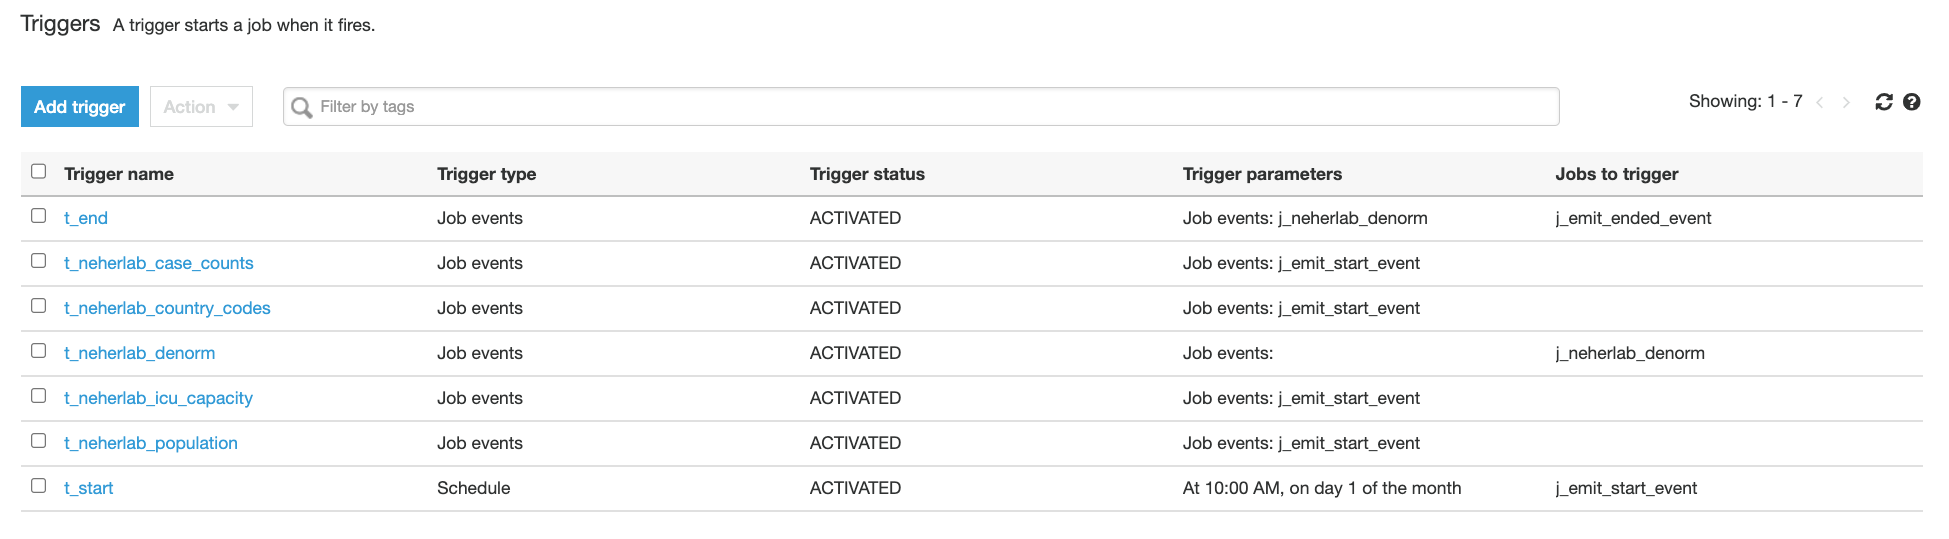
- Choose Triggers in the navigation pane and check for the presence of seven
t-* triggers.

Figure 7 – AWS Glue Triggers
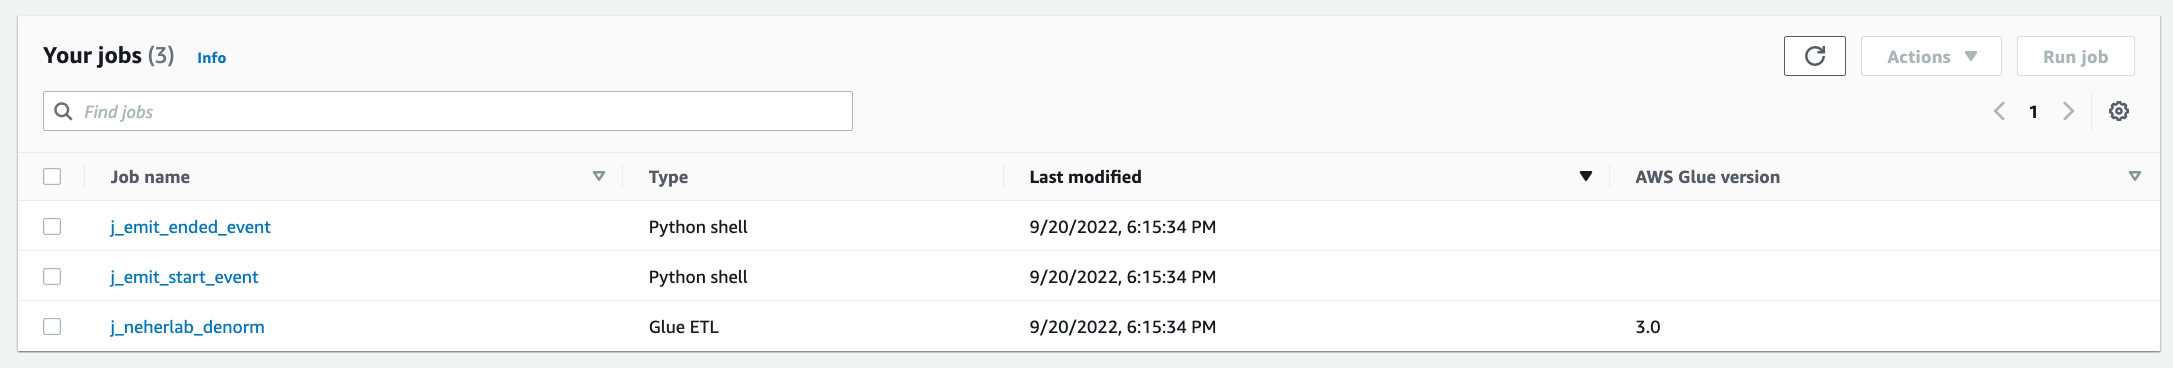
- Choose Jobs in the navigation pane and check for the presence of three
j_* jobs.

Figure 8 – AWS Glue Jobs
The jobs perform the following tasks:
-
- etlScripts/j_emit_start_event.py – A Python job that starts the workflow and creates the event
- etlScripts/j_neherlab_denorm.py – A Spark ETL job to transform the data and create a denormalized view by combining all the base data together in Parquet format
- etlScripts/j_emit_ended_event.py – A Python job that ends the workflow and creates the specific event
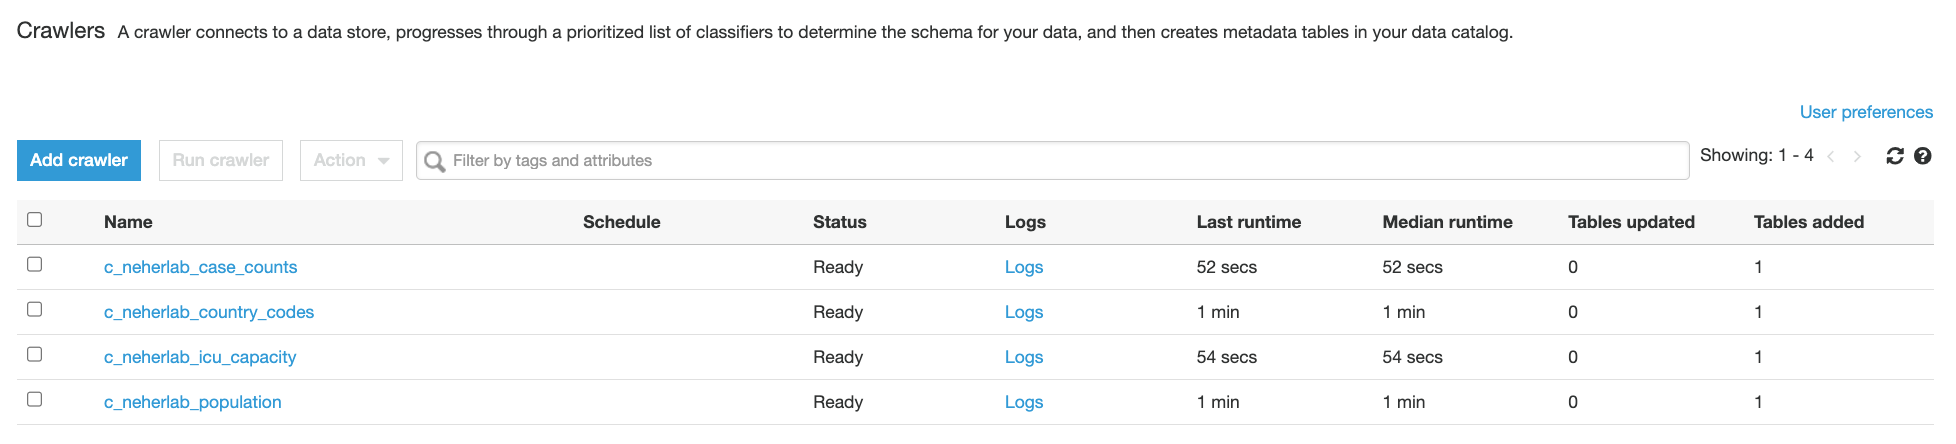
- Choose Crawlers in the navigation pane and check for the presence of five
neherlab-* crawlers.

Figure 9 – AWS Glue Crawlers
Execute the solution
- The solution creates a scheduled AWS Glue workflow which runs at 10:00 AM UTC on day 1 of every month. A scheduled workflow can also be triggered on-demand. For the purpose of this post, we will execute the workflow on-demand using the following command from the AWS CLI. If the workflow is successfully started, the command returns the
run ID. For instructions on how to run and monitor a workflow in Amazon Glue, refer to Running and monitoring a workflow in Amazon Glue.
aws glue start-workflow-run --name Covid_19
- You can verify the status of a workflow run by execution the following command from the AWS CLI. Please use the
run ID returned from the above command. A successfully executed Covid_19 workflow should return a value of 7 for SucceededActions and 0 for FailedActions.
aws glue get-workflow-run --name Covid_19 --run-id <run_ID>
- A sample output of the above command is provided below.
{
"Run": {
"Name": "Covid_19",
"WorkflowRunId": "wr_c8855e82ab42b2455b0e00cf3f12c81f957447abd55a573c087e717f54a4e8be",
"WorkflowRunProperties": {},
"StartedOn": "2022-09-20T22:13:40.500000-04:00",
"CompletedOn": "2022-09-20T22:21:39.545000-04:00",
"Status": "COMPLETED",
"Statistics": {
"TotalActions": 7,
"TimeoutActions": 0,
"FailedActions": 0,
"StoppedActions": 0,
"SucceededActions": 7,
"RunningActions": 0
}
}
}
- (Optional) To verify the status of the workflow run using AWS Glue console, choose Workflows in the navigation pane, select the
Covid_19 workflow, click on the History tab, select the latest row and click on View run details. A successfully completed workflow is marked in green check marks. Please refer to the Legend section in the below screenshot for additional statuses.

Figure 10 – AWS Glue Workflow successful run
Check the output
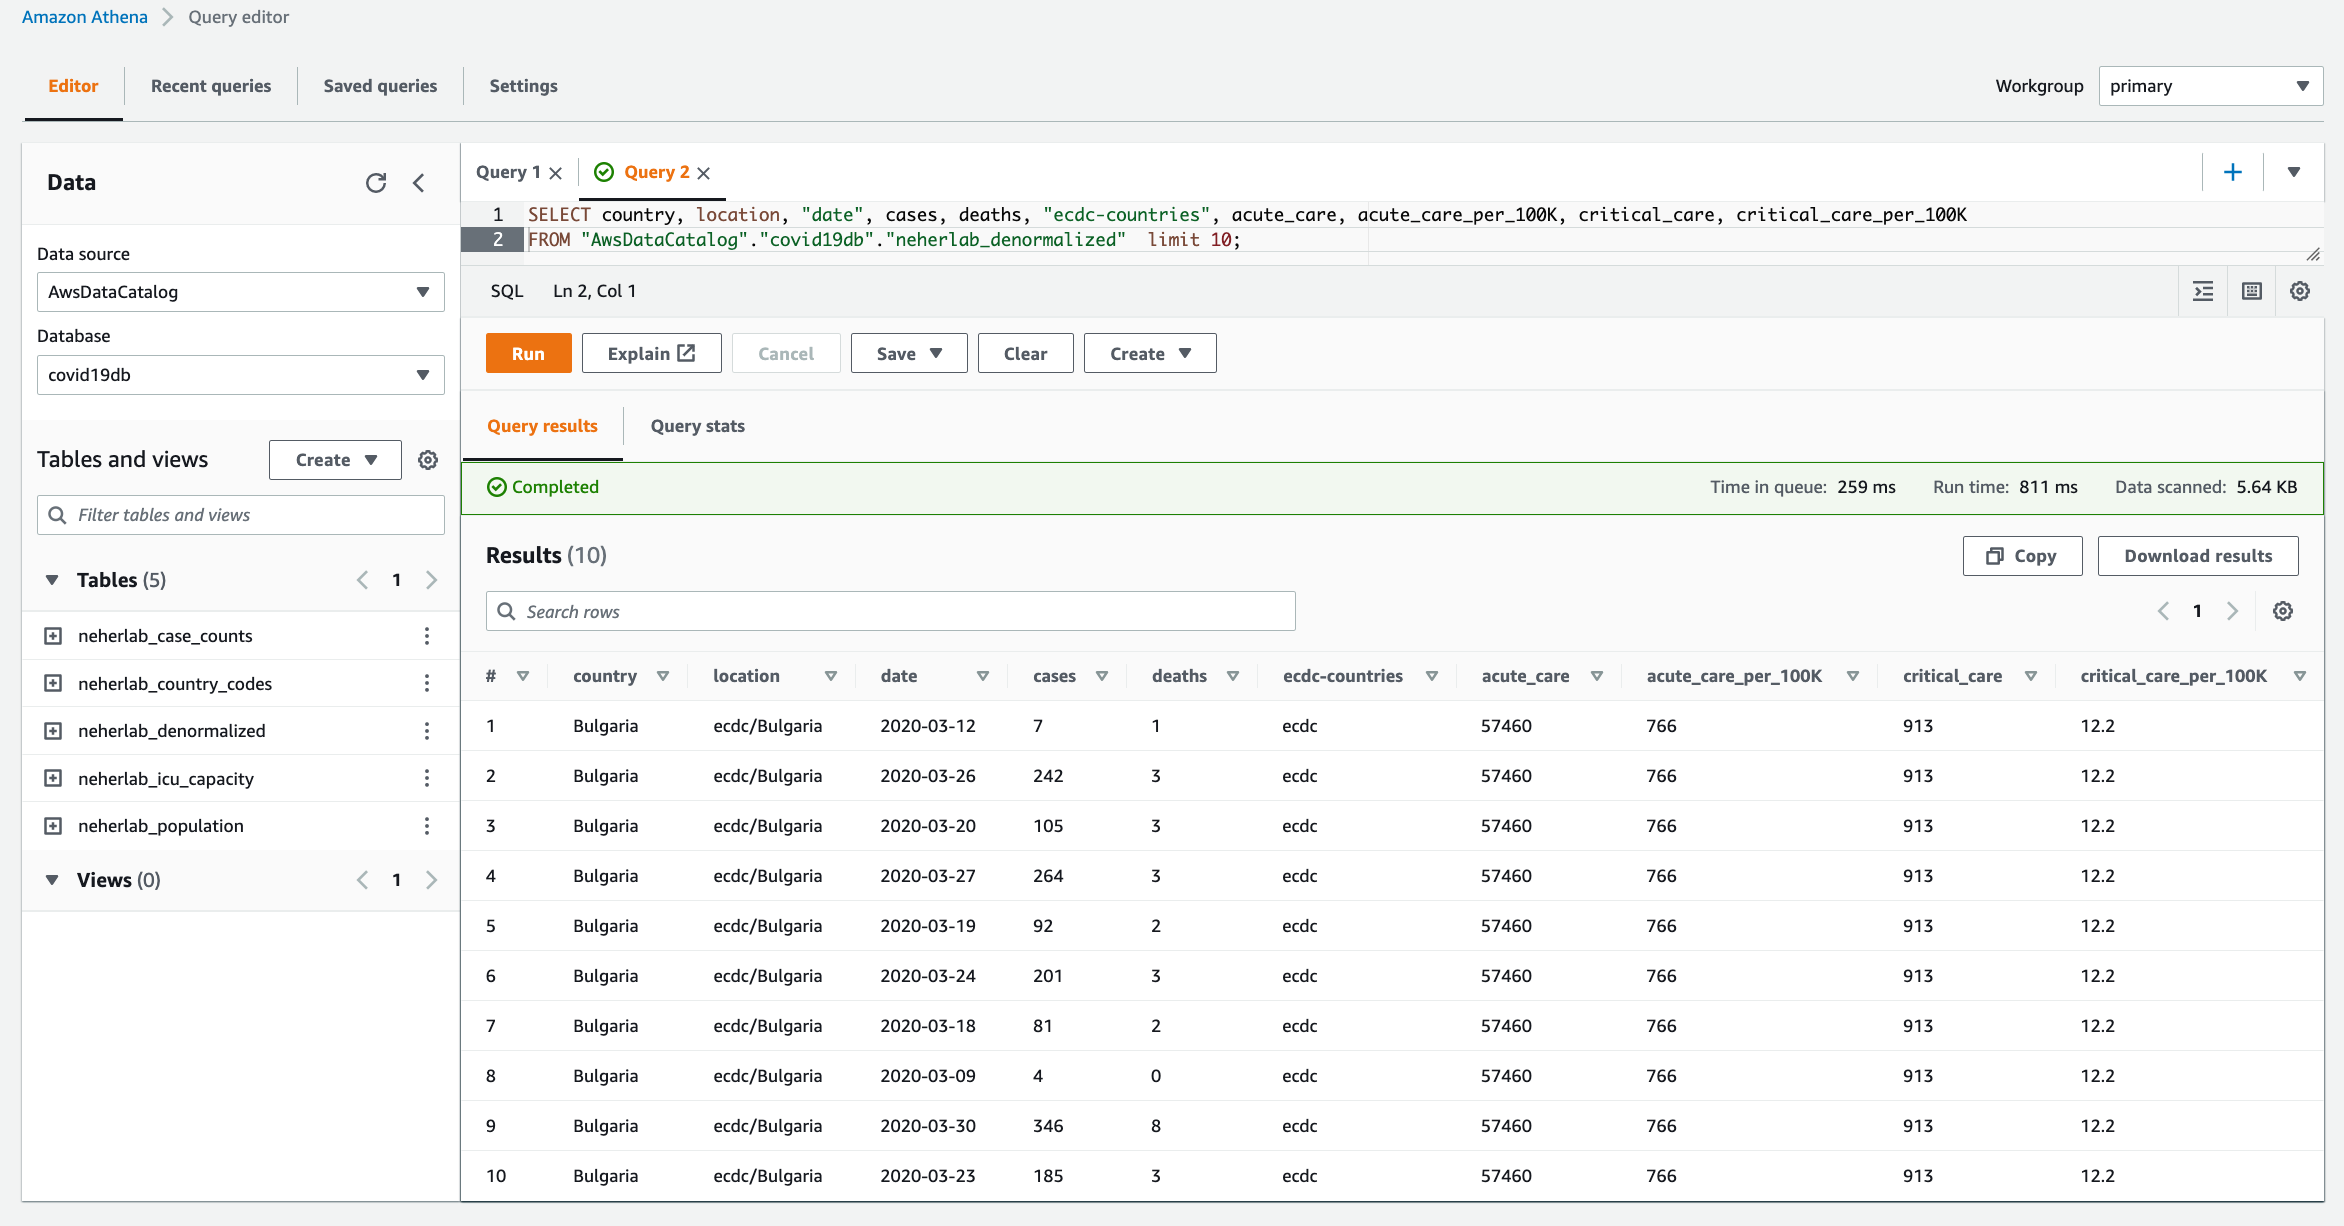
- When the workflow is complete, navigate to the Athena console to check the successful creation and population of
neherlab_denormalized table. You can run SQL queries against all 5 tables to check the data. A sample SQL query is provided below.
SELECT "country", "location", "date", "cases", "deaths", "ecdc-countries",
        "acute_care", "acute_care_per_100K", "critical_care", "critical_care_per_100K"
FROM "AwsDataCatalog"."covid19db"."neherlab_denormalized"
limit 10;

Figure 10 – Amazon Athena
Clean up
To clean up the resources created in this post, delete the AWS CloudFormation stacks in the following order:
cdk-covid19-glue-stackcdk-covid19-glue-stack-pipelineCDKToolkit
Then delete all associated S3 buckets:
cdk-covid19-glue-stack-p-pipelineartifactsbucketa-*cdk-*-assets-<AWS_ACCOUNT_ID>-<AWS_REGION>covid19-glue-config-<AWS_ACCOUNT_ID>-<AWS_REGION>neherlab-denormalized-dataset-<AWS_ACCOUNT_ID>-<AWS_REGION>
Conclusion
In this post, we demonstrated a step-by-step guide to define, test, provision, and manage changes to an AWS Glue based ETL solution using the AWS CDK. We used an AWS Glue example, which has all the components to build a complex ETL solution, and demonstrated how to integrate individual AWS Glue components into a frictionless CI/CD pipeline. We encourage you to use this post and associated code as the starting point to build your own CI/CD pipelines for AWS Glue based ETL solutions.
About the authors
 Puneet Babbar is a Data Architect at AWS, specialized in big data and AI/ML. He is passionate about building products, in particular products that help customers get more out of their data. During his spare time, he loves to spend time with his family and engage in outdoor activities including hiking, running, and skating. Connect with him on LinkedIn.
Suvojit Dasgupta is a Sr. Lakehouse Architect at Amazon Web Services. He works with customers to design and build data solutions on AWS.
Justin Kuskowski is a Principal DevOps Consultant at Amazon Web Services. He works directly with AWS customers to provide guidance and technical assistance around improving their value stream, which ultimately reduces product time to market and leads to a better customer experience. Outside of work, Justin enjoys traveling the country to watch his two kids play soccer and spending time with his family and friends wake surfing on the lakes in Michigan.