Post Syndicated from Ashok Padmanabhan original https://aws.amazon.com/blogs/big-data/simplify-and-optimize-python-package-management-for-aws-glue-pyspark-jobs-with-aws-codeartifact/
Data engineers use various Python packages to meet their data processing requirements while building data pipelines with AWS Glue PySpark Jobs. Languages like Python and Scala are commonly used in data pipeline development. Developers can take advantage of their open-source packages or even customize their own to make it easier and faster to perform use cases, such as data manipulation and analysis. However, managing standardized packages can be cumbersome with multiple teams using different versions of packages, installing non-approved packages, and causing duplicate development effort due to the lack of visibility of what is available at the enterprise level. This can be especially challenging in large enterprises with multiple data engineering teams.
ETL Developers have requirements to use additional packages for their AWS Glue ETL jobs. With security being job zero for customers, many will restrict egress traffic from their VPC to the public internet, and they need a way to manage the packages used by applications including their data processing pipelines.
Our proposed solution will enable you with network egress restrictions to manage packages centrally with AWS CodeArtifact and use their favorite libraries in their AWS Glue ETL PySpark code. In this post, we’ll describe how CodeArtifact can be used for managing packages and modules for AWS Glue ETL jobs, and we’ll demo a solution using Glue PySpark jobs that run within VPC Subnets that have no internet access.
Solution overview
The solution uses CodeArtifact as a tool to make it easier for organizations of any size to securely store, publish, and share software packages used in their ETL with AWS Glue. VPC Endpoints will be enabled for CodeArtifact and Glue to enable private link connections. AWS Step Functions makes it easy to coordinate the orchestration of components used in the data processing pipeline. Native integrations with both CodeArtifact and AWS Glue enable the workflow to both authenticate the request to CodeArtifact and start the AWS Glue ETL job.
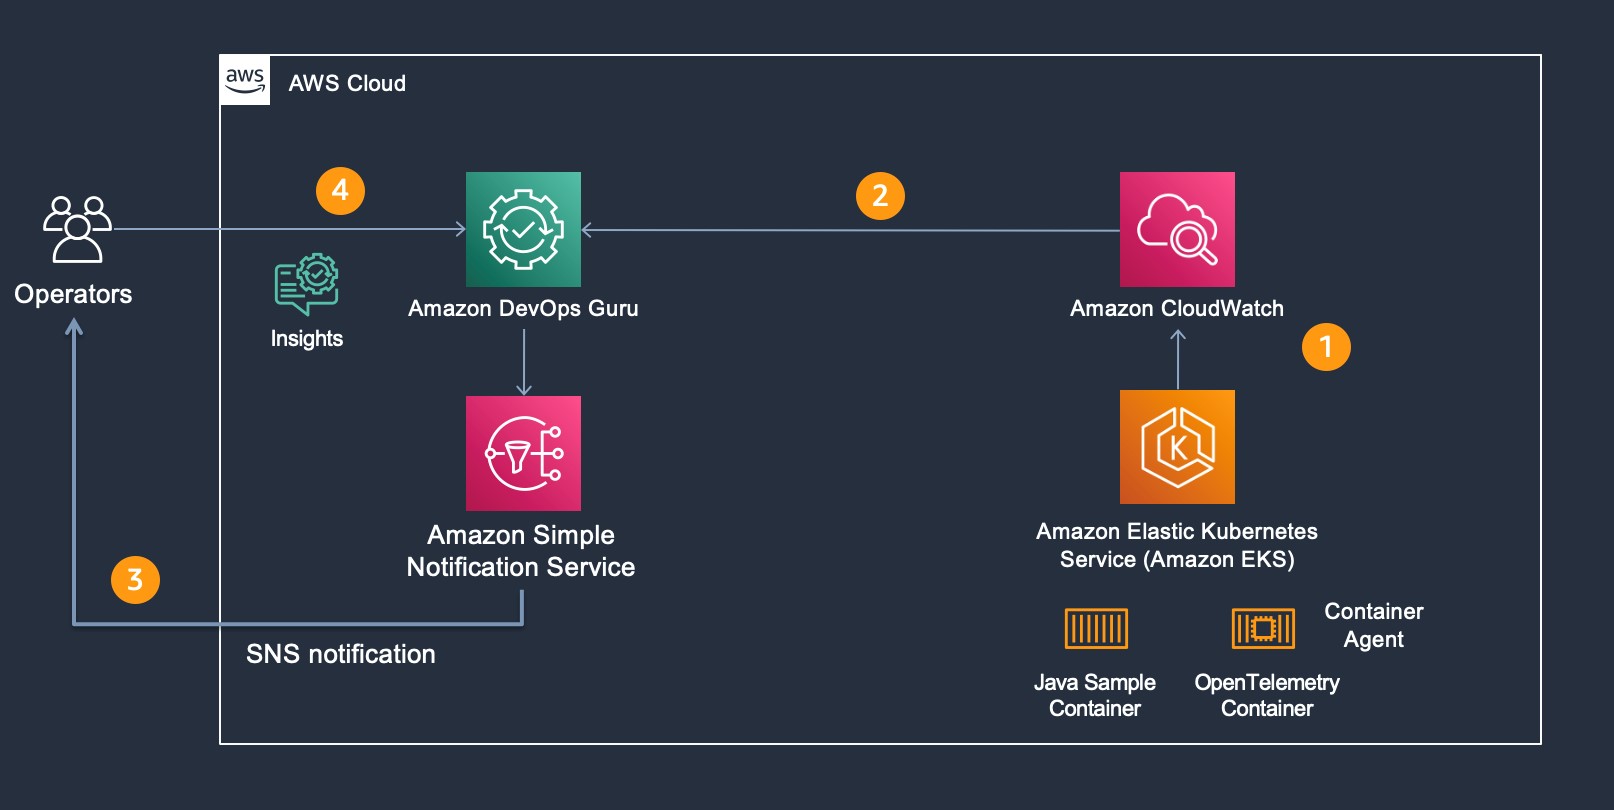
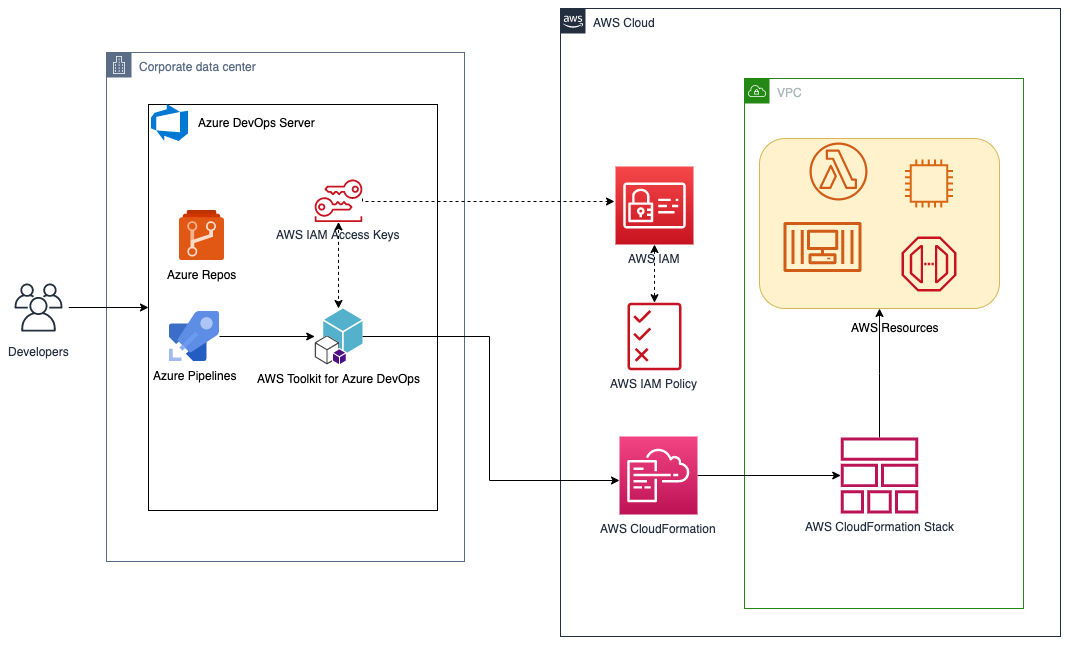
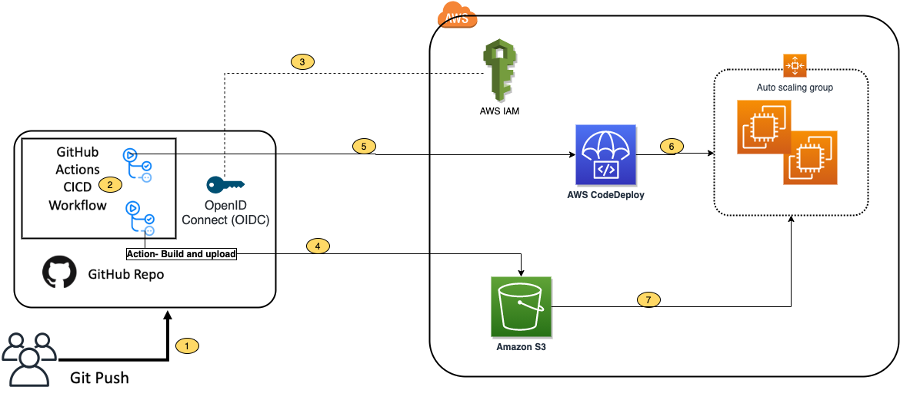
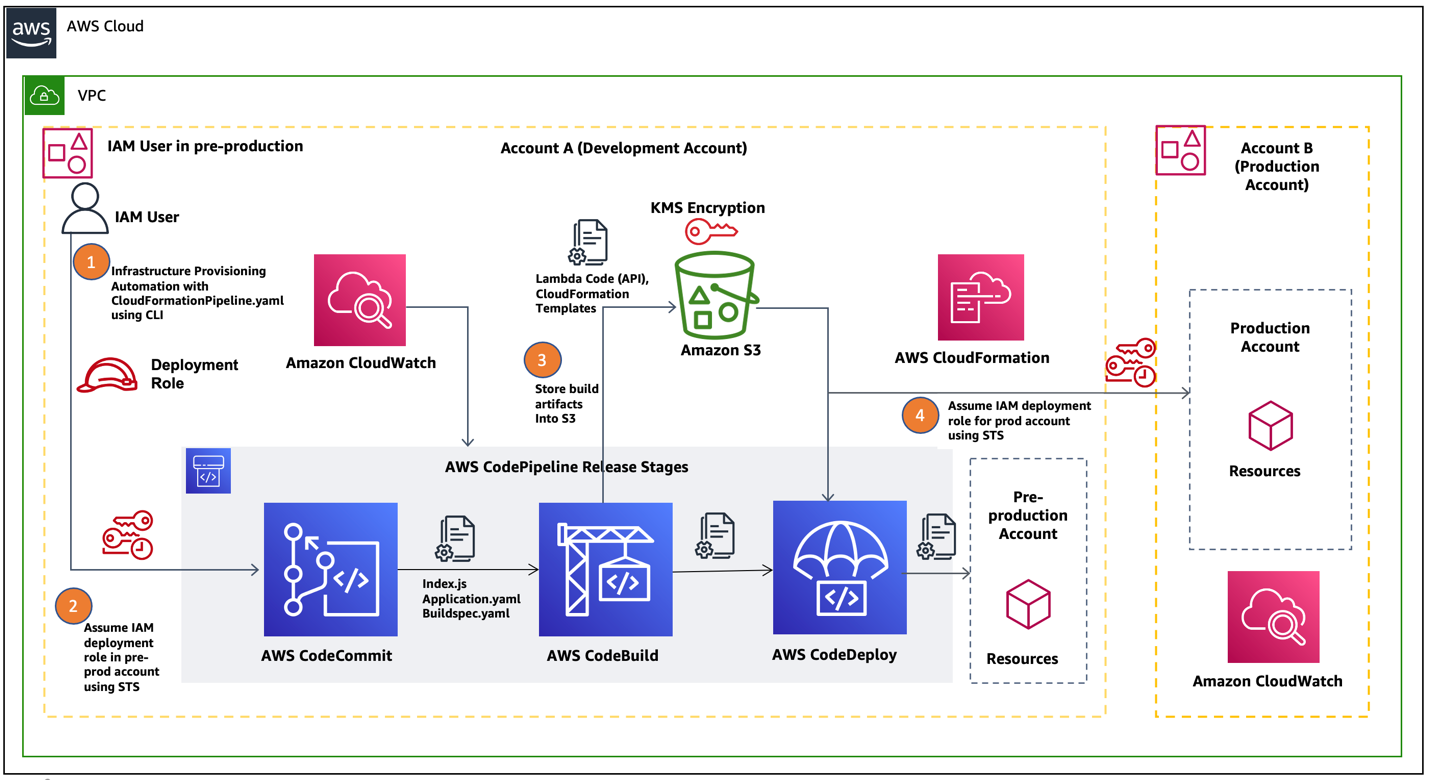
The following architecture shows an implementation of a solution using AWS Glue, CodeArtifact, and Step Functions to use additional Python modules without egress internet access. The solution is deployed using AWS Cloud Development Kit (AWS CDK), an open-source software development framework to define your cloud application resources using familiar programming languages.
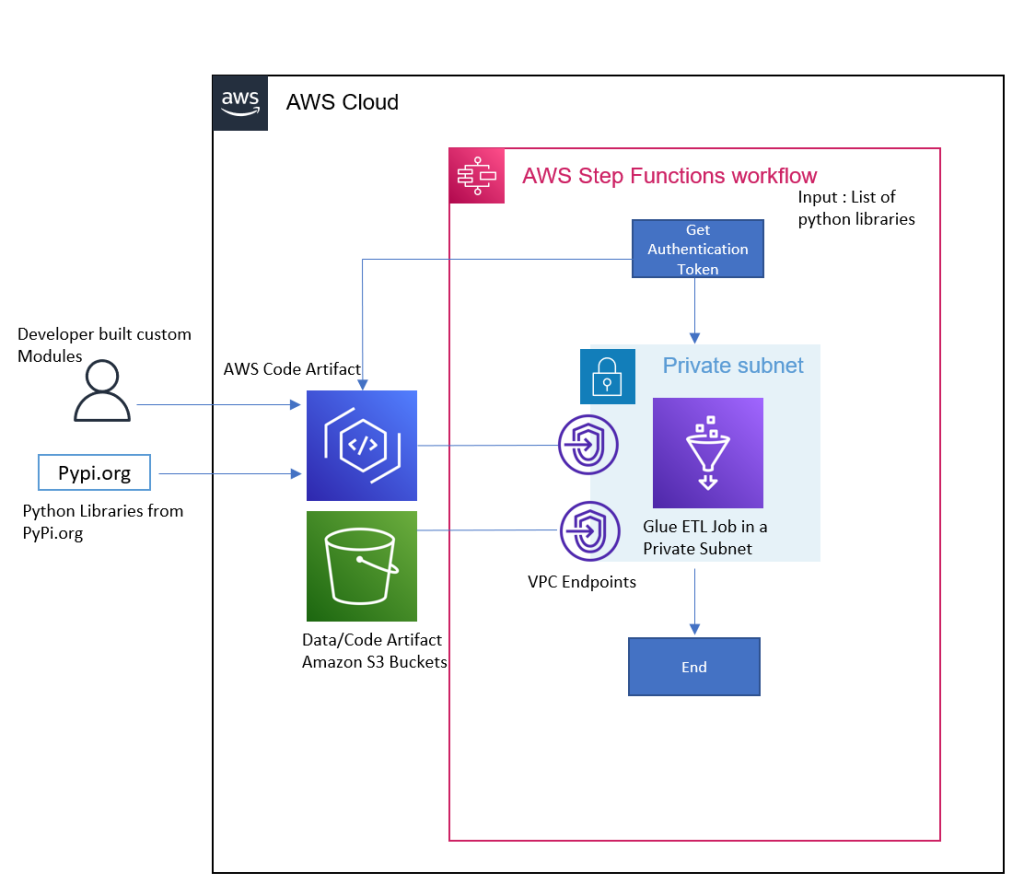
Fig 1: Architecture Diagram for the Solution
To illustrate how to set up this architecture, we’ll walk you through the following steps:
- Deploying an AWS CDK stack to provision the following AWS Resources
- CodeArtifact
- An AWS Glue job
- Step Functions workflow
- Amazon Simple Storage Service (Amazon S3) bucket
- A VPC with a private Subnet and VPC Endpoints to Amazon S3 and CodeArtifact
- Validate the Deployment.
- Run a Sample Workflow – This workflow will run an AWS Glue PySpark job that uses a custom Python library, and an upgraded version of boto3.
- Cleaning up your resources.
Prerequisites
Make sure that you complete the following steps as prerequisites:
- Have an AWS account. For this post, you configure the required AWS resources using AWS CloudFormation. If you haven’t signed up, complete the following tasks:
- Create an account. For instructions, see Sign Up for AWS
- Create an AWS Identity and Access Management (IAM) user. For instructions, see Create IAM User.
- Have the following installed and configured on your machine:
The solution
Launching your AWS CDK Stack
Step 1: Using your device’s command line, check out our Git repository to a local directory on your device:
Step 2: Change directories to the new directory Amazon S3 script location:
Step 3: Download the following CSV, which contains New York City Taxi and Limousine Commission (TLC) Trip weekly trips. This will serve as the input source for the AWS Glue Job:
Step 4: Change the directories to the path where the app.py file is located (in reference to the previous step, execute the following step):
Step 5: Create a virtual environment:
macOS/Linux:
python3 -m venv .env
Windows:
python -m venv .env
Step 6: Activate the virtual environment after the init process completes and the virtual environment is created:
macOS/Linux:
source .env/bin/activate
Windows:
.env\Scripts\activate.bat
Step 7: Install the required dependencies:
Step 8: Make sure that your AWS profile is setup along with the region that you want to deploy as mentioned in the prerequisite. Synthesize the templates. AWS CDK apps use code to define the infrastructure, and when run they produce or “synthesize” a CloudFormation template for each stack defined in the application:
Step 9: BootStrap the cdk app using the following command:
Replace the place holder AWS_ACCOUNTID and AWS_REGION with your AWS account ID and the region to be deployed.
This step provisions the initial resources, including an Amazon S3 bucket for storing files and IAM roles that grant permissions needed to perform deployments.
Step 10: Deploy the solution. By default, some actions that could potentially make security changes require approval. In this deployment, you’re creating an IAM role. The following command overrides the approval prompts, but if you would like to manually accept the prompts, then omit the --require-approval never flag:
While the AWS CDK deploys the CloudFormation stacks, you can follow the deployment progress in your terminal:
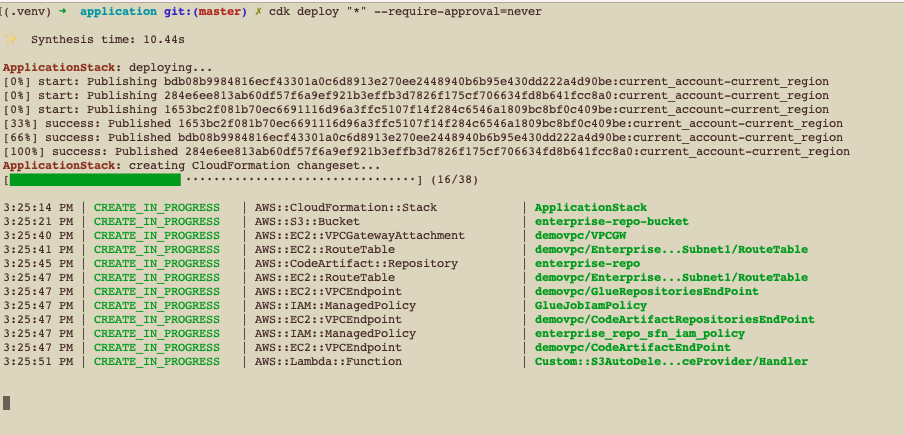
Fig 2: AWS CDK Deployment progress in terminal
Once the deployment is successful, you’ll see the successful status as follows:
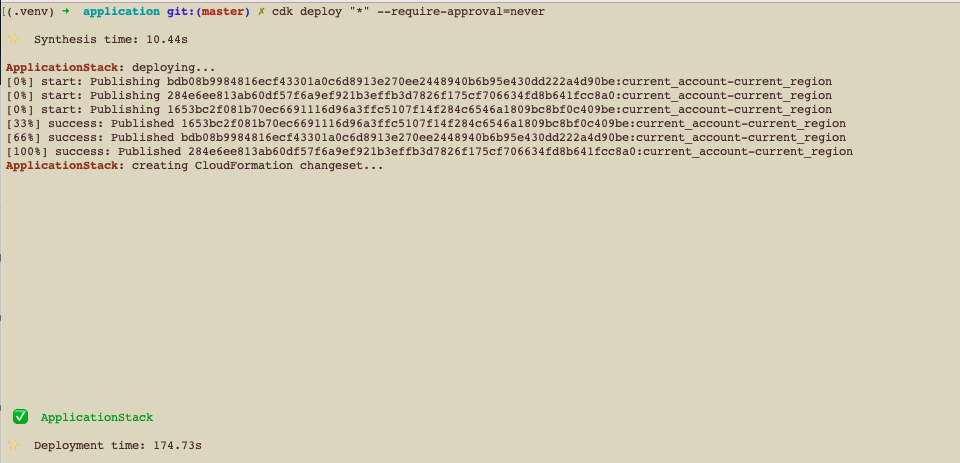
Fig 3: AWS CDK Deployment completion success
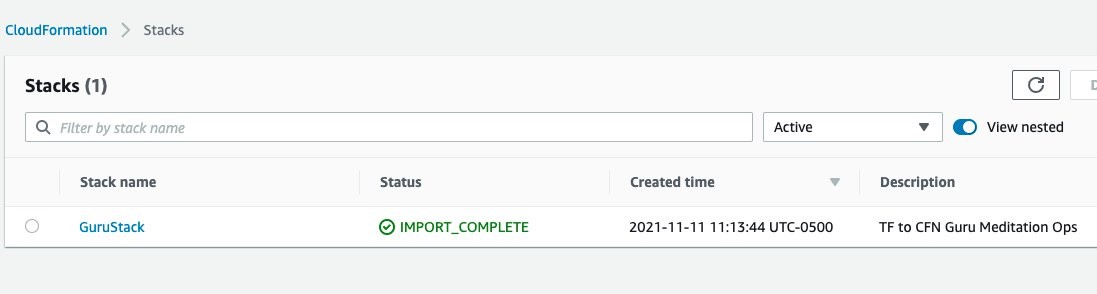
Step 11: Log in to the AWS Console, go to CloudFormation, and see the output of the ApplicationStack stack:
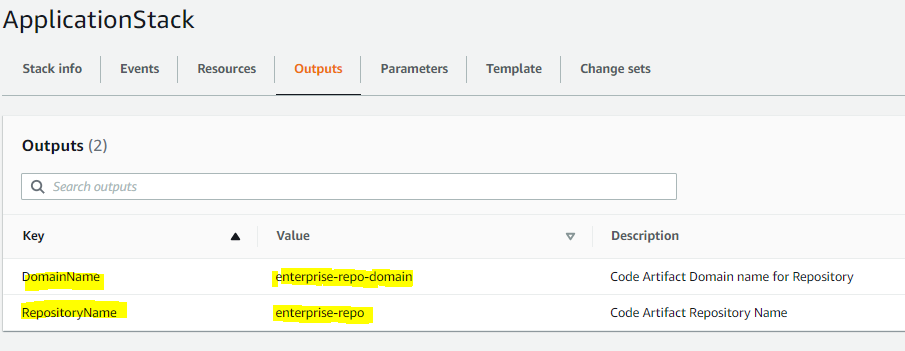
Fig 4: AWS CloudFormation stack output
Note the values of the DomainName and RepositoryName variables. We’ll use them in the next step to upload our artifacts
Step 12: We will upload a custom library into the repo that we created. This will be used by our Glue ETL job.
- Install twine using pip:
The custom python package glueutils-0.2.0.tar.gz can be found under this folder of the cloned repo:
- Configure twine with the login command (additional details here ). Refer to step 11 for the
DomainNameandRepositoryNamefrom the CloudFormation output:
- Publish Python package assets:

Fig 5: Python package publishing using twine
Validate the Deployment
The AWS CDK stack will deploy the following AWS resources:
- Amazon Virtual Private Cloud (Amazon VPC)
- One Private Subnet
- AWS CodeArtifact
- CodeArtifact Repository
- CodeArtifact Domain
- CodeArtifact Upstream Repository
- AWS Glue
- AWS Glue Job
- AWS Glue Database
- AWS Glue Connection
- AWS Step Function
- Amazon S3 Bucket for AWS CDK and also for storing scripts and CSV file
- IAM Roles and Policies
- Amazon Elastic Compute Cloud (Amazon EC2) Security Group
Step 1: Browse to the AWS account and region via the AWS Console to which the resources are deployed.
Step 2: Browse the Subnet page (https://<region> .console.aws.amazon.com/vpc/home?region=<region> #subnets:) (*Replace region with actual AWS Region to which your resources are deployed)
Step 3: Select the Subnet with name as ApplicationStack/enterprise-repo-vpc/Enterprise-Repo-Private-Subnet1
Step 4: Select the Route Table and validate that there are no Internet Gateway or NAT Gateway for routes to Internet, and that it’s similar to the following image:
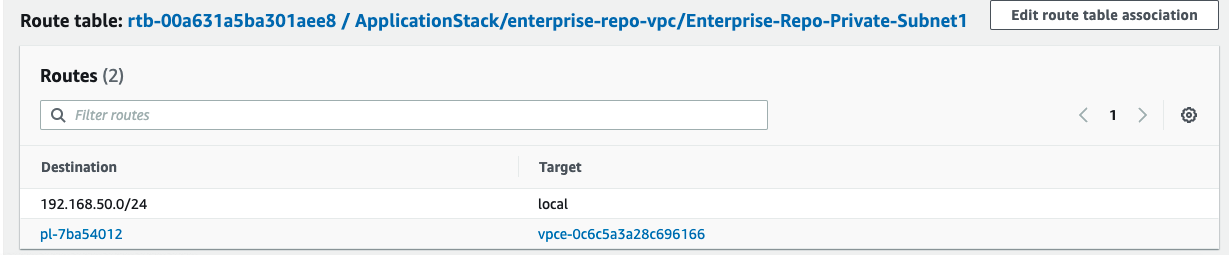
Fig 6: Route table validation
Step 5: Navigate to the CodeArtifact console and review the repositories created. The enterprise-repo is your local repository, and pypi-store is the upstream repository connected to the PyPI, providing artifacts from pypi.org.
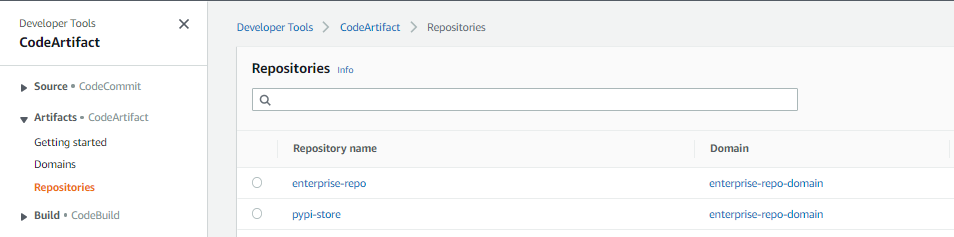
Fig 7: AWS CodeArifact repositories created
Step 6: Navigate to enterprise-repo and search for glueutils. This is the custom python package that we published.
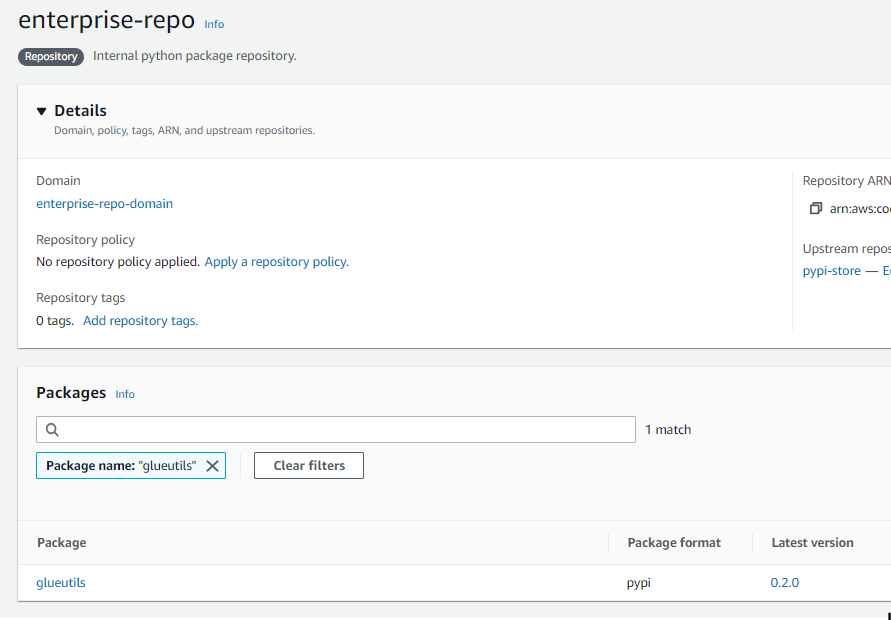
Fig 8: AWS CodeArifact custom python package published
Step 7: Navigate to Step Functions Console and review the enterprise-repo-step-function as follows:
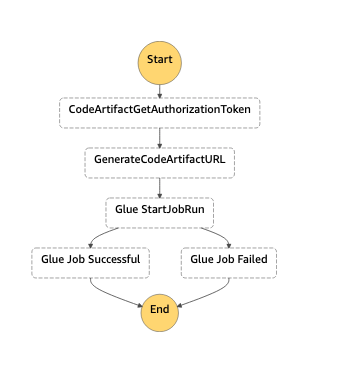
Fig 9: AWS Step Functions workflow
The diagram shows how the Step Functions workflow will orchestrate the pattern.
- The first step
CodeArtifactGetAuthorizationTokencalls the getAuthorizationToken API to generate a temporary authorization token for accessing repositories in the domain (this token is valid for 15 mins.). - The next step
GenerateCodeArtifactURLtakes the authorization token from the response and generates the CodeArtifact URL. - Then, this will move into the
GlueStartJobRunstate, which makes a synchronous API call to run the AWS Glue job.
Step 8: Navigate to the AWS Glue Console and select the Jobs tab, then select enterprise-repo-glue-job.
The AWS Glue job is created with the following script and AWS Glue Connection enterprise-repo-glue-connection. The AWS Glue connection is a Data Catalog object that enables the job to connect to sources and APIs from within the VPC. The network type connection runs the job from within the private subnet to make requests to Amazon S3 and CodeArtifact over the VPC endpoint connection. This enables the job to run without any traffic through the internet.
Note the connections section in the AWS Glue PySpark Job, which makes the Glue job run on the private subnet in the VPC provisioned.
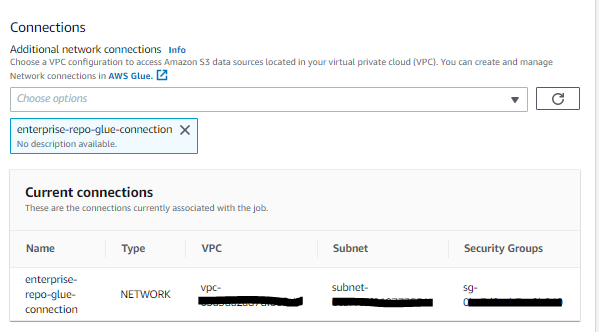
Fig 10: AWS Glue network connections
The job takes an Amazon S3 bucket, Glue Database, Python Job Installer Option, and Additional Python Modules as job parameters. The parameters --additional-python-modules and --python-modules-installer-option are passed to install the selected Python module from a PyPI repository hosted in AWS CodeArtifact.
The script itself first reads the Amazon S3 input path of the taxi data in the CSV format. A light transformation to sum the total trips by year, week, and app is performed. Then the output is written to an Amazon S3 path as parquet . A partitioned table in the AWS Glue Data Catalog will either be created or updated if it already exists .
You can find the Glue PySpark script here.
Run a sample workflow
The following steps will demonstrate how to run a sample workflow:
Step 1: Navigate to the Step Functions Console and select the enterprise-repo-step-function.
Step 2: Select Start execution and input the following: We’re including the glueutils and latest boto3 libraries as part of the job run. It is always recommended to pin your python dependencies to avoid any breaking change due to a future version of dependency . In the below example, the latest available version of boto3, and the 0.2.0 version of glueutils will be installed. To pin it to a specific release you may add boto3==1.24.2 (Current latest release at the time of publishing this post).
Step 3: Select Start execution and wait until Execution Status is Succeeded. This may take a few minutes.
Step 4: Navigate to the CodeArtifact Console to review the enterprise-repo repository. You’ll see the cached PyPi packages and all of their dependencies pulled down from PyPi.
Step 5: In the Glue Console under the Runs section of the enterprise-glue-job, you’ll see the parameters passed:

Fig 11 : AWS Glue job execution history
Note the --index-url which was passed as a parameter to the glue ETL job. The token is valid only for 15 minutes.
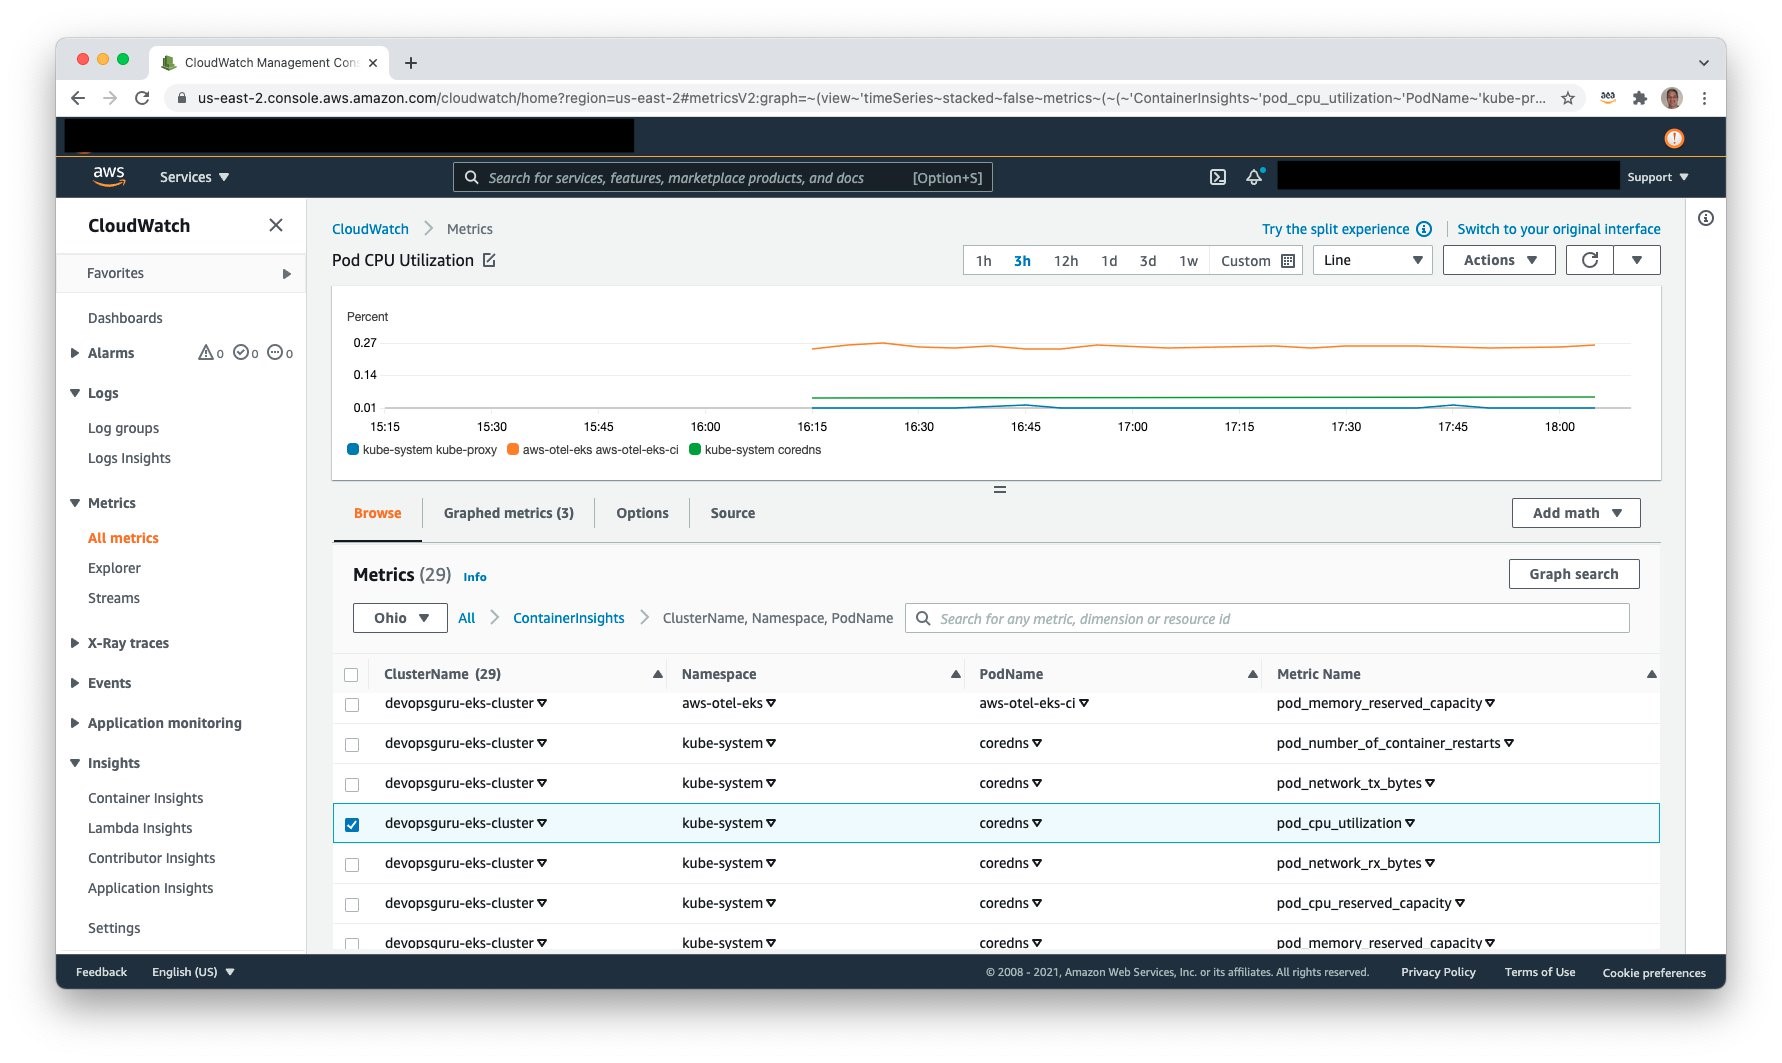
Step 6: Navigate to the Amazon CloudWatch Console and go to the /aws/glue-jobs log group to verify that the packages were installed from the local repo.
You will see that the 2 package names passed as parameters are installed with the corresponding versions.
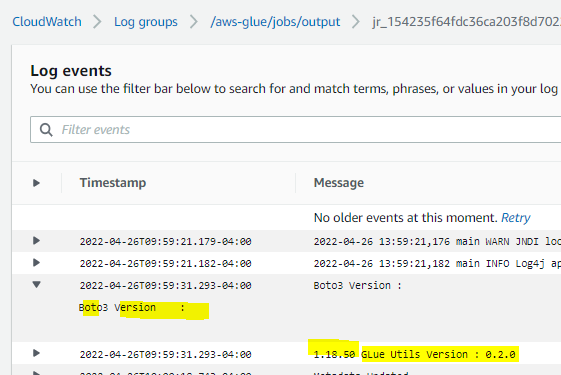
Fig 12 : Amazon CloudWatch logs details for the Glue job
Step 7: Navigate to the Amazon Athena console and select Query Editor.
Step 8: Run the following query to validate the output of the AWS Glue job:
Clean up
Make sure that you clean up all of the other AWS resources that you created in the AWS CDK Stack deployment. You can delete these resources via the AWS CDK Destroy command as follows or the CloudFormation console.
To destroy the resources using AWS CDK, follow these steps:
- Follow Steps 1-6 from the ‘Launching your CDK Stack’ section.
- Destroy the app by executing the following command:
Conclusion
In this post, we demonstrated how CodeArtifact can be used for managing Python packages and modules for AWS Glue jobs that run within VPC Subnets that have no internet access. We also demonstrated how the versions of existing packages can be updated (i.e., boto3) and a custom Python library (glueutils) that is developed locally is also managed through CodeArtifact.
This post enables you to use your favorite Python packages with AWS Glue ETL PySpark jobs by modifying the input to the AWS StepFunctions workflow (Step 2 in the Run a Sample workflow section).
About the Authors
 Bret Pontillo is a Data & ML Engineer with AWS Professional Services. He works closely with enterprise customers building data lakes and analytical applications on the AWS platform. In his free time, Bret enjoys traveling, watching sports, and trying new restaurants.
 Gaurav Gundal is a DevOps consultant with AWS Professional Services, helping customers build solutions on the customer platform. When not building, designing, or developing solutions, Gaurav spends time with his family, plays guitar, and enjoys traveling to different places.
 Ashok Padmanabhan is a Sr. IOT Data Architect with AWS Professional Services, helping customers build data and analytics platform and solutions. When not helping customers build and design data lakes, Ashok enjoys spending time at the beach near his home in Florida.


![git clone CodeCommit repo to Cloud9 using git clone command, readme.md file is created locally and pushed back to CodeCommit repo]](https://d2908q01vomqb2.cloudfront.net/7719a1c782a1ba91c031a682a0a2f8658209adbf/2022/02/02/Picture7.png)