Education is critical to effective security. As organizations migrate, modernize, and build with Amazon Web Services (AWS), engineering and development teams need specific skills and knowledge to embed security into workloads. Lack of support for these skills can increase the likelihood of security incidents.
AWS has partnered with SANS Institute to create SEC480: AWS Secure Builder—a new training course that can help you confidently build and deploy secure workloads in the AWS Cloud.
The training, authored and delivered by the experts at SANS Institute, is designed to equip architects, engineers, and developers with the ability to implement and enhance security controls, and strengthen your security posture with a secure by design approach to product development.
What you’ll learn
The course features eight comprehensive modules that focus on different aspects of AWS security. Each is accompanied by a hands-on lab to provide practical experience and boost confidence in building secure AWS environments.
Responsibility to, for, and of security: Understand the shared responsibility model, the difference between cloud and on-premises security, AWS security architecture, compliance requirements, and how to apply effective security controls.
Identification and authorization: Implement best practices for AWS Identity and Access Management (IAM), explore workforce identity management, address common authentication failures, and apply secure access controls.
Continuous integration and delivery (CI/CD): Learn how to configure and use CI/CD pipelines, automate code deployment with AWS CodePipeline, integrate security tools, and help prevent misconfigurations through hands-on labs and real-world demos.
Security monitoring: Implement comprehensive security monitoring with logging at all levels, use monitoring tools, enhance alerting with artificial AI, and set up early warning systems.
Exposure and attack vectors: Identify and mitigate exposure and attack vectors through open source intelligence (OSINT), understand the anatomy of exploitations, and minimize threat surfaces using threat modeling and compliance tools.
Incident response: Master the six-step incident response process, implement best practices with roles, playbooks, and technology, and prepare with tools and exercises.
Trust, control, and the supply chain: Evaluate vendor reliance and onboarding processes, implement Zero Trust principles, and defend against supply chain attacks to ensure secure vendor interactions.
Anyone technical who will be building in, operating in, configuring, or managing AWS cloud environments can benefit from the training, including AWS customers and partners. The training is offered online, and learnings are validated by an associated GIAC exam.
Arming your teams with the insight provided by this training can help your organization design, build, and maintain applications in the cloud with a security-first mindset, increase product development velocity, and enhance business agility through secure cloud practices.
This course will be offered online. SANS provides in-person training only for private, high-volume trainings.
GIAC is providing a micro-credential for the AWS Secure Builder certification. It will be the first course to have this designation by GIAC. Micro-certifications are short, competency-based courses that demonstrate mastery in a particular area.
If you have feedback about this post, submit comments in the Comments section below.
Recently, passwordless authentication has gained popularity compared to traditional password-based authentication methods. Application owners can add user management to their applications while offloading most of the security heavy-lifting to Amazon Cognito. You can use Amazon Cognito to customize user authentication flow by implementing passwordless authentication. Amazon Cognito enhances the security posture of your applications because it handles the storage and management of user information securely. Additionally, Amazon Cognito provides secure authentication flow and verifiable tokens.
This post explores how you can use the advanced security features of Amazon Cognito to add threat detection to your passwordless authentication custom authentication flow, further strengthening your defenses against account takeover risks.
Overview
Amazon Cognito is a customer identity and access management (CIAM) service that streamlines the process of building secure, scalable, and user-friendly authentication solutions. With Amazon Cognito, you can integrate user sign-up, sign-in, and access control functionalities into your web and mobile applications. One of the key features of Amazon Cognito is that it supports custom authentication flow, which you can use to implement passwordless authentication for your users or you can require users to solve a CAPTCHA or answer a security question before being allowed to authenticate.
Custom authentication flows, such as passwordless authentication, offer an improved user experience while enhancing security by using strong custom factors. In addition, it is recommended to implement additional measures to detect and mitigate potential risks. Amazon Cognito advanced security provides a suite of powerful features designed to detect risks and allows you to take action to protect your user accounts.
By combining passwordless authentication with Amazon Cognito advanced security features, you can enhance your application’s overall security posture while providing a seamless and user-friendly authentication experience to your users.
Advanced security support for custom authentication flow
Amazon Cognito advanced security now supports custom authentication flows to provide additional threat detection, including passwordless authentication. You can improve the security of applications that use custom authentication factors by enabling risk detection and adaptive authentication.
The custom authentication flow triggers three AWS Lambda functions, as shown in Figure 1.
Figure 1: Custom authentication flow
The custom authentication flow depicted in Figure 1 includes the following steps:
A user initiates authentication from the custom sign-in page, which sends the authentication request to the Amazon Cognito user pool.
The user pool calls the Define Auth Challenge Lambda function. This function determines which custom challenge needs to be created. At the end, it reports back to Amazon Cognito to issue a token if authentication is successful. The function is invoked at the start of the custom authentication flow and after each completion of the Verify Auth Challenge Response Lambda trigger.
The user pool calls the Create Auth Challenge Lambda function. This function is invoked to create a unique challenge for the user based on the instruction of the Define Auth Challenge Lambda trigger.
The user responds to the challenge with their answer, which is sent by making a RespondToAuthChallenge API call to the Amazon Cognito user pool.
The user pool calls the Verify Auth Challenge Response Lambda function with the response from the user. The function determines if the answer is correct.
The user pool then calls the Define Auth Challenge Lambda function. This function verifies that the challenge has been successfully answered and that no further challenge is needed. It includes issueTokens: true in its response to the user pool.
When advanced security is enabled, Amazon Cognito performs risk analysis on the authentication request. If a risk is detected, it’s mitigated as configured in advanced security. The user pool now considers the user to be authenticated and sends the user a valid JSON Web Token (JWT) (in response to step 4, the authentication challenge).
How to configure advanced security for custom authentication flow
In this section, you set up a custom passwordless authentication flow and then add advanced security features (ASF) to protect your existing authentication flow.
After setting up passwordless authentication, go to the AWS Management Console for Amazon Cognito and configure advanced security features for your passwordless authentication flow.
Navigate to the user pool that has been created for the passwordless authentication solution.
Choose the Advanced Security tab and choose Activate.
In the Included features and initial states pop-up, you’ll see the Threat protection for standard authentication and Threat protection for custom authentication have already been included in Audit-only mode, choose Activate.
Note: It’s recommended to run advanced security features in audit only mode initially to evaluate risk patterns and decide the appropriate settings for each risk level.
Figure 2: Activate advanced security features
To set up full function mode and enforcement for Threat protection for custom authentication, choose Set up full-function mode.
Figure 3: Activate threat protection for custom authentication flow
For Custom authentication enforcement mode, you can select:
No enforcement – Amazon Cognito doesn’t gather metrics on detected risks or automatically take preventive actions.
Audit-only – Amazon Cognito gathers metrics on detected risks, but doesn’t take automatic action.
Full-function – Amazon Cognito automatically takes preventive actions in response to different levels of risk that you configure for your user pool.
Select Full-function.
Figure 4: Configure enforcement level
You can choose either Cognito defaults or Custom to respond to each level of risk when Amazon Cognito detects potential malicious activity.
Cognito defaults will block sign-in attempts for low, medium, and high risks.
Figure 5: Adaptive authentication configuration
If you choose Custom, you can customize the risk configuration for each risk level.
Allow – Sign-in attempts will be allowed without additional authentication factors.
Optional MFA – Amazon Cognito will send a multi-factor authentication (MFA) challenge to the user if the user is eligible for MFA. A user is eligible for MFA if:
They have configured an authenticator app and TOTP MFA is enabled for the user pool.
They have a phone number or email address, and SMS or email message MFA is enabled for the user pool.
If the user is eligible for MFA, they must respond correctly to the MFA challenge. If the user is not eligible for MFA, Cognito will allow sign-in without additional authentication factors.
Require MFA – Amazon Cognito will send an MFA challenge to the user if the user is eligible for MFA. If the user is eligible for MFA, they must respond correctly to the MFA challenge. If the user is not eligible for MFA, Cognito will block the sign-in attempt.
Block – Cognito blocks future sign-in attempts.
You can notify users when adaptive authentication detects potentially suspicious activity using a customized email message. This notification is sent to users to confirm their activity, and Amazon Cognito uses the user’s response to learn their behavior patterns over time. By customizing the notification message, you can provide a better user experience and make sure communication regarding the security measure is clear to your users.
To test the configuration, sign in from multiple devices and locations. Amazon Cognito will calculate risk and take action based on your configuration. After you’ve signed in multiple times through different devices, you can view the User event history.
In the Amazon Cognito console, go to the user pool and search for the user you signed in as.
Select the user name and navigate to User event history.
Figure 8: User event history
You can see the user event history with the risk levels and actions taken by Amazon Cognito as shown in Figure 8. In the figure, Amazon Cognito advanced security has detected a high-risk event and has blocked the sign-in attempt.
Amazon Cognito will associate a risk level with each sign-in attempt and based on your adaptive configuration; it will either allow the sign in, request an MFA response, or block the request.
Note: Populating UserContextData in the request is important to the functionality of the risk engine. Some SDKs, such as AWS Amplify, will populate this object by default, but in custom code, you need to make sure userContextData is calculated and populated correctly in relevant events. See Adding user device and session data to API requests for more information about populating userContextData.
In this post, you learned how to enable threat detection for a custom authentication flow such as passwordless authentication in Amazon Cognito. Threat detection helps you to monitor user activity and enhances security measures even when your users sign in through a custom authentication flow.
If you have feedback about this post, submit comments in the Comments section below.
Amazon Web Services (AWS) recently released AWS IAM Identity Centertrusted identity propagation to create identity-enhanced IAM role sessions when requesting access to AWS services as well as to trusted token issuers. These two features can help customers build custom applications on top of AWS, which requires fine-grained access to data analytics-focused AWS services such as Amazon Q Business, Amazon Athena, and AWS Lake Formation, and Amazon S3 Access Grants. You can use AWS services compatible with trusted identity propagation to grant access to users and groups belonging to IAM Identity Center instead of solely relying on AWS Identity and Access Management (IAM) role permissions. With a trusted token issuer, you can propagate identities that you have authenticated in your custom application to the underlying AWS services. In the case of an Amazon Q Business application, you can create a different web experience or integrate an Amazon Q Business application as an assistant into an existing web application to help your workforce.
These two features rely on the OAuth 2.0 protocol to exchange user information. For the identity to be consumable by AWS services, your custom application’s identity provider needs to be able to issue OAuth 2.0 tokens for your users.
This blog post from November 2023 covers how to interconnect with an OAuth 2.0 compatible identity provider such as Microsoft Entra ID, Okta, or PingFederate.
In this post, I show you how to use an Amazon Cognito user pool as a trusted token issuer for IAM Identity Center. You will also learn how to use IAM Identity Center as a federated identity provider for a Cognito user pool to provide a seamless authentication flow for your IAM Identity Center custom applications. Note that this content doesn’t cover building a custom application for Amazon Q Business. If needed, you can find more details in Build a custom UI for Amazon Q Business.
IAM Identity Center concepts
IAM Identity Center is the recommended service for managing your workforce’s access to AWS applications. It supports multiple identity sources, such as an internal directory, external Active Directory, or a SAML-compliant identity provider (IdP) with optional SCIM integration.
With trusted identity propagation, a user can sign in to an application, and that application can pass the user’s identity context when creating an identity-enhanced AWS session to access data in AWS services. Because access is now tied to the user’s identity in IAM Identity Center, AWS services can rely on both the IAM role permissions to authorize access as well as the user’s granted scopes and group memberships.
Trusted token issuers are OAuth 2.0 authorization servers that create signed tokens and enable you to use trusted identity propagation with applications that authenticate outside of AWS. With trusted token issuers, you can authorize these applications to make requests on behalf of their users to access AWS managed applications. The trusted token issuers feature is completely independent from the authentication feature of IAM Identity Center and doesn’t need to be the same identity provider as is used for authenticating into IAM Identity Center.
When performing a token exchange, the token must contain an attribute that maps to an existing user in IAM Identity Center, such as an email address or external ID. A token can be exchanged only once.
On the other side, an Amazon Cognito user pool is a user directory and an OAuth 2.0 compliant identity provider (IdP). From the perspective of your application, a Cognito user pool is an OpenID Connect (OIDC) IdP. Your application users can either sign in directly through a user pool, or they can federate through a third-party IdP. When you federate Cognito to a SAML IdP, or OIDC IdPs, your user pool acts as a bridge between multiple identity providers and your application.
Overview of solution
The solution architecture includes the following elements and steps and is depicted in Figure 1.
The custom application: The custom application provides access to the Amazon Q Business application through APIs. Users are authenticated using Amazon Cognito as an OAuth 2.0 IdP.
Amazon Q Business: The Amazon Q Business application requires identity-enhanced AWS credentials issued by AWS Security Token Service (AWS STS) to authorize requests from the custom application.
AWS STS: STS issues identity-enhanced AWS credentials to the custom application through the setContext and AssumeRole API calls. SetContext requires the user’s identity context to be passed from a JSON web token (JWT) issued by IAM Identity Center.
IAM Identity Center: To issue a JWT, IAM Identity Center requires the custom application to perform a token exchange operation from a trusted IAM role and a trusted token issuer (Cognito).
Amazon Cognito user pool: The user pool authenticates users into the custom application. The user pool uses SAML federation to delegate authentication to Identity Center. Users are automatically created in the user pool when the federated authentication is successful. The user pool returns a JWT to the custom application.
SAML-based customer managed application (when IAM Identity Center is acting as a SAML identity provider): By using the SAML customer managed application in IAM Identity Center, you can delegate the authentication from Cognito to IAM Identity Center. One benefit of using IAM Identity Center is to help guarantee that the user exists in IAM Identity Center before authenticating to Cognito, as long as IAM Identity Center is the only way to authenticate to the client application. User existence is a requirement to perform the token exchange operation.
Figure 1: Solution architecture
Walkthrough
The focus of this post is steps 3–6 of the architecture, which follow a three-step approach.
Creation and initial configuration of the Amazon Cognito user pool and domain
Configuration of the OAuth integration for trusted identity propagation
Configuration of the SAML federation trust between IAM Identity Center and Cognito
Prerequisites
For this walkthrough, you need the following prerequisites:
Step 1: Create the Cognito user pool, the user pool domain and the user pool client
The following bash script sets up the Amazon Cognito user pool, user pool domain, and user pool client and outputs the issuer URL and audience that you need to set up IAM Identity Center.
Note: The Cognito user pool domain prefix must be unique across all AWS accounts for a given AWS Region. Replace <demo-tti> with a unique prefix for your user pool domain.
#!/bin/bash
export AWS_PAGER="" # Disable sending response to less
export USER_POOL_NAME=BlogTrustedTokenIssuer
export COGNITO_DOMAIN_PREFIX=<demo-tti> # Must be unique
# Create the user pool
USER_POOL_ID=$(aws cognito-idp create-user-pool \
  --pool-name ${USER_POOL_NAME} \
  --alias-attributes email \
  --schema Name=email,Required=true,Mutable=true,AttributeDataType=String \
  --query "UserPool.Id" \
  --admin-create-user-config AllowAdminCreateUserOnly=True \
  --output text)
# Create the user pool domain
aws cognito-idp create-user-pool-domain \
  --domain ${COGNITO_DOMAIN_PREFIX} \
  --user-pool-id ${USER_POOL_ID}
# Create the user pool client
AUDIENCE=$(aws cognito-idp create-user-pool-client \
  --user-pool-id ${USER_POOL_ID} \
  --client-name TTI \
  --explicit-auth-flows ALLOW_REFRESH_TOKEN_AUTH ALLOW_USER_SRP_AUTH \
  --allowed-o-auth-flows-user-pool-client \
  --allowed-o-auth-scopes openid email profile \
  --allowed-o-auth-flows code \
  --callback-urls "http://localhost:8080" \
  --query "UserPoolClient.ClientId" \
  --output text )
ISSUER_URL="https://cognito-idp.${AWS_REGION}.amazonaws.com/${USER_POOL_ID}"
Step 2: Create the OAuth integration for trusted identity propagation
To create the OAuth integration, you need to set up a trusted token issuer and configure the OAuth customer managed application.
Configure a trusted token issuer
Start by configuring IAM Identity Center to trust tokens issued by the Amazon Cognito user pool.
Create the OAuth customer managed application, which will allow your AWS account to exchange tokens issued for the Cognito user pool client.
# Create the OAuth customer managed application
OAUTH_APPLICATION_ARN=$(aws sso-admin create-application \
    --instance-arn $INSTANCE_ARN \
    --application-provider-arn "arn:aws:sso::aws:applicationProvider/custom" \
    --name DemoApplication \
    --output text \
    --query "ApplicationArn")

# Disable using explicit assignment for user access to this application
aws sso-admin put-application-assignment-configuration \
    --application-arn $OAUTH_APPLICATION_ARN \
    --no-assignment-required
# Allow token exchange process for tokens issuer by the trusted token issuer
cat << EOF > /tmp/grant.json
{
  "JwtBearer": {
    "AuthorizedTokenIssuers": [
      {
        "TrustedTokenIssuerArn": "$TRUSTED_TOKEN_ISSUER_ARN",
        "AuthorizedAudiences": ["$AUDIENCE"]
      }
    ]
  }
}
EOF
aws sso-admin put-application-grant \
    --application-arn $OAUTH_APPLICATION_ARN \
    --grant-type "urn:ietf:params:oauth:grant-type:jwt-bearer" \
    --grant file:///tmp/grant.json
# Allow use of this application for Q Business applications
for scope in qbusiness:messages:access qbusiness:messages:read_write qbusiness:conversations:access qbusiness:conversations:read_write qbusiness:qapps:access; do
    aws sso-admin put-application-access-scope \
        --application-arn $OAUTH_APPLICATION_ARN \
        --scope $scope
done
# Allow this AWS Account Id to invoke the API to exchange token (CreateTokenWithIAM)
AWS_ACCOUNTID=$(aws sts get-caller-identity --output text --query "Account")
cat << EOF > /tmp/authentication-method.json
{
  "Iam": {
    "ActorPolicy": {
      "Version": "2012-10-17",
      "Statement": [
        {
          "Effect": "Allow",
          "Principal": {
            "AWS": "${AWS_ACCOUNTID}"
          },
          "Action": "sso-oauth:CreateTokenWithIAM",
          "Resource": "$OAUTH_APPLICATION_ARN",
        }
      ]
    }
  }
}
EOF
aws sso-admin put-application-authentication-method \
  --application-arn $OAUTH_APPLICATION_ARN \
  --authentication-method file:///tmp/authentication-method.json \
  --authentication-method-type IAM
Step 3: Create the SAML federation trust between IAM Identity Center and Cognito
The SAML integration between IAM Identity Center and Amazon Cognito is useful when your source of identity is IAM Identity Center. In this scenario, SAML integration helps ensure that users will authenticate with IAM Identity Center credentials before being authenticated to your Cognito user pool. When using federated identities, the Cognito user pool will automatically create user profiles, so you don’t need to maintain the user directory separately.
Configure IAM Identity Center
Sign in to the AWS Management Console and navigate to IAM Identity Center.
Choose Applications from the navigation pane.
Choose Add application.
Select I have an application I want to set up, select SAML 2.0, and then choose Next.
For Display name, enter DemoSAMLApplication.
Copy the IAM Identity Center SAML metadata file URL for later use.
For Application properties, leave both fields blank.
For Application ACS URL, enter https://<CognitoUserPoolDomain>.auth.<AWS_REGION>.amazoncognito.com/saml2/idpresonse.
Replace <CognitoUserPoolDomain> with the domain you chose in Step 1 and <AWS_REGION> with the Region in which you created the Cognito user pool.
For Application SAML audience, enter urn:amazon:cognito:sp:<CognitoUserPoolId>.
Replace <CognitoUserPoolId> with the ID of the Cognito user pool you created in Step 1.
Choose Submit.
Configure mapping attributes
Choose Actions and select Edit attribute mappings.
Enter ${user:email} for the field Maps to this string value or user attribute in IAM Identity Center.
Select Persistent for Format.
Choose Save changes.
Configure Cognito user pool
Navigate to the Amazon Cognito console and choose User pools from the navigation pane.
Select the user pool created in Step 1.
Choose the Sign-in experience tab.
Under Federated identity provider sign-in, choose Add identity provider.
Select SAML.
Under Provider name, enter IAMIdentityCenter.
Under Metadata document source, select Enter metadata document endpoint URL and paste the URL copied from step 6 of Configure IAM Identity Center
Under SAML attribute, enter Subject.
Choose Add Identity Provider.
Configure app integration to use IAM Identity Center
Choose the App integration tab.
Under App clients and analytics, choose TTI.
Under Hosted UI, choose Edit.
For Identity providers, select IAMIdentityCenter.
Choose Save changes.
Architecture diagram
Figure 2 shows the authentication flow from the user connecting to the web application up to the chat interaction with Amazon Q Business APIs.
Note: The AWS resources can be in the same Region, but it’s not required for Amazon Cognito and IAM Identity Center.
The application redirects the user to Amazon Cognito for authentication.
Cognito redirects the user to IAM Identity Center for authentication.
Cognito parses the SAML assertion from IAM Identity Center.
Cognito returns a JWT to the application.
The application exchanges the token with IAM Identity Center.
The application assumes an IAM role and sets the context using the IAM Identity Center token.
The application invokes the Amazon Q Business APIs with the context-aware STS session.
Figure 2: Authentication flow
Clean up
To avoid future charges to your AWS account, delete the resources you created in this walkthrough. The resources include:
The Amazon Cognito user pool (deleting this will also delete sub resources such as the user pool client)
The SAML application in IAM Identity Center
The OAuth application in IAM Identity Center
The trusted token issuer configuration in IAM Identity Center
Conclusion
In this post, we demonstrated how to implement trusted identity propagation for applications that are protected by Amazon Cognito. We also showed you how to authenticate Cognito users with IAM Identity Center to help ensure that users are authenticating using the correct mechanisms and policies and to reduce the operational burden of managing the Cognito directory by automatically provisioning users as they sign in.
Using Amazon Cognito as a trusted token issuer is useful when your application is already secured with a user pool, and you want to implement data functionalities such as Amazon Q Business chat capabilities or secure access to S3 buckets using S3 Access Grants.
If your users are authenticating with different identity providers, the solution in this post can reduce the work needed for identity integration by enabling you to add multiple identity providers to a single user pool. By using this solution, you will need to configure the trusted token issuer in IAM Identity Center only for Amazon Cognito and not for every token provider.
This walkthrough doesn’t include a demo web application because I wanted to dive into the integration of IAM Identity Center and Amazon Cognito. I recommend reading Build a custom UI for Amazon Q Business, which shows you how to implement a custom user interface for an Amazon Q Business application using Amazon Cognito for user authentication.
Because trusted identity propagation is becoming more prevalent within AWS services, I recommend the following blog posts to learn more about using it with various services.
If you are new to AWS WAF and are interested in learning how to mitigate bot traffic by implementing Challenge actions in your AWS WAF custom rules, here is a basic, cost-effective way of using this action to help you reduce the impact of bot traffic in your applications. We also cover the basics of using the Bot Control feature to implement Challenge actions as a more sophisticated and robust option for an additional cost.
AWS WAF is a web application firewall that helps you protect against common web exploits and bots that can affect availability, compromise security, or consume excessive resources. In AWS WAF, you can create web access control lists (ACLs) that you can set with managed or custom rules. There are five possible actions you can define to take when the rules are triggered: Allow, Count, Block, CAPTCHA, or Challenge. The Challenge action, which we focus on in this post, is useful for detecting requests from automated tools without affecting the user experience.
Why is it important to mitigate bot traffic?
In cybersecurity, we typically use the term bot to describe a range of tools that allow the automation or simulation of HTTP requests. These bots can be legitimate (such as search engine crawlers that index your app or site) or malicious (tools that are used to automate unwanted requests), but both types have the potential to impact your app availability and performance. By properly handling bot traffic, you can reduce this impact, which can help you optimize costs and improve the stability of your infrastructure and the availability of your business.
Before starting
If you’ve never used AWS WAF before, we recommend that you read Getting started with AWS WAF to learn the basics of how to set up this service.
How does the Challenge action work, and what are the benefits?
When a request matches your rule that contains a Challenge action, the HTTP client is presented with a challenge, which most web browsers or non-automated clients are able to process. After solving that challenge, the client receives a token that will be included in subsequent requests—that’s how AWS WAF considers the request to be non-automated and permits access. Using a Challenge action adds a protection layer because bots and other automated tools typically can’t process the challenge as a legitimate web browser would.
A more effective mechanism against bots is to present a CAPTCHA action, in which the user must solve a puzzle. However, this action affects the user experience because it requires human interaction, and it typically involves higher costs than the Challenge option. Challenge actions, which consist of a JavaScript function that most web browsers can support and process in the background, are a great first step to monitor web requests because they don’t affect the user experience directly and are more economic than CAPTCHA.
Implementation options
In this blog post, we discuss two options for you to start handling the traffic from bots. Although the focus of this post is implementing the Challenge action through a custom rule (a rule you can create and set yourself), we’ve also included basic instructions for implementing the Challenge action through Bot Control, which allows you to directly use client application integration for more sophisticated detections.
Option 1: Implementing the Challenge action through a custom rule
The first step in setting up a custom rule with the Challenge option is to understand and define clearly what the expected normal behaviors are from users who access your app. Specifically, you need to know the expected number of requests in a given period of time from a single IP and the maximum time length of a typical session.
How do I define the normal rate of requests?
Both the maximum session length and the rate of requests expected will vary depending on each webpage or app, and this information needs to come from the business and application teams. When a user browses a page, they might trigger several requests (for example, the user will trigger a separate request for each image the page contains). You can use this information to estimate and define how many requests per IP a valid user can generate in a given time.
Additionally, you can enable web ACL logging, which will allow you to query logs from Amazon CloudWatch Logs Insights. From these logs, you can get an understanding of the current behaviors and trends in your web traffic and compare that with the expected behavior that you defined.
What parameters should I use to trigger the challenge?
Implementing challenges based on the headers in the request or the user-agent isn’t a good idea. Although you can act based on either of these fields for valid crawlers like those used by search engines, malicious bots might evolve and tamper with these fields as their creators notice they are being stopped.
Filtering by static IP won’t always work. Only valid crawlers tend to use the same IP range over time and malicious bots often change IP ranges.
Filtering by path might be a good option. If there are parts of your app that shouldn’t be indexed or crawled, you can declare that in your robots.txt file. Bots that disregard these directives can be considered suspicious, and you can present them with the challenge. However, this approach isn’t always good enough: A bot might be set to respect the directives.
A rate-limit rule is an effective option for triggering your challenge when you’re attempting to handle malicious bots. You can define the normal rate of requests that you expect valid users to make as described earlier in this section. Users that go over that rate will be presented with the challenge. You should set this rule as the top priority in order for it to be more efficient.
To create and set the rate-limit rule
Open the AWS WAF & Shield console, choose Web ACLs, and then choose the web ACL to which you will add the rule.
Figure 1: AWS WAF web ACLs
On the Web ACL page, choose the Rules tab.
In the Add rules drop-down list, choose Add my own rules and rule groups. If you already have your rate-based custom rule in place, select the checkbox to the left of the rule, and then choose Edit.
Figure 2: Add your own rules and rule groups
For Rule type, choose Rule builder. For Rule, enter a name for your rule. For Type, choose Rate-based rule.
Figure 3: Start the rule builder
Under Rate-limiting criteria, set the rate limit and define the evaluation window, which is customizable.
For Request aggregation, choose Source IP address. For Scope of inspection and rate limiting, choose Consider all requests.
Figure 4: Set the rate-limiting criteria
For Action, choose Challenge.
For Immunity time (which specifies how long a Challenge token is valid before a new one is needed), choose a value according to the maximum time a normal session could last.
When you set a challenge through custom rules and the token expires, subsequent requests will include an invalid cookie and will therefore be rejected until a new session is started. For example, if a normal session’s maximum duration is 5 minutes, you can leave immunity set to the default, but if the maximum duration can be longer (as in an online shop), then you will need to increase the immunity time according to your use case. (Note that SDK application integration, which we cover in the next section, takes care of presenting a new token if the current one expires, without impacting human users.)
Figure 5: Set the action to Challenge
Choose Add rule.
Set the rule priority by selecting the rule and moving it up in the list. Note that we’re considering a scenario where you set a web ACL for a single account. In this case, remember to place the rate-limiting rule at the top of the list, so that you prevent undesired traffic from triggering additional rules. This is even more important if you have paid rules later in the list.
Figure 6: Set the rule priority
Option 2: Implementing the Challenge action by using Bot Control
Implementing Challenge actions through the Bot Control feature in AWS WAF is an easier, more robust and flexible solution than using a custom rule. However, it has extra costs associated that you should be aware of and evaluate.
Bot Control is a managed rules group that provides improved visibility and automated detection and mitigation mechanisms for bots. You are charged differently depending on the tier of Bot Control you use (Common or Targeted). The Common tier detects a variety of self-identifying bots by using static request data analysis. The Targeted tier adds active analysis of client blueprints and behavior as well as machine learning, and is capable of detection and mitigation of more sophisticated agents. You can read more about the Bot Control protection levels in the documentation.
Some of the main features of Bot Control include the following:
The availability of specific metrics for bot categories, giving you more granularity and improved visibility.
The ability to automatically identify bots based on known patterns and behaviors, such as user-agent, path, or behavior. (For more details, see the Bot Control documentation.)
Open the WAF & Shield console, choose Web ACLs, and choose the web ACL you want Bot Control enabled on.
On the Rules tab, in the Add rules drop-down list, instead of adding your own rules, choose Add managed rule groups.
Figure 7: Add managed rule groups to your web ACL
On the Add managed rule groups page, expand the first option, AWS managed rule groups, and scroll down to find Bot Control. Then select the Add to web ACL toggle button to enable Bot Control.
Figure 8: Enable the Bot Control rule group
You will need to customize the configuration. To do so, choose Edit.
First, choose the level of inspection you want to use. Common detects a variety of self-identifying bots, but, in this example, we chose Targeted because it adds advanced detection for sophisticated bots by using machine learning and allows the challenge application integration that we mentioned earlier.
Choose the scope of inspection. You can keep the scope set to Inspect all web requests or choose to use scope-down statements if you want a more granular filtering.
Choose the action on a per-bot category basis or choose a single action for all the categories. In this example, we used the same settings for the Challenge action for all the categories.
Figure 9: Set Bot Control actions
Similar to the recommendations for Option 1 earlier in this post, we recommend that you define your use cases and how you want to handle each bot category in the Common section and each rule in the Targeted The settings need to be aligned with your business needs, with the understanding that your needs can change over time. The settings you choose might also be specific to each application—for example, in the case of search engine bots, you need to consider the impact of blocking or mitigating them on your search engine optimization (SEO) and find a balance with app performance.
Figure 10: Targeted rules
Choose Save rule and then choose Add rules.
On the Set rule priority page, set the rule priority by selecting the rule and moving it up or down in the list. Make sure you set the Bot Control managed rule group (AWS-AWSManagedRulesBotControlRuleSet) to be lower in priority than the free rules (both custom and managed). Because Bot Control rules pricing is based on the number of requests processed and the number of CAPTCHA or Challenge actions presented, putting Bot Control rules at the bottom of the list helps you to optimize your costs.
In this post, we reviewed how you can mitigate bot traffic by implementing Challenge actions. By implementing this action type through a custom rule, you can set up basic, cost-effective measures to handle basic bots and control automated traffic to your applications. As your business grows, you can achieve higher efficiency and better protection against more sophisticated bots by enabling Bot Control rules, which use machine learning for advanced detection. To learn more about these topics, see the following links.
APT29 aka Midnight Blizzard recently attempted to phish thousands of people.
Building on work by CERT-UA, Amazon recently identified internet domains abused by APT29, a group widely attributed to Russia’s Foreign Intelligence Service (SVR). In this instance, their targets were associated with government agencies, enterprises, and militaries, and the phishing campaign was apparently aimed at stealing credentials from Russian adversaries. APT29 sent the Ukrainian language phishing emails to significantly more targets than their typical, narrowly targeted approach. Some of the domain names they used tried to trick the targets into believing the domains were AWS domains (they were not), but Amazon wasn’t the target, nor was the group after AWS customer credentials. Rather, APT29 sought its targets’ Windows credentials through Microsoft Remote Desktop. Upon learning of this activity, we immediately initiated the process of seizing the domains APT29 was abusing which impersonated AWS in order to interrupt the operation. CERT-UA has issued an advisory with additional details on their work.
I’d like to thank the cyber threat intelligence teams at Amazon and CERT-UA for all their efforts to make the internet more secure.
This was originally shared on LinkedIn by Chief Information Security Officer and Amazon VP of Security Engineering CJ Moses.
If you have feedback about this post, submit comments in the Comments section below. If you have questions about this post, contact AWS Support.
AWS re:Invent 2024, a learning conference hosted by Amazon Web Services (AWS) for the global cloud computing community, will take place December 2–6, 2024, in Las Vegas, Nevada, across multiple venues. At re:Invent, you can join cloud enthusiasts from around the world to hear the latest cloud industry innovations, meet with AWS experts, and build connections. Whether you want to build deep technical expertise, understand how to prioritize your investments, learn more about the infrastructure offerings of the sovereign-by-design AWS Cloud, or see how the AWS Nitro System enables enhanced security for your workloads, re:Invent is a great opportunity to explore our digital sovereignty solutions.
This year, there will be many ways that you can learn about our advanced sovereignty controls, security features, and infrastructure options that can help meet your unique digital sovereignty needs, including sessions and hands-on activities with AWS hybrid and edge services including AWS Local Zones, AWS Dedicated Local Zones, and AWS Outposts. In the Expo, you can visit the Digital Sovereignty & Data Protection kiosk in the AWS Village to watch demos, learn about the upcoming AWS European Sovereign Cloud, and get your questions answered by AWS team members. To see AWS designed chips and Outposts devices, check out the AWS Next Gen Infrastructure Hub in the AWS Village. You can also visit the AWS Partner Network (APN) booth to connect with AWS Digital Sovereignty Partners to learn about the benefits of partner programs.
Breakout sessions and lightning talks
To add sessions to your AWS re:Invent agenda and find time and location information, choose the session title link.
SEC229 | Breakout | Digital sovereignty: overcome complexity and enable future-readiness Max Peterson, VP, Sovereign Cloud, AWS Organizations are facing increasing complexity in an evolving sovereignty landscape. Building a strong digital foundation can help simplify efforts to meet requirements today and prepare your organization for the future, without slowing innovation. Join this session to learn how AWS sovereign cloud offerings, ranging from encryption services to the announced AWS European Sovereign Cloud, provides more control and choice to help meet your unique needs. Discover how customers are keeping critical workloads secure and protected when leveraging new technologies on AWS, including generative AI, and learn about new digital sovereignty solutions offered by AWS Partners.
HYB201 | Breakout | AWS wherever you need it: From the cloud to the edge Jan Hofmeyr, VP, EC2 Networking and Hybrid Edge, AWS, and Jeff Feist, Executive Director – Hosting Solutions, Merck & Co., Inc. While most workloads can be migrated to the cloud, some remain on premises or at the edge due to low latency, local data processing, or digital sovereignty needs. In this session, learn how AWS services like AWS Outposts, AWS Local Zones, AWS Dedicated Local Zones, and AWS IoT Core support hybrid cloud and edge computing workloads such as multiplayer gaming, high-frequency trading, medical imaging, smart manufacturing, and generative AI applications with data residency requirements.
HYB309 | Breakout | Well-architected for data residency with hybrid cloud services Sherry Lin, Principal Product Manager, AWS; Lakshmi VP, Specialist SA – Hybrid Edge, AWS; and Kevin Ng, Senior Director, Core Engineering Products, GovTech With concerns over data privacy, security, and digital sovereignty, many countries across the world are strengthening data residency laws to keep personal and sensitive data within their borders. For organizations operating across multiple geographies, it can be challenging to meet the evolving data residency laws. In this session, following the AWS Well-Architected Framework, explore the best practices around data residency when using hybrid cloud services, including AWS Local Zones, AWS Dedicated Local Zones, and AWS Outposts.
IOT202 | Breakout | AWS IoT for edge LLM deployment and execution Nikit Pednekar, Principal Product Manager, AWS, and Stefano Marzani, WW Tech Leader, SDX, AWS With the advent of generative AI and large language models (LLMs), you must be wondering, how can these technologies be applied at the IoT edge? After all, there are many benefits of running LLMs at the edge—from network bandwidth efficiencies, offline processing, lower latency, and data sovereignty to cost savings, security, and differentiation. In this session, learn how using AWS IoT services and LLMs at the edge can uplift your solutions with actionable outcomes and innovative capabilities, such as gesture recognition, natural language processing for voice control, real-time predictive maintenance, energy optimization, anomaly detection, and more.
KUB310 | Breakout | Amazon EKS for edge and hybrid use cases Chris Splinter, Product Manager, AWS, and Gokul Chandra Purnachandra Reddy, Senior Solutions Architect, AWS There are some workloads that may need to run on-premises, at the edge, or in a hybrid scenario due to low-latency, data dependencies, data sovereignty, or other regulatory reasons, especially in industries such as manufacturing, healthcare, telco, and financial services. Data dependent workloads may have to wait for the data to be on AWS services before fully migrating. In this session, we will share production-ready architectures leveraging services like Amazon EKS Anywhere to run container workloads on-premises and support modernizing VMware-based workloads. Also learn best practices on migration of on-premises Kubernetes deployments to AWS Cloud.
PEX110 | Lightening Talk | Supercharge your growth and capabilities with partner programs Mike Cannady, Director, Partner Core Public Sector, AWS Discover the latest AWS Partner program updates that propel your public sector business forward. Join this lightning talk to explore innovations tailored to partners: generative AI programs, digital sovereignty, solution building, and managed services. Whether you’re starting out or seasoned, glean insights and use cases to elevate your journey. Don’t miss this opportunity to supercharge your development and stay ahead in this ever-evolving landscape.
Interactive sessions (chalk talks and workshops)
HYB304 | Workshop | Implement RAG without compromising on digital sovereignty Aditya Lolla, Senior Solutions Architect, Hybrid Edge, AWS, and Robert Belson, Senior Developer Advocate, AWS As governments and standards bodies develop data protection and privacy regulations, organizations increasingly need to combine the use of generative AI tooling in the cloud with regulated data that need to remain on premises to meet data sovereignty requirements. In this workshop, learn how to extend Agents for Amazon Bedrock to hybrid and edge services like AWS Outposts and AWS Local Zones to build distributed Retrieval Augmented Generation (RAG) applications with on-premises data for improved model outcomes. Get hands-on with Amazon Bedrock, AWS Lambda, and AWS hybrid and edge services, and build Amazon Simple Storage Service (Amazon S3) compliant workflows using a hybrid S3 compatible solution. You must bring your laptop to participate.
WPS207 | Chalk Talk | How AWS can help you meet your digital sovereignty requirements Mehmet Bakkaloglu, Principal Solutions Architect, AWS, and Addy Upreti, Principal Technical Product Manager – Digital Sovereignty, AWS Customers in the public sector and regulated industries such as healthcare, financial services and telecom have shared how they face digital sovereignty concerns in their cloud journey. In this talk, you can learn about how AWS is sovereign-by-design and the range of capabilities that can enable you to meet your digital sovereignty needs. Plus, discover how the AWS European Sovereign Cloud is being built to provide further choice to meet these needs. We’ll talk through how AWS can help accelerate your cloud journey while meeting your requirements.
HYB310 | Chalk Talk | Addressing data residency requirements with hybrid and edge services Sedji Gaouaou, Senior Solutions Architect, AWS, and Fabio Rodriguez, Head of Hybrid Cloud Solutions Architect, AWS Data residency is a critical consideration for organizations that collect and store sensitive information, including personal identifiable information (PII), financial data, healthcare data, or information pertaining to national security. To help organizations operating across multiple geographies drive innovation while meeting data residency requirements, AWS offers multiple global infrastructure offerings like AWS Regions, AWS Dedicated Local Zones, AWS Local Zones, and AWS Outposts. In this interactive chalk talk, learn how these infrastructure offerings can help you accelerate digital transformation while meeting data residency needs.
For a full view of digital sovereignty content, including sessions with partners, explore the AWS re:Invent catalog and filter on the Digital Sovereignty area of interest. Not able to attend in-person? Register for free for the virtual-only pass to livestream keynotes and innovation talks, and access on-demand breakout sessions today. See you in Las Vegas or on the livestream!
If you have feedback about this post, submit comments in the Comments section below.
Understanding risk and identifying the root cause of an issue in a timely manner is critical to businesses. Amazon Web Services (AWS) offers multiple security services that you can use together to perform more timely investigations and improve the mean time to remediate issues. In this blog post, you will learn how to integrate Amazon Detective with AWS Security Hub, giving you better visibility into threat indicators and investigative data directly from Security Hub, which provides you with a centralized view of your overall security posture across your AWS accounts.
Amazon GuardDuty is an intelligent threat detection service that continuously monitors your AWS accounts, workloads, runtime activity, and data for potential malicious activity. If suspicious activity, such as anomalous behavior or credential exfiltration, is detected, GuardDuty generates detailed security findings. When you enable GuardDuty and Security Hub in the same account within the same AWS Region, GuardDuty sends its generated findings to Security Hub.
AWS Security Hub is a cloud security posture management tool that automatically detects when your AWS accounts and resources deviate from security best practices, aggregates security alerts into a single place and format, and provides insight into your security posture across your AWS accounts.
Amazon Detective makes it easier for you to analyze, investigate, and quickly identify the root cause of potential security issues or suspicious activities. Detective supports the ability to automatically investigate AWS Identity and Access Management (IAM) users and roles for indicators of compromise (IoC). This capability helps security analysts determine whether IAM users and IAM roles have potentially been compromised or involved in any known tactics, techniques, and procedures (TTPs) from the MITRE ATT&CK framework. In this post, we show you an example of how to programmatically use the Detective Investigation API to help investigate potential security issues.
The example architecture we provide in this post performs enrichment automatically for CRITICAL, HIGH, and MEDIUM severity findings and gives you the flexibility to initiate additional investigations and enrichment on-demand. You then have the option to review those enriched findings directly in the Security Hub console, or you can enable an integration to review the enriched findings in the AWS service or AWS Partner Network (APN) solution of your choice. This post gives an overview of what you need to do to build the example architecture, but if you prefer step-by-step instructions, check out the workshop version of the instructions.
This integration and finding enrichment is made possible through the use of the Detective Investigation API. You must have GuardDuty, Detective, and Security Hub enabled for this to work. We recommend that you build this architecture in the account you are using as a delegated admin for GuardDuty, Detective, and Security Hub, and in the Region where Security Hub aggregates findings (if finding aggregation is configured).
Solution architecture
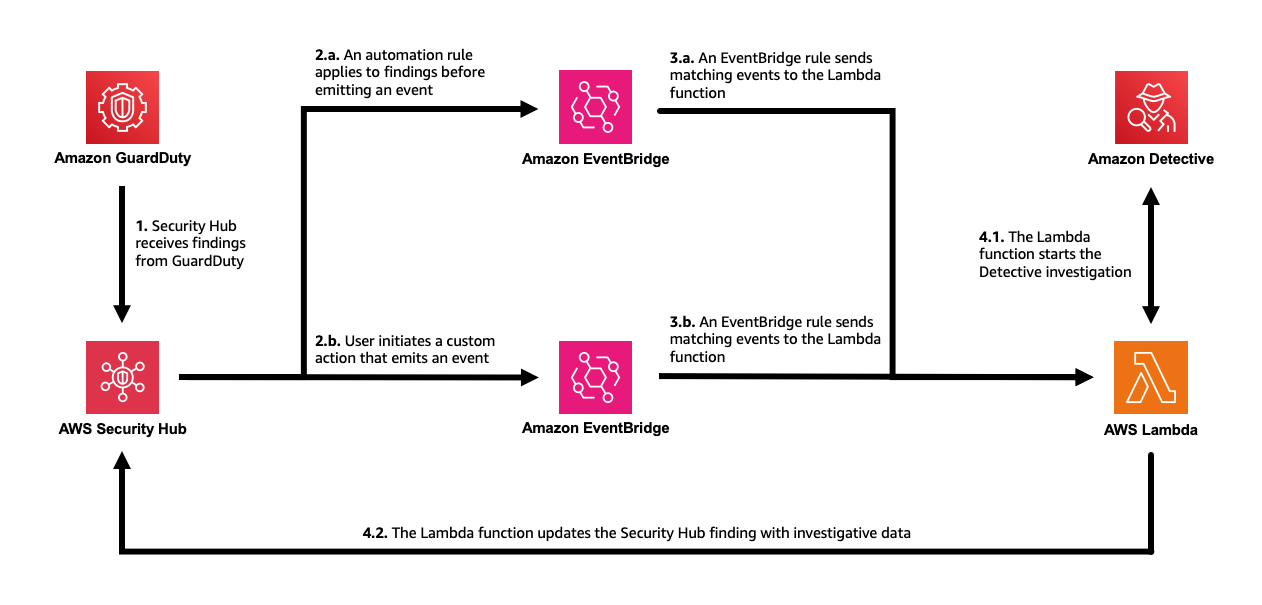
Security Hub automatically ingests findings from GuardDuty. You can integrate Security Hub with Detective using EventBridge rules and a Lambda function. To make the solution more manageable and customizable, you can configure a Security Hub custom action and a Security Hub automation rule. The custom action is used to identify findings you want to manually select for investigation. The automation rule is configured to identify and flag findings you want to automatically initiate investigations for. EventBridge rules (two of them) are used to initiate the Lambda function for each finding you want to investigate and enrich. The Lambda function processes the finding it receives, makes API calls to Detective, and then makes an API call back to Security Hub to update and enrich the finding. The Lambda function is invoked one time for each finding. Figure 1 illustrates this solution.
Figure 1: The solution architecture, including GuardDuty, Security Hub, EventBridge, Lambda, and Detective
The workflow is as follows:
Security Hub automatically ingests the findings from GuardDuty. As Security Hub ingests the findings, it applies one or more enabled automation rules to modify the findings. You can use rules to add a user-defined field to mark which findings you want automatically processed, such as those of CRITICAL, HIGH, and MEDIUM severity.
Security Hub emits an event for each new and updated imported finding after applying the automation rules that are enabled. The event that is emitted includes one finding (after automation rules are applied). B. Security Hub emits an event for each execution of a custom action. The event emitted includes the findings that are selected when the custom action is initiated.
An EventBridge rule evaluates tevents that match Security Hub Findings – Imported and sends the events to a target Lambda function for processing. You can further adjust the event pattern to only send findings that contain a user-defined field. B. A second EventBridge rule evaluates events that match Security Hub Findings – Custom Action (the specific custom action) and sends the events to the same target Lambda function for processing.
The target Lambda function processes the finding in the event, makes API calls to Detective to start an investigation for the related IAM user or IAM role (if there is one) and fetches the results. It then makes an API call to Security Hub to update the finding. The function adds a note with a summary of the investigation, a link to the full investigation result, and a user-defined field that can be used to filter for findings that have been investigated.
In the following sections of this post, we provide more detail on the architecture components and setup. As a prerequisite, you must have GuardDuty, Detective, and Security Hub enabled.
Perform investigations with Detective using Lambda
You can start investigations in Detective and retrieve the results through the API. AWS Lambda supports several programming languages, but you will use JavaScript (Node.js 20.x) in this example. To start an investigation, supply the Amazon Resource Name (ARN) of an IAM role or user, the start time, the end time, and the ARN of the Detective behavior graph. The Detective API will fetch the results of the investigation, including IoCs, TTPs, and a categorical severity score. The severity score returned is computed using two dimensions, confidence and impact, where the confidence represents the likelihood that the events are anomalous and not normal user behavior, while the impact quantifies harm that could occur from the events as a measure of the TTPs’ effect.
You can use the example Lambda function in code sample 1 as the target of the EventBridge rule in the architecture previously described. The function takes the ARN from a GuardDuty security finding that was aggregated by Security Hub and calls the Investigation API. When the result is returned, the function formats the data into the AWS Security Finding Format (ASFF) used by Security Hub and calls the BatchUpdateFindings API to send the enriched, updated finding back to Security Hub. Make sure to read and review the function so you understand in detail how it works.
Code sample 1: Example JavaScript Lambda function using Node.js 20.x
"use strict";
import {
  DetectiveClient,
  GetInvestigationCommand,
  ListGraphsCommand,
  StartInvestigationCommand,
} from "@aws-sdk/client-detective";
import { BatchUpdateFindingsCommand, SecurityHubClient } from "@aws-sdk/client-securityhub";

const SHClient = new SecurityHubClient();
const detectiveClient = new DetectiveClient();

export const handler = async (event) => {
  try {
    // Handle only one (the first) finding per function call
    const finding = event.detail.findings[0];

    if (finding.ProductName != "GuardDuty") {
      // Handle only GuardDuty findings
      throw new Error("This is not a GuardDuty finding!");
    }

    const listgraphs = new ListGraphsCommand({});
    const graphs = await detectiveClient.send(listgraphs);
    const graphArn = graphs.GraphList[0].Arn;

    const IAMResourceARNs = finding.Resources.filter((resource) => {
      return (
        resource.Type == "AwsIamAccessKey" ||
        resource.Type == "AwsIamRole" ||
        resource.Type == "AwsIamUser"
      );
    }).map((resource) => {
      if (resource.Type == "AwsIamRole" || resource.Type == "AwsIamUser") {
        return {
          arn: resource.Id,
          type: resource.Type == "AwsIamRole" ? "role" : "user",
        };
      } else if (resource.Type == "AwsIamAccessKey") {
        return {
          arn: `arn:aws:iam::${finding.AwsAccountId}:role/${resource.Details.AwsIamAccessKey.PrincipalName}`,
          type: "role",
        };
      }
    });

    if (IAMResourceARNs.length == 0) {
      throw new Error("No IAM resource!");
    }

    // Investigate the first IAM role or user identified in the finding
    const investigationTarget = IAMResourceARNs[0].arn;
    const investigationTargetType = IAMResourceARNs[0].type;

    const investigationEndTime = new Date(Date.now());

    let investigationStartTime;
    if (finding.FirstObservedAt) {
      investigationStartTime = new Date(finding.FirstObservedAt);
    } else if (finding.CreatedAt) {
      investigationStartTime = new Date(finding.CreatedAt);
    } else if (finding.ProcessedAt) {
      investigationStartTime = new Date(finding.ProcessedAt);
    } else {
      throw new Error("Investigation start time invalid!");
    }
    investigationStartTime.setHours(investigationStartTime.getHours() - 24);

    const totalInvestigationTime = Math.round(
      (investigationEndTime.getTime() - investigationStartTime.getTime()) / (1000 * 60 * 60),
    ); // Hours

    const startInvestigationRequest = {
      GraphArn: graphArn,
      EntityArn: investigationTarget,
      ScopeStartTime: investigationStartTime,
      ScopeEndTime: investigationEndTime,
    };

    const startinvestigation = new StartInvestigationCommand(startInvestigationRequest);
    const investigation = await detectiveClient.send(startinvestigation);
    const investigationId = investigation.InvestigationId;

    const getInvestigationRequest = {
      GraphArn: graphArn,
      InvestigationId: investigationId,
    };

    let investigationResult = { Status: "RUNNING" };
    while (investigationResult.Status == "RUNNING") {
      await new Promise((r) => setTimeout(r, 30000));
      const getinvestigation = new GetInvestigationCommand(getInvestigationRequest);
      investigationResult = await detectiveClient.send(getinvestigation);
      if (investigationResult.Status == "FAILED") {
        throw new Error("Investigation failed!");
      }
    }

    let investigationSummary = "";
    switch (investigationResult.Severity) {
      case "INFORMATIONAL":
      case "LOW":
        investigationSummary += `We did not observe uncommon behavior for the associated ${investigationTargetType} during the ${totalInvestigationTime} hour investigation window.`;
        break;
      case "MEDIUM":
        investigationSummary += `We observed anomalous behavior for the associated ${investigationTargetType} during the ${totalInvestigationTime} hour investigation window which might be indicative of compromise.`;
        break;
      case "HIGH":
      case "CRITICAL":
        investigationSummary += `We observed anomalous behavior for the associated ${investigationTargetType} during the ${totalInvestigationTime} hour investigation window indicating potential compromise.`;
        break;
      default:
        throw new Error("Severity information not found!");
    }

    investigationSummary += " For more information, visit ";
    investigationSummary += `https://${process.env.AWS_REGION}.console.aws.amazon.com/detective/home?region=${process.env.AWS_REGION}#investigationReport/${investigationResult.InvestigationId}`;

    const findingUpdateInput = {
      FindingIdentifiers: [
        {
          Id: finding.Id,
          ProductArn: finding.ProductArn,
        },
      ],
      Note: {
        Text: investigationSummary.substring(0, 512),
        UpdatedBy: "Detective Investigation Lambda function.",
      },
      UserDefinedFields: {
        investigate: "complete",
      },
    };

    const batchUpdateCommand = new BatchUpdateFindingsCommand(findingUpdateInput);
    const updatedFinding = await SHClient.send(batchUpdateCommand);

    return updatedFinding;
  } catch (error) {
    console.error("Error:", error);
    throw error;
  }
};
For this function to work as desired, you need to change the permissions and the timeout of the Lambda function. The permissions must include the necessary actions you are taking with Detective and Security Hub in the function. Attach the policy shown in code example 2 to the role used by the function. Then set the timeout of the function to 15 minutes to allow Detective to complete the investigation. Note that you can change “Resource”:”*” to restrict permissions as needed.
Code example 2: Permissions required by the Lambda function
Initiate automated investigations and finding enrichment
Now that you’ve set up the Lambda function, you’re ready to set up the two methods of initiating the investigations. The first approach involves automatically investigating and enriching CRITICAL, HIGH, and MEDIUM severity GuardDuty findings. This can accelerate investigations for the highest severity findings because you don’t need to go into Security Hub or Detective and manually select the findings for investigation.
In this approach, the investigation Lambda function you previously created is automatically invoked by using Security Hub automations and an EventBridge rule. Using Security Hub automations allows you to configure and update which findings get automatically investigated and enriched without ongoing code changes. (Automation rules use a UI with dropdown options for criteria.)
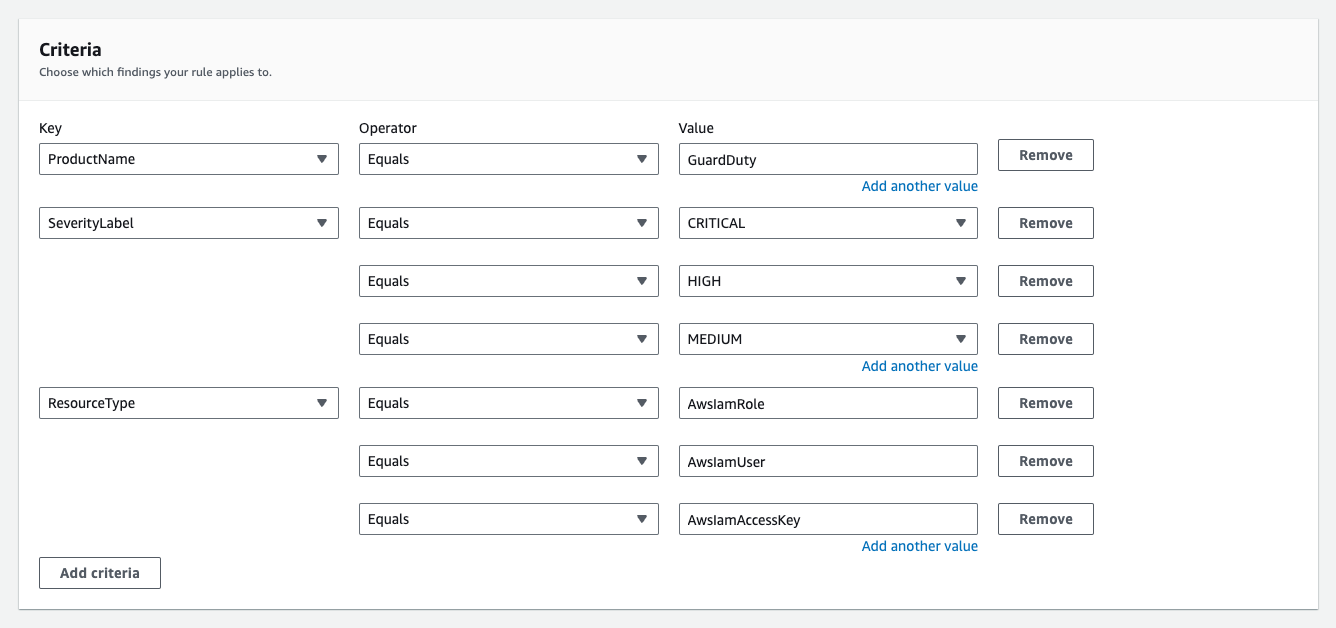
Set up an automation rule from the Automations page in Security Hub. Use these criteria for the rule:
ProductName equals GuardDuty
SeverityLabel equals CRITICAL, HIGH, or MEDIUM
ResourceType equals AwsIamUser or AwsIamRole (shown in Figure 2)
In the future, if you want to modify which findings are automatically investigated, you can revisit the rule and select new criteria to specify which findings receive the user-defined field.
Figure 2: Example criteria for automation rule in Security Hub
For the automated actions for the rule, add a user-defined field as follows:
Key: investigate, Value: true (shown in Figure 3)
Figure 3: Define the user-defined field for the automation rule in Security Hub
Next, set an EventBridge rule to determine which Security Hub Findings – Imported events are investigated based on the user-defined field, investigate. Each Security Hub Findings – Imported event contains a single finding. Use the JSON pattern shown in Code example 3 to match findings in the rule. You need to set the target of this rule to the Lambda function you set up earlier.
Code example 3: The pattern used in your EventBridge rule
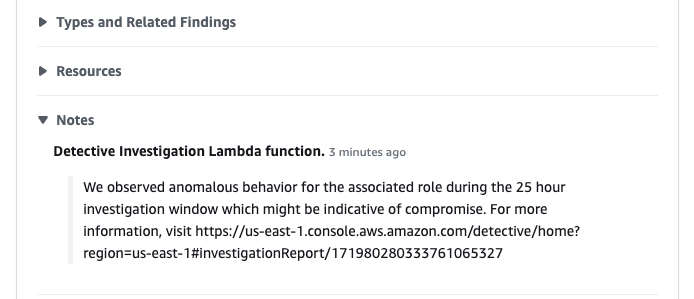
As new findings are aggregated in Security Hub, they are evaluated and updated by the automation rule. Findings that receive the user-defined field will initiate the Lambda function. After the Lambda function is initiated, it might take a couple of minutes for the execution to complete and appear in Security Hub. When it does, you will notice a new Notes field, as shown in Figure 4, and additional data in the finding JSON.
Figure 4: See that the enriched finding now includes a Notes section
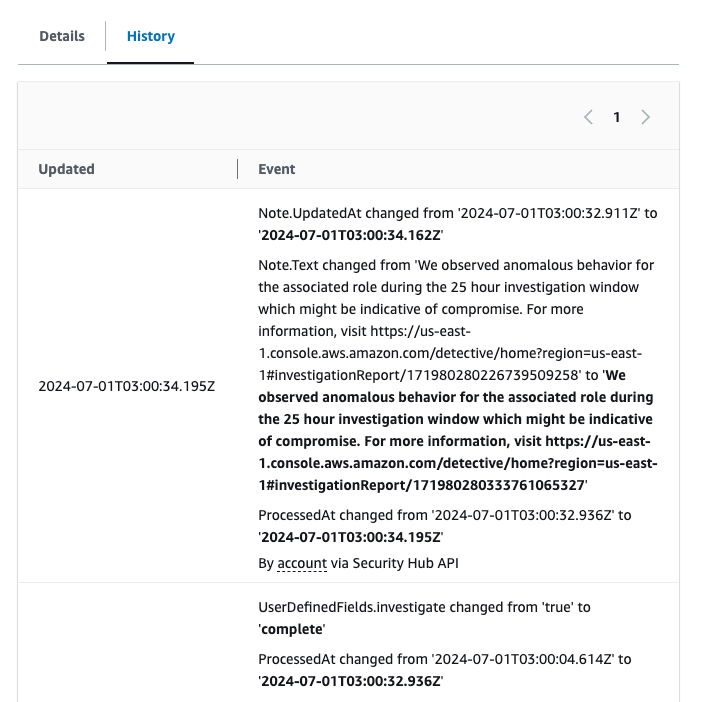
You can also see what updates were made to the finding on the History tab of the finding, as shown in Figure 5.
Figure 5: See the fields that were updated for the finding under the History tab
If you want to modify which findings start this flow, you can modify the automation rule in the Security Hub console. For example, you might also want to investigate findings from other services or with other severity labels. Keep in mind that Detective only supports IAM users and IAM roles.
You might want to add additional criteria to help prevent repeat investigations on the same findings. For example, you might not want to have the investigation flow initiated every time a finding receives an update. To help prevent this behavior, you can add criteria to the automation rule where the user-defined field, investigate, does not equal complete.
On-demand finding investigation and enrichment
The second approach involves investigating and enriching findings on-demand. You might want to use both approaches in case there are findings that don’t meet the criteria of your earlier automation that you still want to investigate.
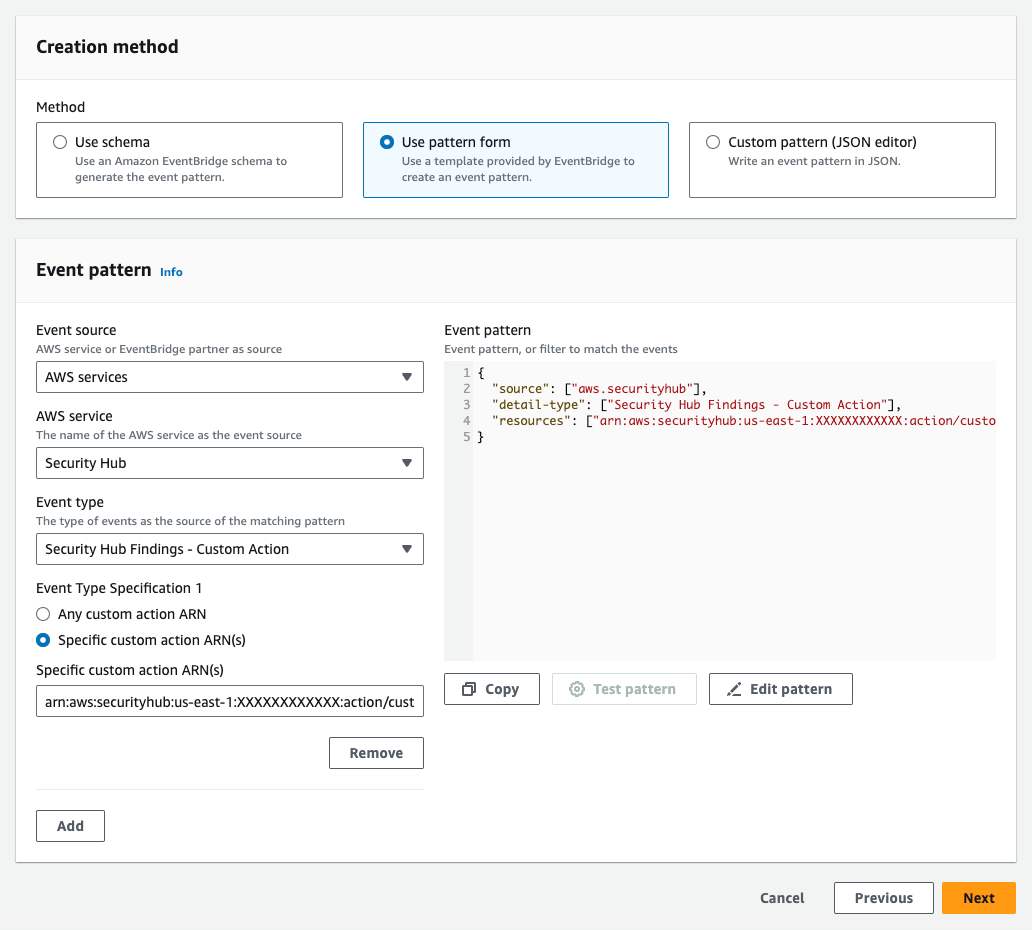
In this approach, initiate the Lambda function through the use of a feature in Security Hub called custom actions. To use a Security Hub custom action to send findings to EventBridge, you first create the custom action in Security Hub. Name it Investigate. Then, define a rule in EventBridge that applies to your custom action (using the ARN of the custom action) and that uses the same Lambda function as the target to orchestrate the automation. The pattern of your EventBridge rule will be similar to the one shown in Figure 6, but uses the ARN of the custom action you create in Security Hub.
Figure 6: The EventBridge rule for the second approach
After you set up the custom action and the EventBridge rule, you can select a finding and choose Investigate from the Actions dropdown list to initiate the processing, as shown in Figure 7.
Figure 7: Initiate the on-demand finding enrichment
Because both approaches to initiating the investigation use the same Lambda function, the resulting enriched finding in Security Hub will be the same.
Limitations and further customization
We encourage you to try, test, and customize the architecture and example code. To simplify the example, there are some limitations coded in the Lambda function. For example, the Lambda function processes only the first finding it receives (per execution) and proceeds only if the finding originates from GuardDuty. The function also only begins an investigation into the first IAM user or IAM role it identifies that is associated with the finding. If you have a use case requiring that the Lambda function handle multiple findings at a time, findings from other services, or other problems, you will need to make code or architectural changes to accommodate those requirements (such as incorporating the use of AWS Step Functions or Amazon Simple Queue Service (Amazon SQS)), and perform the relevant testing.
Amazon Web Services (AWS) is excited to announce that 170 AWS services have achieved HITRUST certification for the 2024 assessment cycle, including the following 12 services that were certified for the first time:
The full list of AWS services, which a third-party assessor audited and certified under the HITRUST CSF, is now available on our Services in Scope by Compliance Program page. Customers can view and download our 2024 HITRUST certification on demand through AWS Artifact.
AWS HITRUST certification is available for customer inheritance
As an added benefit to our customers, organizations no longer have to assess inherited controls for their HITRUST validated assessment because AWS already has. You can deploy business solutions to the AWS Cloud and inherit our HITRUST certification, provided that you use only in-scope services and properly apply the controls detailed on the HITRUST website according to the AWS Shared Responsibility Model.
Our HITRUST certification is based on the version 11.2 control framework, so you can inherit the latest controls and related scoring, knowing that AWS has attested to the latest framework standards available. Leading organizations in a variety of industries have adopted HITRUST CSF as part of their approach to security and privacy. For more information, see the HITRUST website.
As always, we value your feedback and questions and are committed to helping you achieve and maintain the highest standard of security and compliance. Feel free to contact the team through AWS Compliance Support. If you have feedback about this post, submit comments in the Comments section below.
Welcome to the second post in our series on Security Guardians, a mechanism to distribute security ownership at Amazon Web Services (AWS) that trains, develops, and empowers builder teams to make security decisions about the software that they create. In the previous post, you learned the importance of building a culture of security ownership to scale security within your organization, and how AWS achieves this using the Security Guardians program. Since then, many customers have asked how they can build their own, similar program.
In this post, you will learn the steps to build your own Security Guardians program for your organization, including how to:
Set the vision, mission, and goals of your program
Identify developer teams that can pilot your new program
Define the expected behaviors for those teams
Develop training and create opportunities for career development to keep your teams engaged in the program
The guidance in this post is based on what we learned at AWS. Because every organization is different, the final version of the program you build is likely to look different from the one at AWS. Your program needs to reflect the current state of your organization’s culture of security and be designed to cultivate the security-related behaviors that are most important to your organization.
Security Guardians program mechanism
As discussed in the previous post, mechanisms form a key part of our business at AWS. Figure 1 demonstrates how a mechanism is a complete process, or virtuous cycle, that reinforces and improves itself as it operates. It takes controllable inputs and transforms them into ongoing outputs to address a recurring business challenge. In this case, the business challenge AWS faced was that security findings were being identified late in the development lifecycle, making it more expensive—in terms of time, money and effort—to remediate them. This led to bottlenecks in our security review process. The culture of security at AWS, specifically our culture of ownership, provides support to solve this challenge, but we needed the Security Guardians mechanism to actually do it.
Figure 1: AWS mechanism cycle
With most mechanisms, driving adoption is difficult, especially when the mechanism requires human participation to succeed. This is also true in the case of Security Guardians, and you can use our experience to help you avoid some of the challenges and growing pains of driving adoption.
Getting everyone aligned
“If I had an hour to solve a problem and my life depended on the solution, I would spend the first 55 minutes determining the proper question to ask, for once I know the proper question, I could solve the problem in less than five minutes.” – Albert Einstein
Getting alignment for the need to distribute security expertise starts with deeply understanding what problems need to be addressed. For example:
Is product delivery velocity being negatively impacted by delays in the security review process?
What business goal or metric are these delays negatively impacting?
Where in the security review process are those delays occurring?
What factors are contributing to those delays?
Is it a lack of time, people, or skills?
Thoroughly understanding the specific problems and their root causes, as identified by answering those questions, allows you to evaluate whether distributing security ownership is the appropriate solution. This in turn makes it easier to gain alignment and buy-in across the organization for the chosen approach.
A component of a culture of security
Building a strong culture of security requires support from executive leadership to set the direction for the rest of the organization. Executive support makes it easier for product leaders to secure the resources and finances needed for a Security Guardians program to be successful. To align with your organization’s leaders, you can reflect on the goals of your leaders and how the Security Guardians program can be built to meet those goals.
For example, if your business goal is to ship products 25 percent faster, understand how a particular resourcing effort from Security Guardians is going to help your organization meet that goal. AWS benefited from the program with a 26.9 percent reduction in the time to review a new service or feature when a Security Guardian was involved.
Our experience is that it’s challenging to establish a Security Guardians program without executive support. If you’re struggling to identify a business leader to sponsor the program and provide insight on the business problem, your AWS account team—including your account manager or solutions architect—can help. If you’re a business leader or executive reading this post, consider becoming that sponsor yourself.
One step at a time
A step-by-step approach to implementing the Security Guardians program helps overcome organizational challenges and avoid common pitfalls that could lead to failure. These steps, shown in Figure 2, are:
Set the vision
Choose innovators
Define behaviors
Maintain interest
Measure success
These steps support the activities that make a mechanism successful: adoption, inspection, and tools.
Figure 2: Steps for implementing a Security Guardians program
Set the vision
Now that you’ve identified the business problem or business goal, set the vision for the Security Guardians program by working backwards from this problem or goal to define the purpose of your program. For example, the vision of the AWS Security Guardians is “To nourish security ownership that consistently delights our customers with security-by-design throughout the development lifecycle.”
Craft an ambitious vision for your Security Guardians program. Think beyond easy wins and focus on bold, forward-thinking security outcomes for your organization. Make sure that each element of your vision aligns with a business problem or goal. The following table is an example of how the vision of the program is aligned with business goals:
Business goals
Security outcome
Long-term goals
Develop products faster and more efficiently.
To improve developer agility while reducing security risk.
Increase the number of threat models performed by Security Guardians (instead of by application security engineers). Over time, this goal could change to “increase the quality of threat models.”.
Decrease the average monthly security issue rate.
Train three new Security Guardians each quarter.
Reduce long-term security spend.
To identify and mitigate security risk as early as possible.
Increase customer trust.
To exceed customer security expectations by raising the security bar.
The next step is to define a clear mission that is supported with measurable goals. The mission and goals must be achievable and help to move the needle towards the long-term vision.
The final part is to name your program. We chose Security Guardians, like Marvel’s Guardians of the Galaxy. We’ve also heard customers using Security Champions, Security Advocates, Security Innovators, and Security Drivers. Have fun with it and make sure the name resonates with as many participants as possible.
After you’ve defined the vision, future state, mission, measurable goals, and name of the program, review them with your security and business leaders. It’s beneficial to include your innovators or Security Guardians who will be early adopters of the program in this review. In the next section, you’ll learn how to identify these innovators.
Choosing innovators
Just as you develop for and iterate with early adopters of the products you’re building, you should identify individuals and teams who will pilot the program with you. Before the AWS Security Guardians program, our application security engineering teams built relationships with product teams through security reviews.
This meant that they already knew which individuals within those product teams had an interest in security. This is where AWS started, but the success of your program isn’t dependent on whether you already know who these individuals are. Development teams will self-identify and nominate Security Guardians from their own teams. Figure 4 shows examples to help you get started understanding which development teams will be good early adopters for your program.
Figure 3: Example product teams for early program adopters
The examples in Figure 3 include:
Candidate A: Quick wins team
Early adopters typically share key traits, including existing security measures and a designated security role or team members with security expertise. Essentially, they already prioritize security at the team level.
Candidate B: High impact team
This is the team most impacted by the disparity between product development teams and security teams; the agility and time-related benefits of the Security Guardians program will be the highest for this team. For example, this team might be facing long delays in launching products because of the current security review process at your organization.
Candidate C: High risk team
This team owns a product that has a high security risk because of the nature of the product. This team will benefit the most from additional security scrutiny and from raising the security bar at your organization. For example, this team might be building a product that’s considered a critical asset, hosts sensitive data, or performs critical processes.
After you’ve identified one or more teams that could be good early adopters of the program, you need to identify at least one individual from each team to serve as the Security Guardian. Keep the vision and goals of your program in mind when selecting your Security Guardian. Your early Security Guardians should have at least the following characteristics:
Ability to exercise well-informed and decisive judgement
Maintain and showcase their knowledge
Not afraid to have their work be independently validated
Advocate for their security needs in internal discussions
Hold a high security bar
Thoughtful and assertive to make customer security a top priority on their team
In terms of time commitment, our experience is that each Security Guardian spends an average of 3.5 hours each month on activities such as answering general security questions, identifying security stories needed for sprints, diving deep into security related tasks and supporting security related tasks. Each application security review takes approximately 4 hours of effort.
The first post of this series contains even more details on the characteristics that make a good Security Guardian.
Defining behaviors
It’s important to set expectations on what behaviors you want Security Guardians, developers, and security teams to exhibit within the context of the program. These behaviors typically relate directly to the goals of the program. For example, if one of the goals is to increase the number of threat models created, then create threat modeling will be one of the defined behaviors. The behaviors need to be measurable with some flexibility for change as you improve the program.
At AWS, our Security Guardians have access to a runbook that lists the activities each Guardian should take when engaged as part of a review. With each of these activities understood, the program team will then make sure appropriate training is provided so that the Security Guardians are able to complete each of the activities. For example, AWS Security Guardians are asked to help develop threat models. To support this, the program team has developed and released training material to teach Security Guardians how to create a threat model.
With the defined behaviors, understand how the Security Guardian and product development team will engage with the security team. Although we’re clearly defining behaviors, the behaviors aren’t typically done in a silo for the successful launch of a secure product. At AWS, the Security Guardians and product developers engage with the security teams in key partnership areas. If you’re unsure of where to start in defining the behaviors of your program, Figure 4 shows an example of how teams interact at AWS, beginning with the creation of an initial threat model and going through review, remediation, and testing. Consider creating your own version of the model to help define the behaviors and key partnership areas at your organization.
Figure 4: Example behaviors and partnership areas at AWS
In the example of a threat model review, the Guardian and the central security team will jointly create and review the threat model. Specific activity examples include reviewing threats that have no documented mitigations and discussing additional threats that haven’t yet been considered.
As part of encouraging a culture of ownership, AWS recommends allowing Security Guardians to influence the role within a set of boundaries. An example of this is allowing the Security Guardians to be a part of recurring reviews of the program growth metrics, actively collecting their feedback, and encouraging them to host their own training sessions. Active Security Guardians are key to the success of the program and allowing them to influence the program will give them a sense of ownership and inclusion.
Maintaining interest
It’s important to not lose sight that a program like the AWS Security Guardians program is supported by volunteers. Most of your Security Guardians will be product developers who already have a full-time job developing products for your organization. The time and effort to find and onboard new Security Guardians will have a low return on investment if they stop engaging because the program owners didn’t keep them engaged. Keeping Security Guardians is just as important as finding them.
At AWS, we invest time to understand how to build trust with Security Guardians and provide value by working backwards from their wants and needs. Some Security Guardians joined the program to learn new skills and for career growth opportunities. AWS built training programs that were designed for Security Guardians and provide metrics that are used to document their impact to their managers and leaders.
AWS Security Guardians constantly tell us that they value recognition of their contributions by leadership. We work to build mechanisms to continuously surface the great work of our Security Guardians. We also recognize the contributions Security Guardians make through awards, gifts, and other incentives. For example, each quarter, the AWS Security Guardians team sends out a newsletter to senior leaders of the organization. This communication identifies the Guardians within their organization and highlights their contributions, including the number and impact of reviews they’ve completed.
Another way that AWS recognizes the contributions of our Security Guardians is through the Guardians Belt Program. The Guardians Belt Program is designed to recognize Security Guardians for their contributions and support them as they work to advance their security skills and expand their scope of impact. Security Guardians earn Black, Green, Yellow, and White belts with each belt corresponding to significant accomplishments that require consistent commitment to raising the security bar.
To make sure that Security Guardians value the program, your organization should provide and actively facilitate benefits. The benefits must be accessible without requiring additional time or effort from the Security Guardians, promoting immediate and direct gains. Consider the following examples of benefits to maintain Security Guardian interest and support:
Specialized training: Workshops, game days, challenges and contests.
Impact opportunities: Ability to impact multiple products by working with other teams in the organization, ability to help define patterns, best practices, and automation for the program.
Community: Collaborate, connect, share and learn from experts and individuals with similar interests.
Ownership opportunities: Ability to accelerate certain steps in the process.
Leadership opportunities: Active involvement in recurring program or business reviews.
The best ways to maintain interest are determined by the culture of your organization. What does your organization value the most, and how will the program provide that to your Security Guardians? Sometimes, the best way to answer these questions is to ask your early or potential Security Guardians.
Measuring success
The final step of building a successful Security Guardians program is to measure program success. Measuring success is equivalent to the inspection step from Figure 1. This verifies that your desired outcomes are being achieved and provides a jumping off point for iteration. Measuring success also gives you the opportunity to audit the output or results of the Security Guardians program and perform corrections and improvements.
Earlier in this post, we covered identifying the business problem and creating the vision and measurable goals for your Security Guardians program. Example metrics include:
Average time to release features
Average number of security issues per team
Average time spent by Security Guardians and builders doing security work
Percentage of Security Guardians who have taken required and non-required training
Measuring success includes steps to collect feedback and tune the program over time, shown in Figure 5.
Figure 5: Feedback and tuning steps for Security Guardians program.
The cycle to gather feedback and tune the program includes:
Report on metrics
Communicate wins
Measure outcome and cycle time
Identify trends
Review goals
Gathering feedback from Security Guardians is as important as providing feedback to them. One of the ways AWS collects feedback from Security Guardians is through an annual survey that collects feedback on their experiences of program and tooling. To help both builders and Security Guardians improve over time, our security review tooling captures feedback from security engineers on the inputs from Security Guardians. Combined, the data gathered through these surveys helps our security ownership mechanism reinforce and improve itself over time.
Figure 6 summarizes the steps that you can take to develop your program.
Figure 6: Security Guardians program steps
The broad steps to develop a program include:
Set the vision: Set your vision for the program and metrics for success. Get sponsorship from leadership. Choose a name for your program.
Choose innovators: Identify innovators who have a passion for security and foster a community with continuous knowledge sharing.
Define behaviors: Redefine your RACI (responsible, accountable, consulted, informed) and be clear on expectations from your security advocates.
Maintain interest: Provide clear training and learning paths and opportunities for career advancement.
Measure success: Gather feedback and measure the program’s effectiveness.
Conclusion
This post and the previous post covered numerous concepts, considerations, and ideas, including:
The initial intention of the Security Guardians program is to focus on training developers in product teams. This improves early security-focused design thinking.
An alternative approach is to embed or align security engineers directly with product development teams. This can be more effective in organizations where reporting structures and accountability are key considerations.
Some organizations draw Security Guardians from all job types. The program can also be used to focus on uplifting developers and broad security culture.
You must regularly inspect the outcomes delivered by the Security Guardians program and use the information to make incremental improvements as the program matures.
For additional support building a Security Guardians program, contact your AWS account representative and they will get you in touch with a specialist who can help you develop your program.
If you have feedback about this post, submit comments in the Comments section below. If you have questions about this post, contact AWS Support.
Multiple popular browsers have announced that they will no longer trust public certificates issued by Entrust later this year. Certificates that are issued by Entrust on dates up to and including October 31, 2024 will continue to be trusted until they expire, according to current information from browser makers. Certificates issued by Entrust after that date will not be trusted.
If you’ve imported Entrust certificates into AWS Certificate Manager (ACM) for use with integrated services such as Amazon CloudFront or Elastic Load Balancing, consider reissuing these certificates through Entrust before October 31, 2024, and re-importing them. This will provide you with a longer timeline to evaluate your alternatives. In this blog post, we discuss how you can determine whether certificates you imported to ACM will be affected, and suggest potential alternatives, including public certificates issued by Amazon Trust Services.
How to tell if you’ve imported Entrust certificates to ACM
If you’re unsure whether you’ve imported certificates to ACM, there are a few different ways to verify. You can use the ACM console to view your certificates for that AWS account. Certificates that are imported to ACM have the type Imported, as shown in Figure 1.
Figure 1: Viewing certificates in AWS Certificate Manager
You can also list the certificates in your AWS account by using the AWS CLI or APIs. You can use the list-certificates command with the AWS CLI:
aws acm list-certificates
You can then filter the response to only show the certificate ARN of certificates that are imported into ACM by using the following command:
After you’ve identified the ARNs of imported certificates, you can use the describe-certificate CLI command to get more information about each of the imported certificates. One of the returned fields is Issuer—this field indicates who originally issued the certificate in question. See the following example command and output, where in this case the issuer is Amazon:
You can use one of these methods to determine whether you’ve imported certificates to ACM, and use the Issuer field of the DescribeCertificate response to check whether any of your imported certificates were issued by Entrust and will be affected by the coming changes in popular browsers.
Lastly, you can also use this sample code from our GitHub repository to discover imported certificates that were issued by a certain CA or issuer. The project evaluates the ACM certificates for a given AWS account, flagging certificates with an Issuer value that matches against a specific, customizable list of CAs. This can be run as a Python script, an AWS Configquery, or a custom rule in AWS Config.
Consider replacing Entrust certificates with public certificates issued through ACM
If you’re using Extended Validation (EV) or Organization Validation (OV) certificates, we recommend that you use Domain Validated (DV) certificates from ACM instead. Popular browsers do not differentiate between EV/OV and DV certificates when indicating whether a site is trusted. Additionally, EV/OV certificate issuance and renewals cannot be automated and require manual effort, unlike DV certificates.
Evaluate use of private certificates for internal-facing use cases
We also recommend that you re-evaluate your use of certificates to reconsider whether you need private or public certificates for your use cases. For internal-facing workloads, you should consider using private certificates. This will allow you to control the certificate parameters, such as the certificate type or the validity period, to align with your specific TLS requirements. For example, ACM issued public certificates are valid for 395 days, but you might have use cases in which certificates with a longer validity period make more sense, and in such cases you can issue private certificates from AWS Private Certificate Authority (AWS Private CA).
Conclusion
In summary, if you are importing Entrust-issued certificates to ACM, evaluate whether you need public or private certificates, especially for internal-facing workloads—for which private certificates are typically better suited. For public certificates, take this opportunity to re-evaluate your usage of EV and OV certificates, and whether they could be replaced with DV certificates. If you want to use public certificates with services such as Amazon CloudFront, Elastic Load Balancing, or Amazon API Gateway, issue the certificates directly from ACM. Lastly, if you need more time to evaluate your options before making a decision, consider re-issuing and re-importing your certificates from Entrust before October 31, 2024. Popular browsers stated their intention to trust certificates issued by Entrust prior to October 31, 2024 until these certificates expire, giving you until the next certificate renewal to make an informed decision. You can learn more about ACM by reviewing the AWS documentation, and get started issuing certificates from ACM in the AWS Management Console.
If you have feedback about this post, submit comments in the Comments section below. If you have questions about this post, contact AWS Support.
During a recent visit to the Defense Advanced Research Projects Agency (DARPA), I mentioned a trend that piqued their interest: Over the last 10 years of applying automated reasoning at Amazon Web Services (AWS), we’ve found that formally verified code is often more performant than the unverified code it replaces.
The reason is that the bug fixes we make during the process of formal verification often positively impact the code’s runtime. Automated reasoning also gives our builders confidence to explore additional optimizations that improve system performance even further. We’ve found that formally verified code is easier to update, modify, and operate, leading to fewer late-night log analysis and debugging sessions. In this post, I’ll share three examples that came up during my discussions with DARPA.
Automated reasoning: The basics
At AWS, we strive to build services that are simple and intuitive for our customers. Underneath that simplicity lie vast, complex distributed systems that process billions of requests every second. Verifying the correctness of these complex systems is a significant challenge. Our production services are in a constant state of evolution as we introduce new features, redesign components, enhance security, and optimize performance. Many of these changes are complex themselves, and must be made without impacting the security or resilience of AWS or our customers.
Design reviews, code audits, stress testing, and fault injection are all invaluable tools we use regularly, and always will. However, we’ve found that we need to supplement these techniques in order to confirm correctness in many cases. Subtle bugs can still escape detection, particularly in large-scale, fault-tolerant architectures. And some issues might even be rooted in the original system design, rather than implementation flaws. As our services have grown in scale and complexity, we’ve had to supplement traditional testing approaches with more powerful techniques based on math and logic. This is where the branch of artificial intelligence (AI) called automated reasoning comes into play.
While traditional testing focuses on validating system behavior under specific scenarios, automated reasoning aims to use logic to verify system behavior under any possible scenario. In even a moderately complex system, it would take an intractably large amount of time to reproduce every combination of possible states and parameters that may occur. With automated reasoning, it’s possible to achieve the same effect quickly and efficiently by computing a logical proof of the correctness of the system.
Using automated reasoning requires our builders to have a different mindset. Instead of trying to think about all possible input scenarios and how they might go wrong, we define how the system should work and identify the conditions that must be met in order for it to behave correctly. Then we can verify that those conditions are true by using mathematical proof. In other words, we can verify that the system is correct.
Automated reasoning views a system’s specification and implementation in mathematics, then applies algorithmic approaches to verify that the mathematical representation of the system satisfies the specification. By encoding our systems as mathematical systems and reasoning about them using formal logic, automated reasoning allows us to efficiently and authoritatively answer critical questions about the systems’ future behavior. What can the system do? What will it do? What can it never do? Automated reasoning can help answer these questions for even the most complex, large-scale, and potentially unbounded systems—scenarios that are impossible to exhaustively validate through traditional testing alone.
Does automated reasoning allow us to achieve perfection? No, because it still depends on certain assumptions about the correct behavior of the components of a system and the relationship between the system and the model of its environment. For example, the model of a system might incorrectly assume that underlying components such as compilers and processors don’t have any bugs (although it is possible to formally verify those components as well). That said, automated reasoning allows us to achieve higher confidence in correctness than is possible by using traditional software development and testing methods.
Faster development
Automated reasoning is not just for mathematicians and scientists. Our Amazon Simple Storage Service (Amazon S3) engineers use automated reasoning every day to prevent bugs. Behind the simple interface of S3 is one of the world’s largest and most complex distributed systems, holding 400 trillion objects, exabytes of data, and regularly processing over 150 million requests per second. S3 is composed of many subsystems that are distributed systems in their own right, many consisting of tens of thousands of machines. New features are being added all the time, while S3 is under heavy use by our customers.
A key component of S3 is the S3 index subsystem, an object metadata store that enables fast data lookups. This component contains a very large, complex data structure and intricate, optimized algorithms. Because the algorithms are difficult for humans to get right at S3 scale, and because we can’t afford errors in S3 lookups, we made new improvements on a cadence of about once per quarter, due to the extreme care and extensive testing required to confidently make a change.
S3 is a well-built and well-tested system built on 15 years of experience. However, there was a bug in the S3 index subsystem for which we couldn’t determine the root cause for some time. The system was able to automatically recover from the exception, so its presence didn’t impact the behavior of the system. Still, we were not satisfied.
Why was this bug around so long? Distributed systems like S3 have a large number of components, each with their own corner cases, and a number of corner cases happen at the same time. In the case of S3, which has over 300 microservices, the number of potential combinations of these corner cases is enormous. It’s not possible for developers to think through each of these corner cases, even when they have evidence the bug exists and ideas about its root cause—never mind all of the possible combinations of corner cases.
This complexity drove us to look at how we could use automated reasoning to explore the possible states and errors that might be hidden in those states. By building a formal specification of the system, we were able to find the bug and prove the absence of further bugs of its type. Using automated reasoning also gave us the confidence to ship updates and improvements every one to two months rather than just three to four times a year.
Faster code
The correctness of the AWS Identity and Access Management (IAM) service is foundational to the security of our customers’ workloads. Across millions of customers, thousands of resource types, and hundreds of AWS services, every API call—every single request to AWS—is processed by the IAM authorization engine. That’s over 1.2 billion requests per second. This is some of the most security-critical and highly scaled software in AWS.
Before any change at AWS goes into production, we need an extremely high degree of confidence that the system remains secure and correct. Using automated reasoning, we can prove that our systems adhere to specific security properties, under an exhaustive number of circumstances. We call this provable security. Not only has automated reasoning enabled us to provide provable security assurance to our customers, it gives us the ability to deliver functionality, security, and optimization at scale.
Like S3, IAM has evolved over 15 years into a time-tested and trusted system. But we wanted to raise the bar further. We built a formal specification that captures the behavior of the existing IAM authorization engine, codified its policy evaluation principles into provable theorems, and used automated reasoning to build a new and more efficient implementation. Earlier this year, we deployed the new proved-correct authorization engine —and no one noticed. Automated reasoning allowed us to seamlessly replace one of the most critical pieces of AWS infrastructure, the authorization engine, with a proved-correct equivalent.
With the specification and proofs in place, we could safely and aggressively optimize the code with a high degree of confidence. At the massive scale of IAM, every microsecond of performance improvement translates into a better customer experience and better cost optimization for AWS. We optimized string matching, removed unnecessary memory allocation and redundant computations, strengthened security, and improved scalability. After every change, we re-ran our proofs to confirm that the system was still operating correctly.
The optimized IAM authorization engine is now 50% faster than its predecessor. We simply would not have been able to make these types of impactful optimizations with such confidence if we didn’t use automated reasoning. For a deeper look at how we did this, see this AWS re:Inforce session.
Faster deployment (of faster code)
Most secure online transactions are protected by encryption. For example, the RSA encryption algorithm protects data by generating two keys: one to encrypt the data, and one to decrypt it. These keys enable secure data transmission as well as secure digital signatures. In the context of encryption, correctness and performance are both essential—a bug in an encryption algorithm can be disastrous.
As AWS customers move their workloads to AWS Graviton, the benefits of optimizing cryptography for the ARM instruction set increase. But optimizing encryption for better performance is complex, which makes it difficult to verify that modified encryption algorithms are behaving properly. Before we started to use automated reasoning, optimizations to cryptography libraries often required months-long reviews to achieve confidence for release into production.
Over the last decade, we’ve increasingly applied automated reasoning techniques within AWS to prove the correctness of our cloud infrastructure and services. We routinely use these methods not only to verify correctness, but also to enhance security and reliability and minimize design flaws. Automated reasoning can be used to create a precise, testable model of a system, which we can use to quickly verify that changes are safe—or learn they are unsafe without causing harm in production.
We can answer critical questions about our infrastructure to detect misconfigurations that might expose data. We can help stop subtle but serious bugs from reaching production that we would not have found with other techniques. We can make bold performance optimizations that we would not have dared attempt without model checking. Automated reasoning provides rigorous mathematical assurance that critical systems behave as expected.
AWS is the first and only cloud provider to use automated reasoning at this scale. As adoption of automated reasoning tools increases, it becomes easier for us to justify ever-larger investments into improving the usability and scalability of automated reasoning tools. The easier it is to use the automated reasoning tools and the more powerful they become, the more adoption we’ve observed. The more we’re able to prove correctness of our cloud infrastructure, the more compelling the cloud is to security-obsessed customers. And, as the examples in this post illustrate, not only are we able to increase security assurance, we are delivering higher performant code to customers faster, translating into cost savings that we can eventually pass on to customers.
My prediction is that we’re in the beginning of an era in which critical properties like security, compliance, availability, durability, and safety can be proved automatically for large-scale cloud architectures. From preventing potential issues with AI hallucinations to analyzing hypervisors, cryptography, and distributed systems, having sound mathematical reasoning at our foundations and continuously analyzing what we build sets Amazon apart.
Generative AI is transforming industries in new and exciting ways every single day. At Amazon Web Services (AWS), security is our top priority, and we see security as a foundational enabler for organizations looking to innovate. As you prepare for AWS re:Invent 2024, make sure that these essential sessions are on your schedule to learn how security can help your organization innovate with generative AI solutions quickly and securely. Leading experts will provide deep insights into how you can secure generative AI workloads in order to protect data and navigate governance, risk, and compliance.
In this post, we’ve highlighted some of our must-attend sessions and favorite activities for security leaders and practitioners, technical decision-makers, and artificial intelligence and machine learning (AI/ML) builders. To join in on the fun, register here, and we’ll see you in Vegas!
Keynotes and innovation talks
The AWS re:Invent 2024 keynote and innovation talks offer the opportunity to gain direct, transformative insights from senior AWS leaders. Delve into the latest breakthroughs in generative AI, cloud security, and cutting-edge architectural innovations that are redefining the future of application development and the AWS Cloud.
KEY002 – CEO Keynote with Matt Garman. Discover how AWS is innovating across the cloud, from reinventing core services to creating new experiences, empowering customers and partners to build a secure and better future.
SEC203-INT – Security insights and innovation from AWS with Chris Betz. Discover how groundbreaking security innovations and generative AI empower your organization to accelerate innovation securely, as AWS CISO Chris Betz reveals transformative strategies to integrate and automate security, freeing your team to focus on high-value initiatives.
ARC203-INT – Architectural methods & breakthroughs in innovative apps in the cloud with Shaown Nandi and Ben Cabanas. This talk showcases how generative AI and cutting-edge architectural advancements are transforming application design, empowering AWS customers to modernize their systems, develop robust data strategies, and securely navigate the evolving cloud landscape.
Check out the full list of innovation talks. Not attending live this year? The keynote and all innovation talks will be live streamed.
Sessions
Discover a range of learning opportunities designed to deepen your expertise in securing generative AI. This year’s sessions put a strong focus on providing customers with impactful real-world, practical prescriptions for securing your AI workloads and the data that powers them. Whether you prefer lecture-style breakout sessions, interactive chalk talks, hands-on workshops, or code-driven discussions, there’s a session tailored to help meet your needs. Explore the following options and reserve your spot to enhance your understanding and practical skills in this rapidly evolving field.
You can find more details and descriptions for session levels (100–400) and session types on the re:Invent website.
Breakout sessions
Breakout sessions are lecture-style, 1-hour sessions delivered by AWS experts, customers, and partners—perfect for deepening your knowledge on important topics, gaining actionable insights, and connecting with industry leaders.
SEC214 –Elevating client experiences with secure AI: Rocket Mortgage’s approach. Discover how Rocket Mortgage implemented AWS generative AI services to enhance customer experiences while navigating security challenges. Register for this session
SEC315 – Bring your workforce identities to AWS for generative AI and analytics. This session will demonstrate the power of integrating your workforce identity provider to gain easier access to generative AI applications and tools. AWS and NVIDIA will demonstrate a full end-to-end identity-aware experience. Register for this session
SEC323 –The AWS approach to secure generative AI. Learn how AWS secures generative AI across the infrastructure, model, and application layers, giving customers control over their data with built-in security features. Register for this session
SEC403 –Generative AI for security in the real world. Explore practical generative AI applications for security teams, including incident response, red team/blue team enablement, and security operations center (SOC) use cases, to boost your security operations. Register for this session
Chalk talks
Chalk talks are 1-hour long, highly interactive sessions with a small audience. This format is ideal for diving deep into specific topics, engaging directly with AWS experts, and getting your questions answered in real time.
SEC303 – Protecting data within your generative AI architectures. Mitigate risks when training large language models (LLMs) on sensitive data. Explore techniques like sanitization, anonymization, and differential privacy. Register for this talk
SEC327 – Building secure network designs for gen AI applications. Optimize your cloud network design to power transformative generative AI applications more securely, as we share proven best practices, proactive controls, and reference architectures to build resilient, defense-in-depth architectures and accelerate innovation on AWS. Register for this talk
SEC335 –Harness generative AI for business growth amidst the regulatory landscape. Explore how AWS AI/ML solutions can drive business growth while helping you align to responsible practices. Learn from your peers about their strategies to navigate evolving regulatory landscapes, from the European Union’s General Data Protection Regulation (GDPR) to industry-specific mandates. Register for this talk
SEC336 –Security and compliance considerations using Amazon Q Business. Discover best practices for securing your Amazon Q Business application, focusing on access control, data protection, and compliance considerations, so that you can keep your AI assistant secure and compliant. Register for this talk
SEC338 –Safeguard your generative AI apps from prompt injections. Learn to protect your generative AI applications from prompt injection attacks by understanding input validation, secure prompt engineering, and content moderation. Register for this talk
PEX308 – Securing generative AI on AWS. Explore generative AI security considerations through a partner lens, including how partners can enhance data security and the value-adds that partners bring to a customer’s generative AI workloads. Register for this talk
AIM344 – Understanding the deep security controls within Amazon Q Business. Learn about the security-related capabilities and controls within Amazon Q that allow you to confidently use your business data safely. Register for this talk
AIM407 – Understand the deep security controls within Amazon Bedrock. Dive deep into the security nuances of Amazon Bedrock, as we unpack the architectures, data flows, and lifecycle management of complex features like Guardrails, Agents, and Knowledge Bases, empowering you to use this generative AI service with uncompromising data privacy and control. Register for this talk
DEV323 – OWASP Top 10 for LLMs. Strengthen your skills in securing generative AI applications by exploring real-world vulnerabilities and proven mitigation strategies against the OWASP Top 10 risks for large language models (LLMs), through interactive demos and hands-on exercises. Register for this talk
Code talks
Code talks are similar to our popular chalk talk format, but with a focus on live coding or code samples rather than whiteboarding. These sessions look into the actual code used to build a solution, allowing attendees to understand the “why” behind the approach and witness the development process, including any errors that may arise. Participants are encouraged to ask questions and follow along for a deeper, hands-on learning experience.
SEC401 – Inspect and secure your application with generative AI. Harness the power of generative AI to bolster your application security, as we unveil how AI-driven tools can rapidly detect vulnerabilities and recommend remediation strategies, empowering you to build more secure software with ease. Register for this talk
SEC405 – Consolidated data protection insights with generative AI. Discover how to secure your AWS KMS keys across your accounts by using Amazon Q in QuickSight for quick, actionable insights. Register for this talk
Builders’ sessions
Interact with small groups, led by an AWS expert providing interactive learning about how to build on AWS. Each builders’ session begins with a short explanation or demonstration of what attendees are building, then it’s your turn to build! The expert will guide you end-to-end through this hands-on experience.
Note: You must bring your own laptop to participate in these sessions.
DOP302 – Creating secure code with Amazon Q Developer. Supercharge your coding prowess with Amazon Q Developer, as you gain hands-on experience using its AI-powered capabilities to write more secure, optimized code, detect vulnerabilities, and implement instant remediations—transforming your development workflow. Register for this session
SMB302 – Empower your business with defense-in-depth architecture. Empower your small-to-medium business to innovate more securely with generative AI by exploring practical, cost-effective defense-in-depth strategies, layered security architectures, and AI-specific safeguards to build resilient, trusted AI-powered solutions in the AWS Cloud. Register for this session
Workshops
Workshops are 2-hour interactive sessions where you collaborate in teams or work individually to solve real-world challenges by using AWS services, making them perfect for hands-on learning. Each workshop begins with a brief lecture, followed by dedicated time to work through the problem.
Note: Don’t forget to bring your laptop to build alongside AWS experts.
SEC305 – Generative AI-based code remediations and patch management at scale. Experience hands-on how to use generative AI to assist in automating vulnerability detection and remediation across AWS Lambda, containers, and Amazon Elastic Compute Cloud (Amazon EC2) at scale, empowering your team to proactively secure your applications. Register for this workshop
SEC306 – Securing your generative AI applications on AWS. Gain hands-on experience securing generative AI applications by using AWS services and features. Deploy a vulnerable sample AI app, then implement layered security controls to protect, detect, and respond to issues. Use these best practices to secure your own AI apps when you return home! Register for this workshop
SEC309 – AWS IAM Identity Center: Secure access to generative AI applications. You’ll learn how to build an identity-aware chat experience, train it on a sample dataset, and connect it to an external workforce identity provider by using native integration between Amazon Q Business and AWS Identity and Access Management (IAM) Identity Center. Register for this workshop
SEC310 – Persona-based access to enterprise data for generative AI applications. Learn how to secure document access in generative AI applications by using retrieval augmented generation (RAG), metadata filtering, and Amazon Cognito in this interactive workshop. Register for this workshop
Expo
Want to talk directly with an AWS security expert on generative AI security, or a variety of other security topics? Then don’t miss this opportunity to have one-on-one conversations with leading AWS security experts in the Security Activation area of the expo floor to help you take your organization’s security posture to new heights.
Delve into key security domains such as:
Detection and Response: Explore techniques for detecting and responding to security risks to help protect your workloads at scale.
Network and Infrastructure Security: Learn how to build and manage a secure global network with AWS services.
Application Security: Discover strategies to ship secure software and address the challenges of application security.
Identity and Access Management: Adopt modern cloud-native identity solutions and apply least-privilege access controls.
Digital Sovereignty & Data Protection: Maintain control over your data and choose how to secure and manage it in the AWS Cloud.
Still time for fun!
After an inspiring week of transformative insights and deep learning, join us for the world renowned re:Play party—the ultimate re:Invent sendoff! Immerse yourself in live entertainment from headlining musical artists, scrumptious cuisine, and flowing refreshments as we come together to unwind, connect, and toast to a future of limitless possibilities.
Register today
It’s going to be an amazing event, and we can’t wait to see you at re:Invent 2024! Register now to secure your spot.
If you have feedback about this post, submit comments in the Comments section below. If you have questions about this post, contact AWS Support.
AWS is deeply committed to earning and maintaining the trust of customers who rely on us to run their workloads. Security has always been our top priority, which includes designing our own services with security in mind at the outset, and taking proactive measures to mitigate potential threats so that customers can focus on their businesses with confidence. We continuously innovate and invest in advancing our security capabilities.
To help prevent security incidents from disrupting our customers’ businesses, we need to stay ahead of potential threats, and protect customers quickly when we become aware of activities that could be potentially harmful to them. We’ve previously shared details about our sophisticated global honeypot system MadPot and our massive internal neural network graph model Mithra. These are two examples of internal threat intelligence tools that we use to take proactive, real-time action to help prevent a potential threat from becoming a real security issue for our customers.
I mentioned another internal threat intelligence tool called Sonaris in my recent re:Inforce keynote. Sonaris is an active defense tool that analyzes potentially harmful network traffic so that we can quickly and automatically restrict threat actors who are hunting for exploitable vulnerabilities. With MadPot, Mithra, and Sonaris in the hands of our world-class security teams, AWS is equipped with powerful, actionable threat intelligence on a scale that is only possible with AWS. This blog post covers why and how we use Sonaris behind the scenes to help protect customers, and how we know our threat intelligence is having measurable results.
AWS security innovation tackles threats with measurable results for customers at global scale
As organizations have migrated to the cloud over the last decade, threat actors have evolved their tactics to exploit environments that aren’t properly secured. In 2017, our security teams observed an increasing number of unauthorized attempts to scan (systematic examination through digital means and tools) and probe AWS customer accounts—activities conducted by threat actors who were hunting for Amazon Simple Storage Service (Amazon S3) buckets that customers unintentionally configured with public access. To help address this security issue on behalf of our customers, AWS security teams developed active defense capabilities to help detect these kinds of suspicious scanning behaviors and then restrict the actions that malicious actors might take to further improperly access a customer’s S3 bucket.
This novel approach to a new cloud-era security challenge evolved to become the threat intelligence tool we now call Sonaris, which today identifies and automatically restricts unauthorized scanning and S3 bucket discovery within minutes at global scale. Sonaris applies security rules and algorithms to identify anomalies from over two hundred billion events each minute. Preventing opportunistic attempts from threat actors to discover and exploit misconfigurations or out-of-date software represents a significant leap forward in our security capabilities at AWS.
How do we know that the network mitigations performed by Sonaris are actually making a difference for our customers? We can compare threat activity between MadPot sensors, with and without Sonaris protections. To do this, we use MadPot to construct two separate large-scale fleets of honeypot testing groups to compare statistics for each security configuration. One group is protected by our perimeter security controls fed by Sonaris analytics, and a separate fleet receives no protection. This allows us to measure the protective coverage of hosts within the AWS network perimeter.
Findings from these split testing groups underscore the sheer volume of potential threats that Sonaris manages to thwart, and the ongoing work behind the scenes to enhance the security of AWS infrastructure. For example, across the hundreds of different types of malicious interactions that MadPot classified, Sonaris observed an 83% reduction in abuse attempts in September 2024. In the past 12 months, Sonaris denied more than 27 billion attempts to find unintentionally public S3 buckets, and prevented nearly 2.7 trillion attempts to discover vulnerable services on Amazon Elastic Compute Cloud (Amazon EC2). This protection drastically reduces risk for AWS customers.
How Sonaris detects and restricts abusive scanning and exploitation attempts
Sonaris plays a critical role in helping to secure AWS and our customers by detecting and then restricting certain suspicious behavior aimed at AWS infrastructure and services. Its capabilities are built on the integration of both network telemetry sources across AWS, plus our threat intelligence data. What sets Sonaris apart is its integration of AWS network telemetry with Amazon threat intelligence to provide safe and effective threat mitigation to reduce indiscriminate scanning activity.
Sonaris applies heuristic, statistical, and machine learning algorithms to vast amounts of the summarized metadata and service health telemetry that we use to operate our services. One threat intelligence source that Sonaris uses is MadPot, which receives traffic on tens of thousands of IP addresses every day. MadPot emulates hundreds of different services and mimics customer accounts, and then classifies these interactions into known Common Vulnerabilities and Exposures (CVEs) and other vulnerabilities. Through MadPot, Sonaris can also integrate additional high-fidelity signals that help identify activities of threat actors with enhanced precision. First-party threat intelligence collected from MadPot increases Sonaris confidence and accuracy for automatically restricting known malicious vulnerability enumeration attacks so that customers are protected automatically.
When Sonaris identifies malicious attempts to scan an AWS IP address or customer account, it triggers automated protections in AWS Shield, Amazon Virtual Private Cloud (Amazon VPC), Amazon S3, and AWS WAF, automatically protecting customer resources from unauthorized activity in real time. Sonaris is judicious about what activities it restricts, only intervening when there is a sufficiently high assurance that the interactions are malicious. For example, to help ensure that legitimate customer interactions are not restricted, we developed dynamic guardrail models to identify what normal behavior looks like in AWS services so that only suspicious activities are detected and acted on. We update and refresh these guardrail models constantly with our latest observations to help avoid taking action on legitimate customer activities.
Sonaris is having real-world impact at scale against dynamic threats that exist today
Throughout 2023 and 2024, a large active botnet known as Dota3 has been scanning the internet for vulnerable hosts and devices to install cryptominer malware (malicious software designed to secretly use a victim’s computer or device resources). Sonaris has been effectively protecting customers from this botnet, even as the botnet’s operators try new ways to evade defenses. In Q3 2024, we observed this botnet’s scanning behavior change as it began using different payloads, rates, and endpoints, as shown in the following figure. Thanks to the layered detection methods of Sonaris, this botnet was unable to avoid our automatic detection. Sonaris automatically protected customers from more than 16,000 malicious scanning endpoints each hour.
Figure 1: Dota3 botnet activity suddenly changes in September 2024
AWS is committed to making the internet a safer place
Although Sonaris reduces risk, it does not eliminate it entirely, and our work is far from over. As we continue to evolve and strengthen our security measures, AWS remains committed to making the internet a safer place so that customers can thrive in an increasingly complex digital landscape while maintaining a strong security posture. Through the creation of active security tools such as Sonaris, and our customers’ diligent application of security best practices, we can collectively create a more secure cloud environment for all.
Your feedback is crucial to us and we encourage you to leave comments, reach out to our customer support teams, or engage with us through your preferred channels. Together, we can shape the future of cloud security and stay ahead of emerging threats.
If you have feedback about this post, submit comments in the Comments section below. If you have questions about this post, contact AWS Support.
Many organizations continuously receive security-related findings that highlight resources that aren’t configured according to the organization’s security policies. The findings can come from threat detection services like Amazon GuardDuty, or from cloud security posture management (CSPM) services like AWS Security Hub, or other sources. An important question to ask is: How, and how soon, are your teams notified of these findings?
Often, security-related findings are streamed to a single centralized security team or Security Operations Center (SOC). Although it’s a best practice to capture logs, findings, and metrics in standardized locations, the centralized team might not be the best equipped to make configuration changes in response to an incident. Involving the owners or developers of the impacted applications and resources is key because they have the context required to respond appropriately. Security teams often have manual processes for locating and contacting workload owners, but they might not be up to date on the current owners of a workload. Delays in notifying workload owners can increase the time to resolve a security incident or a resource misconfiguration.
This post outlines a decentralized approach to security notifications, using a self-service mechanism powered by AWS Service Catalog to enhance response times. With this mechanism, workload owners can subscribe to receive near real-time Security Hub notifications for their AWS accounts or workloads through email. The notifications include those from Security Hub product integrations like GuardDuty, AWS Health, Amazon Inspector, and third-party products, as well as notifications of non-compliance with security standards. These notifications can better equip your teams to configure AWS resources properly and reduce the exposure time of unsecured resources.
End-user experience
After you deploy the solution in this post, users in assigned groups can access a least-privilege AWS IAM Identity Center permission set, called SubscribeToSecurityNotifications, for their AWS accounts (Figure 1). The solution can also work with existing permission sets or federated IAM roles without IAM Identity Center.
Figure 1: IAM Identity Center portal with the permission set to subscribe to security notifications
After the user chooses SubscribeToSecurityNotifications, they are redirected to an AWS Service Catalog product for subscribing to security notifications and can see instructions on how to proceed (Figure 2).
Figure 2: AWS Service Catalog product view
The user can then choose the Launch product utton and enter one or more email addresses and the minimum severity level for notifications (Critical, High, Medium, or Low). If the AWS account has multiple workloads, they can choose to receive only the notifications related to the applications they own by specifying the resource tags. They can also choose to restrict security notifications to include or exclude specific security products (Figure 3).
Figure 3: Service Catalog security notifications product parameters
You can update the Service Catalog product configurations after provisioning by doing the following:
In the Service Catalog console, in the left navigation menu, choose Provisioned products.
Select the provisioned product, choose Actions, and then choose Update.
Update the parameters you want to change.
For accounts that have multiple applications, each application owner can set up their own notifications by provisioning an additional Service Catalog product. You can use the Filter findings by tag parameters to receive notifications only for a specific application. The example shown in Figure 3 specifies that the user will receive notifications only from resources with the tag key app and the tag value BigApp1 or AnotherApp.
After confirming the subscription, the user starts to receive email notifications for new Security Hub findings in near real-time. Each email contains a summary of the finding in the subject line, the account details, the finding details, recommendations (if any), the list of resources affected with their tags, and an IAM Identity Center shortcut link to the Security Hub finding (Figure 4). The email ends with the raw JSON of the finding.
Figure 4: Sample email showing details of the security notification
Choosing the link in the email takes the user directly to the AWS account and the finding in Security Hub, where they can see more details and search for related findings (Figure 5).
Figure 5: Security Hub finding detail page, linked from the notification email
Solution overview
We’ve provided two deployment options for this solution; a simpler option and one that is more advanced.
Figure 6 shows the simpler deployment option of using the requesting user’s IAM permissions to create the resources required for notifications.
Figure 6: Architecture diagram of the simpler configuration of the solution
The solution involves the following steps:
Create a central Subscribe to AWS Security Hub notifications Service Catalog product in an AWS account which is shared with the entire organization in AWS Organizations or with specific organizational units (OUs). Configure the product with the names of IAM roles or IAM Identity Center permission sets that can launch the product.
Users who sign in through the designated IAM roles or permission sets can access the shared Service Catalog product from the AWS Management Console and enter the required parameters such as their email address and the minimum severity level for notifications.
The Service Catalog product creates an AWS CloudFormation stack, which creates an Amazon Simple Notification Service (Amazon SNS) topic and an Amazon EventBridge rule that filters new Security Hub finding events that match the user’s parameters, such as minimum severity level. The rule then formats the Security Hub JSON event message to make it human-readable by using native EventBridge input transformers. The formatted message is then sent to SNS, which emails the user.
We also provide a more advanced and recommended deployment option, shown in Figure 7. This option involves using an AWS Lambda function to enhance messages by doing conversions from UTC to your selected time zone, setting the email subject to the finding summary, and including an IAM Identity Center shortcut link to the finding. To not require your users to have permissions for creating Lambda functions and IAM roles, a Service Catalog launch role is used to create resources on behalf of the user, and this role is restricted by using IAM permissions boundaries.
Figure 7: Architecture diagram of the solution when using the calling user’s permissions
The architecture is similar to the previous option, but with the following changes:
Create a CloudFormation StackSet in advance to pre-create an IAM role and an IAM permissions boundary policy in every AWS account. The IAM role is used by the Service Catalog product as a launch role. It has permissions to create CloudFormation resources such as SNS topics, as well as to create IAM roles that are restricted by the IAM permissions boundary policy that allows only publishing SNS messages and writing to Amazon CloudWatch Logs.
Users who want to subscribe to security notifications require only minimal permissions; just enough to access Service Catalog and to pass the pre-created role (from the preceding step) to Service Catalog. This solution provides a sample AWS Identity Center permission set with these minimal permissions.
The Service Catalog product uses a Lambda function to format the message to make it human-readable. The stack creates an IAM role, limited by the permissions boundary, and the role is assumed by the Lambda function to publish the SNS message.
Security Hub enabled in the accounts you are monitoring.
An AWS account to host this solution, for example the Security Hub administrator account or a shared services account. This cannot be the management account.
One or more AWS accounts to consume the Service Catalog product.
Authentication that uses AWS IAM Identity Center or federated IAM role names in every AWS account for users accessing the Service Catalog product.
(Optional, only required when you opt to use Service Catalog launch roles) CloudFormation StackSet creation access to either the management account or a CloudFormation delegated administrator account.
This solution supports notifications coming from multiple AWS Regions. If you are operating Security Hub in multiple Regions, for a simplified deployment evaluate the Security Hub cross-Region aggregation feature and enable it for the applicable Regions.
Walkthrough
There are four steps to deploy this solution:
Configure AWS Organizations to allow Service Catalog product sharing.
(Optional, recommended) Use CloudFormation StackSets to deploy the Service Catalog launch IAM role across accounts.
Service Catalog product creation to allow users to subscribe to Security Hub notifications. This needs to be deployed in the specific Region you want to monitor your Security Hub findings in, or where you enabled cross-Region aggregation.
(Optional, recommended) Provision least-privileged IAM Identity Center permission sets.
Step 1: Configure AWS Organizations
Service Catalog organizations sharing in AWS Organizations must be enabled, and the account that is hosting the solution must be one of the delegated administrators for Service Catalog. This allows the Service Catalog product to be shared to other AWS accounts in the organization.
To enable this configuration, sign in to the AWS Management Console in the management AWS account, launch the AWS CloudShell service, and enter the following commands. Replace the <Account ID> variable with the ID of the account that will host the Service Catalog product.
# Enable AWS Organizations integration in Service Catalog
aws servicecatalog enable-aws-organizations-access

# Nominate the account to be one of the delegated administrators for Service Catalog
aws organizations register-delegated-administrator --account-id <Account ID> --service-principal servicecatalog.amazonaws.com
Step 2: (Optional, recommended) Deploy IAM roles across accounts with CloudFormation StackSets
The following steps create a CloudFormation StackSet to deploy a Service Catalog launch role and permissions boundary across your accounts. This is highly recommended if you plan to enable Lambda formatting, because if you skip this step, only users who have permissions to create IAM roles will be able to subscribe to security notifications.
To deploy IAM roles with StackSets
Sign in to the AWS Management Console from the management AWS account, or from a CloudFormation delegated administrator
Choose Create stack, and then choose With new resources (standard).
Choose Upload a template file and upload the CloudFormation template that you downloaded earlier:SecurityHub_notifications_IAM_role_stackset.yaml. Then choose Next.
Enter the stack name SecurityNotifications-IAM-roles-StackSet.
Enter the following values for the parameters:
AWS Organization ID: Start AWS CloudShell and enter the command provided in the parameter description to get the organization ID.
Organization root ID or OU ID(s): To deploy the IAM role and permissions boundary to every account, enter the organization root ID using CloudShell and the command in the parameter description. To deploy to specific OUs, enter a comma-separated list of OU IDs. Make sure that you include the OU of the account that is hosting the solution.
Current Account Type: Choose either Management account or Delegated administrator account, as needed.
Formatting method: Indicate whether you plan to use the Lambda formatter for Security Hub notifications, or native EventBridge formatting with no Lambda functions. If you’re unsure, choose Lambda.
Choose Next, and then optionally enter tags and choose Submit. Wait for the stack creation to finish.
Step 3: Create Service Catalog product
Next, run the included installation script that creates the CloudFormation templates that are required to deploy the Service Catalog product and portfolio.
To run the installation script
Sign in to the console of the AWS account and Region that will host the solution, and start the AWS CloudShell service.
In the terminal, enter the following commands:
git clone https://github.com/aws-samples/improving-security-incident-response-times-by-decentralizing-notifications.git

cd improving-security-incident-response-times-by-decentralizing-notifications

./install.sh
The script will ask for the following information:
Whether you will be using the Lambda formatter (as opposed to the native EventBridge formatter).
The timezone to use for displaying dates and times in the email notifications, for example Australia/Melbourne. The default is UTC.
The Service Catalog provider displayname, which can be your company, organization, or team name.
The Service Catalog product version, which defaults to v1. Increment this value if you make a change in the product CloudFormation template file.
Whether you deployed the IAM role StackSet in Step 2, earlier.
The principal type that will use the Service Catalog product. If you are using IAM Identity Center, enter IAM_Identity_Center_Permission_Set. If you have federated IAM roles configured, enter IAM role name.
If you entered IAM_Identity_Center_Permission_Set in the previous step, enter the IAM Identity Center URL subdomain. This is used for creating a shortcut URL link to Security Hub in the email. For example, if your URL looks like this: https://d-abcd1234.awsapps.com/start/#/, then enter d-abcd1234.
The principals that will have access to the Service Catalog product across the AWS accounts. If you’re using IAM Identity Center, this will be a permission set name. If you plan to deploy the provided permission set in the next step (Step 4), press enter to accept the default value SubscribeToSecurityNotifications. Otherwise, enter an appropriate permission set name (for example AWSPowerUserAccess) or IAM role name that users use.
The script creates the following CloudFormation stacks:
SecurityHub_notifications_SC-Bucket.yaml: This stack creates an Amazon Simple Storage (Amazon S3) bucket that contains the file SecurityHub-Notifications.yaml, which is the CloudFormation template file associated with the Service Catalog product. The script modifies the Mappings section of the template file that has the configuration details depending on the answers to the installation script questions, and then uploads the file to the bucket.
SecurityHub_notifications_ServiceCatalog_Portfolio.yaml: This stack creates a Service Catalog portfolio and product using the Amazon S3 bucket from the previous step and gives permissions to the required principals to launch the product.
After the script finishes the installation, it outputs the Service Catalog Product ID, which you will need in the next step. The script then asks whether it should automatically share this Service Catalog portfolio with the entire organization or a specific account, or whether you will configure sharing to specific OUs manually.
(Optional) To manually configure sharing with an OU
In the Service Catalog console, choose Portfolios.
Choose Subscribe to AWS Security Hub notifications.
On the Share tab, choose Add a share.
Choose AWS Organization, and then select the OU. The product will be shared to the accounts and child OUs within the selected OU.
Select Principal sharing, and then choose Share.
To expand this solution across Regions, enable Security Hub cross-Region aggregation. This results in the email notifications coming from the linked Regions that are configured in Security Hub, even though the Service Catalog product is instantiated in a single Region. If cross-Region aggregation isn’t enabled and you want to monitor multiple Regions, you must repeat the preceding steps in all the Regions you are monitoring.
Step 4: (Optional, recommended) Provision IAM Identity Center permission sets
This step requires you to have completed Step 2 (Deploy IAM roles across accounts with CloudFormation StackSets).
If you’re using IAM Identity Center, the following steps create a custom permission set, SubscribeToSecurityNotifications, that provides least-privileged access for users to subscribe to security notifications. The permission set redirects to the Service Catalog page to launch the product.
To provision Identity Center permission sets
Sign in to the AWS Management Console from the management AWS account, or from an IAM Identity Center delegated administrator
Choose Create stack, and then choose With new resources (standard).
Choose Upload a template file and upload the CloudFormation template you downloaded earlier: SecurityHub_notifications_PermissionSets.yaml. Then choose Next.
Enter the stack name SecurityNotifications-PermissionSet.
Enter the following values for the parameters:
AWS IAM Identity Center Instance ARN: Use the AWS CloudShell command in the parameter description to get the IAM Identity Center ARN.
Permission set name: Use the default value SubscribeToSecurityNotifications.
Service Catalog product ID: Use the last output line of the install.sh script in Step 3, or alternatively get the product ID from the Service Catalog console for the product account.
Choose Next. Then optionally enter tags and choose Next Wait for the stack creation to finish.
Next, go to the IAM Identity Center console, select your AWS accounts, and assign access to the SubscribeToSecurityNotifications permission set for your users or groups.
Testing
To test the solution, sign in to an AWS account, making sure to sign in with the designated IAM Identity Center permission set or IAM role. Launch the product in Service Catalog to subscribe to Security Hub security notifications.
Wait for a Security Hub notification. For example, if you have the AWS Foundational Security Best Practices (FSBP) standard enabled, creating an S3 bucket with no server access logging enabled should generate a notification within a few minutes.
Consider enabling Security Hub consolidated control findings so you don’t receive multiple email notifications for a control that applies to multiple standards.
To remove unneeded resources after testing the solution, follow these steps:
In the workload account or accounts where the product was launched:
Go to the Service Catalog provisioned products page and terminate each associated provisioned product. This stops security notifications from being sent to the email address associated with the product.
In the AWS account that is hosting the directory:
In the Service Catalog console, choose Portfolios, and then choose Subscribe to AWS Security Hub notifications. On the Share tab, select the items in the list and choose Actions, then choose Unshare.
In the CloudFormation console, delete the SecurityNotifications-Service-Catalog stack.
In the Amazon S3 console, for the two buckets starting with securitynotifications-sc-bucket, select the bucket and choose Empty to empty the bucket.
In the CloudFormation console, delete the SecurityNotifications-SC-Bucket stack.
If applicable, go to the management account or the CloudFormation delegated administrator account and delete the SecurityNotifications-IAM-roles-StackSet stack.
If applicable, go to the management account or the IAM Identity Center delegated administrator account and delete the SecurityNotifications-PermissionSet stack.
Conclusion
This solution described in this blog post enables you to set up a self-service standardized mechanism that application or workload owners can use to get security notifications within minutes through email, as opposed to being contacted by a security team later. This can help to improve your security posture by reducing the incident resolution time, which reduces the time that a security issue remains active.
If you have feedback about this post, submit comments in the Comments section below. If you have questions about this post, contact AWS Support.
Last Friday, I had the privilege of attending China Engineer’s Day 2024(CED 2024) in Hangzhou as the Amazon Web Services (AWS) speaker. The event was organized by the China Computer Federation (CCF), one of the most influential professional developer communities in China.
At CED 2024, I spoke about how AI development tools can improve developer productivity. I was honored to receive a certificate of excellence from CCF, and Amazon Q garnered significant attention from the attendees.
Now, let’s turn to other exciting news in the AWS universe from last week.
Last week’s launches Here are some launches that got my attention:
NICE DCV renames to Amazon DCV – NICE DCV is rebranded to Amazon DCV. This high performance remote display protocol allows secure delivery of remote desktops and application streaming from any cloud or data center to any device, even over varying network conditions. Amazon DCV supports both Windows and major Linux distributions on the server side. Clients can use native DCV client for Windows, Linux, or macOS, as well as web browsers, to receive desktops and application streamings. The DCV server and client only transfer encrypted pixels, not data, ensuring no confidential information is downloaded. When using Amazon DCV on AWS with Amazon Elastic Compute Cloud (Amazon EC2), you can take advantage of the AWS 108 Availability Zones across the 33 geographic Regions and 31 local zones. The 2024.0 release now supports the latest Ubuntu 24.04 LTS. For more details, check out Sébastien Stormacq’snew launch blog post.
AWS re:Post launches re:Post Agent – AWS re:Post provides access to curated knowledge and a vibrant community that helps users become even more successful on AWS. re:Post Agent is a generative AI assistant designed to provide rapid, intelligent responses to questions in the re:Post community. It expands the available AWS knowledge base, and community experts will earn reputation points by reviewing the AI-generated answers.
A new stop ingestion API of Amazon Bedrock Knowledge Bases – This new API allows users to halt ongoing ingestion jobs at will. Providing greater control over data ingestion workflows, users can quickly stop accidental or unwanted ingestion processes without waiting for completion. By using the new StopIngestionJob API, you can respond rapidly to evolving needs and potentially reduce costs. This capability is available across all AWS Regions where Amazon Bedrock Knowledge Bases are offered.
Higher storage limit of Amazon AppStream 2.0 – Amazon AppStream 2.0 has expanded the default size limit for application settings persistence from 1 GB to 5 GB. This increase allows end users to store more application data and settings without manual intervention and without affecting performance or session setup time.
There were over 40 launches and releases last week. It was difficult for me to select the important ones. In addition to those already mentioned, here’s a list of potentially important feature updates:
For a full list of AWS announcements, be sure to keep an eye on AWS’s What’s New Feed page.
Other AWS news Here are some other noteworthy items from last week.
Amazon WorkSpaces Thin Client – Amazon WorkSpaces Thin Client inventory is now available to purchase in the UK on Amazon Business, in addition to the US, France, Germany, Italy, and Spain. It’s a sleek, cost-effective device that brings secure access to AWS end user computing services right to your fingertips. This nifty gadget is like a digital fortress, preventing unauthorized data storage and applications, while giving IT admins the tools to manage and monitor their fleet of thin clients with ease.
Helping communities impacted by Hurricane Helene – AWS Disaster Response team is working closely with local partners and humanitarian organizations to deliver critical supplies to those in need in the Southeast. We’re also deploying AWS technology to help with re-connectivity, aid relief operations on the ground, and support food distribution needs in the region.
The life of a prescription at Amazon Pharmacy – Read the Amazon Pharmacy AI use case to remove the complexity of the process of dispensing medications and improve patients’ experiences. The system transcribes raw prescription data into standardized formats, transforms medical abbreviations into full-text equivalents, and validates medication details against an industry database. This automated process, followed by pharmacist review, has reduced potential medication errors by 50 percent and improved processing speed by up to 90 percent, allowing pharmacists to focus on critical tasks and personalized care.
A thought leadership article on generative AI in the WIRED magazine – Read Antje‘s news column in Wired. It discusses how AWS opens the transformative power of AI to organizations of any size and level of experience. I recommend it to all AI enthusiasts and business innovators. AWS is on a mission to bring generative AI magic to businesses of all sizes, offering a buffet of AI tools for tech wizards and newcomers alike. Whether you’re a startup with big dreams or a corporate giant looking to stay ahead, AWS is rolling out the red carpet to the AI revolution. Don’t miss this chance to turn your wildest tech fantasies into reality!
Upcoming AWS events Check your calendars and sign up for these AWS events:
AWS re:Invent 2024 – Registration is now open for the annual tech extravaganza, taking place December 2 – 6 in Las Vegas. I’m eager to learn about the new launches and excited to contribute to two chalk talks focusing on security topics (Dev311 – Enhance code security with generative AI and SEC228 – Navigate multi-level protection scheme compliance in AWS China Regions).
AWS Community Days – Join community-led conferences featuring technical discussions, workshops, and hands-on labs led by expert AWS users and industry leaders from around the world. Don’t miss out on the AWS Community Days happening on October 12 in Sofia and October 19 in Vadodara, Spain, and Guatemala.
At Amazon Web Services (AWS), we continue to listen to our customers, regulators, and stakeholders to understand their needs regarding audit, assurance, certification, and attestation programs. We are pleased to announce that the AWS System and Organization Controls (SOC) 1 report is now available in Japanese, Korean, and Spanish. This translated report will help drive greater engagement and alignment with customer and regulatory requirements across Japan, Korea, Latin America, and Spain.
The Japanese, Korean, and Spanish language versions of the report do not contain the independent opinion issued by the auditors, but you can find this information in the English language version. Stakeholders should use the English version as a complement to the Japanese, Korean, or Spanish versions.
Going forward, the following reports in each quarter will be translated. Spring and Fall SOC 1 controls are included in the Spring and Fall SOC 2 reports, so this translation schedule will provide year-round coverage of the English versions.
The Summer 2024 SOC 1 report includes a total of 177 services in scope. For up-to-date information, including when additional services are added, see the AWS Services in Scope by Compliance Program webpage and choose SOC.
AWS strives to continuously bring services into scope of its compliance programs to help you meet your architectural and regulatory needs. Please reach out to your AWS account team if you have questions or feedback about SOC compliance.
To learn more about our compliance and security programs, see AWS Compliance Programs. As always, we value your feedback and questions; reach out to the AWS Compliance team through the Contact Us page.
Japanese version
Summer 2024 SOC 1 レポートの日本語、韓国語、スペイン語版の提供を開始
当社はお客様、規制当局、利害関係者の声に継続的に傾聴し、Amazon Web Services (AWS) における監査、保証、認定、認証プログラムに関するそれぞれのニーズを理解に努めています。この度、AWS System and Organization Controls (SOC) 1 レポートが、日本語、韓国語、スペイン語で利用可能になりました。この翻訳版のレポートは、日本、韓国、ラテンアメリカ、スペインのお客様および規制要件との連携と協力体制を強化するためのものです。
Amazon은 고객, 규제 기관 및 이해관계자의 의견을 지속적으로 경청하여 Amazon Web Services (AWS)의 감사, 보증, 인증 및 증명 프로그램과 관련된 요구사항을 파악하고 있습니다. AWS System and Organization Controls(SOC) 1 보고서가 이제 한국어, 일본어, 스페인어로 제공됨을 알려 드립니다. 이 번역된 보고서는 일본, 한국, 중남미, 스페인 전역의 고객의 참여도를 높이고 규제 요건을 준수하는 데 도움이 될 것입니다.
보고서의 일본어, 한국어, 스페인어 버전에는 감사인의 독립적인 의견이 포함되어 있지 않지만, 영어 버전에서는 해당 정보를 확인할 수 있습니다. 이해관계자는 일본어, 한국어 또는 스페인어 버전을 보완하기 위해 영어 버전을 사용해야 합니다.
앞으로 분기마다 다음 보고서가 번역본으로 제공됩니다. SOC 1 통제 조치는 춘계 및 추계 SOC 2 보고서에 포함되어 있으므로, 이 일정은 영어 버전과 함께 모든 번역된 언어로 연중 내내 제공됩니다.
AWS는 고객이 아키텍처 및 규제 요구사항을 충족할 수 있도록 지속적으로 서비스를 규정 준수 프로그램의 범위에 포함시키기 위해 노력하고 있습니다. SOC 규정 준수에 대한 질문이나 피드백이 있는 경우 AWS Account 팀에 문의하시기 바랍니다.
규정 준수 및 보안 프로그램에 대한 자세한 내용은 AWS 규정 준수 프로그램을 참조하세요. 언제나 그렇듯이 AWS는 여러분의 피드백과 질문을 소중히 여깁니다. 문의하기 페이지를 통해 AWS 규정 준수 팀에 문의하시기 바랍니다.
Spanish version
El informe SOC 1 verano 2024 se encuentra disponible actualmente en japonés, coreano y español
Seguimos escuchando a nuestros clientes, reguladores y partes interesadas para comprender sus necesidades en relación con los programas de auditoría, garantía, certificación y acreditación en Amazon Web Services (AWS). Nos enorgullece anunciar que el informe de controles de sistema y organización (SOC) 1 de AWS se encuentra disponible en japonés, coreano y español. Estos informes traducidos ayudarán a impulsar un mayor compromiso y alineación con los requisitos normativos y de los clientes en Japón, Corea, Latinoamérica y España.
Estas versiones del informe en japonés, coreano y español no contienen la opinión independiente emitida por los auditores, pero se puede acceder a esta información en la versión en inglés del documento. Las partes interesadas deben usar la versión en inglés como complemento de las versiones en japonés, coreano y español.
De aquí en adelante, los siguientes informes trimestrales estarán traducidos. Dado que los controles SOC 1 se incluyen en los informes de primavera y otoño de SOC 2, esta programación brinda una cobertura anual para todos los idiomas traducidos cuando se la combina con las versiones en inglés.
de AWS IAM
Período cubierto
SOC 2 primavera
Del 1 de abril al 31 de marzo
SOC 1 verano
Del 1 de julio al 30 de junio
SOC 2 otoño
Del 1 de octubre al 30 de septiembre
SOC 1 invierno
Del 1 de enero al 31 de diciembre
Los clientes pueden descargar los informes SOC 1 verano 2024 traducidos al japonés, coreano y español a través de AWS Artifact, un portal de autoservicio para el acceso bajo demanda a los informes de conformidad de AWS. Inicie sesión en AWS Artifact mediante la Consola de administración de AWS u obtenga más información en Introducción a AWS Artifact.
El informe SOC 1 verano 2024 incluye un total de 177 servicios que se encuentran dentro del alcance. Para acceder a información actualizada, que incluye novedades sobre cuándo se agregan nuevos servicios, consulte los Servicios de AWS en el ámbito del programa de conformidad y seleccione SOC.
AWS se esfuerza de manera continua por añadir servicios dentro del alcance de sus programas de conformidad para ayudarlo a cumplir con sus necesidades de arquitectura y regulación. Si tiene alguna pregunta o sugerencia sobre la conformidad de los SOC, no dude en comunicarse con su equipo de cuenta de AWS.
Para obtener más información sobre los programas de conformidad y seguridad, consulte los Programas de conformidad de AWS. Como siempre, valoramos sus comentarios y preguntas; de modo que no dude en comunicarse con el equipo de conformidad de AWS a través de la página Contacte con nosotros.
Amazon Web Services (AWS) prioritizes the security, privacy, and performance of its services. AWS is responsible for the security of the cloud and the services it offers, and customers own the security of the hosts, applications, and services they deploy in the cloud. AWS has also been introducing quantum-resistant key exchange in common transport protocols used by our customers in order to provide long-term confidentiality. In this blog post, we elaborate how customer compliance and security configuration responsibility will operate in the post-quantum migration of secure connections to the cloud. We explain how customers are responsible for enabling quantum-resistant algorithms or having these algorithms enabled by default in their applications that connect to AWS. We also discuss how AWS will honor and choose these algorithms (if they are supported on the server side) even if that means the introduction of a small delay to the connection.
Secure connectivity
Security and compliance is a shared responsibility between AWS and the customer. This Shared Responsibility Model can help relieve the customer’s operational burden as AWS operates, manages, and controls the components from the host operating system and virtualization layer down to the physical security of the facilities in which the service operates. The customer assumes responsibility and management of the guest operating system and other associated application software, as well as the configuration of the AWS provided security group firewall. AWS has released Customer Compliance Guides (CCGs) to support customers, partners, and auditors in their understanding of how compliance requirements from leading frameworks map to AWS service security recommendations.
In the context of secure connectivity, AWS makes available secure algorithms in encryption protocols (for example, TLS, SSH, and VPN) for customers that connect to its services. That way AWS is responsible for enabling and prioritizing modern cryptography in connections to the AWS Cloud. Customers, on the other hand, use clients that enable such algorithms and negotiate cryptographic ciphers when connecting to AWS. It is the responsibility of the customer to configure or use clients that only negotiate the algorithms the customer prefers and trusts when connecting.
Prioritizing quantum-resistance or performance?
AWS has been in the process of migrating to post-quantum cryptography in network connections to AWS services. New cryptographic algorithms are designed to protect against a future cryptanalytically relevant quantum computer (CRQC) which could threaten the algorithms we use today. Post-quantum cryptography involves introducing post-quantum (PQ) hybrid key exchanges in protocols like TLS 1.3 or SSH/SFTP. Because both classical and PQ-hybrid exchanges need to be supported for backwards compatibility, AWS will prioritize PQ-hybrid exchanges for clients that support it and classical for clients that have not been upgraded yet. We don’t want to switch a client to classical if it advertises support for PQ.
PQ-hybrid key establishment leverages quantum-resistant key encapsulation mechanisms (KEMs) used in conjunction with classical key exchange. The client and server still do an ECDH key exchange, which gets combined with the KEM shared secret when deriving the symmetric key. For example, clients could perform an ECDH key exchange with curve P256 and post-quantum Kyber-768 from NIST’s PQC Project Round 3 (TLS group identifier X25519Kyber768Draft00) when connecting to AWS Certificate Manager (ACM), AWS Key Management Service (AWS KMS), and AWS Secrets Manager. This strategy combines the high assurance of a classical key exchange with the quantum-resistance of the proposed post-quantum key exchanges, to help ensure that the handshakes are protected as long as the ECDH or the post-quantum shared secret cannot be broken. The introduction of the ML-KEM algorithm adds more data (2.3 KB) to be transferred and slightly more processing overhead. The processing overhead is comparable to the existing ECDH algorithm, which has been used in most TLS connections for years. As shown in the following table, the total overhead of hybrid key exchanges has been shown to be immaterial in typical handshakes over the Internet. (Sources: Blog posts How to tune TLS for hybrid post-quantum cryptography with Kyber and The state of the post-quantum Internet)
Data transferred (bytes)
CPU processing (thousand ops/sec)
Client
Server
ECDH with P256
128
17
17
X25519
64
31
31
ML-KEM-768
2,272
13
25
The new key exchanges introduce some unique conceptual choices that we didn’t have before, which could lead to the peers negotiating classical-only algorithms. In the past, our cryptographic protocol configurations involved algorithms that were widely trusted to be secure. The client and server configured a priority for their algorithms of choice and they picked the more appropriate ones from their negotiated prioritized order. Now, the industry has two families of algorithms, the “trusted classical” and the “trusted post-quantum” algorithms. Given that a CRQC is not available, both classical and post-quantum algorithms are considered secure. Thus, there is a paradigm shift that calls for a decision in the priority vendors should enforce on the client and server configurations regarding the “secure classical” or “secure post-quantum” algorithms.
Figure 1 shows a typical PQ-hybrid key exchange in TLS.
Figure 1: A typical TLS 1.3 handshake
In the example in Figure 1, the client advertises support for PQ-hybrid algorithms with ECDH curve P256 and quantum-resistant ML-KEM-768, ECDH curve P256 and quantum-resistant Kyber-512 Round 3, and classical ECDH with P256. The client also sends a Keyshare value for classical ECDH with P256 and for PQ-hybrid P256+MLKEM768. The Keyshare values include the client’s public keys. The client does not include a Keyshare for P256+Kyber512, because that would increase the size of the ClientHello unnecessarily and because ML-KEM-768 is the ratified version of Kyber Round 3, and so the client chose to only generate and send a P256+MLKEM768 public key. Now let’s say that the server supports ECDH curve P256 and PQ-hybrid P256+Kyber512, but not P256+MLKEM768. Given the groups and the Keyshare values the client included in the ClientHello, the server has the following two options:
Use the client P256 Keyshare to negotiate a classical key exchange, as shown in Figure 1. Although one might assume that the P256+Kyber512 Keyshare could have been used for a quantum-resistant key exchange, the server can pick to negotiate only classical ECDH key exchange with P256, which is not resistant to a CRQC.
Send a Hello Retry Request (HRR) to tell the client to send a PQ-hybrid Keyshare for P256+Kyber512 in a new ClientHello (Figure 2). This introduces a round trip, but it also forces the peers to negotiate a quantum-resistant symmetric key.
Note: A round-trip could take 30-50 ms in typical Internet connections.
Previously, some servers were using the Keyshare value to pick the key exchange algorithm (option 1 above). This generally allowed for faster TLS 1.3 handshakes that did not require an extra round-trip (HRR), but in the post-quantum scenario described earlier, it would mean the server does not negotiate a quantum-resistant algorithm even though both peers support it.
Such scenarios could arise in cases where the client and server don’t deploy the same version of a new algorithm at the same time. In the example in Figure 1, the server could have been an early adopter of the post-quantum algorithm and added support for P256+Kyber512 Round 3. The client could subsequently have upgraded to the ratified post-quantum algorithm with ML-KEM (P256+MLKEM768). AWS doesn’t always control both the client and the server. Some AWS services have adopted the earlier versions of Kyber and others will deploy ML-KEM-768 from the start. Thus, such scenarios could arise while AWS is in the post-quantum migration phase.
Note: In these cases, there won’t be a connection failure; the side-effect is that the connection will use classical-only algorithms although it could have negotiated PQ-hybrid.
These intricacies are not specific to AWS. Other industry peers have been thinking about these issues, and they have been a topic of discussion in the Internet Engineering Task Force (IETF) TLS Working Group. The issue of potentially negotiating a classical key exchange although the client and server support quantum-resistant ones is discussed in the Security Considerations of the TLS Key Share Prediction draft (draft-davidben-tls-key-share-prediction). To address some of these concerns, the Transport Layer Security (TLS) Protocol Version 1.3 draft (draft-ietf-tls-rfc8446bis), which is the draft update of TLS 1.3 (RFC 8446), introduces text about client and server behavior when choosing key exchange groups and the use of Keyshare values in Section 4.2.8. The TLS Key Share Prediction draft also tries to address the issue by providing DNS as a mechanism for the client to use a proper Keyshare that the server supports.
Prioritizing quantum resistance
In a typical TLS 1.3 handshake, the ClientHello includes the client’s key exchange algorithm order of preferences. Upon receiving the ClientHello, the server responds by picking the algorithms based on its preferences.
Figure 2 shows how a server can send a HelloRetryRequest (HRR) to the client in the previous scenario (Figure 1) in order to request the negotiation of quantum-resistant keys by using P256+Kyber512. This approach introduces an extra round trip to the handshake.
Figure 2: An HRR from the server to request the negotiation of mutually supported quantum-resistant keys with the client
AWS services that terminate TLS 1.3 connections will take this approach. They will prioritize quantum resistance for clients that advertise support for it. If the AWS service has added quantum-resistant algorithms, it will honor a client-supported post-quantum key exchange even if that means that the handshake will take an extra round trip and the PQ-hybrid key exchange will include minor processing overhead (ML-KEM is almost performant as ECDH). A typical round trip in regionalized TLS connections today is usually under 50 ms and won’t have material impact to the connection performance. In the post-quantum transition, we consider clients that advertise support for quantum-resistant key exchange to be clients that take the CRQC risk seriously. Thus, the AWS server will honor that preference if the server supports the algorithm.
Pull Request 4526 introduces this behavior in s2n-tls, the AWS open source, efficient TLS library built over other crypto libraries like OpenSSL libcrypto or AWS libcrypto (AWS-LC). When built with s2n-tls, s2n-quic handshakes will also inherit the same behavior. s2n-quic is the AWS open source Rust implementation of the QUIC protocol.
What AWS customers can do to verify post-quantum key exchanges
AWS services that have already adopted the behavior described in this post include AWS KMS, ACM, and Secrets Manager TLS endpoints, which have been supporting post-quantum hybrid key exchange for a few years already. Other endpoints that will deploy quantum-resistant algorithms will inherit the same behavior.
AWS customers that want to take advantage of new quantum-resistant algorithms introduced in AWS services are expected to enable them on the client side or the server side of a customer-managed endpoint. For example, if you are using the AWS Common Runtime (CRT) HTTP client in the AWS SDK for Java v2, you would need to enable post-quantum hybrid TLS key exchanges with the following.
The AWS KMS and Secrets Manager documentation includes more details for using the AWS SDK to make HTTP API calls over quantum-resistant connections to AWS endpoints that support post-quantum TLS.
To confirm that a server endpoint properly prioritizes and enforces the PQ algorithms, you can use an “old” client that sends a PQ-hybrid Keyshare value that the PQ-enabled server does not support. For example, you could use s2n-tls built with AWS-LC (which supports the quantum-resistant KEMs). You could use a client TLS policy (PQ-TLS-1-3-2023-06-01) that is newer than the server’s policy (PQ-TLS-1-0-2021-05-24). That will lead the server to request the client by means of an HRR to send a new ClientHello that includes P256+MLKEM768, as shown following.
The hrr-capture.pcap packet capture will show the negotiation and the HRR from the server.
To confirm that a server endpoint properly implements the post-quantum hybrid key exchanges, you can use a modern client that supports the key exchange and connect against the endpoint. For example, using the s2n-tls client built with AWS-LC (which supports the quantum-resistant KEMs), you could try connecting to a Secrets Manager endpoint by using a post-quantum TLS policy (for example, PQ-TLS-1-2-2023-12-15) and observe the PQ hybrid key exchange used in the output, as shown following.
./bin/s2nc -c PQ-TLS-1-2-2023-12-15 secretsmanager.us-east-1.amazonaws.com 443
CONNECTED:
Handshake: NEGOTIATED|FULL_HANDSHAKE|MIDDLEBOX_COMPAT
Client hello version: 33
Client protocol version: 34
Server protocol version: 34
Actual protocol version: 34
Server name: secretsmanager.us-east-1.amazonaws.com
Curve: NONE
KEM: NONE
KEM Group: SecP256r1Kyber768Draft00
Cipher negotiated: TLS_AES_128_GCM_SHA256
Server signature negotiated: RSA-PSS-RSAE+SHA256
Early Data status: NOT REQUESTED
Wire bytes in: 6699
Wire bytes out: 1674
s2n is ready
Connected to secretsmanager.us-east-1.amazonaws.com:443
Cryptographic migrations can introduce intricacies to cryptographic negotiations between clients and servers. During the migration phase, AWS services will mitigate the risks of these intricacies by prioritizing post-quantum algorithms for customers that advertise support for these algorithms—even if that means a small slowdown in the initial negotiation phase. While in the post-quantum migration phase, customers who choose to enable quantum resistance have made a choice which shows that they consider the CRQC risk as important. To mitigate this risk, AWS will honor the customer’s choice, assuming that quantum resistance is supported on the server side.
If you have feedback about this post, submit comments in the Comments section below. If you have questions about this post, start a new thread on the AWS Security, Identity, & Compliance re:Post or contact AWS Support. For more details regarding AWS PQC efforts, refer to our PQC page.
Customers are finding several advantages to using generative AI within their applications. However, using generative AI adds new considerations when reviewing the threat model of an application, whether you’re using it to improve the customer experience for operational efficiency, to generate more tailored or specific results, or for other reasons.
Generative AI models are inherently non-deterministic, meaning that even when given the same input, the output they generate can vary because of the probabilistic nature of the models. When using managed services such as Amazon Bedrock in your workloads, there are additional security considerations to help ensure protection of data that’s accessed by Amazon Bedrock.
In this blog post, we discuss the current challenges that you may face regarding data controls when using generative AI services and how to overcome them using native solutions within Amazon Bedrock and layered authorization.
Definitions
Before we get started, let’s review some definitions.
Amazon Bedrock Agents: You can use Amazon Bedrock Agents to autonomously complete multistep tasks across company systems and data sources. Agents can be used to enrich entry data to provide more accurate results or to automate repetitive tasks. Generative AI agents can make decisions based on input and the environmental data they have access to.
Layered authorization: Layered authorization is the practice of implementing multiple authorization checks between the application components beyond the initial point of ingress. This includes service-to-service authorization, carrying the true end-user identity through application components, and adding end-user authorization for each operation in addition to the service authorization.
Trusted identity propagation: Trusted identity propagation provides more simply defined, granted, and logged user access to AWS resources. Trusted identity propagation is built on the OAuth 2.0 authorization framework, which allows applications to access and share user data securely without the need to share passwords.
Amazon Verified Permissions: Amazon Verified Permissions is a fully managed authorization service that uses the provably correct Cedar policy language, so you can build more secure applications.
Challenge
As you build on AWS, there are several services and features that you can use to help ensure your data or your customers’ data is secure. This might include encryption at-rest with Amazon Simple Storage Service (Amazon S3) default encryption or AWS Key Management Service (AWS KMS) keys, or the use of prefixes in Amazon S3 or partition keys in Amazon DynamoDB to separate tenants’ data. These mechanisms are great for dealing with data at-rest and separation of data partitions, but after a generative AI powered application enables customers to access a variety of data (different sensitivity types of data, multiple tenants’ data, and so on) based on user input, the risk of disclosure of sensitive data increases (see the data privacy FAQ for more information about data privacy at AWS). This is because access to data is now being passed to an untrusted identity (the model) within the workload operating on behalf of the calling principal.
Many customers are using Amazon Bedrock Agents in their architecture to augment user input with additional information to improve responses. Agents might also be used to automate repetitive tasks and streamline workflows. For example, chatbots can be useful tools for improving user experiences, such as summarizing patient test results for healthcare providers. However, it’s important to understand the potential security risks and mitigation strategies when implementing chatbot solutions.
A common architecture involves invoking a chatbot agent through an Amazon API Gateway. The API gateway validates the API call using an Amazon Cognito or AWS Lambda authorizer and then passes the request to the chatbot agent to perform its function.
A potential risk arises when users can provide input prompts to the chatbot agent. This input could lead to prompt injection (OWASP LLM:01) or sensitive data disclosure (OWASP LLM:06) vulnerabilities. The root cause is that the chatbot agent often requires broad access permissions through an AWS Identity and Access Management (IAM) service role with access to various data stores (such as S3 buckets or databases), to fulfill its function. Without proper security controls, a threat actor from one tenant could potentially access or manipulate data belonging to another tenant.
Solution
While there is no single solution that can mitigate all risks, having a proper threat model of your consumer application to identify risks (such unauthorized access to data) is critical. AWS offers several generative AI security strategies to assist you in generating appropriate threat models. In this post, we focus on layered authorization throughout the application, focusing on a solution to support a consumer application.
By using a strong authentication process such as an OpenID Connect (OIDC) identity provider (IdP) for your consumers enhanced with multi-factor authentication (MFA), you can govern access to invoke the agents at the API gateway. We recommend that you also pass custom parameters to the agent—as shown in Figure 1, using the JWT token from the header of the request. With such a configuration, the agent will evaluate an isAuthorized request with Amazon Verified Permissions to confirm that the calling user has access to the data requested prior to the agent running its described function. This architecture is shown in Figure 1:
Figure 1: Authorization architecture
The steps of the architecture are as follows:
The client connects to the application frontend.
The client is redirected to the Amazon Cognito user pool UI for authentication.
The client receives a JWT token from Amazon Cognito.
The application frontend uses the JWT token presented by the client to authorize a request to the Amazon Bedrock agent. The application frontend adds the JWT token to the InvokeAgent API call.
The agent reviews the request, calls the knowledge base if required, and calls the Lambda function. The agent includes the JWT token provided by the application frontend into the Lambda invocation context.
The Lambda function uses the JWT token details to authorize subsequent calls to DynamoDB tables using Verified Permissions (6a), and calls the DynamoDB table only if the call is authorized (6b).
Deep dive
When you design an application behind an API gateway that triggers Amazon Bedrock agents, you must create an IAM service role for your agent with a trust policy that grants AssumeRole access to Amazon Bedrock. This role should allow Amazon Bedrock to get the OpenAPI schema for your agent Action Group Lambda function from the S3 bucket and allow for the bedrock:InvokeModel action to the specified model. If you did not select the default KMS key to encrypt your agent session data, you must grant access in the IAM service role to access the customer managed KMS key. Example policies and trust relationship are shown in the following examples.
The following policy grants permission to invoke an Amazon Bedrock model. This will be granted to the agent. In the resource, we are specifically targeting an approved foundational model (FM).
Next, we add a policy statement that allows the Amazon Bedrock agent access to S3:GetObject and targets a specific S3 bucket with a condition that the account number matches one within our organization.
Finally, we add a trust policy that grants Amazon Bedrock permissions to assume the defined role. We have also added conditional statements to make sure that the service is calling on behalf of our account to help prevent the confused deputy problem.
Amazon Bedrock agents use a service role and don’t propagate the consumer’s identity natively. This is where the underlying problem of protecting tenants’ data might exist. If the agent is accessing unclassified data, then there’s no need to add layered authorization because there’s no additional segregation of access needed based on the authorization caller. But if the application has access to sensitive data, you must carry authorization into processing the agent’s function.
You can do this by adding an additional layer to the Lambda function triggered by invoking the agent. First, initialize the agent to make an isAuthorized call to Verified Permissions. Only upon an Allow response will the agent perform the rest of its function. If the response from Verified Permissions is Deny, then the agent should return a status 403 or a friendly error message to the user.
Verified Permissions must have pre-built policies to dictate how authorization should occur when data is being accessed. For example, you might have a policy like the following to grant access to patient records if the calling principal is a doctor.
permit(
  principal in Group::"doctor",
  action == Action::"view",
  resource
 )
 when {
 resource.fileType == Sensitive &&
 resource.patient == doctor.patient
};
In this example, the authorization logic to handle this decision is within the agent Lambda. To do so, the Lambda function first builds the entities structure by decoding the JWT passed as a custom parameter to the Amazon Bedrock agent to assess the calling principal’s access. The requested data should also be included in the isAuthorized call. After this data is passed to Verified Permissions, it will assess the access decision based on the context provided and the policies within the policy store. As a policy decision point (PDP), it’s important to note that the allow or deny decision must be enforced at the application level. Based on this decision, access to the data will be allowed or denied. The resources being accessed should be categorized to help the application evaluate access control. For example, if the data is stored in DynamoDB, then patients might be separated by partition keys that are defined in the Verified Permissions schema and referenced in a hierarchal sense.
Conclusion
In this post, you learned how you can improve data protection by using AWS native services to enforce layered authorization throughout a consumer application that uses Amazon Bedrock Agents. This post has shown you the steps to improve enforcement of access controls through identity processes. This can help you build applications using Amazon Bedrock Agents and maintain strong isolation of data to mitigate unintended sensitive data disclosure.
We recommend the Secure Generative AI Solutions using OWASP Framework workshop to learn more about using Verified Permissions and Amazon Bedrock Agents to enforce layered authorization throughout an application.
If you have feedback about this post, submit comments in the Comments section below. If you have questions about this post, contact AWS Support.
Amazon Web Services (AWS) customers of various sizes across different industries are pursuing initiatives to better classify and protect the data they store in Amazon Simple Storage Service (Amazon S3). Amazon Macie helps customers identify, discover, monitor, and protect sensitive data stored in Amazon S3. However, it’s important that customers evaluate and test the capabilities of Macie to verify that they can meet their specific data identification and protection goals. In this post, we show you how to define and run a proof of concept (POC) to validate using Macie and automated discovery to enhance your current data protection strategies. The POC steps demonstrate how you can use Macie to detect and alert you to sensitive data discovered in your AWS environment and help you determine the value of using Macie to enhance your current data protection strategies.
Note: This POC uses some features that offer a 30-day free trial and other features that will incur minimal charges during the POC phase. We highlight and summarize these throughout this post.
Data security business challenges
Data security is a broad concept that revolves around protecting digital information from unauthorized access, corruption, theft, and other forms of malicious activity throughout its lifecycle. There’s an exponential growth of digital data and organizations are grappling with not only managing it but also determining where their sensitive data exists. Additionally, many organizations have compliance requirements from government regulators and industry standards, such as PCI DSS or HIPAA. Organizations want to move fast, which means giving developers the tools to build quickly to stay ahead, while making sure that the correct data classification policies are defined and enforced.
Macie features
Amazon Macie is a data security service that discovers sensitive data using machine learning and pattern matching, provides visibility into data security risks, and enables automated protection against those risks. The following is a summary of the key features of Macie, many of which will be used in this POC. The core capabilities of Macie are focused on the security of your S3 buckets and helping to identify sensitive data including financial data, personal data, and credentials as well as sensitive data that’s unique to your organization, such as intellectual property.
S3 bucket security
Customers use Amazon S3 for a variety of use cases and store various types of data in S3 buckets, including sensitive data. Continuously monitoring these buckets for the presence of sensitive data is a vital part of a data protection strategy. Macie gives you visibility into your S3 bucket inventory and the security and access controls associated with your buckets. This visibility includes if the bucket is publicly accessible, the encryption level of the bucket, and if the bucket is shared with other accounts. Whenever the security posture of one of your buckets is reduced, Macie generates a finding about the change, enabling you to respond. These findings are consumable through the AWS Management Console for Macie, through Macie APIs, as Amazon EventBridge messages, or through AWS Security Hub.
Sensitive data discovery jobs
Sensitive data discovery jobs provide a way to target a specific S3 bucket or group of buckets to do a deep analysis of the objects in those buckets and identify if sensitive data is present in the objects and if so, the type of data. These jobs can run on a daily, weekly, or monthly basis for new or changed data or once for on-demand analysis.
Automated data discovery
Macie offers an automated data discovery feature that can continually discover sensitive data within your S3 buckets. This feature is intended to help customers who have large amounts of S3 buckets and data better understand where sensitive data might be stored without having to scan all their data. By using automated data discovery, you can focus your resources on deeper investigations of the security of buckets identified to have sensitive data. Macie selects samples of the objects within S3 buckets and inspects them for the presence of sensitive data daily, providing insight into where sensitive data might reside in your overall Amazon S3 data estate.
POC overview
This POC is intended to help you gain an understanding of what Macie is capable of and how you can use it to achieve your data discovery goals. The POC in this post includes the following tasks in Macie:
Reviewing managed data identifiers
Defining custom data identifiers
Staging POC data
Running a sensitive data discovery job
Reviewing the output of the discovery job
Enabling and reviewing the output of automated data discovery
Note: The amount of time required for each task depends on your preparation and analysis for each stage. Note that, in the automated data discovery phase, it will take 24–48 hours for Macie to perform the first scan after the feature is enabled.
Enable Macie
Macie must be enabled before you can proceed with the POC. If you haven’t yet enabled Macie, see Enable Macie for instructions.
Note: When you enable Macie and the 30-day free trial for S3, monitoring S3 bucket security and privacy is automatically enabled. There’s also a 30-day free trial for automated data discovery, which is covered later in this post. There is no free trial for running targeted data discovery jobs. Review the Macie pricing page for details.
Review managed data identifiers
A successful POC of Macie includes understanding what data Macie can detect. Macie comes with over 150 managed data identifiers that are designed to identify sensitive data in your S3 objects. It’s important to first understand the available managed data identifiers and which ones align with the use cases you want to address. Examples of Macie managed data identifiers include credit card numbers, AWS secret access keys, and national identification numbers. Macie offers a default collection of recommend managed data identifiers to use for detecting general categories and types of sensitive data while optimizing data discovery results and reducing noise.
Keywords are an important component for Macie to be able to detect sensitive data. Many managed data identifiers require keywords to be in proximity of the data for Macie to be able to detect findings. Understanding the keywords that are used as part of sensitive data detection is important when it comes to building test data for a POC.
Prior to beginning your POC, review the list of managed data identifiers and determine which ones you feel will be necessary to use for your data discovery requirements. Additionally, identify which managed data identifiers, which are applicable to your POC, fall outside of the default list of identifiers.
Define custom data identifiers
Macie covers a wide number of use cases with its managed data identifiers, but some use cases need custom data identifiers for data types that aren’t included in the managed data identifiers. For example, customers might need to identify sensitive data that’s specific to their company, such as an employee ID or project number. Other customers might operate in industries that have data types unique to that industry, such as a known traveler number in the airline industry. If your requirements for identifying sensitive data include detecting sensitive data that isn’t part of the current list of managed data identifiers, then you can create custom data identifiers for those data types. For a POC, you might not want to create a custom data identifier for every additional detection. Instead, you can create a few to help confirm that you can use custom data identifiers for sensitive data detection and that Macie can support your data discovery goals. Building custom data identifiers has a thorough explanation of how to define a custom data identifier. Similar to managed data identifiers, custom data identifiers have keyword requirements. Defining detection criteria for custom data identifiers provides details for the types of data that require keywords.
Stage POC data
After reviewing the managed data identifiers provided by Macie and creating the custom data identifiers needed for your POC, it’s time to stage data sets that will help demonstrate the capabilities of these identifiers and better understand how Macie identifies sensitive data. We recommend that you stage data sets that contain sensitive data as well as data sets that do not to gain a full understanding of how Macie detects and reports on each of these situations. You can stage a variety of data sets to use for your POC using just a few GB of data to help keep your initial POC scans’ cost low. Staged data must be in file formats that Macie supports.
When preparing data to stage, keep in mind the keyword requirements for many of the Macie managed data identifiers. To determine which managed data identifiers have keyword requirements, see Managed data identifiers by type. When you’re staging your data, reference the keywords that are supported for the managed data identifiers you are using to help ensure that the data can be identified in your POC tests.
We recommend staging the data in one S3 bucket that’s dedicated to the POC and to use S3 server-side encryption on the bucket. If you want to use a customer managed AWS KMS key to encrypt the S3 data at rest, follow the instructions in Allowing Macie to use a customer managed AWS KMS key to give Macie access to decrypt the data in the bucket. You should also follow best practices for the S3 bucket related to not allowing public access and implementing least privilege access.
You can use one or more of the following approaches to identify and stage data for your POC:
Stage data files created by synthetic data generator tools with sensitive data included. There are many tools available for generating sensitive data. The following are two that you can use to generate test data.
Stage data files from public data repositories. There are various repositories staged with information that could be used for sensitive data detection. These repositories are often comprised of publicly available data sets or were created to help with testing machine learning models or sensitive data detection.
Stage data files of your own data with sensitive information. Because the goal is to use Macie to identify sensitive information in your S3 buckets, including examples of your own data that contains sensitive information can be helpful to test the capabilities of Macie.
Stage data files that don’t contain sensitive information. This can help you understand how Macie handles data that you believe doesn’t contain sensitive information. With the managed data identifiers that Macie offers, you should stage data files that you believe don’t contain information that aligns to the managed data identifiers. The staged data files could be log files, documents, or data sets that meet the criteria of this step.
Stage data that contains information that’s representative of data that you would want to detect using custom data identifiers.
Run a data classification job
Now that you’ve reviewed the managed data identifiers, defined custom data identifiers, and staged sample data, it’s time to run a sensitive data discovery job. When configuring the job scope, we recommend the following:
A specific S3 bucket where the POC data is staged.
The scope is set to be a one-time job.
Leave the sampling depth at 100 percent. Most customers leave this value at 100 percent, but some will lower it if they want a smaller random sample scan of their data. Most customers use automated data discovery to get sample scans instead of adjusting the sampling depth for individual jobs.
Select the recommended managed data identifiers. If your testing requires that Macie identify additional sensitive data types that are offered as managed data identifiers but aren’t part of the recommended list, choose the Custom option and select the managed data identifiers that you need. Make sure that the recommended managed data identifiers are part of the custom list that you construct.
Choose the custom data identifiers that you want to be used in the job.
After you configure your job, give it a name, review the final configuration, and then submit the job to run. A job that uses a data set of a few GB should complete within 30 minutes.
Review the findings from your job
After the job completes, it’s time to review what Macie found in the data. Objects that Macie found with sensitive data will be presented as Findings in the Macie console. From the Jobs screen, choose the job you submitted. In the right-hand window, you will see the overview information for the job. From the overview window you can choose Show results menu and then select Show findings to view a list of the findings that were generated by the job.
Figure 1: Viewing Macie job findings
Each object where Macie found sensitive data will be listed as a single finding. If there were multiple types of sensitive data found in the object, each type of sensitive data and a count will be included in the details. Choose each of the findings that was produced and review the details to confirm what sensitive data was identified and if the sensitive data was discovered as you expected. Additionally, confirm that you don’t have findings for objects that you staged that were not supposed to have sensitive data so that you can confirm how Macie handles these types of objects. If you created custom data identifiers, review findings for the objects that included the custom data that you detect to confirm that the data was detected.
Enable automated discovery
Now that you understand how to use Macie to discover sensitive data, the next step in the POC is to enable automated discovery and use Macie to discover sensitive data across a larger collection of your existing S3 data.
You will be enabling automated discovery in Macie as a 30-day free trial. For the free trial, the scope of total data storage to be evaluated will be 150 GB. Use the following steps to guide your setup of the automated discovery feature:
After your delegated administrator account is configured, enable automated discovery. As part of enabling automated discovery, pay extra attention to the following items:
Set managed data identifiers. Ideally, choose the recommended data identifiers to help reduce noise. If there are specific managed data identifiers that you really want to see, then choose Custom to choose the ones you want.
Include custom data identifiers that you want to be used to evaluate your sensitive data.
Exclude buckets that you don’t want included in the scope for identifying sensitive data.
Include or exclude specific accounts that should be part of the POC. Step 5 of Enable automated discovery covers how to enable it for specific accounts.
You will see the first set of results 24 to 48 hours after you enable automated discovery. After that, you will see updates to the automated discovery results every 24 hours.
After automated discovery starts producing results, you will start seeing data in the Automated Discovery section of the Macie summary page in the console. The summary includes metrics for the total number of buckets eligible for discovery, counts for the number of buckets where sensitive data was or was not found, and how many of these buckets are public.
Figure 2: Example automated discovery summary metrics
Choosing a link for one of the counts will take you to the S3 buckets view with the appropriate filters applied.
After reviewing the summary screen, choose S3 buckets from the navigation pane to see a heatmap that shows each account and the buckets within each account.
Figure 3: S3 bucket heatmap view in Macie
The heatmap provides point-in-time insights into the data that Macie has scanned, and in which buckets sensitive data has been identified or no sensitive data has been found.
Over time, this heatmap might change as automated data discovery continues sampling the data in each bucket. The heatmap view provides information on each organizational member account and insight about sensitive data within each bucket in the account.
The console displays the results as a set of colored squares for each account. Each square represents a bucket in that account and the color of the square indicates whether sensitive data was discovered in that bucket. Red indicates that some type of sensitive data has been found in the bucket, while blue indicates no sensitive data has been identified. If a bucket is blue, that means only that automated data discovery hasn’t identified sensitive data up to the point in time of the last scan, not that there is no sensitive data in the bucket.
Hover over each bucket to see a summary of the sensitivity score of the bucket along with statistics about the data in the bucket. Choosing a bucket in the heatmap will open a window that provides more information about the bucket. This information includes the sensitivity score of the bucket, a summary of the types of sensitive data found in the bucket, which objects within the bucket have been sampled, statistics related to the data that has been scanned and data that is still to be scanned, and other information about the bucket.
Figure 4: S3 bucket sensitivity information in Macie
As part of your POC, it’s recommended that you investigate buckets that are reported to contain sensitive data. For your investigation, validate if the data identified is sensitive based on your organization’s data classification policy. Each Macie finding contains not only the details on the types of sensitive data identified, but also the location within the file where the sensitive data is located so that you can confirm the identified data is sensitive. The following is an example of a Macie finding in an Excel file where bank account numbers were found. This example shows the row and column where the sensitive data was found.
Investigating sensitive data with findings has detailed guidance around locating sensitive data from Macie findings, retrieving the sensitive data, and the schema for sensitive data locations. If the findings are true positives, make sure that the bucket has the right level of security configurations and permissions based on the data stored in the bucket.
In addition to reviewing the bucket level statistics that are generated by automated discovery, you can view the individual findings that were generated for each S3 object that was identified as having sensitive data. You can view the findings through the Findings tab in Macie or by choosing the sensitive data type when looking at the summary detections for a bucket.
Next steps
With the preceding POC, you should now have a more complete understanding of how Macie identifies sensitive data and how you can use the information that Macie provides about that data identified. As you complete your POC, there are a few next steps that other customers have taken after completing their POC with Macie.
Operationalize Macie output
In the POC steps, we outlined how to view the findings and the insights that the automated discovery provides. Before you proceed with Macie, you should have a plan for how you will operationalize the Macie output. This will help ensure that the remediation steps for identified sensitive data are directed to the correct parties.
Depending on what operational tools you have in place, the steps that you take to operationalize the output of Macie will vary. Many customers implement operational processes that cover the following areas:
The privacy or security team that’s responsible for Macie does an initial triage on the findings to confirm if there are true positives.
The privacy or security team defines their operational processes related to the summary dashboard and bucket sensitivity information that’s provided by automated discovery.
The team that owns the bucket where the sensitive data is located is provided the information needed to investigate the identified data and provide a response. Responses will vary but could include removal of the data, correcting the application that is writing the data, or applying additional security to the bucket.
A key part of operationalizing Macie output is also how you are getting and reviewing the signals related to Macie findings. As outlined in this post, you can view and investigate findings in the Macie console. At a steady state, customers find it beneficial to consume Macie findings using Amazon EventBridge, through Macie APIs, or through the integration of Macie with AWS Security Hub. These options can be used to incorporate the findings that are reported by Macie into the operational workflows and tools that work best for your organization and allow you to consume and address findings at scale. Monitoring and processing findings provides more insight into these integration approaches.
Store and retain sensitive data discovery results
As you move forward with Macie, it’s important to enable logging for each of the S3 objects that Macie has scanned. Macie creates an analysis record for each S3 object that’s in scope for a data discovery job or an automated discovery scan. These records are an audit of every object that Macie attempted to scan, including objects that didn’t contain sensitive data. Data discovery results are written to an S3 bucket that you own and where you control the data retention. These data discovery results can assist with analysis of records over time or to get a broader sense of what data Macie has scanned and which objects had sensitive data and which did not.
The data discovery scan results are stored as JSON Lines files. You can use multiple approaches to analyze and query these log files. The Amazon Macie Results Analytics GitHub repository provides instructions on how to configure Amazon Athena with tables that allow you to query the results of Macie discovery scan files.
Define the scope for Macie use
After a POC with Macie, you can set the scope of how you will use Macie in production by deciding which buckets don’t need to be evaluated and so can be excluded, such as buckets used for AWS logs and buckets deemed not in scope for sensitive data identification.
You can also refine the managed data identifiers that are required for detecting sensitive data. Based on what they learned from the POC. You can create custom data identifiers to help meet your data detection needs if necessary.
As you identify the sensitive data discovery jobs to run as part of your production use of Macie, keep in mind that these jobs are immutable. To edit an existing scheduled job, you must create a copy of the job with the updated configuration and cancel the original job for changes to take effect. Depending on the updated criteria for your job, you must do one of the following to help avoid re-scanning objects that were covered by the previous job:
Clear include existing objects when setting the scope. This will cause the new job to schedule only objects that were created between when it was first created and when it was run for the first time.
When setting the job scope, set the object attributes so that the object last modified date is the date of the last time the previous job ran. This helps ensure that when the new scheduled job runs, it evaluates only objects that weren’t covered by the previous job.
Clean up
To avoid incurring additional charges, disable Macie while you evaluate the value of the additional data protection provided. If S3 buckets were created for this POC, those should also be deleted.
Call to action
After the POC is complete, evaluate the results to determine how much using Macie can strengthen your organization’s data protection program. Based on that evaluation, you can identify how and where to use Macie for maximum effectiveness. Also consider how the information provided can be factored into operational workflows to get additional value from Macie.
Conclusion
This post outlined how you can use a POC to better understand how Amazon Macie can help meet your data discovery and classification needs. A well thought-out and implemented POC can provide valuable early insights and help you develop a more thorough understanding of what your data discovery and classification strategy should be. Planning your POC using the guidance in this post can help you determine more quickly if Macie is a fit for your company.
If you have feedback about this post, submit comments in the Comments section below. If you have questions about this post, contact AWS Support.
AWS Network Firewall is a managed firewall service that makes it simple to deploy essential network protections for your virtual private clouds (VPCs) on AWS. Network Firewall automatically scales with your traffic, and you can define firewall rules that provide fine-grained control over network traffic.
When you work with security products in a production environment, you need to maintain a consistent effort to keep the security rules synchronized as you make modifications to your environment. To stay aligned with your organization’s best practices, you should diligently review and update security rules, but this can increase your team’s operational overhead.
Since the launch of Network Firewall, we have added new capabilities that simplify your efforts by using managed rules and automated methods to help keep your firewall rules current. This approach can streamline operations for your team and help enhance security by reducing the risk of failures stemming from manual intervention or customer automation processes. You can apply regularly updated security rules with just a few clicks, enabling a wide range of comprehensive protection measures.
In this blog post, I discuss three features—managed rule groups, prefix lists, and tag-based resource groups—offering an in-depth look at how Network Firewall operates to assist you in keeping your rule sets current and effective.
Prerequisites
If this is your first time using Network Firewall, make sure to complete the following prerequisites. However, if you already created rule groups, a firewall policy, and a firewall, then you can skip this section.
AWS managed rule groups are collections of predefined, ready-to-use rules that AWS maintains on your behalf. You can use them to address common security use cases and help protect your environment from various types of threats. This can help you stay current with the evolving threat landscape and security best practices.
AWS managed rule groups are available for no additional cost to customers who use Network Firewall. When you work with a stateful rule group—a rule group that uses Suricata-compatible intrusion prevention system (IPS) specifications—you can integrate managed rules that help provide protection from botnet, malware, and phishing attempts.
AWS offers two types of managed rule groups: domain and IP rule groups and threat signature rule groups. AWS regularly maintains and updates these rule groups, so you can use them to help protect against constantly evolving security threats.
When you use Network Firewall, one of the use cases is to protect your outbound traffic from compromised hosts, malware, and botnets. To help meet this requirement, you can use the domain and IP rule group. You can select domain and IP rules based on several factors, such as the following:
Domains that are generally legitimate but now are compromised and hosting malware
Domains that are known for hosting malware
Domains that are generally legitimate but now are compromised and hosting botnets
Domains that are known for hosting botnets
The threat signature rule group offers additional protection by supporting several categories of threat signatures to help protect against various types of malware and exploits, denial of service attempts, botnets, web attacks, credential phishing, scanning tools, and mail or messaging attacks.
Figure 1 illustrates the use of AWS managed rules. It shows both the domain and IP rule group and the threat signature rule group, and it includes one specific rule or category from each as a demonstration.
Figure 1: Network Firewall deployed with AWS managed rules
As shown in Figure 1, the process for using AWS managed rules has the following steps:
The Network Firewall policy contains managed rules from the domain and IP rule groups and threat signature rule groups.
If the traffic from a protected subnet passes the checks of the firewall policy as it goes to the Network Firewall endpoint, then it proceeds to the NAT gateway and the internet gateway (depicted with the dashed line in the figure).
If traffic from a protected subnet fails the checks of the firewall policy, the traffic is dropped at the Network Firewall endpoint (depicted with the dotted line).
Inner workings of AWS managed rules
Let’s go deeper into the underlying mechanisms and processes that AWS uses for managed rules. After you configure your firewall with these managed rules, you gain the benefits of the up-to-date rules that AWS manages. AWS pulls updated rule content from the managed rules provider on a fixed cadence for domain-based rules and other managed rule groups.
The Network Firewall team operates a serverless processing pipeline powered by AWS Lambda. This processes the rules from the vendor source, first fetching them so that they can be manipulated and transformed into the managed rule groups. Then the rules are mapped to the appropriate category based on their metadata. The final rules are uploaded to Amazon Simple Storage Service (Amazon S3) to prepare for propagation in each AWS Region.
Finally, Network Firewall processes the rule group content Region by Region, updating the managed rule group object associated with your firewall with the new content from the vendor. For threat signature rule groups, subscribers receive an SNS notification, letting them know that the rules have been updated.
AWS handles the tasks associated with this process so you can deploy and secure your workloads while addressing evolving security threats.
Network Firewall and prefix lists
Network Firewall supports Amazon Virtual Private Cloud (Amazon VPC) prefix lists to simplify management of your firewall rules and policies across your VPCs. With this capability, you can define a prefix list one time and reference it in your rules later. For example, with prefix lists, you can group multiple CIDR blocks into a single object instead of managing them at an individual IP level by creating a prefix list for their specific use case.
AWS offers two types of prefix lists: AWS-managed prefix lists and customer-managed prefix lists. In this post, we focus on customer-managed prefix lists. With customer-managed prefix lists, you can define and maintain your own sets of IP address ranges to meet your specific needs. Although you operate these prefix lists and can add and remove IP addresses, AWS controls and maintains the integration of these prefix lists with Network Firewall.
Figure 2 illustrates Network Firewall deployed with a prefix list.
Figure 2: Network Firewall deployed with prefix list
As shown in Figure 2, we use the same design as in our previous example:
We use a prefix list that is referenced in our rule group.
The traffic from the protected subnet goes through the Network Firewall endpoint and NAT gateway and then to the internet gateway. As it passes through the Network Firewall endpoint, the firewall policy that contains the rule group determines if the traffic is allowed or not according to the policy.
Inner workings of prefix lists
After you configure a rule group that references a prefix list, Network Firewall automatically keeps the associated rules up to date. Network Firewall creates an IP set object that corresponds to this prefix list. This IP set object is how Network Firewall internally tracks the state of the prefix list reference, and it contains both resolved IP addresses from the source and additional metadata that’s associated with the IP set, such as which rule groups reference it. AWS manages these references and uses them to track which firewalls need to be updated when the content of these IP sets change.
The Network Firewall orchestration engine is integrated with prefix lists, and it works in conjunction with Amazon VPC to keep the resolved IPs up to date. The orchestration engine automatically refreshes IPs associated with a prefix list, whether that prefix list is AWS-managed or customer-managed.
When you use a prefix list with Network Firewall, AWS handles a significant portion of the work on your behalf. This managed approach simplifies the process while providing the flexibility that you need to customize the allow or deny list of IP addresses according to your specific security requirements.
Network Firewall and tag-based resource groups
With Network Firewall, you can now use tag-based resource groups to simplify managing your firewall rules. A resource group is a collection of AWS resources that are in the same Region, and that match the criteria specified in the group’s query. A tag-based resource group bases its membership on a query that specifies a list of resource types and tags. Tags are key value pairs that help identify and sort your resources within your organization.
In your stateful firewall rules, you can reference a resource group that you have created for a specific set of Amazon Elastic Compute Cloud (Amazon EC2) instances or elastic network interfaces (ENIs). When these resources change, you don’t have to update your rule group every time. Instead, you can use a tagging policy for the resources that are in your tag-based resource group.
As your AWS environment changes, it’s important to make sure that new resources are using the same egress rules as the current resources. However, managing the changing EC2 instances due to workload changes creates an operational overhead. By using tag-based resource groups in your rules, you can eliminate the need to manually manage the changing resources in your AWS environment.
To use Network Firewall resource groups with a stateful rule group
Create Network Firewall resource groups – Create a resource group for each of two applications. For the example in this blog post, enter the name rg-app-1 for application 1, and rg-app-2 for application 2.
Update your existing rule group that you created as a part of the Prerequisites for this post or create a new rule group. In the IP set references section, select Edit; and in the Resource ID section, choose the resource groups that you created in the previous step (rg-app-1 and rg-app-2).
Now as your EC2 instance or ENIs scale, those resources stay in sync automatically.
Figure 3 illustrates resource groups with a stateful rule group.
Figure 3: Network Firewall deployed with resource groups
As shown in Figure 3, we tagged the EC2 instances as app-1 or app-2. In your stateful rule group, restrict access to a website for app-2, but allow it for app-1:
We use the resource group that is referenced in our rule group.
The traffic from the protected subnet goes through the Network Firewall endpoint and the NAT gateway and then to the internet gateway. As it passes through the Network Firewall endpoint, the firewall policy that contains the rule group referencing the specific resource group determines how to handle the traffic. In the figure, the dashed line shows that the traffic is allowed while the dotted line shows it’s denied based on this rule.
Inner workings of resource groups
For tag-based resource groups, Network Firewall works with resource groups to automatically refresh the contents of the Network Firewall resource groups. Network Firewall first resolves the resources that are associated with the resource group, which are EC2 instances or ENIs that match the tag-based query specified. Then it resolves the IP addresses associated with these resources by calling the relevant Amazon EC2 API.
After the IP addresses are resolved, through either a prefix list or Network Firewall resource group, the IP set is ready for propagation. Network Firewall uploads the refreshed content of the IP set object to Amazon S3, and the data plane capacity (the hardware responsible for packet processing) fetches this new configuration. The stateful firewall engine accepts and applies these updates, which allows your rules to apply to the new IP set content.
By using tag-based resource groups within your workloads, you can delegate a substantial amount of your firewall management tasks to AWS, enhancing efficiency and reducing manual efforts on your part.
Considerations
When you use a managed rule group in your firewall policy, you can edit the following setting: Set rule actions to alert. This will override all rule actions in the rule group to alert which is useful for testing a rule group before using it control your traffic.
When working with prefix lists and resource groups, make sure that you understand the Limits for IP set references.
Conclusion
In this blog post, you learned how to use Network Firewall managed rule groups, prefix lists, and tag-based resource groups to harness the automation and user-friendly capabilities of Network Firewall. You also learned more detail about how AWS operates these features on your behalf, to help you deploy a simple-to-use and secure solution. Enhance your current or new Network Firewall deployments by integrating these features today.
If you have feedback about this post, submit comments in the Comments section below. If you have questions about this post, contact AWS Support.
The collective thoughts of the interwebz
Manage Consent
To provide the best experiences, we use technologies like cookies to store and/or access device information. Consenting to these technologies will allow us to process data such as browsing behavior or unique IDs on this site. Not consenting or withdrawing consent, may adversely affect certain features and functions.
Functional
Always active
The technical storage or access is strictly necessary for the legitimate purpose of enabling the use of a specific service explicitly requested by the subscriber or user, or for the sole purpose of carrying out the transmission of a communication over an electronic communications network.
Preferences
The technical storage or access is necessary for the legitimate purpose of storing preferences that are not requested by the subscriber or user.
Statistics
The technical storage or access that is used exclusively for statistical purposes.The technical storage or access that is used exclusively for anonymous statistical purposes. Without a subpoena, voluntary compliance on the part of your Internet Service Provider, or additional records from a third party, information stored or retrieved for this purpose alone cannot usually be used to identify you.
Marketing
The technical storage or access is required to create user profiles to send advertising, or to track the user on a website or across several websites for similar marketing purposes.