Post Syndicated from dboyne original https://aws.amazon.com/blogs/compute/icymi-serverless-q2-2022/
Welcome to the 18th edition of the AWS Serverless ICYMI (in case you missed it) quarterly recap. Every quarter, we share all the most recent product launches, feature enhancements, blog posts, webinars, Twitch live streams, and other interesting things that you might have missed!

In case you missed our last ICYMI, check out what happened last quarter here.
AWS Lambda
For Node.js developers, AWS Lambda now supports the Node.js 16.x runtime version. This offers new features, including the Stable timers promises API and RegExp match indices. There is also new documentation for TypeScript with Lambda.
Customers are rapidly adopting the new runtime version by updating to Node.js 16.x. To help keep Lambda functions secure, AWS continually updates Node.js 16 with all minor updates released by the Node.js community when using the zip archive format. Read the release blog post to learn more about building Lambda functions with Node.js 16.x.
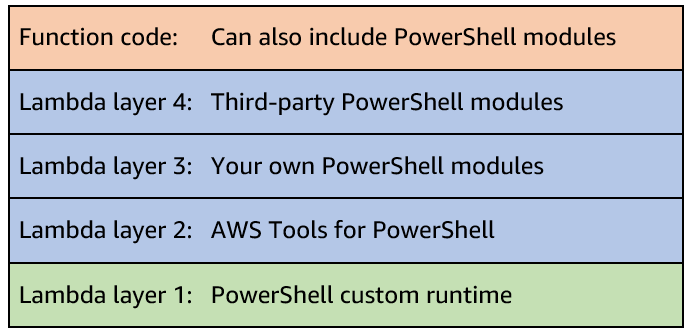
A new Lambda custom runtime is now available for PowerShell. It makes it even easier to run Lambda functions written in PowerShell. Although Lambda has supported PowerShell since 2018, this new version simplifies the process and reduces the additional steps required during the development process.
To get started, see the GitHub repository which contains the code, examples and installation instructions.

PowerShell code in Lambda console
AWS Lambda Powertools is an open-source library to help customers discover and incorporate serverless best practices more easily. Powertools for Python went GA in July 2020, followed by Java in 2021, TypeScript in 2022, and .NET is coming soon. AWS Lambda Powertools crossed the 10M download milestone and TypeScript support has now moved from beta to a release candidate.
When building with Lambda, it’s important to develop solutions to handle retries and failures when the same event may be received more than once. Lambda Powertools provide a utility to handle idempotency within your functions.
To learn more:
- Explore the documentation for Lambda Powertools and utilities for Python, Java and TypeScript.
AWS Step Functions
AWS Step Functions launched a new opt-in console experience to help builders analyze, debug, and optimize Step Functions Standard Workflows. This allows you to debug workflow executions and analyze the payload as it passes through each state. To opt in to the new console experience and get started, follow these detailed instructions.

Events tab in Step Functions workflow
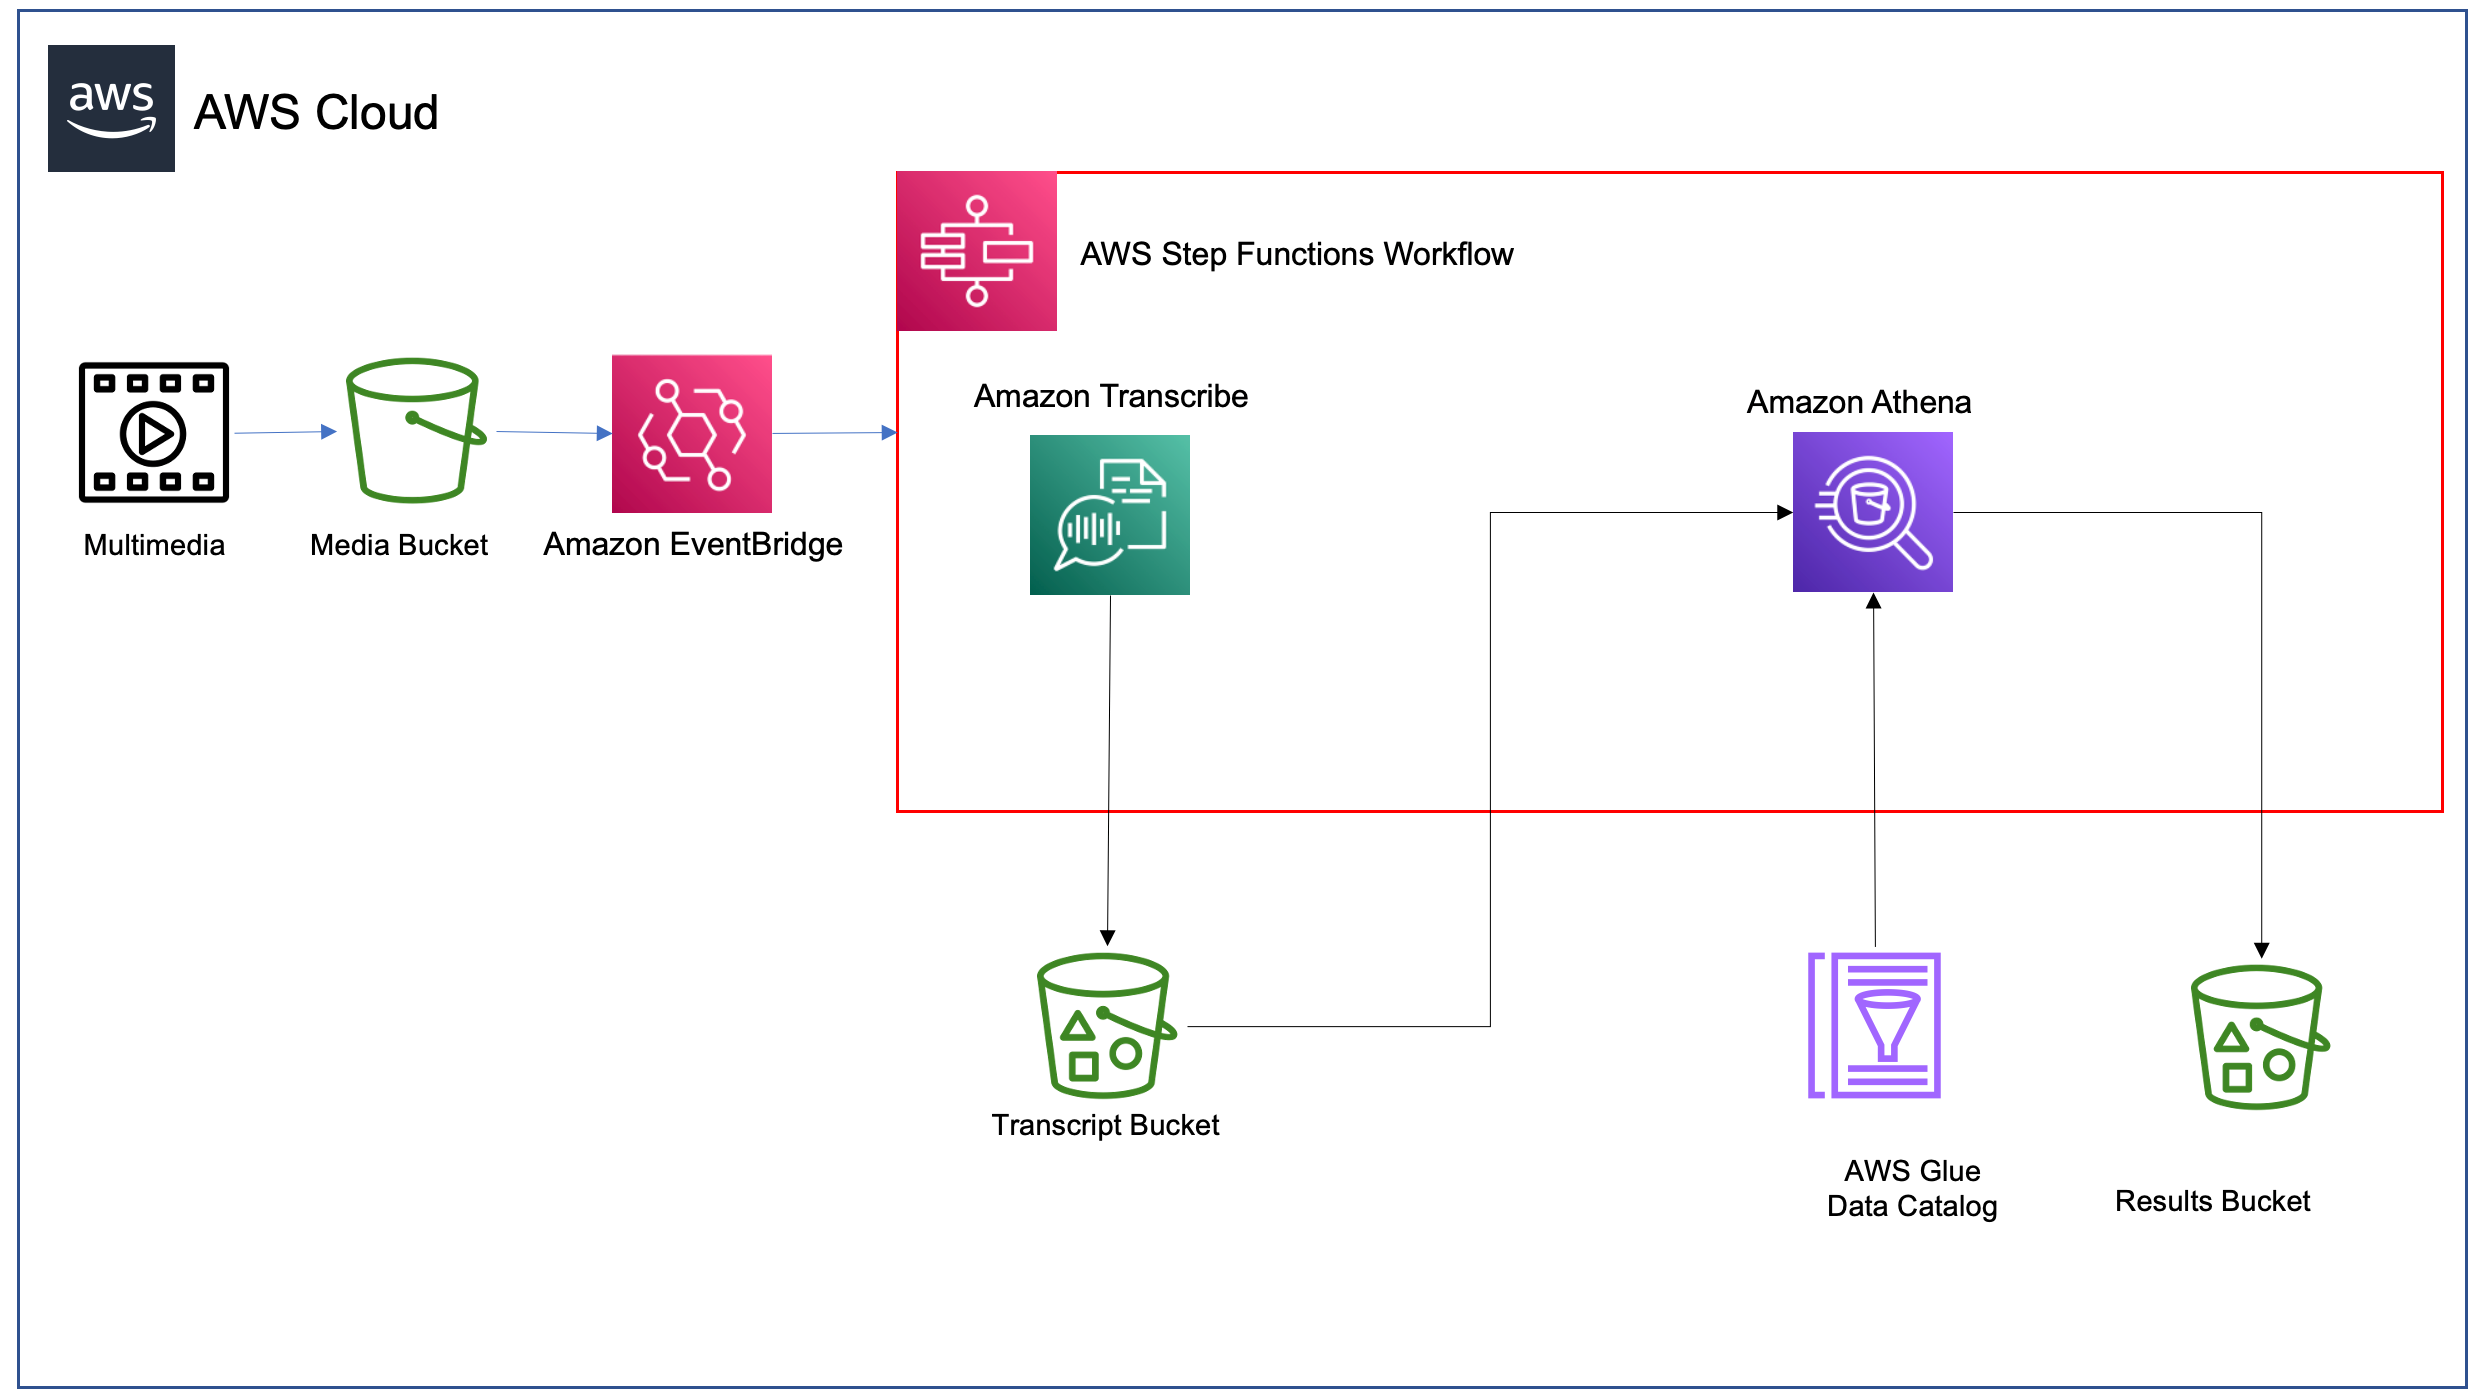
Amazon EventBridge
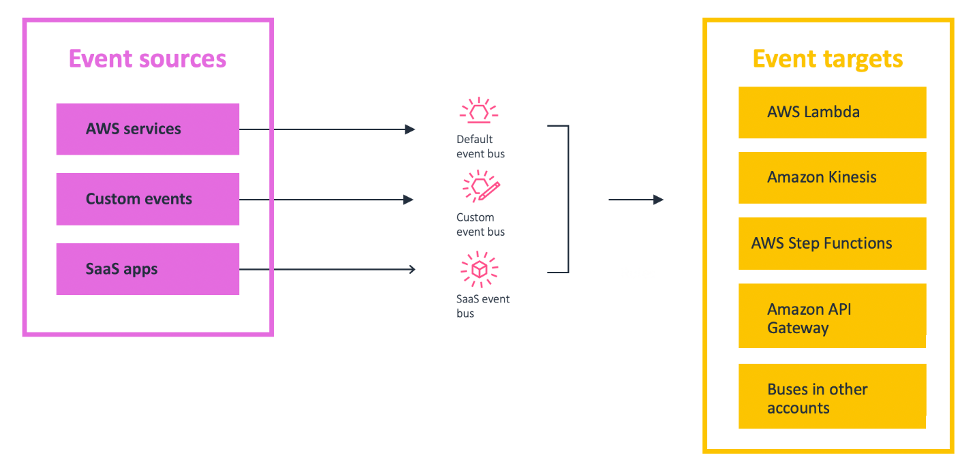
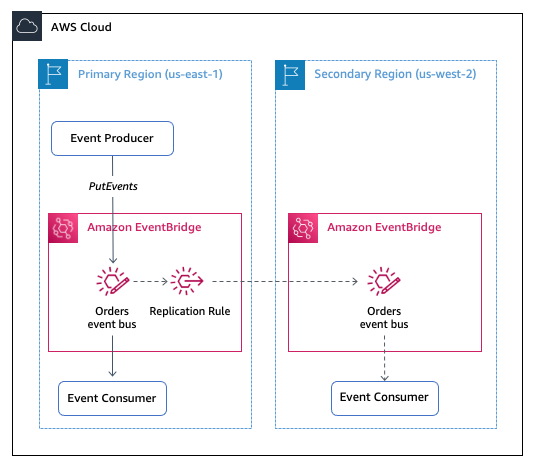
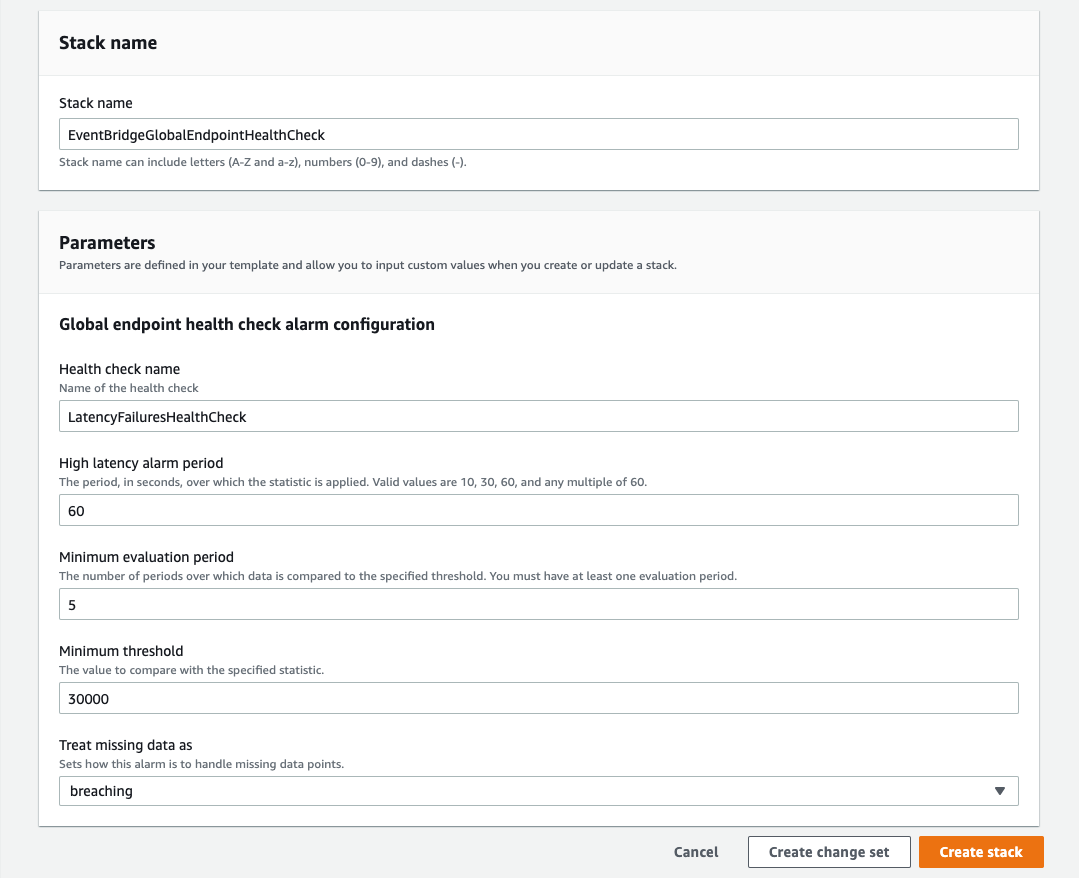
Amazon EventBridge released support for global endpoints in April 2022. Global endpoints provide a reliable way for you to improve availability and reliability of event-driven applications. Using global endpoints, you can fail over event ingestion automatically to another Region during service disruptions.
The new IngestionToInvocationStartLatency metric exposes the time to process events from the point at which they are ingested by EventBridge to the point of the first invocation. Amazon Route 53 uses this information to failover event ingestion automatically to a secondary Region if the metric exceeds a configured threshold of 30 seconds, consecutively for 5 minutes.
To learn more:
- Read the feature announcement for global endpoints with EventBridge.
- Serverless Office Hours covered global endpoints with the Amazon EventBridge team.
- Learn more about what EventBridge metrics are available.

Amazon EventBridge global endpoints architecture diagram
Serverless Blog Posts
April
Apr 6 – Getting Started with Event-Driven Architecture
Apr 7 – Introducing global endpoints for Amazon EventBridge
Apr 11 – Building an event-driven application with Amazon EventBridge
Apr 12 – Orchestrating high performance computing with AWS Step Functions and AWS Batch
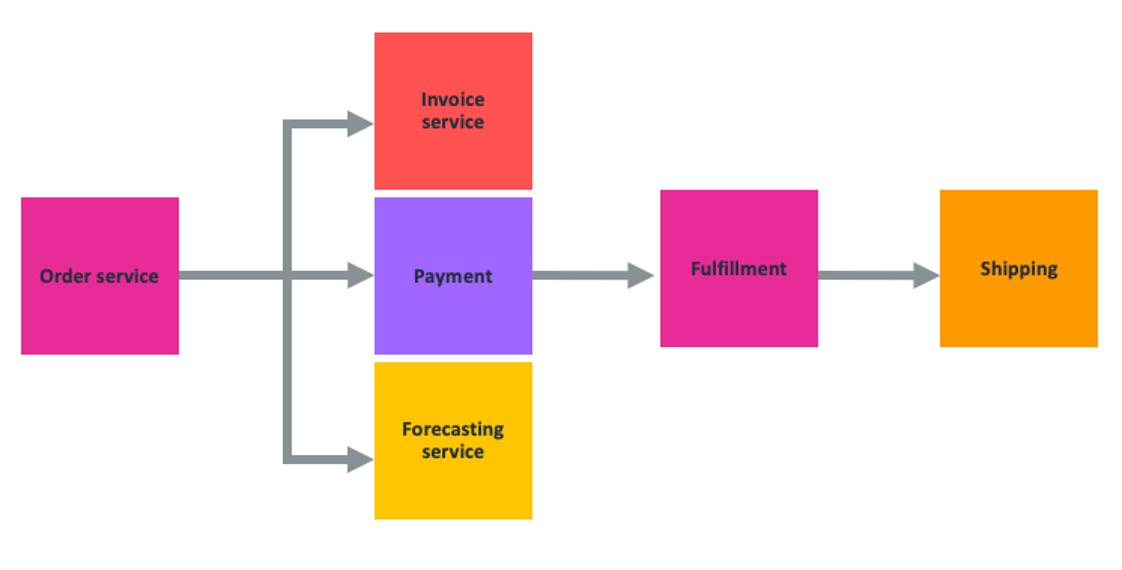
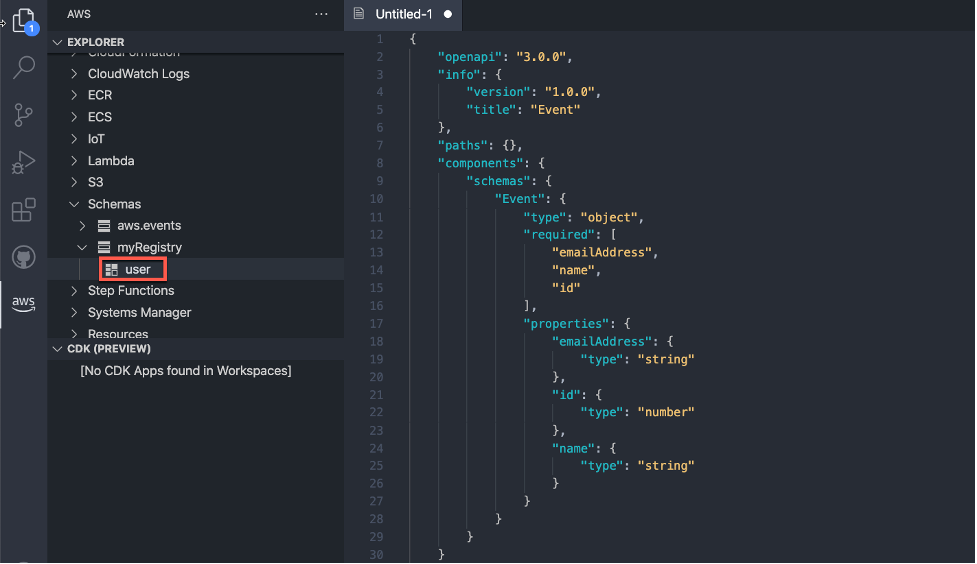
Apr 14 – Working with events and the Amazon EventBridge schema registry
Apr 20 – Handling Lambda functions idempotency with AWS Lambda Powertools
Apr 26 – Build a custom Java runtime for AWS Lambda
May
May 05 – Amazon EC2 DL1 instances Deep Dive
May 05 – Orchestrating Amazon S3 Glacier Deep Archive object retrieval using AWS Step Functions
May 09 – Benefits of migrating to event-driven architecture
May 09 – Debugging AWS Step Functions executions with the new console experience
May 12 – Node.js 16.x runtime now available in AWS Lambda
May 25 – Introducing the PowerShell custom runtime for AWS Lambda
June
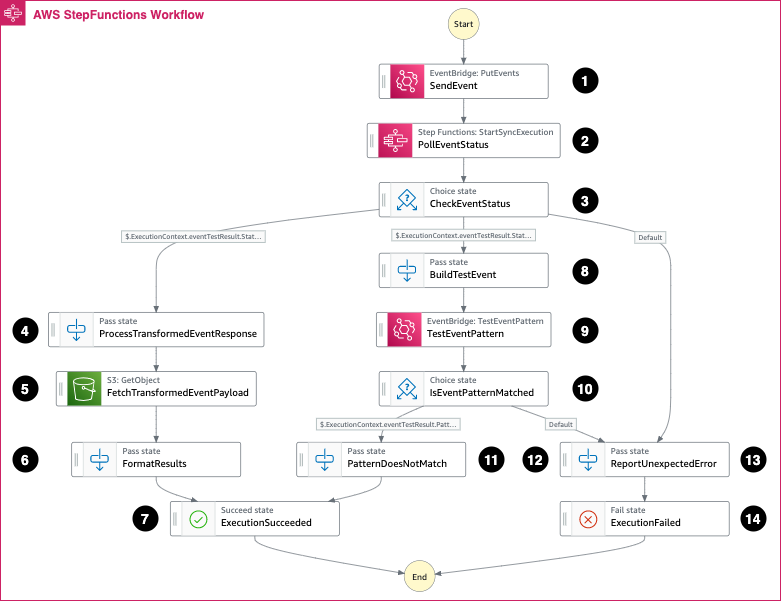
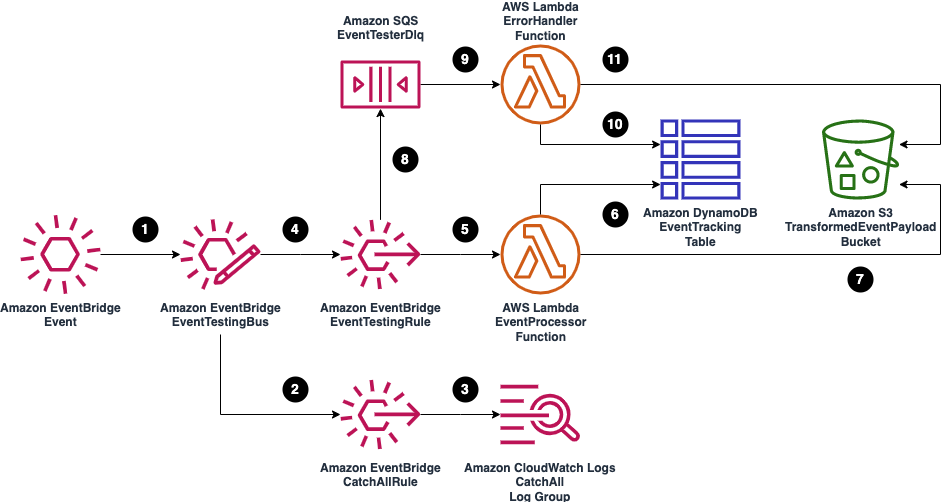
Jun 01 – Testing Amazon EventBridge events using AWS Step Functions
Jun 02 – Optimizing your AWS Lambda costs – Part 1
Jun 02 – Optimizing your AWS Lambda costs – Part 2
Jun 02 – Extending PowerShell on AWS Lambda with other services
Jun 02 – Running AWS Lambda functions on AWS Outposts using AWS IoT Greengrass
Jun 14 – Combining Amazon AppFlow with AWS Step Functions to maximize application integration benefits
Jun 14 – Capturing GPU Telemetry on the Amazon EC2 Accelerated Computing Instances
Serverlesspresso goes global
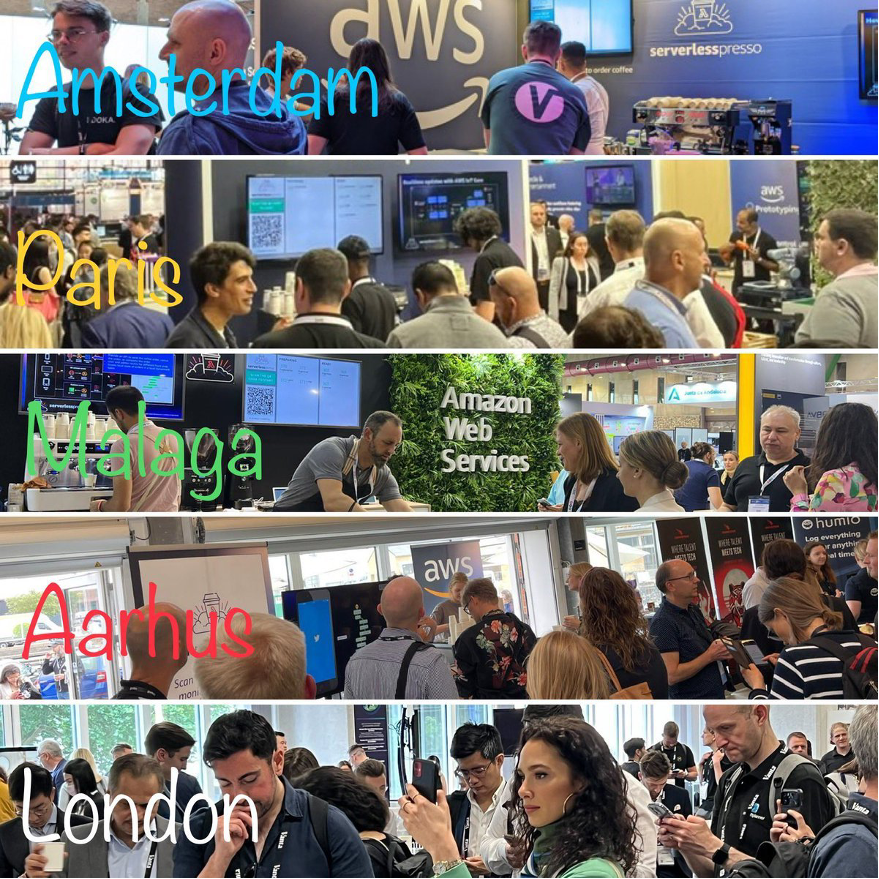
Serverlesspresso in five countries
Serverlesspresso is a serverless event-driven application that allows you to order coffee from your phone.
Since building Serverlesspresso for reinvent 2021, the Developer Advocate team have put in approximately 100 additional development hours to improve the application to make it a multi-tenant event-driven serverless app.
This allowed us to run Serverlesspresso concurrently at five separate events across Europe on a single day in June, serving over 5,000 coffees. Each order is orchestrated by a single Step Functions workflow. To read more about how this application is built:
- Take the free workshop and build your own Serverlesspresso application
- Learn more about Serverlesspresso architecture and explore the code
AWS Heroes EMEA Summit in Milan, Italy
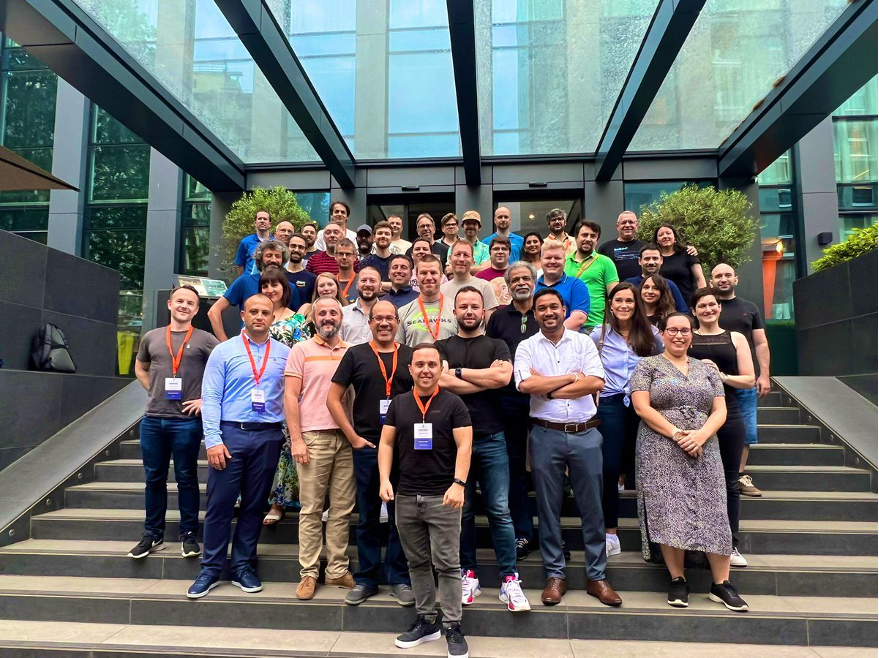
AWS Heroes EMEA Summit in Milan, Italy
The AWS Heroes program recognizes talented experts whose enthusiasm for knowledge-sharing has a real impact within the community. The EMEA-based Heroes gathered for a Summit on June 28 to share their thoughts, providing valuable feedback on topics such as containers, serverless and machine learning.
Serverless workflow collection added to Serverless Land
Serverless Land is a website that is maintained by the Serverless Developer Advocate team to help you learn with workshops, patterns, blogs and videos.
The Developer Advocate team have extended Serverless Land and introduced the new AWS Step Functions workflows collection.
Using the new collection you can explore common patterns built with Step Functions and use the 1-click deploy button to deploy straight into your AWS account.

Serverless Workflows Collection on Serverless Land
Videos
Serverless Office Hours – Tues 10AM PT

ServerlessLand YouTube Channel
Weekly live virtual office hours. In each session we talk about a specific topic or technology related to serverless and open it up to helping you with your real serverless challenges and issues. Ask us anything you want about serverless technologies and applications.
YouTube: youtube.com/serverlessland
Twitch: twitch.tv/aws
April
- Apr 5 – Building Amazon Alexa skills
- Apr 12 – Serverless Hero Luc van Donkersgoed talks CDK
- Apr 19 – Amazon EventBridge Global Endpoints
- Apr 26 – AWS Lambda Function URLs
May
- May 3 – Ben Ellerby – EventBridge Storming and Minimal Viable Migrations
- May 10 – Debugging AWS Step Functions executions with the new console experience
- May 17 – Serverless CI/CD
- May 24 – AIOps using Amazon DevOps Guru
- May 31 – PowerShell on Lambda
June
- Jun 07 – Live at MongoDB World!
- Jun 21 – Serverless for Startups with Serverless Hero Slobodan Stojanović
- Jun 28 – Serverless Framework – What’s New
FooBar Serverless YouTube channel

FooBar Serverless Channel
Marcia Villalba frequently publishes new videos on her popular serverless YouTube channel. You can view all of Marcia’s videos at https://www.youtube.com/c/FooBar_codes.
April
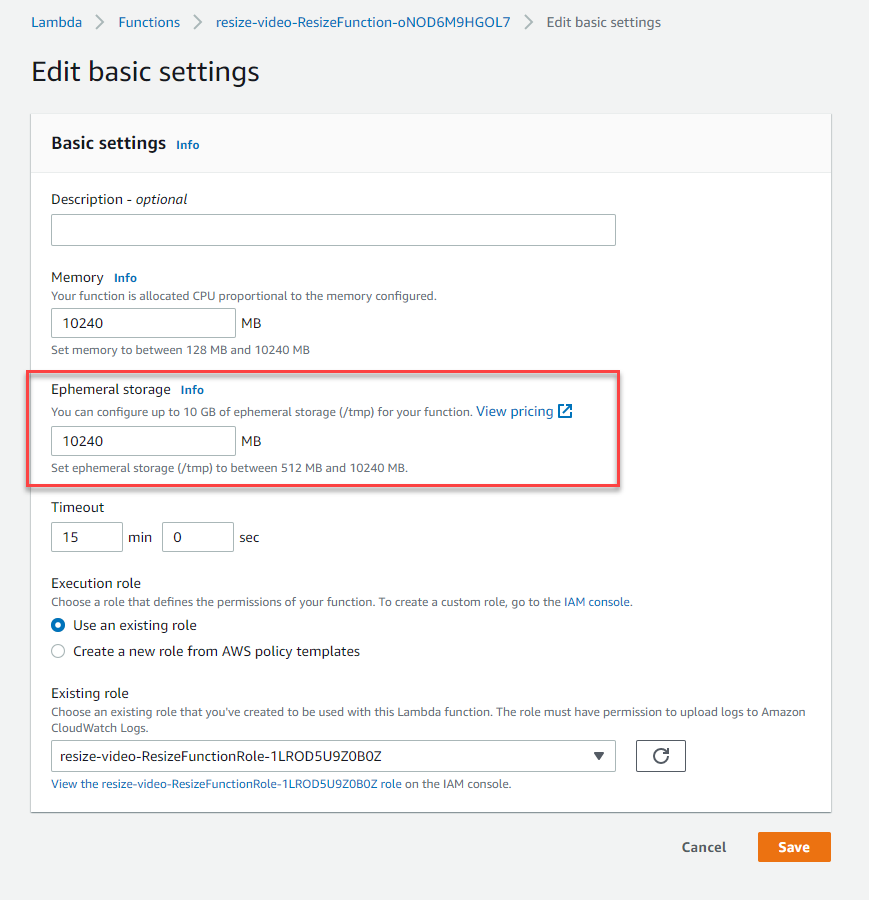
- Apr 7 – AWS Lambda now supports up to 10GB of temporary storage / demo on how to add a watermark to video
- Apr 14 – What’s new in AWS CDK v2?
- Apr 22 – Choose the right storage solution for AWS Lambda – Amazon S3, Amazon EFS, Lambda layers, temp storage
May
- May 5 – Building an Event-Driven Application with AWS CDK and Amazon EventBridge
- May 12 – API Destinations and Event Logs with Amazon EventBridge and AWS CDK
- May 19 – Write your Lambda functions using TypeScript with AWS CDK
- May 26 – AWS Lambda Powertools for TypeScript | Adopt easily the best practices in your apps
June
- Jun 02 – Write your Lambda functions using TypeScript with AWS SAM
- Jun 09 – Is lift and shift migration Lambda possible? Demo with Node-Express app
- Jun 16 – New AWS Step Function console to help you debug and analyze your Workflows!
Still looking for more?
The Serverless landing page has more information. The Lambda resources page contains case studies, webinars, whitepapers, customer stories, reference architectures, and even more Getting Started tutorials.
You can also follow the Serverless Developer Advocacy team on Twitter to see the latest news, follow conversations, and interact with the team.
- Eric Johnson: @edjgeek
- James Beswick: @jbesw
- Ben Smith: @benjamin_l_s
- Julian Wood: @julian_wood
- Talia Nassi: @talia_nassi
- Marcia Villalba: @mavi888uy
- Sam Dengler @samdengler
- David Boyne: @boyney123


 Anand Shah is a Big Data Prototyping Solution Architect at AWS. He works with AWS customers and their engineering teams to build prototypes using AWS analytics services and purpose-built databases. Anand helps customers solve the most challenging problems using the art of the possible technology. He enjoys beaches in his leisure time.