Tag Archives: Amazon EventBridge

Monitoring Amazon DevOps Guru insights using Amazon Managed Grafana

Post Syndicated from MJ Kubba original https://aws.amazon.com/blogs/devops/monitoring-amazon-devops-guru-insights-using-amazon-managed-grafana/

As organizations operate day-to-day, having insights into their cloud infrastructure state can be crucial for the durability and availability of their systems. Industry research estimates[1] that downtime costs small businesses around $427 per minute of downtime, and medium to large businesses an average of $9,000 per minute of downtime. Amazon DevOps Guru customers want to monitor and generate alerts using a single dashboard. This allows them to reduce context switching between applications, providing them an opportunity to respond to operational issues faster.

DevOps Guru can integrate with Amazon Managed Grafana to create and display operational insights. Alerts can be created and communicated for any critical events captured by DevOps Guru and notifications can be sent to operation teams to respond to these events. The key telemetry data types of logs and metrics are parsed and filtered to provide the necessary insights into observability.

Furthermore, it provides plug-ins to popular open-source databases, third-party ISV monitoring tools, and other cloud services. With Amazon Managed Grafana, you can easily visualize information from multiple AWS services, AWS accounts, and Regions in a single Grafana dashboard.

In this post, we will walk you through integrating the insights generated from DevOps Guru with Amazon Managed Grafana.

Solution Overview:

This architecture diagram shows the flow of the logs and metrics that will be utilized by Amazon Managed Grafana. Insights originate from DevOps Guru, each insight generating an event. These events are captured by Amazon EventBridge, and then saved as logs to Amazon CloudWatch Log Group DevOps Guru service metrics, and then parsed by Amazon Managed Grafana to create new dashboards.

This architecture diagram shows the flow of the logs and metrics that will be utilized by Amazon Managed Grafana, starting with DevOps Guru and then using Amazon EventBridge to save the insight event logs to Amazon CloudWatch Log Group DevOps Guru service metrics to be parsed by Amazon Managed Grafana and create new dashboards in Grafana from these logs and Metrics.

Now we will walk you through how to do this and set up notifications to your operations team.

Prerequisites:

The following prerequisites are required for this walkthrough:

  • An AWS Account
  • Enabled DevOps Guru on your account with CloudFormation stack, or tagged resources monitored.

Using Amazon CloudWatch Metrics


DevOps Guru sends service metrics to CloudWatch Metrics. We will use these to      track metrics for insights and metrics for your DevOps Guru usage; the DevOps Guru service reports the metrics to the AWS/DevOps-Guru namespace in CloudWatch by default.

First, we will provision an Amazon Managed Grafana workspace and then create a Dashboard in the workspace that uses Amazon CloudWatch as a data source.

Setting up Amazon CloudWatch Metrics

  1. Create Grafana Workspace
    Navigate to Amazon Managed Grafana from AWS console, then click Create workspace

a. Select the Authentication mechanism

i. AWS IAM Identity Center (AWS SSO) or SAML v2 based Identity Providers

ii. Service Managed Permission or Customer Managed

iii. Choose Next

b. Under “Data sources and notification channels”, choose Amazon CloudWatch

c. Create the Service.

You can use this post for more information on how to create and configure the Grafana workspace with SAML based authentication.

Next, we will show you how to create a dashboard and parse the Logs and Metrics to display the DevOps Guru insights and recommendations.

2. Configure Amazon Managed Grafana

a. Add CloudWatch as a data source:
From the left bar navigation menu, hover over AWS and select Data sources.

b. From the Services dropdown select and configure CloudWatch.

3. Create a Dashboard

a. From the left navigation bar, click on add a new Panel.

b. You will see a demo panel.

c. In the demo panel – Click on Data source and select Amazon CloudWatch.

The Amazon Grafana Workspace dashboard with the Grafana data source dropdown menu open. The drop down has 'Amazon CloudWatch (region name)' highlighted, other options include 'Mixed, 'Dashboard', and 'Grafana'.

d. For this panel we will use CloudWatch metrics to display the number of insights.

e. From Namespace select the AWS/DevOps-Guru name space, Insights as Metric name and Average for Statistics.

In the Amazon Grafana Workspace dashboard the user has entered values in three fields. "Grafana Query with Namespace" has the chosen value: AWS/DevOps-Guru. "Metric name" has the chosen value: Insights. "Statistic" has the chosen value: Average.

click apply

Time series graph contains a single new data point, indicting a recent event.

f. This is our first panel. We can change the panel name from the right-side bar under Title. We will name this panel “Insights

g. From the top right menu, click save dashboard and give your new dashboard a name

Using Amazon CloudWatch Logs via Amazon EventBridge

For other insights outside of the service metrics, such as a number of insights per specific service or the average for a region or for a specific AWS account, we will need to parse the event logs. These logs first need to be sent to Amazon CloudWatch Logs. We will go over the details on how to set this up and how we can parse these logs in Amazon Managed Grafana using CloudWatch Logs Query Syntax. In this post, we will show a couple of examples. For more details, please check out this User Guide documentation. This is not done by default and we will need to use Amazon EventBridge to pass these logs to CloudWatch.

DevOps Guru logs include other details that can be helpful when building Dashboards, such as region, Insight Severity (High, Medium, or Low), associated resources, and DevOps guru dashboard URL, among other things.  For more information, please check out this User Guide documentation.

EventBridge offers a serverless event bus that helps you receive, filter, transform, route, and deliver events. It provides one to many messaging solutions to support decoupled architectures, and it is easy to integrate with AWS Services and 3rd-party tools. Using Amazon EventBridge with DevOps Guru provides a solution that is easy to extend to create a ticketing system through integrations with ServiceNow, Jira, and other tools. It also makes it easy to set up alert systems through integrations with PagerDuty, Slack, and more.


Setting up Amazon CloudWatch Logs

  1. Let’s dive in to creating the EventBridge rule and enhance our Grafana dashboard:

a. First head to Amazon EventBridge in the AWS console.

b. Click Create rule.

     Type in rule Name and Description. You can leave the Event bus to default and Rule type to Rule with an event pattern.

c. Select AWS events or EventBridge partner events.

    For event Pattern change to Customer patterns (JSON editor) and use:

{"source": ["aws.devops-guru"]}

This filters for all events generated from DevOps Guru. You can use the same mechanism to filter out specific messages such as new insights, or insights closed to a different channel. For this demonstration, let’s consider extracting all events.

As the user configures their EventBridge Rule, for the Creation method they have chosen "Custom pattern (JSON editor) write an event pattern in JSON." For the Event pattern editor just below they have entered {"source":["aws.devops-guru"]}

d. Next, for Target, select AWS service.

    Then use CloudWatch log Group.

    For the Log Group, give your group a name, such as “devops-guru”.

In the prompt for the new Target's configurations, the user has chosen AWS service as the Target type. For the Select a target drop down, they chose CloudWatch log Group. For the log group, they selected the /aws/events radio option, and then filled in the following input text box with the kebab case group name devops-guru.

e. Click Create rule.

f. Navigate back to Amazon Managed Grafana.
It’s time to add a couple more additional Panels to our dashboard.  Click Add panel.
    Then Select Amazon CloudWatch, and change from metrics to CloudWatch Logs and select the Log Group we created previously.

In the Grafana Workspace, the user has "Data source" selected as Amazon CloudWatch us-east-1. Underneath that they have chosen to use the default region and CloudWatch Logs. Below that, for the Log Groups they have entered /aws/events/DevOpsGuru

g. For the query use the following to get the number of closed insights:

fields @detail.messageType
| filter detail.messageType="CLOSED_INSIGHT"
| count(detail.messageType)

You’ll see the new dashboard get updated with “Data is missing a time field”.

New panel suggestion with switch to table or open visualization suggestions

You can either open the suggestions and select a gauge that makes sense;

New Suggestions display a dial graph, a bar graph, and a count numerical tracker

Or choose from multiple visualization options.

Now we have 2 panels:

Two panels are shown, one is the new dial graph, and the other is the time series graph that was created earlier.

h. You can repeat the same process. To create 3rd panel for the new insights using this query:

fields @detail.messageType 
| filter detail.messageType="NEW_INSIGHT" 
| count(detail.messageType)

Now we have 3 panels:

Grafana now shows three 3 panels. Two dial graphs, and the time series graph.

Next, depending on the visualizations, you can work with the Logs and metrics data types to parse and filter the data.

Setting up a 4th panel as table. Under the Query tab, in the query editor, the user has entered the text: fields detail.messageType, detail.insightSeverity, detail.insightUrlfilter | filter detail.messageType="CLOSED_INSIGHT" or detail.messageType="NEW_INSIGHT"

i. For our fourth panel, we will add DevOps Guru dashboard direct link to the AWS Console.

Repeat the same process as demonstrated previously one more time with this query:

fields detail.messageType, detail.insightSeverity, detail.insightUrlfilter 
| filter detail.messageType="CLOSED_INSIGHT" or detail.messageType="NEW_INSIGHT"                       

                        Switch to table when prompted on the panel.

Grafana now shows 4 panels. The new panel displays a data table that contains information about the most recent DevOps Guru insights. There are also the two dial graphs, and the time series graph from before.

This will give us a direct link to the DevOps Guru dashboard and help us get to the insight details and Recommendations.

Grafana now shows 4 panels. The new panel displays a data table that contains information about the most recent DevOps Guru insights. There are also the two dial graphs, and the time series graph from before.

Save your dashboard.

  1. You can extend observability by sending notifications through alerts on dashboards of panels providing metrics. The alerts will be triggered when a condition is met. The Alerts are communicated with Amazon SNS notification mechanism. This is our SNS notification channel setup.

Screenshot: notification settings show Name: DevopsGuruAlertsFromGrafana and Type: SNS

A previously created notification is used next to communicate any alerts when the condition is met across the metrics being observed.

Screenshot: notification setting with condition when count of query is above 5, a notification is sent to DevopsGuruAlertsFromGrafana with message, "More than 5 insights in the past 1 hour"

Cleanup

To avoid incurring future charges, delete the resources.

  • Navigate to EventBridge in AWS console and delete the rule created in step 4 (a-e) “devops-guru”.
  • Navigate to CloudWatch logs in AWS console and delete the log group created as results of step 4 (a-e) named “devops-guru”.
  • Amazon Managed Grafana: Navigate to Amazon Managed Grafana service and delete the Grafana services you created in step 1.

Conclusion

In this post, we have demonstrated how to successfully incorporate Amazon DevOps Guru insights into Amazon Managed Grafana and use Grafana as the observability tool. This will allow Operations team to successfully observe the state of their AWS resources and notify them through Alarms on any preset thresholds on DevOps Guru metrics and logs. You can expand on this to create other panels and dashboards specific to your needs. If you don’t have DevOps Guru, you can start monitoring your AWS applications with AWS DevOps Guru today using this link.

[1] https://www.atlassian.com/incident-management/kpis/cost-of-downtime

About the authors:

MJ Kubba

MJ Kubba is a Solutions Architect who enjoys working with public sector customers to build solutions that meet their business needs. MJ has over 15 years of experience designing and implementing software solutions. He has a keen passion for DevOps and cultural transformation.

David Ernst

David is a Sr. Specialist Solution Architect – DevOps, with 20+ years of experience in designing and implementing software solutions for various industries. David is an automation enthusiast and works with AWS customers to design, deploy, and manage their AWS workloads/architectures.

Sofia Kendall

Sofia Kendall is a Solutions Architect who helps small and medium businesses achieve their goals as they utilize the cloud. Sofia has a background in Software Engineering and enjoys working to make systems reliable, efficient, and scalable.

Serverless ICYMI Q1 2023

Post Syndicated from Julian Wood original https://aws.amazon.com/blogs/compute/serverless-icymi-q1-2023/

Welcome to the 21st edition of the AWS Serverless ICYMI (in case you missed it) quarterly recap. Every quarter, we share all the most recent product launches, feature enhancements, blog posts, webinars, live streams, and other interesting things that you might have missed!

ICYMI2023Q1

In case you missed our last ICYMI, check out what happened last quarter here.

Artificial intelligence (AI) technologies, ChatGPT, and DALL-E are creating significant interest in the industry at the moment. Find out how to integrate serverless services with ChatGPT and DALL-E to generate unique bedtime stories for children.

Example notification of a story hosted with Next.js and App Runner

Example notification of a story hosted with Next.js and App Runner

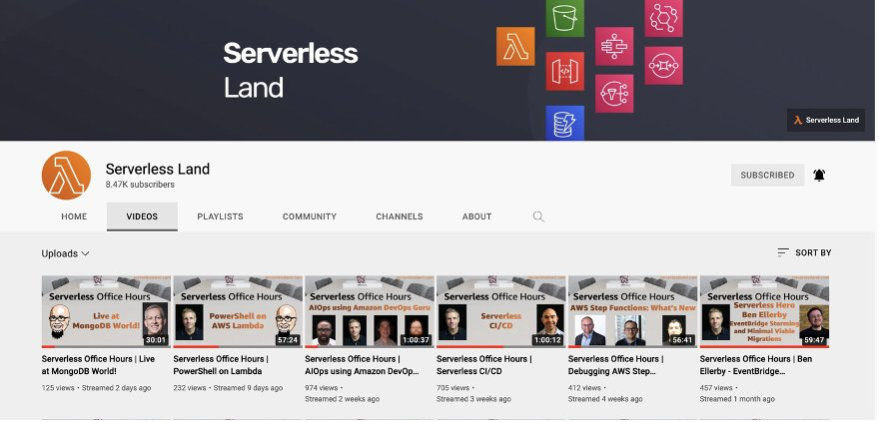
Serverless Land is a website maintained by the Serverless Developer Advocate team to help you build serverless applications and includes workshops, code examples, blogs, and videos. There is now enhanced search functionality so you can search across resources, patterns, and video content.

SLand-search

ServerlessLand search

AWS Lambda

AWS Lambda has improved how concurrency works with Amazon SQS. You can now control the maximum number of concurrent Lambda functions invoked.

The launch blog post explains the scaling behavior of Lambda using this architectural pattern, challenges this feature helps address, and a demo of maximum concurrency in action.

Maximum concurrency is set to 10 for the SQS queue.

Maximum concurrency is set to 10 for the SQS queue.

AWS Lambda Powertools is an open-source library to help you discover and incorporate serverless best practices more easily. Lambda Powertools for .NET is now generally available and currently focused on three observability features: distributed tracing (Tracer), structured logging (Logger), and asynchronous business and application metrics (Metrics). Powertools is also available for Python, Java, and Typescript/Node.js programming languages.

To learn more:

Lambda announced a new feature, runtime management controls, which provide more visibility and control over when Lambda applies runtime updates to your functions. The runtime controls are optional capabilities for advanced customers that require more control over their runtime changes. You can now specify a runtime management configuration for each function with three settings, Automatic (default), Function update, or manual.

There are three new Amazon CloudWatch metrics for asynchronous Lambda function invocations: AsyncEventsReceived, AsyncEventAge, and AsyncEventsDropped. You can track the asynchronous invocation requests sent to Lambda functions to monitor any delays in processing and take corrective actions if required. The launch blog post explains the new metrics and how to use them to troubleshoot issues.

Lambda now supports Amazon DocumentDB change streams as an event source. You can use Lambda functions to process new documents, track updates to existing documents, or log deleted documents. You can use any programming language that is supported by Lambda to write your functions.

There is a helpful blog post suggesting best practices for developing portable Lambda functions that allow you to port your code to containers if you later choose to.

AWS Step Functions

AWS Step Functions has expanded its AWS SDK integrations with support for 35 additional AWS services including Amazon EMR Serverless, AWS Clean Rooms, AWS IoT FleetWise, AWS IoT RoboRunner and 31 other AWS services. In addition, Step Functions also added support for 1000+ new API actions from new and existing AWS services such as Amazon DynamoDB and Amazon Athena. For the full list of added services, visit AWS SDK service integrations.

Amazon EventBridge

Amazon EventBridge has launched the AWS Controllers for Kubernetes (ACK) for EventBridge and Pipes . This allows you to manage EventBridge resources, such as event buses, rules, and pipes, using the Kubernetes API and resource model (custom resource definitions).

EventBridge event buses now also support enhanced integration with Service Quotas. Your quota increase requests for limits such as PutEvents transactions-per-second, number of rules, and invocations per second among others will be processed within one business day or faster, enabling you to respond quickly to changes in usage.

AWS SAM

The AWS Serverless Application Model (SAM) Command Line Interface (CLI) has added the sam list command. You can now show resources defined in your application, including the endpoints, methods, and stack outputs required to test your deployed application.

AWS SAM has a preview of sam build support for building and packaging serverless applications developed in Rust. You can use cargo-lambda in the AWS SAM CLI build workflow and AWS SAM Accelerate to iterate on your code changes rapidly in the cloud.

You can now use AWS SAM connectors as a source resource parameter. Previously, you could only define AWS SAM connectors as a AWS::Serverless::Connector resource. Now you can add the resource attribute on a connector’s source resource, which makes templates more readable and easier to update over time.

AWS SAM connectors now also support multiple destinations to simplify your permissions. You can now use a single connector between a single source resource and multiple destination resources.

In October 2022, AWS released OpenID Connect (OIDC) support for AWS SAM Pipelines. This improves your security posture by creating integrations that use short-lived credentials from your CI/CD provider. There is a new blog post on how to implement it.

Find out how best to build serverless Java applications with the AWS SAM CLI.

AWS App Runner

AWS App Runner now supports retrieving secrets and configuration data stored in AWS Secrets Manager and AWS Systems Manager (SSM) Parameter Store in an App Runner service as runtime environment variables.

AppRunner also now supports incoming requests based on HTTP 1.0 protocol, and has added service level concurrency, CPU and Memory utilization metrics.

Amazon S3

Amazon S3 now automatically applies default encryption to all new objects added to S3, at no additional cost and with no impact on performance.

You can now use an S3 Object Lambda Access Point alias as an origin for your Amazon CloudFront distribution to tailor or customize data to end users. For example, you can resize an image depending on the device that an end user is visiting from.

S3 has introduced Mountpoint for S3, a high performance open source file client that translates local file system API calls to S3 object API calls like GET and LIST.

S3 Multi-Region Access Points now support datasets that are replicated across multiple AWS accounts. They provide a single global endpoint for your multi-region applications, and dynamically route S3 requests based on policies that you define. This helps you to more easily implement multi-Region resilience, latency-based routing, and active-passive failover, even when data is stored in multiple accounts.

Amazon Kinesis

Amazon Kinesis Data Firehose now supports streaming data delivery to Elastic. This is an easier way to ingest streaming data to Elastic and consume the Elastic Stack (ELK Stack) solutions for enterprise search, observability, and security without having to manage applications or write code.

Amazon DynamoDB

Amazon DynamoDB now supports table deletion protection to protect your tables from accidental deletion when performing regular table management operations. You can set the deletion protection property for each table, which is set to disabled by default.

Amazon SNS

Amazon SNS now supports AWS X-Ray active tracing to visualize, analyze, and debug application performance. You can now view traces that flow through Amazon SNS topics to destination services, such as Amazon Simple Queue Service, Lambda, and Kinesis Data Firehose, in addition to traversing the application topology in Amazon CloudWatch ServiceLens.

SNS also now supports setting content-type request headers for HTTPS notifications so applications can receive their notifications in a more predictable format. Topic subscribers can create a DeliveryPolicy that specifies the content-type value that SNS assigns to their HTTPS notifications, such as application/json, application/xml, or text/plain.

EDA Visuals collection added to Serverless Land

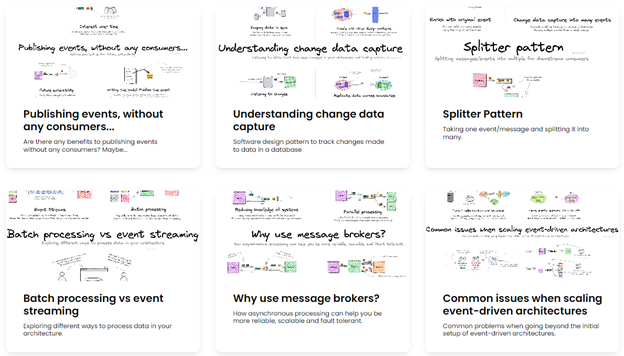
The Serverless Developer Advocate team has extended Serverless Land and introduced EDA visuals. These are small bite sized visuals to help you understand concept and patterns about event-driven architectures. Find out about batch processing vs. event streaming, commands vs. events, message queues vs. event brokers, and point-to-point messaging. Discover bounded contexts, migrations, idempotency, claims, enrichment and more!

EDA-visuals

EDA Visuals

To learn more:

Serverless Repos Collection on Serverless Land

There is also a new section on Serverless Land containing helpful code repositories. You can search for code repos to use for examples, learning or building serverless applications. You can also filter by use-case, runtime, and level.

Serverless Repos Collection

Serverless Repos Collection

Serverless Blog Posts

January

Jan 12 – Introducing maximum concurrency of AWS Lambda functions when using Amazon SQS as an event source

Jan 20 – Processing geospatial IoT data with AWS IoT Core and the Amazon Location Service

Jan 23 – AWS Lambda: Resilience under-the-hood

Jan 24 – Introducing AWS Lambda runtime management controls

Jan 24 – Best practices for working with the Apache Velocity Template Language in Amazon API Gateway

February

Feb 6 – Previewing environments using containerized AWS Lambda functions

Feb 7 – Building ad-hoc consumers for event-driven architectures

Feb 9 – Implementing architectural patterns with Amazon EventBridge Pipes

Feb 9 – Securing CI/CD pipelines with AWS SAM Pipelines and OIDC

Feb 9 – Introducing new asynchronous invocation metrics for AWS Lambda

Feb 14 – Migrating to token-based authentication for iOS applications with Amazon SNS

Feb 15 – Implementing reactive progress tracking for AWS Step Functions

Feb 23 – Developing portable AWS Lambda functions

Feb 23 – Uploading large objects to Amazon S3 using multipart upload and transfer acceleration

Feb 28 – Introducing AWS Lambda Powertools for .NET

March

Mar 9 – Server-side rendering micro-frontends – UI composer and service discovery

Mar 9 – Building serverless Java applications with the AWS SAM CLI

Mar 10 – Managing sessions of anonymous users in WebSocket API-based applications

Mar 14 –
Implementing an event-driven serverless story generation application with ChatGPT and DALL-E

Videos

Serverless Office Hours – Tues 10AM PT

Weekly office hours live stream. In each session we talk about a specific topic or technology related to serverless and open it up to helping you with your real serverless challenges and issues. Ask us anything you want about serverless technologies and applications.

January

Jan 10 – Building .NET 7 high performance Lambda functions

Jan 17 – Amazon Managed Workflows for Apache Airflow at Scale

Jan 24 – Using Terraform with AWS SAM

Jan 31 – Preparing your serverless architectures for the big day

February

Feb 07- Visually design and build serverless applications

Feb 14 – Multi-tenant serverless SaaS

Feb 21 – Refactoring to Serverless

Feb 28 – EDA visually explained

March

Mar 07 – Lambda cookbook with Python

Mar 14 – Succeeding with serverless

Mar 21 – Lambda Powertools .NET

Mar 28 – Server-side rendering micro-frontends

FooBar Serverless YouTube channel

Marcia Villalba frequently publishes new videos on her popular serverless YouTube channel. You can view all of Marcia’s videos at https://www.youtube.com/c/FooBar_codes.

January

Jan 12 – Serverless Badge – A new certification to validate your Serverless Knowledge

Jan 19 – Step functions Distributed map – Run 10k parallel serverless executions!

Jan 26 – Step Functions Intrinsic Functions – Do simple data processing directly from the state machines!

February

Feb 02 – Unlock the Power of EventBridge Pipes: Integrate Across Platforms with Ease!

Feb 09 – Amazon EventBridge Pipes: Enrichment and filter of events Demo with AWS SAM

Feb 16 – AWS App Runner – Deploy your apps from GitHub to Cloud in Record Time

Feb 23 – AWS App Runner – Demo hosting a Node.js app in the cloud directly from GitHub (AWS CDK)

March

Mar 02 – What is Amazon DynamoDB? What are the most important concepts? What are the indexes?

Mar 09 – Choreography vs Orchestration: Which is Best for Your Distributed Application?

Mar 16 – DynamoDB Single Table Design: Simplify Your Code and Boost Performance with Table Design Strategies

Mar 23 – 8 Reasons You Should Choose DynamoDB for Your Next Project and How to Get Started

Sessions with SAM & Friends

SAMFiends

AWS SAM & Friends

Eric Johnson is exploring how developers are building serverless applications. We spend time talking about AWS SAM as well as others like AWS CDK, Terraform, Wing, and AMPT.

Feb 16 – What’s new with AWS SAM

Feb 23 – AWS SAM with AWS CDK

Mar 02 – AWS SAM and Terraform

Mar 10 – Live from ServerlessDays ANZ

Mar 16 – All about AMPT

Mar 23 – All about Wing

Mar 30 – SAM Accelerate deep dive

Still looking for more?

The Serverless landing page has more information. The Lambda resources page contains case studies, webinars, whitepapers, customer stories, reference architectures, and even more Getting Started tutorials.

You can also follow the Serverless Developer Advocacy team on Twitter to see the latest news, follow conversations, and interact with the team.

Build event-driven data pipelines using AWS Controllers for Kubernetes and Amazon EMR on EKS

Post Syndicated from Victor Gu original https://aws.amazon.com/blogs/big-data/build-event-driven-data-pipelines-using-aws-controllers-for-kubernetes-and-amazon-emr-on-eks/

An event-driven architecture is a software design pattern in which decoupled applications can asynchronously publish and subscribe to events via an event broker. By promoting loose coupling between components of a system, an event-driven architecture leads to greater agility and can enable components in the system to scale independently and fail without impacting other services. AWS has many services to build solutions with an event-driven architecture, such as Amazon EventBridge, Amazon Simple Notification Service (Amazon SNS), Amazon Simple Queue Service (Amazon SQS), and AWS Lambda.

Amazon Elastic Kubernetes Service (Amazon EKS) is becoming a popular choice among AWS customers to host long-running analytics and AI or machine learning (ML) workloads. By containerizing your data processing tasks, you can simply deploy them into Amazon EKS as Kubernetes jobs and use Kubernetes to manage underlying computing compute resources. For big data processing, which requires distributed computing, you can use Spark on Amazon EKS. Amazon EMR on EKS, a managed Spark framework on Amazon EKS, enables you to run Spark jobs with benefits of scalability, portability, extensibility, and speed. With EMR on EKS, the Spark jobs run using the Amazon EMR runtime for Apache Spark, which increases the performance of your Spark jobs so that they run faster and cost less than open-source Apache Spark.

Data processes require a workflow management to schedule jobs and manage dependencies between jobs, and require monitoring to ensure that the transformed data is always accurate and up to date. One popular orchestration tool for managing workflows is Apache Airflow, which can be installed in Amazon EKS. Alternatively, you can use the AWS-managed version, Amazon Managed Workflows for Apache Airflow (Amazon MWAA). Another option is to use AWS Step Functions, which is a serverless workflow service that integrates with EMR on EKS and EventBridge to build event-driven workflows.

In this post, we demonstrate how to build an event-driven data pipeline using AWS Controllers for Kubernetes (ACK) and EMR on EKS. We use ACK to provision and configure serverless AWS resources, such as EventBridge and Step Functions. Triggered by an EventBridge rule, Step Functions orchestrates jobs running in EMR on EKS. With ACK, you can use the Kubernetes API and configuration language to create and configure AWS resources the same way you create and configure a Kubernetes data processing job. Because most of the managed services are serverless, you can build and manage your entire data pipeline using the Kubernetes API with tools such as kubectl.

Solution overview

ACK lets you define and use AWS service resources directly from Kubernetes, using the Kubernetes Resource Model (KRM). The ACK project contains a series of service controllers, one for each AWS service API. With ACK, developers can stay in their familiar Kubernetes environment and take advantage of AWS services for their application-supporting infrastructure. In the post Microservices development using AWS controllers for Kubernetes (ACK) and Amazon EKS blueprints, we show how to use ACK for microservices development.

In this post, we show how to build an event-driven data pipeline using ACK controllers for EMR on EKS, Step Functions, EventBridge, and Amazon Simple Storage Service (Amazon S3). We provision an EKS cluster with ACK controllers using Terraform modules. We create the data pipeline with the following steps:

  1. Create the emr-data-team-a namespace and bind it with the virtual cluster my-ack-vc in Amazon EMR by using the ACK controller.
  2. Use the ACK controller for Amazon S3 to create an S3 bucket. Upload the sample Spark scripts and sample data to the S3 bucket.
  3. Use the ACK controller for Step Functions to create a Step Functions state machine as an EventBridge rule target based on Kubernetes resources defined in YAML manifests.
  4. Use the ACK controller for EventBridge to create an EventBridge rule for pattern matching and target routing.

The pipeline is triggered when a new script is uploaded. An S3 upload notification is sent to EventBridge and, if it matches the specified rule pattern, triggers the Step Functions state machine. Step Functions calls the EMR virtual cluster to run the Spark job, and all the Spark executors and driver are provisioned inside the emr-data-team-a namespace. The output is saved back to the S3 bucket, and the developer can check the result on the Amazon EMR console.

The following diagram illustrates this architecture.

Prerequisites

Ensure that you have the following tools installed locally:

Deploy the solution infrastructure

Because each ACK service controller requires different AWS Identity and Access Management (IAM) roles for managing AWS resources, it’s better to use an automation tool to install the required service controllers. For this post, we use Amazon EKS Blueprints for Terraform and the AWS EKS ACK Addons Terraform module to provision the following components:

  • A new VPC with three private subnets and three public subnets
  • An internet gateway for the public subnets and a NAT Gateway for the private subnets
  • An EKS cluster control plane with one managed node group
  • Amazon EKS-managed add-ons: VPC_CNI, CoreDNS, and Kube_Proxy
  • ACK controllers for EMR on EKS, Step Functions, EventBridge, and Amazon S3
  • IAM execution roles for EMR on EKS, Step Functions, and EventBridge

Let’s start by cloning the GitHub repo to your local desktop. The module eks_ack_addons in addon.tf is for installing ACK controllers. ACK controllers are installed by using helm charts in the Amazon ECR public galley. See the following code:

cd examples/usecases/event-driven-pipeline
terraform init
terraform plan
terraform apply -auto-approve #defaults to us-west-2

The following screenshot shows an example of our output. emr_on_eks_role_arn is the ARN of the IAM role created for Amazon EMR running Spark jobs in the emr-data-team-a namespace in Amazon EKS. stepfunction_role_arn is the ARN of the IAM execution role for the Step Functions state machine. eventbridge_role_arn is the ARN of the IAM execution role for the EventBridge rule.

The following command updates kubeconfig on your local machine and allows you to interact with your EKS cluster using kubectl to validate the deployment:

region=us-west-2
aws eks --region $region update-kubeconfig --name event-driven-pipeline-demo

Test your access to the EKS cluster by listing the nodes:

kubectl get nodes
# Output should look like below
NAME                                        STATUS   ROLES    AGE     VERSION
ip-10-1-10-64.us-west-2.compute.internal    Ready    <none>   19h     v1.24.9-eks-49d8fe8
ip-10-1-10-65.us-west-2.compute.internal    Ready    <none>   19h     v1.24.9-eks-49d8fe8
ip-10-1-10-7.us-west-2.compute.internal     Ready    <none>   19h     v1.24.9-eks-49d8fe8
ip-10-1-10-73.us-west-2.compute.internal    Ready    <none>   19h     v1.24.9-eks-49d8fe8
ip-10-1-11-96.us-west-2.compute.internal    Ready    <none>   19h     v1.24.9-eks-49d8fe8
ip-10-1-12-197.us-west-2.compute.internal   Ready    <none>   19h     v1.24.9-eks-49d8fe8

Now we’re ready to set up the event-driven pipeline.

Create an EMR virtual cluster

Let’s start by creating a virtual cluster in Amazon EMR and link it with a Kubernetes namespace in EKS. By doing that, the virtual cluster will use the linked namespace in Amazon EKS for running Spark workloads. We use the file emr-virtualcluster.yaml. See the following code:

apiVersion: emrcontainers.services.k8s.aws/v1alpha1
kind: VirtualCluster
metadata:
  name: my-ack-vc
spec:
  name: my-ack-vc
  containerProvider:
    id: event-driven-pipeline-demo  # your eks cluster name
    type_: EKS
    info:
      eksInfo:
        namespace: emr-data-team-a # namespace binding with EMR virtual cluster

Let’s apply the manifest by using the following kubectl command:

kubectl apply -f ack-yamls/emr-virtualcluster.yaml

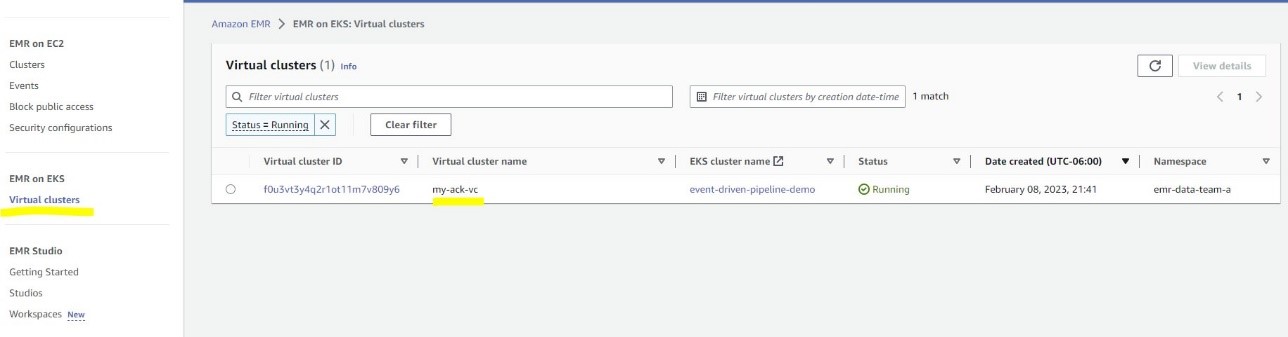
You can navigate to the Virtual clusters page on the Amazon EMR console to see the cluster record.

Create an S3 bucket and upload data

Next, let’s create a S3 bucket for storing Spark pod templates and sample data. We use the s3.yaml file. See the following code:

apiVersion: s3.services.k8s.aws/v1alpha1
kind: Bucket
metadata:
  name: sparkjob-demo-bucket
spec:
  name: sparkjob-demo-bucket

kubectl apply -f ack-yamls/s3.yaml

If you don’t see the bucket, you can check the log from the ACK S3 controller pod for details. The error is mostly caused if a bucket with the same name already exists. You need to change the bucket name in s3.yaml as well as in eventbridge.yaml and sfn.yaml. You also need to update upload-inputdata.sh and upload-spark-scripts.sh with the new bucket name.

Run the following command to upload the input data and pod templates:

bash spark-scripts-data/upload-inputdata.sh

The sparkjob-demo-bucket S3 bucket is created with two folders: input and scripts.

Create a Step Functions state machine

The next step is to create a Step Functions state machine that calls the EMR virtual cluster to run a Spark job, which is a sample Python script to process the New York City Taxi Records dataset. You need to define the Spark script location and pod templates for the Spark driver and executor in the StateMachine object .yaml file. Let’s make the following changes (highlighted) in sfn.yaml first:

  • Replace the value for roleARN with stepfunctions_role_arn
  • Replace the value for ExecutionRoleArn with emr_on_eks_role_arn
  • Replace the value for VirtualClusterId with your virtual cluster ID
  • Optionally, replace sparkjob-demo-bucket with your bucket name

See the following code:

apiVersion: sfn.services.k8s.aws/v1alpha1
kind: StateMachine
metadata:
  name: run-spark-job-ack
spec:
  name: run-spark-job-ack
  roleARN: "arn:aws:iam::xxxxxxxxxxx:role/event-driven-pipeline-demo-sfn-execution-role"   # replace with your stepfunctions_role_arn
  tags:
  - key: owner
    value: sfn-ack
  definition: |
      {
      "Comment": "A description of my state machine",
      "StartAt": "input-output-s3",
      "States": {
        "input-output-s3": {
          "Type": "Task",
          "Resource": "arn:aws:states:::emr-containers:startJobRun.sync",
          "Parameters": {
            "VirtualClusterId": "f0u3vt3y4q2r1ot11m7v809y6",  
            "ExecutionRoleArn": "arn:aws:iam::xxxxxxxxxxx:role/event-driven-pipeline-demo-emr-eks-data-team-a",
            "ReleaseLabel": "emr-6.7.0-latest",
            "JobDriver": {
              "SparkSubmitJobDriver": {
                "EntryPoint": "s3://sparkjob-demo-bucket/scripts/pyspark-taxi-trip.py",
                "EntryPointArguments": [
                  "s3://sparkjob-demo-bucket/input/",
                  "s3://sparkjob-demo-bucket/output/"
                ],
                "SparkSubmitParameters": "--conf spark.executor.instances=10"
              }
            },
            "ConfigurationOverrides": {
              "ApplicationConfiguration": [
                {
                 "Classification": "spark-defaults",
                "Properties": {
                  "spark.driver.cores":"1",
                  "spark.executor.cores":"1",
                  "spark.driver.memory": "10g",
                  "spark.executor.memory": "10g",
                  "spark.kubernetes.driver.podTemplateFile":"s3://sparkjob-demo-bucket/scripts/driver-pod-template.yaml",
                  "spark.kubernetes.executor.podTemplateFile":"s3://sparkjob-demo-bucket/scripts/executor-pod-template.yaml",
                  "spark.local.dir" : "/data1,/data2"
                }
              }
              ]
            }...

You can get your virtual cluster ID from the Amazon EMR console or with the following command:

kubectl get virtualcluster -o jsonpath={.items..status.id}
# result:
f0u3vt3y4q2r1ot11m7v809y6  # VirtualClusterId

Then apply the manifest to create the Step Functions state machine:

kubectl apply -f ack-yamls/sfn.yaml

Create an EventBridge rule

The last step is to create an EventBridge rule, which is used as an event broker to receive event notifications from Amazon S3. Whenever a new file, such as a new Spark script, is created in the S3 bucket, the EventBridge rule will evaluate (filter) the event and invoke the Step Functions state machine if it matches the specified rule pattern, triggering the configured Spark job.

Let’s use the following command to get the ARN of the Step Functions state machine we created earlier:

kubectl get StateMachine -o jsonpath={.items..status.ackResourceMetadata.arn}
# result
arn: arn:aws:states:us-west-2:xxxxxxxxxx:stateMachine:run-spark-job-ack # sfn_arn

Then, update eventbridge.yaml with the following values:

  • Under targets, replace the value for roleARN with eventbridge_role_arn

Under targets, replace arn with your sfn_arn

  • Optionally, in eventPattern, replace sparkjob-demo-bucket with your bucket name

See the following code:

apiVersion: eventbridge.services.k8s.aws/v1alpha1
kind: Rule
metadata:
  name: eb-rule-ack
spec:
  name: eb-rule-ack
  description: "ACK EventBridge Filter Rule to sfn using event bus reference"
  eventPattern: | 
    {
      "source": ["aws.s3"],
      "detail-type": ["Object Created"],
      "detail": {
        "bucket": {
          "name": ["sparkjob-demo-bucket"]    
        },
        "object": {
          "key": [{
            "prefix": "scripts/"
          }]
        }
      }
    }
  targets:
    - arn: arn:aws:states:us-west-2:xxxxxxxxxx:stateMachine:run-spark-job-ack # replace with your sfn arn
      id: sfn-run-spark-job-target
      roleARN: arn:aws:iam::xxxxxxxxx:role/event-driven-pipeline-demo-eb-execution-role # replace your eventbridge_role_arn
      retryPolicy:
        maximumRetryAttempts: 0 # no retries
  tags:
    - key:owner
      value: eb-ack

By applying the EventBridge configuration file, an EventBridge rule is created to monitor the folder scripts in the S3 bucket sparkjob-demo-bucket:

kubectl apply -f ack-yamls/eventbridge.yaml

For simplicity, the dead-letter queue is not set and maximum retry attempts is set to 0. For production usage, set them based on your requirements. For more information, refer to Event retry policy and using dead-letter queues.

Test the data pipeline

To test the data pipeline, we trigger it by uploading a Spark script to the S3 bucket scripts folder using the following command:

bash spark-scripts-data/upload-spark-scripts.sh

The upload event triggers the EventBridge rule and then calls the Step Functions state machine. You can go to the State machines page on the Step Functions console and choose the job run-spark-job-ack to monitor its status.

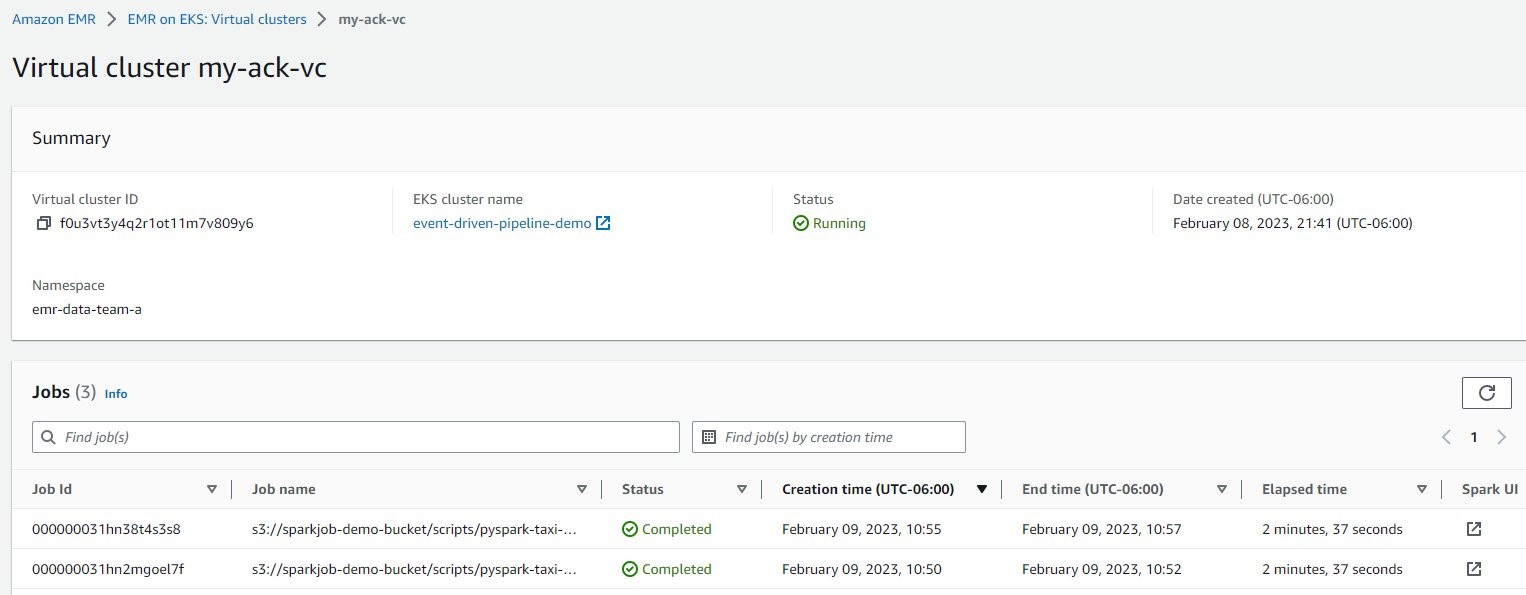
For the Spark job details, on the Amazon EMR console, choose Virtual clusters in the navigation pane, and then choose my-ack-vc. You can review all the job run history for this virtual cluster. If you choose Spark UI in any row, you’re redirected the Spark history server for more Spark driver and executor logs.

Clean up

To clean up the resources created in the post, use the following code:

aws s3 rm s3://sparkjob-demo-bucket --recursive # clean up data in S3
kubectl delete -f ack-yamls/. #Delete aws resources created by ACK
terraform destroy -target="module.eks_blueprints_kubernetes_addons" -target="module.eks_ack_addons" -auto-approve -var region=$region
terraform destroy -target="module.eks_blueprints" -auto-approve -var region=$region
terraform destroy -auto-approve -var region=$regionterraform destroy -auto-approve -var region=$region

Conclusion

This post showed how to build an event-driven data pipeline purely with native Kubernetes API and tooling. The pipeline uses EMR on EKS as compute and uses serverless AWS resources Amazon S3, EventBridge, and Step Functions as storage and orchestration in an event-driven architecture. With EventBridge, AWS and custom events can be ingested, filtered, transformed, and reliably delivered (routed) to more than 20 AWS services and public APIs (webhooks), using human-readable configuration instead of writing undifferentiated code. EventBridge helps you decouple applications and achieve more efficient organizations using event-driven architectures, and has quickly become the event bus of choice for AWS customers for many use cases, such as auditing and monitoring, application integration, and IT automation.

By using ACK controllers to create and configure different AWS services, developers can perform all data plane operations without leaving the Kubernetes platform. Also, developers only need to maintain the EKS cluster because all the other components are serverless.

As a next step, clone the GitHub repository to your local machine and test the data pipeline in your own AWS account. You can modify the code in this post and customize it for your own needs by using different EventBridge rules or adding more steps in Step Functions.


About the authors

Victor Gu is a Containers and Serverless Architect at AWS. He works with AWS customers to design microservices and cloud native solutions using Amazon EKS/ECS and AWS serverless services. His specialties are Kubernetes, Spark on Kubernetes, MLOps and DevOps.

Michael Gasch is a Senior Product Manager for AWS EventBridge, driving innovations in event-driven architectures. Prior to AWS, Michael was a Staff Engineer at the VMware Office of the CTO, working on open-source projects, such as Kubernetes and Knative, and related distributed systems research.

Peter Dalbhanjan is a Solutions Architect for AWS based in Herndon, VA. Peter has a keen interest in evangelizing AWS solutions and has written multiple blog posts that focus on simplifying complex use cases. At AWS, Peter helps with designing and architecting variety of customer workloads.

How to use Amazon GuardDuty and AWS WAF v2 to automatically block suspicious hosts

Post Syndicated from Eucke Warren original https://aws.amazon.com/blogs/security/how-to-use-amazon-guardduty-and-aws-waf-v2-to-automatically-block-suspicious-hosts/

In this post, we’ll share an automation pattern that you can use to automatically detect and block suspicious hosts that are attempting to access your Amazon Web Services (AWS) resources. The automation will rely on Amazon GuardDuty to generate findings about the suspicious hosts, and then you can respond to those findings by programmatically updating AWS WAF to block the host from accessing your workloads.

You should implement security measures across your AWS resources by using a holistic approach that incorporates controls across multiple areas. In the AWS CAF Security Perspective section of the AWS Security Incident Response Guide, we define these controls across four categories:

  • Directive controls — Establish the governance, risk, and compliance models the environment will operate within
  • Preventive controls — Protect your workloads and mitigate threats and vulnerabilities
  • Detective controls — Provide full visibility and transparency over the operation of your deployments in AWS
  • Responsive controls — Drive remediation of potential deviations from your security baselines

Security automation is a key principle outlined in the Response Guide. It helps reduce operational overhead and creates repeatable, predictable approaches to monitoring and responding to events. AWS services provide the building blocks to create powerful patterns for the automated detection and remediation of threats against your AWS environments. You can configure automated flows that use both detective and responsive controls and might also feed into preventative controls to help mitigate risks in the future. Depending on the type of source event, you can automatically invoke specific actions, such as modifying access controls, terminating instances, or revoking credentials.

The patterns highlighted in this post provide an example of how to automatically remediate detected threats. You should modify these patterns to suit your defined requirements, and test and validate them before deploying them in a production environment.

AWS services used for the example pattern

Amazon GuardDuty is a continuous security monitoring and threat detection service that incorporates threat intelligence, anomaly detection, and machine learning to help protect your AWS resources, including your AWS accounts. Amazon EventBridge delivers a near-real-time stream of system events that describe changes in AWS resources. Amazon GuardDuty sends events to Amazon CloudWatch when a change in the findings takes place. In the context of GuardDuty, such changes include newly generated findings and subsequent occurrences of these findings. You can quickly set up rules to match events generated by GuardDuty findings in EventBridge events and route those events to one or more target actions. The pattern in this post routes matched events to AWS Lambda, which then updates AWS WAF web access control lists (web ACLs) and Amazon Virtual Private Cloud (Amazon VPC) network access control lists (network ACLs). AWS WAF is a web application firewall that helps protect your web applications from common web exploits that could affect application availability, security, or excess resource consumption. It supports both managed rules as well as a powerful rule language for custom rules. A network ACL is stateless and is an optional layer of security for your VPC that helps you restrict specific inbound and outbound traffic at the subnet level.

Pattern overview

This example pattern assumes that Amazon GuardDuty is enabled in your AWS account. If it isn’t enabled, you can learn more about the free trial and pricing, and follow the steps in the GuardDuty documentation to configure the service and start monitoring your account. The example code will only work in the us-east-1 AWS Region due to the use of Amazon CloudFront and web ACLs within the template.

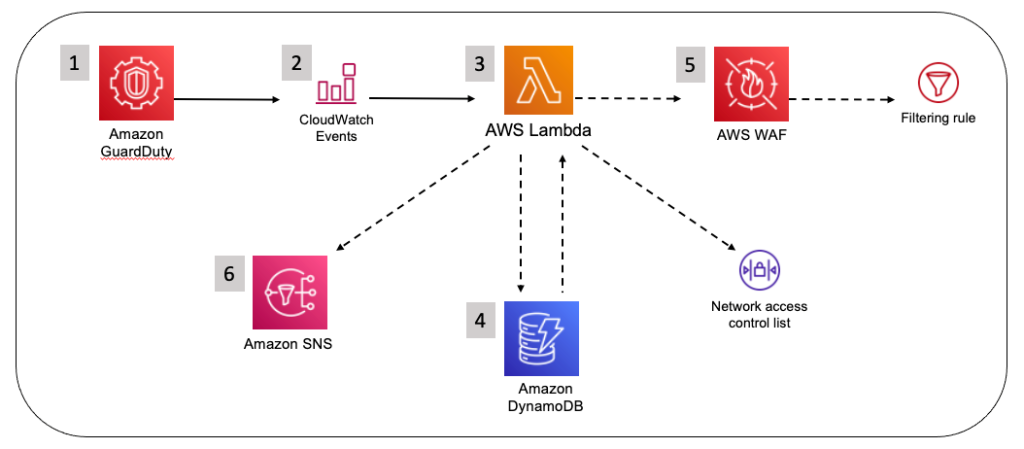
Figure 1 shows how the AWS CloudFormation template creates the sample pattern.

Figure 1: How the CloudFormation template works

Figure 1: How the CloudFormation template works

Here’s how the pattern works, as shown in the diagram:

  1. A GuardDuty finding is generated due to suspected malicious activity.
  2. An EventBridge event is configured to filter for GuardDuty finding types by using event patterns.
  3. A Lambda function is invoked by the EventBridge event and parses the GuardDuty finding.
  4. The Lambda function checks the Amazon DynamoDB state table for an existing entry that matches the identified host. If state data is not found in the table for the identified host, a new entry is created in the Amazon DynamoDB state table.
  5. The Lambda function creates a web ACL rule inside AWS WAF and updates a subnet network ACL.
  6. A notification email is sent through Amazon Simple Notification Service (SNS).

A second Lambda function runs on a 5-minute recurring schedule and removes entries that are past the configurable retention period from AWS WAF IPSets (an IPSet is a list that contains the blocklisted IPs or CIDRs), VPC network ACLs, and the DynamoDB table.

GuardDuty prefix patterns and findings

The EventBridge event rule provided by the example automation uses the following seven prefix patterns, which allow coverage for 36 GuardDuty finding types. These specific finding types are of a network nature, and so we can use AWS WAF to block them. Be sure to read through the full list of finding types in the GuardDuty documentation to better understand what GuardDuty can report findings for. The covered findings are as follows:

  1. UnauthorizedAccess:EC2
    • UnauthorizedAccess:EC2/MaliciousIPCaller.Custom
    • UnauthorizedAccess:EC2/MetadataDNSRebind
    • UnauthorizedAccess:EC2/RDPBruteForce
    • UnauthorizedAccess:EC2/SSHBruteForce
    • UnauthorizedAccess:EC2/TorClient
    • UnauthorizedAccess:EC2/TorRelay
  2. Recon:EC2
    • Recon:EC2/PortProbeEMRUnprotectedPort
    • Recon:EC2/PortProbeUnprotectedPort
    • Recon:EC2/Portscan
  3. Trojan:EC2
    • Trojan:EC2/BlackholeTraffic
    • Trojan:EC2/BlackholeTraffic!DNS
    • Trojan:EC2/DGADomainRequest.B
    • Trojan:EC2/DGADomainRequest.C!DNS
    • Trojan:EC2/DNSDataExfiltration
    • Trojan:EC2/DriveBySourceTraffic!DNS
    • Trojan:EC2/DropPoint
    • Trojan:EC2/DropPoint!DNS
    • Trojan:EC2/PhishingDomainRequest!DNS
  4. Backdoor:EC2
    • Backdoor:EC2/C&CActivity.B
    • Backdoor:EC2/C&CActivity.B!DNS
    • Backdoor:EC2/DenialOfService.Dns
    • Backdoor:EC2/DenialOfService.Tcp
    • Backdoor:EC2/DenialOfService.Udp
    • Backdoor:EC2/DenialOfService.UdpOnTcpPorts
    • Backdoor:EC2/DenialOfService.UnusualProtocol
    • Backdoor:EC2/Spambot
  5. Impact:EC2
    • Impact:EC2/AbusedDomainRequest.Reputation
    • Impact:EC2/BitcoinDomainRequest.Reputation
    • Impact:EC2/MaliciousDomainRequest.Reputation
    • Impact:EC2/PortSweep
    • Impact:EC2/SuspiciousDomainRequest.Reputation
    • Impact:EC2/WinRMBruteForce
  6. CryptoCurrency:EC2
    • CryptoCurrency:EC2/BitcoinTool.B
    • CryptoCurrency:EC2/BitcoinTool.B!DNS
  7. Behavior:EC2
    • Behavior:EC2/NetworkPortUnusual
    • Behavior:EC2/TrafficVolumeUnusual

When activity occurs that generates one of these GuardDuty finding types and is then matched by the EventBridge event rule, an entry is created in the target web ACLs and subnet network ACLs to deny access from the suspicious host, and then a notification is sent to an email address by this pattern’s Lambda function. Blocking traffic from the suspicious host helps to mitigate potential threats while you perform additional investigation and remediation. For more information, see Remediating a compromised EC2 instance.

Solution deployment

To deploy the solution, you’ll do the following steps. Each step is described in more detail in the sections that follow.

  1. Download the required files.
  2. Create your Amazon Simple Storage Service (Amazon S3) bucket and upload the .zip files.
  3. Deploy the CloudFormation template.
  4. Create and test the Lambda function for a GuardDuty finding event.
  5. Confirm the entry for the test event in the VPC network ACL.
  6. Confirm the entry in the AWS WAF IP sets.
  7. Confirm the SNS notification email alert.
  8. Apply the AWS WAF web ACLs to resources.

Step 1: Download the required files

Download the following four files from the amazon-guardduty-waf-acl GitHub code repository:

  1. CloudFormation template – Copy and save the linked raw text, using the file name guarddutytoacl.template on your local file system.
  2. JSON event test file – Copy and save the linked raw text, using the file name gd2acl_test_event.json on your local file system.
  3. guardduty_to_acl_lambda_wafv2.zip – Choose the Download button on the GitHub page and save the .zip file to your local file system.
  4. prune_old_entries_wafv2.zip – Choose the Download button on the GitHub page and save the .zip file to your local file system.

Step 2: Create your S3 bucket and upload .zip files

For this step, create an S3 bucket with public access blocked, and then upload the Lambda .zip files to the newly created S3 bucket.

To create your S3 bucket and upload .zip files

  1. Create an S3 bucket in the us-east-1 Region.
  2. Upload the .zip files guardduty_to_acl_lambda_wafv2.zip and prune_old_entries_wafv2.zip that you saved to your local file system in Step 1 to the newly created S3 bucket.

Step 3: Deploy the CloudFormation template

For this step, deploy the CloudFormation template only to the us-east-1 Region within the AWS account where GuardDuty findings are to be monitored.

To deploy the CloudFormation template

  1. Sign in to the AWS Management Console, choose the CloudFormation service, and set N.Virginia (us-east-1) as the Region.
  2. Choose Create stack, and then choose With new resources (standard).
  3. When the Create stack landing page is presented, make sure that Template is ready is selected in the Prepare template section. In the Template source section, choose Upload a template file.
  4. Choose the Choose file button and browse to the location where the guarddutytoacl.template file was saved on your local file system. Select the file, choose Open, and then choose Next.
  5. On the Specify stack details page, provide the following input parameters. You can modify the default values to customize the pattern for your environment.

    Input parameter Input parameter description
    Notification email The email address to receive notifications. Must be a valid email address.
    Retention time, in minutes How long to retain IP addresses in the blocklist (in minutes). The default is 12 hours.
    S3 bucket for artifacts The S3 bucket with artifact files (Lambda functions, templates, HTML files, and so on). Keep the default value for deployment into the N. Virginia Region.
    S3 path to artifacts The path in the S3 bucket that contains artifact files. Keep the default value for deployment into the N. Virginia Region.
    CloudFrontWebACL Create CloudFront Web ACL? If set to true, a CloudFront IP set will be created automatically.
    RegionalWebACL Create Regional Web ACL? If set to true, a Regional IP set will be created automatically.

    Figure 2 shows an example of the values entered on this page.

    Figure 2: CloudFormation parameters on the Specify stack details page

    Figure 2: CloudFormation parameters on the Specify stack details page

  6. Enter values for all of the input parameters, and then choose Next.
  7. On the Configure stack options page, accept the defaults, and then choose Next.
  8. On the Review page, confirm the details, check the box acknowledging that the template will require capabilities for AWS::IAM::Role, and then choose Create Stack.

    The stack normally requires no more than 3–5 minutes to complete.

  9. While the stack is being created, check the email inbox that you specified for the Notification email address parameter. Look for an email message with the subject “AWS Notification – Subscription Confirmation”. Choose the link in the email to confirm the subscription to the SNS topic. You should see a message similar to the following.
    Figure 3: Subscription confirmation

    Figure 3: Subscription confirmation

When the Status field for the CloudFormation stack changes to CREATE_COMPLETE, as shown in Figure 4, the pattern is implemented and is ready for testing.

Figure 4: The stack status is CREATE_COMPLETE

Figure 4: The stack status is CREATE_COMPLETE

Step 4: Create and test the Lambda function for a GuardDuty finding event

After the CloudFormation stack has completed deployment, you can test the functionality by using a Lambda test event.

To create and run a Lambda GuardDuty finding test event

  1. In the AWS Management Console, choose Services > VPC > Subnets and locate a subnet that is suitable for testing the pattern.
  2. On the Details tab, copy the subnet ID to the clipboard or to a text editor.
    Figure 5: The subnet ID value on the Details tab

    Figure 5: The subnet ID value on the Details tab

  3. In the AWS Management Console, choose Services > CloudFormation > GuardDutytoACL stack. On the Outputs tab for the stack, look for the GuardDutytoACLLambda entry.
    Figure 6: The GuardDutytoACLLambda entry on the Outputs tab

    Figure 6: The GuardDutytoACLLambda entry on the Outputs tab

  4. Choose the link for the entry, and you’ll be redirected to the Lambda console, with the Lambda Code source page already open.
    Figure 7: The Lambda function open in the Lambda console

    Figure 7: The Lambda function open in the Lambda console

  5. In the middle of the Code source menu, in the Test dropdown list, locate and select the Configure test event option.
    Figure 8: Select Configure test event from the dropdown list

    Figure 8: Select Configure test event from the dropdown list

  6. To facilitate testing, we’ve provided a test event file. On the Configure test event page, do the following:
    1. For Event name, enter a name.
    2. In the body of the Event JSON field, paste the provided test event JSON, overwriting the existing contents.
    3. Update the value of SubnetId key (line 35) to the value of the subnet ID that you chose in Step 1 of this procedure.
    4. Choose Save.
    Figure 9: Update the value of the subnetId key

    Figure 9: Update the value of the subnetId key

  7. Choose Test to invoke the Lambda function with the test event. You should see the message “Status: succeeded” at the top of the execution results, similar to what is shown in Figure 10.
    Figure 10: The Test button and the “succeeded” message

    Figure 10: The Test button and the “succeeded” message

Step 5: Confirm the entry in the VPC network ACL

In this step, you’ll confirm that the DENY entry was created in the network ACL. This pattern is configured to create up to 10 entries in an ACL, ranging between rule numbers 71 and 80. Because network ACL rules are processed in order, it’s important that the DENY rule is placed before the ALLOW rule.

To confirm the entry in the VPC network ACL

  1. In the AWS Management Console, choose Services > VPC > Subnets, and locate the subnet you provided for the test event.
  2. Choose the network ACL link and confirm that the new DENY entry was generated from the test event.
    Figure 11: Check the entry from the test event on the Network tab

    Figure 11: Check the entry from the test event on the Network tab

    Note that VPC network ACL entries are created in the rule number range between 71 and 80. Older entries are aged out to create a “sliding window” of blocked hosts.

Step 6: Confirm the entry in the AWS WAF IP sets and blocklists

Next, verify that the entry was added to the CloudFront AWS WAF IP set and to the Application Load Balancer (ALB) AWS WAF IP set.

To confirm the entry in the AWS WAF IP set and blocklist

  1. In the AWS Management Console, choose Services > WAF & Shield > Web ACLs, and then set the selected Region to Global (CloudFront).
  2. Find and select the web ACL name that starts with CloudFrontBlockListWeb. In the Rule view, on the Rules tab, select the rule named CloudFrontBlocklistIPSetRule. Note that 198.51.100.0/32 appears as an entry in the rule.
    Figure 12: Confirm that the IP address was added

    Figure 12: Confirm that the IP address was added

  3. In the AWS Management Console, on the left navigation menu, choose Web ACLs, and then set the selected Region to US East (N. Virginia).
  4. Find and select the web ACL name that starts with RegionalBlocklistACL. In the Rule view, on the Rules tab, select the rule named RegionalBlocklistIPSetRule. Note that 198.51.100.0/32 appears as an entry in the rule.
    Figure 13: Make sure that the IP address was added

    Figure 13: Make sure that the IP address was added

There might be specific host addresses that you want to prevent from being added to the blocklist. You can do this within GuardDuty by using a trusted IP list. Trusted IP lists consist of IP addresses that you have allowlisted for secure communication with your AWS infrastructure and applications. GuardDuty doesn’t generate findings for IP addresses on trusted IP lists. For more information, see Working with trusted IP lists and threat lists.

Step 7: Confirm the SNS notification email

Finally, verify that the SNS notification was sent to the email address you set up.

To confirm receipt of the SNS notification email

  • Review the email inbox that you specified for the AdminEmail parameter and look for a message with the subject line “AWS GD2ACL Alert”. The contents of the message from SNS should be similar to the following.
    Figure 14: SNS message example

    Figure 14: SNS message example

Step 8: Apply the AWS WAF web ACLs to resources

The final task is to associate the web ACL with the CloudFront distributions and Application Load Balancers that you want to automatically update with this pattern. To learn how to do this, see Associating or disassociating a web ACL with an AWS resource.

You can also use AWS Firewall Manager to associate the web ACLs. AWS Firewall Manager can simplify your AWS WAF administration and maintenance tasks across multiple accounts and resources. With Firewall Manager, you set up your firewall rules just once. The service automatically applies your rules across your accounts and resources, even as you add new resources.

Conclusion

In this post, you’ve learned how to use Lambda to automatically update AWS WAF and VPC network ACLs in response to GuardDuty findings. With just a few steps, you can use this sample pattern to help mitigate threats by blocking communication with suspicious hosts. You can explore additional possible patterns by using GuardDuty finding types and Amazon EventBridge target actions. This pattern’s code is available on GitHub. Feel free to play around with the code to add more GuardDuty findings to this pattern and also to build bigger and better patterns! Make sure to modify the patterns in this post to suit your defined requirements, and test and validate them before deploying them in a production environment.

If you have comments about this blog post, you can submit them in the Comments section below. If you have questions about using this pattern, start a thread in the GuardDutyAWS WAF, or CloudWatch forums, or contact AWS Support.

Want more AWS Security news? Follow us on Twitter.

Eucke Warren

Eucke Warren

Eucke is a Sr Solution Architect helping ISV customers grow and mature securely. He has been fortunate to be able to work with technology for more than 30 years and counts automation, infrastructure, and security as areas of focus. When he’s not supporting customers, he enjoys time with his wife, family, and the company of a very bossy 18-pound dog.

Geoff Sweet

Geoff Sweet

Geoff has been in industry for over 20 years. He began his career in Electrical Engineering. Starting in IT during the dot-com boom, he has held a variety of diverse roles, such as systems architect, network architect, and, for the past several years, security architect. Geoff specializes in infrastructure security.

Genomics workflows, Part 5: automated benchmarking

Post Syndicated from Rostislav Markov original https://aws.amazon.com/blogs/architecture/genomics-workflows-part-5-automated-benchmarking/

Launching and running genomics workflows can take hours and involves large pools of compute instances that process data at a petabyte scale. Benchmarking helps you evaluate workflow performance and discover faster and cheaper ways of running them.

In practice, performance evaluations happen irregularly because of the associated heavy lifting. In this blog post, we discuss how life-science research teams can automate evaluations.

Business Benefits

An automated benchmarking solution provides:

  • more accurate enterprise resource planning by performing historical analytics,
  • lower cost to the business by comparing performance on different resource types, and
  • cost transparency to the business by quantifying periodical chargeback.

We’ve used automated benchmarking to compare processing times on different services such as Amazon Elastic Compute Cloud (Amazon EC2), AWS Batch, AWS ParallelCluster, Amazon Elastic Kubernetes Service (Amazon EKS), and on-premises HPC clusters. Scientists, financiers, technical leaders, and other stakeholders can build reports and dashboards to compare consumption data by consumer, workflow type, and time period.

Design pattern

Our automated benchmarking solution measures performance on two dimensions:

  • Timing: measures the duration of a workflow launch on a specific dataset
  • Pricing: measures the associated cost

This solution can be extended to other performance metrics such as iterations per second or process/thread distribution across compute nodes.

Our requirements include the following:

  • Consistent measurement of timing based on workflow status (such as preparing, waiting, ready, running, failed, complete)
  • Extensible pricing models based on unit prices (the Amazon EC2 Spot price at a specific period of time compared to Amazon EC2 On-Demand pricing)
  • Scalable, cost-efficient, and flexible data store enabling historical benchmarking and estimations
  • Minimal infrastructure management overhead

We choose a serverless design pattern using AWS Step Functions orchestration, AWS Lambda for our application code, and Amazon DynamoDB to track workflow launch IDs and states (as described in Part 3). We assume that the genomics workflows run on AWS Batch with genomics data on Amazon FSx for Lustre (Part 1). AWS Step Functions allows us to break down processing into smaller steps and avoid monolithic application code. Our evaluation process runs in four steps:

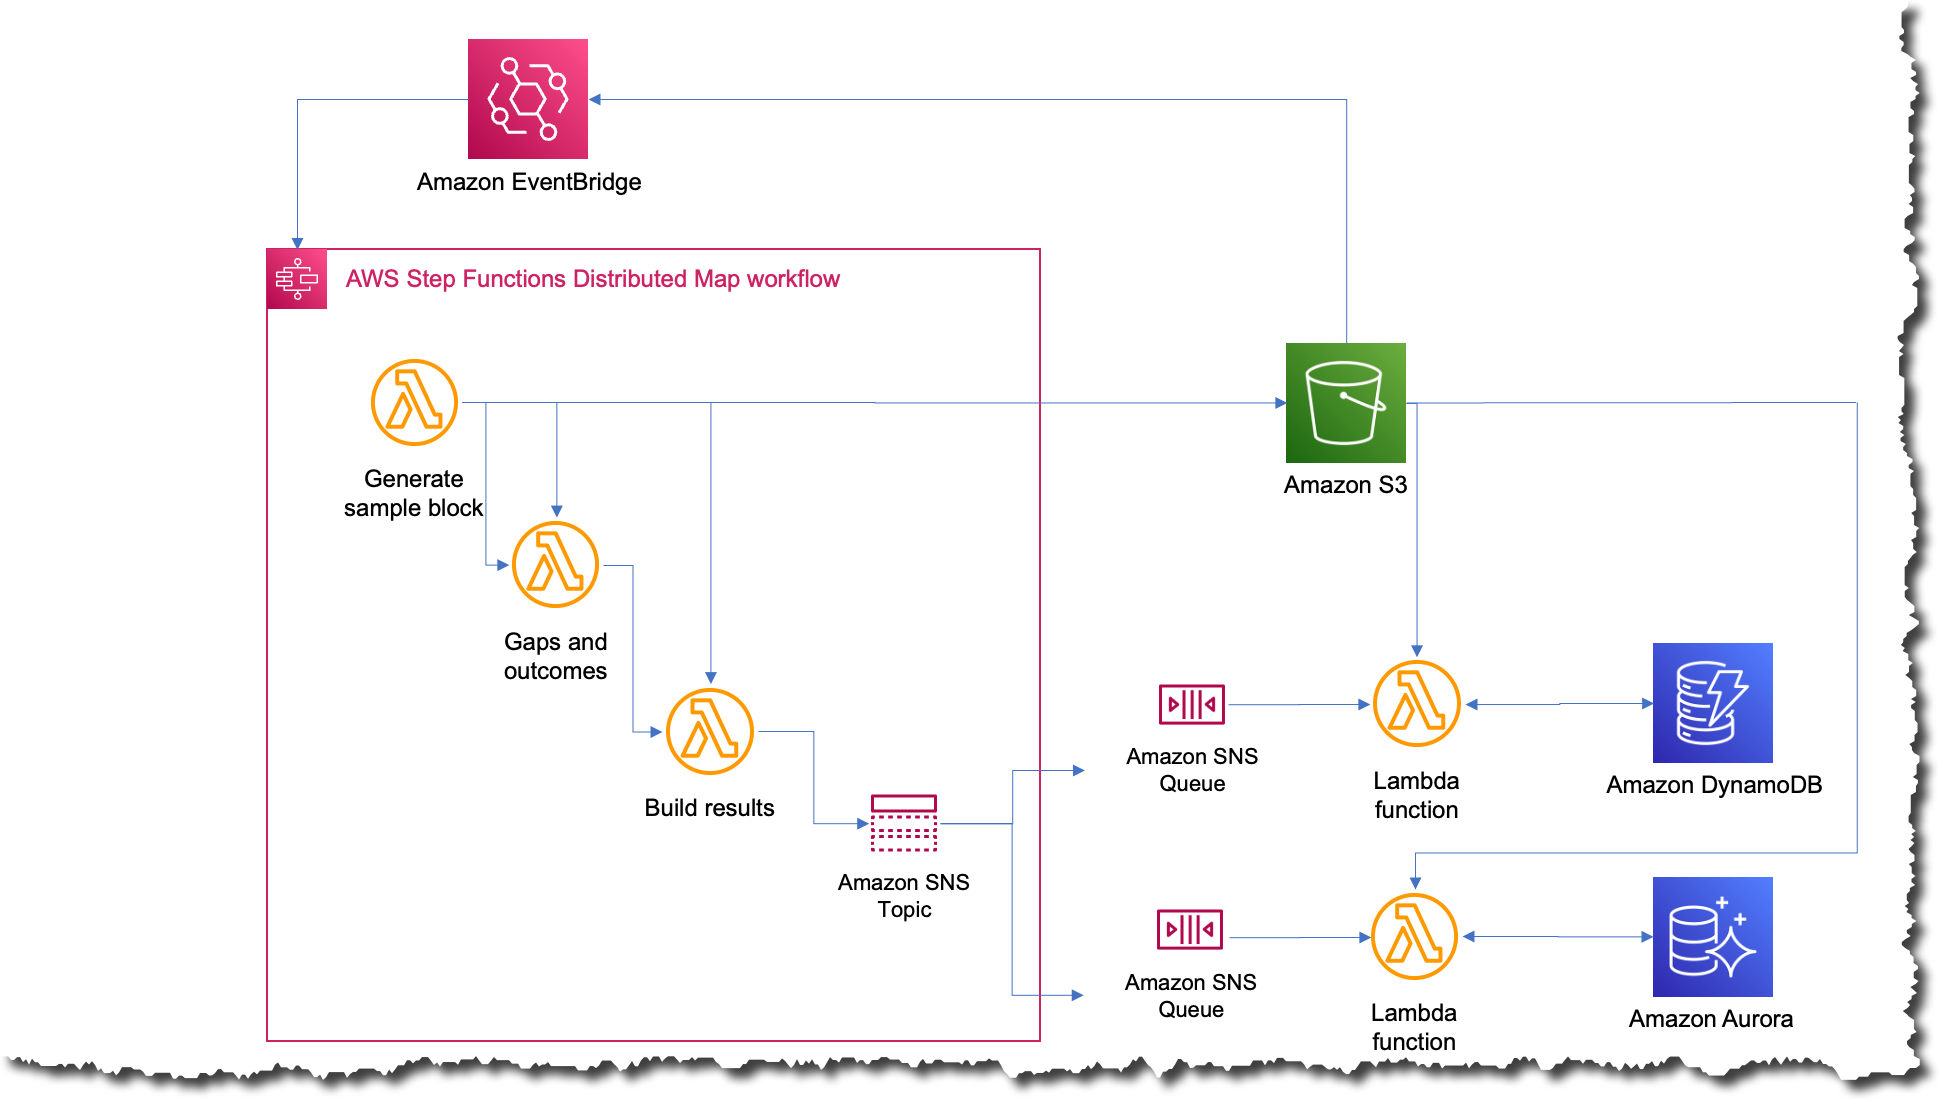
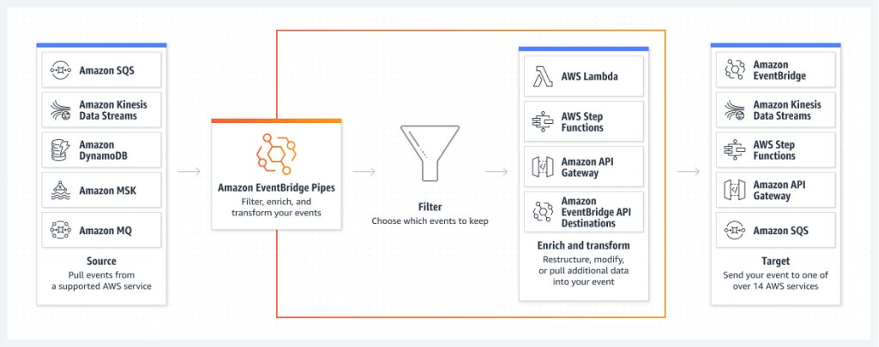
  1. Monitor for completed workflow launches in the DynamoDB stream using an Amazon EventBridge pipe with a Step Functions workflow as target. This event-driven approach is more efficient than periodic polling and avoids custom code for parsing status and cost values in all records of the DynamoDB stream.
  2. Collect a list of all compute resources associated with the workflow launch. Design a Lambda function that queries the AWS Batch API (see Part 1) to describe compute environment parameters like the Amazon EC2 instance IDs and their details, such as processing times, instance family/size, and allocation strategy (for example, Spot Instances, Reserved Instances, On-Demand Instances).
  3. Calculate the cost of all consumed resources. We achieve this with another Lambda function, which calculates the total price based on unit prices from the AWS Price List Query API.
  4. Our state machine updates the total price in the DynamoDB table without the need for additional application code.

Figure 1 visualizes these steps.

Automated benchmarking of genomics workflows

Figure 1. Automated benchmarking of genomics workflows

Implementation considerations

AWS Step Functions orchestrates our benchmarking workflow reliably and makes our application code easy to maintain. Figure 2 summarizes the state machine transitions that we’ll describe.

AWS Step Functions state machine for automated benchmarking

Figure 2. AWS Step Functions state machine for automated benchmarking

Gather consumption details

Configure the DynamoDB stream view type to New image so that the entire item is passed through as it appears after it was changed. We set up an Amazon EventBridge pipe with event filtering and the DynamoDB stream as a source. Our event filter uses multiple matching on records with a status of COMPLETE, but no cost entry in order to avoid an infinite loop. Once our state machine has updated the DynamoDB item with the workflow price, the resulting record in the DynamoDB stream will not pass our event filter.

The syntax of our event filter is as follows:

{
  "dynamodb": {
    "NewImage": {
      "status": {
        "S": ["COMPLETE"]
      },
      "totalCost": {
        "S": [{
          "exists": false
        }]
      }
    }
  }
}

We use an input transformer to simplify follow-on parsing by removing unnecessary metadata from the event.

The consumed resources included in the stream record are the auto-scaling group ID for AWS Batch and the Amazon FSx for Lustre volume ID. We use the DescribeJobs API (describe_jobs in Boto3) to determine which compute resources were used. If the response is a list of EC2 instances, we then look up consumption information including start and end times using the ListJobs API (list_jobs in Boto3) for each compute node. We use describe_volumes with filters on the identified EC2 instances to obtain the size and type of Amazon Elastic Block Store (Amazon EBS) volumes.

Calculate prices

Another Lambda function obtains the associated unit prices of all consumed resources using the GetProducts request of AWS Price List Query API (get_products in Boto3) and then parsing the pricePerUnit value. For Spot Instances, we use describe_spot_price_history of the EC2 client in Boto3 and specify the time range and instance types for which we want to receive prices.

Calculate the price of workflow launches based on the following factors:

  • Number and size of EC2 instances in auto-scaling node groups
  • Size of EBS volumes and Amazon FSx for Lustre
  • Processing duration

Our Python-based Lambda function calculates the total, rounds it, and delivers the price breakdown in the following format:

total_cost: str, instance_cost: str, volume_cost: str, filesystem_cost: str

Lastly, we put the price breakdown to the DynamoDB table using UpdateItem directly from the Amazon States Language.

Note that AWS credits and enterprise discounts might not be reflected in the responses of the AWS Price List Query API unless applied to the particular AWS account. This is often considered best practice in light of least-privilege considerations.

In the past, we’ve also used AWS Cost Explorer instead of the AWS Price List API. AWS Cost Explorer data is updated at least once every 24 hours. You can denote the pending price status in the DynamoDB table item and use the Wait state to delay the calculation process.

The presented solution can be extended to other compute services such as Amazon Elastic Kubernetes Service (Amazon EKS). For Amazon EKS, events are enriched with the cluster ID from the DynamoDB table and the price calculation should also include control plane costs.

Conclusion

Life-science research teams use benchmarking to compare workflow performance and inform their architectural decisions. Such evaluations are effort-intensive and therefore done irregularly.

In this blog post, we showed how life-science research teams can automate benchmarking for their scientific workflows. The insights teams gain from automated benchmarking indicate continuous optimization opportunities, such as by adjusting compute node configuration. The evaluation data is also available on demand for other purposes including chargeback.

Stay tuned for our next post in which we show how to use historical benchmarking data for price estimations of future workflow launches.

Related information

Implementing an event-driven serverless story generation application with ChatGPT and DALL-E

Post Syndicated from David Boyne original https://aws.amazon.com/blogs/compute/implementing-an-event-driven-serverless-story-generation-application-with-chatgpt-and-dall-e/

This post demonstrates how to integrate AWS serverless services with artificial intelligence (AI) technologies, ChatGPT, and DALL-E. This full stack event-driven application showcases a method of generating unique bedtime stories for children by using predetermined characters and scenes as a prompt for ChatGPT.

Every night at bedtime, the serverless scheduler triggers the application, initiating an event-driven workflow to create and store new unique AI-generated stories with AI-generated images and supporting audio.

These datasets are used to showcase the story on a custom website built with Next.js hosted with AWS App Runner. After the story is created, a notification is sent to the user containing a URL to view and read the story to the children.

Example notification of a story hosted with Next.js and App Runner

Example notification of a story hosted with Next.js and App Runner

By integrating AWS services with AI technologies, you can now create new and innovative ideas that were previously unimaginable.

The application mentioned in this blog post demonstrates examples of point-to-point messaging with Amazon EventBridge pipes, publish/subscribe patterns with Amazon EventBridge and reacting to change data capture events with DynamoDB Streams.

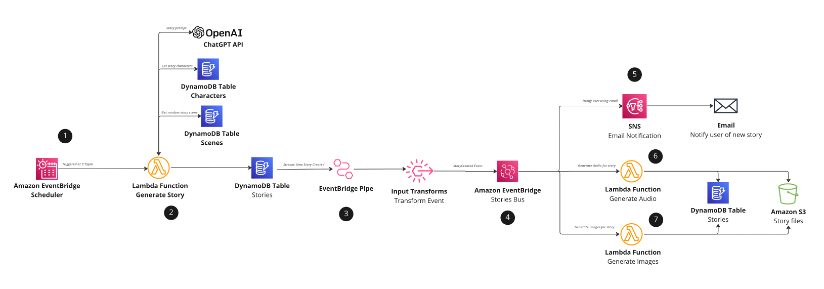
Understanding the architecture

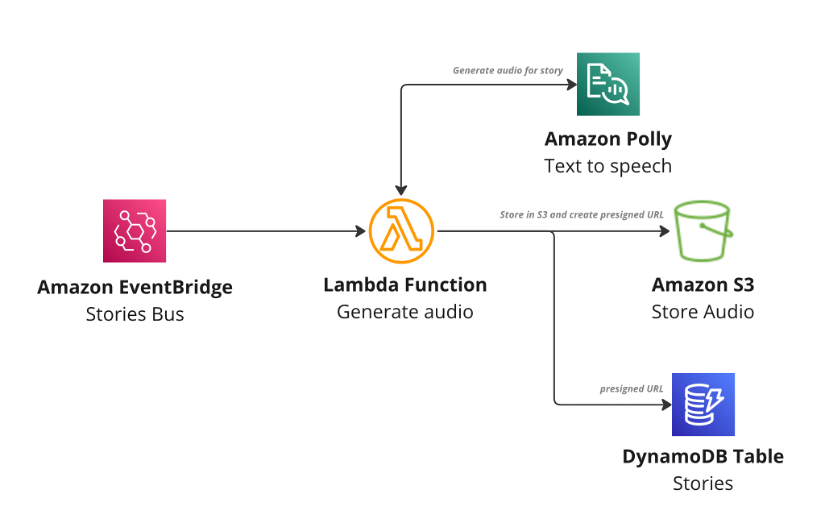
The following image shows the serverless architecture used to generate stories:

Architecture diagram for Serverless bed time story generation with ChatGPT and DALL-E

Architecture diagram for Serverless bed time story generation with ChatGPT and DALL-E

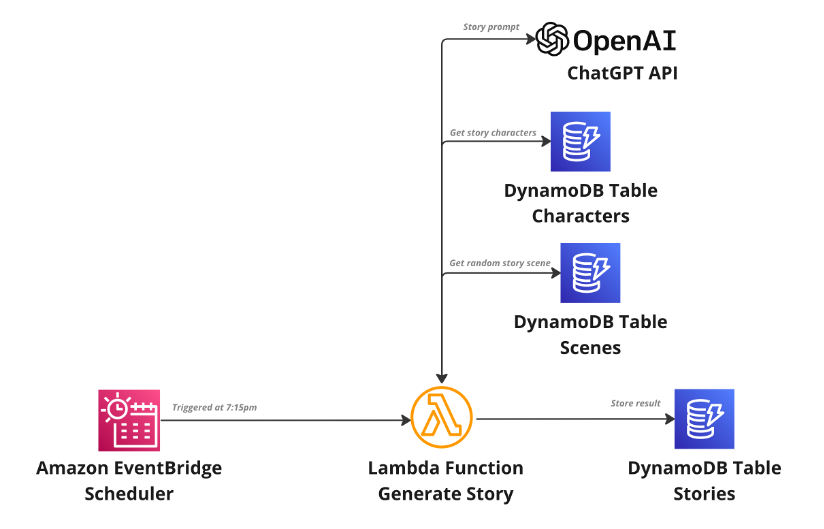
A new children’s story is generated every day at configured time using Amazon EventBridge Scheduler (Step 1). EventBridge Scheduler is a service capable of scaling millions of schedules with over 200 targets and over 6000 API calls. This example application uses EventBridge scheduler to trigger an AWS Lambda function every night at the same time (7:15pm). The Lambda function is triggered to start the generation of the story.

EventBridge scheduler triggers Lambda function every day at 7:15pm (bed time)

EventBridge scheduler triggers Lambda function every day at 7:15pm (bed time)

The “Scenes” and “Characters” Amazon DynamoDB tables contain the characters involved in the story and a scene that is randomly selected during its creation. As a result, ChatGPT receives a unique prompt each time. An example of the prompt may look like this:

“`
Write a title and a rhyming story on 2 main characters called Parker and Jackson. The story needs to be set within the scene haunted woods and be at least 200 words long

“`

After the story is created, it is then saved in the “Stories” DynamoDB table (Step 2).

Scheduler triggering Lambda function to generate the story and store story into DynamoDB

Scheduler triggering Lambda function to generate the story and store story into DynamoDB

Once the story is created this initiates a change data capture event using DynamoDB Streams (Step 3). This event flows through point-to-point messaging with EventBridge pipes and directly into EventBridge. Input transforms are then used to convert the DynamoDB Stream event into a custom EventBridge event, which downstream consumers can comprehend. Adopting this pattern is beneficial as it allows us to separate contracts from the DynamoDB event schema and not having downstream consumers conform to this schema structure, this mapping allows us to remain decoupled from implementation details.

EventBridge Pipes connecting DynamoDB streams directly into EventBridge.

EventBridge Pipes connecting DynamoDB streams directly into EventBridge.

Upon triggering the StoryCreated event in EventBridge, three targets are triggered to carry out several processes (Step 4). Firstly, AI Images are processed, followed by the creation of audio for the story. Finally, the end user is notified of the completed story through Amazon SNS and email subscriptions. This fan-out pattern enables these tasks to be run asynchronously and in parallel, allowing for faster processing times.

EventBridge pub/sub pattern used to start async processing of notifications, audio, and images.

EventBridge pub/sub pattern used to start async processing of notifications, audio, and images.

An SNS topic is triggered by the `StoryCreated` event to send an email to the end user using email subscriptions (Step 6). The email consists of a URL with the id of the story that has been created. Clicking on the URL takes the user to the frontend application that is hosted with App Runner.

Using SNS to notify the user of a new story

Using SNS to notify the user of a new story

Example email sent to the user

Example email sent to the user

Amazon Polly is used to generate the audio files for the story (Step 6). Upon triggering the `StoryCreated` event, a Lambda function is triggered, and the story description is used and given to Amazon Polly. Amazon Polly then creates an audio file of the story, which is stored in Amazon S3. A presigned URL is generated and saved in DynamoDB against the created story. This allows the frontend application and browser to retrieve the audio file when the user views the page. The presigned URL has a validity of two days, after which it can no longer be accessed or listened to.

Lambda function to generate audio using Amazon Polly, store in S3 and update story with presigned URL

Lambda function to generate audio using Amazon Polly, store in S3 and update story with presigned URL

The `StoryCreated` event also triggers another Lambda function, which uses the OpenAI API to generate an AI image using DALL-E based on the generated story (Step 7). Once the image is generated, the image is downloaded and stored in Amazon S3. Similar to the audio file, the system generates a presigned URL for the image and saves it in DynamoDB against the story. The presigned URL is only valid for two days, after which it becomes inaccessible for download or viewing.

Lambda function to generate images, store in S3 and update story with presigned URL.

Lambda function to generate images, store in S3 and update story with presigned URL.

In the event of a failure in audio or image generation, the frontend application still loads the story, but does not display the missing image or audio at that moment. This ensures that the frontend can continue working and provide value. If you wanted more control and only trigger the user’s notification event once all parallel tasks are complete the aggregator messaging pattern can be considered.

Hosting the frontend Next.js application with AWS App Runner

Next.js is used by the frontend application to render server-side rendered (SSR) pages that can access the stories from the DynamoDB table, which are then hosted with AWS App Runner after being containerized.

Next.js application hosted with App Runner, with permissions into DynamoDB table.

Next.js application hosted with App Runner, with permissions into DynamoDB table.

AWS App Runner enables you to deploy containerized web applications and APIs securely, without needing any prior knowledge of containers or infrastructure. With App Runner, developers can concentrate on their application, while the service handles container startup, running, scaling, and load balancing. After deployment, App Runner provides a secure URL for clients to begin making HTTP requests against.

With App Runner, you have two primary options for deploying your container: source code connections or source images. Using source code connections grants App Runner permission to pull the image file directly from your source code, and with Automatic deployment configured, it can redeploy the application when changes are made. Alternatively, source images provide App Runner with the image’s location in an image registry, and this image is deployed by App Runner.

In this example application, CDK deploys the application using the DockerImageAsset construct with the App Runner construct. Once deployed, App Runner builds and uploads the frontend image to Amazon Elastic Container Registry (ECR) and deploys it. Downstream consumers can access the application using the secure URL provided by App Runner. In this example, the URL is used when the SNS notification is sent to the user when the story is ready to be viewed.

Giving the frontend container permission to DynamoDB table

To grant the Next.js application permission to obtain stories from the Stories DynamoDB table, App Runner instance roles are configured. These roles are optional and can provide the necessary permissions for the container to access AWS services required by the compute service.

If you want to learn more about AWS App Runner, you can explore the free workshop.

Design choices and assumptions

The DynamoDB Time to Live (TTL) feature is ideal for the short-lived nature of daily generated stories. DynamoDB handle the deletion of stories after two days by setting the TTL attribute on each story. Once a story is deleted, it becomes inaccessible through the generated story URLs.

Using Amazon S3 presigned URLs is a method to grant temporary access to a file in S3. This application creates presigned URLs for the audio file and generated images that last for 2 days, after which the URLs for the S3 items become invalid.

Input transforms are used between DynamoDB streams and EventBridge events to decouple the schemas and events consumed by downstream targets. Consuming the events as they are is known as the “conformist” pattern, and couples us to implementation details of DynamoDB streams with downstream EventBridge consumers. This allows the application to remain decoupled from implementation details and remain flexible.

Conclusion

The adoption of artificial intelligence (AI) technology has significantly increased in various industries. ChatGPT, a large language model that can understand and generate human-like responses in natural language, and DALL-E, an image generation system that can create realistic images based on textual descriptions, are examples of such technology. These systems have demonstrated the potential for AI to provide innovative solutions and transform the way we interact with technology.

This blog post explores ways in which you can utilize AWS serverless services with ChatGTP and DALL-E to create a story generation application fronted by a Next.js application hosted with App Runner. EventBridge Scheduler is used to trigger the story creation process then react to change data capture events with DynamoDB streams and EventBridge Pipes, and use Amazon EventBridge to fan out compute tasks to process notifications, images, and audio files.

You can find the documentation and the source code for this application in GitHub.

For more serverless learning resources, visit Serverless Land.

Managing sessions of anonymous users in WebSocket API-based applications

Post Syndicated from James Beswick original https://aws.amazon.com/blogs/compute/managing-sessions-of-anonymous-users-in-websocket-api-based-applications/

This post is written by Alexey Paramonov, Solutions Architect, ISV.

This blog post demonstrates how to reconnect anonymous users to WebSocket API without losing their session context. You learn how to link WebSocket API connection IDs to the logical user, what to do when the connection fails, and how to store and recover session information when the user reconnects.

WebSocket APIs are common in modern interactive applications. For example, for watching stock prices, following live chat feeds, collaborating with others in productivity tools, or playing online games. Another example described in “Implementing reactive progress tracking for AWS Step Functions” blog post uses WebSocket APIs to send progress back to the client.

The backend is aware of the client’s connection ID to find the right client to send data to. But if the connection temporarily fails, the client reconnects with a new connection ID. If the backend does not have a mechanism to associate a new connection ID with the same client, the interaction context is lost and the user must start over again. In a live chat feed that could mean skipping to the most recent message with a loss of some previous messages. And in case of AWS Step Functions progress tracking the user would lose progress updates.

Overview

The sample uses Amazon API Gateway WebSocket APIs. It uses AWS Lambda for WebSocket connection management and for mocking a teleprinter to generate a stateful stream of characters for testing purposes. There are two Amazon DynamoDB tables for storing connection IDs and user sessions, as well as an optional MediaWiki API for retrieving an article.

The following diagram outlines the architecture:

Reference architecture

  1. The browser generates a random user ID and stores it locally in the session storage. The client sends the user ID inside the Sec-WebSocket-Protocol header to WebSocket API.
  2. The default WebSocket API route OnConnect invokes OnConnect Lambda function and passes the connection ID and the user ID to it. OnConnect Lambda function determines if the user ID exists in the DynamoDB table and either creates a new item or updates the existing one.
  3. When the connection is open, the client sends the Read request to the Teleprinter Lambda function.
  4. The Teleprinter Lambda function downloads an article about WebSocket APIs from Wikipedia and stores it as a string in memory.
  5. The Teleprinter Lambda function checks if there is a previous state stored in the Sessions table in DynamoDB. If it is a new user, the Teleprinter Lambda function starts sending the article from the beginning character by character back to the client via WebSocket API. If it is a returning user, the Teleprinter Lambda function retrieves the last cursor position (the last successfully sent character) from the DynamoDB table and continues from there.
  6. The Teleprinter Lambda function sends 1 character every 100ms back to the client.
  7. The client receives the article and prints it out character by character as each character arrives.
  8. If the connection breaks, the WebSocket API calls the OnDisconnect Lambda function automatically. The function marks the connection ID for the given user ID as inactive.
  9. If the user does not return within 5 minutes, Amazon EventBridge scheduler invokes the OnDelete Lambda function, which deletes items with more than 5 minutes of inactivity from Connections and Sessions tables.

A teleprinter returns data one character at a time instead of a single response. When the Lambda function fetches an article, it feeds it character by character inside the for-loop with a delay of 100ms on every iteration. This demonstrates how the user can continue reading the article after reconnecting and not starting the feed all over again. The pattern could be useful for traffic limiting by slowing down user interactions with the backend.

Understanding sample code functionality

When the user connects to the WebSocket API, the client generates a user ID and saves it in the browser’s session storage. The user ID is a random string. When the client opens a WebSocket connection, the frontend sends the user ID inside the Sec-WebSocket-Protocol header, which is standard for WebSocket APIs. When using the JavaScript WebSocket library, there is no need to specify the header manually. To initialize a new connection, use:

const newWebsocket = new WebSocket(wsUri, userId);

wsUri is the deployed WebSocket API URL and userId is a random string generated in the browser. The userId goes to the Sec-WebSocket-Protocol header because WebSocket APIs generally offer less flexibility in choosing headers compared to RESTful APIs. Another way to pass the user ID to the backend could be a query string parameter.

The backend receives the connection request with the user ID and connection ID. The WebSocket API generates the connection ID automatically. It’s important to include the Sec-WebSocket-Protocol in the backend response, otherwise the connection closes immediately:

    return {
        'statusCode': 200,
        'headers': {
            'Sec-WebSocket-Protocol': userId
        }
    }

The Lambda function stores this information in the DynamoDB Connections table:

    ddb.put_item(
        TableName=table_name,
        Item={
            'userId': {'S': userId},
            'connectionId': {'S': connection_id},
            'domainName': {'S': domain_name},
            'stage': {'S': stage},
            'active': {'S': True}
        }
    )

The active attribute indicates if the connection is up. In the case of inactivity over a specified time limit, the OnDelete Lambda function deletes the item automatically. The Put operation comes handy here because you don’t need to query the DB if the user already exists. If it is a new user, Put creates a new item. If it is a reconnection, Put updates the connectionId and sets active to True again.

The primary key for the Connections table is userId, which helps locate users faster as they reconnect. The application relies on a global secondary index (GSI) for locating connectionId. This is necessary for marking the connection inactive when WebSocket API calls OnDisconnect function automatically.

Now the application has connection management, you can retrieve session data. The Teleprinter Lambda function receives a connection ID from WebSocket API. You can query the GSI of Connections table and find if the user exists:

    def get_user_id(connection_id):
        response = ddb.query(
            TableName=connections_table_name,
            IndexName='connectionId-index',
            KeyConditionExpression='connectionId = :c',
            ExpressionAttributeValues={
                ':c': {'S': connection_id}
            }
        )

        items = response['Items']

        if len(items) == 1:
            return items[0]['userId']['S']

        return None

Another DynamoDB table called Sessions is used to check if the user has an existing session context. If yes, the Lambda function retrieves the cursor position and resumes teletyping. If it is a brand-new user, the Lambda function starts sending characters from the beginning. The function stores a new cursor position if the connection breaks. This makes it easier to detect stale connections and store the current cursor position in the Sessions table.

    Try:
        api_client.post_to_connection(
            ConnectionId=connection_id,
            Data=bytes(ch, 'utf-8')
        )
    except api_client.exceptions.GoneException as e:
        print(f"Found stale connection, persisting state")
        store_cursor_position(user_id, pos)
        return {
            'statusCode': 410
        }

    def store_cursor_position(user_id, pos):
        ddb.put_item(
            TableName=sessions_table_name,
            Item={
                'userId': {'S': user_id},
                'cursorPosition': {'N': str(pos)}
            }
        )

After this, the Teleprinter Lambda function ends.

Serving authenticated users

The same mechanism also works for authenticated users. The main difference is it takes a given ID from a JWT token or other form of authentication and uses it instead of a randomly generated user ID. The backend relies on unambiguous user identification and may require only minor changes for handling authenticated users.

Deleting inactive users

The OnDisconnect function marks user connections as inactive and adds a timestamp to ‘lastSeen’ attribute. If the user never reconnects, the application should purge inactive items from Connections and Sessions tables. Depending on your operational requirements, there are two options.

Option 1: Using EventBridge Scheduler

The sample application uses EventBridge to schedule OnDelete function execution every 5 minutes. The following code shows how AWS SAM adds the scheduler to the OnDelete function:

  OnDeleteSchedulerFunction:
    Type: AWS::Serverless::Function
    Properties:
      Handler: app.handler
      Runtime: python3.9
      CodeUri: handlers/onDelete/
      MemorySize: 128
      Environment:
        Variables:
          CONNECTIONS_TABLE_NAME: !Ref ConnectionsTable
          SESSIONS_TABLE_NAME: !Ref SessionsTable
      Policies:
      - DynamoDBCrudPolicy:
          TableName: !Ref ConnectionsTable
      - DynamoDBCrudPolicy:
          TableName: !Ref SessionsTable
      Events:
        Schedule:
          Type: ScheduleV2
          Properties:
            ScheduleExpression: rate(5 minute)

The Events section of the function definition is where AWS SAM sets up the scheduled execution. Change values in ScheduleExpression to meet your scheduling requirements.

The OnDelete function relies on the GSI to find inactive user IDs. The following code snippet shows how to query connections with more than 5 minutes of inactivity:

    five_minutes_ago = int((datetime.now() - timedelta(minutes=5)).timestamp())

    stale_connection_items = table_connections.query(
        IndexName='lastSeen-index',
        KeyConditionExpression='active = :hk and lastSeen < :rk',
        ExpressionAttributeValues={
            ':hk': 'False',
            ':rk': five_minutes_ago
        }
    )

After that, the function iterates through the list of user IDs and deletes them from the Connections and Sessions tables:

    # remove inactive connections
    with table_connections.batch_writer() as batch:
        for item in inactive_users:
            batch.delete_item(Key={'userId': item['userId']})

    # remove inactive sessions
    with table_sessions.batch_writer() as batch:
        for item in inactive_users:
            batch.delete_item(Key={'userId': item['userId']})

The sample uses batch_writer() to avoid requests for each user ID.

Option 2: Using DynamoDB TTL

DynamoDB provides a built-in mechanism for expiring items called Time to Live (TTL). This option is easier to implement. With TTL, there’s no need for EventBridge scheduler, OnDelete Lambda function and additional GSI to track time span. To set up TTL, use the ‘lastSeen’ attribute as an object creation time. TTL deletes or archives the item after a specified period of time. When using AWS SAM or AWS CloudFormation templates, add TimeToLiveSpecification to your code.

The TTL typically deletes expired items within 48 hours. If your operational requirements demand faster and more predictable timing, use option 1. For example, if your application aggregates data while the user is offline, use option 1. But if your application stores a static session data, like cursor position used in this sample, option 2 can be an easier alternative.

Deploying the sample

Prerequisites

Ensure you can manage AWS resources from your terminal.

  • AWS CLI and AWS SAM CLI installed.
  • You have an AWS account. If not, visit this page.
  • Your user has enough permissions to manage AWS resources.
  • Git is installed.
  • NPM is installed (only for local frontend deployment).

You can find the source code and README here.

The repository contains both the frontend and the backend code. To deploy the sample, follow this procedure:

  1. Open a terminal and clone the repository:
    git clone https://github.com/aws-samples/websocket-sessions-management.git
  2. Navigate to the root of the repository.
  3. Build and deploy the AWS SAM template:
    sam build && sam deploy --guided
  4. Note the value of WebSocketURL in the output. You need it later.

With the backend deployed, test it using the hosted frontend.

Testing the application

Testing the application

You can watch an animated demo here.

Notice that the app has generated a random user ID on startup. The app shows the user ID above in the header.

  1. Paste the WebSocket URL into the text field. You can find the URL in the console output after you have successfully deployed your AWS SAM template. Alternatively, you can navigate to AWS Management Console (make sure you are in the right Region), select the API you have recently deployed, go to “Stages”, select the deployed stage and copy the “WebSocket URL” value.
  2. Choose Connect. The app opens a WebSocket connection.
  3. Choose Tele-read to start receiving the Wikipedia article character by character. New characters appear in the second half of the screen as they arrive.
  4. Choose Disconnect to close WebSocket connection. Reconnect again and choose Tele-read. Your session resumes from where you stopped.
  5. Choose Reset Identity. The app closes the WebSocket connection and changes the user ID. Choose Connect and Tele-read again and your character feed starts from the beginning.

Cleaning up

To clean up the resources, in the root directory of the repository run:

sam delete

This removes all resources provisioned by the template.yml file.

Conclusion

In this post, you learn how to keep track of user sessions when using WebSockets API and not lose the session context when the user reconnects again. Apply learnings from this example to improve your user experience when using WebSocket APIs for web-frontend and mobile applications, where internet connections may be unstable.

For more serverless learning resources, visit  Serverless Land.

Building an event-driven solution for AvalonBay property leasing and search

Post Syndicated from Kausik Dey original https://aws.amazon.com/blogs/architecture/building-an-event-driven-solution-for-avalonbay-property-leasing-and-search/

In this blog post, we show you how to build an event-driven and serverless solution for property leasing and search that is scalable and resilient. This solution was created for AvalonBay Communities, Inc.—a leading residential Real Estate Investment Trusts (REITs). It enables:

  • More than 150,000 multi-parameter searches per day
  • The processing of more than 3,500 lease applications and 85,000 individual rent payments per month

Introduction

AvalonBay is an equity REIT. The company has a long track record of developing, redeveloping, acquiring, and managing apartment homes in top U.S. markets. AvalonBay builds long-term value for customers using innovative technology solutions.

The company understands that data-driven insights contribute to targeted business growth. But AvalonBay found that managing the complex interdependencies between multiple data sets—from real estate and property management systems to financial and payment systems—required a new solution.

The challenge

AvalonBay owned or held a direct or indirect ownership interest in 293 apartment communities containing 88,405 apartment homes in 12 states and Washington, D.C., as of September 30, 2022.

Of these, 18 communities were under development and one was under redevelopment. This presented a unique challenge to both internal and external users looking to search and lease apartment units based on multi-parameter selection criteria in geographically dispersed regions. For example, finding units in buildings with specific amenities, lease terms, furnishings and availability dates.

Overview of solution

AvalonBay’s fully managed leasing solution for applicants and residents is hosted by Amazon Web Services (AWS). The solution is secure, autoscaling, and multi-region, ensuring resiliency and performance with efficient resource usage.

In this event-driven solution, AvalonBay’s leasing service is hosted in multiple AWS Regions to provide low latency response to users across various geolocations. This blog post focuses on showing use case implementation in only one region—Region East— as shown in Figure 1.

AvalonBay lease processing platform

Figure 1. AvalonBay lease processing platform

Several AWS services come together in this solution to meet key company objectives. Let’s explore each one and its purpose within the architecture.

    1. Amazon Route 53: For AvalonBay’s Lease Processing solution, any non-transient service failure is unacceptable. In addition to providing a high degree of resiliency through a Multi-AZ architecture, Lease Processing also provides regional-level high availability through its multi-Region active-active architecture. Route 53 with latency-based routing allows dynamic rerouting of requests within seconds to alternate Regions.
    2. Amazon API Gateway: Route 53 latency-based routing is configured across multiple AWS Regions as Route 53 to route traffic to an API Gateway endpoint. API Gateway authorizers were added to control access to APIs using an Amazon Cognito user pool.
    3. AWS Lambda with provisioned concurrency: The Lambda services are set up for automatic scaling, secured through a private subnet, and span across Availability Zones. This provides horizontal scaling capability, self-healing capacity, and resiliency across Availability Zones. Provisioned concurrency minimizes the estimate of cold starts by generating execution environments. It also greatly reduces time spent on APIs invocations.
    4. Amazon Aurora V2 for Amazon Relational Database Service (Amazon RDS) PostgreSQL-Compatible Edition: Aurora Serverless V2 is an on-demand, autoscaling configuration for Aurora. Serverless Aurora V2 PostgreSQL-Compatible is used for the Lease Processing solution. The global database was configured with two Regions; us-east-1 as the primary cluster and us-west-2 as the secondary cluster. Automated Aurora global database endpoint management for planned and unplanned failover is configured through a Route 53 private hosted zone, Amazon EventBridge, and Lambda.
    5. Amazon RDS Proxy for Aurora: Amazon RDS Proxy allows the leasing application to pool and share database connections to improve its ability to scale. It also makes the leasing solution more resilient to database failures by automatically connecting to a standby database instance while preserving application connections.
    6. Amazon EventBridge: EventBridge supports the solution through two primary purposes:
      1. Oversees lease flow events – During the lease application process, the solution generates various events which are consumed by AvalonBay and external applications such as property management, finance portals, administration, and more. Leasing events are sent to EventBridge and various event rules are configured for multiple destinations including Lambda, Amazon Simple Notification Service (Amazon SNS), and external API endpoints.
      2. Handles global Aurora V2 failover – Aurora generates events when certain actions are taken or events occur, including any type of global database activity.
        • When a managed planned failover is initiated—either via the AWS Command Line Interface (AWS CLI), API, or console—the global database failover process starts and generates an event.
        • When an Aurora cluster is removed from a global cluster through the AWS CLI, API, or console, the Aurora cluster is promoted as a single primary cluster. Once this process is completed, it generates an event.

An EventBridge rule is created to match an event pattern any time a global database managed planned failover completes successfully in a Region. When a failover is completed, the completion event is detected, and this rule is triggered. The event rule is configured to invoke a Lambda function that is triggered on global database failover and updates the Amazon CloudFront CNAME record to the correct value.

Scalable search solution

Leasing professionals need to easily scan a huge amount of property information using AvalonBay’s Search Solution to obtain required information.

Using the Amazon OpenSearch Service, agents can generate property profiles and other asset data to identify matching units and quickly respond to end customers. OpenSearch is a fully open-source search and analytics engine that securely unlocks real-time search, monitoring, and analysis of business and operational data. It is employed for use cases such as application monitoring, log analytics, observability, and website search.

The AvalonBay Search Service solution architecture featuring OpenSearch is shown in Figure 2.

AvalonBay Search Service solution architecture

Figure 2: AvalonBay Search Service solution architecture

AvalonBay search requires search criteria including keyword and Universal Resource Identifier (URI) search, SQL-based search, and custom package search, all of which are detailed in the Amazon OpenSearch Service Developer Guide.

OpenSearch automatically detects and replaces failed OpenSearch Service nodes, reducing the overhead associated with self-managed infrastructures.

Let’s explore this architecture further by step.

  1. Amazon Kinesis event stream – The AvalonBay community requires near real-time updates to search attributes such as amenities, features, promotion, and pricing. Events created through various producers are streamed through Kinesis and inserted or updated through OpenSearch.
  2. Amazon OpenSearch – OpenSearch is used for end-to-end community search—a managed service making it easy to deploy, operate, and scale OpenSearch clusters in the AWS Cloud. As community search data is read-only, UltraWarm and cold storage are also used based on usage frequency.
  3. Amazon Simple Storage Service (S3): Various community documents, policies, and image or video files are key search elements. They must be maintained securely and reliably for years due to contractual obligations. Amazon S3 simplifies this task with high durabilitylifecycle rules, and varied controls for retention.

Conclusion

This post showed how AvalonBay has built and deployed custom leasing and search solutions on AWS serverless platforms without compromising resiliency, performance, and capacity requirements. This is a 24/7, fully managed solution with no additional equipment on-premises.

Choosing AWS for leasing and search solutions gives AvalonBay the ability to dynamically scale and meet future growth demands while introducing cost advantages. In addition, the global availability of AWS services makes it possible to deploy services across geographic locations to meet performance requirements.

Scaling an ASG using target tracking with a dynamic SQS target

Post Syndicated from Sheila Busser original https://aws.amazon.com/blogs/compute/scaling-an-asg-using-target-tracking-with-a-dynamic-sqs-target/

This blog post is written by Wassim Benhallam, Sr Cloud Application Architect AWS WWCO ProServe, and Rajesh Kesaraju, Sr. Specialist Solution Architect, EC2 Flexible Compute.

Scaling an Amazon EC2 Auto Scaling group based on Amazon Simple Queue Service (Amazon SQS) is a commonly used design pattern in decoupled applications. For example, an EC2 Auto Scaling Group can be used as a worker tier to offload the processing of audio files, images, or other files sent to the queue from an upstream tier (e.g., web tier). For latency-sensitive applications, AWS guidance describes a common pattern that allows an Auto Scaling group to scale in response to the backlog of an Amazon SQS queue while accounting for the average message processing duration (MPD) and the application’s desired latency.

This post builds on that guidance to focus on latency-sensitive applications where the MPD varies over time. Specifically, we demonstrate how to dynamically update the target value of the Auto Scaling group’s target tracking policy based on observed changes in the MPD. We also cover the utilization of Amazon EC2 Spot instances, mixed instance policies, and attribute-based instance selection in the Auto Scaling Groups as well as best practice implementation to achieve greater cost savings.

The challenge

The key challenge that this post addresses is applications that fail to honor their acceptable/target latency in situations where the MPD varies over time. Latency refers here to the time required for any queue message to be consumed and fully processed.

Consider the example of a customer using a worker tier to process image files (e.g., resizing, rescaling, or transformation) uploaded by users within a target latency of 100 seconds. The worker tier consists of an Auto Scaling group configured with a target tracking policy. To achieve the target latency mentioned previously, the customer assumes that each image can be processed in one second, and configures the target value of the scaling policy so that the average image backlog per instance is maintained at approximately 100 images.

In the first week, the customer submits 1000 images to the Amazon SQS queue for processing, each of which takes one second of processing time. Therefore, the Auto Scaling group scales to 10 instances, each of which processes 100 images in 100s, thereby honoring the target latency of 100s.

In the second week, the customer submits 1000 slightly larger images for processing. Since an image’s processing duration scales with its size, each image takes two seconds to process. As in the first week, the Auto Scaling group scales to 10 instances, but this time each instance processes 100 images in 200s, which is twice as long as was needed in the first round. As a result, the application fails to process the latter images within its acceptable latency.

Therefore, the challenge is common to any latency-sensitive application where the MPD is subject to change. Applications where the processing duration scales with input data size are particularly vulnerable to this problem. This includes image processing, document processing, computational jobs, and others.

Solution overview

Before we dive into the solution, let’s briefly review the target tracking policy’s scaling metric and its corresponding target value. A target tracking scaling policy works by adjusting the capacity to keep a scaling metric at, or close to, the specified target value. When scaling in response to an Amazon SQS backlog, it’s good practice to use a scaling metric known as the Backlog Per Instance (BPI) and a target value based on the acceptable BPI. These are computed as follows:

BPI equation, Saling metric and target value.

Given the acceptable BPI equation, a longer MPD requires us to use a smaller target value if we are to process these messages in the same acceptable latency, and vice versa. Therefore, the solution we propose here works by monitoring the average MPD over time and dynamically adjusting the target value of the Auto Scaling group’s target tracking policy (acceptable BPI) based on the observed changes in the MPD. This allows the scaling policy to adapt to variations in the average MPD over time, and thus enables the application to honor its acceptable latency.

Solution architecture

To demonstrate how the approach above can be implemented in practice, we put together an example architecture highlighting the services involved (see the following figure). We also provide an automated deployment solution for this architecture using an AWS Serverless Application Model (AWS SAM) template and some Python code (repository link). The repository also includes a README file with detailed instructions that you can follow to deploy the solution. The AWS SAM template deploys several resources, including an autoscaling group, launch template, target tracking scaling policy, an Amazon SQS queue, and a few AWS Lambda functions that serve various functions described as follows.

The Amazon SQS queue is used to accumulate messages intended for processing, while the Auto Scaling group instances are responsible for polling the queue and processing any messages received. To do this, a launch template defines a bootstrap script that allows the group’s instances to download and execute a Python code when first launched. The Python code consumes messages from the Amazon SQS queue and simulates their processing by sleeping for the MPD duration specified in the message body. After processing each message, the instance publishes the MPD as an Amazon CloudWatch metric (see the following figure).

Figure 1: Architecture diagram showing the components deployed by the AWS SAM template. These include an SQS queue, an Auto Scaling group responsible for polling and processing queue messages, a Lambda function that regularly updates the BPI CloudWatch metric, and a “Target Setter” Lambda function that regularly updates the Auto Scaling group’s target tracking scaling policy.

Figure 1: Architecture diagram showing the components deployed by the AWS SAM template.

To enable scaling, the Auto Scaling group is configured with a target tracking scaling policy that specifies BPI as the scaling metric and with an initial target value provided by the user.

The BPI CloudWatch metric is calculated and published by the “Metric-Publisher” Lambda function which is invoked every one minute using an Amazon EventBridge rate expression. To calculate BPI, the Lambda function simply takes the ratio of the number of messages visible in the Amazon SQS queue by the total number of in-service instances in the Auto Scaling group, as shown in equation (2) above.

On the other hand, the scaling policy’s target value is updated by the “Target-Setter” Lambda function, which is invoked every 30 minutes using another EventBridge rate expression. To calculate the new target value, the Lambda function simply takes the ratio of the user-defined acceptable latency value by the current average MPD queried from the corresponding CloudWatch metric, as shown in the previous equation (1).

Finally, to help you quickly test this solution, a Lambda function “Testing Lambda” is also provided and can be used to send messages to the Amazon SQS queue with a processing duration of your choice. This is specified within each message’s body. You can invoke this Lambda function with different MPDs (by modifying the corresponding environment variable) to verify how the Auto Scaling group scales in response. A CloudWatch dashboard is also deployed to enable you to track key scaling metrics through time. These include the number of messages visible in the queue, the number of in-service instances in the Auto Scaling group, the MPD, and BPI vs acceptable BPI.

Solution testing

To demonstrate the solution in action and its impact on application latency, we conducted two tests that you can reproduce by following the instructions described in the “Testing” section of the repository’s README file (repository link). In both tests, we assume a hypothetical application with a target latency of 300s. We also modified the invocation frequency of the “Target Setter” Lambda function to one minute to quickly assess the impact of target value changes. In both tests, we submit 50 messages to the Amazon SQS queue through the provided helper lambda. An MPD of 25s and 50s was used for the first and second test, respectively. The provided CloudWatch dashboard shows that the ASG scales to a total of four instances in the first test, and eight instances in the second (see the following figure). See README file for a detailed description of how various metrics evolve over time.

Comparison of Tests 1 and 2

Since Test 2 messages take twice as long to process, the Auto Scaling group launched twice as many instances to attempt to process all of the messages in the same amount of time as Test 1 (latency). The following figure shows that the total time to process all 50 messages in Test 1 was 9 mins vs 10 mins in Test 2. In contrast, if we were to use a static/fixed acceptable BPI of 12, then a total of four instances would have been operational in Test 2, thereby requiring double the time of Test 1 (~20 minutes) to process all of the messages. This demonstrates the value of using a dynamic scaling target when processing messages from Amazon SQS queues, especially in circumstances where the MPD is prone to vary with time.

Figure 2: CloudWatch dashboard showing Auto Scaling group scaling test results (Test 1 and 2). Although Test 2 messages require double the MPD of Test 1 messages, the Auto Scaling group processed Test 2 messages in the same amount of time as Test 1 by launching twice as many instances.

Figure 2: CloudWatch dashboard showing Auto Scaling group scaling test results (Test 1 and 2).

Recommended best practices for Auto Scaling groups

This section highlights a few key best practices that we recommend adopting when deploying and working with Auto Scaling groups.

Reducing cost using EC2 Spot instances

Amazon SQS helps build loosely coupled application architectures, while providing reliable asynchronous communication between the various layers/components of an application. If a worker node fails to process a message within the Amazon SQS message visibility time-out, then the message is returned to the queue and another worker node can pick up and process that message. This makes Amazon SQS-backed applications fault-tolerant by design and thus a great fit for EC2 Spot instances. EC2 spot instances are spare compute capacity in the AWS cloud that is available to you at steep discounts as compared to On-Demand prices.

Maximizing capacity using attribute-based instance selection

With the recently released attribute-based instance selection feature, you can define infrastructure requirements based on application needs such as vCPU, RAM, and processor family (e.g., x86, ARM). This removes the need to define specific instances in your Auto Scaling group configuration, and it eliminates the burden of identifying the correct instance families and sizes. In addition, newly released instance types will be automatically considered if they fit your requirements. Attribute-based instance selection lets you tap into hundreds of different EC2 instance pools, which increases the chance of getting EC2 (Spot/On-demand) instances. When using attribute-based instance selection with the capacity optimized allocation strategy, Amazon EC2 allocates instances from deeper Spot capacity pools, thereby further reducing the chance of Spot interruption.

The following sample configuration creates an Auto Scaling group with attribute-based instance selection:

AutoScalingGroupName: 'my-asg' # [REQUIRED] 
MixedInstancesPolicy:
  LaunchTemplate:
    LaunchTemplateSpecification:
      LaunchTemplateId: 'lt-0537239d9aef10a77'
    Overrides:
    - InstanceRequirements:
        VCpuCount: # [REQUIRED] 
          Min: 2
          Max: 4
        MemoryMiB: # [REQUIRED] 
          Min: 2048
  InstancesDistribution:
    SpotAllocationStrategy: 'capacity-optimized'
MinSize: 0 # [REQUIRED] 
MaxSize: 100 # [REQUIRED] 
DesiredCapacity: 4
VPCZoneIdentifier: 'subnet-e76a128a,subnet-e66a128b,subnet-e16a128c'

Conclusion

As can be seen from the test results, this approach demonstrates how an Auto Scaling group can honor a user-provided acceptable latency constraint while accomodating variations in the MPD over time. This is possible because the average MPD is monitored and regularly updated as a CloudWatch metric. In turn, this is continously used to update the target value of the group’s target tracking policy. Moreover, we have covered additional Auto Scaling group best practices suitable for this use case, including the use of Spot instances to reduce costs and attribute-based instance selection to simplify the selection of relevant instance types.

For more information on scaling options for Auto Scaling groups, visit the Amazon EC2 Auto Scaling documentation page and the SQS-based scaling guide.

Implementing architectural patterns with Amazon EventBridge Pipes

Post Syndicated from David Boyne original https://aws.amazon.com/blogs/compute/implementing-architectural-patterns-with-amazon-eventbridge-pipes/

This post is written by Dominik Richter (Solutions Architect)

Architectural patterns help you solve recurring challenges in software design. They are blueprints that have been used and tested many times. When you design distributed applications, enterprise integration patterns (EIP) help you integrate distributed components. For example, they describe how to integrate third-party services into your existing applications. But patterns are technology agnostic. They do not provide any guidance on how to implement them.

This post shows you how to use Amazon EventBridge Pipes to implement four common enterprise integration patterns (EIP) on AWS. This helps you to simplify your architectures. Pipes is a feature of Amazon EventBridge to connect your AWS resources. Using Pipes can reduce the complexity of your integrations. It can also reduce the amount of code you have to write and maintain.

Content filter pattern

The content filter pattern removes unwanted content from a message before forwarding it to a downstream system. Use cases for this pattern include reducing storage costs by removing unnecessary data or removing personally identifiable information (PII) for compliance purposes.

In the following example, the goal is to retain only non-PII data from “ORDER”-events. To achieve this, you must remove all events that aren’t “ORDER” events. In addition, you must remove any field in the “ORDER” events that contain PII.

While you can use this pattern with various sources and targets, the following architecture shows this pattern with Amazon Kinesis. EventBridge Pipes filtering discards unwanted events. EventBridge Pipes input transformers remove PII data from events that are forwarded to the second stream with longer retention.

Instead of using Pipes, you could connect the streams using an AWS Lambda function. This requires you to write and maintain code to read from and write to Kinesis. However, Pipes may be more cost effective than using a Lambda function.

Some situations require an enrichment function. For example, if your goal is to mask an attribute without removing it entirely. For example, you could replace the attribute “birthday” with an “age_group”-attribute.

In this case, if you use Pipes for integration, the Lambda function contains only your business logic. On the other hand, if you use Lambda for both integration and business logic, you do not pay for Pipes. At the same time, you add complexity to your Lambda function, which now contains integration code. This can increase its execution time and cost. Therefore, your priorities determine the best option and you should compare both approaches to make a decision.

To implement Pipes using the AWS Cloud Development Kit (AWS CDK), use the following source code. The full source code for all of the patterns that are described in this blog post can be found in the AWS samples GitHub repo.

const filterPipe = new pipes.CfnPipe(this, 'FilterPipe', {
  roleArn: pipeRole.roleArn,
  source: sourceStream.streamArn,
  target: targetStream.streamArn,
  sourceParameters: { filterCriteria: { filters: [{ pattern: '{"data" : {"event_type" : ["ORDER"] }}' }] }, kinesisStreamParameters: { startingPosition: 'LATEST' } },
  targetParameters: { inputTemplate: '{"event_type": <$.data.event_type>, "currency": <$.data.currency>, "sum": <$.data.sum>}', kinesisStreamParameters: { partitionKey: 'event_type' } },
});

To allow access to source and target, you must assign the correct permissions:

const pipeRole = new iam.Role(this, 'FilterPipeRole', { assumedBy: new iam.ServicePrincipal('pipes.amazonaws.com') });

sourceStream.grantRead(pipeRole);
targetStream.grantWrite(pipeRole);

Message translator pattern

In an event-driven architecture, event producers and consumers are independent of each other. Therefore, they may exchange events of different formats. To enable communication, the events must be translated. This is known as the message translator pattern. For example, an event may contain an address, but the consumer expects coordinates.

If a computation is required to translate messages, use the enrichment step. The following architecture diagram shows how to accomplish this enrichment via API destinations. In the example, you can call an existing geocoding service to resolve addresses to coordinates.

There may be cases where the translation is purely syntactical. For example, a field may have a different name or structure.

You can achieve these translations without enrichment by using input transformers.

Here is the source code for the pipe, including the role with the correct permissions:

const pipeRole = new iam.Role(this, 'MessageTranslatorRole', { assumedBy: new iam.ServicePrincipal('pipes.amazonaws.com'), inlinePolicies: { invokeApiDestinationPolicy } });

sourceQueue.grantConsumeMessages(pipeRole);
targetStepFunctionsWorkflow.grantStartExecution(pipeRole);

const messageTranslatorPipe = new pipes.CfnPipe(this, 'MessageTranslatorPipe', {
  roleArn: pipeRole.roleArn,
  source: sourceQueue.queueArn,
  target: targetStepFunctionsWorkflow.stateMachineArn,
  enrichment: enrichmentDestination.apiDestinationArn,
  sourceParameters: { sqsQueueParameters: { batchSize: 1 } },
});

Normalizer pattern

The normalizer pattern is similar to the message translator but there are different source components with different formats for events. The normalizer pattern routes each event type through its specific message translator so that downstream systems process messages with a consistent structure.

The example shows a system where different source systems store the name property differently. To process the messages differently based on their source, use an AWS Step Functions workflow. You can separate by event type and then have individual paths perform the unifying process. This diagram visualizes that you can call a Lambda function if needed. However, in basic cases like the preceding “name” example, you can modify the events using Amazon States Language (ASL).

In the example, you unify the events using Step Functions before putting them on your event bus. As is often the case with architectural choices, there are alternatives. Another approach is to introduce separate queues for each source system, connected by its own pipe containing only its unification actions.

This is the source code for the normalizer pattern using a Step Functions workflow as enrichment:

const pipeRole = new iam.Role(this, 'NormalizerRole', { assumedBy: new iam.ServicePrincipal('pipes.amazonaws.com') });

sourceQueue.grantConsumeMessages(pipeRole);
enrichmentWorkflow.grantStartSyncExecution(pipeRole);
normalizerTargetBus.grantPutEventsTo(pipeRole);

const normalizerPipe = new pipes.CfnPipe(this, 'NormalizerPipe', {
  roleArn: pipeRole.roleArn,
  source: sourceQueue.queueArn,
  target: normalizerTargetBus.eventBusArn,
  enrichment: enrichmentWorkflow.stateMachineArn,
  sourceParameters: { sqsQueueParameters: { batchSize: 1 } },
});

Claim check pattern

To reduce the size of the events in your event-driven application, you can temporarily remove attributes. This approach is known as the claim check pattern. You split a message into a reference (“claim check”) and the associated payload. Then, you store the payload in external storage and add only the claim check to events. When you process events, you retrieve relevant parts of the payload using the claim check. For example, you can retrieve a user’s name and birthday based on their userID.

The claim check pattern has two parts. First, when an event is received, you split it and store the payload elsewhere. Second, when the event is processed, you retrieve the relevant information. You can implement both aspects with a pipe.

In the first pipe, you use the enrichment to split the event, in the second to retrieve the payload. Below are several enrichment options, such as using an external API via API Destinations, or using Amazon DynamoDB via Lambda. Other enrichment options are Amazon API Gateway and Step Functions.

Using a pipe to split and retrieve messages has three advantages. First, you keep events concise as they move through the system. Second, you ensure that the event contains all relevant information when it is processed. Third, you encapsulate the complexity of splitting and retrieving within the pipe.

The following code implements a pipe for the claim check pattern using the CDK:

const pipeRole = new iam.Role(this, 'ClaimCheckRole', { assumedBy: new iam.ServicePrincipal('pipes.amazonaws.com') });

claimCheckLambda.grantInvoke(pipeRole);
sourceQueue.grantConsumeMessages(pipeRole);
targetWorkflow.grantStartExecution(pipeRole);

const claimCheckPipe = new pipes.CfnPipe(this, 'ClaimCheckPipe', {
  roleArn: pipeRole.roleArn,
  source: sourceQueue.queueArn,
  target: targetWorkflow.stateMachineArn,
  enrichment: claimCheckLambda.functionArn,
  sourceParameters: { sqsQueueParameters: { batchSize: 1 } },
  targetParameters: { stepFunctionStateMachineParameters: { invocationType: 'FIRE_AND_FORGET' } },
});

Conclusion

This blog post shows how you can implement four enterprise integration patterns with Amazon EventBridge Pipes. In many cases, this reduces the amount of code you have to write and maintain. It can also simplify your architectures and, in some scenarios, reduce costs.

You can find the source code for all the patterns on the AWS samples GitHub repo.

For more serverless learning resources, visit Serverless Land. To find more patterns, go directly to the Serverless Patterns Collection.

Building ad-hoc consumers for event-driven architectures

Post Syndicated from Benjamin Smith original https://aws.amazon.com/blogs/compute/building-ad-hoc-consumers-for-event-driven-architectures/

This post is written by Corneliu Croitoru (Media Streaming and Edge Architect) and Benjamin Smith (Principal Developer Advocate, Serverless)

In January 2022, the Serverless Developer Advocate team launched Serverlesspresso Extensions, a program that lets you contribute to Serverlesspresso. This is a multi-tenant event-driven application for a pop-up coffee bar that allows you to order from your phone. In 2022, Serverlesspresso processed over 20,000 orders at technology events around the world. The goal of Serverlesspresso extensions is to showcase the power and simplicity of evolving an event-driven application.

Event-driven architecture is a design pattern that allows developers to create and evolve applications by responding to events generated by various parts of the system. For modern applications, the need for flexible and scalable approaches is critical, and event-driven architecture can provide a powerful solution.

This blog post shows how to build and deploy an extension to an event-driven application. It describes the benefits and challenges of evolving event-driven applications. It also walks through a real-life example that was created in under 24 hours.

Decoupled integrations

A key benefit of event-driven architecture is its ability to decouple different parts of the system, making it easier to manage changes and evolve the application. In traditional, monolithic applications, changes to one part of the system can affect the entire application.

With event-driven architecture, you can change individual parts of the system without affecting the rest of the application. Event-driven architecture also makes it easier to integrate new functionality into an existing application by creating new event handlers to respond to existing events. This way, you can add new functionality without affecting the existing system, making it easier to test and deploy.

The following diagrams illustrate how to add and remove consumers and producers without affecting the core application.

Adding and removing event-driven extensions

Extension 2 is consuming events from the event bus and emitting events back onto the bus. It can be added to the core application without creating any dependencies. When extension 2 is removed, the core application remains unchanged.

In monolithic applications, additional features can create dependencies on the core application. Removing those features keeps those dependencies in place, making it more complex to remove them.

Adding and removing monolithic extensions

Collaboration

In a traditional monolithic application, it can be difficult to collaborate with multiple developers on a single code base. It can lead to conflicts, bugs, and other issues that must be resolved. Integrating new features and components into these applications can be challenging, especially when multiple developers are using different technologies. Deploying updates can also be complex when multiple developers are involved and different parts of the application must be updated simultaneously.

With event-based applications, these challenges are often less significant. A well-designed consumer contains well-defined permissions boundaries. Its resources should not need permission to interact with resources outside the extension definition. This means you can deploy and delete them independently of other extensions and of the core application. This makes it easier to collaborate with multiple developers across different languages, runtimes, and deployment frameworks.

Near real-time feedback

Another characteristic of event-driven architecture is the ability to provide real-time feedback to users. This is because consumers can process events as they occur, making it possible to provide immediate feedback. This can be useful in applications that handle high volumes of data or interact with multiple users, as they can provide real-time updates and ensure that the application remains responsive.

An alternative approach for near real-time feedback is to use batching. This involves grouping multiple events or data points into a batch and processing them. Choosing between batching and processing data in real-time with events depends on the amount of data being processed, the latency requirements, and the complexity of the processing logic. Batching can be more efficient for large volumes of data as it reduces the overhead of processing each event individually, while processing data with events can be better suited for real-time applications that require low latency.

The newest Serverlesspresso extension uses an event-driven approach to gain real-time insight into the application.

The average wait time extension

A new extension was created by Corneliu Croitoru that calculates the average wait for each drink at the Serverlesspresso coffee bar. This extension uses AWS Step Functions, DynamoDB, and AWS Lambda. The app displays the results in near real-time, allowing customers to see how long they may need to wait for their order. The extension uses the AWS Cloud Development Kit (CDK) for deployment.

The extension uses the existing Amazon EventBridge event bus to start a Step Functions workflow. The workflow is triggered by the order submission and order completion events and calculates the average wait time for each type of drink (for example, Caffe Latte). This information is then sent back to the Serverlesspresso event bus.

The following diagram illustrates the Step Functions workflow:

When a new order submission event is emitted, the Step Functions workflow persists the event timestamp to a DynamoDB table, a key/value data store. It uses the unique order ID as the key. When an order completion event is emitted, the workflow persists the completion timestamp to DynamoDB. The workflow then invokes a Lambda function to calculate the average duration of that specific drink by using the last 10 orders stored in the DynamoDB table.

This is the DynamoDB table structure:

The workflow sends an event to the Serverlesspresso event bus with the calculated duration and drink type. A rule on the event bus routes this event to an IoT topic, which publishes it to the front-end application via an existing open WebSocket connection. The result appears on the front end:

Alternative approaches

There are a number of alternative approaches that you could use to build a real-time “average wait” extension without using events.

One such approach might be to use DynamoDB as a cache for the event-driven data. This way it would be possible to query the database periodically to check for updates. This approach can be implemented by adding a timestamp field to the database records and querying for records that have been updated since the last time you checked.

Alternatively, you could use DynamoDB streams to capture changes as they occur instead of subscribing to new events directly. However, these approaches may face several challenges. The extension would require permission to read data from the DynamoDB table or stream. Since the DynamoDB table resource is defined in the application’s core template, this presents challenges of ownership, permissions boundaries and dependencies. It adds additional complexity to the application as the extension would not be decoupled from the core.

The challenges

The biggest challenge in building this extension is the required shift in developer mindset. Despite understanding the principles of decoupled event-driven architecture, it was not until building an event-driven architecture extension that the concept became clear.

For example, you may think it necessary to deploy the existing application to submit orders, emit events onto the application event bus, and interact with various core resources. The development team had discussions about the degree to which the extension should interact with existing application components. This was not an event-driven mindset.

Each new extension must be based entirely on events. This means it can only interact with the core application through the shared event bus by consuming and emitting events. It also means that you could write the extension in any runtime, with any infrastructure as code (IaC) framework, and that it should be possible to deploy and destroy the extension stack with no effect on the core application.

Once you understand this, the next challenge is discoverability. Finding the right events to consume may prove harder than expected. This is why documenting events as you build your application is important. The event schema, producer and consumer should be documented, and evolve with each version of the event. The Serverlesspresso Events Catalog helps to overcome this in this example.

Finally, the event player can emit realistic Serverlesspresso events onto the event bus. This replaces the need to deploy the core application stack.

Conclusion

The Serverlesspresso Extensions program shows the simplicity of developing event-driven applications. Building event-driven architectures allows for decoupled integrations, making it easier to manage changes and develop the application. It also simplifies collaboration among multiple teams as consumers of events can come and go independently without affecting the procedure or core application.

Using these principles, the average wait time extension was built and deployed within 24 hours, using a different IaC framework to the core application.

Use the Serverlesspresso extensions GitHub repository to read how to build more Serverlesspresso extensions.

For more serverless learning resources, visit Serverless Land.

Quick Restoration through Replacing the Root Volumes of Amazon EC2 instances

Post Syndicated from Sheila Busser original https://aws.amazon.com/blogs/compute/quick-restoration-through-replacing-the-root-volumes-of-amazon-ec2/

This blog post is written by Katja-Maja Krödel, IoT Specialist Solutions Architect, and Benjamin Meyer, Senior Solutions Architect, Game Tech.

Customers use Amazon Elastic Compute Cloud (Amazon EC2) instances to develop, deploy, and test applications. To use those instances most effectively, customers have expressed the need to set back their instance to a previous state within minutes or even seconds. They want to find a quick and automated way to manage setting back their instances at scale.

The feature of replacing Root Volumes of Amazon EC2 instances enables customers to replace the root volumes of running EC2 instances to a specific snapshot or its launch state. Without stopping the instance, this allows customers to fix issues while retaining the instance store data, networking, and AWS Identity and Access Management (IAM) configuration. Customers can resume their operations with their instance store data intact. This works for all virtualized EC2 instances and bare metal EC2 Mac instances today.

In this post, we show you how to design your architecture for automated Root Volume Replacement using this Amazon EC2 feature. We start with the automated snapshot creation, continue with automatically replacing the root volume, and finish with how to keep your environment clean after your replacement job succeeds.

What is Root Volume Replacement?

Amazon EC2 enables customers to replace the root Amazon Elastic Block Store (Amazon EBS) volume for an instance without stopping the instance to which it’s attached. An Amazon EBS root volume is replaced to the launch state, or any snapshot taken from the EBS volume itself. This allows issues to be fixed, such as root volume corruption or guest OS networking errors. Replacing the root volume of an instance includes the following steps:

  • A new EBS volume is created from a previously taken snapshot or the launch state
  • Reboot of the instance
  • While rebooting, the current root volume is detached and the new root volume is attached

The previous EBS root volume isn’t deleted and can be attached to an instance for later investigation of the volume. If replacing to a different state of the EBS than the launch state, then a snapshot of the current root volume is used.

An example use case is a continuous integration/continuous deployment (CI/CD) System that builds on EC2 instances to build artifacts. Within this system, you could alter the installed tools on the host and may cause failing builds on the same machine. To prevent any unclean builds, the introduced architecture is used to clean up the machine by replacing the root volume to a previously known good state. This is especially interesting for EC2 Mac Instances, as their Dedicated Host won’t undergo the scrubbing process, and the instance is more quickly restored than launching a fresh EC2 Mac instance on the same host.

Overview

The feature of replacing Root Volumes was introduced in April 2021 and has just been <TBD> extended to work for Bare Metal EC2 Mac Instances. This means that EC2 Mac Instances are included. If you want to reset an EC2 instance to a previously known good state, then you can create Snapshots of your EBS volumes. To reset the root volume to its launch state, no snapshot is needed. For non-root volumes, you can use these Snapshots to create new EBS volumes, and then attach those to your instance as well as detach them. To automate the process of replacing your root volume not only once, but also in a repeatable manner, we’re introducing you to an architecture that can fully-automate this process.

In the case that you use a snapshot to create a new root volume, you must take a new snapshot of that volume to be able to get back to that state later on. You can’t use a snapshot of a different volume to restore to, which is the reason that the architecture includes the automatic snapshot creation of a fresh root volume.

The architecture is built in three steps:

  1. Automation of Snapshot Creation for new EBS volumes
  2. Automation of replacing your Root Volume
  3. Preparation of the environment for the next Root Volume Replacement

The following diagram illustrates the architecture of this solution.

 Architecture of the automated creation of Root Volumes for Amazon EC2 Instances

In the next sections, we go through these concepts to design the automatic Root Volume Replacement Task.

Automation of Snapshot Creation for new EBS volumes

Architecture of the automated creation of Snapshots of new EBS Volumes.

The figure above illustrates the architecture for automatically creating a snapshot of an existing EBS volume. In this architecture, we focus on the automation of creating a snapshot whenever a new EBS root volume is created.

Amazon EventBridge is used to invoke an AWS Lambda function on an emitted createVolume event. For automated reaction to the event, you can add a rule to the EventBridge which will forward the event to an AWS Lambda function whenever a new EBS volume is created. The rule within EventBridge looks like this:

{
  "source": ["aws.ec2"],
  "detail-type": ["EBS Volume Notification"],
  "detail": {
    "event": ["createVolume"]
  }
}

An example event is emitted when an EBS root volume is created, which will then invoke the Lambda function to look like this:

{
   "version": "0",
   "id": "01234567-0123-0123-0123-012345678901",
   "detail-type": "EBS Volume Notification",
   "source": "aws.ec2",
   "account": "012345678901",
   "time": "yyyy-mm-ddThh:mm:ssZ",
   "region": "us-east-1",
   "resources": [
      "arn:aws:ec2:us-east-1:012345678901:volume/vol-01234567"
   ],
   "detail": {
      "result": "available",
      "cause": "",
      "event": "createVolume",
      "request-id": "01234567-0123-0123-0123-0123456789ab"
   }
}

The code of the function uses the resource ARN within the received event and requests resource details about the EBS volume from the Amazon EC2 APIs. Since the event doesn’t include information if it’s a root volume, then you must verify this using the Amazon EC2 API.

The following is a summary of the tasks of the Lambda function:

  1. Extract the EBS ARN from the EventBridge Event
  2. Verify that it’s a root volume of an EC2 Instance
  3. Call the Amazon EC2 API create-snapshot to create a snapshot of the root volume and add a tag replace-snapshot=true

Then, the tag is used to clean up the environment and get rid of snapshots that aren’t needed.

As an alternative, you can emit your own event to EventBridge. This can be used to automatically create snapshots to which you can restore your volume. Instead of reacting to the createVolume event, you can use a customized approach for this architecture.

Automation of replacing your Root Volume

Architecture of the automated creation of Snapshots of new EBS Volumes.

The figure above illustrates the procedure of replacing the EBS root volume. It starts with the event, which is created through the AWS Command Line Interface (AWS CLI), console, or usage of the API. This leads to creating a new volume from a snapshot or using the initial launch state. The EC2 instance is rebooted, and during that time the old root volume is detached and a new volume gets attached as the root volume.

To invoke the create-replace-root-volume-task, you can call the Amazon EC2 API with the following AWS CLI command:

aws ec2 create-replace-root-volume-task --instance-id <value> --snapshot <value> --tag-specifications ResourceType=string,Tags=[{Key=replaced-volume,Value=true}]

If you want to restore to launch state, then omit the --snapshot parameter:

aws ec2 create-replace-root-volume-task --instance-id <value> --tag-specifications ResourceType=string,Tags=[{Key=delete-volume,Value=true}]

After running this command, AWS will create a new EBS volume, add the tag to the old EBS replaced-volume=true, restart your instance, and attach the new volume to the instance as the root volume. The tag is used later to detect old root volumes and clean up the environment.

If this is combined with the earlier explained automation, then the automation will immediately take a snapshot from the new EBS volume. A restore operation can only be done to a snapshot of the current EBS root volume. Therefore, if no snapshot is taken from the freshly restored EBS volume, then no restore operation is possible except the restore to launch state.

Preparation of the Environment for the next Root Volume Replacement

After the task is completed, the old root volume isn’t removed. Additionally, snapshots of previous root volumes can’t be used to restore current root volumes. To clean up your environment, you can schedule a Lambda function which does the following steps:

  • Delete detached EBS volumes with the tag delete-volume=true
  • Delete snapshots with the tag replace-snapshot=true, which aren’t associated with an existing EBS volume

Conclusion

In this post, we described an architecture to quickly restore EC2 instances through Root Volume Replacement. The feature of replacing Root Volumes of Amazon EC2 instances, now including Bare Metal EC2 Mac instances, enables customers to replace the root volumes of running EC2 instances to a specific snapshot or its launch state. Customers can resume their operations with their instance store data intact. We’ve split the process of doing this in an automated and quick manner into three steps: Create a snapshot, run the replacement task, and reset your environment to be prepared for a following replacement task. If you want to learn more about this feature, then see the Announcement of replacing Root Volumes, as well as the documentation for this feature. <TBD Announcement Bare Metal>

Deliver Operational Insights to Atlassian Opsgenie using DevOps Guru

Post Syndicated from Brendan Jenkins original https://aws.amazon.com/blogs/devops/deliver-operational-insights-to-atlassian-opsgenie-using-devops-guru/

As organizations continue to grow and scale their applications, the need for teams to be able to quickly and autonomously detect anomalous operational behaviors becomes increasingly important. Amazon DevOps Guru offers a fully managed AIOps service that enables you to improve application availability and resolve operational issues quickly. DevOps Guru helps ease this process by leveraging machine learning (ML) powered recommendations to detect operational insights, identify the exhaustion of resources, and provide suggestions to remediate issues. Many organizations running business critical applications use different tools to be notified about anomalous events in real-time for the remediation of critical issues. Atlassian is a modern team collaboration and productivity software suite that helps teams organize, discuss, and complete shared work. You can deliver these insights in near-real time to DevOps teams by integrating DevOps Guru with Atlassian Opsgenie. Opsgenie is a modern incident management platform that receives alerts from your monitoring systems and custom applications and categorizes each alert based on importance and timing.

This blog post walks you through how to integrate Amazon DevOps Guru with Atlassian Opsgenie to
receive notifications for new operational insights detected by DevOps Guru with more flexibility and customization using Amazon EventBridge and AWS Lambda. The Lambda function will be used to demonstrate how to customize insights sent to Opsgenie.

Solution overview

Figure 1: Amazon EventBridge Integration with Opsgenie using AWS Lambda

Figure 1: Amazon EventBridge Integration with Opsgenie using AWS Lambda

Amazon DevOps Guru directly integrates with Amazon EventBridge to notify you of events relating to generated insights and updates to insights. To begin routing these notifications to Opsgenie, you can configure routing rules to determine where to send notifications. As outlined below, you can also use pre-defined DevOps Guru patterns to only send notifications or trigger actions that match that pattern. You can select any of the following pre-defined patterns to filter events to trigger actions in a supported AWS resource. Here are the following predefined patterns supported by DevOps Guru:

  • DevOps Guru New Insight Open
  • DevOps Guru New Anomaly Association
  • DevOps Guru Insight Severity Upgraded
  • DevOps Guru New Recommendation Created
  • DevOps Guru Insight Closed

By default, the patterns referenced above are enabled so we will leave all patterns operational in this implementation.  However, you do have flexibility to change which of these patterns to choose to send to Opsgenie. When EventBridge receives an event, the EventBridge rule matches incoming events and sends it to a target, such as AWS Lambda, to process and send the insight to Opsgenie.

Prerequisites

The following prerequisites are required for this walkthrough:

Push Insights using Amazon EventBridge & AWS Lambda

In this tutorial, you will perform the following steps:

  1. Create an Opsgenie integration
  2. Launch the SAM template to deploy the solution
  3. Test the solution

Create an Opsgenie integration

In this step, you will navigate to Opsgenie to create the integration with DevOps Guru and to obtain the API key and team name within your account. These parameters will be used as inputs in a later section of this blog.

  1. Navigate to Teams, and take note of the team name you have as shown below, as you will need this parameter in a later section.
Figure 2: Opsgenie team names

Figure 2: Opsgenie team names

  1. Click on the team to proceed and navigate to Integrations on the left-hand pane. Click on Add Integration and select the Amazon DevOps Guru option.
Figure 3: Integration option for DevOps Guru

Figure 3: Integration option for DevOps Guru

  1. Now, scroll down and take note of the API Key for this integration and copy it to your notes as it will be needed in a later section. Click Save Integration at the bottom of the page to proceed.

­­­

 Figure 4: API Key for DevOps Guru Integration

Figure 4: API Key for DevOps Guru Integration

  1. Now, the Opsgenie integration has been created and we’ve obtained the API key and team name. The email of any team member will be used in the next section as well.

Review & launch the AWS SAM template to deploy the solution

In this step, you will review & launch the SAM template. The template will deploy an AWS Lambda function that is triggered by an Amazon EventBridge rule when Amazon DevOps Guru generates a new event. The Lambda function will retrieve the parameters obtained from the deployment and pushes the events to Opsgenie via an API.

Reviewing the template

Below is the SAM template that will be deployed in the next step. This template launches a few key components specified earlier in the blog. The Transform section of the template allows us takes an entire template written in the AWS Serverless Application Model (AWS SAM) syntax and transforms and expands it into a compliant CloudFormation template. Under the Resources section this solution will deploy an AWS Lamba function using the Java runtime as well as an Amazon EventBridge Rule/Pattern. Another key aspect of the template are the Parameters. As shown below, the ApiKey, Email, and TeamName are parameters we will use for this CloudFormation template which will then be used as environment variables for our Lambda function to pass to OpsGenie.

Figure 5: Review of SAM Template

Figure 5: Review of SAM Template

Launching the Template

  1. Navigate to the directory of choice within a terminal and clone the GitHub repository with the following command:
  1. Change directories with the command below to navigate to the directory of the SAM template.
cd amazon-devops-guru-connector-opsgenie/OpsGenieServerlessTemplate
  1. From the CLI, use the AWS SAM to build and process your AWS SAM template file, application code, and any applicable language-specific files and dependencies.
sam build
  1. From the CLI, use the AWS SAM to deploy the AWS resources for the pattern as specified in the template.yml file.
sam deploy --guided
  1. You will now be prompted to enter the following information below. Use the information obtained from the previous section to enter the Parameter ApiKey, Parameter Email, and Parameter TeamName fields.
  •  Stack Name
  • AWS Region
  • Parameter ApiKey
  • Parameter Email
  • Parameter TeamName
  • Allow SAM CLI IAM Role Creation

Test the solution

  1. Follow this blog to enable DevOps Guru and generate an operational insight.
  2. When DevOps Guru detects a new insight, it will generate an event in EventBridge. EventBridge then triggers Lambda and sends the event to Opsgenie as shown below.
Figure 6: Event Published to Opsgenie with details such as the source, alert type, insight type, and a URL to the insight in the AWS console.

Figure 6: Event Published to Opsgenie with details such as the source, alert type, insight type, and a URL to the insight in the AWS console.enecccdgruicnuelinbbbigebgtfcgdjknrjnjfglclt

Cleaning up

To avoid incurring future charges, delete the resources.

  1. Delete resources deployed from this blog.
  2. From the command line, use AWS SAM to delete the serverless application along with its dependencies.
sam delete

Customizing Insights published using Amazon EventBridge & AWS Lambda

The foundation of the DevOps Guru and Opsgenie integration is based on Amazon EventBridge and AWS Lambda which allows you the flexibility to implement several customizations. An example of this would be the ability to generate an Opsgenie alert when a DevOps Guru insight severity is high. Another example would be the ability to forward appropriate notifications to the AIOps team when there is a serverless-related resource issue or forwarding a database-related resource issue to your DBA team. This section will walk you through how these customizations can be done.

EventBridge customization

EventBridge rules can be used to select specific events by using event patterns. As detailed below, you can trigger the lambda function only if a new insight is opened and the severity is high. The advantage of this kind of customization is that the Lambda function will only be invoked when needed.

{
  "source": [
    "aws.devops-guru"
  ],
  "detail-type": [
    "DevOps Guru New Insight Open"
  ],
  "detail": {
    "insightSeverity": [
         "high"
         ]
  }
}

Applying EventBridge customization

  1. Open the file template.yaml reviewed in the previous section and implement the changes as highlighted below under the Events section within resources (original file on the left, changes on the right hand side).
Figure 7: CloudFormation template file changed so that the EventBridge rule is only triggered when the alert type is "DevOps Guru New Insight Open" and insightSeverity is “high”.

Figure 7: CloudFormation template file changed so that the EventBridge rule is only triggered when the alert type is “DevOps Guru New Insight Open” and insightSeverity is “high”.

  1. Save the changes and use the following command to apply the changes
sam deploy --template-file template.yaml
  1. Accept the changeset deployment

Determining the Ops team based on the resource type

Another customization would be to change the Lambda code to route and control how alerts will be managed.  Let’s say you want to get your DBA team involved whenever DevOps Guru raises an insight related to an Amazon RDS resource. You can change the AlertType Java class as follows:

  1. To begin this customization of the Lambda code, the following changes need to be made within the AlertType.java file:
  • At the beginning of the file, the standard java.util.List and java.util.ArrayList packages were imported
  • Line 60: created a list of CloudWatch metrics namespaces
  • Line 74: Assigned the dataIdentifiers JsonNode to the variable dataIdentifiersNode
  • Line 75: Assigned the namespace JsonNode to a variable namespaceNode
  • Line 77: Added the namespace to the list for each DevOps Insight which is always raised as an EventBridge event with the structure detail►anomalies►0►sourceDetails►0►dataIdentifiers►namespace
  • Line 88: Assigned the default responder team to the variable defaultResponderTeam
  • Line 89: Created the list of responders and assigned it to the variable respondersTeam
  • Line 92: Check if there is at least one AWS/RDS namespace
  • Line 93: Assigned the DBAOps_Team to the variable dbaopsTeam
  • Line 93: Included the DBAOps_Team team as part of the responders list
  • Line 97: Set the OpsGenie request teams to be the responders list
Figure 8: java.util.List and java.util.ArrayList packages were imported

Figure 8: java.util.List and java.util.ArrayList packages were imported


Figure 9: AlertType Java class customized to include DBAOps_Team for RDS-related DevOps Guru insights.

Figure 9: AlertType Java class customized to include DBAOps_Team for RDS-related DevOps Guru insights.


  1. You then need to generate the jar file by using the mvn clean package command.
  • The function needs to be updated with:
    • FUNCTION_NAME=$(aws lambda
      list-functions –query ‘Functions[?contains(FunctionName, `DevOps-Guru`) ==
      `true`].FunctionName’ –output text)
    • aws lambda update-function-code –region
      us-east-1 –function-name $FUNCTION_NAME –zip-file fileb://target/Functions-1.0.jar
  1. As result, the DBAOps_Team will be assigned to the Opsgenie alert in the case a DevOps Guru Insight is related to RDS.
Figure 10: Opsgenie alert assigned to both DBAOps_Team and AIOps_Team.

Figure 10: Opsgenie alert assigned to both DBAOps_Team and AIOps_Team.

Conclusion

In this post, you learned how Amazon DevOps Guru integrates with Amazon EventBridge and publishes insights to Opsgenie using AWS Lambda. By creating an Opsgenie integration with DevOps Guru, you can now leverage Opsgenie strengths, incident management, team communication, and collaboration when responding to an insight. All of the insight data can be viewed and addressed in Opsgenie’s Incident Command Center (ICC).  By customizing the data sent to Opsgenie via Lambda, you can empower your organization even more by fine tuning and displaying the most relevant data thus decreasing the MTTR (mean time to resolve) of the responding operations team.

About the authors:

Brendan Jenkins

Brendan Jenkins is a solutions architect working with Enterprise AWS customers providing them with technical guidance and helping achieve their business goals. He has an area of interest around DevOps and Machine Learning technology. He enjoys building solutions for customers whenever he can in his spare time.

Pablo Silva

Pablo Silva is a Sr. DevOps consultant that guide customers in their decisions on technology strategy, business model, operating model, technical architecture, and investments.

He holds a master’s degree in Artificial Intelligence and has more than 10 years of experience with telecommunication and financial companies.

Joseph Simon

Joseph Simon is a solutions architect working with mid to large Enterprise AWS customers. He has been in technology for 13 years with 5 of those centered around DevOps. He has a passion for Cloud, DevOps and Automation and in his spare time, likes to travel and spend time with his family.

Text analytics on AWS: implementing a data lake architecture with OpenSearch

Post Syndicated from Francisco Losada original https://aws.amazon.com/blogs/architecture/text-analytics-on-aws-implementing-a-data-lake-architecture-with-opensearch/

Text data is a common type of unstructured data found in analytics. It is often stored without a predefined format and can be hard to obtain and process.

For example, web pages contain text data that data analysts collect through web scraping and pre-process using lowercasing, stemming, and lemmatization. After pre-processing, the cleaned text is analyzed by data scientists and analysts to extract relevant insights.

This blog post covers how to effectively handle text data using a data lake architecture on Amazon Web Services (AWS). We explain how data teams can independently extract insights from text documents using OpenSearch as the central search and analytics service. We also discuss how to index and update text data in OpenSearch and evolve the architecture towards automation.

Architecture overview

This architecture outlines the use of AWS services to create an end-to-end text analytics solution, starting from the data collection and ingestion up to the data consumption in OpenSearch (Figure 1).

Data lake architecture with OpenSearch

Figure 1. Data lake architecture with OpenSearch

  1. Collect data from various sources, such as SaaS applications, edge devices, logs, streaming media, and social networks.
  2. Use tools like AWS Database Migration Service (AWS DMS), AWS DataSync, Amazon Kinesis, Amazon Managed Streaming for Apache Kafka (Amazon MSK), AWS IoT Core, and Amazon AppFlow to ingest the data into the AWS data lake, depending on the data source type.
  3. Store the ingested data in the raw zone of the Amazon Simple Storage Service (Amazon S3) data lake—a temporary area where data is kept in its original form.
  4. Validate, clean, normalize, transform, and enrich the data through a series of pre-processing steps using AWS Glue or Amazon EMR.
  5. Place the data that is ready to be indexed in the indexing zone.
  6. Use AWS Lambda to index the documents into OpenSearch and store them back in the data lake with a unique identifier.
  7. Use the clean zone as the source of truth for teams to consume the data and calculate additional metrics.
  8. Develop, train, and generate new metrics using machine learning (ML) models with Amazon SageMaker or artificial intelligence (AI) services like Amazon Comprehend.
  9. Store the new metrics in the enriching zone along with the identifier of the OpenSearch document.
  10. Use the identifier column from the initial indexing phase to identify the correct documents and update them in OpenSearch with the newly calculated metrics using AWS Lambda.
  11. Use OpenSearch to search through the documents and visualize them with metrics using OpenSearch Dashboards.

Considerations

Data lake orchestration among teams

This architecture allows data teams to work independently on text documents at different stages of their lifecycles. The data engineering team manages the raw and indexing zones, who also handle data ingestion and preprocessing for indexing in OpenSearch.

The cleaned data is stored in the clean zone, where data analysts and data scientists generate insights and calculate new metrics. These metrics are stored in the enrich zone and indexed as new fields in the OpenSearch documents by the data engineering team (Figure 2).

Data lake orchestration among teams

Figure 2. Data lake orchestration among teams

Let’s explore an example. Consider a company that periodically retrieves blog site comments and performs sentiment analysis using Amazon Comprehend. In this case:

  1. The comments are ingested into the raw zone of the data lake.
  2. The data engineering team processes the comments and stores them in the indexing zone.
  3. A Lambda function indexes the comments into OpenSearch, enriches the comments with the OpenSearch document ID, and saves it in the clean zone.
  4. The data science team consumes the comments and performs sentiment analysis using Amazon Comprehend.
  5. The sentiment analysis metrics are stored in the metrics zone of the data lake. A second Lambda function updates the comments in OpenSearch with the new metrics.

If the raw data does not require any preprocessing steps, the indexing and clean zones can be combined. You can explore this specific example, along with code implementation, in the AWS samples repository.

Schema evolution

As your data progresses through data lake stages, the schema changes and gets enriched accordingly. Continuing with our previous example, Figure 3 explains how the schema evolves.

Schema evolution through the data lake stages

Figure 3. Schema evolution through the data lake stages

  1. In the raw zone, there is a raw text field received directly from the ingestion phase. It’s best practice to keep a raw version of the data as a backup, or in case the processing steps need to be repeated later.
  2. In the indexing zone, the clean text field replaces the raw text field after being processed.
  3. In the clean zone, we add a new ID field that is generated during indexing and identifies the OpenSearch document of the text field.
  4. In the enrich zone, the ID field is required. Other fields with metric names are optional and represent new metrics calculated by other teams that will be added to OpenSearch.

Consumption layer with OpenSearch

In OpenSearch, data is organized into indices, which can be thought of as tables in a relational database. Each index consists of documents—similar to table rows—and multiple fields, similar to table columns. You can add documents to an index by indexing and updating them using various client APIs for popular programming languages.

Now, let’s explore how our architecture integrates with OpenSearch in the indexing and updating stage.

Indexing and updating documents using Python

The index document API operation allows you to index a document with a custom ID, or assigns one if none is provided. To speed up indexing, we can use the bulk index API to index multiple documents in one call.

We need to store the IDs back from the index operation to later identify the documents we’ll update with new metrics. Let’s explore two ways of doing this:

  • Use the requests library to call the REST Bulk Index API (preferred): the response returns the auto-generated IDs we need.
  • Use the Python Low-Level Client for OpenSearch: The IDs are not returned and need to be pre-assigned to later store them. We can use an atomic counter in Amazon DynamoDB to do so. This allows multiple Lambda functions to index documents in parallel without ID collisions.

As in Figure 4, the Lambda function:

  1. Increases the atomic counter by the number of documents that will index into OpenSearch.
  2. Gets the value of the counter back from the API call.
  3. Indexes the documents using the range that goes between [current counter value, current counter value – number of documents].
Storing the IDs back from the bulk index operation using the Python Low-Level Client for OpenSearch

Figure 4. Storing the IDs back from the bulk index operation using the Python Low-Level Client for OpenSearch

Data flow automation

As architectures evolve towards automation, the data flow between data lake stages becomes event-driven. Following our previous example, we can automate the processing steps of the data when moving from the raw to the indexing zone (Figure 5).

Event-driven automation for data flow

Figure 5. Event-driven automation for data flow

With Amazon EventBridge and AWS Step Functions, we can automatically trigger our pre-processing AWS Glue jobs so our data gets pre-processed without manual intervention.

The same approach can be applied to the other data lake stages to achieve a fully automated architecture. Explore this implementation for an automated language use case.

Conclusion

In this blog post, we covered designing an architecture to effectively handle text data using a data lake on AWS. We explained how different data teams can work independently to extract insights from text documents at different lifecycle stages using OpenSearch as the search and analytics service.

Serverless ICYMI Q4 2022

Post Syndicated from Marcia Villalba original https://aws.amazon.com/blogs/compute/serverless-icymi-q4-2022/

Welcome to the 20th edition of the AWS Serverless ICYMI (in case you missed it) quarterly recap. Every quarter, we share all the most recent product launches, feature enhancements, blog posts, webinars, Twitch live streams, and other interesting things that you might have missed!In case you missed our last ICYMI, check out what happened last quarter here.

AWS Lambda

For developers using Java, AWS Lambda has introduced Lambda SnapStart. SnapStart is a new capability that can improve the start-up performance of functions using Corretto (java11) runtime by up to 10 times, at no extra cost.

To use this capability, you must enable it in your function and then publish a new version. This triggers the optimization process. This process initializes the function, takes an immutable, encrypted snapshot of the memory and disk state, and caches it for reuse. When the function is invoked, the state is retrieved from the cache in chunks, on an as-needed basis, and it is used to populate the execution environment.

The ICYMI: Serverless pre:Invent 2022 post shares some of the launches for Lambda before November 21, like the support of Lambda functions using Node.js 18 as a runtime, the Lambda Telemetry API, and new .NET tooling to support .NET 7 applications.

Also, now Amazon Inspector supports Lambda functions. You can enable Amazon Inspector to scan your functions continually for known vulnerabilities. The log4j vulnerability shows how important it is to scan your code for vulnerabilities continuously, not only after deployment. Vulnerabilities can be discovered at any time, and with Amazon Inspector, your functions and layers are rescanned whenever a new vulnerability is published.

AWS Step Functions

There were many new launches for AWS Step Functions, like intrinsic functions, cross-account access capabilities, and the new executions experience for Express Workflows covered in the pre:Invent post.

During AWS re:Invent this year, we announced Step Functions Distributed Map. If you need to process many files, or items inside CSV or JSON files, this new flow can help you. The new distributed map flow orchestrates large-scale parallel workloads.

This feature is optimized for files stored in Amazon S3. You can either process in parallel multiple files stored in a bucket, or process one large JSON or CSV file, in which each line contains an independent item. For example, you can convert a video file into multiple .gif animations using a distributed map, or process over 37 GB of aggregated weather data to find the highest temperature of the day. 

Amazon EventBridge

Amazon EventBridge launched two major features: Scheduler and Pipes. Amazon EventBridge Scheduler allows you to create, run, and manage scheduled tasks at scale. You can schedule one-time or recurring tasks across 270 services and over 6.000 APIs.

Amazon EventBridge Pipes allows you to create point-to-point integrations between event producers and consumers. With Pipes you can now connect different sources, like Amazon Kinesis Data Streams, Amazon DynamoDB Streams, Amazon SQS, Amazon Managed Streaming for Apache Kafka, and Amazon MQ to over 14 targets, such as Step Functions, Kinesis Data Streams, Lambda, and others. It not only allows you to connect these different event producers to consumers, but also provides filtering and enriching capabilities for events.

EventBridge now supports enhanced filtering capabilities including:

  • Matching against characters at the end of a value (suffix filtering)
  • Ignoring case sensitivity (equals-ignore-case)
  • OR matching: A single rule can match if any conditions across multiple separate fields are true.

It’s now also simpler to build rules, and you can generate AWS CloudFormation from the console pages and generate event patterns from a schema.

AWS Serverless Application Model (AWS SAM)

There were many announcements for AWS SAM during this quarter summarized in the ICMYI: Serverless pre:Invent 2022 post, like AWS SAM ConnectorsSAM CLI Pipelines now support OpenID Connect Protocol, and AWS SAM CLI Terraform support.

AWS Application Composer

AWS Application Composer is a new visual designer that you can use to build serverless applications using multiple AWS services. This is ideal if you want to build a prototype, review with others architectures, generate diagrams for your projects, or onboard new team members to a project.

Within a simple user interface, you can drag and drop the different AWS resources and configure them visually. You can use AWS Application Composer together with AWS SAM Accelerate to build and test your applications in the AWS Cloud.

AWS Serverless digital learning badges

The new AWS Serverless digital learning badges let you show your AWS Serverless knowledge and skills. This is a verifiable digital badge that is aligned with the AWS Serverless Learning Plan.

This badge proves your knowledge and skills for Lambda, Amazon API Gateway, and designing serverless applications. To earn this badge, you must score at least 80 percent on the assessment associated with the Learning Plan. Visit this link if you are ready to get started learning or just jump directly to the assessment. 

News from other services:

Amazon SNS

Amazon SQS

AWS AppSync and AWS Amplify

Observability

AWS re:Invent 2022

AWS re:Invent was held in Las Vegas from November 28 to December 2, 2022. Werner Vogels, Amazon’s CTO, highlighted event-driven applications during his keynote. He stated that the world is asynchronous and showed how strange a synchronous world would be. During the keynote, he showcased Serverlesspresso as an example of an event-driven application. The Serverless DA team presented many breakouts, workshops, and chalk talks. Rewatch all our breakout content:

In addition, we brought Serverlesspresso back to Vegas. Serverlesspresso is a contactless, serverless order management system for a physical coffee bar. The architecture comprises several serverless apps that support an ordering process from a customer’s smartphone to a real espresso bar. The customer can check the virtual line, place an order, and receive a notification when their drink is ready for pickup.

Serverless blog posts

October

November

December

Videos

Serverless Office Hours – Tuesday 10 AM PT

Weekly live virtual office hours: In each session, we talk about a specific topic or technology related to serverless and open it up to helping with your real serverless challenges and issues. Ask us anything about serverless technologies and applications.

YouTube: youtube.com/serverlessland

Twitch: twitch.tv/aws

October

November

December

FooBar Serverless YouTube Channel

Marcia Villalba frequently publishes new videos on her popular FooBar Serverless YouTube channel.

October

November

December

Still looking for more?

The Serverless landing page has more information. The Lambda resources page contains case studies, webinars, whitepapers, customer stories, reference architectures, and even more Getting Started tutorials. If you want to learn more about event-driven architectures, read our new guide that will help you get started.

You can also follow the Serverless Developer Advocacy team on Twitter and LinkedIn to see the latest news, follow conversations, and interact with the team.

For more serverless learning resources, visit Serverless Land.

Enabling load-balancing of non-HTTP(s) traffic on AWS Wavelength

Post Syndicated from Sheila Busser original https://aws.amazon.com/blogs/compute/enabling-load-balancing-of-non-https-traffic-on-aws-wavelength/

This blog post is written by Jack Chen, Telco Solutions Architect, and Robert Belson, Developer Advocate.

AWS Wavelength embeds AWS compute and storage services within 5G networks, providing mobile edge computing infrastructure for developing, deploying, and scaling ultra-low-latency applications. AWS recently introduced support for Application Load Balancer (ALB) in AWS Wavelength zones. Although ALB addresses Layer-7 load balancing use cases, some low latency applications that get deployed in AWS Wavelength Zones rely on UDP-based protocols, such as QUIC, WebRTC, and SRT, which can’t be load-balanced by Layer-7 Load Balancers. In this post, we’ll review popular load-balancing patterns on AWS Wavelength, including a proposed architecture demonstrating how DNS-based load balancing can address customer requirements for load-balancing non-HTTP(s) traffic across multiple Amazon Elastic Compute Cloud (Amazon EC2) instances. This solution also builds a foundation for automatic scale-up and scale-down capabilities for workloads running in an AWS Wavelength Zone.

Load balancing use cases in AWS Wavelength

In the AWS Regions, customers looking to deploy highly-available edge applications often consider Amazon Elastic Load Balancing (Amazon ELB) as an approach to automatically distribute incoming application traffic across multiple targets in one or more Availability Zones (AZs). However, at the time of this publication, AWS-managed Network Load Balancer (NLB) isn’t supported in AWS Wavelength Zones and ALB is being rolled out to all AWS Wavelength Zones globally. As a result, this post will seek to document general architectural guidance for load balancing solutions on AWS Wavelength.

As one of the most prominent AWS Wavelength use cases, highly-immersive video streaming over UDP using protocols such as WebRTC at scale often require a load balancing solution to accommodate surges in traffic, either due to live events or general customer access patterns. These use cases, relying on Layer-4 traffic, can’t be load-balanced from a Layer-7 ALB. Instead, Layer-4 load balancing is needed.

To date, two infrastructure deployments involving Layer-4 load balancers are most often seen:

  • Amazon EC2-based deployments: Often the environment of choice for earlier-stage enterprises and ISVs, a fleet of EC2 instances will leverage a load balancer for high-throughput use cases, such as video streaming, data analytics, or Industrial IoT (IIoT) applications
  • Amazon EKS deployments: Customers looking to optimize performance and cost efficiency of their infrastructure can leverage containerized deployments at the edge to manage their AWS Wavelength Zone applications. In turn, external load balancers could be configured to point to exposed services via NodePort objects. Furthermore, a more popular choice might be to leverage the AWS Load Balancer Controller to provision an ALB when you create a Kubernetes Ingress.

Regardless of deployment type, the following design constraints must be considered:

  • Target registration: For load balancing solutions not managed by AWS, seamless solutions to load balancer target registration must be managed by the customer. As one potential solution, visit a recent HAProxyConf presentation, Practical Advice for Load Balancing at the Network Edge.
  • Edge Discovery: Although DNS records can be populated into Amazon Route 53 for each carrier-facing endpoint, DNS won’t deterministically route mobile clients to the most optimal mobile endpoint. When available, edge discovery services are required to most effectively route mobile clients to the lowest latency endpoint.
  • Cross-zone load balancing: Given the hub-and-spoke design of AWS Wavelength, customer-managed load balancers should proxy traffic only to that AWS Wavelength Zone.

Solution overview – Amazon EC2

In this solution, we’ll present a solution for a highly-available load balancing solution in a single AWS Wavelength Zone for an Amazon EC2-based deployment. In a separate post, we’ll cover the needed configurations for the AWS Load Balancer Controller in AWS Wavelength for Amazon Elastic Kubernetes Service (Amazon EKS) clusters.

The proposed solution introduces DNS-based load balancing, a technique to abstract away the complexity of intelligent load-balancing software and allow your Domain Name System (DNS) resolvers to distribute traffic (equally, or in a weighted distribution) to your set of endpoints.

Our solution leverages the weighted routing policy in Route 53 to resolve inbound DNS queries to multiple EC2 instances running within an AWS Wavelength zone. As EC2 instances for a given workload get deployed in an AWS Wavelength zone, Carrier IP addresses can be assigned to the network interfaces at launch.

Through this solution, Carrier IP addresses attached to AWS Wavelength instances are automatically added as DNS records for the customer-provided public hosted zone.

To determine how Route 53 responds to queries, given an arbitrary number of records of a public hosted zone, Route53 offers numerous routing policies:

Simple routing policy – In the event that you must route traffic to a single resource in an AWS Wavelength Zone, simple routing can be used. A single record can contain multiple IP addresses, but Route 53 returns the values in a random order to the client.

Weighted routing policy – To route traffic more deterministically using a set of proportions that you specify, this policy can be selected. For example, if you would like Carrier IP A to receive 50% of the traffic and Carrier IP B to receive 50% of the traffic, we’ll create two individual A records (one for each Carrier IP) with a weight of 50 and 50, respectively. Learn more about Route 53 routing policies by visiting the Route 53 Developer Guide.

The proposed solution leverages weighted routing policy in Route 53 DNS to route traffic to multiple EC2 instances running within an AWS Wavelength zone.

Reference architecture

The following diagram illustrates the load-balancing component of the solution, where EC2 instances in an AWS Wavelength zone are assigned Carrier IP addresses. A weighted DNS record for a host (e.g., www.example.com) is updated with Carrier IP addresses.

DNS-based load balancing

When a device makes a DNS query, it will be returned to one of the Carrier IP addresses associated with the given domain name. With a large number of devices, we expect a fair distribution of load across all EC2 instances in the resource pool. Given the highly ephemeral mobile edge environments, it’s likely that Carrier IPs could frequently be allocated to accommodate a workload and released shortly thereafter. However, this unpredictable behavior could yield stale DNS records, resulting in a “blackhole” – routes to endpoints that no longer exist.

Time-To-Live (TTL) is a DNS attribute that specifies the amount of time, in seconds, that you want DNS recursive resolvers to cache information about this record.

In our example, we should set to 30 seconds to force DNS resolvers to retrieve the latest records from the authoritative nameservers and minimize stale DNS responses. However, a lower TTL has a direct impact on cost, as a result of increased number of calls from recursive resolvers to Route53 to constantly retrieve the latest records.

The core components of the solution are as follows:

Alongside the services above in the AWS Wavelength Zone, the following services are also leveraged in the AWS Region:

  • AWS Lambda – a serverless event-driven function that makes API calls to the Route 53 service to update DNS records.
  • Amazon EventBridge– a serverless event bus that reacts to EC2 instance lifecycle events and invokes the Lambda function to make DNS updates.
  • Route 53– cloud DNS service with a domain record pointing to AWS Wavelength-hosted resources.

In this post, we intentionally leave the specific load balancing software solution up to the customer. Customers can leverage various popular load balancers available on the AWS Marketplace, such as HAProxy and NGINX. To focus our solution on the auto-registration of DNS records to create functional load balancing, this solution is designed to support stateless workloads only. To support stateful workloads, sticky sessions – a process in which routes requests to the same target in a target group – must be configured by the underlying load balancer solution and are outside of the scope of what DNS can provide natively.

Automation overview

Using the aforementioned components, we can implement the following workflow automation:

Event-driven Auto Scaling Workflow

Amazon CloudWatch alarm can trigger the Auto Scaling group Scale out or Scale in event by adding or removing EC2 instances. Eventbridge will detect the EC2 instance state change event and invoke the Lambda function. This function will update the DNS record in Route53 by either adding (scale out) or deleting (scale in) a weighted A record associated with the EC2 instance changing state.

Configuration of the automatic auto scaling policy is out of the scope of this post. There are many auto scaling triggers that you can consider using, based on predefined and custom metrics such as memory utilization. For the demo purposes, we will be leveraging manual auto scaling.

In addition to the core components that were already described, our solution also utilizes AWS Identity and Access Management (IAM) policies and CloudWatch. Both services are key components to building AWS Well-Architected solutions on AWS. We also use AWS Systems Manager Parameter Store to keep track of user input parameters. The deployment of the solution is automated via AWS CloudFormation templates. The Lambda function provided should be uploaded to an AWS Simple Storage Service (Amazon S3) bucket.

Amazon Virtual Private Cloud (Amazon VPC), subnets, Carrier Gateway, and Route Tables are foundational building blocks for AWS-based networking infrastructure. In our deployment, we are creating a new VPC, one subnet in an AWS Wavelength zone of your choice, a Carrier Gateway, and updating the route table for this subnet to point the default route to the Carrier Gateway.

Wavelength VPC architecture.

Deployment prerequisites

The following are prerequisites to deploy the described solution in your account:

  • Access to an AWS Wavelength zone. If your account is not allow-listed to use AWS Wavelength zones, then opt-in to AWS Wavelength zones here.
  • Public DNS Hosted Zone hosted in Route 53. You must have access to a registered public domain to deploy this solution. The zone for this domain should be hosted in the same account where you plan to deploy AWS Wavelength workloads.
    If you don’t have a public domain, then you can register a new one. Note that there will be a service charge for the domain registration.
  • Amazon S3 bucket. For the Lambda function that updates DNS records in Route 53, store the source code as a .zip file in an Amazon S3 bucket.
  • Amazon EC2 Key pair. You can use an existing Key pair for the deployment. If you don’t have a KeyPair in the region where you plan to deploy this solution, then create one by following these instructions.
  • 4G or 5G-connected device. Although the infrastructure can be deployed independent of the underlying connected devices, testing the connectivity will require a mobile device on one of the Wavelength partner’s networks. View the complete list of Telecommunications providers and Wavelength Zone locations to learn more.

Conclusion

In this post, we demonstrated how to implement DNS-based load balancing for workloads running in an AWS Wavelength zone. We deployed the solution that used the EventBridge Rule and the Lambda function to update DNS records hosted by Route53. If you want to learn more about AWS Wavelength, subscribe to AWS Compute Blog channel here.

AWS Week in Review – December 12, 2022

Post Syndicated from Marcia Villalba original https://aws.amazon.com/blogs/aws/aws-week-in-review-december-12-2022/

This post is part of our Week in Review series. Check back each week for a quick roundup of interesting news and announcements from AWS!

The world is asynchronous, is what Werner Vogels, Amazon CTO, reminded us during his keynote last week at AWS re:Invent. At the beginning of the keynote, he showed us how weird a synchronous world would be and how everything in nature is asynchronous. One example of an event-driven application he showcased during his keynote is Serverlesspresso, a project my team has been working on for the last year. And last week, we announced Serverlesspresso extensions, a new program that lets you contribute to Serverlesspresso and learn how event-driven applications can be extended.

Last Week’s Launches
Here are some launches that got my attention during the previous week.

Amazon SageMaker Studio now supports fine-grained data access control with AWS LakeFormation when accessing data through Amazon EMR. Now, when you connect to EMR clusters to SageMaker Studio notebooks, you can choose what runtime IAM role you want to connect with, and the notebooks will only access data and resources permitted by the attached runtime role.

Amazon Lex has now added support for Arabic, Cantonese, Norwegian, Swedish, Polish, and Finnish. This opens new possibilities to create chat bots and conversational experiences in more languages.

Amazon RDS Proxy now supports creating proxies in Amazon Aurora Global Database primary and secondary Regions. Now, building multi-Region applications with Amazon Aurora is simpler. RDS proxy sits between your application and the database pool and shares established database connections.

Amazon FSx for NetApp ONTAP launched many new features. First, it added the support for Nitro-based encryption of data in transit. It also extended NVMe read cache support to Single-AZ file systems. And it added four new features to ease the use of the service: easily assign a snapshot policy to your volumes, easily create data protection volumes, configure volumes so their tags are automatically copied to the backups, and finally, add or remove VPC route tables for your existing Multi-AZ file systems.

I would also like to mention two launches that happened before re:Invent but were not covered on the News Blog:

Amazon EventBridge Scheduler is a new capability from Amazon EventBridge that allows you to create, run, and manage scheduled tasks at scale. Using this new capability, you can schedule one-time or recurrent tasks across 270 AWS services.

AWS IoT RoboRunner is now generally available. Last year at re:Invent Channy wrote a blog post introducing the preview for this service. IoT RoboRunner is a robotic service that makes it easier to build and deploy applications for fleets of robots working seamlessly together.

For a full list of AWS announcements, be sure to keep an eye on the What’s New at AWS page.

Other AWS News
Some other updates and news that you may have missed:

I would like to recommend this really interesting Amazon Science article about federated learning. This is a framework that allows edge devices to work together to train a global model while keeping customers’ data on-device.

Podcast Charlas Técnicas de AWS – If you understand Spanish, this podcast is for you. Podcast Charlas Técnicas is one of the official AWS podcasts in Spanish, and every other week there is a new episode. Today the final episode for season three launched, and in it, we discussed many of the re:Invent launches. You can listen to all the episodes directly from your favorite podcast app or at AWS Podcasts en español.

AWS open-source news and updates–This is a newsletter curated by my colleague Ricardo to bring you the latest open-source projects, posts, events, and more.

Upcoming AWS Events
Check your calendars and sign up for these AWS events:

AWS Resiliency Hub Activation Day is a half-day technical virtual session to deep dive into the features and functionality of Resiliency Hub. You can register for free here.

AWS re:Invent recaps in your area. During the re:Invent week, we had lots of new announcements, and in the next weeks you can find in your area a recap of all these launches. All the events will be posted on this site, so check it regularly to find an event nearby.

AWS re:Invent keynotes, leadership sessions, and breakout sessions are available on demand. I recommend that you check the playlists and find the talks about your favorite topics in one collection.

That’s all for this week. Check back next Monday for another Week in Review!

— Marcia

Configuration driven dynamic multi-account CI/CD solution on AWS

Post Syndicated from Anshul Saxena original https://aws.amazon.com/blogs/devops/configuration-driven-dynamic-multi-account-ci-cd-solution-on-aws/

Many organizations require durable automated code delivery for their applications. They leverage multi-account continuous integration/continuous deployment (CI/CD) pipelines to deploy code and run automated tests in multiple environments before deploying to Production. In cases where the testing strategy is release specific, you must update the pipeline before every release. Traditional pipeline stages are predefined and static in nature, and once the pipeline stages are defined it’s hard to update them. In this post, we present a configuration driven dynamic CI/CD solution per repository. The pipeline state is maintained and governed by configurations stored in Amazon DynamoDB. This gives you the advantage of automatically customizing the pipeline for every release based on the testing requirements.

By following this post, you will set up a dynamic multi-account CI/CD solution. Your pipeline will deploy and test a sample pet store API application. Refer to Automating your API testing with AWS CodeBuild, AWS CodePipeline, and Postman for more details on this application. New code deployments will be delivered with custom pipeline stages based on the pipeline configuration that you create. This solution uses services such as AWS Cloud Development Kit (AWS CDK), AWS CloudFormation, Amazon DynamoDB, AWS Lambda, and AWS Step Functions.

Solution overview

The following diagram illustrates the solution architecture:

The image represents the solution workflow, highlighting the integration of the AWS components involved.

Figure 1: Architecture Diagram

  1. Users insert/update/delete entry in the DynamoDB table.
  2. The Step Function Trigger Lambda is invoked on all modifications.
  3. The Step Function Trigger Lambda evaluates the incoming event and does the following:
    1. On insert and update, triggers the Step Function.
    2. On delete, finds the appropriate CloudFormation stack and deletes it.
  4. Steps in the Step Function are as follows:
    1. Collect Information (Pass State) – Filters the relevant information from the event, such as repositoryName and referenceName.
    2. Get Mapping Information (Backed by CodeCommit event filter Lambda) – Retrieves the mapping information from the Pipeline config stored in the DynamoDB.
    3. Deployment Configuration Exist? (Choice State) – If the StatusCode == 200, then the DynamoDB entry is found, and Initiate CloudFormation Stack step is invoked, or else StepFunction exits with Successful.
    4. Initiate CloudFormation Stack (Backed by stack create Lambda) – Constructs the CloudFormation parameters and creates/updates the dynamic pipeline based on the configuration stored in the DynamoDB via CloudFormation.

Code deliverables

The code deliverables include the following:

  1. AWS CDK app – The AWS CDK app contains the code for all the Lambdas, Step Functions, and CloudFormation templates.
  2. sample-application-repo – This directory contains the sample application repository used for deployment.
  3. automated-tests-repo– This directory contains the sample automated tests repository for testing the sample repo.

Deploying the CI/CD solution

  1. Clone this repository to your local machine.
  2. Follow the README to deploy the solution to your main CI/CD account. Upon successful deployment, the following resources should be created in the CI/CD account:
    1. A DynamoDB table
    2. Step Function
    3. Lambda Functions
  3. Navigate to the Amazon Simple Storage Service (Amazon S3) console in your main CI/CD account and search for a bucket with the name: cloudformation-template-bucket-<AWS_ACCOUNT_ID>. You should see two CloudFormation templates (templates/codepipeline.yaml and templates/childaccount.yaml) uploaded to this bucket.
  4. Run the childaccount.yaml in every target CI/CD account (Alpha, Beta, Gamma, and Prod) by going to the CloudFormation Console. Provide the main CI/CD account number as the “CentralAwsAccountId” parameter, and execute.
  5. Upon successful creation of Stack, two roles will be created in the Child Accounts:
    1. ChildAccountFormationRole
    2. ChildAccountDeployerRole

Pipeline configuration

Make an entry into devops-pipeline-table-info for the Repository name and branch combination. A sample entry can be found in sample-entry.json.

The pipeline is highly configurable, and everything can be configured through the DynamoDB entry.

The following are the top-level keys:

RepoName: Name of the repository for which AWS CodePipeline is configured.
RepoTag: Name of the branch used in CodePipeline.
BuildImage: Build image used for application AWS CodeBuild project.
BuildSpecFile: Buildspec file used in the application CodeBuild project.
DeploymentConfigurations: This key holds the deployment configurations for the pipeline. Under this key are the environment specific configurations. In our case, we’ve named our environments Alpha, Beta, Gamma, and Prod. You can configure to any name you like, but make sure that the entries in json are the same as in the codepipeline.yaml CloudFormation template. This is because there is a 1:1 mapping between them. Sub-level keys under DeploymentConfigurations are as follows:

  • EnvironmentName. This is the top-level key for environment specific configuration. In our case, it’s Alpha, Beta, Gamma, and Prod. Sub level keys under this are:
    • <Env>AwsAccountId: AWS account ID of the target environment.
    • Deploy<Env>: A key specifying whether or not the artifact should be deployed to this environment. Based on its value, the CodePipeline will have a deployment stage to this environment.
    • ManualApproval<Env>: Key representing whether or not manual approval is required before deployment. Enter your email or set to false.
    • Tests: Once again, this is a top-level key with sub-level keys. This key holds the test related information to be run on specific environments. Each test based on whether or not it will be run will add an additional step to the CodePipeline. The tests’ related information is also configurable with the ability to specify the test repository, branch name, buildspec file, and build image for testing the CodeBuild project.

Execute

  1. Make an entry into the devops-pipeline-table-info DynamoDB table in the main CI/CD account. A sample entry can be found in sample-entry.json. Make sure to replace the configuration values with appropriate values for your environment. An explanation of the values can be found in the Pipeline Configuration section above.
  2. After the entry is made in the DynamoDB table, you should see a CloudFormation stack being created. This CloudFormation stack will deploy the CodePipeline in the main CI/CD account by reading and using the entry in the DynamoDB table.

Customize the solution for different combinations such as deploying to an environment while skipping for others by updating the pipeline configurations stored in the devops-pipeline-table-info DynamoDB table. The following is the pipeline configured for the sample-application repository’s main branch.

The image represents the dynamic CI/CD pipeline deployed in your account.

The image represents the dynamic CI/CD pipeline deployed in your account.

The image represents the dynamic CI/CD pipeline deployed in your account.

The image represents the dynamic CI/CD pipeline deployed in your account.

Figure 2: Dynamic Multi-Account CI/CD Pipeline

Clean up your dynamic multi-account CI/CD solution and related resources

To avoid ongoing charges for the resources that you created following this post, you should delete the following:

  1. The pipeline configuration stored in the DynamoDB
  2. The CloudFormation stacks deployed in the target CI/CD accounts
  3. The AWS CDK app deployed in the main CI/CD account
  4. Empty and delete the retained S3 buckets.

Conclusion

This configuration-driven CI/CD solution provides the ability to dynamically create and configure your pipelines in DynamoDB. IDEMIA, a global leader in identity technologies, adopted this approach for deploying their microservices based application across environments. This solution created by AWS Professional Services allowed them to dynamically create and configure their pipelines per repository per release. As Kunal Bajaj, Tech Lead of IDEMIA, states, “We worked with AWS pro-serve team to create a dynamic CI/CD solution using lambdas, step functions, SQS, and other native AWS services to conduct cross-account deployments to our different environments while providing us the flexibility to add tests and approvals as needed by the business.”

About the authors:

Anshul Saxena

Anshul is a Cloud Application Architect at AWS Professional Services and works with customers helping them in their cloud adoption journey. His expertise lies in DevOps, serverless architectures, and architecting and implementing cloud native solutions aligning with best practices.

Libin Roy

Libin is a Cloud Infrastructure Architect at AWS Professional Services. He enjoys working with customers to design and build cloud native solutions to accelerate their cloud journey. Outside of work, he enjoys traveling, cooking, playing sports and weight training.

New — Create Point-to-Point Integrations Between Event Producers and Consumers with Amazon EventBridge Pipes

Post Syndicated from Donnie Prakoso original https://aws.amazon.com/blogs/aws/new-create-point-to-point-integrations-between-event-producers-and-consumers-with-amazon-eventbridge-pipes/

It is increasingly common to use multiple cloud services as building blocks to assemble a modern event-driven application. Using purpose-built services to accomplish a particular task ensures developers get the best capabilities for their use case. However, communication between services can be difficult if they use different technologies to communicate, meaning that you need to learn the nuances of each service and how to integrate them with each other. We usually need to create integration code (or “glue” code) to connect and bridge communication between services. Writing glue code slows our velocity, increases the risk of bugs, and means we spend our time writing undifferentiated code rather than building better experiences for our customers.

Introducing Amazon EventBridge Pipes
Today, I’m excited to announce Amazon EventBridge Pipes, a new feature of Amazon EventBridge that makes it easier for you to build event-driven applications by providing a simple, consistent, and cost-effective way to create point-to-point integrations between event producers and consumers, removing the need to write undifferentiated glue code.

The simplest pipe consists of a source and a target. An optional filtering step allows only specific source events to flow into the Pipe and an optional enrichment step using AWS Lambda, AWS Step Functions, Amazon EventBridge API Destinations, or Amazon API Gateway enriches or transforms events before they reach the target. With Amazon EventBridge Pipes, you can integrate supported AWS and self-managed services as event producers and event consumers into your application in a simple, reliable, consistent and cost-effective way.

Amazon EventBridge Pipes bring the most popular features of Amazon EventBridge Event Bus, such as event filtering, integration with more than 14 AWS services, and automatic delivery retries.

How Amazon EventBridge Pipes Works
Amazon EventBridge Pipes provides you a seamless means of integrating supported AWS and self-managed services, favouring configuration over code. To start integrating services with EventBridge Pipes, you need to take the following steps:

  1. Choose a source that is producing your events. Supported sources include: Amazon DynamoDB, Amazon Kinesis Data Streams, Amazon SQS, Amazon Managed Streaming for Apache Kafka, and Amazon MQ (both ActiveMQ and RabbitMQ).
  2. (Optional) Specify an event filter to only process events that match your filter (you’re not charged for events that are filtered out).
  3. (Optional) Transform and enrich your events using built-in free transformations, or AWS Lambda, AWS Step Functions, Amazon API Gateway, or EventBridge API Destinations to perform more advanced transformations and enrichments.
  4. Choose a target destination from more than 14 AWS services, including Amazon Step Functions, Kinesis Data Streams, AWS Lambda, and third-party APIs using EventBridge API destinations.

Amazon EventBridge Pipes provides simplicity to accelerate development velocity by reducing the time needed to learn the services and write integration code, to get reliable and consistent integration.

EventBridge Pipes also comes with additional features that can help in building event-driven applications. For example, with event filtering, Pipes helps event-driven applications become more cost-effective by only processing the events of interest.

Get Started with Amazon EventBridge Pipes
Let’s see how to get started with Amazon EventBridge Pipes. In this post, I will show how to integrate an Amazon SQS queue with AWS Step Functions using Amazon EventBridge Pipes.

The following screenshot is my existing Amazon SQS queue and AWS Step Functions state machine. In my case, I need to run the state machine for every event in the queue. To do so, I need to connect my SQS queue and Step Functions state machine with EventBridge Pipes.

Existing Amazon SQS queue and AWS Step Functions state machine

First, I open the Amazon EventBridge console. In the navigation section, I select Pipes. Then I select Create pipe.

On this page, I can start configuring a pipe and set the AWS Identity and Access Management (IAM) permission, and I can navigate to the Pipe settings tab.

Navigate to Pipe Settings

In the Permissions section, I can define a new IAM role for this pipe or use an existing role. To improve developer experience, the EventBridge Pipes console will figure out the IAM role for me, so I don’t need to manually configure required permissions and let EventBridge Pipes configures least-privilege permissions for IAM role. Since this is my first time creating a pipe, I select Create a new role for this specific resource.

Setting IAM Permission for pipe

Then, I go back to the Build pipe section. On this page, I can see the available event sources supported by EventBridge Pipes.

List of available services as the event source

I select SQS and select my existing SQS queue. If I need to do batch processing, I can select Additional settings to start defining Batch size and Batch window. Then, I select Next.

Select SQS Queue as event source

On the next page, things get even more interesting because I can define Event filtering from the event source that I just selected. This step is optional, but the event filtering feature makes it easy for me to process events that only need to be processed by my event-driven application. In addition, this event filtering feature also helps me to be more cost-effective, as this pipe won’t process unnecessary events. For example, if I use Step Functions as the target, the event filtering will only execute events that match the filter.

Event filtering in Amazon EventBridge Pipes

I can use sample events from AWS events or define custom events. For example, I want to process events for returned purchased items with a value of 100 or more. The following is the sample event in JSON format:

{
   "event-type":"RETURN_PURCHASE",
   "value":100
}

Then, in the event pattern section, I can define the pattern by referring to the Content filtering in Amazon EventBridge event patterns documentation. I define the event pattern as follows:

{
   "event-type": ["RETURN_PURCHASE"],
   "value": [{
      "numeric": [">=", 100]
   }]
}

I can also test by selecting test pattern to make sure this event pattern will match the custom event I’m going to use. Once I’m confident that this is the event pattern that I want, I select Next.

Defining and testing an event pattern for filtering

In the next optional step, I can use an Enrichment that will augment, transform, or expand the event before sending the event to the target destination. This enrichment is useful when I need to enrich the event using an existing AWS Lambda function, or external SaaS API using the Destination API. Additionally, I can shape the event using the Enrichment Input Transformer.

The final step is to define a target for processing the events delivered by this pipe.

Defining target destination service

Here, I can select various AWS services supported by EventBridge Pipes.

I select my existing AWS Step Functions state machine, named pipes-statemachine.

In addition, I can also use Target Input Transformer by referring to the Transforming Amazon EventBridge target input documentation. For my case, I need to define a high priority for events going into this target. To do that, I define a sample custom event in Sample events/Event Payload and add the priority: HIGH in the Transformer section. Then in the Output section, I can see the final event to be passed to the target destination service. Then, I select Create pipe.

In less than a minute, my pipe was successfully created.

Pipe successfully created

To test this pipe, I need to put an event into the Amaon SQS queue.

Sending a message into Amazon SQS Queue

To check if my event is successfully processed by Step Functions, I can look into my state machine in Step Functions. On this page, I see my event is successfully processed.

I can also go to Amazon CloudWatch Logs to get more detailed logs.

Things to Know
Event Sources
– At launch, Amazon EventBridge Pipes supports the following services as event sources: Amazon DynamoDB, Amazon Kinesis, Amazon Managed Streaming for Apache Kafka (Amazon MSK) alongside self-managed Apache Kafka, Amazon SQS (standard and FIFO), and Amazon MQ (both for ActiveMQ and RabbitMQ).

Event Targets – Amazon EventBridge Pipes supports 15 Amazon EventBridge targets, including AWS Lambda, Amazon API Gateway, Amazon SNS, Amazon SQS, and AWS Step Functions. To deliver events to any HTTPS endpoint, developers can use API destinations as the target.

Event Ordering – EventBridge Pipes maintains the ordering of events received from an event sources that support ordering when sending those events to a destination service.

Programmatic Access – You can also interact with Amazon EventBridge Pipes and create a pipe using AWS Command Line Interface (CLI), AWS CloudFormation, and AWS Cloud Development Kit (AWS CDK).

Independent Usage – EventBridge Pipes can be used separately from Amazon EventBridge bus and Amazon EventBridge Scheduler. This flexibility helps developers to define source events from supported AWS and self-managed services as event sources without Amazon EventBridge Event Bus.

Availability – Amazon EventBridge Pipes is now generally available in all AWS commercial Regions, with the exception of Asia Pacific (Hyderabad) and Europe (Zurich).

Visit the Amazon EventBridge Pipes page to learn more about this feature and understand the pricing. You can also visit the documentation page to learn more about how to get started.

Happy building!

— Donnie

AWS Week in Review – November 21, 2022

Post Syndicated from Danilo Poccia original https://aws.amazon.com/blogs/aws/aws-week-in-review-november-21-2022/

This post is part of our Week in Review series. Check back each week for a quick roundup of interesting news and announcements from AWS!

A new week starts, and the News Blog team is getting ready for AWS re:Invent! Many of us will be there next week and it would be great to meet in person. If you’re coming, do you know about PeerTalk? It’s an onsite networking program for re:Invent attendees available through the AWS Events mobile app (which you can get on Google Play or Apple App Store) to help facilitate connections among the re:Invent community.

If you’re not coming to re:Invent, no worries, you can get a free online pass to watch keynotes and leadership sessions.

Last Week’s Launches
It was a busy week for our service teams! Here are the launches that got my attention:

AWS Region in Spain – The AWS Region in Aragón, Spain, is now open. The official name is Europe (Spain), and the API name is eu-south-2.

Amazon Athena – You can now apply AWS Lake Formation fine-grained access control policies with all table and file format supported by Amazon Athena to centrally manage permissions and access data catalog resources in your Amazon Simple Storage Service (Amazon S3) data lake. With fine-grained access control, you can restrict access to data in query results using data filters to achieve column-level, row-level, and cell-level security.

Amazon EventBridge – With these additional filtering capabilities, you can now filter events by suffix, ignore case, and match if at least one condition is true. This makes it easier to write complex rules when building event-driven applications.

AWS Controllers for Kubernetes (ACK) – The ACK for Amazon Elastic Compute Cloud (Amazon EC2) is now generally available and lets you provision and manage EC2 networking resources, such as VPCs, security groups and internet gateways using the Kubernetes API. Also, the ACK for Amazon EMR on EKS is now generally available to allow you to declaratively define and manage EMR on EKS resources such as virtual clusters and job runs as Kubernetes custom resources. Learn more about ACK for Amazon EMR on EKS in this blog post.

Amazon HealthLake – New analytics capabilities make it easier to query, visualize, and build machine learning (ML) models. Now HealthLake transforms customer data into an analytics-ready format in near real-time so that you can query, and use the resulting data to build visualizations or ML models. Also new is Amazon HealthLake Imaging (preview), a new HIPAA-eligible capability that enables you to easily store, access, and analyze medical images at any scale. More on HealthLake Imaging can be found in this blog post.

Amazon RDS – You can now transfer files between Amazon Relational Database Service (RDS) for Oracle and an Amazon Elastic File System (Amazon EFS) file system. You can use this integration to stage files like Oracle Data Pump export files when you import them. You can also use EFS to share a file system between an application and one or more RDS Oracle DB instances to address specific application needs.

Amazon ECS and Amazon EKS – We added centralized logging support for Windows containers to help you easily process and forward container logs to various AWS and third-party destinations such as Amazon CloudWatch, S3, Amazon Kinesis Data Firehose, Datadog, and Splunk. See these blog posts for how to use this new capability with ECS and with EKS.

AWS SAM CLI – You can now use the Serverless Application Model CLI to locally test and debug an AWS Lambda function defined in a Terraform application. You can see a walkthrough in this blog post.

AWS Lambda – Now supports Node.js 18 as both a managed runtime and a container base image, which you can learn more about in this blog post. Also check out this interesting article on why and how you should use AWS SDK for JavaScript V3 with Node.js 18. And last but not least, there is new tooling support to build and deploy native AOT compiled .NET 7 applications to AWS Lambda. With this tooling, you can enable faster application starts and benefit from reduced costs through the faster initialization times and lower memory consumption of native AOT applications. Learn more in this blog post.

AWS Step Functions – Now supports cross-account access for more than 220 AWS services to process data, automate IT and business processes, and build applications across multiple accounts. Learn more in this blog post.

AWS Fargate – Adds the ability to monitor the utilization of the ephemeral storage attached to an Amazon ECS task. You can track the storage utilization with Amazon CloudWatch Container Insights and ECS Task Metadata endpoint.

AWS Proton – Now has a centralized dashboard for all resources deployed and managed by AWS Proton, which you can learn more about in this blog post. You can now also specify custom commands to provision infrastructure from templates. In this way, you can manage templates defined using the AWS Cloud Development Kit (AWS CDK) and other templating and provisioning tools. More on CDK support and AWS CodeBuild provisioning can be found in this blog post.

AWS IAM – You can now use more than one multi-factor authentication (MFA) device for root account users and IAM users in your AWS accounts. More information is available in this post.

Amazon ElastiCache – You can now use IAM authentication to access Redis clusters. With this new capability, IAM users and roles can be associated with ElastiCache for Redis users to manage their cluster access.

Amazon WorkSpaces – You can now use version 2.0 of the WorkSpaces Streaming Protocol (WSP) host agent that offers significant streaming quality and performance improvements, and you can learn more in this blog post. Also, with Amazon WorkSpaces Multi-Region Resilience, you can implement business continuity solutions that keep users online and productive with less than 30-minute recovery time objective (RTO) in another AWS Region during disruptive events. More on multi-region resilience is available in this post.

Amazon CloudWatch RUM – You can now send custom events (in addition to predefined events) for better troubleshooting and application specific monitoring. In this way, you can monitor specific functions of your application and troubleshoot end user impacting issues unique to the application components.

AWS AppSync – You can now define GraphQL API resolvers using JavaScript. You can also mix functions written in JavaScript and Velocity Template Language (VTL) inside a single pipeline resolver. To simplify local development of resolvers, AppSync released two new NPM libraries and a new API command. More info can be found in this blog post.

AWS SDK for SAP ABAP – This new SDK makes it easier for ABAP developers to modernize and transform SAP-based business processes and connect to AWS services natively using the SAP ABAP language. Learn more in this blog post.

AWS CloudFormation – CloudFormation can now send event notifications via Amazon EventBridge when you create, update, or delete a stack set.

AWS Console – With the new Applications widget on the Console home, you have one-click access to applications in AWS Systems Manager Application Manager and their resources, code, and related data. From Application Manager, you can view the resources that power your application and your costs using AWS Cost Explorer.

AWS Amplify – Expands Flutter support (developer preview) to Web and Desktop for the API, Analytics, and Storage use cases. You can now build cross-platform Flutter apps with Amplify that target iOS, Android, Web, and Desktop (macOS, Windows, Linux) using a single codebase. Learn more on Flutter Web and Desktop support for AWS Amplify in this post. Amplify Hosting now supports fully managed CI/CD deployments and hosting for server-side rendered (SSR) apps built using Next.js 12 and 13. Learn more in this blog post and see how to deploy a NextJS 13 app with the AWS CDK here.

Amazon SQS – With attribute-based access control (ABAC), you can define permissions based on tags attached to users and AWS resources. With this release, you can now use tags to configure access permissions and policies for SQS queues. More details can be found in this blog.

AWS Well-Architected Framework – The latest version of the Data Analytics Lens is now available. The Data Analytics Lens is a collection of design principles, best practices, and prescriptive guidance to help you running analytics on AWS.

AWS Organizations – You can now manage accounts, organizational units (OUs), and policies within your organization using CloudFormation templates.

For a full list of AWS announcements, be sure to keep an eye on the What’s New at AWS page.

Other AWS News
A few more stuff you might have missed:

Introducing our final AWS Heroes of the year – As the end of 2022 approaches, we are recognizing individuals whose enthusiasm for knowledge-sharing has a real impact with the AWS community. Please meet them here!

The Distributed Computing ManifestoWerner Vogles, VP & CTO at Amazon.com, shared the Distributed Computing Manifesto, a canonical document from the early days of Amazon that transformed the way we built architectures and highlights the challenges faced at the end of the 20th century.

AWS re:Post – To make this community more accessible globally, we expanded the user experience to support five additional languages. You can now interact with AWS re:Post also using Traditional Chinese, Simplified Chinese, French, Japanese, and Korean.

For AWS open-source news and updates, here’s the latest newsletter curated by Ricardo to bring you the most recent updates on open-source projects, posts, events, and more.

Upcoming AWS Events
As usual, there are many opportunities to meet:

AWS re:Invent – Our yearly event is next week from November 28 to December 2. If you can’t be there in person, get your free online pass to watch live the keynotes and the leadership sessions.

AWS Community DaysAWS Community Day events are community-led conferences to share and learn together. Join us in Sri Lanka (on December 6-7), Dubai, UAE (December 10), Pune, India (December 10), and Ahmedabad, India (December 17).

That’s all from me for this week. Next week we’ll focus on re:Invent, and then we’ll take a short break. We’ll be back with the next Week in Review on December 12!

Danilo