Tag Archives: AWS CloudFormation

Govern CI/CD best practices via AWS Service Catalog

Post Syndicated from César Prieto Ballester original https://aws.amazon.com/blogs/devops/govern-ci-cd-best-practices-via-aws-service-catalog/

Introduction

AWS Service Catalog enables organizations to create and manage Information Technology (IT) services catalogs that are approved for use on AWS. These IT services can include resources such as virtual machine images, servers, software, and databases to complete multi-tier application architectures. AWS Service Catalog lets you centrally manage deployed IT services and your applications, resources, and metadata , which helps you achieve consistent governance and meet your compliance requirements. In addition,  this configuration enables users to quickly deploy only approved IT services.

In large organizations, as more products are created, Service Catalog management can become exponentially complicated when different teams work on various products. The following solution simplifies Service Catalog products provisioning by considering elements such as shared accounts, roles, or users who can run portfolios or tags in the form of best practices via Continuous Integrations and Continuous Deployment (CI/CD) patterns.

This post demonstrates how Service Catalog Products can be delivered by taking advantage of the main benefits of CI/CD principles along with reducing complexity required to sync services. In this scenario, we have built a CI/CD Pipeline exclusively using AWS Services and the AWS Cloud Development Kit (CDK) Framework to provision the necessary Infrastructure.

Customers need the capability to consume services in a self-service manner, with services built on patterns that follow best practices, including focus areas such as compliance and security. The key tenants for these customers are: the use of infrastructure as code (IaC), and CI/CD. For these reasons, we built a scalable and automated deployment solution covered in this post.Furthermore, this post is also inspired from another post from the AWS community, Building a Continuous Delivery Pipeline for AWS Service Catalog.

Solution Overview

The solution is built using a unified AWS CodeCommit repository with CDK v1 code, which manages and deploys the Service Catalog Product estate. The solution supports the following scenarios: 1) making Products available to accounts and 2) provisioning these Products directly into accounts. The configuration provides flexibility regarding which components must be deployed in accounts as opposed to making a collection of these components available to account owners/users who can in turn build upon and provision them via sharing.

Figure shows the pipeline created comprised of stages

The pipeline created is comprised of the following stages:

  1. Retrieving the code from the repository
  2. Synthesize the CDK code to transform it into a CloudFormation template
  3. Ensure the pipeline is defined correctly
  4. Deploy and/or share the defined Portfolios and Products to a hub account or multiple accounts

Deploying and using the solution

Deploy the pipeline

We have created a Python AWS Cloud Development Kit (AWS CDK) v1 application hosted in a Git Repository. Deploying this application will create the required components described in this post. For a list of the deployment prerequisites, see the project README.

Clone the repository to your local machine. Then, bootstrap and deploy the CDK stack following the next steps.

git clone https://github.com/aws-samples/aws-cdk-service-catalog-pipeline
cd aws-cdk-service-catalog
pip install -r requirements.txt
cdk bootstrap aws://account_id/eu-west-1
cdk deploy

The infrastructure creation takes around 3-5 minutes to complete deploying the AWS CodePipelines and repository creation. Once CDK has deployed the components, you will have a new empty repository where we will define the target Service Catalog estate. To do so, clone the new repository and push our sample code into it:

git clone https://git-codecommit.eu-west-1.amazonaws.com/v1/repos/service-catalog-repo
git checkout -b main
cd service-catalog-repo
cp -aR ../cdk-service-catalog-pipeline/* .
git add .
git commit -am "First commit"
git push origin main

Review and update configuration

Our cdk.json file is used to manage context settings such as shared accounts, permissions, region to deploy, etc.

shared_accounts_ecs: AWS account IDs where the ECS portfolio will be shared
shared_accounts_storage: AWS account IDs where the Storage portfolio will be shared
roles: ARN for the roles who will have permissions to access to the Portfolio
users: ARN for the users who will have permissions to access to the Portfolio
groups: ARN for the groups who will have permissions to access to the Portfolio
hub_account: AWS account ID where the Portfolio will be created
pipeline_account: AWS account ID where the main Infrastructure Pipeline will be created
region: the AWS region to be used for the deployment of the account
"shared_accounts_ecs":["012345678901","012345678902"],
    "shared_accounts_storage":["012345678901","012345678902"],
    "roles":[],
    "users":[],
    "groups":[],
    "hub_account":"012345678901",
    "pipeline_account":"012345678901",
    "region":"eu-west-1"

There are two mechanisms that can be used to create Service Catalog Products in this solution: 1) providing a CloudFormation template or 2) declaring a CDK stack (that will be transformed as part of the pipeline). Our sample contains two Products, each demonstrating one of these options: an Amazon Elastic Container Services (ECS) deployment and an Amazon Simple Storage Service (S3) product.

These Products are automatically shared with accounts specified in the shared_accounts_storage variable. Each product is managed by a CDK Python file in the cdk_service_catalog folder.

Figure shows Pipeline stages that AWS CodePipeline runs through

Figure shows Pipeline stages that AWS CodePipeline runs through

Figure shows Pipeline stages that AWS CodePipeline runs through

The Pipeline stages that AWS CodePipeline runs through are as follows:

  1. Download the AWS CodeCommit code
  2. Synthesize the CDK code to transform it into a CloudFormation template
  3. Auto-modify the Pipeline in case you have made manual changes to it
  4. Display the different Portfolios and Products associated in a Hub account in a Region or in multiple accounts

Adding new Portfolios and Products

To add a new Portfolio to the Pipeline, we recommend creating a new class under cdk_service_catalog similar to cdk_service_catalog_ecs_stack.py from our sample. Once the new class is created with the products you wish to associate, we instantiate the new class inside cdk_pipelines.py, and then add it inside the wave in the stage. There are two ways to create portfolio products. The first one is by creating a CloudFormation template, as can be seen in the Amazon Elastic Container Service (ECS) example.  The second way is by creating a CDK stack that will be transformed into a template, as can be seen in the Storage example.

Product and Portfolio definition:

class ECSCluster(servicecatalog.ProductStack):
    def __init__(self, scope, id):
        super().__init__(scope, id)
        # Parameters for the Product Template
        cluster_name = cdk.CfnParameter(self, "clusterName", type="String", description="The name of the ECS cluster")
        container_insights_enable = cdk.CfnParameter(self, "container_insights", type="String",default="False",allowed_values=["False","True"],description="Enable Container Insights")
        vpc = cdk.CfnParameter(self, "vpc", type="AWS::EC2::VPC::Id", description="VPC")
        ecs.Cluster(self,"ECSCluster_template", enable_fargate_capacity_providers=True,cluster_name=cluster_name.value_as_string,container_insights=bool(container_insights_enable.value_as_string),vpc=vpc)
              cdk.Tags.of(self).add("key", "value")

Clean up

The following will help you clean up all necessary parts of this post: After completing your demo, feel free to delete your stack using the CDK CLI:

cdk destroy --all

Conclusion

In this post, we demonstrated how Service Catalog deployments can be accelerated by building a CI/CD pipeline using self-managed services. The Portfolio & Product estate is defined in its entirety by using Infrastructure-as-Code and automatically deployed based on your configuration. To learn more about AWS CDK Pipelines or AWS Service Catalog, visit the appropriate product documentation.

Authors:


César Prieto Ballester

César Prieto Ballester is a Senior DevOps Consultant at AWS. He enjoys automating everything and building infrastructure using code. Apart from work, he plays electric guitar and loves riding his mountain bike.

Daniel Mutale

Daniel Mutale is a Cloud Infrastructure Architect at AWS Professional Services. He enjoys creating cloud based architectures and building out the underlying infrastructure to support the architectures using code. Apart from work, he is an avid animal photographer and has a passion for interior design.

Raphael Sack

Raphael is a technical business development manager for Service Catalog & Control Tower. He enjoys tinkering with automation and code and active member of the management tools community.

Leverage DevOps Guru for RDS to detect anomalies and resolve operational issues

Post Syndicated from Kishore Dhamodaran original https://aws.amazon.com/blogs/devops/leverage-devops-guru-for-rds-to-detect-anomalies-and-resolve-operational-issues/

The Relational Database Management System (RDBMS) is a popular choice among organizations running critical applications that supports online transaction processing (OLTP) use-cases. But managing the RDBMS database comes with its own challenges. AWS has made it easier for organizations to operate these databases in the cloud, thereby addressing the undifferentiated heavy lifting with managed databases (Amazon Aurora, Amazon RDS). Although using managed services has freed up engineering from provisioning hardware, database setup, patching, and backups, they still face the challenges that come with running a highly performant database. As applications scale in size and sophistication, it becomes increasingly challenging for customers to detect and resolve relational database performance bottlenecks and other operational issues quickly.

Amazon RDS Performance Insights is a database performance tuning and monitoring feature, that lets you quickly assess your database load and determine when and where to take action. Performance Insights lets non-experts in database administration diagnose performance problems with an easy-to-understand dashboard that visualizes database load. Furthermore, Performance Insights expands on the existing Amazon RDS monitoring features to illustrate database performance and help analyze any issues that affect it. The Performance Insights dashboard also lets you visualize the database load and filter the load by waits, SQL statements, hosts, or users.

On Dec 1st, 2021, we announced Amazon DevOps Guru for RDS, a new capability for Amazon DevOps Guru. It’s a fully-managed machine learning (ML)-powered service that detects operational and performance related issues for Amazon Aurora engines. It uses the data that it collects from Performance Insights, and then automatically detects and alerts customers of application issues, including database problems. When DevOps Guru detects an issue in an RDS database, it publishes an insight in the DevOps Guru dashboard. The insight contains an anomaly for the resource AWS/RDS. If DevOps Guru for RDS is turned on for your instances, then the anomaly contains a detailed analysis of the problem. DevOps Guru for RDS also recommends that you perform an investigation, or it provides a specific corrective action. For example, the recommendation might be to investigate a specific high-load SQL statement or to scale database resources.

In this post, we’ll deep-dive into some of the common issues that you may encounter while running your workloads against Amazon Aurora MySQL-Compatible Edition databases, with simulated performance issues. We’ll also look at how DevOps Guru for RDS can help identify and resolve these issues. Simulating a performance issue is resource intensive, and it will cost you money to run these tests. If you choose the default options that are provided, and clean up your resources using the following clean-up instructions, then it will cost you approximately $15 to run the first test only. If you wish to run all of the tests, then you can choose “all” in the Tests parameter choice. This will cost you approximately $28 to run all three tests.

Prerequisites

To follow along with this walkthrough, you must have the following prerequisites:

  • An AWS account with a role that has sufficient access to provision the required infrastructure. The account should also not have exceeded its quota for the resources being deployed (VPCs, Amazon Aurora, etc.).
  • Credentials that enable you to interact with your AWS account.
  • If you already have Amazon DevOps Guru turned on, then make sure that it’s tagged properly to detect issues for the resource being deployed.

Solution overview

You will clone the project from GitHub and deploy an AWS CloudFormation template, which will set up the infrastructure required to run the tests. If you choose to use the defaults, then you can run only the first test. If you would like to run all of the tests, then choose the “all” option under Tests parameter.

We simulate some common scenarios that your database might encounter when running enterprise applications. The first test simulates locking issues. The second test simulates the behavior when the AUTOCOMMIT property of the database driver is set to: True. This could result in statement latency. The third test simulates performance issues when an index is missing on a large table.

Solution walk through

Clone the repo and deploy resources

  1. Utilize the following command to clone the GitHub repository that contains the CloudFormation template and the scripts necessary to simulate the database load. Note that by default, we’ve provided the command to run only the first test.
    git clone https://github.com/aws-samples/amazon-devops-guru-rds.git
    cd amazon-devops-guru-rds
    
    aws cloudformation create-stack --stack-name DevOpsGuru-Stack \
        --template-body file://DevOpsGuruMySQL.yaml \
        --capabilities CAPABILITY_IAM \
        --parameters ParameterKey=Tests,ParameterValue=one \
    ParameterKey=EnableDevOpsGuru,ParameterValue=y

    If you wish to run all four of the tests, then flip the ParameterValue of the Tests ParameterKey to “all”.

    If Amazon DevOps Guru is already enabled in your account, then change the ParameterValue of the EnableDevOpsGuru ParameterKey to “n”.

    It may take up to 30 minutes for CloudFormation to provision the necessary resources. Visit the CloudFormation console (make sure to choose the region where you have deployed your resources), and make sure that DevOpsGuru-Stack is in the CREATE_COMPLETE state before proceeding to the next step.

  2. Navigate to AWS Cloud9, then choose Your environments. Next, choose DevOpsGuruMySQLInstance followed by Open IDE. This opens a cloud-based IDE environment where you will be running your tests. Note that in this setup, AWS Cloud9 inherits the credentials that you used to deploy the CloudFormation template.
  3. Open a new terminal window which you will be using to clone the repository where the scripts are located.

  1. Clone the repo into your Cloud9 environment, then navigate to the directory where the scripts are located, and run initial setup.
git clone https://github.com/aws-samples/amazon-devops-guru-rds.git
cd amazon-devops-guru-rds/scripts
sh setup.sh 
# NOTE: If you are running all test cases, use sh setup.sh all command instead. 
source ~/.bashrc
  1. Initialize databases for all of the test cases, and add random data into them. The script to insert random data takes approximately five hours to complete. Your AWS Cloud9 instance is set up to run for up to 24 hours before shutting down. You can exit the browser and return between 5–24 hours to validate that the script ran successfully, then continue to the next step.
source ./connect.sh test 1
USE devopsgurusource;
CREATE TABLE IF NOT EXISTS test1 (id int, filler char(255), timer timestamp);
exit;
python3 ct.py

If you chose to run all test cases, and you ran the sh setup.sh all command in Step 4, open two new terminal windows and run the following commands to insert random data for test cases 2 and 3.

# Test case 2 – Open a new terminal window to run the commands
cd amazon-devops-guru-rds/scripts
source ./connect.sh test 2
USE devopsgurusource;
CREATE TABLE IF NOT EXISTS test1 (id int, filler char(255), timer timestamp);
exit;
python3 ct.py
# Test case 3 - Open a new terminal window to run the commands
cd amazon-devops-guru-rds/scripts
source ./connect.sh test 3
USE devopsgurusource;
CREATE TABLE IF NOT EXISTS test1 (id int, filler char(255), timer timestamp);
exit;
python3 ct.py
  1. Return between 5-24 hours to run the next set of commands.
  1. Add an index to the first database.
source ./connect.sh test 1
CREATE UNIQUE INDEX test1_pk ON test1(id);
INSERT INTO test1 VALUES (-1, 'locker', current_timestamp);
exit;
  1. If you chose to run all test cases, and you ran the sh setup.sh all command in Step 4, add an index to the second database. NOTE: Do no add an index to the third database.
source ./connect.sh test 2
CREATE UNIQUE INDEX test1_pk ON test1(id);
INSERT INTO test1 VALUES (-1, 'locker', current_timestamp);
exit;

DevOps Guru for RDS uses Performance Insights, and it establishes a baseline for the database metrics. Baselining involves analyzing the database performance metrics over a period of time to establish a “normal” behavior. DevOps Guru for RDS then uses ML to detect anomalies against the established baseline. If your workload pattern changes, then DevOps Guru for RDS establishes a new baseline that it uses to detect anomalies against the new “normal”. For new database instances, DevOps Guru for RDS takes up to two days to establish an initial baseline, as it requires an analysis of the database usage patterns and establishing what is considered a normal behavior.

  1. Allow two days before you start running the following tests.

Scenario 1: Locking Issues

In this scenario, multiple sessions compete for the same (“locked”) record, and they must wait for each other.
In real life, this often happens when:

  • A database session gets disconnected due to a (i.e., temporary network) malfunction, while still holding a critical lock.
  • Other sessions become stuck while waiting for the lock to be released.
  • The problem is often exacerbated by the application connection manager that keeps spawning additional sessions (because the existing sessions don’t complete the work on time), thus creating a distinct “inclined slope” pattern that you’ll see in this scenario.

Here’s how you can reproduce it:

  1. Connect to the database.
cd amazon-devops-guru-rds/scripts
source ./connect.sh test 1
  1. In your MySQL, enter the following SQL, and don’t exit the shell.
START TRANSACTION;
UPDATE test1 SET timer=current_timestamp WHERE id=-1;
-- Do NOT exit!
  1. Open a new terminal, and run the command to simulate competing transactions. Give it approximately five minutes before you run the commands in this step.
cd amazon-devops-guru-rds/scripts
source ./connect.sh test 1
exit;
python3 locking_scenario.py 1 1200 2
  1. After the program completes its execution, navigate to the Amazon DevOps Guru console, choose Insights, and then choose RDS DB Load Anomalous. You’ll notice a summary of the insight under Description.

Shows navigation to Amazon DevOps Guru Insights and RDS DB Load Anomalous screen to find the summary description of the anomaly.

  1. Choose the View Recommendations link on the top right, and observe the databases for which it’s showing the recommendations.
  2. Next, choose View detailed analysis for database performance anomaly for the following resources.
  3. Under To view a detailed analysis, choose a resource name, choose the database associated with the first test.

 Shows the detailed analysis of the database performance anomaly. The database experiencing load is chosen, and a graphical representation of how the Average active sessions (AAS) spikes, which Amazon DevOps Guru is able to identify.

  1. Observe the recommendations under Analysis and recommendations. It provides you with analysis, recommendations, and links to troubleshooting documentation.

Shows a different section of the detailed analysis screen that provides Analysis and recommendations and links to the troubleshooting documentation.

In this example, DevOps Guru for RDS has detected a high and unusual spike of database load, and then marked it as “performance anomaly”.

Note that the relative size of the anomaly is significant: 490 times higher than the “typical” database load, which is why it’s deemed: “HIGH severity”.

In the analysis section, note that a single “wait event”, wait/synch/mutex/innodb/aurora_lock_thread_slot_futex, is dominating the entire spike. Moreover, a single SQL is “responsible” (or more precisely: “suffering”) from this wait event at the time of the problem. Select the wait event name and see a simple explanation of what’s happening in the database. For example, it’s “record locking”, where multiple sessions are competing for the same database records. Additionally, you can select the SQL hash and see the exact text of the SQL that’s responsible for the issue.

If you’re interested in why DevOps Guru for RDS detected this problem, and why these particular wait events and an SQL were selected, the Why is this a problem? and Why do we recommend this? links will provide the answer.

Finally, the most relevant part of this analysis is a View troubleshooting doc link. It references a document that contains a detailed explanation of the likely causes for this problem, as well as the actions that you can take to troubleshoot and address it.

Scenario 2: Autocommit: ON

In this scenario, we must run multiple batch updates, and we’re using a fairly popular driver setting: AUTOCOMMIT: ON.

This setting can sometimes lead to performance issues as it causes each UPDATE statement in a batch to be “encased” in its own “transaction”. This leads to data changes being frequently synchronized to disk, thus dramatically increasing batch latency.

Here’s how you can reproduce the scenario:

  1. On your Cloud9 terminal, run the following commands:
cd amazon-devops-guru-rds/scripts
source ./connect.sh test 2
exit;
python3 batch_autocommit.py 50 1200 1000 10000000
  1. Once the program completes its execution, or after an hour, navigate to the Amazon DevOps Guru console, choose Insights, and then choose RDS DB Load Anomalous. Then choose Recommendations and choose View detailed analysis for database performance anomaly for the following resources. Under To view a detailed analysis, choose a resource name, choose the database associated with the second test.

  1. Observe the recommendations under Analysis and recommendations. It provides you with analysis, recommendations, and links to troubleshooting documentation.

Shows a different section of the detailed analysis screen that provides Analysis and recommendations and links to the troubleshooting documentation.

Note that DevOps Guru for RDS detected a significant (and unusual) spike of database load and marked it as a HIGH severity anomaly.

The spike looks similar to the previous example (albeit, “smaller”), but it describes a different database problem (“COMMIT slowdowns”). This is because of a different database wait event that dominates the spike: wait/io/aurora_redo_log_flush.

As in the previous example, you can select the wait event name to see a simple description of what’s going on, and you can select the SQL hash to see the actual statement that is slow. Furthermore, just as before, the View troubleshooting doc link references the document that describes what you can do to troubleshoot the problem further and address it.

Scenario 3: Missing index

Have you ever wondered what would happen if you drop a frequently accessed index on a large table?

In this relatively simple scenario, we’re testing exactly that – an index gets dropped causing queries to switch from fast index lookups to slow full table scans, thus dramatically increasing latency and resource use.

Here’s how you can reproduce this problem and see it for yourself:

  1. On your Cloud9 terminal, run the following commands:
cd amazon-devops-guru-rds/scripts
source ./connect.sh test 3
exit;
python3 no_index.py 50 1200 1000 10000000
  1. Once the program completes its execution, or after an hour, navigate to the Amazon DevOps Guru console, choose Insights, and then choose RDS DB Load Anomalous. Then choose Recommendations and choose View detailed analysis for database performance anomaly for the following resources. Under To view a detailed analysis, choose a resource name, choose the database associated with the third test.

Shows the detailed analysis of the database performance anomaly. The database experiencing load is chosen and a graphical representation of how the Average active sessions (AAS) spikes which Amazon DevOps Guru is able to identify.

  1. Observe the recommendations under Analysis and recommendations. It provides you with analysis, recommendations, and links to troubleshooting documentation.

Shows a different section of the detailed analysis screen that provides Analysis and recommendations and links to the troubleshooting documentation.

As with the previous examples, DevOps Guru for RDS detected a high and unusual spike of database load (in this case, ~ 50 times larger than the “typical” database load). It also identified that a single wait event, wait/io/table/sql/handler, and a single SQL, are responsible for this issue.

The analysis highlights the SQL that you must pay attention to, and it links a detailed troubleshooting document that lists the likely causes and recommended actions for the problems that you see. While it doesn’t tell you that the “missing index” is the real root cause of the issue (this is planned in future versions), it does offer many relevant details that can help you come to that conclusion yourself.

Cleanup

On your terminal where you originally ran the AWS Command Line Interface (AWS CLI) command to create the CloudFormation resources, run the following command:

aws cloudformation delete-stack --stack-name DevOpsGuru-Stack

Conclusion

In this post, you learned how to leverage DevOps Guru for RDS to alert you of any operational issues with recommendations. You simulated some of the commonly encountered, real-world production issues, such as locking contentions, AUTOCOMMIT, and missing indexes. Moreover, you saw how DevOps Guru for RDS helped you detect and resolve these issues. Try this out, and let us know how DevOps Guru for RDS was able to address your use-case.

Authors:

Kishore Dhamodaran

Kishore Dhamodaran is a Senior Solutions Architect at AWS. Kishore helps strategic customers with their cloud enterprise strategy and migration journey, leveraging his years of industry and cloud experience.

Simsek Mert

Simsek Mert is a Cloud Application Architect with AWS Professional Services.
Simsek helps customers with their application architecture, containers, serverless applications, leveraging his over 20 years of experience.

Maxym Kharchenko

Maxym Kharchenko is a Principal Database Engineer at AWS. He builds automated monitoring tools that use machine learning to discover and explain performance problems in relational databases.

Jared Keating

Jared Keating is a Senior Cloud Consultant with Amazon Web Services Professional Services. Jared assists customers with their cloud infrastructure, compliance, and automation requirements drawing from his over 20 years of experience in IT.

How to unit test and deploy AWS Glue jobs using AWS CodePipeline

Post Syndicated from Praveen Kumar Jeyarajan original https://aws.amazon.com/blogs/devops/how-to-unit-test-and-deploy-aws-glue-jobs-using-aws-codepipeline/

This post is intended to assist users in understanding and replicating a method to unit test Python-based ETL Glue Jobs, using the PyTest Framework in AWS CodePipeline. In the current practice, several options exist for unit testing Python scripts for Glue jobs in a local environment. Although a local development environment may be set up to build and unit test Python-based Glue jobs, by following the documentation, replicating the same procedure in a DevOps pipeline is difficult and time consuming.

Unit test scripts are one of the initial quality gates used by developers to provide a high-quality build. One must reuse these scripts during regression testing to make sure that all of the existing functionality is intact, and that new releases don’t disrupt key application functionality. The majority of the regression test suites are expected to be integrated with the DevOps Pipeline for its execution. Unit testing an application code is a fundamental task that evaluates  whether each (unit) code written by a programmer functions as expected. Unit testing of code provides a mechanism to determine that software quality hasn’t been compromised. One of the difficulties in building Python-based Glue ETL tasks is their ability for unit testing to be incorporated within DevOps Pipeline, especially when there are modernization of mainframe ETL process to modern tech stacks in AWS

AWS Glue is a serverless data integration service that makes it easy to discover, prepare, and combine data for analytics, machine learning (ML), and application development. AWS Glue provides all of the capabilities needed for data integration. This means that you can start analyzing your data and putting it to use in minutes rather than months. AWS Glue provides both visual and code-based interfaces to make data integration easier.

Prerequisites

GitHub Repository

Amazon ECR Image URI for Glue Library

Solution overview

A typical enterprise-scale DevOps pipeline is illustrated in the following diagram. This solution describes how to incorporate the unit testing of Python-based AWS Glue ETL processes into the AWS DevOps Pipeline.

Figure 1 Solution Overview

The GitHub repository aws-glue-jobs-unit-testing has a sample Python-based Glue job in the src folder. Its associated unit test cases built using the Pytest Framework are accessible in the tests folder. An AWS CloudFormation template written in YAML is included in the deploy folder. As a runtime environment, AWS CodeBuild utilizes custom container images. This feature is used to build a project utilizing Glue libraries from Public ECR repository, that can run the code package to demonstrate unit testing integration.

Solution walkthrough

Time to read  7 min
Time to complete  15-20 min
Learning level  300
Services used
AWS CodePipeline, AWS CodeCommit, AWS CodeBuild, Amazon Elastic Container Registry (Amazon ECR) Public Repositories, AWS CloudFormation

The container image at the Public ECR repository for AWS Glue libraries includes all of the binaries required to run PySpark-based AWS Glue ETL tasks locally, as well as unit test them. The public container repository has three image tags, one for each AWS Glue version supported by AWS Glue. To demonstrate the solution, we use the image tag glue_libs_3.0.0_image_01 in this post. To utilize this container image as a runtime image in CodeBuild, copy the Image URI corresponding to the image tag that you intend to use, as shown in the following image.

Figure 2 Select Glue Library from Public ECR

The aws-glue-jobs-unit-testing GitHub repository contains a CloudFormation template, pipeline.yml, which deploys a CodePipeline with CodeBuild projects to create, test, and publish the AWS Glue job. As illustrated in the following, use the copied image URL from Amazon ECR public to create and test a CodeBuild project.

  TestBuild:
    Type: AWS::CodeBuild::Project
    Properties:
      Artifacts:
        Type: CODEPIPELINE
      BadgeEnabled: false
      Environment:
        ComputeType: BUILD_GENERAL1_LARGE
        Image: "public.ecr.aws/glue/aws-glue-libs:glue_libs_3.0.0_image_01"
        ImagePullCredentialsType: CODEBUILD
        PrivilegedMode: false
        Type: LINUX_CONTAINER
      Name: !Sub "${RepositoryName}-${BranchName}-build"
      ServiceRole: !GetAtt CodeBuildRole.Arn  

The pipeline performs the following operations:

  1. It uses the CodeCommit repository as the source and transfers the most recent code from the main branch to the CodeBuild project for further processing.
  2. The following stage is build and test, in which the most recent code from the previous phase is unit tested and the test report is published to CodeBuild report groups.
  3. If all of the test results are good, then the next CodeBuild project is launched to publish the code to an Amazon Simple Storage Service (Amazon S3) bucket.
  4. Following the successful completion of the publish phase, the final step is to deploy the AWS Glue task using the CloudFormation template in the deploy folder.

Deploying the solution

Set up

Now we’ll deploy the solution using a CloudFormation template.

  • Using the GitHub Web, download the code.zip file from the aws-glue-jobs-unit-testing repository. This zip file contains the GitHub repository’s src, tests, and deploy folders. You may also create the zip file yourself using command-line tools, such as git and zip. To create the zip file on Linux or Mac, open the terminal and enter the following commands.
git clone https://github.com/aws-samples/aws-glue-jobs-unit-testing.git
cd aws-glue-jobs-unit-testing
git checkout master
zip -r code.zip src/ tests/ deploy/
  • Sign in to the AWS Management Console and choose the AWS Region of your choice.
  • Create an Amazon S3 bucket. For more information, see How Do I Create an S3 Bucket? in the AWS documentation.
  • Upload the downloaded zip package, code.zip, to the Amazon S3 bucket that you created.

In this example, I created an Amazon S3 bucket named aws-glue-artifacts-us-east-1 in the N. Virginia (us-east-1) Region, and used the console to upload the zip package from the GitHub repository to the Amazon S3 bucket.

Figure 3 Upload code.zip file to S3 bucket

Creating the stack

  1.  In the CloudFormation console, choose Create stack.
  2. On the Specify template page, choose Upload a template file, and then choose the pipeline.yml template, downloaded from the GitHub repository

Figure 4 Upload pipeline.yml template to create a new CloudFormation stack

  1. Specify the following parameters:.
  • Stack name: glue-unit-testing-pipeline (Choose a stack name of your choice)
  • ApplicationStackName: glue-codepipeline-app (This is the name of the CloudFormation stack that will be created by the pipeline)
  • BranchName: master (This is the name of the branch to be created in the CodeCommit repository to check-in the code from the Amazon S3 bucket zip file)
  • BucketName: aws-glue-artifacts-us-east-1 (This is the name of the Amazon S3 bucket that contains the zip file. This bucket will also be used by the pipeline for storing code artifacts)
  • CodeZipFile: lambda.zip (This is the key name of the sample code Amazon S3 object. The object should be a zip file)
  • RepositoryName: aws-glue-unit-testing (This is the name of the CodeCommit repository that will be created by the stack)
  • TestReportGroupName: glue-unittest-report (This is the name of the CodeBuild test report group that will be created to store the unit test reports)

Figure 5 Fill parameters for stack creation

  1. Choose Next, and again Next.
  1. On the Review page, under Capabilities, choose the following options:
  • I acknowledge that CloudFormation might create IAM resources with custom names.

Figure 6 Acknowledge IAM roles creation

  1. Choose Create stack to begin the stack creation process. Once the stack creation is complete, the resources that were created are displayed on the Resources tab. The stack creation takes approximately 5-7 minutes.

Figure 7 Successful completion of stack creation

The stack automatically creates a CodeCommit repository with the initial code checked-in from the zip file uploaded to the Amazon S3 bucket. Furthermore, it creates a CodePipeline view using the CodeCommit repository as the source. In the above example, the CodeCommit repository is aws-glue-unit-test, and the pipeline is aws-glue-unit-test-pipeline.

Testing the solution

To test the deployed pipeline, open the CodePipeline console and select the pipeline created by the CloudFormation stack. Select the Release Change button on the pipeline page.

Figure 8 Choose Release Change on pipeline page

The pipeline begins its execution with the most recent code in the CodeCommit repository.

When the Test_and_Build phase is finished, select the Details link to examine the execution logs.

Figure 9 Successfully completed the Test_and_Build stage

Select the Reports tab, and choose the test report from Report history to view the unit execution results.

Figure 10 Test report from pipeline execution

Finally, after the deployment stage is complete, you can see, run, and monitor the deployed AWS Glue job on the AWS Glue console page. For more information, refer to the Running and monitoring AWS Glue documentation

Figure 11 Successful pipeline execution

Cleanup

To avoid additional infrastructure costs, make sure that you delete the stack after experimenting with the examples provided in the post. On the CloudFormation console, select the stack that you created, and then choose Delete. This will delete all of the resources that it created, including CodeCommit repositories, IAM roles/policies, and CodeBuild projects.

Summary

In this post, we demonstrated how to unit test and deploy Python-based AWS Glue jobs in a pipeline with unit tests written with the PyTest framework. The approach is not limited to CodePipeline, and it can be used to build up a local development environment, as demonstrated in the Big Data blog. The aws-glue-jobs-unit-testing GitHub repository contains the example’s CloudFormation template, as well as sample AWS Glue Python code and Pytest code used in this post. If you have any questions or comments regarding this example, please open an issue or submit a pull request.

Authors:

Praveen Kumar Jeyarajan

Praveen Kumar Jeyarajan is a PraveenKumar is a Senior DevOps Consultant in AWS supporting Enterprise customers and their journey to the cloud. He has 11+ years of DevOps experience and is skilled in solving myriad technical challenges using the latest technologies. He holds a Masters degree in Software Engineering. Outside of work, he enjoys watching movies and playing tennis.

Vaidyanathan Ganesa Sankaran

Vaidyanathan Ganesa Sankaran is a Sr Modernization Architect at AWS supporting Global Enterprise customers on their journey towards modernization. He is specialized in Artificial intelligence, legacy Modernization and Cloud Computing. He holds a Masters degree in Software Engineering and has 12+ years of Modernization experience. Outside work, he loves conducting training sessions for college grads and professional starter who wants to learn cloud and AI. His hobbies are playing tennis, philately and traveling.

Extend your pre-commit hooks with AWS CloudFormation Guard

Post Syndicated from Joaquin Manuel Rinaudo original https://aws.amazon.com/blogs/security/extend-your-pre-commit-hooks-with-aws-cloudformation-guard/

Git hooks are scripts that extend Git functionality when certain events and actions occur during code development. Developer teams often use Git hooks to perform quality checks before they commit their code changes. For example, see the blog post Use Git pre-commit hooks to avoid AWS CloudFormation errors for a description of how the AWS Integration and Automation team uses various pre-commit hooks to help reduce effort and errors when they build AWS Quick Starts.

This blog post shows you how to extend your Git hooks to validate your AWS CloudFormation templates against policy-as-code rules by using AWS CloudFormation Guard. This can help you verify that your code follows organizational best practices for security, compliance, and more by preventing you from commit changes that fail validation rules.

We will also provide patterns you can use to centrally maintain a list of rules that security teams can use to roll out new security best practices across an organization. You will learn how to configure a pre-commit framework by using an example repository while you store Guard rules in both a central Amazon Simple Storage Service (Amazon S3) bucket or in versioned code repositories (such as AWS CodeCommit, GitHub, Bitbucket, or GitLab).

Prerequisites

To complete the steps in this blog post, first perform the following installations.

  1. Install AWS Command Line Interface (AWS CLI).
  2. Install the Git CLI.
  3. Install the pre-commit framework by running the following command.
    pip install pre-commit
  4. Install the Rust programming language by following these instructions.
  5. (Windows only) Install the version of Microsoft Visual C++ Build Tools 2019 that provides just the Visual C++ build tools. 

Solution walkthrough

In this section, we walk you through an exercise to extend a Java service on an Amazon EKS example repository with Git hooks by using AWS CloudFormation Guard. You can choose to upload your Guard rules in either a separate GitHub repository or your own S3 bucket.

First, download the sample repository that you will add the pre-commit framework to.

To clone the test repository

  • Clone the repo to a local directory by running the following command in your local terminal.

    git clone https://github.com/aws-samples/amazon-eks-example-for-stateful-java-service.git

Next, create Guard rules that reflect the organization’s policy-as-code best practices and store them in an S3 bucket.

To set up an S3 bucket with your Guard rules

  1. Create an S3 bucket by running the following command in the AWS CLI.

    aws s3 mb s3://<account-id>-cfn-guard-rules --region <aws-region>

    where <account-id> is the ID of the AWS account you’re using and <aws-region> is the AWS Region you want to use.

  2. (Optional) Alternatively, you can follow the Getting started with Amazon S3 tutorial to create the bucket and upload the object (as described in step 4 that follows) by using the AWS Management Console.

    When you store your Guard rules in an S3 bucket, you can make the rules accessible to other member accounts in your organization by using the aws:PrincipalOrgID condition and setting the value to your organization ID in the bucket policy.

  3. Create a file that contains a Guard rule named rules.guard, with the following content.
    let eks_cluster = Resources.* [ Type == 'AWS::EKS::Cluster' ]
    rule eks_public_disallowed when %eks_cluster !empty {
          %eks_cluster.Properties.ResourcesVpcConfig.EndpointPublicAccess == false
    }

    This rule will verify that public endpoints are disabled by checking that resources that are created by using the AWS::EKS::Cluster resource type have the EndpointPublicAccess property set to false. For more information about authoring your own rules using Guard domain-specific language (DSL), see Introducing AWS CloudFormation Guard 2.0.

  4. Upload the rule set to your S3 bucket by running the following command in the AWS CLI.

    aws s3 cp rules.guard s3://<account-id>-cfn-guard-rules/rules/rules.guard

In the next step, you will set up the pre-commit framework in the repository to run CloudFormation Guard against code changes.

To configure your pre-commit hook to use Guard

  1. Run the following command to create a new branch where you will test your changes.
    git checkout -b feature/guard-hook
  2. Navigate to the root directory of the project that you cloned earlier and create a .pre-commit-config.yaml file with the following configuration.
    repos:
      - repo: local
        hooks:
          -   id: cfn-guard-rules
              name: Rules for AWS
              description: Download Organization rules
              entry: aws s3 cp --recursive s3://<account-id>-cfn-guard-rules/rules  guard-rules/org-rules/
              language: system
              pass_filenames: false
          -   id: cfn-guard
              name: AWS CloudFormation Guard
              description: Validate code against your Guard rules
              entry: bash -c 'for template in "$@"; do cfn-guard validate -r guard-rules -d "$template" || SCAN_RESULT="FAILED"; done; if [[ "$SCAN_RESULT" = "FAILED" ]]; then exit 1; fi'
              language: rust
              files: \.(json|yaml|yml|template\.json|template)$
              additional_dependencies:
                - cli:cfn-guard

    You will need to replace the <account-id> placeholder value with the AWS account ID you entered in the To set up an S3 bucket with your Guard rules procedure.

    This hook configuration uses local pre-commit hooks to download the latest version of Guard rules from the bucket you created previously. This allows you to set up a centralized set of Guard rules across your organization.

    Alternatively, you can create and use a code repository such as GitHub, AWS CodeCommit, or Bitbucket to keep your rules in version control. To do so, replace the command in the Download Organization rules step of the .pre-commit-config.yaml file with:

    bash -c ‘if [ -d guard-rules/org-rules ]; then cd guard-rules/org-rules && git pull; else git clone <guard-rules-repository-target> guard-rules/org-rules; fi’

    Where <guard-rules-repository-target> is the HTTPS or SSH URL of your repository. This command will clone or pull the latest rules from your Git repo by using your Git credentials.

    The hook will also install Guard as an additional dependency by using a Rust hook. Using Guard, it will run the code changes in the repository directory against the downloaded rule set. When misconfigurations are detected, the hook stops the commit.

    You can further extend your organization rules with your own Guard rules by adding them to the cfn-guard-rules folder. You should commit these rules in your repository and add cfn-guard-rules/org-rules/* to your .gitignore file.

  3. Run a pre-commit install command to install the hooks you just created.

Finally, test that the pre-commit’s Guard hook fails commits of code changes that do not follow organizational best practices.

To test pre-commit hooks

  1. Add EndpointPublicAccess: true in cloudformation/eks.template.yaml, as shown following. This describes the test-only intent (meaning that you want to detect and flag errors in your rule) of adding public access to the Amazon Elastic Kubernetes Service (Amazon EKS) cluster.
      EKSCluster:
        Type: AWS::EKS::Cluster
        Properties:
          Name: java-app-demo-cluster
          ResourcesVpcConfig:
            EndpointPublicAccess: true
            SecurityGroupIds:
              - !Ref EKSControlPlaneSecurityGroup

  2. Add your changes with the git add command.

    git add .pre-commit-config.yaml

    git add cloudformation/eks.template.yaml

  3. Commit changes with the following command.

    git commit -m bad config

    You should see the following error that disallows the commit to the local repository and shows which one of your Guard rules failed.

    amazon-eks-controlplane.template.yaml Status = FAIL
    		
    FAILED rules
    		
    rules.guard/eks_public_disallowed    FAIL
    		
    ---
    		
    Evaluation of rules rules.guard against data amazon-eks-controlplane.template.yaml
    		
    ---
    		
    Property
    [/Resources/EKS/Properties/ResourcesVpcConfig/EndpointPublicAccess] in data
    [eks.template.yaml] is not compliant with [rules.guard/eks_public_disallowed] 
    because provided value [true] did not match expected value [false]. 
    Error Message []

  4. (Optional) You can also test hooks before committing by using the pre-commit run command to see similar output.

Cleanup

To avoid incurring ongoing charges, follow these cleanup steps to delete the resources and files you created as you followed along with this blog post.

To clean up resources and files

  1. Remove your local repository.
    rm -rf /path/to/repository
  2. Delete the S3 bucket you created by running the following command.
    aws s3 rb s3://<account-id>-cfn-guard-rules --force
  3. (Optional) Remove the pre-commit hooks framework by running this command.
    pip uninstall pre-commit

Conclusion

In this post, you learned how to use AWS CloudFormation Guard with the pre-commit framework locally to validate your infrastructure-as-code solutions before you push remote changes to your repositories.

You also learned how to extend the solution to use a centralized list of security rules that is stored in versioned code repositories (GitHub, Bitbucket, or GitLab) or an S3 bucket. And you learned how to further extend the solution with your own rules. You can find examples of rules to use in Guard’s Github repository or refer to write preventative compliance rules for AWS CloudFormation templates the cfn-guard way. You can then further configure other repositories to prevent misconfigurations by using the same Guard rules.

 
If you have feedback about this post, submit comments in the Comments section below. If you have questions about this post, start a new thread on the KMS re:Post or contact AWS Support.

Want more AWS Security news? Follow us on Twitter.

Author

Joaquin Manuel Rinaudo

Joaquin is a Senior Security Architect with AWS Professional Services. He is passionate about building solutions that help developers improve their software quality. Prior to AWS, he worked across multiple domains in the security industry, from mobile security to cloud and compliance related topics. In his free time, Joaquin enjoys spending time with family and reading science-fiction novels.

How MarketAxess® uses AWS Developer Tools to create scalable and secure CI/CD pipelines

Post Syndicated from Aaron Lima original https://aws.amazon.com/blogs/devops/how-marketaxess-uses-aws-developer-tools-to-create-scalable-and-secure-ci-cd-pipelines/

Very often,  enterprise organizations strive to adopt modern DevOps practices, tofocus on governance and security without sacrificing development velocity. In this guest post, Prashant Joshi, Senior Cloud Engineer at MarketAxess, explains how they use the AWS Cloud Development Kit (AWS CDK), AWS CodePipeline, and AWS CodeBuild to simplify the developer experience by dynamically provisioning pipelines and maintaining governance at MarketAxess.

Problem Statement

MarketAxess is a financial technology company that operates an e-trading platform, for institutional credit markets. As MarketAxess adopted DevOps firm-wide, we struggled to ensure pipeline consistency. We had developers using static code analysis and linting, but it wasn’t enforced. As more teams began to adopt DevOps practices, the importance of providing consistency over code quality, security scanning, and artifact management grew. However, we were challenged with increasing our engineering workforce and implementing best practices in the various pipelines. As a small team, we needed a way to reliably manage and scale pipelines while reducing engineering overhead. We thought about the DevOps tenets, as well as the importance of automation, and we decided to build automation that would provision pipelines for development teams.  These pipelines included best practices for Continuous Integration and Continuous Deployment (CI/CD). We wanted to build this automation with self-service, so that teams can get started developing a solution to a business problem, without having to spend too much time around the CI/CD aspects of their projects.

We chose the AWS CDK to deploy AWS CodePipeline, AWS CodeBuild, and AWS Identity and Access Management (IAM) resources, and used an API webhook using AWS Lambda and Amazon API Gateway for integration. In this post, we provide an example of how these services can be used to create dynamic cross account CI/CD pipelines.

Solution

In developing our solution, we wanted to accomplish three main goals:

  1. Standardization and Governance of Pipelines – We wanted to ensure consistent practices in each team’s pipeline to make sure of code quality and security.
  2. Simplified Developer Interaction – We wanted developers to focus mainly on interacting with the code repository for their project.
  3. Improve Management of Dynamically Provisioned Pipelines – Knowing that we would need to make changes, improvements, and enhancements, we wanted tools and a process that was flexible.

We achieved these goals using AWS CDK to automate the creation of CodePipeline and define mandatory actions in the pipeline. We also created a webhook using API Gateway to integrate with our Bitbucket repositories to automatically trigger the automation. The pipelines can dynamically be provisioned or updated based on the YAML manifest file submitted to the repository. We process the manifest file with Amazon Elastic Container Service (Amazon ECS) Fargate tasks, because we had containerized the processing components using Docker. However, with the release of container support in Lambda, we are now considering this as a potential replacement. These pipelines run CI stages based on the programing language defined by development teams in the manifest file, and they deploy a tested versioned artifact to the corresponding environments via standard Software Defined Lifecycle (SDLC) practices. As a part of CI stages, we semantically version our code and tag our commits accordingly. This lets us trace commit to pipeline execution. The following architecture diagram shows a CloudFormation pipeline generated via AWS CDK.

CloudFormation Pipeline Architecture Diagram

The process flow is as follows:

  1. Developer pushes a change to the repository.
  2. A webhook is triggered when the Pull Request is merged that creates or modifies the pipeline based on the manifest file submitted to the repository.
  3. This triggers a Lambda function that performs the following:
    1. Clones the repository from Internally hosted BitBucket repos.
    2. Uploads the repository to the source Amazon Simple Storage Service (Amazon S3) bucket, which is encrypted using Customer Managed Keys (CMK) with the AWS Key Management Service (KMS).
    3. An ECS Task is run, and a manifest file is passed which gives the project parameters. Pipelines are built according to these project parameters.
  4. An ECS Task processes the metadata file and runs cdk Logic, finally it triggers the pipeline.
    1. As source code is progressed through the pipeline, the build stage output to the artifact bucket. Pipeline artifacts are encrypted with a CMK. The IAM roles in the target account only have access to this bucket.

Additionally, through the power of the IAM integration with CodePipeline, the team could implement session tags with IAM roles and Okta to make sure that independent teams only approve pipelines, which are owned by respective teams. Furthermore, we use attribute-based tags to protect the production environment from unauthorized actions, so that deployment to production can only come through the pipeline.

The AWS CDK-based pipelines let MarketAxess enable teams to independently build and obtain immediate feedback, while still centrally governing CI and CD patterns. The solution took six months of two DevOps engineers working full time to build the cdk structure and support for the core languages and their corresponding CI and CD stages. We continue to iterate on the cdk code base and pipelines, incorporating feedback from our development community to ensure developer satisfaction.

Simplified Developer Interaction

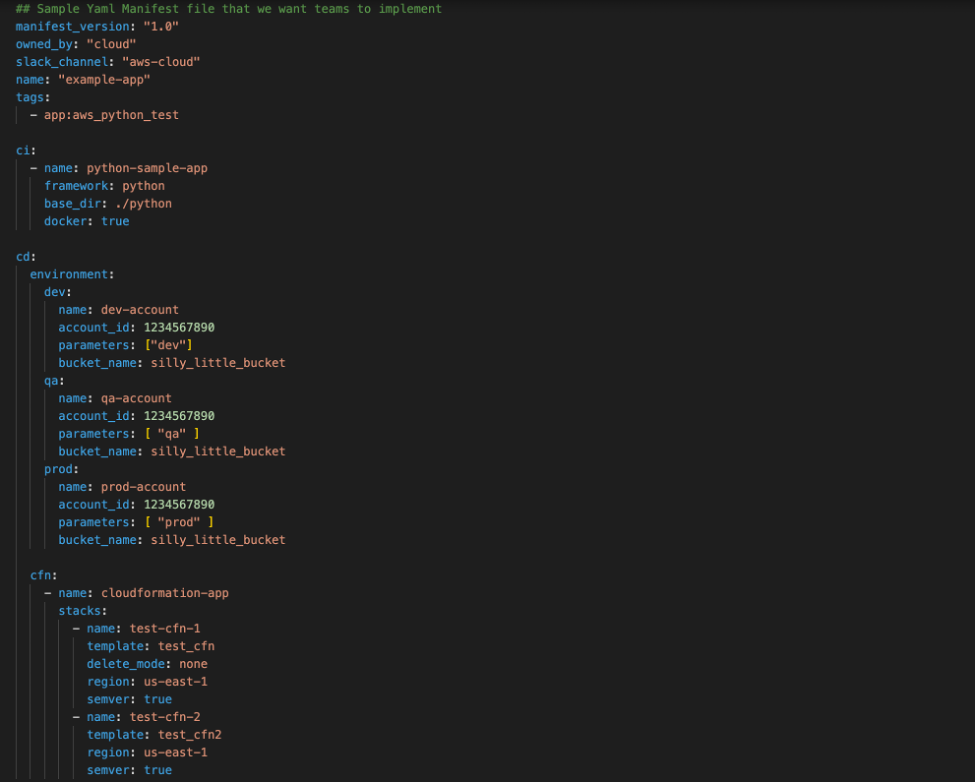
Although we were enforcing standards via the automation, we still wanted to give development teams autonomy through a simple mechanism. We wanted developers to interact with our pipeline creation process through a pipeline manifest file that they submitted to their repository. An example of the manifest file schema is in the following screenshot:

Manifest File Schema

As shown above, the manifest lets developers define custom application configurations, while preserving consistent quality gates. This manifest is checked in to source control, and upon a commit to the code repository it triggers our automation. This lets our pipelines mutate on manifest file changes, and it makes sure that the latest commit goes through the latest quality gates. Each repository gets its own pipeline, and, to maintain the security of the pipeline, we used IAM Session Tags with Okta. We tag each pipeline and its associated resources with a unique attribute that is mapped to the development team so that they only have access to their pipelines, and only authorized individuals may approve production deployments.

Using AWS CDK, AWS CodePipeline, and other AWS Services, we have been able to improve the stability and quality of the code being delivered. CodePipeline and AWS CDK have helped us develop a cloud native pipeline solution that meets our governance best practices and compliance requirements. We met our three goals, and we can iterate and change easily moving forward.

Conclusion

Organizations that achieve the automation and self-service ideals of DevOps can build, release, and deploy features and apps to users faster and at higher levels of quality. In this post, we saw a real-life example of using Infrastructure as Code with AWS CDK to build a service that helps maintain governance and helps developers get work done. Here are two other posts that demonstrate using AWS Service Catalog to create secure DevOps pipelines or DevOps pipelines that deploy containerized applications.


Prashant Joshi

Prashant Joshi

Prashant Joshi is a Senior Cloud Engineer working in the Cloud Foundation team at MarketAxess. MarketAxess is a registered trademark of MarketAxess Holdings Inc.

Creating a Multi-Region Application with AWS Services – Part 3, Application Management and Monitoring

Post Syndicated from Joe Chapman original https://aws.amazon.com/blogs/architecture/creating-a-multi-region-application-with-aws-services-part-3-application-management-and-monitoring/

In Part 1 of this series, we built a foundation for your multi-Region application using AWS compute, networking, and security services. In Part 2, we integrated AWS data and replication services to move and sync data between AWS Regions.

In Part 3, we cover AWS services and features used for messaging, deployment, monitoring, and management.

Developer tools

Automation that uses infrastructure as code (IaC) removes manual steps to create and configure infrastructure. It offers a repeatable template that can deploy consistent environments in different Regions.

IaC with AWS CloudFormation StackSets uses a single template to create, update, and delete stacks across multiple accounts and Regions in a single operation. When writing an AWS CloudFormation template, you can change the deployment behavior by pairing parameters with conditional logic. For example, you can set a “standby” parameter that, when “true,” limits the number of Amazon Elastic Compute Cloud (Amazon EC2) instances in an Amazon EC2 Auto Scaling group deployed to a standby Region.

Applications with deployments that span multiple Regions can use cross-Region actions in AWS CodePipeline for a consistent release pipeline. This way you won’t need to set up different actions in each Region. EC2 Image Builder and Amazon Elastic Container Registry (Amazon ECR) have cross-Region copy features to help with consistent AMI and image deployments, as covered in Part 1.

Event-driven architecture

Decoupled, event-driven applications produce a more extensible and maintainable architecture by having each component perform its specific task independently.

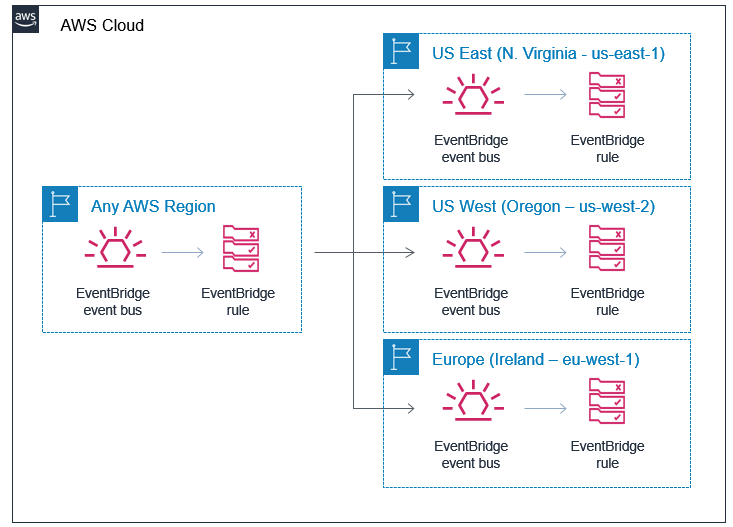
Amazon EventBridge, a serverless event bus, can send events between AWS resources. By utilizing cross-Region event routing, you can share events between workloads in different Regions (Figure 1) and accounts. For example, you can share health and utilization events across Regions to determine which Regional workload deployment is best suited for requests.

EventBridge routing events from one Region to event buses in other Regions

Figure 1. EventBridge routing events from one Region to event buses in other Regions

If your event-driven application relies on pub/sub messaging, Amazon Simple Notification Service (Amazon SNS) can fan out to multiple destinations. When the destination targets are Amazon Simple Queue Service (Amazon SQS) queues or AWS Lambda functions, Amazon SNS can notify recipients in different Regions. For example, you can send messages to a central SQS queue that processes orders for a multi-Region application.

Monitoring and observability

Observability becomes even more important as the number of resources and deployment locations increases. Being able to quickly identify the impact and root cause of an issue will influence recovery activities, and ensuring your observability stack is resilient to failures will help you make these decisions. When building on AWS, you can pair the health of AWS services with your application metrics to obtain a more complete view of the health of your infrastructure.

AWS Health dashboards and APIs show account-specific events and scheduled activities that may affect your resources. These events cover all Regions, and can expand to include all accounts in your AWS Organization. EventBridge can monitor events from AWS Health to take immediate actions based on an event. For example, if multiple services are reporting as degraded, you could set the EventBridge event target to an AWS Systems Manager automated runbook that prepares your disaster recovery (DR) application for failover.

AWS Trusted Advisor offers actionable alerts to optimize cost, increase performance, and improve security and fault tolerance. Trusted Advisor shows results across all Regions and can generate a report that shows an aggregated view of all check results across all accounts within an organization.

To maintain visibility over an application deployed across multiple Regions and accounts, you can create a Trusted Advisor dashboard and an operations dashboard with AWS Systems Manager Explorer. The operations dashboard offers a unified view of resources, such as Amazon EC2, Amazon CloudWatch, and AWS Config data. You can combine the metadata with Amazon Athena to create a multi-Region and multi-account inventory view of resources.

You can view metrics from applications and resources deployed across multiple Regions in the CloudWatch console. This makes it easy to create graphs and dashboards for multi-Region applications. Cross-account functionality is also available in CloudWatch, so you can create a centralized view of dashboards, alarms, and metrics across your organization.

Amazon OpenSearch Service aggregates unstructured and semi-structured log files, messages, metrics, documents, configuration data, and more. Cross-cluster replication replicates indices, mappings, and metadata in an active-passive setup from one OpenSearch Service domain to another. This reduces latency across Regions and ensures high availability of your data.

AWS Resilience Hub assesses and tracks the resiliency of your application. It checks how well an application will maintain availability when performing a Regional failover. For example, it can check if an application has cross-Region replication configured on Amazon Simple Storage Service (Amazon S3) buckets or that Amazon Relational Database Service (Amazon RDS) instances have a cross-Region read-replica. Figure 2 shows an output of a Resilience Hub assessment. It recommends use of Route 53 Application Recovery Controller (covered in Part 1) to ensure the Amazon EC2 Auto Scaling group in a Region is scaled and ready to accept traffic before we fail over to it.

Resilience Hub recommendations

Figure 2. Resilience Hub recommendations

Management: Governance

Growing an application into a new country means there may be additional data privacy laws and regulations to follow. These will vary depending on the country, and we encourage you to investigate with your legal team to fully understand how this affects your application.

AWS Control Tower supports data compliance by providing guardrails to control and meet data residency requirements. These guardrails are a collection of Service Control Policies (SCPs) and AWS Config rules. You can implement them independently of AWS Control Tower if needed. Additional security-centric multi-Region services are covered in part 1.

AWS Config provides a detailed view of the configuration and history of AWS resources. An AWS Config aggregator collects configuration and compliance data from multiple accounts and Regions into a central account. This centralized view offers a comprehensive view of the compliance and actions on resources, regardless of which account or Region they reside in.

Management: Operations

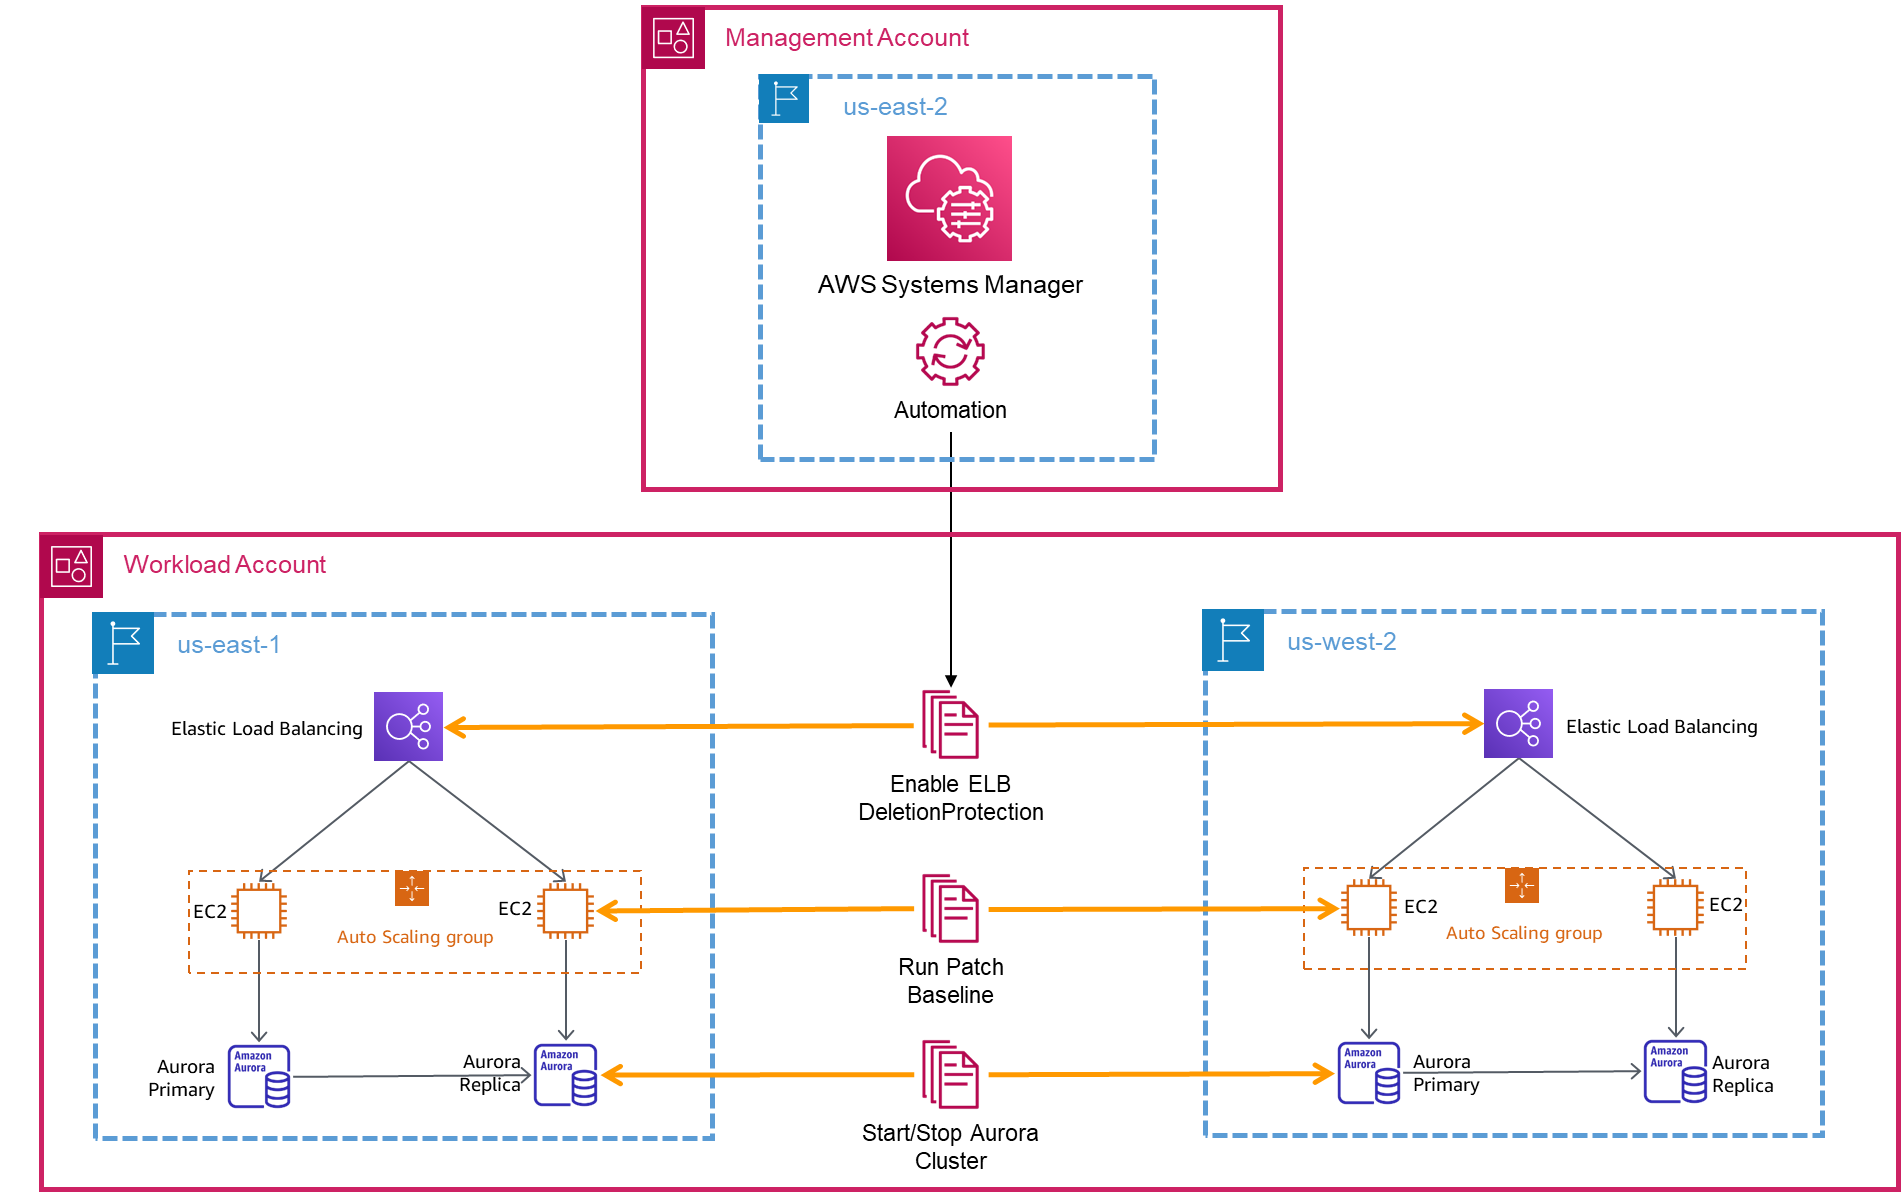
Several AWS Systems Manager capabilities allow for easier administration of AWS resources, especially as applications grow. Systems Manager Automation simplifies common maintenance and deployment tasks for AWS resources with automated runbooks. These runbooks automate actions on resources across Regions and accounts. You can pair Systems Manager Automation with Systems Manager Patch Manager to ensure instances maintain the latest patches across accounts and Regions. Figure 3 shows Systems Manager running several automation documents on a multi-Region architecture.

Using Systems Manager automation from a central operations AWS account to automate actions across multiple Regions

Figure 3. Using Systems Manager automation from a central operations AWS account to automate actions across multiple Regions

Bringing it together

At the end of each part of this blog series, we build on a sample application based on the services covered. This shows you how to bring these services together to build a multi-Region application with AWS services. We don’t use every service mentioned, just those that fit the use case.

We built this example to expand to a global audience. It requires high availability across Regions, and favors performance over strict consistency. We have chosen the following services covered in this post to accomplish our goals, building on our foundation from part 1 and part 2:

  • CloudFormation StackSets to deploy everything with IaC. This ensures the infrastructure is deployed consistently across Regions.
  • AWS Config rules provide a centralized place to monitor, record, and evaluate the configuration of our resources.
  • For added observability, we created dashboards with CloudWatch dashboard, Personal Health dashboard, and Trusted Advisor dashboard.
Building an application with multi-Region services

Figure 4. Building an application with multi-Region services

While our primary objective is expanding to a global audience, we note that some of the services such as CloudFormation StackSets rely on Region 1. Each Regional deployment is set up for static stability, but if there were an outage in Region 1 for an extended period of time, our DR playbook would outline how to make CloudFormation changes in Region 2.

Summary

Many AWS services have features to help you build and manage a multi-Region architecture, but identifying those capabilities across 200+ services can be overwhelming.

In this 3-part blog series, we’ve explored AWS services with features to assist you in building multi-Region applications. In Part 1, we built a foundation with AWS security, networking, and compute services. In Part 2, we added in data and replication strategies. Finally, in Part 3, we examined application and management layers.

Ready to get started? We’ve chosen some AWS Solutions, AWS Blogs, and Well-Architected labs to help you!

Other posts in this series

Related information

Dream11: Blocking application attacks using AWS WAF at scale

Post Syndicated from Vatsal Shah original https://aws.amazon.com/blogs/architecture/dream11-blocking-application-attacks-using-aws-waf-at-scale/

As the world’s largest fantasy sports platforms with more than 120 million registered users, Dream11 runs multiple contests simultaneously while processing millions of user requests per minute. Their user-centric and data-driven teams make it a priority to ensure that the Dream11 application (app) remains protected against all kinds of threats and vulnerabilities.

Introduction to AWS WAF Security Automations

AWS WAF is a web application firewall that helps protect apps and APIs against common web exploits and bots. These attacks may affect availability, compromise security, or consume excessive resources. AWS WAF gives you control over how traffic reaches your applications. You can create security rules that control bot traffic and block common attack patterns, such as SQL injection or cross-site scripting (XSS.)

AWS WAF Security Automations use AWS CloudFormation to quickly configure AWS WAF rules that help block the following common types of attacks:

  • SQL injection
  • Cross-site scripting
  • HTTP floods
  • Scanners and probes
  • Known attacker origins (IP reputation lists)
  • Bots and scrapers

In this blog post, we will explain how Dream11 uses AWS WAF Security Automations to protect its application from scanners and probes attacks.

Scanner and probe automation

To understand the scanner and probe automation, let’s look at a realistic attack scenario for a standard app that is protected by AWS WAF. Let’s assume that a malicious user is trying to scan the app and identify loopholes using their custom tool. They plan to conduct injection attacks (such as SQLi, XSS) or directory brute force attacks.

The app, secured by AWS WAF, has rules in place to block requests if certain signatures and patterns are matched. AWS WAF cannot have all possible payload lists for each attack vector. This means that after some trial and errors, an attacker may find the payload that doesn’t get blocked by AWS WAF and try to exploit the vulnerability.

In this case, what if AWS WAF can detect the behavior of malicious user IPs and block it for a certain time period? Wouldn’t it be great if AWS WAF blocks the IP of a malicious user after receiving a couple of malicious requests? That way, new requests coming from that IP will be blocked without AWS WAF having to check all the rules in the web ACL. Any successful bypass attempts will also get blocked from that IP. Rather than permanently blocking the IP, this feature blocks the offending IP for a certain time period, discouraging the attacker from any further attempts. It acts as a first step of incident response. Here’s where automation can help.

Scanner and probe automation monitors Amazon CloudFront logs and analyses HTTP status codes for requests coming from different IPs. Based on the configured threshold of HTTP status codes, scanner and probe automation will update the malicious IP directly to the AWS WAF rule IPSet. It then blocks subsequent requests from that IP for a configured period of time.

The AWS WAF Security Automations solution creates an AWS WAF rule, an AWS Lambda function, and a Scanner and Probes Amazon Athena query. The Athena query parses Amazon CloudFront or Application Load Balancer access logs at regular intervals. It counts the number of bad requests per minute from unique source IP addresses. The Lambda function updates the AWS WAF IPSet rule to block further scans from IP addresses with a high error rate.

Scanner and probe solution

Solution architecture for scanner and probe automation (xxx represents the numbers as defined by the use case)

Figure 1. Solution architecture for scanner and probe automation (xxx represents the numbers as defined by the use case)

The workflow of the solution is as follows, shown in Figure 1:

  • CloudFront logs are pushed to the Amazon S3 bucket
  • Log Parser Lambda will run the Athena query to find the error code threshold for each unique IP
  • If the HTTP error threshold is crossed for any IP, the Lambda function will update the IP into an AWS WAF IPSet for a certain time
  • The IPSet is unblocked automatically after the time period is over

Customizing the AWS WAF Security Automation solution

Scanner and probe automation with rules will block traffic if the error rate for a particular IP crosses the threshold. It then adds the IP in the blocked IPSet. This IP is blocked for a configurable amount of time (for example, 12 hours, 2 days, 1 week).

During the customization of AWS WAF for Dream11, there were instances which required exceptions to the preceding rule. One was to prevent internal services/gateway IPs from getting blocked by the security automation. We needed to customize the rules for these predefined thresholds. For example: the solution should block the external traffic, but exclude any internal IP addresses.

The Dream11 Security team customized the Lambda logic to approve all internal NAT gateway IPs. Scanner and probe automation ignores these IPs even if there is a high number of errors from the approved IPs. Sample code is as follows:

log.info("[update_ip_set] \tIgnore the approved IP ")

if ip_type == "IPV4" and source_ip not in outstanding_requesters['ApprovedIPs']:  
                addresses_v4.append(source_ip)
elif ip_type == "IPV6" and source_ip not in outstanding_requesters['ApprovedIPs']:                     addresses_v6.append(source_ip)

Note: Create a JSON file with list of approved IPs and store it in APP_ACCESS_LOG_BUCKET
We will use the same S3 bucket to put our office-approved IPs as xyz.json file where we store our CloudFront access logs. This is configurable during CloudFormation template for Security Automation.

Code explanation:

  1. The custom code first validates the particular IP for which the error threshold is crossed against the approved IPs.
  2. If the IP belongs to the IPV4 or IPV6 format and isn’t an approved IP, it will be appended to the blocked IPSet for a certain period of time.

The customization of the Lambda function provides a security automation solution that doesn’t block any legitimate request. At the same time, it provides protection against scanner and probe attacks. AWS WAF security automation is an open-source solution and is hosted on GitHub.

Conclusion

In this blog post, we’ve given a brief overview of how you can reduce attacks by using AWS WAF Security Automations against scanners and probes. We’ve also illustrated the customization implemented by the Dream11 security team.

By automating your security operations, you will improve effective incident response. You can prioritize threats and handle cyber attacks automatically with automated courses of action. This reduces the need for human intervention, reduces response time, and addresses security issues without manual effort.

After implementing this at Dream11, we were able to create custom, application-specific rules that blocked attack patterns. This has provided application availability, secure resources, and has prevented excessive resource consumption. With this solution, we are able to provide the best fantasy sports experience for over 120 million users.

Read more about Security Automations in AWS WAF.

Using DevOps Automation to Deploy Lambda APIs across Accounts and Environments

Post Syndicated from Subrahmanyam Madduru original https://aws.amazon.com/blogs/architecture/using-devops-automation-to-deploy-lambda-apis-across-accounts-and-environments/

by Subrahmanyam Madduru – Global Partner Solutions Architect Leader, AWS, Sandipan Chakraborti – Senior AWS Architect, Wipro Limited, Abhishek Gautam – AWS Developer and Solutions Architect, Wipro Limited, Arati Deshmukh – AWS Architect, Infosys

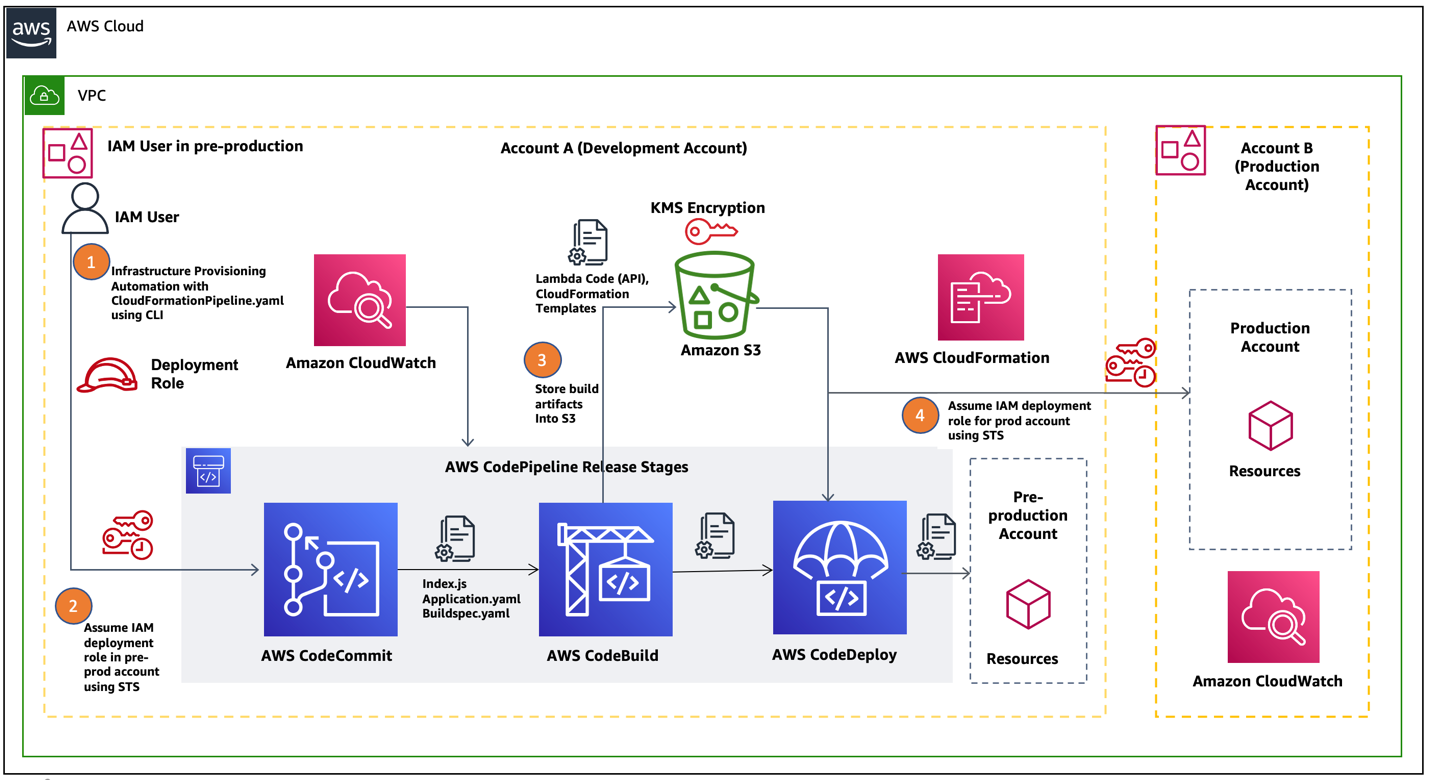
As more and more enterprises adopt serverless technologies to deliver their business capabilities in a more agile manner, it is imperative to automate release processes. Multiple AWS Accounts are needed to separate and isolate workloads in production versus non-production environments. Release automation becomes critical when you have multiple business units within an enterprise, each consisting of a number of AWS accounts that are continuously deploying to production and non-production environments.

As a DevOps best practice, the DevOps engineering team responsible for build-test-deploy in a non-production environment should not release the application and infrastructure code on to both non-production and production environments.  This risks introducing errors in application and infrastructure deployments in production environments. This in turn results in significant rework and delays in delivering functionalities and go-to-market initiatives. Deploying the code in a repeatable fashion while reducing manual error requires automating the entire release process. In this blog, we show how you can build a cross-account code pipeline that automates the releases across different environments using AWS CloudFormation templates and AWS cross-account access.

Cross-account code pipeline enables an AWS Identity & Access Management (IAM) user to assume an IAM Production role using AWS Secure Token Service (Managing AWS STS in an AWS Region – AWS Identity and Access Management) to switch between non-production and production deployments based as required. An automated release pipeline goes through all the release stages from source, to build, to deploy, on non-production AWS Account and then calls STS Assume Role API (cross-account access) to get temporary token and access to AWS Production Account for deployment. This follow the least privilege model for granting role-based access through IAM policies, which ensures the secure automation of the production pipeline release.

Solution Overview

In this blog post, we will show how a cross-account IAM assume role can be used to deploy AWS Lambda Serverless API code into pre-production and production environments. We are building on the process outlined in this blog post: Building a CI/CD pipeline for cross-account deployment of an AWS Lambda API with the Serverless Framework by programmatically automating the deployment of Amazon API Gateway using CloudFormation templates. For this use case, we are assuming a single tenant customer with separate AWS Accounts to isolate pre-production and production workloads.  In Figure 1, we have represented the code pipeline workflow diagramatically for our use case.

Figure 1. AWS cross-account CodePipeline for production and non-production workloads

Figure 1. AWS cross-account AWS CodePipeline for production and non-production workloads

Let us describe the code pipeline workflow in detail for each step noted in the preceding diagram:

  1. An IAM user belonging to the DevOps engineering team logs in to AWS Command-line Interface (AWS CLI) from a local machine using an IAM secret and access key.
  2. Next, the  IAM user assumes the IAM role to the corresponding activities – AWS Code Commit, AWS CodeBuild, AWS CodeDeploy, AWS CodePipeline Execution and deploys the code for pre-production.
  3. A typical AWS CodePipeline comprises of build, test and deploy stages. In the build stage, the AWS CodeBuild service generates the Cloudformation template stack (template-export.yaml) into Amazon S3.
  4. In the deploy stage, AWS CodePipeline uses a CloudFormation template (a yaml file) to deploy the code from an S3 bucket containing the application API endpoints via Amazon API Gateway in the pre-production environment.
  5. The final step in the pipeline workflow is to deploy the application code changes onto the Production environment by assuming STS production IAM role.

Since the AWS CodePipeline is fully automated, we can use the same pipeline by switching between  pre-production and production accounts. These accounts assume the IAM role appropriate to the target environment and deploy the validated build to that environment using CloudFormation templates.

Prerequisites

Here are the pre-requisites before you get started with implementation.

  • A user  with appropriate privileges (for example: Project Admin) in a production AWS account
  • A user with appropriate privileges (for example: Developer Lead) in a pre-production AWS account such as development
  • A CloudFormation template for deploying infrastructure in the pre-production account
  • Ensure your local machine has AWS CLI installed and configured 

Implementation Steps

In this section, we show how you can use AWS CodePipeline to release a serverless API in a secure manner to pre-production and production environments. AWS CloudWatch logging will be used to monitor the events on the AWS CodePipeline.

1. Create Resources in a pre-production account

In this step, we create the required resources such as a code repository, an S3 bucket, and a KMS key in a pre-production environment.

  • Clone the code repository into your CodeCommit. Make necessary changes to index.js and ensure the buildspec.yaml is there to build the artifacts.
    • Using codebase (lambda APIs) as input, you output a CloudFormation template, and environmental configuration JSON files (used for configuring Production and other non-Production environments such as dev, test). The build artifacts are packaged using AWS Serverless Application Model into a zip file and uploads it to an S3 bucket created for storing artifacts. Make note of the repository name as it will be required later.
  • Create an S3 bucket in a Region (Example: us-east-2). This bucket will be used by the pipeline for get and put artifacts. Make a note of the bucket name.
    • Make sure you edit the bucket policy to have your production account ID and the bucket name. Refer to AWS S3 Bucket Policy documentation to make changes to Amazon S3 bucket policies and permissions.
  • Navigate to AWS Key Management Service (KMS) and create a symmetric key.
  • Then create a new secret, configure the KMS key and provide access to development and production account. Make a note of the ARN for the key.

2. Create IAM Roles in the Production Account and required policies

In this step, we create roles and policies required to deploy the code.

{
    "Version": "2012-10-17",
    "Statement": [
      {
        "Effect": "Allow",
        "Action": [
        "kms:DescribeKey",
        "kms:GenerateDataKey*",
        "kms:Encrypt",
        "kms:ReEncrypt*",
        "kms:Decrypt"
      ],
      "Resource": [
        "Your KMS Key ARN you created in Development Account"
      ]
    }
  ]
}

Once you’ve created both policies, attach them to the previously created cross-account role.

3. Create a CloudFormation Deployment role

In this step, you need to create another IAM role, “CloudFormationDeploymentRole” for Application deployment. Then attach the following four policies to it.

Policy 1: For Cloudformation to deploy the application in the Production account

{
  "Version": "2012-10-17",
  "Statement": [
    {
      "Sid": "VisualEditor0",
      "Effect": "Allow",
      "Action": [
        "cloudformation:DetectStackDrift",
        "cloudformation:CancelUpdateStack",
        "cloudformation:DescribeStackResource",
        "cloudformation:CreateChangeSet",
        "cloudformation:ContinueUpdateRollback",
        "cloudformation:DetectStackResourceDrift",
        "cloudformation:DescribeStackEvents",
        "cloudformation:UpdateStack",
        "cloudformation:DescribeChangeSet",
        "cloudformation:ExecuteChangeSet",
        "cloudformation:ListStackResources",
        "cloudformation:SetStackPolicy",
        "cloudformation:ListStacks",
        "cloudformation:DescribeStackResources",
        "cloudformation:DescribePublisher",
        "cloudformation:GetTemplateSummary",
        "cloudformation:DescribeStacks",
        "cloudformation:DescribeStackResourceDrifts",
        "cloudformation:CreateStack",
        "cloudformation:GetTemplate",
        "cloudformation:DeleteStack",
        "cloudformation:TagResource",
        "cloudformation:UntagResource",
        "cloudformation:ListChangeSets",
        "cloudformation:ValidateTemplate"
      ],
      "Resource": "arn:aws:cloudformation:us-east-2:940679525002:stack/DevOps-Automation-API*/*"        }
  ]
}

Policy 2: For Cloudformation to perform required IAM actions

{
  "Version": "2012-10-17",
  "Statement": [
    {
      "Sid": "VisualEditor0",
      "Effect": "Allow",
      "Action": [
        "iam:GetRole",
        "iam:GetPolicy",
        "iam:TagRole",
        "iam:DeletePolicy",
        "iam:CreateRole",
        "iam:DeleteRole",
        "iam:AttachRolePolicy",
        "iam:PutRolePolicy",
        "iam:TagPolicy",
        "iam:CreatePolicy",
        "iam:PassRole",
        "iam:DetachRolePolicy",
        "iam:DeleteRolePolicy"
      ],
      "Resource": "*"
    }
  ]
}

Policy 3: Lambda function service invocation policy

{
  "Version": "2012-10-17",
  "Statement": [
    {
      "Sid": "VisualEditor0",
      "Effect": "Allow",
      "Action": [
        "lambda:CreateFunction",
        "lambda:UpdateFunctionCode",
        "lambda:AddPermission",
        "lambda:InvokeFunction",
        "lambda:GetFunction",
        "lambda:DeleteFunction",
        "lambda:PublishVersion",
        "lambda:CreateAlias"
      ],
      "Resource": "arn:aws:lambda:us-east-2:Your_Production_AccountID:function:SampleApplication*"
    }
  ]
}

Policy 4: API Gateway service invocation policy

{
  "Version": "2012-10-17",
  "Statement": [
    {
      "Sid": "VisualEditor0",
      "Effect": "Allow",
      "Action": [
        "apigateway:DELETE",
        "apigateway:PATCH",
        "apigateway:POST",
        "apigateway:GET"
      ],
      "Resource": [
        "arn:aws:apigateway:*::/restapis/*/deployments/*",
        "arn:aws:apigateway:*::/restapis/*/stages/*",
        "arn:aws:apigateway:*::/clientcertificates",
        "arn:aws:apigateway:*::/restapis/*/models",
        "arn:aws:apigateway:*::/restapis/*/resources/*",
        "arn:aws:apigateway:*::/restapis/*/models/*",
        "arn:aws:apigateway:*::/restapis/*/gatewayresponses/*",
        "arn:aws:apigateway:*::/restapis/*/stages",
        "arn:aws:apigateway:*::/restapis/*/resources",
        "arn:aws:apigateway:*::/restapis/*/gatewayresponses",
        "arn:aws:apigateway:*::/clientcertificates/*",
        "arn:aws:apigateway:*::/account",
        "arn:aws:apigateway:*::/restapis/*/deployments",
        "arn:aws:apigateway:*::/restapis"
      ]
    },
    {
      "Sid": "VisualEditor1",
      "Effect": "Allow",
      "Action": [
        "apigateway:DELETE",
        "apigateway:PATCH",
        "apigateway:POST",
        "apigateway:GET"
      ],
      "Resource": "arn:aws:apigateway:*::/restapis/*/resources/*/methods/*/responses/*"
    },
    {
      "Sid": "VisualEditor2",
      "Effect": "Allow",
      "Action": [
        "apigateway:DELETE",
        "apigateway:PATCH",
        "apigateway:GET"
      ],
      "Resource": "arn:aws:apigateway:*::/restapis/*"
    },
    {
      "Sid": "VisualEditor3",
      "Effect": "Allow",
      "Action": [
        "apigateway:DELETE",
        "apigateway:PATCH",
        "apigateway:GET"
      ],
      "Resource": "arn:aws:apigateway:*::/restapis/*/resources/*/methods/*"
    }
  ]
}

Make sure you also attach the S3 read/write access and KMS policies created in Step-2, to the CloudFormationDeploymentRole.

4. Setup and launch CodePipeline

You can launch the CodePipeline either manually in the AWS console using “Launch Stack” or programmatically via command-line in CLI.

On your local machine go to terminal/ command prompt and launch this command:

aws cloudformation deploy –template-file <Path to pipeline.yaml> –region us-east-2 –stack-name <Name_Of_Your_Stack> –capabilities CAPABILITY_IAM –parameter-overrides ArtifactBucketName=<Your_Artifact_Bucket_Name>  ArtifactEncryptionKeyArn=<Your_KMS_Key_ARN>  ProductionAccountId=<Your_Production_Account_ID>  ApplicationRepositoryName=<Your_Repository_Name> RepositoryBranch=master

If you have configured a profile in AWS CLI,  mention that profile while executing the command:

–profile <your_profile_name>

After launching the pipeline, your serverless API gets deployed in pre-production as well as in the production Accounts. You can check the deployment of your API in production or pre-production Account, by navigating to the API Gateway in the AWS console and looking for your API in the Region where it was deployed.

Figure 2. Check your deployment in pre-production/production environment

Figure 2. Check your deployment in pre-production/production environment

Then select your API and navigate to stages, to view the published API with an endpoint. Then validate your API response by selecting the API link.

Figure 3. Check whether your API is being published in pre-production/production environment

Figure 3. Check whether your API is being published in pre-production/production environment

Alternatively you can also navigate to your APIs by navigating through your deployed application CloudFormation stack and selecting the link for API in the Resources tab.

Cleanup

If you are trying this out in your AWS accounts, make sure to delete all the resources created during this exercise to avoid incurring any AWS charges.

Conclusion

In this blog, we showed how to build a cross-account code pipeline to automate releases across different environments using AWS CloudFormation templates and AWS Cross Account Access. You also learned how serveless APIs can be securely deployed across pre-production and production accounts. This helps enterprises automate release deployments in a repeatable and agile manner, reduce manual errors and deliver business cababilities more quickly.

Expanding Your EC2 Possibilities By Utilizing the CPU Launch Options

Post Syndicated from limillan original https://aws.amazon.com/blogs/compute/expanding-your-ec2-possibilities-by-utilizing-the-cpu-launch-options/

This post is written by: Matthew Brunton, Senior Solutions Architect – WWPS

To ensure our customers have the appropriate machines available for their workloads, AWS offers a wide range of hardware options that include hundreds of types of instances that help customers achieve the best price performance for their workloads.  In some specialized circumstances, our customers need an even wider range of options, or more flexibility. This could be driven by a desire to optimize licensing costs, or the customer wanting more hardware configuration options. Some high performance workloads can improve by turning off simultaneous multithreading. In our AWS Well Architected Framework – High Performance Computing Lens we have the following recommendation “Unless an application has been tested with hyperthreading enabled, it is recommended that hyperthreading be disabled”. With these factors in mind, AWS offers the ability to configure some options regarding the CPU configuration in launched instances.

Our larger instance types that have a higher number of cores, and offer multithreaded cores will translate to a larger combination of potential options. The valid combinations of cores and threads per core can be found here. To consider utilizing the CPU options for both cores and threads per core, you will need to consider instance types that have multiple CPU’s and/or cores.

You can specify numerous CPU options for some of our larger instances via the console, command line interface, or the API. Moreover, you can remove CPUs from the launch configuration, or deactivate threading within CPUs that have multiple threads per core. Amazon Elastic Compute Cloud (Amazon EC2) FAQ’s for the Optimize CPU’s feature can be found here. You should be aware that this feature is only available during instance launch and cannot be modified after launch. The launch options persist after you reboot, stop, or start an instance.

You can easily determine how many CPUs and threads a machine has. There are numerous ways to see this via the AWS Management Console and the AWS Command Line Interface (CLI).

Within the AWS Management Console, under the ‘Instance Details’ section, opening up the ‘Host and placement group’ item reveals the number of vCPUs that your machine has.

Instance Details showing the number of vCPU's a particular EC2 machine has

Figure 1: Console details showing number of vCPU’s

This information is also available using the AWS CLI as follows:

aws ec2 describe-instances --region us-east-1 --filters "Name=instance-type,Values='c6i.*large'"

...
    "Instances": [
        {
            "Monitoring": {
                "State": "disabled"
            }, 
            "PrivateDnsName": "ip-172-31-44-121.ec2.internal",
 "PrivateIpAddress": "172.31.44.121",                              
 "State": {
                "Code": 16, 
                "Name": "running"
            }, 
            "EbsOptimized": false, 
            "LaunchTime": "2021-11-22T01:46:58+00:00",
            "ProductCodes": [], 
            "VpcId": " vpc-7f7f1502", 
            "CpuOptions": { "CoreCount": 32, "ThreadsPerCore": 1 }, 
            "StateTransitionReason": "", 
            ...
        }
    ]
...

Figure 2: ec2 describe-instances cli output

A handy AWS CLI command ‘describe-instance-types’ will show the list of valid cores, the possible threads-per-core, and the default values for the vCPUs and cores. These are listed in the ‘DefaultVCpus’ and ‘DefaultCores’ items in the returned JSON listed as follows.

aws ec2 describe-instance-types --region us-east-1 --filters "Name=instance-type,Values='c6i.*'"
{
    "InstanceTypes": [
        {
            "InstanceType": "c6i.4xlarge",
            "CurrentGeneration": true,
            "FreeTierEligible": false,
            "SupportedUsageClasses": [
                "on-demand",
                "spot"
            ],
            "SupportedRootDeviceTypes": [
                "ebs"
            ],
            "SupportedVirtualizationTypes": [
                "hvm"
            ],
            "BareMetal": false,
            "Hypervisor": "nitro",
            "ProcessorInfo": {
                "SupportedArchitectures": [
                    "x86_64"
                ],
                "SustainedClockSpeedInGhz": 3.5
            },
            "VCpuInfo": { "DefaultVCpus": 16, "DefaultCores": 8, "DefaultThreadsPerCore": 2, "ValidCores": [ 2, 4, 6, 8 ], "ValidThreadsPerCore": [ 1, 2 ] },
            "MemoryInfo": {
                "SizeInMiB": 32768
            },


Figure 3: ec2 describe-instance-types cli output

To utilize the AWS CLI to launch one or multiple instances, you should use the run instances CLI command.

The following is the shorthand syntax:

aws ec2 run-instances --image-id xxx --instance-type xxx --cpu-options “CoreCount=xx,ThreadsPerCore=xx” --key-name xxx --region xxx

For example, the following command launches a 32-core machine with only 1 thread per core instead of the standard 2 threads per core:

aws ec2 run-instances --image-id ami-0c2b8ca1dad447f8a --instance-type c6i.16xlarge
--cpu-options " CoreCount =32, ThreadsPerCore =1" --key-name MyKeyPair --region xxx

If you are using the CPU options parameters in CloudFormation templates, then the following applies:

https://docs.aws.amazon.com/AWSCloudFormation/latest/UserGuide/aws-properties-ec2-instance-cpuoptions.html

The following is an example of the YAML syntax for specifying the CPU configuration.

Resources:
  CustomEC2Instance:
    Type: "AWS::EC2::Instance"
    Properties:
      InstanceType: xxx
      ImageId: xxx
      CpuOptions:
CoreCount: xx
ThreadsPerCore: x

As can be seen in the following table, there are a number of valid CPU core options, as well as the option to set one or two threads per core for each CPU for certain instance types. This significantly opens up the number of combinations and permutations to meet your specific workload need. In the case of the c6i instance listed in the following table, there are an additional 32 CPU core and threading combinations available to customers.

Instance type Default vCPUs Default CPU cores Default threads per core Valid CPU cores Valid threads per core
c6i.16xlarge 64 32 2 2, 4, 6, 8, 10, 12, 14, 16, 18, 20, 22, 24, 26, 28, 30, 32 1, 2

Figure 4: Valid Core and Thread Launch Options

Note that you still pay the same amount for the EC2 instance, even if you deactivate some of the cores or threads.

Conclusion

This approach can let customers customize the EC2 hardware options even further to ensure a wider range of CPU/memory combinations over and above the already extensive AWS instance options. This lets customers finely tune hardware for their exact application requirements, whether that is running High Performance workloads or trying to save money where license restrictions mean you can benefit from a specific CPU configuration.

We have run through various scenarios in this post, which detailed how to launch instances with alternate CPU configurations, easily check the current configuration of your running instances via our API and console, and how to configure the options in CloudFormation templates.

We love to see our customers maximizing the flexibility of the AWS platform to deliver outstanding results. Have a look at some of your High Performance workloads and give the threading options a try, or take a deep dive into any of your more expensive licenses to see if you could benefit from an alternate CPU configuration. In order to get started, check out our detailed developer documentation for the optimize CPU options.

Deploy and Manage Gitlab Runners on Amazon EC2

Post Syndicated from Sylvia Qi original https://aws.amazon.com/blogs/devops/deploy-and-manage-gitlab-runners-on-amazon-ec2/

Gitlab CI is a tool utilized by many enterprises to automate their Continuous integration, continuous delivery and deployment (CI/CD) process. A Gitlab CI/CD pipeline consists of two major components: A .gitlab-ci.yml file describing a pipeline’s jobs, and a Gitlab Runner, an application that executes the pipeline jobs.

Setting up the Gitlab Runner is a time-consuming process. It involves provisioning the necessary infrastructure, installing the necessary software to run pipeline workloads, and configuring the runner. For enterprises running hundreds of pipelines across multiple environments, it is essential to automate the Gitlab Runner deployment process so as to be deployed quickly in a repeatable, consistent manner.

This post will guide you through utilizing Infrastructure-as-Code (IaC) to automate Gitlab Runner deployment and administrative tasks on Amazon EC2. With IaC, you can quickly and consistently deploy the entire Gitlab Runner architecture by running a script. You can track and manage changes efficiently. And, you can enforce guardrails and best practices via code. The solution presented here also offers autoscaling so that you save costs by terminating resources when not in use. You will learn:

  • How to deploy Gitlab Runner quickly and consistently across multiple AWS accounts.
  • How to enforce guardrails and best practices on the Gitlab Runner through IaC.
  • How to autoscale Gitlab Runner based on workloads to ensure best performance and save costs.

This post comes from a DevOps engineer perspective, and assumes that the engineer is familiar with the practices and tools of IaC and CI/CD.

Overview of the solution

The following diagram displays the solution architecture. We use AWS CloudFormation to describe the infrastructure that is hosting the Gitlab Runner. The main steps are as follows:

  1. The user runs a deploy script in order to deploy the CloudFormation template. The template is parameterized, and the parameters are defined in a properties file. The properties file specifies the infrastructure configuration, as well as the environment in which to deploy the template.
  2. The deploy script calls CloudFormation CreateStack API to create a Gitlab Runner stack in the specified environment.
  3. During stack creation, an EC2 autoscaling group is created with the desired number of EC2 instances. Each instance is launched via a launch template, which is created with values from the properties file. An IAM role is created and attached to the EC2 instance. The role contains permissions required for the Gitlab Runner to execute pipeline jobs. A lifecycle hook is attached to the autoscaling group on instance termination events. This ensures graceful instance termination.
  4. During instance launch, CloudFormation uses a cfn-init helper script to install and configure the Gitlab Runner:
    1. cfn-init installs the Gitlab Runner software on the EC2 instance.
    2. cfn-init configures the Gitlab Runner as a docker executor using a pre-defined docker image in the Gitlab Container Registry. The docker executor implementation lets the Gitlab Runner run each build in a separate and isolated container. The docker image contains the software required to run the pipeline workloads, thereby eliminating the need to install these packages during each build.
    3. cfn-init registers the Gitlab Runner to Gitlab projects specified in the properties file, so that these projects can utilize the Gitlab Runner to run pipelines.
  1. The user may repeat the same steps to deploy Gitlab Runner into another environment.

Architecture diagram previously explained in post.

Walkthrough

This walkthrough will demonstrate how to deploy the Gitlab Runner, and how easy it is to conduct Gitlab Runner administrative tasks via this architecture. We will walk through the following tasks:

  • Build a docker executor image for the Gitlab Runner.
  • Deploy the Gitlab Runner stack.
  • Update the Gitlab Runner.
  • Terminate the Gitlab Runner.
  • Add/Remove Gitlab projects from the Gitlab Runner.
  • Autoscale the Gitlab Runner based on workloads.

The code in this post is available at https://github.com/aws-samples/amazon-ec2-gitlab-runner.git

Prerequisites

For this walkthrough, you need the following:

  • A Gitlab account (all tiers including Gitlab Free self-managed, Gitlab Free SaaS, and higher tiers). This demo uses gitlab.com free tire.
  • A Gitlab Container Registry.
  • Git client to clone the source code provided.
  • An AWS account with local credentials properly configured (typically under ~/.aws/credentials).
  • The latest version of the AWS CLI. For more information, see Installing, updating, and uninstalling the AWS CLI.
  • Docker is installed and running on the localhost/laptop.
  • Nodejs and npm installed on the localhost/laptop.
  • A VPC with 2 private subnets and that is connected to the internet via NAT gateway allowing outbound traffic.
  • The following IAM service-linked role created in the AWS account: AWSServiceRoleForAutoScaling
  • An Amazon S3 bucket for storing Lambda deployment packages.
  • Familiarity with Git, Gitlab CI/CD, Docker, EC2, CloudFormation and Amazon CloudWatch.

Build a docker executor image for the Gitlab Runner

The Gitlab Runner in this solution is implemented as docker executor. The Docker executor connects to Docker Engine and runs each build in a separate and isolated container via a predefined docker image. The first step in deploying the Gitlab Runner is building a docker executor image. We provided a simple Dockerfile in order to build this image. You may customize the Dockerfile to install your own requirements.

To build a docker image using the sample Dockerfile:

  1. Create a directory where we will store our demo code. From your terminal run:
mkdir demo-repos && cd demo-repos
  1. Clone the source code repository found in the following location:
git clone https://github.com/aws-samples/amazon-ec2-gitlab-runner.git
  1. Create a new project on your Gitlab server. Name the project any name you like.
  2. Clone your newly created repo to your laptop. Ignore the warning about cloning an empty repository.
git clone <your-repo-url>
  1. Copy the demo repo files into your newly created repo on your laptop, and push it to your Gitlab repository. You may customize the Dockerfile before pushing it to Gitlab.
cp -r amazon-ec2-gitlab-runner/* <your-repo-dir>
cd <your-repo-dir>
git add .
git commit -m “Initial commit”
git push
  1. On the Gitlab console, go to your repository’s Package & Registries -> Container Registry. Follow the instructions provided on the Container Registry page in order to build and push a docker image to your repository’s container registry.

Deploy the Gitlab Runner stack

Once the docker executor image has been pushed to the Gitlab Container Registry, we can deploy the Gitlab Runner. The Gitlab Runner infrastructure is described in the Cloudformation template gitlab-runner.yaml. Its configuration is stored in a properties file called sample-runner.properties. A launch template is created with the values in the properties file. Then it is used to launch instances. This architecture lets you deploy Gitlab Runner to as many environments as you like by utilizing the configurations provided in the appropriate properties files.

During the provisioning process, utilize a cfn-init helper script to run a series of commands to install and configure the Gitlab Runner.

          commands:
            01InstallDocker:
              command: sudo yum -y install docker
            02StartDocker:
              command: sudo service docker start
            03DownloadGitlabRunner:
              command: sudo wget -O /usr/bin/gitlab-runner https://gitlab-runner-downloads.s3.amazonaws.com/latest/binaries/gitlab-runner-linux-amd64
            04ChmodGitlabRunner:
              command: sudo chmod a+x /usr/bin/gitlab-runner
            05AddUser:
              command: sudo useradd --comment 'GitLab Runner' --create-home gitlab-runner --shell /bin/bash
            06InstallGitlabRunner:
              command: sudo gitlab-runner install --user=gitlab-runner --working-directory=/home/gitlab-runner
            07SetRegion:
              command: !Sub 'aws configure set default.region ${AWS::Region}'
            08ConfigureDockerExecutor:
              command: !Sub 
                - |
                  for GitlabGroupToken in `aws ssm get-parameters --names /${AWS::StackName}/ci-tokens --query 'Parameters[0].Value' | sed -e "s/\"//g" | sed "s/,/ /g"`;do
                      sudo gitlab-runner register \
                      --non-interactive \
                      --url "${GitlabServerURL}" \
                      --registration-token $GitlabGroupToken \
                      --executor "docker" \
                      --docker-image "${DockerImagePath}" \
                      --description "Gitlab Runner with Docker Executor" \
                      --locked="${isLOCKED}" --access-level "${ACCESS}" \
                      --docker-volumes "/var/run/docker.sock:/var/run/docker.sock" \
                      --tag-list "${RunnerEnvironment}-${RunnerVersion}-docker"
                  done
                - isLOCKED: !FindInMap [GitlabRunnerRegisterOptionsMap, !Ref RunnerEnvironment, isLOCKED]
                  ACCESS: !FindInMap [GitlabRunnerRegisterOptionsMap, !Ref RunnerEnvironment, ACCESS]                              
            09StartGitlabRunner:
              command: sudo gitlab-runner start

The helper script ensures that the Gitlab Runner setup is consistent and repeatable for each deployment. If a configuration change is required, users simply update the configuration steps and redeploy the stack. Furthermore, all changes are tracked in Git, which allows for versioning of the Gitlab Runner.

To deploy the Gitlab Runner stack:

  1. Obtain the runner registration tokens of the Gitlab projects that you want registered to the Gitlab Runner. Obtain the token by selecting the project’s Settings > CI/CD and expand the Runners section.
  2. Update the sample-runner.properties file parameters according to your own environment. Refer to the gitlab-runner.yaml file for a description of these parameters. Rename the file if you like. You may also create an additional properties file for deploying into other environments.
  3. Run the deploy script to deploy the runner:
cd <your-repo-dir>
./deploy-runner.sh <properties-file> <region> <aws-profile> <stack-name> 

<properties-file> is the name of the properties file.

<region> is the region where you want to deploy the stack.

<aws-profile> is the name of the CLI profile you set up in the prerequisites section.

<stack-name> is the name you chose for the CloudFormation stack.

For example:

./deploy-runner.sh sample-runner.properties us-east-1 dev amazon-ec2-gitlab-runner-demo

After the stack is deployed successfully, you will see the Gitlab Runner autoscaling group created in the EC2 console:

After the stack is deployed successfully, you will see the Gitlab Runner autoscaling group created in the EC2 console.

Under your Gitlab project Settings > CICD > Runners > Available specific runners, you will see the fully configured Gitlab Runner. The green circle indicates that the Gitlab Runner is ready for use.

Now go to your Gitlab project Settings  CICD  Runners  Available specific runners, you will see the fully configured Gitlab Runner. The green circle indicates that the Gitlab Runner is ready for use.

Updating the Gitlab Runner

There are times when you would want to update the Gitlab Runner. For example, updating the instance VolumeSize in order to resolve a disk space issue, or updating the AMI ID when a new AMI becomes available.

Utilizing the properties file and launch template makes it easy to update the Gitlab Runner. Simply update the Gitlab Runner configuration parameters in the properties file. Then, run the deploy script to udpate the Gitlab Runner stack. To ensure that the changes take effect immediately (e.g., existing instances are replaced by new instances with the new configuration), we utilize an AutoscalingRollingUpdate update policy to automatically update the instances in the autoscaling group.

    UpdatePolicy:
      AutoScalingRollingUpdate:
        MinInstancesInService: !Ref MinInstancesInService
        MaxBatchSize: !Ref MaxBatchSize
        PauseTime: "PT5M"
        WaitOnResourceSignals: true
        SuspendProcesses:
          - HealthCheck
          - ReplaceUnhealthy
          - AZRebalance
          - AlarmNotification
          - ScheduledActions

The policy tells CloudFormation that when changes are detected in the launch template, update the instances in batch size of MaxBatchSize, while keeping a number of instances (specified in MinInstanceInService) in service during the update.

Below is an example of updating the Gitlab Runner instance type.

To update the instance type of the runner instance:

  1. Update the “InstanceType” parameter in the properties file.

InstanceType=t2.medium

  1. Run the deploy-runner.sh script to update the CloudFormation stack:
cd <your-repo-dir>
./deploy-runner.sh <properties-file> <region> <aws-profile> <stack-name> 

In the CloudFormation console, you will see that the launch template is updated first, then a rolling update is initiated. The instance type update requires a replacement of the original instance, so a temporary instance was launched and put in service. Then, the temporary instance was terminated when the new instance was launched successfully.

In the CloudFormation console, you will see that the launch template is updated first, then a rolling update is initiated. The instance type update requires a replacement of the original instance, so a temporary instance was launched and put in service. Then, the temporary instance was terminated when the new instance was launched successfully.

After the update is complete, you will see that on the Gitlab project’s console, the old Gitlab Runner, ez_5x8Rv, is replaced by the new Gitlab Runner, N1_UQ7yc.

After the update is complete, you will see that on the Gitlab project’s console, the old Gitlab Runner, ez_5x8Rv, is replaced by the new Gitlab Runner, N1_UQ7yc.

Terminate the Gitlab Runner

There are times when an autoscaling group instance must be terminated. For example, during an autoscaling scale-in event, or when the instance is being replaced by a new instance during a stack update, as seen previously. When terminating an instance, you must ensure that the Gitlab Runner finishes executing any running jobs before the instance is terminated, otherwise your environment could be left in an inconsistent state. Also, we want to ensure that the terminated Gitlab Runner is removed from the Gitlab project. We utilize an autoscaling lifecycle hook to achieve these goals.

The lifecycle hook works like this: A CloudWatch event rule actively listens for the EC2 Instance-terminate events. When one is detected, the event rule triggers a Lambda function. The Lambda function calls SSM Run Command to run a series of commands on the EC2 instances, via a SSM Document. The commands include stopping the Gitlab Runner gracefully when all running jobs are finished, de-registering the runner from Gitlab projects, and signaling the autoscaling group to terminate the instance.

The lifecycle hook works like this: A CloudWatch event rule actively listens for the EC2 Instance-terminate events. When one is detected, the event rule triggers a Lambda function. The Lambda function calls SSM Run Command to run a series of commands on the EC2 instances, via a SSM Document. The commands include stopping the Gitlab Runner gracefully when all running jobs are finished, de-registering the runner from Gitlab projects, and signaling the autoscaling group to terminate the instance.

There are also times when you want to terminate an instance manually. For example, when an instance is suspected to not be functioning properly. To terminate an instance from the Gitlab Runner autoscaling group, use the following command:

aws autoscaling terminate-instance-in-auto-scaling-group \
    --instance-id="${InstanceId}" \
    --no-should-decrement-desired-capacity \
    --region="${region}" \
    --profile="${profile}"

The above command terminates the instance. The lifecycle hook ensures that the cleanup steps are conducted properly, and the autoscaling group launches another new instance to replace the old one.

Note that if you terminate the instance by using the “ec2 terminate-instance” command, then the autoscaling lifecycle hook actions will not be triggered.

Add/Remove Gitlab projects from the Gitlab Runner

As new projects are added to your enterprise, you may want to register them to the Gitlab Runner, so that those projects can utilize the Gitlab Runner to run pipelines. On the other hand, you would want to remove the Gitlab Runner from a project if it no longer wants to utilize the Gitlab Runner, or if it qualifies to utilize the Gitlab Runner. For example, if a project is no longer allowed to deploy to an environment configured by the Gitlab Runner. Our architecture offers a simple way to add and remove projects from the Gitlab Runner. To add new projects to the Gitlab Runner, update the RunnerRegistrationTokens parameter in the properties file, and then rerun the deploy script to update the Gitlab Runner stack.

To add new projects to the Gitlab Runner:

  1. Update the RunnerRegistrationTokens parameter in the properties file. For example:
RunnerRegistrationTokens=ps8RjBSruy1sdRdP2nZX,XbtZNv4yxysbYhqvjEkC
  1. Update the Gitlab Runner stack. This updates the SSM parameter which stores the tokens.
cd <your-repo-dir>
./deploy-runner.sh <properties-file> <region> <aws-profile> <stack-name> 
  1. Relaunch the instances in the Gitlab Runner autoscaling group. The new instances will use the new RunnerRegistrationTokens value. Run the following command to relaunch the instances:
./cycle-runner.sh <runner-autoscaling-group-name> <region> <optional-aws-profile>

To remove projects from the Gitlab Runner, follow the steps described above, with just one difference. Instead of adding new tokens to the RunnerRegistrationTokens parameter, remove the token(s) of the project that you want to dissociate from the runner.

Autoscale the runner based on custom performance metrics

Each Gitlab Runner can be configured to handle a fixed number of concurrent jobs. Once this capacity is reached for every runner, any new jobs will be in a Queued/Waiting status until the current jobs complete, which would be a poor experience for our team. Setting the number of concurrent jobs too high on our runners would also result in a poor experience, because all jobs leverage the same CPU, memory, and storage in order to conduct the builds.

In this solution, we utilize a scheduled Lambda function that runs every minute in order to inspect the number of jobs running on every runner, leveraging the Prometheus Metrics endpoint that the runners expose. If we approach the concurrent build limit of the group, then we increase the Autoscaling Group size so that it can take on more work. As the number of concurrent jobs decreases, then the scheduled Lambda function will scale the Autoscaling Group back in an effort to minimize cost. The Scaling-Up operation will ignore the Autoscaling Group’s cooldown period, which will help ensure that our team is not waiting on a new instance, whereas the Scale-Down operation will obey the group’s cooldown period.

Here is the logical sequence diagram for the work:

Sequence diagram

For operational monitoring, the Lambda function also publishes custom CloudWatch Metrics for the count of active jobs, along with the target and actual capacities of the Autoscaling group. We can utilize this information to validate that the system is working properly and determine if we need to modify any of our autoscaling parameters.

For operational monitoring, the Lambda function also publishes custom CloudWatch Metrics for the count of active jobs, along with the target and actual capacities of the Autoscaling group. We can utilize this information to validate that the system is working properly and determine if we need to modify any of our autoscaling parameters.

Congratulations! You have completed the walkthrough. Take some time to review the resources you have deployed, and practice the various runner administrative tasks that we have covered in this post.

Troubleshooting

Problem: I deployed the CloudFormation template, but no runner is listed in my repository.

Possible Cause: Errors have been encountered during cfn-init, causing runner registration to fail. Connect to your runner EC2 instance, and check /var/log/cfn-*.log files.

Cleaning up

To avoid incurring future charges, delete every resource provisioned in this demo by deleting the CloudFormation stack created in the “Deploy the Gitlab Runner stack” section.

Conclusion

This article demonstrated how to utilize IaC to efficiently conduct various administrative tasks associated with a Gitlab Runner. We deployed Gitlab Runner consistently and quickly across multiple accounts. We utilized IaC to enforce guardrails and best practices, such as tracking Gitlab Runner configuration changes, terminating the Gitlab Runner gracefully, and autoscaling the Gitlab Runner to ensure best performance and minimum cost. We walked through the deploying, updating, autoscaling, and terminating of the Gitlab Runner. We also saw how easy it was to clean up the entire Gitlab Runner architecture by simply deleting a CloudFormation stack.

About the authors

Sylvia Qi

Sylvia is a Senior DevOps Architect focusing on architecting and automating DevOps processes, helping customers through their DevOps transformation journey. In her spare time, she enjoys biking, swimming, yoga, and photography.

Sebastian Carreras

Sebastian is a Senior Cloud Application Architect with AWS Professional Services. He leverages his breadth of experience to deliver bespoke solutions to satisfy the visions of his customer. In his free time, he really enjoys doing laundry. Really.

Monitor AWS resources created by Terraform in Amazon DevOps Guru using tfdevops

Post Syndicated from Harish Vaswani original https://aws.amazon.com/blogs/devops/monitor-aws-resources-created-by-terraform-in-amazon-devops-guru-using-tfdevops/

This post was written in collaboration with Kapil Thangavelu, CTO at Stacklet


Amazon DevOps Guru is a machine learning (ML) powered service that helps developers and operators automatically detect anomalies and improve application availability. DevOps Guru utilizes machine learning models, informed by years of Amazon.com and AWS operational excellence to identify anomalous application behavior (e.g., increased latency, error rates, resource constraints) and surface critical issues that could cause potential outages or service disruptions. DevOps Guru’s anomaly detectors can also proactively detect anomalous behavior even before it occurs, helping you address issues before they happen; insights provide recommendations to mitigate anomalous behavior.

When you enable DevOps Guru, you can configure its coverage to determine which AWS resources you want to analyze. As an option, you can define the coverage boundary by selecting specific AWS CloudFormation stacks. For each stack you choose, DevOps Guru analyzes operational data from the supported resources to detect anomalous behavior. See Working with AWS CloudFormation stacks in DevOps Guru for more details.

For Terraform users, Stacklet developed an open-source tool called tfdevops, which converts Terraform state to an importable CloudFormation stack, which allows DevOps Guru to start monitoring the encapsulated AWS resources. Note that tfdevops is not a tool to convert Terraform into CloudFormation. Instead, it creates the CloudFormation stack containing the imported resources that are specified in the Terraform module and enables DevOps Guru to monitor the resources in that CloudFormation stack.

In this blog post, we will explain how you can configure and use tfdevops, to easily enable DevOps Guru for your existing AWS resources created by Terraform.

Solution overview

tfdevops performs the following steps to import resources into Amazon DevOps Guru:

  • It translates terraform state into an AWS CloudFormation template with a retain deletion policy
  • It creates an AWS CloudFormation stack with imported resources
  • It enrolls the stack into Amazon DevOps Guru

For illustration purposes, we will use a sample serverless application that includes some of the components DevOps Guru and tfdevops supports. This application consists of an Amazon Simple Queue Service (SQS) queue, and an AWS Lambda function that processes messages in the SQS queue. It also includes an Amazon DynamoDB table that the Lambda function uses to persist or to read data, and an Amazon Simple Notification Service (SNS) topic to where the Lambda function publishes the results of its processing. The following diagram depicts our sample application:

The architecture diagram shows a sample application containing an Amazon SQS queue, an AWS Lambda function, an Amazon SNS topic and an Amazon DynamoDB table.

Prerequisites

Before getting started, make sure you have these prerequisites:

Walkthrough

Follow these steps to monitor your AWS resources created with Terraform templates by using tfdevops:

  1. Install tfdevops following the instructions on GitHub
  2. Create a Terraform module with the resources supported by tfdevops
  3. Deploy the Terraform to your AWS account to create the resources in your account

Below is a sample Terraform module to create a sample AWS Lambda function, an Amazon DynamoDB table, an Amazon SNS topic and an Amazon SQS queue.

# IAM role for the lambda function
resource "aws_iam_role" "lambda_role" {
 name   = "iam_role_lambda_function"
 assume_role_policy = <<EOF
{
  "Version": "2012-10-17",
  "Statement": [
    {
      "Action": "sts:AssumeRole",
      "Principal": {
        "Service": "lambda.amazonaws.com"
      },
      "Effect": "Allow",
      "Sid": ""
    }
  ]
}
EOF
}

# IAM policy for logging from the lambda function
resource "aws_iam_policy" "lambda_logging" {

  name         = "iam_policy_lambda_logging_function"
  path         = "/"
  description  = "IAM policy for logging from a lambda"
  policy = <<EOF
{
  "Version": "2012-10-17",
  "Statement": [
    {
      "Action": [
        "logs:CreateLogGroup",
        "logs:CreateLogStream",
        "logs:PutLogEvents"
      ],
      "Resource": "arn:aws:logs:*:*:*",
      "Effect": "Allow"
    }
  ]
}
EOF
}

# Policy attachment for the role
resource "aws_iam_role_policy_attachment" "policy_attach" {
  role        = aws_iam_role.lambda_role.name
  policy_arn  = aws_iam_policy.lambda_logging.arn
}

# Generates an archive from the source
data "archive_file" "default" {
  type        = "zip"
  source_dir  = "${path.module}/src/"
  output_path = "${path.module}/myzip/python.zip"
}

# Create a lambda function
resource "aws_lambda_function" "basic_lambda_function" {
  filename                       = "${path.module}/myzip/python.zip"
  function_name                  = "basic_lambda_function"
  role                           = aws_iam_role.lambda_role.arn
  handler                        = "index.lambda_handler"
  runtime                        = "python3.8"
  depends_on                     = [aws_iam_role_policy_attachment.policy_attach]
}

# Create a DynamoDB table
resource "aws_dynamodb_table" "sample_dynamodb_table" {
  name           = "sample_dynamodb_table"
  hash_key       = "sampleHashKey"
  billing_mode   = "PAY_PER_REQUEST"

  attribute {
    name = "sampleHashKey"
    type = "S"
  }
}

# Create an SQS queue
resource "aws_sqs_queue" "sample_sqs_queue" {
  name          = "sample_sqs_queue"
}

# Create an SNS topic
resource "aws_sns_topic" "sample_sns_topic" {
  name = "sample_sns_topic"
}
  1. Run tfdevops to convert to CloudFormation template, deploy the stack and enable DevOps Guru

The following command generates a CloudFormation template locally from a Terraform state file:

tfdevops cfn -d ~/path/to/terraform/module --template mycfn.json --resources importable-ids.json

The following command deploys the CloudFormation template, creates a CloudFormation stack, imports resources, and activates DevOps Guru on the stack:

tfdevops deploy --template mycfn.json --resources importable-ids.json
  1. After tfdevopsfinishes the deployment, you can already see the stack in the CloudFormation dashboard.

CloudFormation dashboard showing the stack, GuruStack, created by tfdevops

tfdevops imports the existing resources in the Terraform module into AWS CloudFormation. Note, that these are not new resources and would have no additional cost implications for the resources itself. See Bringing existing resources into CloudFormation management to learn more about importing resources into CloudFormation.

Resources view for GuruStack listing the imported resources in GuruStack

  1. Your stack also appears at the DevOps Guru dashboard, indicating that DevOps Guru is monitoring your resources, and will alarm in case it detects anomalous behavior. Insights are co-related sequence of events and trails, grouped together to provide you with prescriptive guidance and recommendations to root-cause and resolve issues more quickly. See Working with insights in DevOps Guru to learn more about DevOps Guru insights.

Amazon DevOps Guru Dashboard displays the system health summary and system health overview of each CloudFormation stack. GuruStack is marked as healthy with 0 reactive insights and 0 proactive insights.

Note that when you use the tfdevops tool, it automatically enables DevOps Guru on the imported stack.

Amazon DevOps Guru Analyze resources displays the analysis coverage option selected. GuruStack is the selected stack for analysis

  1. Clean up – delete the stack

CloudFormation Stacks menu showing GuruStack as selected. The stack can be deleted by pressing the Delete button.

Conclusion

This blog post demonstrated how to enable DevOps Guru to monitor your AWS resources created by Terraform. Using the Stacklet’s tfdevops tool, you can create a CloudFormation stack from your Terraform state, and use that to define the coverage boundary for DevOps Guru. With that, if your resources have unexpected or unusual behavior, DevOps Guru will notify you and provide prescriptive recommendations to help you quickly fix the issue.

If you want to experiment DevOps Guru, AWS offers a free tier for the first three months that includes 7,200 AWS resource hours per month for free on each resource group A and B. Also, you can Estimate Amazon DevOps Guru resource analysis costs from the AWS Management Console. This feature scans selected resources to automatically generate a monthly cost estimate. Furthermore, refer to Gaining operational insights with AIOps using Amazon DevOps Guru to learn more about how DevOps Guru helps you increase your applications’ availability, and check out this workshop for a hands-on walkthrough of DevOps Guru’s main features and capabilities. To learn more about proactive insights, see Generating DevOps Guru Proactive Insights for Amazon ECS. To learn more about anomaly detection, see Anomaly Detection in AWS Lambda using Amazon DevOps Guru’s ML-powered insights.

About the authors

Harish Vaswani

Harish Vaswani is a Senior Cloud Application Architect at Amazon Web Services. He specializes in architecting and building cloud native applications and enables customers with best practices in their cloud journey. He is a DevOps and Machine Learning enthusiast. Harish lives in New Jersey and enjoys spending time with this family, filmmaking and music production.

Rafael Ramos

Rafael is a Solutions Architect at AWS, where he helps ISVs on their journey to the cloud. He spent over 13 years working as a software developer, and is passionate about DevOps and serverless. Outside of work, he enjoys playing tabletop RPG, cooking and running marathons.

Optimize Cost by Automating the Start/Stop of Resources in Non-Production Environments

Post Syndicated from Ashutosh Pateriya original https://aws.amazon.com/blogs/architecture/optimize-cost-by-automating-the-start-stop-of-resources-in-non-production-environments/

Co-authored with Nirmal Tomar, Principal Consultant, Infosys Technologies Ltd.

Ease of creating on-demand resources on AWS can sometimes lead to over-provisioning or under-utilization of AWS resources like Amazon EC2 and Amazon RDS. This can lead to higher costs that can often be avoided with proper planning and monitoring.  Non-critical environments, like development and test are often not monitored on a regular basis and can result in under-utilization of AWS resources.

In this blog, we discuss a common AWS cost optimization strategy, which is an automated and deployable solution to schedule the start/stop of AWS resources. For this example, we are considering non-production environments because in most scenarios these do not need to be available at all time. By following this solution, cloud architects can automate the start/stop of services per their usage pattern and can save up to 70% of costs while running their non-production environment.

The solution outlined here is designed to automatically stop and start the following AWS services based on your needs; Amazon RDS, Amazon Aurora, Amazon EC2, Auto Scaling groups, AWS Beanstalk, and Amazon EKS. The solution is automated using AWS Step functions, AWS Lambda, AWS Cloud​Formation Templates, Amazon EventBridge and AWS Identity and Access Management (IAM).

In this solution, we also provide an option to exclude specific Amazon Resource Names (ARNs) of the aforementioned services. This helps cloud architects to exclude the start/stop function for various use cases like in a QA environment when they don’t want to stop Aurora or they want to start RDS in a Development environment. The solution can be used to start/stop the services mentioned previously on a scheduled interval but can also be used for other applicable services like Amazon ECS, Amazon SageMaker Notebook Instances, Amazon Redshift and many more.

Note – Don’t set up this solution in a production or other environment where you require continuous service availability.

Prerequisites

For this walkthrough, you should have the following prerequisites:

  • An AWS account with permission to spin up required resources.
  • A running Amazon Aurora instance in the source AWS account.

Walkthrough

To set up this solution, proceed with the following two steps:

  1. Set up the step function workflow to stop services using a CloudFormation template. On a scheduled interval, this workflow will run and stop the chosen services.
  2. Set up the step function workflow to start services using a  CloudFormation template. On a scheduled interval, this workflow will run and start services as configured during the CloudFormation setup.

1. Stop Services using the Step Function workflow for a predefined duration

Figure 1 – Architecture showing the AWS Step Functions Workflow to stop services

Figure 1 – Architecture showing the AWS Step Functions Workflow to stop services

The AWS Lambda functions involved in this workflow:

  • StopAuroraCluster:  This Lambda function will stop all Aurora Cluster setup across Region including read replica.
  • StopRDSInstances:  This Lambda function will stop all RDS Instances except the Aurora setup across the Region.
  • ScaleDownEKSNodeGroups: This Lambda function will downsize all nodegroups to zero instance across the Region.
  • ScaleDownASG: This Lambda function will downsize all Auto Scaling groups including the Elastic Beanstalk Auto Scaling group to zero instance across Region. We can edit CloudFormation templates to include the custom value.
  • StopEC2Instances: This Lambda function will stop all EC2 instances set up across the Region.

Using the following AWS CloudFormation Template, we set up the required services and workflow:

a. Launch the template in the source account and source Region:

Launch Stack

Specify stack details screenshot

b.     Fill out the preceding form with the following details and select Next.

Stack name:  Stack Name which you want to create.

ExcludeAuroraClusterArnListInCommaSeprated: Comma separated Aurora clusters ARN which enterprises don’t want to stop, keep the default value if there is no exclusion list.

e.g.  arn:aws:rds:us-east-1:111111111111:cluster:aurorcluster1, arn:aws:rds:us-east-2:111111111111:cluster:auroracluster2

ExcludeRDSDBInstancesArnListInCommaSeprated: Comma separated DB instances ARN which enterprises don’t want to stop, keep the default value if there is no exclusion list.

e.g.   arn:aws:rds:us-east-1:111111111111:db:rds-instance-1, arn:aws:rds:us-east-2:111111111111:db:rds-instance-2

ExcludeEKSClusterNodeGroupsArnListInCommaSeprated: Comma separated EKS Clusters ARN which enterprises don’t want to stop, leave it with default value if there is no exclusion list.

e.g.   arn:aws:eks:us-east-2:111111111111:cluster/testcluster

ExcludeAutoScalingGroupIncludingBeanstalkListInCommaSeprated: Comma separated Beanstalk and other Auto Clusters groups ARN (except Amazon EKS) which enterprises don’t want to stop, keep the default value if there is no exclusion list.

e.g.  arn:aws:autoscaling:us-east-1:111111111111:autoScalingGroup:6d5af669-eb3b-4530-894b-e314a667f2e7:autoScalingGroupName/test-0-ASG

ExcludeEC2InstancesIdListInCommaSeprated: Comma separated EC2 instance ID’s which you don’t want to stop, keep the default value if there is no exclusion list.

e.g.  i-02185df0872f0f852, 0775f7e39513c50dd

ScheduleExpression: Schedule a cron expression when you want to run this workflow. Sample expressions are available in this guide, Schedule expressions using rate or cron.

c.     Select IAM role to launch this template.  As a best practice, select the AWS CloudFormation service role to manage AWS services and resources  available to each user.

Permissions screenshot

d.     Acknowledge that you want to create various resources including IAM roles/policies and select Create Stack.

d. Acknowledge to create various resources including IAM roles/policies and select Create Stack.

2. Start Services using the Step Function workflow in pre-configured time

Figure 2 – Architecture showing the AWS Step Functions Workflow to start services

Figure 2 – Architecture showing the AWS Step Functions Workflow to start services

The  Lambda functions involved in this workflow:

  • StartAuroraCluster:  This Lambda function will start all Aurora Cluster setup across Region including read-replica.
  • StartRDSInstances:  This Lambda function will start all RDS Instances except for the Aurora setup across the Region.
  • ScaleUpEKSNodeGroups: This Lambda function will upsize all nodegroups to minimum 2 and maximum 4 instances across Region. We can edit CloudFormation templates for custom value.
  • ScaleUpASG: This Lambda function will Scale up all Auto Scaling group including Elastic Beanstalk Auto Scaling group to minimum 2 and maximum 4 instances across the Region. We can edit CloudFormation templates for custom value.
  • StartEC2Instances: This Lambda function will start all EC2 instances setup across the Region.

Using the following AWS CloudFormation template, we set up the required services and workflow:

a. Launch the template in the source account and source Region:

Launch Stack

b. Fill out the preceding form with the following details and select Next.

Stack details screenshot

Stack name:  Stack Name which you want to create.

ExcludeAuroraClusterArnListInCommaSeprated: Comma separated Aurora clusters the ARN which you don’t want to start, keep the default value if there is no exclusion list.

For example:  arn:aws:rds:us-east-1:111111111111:cluster:aurorcluster1, arn:aws:rds:us-east-2:111111111111:cluster:auroracluster2

ExcludeRDSDBInstancesArnListInCommaSeprated: Comma separated databaseinstances ARN which you don’t want to start, keep default value if there is no exclusion list.

For example:   arn:aws:rds:us-east-1:111111111111:db:rds-instance-1, arn:aws:rds:us-east-2:111111111111:db:rds-instance-2

ExcludeEKSClusterNodeGroupsArnListInCommaSeprated: Comma separated EKS Clusters ARN which you don’t want to start, keep the default value if there is no exclusion list.

For example:   arn:aws:eks:us-east-2:111111111111:cluster/testcluster

ExcludeAutoScalingGroupIncludingBeanstalkListInCommaSeprated: Comma separated Beanstalk and other Auto Clusters groups ARN (except EKS) which you don’t want to start, keep the default value if there is no exclusion list.

For example:  arn:aws:autoscaling:us-east-1:111111111111:autoScalingGroup:6d5af669-eb3b-4530-894b-e314a667f2e7:autoScalingGroupName/test-0-ASG

ExcludeEC2InstancesIdListInCommaSeprated: Comma separated EC2 instance ID s you  don’t want to start, keep the default value if there is no exclusion list.

For example:  i-02185df0872f0f852, 0775f7e39513c50dd

ScheduleExpression: Schedule a cron expression when you want to run this workflow. Sample expressions are available in this guide, Schedule expressions using rate or cron.

c.     Select IAM role to launch this template.  As a best practice, select the AWS CloudFormation service role to manage AWS services and resources available to each user.

Permissions screenshot

d. Acknowledge that you want to create various resources including IAM roles and policies and select Create Stack.

Acknowledgement screenshot

Cleaning up

Delete any unused resources to avoid incurring future charges.

Conclusion

In this blog post, we outlined a solution to help you optimize cost by automating the stop/start of AWS services in non-production environments. Cost Optimization and Cloud Financial Management are ongoing initiatives. We hope you found this solution helpful and encourage you to explore additional ways to optimize cost on the AWS Architecture Center.

Nirmal Tomar

Nirmal Tomar

Nirmal is a principal consultant with Infosys, assisting vertical industries on application migration and modernization to the public cloud. He is the part of the Infosys Cloud CoE team and leads various initiatives with AWS. Nirmal has a keen interest in industry and cloud trends, and in working with hyperscalers to build differentiated offerings. Nirmal also specializes in cloud native development, managed containerization solutions, data analytics, data lakes, IoT, AI, and machine learning solutions.

Optimize your IoT Services for Scale with IoT Device Simulator

Post Syndicated from Ajay Swamy original https://aws.amazon.com/blogs/architecture/optimize-your-iot-services-for-scale-with-iot-device-simulator/

The IoT (Internet of Things) has accelerated digital transformation for many industries. Companies can now offer smarter home devices, remote patient monitoring, connected and autonomous vehicles, smart consumer devices, and many more products. The enormous volume of data emitted from IoT devices can be used to improve performance, efficiency, and develop new service and business models. This can help you build better relationships with your end consumers. But you’ll need an efficient and affordable way to test your IoT backend services without incurring significant capex by deploying test devices to generate this data.

IoT Device Simulator (IDS) is an AWS Solution that manufacturing companies can use to simulate data, test device integration, and improve the performance of their IoT backend services. The solution enables you to create hundreds of IoT devices with unique attributes and properties. You can simulate data without configuring and managing physical devices.

An intuitive UI to create and manage devices and simulations

IoT Device Simulator comes with an intuitive user interface that enables you to create and manage device types for data simulation. The solution also provides you with a pre-built autonomous car device type to simulate a fleet of connected vehicles. Once you create devices, you can create simulations and generate data (see Figure 1.)

Figure 1. The landing page UI enables you to create devices and simulation

Figure 1. The landing page UI enables you to create devices and simulation

Create devices and simulate data

With IDS, you can create multiple device types with varying properties and data attributes (see Figure 2.) Each device type has a topic where simulation data is sent. The supported data types are object, array, sinusoidal, location, Boolean, integer, float, and more. Refer to this full list of data types. Additionally, you can import device types via a specific JSON format or use the existing automotive demo to pre-populate connected vehicles.

Figure 2. Create multiple device types and their data attributes

Figure 2. Create multiple device types and their data attributes

Create and manage simulations

With IDS, you can create simulations with one device or multiple device types (see Figure 3.) In addition, you can specify the number of devices to simulate for each device type and how often data is generated and sent.

Figure 3. Create simulations for multiple devices

Figure 3. Create simulations for multiple devices

You can then run multiple simulations (see Figure 4) and use the data generated to test your IoT backend services and infrastructure. In addition, you have the flexibility to stop and restart the simulation as needed.

Figure 4. Run and stop multiple simulations

Figure 4. Run and stop multiple simulations

You can view the simulation in real time and observe the data messages flowing through. This way you can ensure that the simulation is working as expected (see Figure 5.) You can stop the simulation or add a new simulation to the mix at any time.

Figure 5. Observe your simulation in real time

Figure 5. Observe your simulation in real time

IoT Device Simulator architecture

Figure 6. IoT Device Simulator architecture

Figure 6. IoT Device Simulator architecture

The AWS CloudFormation template for this solution deploys the following architecture, shown in Figure 6:

  1. Amazon CloudFront serves the web interface content from an Amazon Simple Storage Service (Amazon S3) bucket.
  2. The Amazon S3 bucket hosts the web interface.
  3. Amazon Cognito user pool authenticates the API requests.
  4. An Amazon API Gateway API provides the solution’s API layer.
  5. AWS Lambda serves as the solution’s microservices and routes API requests.
  6. Amazon DynamoDB stores simulation and device type information.
  7. AWS Step Functions include an AWS Lambda simulator function to simulate devices and send messages.
  8. An Amazon S3 bucket stores pre-defined routes that are used for the automotive demo (which is a pre-built example in the solution).
  9. AWS IoT Core serves as the endpoint to which messages are sent.
  10. Amazon Location Service provides the map display showing the location of automotive devices for the automotive demo.

The IoT Device Simulator console is hosted on an Amazon S3 bucket, which is accessed via Amazon CloudFront. It uses Amazon Cognito to manage access. API calls, such as retrieving or manipulating information from the databases or running simulations, are routed through API Gateway. API Gateway calls the microservices, which will call the relevant service.

For example, when creating a new device type, the request is sent to API Gateway, which then routes the request to the microservices Lambda function. Based on the request, the microservices Lambda function recognizes that it is a request to create a device type and saves the device type to DynamoDB.

Running a simulation

When running a simulation, the microservices Lambda starts a Step Functions workflow. First, the request contains information about the simulation to be run, including the unique device type ID. Then, using the unique device type ID, Step Functions retrieves all the necessary information about each device type to run the simulation. Once all the information has been retrieved, the simulator Lambda function is run. The simulator Lambda function uses the device type information, including the message payload template. The Lambda function uses this template to build the message sent to the IoT topic specified for the device type.

When running a custom device type, the simulator generates random information based on the values provided for each attribute. For example, when the automotive simulation is run, the simulation runs a series of calculations to simulate an automobile moving along a series of pre-defined routes. Pre-defined routes are created and stored in an S3 bucket, when the solution is launched. The simulation retrieves the routes at random each time the Lambda function runs. Automotive demo simulations also show a map generated from Amazon Location Service and display the device locations as they move.

The simulator exits once the Lambda function has completed or has reached the fifteen-minute execution limit. It then passes all the necessary information back to the Step Function. Step Functions then enters a choice state and restarts the Lambda function if it has not yet surpassed the duration specified for the simulation. It then passes all the pertinent information back to the Lambda function so that it can resume where it left off. The simulator Lambda function also checks DynamoDB every thirty seconds to see if the user has manually stopped the simulation. If it has, it will end the simulation early. Once the simulation is complete, the Step Function updates the DynamoDB table.

The solution enables you to launch hundreds of devices to test backend infrastructure in an IoT workflow. The solution contains an Import/Export feature to share device types. Exporting a device type generates a JSON file that represents the device type. The JSON file can then be imported to create the same device type automatically. The solution allows the viewing of up to 100 messages while the solution is running. You can also filter the messages by topic and device and see what data each device emits.

Conclusion

IoT Device Simulator is designed to help customers test device integration and IoT backend services more efficiently without incurring capex for physical devices. This solution provides an intuitive web-based graphic user interface (GUI) that enables customers to create and simulate hundreds of connected devices. It is not necessary to configure and manage physical devices or develop time-consuming scripts. Although we’ve illustrated an automotive application in this post, this simulator can be used for many different industries, such as consumer electronics, healthcare equipment, utilities, manufacturing, and more.

Get started with IoT Device Simulator today.

Anomaly Detection in AWS Lambda using Amazon DevOps Guru’s ML-powered insights

Post Syndicated from Harish Vaswani original https://aws.amazon.com/blogs/devops/anomaly-detection-in-aws-lambda-using-amazon-devops-gurus-ml-powered-insights/

Critical business applications are monitored in order to prevent anomalies from negatively impacting their operational performance and availability. Amazon DevOps Guru is a Machine Learning (ML) powered solution that aids operations by detecting anomalous behavior and providing insights and recommendations for how to address the root cause before it impacts the customer.

This post demonstrates how Amazon DevOps Guru can detect an anomaly following a critical AWS Lambda function deployment and its remediation recommendations to fix such behavior.

Solution Overview

Amazon DevOps Guru lets you monitor resources at the region or AWS CloudFormation level. This post will demonstrate how to deploy an AWS Serverless Application Model (AWS SAM) stack, and then enable Amazon DevOps Guru to monitor the stack.

You will utilize the following services:

  • AWS Lambda
  • Amazon EventBridge
  • Amazon DevOps Guru

The architecture diagram shows an AWS SAM stack containing AWS Lambda and Amazon EventBridge resources, as well as Amazon DevOps Guru monitoring the resources in the AWS SAM stack.

Figure 1: Amazon DevOps Guru monitoring the resources in an AWS SAM stack

The architecture diagram shows an AWS SAM stack containing AWS Lambda and Amazon EventBridge resources, as well as Amazon DevOps Guru monitoring the resources in the AWS SAM stack.

This post simulates a real-world scenario where an anomaly is introduced in the AWS Lambda function in the form of latency. While the AWS Lambda function execution time is within its timeout threshold, it is not at optimal performance. This anomalous execution time can result in larger compute times and costs. Furthermore, this post demonstrates how Amazon DevOps Guru identifies this anomaly and provides recommendations for remediation.

Here is an overview of the steps that we will conduct:

  1. First, we will deploy the AWS SAM stack containing a healthy AWS Lambda function with an Amazon EventBridge rule to invoke it on a regular basis.
  2. We will enable Amazon DevOps Guru to monitor the stack, which will show the AWS Lambda function as healthy.
  3. After waiting for a period of time, we will make changes to the AWS Lambda function in order to introduce an anomaly and redeploy the AWS SAM stack. This anomaly will be identified by Amazon DevOps Guru, which will mark the AWS Lambda function as unhealthy, provide insights into the anomaly, and provide remediation recommendations.
  4. After making the changes recommended by Amazon DevOps Guru, we will redeploy the stack and observe Amazon DevOps Guru marking the AWS Lambda function healthy again.

This post also explores utilizing Provisioned Concurrency for AWS Lambda functions and the best practice approach of utilizing Warm Start for variables reuse.

Pricing

Before beginning, note the costs associated with each resource. The AWS Lambda function will incur a fee based on the number of requests and duration, while Amazon EventBridge is free. With Amazon DevOps Guru, you only pay for the data analyzed. There is no upfront cost or commitment. Learn more about the pricing per resource here.

Prerequisites

To complete this post, you need the following prerequisites:

Getting Started

We will set up an application stack in our AWS account that contains an AWS Lambda and an Amazon EventBridge event. The event will regularly trigger the AWS Lambda function, which simulates a high-traffic application. To get started, please follow the instructions below:

  1. In your local terminal, clone the amazon-devopsguru-samples repository.
git clone https://github.com/aws-samples/amazon-devopsguru-samples.git
  1.  In your IDE of choice, open the amazon-devopsguru-samples repository.
  2. In your terminal, change directories into the repository’s subfolder amazon-devopsguru-samples/generate-lambda-devopsguru-insights.
cd amazon-devopsguru-samples/generate-lambda-devopsguru-insights
  1. Utilize the SAM CLI to conduct a guided deployment of lambda-template.yaml.
sam deploy --guided --template lambda-template.yaml
    Stack Name [sam-app]: DevOpsGuru-Sample-AnomalousLambda-Stack
    AWS Region [us-east-1]: us-east-1
    #Shows you resources changes to be deployed and require a 'Y' to initiate deploy
    Confirm changes before deploy [y/N]: y
    #SAM needs permission to be able to create roles to connect to the resources in your template
    Allow SAM CLI IAM role creation [Y/n]: y
    Save arguments to configuration file [Y/n]: y
    SAM configuration file [samconfig.toml]: y
    SAM configuration environment [default]: default

You should see a success message in your terminal, such as:

Successfully created/updated stack - DevOpsGuru-Sample-AnomalousLambda-Stack in us-east-1.

Enabling Amazon DevOps Guru

Now that we have deployed our application stack, we can enable Amazon DevOps Guru.

  1. Log in to your AWS Account.
  2. Navigate to the Amazon DevOps Guru service page.
  3. Click “Get started”.
  4. In the “Amazon DevOps Guru analysis coverage” section, select “Choose later”, then click “Enable”.

Amazon DevOps Guru analysis coverage menu which asks which AWS resources to analyze. The “Choose later” option is selected.

Figure 2.1: Amazon DevOps Guru analysis coverage menu

  1. On the left-hand menu, select “Settings”
  2. In the “DevOps Guru analysis coverage” section, click on “Manage”.
  3. Select the “Analyze all AWS resources in the specified CloudFormation stacks in this Region” radio button.
  4. The stack created in the previous section should appear. Select it, click “Save”, and then “Confirm”.

Amazon DevOps Guru analysis coverage menu which asks which AWS resources to analyze. The “Analyze all AWS resources in the specified CloudFormation stacks in this Region” option is selected and CloudFormation stacks are displayed to choose from.

Figure 2.2: Amazon DevOps Guru analysis coverage resource selection

Before moving on to the next section, we must allow Amazon DevOps Guru to baseline the resources and benchmark the application’s normal behavior. For our serverless stack with two resources, we recommend waiting two hours before carrying out the next steps. When enabled in a production environment, depending upon the number of resources selected for monitoring, it can take up to 24 hours for Amazon DevOps Guru to complete baselining.

Once baselining is complete, the Amazon DevOps Guru dashboard, an overview of the health of your resources, will display the application stack, DevOpsGuru-Sample-AnomalousLambda-Stack, and mark it as healthy, shown below.

Amazon DevOps Guru Dashboard displays the system health summary and system health overview of each CloudFormation stack. The DevOpsGuru-Sample-AnomalousLambda-Stack is marked as healthy with 0 reactive insights and 0 proactive insights.

Figure 2.3: Amazon DevOps Guru Healthy Dashboard

Enabling SNS

If you would like to set up notifications upon the detection of an anomaly by Amazon DevOps Guru, then please follow these additional instructions.

Amazon DevOps Guru Specify an SNS topic menu which enables notifications for important DevOps Guru events. No SNS topics are currently configured.

Figure 3: Amazon DevOps Guru Specify an SNS topic

Invoking an Anomaly

Once Amazon DevOps Guru has identified the stack as healthy, we will update the AWS Lambda function with suboptimal code. This update will simulate an update to critical business applications which are causing the anomalous performance.

  1. Open the amazon-devopsguru-samples repository in your IDE.
  2. Open the file generate-lambda-devopsguru-insights/lambda-code.py
  3. Uncomment lines 7-8 and save the file. These lines of code will produce an anomaly due to the function’s increased runtime.
  4. Deploy these updates to your stack by running:
cd generate-lambda-devopsguru-insights 
sam deploy --template lambda-template.yaml -stack-name DevOpsGuru-Sample-AnomalousLambda-Stack

Anomaly Overview

Shortly after, Amazon DevOps Guru will generate a reactive insight from the sample stack. This insight contains recommendations, metrics, and events related to anomalous behavior. View the unhealthy stack status in the Dashboard.

Amazon DevOps Guru Dashboard displays the system health summary and system health overview of each CloudFormation stack. The DevOpsGuru-Sample-AnomalousLambda-Stack is marked as unhealthy with 1 reactive insights and 0 proactive insights.

Figure 4.1: Amazon DevOps Guru Unhealthy Dashboard

By clicking on the “Ongoing reactive insight” within the tile, you will be brought to the Insight Details page. This page contains an array of useful information to help you understand and address anomalous behavior.

Insight overview

Utilize this section to get a high-level overview of the insight. You can see that the status of the insight is ongoing, 1 AWS CloudFormation stack is affected, the insight started on Sept-08-2021, it does not have an end time, and it was last updated on Sept-08-2021.

Amazon DevOps Guru Insight Details page has multiple information sections. The Insight overview is the first section which displays the status is ongoing, there is 1 affected stack, the start time and last updated time. The end time is empty as the insight is ongoing.

Figure 4.2: Amazon DevOps Guru Ongoing Reactive Insight Overview

Aggregated metrics

The Aggregated metrics tab displays metrics related to the insight. The table is grouped by AWS CloudFormation stacks and subsequent resources that created the metrics. In this example, the insight was a product of an anomaly in the “duration p50” metric generated by the “DevOpsGuruSample-AnomalousLambda” AWS Lambda function.

AWS Lambda duration metrics derive from a percentile statistic utilized to exclude outlier values that skew average and maximum statistics. The P50 statistic is typically a great middle estimate. It is defined as 50% of estimates exceed the P50 estimate and 50% of estimates are less than the P50 estimate.

The red lines on the timeline indicate spans of time when the “duration p50” metric emitted unusual values. Click the red line in the timeline in order to view detailed information.

  • Choose View in CloudWatch to see how the metric looks in the CloudWatch console. For more information, see Statistics and Dimensions in the Amazon CloudWatch User Guide.
  • Hover over the graph in order to view details about the anomalous metric data and when it occurred.
  • Choose the box with the downward arrow to download a PNG image of the graph.

Amazon DevOps Guru Insight Details page contains aggregated metrics. The Duration p50 metric is selected and displayed in graph form.

Figure 4.3: Amazon DevOps Guru Ongoing Reactive Insight Aggregated Metrics

Graphed anomalies

The Graphed anomalies tab displays detailed graphs for each of the insight’s anomalies. Because our insight was comprised of a single anomaly, there is one tile with details about unusual behavior detected in related metrics.

  • Choose View all statistics and dimensions in order to see details about the anomaly. In the window that opens, you can:
  • Choose View in CloudWatch in order to see how the metric looks in the CloudWatch console.
  • Hover over the graph to view details about the anomalous metric data and when it occurred.
  • Choose Statistics or Dimension in order to customize the graph’s display. For more information, see Statistics and Dimensions in the Amazon CloudWatch User Guide.

Amazon DevOps Guru Insight Details page contains Graphed anomalies. The p50 metric of the AWS/Lambda duration in displayed in graph form.

Figure 4.4: Amazon DevOps Guru Ongoing Reactive Insight Graphed Anomaly

Related events

In Related events, view AWS CloudTrail events related to your insight. These events help understand, diagnose, and address the underlying cause of the anomalous behavior. In this example, the events are:

  1. CreateFunction – when we created and deployed the AWS SAM template containing our AWS Lambda function.
  2. CreateChangeSet – when we pushed updates to our stack via the AWS SAM CLI.
  3. UpdateFunctionCode – when the AWS Lambda function code was updated.

Continuation of figure 4.4

Figure 4.5: Amazon DevOps Guru Ongoing Reactive Insight Related Events

Recommendations

The final section in the Insight Detail page is Recommendations. You can view suggestions that might help you resolve the underlying problem. When Amazon DevOps Guru detects anomalous behavior, it attempts to create recommendations. An insight might contain one, multiple, or zero recommendations.

In this example, the Amazon DevOps Guru recommendation matches the best resolution to our problem-provisioned concurrency.

Amazon DevOps Guru Insight Details page contains Recommendations. The suggested recommendation is to configure provisioned concurrency for the AWS Lambda.

Figure 4.6: Amazon DevOps Guru Ongoing Reactive Insight Recommendations

Understanding what happened

Amazon DevOps Guru recommends enabling Provisioned Concurrency for the AWS Lambda functions in order to help it scale better when responding to concurrent requests. As mentioned earlier, Provisioned Concurrency keeps functions initialized by creating the requested number of execution environments so that they can respond to invocations. This is a suggested best practice when building high-traffic applications, such as the one that this sample is mimicking.

In the anomalous AWS Lambda function, we have sample code that is causing delays. This is analogous to application initialization logic within the handler function. It is a best practice for this logic to live outside of the handler function. Because we are mimicking a high-traffic application, the expectation is to receive a large number of concurrent requests. Therefore, it may be advisable to turn on Provisioned Concurrency for the AWS Lambda function. For Provisioned Concurrency pricing, refer to the AWS Lambda Pricing page.

Resolving the Anomaly

To resolve the sample application’s anomaly, we will update the AWS Lambda function code and enable provisioned concurrency for the AWS Lambda infrastructure.

  1. Opening the sample repository in your IDE.
  2. Open the file generate-lambda-devopsguru-insights/lambda-code.py.
  3. Move lines 7-8, the code forcing the AWS Lambda function to respond slowly, above the lambda_handler function definition.
  4. Save the file.
  5. Open the file generate-lambda-devopsguru-insights/lambda-template.yaml.
  6. Uncomment lines 15-17, the code enabling provisioned concurrency in the sample AWS Lambda function.
  7. Save the file.
  8. Deploy these updates to your stack.
cd generate-lambda-devopsguru-insights 
sam deploy --template lambda-template.yaml --stack-name DevOpsGuru-Sample-AnomalousLambda-Stack       

After completing these steps, the duration P50 metric will emit more typical results, thereby causing Amazon DevOps Guru to recognize the anomaly as fixed, and then close the reactive insight as shown below.

Amazon DevOps Guru Insight Summary page displays the reactive insight has been closed.

Figure 5: Amazon DevOps Guru Closed Reactive Insight

Clean Up

When you are finished walking through this post, you will have multiple test resources in your AWS account that should be cleaned up or un-provisioned in order to avoid incurring any further charges.

  1. Opening the sample repository in your IDE.
  2. Run the below AWS SAM CLI command to delete the sample stack.
cd generate-lambda-devopsguru-insights 
sam delete --stack-name DevOpsGuru-Sample-AnomalousLambda-Stack 

Conclusion

As seen in the example above, Amazon DevOps Guru can detect anomalous behavior in an AWS Lambda function, tie it to relevant events that introduced that anomaly, and provide recommendations for remediation by using its pre-trained ML models. All of this was possible by simply enabling Amazon DevOps Guru to monitor the resources with minimal configuration changes and no previous ML expertise. Start using Amazon DevOps Guru today.

About the authors

Harish Vaswani

Harish Vaswani is a Senior Cloud Application Architect at Amazon Web Services. He specializes in architecting and building cloud native applications and enables customers with best practices in their cloud journey. He is a DevOps and Machine Learning enthusiast. Harish lives in New Jersey and enjoys spending time with this family, filmmaking and music production.

Caroline Gluck

Caroline Gluck is a Cloud Application Architect at Amazon Web Services based in New York City, where she helps customer design and build cloud native Data Science applications. Caroline is a builder at heart, with a passion for serverless architecture and Machine Learning. In her spare time, she enjoys traveling, cooking, and spending time with family and friends.

Generating DevOps Guru Proactive Insights for Amazon ECS

Post Syndicated from Trishanka Saikia original https://aws.amazon.com/blogs/devops/generate-devops-guru-proactive-insights-in-ecs-using-container-insights/

Monitoring is fundamental to operating an application in production, since we can only operate what we can measure and alert on. As an application evolves, or the environment grows more complex, it becomes increasingly challenging to maintain monitoring thresholds for each component, and to validate that they’re still set to an effective value. We not only want monitoring alarms to trigger when needed, but also want to minimize false positives.

Amazon DevOps Guru is an AWS service that helps you effectively monitor your application by ingesting vended metrics from Amazon CloudWatch. It learns your application’s behavior over time and then detects anomalies. Based on these anomalies, it generates insights by first combining the detected anomalies with suspected related events from AWS CloudTrail, and then providing the information to you in a simple, ready-to-use dashboard when you start investigating potential issues. Amazon DevOpsGuru makes use of the CloudWatch Containers Insights to detect issues around resource exhaustion for Amazon ECS or Amazon EKS applications. This helps in proactively detecting issues like memory leaks in your applications before they impact your users, and also provides guidance as to what the probable root-causes and resolutions might be.

This post will demonstrate how to simulate a memory leak in a container running in Amazon ECS, and have it generate a proactive insight in Amazon DevOps Guru.

Solution Overview

The following diagram shows the environment we’ll use for our scenario. The container “brickwall-maker” is preconfigured as to how quickly to allocate memory, and we have built this container image and published it to our public Amazon ECR repository. Optionally, you can build and host the docker image in your own private repository as described in step 2 & 3.

After creating the container image, we’ll utilize an AWS CloudFormation template to create an ECS Cluster and an ECS Service called “Test” with a desired count of two. This will create two tasks using our “brickwall-maker” container image. The stack will also enable Container Insights for the ECS Cluster. Then, we will enable resource coverage for this CloudFormation stack in Amazon DevOpsGuru in order to start our resource analysis.

Architecture Diagram showing the service “Test” using the container “brickwall-maker” with a desired count of two. The two ECS Task’s vended metrics are then processed by CloudWatch Container Insights. Both, CloudWatch Container Insights and CloudTrail, are ingested by Amazon DevOps Guru which then makes detected insights available to the user. [Image: DevOpsGuruBlog1.png]V1: DevOpsGuruBlog1.drawio (https://api.quip-amazon.com/2/blob/fbe9AAT37Ge/LdkTqbmlZ8uNj7A44pZbnw?name=DevOpsGuruBlog1.drawio&s=cVbmAWsXnynz) V2: DevOpsGuruBlog1.drawio (https://api.quip-amazon.com/2/blob/fbe9AAT37Ge/SvsNTJLEJOHHBls_kV7EwA?name=DevOpsGuruBlog1.drawio&s=cVbmAWsXnynz) V3: DevOpsGuruBlog1.drawio (https://api.quip-amazon.com/2/blob/fbe9AAT37Ge/DqKTxtQvmOLrzM3KcF_oTg?name=DevOpsGuruBlog1.drawio&s=cVbmAWsXnynz)

Source provided on GitHub:

  • DevOpsGuru.yaml
  • EnableDevOpsGuruForCfnStack.yaml
  • Docker container source

Steps:

1. Create your IDE environment

In the AWS Cloud9 console, click Create environment, give your environment a Name, and click Next step. On the Environment settings page, change the instance type to t3.small, and click Next step. On the Review page, make sure that the Name and Instance type are set as intended, and click Create environment. The environment creation will take a few minutes. After that, the AWS Cloud9 IDE will open, and you can continue working in the terminal tab displayed in the bottom pane of the IDE.

Install the following prerequisite packages, and ensure that you have docker installed:

sudo yum install -y docker
sudo service docker start 
docker --version
Clone the git repository in order to download the required CloudFormation templates and code:

git clone https://github.com/aws-samples/amazon-devopsguru-brickwall-maker

Change to the directory that contains the cloned repository

cd amazon-devopsguru-brickwall-maker

2. Optional : Create ECR private repository

If you want to build your own container image and host it in your own private ECR repository, create a new repository with the following command and then follow the steps to prepare your own image:

aws ecr create-repository —repository-name brickwall-maker

3. Optional: Prepare Docker Image

Authenticate to Amazon Elastic Container Registry (ECR) in the target region

aws ecr get-login-password --region ap-northeast-1 | \
    docker login --username AWS --password-stdin \
    123456789012.dkr.ecr.ap-northeast-1.amazonaws.com

In the above command, as well as in the following shown below, make sure that you replace 123456789012 with your own account ID.

Build brickwall-maker Docker container:

docker build -t brickwall-maker .

Tag the Docker container to prepare it to be pushed to ECR:

docker tag brickwall-maker:latest 123456789012.dkr.ecr.ap-northeast-1.amazonaws.com/brickwall-maker:latest

Push the built Docker container to ECR

docker push 123456789012.dkr.ecr.ap-northeast-1.amazonaws.com/brickwall-maker:latest

4. Launch the CloudFormation template to deploy your ECS infrastructure

To deploy your ECS infrastructure, run the following command (replace your own private ECR URL or use our public URL) in the ParameterValue) to launch the CloudFormation template :

aws cloudformation create-stack --stack-name myECS-Stack \
--template-body file://DevOpsGuru.yaml \
--capabilities CAPABILITY_IAM CAPABILITY_NAMED_IAM \
--parameters ParameterKey=ImageUrl,ParameterValue=public.ecr.aws/p8v8e7e5/myartifacts:brickwallv1

5. Enable DevOps Guru to monitor the ECS Application

Run the following command to enable DevOps Guru for monitoring your ECS application:

aws cloudformation create-stack \
--stack-name EnableDevOpsGuruForCfnStack \
--template-body file://EnableDevOpsGuruForCfnStack.yaml \
--parameters ParameterKey=CfnStackNames,ParameterValue=myECS-Stack

6. Wait for base-lining of resources

This step lets DevOps Guru complete the baselining of the resources and benchmark the normal behavior. For this particular scenario, we recommend waiting two days before any insights are triggered.

Unlike other monitoring tools, the DevOps Guru dashboard would not present any counters or graphs. In the meantime, you can utilize CloudWatch Container Insights to monitor the cluster-level, task-level, and service-level metrics in ECS.

7. View Container Insights metrics

  • Open the CloudWatch console.
  • In the navigation pane, choose Container Insights.
  • Use the drop-down boxes near the top to select ECS Services as the resource type to view, then select DevOps Guru as the resource to monitor.
  • The performance monitoring view will show you graphs for several metrics, including “Memory Utilization”, which you can watch increasing from here. In addition, it will show the list of tasks in the lower “Task performance” pane showing the “Avg CPU” and “Avg memory” metrics for the individual tasks.

8. Review DevOps Guru insights

When DevOps Guru detects an anomaly, it generates a proactive insight with the relevant information needed to investigate the anomaly, and it will list it in the DevOps Guru Dashboard.

You can view the insights by clicking on the number of insights displayed in the dashboard. In our case, we expect insights to be shown in the “proactive insights” category on the dashboard.

Once you have opened the insight, you will see that the insight view is divided into the following sections:

  • Insight Overview with a basic description of the anomaly. In this case, stating that Memory Utilization is approaching limit with details of the stack that is being affected by the anomaly.
  • Anomalous metrics consisting of related graphs and a timeline of the predicted impact time in the future.
  • Relevant events with contextual information, such as changes or updates made to the CloudFormation stack’s resources in the region.
  • Recommendations to mitigate the issue. As seen in the following screenshot, it recommends troubleshooting High CPU or Memory Utilization in ECS along with a link to the necessary documentation.

The following screenshot illustrates an example insight detail page from DevOps Guru

 An example of an ECS Service’s Memory Utilization approaching a limit of 100%. The metric graph shows the anomaly starting two days ago at about 22:00 with memory utilization increasing steadily until the anomaly was reported today at 18:08. The graph also shows a forecast of the memory utilization with a predicted impact of reaching 100% the next day at about 22:00.

Potentially related events on a timeline and below them a list of recommendations. Two deployment events are shown without further details on a timeline. The recommendations table links to one document on how to troubleshoot high CPU or memory utilization in Amazon ECS.

Conclusion

This post describes how DevOps Guru continuously monitors resources in a particular region in your AWS account, as well as proactively helps identify problems around resource exhaustion such as running out of memory, in advance. This helps IT operators take preventative actions even before a problem presents itself, thereby preventing downtime.

Cleaning up

After walking through this post, you should clean up and un-provision the resources in order to avoid incurring any further charges.

  1. To un-provision the CloudFormation stacks, on the AWS CloudFormation console, choose Stacks. Select the stack name, and choose Delete.
  2. Delete the AWS Cloud9 environment.
  3. Delete the ECR repository.

About the authors

Trishanka Saikia

Trishanka Saikia is a Technical Account Manager for AWS. She is also a DevOps enthusiast and works with AWS customers to design, deploy, and manage their AWS workloads/architectures.

Gerhard Poul

Gerhard Poul is a Senior Solutions Architect at Amazon Web Services based in Vienna, Austria. Gerhard works with customers in Austria to enable them with best practices in their cloud journey. He is passionate about infrastructure as code and how cloud technologies can improve IT operations.

Automate Amazon Redshift Cluster management operations using AWS CloudFormation

Post Syndicated from Anusha Challa original https://aws.amazon.com/blogs/big-data/automate-amazon-redshift-cluster-management-operations-using-aws-cloudformation/

Amazon Redshift is the fastest and most widely used cloud data warehouse. Tens of thousands of customers run business-critical workloads on Amazon Redshift. Amazon Redshift offers many features that enable you to build scalable, highly performant, cost-effective, and easy-to-manage workloads. For example, you can scale an Amazon Redshift cluster up or down based on your workload requirements, pause clusters when not in use to suspend on-demand billing, and enable relocation. You can automate these management activities either using the Amazon Redshift API, AWS Command Line Interface (AWS CLI), or AWS CloudFormation.

AWS CloudFormation helps you model and set up your AWS resources so that you can spend less time managing those resources and more time focusing on your applications that run in AWS. You create a template that describes all the AWS resources that you want, and AWS CloudFormation takes care of provisioning and configuring those resources for you.

In this post, we walk through how to use AWS CloudFormation to automate some of the most common Amazon Redshift cluster management operations:

  • Create an Amazon Redshift cluster via the following methods:
    • Restore a cluster from a snapshot
    • Create an encrypted Amazon Redshift cluster
  • Perform cluster management operations:
    • Pause or resume a cluster
    • Perform elastic resize or classic resize
    • Add or remove Identity and Access Management (IAM) roles to cluster permissions
    • Rotate encryption keys
    • Modify snapshot retention period for automated and manual snapshots
    • Enable or disable snapshot copy to another AWS Region
    • Create a parameter group with required workload management (WLM) configuration and associate it to the Amazon Redshift cluster
    • Enable concurrency scaling by modifying WLM configuration
    • Enable or disable audit logging

For a complete list of operations that you can automate using AWS CloudFormation, see Amazon Redshift resource type reference.

Benefits of using CloudFormation templates

Many of our customers build fully automated production environments and use AWS CloudFormation to aid automation. AWS CloudFormation offers an easy way to create and manage AWS Infrastructure, by treating infrastructure as code. CloudFormation templates create infrastructure resources in a group called a stack, and allow you to define and customize all components. CloudFormation templates introduce the ability to implement version control, and the ability to quickly and reliably replicate your infrastructure. This significantly simplifies your continuous integration and continuous delivery (CI/CD) pipelines and keeps multiple environments in sync. The CloudFormation template becomes a repeatable, single source of truth for your infrastructure. You can create CloudFormation templates in YAML and JSON formats. The templates provided in this post use YAML format. Amazon Redshift clusters are one of the resources that you can provision and manage using AWS CloudFormation.

Create an Amazon Redshift cluster using AWS CloudFormation

With AWS CloudFormation, you can automate Amazon Redshift cluster creation. In this section, we describe two additional ways of creating Amazon Redshift clusters: by restoring from an existing snapshot or creating using default options. In the next section, we describe how you can manage the lifecycle of a cluster by performing cluster management operations using AWS CloudFormation.

Restore an Amazon Redshift cluster from a snapshot

Snapshots are point-in-time backups of a cluster. Amazon Redshift periodically takes automated snapshots of the cluster. You can also take a snapshot manually any time. A snapshot contains data from any databases that are running on the cluster. Snapshots enable data protection, and you can also use them to build new environments to perform application testing, data mining, and more. When you start a new development or enhancement project, you may want to build a new Amazon Redshift cluster that has the same code and data as that of your production, so you can develop and test your code there before deploying it. To do this, create the new cluster by restoring from your production cluster’s snapshot.

You can use AWS CloudFormation to automate the restore operation. If you have multiple projects with different timelines or requirements, you can build multiple Amazon Redshift clusters in an automatic and scalable fashion using AWS CloudFormation.

To create a new Amazon Redshift cluster by restoring from an existing snapshot, create a CloudFormation stack using a CloudFormation template that has the AWS::Redshift::Cluster resource with the following mandatory properties:

  • SnapshotIdentifier – The name of the snapshot from which to create the new cluster
  • ClusterIdentifier – A unique identifier of your choice for the cluster
  • NodeType – The node type to be provisioned for the cluster
  • ClusterType – The type of the cluster, either single-node or multi-node (recommended for production workloads)
  • NumberofNodes – The number of compute nodes in the cluster
  • DBName – The name of the first database to be created in the new cluster
  • MasterUserName – The user name associated with the admin user account for the cluster that is being created
  • MasterUserPassword – The password associated with the admin user account for the cluster that is being created

The following is a sample CloudFormation template that restores a snapshot with identifier cfn-blog-redshift-snapshot and creates a two-node Amazon Redshift cluster with identifier cfn-blog-redshift-cluster and node type ra3.4xlarge:

AWSTemplateFormatVersion: 2010-09-09
Description: Redshift CFN Blog Cluster Stack
Parameters:
  MasterUserPasswordParam:
    NoEcho: true
    Type: String
    Description: Enter Master User Password 
Resources:
  RedshiftCluster:
    Type: "AWS::Redshift::Cluster"
    Properties:
      SnapshotIdentifier: "cfn-blog-redshift-snapshot"
      ClusterIdentifier: "cfn-blog-redshift-cluster"
      ClusterType: "multi-node"
      NodeType: "ra3.4xlarge"
      NumberOfNodes: "2"
      DBName: "dev"
      MasterUsername: "username"
      Encrypted: true
      MasterUserPassword: !Ref MasterUserPasswordParam
Outputs:
  ClusterName:
    Value: !Ref RedshiftCluster

Create an encrypted Amazon Redshift cluster

You can enable database encryption for your clusters to protect data at rest.

Use the following sample CloudFormation template to create an encrypted Amazon Redshift cluster. This template has basic properties only to make this walkthrough easy to understand. For your production workload, we recommend following the best practices as described in the post Automate Amazon Redshift cluster creation using AWS CloudFormation.

AWSTemplateFormatVersion: 2010-09-09
Description: Redshift CFN Blog Cluster Stack
Parameters:
  MasterUserPasswordParam:
    NoEcho: true
    Type: String
    Description: Enter Master User Password. Must be 8-64 characters long. Must contain at least one uppercase letter, one lowercase letter and one number. Can be any printable ASCII character except “/”, ““”, or “@”.
Resources:
  RedshiftCluster:
    Type: "AWS::Redshift::Cluster"
    Properties:
      ClusterIdentifier: "cfn-blog-redshift-cluster"
      ClusterType: "multi-node"
      NodeType: "ra3.4xlarge"
      NumberOfNodes: "2"
      DBName: "dev"
      MasterUsername: "username"
      Encrypted: true
      MasterUserPassword: !Ref MasterUserPasswordParam
Outputs:
  ClusterName:
    Value: !Ref RedshiftCluster

In AWS CloudFormation, create a stack using this template. When the creation of CloudFormation stack is complete, you can see a new encrypted Amazon Redshift cluster called cfn-blog-redshift-cluster. For the rest of this post, we use this CloudFormation template as the base and explore how to modify the template to perform various Amazon Redshift management operations.

To create a new CloudFormation stack that uses the preceding template via the AWS CloudFormation console, complete the following steps:

  1. On the AWS CloudFormation console, choose Create Stack.
  2. On the drop-down menu, choose With new resources (standard).
  3. For Prepare template, choose Template is ready.
  4. For Specify template, choose Upload a template file.
  5. Save the provided CloudFormation template in a .yaml file and upload it.
  6. Choose Next.
  7. Enter a name for the stack. For this post, we use RedshiftClusterStack-CFNBlog.
  8. Choose Next.
  9. Choose Next again.
  10. Choose Create Stack.

To create the CloudFormation stack using the AWS CLI, run the following command:

aws cloudformation create-stack \
--stack-name RedshiftClusterStack-CFNBlog \
--template-body <<CloudFormation template’s file name>> \

The status of the stack changes to CREATE_IN_PROGRESS. After the Amazon Redshift cluster is created, the status changes to CREATE_COMPLETE. Navigate to the Amazon Redshift console to verify that the cluster is created and the status is Available.

Perform cluster management operations

Amazon Redshift customers have the flexibility to perform various cluster operations to implement workload security, perform cost-optimization, and manage scale. Often, we see our customers perform these operations in all their environments, such as DEV, QA, and PROD, to keep them in sync. You can automate these operations using CloudFormation stack updates by updating the CloudFormation template you used to create the cluster.

To perform these management operations using CloudFormation stack updates, you can create your initial CloudFormation stack in one of the two ways:

  • If your cluster isn’t already created, you can create it using AWS CloudFormation.
  • If you have an existing cluster, create a CloudFormation stack with the using existing resources option. Provide a template of the existing cluster and have a CloudFormation stack associated with the resource.

Each subsequent cluster management operation is an update to the base CloudFormation stack’s template. CloudFormation stack updates enable you to make changes to a stack’s resources by performing an update to the stack instead of deleting it and creating a new stack. Update to either add, modify, or remove relevant property values in the AWS::Redshift::Cluster resource to trigger the respective Amazon Redshift cluster management operation. AWS CloudFormation compares the changes you submit with the current state of your stack and applies only the changes. For a summary of the update workflow, see How does AWS CloudFormation work?

The following steps describe how to perform a CloudFormation stack update on the RedshiftClusterStack-CFNBlog stack that you created in the previous section.

  1. On the AWS CloudFormation console, choose Stacks in the navigation pane.
  2. Choose the stack you want to update (for this post, RedshiftClusterStack-CFNBlog).
  3. Choose Update.
  4. In the Prerequisite – Prepare template section, choose Replace current template.
  5. For Specify template, choose Upload a template file.
  6. Make changes to your current CloudFormation template based on the operation you wish to perform on the Amazon Redshift cluster.
  7. Save the updated CloudFormation template .yaml file and upload it.
  8. Choose Next.
  9. Choose Next again.
  10. Choose Next again.
  11. Choose Update Stack.

To update CloudFormation stack using the AWS CLI, run the following command:

aws cloudformation update-stack \
--stack-name RedshiftClusterStack-CFNBlog \
--template-body <<Updated CloudFormation template’s file name>> \

In this section, we look at some AWS CloudFormation properties available for Amazon Redshift clusters and dive deep to understand how to update the CloudFormation template and add, remove, or modify these properties to automate some of the most common cluster management operations. We use the RedshiftClusterStack-CFNBlog stack that you created in the previous section as an example.

Pause or resume cluster

If an Amazon Redshift cluster isn’t being used for a certain period of time, you can pause it easily and suspend on-demand billing. For example, you can suspend on-demand billing on a cluster that is used for development when it’s not in use. While the cluster is paused, you’re only charged for the cluster’s storage. This adds significant flexibility in managing operating costs for your Amazon Redshift clusters. You can resume a paused cluster when you’re ready to use it. To pause a cluster, update the cluster’s current CloudFormation stack template to add a new property called ResourceAction with the value pause-cluster. To pause the cluster created using the RedshiftClusterStack-CFNBlog stack, you can perform a stack update and use the following updated CloudFormation template:

AWSTemplateFormatVersion: 2010-09-09
Description: Redshift CFN Blog Cluster Stack
Parameters:
  MasterUserPasswordParam:
    NoEcho: true
    Type: String
    Description: Enter Master User Password
Resources:
  RedshiftCluster:
    Type: "AWS::Redshift::Cluster"
    Properties:
      #Added this property to pause cluster
      ResourceAction: "pause-cluster"
      ClusterIdentifier: "cfn-blog-redshift-cluster"
      ClusterType: "multi-node"
      NodeType: "ra3.4xlarge"
      NumberOfNodes: "2"
      DBName: "dev"
      MasterUsername: "username"
      Encrypted: true
      MasterUserPassword: !Ref MasterUserPasswordParam
Outputs:
  ClusterName:
    Value: !Ref RedshiftCluster

Follow the steps in the previous section to update the stack. When the stack update operation is in progress, the cluster’s status changes from Available to Modifying, Pausing.

When the stack update is complete, the cluster’s status changes to Paused.

When you’re ready to use the cluster, you can resume it. To resume the cluster, update the cluster’s current CloudFormation stack template and change the value of the ResourceAction property to resume-cluster. You can use the following template to perform a stack update operation to resume the cluster created using the RedshiftClusterStack-CFNBlog stack:

AWSTemplateFormatVersion: 2010-09-09
Description: Redshift CFN Blog Cluster Stack
Parameters:
  MasterUserPasswordParam:
    NoEcho: true
    Type: String
    Description: Enter Master User Password
Resources:
  RedshiftCluster:
    Type: "AWS::Redshift::Cluster"
    Properties:
      #Added this property to resume cluster
      ResourceAction: "resume-cluster"
      ClusterIdentifier: "cfn-blog-redshift-cluster"
      ClusterType: "multi-node"
      NodeType: "ra3.4xlarge"
      NumberOfNodes: "2"
      DBName: "dev"
      MasterUsername: "username"
      Encrypted: true
      MasterUserPassword: !Ref MasterUserPasswordParam
Outputs:
  ClusterName:
    Value: !Ref RedshiftCluster

Follow the steps in the previous section to update the stack. When the stack update is in progress, the cluster’s status changes from Paused to Modifying, Resuming.

When the stack update is complete, the cluster’s status changes to Available.

Perform elastic resize or classic resize

Data warehouse workloads often have changing needs. You may add a new line of business and thereby ingest more data into the data warehouse, or you may have a new analytics application for your business users and add new ETL processes to support it. When your compute requirements change due to changing needs, you can resize your Amazon Redshift cluster using one of the following approaches:

  • Elastic resize – This changes the node type, number of nodes, or both. Typically, it completes within 10–15 minutes when adding or removing nodes of the same type. Cross-instance elastic resize can take up to 45 minutes. We recommend using elastic resize whenever possible, because it completes much more quickly than classic resize. Elastic resize has some growth and reduction limits on the number of nodes.
  • Classic resize – You can also use classic resize to change the node type, number of nodes, or both. We recommend this option only when you’re resizing to a configuration that isn’t available through elastic resize, because it takes considerably more time depending on your data size.

You can automate both elastic resize and classic resize operations on Amazon Redshift clusters using AWS CloudFormation. The default resize operation when initiated using a CloudFormation stack update is elastic resize. If elastic resize isn’t possible for your configuration, AWS CloudFormation throws an error. You can force the resize operation to be classic resize by specifying the value of the property Classic to Boolean true in the CloudFormation template provided in the update stack operation. If you don’t provide this parameter or set the value to false, the resize type is elastic. To initiate the resize operation, update the cluster’s current CloudFormation stack template and change the value of NodeType and NumberOfNodes properties as per your requirement.

To perform an elastic resize from the initial two-node RA3 4xlarge configuration to NumberOfNodes:2 and NodeType:ra3.16xlarge configuration on the Amazon Redshift cluster cfn-blog-redshift-cluster, you can update the current template of the RedshiftClusterStack-CFNBlog stack as shown in the following CloudFormation template:

AWSTemplateFormatVersion: 2010-09-09
Description: Redshift CFN Blog Cluster Stack
Parameters:
  MasterUserPasswordParam:
    NoEcho: true
    Type: String
    Description: Enter Master User Password
Resources:
  RedshiftCluster:
    Type: "AWS::Redshift::Cluster"
    Properties:
      ResourceAction: "resume-cluster"
      ClusterIdentifier: "cfn-blog-redshift-cluster"
      ClusterType: "multi-node"
      #Modified the below 2 properties to perform elastic resize
      NodeType: "ra3.16xlarge"
      NumberOfNodes: "2"
      DBName: "dev"
      MasterUsername: "username"
      Encrypted: true
      MasterUserPassword: !Ref MasterUserPasswordParam
Outputs:
  ClusterName:
    Value: !Ref RedshiftCluster

Alternatively, if you want to force this resize to be a classic resize, use the following CloudFormation template to update the RedshiftClusterStack-CFNBlog stack. This template has an additional property, Classic with Boolean value true, to initiate classic resize, in addition to having updated NodeType and NumberOfNodes properties.

AWSTemplateFormatVersion: 2010-09-09
Description: Redshift CFN Blog Cluster Stack
Parameters:
  MasterUserPasswordParam:
    NoEcho: true
    Type: String
    Description: Enter Master User Password
Resources:
  RedshiftCluster:
    Type: "AWS::Redshift::Cluster"
    Properties:
      ResourceAction: "resume-cluster"
      ClusterIdentifier: "cfn-blog-redshift-cluster"
      ClusterType: "multi-node"
      #Modified the below 3 properties to perform classic resize
      NodeType: "ra3.16xlarge"
      NumberOfNodes: "2"
      Classic: true
      DBName: "dev"
      MasterUsername: "username"
      Encrypted: true
      MasterUserPassword: !Ref MasterUserPasswordParam
Outputs:
  ClusterName:
    Value: !Ref RedshiftCluster

Follow the steps earlier in this post to update the stack. For both elastic resize and classic resize, when the stack update is in progress, the cluster’s status changes from Available to Resizing.

Add or remove IAM roles to cluster permissions

Your Amazon Redshift cluster needs permissions to access other AWS services on your behalf. For the required permissions, add IAM roles to cluster permissions. You can add up to 10 IAM roles. For instructions on creating roles, see Create an IAM role.

To add IAM roles to the cluster, update the cluster’s current CloudFormation stack template and add the IamRoles property with a list of IAM roles you want to add. For example, to add IAM roles cfn-blog-redshift-role-1 and cfn-blog-redshift-role-2 to the cluster cfn-blog-redshift-cluster, you can update the RedshiftClusterStack-CFNBlog stack using the following CloudFormation template. In this template, the new array property IamRoles has been added with values cfn-blog-redshift-role-1 and cfn-blog-redshift-role-2.

AWSTemplateFormatVersion: 2010-09-09
Description: Redshift CFN Blog Cluster Stack
Parameters:
  MasterUserPasswordParam:
    NoEcho: true
    Type: String
    Description: Enter Master User Password
Resources:
  RedshiftCluster:
    Type: "AWS::Redshift::Cluster"
    Properties:
      ResourceAction: "resume-cluster"
      ClusterIdentifier: "cfn-blog-redshift-cluster"
      ClusterType: "multi-node"
      NodeType: "ra3.4xlarge"
      NumberOfNodes: "2"
      #Added IAMRoles property with ARNs for 2 roles
      IamRoles: [
                    !Sub "arn:${AWS::Partition}:iam::${AWS::AccountId}:role/cfn-blog-redshift-role-1",
                    !Sub "arn:${AWS::Partition}:iam::${AWS::AccountId}:role/cfn-blog-redshift-role-2"
                ]
      DBName: "dev"
      MasterUsername: "username"
      Encrypted: true
      MasterUserPassword: !Ref MasterUserPasswordParam
Outputs:
  ClusterName:
    Value: !Ref RedshiftCluster

Now, if you want to remove the IAM role cfn-blog-redshift-role-2 from the cfn-blog-redshift-cluster cluster, you can perform another CloudFormation stack update on RedshiftClusterStack-CFNBlog using the following CloudFormation template. This template contains only those IAM roles you want to retain.

AWSTemplateFormatVersion: 2010-09-09
Description: Redshift CFN Blog Cluster Stack
Parameters:
  MasterUserPasswordParam:
    NoEcho: true
    Type: String
    Description: Enter Master User Password
Resources:
  RedshiftCluster:
    Type: "AWS::Redshift::Cluster"
    Properties:
      ResourceAction: "resume-cluster"
      ClusterIdentifier: "cfn-blog-redshift-cluster"
      ClusterType: "multi-node"
      NodeType: "ra3.4xlarge"
      NumberOfNodes: "2"
      #Updated IAMRoles property to remove role-2
      IamRoles: [
                    !Sub "arn:${AWS::Partition}:iam::${AWS::AccountId}:role/cfn-blog-redshift-role-1"
                ]
      DBName: "dev"
      MasterUsername: "username"
      Encrypted: true
      MasterUserPassword: !Ref MasterUserPasswordParam
Outputs:
  ClusterName:
    Value: !Ref RedshiftCluster

Follow the steps earlier in this post to update the stack. When the stack update is in progress, the cluster’s status changes from Available to Available, Modifying.

Navigate to cluster’s properties tab and the Cluster Permissions section to validate that the IAM roles were associated to the cluster after the stack update is complete.

Rotate encryption keys on the cluster

You can enable database encryption for your Amazon Redshift clusters to protect data at rest. You can rotate encryption keys using AWS CloudFormation. To rotate encryption keys, update the base CloudFormation template to add the RotateEncryptionKey property and set it to Boolean true. For example, you can use the following CloudFormation template to rotate the encryption key for cfn-blog-redshift-cluster by performing an update on the CloudFormation stack RedshiftClusterStack-CFNBlog:

AWSTemplateFormatVersion: 2010-09-09
Description: Redshift CFN Blog Cluster Stack
Parameters:
  MasterUserPasswordParam:
    NoEcho: true
    Type: String
    Description: Enter Master User Password
Resources:
  RedshiftCluster:
    Type: "AWS::Redshift::Cluster"
    Properties:
      ResourceAction: "resume-cluster"
      ClusterIdentifier: "cfn-blog-redshift-cluster"
      ClusterType: "multi-node"
      NodeType: "ra3.4xlarge"
      NumberOfNodes: "2"
      #Added RotateEncryptionKey property
      RotateEncryptionKey: true
      DBName: "dev"
      MasterUsername: "username"
      Encrypted: true
      MasterUserPassword: !Ref MasterUserPasswordParam
Outputs:
  ClusterName:
    Value: !Ref RedshiftCluster

Follow the steps earlier in this post to update the stack. When the stack update is in progress, the cluster’s status changes from Available to Modifying, Rotating Keys. It takes approximately 2 minutes to rotate the encryption keys.

Modify the snapshot retention period for automated and manual snapshots

Amazon Redshift takes periodic automated snapshots of the cluster. By default, automated snapshots are retained for 24 hours. You can change the retention period of automated snapshots to 0–35 days. Amazon Redshift deletes automated snapshots at the end of a snapshot’s retention period, when you disable automated snapshots for the cluster or delete the cluster.

If you set the automated snapshot retention period to 0 days, the automated snapshots feature is disabled and any existing automated snapshots are deleted. Exercise caution before setting the automated snapshot retention period to 0.

You can take manual snapshots of the cluster any time. By default, manual snapshots are retained indefinitely, even after you delete the cluster. You can also specify the retention period when you create a manual snapshot. When the snapshot retention period is modified on automated snapshots, it applies to both existing and new automated snapshots. In contrast, when the snapshot retention period is modified on manual snapshots, it applies to new manual snapshots only.

To modify the retention period on snapshots, update your current cluster’s CloudFormation stack template. Add or update the AutomatedSnapshotRetentionPeriod property with an integer value (must be between 0–35) indicating the new retention period in days for automated snapshots, and the ManualSnapshotRetentionPeriod property with an integer value (must be between 1–3653) indicating the new retention period in days for manual snapshots.

The following CloudFormation template sets the AutomatedSnapshotRetentionPeriod to 7 days and ManualSnapshotRetentionPeriod to 90 days on cfn-blog-redshift-cluster when you update the current CloudFormation stack RedshiftClusterStack-CFNBlog:

AWSTemplateFormatVersion: 2010-09-09
Description: Redshift CFN Blog Cluster Stack
Parameters:
  MasterUserPasswordParam:
    NoEcho: true
    Type: String
    Description: Enter Master User Password
Resources:
  RedshiftCluster:
    Type: "AWS::Redshift::Cluster"
    Properties:
      ResourceAction: "resume-cluster"
      ClusterIdentifier: "cfn-blog-redshift-cluster"
      ClusterType: "multi-node"
      NodeType: "ra3.4xlarge"
      NumberOfNodes: "2"
      #Add snapshot retention properties
      AutomatedSnapshotRetentionPeriod: 7
      ManualSnapshotRetentionPeriod: 90
      DBName: "dev"
      MasterUsername: "username"
      Encrypted: true
      MasterUserPassword: !Ref MasterUserPasswordParam
Outputs:
  ClusterName:
    Value: !Ref RedshiftCluster

Enable or disable snapshot copies to another Region

You can configure your Amazon Redshift cluster to copy all new manual and automated snapshots for a cluster to another Region. You can choose how long to keep copied automated or manual snapshots in the destination Region. If the cluster is encrypted, because AWS Key Management Service (AWS KMS) keys are specific to a Region, you must configure a snapshot copy grant for a primary key in the destination Region. For information on how to create a snapshot copy grant, see Copying AWS KMS–encrypted snapshots to another AWS Region. Make sure that the snapshot copy grant is created before enabling snapshot copy to another Region using CloudFormation templates.

To enable snapshot copy to another Region, update your current cluster’s CloudFormation stack template and add or update the following properties:

  • DestinationRegion – Required to enable snapshot copy. It specifies the destination Region that snapshots are automatically copied to.
  • SnapshotCopyRetentionPeriod – Optional. Modifies the number of days to retain snapshots in the destination Region. If this property is not specified, the retention period is the same as that of the source Region. By default, this operation only modifies the retention period of existing and new copied automated snapshots. To change the retention period of copied manual snapshots using this property, set the SnapshotCopyManual property to true.
  • SnapshotCopyManual – Indicates whether to apply the snapshot retention period to newly copied manual snapshots instead of automated snapshots. If you set this option, only newly copied manual snapshots have the new retention period.
  • SnapshotCopyGrantName – The name of the snapshot copy grant.

To copy snapshots taken from cfn-blog-redshift-cluster into the Region us-west-1 and to modify the retention period of the newly copied manual snapshots to 90 days, update the current CloudFormation stack RedshiftClusterStack-CFNBlog with the following CloudFormation template:

AWSTemplateFormatVersion: 2010-09-09
Description: Redshift CFN Blog Cluster Stack
Parameters:
  MasterUserPasswordParam:
    NoEcho: true
    Type: String
    Description: Enter Master User Password
Resources:
  RedshiftCluster:
    Type: "AWS::Redshift::Cluster"
    Properties:
      ResourceAction: "resume-cluster"
      ClusterIdentifier: "cfn-blog-redshift-cluster"
      ClusterType: "multi-node"
      NodeType: "ra3.4xlarge"
      NumberOfNodes: "2"
      #Add cross-region snapshot copy properties
      DestinationRegion: "us-west-1"
      SnapshotCopyGrantName: "cfn-blog-redshift-cross-region-snapshot-copy-grant"
      SnapshotCopyManual: true
      SnapshotCopyRetentionPeriod: 90
      DBName: "dev"
      MasterUsername: "username"
      Encrypted: true
      MasterUserPassword: !Ref MasterUserPasswordParam
Outputs:
  ClusterName:
    Value: !Ref RedshiftCluster

To disable cross-Region snapshot copy, update your current CloudFormation stack’s template and remove the properties DestinationRegion, SnapshotCopyRetentionPeriod, SnapshotCopyManual and SnapshotCopyGrantName.

Create a parameter group with required WLM configuration and assign it to an Amazon Redshift cluster

You can use AWS CloudFormation to create an Amazon Redshift parameter group and associate it to an Amazon Redshift cluster. If you don’t associate a parameter group, the default parameter group is assigned, which has the defaults for parameter values and WLM configuration. When you create a new parameter group, it also has the defaults for parameters, unless you override them. The following CloudFormation template overrides the default values for the require_ssl and wlm_json_configuration parameters. The WLM configuration is specified in JSON format. In this template, automatic WLM configuration is defined on cfn-blog-redshift-cluster with three queues: etl_queue, reporting_queue, and the default queue, with the following specifications:

  • Priority for etl_queue is set to highest. It’s configured to route all queries run by users belonging to the group named etl_group to etl_queue.
  • Priority for reporting_queue is set to normal. It’s configured to route all queries run by users belonging to any group name with the word report in it or any query having a query group with the word report in it to the reporting_queue.
  • The following three query monitoring rules are defined to protect reporting_queue from bad queries:
    • When query runtime is greater than 7,200 seconds (2 hours), the query is stopped.
    • If a query has a nested loop join with more than 1,000,000 rows, its priority is changed to lowest.
    • If any query consumes more than 50% CPU utilization, it is logged.
  • All other queries are routed to the default queue. Priority for default_queue is set to lowest.
  • The following three query monitoring rules are defined to protect the default queue from bad queries:
    • If a query has a nested loop join with more than 1,000,000 rows, it is stopped.
    • If a query has a large return set and is returning more than 1,000,000 rows, it is stopped.
    • If more than 10 GB spilled to disk for a query, it is stopped.
AWSTemplateFormatVersion: 2010-09-09
Description: Redshift CFN Blog Cluster Stack
Parameters:
  MasterUserPasswordParam:
    NoEcho: true
    Type: String
    Description: Enter Master User Password
Resources:
  #Add parameter group resource
  RedshiftClusterParameterGroup: 
    Type: "AWS::Redshift::ClusterParameterGroup"
    Properties: 
      Description: "CFNBlog-Redshift-Cluster-parameter-group"
      ParameterGroupFamily: "redshift-1.0"
      Parameters: 
        - 
          ParameterName: "require_ssl"
          ParameterValue: "true"
        -
          ParameterName: "wlm_json_configuration"
          ParameterValue: "[
                            {
                              \"name\":\"etl_queue\",
                              \"user_group\":[\"etl_user\"],
                              \"auto_wlm\":true,
                              \"queue_type\":\"auto\",
                              \"priority\":\"highest\"
                            },
                            {
                              \"name\":\"reporting_queue\",
                              \"user_group\":[\"%report%\"],
                              \"user_group_wild_card\":1,
                              \"query_group\":[\"%report%\"],
                              \"query_group_wild_card\":1,
                              \"auto_wlm\":true,
                              \"queue_type\":\"auto\",
                              \"priority\":\"normal\",
                              \"rules\":[
                                        {
                                          \"rule_name\":\"timeout_2hours\",
                                          \"predicate\":[
                                                        {
                                                          \"metric_name\":\"query_execution_time\",
                                                          \"operator\":\">\",\"value\":7200
                                                        }
                                                      ],
                                          \"action\":\"abort\"
                                        },
                                        {
                                          \"rule_name\":\"nested_loop_reporting\",
                                          \"action\":\"change_query_priority\",
                                          \"predicate\":[
                                                        {
                                                          \"metric_name\":\"nested_loop_join_row_count\",
                                                          \"operator\":\">\",\"value\":1000000
                                                        }
                                                      ],
                                          \"value\":\"lowest\"
                                        },
                                        {
                                          \"rule_name\":\"expensive_computation\",
                                          \"predicate\":[
                                                        {
                                                          \"metric_name\":\"query_cpu_usage_percent\",
                                                          \"operator\":\">\",\"value\":50
                                                        }
                                                      ],
                                          \"action\":\"log\"
                                        }
                                      ]
                            },
                            {
                              \"name\":\"Default queue\",
                              \"auto_wlm\":true,
                              \"priority\":\"lowest\",
                              \"rules\":[
                                        {
                                          \"rule_name\":\"nested_loop\",
                                          \"action\":\"abort\",
                                          \"predicate\":[
                                                        {
                                                          \"metric_name\":\"nested_loop_join_row_count\",
                                                          \"operator\":\">\",\"value\":1000000
                                                        }
                                                      ]
                                        },
                                        {
                                          \"rule_name\":\"large_return_set\",
                                          \"action\":\"abort\",
                                          \"predicate\":[
                                                        {
                                                          \"metric_name\":\"return_row_count\",
                                                          \"operator\":\">\",\"value\":1000000
                                                        }
                                                      ]
                                        },
                                        {
                                          \"rule_name\":\"large_spill_to_disk\",
                                          \"action\":\"abort\",
                                          \"predicate\":[
                                                        {
                                                          \"metric_name\":\"query_temp_blocks_to_disk\",
                                                          \"operator\":\">\",
                                                          \"value\":10000
                                                        }
                                                      ]
                                        }
                                      ]
                            },
                            {
                              \"short_query_queue\":true
                            }
                          ]"
  RedshiftCluster:
    Type: "AWS::Redshift::Cluster"
    Properties:
      ResourceAction: "resume-cluster"
      ClusterIdentifier: "cfn-blog-redshift-cluster"
      ClusterType: "multi-node"
      NodeType: "ra3.4xlarge"
      NumberOfNodes: "2"
      DBName: "dev"
      MasterUsername: "username"
      Encrypted: true
      MasterUserPassword: !Ref MasterUserPasswordParam
      #Add parameter to associate parameter group
      ClusterParameterGroupName: !Ref RedshiftClusterParameterGroup
Outputs:
  ClusterName:
    Value: !Ref RedshiftCluster

Enable concurrency scaling by modifying WLM configuration

Concurrency scaling is an autoscaling feature of Amazon Redshift that enables you to support virtually unlimited concurrent users. When you turn on concurrency scaling, Amazon Redshift automatically adds additional cluster capacity to process an increase in both read queries and write queries.

You can enable concurrency scaling at an individual WLM queue level. To enable concurrency scaling using AWS CloudFormation, update you current stack’s CloudFormation template and change the parameter value for wlm_json_configuration to add a property called concurrency_scaling and set its value to auto.

The following CloudFormation template sets concurrency scaling to auto on reporting_queue. It also overrides the value for the max_concurrency_scaling_clusters parameter from default 1 to 5.

AWSTemplateFormatVersion: 2010-09-09
Description: Redshift CFN Blog Cluster Stack
Parameters:
  MasterUserPasswordParam:
    NoEcho: true
    Type: String
    Description: Enter Master User Password
Resources:
  RedshiftClusterParameterGroup: 
    Type: "AWS::Redshift::ClusterParameterGroup"
    Properties: 
      Description: "CFNBlog-Redshift-Cluster-parameter-group"
      ParameterGroupFamily: "redshift-1.0"
      Parameters: 
        - 
          ParameterName: "require_ssl"
          ParameterValue: "true"
        #add parameter to change default value for max number of concurrency scaling clusters parameter
        - 
          ParameterName: "max_concurrency_scaling_clusters"
          ParameterValue: "5"
        #Updated wlm configuration to set concurrency_scaling to auto
        -
          ParameterName: "wlm_json_configuration"
          ParameterValue: "[
                            {
                              \"name\":\"etl_queue\",
                              \"user_group\":[\"etl_user\"],
                              \"auto_wlm\":true,
                              \"queue_type\":\"auto\",
                              \"priority\":\"highest\"
                            },
                            {
                              \"name\":\"reporting_queue\",
                              \"user_group\":[\"%report%\"],
                              \"user_group_wild_card\":1,
                              \"query_group\":[\"%report%\"],
                              \"query_group_wild_card\":1,
                              \"auto_wlm\":true,
                              \"queue_type\":\"auto\",
                              \"priority\":\"normal\",
                              \"concurrency_scaling\":\"auto\"
                            },
                            {
                              \"name\":\"Default queue\",
                              \"auto_wlm\":true,
                              \"priority\":\"lowest\"
                            },
                            {
                              \"short_query_queue\":true
                            }
                          ]"
  RedshiftCluster:
    Type: "AWS::Redshift::Cluster"
    Properties:
      ResourceAction: "resume-cluster"
      ClusterIdentifier: "cfn-blog-redshift-cluster"
      ClusterType: "multi-node"
      NodeType: "ra3.4xlarge"
      NumberOfNodes: "2"
      DBName: "dev"
      MasterUsername: "username"
      Encrypted: true
      MasterUserPassword: !Ref MasterUserPasswordParam
      ClusterParameterGroupName: !Ref RedshiftClusterParameterGroup
Outputs:
  ClusterName:
    Value: !Ref RedshiftCluster

Enable or disable audit logging

When you enable audit logging, Amazon Redshift creates and uploads the connection log, user log, and user activity logs to Amazon Simple Storage Service (Amazon S3). You can automate enabling and disabling audit logging using AWS CloudFormation. To enable audit logging, update the base CloudFormation template to add the LoggingProperties property with the following sub-properties:

  • BucketName – The name of an existing S3 bucket where the log files are to be stored.
  • S3KeyPrefix – The prefix applied to the log file names

Also update the parameter group to change the value of the enable_user_activity_logging parameter to true.

To enable audit logging on cfn-blog-redshift-cluster and deliver log files to BucketName: cfn-blog-redshift-cluster-audit-logs with the S3KeyPrefix:cfn-blog, update the current CloudFormation stack RedshiftClusterStack-CFNBlog with the following CloudFormation template:

AWSTemplateFormatVersion: 2010-09-09
Description: Redshift CFN Blog Cluster Stack
Parameters:
  MasterUserPasswordParam:
    NoEcho: true
    Type: String
    Description: Enter Master User Password
Resources:
  RedshiftClusterParameterGroup: 
    Type: "AWS::Redshift::ClusterParameterGroup"
    Properties: 
      Description: "CFNBlog-Redshift-Cluster-parameter-group"
      ParameterGroupFamily: "redshift-1.0"
      Parameters: 
        - 
          ParameterName: "require_ssl"
          ParameterValue: "true"
        - 
          ParameterName: "max_concurrency_scaling_clusters"
          ParameterValue: "5"
        #add parameter to enable user activity logging
        -
          ParameterName: "enable_user_activity_logging"
          ParameterValue: "true"
  RedshiftCluster:
    Type: "AWS::Redshift::Cluster"
    Properties:
      ResourceAction: "resume-cluster"
      ClusterIdentifier: "cfn-blog-redshift-cluster"
      ClusterType: "multi-node"
      NodeType: "ra3.4xlarge"
      NumberOfNodes: "2"
      DBName: "dev"
      MasterUsername: "username"
      Encrypted: true
      MasterUserPassword: !Ref MasterUserPasswordParam
      #Add LoggingProperties and its sub-properties
      LoggingProperties:
          BucketName: "cfn-blog-redshift-cluster-audit-logs"
          S3KeyPrefix: "cfn-blog/"
      ClusterParameterGroupName: !Ref RedshiftClusterParameterGroup
Outputs:
  ClusterName:
    Value: !Ref RedshiftCluster

Follow the steps earlier in this post to update the stack. To disable audit logging, update the cluster’s CloudFormation stack template and remove the LoggingProperties property.

Concurrent operations

You can perform multiple cluster management operations using a single CloudFormation stack update. For example, you can perform elastic resize and rotate encryption keys on the cfn-blog-redshift-cluster using the following CloudFormation template. This template updates the values for NodeType and NumberOfNodes, which results in an elastic resize operation, and also sets the RotateEncryptionKey parameter value to Boolean true, which results in the encryption key rotation.

AWSTemplateFormatVersion: 2010-09-09
Description: Redshift CFN Blog Cluster Stack
Parameters:
  MasterUserPasswordParam:
    NoEcho: true
    Type: String
    Description: Enter Master User Password
Resources:
  RedshiftCluster:
    Type: "AWS::Redshift::Cluster"
    Properties:
      ResourceAction: "resume-cluster"
      ClusterIdentifier: "cfn-blog-redshift-cluster"
      ClusterType: "multi-node"
      # Change Node type, number of nodes and rotate encryption
      NodeType: "ra3.16xlarge"
      NumberOfNodes: "2"
      RotateEncryptionKey: true
      DBName: "dev"
      MasterUsername: "username"
      Encrypted: true
      MasterUserPassword: !Ref MasterUserPasswordParam
Outputs:
  ClusterName:
    Value: !Ref RedshiftCluster

Conclusion

You have now learned how to automate management operations on Amazon Redshift clusters using AWS CloudFormation. For a full list of properties you can update using this process, see Properties. For more sample CloudFormation templates, see Amazon Redshift template snippets.


About the Authors

Anusha Challa is a Senior Analytics Specialist Solutions Architect at AWS. She has over a decade of experience in building large-scale data warehouses, both on-premises and in the cloud. She provides architectural guidance to our customers on end-to-end data warehousing implementations and migrations.

Shweta Yakkali is a Software Engineer for Amazon Redshift, where she works on developing features for Redshift Cloud infrastructure. She is passionate about innovations in cloud infrastructure and enjoys learning new technologies and building enhanced features for Redshift. She holds M.S in Computer Science from Rochester Institute of Technology, New York. Outside of work, she enjoys dancing, painting and playing badminton.

Zirui Hua is a Software Development Engineer for Amazon Redshift, where he works on developing next generation features for Redshift. His main focuses are on networking and proxy of database. Outside of work, he likes to play tennis and basketball.
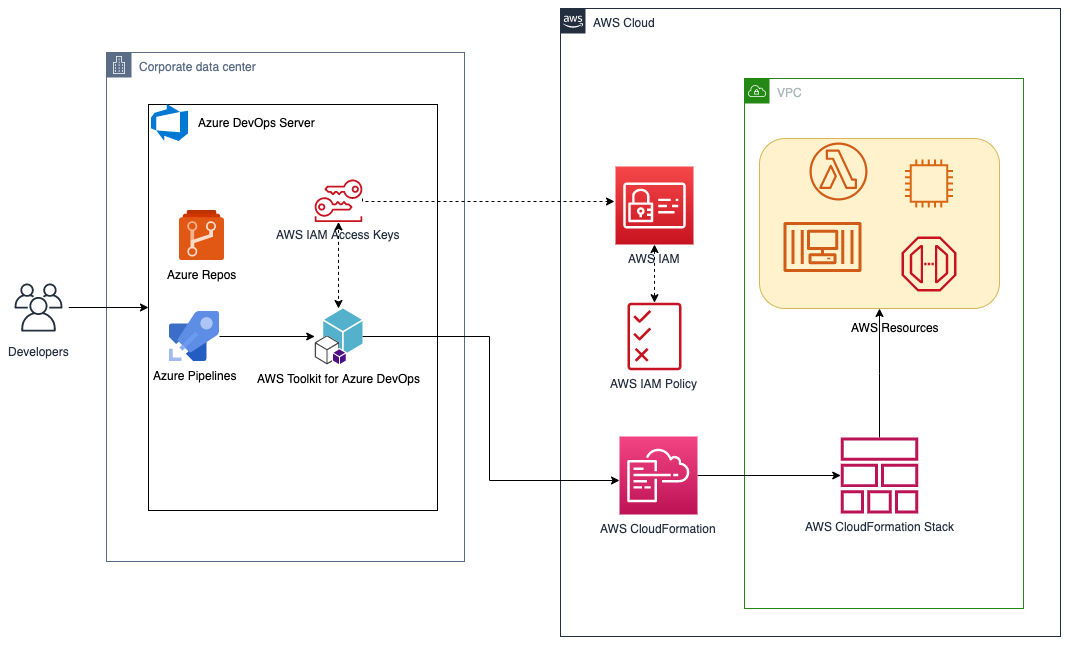
Field Notes: Building Multi-Region and Multi-Account Tools with AWS Organizations

Post Syndicated from Cody Penta original https://aws.amazon.com/blogs/architecture/field-notes-building-multi-region-and-multi-account-tools-with-aws-organizations/

It’s common to start with a single AWS account when you are beginning your cloud journey with AWS. Running operations such as creating, reading, updating, and deleting resources in a single AWS account can be straightforward with AWS application program interfaces (APIs). Because an organization grows, so does their account strategy, often splitting workloads across multiple accounts. Fortunately, AWS customers can use AWS Organizations to group these accounts into logical units, also known as organizational units (OUs), to apply common policies and deploy standard infrastructure. However, this will result in an increased difficulty to run an API against all accounts, moreover, every Region that account could use. How does an organization answer these questions:

  • What is every Amazon FSx backup I own?
  • How can I do an on-demand batch job that will apply to my entire organization?
  • What is every internet access point across my organization?

This blog post shows us how we can use Organizations, AWS Single Sign-On (AWS SSO), AWS CloudFormation StackSets, and various AWS APIs to effectively build multi-account and multi-region tools that can address use cases like the ones above.

Running an AWS API sequentially across hundreds of accounts—potentially, many Regions—could take hours, depending on the API you call. An important aspect we will cover throughout this solution is the importance of concurrency for these types of tools.
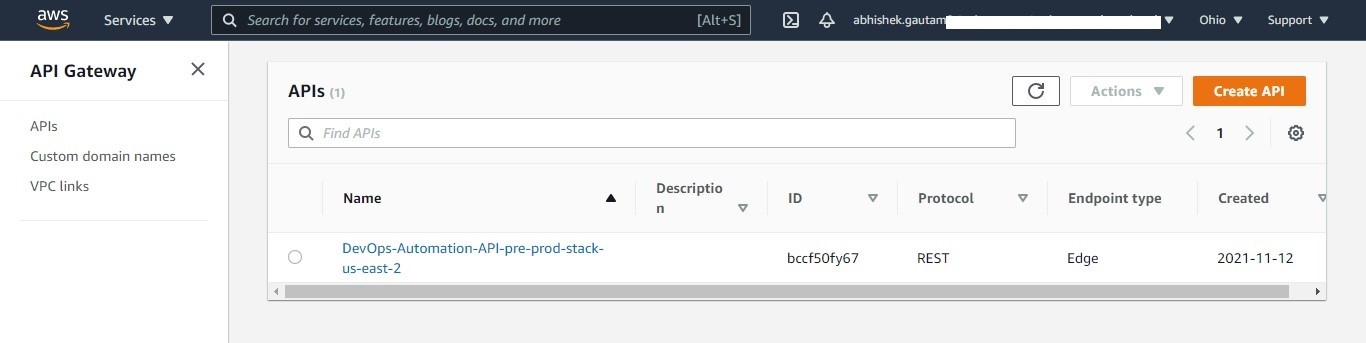
Overview of solution

For this solution, we have created a fictional organization called Tavern that is set up with multiple organizational units (OUs), accounts, and Regions, to reflect a real-world scenario.

Figure 1. Organization configuration example

Figure 1. Organization configuration example

We will set up a user with multi-factor authentication (MFA) enabled so we can sign-in and access an admin user in the root account. Using this admin user, we will deploy a stack set across the organization that enables this user to assume limited permissions into each child account.

Next, we will use the Go programming language because of its native concurrency capabilities. More specifically, we will implement the pipeline concurrency pattern to build a multi-account and multi-region tool that will run APIs across our entire AWS footprint.

Additionally, we will add two common edge cases:

  • We block mass API actions to an account in a suspended OU (not pictured) and the root account.
  • We block API actions in disabled regions.

This will show us how to implement robust error handling in equally powerful tooling.

 Walkthrough

Let us separate the solution into distinct steps:

  • Create an automation user through AWS SSO.
    • This user can optionally be an IAM user or role assumed into by a third-party identity provider (such as, Azure Active Directory). Note the ARN of this identity because that is the key piece of information we will use for crafting a policy document.
  • Deploy a CloudFormation stack set across the organization that enables this user to assume limited access into each account.
    • For this blog post, we will deploy an organization-wide role with `ec2:DescribeRouteTables` permissions. Feel free to expand or change the permission set based on the type of tool you build.
  • Using Go, AWS Command Line Interface (CLI) v2, and AWS SDK for Go v2:
    1. Authenticate using AWS SSO.
    2. List every account in the organization.
    3. Assume permissions into that account.
    4.  Run an API across every Region in that account.
    5. Aggregate results for every Region.
    6. Aggregate results for every account.
    7. Report back the result.

For additional context, review this GitHub repository that contains all code and assets for this blog post.

Prerequisites

For this walkthrough, you should have the following prerequisites:

  • Multiple AWS accounts
  • AWS Organizations
  • AWS SSO (optional)
  • AWS SDK for Go v2
  • AWS CLI v2
  • Go programming knowledge (preferred), especially Go’s concurrency model
  • General programming knowledge

Create an automation user in AWS SSO

The first thing we need to do is create an identity to sign into. This can either be an AWS Identity and Access Management (IAM) user, an IAM role integrated with a third-party identity provider, or—in this case—an AWS SSO user.

  1. Log into the AWS SSO user console.
  2. Press Add user button.
  3. Fill in the appropriate information.
Figure 2.AWS SSO create user

Figure 2. AWS SSO create user

  1. Assign the user to the appropriate group. In this case, we will assign this user to AWSControlTowerAdmins.
Figure 3.Assigning SSO user to a group

Figure 3. Assigning SSO user to a group

  1. Verify the user was created. (Optionally: enable MFA).
Figure 4.Verifying User Creation and MFA

Figure 4. Verifying User Creation and MFA

Deploy a stack set across your organization

To effectively run any API across the organization, we need to deploy a common role that our AWS SSO user can assume across every account. We can use AWS CloudFormation StackSets to deploy this role at scale.

  1. Write the IAM role and associated policy document. The following is an example AWS Cloud Development Kit (AWS CDK) code for such a role. Note that orgAccount, roleName, and ssoUser in the below code will have to be replaced with your own values.
    const role = new iam.Role(this, 'TavernAutomationRole', {
      roleName: 'TavernAutomationRole',
      assumedBy: new iam.ArnPrincipal(`arn:aws:sts::${orgAccount}:assumed-role/${roleName}/${ssoUser}`),
    })
    role.addToPolicy(new PolicyStatement({
      actions: ['ec2:DescribeRouteTables'],
      resources: ['*']
    }))
  1. Log into the CloudFormation StackSets console.
  2. Press Create StackSet button.
  3. Upload the CloudFormation template containing the common role to be deployed to the organization by the preferred method.
  4. Specify name and optional description.
  5. Add any standard organization tags, and choose Service-managed permissions option.
  6. Choose Deploy to organization, and decide whether to disable or enable automatic deployment and appropriate account removal behavior. For this blog post, we choose to enable automatic deployment and accounts should remove the stack with removed from the target OU.
  7. For Specify regions, choose US East (N.Virginia). Note, because this stack contains only an IAM role, and IAM is a global service, region choice has no effect.
  8. For Maximum concurrent accounts, choose Percent, and enter 100 (this stack is not dependent on order).
  9. For Failure tolerance, choose Number, and enter 5, account deployment failures before a total rollback happens.
  10. For Region Concurrency, choose Sequential.
  11. Review your choices, note the deployment target (should be r-*), and acknowledge that CloudFormation might create IAM resources with custom names.
  12. Press the Submit button to deploy the stack.

Configure AWS SSO for the AWS CLI

To use our organization tools, we must first configure AWS SSO locally. With the AWS CLI v2, we can run:

aws configure sso

To configure credentials:

  1. Run the preceding command in your terminal.
  2. Follow the prompted steps.
    1. Specify your AWS SSO Start URL:
    2. AWS SSO Region:
  1. Authenticate through the pop-up browser window.
  2. Navigate back to the CLI, and choose the root account (this is where our principle for IAM originates).
  3. Specify the default client region.
  4. Specify the default output format.

Note the CLI profile name. Regardless if you choose to go with the autogenerated one or the custom one, we need this profile name for our upcoming code.

Start coding to utilize the AWS SSO shared profile

After AWS SSO is configured, we can start coding the beginning part of our multi-account tool. Our first step is to list every account belonging to our organization.

var (
    stsc    *sts.Client
    orgc    *organizations.Client
    ec2c    *ec2.Client
    regions []string
)

// init initializes common AWS SDK clients and pulls in all enabled regions
func init() {
    cfg, err := config.LoadDefaultConfig(context.TODO(), config.WithSharedConfigProfile("tavern-automation"))
    if err != nil {
        log.Fatal("ERROR: Unable to resolve credentials for tavern-automation: ", err)
    }

    stsc = sts.NewFromConfig(cfg)
    orgc = organizations.NewFromConfig(cfg)
    ec2c = ec2.NewFromConfig(cfg)

    // NOTE: By default, only describes regions that are enabled in the root org account, not all Regions
    resp, err := ec2c.DescribeRegions(context.TODO(), &ec2.DescribeRegionsInput{})
    if err != nil {
        log.Fatal("ERROR: Unable to describe regions", err)
    }

    for _, region := range resp.Regions {
        regions = append(regions, *region.RegionName)
    }
    fmt.Println("INFO: Listing all enabled regions:")
    fmt.Println(regions)
}

// main constructs a concurrent pipeline that pushes every account ID down
// the pipeline, where an action is concurrently run on each account and
// results are aggregated into a single json file
func main() {
    var accounts []string

    paginator := organizations.NewListAccountsPaginator(orgc, &organizations.ListAccountsInput{})
    for paginator.HasMorePages() {
        resp, err := paginator.NextPage(context.TODO())
        if err != nil {
            log.Fatal("ERROR: Unable to list accounts in this organization: ", err)
        }

        for _, account := range resp.Accounts {
            accounts = append(accounts, *account.Id)
        }
    }
    fmt.Println(accounts)

Implement concurrency into our code

With a slice of every AWS account, it’s time to concurrently run an API across all accounts. We will use some familiar Go concurrency patterns, as well as fan-out and fan-in.

// ... continued in main

    // Begin pipeline by calling gen with a list of every account
    in := gen(accounts...)

    // Fan out and create individual goroutines handling the requested action (getRoute)
    var out []<-chan models.InternetRoute
    for range accounts {
        c := getRoute(in)
        out = append(out, c)
    }

    // Fans in and collect the routing information from all go routines
    var allRoutes []models.InternetRoute
    for n := range merge(out...) {
        allRoutes = append(allRoutes, n)
    }

In the preceding code, we called a gen() function that started construction of our pipeline. Let’s take a deeper look into this function.

// gen primes the pipeline, creating a single separate goroutine
// that will sequentially put a single account id down the channel
// gen returns the channel so that we can plug it in into the next
// stage
func gen(accounts ...string) <-chan string {
    out := make(chan string)
    go func() {
        for _, account := range accounts {
            out <- account
        }
        close(out)
    }()
    return out
}

We see that gen just initializes the pipeline, and then starts pushing account ID’s down the pipeline one by one.

The next two functions are where all the heavy lifting is done. First, let’s investigate `getRoute()`.

// getRoute queries every route table in an account, including every enabled region, for a
// 0.0.0.0/0 (i.e. default route) to an internet gateway
func getRoute(in <-chan string) <-chan models.InternetRoute {
    out := make(chan models.InternetRoute)
    go func() {
        for account := range in {
            role := fmt.Sprintf("arn:aws:iam::%s:role/TavernAutomationRole", account)
            creds := stscreds.NewAssumeRoleProvider(stsc, role)

            for _, region := range regions {
                localCfg := aws.Config{
                    Region:      region,
                    Credentials: aws.NewCredentialsCache(creds),
                }

                localEc2Client := ec2.NewFromConfig(localCfg)

                paginator := ec2.NewDescribeRouteTablesPaginator(localEc2Client, &ec2.DescribeRouteTablesInput{})
                for paginator.HasMorePages() {
                    resp, err := paginator.NextPage(context.TODO())
                    if err != nil {
                        fmt.Println("WARNING: Unable to retrieve route tables from account: ", account, err)
                        out <- models.InternetRoute{Account: account}
                        close(out)
                        return
                    }

                    for _, routeTable := range resp.RouteTables {
                        for _, r := range routeTable.Routes {
                            if r.GatewayId != nil && strings.Contains(*r.GatewayId, "igw-") {
                                fmt.Println(
                                    "Account: ", account,
                                    " Region: ", region,
                                    " DestinationCIDR: ", *r.DestinationCidrBlock,
                                    " GatewayId: ", *r.GatewayId,
                                )
    
                                out <- models.InternetRoute{
                                    Account:         account,
                                    Region:          region,
                                    Vpc:             routeTable.VpcId,
                                    RouteTable:      routeTable.RouteTableId,
                                    DestinationCidr: r.DestinationCidrBlock,
                                    InternetGateway: r.GatewayId,
                                }
                            }
                        }
                    }
                }
            }

        }
        close(out)
    }()
    return out
}

A couple of key points to highlight are as follows:

for account := range in

When iterating over a channel, the current goroutine blocks, meaning we wait here until we get an account ID passed to us before continuing. We’ll keep doing this until our upstream closes the channel. In our case, our upstream closes the channel once it pushes every account ID down the channel.

role := fmt.Sprintf("arn:aws:iam::%s:role/TavernAutomationRole", account)
creds := stscreds.NewAssumeRoleProvider(stsc, role)

Here, we can reference our existing role that we deployed to every account and assume into that role with AWS Security Token Service (STS).

for _, region := range regions {

Lastly, when we have credentials into that account, we need to iterate over every region in that account to ensure we are capturing the entire global presence.

These three key areas are how we build organization-level tools. The remaining code is calling the desired API and delivering the result down to the next stage in our pipeline, where we merge all of the results.

// merge takes every go routine and "plugs" it into a common out channel
// then blocks until every input channel closes, signally that all goroutines
// are done in the previous stage
func merge(cs ...<-chan models.InternetRoute) <-chan models.InternetRoute {
    var wg sync.WaitGroup
    out := make(chan models.InternetRoute)

    output := func(c <-chan models.InternetRoute) {
        for n := range c {
            out <- n
        }
        wg.Done()
    }

    wg.Add(len(cs))
    for _, c := range cs {
        go output(c)
    }

    go func() {
        wg.Wait()
        close(out)
    }()
    return out
}

At the end of the main function, we take our in-memory data structures representing our internet entry points and marshal it into a JSON file.

    // ... continued in main

    savedRoutes, err := json.MarshalIndent(allRoutes, "", "\t")
    if err != nil {
        fmt.Println("ERROR: Unable to marshal internet routes to JSON: ", err)
    }
    ioutil.WriteFile("routes.json", savedRoutes, 0644)

With the code in place, we can run the code with `go run main.go` inside of your preferred terminal. The command will generate results like the following:

    // ... routes.json
    {
        "Account": "REDACTED",
        "Region": "eu-north-1",
        "Vpc": "vpc-1efd6c77",
        "RouteTable": "rtb-1038a979",
        "DestinationCidr": "0.0.0.0/0",
        "InternetGateway": "igw-c1b125a8"
    },
    {
        "Account": " REDACTED ",
        "Region": "eu-north-1",
        "Vpc": "vpc-de109db7",
        "RouteTable": "rtb-e042ce89",
        "DestinationCidr": "0.0.0.0/0",
        "InternetGateway": "igw-cbd457a2"
    },
    // ...

Cleaning up

To avoid incurring future charges, delete the following resources:

  • Stack set through the CloudFormation console
  • AWS SSO user (if you created one)

Conclusion

Creating organization tools that answer difficult questions such as, “show me every internet entry point in our organization,” are possible using Organizations APIs and CloudFormation StackSets. We also learned how to use Go’s native concurrency features to build these tools that scale across hundreds of accounts.

Further steps you might explore include:

  • Visiting the Github Repo to capture the full picture.
  • Taking our sequential solution for iterating over Regions and making it concurrent.
  • Exploring the possibility of accepting functions and interfaces in stages to generalize specific pipeline features.

Thanks for taking the time to read, and feel free to leave comments.

Field Notes provides hands-on technical guidance from AWS Solutions Architects, consultants, and technical account managers, based on their experiences in the field solving real-world business problems for customers.

Validate IAM policies in CloudFormation templates using IAM Access Analyzer

Post Syndicated from Matt Luttrell original https://aws.amazon.com/blogs/security/validate-iam-policies-in-cloudformation-templates-using-iam-access-analyzer/

In this blog post, I introduce IAM Policy Validator for AWS CloudFormation (cfn-policy-validator), an open source tool that extracts AWS Identity and Access Management (IAM) policies from an AWS CloudFormation template, and allows you to run existing IAM Access Analyzer policy validation APIs against the template. I also show you how to run the tool in a continuous integration and continuous delivery (CI/CD) pipeline to validate IAM policies in a CloudFormation template before they are deployed to your AWS environment.

Embedding this validation in a CI/CD pipeline can help prevent IAM policies that have IAM Access Analyzer findings from being deployed to your AWS environment. This tool acts as a guardrail that can allow you to delegate the creation of IAM policies to the developers in your organization. You can also use the tool to provide additional confidence in your existing policy authoring process, enabling you to catch mistakes prior to IAM policy deployment.

What is IAM Access Analyzer?

IAM Access Analyzer mathematically analyzes access control policies that are attached to resources, and determines which resources can be accessed publicly or from other accounts. IAM Access Analyzer can also validate both identity and resource policies against over 100 checks, each designed to improve your security posture and to help you to simplify policy management at scale.

The IAM Policy Validator for AWS CloudFormation tool

IAM Policy Validator for AWS CloudFormation (cfn-policy-validator) is a new command-line tool that parses resource-based and identity-based IAM policies from your CloudFormation template, and runs the policies through IAM Access Analyzer checks. The tool is designed to run in the CI/CD pipeline that deploys your CloudFormation templates, and to prevent a deployment when an IAM Access Analyzer finding is detected. This ensures that changes made to IAM policies are validated before they can be deployed.

The cfn-policy-validator tool looks for all identity-based policies, and a subset of resource-based policies, from your templates. For the full list of supported resource-based policies, see the cfn-policy-validator GitHub repository.

Parsing IAM policies from a CloudFormation template

One of the challenges you can face when parsing IAM policies from a CloudFormation template is that these policies often contain CloudFormation intrinsic functions (such as Ref and Fn::GetAtt) and pseudo parameters (such as AWS::AccountId and AWS::Region). As an example, it’s common for least privileged IAM policies to reference the Amazon Resource Name (ARN) of another CloudFormation resource. Take a look at the following example CloudFormation resources that create an Amazon Simple Queue Service (Amazon SQS) queue, and an IAM role with a policy that grants access to perform the sqs:SendMessage action on the SQS queue.
 

Figure 1- Example policy in CloudFormation template

Figure 1- Example policy in CloudFormation template

As you can see in Figure 1, line 21 uses the function Fn::Sub to restrict this policy to MySQSQueue created earlier in the template.

In this example, if you were to pass the root policy (lines 15-21) as written to IAM Access Analyzer, you would get an error because !Sub ${MySQSQueue.Arn} is syntax that is specific to CloudFormation. The cfn-policy-validator tool takes the policy and translates the CloudFormation syntax to valid IAM policy syntax that Access Analyzer can parse.

The cfn-policy-validator tool recognizes when an intrinsic function such as !Sub ${MySQSQueue.Arn} evaluates to a resource’s ARN, and generates a valid ARN for the resource. The tool creates the ARN by mapping the type of CloudFormation resource (in this example AWS::SQS::Queue) to a pattern that represents what the ARN of the resource will look like when it is deployed. For example, the following is what the mapping looks like for the SQS queue referenced previously:

AWS::SQS::Queue.Arn -> arn:${Partition}:sqs:${Region}:${Account}:${QueueName}

For some CloudFormation resources, the Ref intrinsic function also returns an ARN. The cfn-policy-validator tool handles these cases as well.
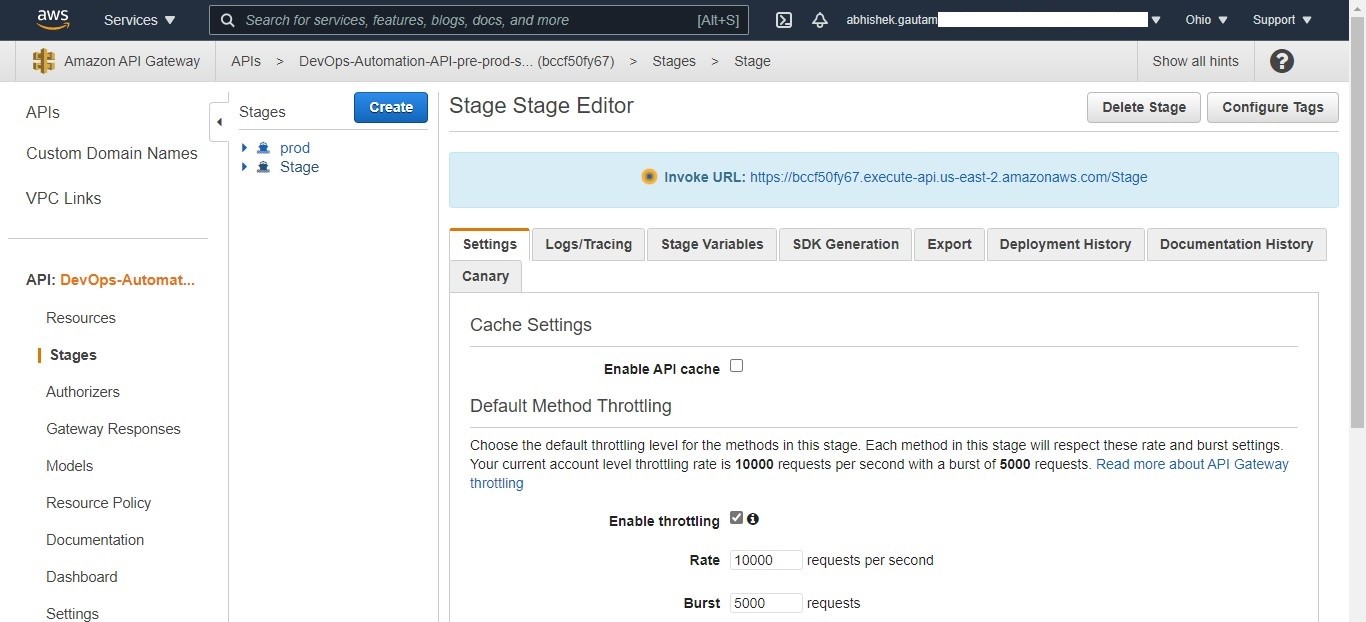
Cfn-policy-validator walks through each of the six parts of an ARN and substitutes values for variables in the ARN pattern (any text contained within ${}). The values of ${Partition} and ${Account} are taken from the identity of the role that runs the cfn-policy-validator tool, and the value for ${Region} is provided as an input flag. The cfn-policy-validator tool performs a best-effort resolution of the QueueName, but typically defaults it to the name of the CloudFormation resource (in the previous example, MySQSQueue). Validation of policies with IAM Access Analyzer does not rely on the name of the resource, so the cfn-policy-validator tool is able to substitute a replacement name without affecting the policy checks.

The final ARN generated for the MySQSQueue resource looks like the following (for an account with ID of 111111111111):

arn:aws:sqs:us-east-1:111111111111:MySQSQueue

The cfn-policy-validator tool substitutes this generated ARN for !Sub ${MySQSQueue.Arn}, which allows the cfn-policy-validator tool to parse a policy from the template that can be fed into IAM Access Analyzer for validation. The cfn-policy-validator tool walks through your entire CloudFormation template and performs this ARN substitution until it has generated ARNs for all policies in your template.

Validating the policies with IAM Access Analyzer

After the cfn-policy-validator tool has your IAM policies in a valid format (with no CloudFormation intrinsic functions or pseudo parameters), it can take those policies and feed them into IAM Access Analyzer for validation. The cfn-policy-validator tool runs resource-based and identity-based policies in your CloudFormation template through the ValidatePolicy action of the IAM Access Analyzer. ValidatePolicy is what ensures that your policies have correct grammar and follow IAM policy best practices (for example, not allowing iam:PassRole to all resources). The cfn-policy-validator tool also makes a call to the CreateAccessPreview action for supported resource policies to determine if the policy would grant unintended public or cross-account access to your resource.

The cfn-policy-validator tool categorizes findings from IAM Access Analyzer into the categories blocking or non-blocking. Findings categorized as blocking cause the tool to exit with a non-zero exit code, thereby causing your deployment to fail and preventing your CI/CD pipeline from continuing. If there are no findings, or only non-blocking findings detected, the tool will exit with an exit code of zero (0) and your pipeline can to continue to the next stage. For more information about how the cfn-policy-validator tool decides what findings to categorize as blocking and non-blocking, as well as how to customize the categorization, see the cfn-policy-validator GitHub repository.

Example of running the cfn-policy-validator tool

This section guides you through an example of what happens when you run a CloudFormation template that has some policy violations through the cfn-policy-validator tool.

The following template has two CloudFormation resources with policy findings: an SQS queue policy that grants account 111122223333 access to the SQS queue, and an IAM role with a policy that allows the role to perform a misspelled sqs:ReceiveMessages action. These issues are highlighted in the policy below.

Important: The policy in Figure 2 is written to illustrate a CloudFormation template with potentially undesirable IAM policies. You should be careful when setting the Principal element to an account that is not your own.

Figure 2: CloudFormation template with undesirable IAM policies

Figure 2: CloudFormation template with undesirable IAM policies

When you pass this template as a parameter to the cfn-policy-validator tool, you specify the AWS Region that you want to deploy the template to, as follows:

cfn-policy-validator validate --template-path ./template.json --region us-east-1

After the cfn-policy-validator tool runs, it returns the validation results, which includes the actual response from IAM Access Analyzer:

{
    "BlockingFindings": [
        {
            "findingType": "ERROR",
            "code": "INVALID_ACTION",
            "message": "The action sqs:ReceiveMessages does not exist.",
            "resourceName": "MyRole",
            "policyName": "root",
            "details": …
        },
        {
            "findingType": "SECURITY_WARNING",
            "code": "EXTERNAL_PRINCIPAL",
            "message": "Resource policy allows access from external principals.",
            "resourceName": "MyQueue",
            "policyName": "QueuePolicy",
            "details": …
        }
    ],
    "NonBlockingFindings": []
}

The output from the cfn-policy-validator tool includes the type of finding, the code for the finding, and a message that explains the finding. It also includes the resource and policy name from the CloudFormation template, to allow you to quickly track down and resolve the finding in your template. In the previous example, you can see that IAM Access Analyzer has detected two findings, one security warning and one error, which the cfn-policy-validator tool has classified as blocking. The actual response from IAM Access Analyzer is returned under details, but is excluded above for brevity.

If account 111122223333 is an account that you trust and you are certain that it should have access to the SQS queue, then you can suppress the finding for external access from the 111122223333 account in this example. Modify the call to the cfn-policy-validator tool to ignore this specific finding by using the –-allow-external-principals flag, as follows:

cfn-policy-validator validate --template-path ./template.json --region us-east-1 --allow-external-principals 111122223333

When you look at the output that follows, you’re left with only the blocking finding that states that sqs:ReceiveMessages does not exist.

{
    "BlockingFindings": [
        {
            "findingType": "ERROR",
            "code": "INVALID_ACTION",
            "message": "The action sqs:ReceiveMessages does not exist.",
            "resourceName": "MyRole",
            "policyName": "root",
            "details": …
    ],
    "NonBlockingFindings": []
}

To resolve this finding, update the template to have the correct spelling, sqs:ReceiveMessage (without trailing s).

For the full list of available flags and commands supported, see the cfn-policy-validator GitHub repository.

Now that you’ve seen an example of how you can run the cfn-policy-validator tool to validate policies that are on your local machine, you will take it a step further and see how you can embed the cfn-policy-validator tool in a CI/CD pipeline. By embedding the cfn-policy-validator tool in your CI/CD pipeline, you can ensure that your IAM policies are validated each time a commit is made to your repository.

Embedding the cfn-policy-validator tool in a CI/CD pipeline

The CI/CD pipeline you will create in this post uses AWS CodePipeline and AWS CodeBuild. AWS CodePipeline is a continuous delivery service that enables you to model, visualize, and automate the steps required to release your software. AWS CodeBuild is a fully-managed continuous integration service that compiles source code, runs tests, and produces software packages that are ready to deploy. You will also use AWS CodeCommit as the source repository where your CloudFormation template is stored. AWS CodeCommit is a fully managed source-control service that hosts secure Git-based repositories.

To deploy the pipeline

  1. To deploy the CloudFormation template that builds the source repository and AWS CodePipeline pipeline, select the following Launch Stack button.
    Select the Launch Stack button to launch the template
  2. In the CloudFormation console, choose Next until you reach the Review page.
  3. Select I acknowledge that AWS CloudFormation might create IAM resources and choose Create stack.
  4. Open the AWS CodeCommit console and choose Repositories.
  5. Select cfn-policy-validator-source-repository.
  6. Download the template.json and template-configuration.json files to your machine.
  7. In the cfn-policy-validator-source-repository, on the right side, select Add file and choose Upload file.
  8. Choose Choose File and select the template.json file that you downloaded previously.
  9. Enter an Author name and an E-mail address and choose Commit changes.
  10. In the cfn-policy-validator-source-repository, repeat steps 7-9 for the template-configuration.json file.

To view validation in the pipeline

  1. In the AWS CodePipeline console choose the IAMPolicyValidatorPipeline.
  2. Watch as your commit travels through the pipeline. If you followed the previous instructions and made two separate commits, you can ignore the failed results of the first pipeline execution. As shown in Figure 3, you will see that the pipeline fails in the Validation stage on the CfnPolicyValidator action, because it detected a blocking finding in the template you committed, which prevents the invalid policy from reaching your AWS environment.
     
    Figure 3: Validation failed on the CfnPolicyValidator action

    Figure 3: Validation failed on the CfnPolicyValidator action

  3. Under CfnPolicyValidator, choose Details, as shown in Figure 3.
  4. In the Action execution failed pop-up, choose Link to execution details to view the cfn-policy-validator tool output in AWS CodeBuild.

Architectural overview of deploying cfn-policy-validator in your pipeline

You can see the architecture diagram for the CI/CD pipeline you deployed in Figure 4.
 
Figure 4: CI/CD pipeline that performs IAM policy validation using the AWS CloudFormation Policy Validator and IAM Access Analyzer

Figure 4 shows the following steps, starting with the CodeCommit source action on the left:

  1. The pipeline starts when you commit to your AWS CodeCommit source code repository. The AWS CodeCommit repository is what contains the CloudFormation template that has the IAM policies that you would like to deploy to your AWS environment.
  2. AWS CodePipeline detects the change in your source code repository and begins the Validation stage. The first step it takes is to start an AWS CodeBuild project that runs the CloudFormation template through the AWS CloudFormation Linter (cfn-lint). The cfn-lint tool validates your template against the CloudFormation resource specification. Taking this initial step ensures that you have a valid CloudFormation template before validating your IAM policies. This is an optional step, but a recommended one. Early schema validation provides fast feedback for any typos or mistakes in your template. There’s little benefit to running additional static analysis tools if your template has an invalid schema.
  3. If the cfn-lint tool completes successfully, you then call a separate AWS CodeBuild project that invokes the IAM Policy Validator for AWS CloudFormation (cfn-policy-validator). The cfn-policy-validator tool then extracts the identity-based and resource-based policies from your template, as described earlier, and runs the policies through IAM Access Analyzer.

    Note: if your template has parameters, then you need to provide them to the cfn-policy-validator tool. You can provide parameters as command-line arguments, or use a template configuration file. It is recommended to use a template configuration file when running validation with an AWS CodePipeline pipeline. The same file can also be used in the deploy stage to deploy the CloudFormation template. By using the template configuration file, you can ensure that you use the same parameters to validate and deploy your template. The CloudFormation template for the pipeline provided with this blog post defaults to using a template configuration file.

    If there are no blocking findings found in the policy validation, the cfn-policy-validator tool exits with an exit code of zero (0) and the pipeline moves to the next stage. If any blocking findings are detected, the cfn-policy-validator tool will exit with a non-zero exit code and the pipeline stops, to prevent the deployment of undesired IAM policies.

  4. The final stage of the pipeline uses the AWS CloudFormation action in AWS CodePipeline to deploy the template to your environment. Your template will only make it to this stage if it passes all static analysis checks run in the Validation Stage.

Cleaning Up

To avoid incurring future charges, in the AWS CloudFormation console delete the validate-iam-policy-pipeline stack. This will remove the validation pipeline from your AWS account.

Summary

In this blog post, I introduced the IAM Policy Validator for AWS CloudFormation (cfn-policy-validator). The cfn-policy-validator tool automates the parsing of identity-based and resource-based IAM policies from your CloudFormation templates and runs those policies through IAM Access Analyzer. This enables you to validate that the policies in your templates follow IAM best practices and do not allow unintended external access to your AWS resources.

I showed you how the IAM Policy Validator for AWS CloudFormation can be included in a CI/CD pipeline. This allows you to run validation on your IAM policies on every commit to your repository and only deploy the template if validation succeeds.

For more information, or to provide feedback and feature requests, see the cfn-policy-validator GitHub repository.

If you have feedback about this post, submit comments in the Comments section below.

Want more AWS Security how-to content, news, and feature announcements? Follow us on Twitter.

Author

Matt Luttrell

Matt is a Sr. Solutions Architect on the AWS Identity Solutions team. When he’s not spending time chasing his kids around, he enjoys skiing, cycling, and the occasional video game.

Migrate Resources Between AWS Accounts

Post Syndicated from Ashok Srirama original https://aws.amazon.com/blogs/architecture/migrate-resources-between-aws-accounts/

Have you ever wondered how to move resources between Amazon Web Services (AWS) accounts? You can really view this as a migration of resources. Migrating resources from one AWS account to another may be desired or required due to your business needs. Following are a few scenarios where this may be of benefit:

  1. When you acquire, sell, or merge overseas operations from other businesses.
  2. When you move regional operations from one Managed Service Provider (MSP) to another.
  3. When you reorganize your AWS account and organizational structure.

This process may involve migrating the infrastructure either partially or completely.

In this blog, we will discuss various approaches to migrating resources based on type, configuration, and workload needs. Usually, the first consideration is infrastructure. What’s in your environment? What are the interdependencies? How will you migrate each resource?

Using this information, you can outline a plan on how you will approach migrating each of the resources in your portfolio, and in what order.

Here are some considerations to address for a typical migration:

Let’s look at each of these considerations in detail.

Migrating infrastructure

To migrate infrastructure that includes ephemeral resources, you can use one of the following Infrastructure as Code (IaC) approaches, shown in Figure 1. IaC templates are like programming scripts that automate the provisioning of IT resources.

Figure 1. Approaches to migrate infrastructure using IaC

Figure 1. Approaches to migrate infrastructure using IaC

1. If you are already using AWS CloudFormation templates, you can easily import the existing templates to the target AWS account.

AWS CloudFormation simplifies provisioning and management on AWS. You can create templates for quick and reliable provisioning of services or applications (called “stacks”).

2. You can use tools like Former2 to templatize your existing resources in the source AWS account and deploy them in the target account.

Former2 is an open-source project that allows you to generate IaC templates. For example, AWS CloudFormation or HashiCorp Terraform can be generated from the existing resources within your AWS account. Read Accelerate infrastructure as code development with open source Former2 for step-by-step guidance.

Migrating compute resources

To migrate compute resources that have a persistent state, you can use one of the following approaches, shown in Figure 2. These provide a virtual computing environment, allowing you to launch instances with a variety of operating systems.

Figure 2. Approaches to migrate compute resources

Figure 2. Approaches to migrate compute resources

1. If you are already using AWS Backup service and AWS Organizations to centrally manage backup policies, you can enable AWS Backup cross-account management feature. This manages, monitors, restores your backup, and copies jobs across AWS accounts. Ensure you have both accounts in same AWS Organization. Once the backups are available in the target account, you can restore EC2 instances. Follow detailed instructions at Creating backup copies across AWS accounts.

AWS Backup is a fully managed data protection service that centralizes and automates data across AWS services, in the cloud, and on-premises. You can configure backup policies and monitor activity for your AWS resources. You can automate and consolidate backup tasks that were previously performed service-by-service. This removes the need to create custom scripts and use manual processes.

2. Create an Amazon Machine Image of your EC2 instances and share it with the target account. You can launch new EC2 instances using the shared AMI. Follow step-by-step instructions: How do I transfer an Amazon EC2 instance or AMI to a different AWS account?

Amazon Machine Image (AMI) provides the information required to launch an instance. Specify an AMI and then launch multiple instances from a single AMI with the same configuration. You can use different AMIs to launch instances when you need instances with different configurations.

For migrating non-persistent compute resources, refer Migrating Infrastructure section.

Migrating storage resources

AWS offers various storage services including object, file, and block storage. To migrate objects from a S3 bucket, you can take the following approaches, shown in Figure 3a.

Figure 3a. Approaches to migrate S3 buckets

Figure 3a. Approaches to migrate S3 buckets

1. Use Amazon S3 command line interface (CLI) commands to copy the initial load of objects from the source account to the target account. Read How can I copy S3 objects from another AWS account? After the initial copy, you can enable Amazon S3 replication feature to continuously replicate object changes across accounts. Add a bucket policy to grant source bucket permission to replicate objects in destination bucket. Read this walkthrough on how to configure replications.

2. If the S3 bucket contains large number of objects, use Amazon S3 Batch operations to copy objects across AWS accounts in bulk. Read Cross-account bulk transfer of files using Amazon S3 Batch Operations.

To migrate files from an Amazon EFS file system, you can take the following approach, shown in Figure 3b.

Figure 3b. Approach to migrate EFS file systems

Figure 3b. Approach to migrate EFS file systems

Use AWS DataSync agent to transfer data from one EFS file system to another. AWS DataSync is an online transfer service that simplifies moving, copying, and synchronizing large amounts of data between on-premises storage systems and AWS storage services. Read Transferring file data across AWS Regions and accounts using AWS DataSync for step-by-step guidance.

Migrating database resources

AWS offers various purpose-built database engines. These include relational, key-value, document, in-memory, graph, time series, wide column, and ledger databases. To migrate relational databases, you can take one of the following approaches, shown in Figure 4.

Figure 4. Approaches to migrate relational database resources

Figure 4. Approaches to migrate relational database resources

1. If you want to continuously replicate data changes, use AWS Database Migration Service (AWS DMS) to replicate your data across AWS accounts with high availability. The source database remains fully operational during the migration, minimizing downtime to applications that rely on the database. You can set up a DMS task for either one-time migration or on-going replication. An on-going replication task keeps your source and target databases in sync. Once set up, the on-going replication task will continuously apply source changes to the target with minimal latency. Learn how to Set Up AWS DMS for Cross-Account Migration.

AWS DMS is a cloud service that streamlines the migration of relational databases, data warehouses, NoSQL databases, and other types of data stores. You can use AWS DMS to migrate your data into the AWS Cloud or between combinations of cloud and on-premises setups.

2. Use RDS Snapshots to create and share database backups across AWS accounts. Use the shared snapshots to launch new Amazon Relational Database Service (RDS) instances in the target account. Read step-by-step instructions: How can I share an encrypted Amazon RDS DB snapshot with another account?

3. Use AWS Backup to create backup policies that automatically back up your AWS resources. Use AWS Backup cross-account management feature to manage and monitor your backup, restore, and copy jobs across AWS accounts. Once the backups are available in the target account, you can restore RDS instances. Learn about Creating backup copies across AWS accounts.

In this section, we discussed relational databases migration. You can also use AWS DMS for migrating other databases. Read supported AWS DMS source and target databases.

Conclusion

In this blog post, we discussed various approaches you can take to migrate resources from one account to another depending upon the resource type and configuration. Additionally, you can also explore CloudEndure Migration for continuous data replication. Learn more about Migrating workloads across AWS Regions with CloudEndure Migration.

Optimizing Cloud Infrastructure Cost and Performance with Starburst on AWS

Post Syndicated from Kinnar Kumar Sen original https://aws.amazon.com/blogs/architecture/optimizing-cloud-infrastructure-cost-and-performance-with-starburst-on-aws/

Amazon Web Services (AWS) Cloud is elastic, convenient to use, easy to consume, and makes it simple to onboard workloads. Because of this simplicity, the cost associated with onboarding workloads is sometimes overlooked.

There is a notion that when an organization moves its workload to the cloud, agility, scalability, performance, and cost issues will disappear. While this may be true for agility and scalability, you must optimize your workload. You can do this with services like Amazon EC2 Auto Scaling via Amazon Elastic Compute Cloud (Amazon EC2) and Amazon EC2 Spot Instances to realize the performance and cost benefits the cloud offers.

In this blog post, we show you how Starburst Enterprise (Starburst) addressed a sudden increase in cost for their data analytics platform as they grew their internal teams and scaled out their infrastructure. After reviewing their architecture and deployments with AWS specialist architects, Starburst and AWS concluded that they could take the following steps to greatly reduce costs:

  1. Use Spot Instances to run workloads.
  2. Add Amazon EC2 Auto Scaling into their training and demonstration environments, because the Starburst platform is designed to elastically scale up and down.

For analytics workloads, when you rein in costs, you typically rein in performance. Starburst and AWS worked together to balance the cost and performance of Starburst’s data analytics platform while also harnessing the flexibility, scalability, security, and performance of the cloud.

What is Starburst Enterprise?

Starburst provides a Massively Parallel Processing SQL (MPPSQL) engine based on open source Trino. It is an analytics platform that provides the cornerstone in customers’ intelligent data mesh and offers the following benefits and services:

  • The platform gives you a single point to access, monitor, and secure your data mesh.
  • The platform gives you options for your data compute. You no longer have to wait on data migrations or extract, transform, and load (ETL), there is no vendor lock-in, and there is no need to swap out your existing analytics tools.
  • Starburst Stargate (Stargate) ensures that large jobs are completed within each data domain of your data mesh. Only the result set is retrieved from the domain.
    • Stargate reduces data output, which reduces costs and increases performance.
    • Data governance policies can also be applied uniquely in each data domain, ensuring security compliance and federation.

As shown in Figure 1, there are many connectors for input and output that ensure you experience improved performance and security.

Starburst platform

Figure 1. Starburst platform

Integrating Starburst Enterprise with AWS

As shown in Figure 2, Starburst Enterprise uses AWS services to deliver elastic scaling and optimize cost. The platform is architected with decoupled storage and compute. This allows the platform to scale as needed to analyze petabytes of data.

The platform can be deployed via AWS CloudFormation or Amazon Elastic Kubernetes Service (Amazon EKS). Starburst on AWS allows you to run analytic queries across AWS data sources and on-premises systems such as Teradata and Oracle.

Deployment architecture of Starburst platform on AWS

Figure 2. Deployment architecture of Starburst platform on AWS

Amazon EC2 Auto Scaling

Enterprises have diverse analytic workloads; their compute and memory requirements vary with time. Starburst uses Amazon EKS and Amazon EC2 Auto Scaling to elastically scale compute resources to meet the demands of their analytics workloads.

  • Amazon EC2 Auto Scaling ensures that you have the compute capacity for your workloads to handle the load elastically. It is used to architect sophisticated, elastic, and resilient applications on the AWS Cloud.
    • Starburst uses the scheduled scaling feature of Amazon EC2 Auto Scaling to scale the cluster up/down based on time. Thus, they incur no costs when the cluster is not in use.
  • Amazon EKS is a fully managed Kubernetes service that allows you to run Kubernetes on AWS without needing to install, operate, and maintain your own Kubernetes control plane.

Scaling cloud resource consumption on demand has a major impact on controlling cloud costs. Starburst supports scaling down elastically, which means removing compute resources doesn’t impact the underlying processes.

Amazon EC2 Spot Instances

Spot Instances let you take advantage of unused EC2 capacity in the AWS Cloud. They are available at up to a 90% discount compared to On-Demand Instance prices. If EC2 needs capacity for On-Demand Instance usage, Spot Instances can be interrupted by Amazon EC2 with a two-minute notification. There are many ways to handle the interruption to ensure that the application is well architected for resilience and fault tolerance.

Starburst has integrated Spot Instances as a part of the Amazon EKS managed node groups to cost optimize the analytics workloads. This best practice of instance diversification is implemented by using the integration eksctl and instance selector with dry-run flag. This creates a list of instances of same size (vCPU/Mem ratio) and uses them in the underlying node groups.

Same size instances are required to make best use of Kubernetes Cluster Autoscaler, which is used to manage the size of the cluster.

Scaling down, handling interruptions, and provisioning compute

“Scaling in” an active application is tricky, but Starburst was built with resiliency in mind, and it can effectively manage shut downs.

Spot Instances are an ideal compute option because Starburst can handle potential interruptions natively. Starburst also uses Amazon EKS managed node groups to provision nodes in the cluster. This requires significantly less operational effort compared to using self-managed node groups. It allows Starburst to enforce best practices like capacity optimized allocation strategy, capacity rebalancing, and instance diversification.

When you need to “scale out” the deployment, Amazon EKS and Amazon EC2 Auto Scaling help to provision capacity, as depicted in Figure 3.

Depicting “scale out” in a Starburst deployment

Figure 3. Depicting “scale out” in a Starburst deployment

Benefits realized from using AWS services

In a short period, Starburst was able to increase the number of people working on AWS. They added five times the number of Solutions Architects, they have previously. Additionally, in their initial tests of their new deployment architecture, their Solutions Architects were able to complete up to three times the amount of work than they had been able to previously. Even after the workload increased more than 15 times, with two simple changes they only had a slight increase in total cost.

This cost and performance optimization allows Starburst to be more productive internally and realize value for each dollar spent. This further justified investing more into building out infrastructure footprint.

Conclusion

In building their architecture with AWS, Starburst realized the importance of having a robust and comprehensive cloud administration plan that they can implement and manage going forward. They are now able to balance the cloud costs with performance and stability, even after considering the SLA requirements. Starburst is planning to teach their customers about the Spot Instance and Amazon EC2 Auto Scaling best practices to ensure they maintain a cost and performance optimized cloud architecture.

If you want to see the Starburst data analytics platform in action, you can get a free trial in the AWS Marketplace: Starburst Data Free Trial.