Tag Archives: Best practices

Improve productivity by using keyboard shortcuts in Amazon Athena query editor

Post Syndicated from Naresh Gautam original https://aws.amazon.com/blogs/big-data/improve-productivity-by-using-keyboard-shortcuts-in-amazon-athena-query-editor/

Amazon Athena is a serverless, interactive analytics service built on open-source frameworks, supporting open-table and file formats. Athena provides a simplified, flexible way to analyze petabytes of data where it lives. You can analyze data or build applications from an Amazon Simple Storage Service (Amazon S3) data lake and over 25 data sources, including on-premises data sources or other cloud systems using SQL or Python. Athena is built on open-source Trino and Presto engines and Apache Spark frameworks, with no provisioning or configuration effort required.

Different types of users rely on Athena, including business analysts, data scientists, security, and operations engineers. Athena provides a query editor to enter and run queries on data using structured query language (SQL). The query editor provides features like run, cancel, and save queries or statements. Additionally, it provides keyboard shortcuts for user-friendly operation.

This post discusses the keyboard shortcuts available and how you can use them.

Accessing the Athena console

If you’re new to Athena and don’t know how to access the Athena console and run queries and statements, refer to the following getting started tutorial. This tutorial walks you through using Athena to query data. You’ll create a table based on sample data stored in Amazon S3, query the table, and check the results of the query.

Keyboard shortcuts

The query editor provides keyboard shortcuts for different action types like running a query, formatting a query, line operations, selection, multi-cursor, go to, find/replace, and folding. Compared to reaching for the mouse or navigating a menu, a single keyboard shortcut saves a moment of your time.

With keyboard shortcuts, you can use key combinations to edit your SQL statement without using a mouse. For example, you can use multiple cursors in your editing window for selecting all instances of text you wish to edit, and edit your text, fold or unfold selected text, find and replace text, and perform line operations like remove line, move lines, and more.

You can also find these keyboard shortcuts on the query editor on the bottom right corner, as highlighted in the following screenshot.

The following table shows the keyboards shortcuts for Window/Linux and Mac.

Action Type Action Windows/Linux Mac
Other Execute query Ctrl-Enter Cmd-Enter, Ctrl-Enter
Other Format query Ctrl-Alt-L Opt-Cmd-L
Other Previous query Ctrl-Up Ctrl-Shift-Up
Other Next query Ctrl-Down Ctrl-Shift-Down
Other Close tab Alt-X Opt-X
Other Previous tab Ctrl-, Ctrl-,
Other Next tab Ctrl-. Ctrl-.
Other Indent Tab Tab
Other Outdent Shift-Tab Shift-Tab
Other Save Ctrl-S Cmd-S
Other Undo Ctrl-Z Cmd-Z
Other Redo Ctrl-Shift-Z, Ctrl-Y Cmd-Shift-Z, Cmd-Y
Other Toggle comment Ctrl-/ Cmd-/
Other Transpose letters Ctrl-T Ctrl-T
Other Change to lower case Ctrl-Shift-U Ctrl-Shift-U
Other Change to upper case Ctrl-U Ctrl-U
Other Overwrite Insert Insert
Other Delete Delete
Line Operations Remove line Ctrl-D Cmd-D
Line Operations Copy lines down Alt-Shift-Down Cmd-Opt-Down
Line Operations Copy lines up Alt-Shift-Up Cmd-Opt-Up
Line Operations Move lines down Alt-Down Opt-Down
Line Operations Move lines up Alt-Up Opt-Up
Line Operations Remove to line end Alt-Delete Ctrl-K
Line Operations Remove to line start Alt-Backspace Cmd-Backspace
Line Operations Remove word left Ctrl-Backspace Opt-Backspace, Ctrl-Opt-Backspace
Line Operations Remove word right Ctrl-Delete Opt-Delete
Line Operations Split line Ctrl-O
Selection Select all Ctrl-A Cmd-A
Selection Select left Shift-Left Shift-Left
Selection Select right Shift-Right Shift-Right
Selection Select word left Ctrl-Shift-Left Opt-Shift-Left
Selection Select word right Ctrl-Shift-Right Opt-Shift-Right
Selection Select line start Shift-Home Shift-Home
Selection Select line end Shift-End Shift-End
Selection Select to line end Alt-Shift-Right Cmd-Shift-Right
Selection Select to line start Alt-Shift-Left Cmd-Shift-Left
Selection Select up Shift-Up Shift-Up
Selection Select down Shift-Down Shift-Down
Selection Select page up Shift-PageUp Shift-PageUp
Selection Select page down Shift-PageDown Shift-PageDown
Selection Select to start Ctrl-Shift-Home Cmd-Shift-Up
Selection Select to end Ctrl-Shift-End Cmd-Shift-Down
Selection Duplicate selection Ctrl-Shift-D Cmd-Shift-D
Selection Select to matching bracket Ctrl-Shift-P
Multicursor Add multi-cursor above Ctrl-Alt-Up Ctrl-Opt-Up
Multicursor Add multi-cursor below Ctrl-Alt-Down Ctrl-Opt-Down
Multicursor Add next occurrence to multi-selection Ctrl-Alt-Right Ctrl-Opt-Right
Multicursor Add previous occurrence to multi-selection Ctrl-Alt-Left Ctrl-Opt-Left
Multicursor Move multi-cursor from current line to the line above Ctrl-Alt-Shift-Up Ctrl-Opt-Shift-Up
Multicursor Move multi-cursor from current line to the line below Ctrl-Alt-Shift-Down Ctrl-Opt-Shift-Down
Multicursor Remove current occurrence from multi-selection and move to next Ctrl-Alt-Shift-Right Ctrl-Opt-Shift-Right
Multicursor Remove current occurrence from multi-selection and move to previous Ctrl-Alt-Shift-Left Ctrl-Opt-Shift-Left
Multicursor Select all from multi-selection Ctrl-Shift-L Ctrl-Shift-L
Go to Go to left Left Left, Ctrl-B
Go to Go to right Right Right, Ctrl-F
Go to Go to word left Ctrl-Left Opt-Left
Go to Go to word right Ctrl-Right Opt-Right
Go to Go line up Up Up, Ctrl-P
Go to Go line down Down Down, Ctrl-N
Go to Go to line start Alt-Left, Home Cmd-Left, Home, Ctrl-A
Go to Go to line end Alt-Right, End Cmd-Right, End, Ctrl-E
Go to Go to page up PageUp Opt-PageUp
Go to Go to page down PageDown Opt-PageDown, Ctrl-V
Go to Go to start Ctrl-Home Cmd-Home, Cmd-Up
Go to Go to end Ctrl-End Cmd-End, Cmd-Down
Go to Scroll line down Ctrl-Down Cmd-Down
Go to Scroll line up Ctrl-Up
Go to Go to matching bracket Ctrl-P
Go to Scroll page down Opt-PageDown
Go to Scroll page up Opt-PageUp
Find/Replace Find Ctrl-F Cmd-F
Find/Replace Replace Ctrl-H Cmd-Opt-F
Find/Replace Find next Ctrl-K Cmd-G
Find/Replace Find previous Ctrl-Shift-K Cmd-Shift-G
Folding Fold selection Alt-L, Ctrl-F1 Cmd-Opt-L, Cmd-F1
Folding Unfold Alt-Shift-L, Ctrl-Shift-F1 Cmd-Opt-Shift-L, Cmd-Shift-F1
Folding Unfold all Alt-Shift-0 Cmd-Opt-Shift-0
Other Autocomplete Ctrl-Space Ctrl-Space
Other Focus out Esc Esc

For illustration, you can perform the Format query action by using the keyboard shortcut (Ctrl-Alt-L for Windows/Linux, Opt-Cmd-L for Mac). It converts unformatted SQL to a well-formatted SQL, as shown in the following screenshots.

Similarly, you can try out the Toggle comment command (Ctrl-/ for Windows/Linux, Cmd-/ for Mac) to comment or uncomment lines of SQL in the Athena query editor. This comes in very handy when you want to quickly comment out specific lines in your query, as shown in the following screenshots.

You can do line operations like Remove line, Copy lines down, Copy lines up, and more. The following screenshots show an example of the Remove line action (Ctrl-D for Windows/Linux, Cmd-D for Mac).

You can do a line selection like Select all, Select left, Select line start, and more. The following screenshots show an example the Select all action (Ctrl-A for Windows/Linux, Cmd-A for Mac).

You can do multi-cursor actions like Add multi-cursor above, Add multi-cursor below, Add next occurrence to multi-selection, Add previous occurrence to multi-selection, Move multi-cursor from current line to the line above, and more. The following example is of the Add multi-cursor above action (Ctrl-Alt-Up for Windows/Linux, Ctrl-Opt-Up for Mac).

You can do go to actions like Go to left, Go to right, Go to word left, and more. The following is an example of the Go to left action (Ctrl-B).

You can do find and replace actions like Find, Replace, Find next, and more. The following is an example of the Replace action (Ctrl-H for Windows/Linux, Cmd-Opt-F for Mac).

You can also do folding actions like Fold selection, Unfold, and Unfold all. The following example is of the Unfold action (Alt-Shift-L or Ctrl-Shift-F1 for Windows/Linux, Cmd-Opt-Shift-L or Cmd-Shift-F1 for Mac).

Conclusion

In this post, we saw how Athena provides an array of native options to help you improve productivity when analyzing your data. You can go to the Athena console and start running SQL statements or querying data using the built-in query editor. The query editor provides key shortcuts to improve your productivity by using key combinations to edit SQL statements, instead of using a mouse.

If you have any questions or suggestions, please leave a comment.


About the Authors

Naresh Gautam is a Data Analytics and AI/ML leader at AWS with 20 years of experience, who enjoys helping customers architect highly available, high-performance, and cost-effective data analytics and AI/ML solutions to empower customers with data-driven decision-making. In his free time, he enjoys meditation and cooking.

Srikanth Sopirala is a Principal Analytics Specialist Solutions Architect at AWS. He is a seasoned leader with over 20 years of experience, who is passionate about helping customers build scalable data and analytics solutions to gain timely insights and make critical business decisions. In his spare time, he enjoys reading, spending time with his family, and road biking.

Harsh Vardhan is an AWS Solutions Architect, specializing in analytics. He has over 5 years of experience working in the field of big data and data science. He is passionate about helping customers adopt best practices and discover insights from their data.

Boosting Resiliency with an ML-based Telemetry Analytics Architecture

Post Syndicated from Shibu Nair original https://aws.amazon.com/blogs/architecture/boosting-resiliency-with-an-ml-based-telemetry-analytics-architecture/

Data proliferation has become a norm and as organizations become more data driven, automating data pipelines that enable data ingestion, curation, and processing is vital. Since many organizations have thousands of time-bound, automated, complex pipelines, monitoring their telemetry information is critical. Keeping track of telemetry data helps businesses monitor and recover their pipelines faster which results in better customer experiences.

In our blog post, we explain how you can collect telemetry from your data pipeline jobs and use machine learning (ML) to build a lower- and upper-bound threshold to help operators identify anomalies in near-real time.

The applications of anomaly detection on telemetry data from job pipelines are wide-ranging, including these and more:

  • Detecting abnormal runtimes
  • Detecting jobs running slower than expected
  • Proactive monitoring
  • Notifications

Key tenets of telemetry analytics

There are five key tenets of telemetry analytics, as in Figure 1.

Key tenets of telemetry analytics

Figure 1. Key tenets of telemetry analytics

The key tenets for near real-time telemetry analytics for data pipelines are:

  1. Collecting the metrics
  2. Aggregating the metrics
  3. Identify anomaly
  4. Notify and resolve issues
  5. Persist for compliance reasons, historical trend analysis, and to visualize

This blog post describes how customers can easily implement these steps by using AWS native no-code, low-code (AWS LCNC) solutions.

ML-based telemetry analytics solution architecture

The architecture defined here helps customers incrementally enable features with AWS LCNC solutions by leveraging AWS managed services to avoid the overhead of infrastructure provisioning. Most of the steps are configurations of the features provided by AWS services. This enables customers to make their applications resilient by tracking and resolving anomalies in near real time, as in Figure 2.

ML-based telemetry analytics solution architecture

Figure 2. ML-based telemetry analytics solution architecture

Let’s explore each of the architecture steps in detail.

1. Indicative AWS data analytics services: Choose from a broad range of AWS analytics services, including data movement, data storage, data lakes, big data analytics, log analytics, and streaming analytics to business intelligence, ML, and beyond. This diagram shows a subset of these data analytics services. You may use one or a combination of many, depending on your use case.

2. Amazon CloudWatch metrics for telemetry analytics: Collecting and visualizing real-time logs, metrics, and event data is a key step in any process. CloudWatch helps you accomplish these tasks without any infrastructure provisioning. Almost every AWS data analytics service is integrated with CloudWatch to enable automatic capturing of the detailed metrics needed for telemetry analytics.

3. Near real-time use case examples: Step three presents practical, near real-time use cases that represent a range of real-world applications, one or more of which may apply to your own business needs.

Use case 1: Anomaly detection

CloudWatch provides the functionality to apply anomaly detection for a metric. The key business use case of this feature is to apply statistical and ML algorithms on a per-metrics basis of business critical applications to proactively identify issues and raise alarms.

The focus is on a single set of metrics that will be important for the application’s functioning—for example, AWS Lambda metrics of a 24/7 credit card company’s fraud monitoring application.

Use case 2: Unified metrics using Amazon Managed Grafana

For proper insights into telemetry data, it is important to unify metrics and collaboratively identify and troubleshoot issues in analytical systems. Amazon Managed Grafana helps to visualize, query, and corelate metrics from CloudWatch in near real-time.

For example, Amazon Managed Grafana can be used to monitor container metrics for Amazon EMR running on Amazon Elastic Kubernetes Service (Amazon EKS), which supports processing high-volume data from business critical Internet of Things (IoT) applications like connected factories, offsite refineries, wind farms, and more.

Use case 3: Combined business and metrics data using Amazon OpenSearch Service

Amazon OpenSearch Service provides the capability to perform near real-time, ML-based interactive log analytics, application monitoring, and search by combining business and telemetry data.

As an example, customers can combine AWS CloudTrail logs for AWS logins, Amazon Athena, and Amazon RedShift query access times with employee reference data to detect insider threats.

This log analytics use case architecture integrates into OpenSearch, as in Figure 3.

Log analytics use case architecture overview with OpenSearch

Figure 3. Log analytics use case architecture overview with OpenSearch

Use case 4: ML-based advanced analytics

Using Amazon Simple Storage Service (Amazon S3) as data storage, data lake customers can tap into AWS analytics services such as the AWS Glue Catalog, AWS Glue DataBrew, and Athena for preparing and transforming data, as well as build trend analysis using ML models in Amazon SageMaker. This mechanism helps with performing ML-based advanced analytics to identify and resolve recurring issues.

4. Anomaly resolution: When an alert is generated either by CloudWatch alarm, OpenSearch, or Amazon Managed Grafana, you have the option to act on the alert in near-real time. Amazon Simple Notification Service (Amazon SNS) and Lambda can help build workflows. Lambda also helps integrate with ServiceNow ticket creation, Slack channel notifications, or other ticketing systems.

Simple data pipeline example

Let’s explore another practical example using an architecture that demonstrates how AWS Step Functions orchestrates Lambda, AWS Glue jobs, and crawlers.

To report an anomaly on AWS Glue jobs based on total number of records processed, you can leverage the glue.driver.aggregate.recordsRead CloudWatch metric and set up a CloudWatch alarm based on anomaly detection, Amazon SNS topic for notifications, and Lambda for resolution, as in Figure 4.

AWS Step Functions orchestrating Lamba, AWS Glue jobs, and crawlers

Figure 4. AWS Step Functions orchestrating Lamba, AWS Glue jobs, and crawlers

Here are the steps involved in the architecture proposed:

  • CloudWatch automatically captures the metric glue.driver.aggregate.recordsRead from AWS Glue jobs.
  • Customers set a CloudWatch alarm based on the anomaly detection of glue.driver.aggregate.recordsRead metric and set a notification to Amazon SNS topic.
  • CloudWatch applies a ML algorithm to the metric’s past data and creates a model of metric’s expected values.
  • When the number of records increases significantly, the metric from the CloudWatch anomaly detection model notifies the Amazon SNS topic.
  • Customers can notify an email group and trigger a Lambda function to resolve the issue, or create tickets in their operational monitoring system.
  • Customers can also unify all the AWS Glue metrics using Amazon Managed Grafana. Using Amazon S3, data lake customers can crawl and catalog the data in the AWS Glue catalog and make it available for ad-hoc querying. Amazon SageMaker can be used for custom model training and inferencing.

Conclusion

In this blog post, we covered a recommended architecture to enable near-real time telemetry analytics for data pipelines, anomaly detection, notification, and resolution. This provides resiliency to the customer applications by proactively identifying and resolving issues.

Use Apache Iceberg in a data lake to support incremental data processing

Post Syndicated from Flora Wu original https://aws.amazon.com/blogs/big-data/use-apache-iceberg-in-a-data-lake-to-support-incremental-data-processing/

Apache Iceberg is an open table format for very large analytic datasets, which captures metadata information on the state of datasets as they evolve and change over time. It adds tables to compute engines including Spark, Trino, PrestoDB, Flink, and Hive using a high-performance table format that works just like a SQL table. Iceberg has become very popular for its support for ACID transactions in data lakes and features like schema and partition evolution, time travel, and rollback.

Apache Iceberg integration is supported by AWS analytics services including Amazon EMR, Amazon Athena, and AWS Glue. Amazon EMR can provision clusters with Spark, Hive, Trino, and Flink that can run Iceberg. Starting with Amazon EMR version 6.5.0, you can use Iceberg with your EMR cluster without requiring a bootstrap action. In early 2022, AWS announced general availability of Athena ACID transactions, powered by Apache Iceberg. The recently released Athena query engine version 3 provides better integration with the Iceberg table format. AWS Glue 3.0 and later supports the Apache Iceberg framework for data lakes.

In this post, we discuss what customers want in modern data lakes and how Apache Iceberg helps address customer needs. Then we walk through a solution to build a high-performance and evolving Iceberg data lake on Amazon Simple Storage Service (Amazon S3) and process incremental data by running insert, update, and delete SQL statements. Finally, we show you how to performance tune the process to improve read and write performance.

How Apache Iceberg addresses what customers want in modern data lakes

More and more customers are building data lakes, with structured and unstructured data, to support many users, applications, and analytics tools. There is an increased need for data lakes to support database like features such as ACID transactions, record-level updates and deletes, time travel, and rollback. Apache Iceberg is designed to support these features on cost-effective petabyte-scale data lakes on Amazon S3.

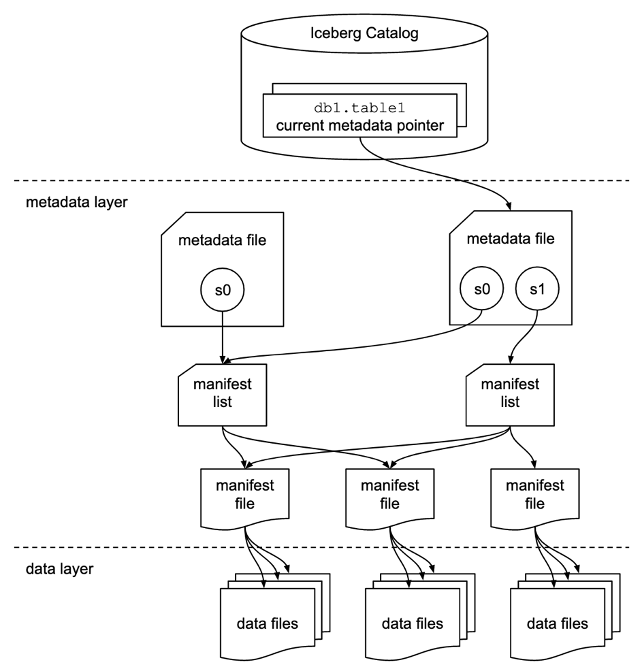
Apache Iceberg addresses customer needs by capturing rich metadata information about the dataset at the time the individual data files are created. There are three layers in the architecture of an Iceberg table: the Iceberg catalog, the metadata layer, and the data layer, as depicted in the following figure (source).

The Iceberg catalog stores the metadata pointer to the current table metadata file. When a select query is reading an Iceberg table, the query engine first goes to the Iceberg catalog, then retrieves the location of the current metadata file. Whenever there is an update to the Iceberg table, a new snapshot of the table is created, and the metadata pointer points to the current table metadata file.

The following is an example Iceberg catalog with AWS Glue implementation. You can see the database name, the location (S3 path) of the Iceberg table, and the metadata location.

The metadata layer has three types of files: the metadata file, manifest list, and manifest file in a hierarchy. At the top of the hierarchy is the metadata file, which stores information about the table’s schema, partition information, and snapshots. The snapshot points to the manifest list. The manifest list has the information about each manifest file that makes up the snapshot, such as location of the manifest file, the partitions it belongs to, and the lower and upper bounds for partition columns for the data files it tracks. The manifest file tracks data files as well as additional details about each file, such as the file format. All three files work in a hierarchy to track the snapshots, schema, partitioning, properties, and data files in an Iceberg table.

The data layer has the individual data files of the Iceberg table. Iceberg supports a wide range of file formats including Parquet, ORC, and Avro. Because the Iceberg table tracks the individual data files instead of only pointing to the partition location with data files, it isolates the writing operations from reading operations. You can write the data files at any time, but only commit the change explicitly, which creates a new version of the snapshot and metadata files.

Solution overview

In this post, we walk you through a solution to build a high-performing Apache Iceberg data lake on Amazon S3; process incremental data with insert, update, and delete SQL statements; and tune the Iceberg table to improve read and write performance. The following diagram illustrates the solution architecture.

To demonstrate this solution, we use the Amazon Customer Reviews dataset in an S3 bucket (s3://amazon-reviews-pds/parquet/). In real use case, it would be raw data stored in your S3 bucket. We can check the data size with the following code in the AWS Command Line Interface (AWS CLI):

//Run this AWS CLI command to check the data size
aws s3 ls --summarize --human-readable --recursive s3://amazon-reviews-pds/parquet

The total object count is 430, and total size is 47.4 GiB.

To set up and test this solution, we complete the following high-level steps:

  1. Set up an S3 bucket in the curated zone to store converted data in Iceberg table format.
  2. Launch an EMR cluster with appropriate configurations for Apache Iceberg.
  3. Create a notebook in EMR Studio.
  4. Configure the Spark session for Apache Iceberg.
  5. Convert data to Iceberg table format and move data to the curated zone.
  6. Run insert, update, and delete queries in Athena to process incremental data.
  7. Carry out performance tuning.

Prerequisites

To follow along with this walkthrough, you must have an AWS account with an AWS Identity and Access Management (IAM) role that has sufficient access to provision the required resources.

Set up the S3 bucket for Iceberg data in the curated zone in your data lake

Choose the Region in which you want to create the S3 bucket and provide a unique name:

s3://iceberg-curated-blog-data

Launch an EMR cluster to run Iceberg jobs using Spark

You can create an EMR cluster from the AWS Management Console, Amazon EMR CLI, or AWS Cloud Development Kit (AWS CDK). For this post, we walk you through how to create an EMR cluster from the console.

  1. On the Amazon EMR console, choose Create cluster.
  2. Choose Advanced options.
  3. For Software Configuration, choose the latest Amazon EMR release. As of January 2023, the latest release is 6.9.0. Iceberg requires release 6.5.0 and above.
  4. Select JupyterEnterpriseGateway and Spark as the software to install.
  5. For Edit software settings, select Enter configuration and enter [{"classification":"iceberg-defaults","properties":{"iceberg.enabled":true}}].
  6. Leave other settings at their default and choose Next.
  7. For Hardware, use the default setting.
  8. Choose Next.
  9. For Cluster name, enter a name. We use iceberg-blog-cluster.
  10. Leave the remaining settings unchanged and choose Next.
  11. Choose Create cluster.

Create a notebook in EMR Studio

We now walk you through how to create a notebook in EMR Studio from the console.

  1. On the IAM console, create an EMR Studio service role.
  2. On the Amazon EMR console, choose EMR Studio.
  3. Choose Get started.

The Get started page appears in a new tab.

  1. Choose Create Studio in the new tab.
  2. Enter a name. We use iceberg-studio.
  3. Choose the same VPC and subnet as those for the EMR cluster, and the default security group.
  4. Choose AWS Identity and Access Management (IAM) for authentication, and choose the EMR Studio service role you just created.
  5. Choose an S3 path for Workspaces backup.
  6. Choose Create Studio.
  7. After the Studio is created, choose the Studio access URL.
  8. On the EMR Studio dashboard, choose Create workspace.
  9. Enter a name for your Workspace. We use iceberg-workspace.
  10. Expand Advanced configuration and choose Attach Workspace to an EMR cluster.
  11. Choose the EMR cluster you created earlier.
  12. Choose Create Workspace.
  13. Choose the Workspace name to open a new tab.

In the navigation pane, there is a notebook that has the same name as the Workspace. In our case, it is iceberg-workspace.

  1. Open the notebook.
  2. When prompted to choose a kernel, choose Spark.

Configure a Spark session for Apache Iceberg

Use the following code, providing your own S3 bucket name:

%%configure -f
{
"conf": {
"spark.sql.catalog.demo": "org.apache.iceberg.spark.SparkCatalog",
"spark.sql.catalog.demo.catalog-impl": "org.apache.iceberg.aws.glue.GlueCatalog",
"spark.sql.catalog.demo.warehouse": "s3://iceberg-curated-blog-data",
"spark.sql.extensions":"org.apache.iceberg.spark.extensions.IcebergSparkSessionExtensions",
"spark.sql.catalog.demo.io-impl":"org.apache.iceberg.aws.s3.S3FileIO"
}
}

This sets the following Spark session configurations:

  • spark.sql.catalog.demo – Registers a Spark catalog named demo, which uses the Iceberg Spark catalog plugin.
  • spark.sql.catalog.demo.catalog-impl – The demo Spark catalog uses AWS Glue as the physical catalog to store Iceberg database and table information.
  • spark.sql.catalog.demo.warehouse – The demo Spark catalog stores all Iceberg metadata and data files under the root path defined by this property: s3://iceberg-curated-blog-data.
  • spark.sql.extensions – Adds support to Iceberg Spark SQL extensions, which allows you to run Iceberg Spark procedures and some Iceberg-only SQL commands (you use this in a later step).
  • spark.sql.catalog.demo.io-impl – Iceberg allows users to write data to Amazon S3 through S3FileIO. The AWS Glue Data Catalog by default uses this FileIO, and other catalogs can load this FileIO using the io-impl catalog property.

Convert data to Iceberg table format

You can use either Spark on Amazon EMR or Athena to load the Iceberg table. In the EMR Studio Workspace notebook Spark session, run the following commands to load the data:

// create a database in AWS Glue named reviews if not exist
spark.sql("CREATE DATABASE IF NOT EXISTS demo.reviews")

// load reviews - this load all the parquet files
val reviews_all_location = "s3://amazon-reviews-pds/parquet/"
val reviews_all = spark.read.parquet(reviews_all_location)

// write reviews data to an Iceberg v2 table
reviews_all.writeTo("demo.reviews.all_reviews").tableProperty("format-version", "2").createOrReplace()

After you run the code, you should find two prefixes created in your data warehouse S3 path (s3://iceberg-curated-blog-data/reviews.db/all_reviews): data and metadata.

Process incremental data using insert, update, and delete SQL statements in Athena

Athena is a serverless query engine that you can use to perform read, write, update, and optimization tasks against Iceberg tables. To demonstrate how the Apache Iceberg data lake format supports incremental data ingestion, we run insert, update, and delete SQL statements on the data lake.

Navigate to the Athena console and choose Query editor. If this is your first time using the Athena query editor, you need to configure the query result location to be the S3 bucket you created earlier. You should be able to see that the table reviews.all_reviews is available for querying. Run the following query to verify that you have loaded the Iceberg table successfully:

select * from reviews.all_reviews limit 5;

Process incremental data by running insert, update, and delete SQL statements:

//Example update statement
update reviews.all_reviews set star_rating=5 where product_category = 'Watches' and star_rating=4

//Example delete statement
delete from reviews.all_reviews where product_category = 'Watches' and star_rating=1

Performance tuning

In this section, we walk through different ways to improve Apache Iceberg read and write performance.

Configure Apache Iceberg table properties

Apache Iceberg is a table format, and it supports table properties to configure table behavior such as read, write, and catalog. You can improve the read and write performance on Iceberg tables by adjusting the table properties.

For example, if you notice that you write too many small files for an Iceberg table, you can config the write file size to write fewer but bigger size files, to help improve query performance.

Property Default Description
write.target-file-size-bytes 536870912 (512 MB) Controls the size of files generated to target about this many bytes

Use the following code to alter the table format:

//Example code to alter table format in EMR Studio Workspace notebook
spark.sql("ALTER TABLE demo.reviews.all_reviews 
SET TBLPROPERTIES ('write_target_data_file_size_bytes'='536870912')")

Partitioning and sorting

To make a query run fast, the less data read the better. Iceberg takes advantage of the rich metadata it captures at write time and facilitates techniques such as scan planning, partitioning, pruning, and column-level stats such as min/max values to skip data files that don’t have match records. We walk you through how query scan planning and partitioning work in Iceberg and how we use them to improve query performance.

Query scan planning

For a given query, the first step in a query engine is scan planning, which is the process to find the files in a table needed for a query. Planning in an Iceberg table is very efficient, because Iceberg’s rich metadata can be used to prune metadata files that aren’t needed, in addition to filtering data files that don’t contain matching data. In our tests, we observed Athena scanned 50% or less data for a given query on an Iceberg table compared to original data before conversion to Iceberg format.

There are two types of filtering:

  • Metadata filtering – Iceberg uses two levels of metadata to track the files in a snapshot: the manifest list and manifest files. It first uses the manifest list, which acts as an index of the manifest files. During planning, Iceberg filters manifests using the partition value range in the manifest list without reading all the manifest files. Then it uses selected manifest files to get data files.
  • Data filtering – After selecting the list of manifest files, Iceberg uses the partition data and column-level stats for each data file stored in manifest files to filter data files. During planning, query predicates are converted to predicates on the partition data and applied first to filter data files. Then, the column stats like column-level value counts, null counts, lower bounds, and upper bounds are used to filter out data files that can’t match the query predicate. By using upper and lower bounds to filter data files at planning time, Iceberg greatly improves query performance.

Partitioning and sorting

Partitioning is a way to group records with the same key column values together in writing. The benefit of partitioning is faster queries that access only part of the data, as explained earlier in query scan planning: data filtering. Iceberg makes partitioning simple by supporting hidden partitioning, in the way that Iceberg produces partition values by taking a column value and optionally transforming it.

In our use case, we first run the following query on the Iceberg table not partitioned. Then we partition the Iceberg table by the category of the reviews, which will be used in the query WHERE condition to filter out records. With partitioning, the query could scan much less data. See the following code:

//Example code in EMR Studio Workspace notebook to create an Iceberg table all_reviews_partitioned partitioned by product_category
reviews_all.writeTo("demo.reviews.all_reviews_partitioned").tableProperty("format-version", "2").partitionedBy($"product_category").createOrReplace()

Run the following select statement on the non-partitioned all_reviews table vs. the partitioned table to see the performance difference:

//Run this query on all_reviews table and the partitioned table for performance testing
select marketplace,customer_id, review_id,product_id,product_title,star_rating from reviews.all_reviews where product_category = 'Watches' and review_date between date('2005-01-01') and date('2005-03-31')

//Run the same select query on partitioned dataset
select marketplace,customer_id, review_id,product_id,product_title,star_rating from reviews.all_reviews_partitioned where product_category = 'Watches' and review_date between date('2005-01-01') and date('2005-03-31')

The following table shows the performance improvement of data partitioning, with about 50% performance improvement and 70% less data scanned.

Dataset Name Non-Partitioned Dataset Partitioned Dataset
Runtime (seconds) 8.20 4.25
Data Scanned (MB) 131.55 33.79

Note that the runtime is the average runtime with multiple runs in our test.

We saw good performance improvement after partitioning. However, this can be further improved by using column-level stats from Iceberg manifest files. In order to use the column-level stats effectively, you want to further sort your records based on the query patterns. Sorting the whole dataset using the columns that are often used in queries will reorder the data in such a way that each data file ends up with a unique range of values for the specific columns. If these columns are used in the query condition, it allows query engines to further skip data files, thereby enabling even faster queries.

Copy-on-write vs. read-on-merge

When implementing update and delete on Iceberg tables in the data lake, there are two approaches defined by the Iceberg table properties:

  • Copy-on-write – With this approach, when there are changes to the Iceberg table, either updates or deletes, the data files associated with the impacted records will be duplicated and updated. The records will be either updated or deleted from the duplicated data files. A new snapshot of the Iceberg table will be created and pointing to the newer version of data files. This makes the overall writes slower. There might be situations that concurrent writes are needed with conflicts so retry has to happen, which increases the write time even more. On the other hand, when reading the data, there is no extra process needed. The query will retrieve data from the latest version of data files.
  • Merge-on-read – With this approach, when there are updates or deletes on the Iceberg table, the existing data files will not be rewritten; instead new delete files will be created to track the changes. For deletes, a new delete file will be created with the deleted records. When reading the Iceberg table, the delete file will be applied to the retrieved data to filter out the delete records. For updates, a new delete file will be created to mark the updated records as deleted. Then a new file will be created for those records but with updated values. When reading the Iceberg table, both the delete and new files will be applied to the retrieved data to reflect the latest changes and produce the correct results. So, for any subsequent queries, an extra step to merge the data files with the delete and new files will happen, which will usually increase the query time. On the other hand, the writes might be faster because there is no need to rewrite the existing data files.

To test the impact of the two approaches, you can run the following code to set the Iceberg table properties:

//Run code to alter Iceberg table property to set copy-on-write and merge-on-read in EMR Studio Workspace notebook
spark.sql(“ALTER TABLE demo.reviews.all_reviews 
SET TBLPROPERTIES (‘write.delete.mode’=’copy-on-write’,’write.update.mode’=’copy-on-write’)”)

Run the update, delete, and select SQL statements in Athena to show the runtime difference for copy-on-write vs. merge-on-read:

//Example update statement
update reviews.all_reviews set star_rating=5 where product_category = ‘Watches’ and star_rating=4

//Example delete statement
delete from reviews.all_reviews where product_category = ‘Watches’ and star_rating=1

//Example select statement
select marketplace,customer_id, review_id,product_id,product_title,star_rating from reviews.all_reviews where product_category = ‘Watches’ and review_date between date(‘2005-01-01’) and date(‘2005-03-31’)

The following table summarizes the query runtimes.

Query Copy-on-Write Merge-on-Read
UPDATE DELETE SELECT UPDATE DELETE SELECT
Runtime (seconds) 66.251 116.174 97.75 10.788 54.941 113.44
Data scanned (MB) 494.06 3.07 137.16 494.06 3.07 137.16

Note that the runtime is the average runtime with multiple runs in our test.

As our test results show, there are always trade-offs in the two approaches. Which approach to use depends on your use cases. In summary, the considerations come down to latency on the read vs. write. You can reference the following table and make the right choice.

. Copy-on-Write Merge-on-Read
Pros Faster reads Faster writes
Cons Expensive writes Higher latency on reads
When to use Good for frequent reads, infrequent updates and deletes or large batch updates Good for tables with frequent updates and deletes

Data compaction

If your data file size is small, you might end up with thousands or millions of files in an Iceberg table. This dramatically increases the I/O operation and slows down the queries. Furthermore, Iceberg tracks each data file in a dataset. More data files lead to more metadata. This in turn increases the overhead and I/O operation on reading metadata files. In order to improve the query performance, it’s recommended to compact small data files to larger data files.

When updating and deleting records in Iceberg table, if the read-on-merge approach is used, you might end up with many small deletes or new data files. Running compaction will combine all these files and create a newer version of the data file. This eliminates the need to reconcile them during reads. It’s recommended to have regular compaction jobs to impact reads as little as possible while still maintaining faster write speed.

Run the following data compaction command, then run the select query from Athena:

//Data compaction 
optimize reviews.all_reviews REWRITE DATA USING BIN_PACK

//Run this query before and after data compaction
select marketplace,customer_id, review_id,product_id,product_title,star_rating from reviews.all_reviews where product_category = 'Watches' and review_date between date('2005-01-01') and date('2005-03-31')

The following table compares the runtime before vs. after data compaction. You can see about 40% performance improvement.

Query Before Data Compaction After Data Compaction
Runtime (seconds) 97.75 32.676 seconds
Data scanned (MB) 137.16 M 189.19 M

Note that the select queries ran on the all_reviews table after update and delete operations, before and after data compaction. The runtime is the average runtime with multiple runs in our test.

Clean up

After you follow the solution walkthrough to perform the use cases, complete the following steps to clean up your resources and avoid further costs:

  1. Drop the AWS Glue tables and database from Athena or run the following code in your notebook:
// DROP the table 
spark.sql("DROP TABLE demo.reviews.all_reviews") 
spark.sql("DROP TABLE demo.reviews.all_reviews_partitioned") 

// DROP the database 
spark.sql("DROP DATABASE demo.reviews")
  1. On the EMR Studio console, choose Workspaces in the navigation pane.
  2. Select the Workspace you created and choose Delete.
  3. On the EMR console, navigate to the Studios page.
  4. Select the Studio you created and choose Delete.
  5. On the EMR console, choose Clusters in the navigation pane.
  6. Select the cluster and choose Terminate.
  7. Delete the S3 bucket and any other resources that you created as part of the prerequisites for this post.

Conclusion

In this post, we introduced the Apache Iceberg framework and how it helps resolve some of the challenges we have in a modern data lake. Then we walked you though a solution to process incremental data in a data lake using Apache Iceberg. Finally, we had a deep dive into performance tuning to improve read and write performance for our use cases.

We hope this post provides some useful information for you to decide whether you want to adopt Apache Iceberg in your data lake solution.


About the Authors

Flora Wu is a Sr. Resident Architect at AWS Data Lab. She helps enterprise customers create data analytics strategies and build solutions to accelerate their businesses outcomes. In her spare time, she enjoys playing tennis, dancing salsa, and traveling.

Daniel Li is a Sr. Solutions Architect at Amazon Web Services. He focuses on helping customers develop, adopt, and implement cloud services and strategy. When not working, he likes spending time outdoors with his family.

Three ways to boost your email security and brand reputation with AWS

Post Syndicated from Michael Davie original https://aws.amazon.com/blogs/security/three-ways-to-boost-your-email-security-and-brand-reputation-with-aws/

If you own a domain that you use for email, you want to maintain the reputation and goodwill of your domain’s brand. Several industry-standard mechanisms can help prevent your domain from being used as part of a phishing attack. In this post, we’ll show you how to deploy three of these mechanisms, which visually authenticate emails sent from your domain to users and verify that emails are encrypted in transit. It can take as little as 15 minutes to deploy these mechanisms on Amazon Web Services (AWS), and the result can help to provide immediate and long-term improvements to your organization’s email security.

Phishing through email remains one of the most common ways that bad actors try to compromise computer systems. Incidents of phishing and related crimes far outnumber the incidents of other categories of internet crime, according to the most recent FBI Internet Crime Report. Phishing has consistently led to large annual financial losses in the US and globally.

Overview of BIMI, MTA-STS, and TLS reporting

An earlier post has covered how you can use Amazon Simple Email Service (Amazon SES) to send emails that align with best practices, including the IETF internet standards: Sender Policy Framework (SPF), DomainKeys Identified Mail (DKIM), and Domain-based Message Authentication, Reporting, and Conformance (DMARC). This post will show you how to build on this foundation and configure your domains to align with additional email security standards, including the following:

  • Brand Indicators for Message Identification (BIMI) – This standard allows you to associate a logo with your email domain, which some email clients will display to users in their inbox. Visit the BIMI Group’s Where is my BIMI Logo Displayed? webpage to see how logos are displayed in the user interfaces of BIMI-supporting mailbox providers; Figure 1 shows a mock-up of a typical layout that contains a logo.
  • Mail Transfer Agent Strict Transport Security (MTA-STS) – This standard helps ensure that email servers always use TLS encryption and certificate-based authentication when they send messages to your domain, to protect the confidentiality and integrity of email in transit.
  • SMTP TLS reporting – This reporting allows you to receive reports and monitor your domain’s TLS security posture, identify problems, and learn about attacks that might be occurring.
Figure 1: A mock-up of how BIMI enables branded logos to be displayed in email user interfaces

Figure 1: A mock-up of how BIMI enables branded logos to be displayed in email user interfaces

These three standards require your Domain Name System (DNS) to publish specific records, for example by using Amazon Route 53, that point to web pages that have additional information. You can host this information without having to maintain a web server by storing it in Amazon Simple Storage Service (Amazon S3) and delivering it through Amazon CloudFront, secured with a certificate provisioned from AWS Certificate Manager (ACM).

Note: This AWS solution works for DKIM, BIMI, and DMARC, regardless of what you use to serve the actual email for your domains, which services you use to send email, and where you host DNS. For purposes of clarity, this post assumes that you are using Route 53 for DNS. If you use a different DNS hosting provider, you will manually configure DNS records in your existing hosting provider.

Solution architecture

The architecture for this solution is depicted in Figure 2.

Figure 2: The architecture diagram showing how the solution components interact

Figure 2: The architecture diagram showing how the solution components interact

The interaction points are as follows:

  1. The web content is stored in an S3 bucket, and CloudFront has access to this bucket through an origin access identity, a mechanism of AWS Identity and Access Management (IAM).
  2. As described in more detail in the BIMI section of this blog post, the Verified Mark Certificate is obtained from a BIMI-qualified certificate authority and stored in the S3 bucket.
  3. When an external email system receives a message claiming to be from your domain, it looks up BIMI records for your domain in DNS. As depicted in the diagram, a DNS request is sent to Route 53.
  4. To retrieve the BIMI logo image and Verified Mark Certificate, the external email system will make HTTPS requests to a URL published in the BIMI DNS record. In this solution, the URL points to the CloudFront distribution, which has a TLS certificate provisioned with ACM.

A few important warnings

Email is a complex system of interoperating technologies. It is also brittle: a typo or a missing DNS record can make the difference between whether an email is delivered or not. Pay close attention to your email server and the users of your email systems when implementing the solution in this blog post. The main indicator that something is wrong is the absence of email. Instead of seeing an error in your email server’s log, users will tell you that they’re expecting to receive an email from somewhere and it’s not arriving. Or they will tell you that they sent an email, and their recipient can’t find it.

The DNS uses a lot of caching and time-out values to improve its efficiency. That makes DNS records slow and a little unpredictable as they propagate across the internet. So keep in mind that as you monitor your systems, it can be hours or even more than a day before the DNS record changes have an effect that you can detect.

This solution uses AWS Cloud Development Kit (CDK) custom resources, which are supported by AWS Lambda functions that will be created as part of the deployment. These functions are configured to use CDK-selected runtimes, which will eventually pass out of support and require you to update them.

Prerequisites

You will need permission in an AWS account to create and configure the following resources:

  • An Amazon S3 bucket to store the files and access logs
  • A CloudFront distribution to publicly deliver the files from the S3 bucket
  • A TLS certificate in ACM
  • An origin access identity in IAM that CloudFront will use to access files in Amazon S3
  • Lambda functions, IAM roles, and IAM policies created by CDK custom resources

You might also want to enable these optional services:

  • Amazon Route 53 for setting the necessary DNS records. If your domain is hosted by another DNS provider, you will set these DNS records manually.
  • Amazon SES or an Amazon WorkMail organization with a single mailbox. You can configure either service with a subdomain (for example, [email protected]) such that the existing domain is not disrupted, or you can create new email addresses by using your existing email mailbox provider.

BIMI has some additional requirements:

  • BIMI requires an email domain to have implemented a strong DMARC policy so that recipients can be confident in the authenticity of the branded logos. Your email domain must have a DMARC policy of p=quarantine or p=reject. Additionally, the domain’s policy cannot have sp=none or pct<100.

    Note: Do not adjust the DMARC policy of your domain without careful testing, because this can disrupt mail delivery.

  • You must have your brand’s logo in Scaled Vector Graphics (SVG) format that conforms to the BIMI standard. For more information, see Creating BIMI SVG Logo Files on the BIMI Group website.
  • Purchase a Verified Mark Certificate (VMC) issued by a third-party certificate authority. This certificate attests that the logo, organization, and domain are associated with each other, based on a legal trademark registration. Many email hosting providers require this additional certificate before they will show your branded logo to their users. Others do not currently support BIMI, and others might have alternative mechanisms to determine whether to show your logo. For more information about purchasing a Verified Mark Certificate, see the BIMI Group website.

    Note: If you are not ready to purchase a VMC, you can deploy this solution and validate that BIMI is correctly configured for your domain, but your branded logo will not display to recipients at major email providers.

What gets deployed in this solution?

This solution deploys the DNS records and supporting files that are required to implement BIMI, MTA-STS, and SMTP TLS reporting for an email domain. We’ll look at the deployment in more detail in the following sections.

BIMI

BIMI is described by the Internet Engineering Task Force (IETF) as follows:

Brand Indicators for Message Identification (BIMI) permits Domain Owners to coordinate with Mail User Agents (MUAs) to display brand-specific Indicators next to properly authenticated messages. There are two aspects of BIMI coordination: a scalable mechanism for Domain Owners to publish their desired Indicators, and a mechanism for Mail Transfer Agents (MTAs) to verify the authenticity of the Indicator. This document specifies how Domain Owners communicate their desired Indicators through the BIMI Assertion Record in DNS and how that record is to be interpreted by MTAs and MUAs. MUAs and mail-receiving organizations are free to define their own policies for making use of BIMI data and for Indicator display as they see fit.

If your organization has a trademark-protected logo, you can set up BIMI to have that logo displayed to recipients in their email inboxes. This can have a positive impact on your brand and indicates to end users that your email is more trustworthy. The BIMI Group shows examples of how brand logos are displayed in user inboxes, as well as a list of known email service providers that support the display of BIMI logos.

As a domain owner, you can implement BIMI by publishing the relevant DNS records and hosting the relevant files. To have your logo displayed by most email hosting providers, you will need to purchase a Verified Mark Certificate from a BIMI-qualified certificate authority.

This solution will deploy a valid BIMI record in Route 53 (or tell you what to publish in the DNS if you’re not using Route 53) and will store your provided SVG logo and Verified Mark Certificate files in Amazon S3, to be delivered through CloudFront with a valid TLS certificate from ACM.

To support BIMI, the solution makes the following changes to your resources:

  1. A DNS record of type TXT is published at the following host:
    default._bimi.<your-domain>. The value of this record is: v=BIMI1; l=<url-of-your-logo> a=<url-of-verified-mark-certificate>. The value of <your-domain> refers to the domain that is used in the From header of messages that your organization sends.
  2. The logo and optional Verified Mark Certificate are hosted publicly at the HTTPS locations defined by <url-of-your-logo> and <url-of-verified-mark-certificate>, respectively.

MTA-STS

MTA-STS is described by the IETF in RFC 8461 as follows:

SMTP (Simple Mail Transport Protocol) MTA Strict Transport Security (MTA-STS) is a mechanism enabling mail service providers to declare their ability to receive Transport Layer Security (TLS) secure SMTP connections and to specify whether sending SMTP servers should refuse to deliver to MX hosts that do not offer TLS with a trusted server certificate.

Put simply, MTA-STS helps ensure that email servers always use encryption and certificate-based authentication when sending email to your domains, so that message integrity and confidentiality are preserved while in transit across the internet. MTA-STS also helps to ensure that messages are only sent to authorized servers.

This solution will deploy a valid MTA-STS policy record in Route 53 (or tell you what value to publish in the DNS if you’re not using Route 53) and will create an MTA-STS policy document to be hosted on S3 and delivered through CloudFront with a valid TLS certificate from ACM.

To support MTA-STS, the solution makes the following changes to your resources:

  1. A DNS record of type TXT is published at the following host: _mta-sts.<your-domain>. The value of this record is: v=STSv1; id=<unique value used for cache invalidation>.
  2. The MTA-STS policy document is hosted at and obtained from the following location: https://mta-sts.<your-domain>/.well-known/mta-sts.txt.
  3. The value of <your-domain> in both cases is the domain that is used for routing inbound mail to your organization and is typically the same domain that is used in the From header of messages that your organization sends externally. Depending on the complexity of your organization, you might receive inbound mail for multiple domains, and you might choose to publish MTA-STS policies for each domain.

Is it ever bad to encrypt everything?

In the example MTA-STS policy file provided in the GitHub repository and explained later in this post, the MTA-STS policy mode is set to testing. This means that your email server is advertising its willingness to negotiate encrypted email connections, but it does not require TLS. Servers that want to send mail to you are allowed to connect and deliver mail even if there are problems in the TLS connection, as long as you’re in testing mode. You should expect reports when servers try to connect through TLS to your mail server and fail to do so.

Be fully prepared before you change the MTA-STS policy to enforce. After this policy is set to enforce, servers that follow the MTA-STS policy and that experience an enforceable TLS-related error when they try to connect to your mail server will not deliver mail to your mail server. This is a difficult situation to detect. You will simply stop receiving email from servers that comply with the policy. You might receive reports from them indicating what errors they encountered, but it is not guaranteed. Be sure that the email address you provide in SMTP TLS reporting (in the following section) is functional and monitored by people who can take action to fix issues. If you miss TLS failure reports, you probably won’t receive email. If the TLS certificate that you use on your email server expires, and your MTA-STS policy is set to enforce, this will become an urgent issue and will disrupt the flow of email until it is fixed.

SMTP TLS reporting

SMTP TLS reporting is described by the IETF in RFC 8460 as follows:

A number of protocols exist for establishing encrypted channels between SMTP Mail Transfer Agents (MTAs), including STARTTLS, DNS-Based Authentication of Named Entities (DANE) TLSA, and MTA Strict Transport Security (MTA-STS). These protocols can fail due to misconfiguration or active attack, leading to undelivered messages or delivery over unencrypted or unauthenticated channels. This document describes a reporting mechanism and format by which sending systems can share statistics and specific information about potential failures with recipient domains. Recipient domains can then use this information to both detect potential attacks and diagnose unintentional misconfigurations.

As you gain the security benefits of MTA-STS, SMTP TLS reporting will allow you to receive reports from other internet email providers. These reports contain information that is valuable when monitoring your TLS security posture, identifying problems, and learning about attacks that might be occurring.

This solution will deploy a valid SMTP TLS reporting record on Route 53 (or provide you with the value to publish in the DNS if you are not using Route 53).

To support SMTP TLS reporting, the solution makes the following changes to your resources:

  1. A DNS record of type TXT is published at the following host: _smtp._tls.<your-domain>. The value of this record is: v=TLSRPTv1; rua=mailto:<report-receiver-email-address>
  2. The value of <report-receiver-email-address> might be an address in your domain or in a third-party provider. Automated systems that process these reports must be capable of processing GZIP compressed files and parsing JSON.

Deploy the solution with the AWS CDK

In this section, you’ll learn how to deploy the solution to create the previously described AWS resources in your account.

  1. Clone the following GitHub repository:

    git clone https://github.com/aws-samples/serverless-mail
    cd serverless-mail/email-security-records

  2. Edit CONFIG.py to reflect your desired settings, as follows:
    1. If no Verified Mark Certificate is provided, set VMC_FILENAME = None.
    2. If your DNS zone is not hosted on Route 53, or if you do not want this app to manage Route 53 DNS records, set ROUTE_53_HOSTED = False. In this case, you will need to set TLS_CERTIFICATE_ARN to the Amazon Resource Name (ARN) of a certificate hosted on ACM in us-east-1. This certificate is used by CloudFront and must support two subdomains: mta-sts and your configured BIMI_ASSET_SUBDOMAIN.
  3. Finalize the preparation, as follows:
    1. Place your BIMI logo and Verified Mark Certificate files in the assets folder.
    2. Create an MTA-STS policy file at assets/.well-known/mta-sts.txt to reflect your mail exchange (MX) servers and policy requirements. An example file is provided at assets/.well-known/mta-sts.txt.example
  4. Deploy the solution, as follows:
    1. Open a terminal in the email-security-records folder.
    2. (Recommended) Create and activate a virtual environment by running the following commands.
      python3 -m venv .venv
      source .venv/bin/activate
    3. Install the Python requirements in your environment with the following command.
      pip install -r requirements.txt
    4. Assume a role in the target account that has the permissions outlined in the Prerequisites section of this post.

      Using AWS CDK version 2.17.0 or later, deploy the bootstrap in the target account by running the following command. To learn more, see Bootstrapping in the AWS CDK Developer Guide.
      cdk bootstrap

    5. Run the following command to synthesize the CloudFormation template. Review the output of this command to verify what will be deployed.
      cdk synth
    6. Run the following command to deploy the CloudFormation template. You will be prompted to accept the IAM changes that will be applied to your account.
      cdk deploy

      Note: If you use Route53, these records are created and activated in your DNS zones as soon as the CDK finishes deploying. As the records propagate through the DNS, they will gradually start affecting the email in the affected domains.

    7. If you’re not using Route53 and instead are using a third-party DNS provider, create the CNAME and TXT records as indicated. In this case, your email is not affected by this solution until you create the records in DNS.

Testing and troubleshooting

After you have deployed the CDK solution, you can test it to confirm that the DNS records and web resources are published correctly.

BIMI

  1. Query the BIMI DNS TXT record for your domain by using the dig or nslookup command in your terminal.

    dig +short TXT default._bimi.<your-domain.example>

    Verify the response. For example:

    "v=BIMI1; l=https://bimi-assets.<your-domain.example>/logo.svg"

  2. In your web browser, open the URL from that response (for example, https://bimi-assets.<your-domain.example>/logo.svg) to verify that the logo is available and that the HTTPS certificate is valid.
  3. The BIMI group provides a tool to validate your BIMI configuration. This tool will also validate your VMC if you have purchased one.

MTA-STS

  1. Query the MTA-STS DNS TXT record for your domain.

    dig +short TXT _mta-sts.<your-domain.example>

    The value of this record is as follows:

    v=STSv1; id=<unique value used for cache invalidation>

  2. You can load the MTA-STS policy document using your web browser. For example, https://mta-sts.<your-domain.example>/.well-known/mta-sts.txt
  3. You can also use third party tools to examine your MTA-STS configuration, such as MX Toolbox.

TLS reporting

  1. Query the TLS reporting DNS TXT record for your domain.

    dig +short TXT _smtp._tls.<your-domain.example>

    Verify the response. For example:

    "v=TLSRPTv1; rua=mailto:<your email address>"

  2. You can also use third party tools to examine your TLS reporting configuration, such as Easy DMARC.

Depending on which domains you communicate with on the internet, you will begin to see TLS reports arriving at the email address that you have defined in the TLS reporting DNS record. We recommend that you closely examine the TLS reports, and use automated analytical techniques over an extended period of time before changing the default testing value of your domain’s MTA-STS policy. Not every email provider will send TLS reports, but examining the reports in aggregate will give you a good perspective for making changes to your MTA-STS policy.

Cleanup

To remove the resources created by this solution:

  1. Open a terminal in the cdk-email-security-records folder.
  2. Assume a role in the target account with permission to delete resources.
  3. Run cdk destroy.

Note: The asset and log buckets are automatically emptied and deleted by the cdk destroy command.

Conclusion

When external systems send email to or receive email from your domains they will now query your new DNS records and will look up your domain’s BIMI, MTA-STS, and TLS reporting information from your new CloudFront distribution. By adopting the email domain security mechanisms outlined in this post, you can improve the overall security posture of your email environment, as well as the perception of your brand.

 
If you have feedback about this post, submit comments in the Comments section below. If you have questions about this post, contact AWS Support.

Want more AWS Security news? Follow us on Twitter.

Michael Davie

Michael Davie

Michael is a Senior Industry Specialist with AWS Security Assurance. He works with our customers, their regulators, and AWS teams to help raise the bar on secure cloud adoption and usage. Michael has over 20 years of experience working in the defence, intelligence, and technology sectors in Canada and is a licensed professional engineer.

Jesse Thompson

Jesse Thompson

Jesse is an Email Deliverability Manager with the Amazon Simple Email Service team. His background is in enterprise IT development and operations, with a focus on email abuse mitigation and encouragement of authenticity practices with open standard protocols. Jesse’s favorite activity outside of technology is recreational curling.

Proactive Insights with Amazon DevOps Guru for RDS

Post Syndicated from Kishore Dhamodaran original https://aws.amazon.com/blogs/devops/proactive-insights-with-amazon-devops-guru-for-rds/

Today, we are pleased to announce a new Amazon DevOps Guru for RDS capability: Proactive Insights. DevOps Guru for RDS is a fully-managed service powered by machine learning (ML), that uses the data collected by RDS Performance Insights to detect and alert customers of anomalous behaviors within Amazon Aurora databases. Since its release, DevOps Guru for RDS has empowered customers with information to quickly react to performance problems and to take corrective actions. Now, Proactive Insights adds recommendations related to operational issues that may prevent potential issues in the future.

Proactive Insights requires no additional set up for customers already using DevOps Guru for RDS, for both Amazon Aurora MySQL-Compatible Edition and Amazon Aurora PostgreSQL-Compatible Edition.

The following are example use cases of operational issues available for Proactive Insights today, with more insights coming over time:

  • Long InnoDB History for Aurora MySQL-Compatible engines – Triggered when the InnoDB history list length becomes very large.
  • Temporary tables created on disk for Aurora MySQL-Compatible engines – Triggered when the ratio of temporary tables created versus all temporary tables breaches a threshold.
  • Idle In Transaction for Aurora PostgreSQL-Compatible engines – Triggered when sessions connected to the database are not performing active work, but can keep database resources blocked.

To get started, navigate to the Amazon DevOps Guru Dashboard where you can see a summary of your system’s overall health, including ongoing proactive insights. In the following screen capture, the number three indicates that there are three ongoing proactive insights. Click on that number to see the listing of the corresponding Proactive Insights, which may include RDS or other Proactive Insights supported by Amazon DevOps Guru.

Amazon DevOps Guru Dashboard where you can see a summary of your system’s overall health, including ongoing proactive insights

Figure 1. Amazon DevOps Guru Dashboard where you can see a summary of your system’s overall health, including ongoing proactive insights.

Ongoing problems (including reactive and proactive insights) are also highlighted against your database instance on the Database list page in the Amazon RDS console.

Proactive and Reactive Insights are highlighted against your database instance on the Database list page in the Amazon RDS console

Figure 2. Proactive and Reactive Insights are highlighted against your database instance on the Database list page in the Amazon RDS console.

In the following sections, we will dive deep on these use cases of DevOps Guru for RDS Proactive Insights.

Long InnoDB History for Aurora MySQL-Compatible engines

The InnoDB history list is a global list of the undo logs for committed transactions. MySQL uses the history list to purge records and log pages when transactions no longer require the history.  If the InnoDB history list length grows too large, indicating a large number of old row versions, queries and even the database shutdown process can become slower.

DevOps Guru for RDS now detects when the history list length exceeds 1 million records and alerts users to close (either by commit or by rollback) any unnecessary long-running transactions before triggering database changes that involve a shutdown (this includes reboots and database version upgrades).

From the DevOps Guru console, navigate to Insights, choose Proactive, then choose “RDS InnoDB History List Length Anomalous” Proactive Insight with an ongoing status. You will notice that Proactive Insights provides an “Insight overview”, “Metrics” and “Recommendations”.

Insight overview provides you basic information on this insight. In our case, the history list for row changes increased significantly, which affects query and shutdown performance.

Long InnoDB History for Aurora MySQL-Compatible engines Insight overview

Figure 3. Long InnoDB History for Aurora MySQL-Compatible engines Insight overview.

The Metrics panel gives you a graphical representation of the history list length and the timeline, allowing you to correlate it with any anomalous application activity that may have occurred during this window.

Long InnoDB History for Aurora MySQL-Compatible engines Metrics panel

Figure 4. Long InnoDB History for Aurora MySQL-Compatible engines Metrics panel.

The Recommendations section suggests actions that you can take to mitigate this issue before it leads to a bigger problem. You will also notice the rationale behind the recommendation under the “Why is DevOps Guru recommending this?” column.

The Recommendations section suggests actions that you can take to mitigate this issue before it leads to a bigger problem

Figure 5. The Recommendations section suggests actions that you can take to mitigate this issue before it leads to a bigger problem.

Temporary tables created on disk for Aurora MySQL-Compatible engines

Sometimes it is necessary for the MySQL database to create an internal temporary table while processing a query. An internal temporary table can be held in memory and processed by the TempTable or MEMORY storage engine, or stored on disk by the InnoDB storage engine. An increase of temporary tables created on disk instead of in memory can impact the database performance.

DevOps Guru for RDS now monitors the rate at which the database creates temporary tables and the percentage of those temporary tables that use disk. When these values cross recommended levels over a given period of time, DevOps Guru for RDS creates an insight exposing this situation before it becomes critical.

From the DevOps Guru console, navigate to Insights, choose Proactive, then choose “RDS Temporary Tables On Disk AnomalousProactive Insight with an ongoing status. You will notice this Proactive Insight provides an “Insight overview”, “Metrics” and “Recommendations”.

Insight overview provides you basic information on this insight. In our case, more than 58% of the total temporary tables created per second were using disk, with a sustained rate of two temporary tables on disk created every second, which indicates that query performance is degrading.

Temporary tables created on disk insight overview

Figure 6. Temporary tables created on disk insight overview.

The Metrics panel shows you a graphical representation of the information specific for this insight. You will be presented with the evolution of the amount of temporary tables created on disk per second, the percentage of temporary tables on disk (out of the total number of database-created temporary tables), and of the overall rate at which the temporary tables are created (per second).

Temporary tables created on disk evolution of the amount of temporary tables created on disk per second

Figure 7. Temporary tables created on disk – evolution of the amount of temporary tables created on disk per second.

Temporary tables created on disk the percentage of temporary tables on disk (out of the total number of database-created temporary tables)

Figure 8. Temporary tables created on disk – the percentage of temporary tables on disk (out of the total number of database-created temporary tables).

Temporary tables created on disk overall rate at which the temporary tables are created (per second)

Figure 9. Temporary tables created on disk – overall rate at which the temporary tables are created (per second).

The Recommendations section suggests actions to avoid this situation when possible, such as not using BLOB and TEXT data types, tuning tmp_table_size and max_heap_table_size database parameters, data set reduction, columns indexing and more.

Temporary tables created on disk actions to avoid this situation when possible, such as not using BLOB and TEXT data types, tuning tmp_table_size and max_heap_table_size database parameters, data set reduction, columns indexing and more

Figure 10. Temporary tables created on disk – actions to avoid this situation when possible, such as not using BLOB and TEXT data types, tuning tmp_table_size and max_heap_table_size database parameters, data set reduction, columns indexing and more.

Additional explanations on this use case can be found by clicking on the “View troubleshooting doc” link.

Idle In Transaction for Aurora PostgreSQL-Compatible engines

A connection that has been idle in transaction  for too long can impact performance by holding locks, blocking other queries, or by preventing VACUUM (including autovacuum) from cleaning up dead rows.
PostgreSQL database requires periodic maintenance, which is known as vacuuming. Autovacuum in PostgreSQL automates the execution of VACUUM and ANALYZE commands. This process gathers the table statistics and deletes the dead rows. When vacuuming does not occur, this negatively impacts the database performance. It leads to an increase in table and index bloat (the disk space that was used by a table or index and is available for reuse by the database but has not been reclaimed), leads to stale statistics and can even end in transaction wraparound (when the number of unique transaction ids reaches its maximum of about two billion).

DevOps Guru for RDS monitors the time spent by sessions in an Aurora PostgreSQL database in idle in transaction state and raises initially a warning notification, followed by an alarm notification if the idle in transaction state continues (the current thresholds are 1800 seconds for the warning and 3600 seconds for the alarm).

From the DevOps Guru console, navigate to Insights, choose Proactive, then choose “RDS Idle In Transaction Max Time AnomalousProactive Insight with an ongoing status. You will notice this Proactive Insights provides an “Insight overview”, “Metrics” and “Recommendations”.

In our case, a connection has been in “idle in transaction” state for more than 1800 seconds, which could impact the database performance.

A connection has been in “idle in transaction” state for more than 1800 seconds, which could impact the database performance

Figure 11. A connection has been in “idle in transaction” state for more than 1800 seconds, which could impact the database performance.

The Metrics panel shows you a graphical representation of when the long-running “idle in transaction” connections started.

The Metrics panel shows you a graphical representation of when the long-running “idle in transaction” connections started

Figure 12. The Metrics panel shows you a graphical representation of when the long-running “idle in transaction” connections started.

As with the other insights, recommended actions are listed and a troubleshooting doc is linked for even more details on this use case.

Recommended actions are listed and a troubleshooting doc is linked for even more details on this use case

Figure 13. Recommended actions are listed and a troubleshooting doc is linked for even more details on this use case.

Conclusion

With Proactive Insights, DevOpsGuru for RDS enhances its abilities to help you monitor your databases by notifying you about potential operational issues, before they become bigger problems down the road. To get started, you need to ensure that you have enabled Performance Insights on the database instance(s) you want monitored, as well as ensure and confirm that DevOps Guru is enabled to monitor those instances (for example by enabling it at account level, by monitoring specific CloudFormation stacks or by using AWS tags for specific Aurora resources). Proactive Insights is available in all regions where DevOps Guru for RDS is supported. To learn more about Proactive Insights, join us for a free hands-on Immersion Day (available in three time zones) on March 15th or April 12th.

About the authors:

Kishore Dhamodaran

Kishore Dhamodaran is a Senior Solutions Architect at AWS.

Raluca Constantin

Raluca Constantin is a Senior Database Engineer with the Relational Database Services (RDS) team at Amazon Web Services. She has 16 years of experience in the databases world. She enjoys travels, hikes, arts and is a proud mother of a 12y old daughter and a 7y old son.

Jonathan Vogel

Jonathan is a Developer Advocate at AWS. He was a DevOps Specialist Solutions Architect at AWS for two years prior to taking on the Developer Advocate role. Prior to AWS, he practiced professional software development for over a decade. Jonathan enjoys music, birding and climbing rocks.

Patterns for enterprise data sharing at scale

Post Syndicated from Venkata Sistla original https://aws.amazon.com/blogs/big-data/patterns-for-enterprise-data-sharing-at-scale/

Data sharing is becoming an important element of an enterprise data strategy. AWS services like AWS Data Exchange provide an avenue for companies to share or monetize their value-added data with other companies. Some organizations would like to have a data sharing platform where they can establish a collaborative and strategic approach to exchange data with a restricted group of companies in a closed, secure, and exclusive environment. For example, financial services companies and their auditors, or manufacturing companies and their supply chain partners. This fosters development of new products and services and helps improve their operational efficiency.

Data sharing is a team effort, it’s important to note that in addition to establishing the right infrastructure, successful data sharing also requires organizations to ensure that business owners sponsor data sharing initiatives. They also need to ensure that data is of high quality. Data platform owners and security teams should encourage proper data use and fix any privacy and confidentiality issues.

This blog discusses various data sharing options and common architecture patterns that organizations can adopt to set up their data sharing infrastructure based on AWS service availability and data compliance.

Data sharing options and data classification types

Organizations operate across a spectrum of security compliance constraints. For some organizations, it’s possible to use AWS services like AWS Data Exchange. However, organizations working in heavily regulated industries like federal agencies or financial services might be limited by the allow listed AWS service options. For example, if an organization is required to operate in a Fedramp Medium or Fedramp High environment, their options to share data may be limited by the AWS services that are available and have been allow listed. Service availability is based on platform certification by AWS, and allow listing is based on the organizations defining their security compliance architecture and guidelines.

The kind of data that the organization wants to share with its partners may also have an impact on the method used for data sharing. Complying with data classification rules may further limit their choice of data sharing options they may choose.

The following are some general data classification types:

  • Public data – Important information, though often freely available for people to read, research, review and store. It typically has the lowest level of data classification and security.
  • Private data – Information you might want to keep private like email inboxes, cell phone content, employee identification numbers, or employee addresses. If private data were shared, destroyed, or altered, it might pose a slight risk to an individual or the organization.
  • Confidential or restricted data – A limited group of individuals or parties can access sensitive information often requiring special clearance or special authorization. Confidential or restricted data access might involve aspects of identity and authorization management. Examples of confidential data include Social Security numbers and vehicle identification numbers.

The following is a sample decision tree that you can refer to when choosing your data sharing option based on service availability, classification type, and data format (structured or unstructured). Other factors like usability, multi-partner accessibility, data size, consumption patterns like bulk load/API access, and more may also affect the choice of data sharing pattern.

decisiontree

In the following sections, we discuss each pattern in more detail.

Pattern 1: Using AWS Data Exchange

AWS Data Exchange makes exchanging data easier, helping organizations lower costs, become more agile, and innovate faster. Organizations can choose to share data privately using AWS Data Exchange with their external partners. AWS Data Exchange offers perimeter controls that are applied at identity and resource levels. These controls decide which external identities have access to specific data resources. AWS Data Exchange provides multiple different patterns for external parties to access data, such as the following:

The following diagram illustrates an example architecture.

pattern1

With AWS Data Exchange, once the dataset to share (or sell) is configured, AWS Data Exchange automatically manages entitlements (and billing) between the producer and the consumer. The producer doesn’t have to manage policies, set up new access points, or create new Amazon Redshift data shares for each consumer, and access is automatically revoked if the subscription ends. This can significantly reduce the operational overhead in sharing data.

Pattern 2: Using AWS Lake Formation for centralized access management

You can use this pattern in cases where both the producer and consumer are on the AWS platform with an AWS account that is enabled to use AWS Lake Formation. This pattern provides a no-code approach to data sharing. The following diagram illustrates an example architecture.

pattern2

In this pattern, the central governance account has Lake Formation configured for managing access across the producer’s org accounts. Resource links from the production account Amazon Simple Storage Service (Amazon S3) bucket are created in Lake Formation. The producer grants Lake Formation permissions on an AWS Glue Data Catalog resource to an external account, or directly to an AWS Identity and Access Management (IAM) principal in another account. Lake Formation uses AWS Resource Access Manager (AWS RAM) to share the resource. If the grantee account is in the same organization as the grantor account, the shared resource is available immediately to the grantee. If the grantee account is not in the same organization, AWS RAM sends an invitation to the grantee account to accept or reject the resource grant. To make the shared resource available, the consumer administrator in the grantee account must use the AWS RAM console or AWS Command Line Interface (AWS CLI) to accept the invitation.

Authorized principals can share resources explicitly with an IAM principal in an external account. This feature is useful when the producer wants to have control over who in the external account can access the resources. The permissions the IAM principal receives are a union of direct grants and the account-level grants that are cascaded down to the principals. The data lake administrator of the recipient account can view the direct cross-account grants, but can’t revoke permissions.

Pattern 3: Using AWS Lake Formation from the producer external sharing account

The producer may have stringent security requirements where no external consumer should access their production account or their centralized governance account. They may also not have Lake Formation enabled on their production platform. In such cases, as shown in the following diagram, the producer production account (Account A) is dedicated to its internal organization users. The producer creates another account, the producer external sharing account (Account B), which is dedicated for external sharing. This gives the producer more latitude to create specific policies for specific organizations.

The following architecture diagram shows an overview of the pattern.

pattern3

The producer implements a process to create an asynchronous copy of data in Account B. The bucket can be configured for Same Region Replication (SRR) or Cross Region Replication (CRR) for objects that need to be shared. This facilitates automated refresh of data to the external account to the “External Published Datasets” S3 bucket without having to write any code.

Creating a copy of the data allows the producer to add another degree of separation between the external consumer and its production data. It also helps meet any compliance or data sovereignty requirements.

Lake Formation is set up on Account B, and the administrator creates resources links for the “External Published Datasets” S3 bucket in its account to grant access. The administrator follows the same process to grant access as described earlier.

Pattern 4: Using Amazon Redshift data sharing

This pattern is ideally suited for a producer who has most of their published data products on Amazon Redshift. This pattern also requires the producer’s external sharing account (Account B) and the consumer account (Account C) to have an encrypted Amazon Redshift cluster or Amazon Redshift Serverless endpoint that meets the prerequisites for Amazon Redshift data sharing.

The following architecture diagram shows an overview of the pattern.

pattern4

Two options are possible depending on the producer’s compliance constraints:

  • Option A – The producer enables data sharing directly on the production Amazon Redshift cluster.
  • Option B – The producer may have constraints with respect to sharing the production cluster. The producer creates a simple AWS Glue job that copies data from the Amazon Redshift cluster in the production Account A to the Amazon Redshift cluster in the external Account B. This AWS Glue job can be scheduled to refresh data as needed by the consumer. When the data is available in Account B, the producer can create multiple views and multiple data shares as needed.

In both options, the producer maintains complete control over what data is being shared, and the consumer admin maintains full control over who can access the data within their organization.

After both the producer and consumer admins approve the data sharing request, the consumer user can access this data as if it were part of their own account without have to write any additional code.

Pattern 5: Sharing data securely and privately using APIs

You can adopt this pattern when the external partner doesn’t have a presence on AWS. You can also use this pattern when published data products are spread across various services like Amazon S3, Amazon Redshift, Amazon DynamoDB, and Amazon OpenSearch Service but the producer would like to maintain a single data sharing interface.

Here’s an example use case: Company A would like to share some of its log data in near-real time with its partner Company B, who uses this data to generate predictive insights for Company A. Company A stores this data in Amazon Redshift. The company wants to share this transactional information with its partner after masking the personally identifiable information (PII) in a cost-effective and secure way to generate insights. Company B doesn’t use the AWS platform.

Company A establishes a microbatch process using an AWS Lambda function or AWS Glue that queries Amazon Redshift to get incremental log data, applies the rules to redact the PII, and loads this data to the “Published Datasets” S3 bucket. This instantiates an SRR/CRR process that refreshes this data in the “External Sharing” S3 bucket.

The following diagram shows how the consumer can then use an API-based approach to access this data.

pattern5

The workflow contains the following steps:

  1. An HTTPS API request is sent from the API consumer to the API proxy layer.
  2. The HTTPS API request is forwarded from the API proxy to Amazon API Gateway in the external sharing AWS account.
  3. Amazon API Gateway calls the request receiver Lambda function.
  4. The request receiver function writes the status to a DynamoDB control table.
  5. A second Lambda function, the poller, checks the status of the results in the DynamoDB table.
  6. The poller function fetches results from Amazon S3.
  7. The poller function sends a presigned URL to download the file from the S3 bucket to the requestor via Amazon Simple Email Service (Amazon SES).
  8. The requestor downloads the file using the URL.
  9. The network perimeter AWS account only allows egress internet connection.
  10. The API proxy layer enforces both the egress security controls and perimeter firewall before the traffic leaves the producer’s network perimeter.
  11. The AWS Transit Gateway security egress VPC routing table only allows connectivity from the required producer’s subnet, while preventing internet access.

Pattern 6: Using Amazon S3 access points

Data scientists may need to work collaboratively on image, videos, and text documents. Legal and audit groups may want to share reports and statements with the auditing agencies. This pattern discusses an approach to sharing such documents. The pattern assumes that the external partners are also on AWS. Amazon S3 access points allow the producer to share access with their consumer by setting up cross-account access without having to edit bucket policies.

Access points are named network endpoints that are attached to buckets that you can use to perform S3 object operations, such as GetObject and PutObject. Each access point has distinct permissions and network controls that Amazon S3 applies for any request that is made through that access point. Each access point enforces a customized access point policy that works in conjunction with the bucket policy attached to the underlying bucket.

The following architecture diagram shows an overview of the pattern.

pattern6

The producer creates an S3 bucket and enables the use of access points. As part of the configuration, the producer specifies the consumer account, IAM role, and privileges for the consumer IAM role.

The consumer users with the IAM role in the consumer account can access the S3 bucket via the internet or restricted to an Amazon VPC via VPC endpoints and AWS PrivateLink.

Conclusion

Each organization has its unique set of constraints and requirements that it needs to fulfill to set up an efficient data sharing solution. In this post, we demonstrated various options and best practices available to organizations. The data platform owner and security team should work together to assess what works best for your specific situation. Your AWS account team is also available to help.

Related resources

For more information on related topics, refer to the following:


About the Authors


Venkata Sistla
is a Cloud Architect – Data & Analytics at AWS. He specializes in building data processing capabilities and helping customers remove constraints that prevent them from leveraging their data to develop business insights.

Santosh Chiplunkar is a Principal Resident Architect at AWS. He has over 20 years of experience helping customers solve their data challenges. He helps customers develop their data and analytics strategy and provides them with guidance on how to make it a reality.

Securely validate business application resilience with AWS FIS and IAM

Post Syndicated from Dr. Rudolf Potucek original https://aws.amazon.com/blogs/devops/securely-validate-business-application-resilience-with-aws-fis-and-iam/

To avoid high costs of downtime, mission critical applications in the cloud need to achieve resilience against degradation of cloud provider APIs and services.

In 2021, AWS launched AWS Fault Injection Simulator (FIS), a fully managed service to perform fault injection experiments on workloads in AWS to improve their reliability and resilience. At the time of writing, FIS allows to simulate degradation of Amazon Elastic Compute Cloud (EC2) APIs using API fault injection actions and thus explore the resilience of workflows where EC2 APIs act as a fault boundary. 

In this post we show you how to explore additional fault boundaries in your applications by selectively denying access to any AWS API. This technique is particularly useful for fully managed, “black box” services like Amazon Simple Storage Service (S3) or Amazon Simple Queue Service (SQS) where a failure of read or write operations is sufficient to simulate problems in the service. This technique is also useful for injecting failures in serverless applications without needing to modify code. While similar results could be achieved with network disruption or modifying code with feature flags, this approach provides a fine granular degradation of an AWS API without the need to re-deploy and re-validate code.

Overview

We will explore a common application pattern: user uploads a file, S3 triggers an AWS Lambda function, Lambda transforms the file to a new location and deletes the original:

S3 upload and transform logical workflow: User uploads file to S3, upload triggers AWS Lambda execution, Lambda writes transformed file to a new bucket and deletes original. Workflow can be disrupted at file deletion.

Figure 1. S3 upload and transform logical workflow: User uploads file to S3, upload triggers AWS Lambda execution, Lambda writes transformed file to a new bucket and deletes original. Workflow can be disrupted at file deletion.

We will simulate the user upload with an Amazon EventBridge rate expression triggering an AWS Lambda function which creates a file in S3:

S3 upload and transform implemented demo workflow: Amazon EventBridge triggers a creator Lambda function, Lambda function creates a file in S3, file creation triggers AWS Lambda execution on transformer function, Lambda writes transformed file to a new bucket and deletes original. Workflow can be disrupted at file deletion.

Figure 2. S3 upload and transform implemented demo workflow: Amazon EventBridge triggers a creator Lambda function, Lambda function creates a file in S3, file creation triggers AWS Lambda execution on transformer function, Lambda writes transformed file to a new bucket and deletes original. Workflow can be disrupted at file deletion.

Using this architecture we can explore the effect of S3 API degradation during file creation and deletion. As shown, the API call to delete a file from S3 is an application fault boundary. The failure could occur, with identical effect, because of S3 degradation or because the AWS IAM role of the Lambda function denies access to the API.

To inject failures we use AWS Systems Manager (AWS SSM) automation documents to attach and detach IAM policies at the API fault boundary and FIS to orchestrate the workflow.

Each Lambda function has an IAM execution role that allows S3 write and delete access, respectively. If the processor Lambda fails, the S3 file will remain in the bucket, indicating a failure. Similarly, if the IAM execution role for the processor function is denied the ability to delete a file after processing, that file will remain in the S3 bucket.

Prerequisites

Following this blog posts will incur some costs for AWS services. To explore this test application you will need an AWS account. We will also assume that you are using AWS CloudShell or have the AWS CLI installed and have configured a profile with administrator permissions. With that in place you can create the demo application in your AWS account by downloading this template and deploying an AWS CloudFormation stack:

git clone https://github.com/aws-samples/fis-api-failure-injection-using-iam.git
cd fis-api-failure-injection-using-iam
aws cloudformation deploy --stack-name test-fis-api-faults --template-file template.yaml --capabilities CAPABILITY_NAMED_IAM

Fault injection using IAM

Once the stack has been created, navigate to the Amazon CloudWatch Logs console and filter for /aws/lambda/test-fis-api-faults. Under the EventBridgeTimerHandler log group you should find log events once a minute writing a timestamped file to an S3 bucket named fis-api-failure-ACCOUNT_ID. Under the S3TriggerHandler log group you should find matching deletion events for those files.

Once you have confirmed object creation/deletion, let’s take away the permission of the S3 trigger handler lambda to delete files. To do this you will attach the FISAPI-DenyS3DeleteObject  policy that was created with the template:

ROLE_NAME=FISAPI-TARGET-S3TriggerHandlerRole
ROLE_ARN=$( aws iam list-roles --query "Roles[?RoleName=='${ROLE_NAME}'].Arn" --output text )
echo Target Role ARN: $ROLE_ARN

POLICY_NAME=FISAPI-DenyS3DeleteObject
POLICY_ARN=$( aws iam list-policies --query "Policies[?PolicyName=='${POLICY_NAME}'].Arn" --output text )
echo Impact Policy ARN: $POLICY_ARN

aws iam attach-role-policy \
  --role-name ${ROLE_NAME}\
  --policy-arn ${POLICY_ARN}

With the deny policy in place you should now see object deletion fail and objects should start showing up in the S3 bucket. Navigate to the S3 console and find the bucket starting with fis-api-failure. You should see a new object appearing in this bucket once a minute:

S3 bucket listing showing files not being deleted because IAM permissions DENY file deletion during FIS experiment.

Figure 3. S3 bucket listing showing files not being deleted because IAM permissions DENY file deletion during FIS experiment.

If you would like to graph the results you can navigate to AWS CloudWatch, select “Logs Insights“, select the log group starting with /aws/lambda/test-fis-api-faults-S3CountObjectsHandler, and run this query:

fields @timestamp, @message
| filter NumObjects >= 0
| sort @timestamp desc
| stats max(NumObjects) by bin(1m)
| limit 20

This will show the number of files in the S3 bucket over time:

AWS CloudWatch Logs Insights graph showing the increase in the number of retained files in S3 bucket over time, demonstrating the effect of the introduced failure.

Figure 4. AWS CloudWatch Logs Insights graph showing the increase in the number of retained files in S3 bucket over time, demonstrating the effect of the introduced failure.

You can now detach the policy:

ROLE_NAME=FISAPI-TARGET-S3TriggerHandlerRole
ROLE_ARN=$( aws iam list-roles --query "Roles[?RoleName=='${ROLE_NAME}'].Arn" --output text )
echo Target Role ARN: $ROLE_ARN

POLICY_NAME=FISAPI-DenyS3DeleteObject
POLICY_ARN=$( aws iam list-policies --query "Policies[?PolicyName=='${POLICY_NAME}'].Arn" --output text )
echo Impact Policy ARN: $POLICY_ARN

aws iam detach-role-policy \
  --role-name ${ROLE_NAME}\
  --policy-arn ${POLICY_ARN}

We see that newly written files will once again be deleted but the un-processed files will remain in the S3 bucket. From the fault injection we learned that our system does not tolerate request failures when deleting files from S3. To address this, we should add a dead letter queue or some other retry mechanism.

Note: if the Lambda function does not return a success state on invocation, EventBridge will retry. In our Lambda functions we are cost conscious and explicitly capture the failure states to avoid excessive retries.

Fault injection using SSM

To use this approach from FIS and to always remove the policy at the end of the experiment, we first create an SSM document to automate adding a policy to a role. To inspect this document, open the SSM console, navigate to the “Documents” section, find the FISAPI-IamAttachDetach document under “Owned by me”, and examine the “Content” tab (make sure to select the correct region). This document takes the name of the Role you want to impact and the Policy you want to attach as parameters. It also requires an IAM execution role that grants it the power to list, attach, and detach specific policies to specific roles.

Let’s run the SSM automation document from the console by selecting “Execute Automation”. Determine the ARN of the FISAPI-SSM-Automation-Role from CloudFormation or by running:

POLICY_NAME=FISAPI-DenyS3DeleteObject
POLICY_ARN=$( aws iam list-policies --query "Policies[?PolicyName=='${POLICY_NAME}'].Arn" --output text )
echo Impact Policy ARN: $POLICY_ARN

Use FISAPI-SSM-Automation-Role, a duration of 2 minutes expressed in ISO8601 format as PT2M, the ARN of the deny policy, and the name of the target role FISAPI-TARGET-S3TriggerHandlerRole:

Image of parameter input field reflecting the instructions in blog text.

Figure 5. Image of parameter input field reflecting the instructions in blog text.

Alternatively execute this from a shell:

ASSUME_ROLE_NAME=FISAPI-SSM-Automation-Role
ASSUME_ROLE_ARN=$( aws iam list-roles --query "Roles[?RoleName=='${ASSUME_ROLE_NAME}'].Arn" --output text )
echo Assume Role ARN: $ASSUME_ROLE_ARN

ROLE_NAME=FISAPI-TARGET-S3TriggerHandlerRole
ROLE_ARN=$( aws iam list-roles --query "Roles[?RoleName=='${ROLE_NAME}'].Arn" --output text )
echo Target Role ARN: $ROLE_ARN

POLICY_NAME=FISAPI-DenyS3DeleteObject
POLICY_ARN=$( aws iam list-policies --query "Policies[?PolicyName=='${POLICY_NAME}'].Arn" --output text )
echo Impact Policy ARN: $POLICY_ARN

aws ssm start-automation-execution \
  --document-name FISAPI-IamAttachDetach \
  --parameters "{
      \"AutomationAssumeRole\": [ \"${ASSUME_ROLE_ARN}\" ],
      \"Duration\": [ \"PT2M\" ],
      \"TargetResourceDenyPolicyArn\": [\"${POLICY_ARN}\" ],
      \"TargetApplicationRoleName\": [ \"${ROLE_NAME}\" ]
    }"

Wait two minutes and then examine the content of the S3 bucket starting with fis-api-failure again. You should now see two additional files in the bucket, showing that the policy was attached for 2 minutes during which files could not be deleted, and confirming that our application is not resilient to S3 API degradation.

Permissions for injecting failures with SSM

Fault injection with SSM is controlled by IAM, which is why you had to specify the FISAPI-SSM-Automation-Role:

Visual representation of IAM permission used for fault injections with SSM. It shows the SSM execution role permitting access to use SSM automation documents as well as modify IAM roles and policies via the SSM document. It also shows the SSM user needing to have a pass-role permission to grant the SSM execution role to the SSM service.

Figure 6. Visual representation of IAM permission used for fault injections with SSM.

This role needs to contain an assume role policy statement for SSM to allow assuming the role:

      AssumeRolePolicyDocument:
        Statement:
          - Action:
             - 'sts:AssumeRole'
            Effect: Allow
            Principal:
              Service:
                - "ssm.amazonaws.com"

The role also needs to contain permissions to describe roles and their attached policies with an optional constraint on which roles and policies are visible:

          - Sid: GetRoleAndPolicyDetails
            Effect: Allow
            Action:
              - 'iam:GetRole'
              - 'iam:GetPolicy'
              - 'iam:ListAttachedRolePolicies'
            Resource:
              # Roles
              - !GetAtt EventBridgeTimerHandlerRole.Arn
              - !GetAtt S3TriggerHandlerRole.Arn
              # Policies
              - !Ref AwsFisApiPolicyDenyS3DeleteObject

Finally the SSM role needs to allow attaching and detaching a policy document. This requires

  1. an ALLOW statement
  2. a constraint on the policies that can be attached
  3. a constraint on the roles that can be attached to

In the role we collapse the first two requirements into an ALLOW statement with a condition constraint for the Policy ARN. We then express the third requirement in a DENY statement that will limit the '*' resource to only the explicit role ARNs we want to modify:

          - Sid: AllowOnlyTargetResourcePolicies
            Effect: Allow
            Action:  
              - 'iam:DetachRolePolicy'
              - 'iam:AttachRolePolicy'
            Resource: '*'
            Condition:
              ArnEquals:
                'iam:PolicyARN':
                  # Policies that can be attached
                  - !Ref AwsFisApiPolicyDenyS3DeleteObject
          - Sid: DenyAttachDetachAllRolesExceptApplicationRole
            Effect: Deny
            Action: 
              - 'iam:DetachRolePolicy'
              - 'iam:AttachRolePolicy'
            NotResource: 
              # Roles that can be attached to
              - !GetAtt EventBridgeTimerHandlerRole.Arn
              - !GetAtt S3TriggerHandlerRole.Arn

We will discuss security considerations in more detail at the end of this post.

Fault injection using FIS

With the SSM document in place you can now create an FIS template that calls the SSM document. Navigate to the FIS console and filter for FISAPI-DENY-S3PutObject. You should see that the experiment template passes the same parameters that you previously used with SSM:

Image of FIS experiment template action summary. This shows the SSM document ARN to be used for fault injection and the JSON parameters passed to the SSM document specifying the IAM Role to modify and the IAM Policy to use.

Figure 7. Image of FIS experiment template action summary. This shows the SSM document ARN to be used for fault injection and the JSON parameters passed to the SSM document specifying the IAM Role to modify and the IAM Policy to use.

You can now run the FIS experiment and after a couple minutes once again see new files in the S3 bucket.

Permissions for injecting failures with FIS and SSM

Fault injection with FIS is controlled by IAM, which is why you had to specify the FISAPI-FIS-Injection-EperimentRole:

Visual representation of IAM permission used for fault injections with FIS and SSM. It shows the SSM execution role permitting access to use SSM automation documents as well as modify IAM roles and policies via the SSM document. It also shows the FIS execution role permitting access to use FIS templates, as well as the pass-role permission to grant the SSM execution role to the SSM service. Finally it shows the FIS user needing to have a pass-role permission to grant the FIS execution role to the FIS service.

Figure 8. Visual representation of IAM permission used for fault injections with FIS and SSM. It shows the SSM execution role permitting access to use SSM automation documents as well as modify IAM roles and policies via the SSM document. It also shows the FIS execution role permitting access to use FIS templates, as well as the pass-role permission to grant the SSM execution role to the SSM service. Finally it shows the FIS user needing to have a pass-role permission to grant the FIS execution role to the FIS service.

This role needs to contain an assume role policy statement for FIS to allow assuming the role:

      AssumeRolePolicyDocument:
        Statement:
          - Action:
              - 'sts:AssumeRole'
            Effect: Allow
            Principal:
              Service:
                - "fis.amazonaws.com"

The role also needs permissions to list and execute SSM documents:

            - Sid: RequiredReadActionsforAWSFIS
              Effect: Allow
              Action:
                - 'cloudwatch:DescribeAlarms'
                - 'ssm:GetAutomationExecution'
                - 'ssm:ListCommands'
                - 'iam:ListRoles'
              Resource: '*'
            - Sid: RequiredSSMStopActionforAWSFIS
              Effect: Allow
              Action:
                - 'ssm:CancelCommand'
              Resource: '*'
            - Sid: RequiredSSMWriteActionsforAWSFIS
              Effect: Allow
              Action:
                - 'ssm:StartAutomationExecution'
                - 'ssm:StopAutomationExecution'
              Resource: 
                - !Sub 'arn:aws:ssm:${AWS::Region}:${AWS::AccountId}:automation-definition/${SsmAutomationIamAttachDetachDocument}:$DEFAULT'

Finally, remember that the SSM document needs to use a Role of its own to execute the fault injection actions. Because that Role is different from the Role under which we started the FIS experiment, we need to explicitly allow SSM to assume that role with a PassRole statement which will expand to FISAPI-SSM-Automation-Role:

            - Sid: RequiredIAMPassRoleforSSMADocuments
              Effect: Allow
              Action: 'iam:PassRole'
              Resource: !Sub 'arn:aws:iam::${AWS::AccountId}:role/${SsmAutomationRole}'

Secure and flexible permissions

So far, we have used explicit ARNs for our guardrails. To expand flexibility, we can use wildcards in our resource matching. For example, we might change the Policy matching from:

            Condition:
              ArnEquals:
                'iam:PolicyARN':
                  # Explicitly listed policies - secure but inflexible
                  - !Ref AwsFisApiPolicyDenyS3DeleteObject

or the equivalent:

            Condition:
              ArnEquals:
                'iam:PolicyARN':
                  # Explicitly listed policies - secure but inflexible
                  - !Sub 'arn:${AWS::Partition}:iam::${AWS::AccountId}:policy/${FullPolicyName}

to a wildcard notation like this:

            Condition:
              ArnEquals:
                'iam:PolicyARN':
                  # Wildcard policies - secure and flexible
                  - !Sub 'arn:${AWS::Partition}:iam::${AWS::AccountId}:policy/${PolicyNamePrefix}*'

If we set PolicyNamePrefix to FISAPI-DenyS3 this would now allow invoking FISAPI-DenyS3PutObject and FISAPI-DenyS3DeleteObject but would not allow using a policy named FISAPI-DenyEc2DescribeInstances.

Similarly, we could change the Resource matching from:

            NotResource: 
              # Explicitly listed roles - secure but inflexible
              - !GetAtt EventBridgeTimerHandlerRole.Arn
              - !GetAtt S3TriggerHandlerRole.Arn

to a wildcard equivalent like this:

            NotResource: 
              # Wildcard policies - secure and flexible
              - !Sub 'arn:${AWS::Partition}:iam::${AWS::AccountId}:role/${RoleNamePrefixEventBridge}*'
              - !Sub 'arn:${AWS::Partition}:iam::${AWS::AccountId}:role/${RoleNamePrefixS3}*'
and setting RoleNamePrefixEventBridge to FISAPI-TARGET-EventBridge and RoleNamePrefixS3 to FISAPI-TARGET-S3.

Finally, we would also change the FIS experiment role to allow SSM documents based on a name prefix by changing the constraint on automation execution from:

            - Sid: RequiredSSMWriteActionsforAWSFIS
              Effect: Allow
              Action:
                - 'ssm:StartAutomationExecution'
                - 'ssm:StopAutomationExecution'
              Resource: 
                # Explicitly listed resource - secure but inflexible
                # Note: the $DEFAULT at the end could also be an explicit version number
                # Note: the 'automation-definition' is automatically created from 'document' on invocation
                - !Sub 'arn:aws:ssm:${AWS::Region}:${AWS::AccountId}:automation-definition/${SsmAutomationIamAttachDetachDocument}:$DEFAULT'

to

            - Sid: RequiredSSMWriteActionsforAWSFIS
              Effect: Allow
              Action:
                - 'ssm:StartAutomationExecution'
                - 'ssm:StopAutomationExecution'
              Resource: 
                # Wildcard resources - secure and flexible
                # 
                # Note: the 'automation-definition' is automatically created from 'document' on invocation
                - !Sub 'arn:aws:ssm:${AWS::Region}:${AWS::AccountId}:automation-definition/${SsmAutomationDocumentPrefix}*'

and setting SsmAutomationDocumentPrefix to FISAPI-. Test this by updating the CloudFormation stack with a modified template:

aws cloudformation deploy --stack-name test-fis-api-faults --template-file template2.yaml --capabilities CAPABILITY_NAMED_IAM

Permissions governing users

In production you should not be using administrator access to use FIS. Instead we create two roles FISAPI-AssumableRoleWithCreation and FISAPI-AssumableRoleWithoutCreation for you (see this template). These roles require all FIS and SSM resources to have a Name tag that starts with FISAPI-. Try assuming the role without creation privileges and running an experiment. You will notice that you can only start an experiment if you add a Name tag, e.g. FISAPI-secure-1, and you will only be able to get details of experiments and templates that have proper Name tags.

If you are working with AWS Organizations, you can add further guard rails by defining SCPs that control the use of the FISAPI-* tags similar to this blog post.

Caveats

For this solution we are choosing to attach policies instead of permission boundaries. The benefit of this is that you can attach multiple independent policies and thus simulate multi-step service degradation. However, this means that it is possible to increase the permission level of a role. While there are situations where this might be of interest, e.g. to simulate security breaches, please implement a thorough security review of any fault injection IAM policies you create. Note that modifying IAM Roles may trigger events in your security monitoring tools.

The AttachRolePolicy and DetachRolePolicy calls from AWS IAM are eventually consistent, meaning that in some cases permission propagation when starting and stopping fault injection may take up to 5 minutes each.

Cleanup

To avoid additional cost, delete the content of the S3 bucket and delete the CloudFormation stack:

# Clean up policy attachments just in case
CLEANUP_ROLES=$(aws iam list-roles --query "Roles[?starts_with(RoleName,'FISAPI-')].RoleName" --output text)
for role in $CLEANUP_ROLES; do
  CLEANUP_POLICIES=$(aws iam list-attached-role-policies --role-name $role --query "AttachedPolicies[?starts_with(PolicyName,'FISAPI-')].PolicyName" --output text)
  for policy in $CLEANUP_POLICIES; do
    echo Detaching policy $policy from role $role
    aws iam detach-role-policy --role-name $role --policy-arn $policy
  done
done
# Delete S3 bucket content
ACCOUNT_ID=$( aws sts get-caller-identity --query Account --output text )
S3_BUCKET_NAME=fis-api-failure-${ACCOUNT_ID}
aws s3 rm --recursive s3://${S3_BUCKET_NAME}
aws s3 rb s3://${S3_BUCKET_NAME}
# Delete cloudformation stack
aws cloudformation delete-stack --stack-name test-fis-api-faults
aws cloudformation wait stack-delete-complete --stack-name test-fis-api-faults

Conclusion 

AWS Fault Injection Simulator provides the ability to simulate various external impacts to your application to validate and improve resilience. We’ve shown how combining FIS with IAM to selectively deny access to AWS APIs provides a generic path to explore fault boundaries across all AWS services. We’ve shown how this can be used to identify and improve a resilience problem in a common S3 upload workflow. To learn about more ways to use FIS, see this workshop.

About the authors:

Dr. Rudolf Potucek

Dr. Rudolf Potucek is Startup Solutions Architect at Amazon Web Services. Over the past 30 years he gained a PhD and worked in different roles including leading teams in academia and industry, as well as consulting. He brings experience from working with academia, startups, and large enterprises to his current role of guiding startup customers to succeed in the cloud.

Rudolph Wagner

Rudolph Wagner is a Premium Support Engineer at Amazon Web Services who holds the CISSP and OSCP security certifications, in addition to being a certified AWS Solutions Architect Professional. He assists internal and external Customers with multiple AWS services by using his diverse background in SAP, IT, and construction.

Improve collaboration between teams by using AWS CDK constructs

Post Syndicated from Joerg Woehrle original https://aws.amazon.com/blogs/devops/improve-collaboration-between-teams-by-using-aws-cdk-constructs/

There are different ways to organize teams to deliver great software products. There are companies that give the end-to-end responsibility for a product to a single team, like Amazon’s Two-Pizza teams, and there are companies where multiple teams split the responsibility between infrastructure (or platform) teams and application development teams. This post provides guidance on how collaboration efficiency can be improved in the case of a split-team approach with the help of the AWS Cloud Development Kit (CDK).

The AWS CDK is an open-source software development framework to define your cloud application resources. You do this by using familiar programming languages like TypeScript, Python, Java, C# or Go. It allows you to mix code to define your application’s infrastructure, traditionally expressed through infrastructure as code tools like AWS CloudFormation or HashiCorp Terraform, with code to bundle, compile, and package your application.

This is great for autonomous teams with end-to-end responsibility, as it helps them to keep all code related to that product in a single place and single programming language. There is no need to separate application code into a different repository than infrastructure code with a single team, but what about the split-team model?

Larger enterprises commonly split the responsibility between infrastructure (or platform) teams and application development teams. We’ll see how to use the AWS CDK to ensure team independence and agility even with multiple teams involved. We’ll have a look at the different responsibilities of the participating teams and their produced artifacts, and we’ll also discuss how to make the teams work together in a frictionless way.

This blog post assumes a basic level of knowledge on the AWS CDK and its concepts. Additionally, a very high level understanding of event driven architectures is required.

Team Topologies

Let’s first have a quick look at the different team topologies and each team’s responsibilities.

One-Team Approach

In this blog post we will focus on the split-team approach described below. However, it’s still helpful to understand what we mean by “One-Team” Approach: A single team owns an application from end-to-end. This cross-functional team decides on its own on the features to implement next, which technologies to use and how to build and deploy the resulting infrastructure and application code. The team’s responsibility is infrastructure, application code, its deployment and operations of the developed service.

If you’re interested in how to structure your AWS CDK application in a such an environment have a look at our colleague Alex Pulver’s blog post Recommended AWS CDK project structure for Python applications.

Split-Team Approach

In reality we see many customers who have separate teams for application development and infrastructure development and deployment.

Infrastructure Team

What I call the infrastructure team is also known as the platform or operations team. It configures, deploys, and operates the shared infrastructure which other teams consume to run their applications on. This can be things like an Amazon SQS queue, an Amazon Elastic Container Service (Amazon ECS) cluster as well as the CI/CD pipelines used to bring new versions of the applications into production.
It is the infrastructure team’s responsibility to get the application package developed by the Application Team deployed and running on AWS, as well as provide operational support for the application.

Application Team

Traditionally the application team just provides the application’s package (for example, a JAR file or an npm package) and it’s the infrastructure team’s responsibility to figure out how to deploy, configure, and run it on AWS. However, this traditional setup often leads to bottlenecks, as the infrastructure team will have to support many different applications developed by multiple teams. Additionally, the infrastructure team often has little knowledge of the internals of those applications. This often leads to solutions which are not optimized for the problem at hand: If the infrastructure team only offers a handful of options to run services on, the application team can’t use options optimized for their workload.

This is why we extend the traditional responsibilities of the application team in this blog post. The team provides the application and additionally the description of the infrastructure required to run the application. With “infrastructure required” we mean the AWS services used to run the application. This infrastructure description needs to be written in a format which can be consumed by the infrastructure team.

While we understand that this shift of responsibility adds additional tasks to the application team, we think that in the long term it is worth the effort. This can be the starting point to introduce DevOps concepts into the organization. However, the concepts described in this blog post are still valid even if you decide that you don’t want to add this responsibility to your application teams. The boundary of who is delivering what would then just move more into the direction of the infrastructure team.

To be successful with the given approach, the two teams need to agree on a common format on how to hand over the application, its infrastructure definition, and how to bring it to production. The AWS CDK with its concept of Constructs provides a perfect means for that.

Primer: AWS CDK Constructs

In this section we take a look at the concepts the AWS CDK provides for structuring our code base and how these concepts can be used to fit a CDK project into your team topology.

Constructs

Constructs are the basic building block of an AWS CDK application. An AWS CDK application is composed of multiple constructs which in the end define how and what is deployed by AWS CloudFormation.

The AWS CDK ships with constructs created to deploy AWS services. However, it is important to understand that you are not limited to the out-of-the-box constructs provided by the AWS CDK. The true power of AWS CDK is the possibility to create your own abstractions on top of the default constructs to create solutions for your specific requirement. To achieve this you write, publish, and consume your own, custom constructs. They codify your specific requirements, create an additional level of abstraction and allow other teams to consume and use your construct.

We will use a custom construct to separate the responsibilities between the the application and the infrastructure team. The application team will release a construct which describes the infrastructure along with its configuration required to run the application code. The infrastructure team will consume this construct to deploy and operate the workload on AWS.

How to use the AWS CDK in a Split-Team Setup

Let’s now have a look at how we can use the AWS CDK to split the responsibilities between the application and infrastructure team. I’ll introduce a sample scenario and then illustrate what each team’s responsibility is within this scenario.

Scenario

Our fictitious application development team writes an AWS Lambda function which gets deployed to AWS. Messages in an Amazon SQS queue will invoke the function. Let’s say the function will process orders (whatever this means in detail is irrelevant for the example) and each order is represented by a message in the queue.

The application development team has full flexibility when it comes to creating the AWS Lambda function. They can decide which runtime to use or how much memory to configure. The SQS queue which the function will act upon is created by the infrastructure team. The application team does not have to know how the messages end up in the queue.

With that we can have a look at a sample implementation split between the teams.

Application Team

The application team is responsible for two distinct artifacts: the application code (for example, a Java jar file or an npm module) and the AWS CDK construct used to deploy the required infrastructure on AWS to run the application (an AWS Lambda Function along with its configuration).

The lifecycles of these artifacts differ: the application code changes more frequently than the infrastructure it runs in. That’s why we want to keep the artifacts separate. With that each of the artifacts can be released at its own pace and only if it was changed.

In order to achieve these separate lifecycles, it is important to notice that a release of the application artifact needs to be completely independent from the release of the CDK construct. This fits our approach of separate teams compared to the standard CDK way of building and packaging application code within the CDK construct.

But how will this be done in our example solution? The team will build and publish an application artifact which does not contain anything related to CDK.
When a CDK Stack with this construct is synthesized it will download the pre-built artifact with a given version number from AWS CodeArtifact and use it to create the input zip file for a Lambda function. There is no build of the application package happening during the CDK synth.

With the separation of construct and application code, we need to find a way to tell the CDK construct which specific version of the application code it should fetch from CodeArtifact. We will pass this information to the construct via a property of its constructor.

For dependencies on infrastructure outside of the responsibility of the application team, I follow the pattern of dependency injection. Those dependencies, for example a shared VPC or an Amazon SQS queue, are passed into the construct from the infrastructure team.

Let’s have a look at an example. We pass in the external dependency on an SQS Queue, along with details on the desired appPackageVersion and its CodeArtifact details:

export interface OrderProcessingAppConstructProps {
    queue: aws_sqs.Queue,
    appPackageVersion: string,
    codeArtifactDetails: {
        account: string,
        repository: string,
        domain: string
    }
}

export class OrderProcessingAppConstruct extends Construct {

    constructor(scope: Construct, id: string, props: OrderProcessingAppConstructProps) {
        super(scope, id);

        const lambdaFunction = new lambda.Function(this, 'OrderProcessingLambda', {
            code: lambda.Code.fromDockerBuild(path.join(__dirname, '..', 'bundling'), {
                buildArgs: {
                    'PACKAGE_VERSION' : props.appPackageVersion,
                    'CODE_ARTIFACT_ACCOUNT' : props.codeArtifactDetails.account,
                    'CODE_ARTIFACT_REPOSITORY' : props.codeArtifactDetails.repository,
                    'CODE_ARTIFACT_DOMAIN' : props.codeArtifactDetails.domain
                }
            }),
            runtime: lambda.Runtime.NODEJS_16_X,
            handler: 'node_modules/order-processing-app/dist/index.lambdaHandler'
        });
        const eventSource = new SqsEventSource(props.queue);
        lambdaFunction.addEventSource(eventSource);
    }
}

Note the code lambda.Code.fromDockerBuild(...): We use AWS CDK’s functionality to bundle the code of our Lambda function via a Docker build. The only things which happen inside of the provided Dockerfile are:

  • the login into the AWS CodeArtifact repository which holds the pre-built application code’s package
  • the download and installation of the application code’s artifact from AWS CodeArtifact (in this case via npm)

If you are interested in more details on how you can build, bundle and deploy your AWS CDK assets I highly recommend a blog post by my colleague Cory Hall: Building, bundling, and deploying applications with the AWS CDK. It goes into much more detail than what we are covering here.

Looking at the example Dockerfile we can see the two steps described above:

FROM public.ecr.aws/sam/build-nodejs16.x:latest

ARG PACKAGE_VERSION
ARG CODE_ARTIFACT_AWS_REGION
ARG CODE_ARTIFACT_ACCOUNT
ARG CODE_ARTIFACT_REPOSITORY

RUN aws codeartifact login --tool npm --repository $CODE_ARTIFACT_REPOSITORY --domain $CODE_ARTIFACT_DOMAIN --domain-owner $CODE_ARTIFACT_ACCOUNT --region $CODE_ARTIFACT_AWS_REGION
RUN npm install order-processing-app@$PACKAGE_VERSION --prefix /asset

Please note the following:

  • we use --prefix /asset with our npm install command. This tells npm to install the dependencies into the folder which CDK will mount into the container. All files which should go into the output of the docker build need to be placed here.
  • the aws codeartifact login command requires credentials with the appropriate permissions to proceed. In case you run this on for example AWS CodeBuild or inside of a CDK Pipeline you need to make sure that the used role has the appropriate policies attached.

Infrastructure Team

The infrastructure team consumes the AWS CDK construct published by the application team. They own the AWS CDK Stack which composes the whole application. Possibly this will only be one of several Stacks owned by the Infrastructure team. Other Stacks might create shared infrastructure (like VPCs, networking) and other applications.

Within the stack for our application the infrastructure team consumes and instantiates the application team’s construct, passes any dependencies into it and then deploys the stack by whatever means they see fit (e.g. through AWS CodePipeline, GitHub Actions or any other form of continuous delivery/deployment).

The dependency on the application team’s construct is manifested in the package.json of the infrastructure team’s CDK app:

{
  "name": "order-processing-infra-app",
  ...
  "dependencies": {
    ...
    "order-app-construct" : "1.1.0",
    ...
  }
  ...
}

Within the created CDK Stack we see the dependency version for the application package as well as how the infrastructure team passes in additional information (like e.g. the queue to use):

export class OrderProcessingInfraStack extends cdk.Stack {
  constructor(scope: Construct, id: string, props?: cdk.StackProps) {
    super(scope, id, props);   

    const orderProcessingQueue = new Queue(this, 'order-processing-queue');

    new OrderProcessingAppConstruct(this, 'order-processing-app', {
       appPackageVersion: "2.0.36",
       queue: orderProcessingQueue,
       codeArtifactDetails: { ... }
     });
  }
}

Propagating New Releases

We now have the responsibilities of each team sorted out along with the artifacts owned by each team. But how do we propagate a change done by the application team all the way to production? Or asked differently: how can we invoke the infrastructure team’s CI/CD pipeline with the updated artifact versions of the application team?

We will need to update the infrastructure team’s dependencies on the application teams artifacts whenever a new version of either the application package or the AWS CDK construct is published. With the dependencies updated we can then start the release pipeline.

One approach is to listen and react to events published by AWS CodeArtifact via Amazon EventBridge. On each release AWS CodeArtifact will publish an event to Amazon EventBridge. We can listen to that event, extract the version number of the new release from its payload and start a workflow to update either our dependency on the CDK construct (e.g. in the package.json of our CDK application) or a update the appPackageVersion which the infrastructure team passes into the consumed construct.

Here’s how a release of a new app version flows through the system:

A release of the application package triggers a change and deployment of the infrastructure team's CDK Stack

Figure 1 – A release of the application package triggers a change and deployment of the infrastructure team’s CDK Stack

  1. The application team publishes a new app version into AWS CodeArtifact
  2. CodeArtifact triggers an event on Amazon EventBridge
  3. The infrastructure team listens to this event
  4. The infrastructure team updates its CDK stack to include the latest appPackageVersion
  5. The infrastructure team’s CDK Stack gets deployed

And very similar the release of a new version of the CDK Construct:

A release of the application team's CDK construct triggers a change and deployment of the infrastructure team's CDK Stack

Figure 2 – A release of the application team’s CDK construct triggers a change and deployment of the infrastructure team’s CDK Stack

  1. The application team publishes a new CDK construct version into AWS CodeArtifact
  2. CodeArtifact triggers an event on Amazon EventBridge
  3. The infrastructure team listens to this event
  4. The infrastructure team updates its dependency to the latest CDK construct
  5. The infrastructure team’s CDK Stack gets deployed

We will not go into the details on how such a workflow could look like, because it’s most likely highly custom for each team (think of different tools used for code repositories, CI/CD). However, here are some ideas on how it can be accomplished:

Updating the CDK Construct dependency

To update the dependency version of the CDK construct the infrastructure team’s package.json (or other files used for dependency tracking like pom.xml) needs to be updated. You can build automation to checkout the source code and issue a command like npm install sample-app-construct@NEW_VERSION (where NEW_VERSION is the value read from the EventBridge event payload). You then automatically create a pull request to incorporate this change into your main branch. For a sample on what this looks like see the blog post Keeping up with your dependencies: building a feedback loop for shared librares.

Updating the appPackageVersion

To update the appPackageVersion used inside of the infrastructure team’s CDK Stack you can either follow the same approach outlined above, or you can use CDK’s capability to read from an AWS Systems Manager (SSM) Parameter Store parameter. With that you wouldn’t put the value for appPackageVersion into source control, but rather read it from SSM Parameter Store. There is a how-to for this in the AWS CDK documentation: Get a value from the Systems Manager Parameter Store. You then start the infrastructure team’s pipeline based on the event of a change in the parameter.

To have a clear understanding of what is deployed at any given time and in order to see the used parameter value in CloudFormation I’d recommend using the option described at Reading Systems Manager values at synthesis time.

Conclusion

You’ve seen how the AWS Cloud Development Kit and its Construct concept can help to ensure team independence and agility even though multiple teams (in our case an application development team and an infrastructure team) work together to bring a new version of an application into production. To do so you have put the application team in charge of not only their application code, but also of the parts of the infrastructure they use to run their application on. This is still in line with the discussed split-team approach as all shared infrastructure as well as the final deployment is in control of the infrastructure team and is only consumed by the application team’s construct.

About the Authors

Picture of the author Joerg Woehrle As a Solutions Architect Jörg works with manufacturing customers in Germany. Before he joined AWS in 2019 he held various roles like Developer, DevOps Engineer and SRE. With that Jörg enjoys building and automating things and fell in love with the AWS Cloud Development Kit.
Picture of the author Mohamed Othman Mo joined AWS in 2020 as a Technical Account Manager, bringing with him 7 years of hands-on AWS DevOps experience and 6 year as System operation admin. He is a member of two Technical Field Communities in AWS (Cloud Operation and Builder Experience), focusing on supporting customers with CI/CD pipelines and AI for DevOps to ensure they have the right solutions that fit their business needs.

How to use granular geographic match rules with AWS WAF

Post Syndicated from Mohit Mysore original https://aws.amazon.com/blogs/security/how-to-use-granular-geographic-match-rules-with-aws-waf/

In November 2022, AWS introduced support for granular geographic (geo) match conditions in AWS WAF. This blog post demonstrates how you can use this new feature to customize your AWS WAF implementation and improve the security posture of your protected application.

AWS WAF provides inline inspection of inbound traffic at the application layer. You can use AWS WAF to detect and filter common web exploits and bots that could affect application availability or security, or consume excessive resources. Inbound traffic is inspected against web access control list (web ACL) rules. A web ACL rule consists of rule statements that instruct AWS WAF on how to inspect a web request.

The AWS WAF geographic match rule statement functionality allows you to restrict application access based on the location of your viewers. This feature is crucial for use cases like licensing and legal regulations that limit the delivery of your applications outside of specific geographic areas.

AWS recently released a new feature that you can use to build precise geographic rules based on International Organization for Standardization (ISO) 3166 country and area codes. With this release, you can now manage access at the ISO 3166 region level. This capability is available across AWS Regions where AWS WAF is offered and for all AWS WAF supported services. In this post, you will learn how to use this new feature with Amazon CloudFront and Elastic Load Balancing (ELB) origin types.

Summary of concepts

Before we discuss use cases and setup instructions, make sure that you are familiar with the following AWS services and concepts:

  • Amazon CloudFront: CloudFront is a web service that gives businesses and web application developers a cost-effective way to distribute content with low latency and high data transfer speeds.
  • Amazon Simple Storage Service (Amazon S3): Amazon S3 is an object storage service built to store and retrieve large amounts of data from anywhere.
  • Application Load Balancer: Application Load Balancer operates at the request level (layer 7), routing traffic to targets—Amazon Elastic Compute Cloud (Amazon EC2) instances, IP addresses, and Lambda functions—based on the content of the request.
  • AWS WAF labels: Labels contain metadata that can be added to web requests when a rule is matched. Labels can alter the behavior or default action of managed rules.
  • ISO (International Organization for Standardization) 3166 codes: ISO codes are internationally recognized codes that designate for every country and most of the dependent areas a two- or three-letter combination. Each code consists of two parts, separated by a hyphen. For example, in the code AU-QLD, AU is the ISO 3166 alpha-2 code for Australia, and QLD is the subdivision code of the state or territory—in this case, Queensland.

How granular geo labels work

Previously, geo match statements in AWS WAF were used to allow or block access to applications based on country of origin of web requests. With updated geographic match rule statements, you can control access at the region level.

In a web ACL rule with a geo match statement, AWS WAF determines the country and region of a request based on its IP address. After inspection, AWS WAF adds labels to each request to indicate the ISO 3166 country and region codes. You can use labels generated in the geo match statement to create a label match rule statement to control access.

AWS WAF generates two types of labels based on origin IP or a forwarded IP configuration that is defined in the AWS WAF geo match rule. These labels are the country and region labels.

By default, AWS WAF uses the IP address of the web request’s origin. You can instruct AWS WAF to use an IP address from an alternate request header, like X-Forwarded-For, by enabling forwarded IP configuration in the rule statement settings. For example, the country label for the United States with origin IP and forwarded IP configuration are awswaf:clientip:geo:country:US and awswaf:forwardedip:geo:country:US, respectively. Similarly, the region labels for a request originating in Oregon (US) with origin and forwarded IP configuration are awswaf:clientip:geo:region:US-OR and awswaf:forwardedip:geo:region:US-OR, respectively.

To demonstrate this AWS WAF feature, we will outline two distinct use cases.

Use case 1: Restrict content for copyright compliance using AWS WAF and CloudFront

Licensing agreements might prevent you from distributing content in some geographical locations, regions, states, or entire countries. You can deploy the following setup to geo-block content in specific regions to help meet these requirements.

In this example, we will use an AWS WAF web ACL that is applied to a CloudFront distribution with an S3 bucket origin. The web ACL contains a geo match rule to tag requests from Australia with labels, followed by a label match rule to block requests from the Queensland region. All other requests with source IP originating from Australia are allowed.

To configure the AWS WAF web ACL rule for granular geo restriction

  1. Follow the steps to create an Amazon S3 bucket and CloudFront distribution with the S3 bucket as origin.
  2. After the CloudFront distribution is created, open the AWS WAF console.
  3. In the navigation pane, choose Web ACLs, select Global (CloudFront) from the dropdown list, and then choose Create web ACL.
  4. For Name, enter a name to identify this web ACL.
  5. For Resource type, choose the CloudFront distribution that you created in step 1, and then choose Add.
  6. Choose Next.
  7. Choose Add rules, and then choose Add my own rules and rule groups.
  8. For Name, enter a name to identify this rule.
  9. For Rule type, choose Regular rule.
  10. Configure a rule statement for a request that matches the statement Originates from a Country and select the Australia (AU) country code from the dropdown list.
  11. Set the IP inspection configuration parameter to Source IP address.
  12. Under Action, choose Count, and then choose Add Rule.
  13. Create a new rule by following the same actions as in step 7 and enter a name to identify the rule.
  14. For Rule type, choose Regular rule.
  15. Configure a rule statement for a request that matches the statement Has a Label and enter awswaf:clientip:geo:region:AU-QLD for the match key.
  16. Set the action to Block and choose Add rule.
  17. For Actions, keep the default action of Allow.
  18. For Amazon CloudWatch metrics, select the AWS WAF rules that you created in steps 8 and 14.
  19. For Request sampling options, choose Enable sampled requests, and then choose Next.
  20. Review and create the web ACL rule.

After the web ACL is created, you should see the web ACL configuration, as shown in the following figures. Figure 1 shows the geo match rule configuration.

Figure 1: Web ACL rule configuration

Figure 1: Web ACL rule configuration

Figure 2 shows the Queensland regional geo restriction.

Figure 2: Queensland regional geo restriction - web ACL configuration<

Figure 2: Queensland regional geo restriction – web ACL configuration<

The setup is now complete—you have a web ACL with two regular rules. The first rule matches requests that originate from Australia and adds geographic labels automatically. The label match rule statement inspects requests with Queensland granular geo labels and blocks them. To understand where requests are originating from, you can configure logging on the AWS WAF web ACL.

You can test this setup by making requests from Queensland, Australia, to the DNS name of the CloudFront distribution to invoke a block. CloudFront will return a 403 error, similar to the following example.

$ curl -IL https://abcdd123456789.cloudfront.net
HTTP/2 403 
server: CloudFront
date: Tue, 21 Feb 2023 22:06:25 GMT
content-type: text/html
content-length: 919
x-cache: Error from cloudfront
via: 1.1 abcdd123456789.cloudfront.net (CloudFront)
x-amz-cf-pop: SYD1-C1

As shown in these test results, requests originating from Queensland, Australia, are blocked.

Use case 2: Allow incoming traffic from specific regions with AWS WAF and Application Load Balancer

We recently had a customer ask us how to allow traffic from only one region, and deny the traffic from other regions within a country. You might have similar requirements, and the following section will explain how to achieve that. In the example, we will show you how to allow only visitors from Washington state, while disabling traffic from the rest of the US.

This example uses an AWS WAF web ACL applied to an application load balancer in the US East (N. Virginia) Region with an Amazon EC2 instance as the target. The web ACL contains a geo match rule to tag requests from the US with labels. After we enable forwarded IP configuration, we will inspect the X-Forwarded-For header to determine the origin IP of web requests. Next, we will add a label match rule to allow requests from the Washington region. All other requests from the United States are blocked.

To configure the AWS WAF web ACL rule for granular geo restriction

  1. Follow the steps to create an internet-facing application load balancer in the US East (N. Virginia) Region.
  2. After the application load balancer is created, open the AWS WAF console.
  3. In the navigation pane, choose Web ACLs, and then choose Create web ACL in the US east (N. Virginia) Region.
  4. For Name, enter a name to identify this web ACL.
  5. For Resource type, choose the application load balancer that you created in step 1 of this section, and then choose Add.
  6. Choose Next.
  7. Choose Add rules, and then choose Add my own rules and rule groups.
  8. For Name, enter a name to identify this rule.
  9. For Rule type, choose Regular rule.
  10. Configure a rule statement for a request that matches the statement Originates from a Country in, and then select the United States (US) country code from the dropdown list.
  11. Set the IP inspection configuration parameter to IP address in Header.
  12. Enter the Header field name as X-Forwarded-For.
  13. For Match, choose Fallback for missing IP address. Web requests without a valid IP address in the header will be treated as a match and will be allowed.
  14. Under Action, choose Count, and then choose Add Rule.
  15. Create a new rule by following the same actions as in step 7 of this section, and enter a name to identify the rule.
  16. For Rule type, choose Regular rule.
  17. Configure a rule statement for a request that matches the statement Has a Label, and for the match key, enter awswaf:forwardedip:geo:region:US-WA.
  18. Set the action to Allow and add choose Add Rule.
  19. For Default web ACL action for requests that don’t match any rules, set the Action to Block.
  20. For Amazon CloudWatch metrics, select the AWS WAF rules that you created in steps 8 and 14 of this section.
  21. For Request sampling options, choose Enable sampled requests, and then choose Next.
  22. Review and create the web ACL rule.

After the web ACL is created, you should see the web ACL configuration, as shown in the following figures. Figure 3 shows the geo match rule

Figure 3: Geo match rule

Figure 3: Geo match rule

Figure 4 shows the Washington regional geo restriction.

Figure 4: Washington regional geo restriction - web ACL configuration

Figure 4: Washington regional geo restriction – web ACL configuration

The following is a JSON representation of the rule:

{
  "Name": "WashingtonRegionAllow",
  "Priority": 1,
  "Statement": {
    "LabelMatchStatement": {
      "Scope": "LABEL",
      "Key": "awswaf:forwardedip:geo:region:US-WA"
    }
  },
  "Action": {
    "Allow": {}
  },
  "VisibilityConfig": {
    "SampledRequestsEnabled": true,
    "CloudWatchMetricsEnabled": true,
    "MetricName": "USRegionalRestriction"
  }
}

The setup is now complete—you have a web ACL with two regular rules. The first rule matches requests that originate from the US after inspecting the origin IP in the X-Forwarded-For header, and adds geographic labels. The label match rule statement inspects requests with the Washington region granular geo labels and allows these requests.

If a user makes a web request from outside of the Washington region, the request will be blocked and a HTTP 403 error response will be returned, similar to the following.

curl -IL https://GeoBlock-1234567890.us-east-1.elb.amazonaws.com
HTTP/1.1 403 Forbidden
Server: awselb/2.0
Date: Tue, 21 Feb 2023 22:07:54 GMT
Content-Type: text/html
Content-Length: 118
Connection: keep-alive

Conclusion

AWS WAF now supports the ability to restrict traffic based on granular geographic labels. This gives you further control based on geographic location within a country.

In this post, we demonstrated two different use cases that show how this feature can be applied with CloudFront distributions and application load balancers. Note that, apart from CloudFront and application load balancers, this feature is supported by other origin types that are supported by AWS WAF, such as Amazon API Gateway and Amazon Cognito.

If you have feedback about this post, submit comments in the Comments section below. If you have questions about this post, start a new thread on the AWS WAF re:Post or contact AWS Support.

Want more AWS Security news? Follow us on Twitter.

Mohit Mysore

Mohit Mysore

Mohit is a Technical Account Manager with over 5 years of experience working with AWS Customers. He is passionate about network and system administration. Outside work, He likes to travel, watch soccer and F1 and spend time with his family.

Maintaining Code Quality with Amazon CodeCatalyst Reports

Post Syndicated from Imtranur Rahman original https://aws.amazon.com/blogs/devops/maintaining-code-quality-with-amazon-codecatalyst-reports/

Amazon CodeCatalyst reports contain details about tests that occur during a workflow run. You can create tests such as unit tests, integration tests, configuration tests, and functional tests. You can use a test report to help troubleshoot a problem during a workflow.

Introduction

In prior posts in this series, I discussed reading The Unicorn Project, by Gene Kim, and how the main character, Maxine, struggles with a complicated Software Development Lifecycle (SDLC) after joining a new team. One of the challenges she encounters is the difficulties in shipping secure, functioning code without an automated testing mechanism. To quote Gene Kim, “Without automated testing, the more code we write, the more money it takes for us to test.”

Software Developers know that shipping vulnerable or non-functioning code to a production environment is to be avoided at all costs; the monetary impact is high and the toll it takes on team morale can be even greater. During the SDLC, developers need a way to easily identify and troubleshoot errors in their code.

In this post, I will focus on how developers can seamlessly run tests as a part of workflow actions as well as configure unit test and code coverage reports with Amazon CodeCatalyst. I will also outline how developers can access these reports to gain insights into their code quality.

Prerequisites

If you would like to follow along with this walkthrough, you will need to:

Walkthrough

As with the previous posts in the CodeCatalyst series, I am going to use the Modern Three-tier Web Application blueprint. Blueprints provide sample code and CI/CD workflows to help you get started easily across different combinations of programming languages and architectures. To follow along, you can re-use a project you created previously, or you can refer to a previous post that walks through creating a project using the Three-tier blueprint.

Once the project is deployed, CodeCatalyst opens the project overview. This view shows the content of the README file from the project’s source repository, workflow runs, pull requests, etc. The source repository and workflow are created for me by the project blueprint. To view the source code, I select Code → Source Repositories from the left-hand navigation bar. Then, I select the repository name link from the list of source repositories.

Figure 1. List of source repositories including Mythical Mysfits source code.

Figure 1. List of source repositories including Mythical Mysfits source code.

From here I can view details such as the number of branches, workflows, commits, pull requests and source code of this repo. In this walkthrough, I’m focused on the testing capabilities of CodeCatalyst. The project already includes unit tests that were created by the blueprint so I will start there.

From the Files list, navigate to web → src → components→ __tests__ → TheGrid.spec.js. This file contains the front-end unit tests which simply check if the strings “Good”, “Neutral”, “Evil” and “Lawful”, “Neutral”, “Chaotic” have rendered on the web page. Take a moment to examine the code. I will use these tests throughout the walkthrough.

Figure 2. Unit test for the front-end that test strings have been rendered properly.

Figure 2. Unit test for the front-end that test strings have been rendered properly. 

Next, I navigate to the  workflow that executes the unit tests. From the left-hand navigation bar, select CI/CD → Workflows. Then, find ApplicationDeploymentPipeline, expand Recent runs and select  Run-xxxxx . The Visual tab shows a graphical representation of the underlying YAML file that makes up this workflow. It also provides details on what started the workflow run, when it started,  how long it took to complete, the source repository and whether it succeeded.

Figure 3. The Deployment workflow open in the visual designer.

Figure 3. The Deployment workflow open in the visual designer.

Workflows are comprised of a source and one or more actions. I examined test reports for the back-end in a prior post. Therefore, I will focus on the front-end tests here. Select the build_and_test_frontend action to view logs on what the action ran, its configuration details, and the reports it generated. I’m specifically interested in the Unit Test and Code Coverage reports under the Reports tab:

Figure 4. Reports tab showing line and branch coverage.

Figure 4. Reports tab showing line and branch coverage.

Select the report unitTests.xml (you may need to scroll). Here, you can see an overview of this specific report with metrics like pass rate, duration, test suites, and the test cases for those suites:

Figure 5. Detailed report for the front-end tests

Figure 5. Detailed report for the front-end tests.

This report has passed all checks.  To make this report more interesting, I’ll intentionally edit the unit test to make it fail. First, navigate back to the source repository and open web → src → components→ __tests__→TheGrid.spec.js. This test case is looking for the string “Good” so change it to say “Best” instead and commit the changes.

Figure 6. Front-End Unit Test Code Change.

Figure 6. Front-End Unit Test Code Change.

This will automatically start a new workflow run. Navigating back to CI/CD →  Workflows, you can see a new workflow run is in progress (takes ~7 minutes to complete).

Once complete, you can see that the build_and_test_frontend action failed. Opening the unitTests.xml report again, you can see that the report status is in a Failed state. Notice that the minimum pass rate for this test is 100%, meaning that if any test case in this unit test ever fails, the build fails completely.

There are ways to configure these minimums which will be explored when looking at Code Coverage reports. To see more details on the error message in this report, select the failed test case.

Figure 7. Failed Test Case Error Message.

Figure 7. Failed Test Case Error Message.

As expected, this indicates that the test was looking for the string “Good” but instead, it found the string “Best”. Before continuing, I return to the TheGrid.spec.js file and change the string back to “Good”.

CodeCatalyst also allows me to specify code and branch coverage criteria. Coverage is a metric that can help you understand how much of your source was tested. This ensures source code is properly tested before shipping to a production environment. Coverage is not configured for the front-end, so I will examine the coverage of the back-end.

I select Reports on the left-hand navigation bar, and open the report called backend-coverage.xml. You can see details such as line coverage, number of lines covered, specific files that were scanned, etc.

Figure 8. Code Coverage Report Succeeded.

Figure 8. Code Coverage Report Succeeded.

The Line coverage minimum is set to 70% but the current coverage is 80%, so it succeeds. I want to push the team to continue improving, so I will edit the workflow to raise the minimum threshold to 90%. Navigating back to CI/CD → Workflows → ApplicationDeploymentPipeline, select the Edit button. On the Visual tab, select build_backend. On the Outputs tab, scroll down to Success Criteria and change Line Coverage to 90%.

Figure 9. Configuring Code Coverage Success Criteria.

Figure 9. Configuring Code Coverage Success Criteria.

On the top-right, select Commit. This will push the changes to the repository and start a new workflow run. Once the run has finished, navigate back to the Code Coverage report. This time, you can see it reporting a failure to meet the minimum threshold for Line coverage.

Figure 10. Code Coverage Report Failed.

There are other success criteria options available to experiment with. To learn more about success criteria, see Configuring success criteria for tests.

Cleanup

If you have been following along with this workflow, you should delete the resources you deployed so you do not continue to incur charges. First, delete the two stacks that CDK deployed using the AWS CloudFormation console in the AWS account you associated when you launched the blueprint. These stacks will have names like mysfitsXXXXXWebStack and mysfitsXXXXXAppStack. Second, delete the project from CodeCatalyst by navigating to Project settings and choosing Delete project.

Summary

In this post, I demonstrated how Amazon CodeCatalyst can help developers quickly configure test cases, run unit/code coverage tests, and generate reports using CodeCatalyst’s workflow actions. You can use these reports to adhere to your code testing strategy as a software development team. I also outlined how you can use success criteria to influence the outcome of a build in your workflow.  In the next post, I will demonstrate how to configure CodeCatalyst workflows and integrate Software Composition Analysis (SCA) reports. Stay tuned!

About the authors:

Imtranur Rahman

Imtranur Rahman is an experienced Sr. Solutions Architect in WWPS team with 14+ years of experience. Imtranur works with large AWS Global SI partners and helps them build their cloud strategy and broad adoption of Amazon’s cloud computing platform.Imtranur specializes in Containers, Dev/SecOps, GitOps, microservices based applications, hybrid application solutions, application modernization and loves innovating on behalf of his customers. He is highly customer obsessed and takes pride in providing the best solutions through his extensive expertise.

Wasay Mabood

Wasay is a Partner Solutions Architect based out of New York. He works primarily with AWS Partners on migration, training, and compliance efforts but also dabbles in web development. When he’s not working with customers, he enjoys window-shopping, lounging around at home, and experimenting with new ideas.

How to use AWS Private Certificate Authority short-lived certificate mode

Post Syndicated from Zachary Miller original https://aws.amazon.com/blogs/security/how-to-use-aws-private-certificate-authority-short-lived-certificate-mode/

AWS Private Certificate Authority (AWS Private CA) is a highly available, fully managed private certificate authority (CA) service that you can use to create CA hierarchies and issue private X.509 certificates. You can use these private certificates to establish endpoints for TLS encryption, cryptographically sign code, authenticate users, and more.

Based on customer feedback for prorated certificate pricing options, AWS Private CA now offers short-lived certificate mode, a lower cost mode of AWS Private CA that is designed to issue short-lived certificates. In this blog post, we will compare the original general-purpose and new short-lived CA modes and discuss use cases for each of them.

The general-purpose mode of AWS Private CA supports certificates of any validity period. The addition of short-lived CA mode is intended to facilitate use cases where you want certificates with a short validity period, defined as 7 days or less. Keep in mind this doesn’t mean that the root CA certificate must also be short lived. Although a typical root CA certificate is valid for 10 years, you can customize the certificate validity period for CAs in either mode when you install the CA certificate.

You select the CA mode when you create a certificate authority. The CA mode cannot be changed for an existing CA. Both modes (general-purpose and short-lived) have distinct pricing for the different use cases that they support.

The short-lived CA mode offers an accessible pricing model for customers who need to issue certificates with a short-term validity period. You can use these short-lived certificates for on-demand AWS workloads and align the validity of the certificate with the lifetime of the certificate holder. For example, if you’re using certificate-based authentication for a virtual workstation that is rebuilt each day, you can configure your certificates to expire after 24 hours.

In this blog post, we will compare the two CA modes, examine their pricing models, and discuss several potential use cases for short-lived certificates. We will also provide a walkthrough that shows you how to create a short-lived mode CA by using the AWS Command Line Interface (AWS CLI). To create a short-lived mode CA using the AWS Management Console, see Procedure for creating a CA (console).

Comparing general-purpose mode CAs to short-lived mode CAs

You might be wondering, “How is the short-lived CA mode different from the general-purpose CA mode? I can already create certificates with a short validity period by using AWS Private CA.” The key difference between these two CA modes is cost. Short-lived CA mode is priced to better serve use cases where you reissue private certificates frequently, such as for certificate-based authentication (CBA).

With CBA, users can authenticate once and then seamlessly access resources, including Amazon WorkSpaces and Amazon AppStream 2.0, without re-entering their credentials. This use case demonstrates the security value of short-lived certificates. A short validity period for the certificate reduces the impact of a compromised certificate because the certificate can only be used for authentication during a small window before it’s automatically invalidated. This method of authentication is useful for customers who are looking to adopt a Zero Trust security strategy.

Before the release of the short-lived CA mode, using AWS Private CA for CBA could be cost prohibitive for some customers. This is because CBA needs a new certificate for each user at regular intervals, which can require issuing a high volume of certificates. The best practice for CBA is to use short-lived CA mode, which can issue certificates at a lower cost that can be used to authenticate a user and then expire shortly afterward.

Let’s take a closer look at the pricing models for the two CA modes that are available when you use AWS Private CA.

Pricing model comparison

You can issue short-lived certificates from both the general-purpose and short-lived CA modes of AWS Private CA. However, the general-purpose mode CAs incur a monthly charge of $400 per CA. The cost of issuing certificates from a general-purpose mode CA is based on the number of certificates that you issue per month, per AWS Region.

The following table shows the pricing tiers for certificates issued by AWS Private CA by using a general-purpose mode CA.

Number of private certificates created each month (per Region) Price (per certificate)
1–1,000 $0.75 USD
1,001–10,000 $0.35 USD
10,001 and above $0.001 USD

The short-lived mode CA will only incur a monthly charge of $50 per CA. The cost of issuing certificates from a short-lived mode CA is the same regardless of the volume of certificates issued: $0.058 per certificate. This pricing structure is more cost effective than general-purpose mode if you need to frequently issue new, short-lived certificates for a use case like certificate-based authentication. Figure 1 compares costs between modes at different certificate volumes.

Figure 1: Cost comparison of AWS Private CA modes

Figure 1: Cost comparison of AWS Private CA modes

It’s important to note that if you already issue a high volume of certificates each month from AWS Private CA, the short-lived CA mode might not be more cost effective than the general-purpose mode. Consider a customer who has one CA and issues 80,000 certificates per month using the general-purpose CA mode: This will incur a total monthly cost of $4,370. A breakdown of the total cost per month in this scenario is as follows.

1 private CA x 400 USD per month = 400 USD per month for operation of AWS Private CA

Tiered price for 80,000 issued certificates:
1,000 issued certificates x 0.75 USD = 750 USD
9,000 issued certificates x 0.35 USD = 3,150 USD
70,000 issued certificates x 0.001 USD = 70 USD
Total tier cost: 750 USD + 3,150 USD + 70 USD = 3,970 USD per month for certificates issued
400 USD for instances + 3,970 USD for certificate issued = 4,370 USD
Total cost (monthly): 4,370 USD

Now imagine that same customer chose to use a short-lived mode CA to issue the same number of private certificates. Although the cost per month of the short-lived mode CA instance is lower, the price of issuing short-lived certificates would still be greater than the 70,000 certificates issued at a cost of $0.001 with the general-purpose mode CA. The total cost of issuing this many certificates from a single short-lived mode CA is $4,690. A breakdown of the total cost per month in this scenario is as follows.

1 private CA x 50 USD per month = 50 USD per month for operation of AWS Private CA (short-lived CA mode)

Price for 80,000 issued certificates (short-lived CA mode):
80,000 issued certificates x 0.058 USD = 4,640 USD
50 USD for instances + 4,640 USD for certificate issued = 4,690 USD
Total cost (monthly): 4,690 USD

At very high volumes of certificate issuance, the short-lived CA mode is not as cost effective as the general-purpose CA mode. It’s important to consider the volume of certificates that your organization will be issuing when you decide which CA mode to use. Figure 1 shows the cost difference at various volumes of certificate issuance. This difference will vary based on the number of certificates issued, as well as the number of CAs that your organization used.

You should also evaluate the various use cases that your organization has for using private certificates. For example, private certificates that are used to terminate TLS traffic typically have a validity of a year or more, meaning that the short-lived CA mode could not facilitate this use case. The short-lived CA mode can only issue certificates with a validity of 7 days or less.

However, you can create multiple private CAs and select the appropriate certificate authority mode for each CA based on your requirements. We recommend that you evaluate your use cases and estimate your certificate volume when you consider which CA mode to use.

In general, you should use the new short-lived CA mode for use cases where you require certificates with a short validity period (less than 7 days) and you are not planning to issue more than 75,000 certificates per month. You should use the general-purpose CA mode for scenarios where you need to issue certificates with a validity period of more than 7 days, or when you need short-lived certificates but will be issuing very high volumes of certificates each month (for example, over 75,000).

Use cases

The short-lived certificate feature was initially developed for certificate-based authentication with Amazon WorkSpaces and Amazon AppStream 2.0. For a step-by-step guide on how to configure certificate-based authentication for Amazon Workspaces, see How to configure certificate-based authentication for Amazon WorkSpaces. However, there are other ways to get value from the AWS Private CA short-lived CA mode, which we will describe in the following sections.

IAM Roles Anywhere

For customers who use AWS Identity and Access Management (IAM) Roles Anywhere, you might want to reduce the time period for which a certificate can be used to retrieve temporary credentials to assume an IAM role. If you frequently issue X.509 certificates to servers outside of AWS for use with IAM Roles Anywhere, and you want to use short-lived certificates, the pricing model for short-lived CA mode will be more cost effective in most cases (see Figure 1).

Short-lived credentials are useful for administrative personas that have broad permissions to AWS resources. For instance, you might use IAM Roles Anywhere to allow an entity outside AWS to assume an IAM role with the AdministratorAccess AWS managed policy attached. To help manage the risk of this access pattern, we want the certificate to expire relatively quickly, which reduces the time period during which a compromised certificate could potentially be used to authenticate to a highly privileged IAM role.

Furthermore, IAM Roles Anywhere requires that you manually upload a certificate revocation list (CRL), and does not support the CRL and Online Certificate Status Protocol (OCSP) mechanisms that are native to AWS Private CA. Using short-lived certificates is a way to reduce the impact of a potential credential compromise without needing to configure revocation for IAM Roles Anywhere. The need for certificate revocation is greatly reduced if the certificates are only valid for a single day and can’t be used to retrieve temporary credentials to assume an IAM role after the certificate expires.

Mutual TLS between workloads

Consider a highly sensitive workload running on Amazon Elastic Kubernetes Service (Amazon EKS). AWS Private CA supports an open-source plugin for cert-manager, a widely adopted solution for TLS certificate management in Kubernetes, that offers a more secure CA solution for Kubernetes containers. You can use cert-manager and AWS Private CA to issue certificates to identify cluster resources and encrypt data in transit with TLS.

If you use mutual TLS (mTLS) to protect network traffic between Kubernetes pods, you might want to align the validity period of the private certificates with the lifetime of the pods. For example, if you rebuild the worker nodes for your EKS cluster each day, you can issue certificates that expire after 24 hours and configure your application to request a new short-lived certificate before the current certificate expires.

This enables resource identification and mTLS between pods without requiring frequent revocation of certificates that were issued to resources that no longer exist. As stated previously, this method of issuing short-lived certificates is possible with the general-purpose CA mode—but using the new short-lived CA mode makes this use case more cost effective for customers who issue fewer than 75,000 certificates each month.

Create a short-lived mode CA by using the AWS CLI

In this section, we show you how to use the AWS CLI to create a new private certificate authority with the usage mode set to SHORT_LIVED_CERTIFICATE. If you don’t specify a usage mode, AWS Private CA creates a general-purpose mode CA by default. We won’t use a form of revocation, because the short-lived CA mode makes revocation less useful. The certificates expire quickly as part of normal operations. For more examples of how to create CAs with the AWS CLI, see Procedure for creating a CA (CLI). For instructions to create short-lived mode CAs with the AWS console, see Procedure for creating a CA (Console).

This walkthrough has the following prerequisites:

  1. A terminal with the .aws configuration directory set up with a valid default Region, endpoint, and credentials. For information about configuring your AWS CLI environment, see Configuration and credential file settings.
  2. An AWS Identity and Access Management (IAM) user or role that has permissions to create a certificate authority by using AWS Private CA.
  3. A certificate authority configuration file to supply when you create the CA. This file provides the subject details for the CA certificate, as well as the key and signing algorithm configuration.

    Note: We provide an example CA configuration file, but you will need to modify this example to meet your requirements.

To use the create-certificate-authority command with the AWS CLI

  1. We will use the following ca_config.txt file to create the certificate authority. You will need to modify this example to meet your requirements.
    {
       "KeyAlgorithm":"RSA_2048",
       "SigningAlgorithm":"SHA256WITHRSA",
       "Subject":{
          "Country":"US",
          "Organization":"Example Corp",
          "OrganizationalUnit":"Sales",
          "State":"WA",
          "Locality":"Seattle",
          "CommonName":"Example Root CA G1"
       }
    }

  2. Enter the following command to create a short-lived mode root CA by using the parameters supplied in the ca_config.txt file.

    Note: Make sure that ca_config.txt is located in your current directory, or specify the full path to the file.

    aws acm-pca create-certificate-authority \
    --certificate-authority-configuration file://ca_config.txt \
    --certificate-authority-type "ROOT" \
    --usage-mode SHORT_LIVED_CERTIFICATE \
    --tags Key=usageMode,Value=SHORT_LIVED_CERTIFICATE

  3. Use the describe-certificate-authority command to view the status of your new root CA. The status will show Pending_Certificate, until you install a self-signed root CA certificate. You will need to replace the certificate authority Amazon Resource Name (ARN) in the following command with your own CA ARN.

    sh-4.2$ aws acm-pca describe-certificate-authority --certificate-authority-arn arn:aws:acm-pca:region:account:certificate-authority/CA_ID

    The output of this command is as follows:

    {
        "CertificateAuthority": {
            "Arn": "arn:aws:acm-pca:region:account:certificate-authority/CA_ID",
            "OwnerAccount": "account",
            "CreatedAt": "2022-11-02T23:12:46.916000+00:00",
            "LastStateChangeAt": "2022-11-02T23:12:47.779000+00:00",
            "Type": "ROOT",
            "Status": "PENDING_CERTIFICATE",
            "CertificateAuthorityConfiguration": {
                "KeyAlgorithm": "RSA_2048",
                "SigningAlgorithm": "SHA256WITHRSA",
                "Subject": {
                    "Country": "US",
                    "Organization": "Example Corp",
                    "OrganizationalUnit": "Sales",
                    "State": "WA",
                    "CommonName": "Example Root CA G1",
                    "Locality": "Seattle"
                }
            },
            "RevocationConfiguration": {
                "CrlConfiguration": {
                    "Enabled": false
                },
                "OcspConfiguration": {
                    "Enabled": false
                }
            },
            "KeyStorageSecurityStandard": "FIPS_140_2_LEVEL_3_OR_HIGHER",
            "UsageMode": "SHORT_LIVED_CERTIFICATE"
        }
    }

  4. Generate a certificate signing request for your root CA certificate by running the following command. Make sure to replace the certificate authority ARN in the command with your own CA ARN.

    aws acm-pca get-certificate-authority-csr \
    --certificate-authority-arn arn:aws:acm-pca:region:account:certificate-authority/CA_ID \
    --output text > ca.csr

  5. Using the ca.csr file from the previous step as the argument for the --csr parameter, issue the root certificate with the following command. Make sure to replace the certificate authority ARN in the command with your own CA ARN.

    aws acm-pca issue-certificate \
    --certificate-authority-arn arn:aws:acm-pca:region:account:certificate-authority/CA_ID \
    --csr fileb://ca.csr \
    --signing-algorithm SHA256WITHRSA \
    --template-arn arn:aws:acm-pca:::template/RootCACertificate/V1 \
    --validity Value=10,Type=YEARS

  6. The response will include the CertificateArn for the issued root CA certificate. Next, use your CA ARN and the certificate ARN provided in the response to retrieve the certificate by using the get-certificate CLI command, as follows.

    aws acm-pca get-certificate \
    --certificate-authority-arn arn:aws:acm-pca:region:account:certificate-authority/CA_ID \
    --certificate-arn arn:aws:acm-pca:region:account:certificate-authority/CA_ID/certificate/CERTIFICATE_ID \
    --output text > cert.pem

  7. Notice that we created a new file, cert.pem, that contains the certificate we retrieved in the previous command. We will import this certificate to our short-lived mode root CA by running the following command. Make sure to replace the certificate authority ARN in the command with your own CA ARN.

    aws acm-pca import-certificate-authority-certificate \
    --certificate-authority-arn arn:aws:acm-pca:region:account:certificate-authority/CA_ID \
    --certificate fileb://cert.pem

  8. Check the status of your short-lived mode CA again by using the describe-certificate-authority command. Make sure to replace the certificate authority ARN in the following command with your own CA ARN.

    sh-4.2$ aws acm-pca describe-certificate-authority \
    > --certificate-authority-arn arn:aws:acm-pca:region:account:certificate-authority/CA_ID \
    > --output json

    The output of this command is as follows:

    {
        "CertificateAuthority": {
            "Arn": "arn:aws:acm-pca:region:account:certificate-authority/CA_ID",
            "OwnerAccount": "account",
            "CreatedAt": "2022-11-02T23:12:46.916000+00:00",
            "LastStateChangeAt": "2022-11-02T23:39:23.482000+00:00",
            "Type": "ROOT",
            "Serial": "serial",
            "Status": "ACTIVE",
            "NotBefore": "2022-11-02T22:34:50+00:00",
            "NotAfter": "2032-11-02T23:34:50+00:00",
            "CertificateAuthorityConfiguration": {
                "KeyAlgorithm": "RSA_2048",
                "SigningAlgorithm": "SHA256WITHRSA",
                "Subject": {
                    "Country": "US",
                    "Organization": "Example Corp",
                    "OrganizationalUnit": "Sales",
                    "State": "WA",
                    "CommonName": "Example Root CA G1",
                    "Locality": "Seattle"
                }
            },
            "RevocationConfiguration": {
                "CrlConfiguration": {
                    "Enabled": false
                },
                "OcspConfiguration": {
                    "Enabled": false
                }
            },
            "KeyStorageSecurityStandard": "FIPS_140_2_LEVEL_3_OR_HIGHER",
            "UsageMode": "SHORT_LIVED_CERTIFICATE"
        }
    }

  9. Great! As shown in the output from the preceding command, the new short-lived mode root CA has a status of ACTIVE, meaning it can now issue certificates. This certificate authority will be able to issue end-entity certificates that have a validity period of up to 7 days, as shown in the UsageMode: SHORT_LIVED_CERTIFICATE parameter.

Conclusion

In this post, we introduced the short-lived CA mode that is offered by AWS Private CA, explained how it differs from the general-purpose CA mode, and compared the pricing models for both CA modes. We also provided some recommendations for choosing the appropriate CA mode based on your certificate issuance volume and use cases. Finally, we showed you how to create a short-lived mode CA by using the AWS CLI.

Get started using AWS Private CA, and consult the AWS Private CA User Guide for more details on the short-lived CA mode.

If you have feedback about this post, submit comments in the Comments section below. If you have questions about this post, start a new thread on the AWS Certificate Manager re:Post or contact AWS Support.

Want more AWS Security news? Follow us on Twitter.

Zach Miller

Zach Miller

Zach is a Senior Security Specialist Solutions Architect at AWS. His background is in data protection and security architecture, focused on a variety of security domains, including cryptography, secrets management, and data classification. Today, he is focused on helping enterprise AWS customers adopt and operationalize AWS security services to increase security effectiveness and reduce risk.

Rushir Patel

Rushir Patel

Rushir is a Senior Security Specialist at AWS focused on data protection and cryptography services. His goal is to make complex topics simple for customers and help them adopt better security practices. Prior to AWS, he worked in security product management, engineering, and operations roles.

Trevor Freeman

Trevor Freeman

Trevor is an innovative and solutions-oriented Product Manager at Amazon Web Services, focusing on AWS Private CA. With over 20 years of experience in software and service development, he became an expert in Cloud Services, Security, Enterprise Software, and Databases. Being adept in product architecture and quality assurance, Trevor takes great pride in providing exceptional customer service.

How to Connect Business and Technology to Embrace Strategic Thinking (Book Review)

Post Syndicated from Danilo Poccia original https://aws.amazon.com/blogs/aws/how-to-connect-business-and-technology-to-embrace-strategic-thinking-book-review/

The Value Flywheel Effect: Power the Future and Accelerate Your Organization to the Modern Cloud
by David Anderson with Mark McCann and Michael O’Reilly

With this post, I’d like to share a new book that got my attention. It’s a book at the intersection of business, technology, and people. This is a great read for anyone who wants to understand how organizations can evolve to maximize the business impact of new technologies and speed up their internal processes.

The Value FlyWheel Effect book with David Anderson and Danilo Poccia

Last year at re:Invent, I had the opportunity to meet David Anderson. As Director of Technology at Liberty Mutual, he drove the technology change when the global insurance company, founded in 1912, moved its services to the cloud and adopted a serverless-first strategy. He created an environment where experimentation was normal, and software engineers had time and space to learn. This worked so well that, at some point, he had four AWS Heroes in his extended team.

A few months before, I heard that David was writing a book with Mark McCann and Michael O’Reilly. They all worked together at Liberty Mutual, and they were distilling their learnings to help other organizations implement a similar approach. The book was just out when we met, and I was curious to learn more, starting from the title. We met in the expo area, and David was kind enough to give me a signed copy of the book.

The book is published by IT Revolution, the same publisher behind some of my favorite books such as The Phoenix Project, Team Topologies, and Accelerate. The book is titled The Value Flywheel Effect because when you connect business and technology in an organization, you start to turn a flywheel that builds momentum with each small win.

The Value Flywhell
The four phases of the Value Flywheel are:

  1. Clarity of Purpose – This is the part where you look at what is really important for your organization, what makes your company different, and define your North Star and how to measure your distance from it. In this phase, you look at the company through the eyes of the CEO.
  2. Challenge & Landscape – Here you prepare the organization and set up the environment for the teams. We often forget the social aspect of technical teams and great focus is given here on how to set up the right level of psychological safety for teams to operate. This phase is for engineers.
  3. Next Best Action – In this phase, you think like a product leader and plan the next steps with a focus on how to improve the developer experience. One of the key aspects is that “code is a liability” and the less code you write to solve a business problem, the better it is for speed and maintenance. For example, you can avoid some custom implementations and offload their requirements to capabilities offered by cloud providers.
  4. Long-Term Value – This is the CTO perspective, looking at how to set up a problem-preventing culture with well-architected systems and a focus on observability and sustainability. Sustainability here is not just considering the global environment but also the teams and the people working for the organization.

As you would expect from a flywheel, you should iterate on these four phases so that every new spin gets easier and faster.

Wardley Mapping
One thing that I really appreciate from the book is how it made it easy for me to use Wardley mapping (usually applied to a business context) in a technical scenario. Wardley maps, invented by Simon Wardley, provide a visual representation of the landscape in which a business operates.

Each map consists of a value chain, where you draw the components that your customers need. The components are connected to show how they depend on each other. The position of the components is based on how visible they are to customers (vertical) and their evolution status from genesis to being a product or a commodity (horizontal). Over time, some components evolve from being custom-built to becoming a product or being commoditized. This displays on the map with a natural movement to the right as things evolve. For example, data centers were custom-built in the past, but then they became a standard product, and cloud computing made them available as a commodity.

Wardley mapping – Basic elements of a map

Basic elements of a map – Provided courtesy of Simon Wardley, CC BY-SA 4.0.

With mapping, you can more easily understand what improvements you need and what gaps you have in your technical solution. In this way, engineers can identify which components they should focus on to maximize their impact and what parts are not strategic and can be offloaded to a SaaS solution. It’s a sort of evolutionary architecture where mapping gives a way to look ahead at how the system should evolve over time and where inertia can slow down the evolution of part of the system.

Sometimes it seems the same best practices apply everywhere but this is not true. An advantage of mapping is that it helps identify the best team and methodology to use based on a component evolution status as described by its horizontal position on a map. For example, an “explorer” attitude is best suited for components in their genesis or being custom built, a “villager” works best on products, and when something becomes a commodity you need a “town planner.”

More Tools and Less Code
The authors look at many available tools and frameworks. For example, the book introduces the North Star Framework, a way to manage products by first identifying their most important metric (the North Star), and Gojko Adzic‘s Impact Mapping, a collaborative planning technique that focuses on leading indicators to help teams make a big impact with their software products. By the way, Gojko is also an AWS Serverless Hero.

Another interesting point is how to provide engineers with the necessary time and space to learn. I specifically like how internal events are called out and compared to public conferences. In internal events, engineers have a chance to use a new technology within their company environment, making it easier to demonstrate what can be done with all the limits of an actual scenario.

Finally, I’d like to highlight this part that clearly defines what the book intends by the statements, “code is a liability”:

“When you ask a software team to build something, they deliver a system, not lines of code. The asset is not the code; the asset is the system. The less code in the system, the less overhead you have bought. Some developers may brag about how much code they’ve written, but this isn’t something to brag about.”

This is not a programming book, and serverless technologies are used as examples of how you can speed up the flywheel. If you are looking for a technical deep dive on serverless technologies, you can find more on Serverless Land, a site that brings together the latest information and learning resources for serverless computing, or have a look at the Serverless Architectures on AWS book.

Now that every business is a technology business, The Value Flywheel Effect is about how to accelerate and transform an organization. It helps set the right environment, purpose, and stage to modernize your applications as you adopt cloud computing and get the benefit of it.

You can meet David, Mark, and Michael at the Serverless Edge, where a team of engineers, tech enthusiasts, marketers, and thought leaders obsessed with technology help learn and communicate how serverless can transform a business model.

Danilo

How to create custom health checks for your Amazon EC2 Auto Scaling Fleet

Post Syndicated from Sheila Busser original https://aws.amazon.com/blogs/compute/how-to-create-custom-health-checks-for-your-amazon-ec2-auto-scaling-fleet/

This blog post is written by Gaurav Verma, Cloud Infrastructure Architect, Professional Services AWS.

Amazon EC2 Auto Scaling helps you maintain application availability and lets you automatically add or remove Amazon Elastic Compute Cloud (Amazon EC2) instances according to the conditions that you define. You can use dynamic and predictive scaling to scale-out and scale-in EC2 instances. Auto Scaling helps to maintain the self-healing Amazon EC2 environment for an application where Auto Scaling can use the status of Amazon EC2 health checks to determine if an instance is faulty and needs replacement. Amazon EC2 Auto Scaling provides three types of health checks, which are discussed below.

EC2 Status check: AWS provides two types of health checks for EC2 instances: System status check and instance status check. System status checks monitor the AWS system on which an instance is running. If the problem is with underlying system, AWS will fix the problem. Instance status check monitors the software and network configuration of an instance. If the instance status check fails, then you can fix the problem by following the steps in the troubleshoot instances with failed status checks documentation.

Elastic Load Balancer Health Check: Auto Scaling groups are generally connected to Elastic Load Balancers (ELB). ELB provides the application-level health check by monitoring the endpoint (a webpage, or a health page in a web application) of an application. ELB health check monitors the application and marks the instance unhealthy if there is no response from an instance in the configured time.

Custom Health Check: You can use custom health checks to mark any instance as unhealthy if the instance fails for the check you define. Custom health checks can be used to implement various user requirements, such as the presence of instance tags added upon completion of a required workflow. The user data script is executed at instance boot time, and it can perform additional investigation into whether or not the user requirements are met before confirming that the instance is ready to accept load. For example, this approach could be used to confirm that the instance was successfully integrated with other parts of a complex application stack.

In some cases, a customer may add multiple checks either in the Amazon EC2 AMI or in the boot sequence to keep the instance secure and compliant. These checks can increase the boot time for the EC2 instance, and they can reboot the EC2 instance multiple times before an instance can be marked as compliant. Therefore, in some cases, an EC2 instance boot period can take forty to fifty minutes or longer.

If an EC2 instance isn’t marked as healthy within a defined time, Auto Scaling will mark an instance unhealthy, even though the instance wasn’t yet ready for evaluation. Custom health checks can help manage these situations. You can write the Amazon EC2 user data script to perform the custom health check and force Auto Scaling to wait until the instance is truly healthy (i.e., functional, secure, and compliant).

This blog describes a method to write a custom health check. We write an Amazon EC2 user data script to perform the custom health check and automate it for future EC2 instances in the Auto Scaling group. This script can wait for an instance to successfully complete the boot process and then mark the instance as healthy.

Prerequisites

You must have an AWS Identity and Access Management (IAM) role for Amazon EC2 with an Auto Scaling policy, which has these two actions allowed for the Auto Scaling group:

autoscaling:CompleteLifecycleAction

autoscaling:RecordLifecycleActionHeartbeat

Furthermore, we use the Amazon EC2 Auto Scaling lifecycle hooks. Lifecycle hooks let you create a solutions that are aware of events in Auto Scaling instance lifecycle, and then perform a custom action on instances when the lifecycle event occurs. As mentioned previously, typically a custom health check is needed when determining the workload readiness of an instance would be longer than the usual boot time for an EC2 instance that Auto Scaling assumes. Therefore, we utilize lifecycle hooks to keep the checks running until the instance is marked healthy.

Create custom health check

Let’s look at an example where an instance can only be marked as healthy if the instance has a tag with the key “Compliance-Check” and value “Successful”. Until this tag is both (a) present and (b) carries the value “Successful”, the instance shouldn’t be marked as “InService”.

  1. Create the Auto Scaling launch template for Amazon EC2 Auto Scaling. Name your Launch template “test”. In the additional configuration for user data, use this shell script as text.

The Following script will install the AWS Command Line Interface (AWS CLI) to interact with the AWS tagging and Auto Scaling APIs. Then, the script will run the while loop until the instance has a tag with the key “Compliance-Check” and value “Successful”. Once the instance has a tag, it will mark the instance as healthy and the instance will move into the “InService” state.

#!/bin/bash
curl "https://awscli.amazonaws.com/awscli-exe-linux-x86_64.zip" -o "awscliv2.zip"
unzip awscliv2.zip
sudo ./aws/install
#get instance id
instance=$(curl http://169.254.169.254/latest/meta-data/instance-id)

#Checking instance status
while true
do
readystatus=$(aws ec2 describe-instances --instance-ids $instance --filters "Name=tag: Compliance-Check,Values= Successful" |grep -i $instance)
if [[ $readystatus = *"InstanceId"* ]]; then
        echo $readystatus >> /home/ec2-user/user-script-output.txt
        aws autoscaling set-instance-health --instance-id $instance --health-status Healthy
        aws autoscaling complete-lifecycle-action --lifecycle-action-result CONTINUE --instance-id $instance --lifecycle-hook-name test --auto-scaling-group-name my-asg
        break 
else
	aws autoscaling set-instance-health --instance-id $instance --health-status Unhealthy
	sleep 5  
fi

done
  1. Create an Amazon EC2 Auto Scaling group using the AWS CLI with the “test” launch template that you just created and a predefined lifecycle hook. First, create a JSON file “config.json” in a system where you will run the AWS command to create the Auto Scaling group.
{
    "AutoScalingGroupName": "my-asg",
    "LaunchTemplate": {"LaunchTemplateId": "lt-1234567890abcde12"} ,
    "MinSize": 2,
    "MaxSize": 4,
    "DesiredCapacity": 2,
    "VPCZoneIdentifier": "subnet-12345678, subnet-90123456",
    "NewInstancesProtectedFromScaleIn": true,
    "LifecycleHookSpecificationList": [
        {
            "LifecycleHookName": "test",
            "LifecycleTransition": "autoscaling:EC2_INSTANCE_LAUNCHING",
            "HeartbeatTimeout": 300,
            "DefaultResult": "ABANDON"
        }
    ],
    "Tags": [
        {
            "ResourceId": "my-asg",
            "ResourceType": "auto-scaling-group",
            "Key": "Compliance-Check",
            "Value": "UnSuccessful",
            "PropagateAtLaunch": true
        }
    ]
}

To create the Auto Scaling group with the AWS CLI, you must run the following command at the same location where you saved the preceding JSON file. Make sure to replace the relevant subnets that you intend to use in the VPCZoneIdentifier.

>> aws autoscaling create-auto-scaling-group –cli-input-json file://config.json

This command will create the Auto Scaling group with a configuration defined in the JSON file. This Auto Scaling group should have two instances and a lifecycle hook called “test” with a 300 second wait period at the time of launch of an instance.

Tests

Now is the time to test the newly-created instances with a custom health check. Instances in Auto Scaling should be in the “Pending:Wait” stage, not the “InService” stage. Instances will be in this stage for approximately five minutes because we have a lifecycle hook time of 300 seconds in the config.json file.

If the workload readiness evaluation takes more than 300 seconds in your environment, then you can increase the lifecycle hook period to as long as 7200 seconds.

Change the tag value for one instance from “UnSuccessful” to “Successful”. If you’ve changed the tag within the five minutes of instances creation, then the instance should be in the “InService” state and marked as healthy.

Change Compliance-Check value from "UnSuccessful" to "Successful".

This test is a simulation of the situation where the health check of an instance depends on the tag values, and the tag values are only updated if the instance passes all of the checks as per the organization standards. Here we change the tag value manually, but in a real use case scenario, this value would be changed by the booting process when instances are marked as compliant.

Another test case could be that an instance should be marked as healthy if it’s added to the configuration management database, but not before that. For these checks, you can use the API with the curl command and look for the desired result. An example to call an API is in the above script, where it calls the AWS API to get the instance ID.

In case your custom health check script needs more than 7200 seconds, you can use this command to increase the lifecycle hook time:

>> aws autoscaling record-lifecycle-action-heartbeat –lifecycle-hook-name <lh_
name> –auto-scaling-group-name <asg_name> –instance-id <instance_id>

This command will give you the extra time equal to the time that you have configured in the life cycle hook.

Cleanup

Once you successfully test the solution, to avoid ongoing charges for resources you created, you should delete the resources.

To delete the Amazon EC2 Auto Scaling group, run the following command:

aws autoscaling delete-auto-scaling-group --auto-scaling-group-name my-asg

To delete the launch template, run the following command:

aws ec2 delete-launch-template --launch-template-id lt-1234567890abcde12

Delete the role and policy as well if you no longer need it.

Conclusion

EC2 Auto Scaling custom health checks are useful when system or instance health is insufficient, and you want instances to be marked as healthy only after additional checks. Typically, because of these different checks, the Amazon EC2 boot period can be longer than usual, and this may impact the scale-out process when an application needs more resources.

You can start by exploring EC2 Auto Scaling warm pools for these environments. You can keep the healthy marked instances in the warm pool in the Stopped stage. Then, these instances can be brought into the main pool at the time of scale-out without spending time on the boot process and lengthy health check. If you enable scale-in protection, then these healthy instances can move back to the warm pool at the time of scale-in rather than being terminated altogether.

Scaling an ASG using target tracking with a dynamic SQS target

Post Syndicated from Sheila Busser original https://aws.amazon.com/blogs/compute/scaling-an-asg-using-target-tracking-with-a-dynamic-sqs-target/

This blog post is written by Wassim Benhallam, Sr Cloud Application Architect AWS WWCO ProServe, and Rajesh Kesaraju, Sr. Specialist Solution Architect, EC2 Flexible Compute.

Scaling an Amazon EC2 Auto Scaling group based on Amazon Simple Queue Service (Amazon SQS) is a commonly used design pattern in decoupled applications. For example, an EC2 Auto Scaling Group can be used as a worker tier to offload the processing of audio files, images, or other files sent to the queue from an upstream tier (e.g., web tier). For latency-sensitive applications, AWS guidance describes a common pattern that allows an Auto Scaling group to scale in response to the backlog of an Amazon SQS queue while accounting for the average message processing duration (MPD) and the application’s desired latency.

This post builds on that guidance to focus on latency-sensitive applications where the MPD varies over time. Specifically, we demonstrate how to dynamically update the target value of the Auto Scaling group’s target tracking policy based on observed changes in the MPD. We also cover the utilization of Amazon EC2 Spot instances, mixed instance policies, and attribute-based instance selection in the Auto Scaling Groups as well as best practice implementation to achieve greater cost savings.

The challenge

The key challenge that this post addresses is applications that fail to honor their acceptable/target latency in situations where the MPD varies over time. Latency refers here to the time required for any queue message to be consumed and fully processed.

Consider the example of a customer using a worker tier to process image files (e.g., resizing, rescaling, or transformation) uploaded by users within a target latency of 100 seconds. The worker tier consists of an Auto Scaling group configured with a target tracking policy. To achieve the target latency mentioned previously, the customer assumes that each image can be processed in one second, and configures the target value of the scaling policy so that the average image backlog per instance is maintained at approximately 100 images.

In the first week, the customer submits 1000 images to the Amazon SQS queue for processing, each of which takes one second of processing time. Therefore, the Auto Scaling group scales to 10 instances, each of which processes 100 images in 100s, thereby honoring the target latency of 100s.

In the second week, the customer submits 1000 slightly larger images for processing. Since an image’s processing duration scales with its size, each image takes two seconds to process. As in the first week, the Auto Scaling group scales to 10 instances, but this time each instance processes 100 images in 200s, which is twice as long as was needed in the first round. As a result, the application fails to process the latter images within its acceptable latency.

Therefore, the challenge is common to any latency-sensitive application where the MPD is subject to change. Applications where the processing duration scales with input data size are particularly vulnerable to this problem. This includes image processing, document processing, computational jobs, and others.

Solution overview

Before we dive into the solution, let’s briefly review the target tracking policy’s scaling metric and its corresponding target value. A target tracking scaling policy works by adjusting the capacity to keep a scaling metric at, or close to, the specified target value. When scaling in response to an Amazon SQS backlog, it’s good practice to use a scaling metric known as the Backlog Per Instance (BPI) and a target value based on the acceptable BPI. These are computed as follows:

BPI equation, Saling metric and target value.

Given the acceptable BPI equation, a longer MPD requires us to use a smaller target value if we are to process these messages in the same acceptable latency, and vice versa. Therefore, the solution we propose here works by monitoring the average MPD over time and dynamically adjusting the target value of the Auto Scaling group’s target tracking policy (acceptable BPI) based on the observed changes in the MPD. This allows the scaling policy to adapt to variations in the average MPD over time, and thus enables the application to honor its acceptable latency.

Solution architecture

To demonstrate how the approach above can be implemented in practice, we put together an example architecture highlighting the services involved (see the following figure). We also provide an automated deployment solution for this architecture using an AWS Serverless Application Model (AWS SAM) template and some Python code (repository link). The repository also includes a README file with detailed instructions that you can follow to deploy the solution. The AWS SAM template deploys several resources, including an autoscaling group, launch template, target tracking scaling policy, an Amazon SQS queue, and a few AWS Lambda functions that serve various functions described as follows.

The Amazon SQS queue is used to accumulate messages intended for processing, while the Auto Scaling group instances are responsible for polling the queue and processing any messages received. To do this, a launch template defines a bootstrap script that allows the group’s instances to download and execute a Python code when first launched. The Python code consumes messages from the Amazon SQS queue and simulates their processing by sleeping for the MPD duration specified in the message body. After processing each message, the instance publishes the MPD as an Amazon CloudWatch metric (see the following figure).

Figure 1: Architecture diagram showing the components deployed by the AWS SAM template. These include an SQS queue, an Auto Scaling group responsible for polling and processing queue messages, a Lambda function that regularly updates the BPI CloudWatch metric, and a “Target Setter” Lambda function that regularly updates the Auto Scaling group’s target tracking scaling policy.

Figure 1: Architecture diagram showing the components deployed by the AWS SAM template.

To enable scaling, the Auto Scaling group is configured with a target tracking scaling policy that specifies BPI as the scaling metric and with an initial target value provided by the user.

The BPI CloudWatch metric is calculated and published by the “Metric-Publisher” Lambda function which is invoked every one minute using an Amazon EventBridge rate expression. To calculate BPI, the Lambda function simply takes the ratio of the number of messages visible in the Amazon SQS queue by the total number of in-service instances in the Auto Scaling group, as shown in equation (2) above.

On the other hand, the scaling policy’s target value is updated by the “Target-Setter” Lambda function, which is invoked every 30 minutes using another EventBridge rate expression. To calculate the new target value, the Lambda function simply takes the ratio of the user-defined acceptable latency value by the current average MPD queried from the corresponding CloudWatch metric, as shown in the previous equation (1).

Finally, to help you quickly test this solution, a Lambda function “Testing Lambda” is also provided and can be used to send messages to the Amazon SQS queue with a processing duration of your choice. This is specified within each message’s body. You can invoke this Lambda function with different MPDs (by modifying the corresponding environment variable) to verify how the Auto Scaling group scales in response. A CloudWatch dashboard is also deployed to enable you to track key scaling metrics through time. These include the number of messages visible in the queue, the number of in-service instances in the Auto Scaling group, the MPD, and BPI vs acceptable BPI.

Solution testing

To demonstrate the solution in action and its impact on application latency, we conducted two tests that you can reproduce by following the instructions described in the “Testing” section of the repository’s README file (repository link). In both tests, we assume a hypothetical application with a target latency of 300s. We also modified the invocation frequency of the “Target Setter” Lambda function to one minute to quickly assess the impact of target value changes. In both tests, we submit 50 messages to the Amazon SQS queue through the provided helper lambda. An MPD of 25s and 50s was used for the first and second test, respectively. The provided CloudWatch dashboard shows that the ASG scales to a total of four instances in the first test, and eight instances in the second (see the following figure). See README file for a detailed description of how various metrics evolve over time.

Comparison of Tests 1 and 2

Since Test 2 messages take twice as long to process, the Auto Scaling group launched twice as many instances to attempt to process all of the messages in the same amount of time as Test 1 (latency). The following figure shows that the total time to process all 50 messages in Test 1 was 9 mins vs 10 mins in Test 2. In contrast, if we were to use a static/fixed acceptable BPI of 12, then a total of four instances would have been operational in Test 2, thereby requiring double the time of Test 1 (~20 minutes) to process all of the messages. This demonstrates the value of using a dynamic scaling target when processing messages from Amazon SQS queues, especially in circumstances where the MPD is prone to vary with time.

Figure 2: CloudWatch dashboard showing Auto Scaling group scaling test results (Test 1 and 2). Although Test 2 messages require double the MPD of Test 1 messages, the Auto Scaling group processed Test 2 messages in the same amount of time as Test 1 by launching twice as many instances.

Figure 2: CloudWatch dashboard showing Auto Scaling group scaling test results (Test 1 and 2).

Recommended best practices for Auto Scaling groups

This section highlights a few key best practices that we recommend adopting when deploying and working with Auto Scaling groups.

Reducing cost using EC2 Spot instances

Amazon SQS helps build loosely coupled application architectures, while providing reliable asynchronous communication between the various layers/components of an application. If a worker node fails to process a message within the Amazon SQS message visibility time-out, then the message is returned to the queue and another worker node can pick up and process that message. This makes Amazon SQS-backed applications fault-tolerant by design and thus a great fit for EC2 Spot instances. EC2 spot instances are spare compute capacity in the AWS cloud that is available to you at steep discounts as compared to On-Demand prices.

Maximizing capacity using attribute-based instance selection

With the recently released attribute-based instance selection feature, you can define infrastructure requirements based on application needs such as vCPU, RAM, and processor family (e.g., x86, ARM). This removes the need to define specific instances in your Auto Scaling group configuration, and it eliminates the burden of identifying the correct instance families and sizes. In addition, newly released instance types will be automatically considered if they fit your requirements. Attribute-based instance selection lets you tap into hundreds of different EC2 instance pools, which increases the chance of getting EC2 (Spot/On-demand) instances. When using attribute-based instance selection with the capacity optimized allocation strategy, Amazon EC2 allocates instances from deeper Spot capacity pools, thereby further reducing the chance of Spot interruption.

The following sample configuration creates an Auto Scaling group with attribute-based instance selection:

AutoScalingGroupName: 'my-asg' # [REQUIRED] 
MixedInstancesPolicy:
  LaunchTemplate:
    LaunchTemplateSpecification:
      LaunchTemplateId: 'lt-0537239d9aef10a77'
    Overrides:
    - InstanceRequirements:
        VCpuCount: # [REQUIRED] 
          Min: 2
          Max: 4
        MemoryMiB: # [REQUIRED] 
          Min: 2048
  InstancesDistribution:
    SpotAllocationStrategy: 'capacity-optimized'
MinSize: 0 # [REQUIRED] 
MaxSize: 100 # [REQUIRED] 
DesiredCapacity: 4
VPCZoneIdentifier: 'subnet-e76a128a,subnet-e66a128b,subnet-e16a128c'

Conclusion

As can be seen from the test results, this approach demonstrates how an Auto Scaling group can honor a user-provided acceptable latency constraint while accomodating variations in the MPD over time. This is possible because the average MPD is monitored and regularly updated as a CloudWatch metric. In turn, this is continously used to update the target value of the group’s target tracking policy. Moreover, we have covered additional Auto Scaling group best practices suitable for this use case, including the use of Spot instances to reduce costs and attribute-based instance selection to simplify the selection of relevant instance types.

For more information on scaling options for Auto Scaling groups, visit the Amazon EC2 Auto Scaling documentation page and the SQS-based scaling guide.

How to choose between CoIP and Direct VPC routing modes on AWS Outposts rack

Post Syndicated from Sheila Busser original https://aws.amazon.com/blogs/compute/how-to-choose-between-coip-and-direct-vpc-routing-modes-on-aws-outposts-rack/

This blog post is written by Sumit Menaria, Senior Hybrid Solutions Architect AWS WWSO Core Services.

AWS Outposts Rack is a fully-managed service that extends AWS infrastructure, services, APIs, and tools to customer premises. By providing local access to AWS managed infrastructure and services, Outposts rack enables customers to build and run applications on premises using the same programming interfaces as in AWS Regions, while using local compute and storage resources for low latency, local data processing, and data residency needs.

There are various data sources on premises that you might want to connect from your Outpost. These sources can include field devices, on-premises databases, mainframes, storage arrays, or end users. Each Outpost supports a single Local Gateway (LGW) construct, which enables connectivity from your Outpost subnets to an on-premises network. Note that this post is specific to Outposts racks and a different method of local communication is used for AWS Outposts servers.

Two different options for facilitating communication between your Outpost based resources and on-premises network: Direct VPC routing and customer-owned IP pool. Both of these are mutually exclusive options, and routing works differently based on your choice of the mode. The two modes are the attributes of the LGW route table that your Outpost subnets’ VPC is associated with, which specifies the communication mode for the Outpost subnets.

Direct VPC routing mode

Direct VPC routing uses the private IP address of the instances in the VPC CIDR block to facilitate communication with your on-premises network. These addresses are advertised to your on-premises network with Border Gateway Protocol (BGP). Advertisement via BGP is only for the private IP addresses that belong to the subnets on your Outpost and have a route pointing to the LGW via the subnet’s route table. This type of routing is the default mode for Outposts Rack. In this mode, the LGW doesn’t perform Network Address Translation (NAT) for instances. Furthermore, you don’t have to assign an Elastic IP address to your Amazon Elastic Compute Cloud (Amazon EC2) instance from a (CoIP) to enable communication with your on-premises resources.

A diagram showing how an EC2 instance on an Outpost communicates with on-premises network using direct VPC routing mode

In this diagram, when the instance Y wants to communicate with an on-premises server, it traverses the LGW and can talk to the on-premises server using its source address (10.0.1.11) in the Subnet CIDR range (10.0.1.0/24) that is advertised over BGP from the LGW to the Customer Network Device. Similarly when the on-premises server wants to initiate communication with the Outpost based EC2 instance, it uses the instance’s private IP address (10.0.1.11) as the destination IP address to set up the connection.

CoIP mode

Utilizing CoIP mode means that you must provide a separate IP address range from your on-premises IP space for AWS to create an address pool, known as a CoIP. With CoIP, when an Outpost based resources, such as EC2 instances, Application Load Balancer (ALB), or Amazon Relational Database Service (Amazon RDS) instances, need to communicate to your on-premises network, the Local Gateway will perform 1:1 NAT from the resource’s private IP address from the Outpost subnet range to an IP address from the CoIP pool. The subnet-to-CoIP address mapping is done by assigning an Elastic IP (EIP) from the CoIP address range allocated for resources such as EC2 instances. To enable the communication with the CoIP pool from the on-premises network, and then the LGW advertises the CoIP pool through BGP over its peering with the Customer Network Device.

A diagram showing how an EC2 instance on an Outpost communicates with on-premises network using CoIP mode

In this diagram, when the instance Y wants to talk to an on-premises server, the traffic traverses the LGW and the source IP address (10.0.1.11) of the instance gets translated to an IP address (192.168.0.11) in the CoIP range that is associated with the instance. Similarly, when the on-premises server initiates the communication, the request will be sent with the CoIP address (192.168.0.11) of the instance as the destination IP address. This will be changed to the instance’s private IP address (10.0.1.11) via NAT at the LGW. The CoIP pool (192.168.0.0/26) is advertised via BGP to the Customer Network Device to provide the route to the on-premises environment for reaching the Outpost based resources.

When to choose CoIP routing mode

CoIP is particularly useful when you want to isolate your Outpost based workloads from the on-premises infrastructure and only need specific resources on the Outpost to be able to communicate to the on-premises infrastructure. This is useful in situations where large enterprise networks have hundreds of IP pools allocated and there is a high chance of overlap between IP addresses allocated to Outpost based VPCs/Subnets and those allocated to on-premises infrastructure. Furthermore, CoIP can act as another layer of security, as you may choose to allocate the CoIP addresses to only the resources which must communicate with the on-premises network. Then you can allocate for the rest of them using the subnet private IP address range for communication within the Outpost or Region based resources.

This means that you don’t need to have the number of IPs in the CoIP pool be equal to the number of resources on your Outpost. For example, you may choose to configure a /26 CoIP range and a /22 pool for subnets to meet your workload requirements.

CoIP mode can also be useful when using an external ALB on Outpost and you want to make it routable through the local internet connectivity. By using a smaller internet routable CoIP address range assignment for your external ALB, you can route traffic to the ALB on the Outpost without needing to traverse through the internet gateway (IGW) in the parent Region.

When to choose Direct VPC routing mode

You can choose Direct VPC routing if you don’t want the operational overhead of managing the additional IP pools for NAT between your Outpost based resources and on-premises network. There are also few applications which may not work well if there is an NAT of IPs between the two endpoints communicating with each other. Some examples you may see are Active Directory communication with on-premises based servers, or iSCSI mount of your instances as an additional storage to on-premises Storage Area Network (SAN). These applications may not work or may need additional tuning if they encounter NATed IP addresses between an Outpost based client on an EC2 instance and on-premises based server for a two-way communication.

When Direct VPC routing mode is used, multiple VPCs can be associated to an Outpost LGW route table, and the Outpost subnets with the LGW as the route target, are automatically advertised to the on-premises network through BGP. Therefore, you must make sure that appropriate IP planning is in place to avoid any overlap of the Outpost VPC/Subnet IP range with the on-premises IP range, as they are directly advertised from LGW toward the Customer Network Device. Having overlapping IP subnets in your network can lead to undesired effects on your application connectivity and you must pay special attention when allocating IP pools for your on-premises and Outpost based VPC address space. You can use Amazon VPC IP Address Manager (IPAM) to plan the IP space of your VPCs and CoIP pools, as well as add on-premises based IP Pools using manual allocation.

Conclusion

You can select either Direct VPC routing or CoIP mode for routing through an Outpost Local Gateway. Since this selection affects the routing for all of the subnets on your Outpost associated with the LGW route table, it should be selected based on your workload requirements and existing IP infrastructure planning. You can also change the LGW route table mode at a later stage. However, that involves network disruption and the creation of a new LGW route table. To learn more about Outposts Racks routing, visit the LGW Route table documentation.

Using GitHub Actions with Amazon CodeCatalyst

Post Syndicated from Dr. Rahul Sharad Gaikwad original https://aws.amazon.com/blogs/devops/using-github-actions-with-amazon-codecatalyst/

An Amazon CodeCatalyst workflow is an automated procedure that describes how to build, test, and deploy your code as part of a continuous integration and continuous delivery (CI/CD) system. You can use GitHub Actions alongside native CodeCatalyst actions in a CodeCatalyst workflow.

Introduction:

In a prior post in this series, Using Workflows to Build, Test, and Deploy with Amazon CodeCatalyst, I discussed creating CI/CD pipelines in CodeCatalyst and how that relates to The Unicorn Project’s main protagonist, Maxine. CodeCatalyst workflows help you reliably deliver high-quality application updates frequently, quickly, and securely. CodeCatalyst allows you to quickly assemble and configure actions to compose workflows that automate your CI/CD pipeline, test reporting, and other manual processes. Workflows use provisioned compute, Lambda compute, custom container images, and a managed build infrastructure to scale execution easily without sacrificing flexibility. In this post, I will return to workflows and discuss running GitHub Actions alongside native CodeCatalyst actions.

Prerequisites

If you would like to follow along with this walkthrough, you will need to:

Walkthrough

As with the previous posts in the CodeCatalyst series, I am going to use the Modern Three-tier Web Application blueprint. Blueprints provide sample code and CI/CD workflows to help you get started easily across different combinations of programming languages and architectures. To follow along, you can re-use a project you created previously, or you can refer to a previous post that walks through creating a project using the Three-tier blueprint.

As the team has grown, I have noticed that code quality has decreased. Therefore, I would like to add a few additional tools to validate code quality when a new pull request is submitted. In addition, I would like to create a Software Bill of Materials (SBOM) for each pull request so I know what components are used by the code. In the previous post on workflows, I focused on the deployment workflow. In this post, I will focus on the OnPullRequest workflow. You can view the OnPullRequest pipeline by expanding CI/CD from the left navigation, and choosing Workflows. Next, choose OnPullRequest and you will be presented with the workflow shown in the following screenshot. This workflow runs when a new pull request is submitted and currently uses Amazon CodeGuru to perform an automated code review.

OnPullRequest Workflow with CodeGuru code review

Figure 1. OnPullRequest Workflow with CodeGuru code review

While CodeGuru provides intelligent recommendations to improve code quality, it does not check style. I would like to add a linter to ensure developers follow our coding standards. While CodeCatalyst supports a rich collection of native actions, this does not currently include a linter. Fortunately, CodeCatalyst also supports GitHub Actions. Let’s use a GitHub Action to add a linter to the workflow.

Select Edit in the top right corner of the Workflow screen. If the editor opens in YAML mode, switch to Visual mode using the toggle above the code. Next, select “+ Actions” to show the list of actions. Then, change from Amazon CodeCatalyst to GitHub using the dropdown. At the time this blog was published, CodeCatalyst includes about a dozen curated GitHub Actions. Note that you are not limited to the list of curated actions. I’ll show you how to add GitHub Actions that are not on the list later in this post. For now, I am going to use Super-Linter to check coding style in pull requests. Find Super-Linter in the curated list and click the plus icon to add it to the workflow.

Super-Linter action with add icon

Figure 2. Super-Linter action with add icon

This will add a new action to the workflow and open the configuration dialog box. There is no further configuration needed, so you can simply close the configuration dialog box. The workflow should now look like this.

Workflow with the new Super-Linter action

Figure 3. Workflow with the new Super-Linter action

Notice that the actions are configured to run in parallel. In the previous post, when I discussed the deployment workflow, the steps were sequential. This made sense since each step built on the previous step. For the pull request workflow, the actions are independent, and I will allow them to run in parallel so they complete faster. I select Validate, and assuming there are no issues, I select Commit to save my changes to the repository.

While CodeCatalyst will start the workflow when a pull request is submitted, I do not have a pull request to submit. Therefore, I select Run to test the workflow. A notification at the top of the screen includes a link to view the run. As expected, Super Linter fails because it has found issues in the application code. I click on the Super Linter action and review the logs. Here are few issues that Super Linter reported regarding app.py used by the backend application. Note that the log has been modified slightly to fit on a single line.

/app.py:2:1: F401 'os' imported but unused
/app.py:2:1: F401 'time' imported but unused
/app.py:2:1: F401 'json' imported but unused
/app.py:2:10: E401 multiple imports on one line
/app.py:4:1: F401 'boto3' imported but unused
/app.py:6:9: E225 missing whitespace around operator
/app.py:8:1: E402 module level import not at top of file
/app.py:10:1: E402 module level import not at top of file
/app.py:15:35: W291 trailing whitespace
/app.py:16:5: E128 continuation line under-indented for visual indent
/app.py:17:5: E128 continuation line under-indented for visual indent
/app.py:25:5: E128 continuation line under-indented for visual indent
/app.py:26:5: E128 continuation line under-indented for visual indent
/app.py:33:12: W292 no newline at end of file

With Super-Linter working, I turn my attention to creating a Software Bill of Materials
(SBOM). I am going to use OWASP CycloneDX to create the SBOM. While there is a GitHub Action for CycloneDX, at the time I am writing this post, it is not available from the list of curated GitHub Actions in CodeCatalyst. Fortunately, CodeCatalyst is not limited to the curated list. I can use most any GitHub Action in CodeCatalyst. To add a GitHub Action that is not in the curated list, I return to edit mode, find GitHub Actions in the list of curated actions, and click the plus icon to add it to the workflow.

Figure 4. GitHub Action with add icon

Figure 4. GitHub Action with add icon

CodeCatalyst will add a new action to the workflow and open the configuration dialog box. I choose the Configuration tab and use the pencil icon to change the Action Name to Software-Bill-of-Materials. Then, I scroll down to the configuration section, and change the GitHub Action YAML. Note that you can copy the YAML from the GitHub Actions Marketplace, including the latest version number. In addition, the CycloneDX action expects you to pass the path to the Python requirements file as an input parameter.

GitHub Action YAML configuration

Figure 5. GitHub Action YAML configuration

Since I am using the generic GitHub Action, I must tell CodeCatalyst which artifacts are produced by the action and should be collected after execution. CycloneDX creates an XML file called bom.xml which I configure as an artifact. Note that a CodeCatalyst artifact is the output of a workflow action, and typically consists of a folder or archive of files. You can share artifacts with subsequent actions.

Artifact configuration with the path to bom.xml

Figure 6. Artifact configuration with the path to bom.xml

Once again, I select Validate, and assuming there are no issues, I select Commit to save my changes to the repository. I now have three actions that run in parallel when a pull request is submitted: CodeGuru, Super-Linter, and Software Bill of Materials.

Figure 7. Workflow including the software bill of materials

Figure 7. Workflow including the software bill of materials

As before, I select Run to test my workflow and click the view link in the notification. As expected, the workflow fails because Super-Linter is still reporting issues. However, the new Software Bill of Materials has completed successfully. From the artifacts tab I can download the SBOM.

Figure 8. Artifacts tab listing code review and SBOM

Figure 8. Artifacts tab listing code review and SBOM

The artifact is a zip archive that includes the bom.xml created by CycloneDX. This includes, among other information, a list of components used in the backend application.

    <components>
        <component type="library" bom-ref="7474f0f6-8aa2-46db-bebf-a7648cff84e1">
            <name>Jinja2</name>
            <version>3.1.2</version>
            <purl>pkg:pypi/[email protected]</purl>
        </component>
        <component type="library" bom-ref="fad0708b-d007-4f98-a80c-056b136015df">
            <name>aws-cdk-lib</name>
            <version>2.43.0</version>
            <purl>pkg:pypi/[email protected]</purl>
        </component>
        <component type="library" bom-ref="23e3aaae-b4e1-4f3b-b026-fcd298c9cb9b">
            <name>aws-cdk.aws-apigatewayv2-alpha</name>
            <version>2.43.0a0</version>
            <purl>pkg:pypi/[email protected]</purl>
        </component>
        <component type="library" bom-ref="d283cf17-9125-422c-b55c-cabb64d18f79">
            <name>aws-cdk.aws-apigatewayv2-integrations-alpha</name>
            <version>2.43.0a0</version>
            <purl>pkg:pypi/[email protected]</purl>
        </component>
        <component type="library" bom-ref="0f095c84-c9e9-4d6c-a4ed-c4a6c7605426">
            <name>aws-cdk.aws-lambda-python-alpha</name>
            <version>2.43.0a0</version>
            <purl>pkg:pypi/[email protected]</purl>
        </component>
        <component type="library" bom-ref="b248b85b-ba27-4796-bcdf-6bd82ad47295">
            <name>constructs</name>
            <version>&gt;=10.0.0,&lt;11.0.0</version>
            <purl>pkg:pypi/constructs@%3E%3D10.0.0%2C%3C11.0.0</purl>
        </component>
        <component type="library" bom-ref="72b1da33-19c2-4b5c-bd58-7f719dafc28a">
            <name>simplejson</name>
            <version>3.17.6</version>
            <purl>pkg:pypi/[email protected]</purl>
        </component>
    </components>

The workflow is now enforcing code quality and generating a SBOM like I wanted. Note that while this is a great start, there is still room for improvement. First, I could collect reports generated by the actions in my workflow, and define success criteria for code quality. Second, I could scan the SBOM for known security vulnerabilities using a Software Composition Analysis (SCA) solution. I will be covering this in a future post in this series.

Cleanup

If you have been following along with this workflow, you should delete the resources you deployed so you do not continue to incur charges. First, delete the two stacks that CDK deployed using the AWS CloudFormation console in the AWS account you associated when you launched the blueprint. These stacks will have names like mysfitsXXXXXWebStack and mysfitsXXXXXAppStack. Second, delete the project from CodeCatalyst by navigating to Project settings and choosing Delete project.

Conclusion

In this post, you learned how to add GitHub Actions to a CodeCatalyst workflow. I used GitHub Actions alongside native CodeCatalyst actions in my workflow. I also discussed adding actions from both the curated list of actions and others not in the curated list. Read the documentation to learn more about using GitHub Actions in CodeCatalyst.

About the authors:

Dr. Rahul Gaikwad

Dr. Rahul is a DevOps Lead Consultant at AWS. He helps customers to migrate and modernize workloads to AWS Cloud with a special focus on DevOps and IaC. He is passionate about building innovative solutions using technology and enjoys collaborating with customers and peers. He contributes to open-source community projects. Outside of work, Rahul has completed Ph.D. in AIOps and he enjoys travelling and spending time with his family.

Anirudh Sharma

Anirudh is a Cloud Support Engineer 2 with an extensive background in DevOps offerings at AWS, he is also a Subject Matter Expert in AWS ElasticBeanstalk and AWS CodeDeploy services. He loves helping customers and learning new services and technologies. He also loves travelling and has a goal to visit Japan someday, is a Golden State Warriors fan and loves spending time with his family.

Navdeep Pareek

Navdeep is Lead Migration Consultant at AWS. He helps customer to migrate and modernize customer workloads to AWS Cloud and have specialisation in automation, DevOps. In his spare time, he enjoys travelling, cooking and spending time with family and friends.

Define a custom session duration and terminate active sessions in IAM Identity Center

Post Syndicated from Ron Cully original https://aws.amazon.com/blogs/security/define-a-custom-session-duration-and-terminate-active-sessions-in-iam-identity-center/

Managing access to accounts and applications requires a balance between delivering simple, convenient access and managing the risks associated with active user sessions. Based on your organization’s needs, you might want to make it simple for end users to sign in and to operate long enough to get their work done, without the disruptions associated with requiring re-authentication. You might also consider shortening the session to help meet your compliance or security requirements. At the same time, you might want to terminate active sessions that your users don’t need, such as sessions for former employees, sessions for which the user failed to sign out on a second device, or sessions with suspicious activity.

With AWS IAM Identity Center (successor to AWS Single Sign-On), you now have the option to configure the appropriate session duration for your organization’s needs while using new session management capabilities to look up active user sessions and revoke unwanted sessions.

In this blog post, I show you how to use these new features in IAM Identity Center. First, I walk you through how to configure the session duration for your IAM Identity Center users. Then I show you how to identify existing active sessions and terminate them.

What is IAM Identity Center?

IAM Identity Center helps you securely create or connect your workforce identities and manage their access centrally across AWS accounts and applications. IAM Identity Center is the recommended approach for workforce identities to access AWS resources. In IAM Identity Center, you can integrate with an external identity provider (IdP), such as Okta Universal Directory, Microsoft Azure Active Directory, or Microsoft Active Directory Domain Services, as an identity source or you can create users directly in IAM Identity Center. The service is built on the capabilities of AWS Identity and Access Management (IAM) and is offered at no additional cost.

IAM Identity Center sign-in and sessions

You can use IAM Identity Center to access applications and accounts and to get credentials for the AWS Management Console, AWS Command Line Interface (AWS CLI), and AWS SDK sessions. When you log in to IAM Identity Center through a browser or the AWS CLI, an AWS access portal session is created. When you federate into the console, IAM Identity Center uses the session duration setting on the permission set to control the duration of the session.

Note: The access portal session duration for IAM Identity Center differs from the IAM permission set session duration, which defines how long a user can access their account through the IAM Identity Center console.

Before the release of the new session management feature, the AWS access portal session duration was fixed at 8 hours. Now you can configure the session duration for the AWS access portal in IAM Identity Center from 15 minutes to 7 days. The access portal session duration determines how long the user can access the portal, applications, and accounts, and run CLI commands without re-authenticating. If you have an external IdP connected to IAM Identity Center, the access portal session duration will be the lesser of either the session duration that you set in your IdP or the session duration defined in IAM Identity Center. Users can access accounts and applications until the access portal session expires and initiates re-authentication.

When users access accounts or applications through IAM Identity Center, it creates an additional session that is separate but related to the AWS access portal session. AWS CLI sessions use the AWS access portal session to access roles. The duration of console sessions is defined as part of the permission set that the user accessed. When a console session starts, it continues until the duration expires or the user ends the session. IAM Identity Center-enabled application sessions re-verify the AWS access portal session approximately every 60 minutes. These sessions continue until the AWS access portal session terminates, until another application-specific condition terminates the session, or until the user terminates the session.

To summarize:

  • After a user signs in to IAM Identity Center, they can access their assigned roles and applications for a fixed period, after which they must re-authenticate.
  • If a user accesses an assigned permission set, the user has access to the corresponding role for the duration defined in the permission set (or by the user terminating the session).
  • The AWS CLI uses the AWS access portal session to access roles. The AWS CLI refreshes the IAM permission set in the background. The CLI job continues to run until the access portal session expires.
  • If users access an IAM Identity Center-enabled application, the user can retain access to an application for up to an hour after the access portal session has expired.

Note: IAM Identity Center doesn’t currently support session management capabilities for Active Directory identity sources.

For more information about session management features, see Authentication sessions in the documentation.

Configure session duration

In this section, I show you how to configure the session duration for the AWS access portal in IAM Identity Center. You can choose a session duration between 15 minutes and 7 days.

Session duration is a global setting in IAM Identity Center. After you set the session duration, the maximum session duration applies to IAM Identity Center users.

To configure session duration for the AWS access portal:

  1. Open the IAM Identity Center console.
  2. In the left navigation pane, choose Settings.
  3. On the Settings page, choose the Authentication tab.
  4. Under Authentication, next to Session settings, choose Configure.
  5. For Configure session settings, choose a maximum session duration from the list of pre-defined session durations in the dropdown. To set a custom session duration, select Custom duration, enter the length for the session in minutes, and then choose Save.
Figure 1: Set access portal session duration

Figure 1: Set access portal session duration

Congratulations! You have just modified the session duration for your users. This new duration will take effect on each user’s next sign-in.

Find and terminate AWS access portal sessions

With this new release, you can find active portal sessions for your IAM Identity Center users, and if needed, you can terminate the sessions. This can be useful in situations such as the following:

  • A user no longer works for your organization or was removed from projects that gave them access to applications or permission sets that they should no longer use.
  • If a device is lost or stolen, the user can contact you to end the session. This reduces the risk that someone will access the device and use the open session.

In these cases, you can find a user’s active sessions in the AWS access portal, select the session that you’re interested in, and terminate it. Depending on the situation, you might also want to deactivate sign-in for the user from the system before revoking the user’s session. You can deactivate sign-in for users in the IAM Identity Center console or in your third-party IdP.

If you first deactivate the user’s sign-in in your IdP, and then deactivate the user’s sign-in in IAM Identity Center, deactivation will take effect in IAM Identity Center without synchronization latency. However, if you deactivate the user in IAM Identity Center first, then it is possible that the IdP could activate the user again. By first deactivating the user’s sign-in in your IdP, you can prevent the user from signing in again when you revoke their session. This action is advisable when a user has left your organization and should no longer have access, or if you suspect a valid user’s credentials were stolen and you want to block access until you reset the user’s passwords.

Termination of the access portal session does not affect the active permission set session started from the access portal. IAM role session duration when assumed from the access portal will last as long as the duration specified in the permission set. For AWS CLI sessions, it can take up to an hour for the CLI to terminate after the access portal session is terminated.

Tip: Activate multi-factor authentication (MFA) wherever possible. MFA offers an additional layer of protection to help prevent unauthorized individuals from gaining access to systems or data.

To manage active access portal sessions in the AWS access portal:

  1. Open the IAM Identity Center console.
  2. In the left navigation pane, choose Users.
  3. On the Users page, choose the username of the user whose sessions you want to manage. This takes you to a page with the user’s information.
  4. On the user’s page, choose the Active sessions tab. The number in parentheses next to Active sessions indicates the number of current active sessions for this user.
    Figure 2: View active access portal sessions

    Figure 2: View active access portal sessions

  5. Select the sessions that you want to delete, and then choose Delete session. A dialog box appears that confirms you’re deleting active sessions for this user.
    Figure 3: Delete selected active sessions

    Figure 3: Delete selected active sessions

  6. Review the information in the dialog box, and if you want to continue, choose Delete session.

Conclusion

In this blog post, you learned how IAM Identity Center manages sessions, how to modify the session duration for the AWS access portal, and how to view, search, and terminate active access portal sessions. I also shared some tips on how to think about the appropriate session duration for your use case and related steps that you should take when terminating sessions for users who shouldn’t have permission to sign in again after their session has ended.

With this new feature, you now have more control over user session management. You can use the console to set configurable session lengths based on your organization’s security requirements and desired end-user experience, and you can also terminate sessions, enabling you to manage sessions that are no longer needed or potentially suspicious.

To learn more, see Manage IAM Identity Center integrated application sessions.

 
If you have feedback about this post, submit comments in the Comments section below. If you have questions about this post, contact AWS Support.

Want more AWS Security news? Follow us on Twitter.

Ron Cully

Ron is a Principal Product Manager at AWS where he has led feature and roadmap planning for workforce identity products for over 6 years. He has over 25 years of experience leading networking and directory related product delivery. Ron is passionate about delivering solutions to help make it easier for you to migrate identity-aware workloads, simplify resource and application authorization, and give people a simple sign-in and access experience in the cloud.

Palak Arora

Palak Arora

Palak is a Senior Product Manager at AWS Identity. She has over eight years of cyber security experience with specialization in Identity and Access Management (IAM) domain. She has helped various customers across different sectors to define their enterprise and customer IAM roadmap and strategy, and improve the overall technology risk landscape.

New – Deployment Pipelines Reference Architecture and Reference Implementations

Post Syndicated from Sébastien Stormacq original https://aws.amazon.com/blogs/aws/new_deployment_pipelines_reference_architecture_and_-reference_implementations/

Today, we are launching a new reference architecture and a set of reference implementations for enterprise-grade deployment pipelines. A deployment pipeline automates the building, testing, and deploying of applications or infrastructures into your AWS environments. When you deploy your workloads to the cloud, having deployment pipelines is key to gaining agility and lowering time to market.

When I talk with you at conferences or on social media, I frequently hear that our documentation and tutorials are good resources to get started with a new service or a new concept. However, when you want to scale your usage or when you have complex or enterprise-grade use cases, you often lack resources to dive deeper.

This is why we have created over the years hundreds of reference architectures based on real-life use cases and also the security reference architecture. Today, we are adding a new reference architecture to this collection.

We used the best practices and lessons learned at Amazon and with hundreds of customer projects to create this deployment pipeline reference architecture and implementations. They go well beyond the typical “Hello World” example: They document how to architect and how to implement complex deployment pipelines with multiple environments, multiple AWS accounts, multiple Regions, manual approval, automated testing, automated code analysis, etc. When you want to increase the speed at which you deliver software to your customers through DevOps and continuous delivery, this new reference architecture shows you how to combine AWS services to work together. They document the mandatory and optional components of the architecture.

Having an architecture document and diagram is great, but having an implementation is even better. Each pipeline type in the reference architecture has at least one reference implementation. One of the reference implementations uses an AWS Cloud Development Kit (AWS CDK) application to deploy the reference architecture on your accounts. It is a good starting point to study or customize the reference architecture to fit your specific requirements.

You will find this reference architecture and its implementations at https://pipelines.devops.aws.dev.

Deployment pipeline reference architecture

Let’s Deploy a Reference Implementation
The new deployment pipeline reference architecture demonstrates how to build a pipeline to deploy a Java containerized application and a database. It comes with two reference implementations. We are working on additional pipeline types to deploy Amazon EC2 AMIs, manage a fleet of accounts, and manage dynamic configuration for your applications.

The sample application is developed with SpringBoot. It runs on top of Corretto, the Amazon-provided distribution of the OpenJDK. The application is packaged with the CDK and is deployed on AWS Fargate. But the application is not important here; you can substitute your own application. The important parts are the infrastructure components and the pipeline to deploy an application. For this pipeline type, we provide two reference implementations. One deploys the application using Amazon CodeCatalyst, the new service that we announced at re:Invent 2022, and one uses AWS CodePipeline. This is the one I choose to deploy for this blog post.

The pipeline starts building the applications with AWS CodeBuild. It runs the unit tests and also runs Amazon CodeGuru to review code quality and security. Finally, it runs Trivy to detect additional security concerns, such as known vulnerabilities in the application dependencies. When the build is successful, the pipeline deploys the application in three environments: beta, gamma, and production. It deploys the application in the beta environment in a single Region. The pipeline runs end-to-end tests in the beta environment. All the tests must succeed before the deployment continues to the gamma environment. The gamma environment uses two Regions to host the application. After deployment in the gamma environment, the deployment into production is subject to manual approval. Finally, the pipeline deploys the application in the production environment in six Regions, with three waves of deployments made of two Regions each.

Deployment Pipelines Reference Architecture

I need four AWS accounts to deploy this reference implementation: one to deploy the pipeline and tooling and one for each environment (beta, gamma, and production). At a high level, there are two deployment steps: first, I bootstrap the CDK for all four accounts, and then I create the pipeline itself in the toolchain account. You must plan for 2-3 hours of your time to prepare your accounts, create the pipeline, and go through a first deployment.

Once the pipeline is created, it builds, tests, and deploys the sample application from its source in AWS CodeCommit. You can commit and push changes to the application source code and see it going through the pipeline steps again.

My colleague Irshad Buch helped me try the pipeline on my account. He wrote a detailed README with step-by-step instructions to let you do the same on your side. The reference architecture that describes this implementation in detail is available on this new web page. The application source code, the AWS CDK scripts to deploy the application, and the AWS CDK scripts to create the pipeline itself are all available on AWS’s GitHub. Feel free to contribute, report issues or suggest improvements.

Available Now
The deployment pipeline reference architecture and its reference implementations are available today, free of charge. If you decide to deploy a reference implementation, we will charge you for the resources it creates on your accounts. You can use the provided AWS CDK code and the detailed instructions to deploy this pipeline on your AWS accounts. Try them today!

— seb

Reduce risk by implementing HttpOnly cookie authentication in Amazon API Gateway

Post Syndicated from Marc Borntraeger original https://aws.amazon.com/blogs/security/reduce-risk-by-implementing-httponly-cookie-authentication-in-amazon-api-gateway/

Some web applications need to protect their authentication tokens or session IDs from cross-site scripting (XSS). It’s an Open Web Application Security Project (OWASP) best practice for session management to store secrets in the browsers’ cookie store with the HttpOnly attribute enabled. When cookies have the HttpOnly attribute set, the browser will prevent client-side JavaScript code from accessing the value. This reduces the risk of secrets being compromised.

In this blog post, you’ll learn how to store access tokens and authenticate with HttpOnly cookies in your own workloads when using Amazon API Gateway as the client-facing endpoint. The tutorial in this post will show you a solution to store OAuth2 access tokens in the browser cookie store, and verify user authentication through Amazon API Gateway. This post describes how to use Amazon Cognito to issue OAuth2 access tokens, but the solution is not limited to OAuth2. You can use other kinds of tokens or session IDs.

The solution consists of two decoupled parts:

  1. OAuth2 flow
  2. Authentication check

Note: This tutorial takes you through detailed step-by-step instructions to deploy an example solution. If you prefer to deploy the solution with a script, see the api-gw-http-only-cookie-auth GitHub repository.

Prerequisites

No costs should incur when you deploy the application from this tutorial because the services you’re going to use are included in the AWS Free Tier. However, be aware that small charges may apply if you have other workloads running in your AWS account and exceed the free tier. Make sure to clean up your resources from this tutorial after deployment.

Solution architecture

This solution uses Amazon Cognito, Amazon API Gateway, and AWS Lambda to build a solution that persists OAuth2 access tokens in the browser cookie store. Figure 1 illustrates the solution architecture for the OAuth2 flow.

Figure 1: OAuth2 flow solution architecture

Figure 1: OAuth2 flow solution architecture

  1. A user authenticates by using Amazon Cognito.
  2. Amazon Cognito has an OAuth2 redirect URI pointing to your API Gateway endpoint and invokes the integrated Lambda function oAuth2Callback.
  3. The oAuth2Callback Lambda function makes a request to the Amazon Cognito token endpoint with the OAuth2 authorization code to get the access token.
  4. The Lambda function returns a response with the Set-Cookie header, instructing the web browser to persist the access token as an HttpOnly cookie. The browser will automatically interpret the Set-Cookie header, because it’s a web standard. HttpOnly cookies can’t be accessed through JavaScript—they can only be set through the Set-Cookie header.

After the OAuth2 flow, you are set up to issue and store access tokens. Next, you need to verify that users are authenticated before they are allowed to access your protected backend. Figure 2 illustrates how the authentication check is handled.

Figure 2: Authentication check solution architecture

Figure 2: Authentication check solution architecture

  1. A user requests a protected backend resource. The browser automatically attaches HttpOnly cookies to every request, as defined in the web standard.
  2. The Lambda function oAuth2Authorizer acts as the Lambda authorizer for HTTP APIs. It validates whether requests are authenticated. If requests include the proper access token in the request cookie header, then it allows the request.
  3. API Gateway only passes through requests that are authenticated.

Amazon Cognito is not involved in the authentication check, because the Lambda function can validate the OAuth2 access tokens by using a JSON Web Token (JWT) validation check.

1. Deploying the OAuth2 flow

In this section, you’ll deploy the first part of the solution, which is the OAuth2 flow. The OAuth2 flow is responsible for issuing and persisting OAuth2 access tokens in the browser’s cookie store.

1.1. Create a mock protected backend

As shown in in Figure 2, you need to protect a backend. For the purposes of this post, you create a mock backend by creating a simple Lambda function with a default response.

To create the Lambda function

  1. In the Lambda console, choose Create function.

    Note: Make sure to select your desired AWS Region.

  2. Choose Author from scratch as the option to create the function.
  3. In the Basic information section as shown in , enter or select the following values:
  4. Choose Create function.
    Figure 3: Configuring the getProtectedResource Lambda function

    Figure 3: Configuring the getProtectedResource Lambda function

The default Lambda function code returns a simple Hello from Lambda message, which is sufficient to demonstrate the concept of this solution.

1.2. Create an HTTP API in Amazon API Gateway

Next, you create an HTTP API by using API Gateway. Either an HTTP API or a REST API will work. In this example, choose HTTP API because it’s offered at a lower price point (for this tutorial you will stay within the free tier).

To create the API Gateway API

  1. In the API Gateway console, under HTTP API, choose Build.
  2. On the Create and configure integrations page, as shown in Figure 4, choose Add integration, then enter or select the following values:
    • Select Lambda.
    • For Lambda function, select the getProtectedResource Lambda function that you created in the previous section.
    • For API name, enter a name. In this example, I used MyApp.
    • Choose Next.
    Figure 4: Configuring API Gateway integrations and API name

    Figure 4: Configuring API Gateway integrations and API name

  3. On the Configure routes page, as shown in Figure 5, enter or select the following values:
    • For Method, select GET.
    • For Resource path, enter / (a single forward slash).
    • For Integration target, select the getProtectedResource Lambda function.
    • Choose Next.
    Figure 5: Configuring API Gateway routes

    Figure 5: Configuring API Gateway routes

  4. On the Configure stages page, keep all the default options, and choose Next.
  5. On the Review and create page, choose Create.
  6. Note down the value of Invoke URL, as shown in Figure 6.
    Figure 6: Note down the invoke URL

    Figure 6: Note down the invoke URL

Now it’s time to test your API Gateway API. Paste the value of Invoke URL into your browser. You’ll see the following message from your Lambda function: Hello from Lambda.

1.3. Use Amazon Cognito

You’ll use Amazon Cognito user pools to create and maintain a user directory, and add sign-up and sign-in to your web application.

To create an Amazon Cognito user pool

  1. In the Amazon Cognito console, choose Create user pool.
  2. On the Authentication providers page, as shown in Figure 7, for Cognito user pool sign-in options, select Email, then choose Next.
    Figure 7: Configuring authentication providers

    Figure 7: Configuring authentication providers

  3. In the Multi-factor authentication pane of the Configure Security requirements page, as shown in Figure 8, choose your MFA enforcement. For this example, choose No MFA to make it simpler for you to test your solution. However, in production for data sensitive workloads you should choose Require MFA – Recommended. Choose Next.
    Figure 8: Configuring MFA

    Figure 8: Configuring MFA

  4. On the Configure sign-up experience page, keep all the default options and choose Next.
  5. On the Configure message delivery page, as shown in Figure 9, choose your email provider. For this example, choose Send email with Cognito to make it simple to test your solution. In production workloads, you should choose Send email with Amazon SES – Recommended. Choose Next.
    Figure 9: Configuring email

    Figure 9: Configuring email

  6. In the User pool name section of the Integrate your app page, as shown in Figure 10, enter or select the following values:
    1. For User pool name, enter a name. In this example, I used MyUserPool.
      Figure 10: Configuring user pool name

      Figure 10: Configuring user pool name

    2. In the Hosted authentication pages section, as shown in Figure 11, select Use the Cognito Hosted UI.
      Figure 11: Configuring hosted authentication pages

      Figure 11: Configuring hosted authentication pages

    3. In the Domain section, as shown in Figure 12, for Domain type, choose Use a Cognito domain. For Cognito domain, enter a domain name. Note that domains in Cognito must be unique. Make sure to enter a unique name, for example by appending random numbers at the end of your domain name. For this example, I used https://http-only-cookie-secured-app.
      Figure 12: Configuring an Amazon Cognito domain

      Figure 12: Configuring an Amazon Cognito domain

    4. In the Initial app client section, as shown in Figure 13, enter or select the following values:
      • For App type, keep the default setting Public client.
      • For App client name, enter a friendly name. In this example, I used MyAppClient.
      • For Client secret, keep the default setting Don’t generate a client secret.
      • For Allowed callback URLs, enter <API_GW_INVOKE_URL>/oauth2/callback, replacing <API_GW_INVOKE_URL> with the invoke URL you noted down from API Gateway in the previous section.
        Figure 13: Configuring the initial app client

        Figure 13: Configuring the initial app client

    5. Choose Next.
  7. Choose Create user pool.

Next, you need to retrieve some Amazon Cognito information for later use.

To note down Amazon Cognito information

  1. In the Amazon Cognito console, choose the user pool you created in the previous steps.
  2. Under User pool overview, make note of the User pool ID value.
  3. On the App integration tab, under Cognito Domain, make note of the Domain value.
  4. Under App client list, make note of the Client ID value.
  5. Under App client list, choose the app client name you created in the previous steps.
  6. Under Hosted UI, make note of the Allowed callback URLs value.

Next, create the user that you will use in a later section of this post to run your test.

To create a user

  1. In the Amazon Cognito console, choose the user pool you created in the previous steps.
  2. Under Users, choose Create user.
  3. For Email address, enter [email protected]. For this tutorial, you don’t need to send out actual emails, so the email address does not need to actually exist.
  4. Choose Mark email address as verified.
  5. For password, enter a password you can remember (or even better: use a password generator).
  6. Remember the email and password for later use.
  7. Choose Create user.

1.4. Create the Lambda function oAuth2Callback

Next, you create the Lambda function oAuth2Callback, which is responsible for issuing and persisting the OAuth2 access tokens.

To create the Lambda function oAuth2Callback

  1. In the Lambda console, choose Create function.

    Note: Make sure to select your desired Region.

  2. For Function name, enter oAuth2Callback.
  3. For Runtime, select Node.js 16.x.
  4. For Architecture, select arm64.
  5. Choose Create function.

After you create the Lambda function, you need to add the code. Create a new folder on your local machine and open it with your preferred integrated development environment (IDE). Add the package.json and index.js files, as shown in the following examples.

package.json

{
  "name": "oAuth2Callback",
  "version": "0.0.1",
  "dependencies": {
    "axios": "^0.27.2",
    "qs": "^6.11.0"
  }
}

In a terminal at the root of your created folder, run the following command.

$ npm install

In the index.js example code that follows, be sure to replace the placeholders with your values.

index.js

const qs = require("qs");
const axios = require("axios").default;
exports.handler = async function (event) {
  const code = event.queryStringParameters?.code;
  if (code == null) {
    return {
      statusCode: 400,
      body: "code query param required",
    };
  }
  const data = {
    grant_type: "authorization_code",
    client_id: "<your client ID from Cognito>",
    // The redirect has already happened, but you still need to pass the URI for validation, so a valid oAuth2 access token can be generated
    redirect_uri: encodeURI("<your callback URL from Cognito>"),
    code: code,
  };
  // Every Cognito instance has its own token endpoints. For more information check the documentation: https://docs.aws.amazon.com/cognito/latest/developerguide/token-endpoint.html
  const res = await axios.post(
    "<your App Client Cognito domain>/oauth2/token",
    qs.stringify(data),
    {
      headers: {
        "Content-Type": "application/x-www-form-urlencoded",
      },
    }
  );
  return {
    statusCode: 302,
    // These headers are returned as part of the response to the browser.
    headers: {
      // The Location header tells the browser it should redirect to the root of the URL
      Location: "/",
      // The Set-Cookie header tells the browser to persist the access token in the cookie store
      "Set-Cookie": `accessToken=${res.data.access_token}; Secure; HttpOnly; SameSite=Lax; Path=/`,
    },
  };
};

Along with the HttpOnly attribute, you pass along two additional cookie attributes:

  • Secure – Indicates that cookies are only sent by the browser to the server when a request is made with the https: scheme.
  • SameSite – Controls whether or not a cookie is sent with cross-site requests, providing protection against cross-site request forgery attacks. You set the value to Lax because you want the cookie to be set when the user is forwarded from Amazon Cognito to your web application (which runs under a different URL).

For more information, see Using HTTP cookies on the MDN Web Docs site.

Afterwards, upload the code to the oAuth2Callback Lambda function as described in Upload a Lambda Function in the AWS Toolkit for VS Code User Guide.

1.5. Configure an OAuth2 callback route in API Gateway

Now, you configure API Gateway to use your new Lambda function through a Lambda proxy integration.

To configure API Gateway to use your Lambda function

  1. In the API Gateway console, under APIs, choose your API name. For me, the name is MyApp.
  2. Under Develop, choose Routes.
  3. Choose Create.
  4. Enter or select the following values:
    • For method, select GET.
    • For path, enter /oauth2/callback.
  5. Choose Create.
  6. Choose GET under /oauth2/callback, and then choose Attach integration.
  7. Choose Create and attach an integration.
    • For Integration type, choose Lambda function.
    • For Lambda function, choose oAuth2Callback from the last step.
  8. Choose Create.

Your route configuration in API Gateway should now look like Figure 14.

Figure 14: Routes for API Gateway

Figure 14: Routes for API Gateway

2. Testing the OAuth2 flow

Now that you have the components in place, you can test your OAuth2 flow. You test the OAuth2 flow by invoking the login on your browser.

To test the OAuth2 flow

  1. In the Amazon Cognito console, choose your user pool name. For me, the name is MyUserPool.
  2. Under the navigation tabs, choose App integration.
  3. Under App client list, choose your app client name. For me, the name is MyAppClient.
  4. Choose View Hosted UI.
  5. In the newly opened browser tab, open your developer tools, so you can inspect the network requests.
  6. Log in with the email address and password you set in the previous section. Change your password, if you’re asked to do so. You can also choose the same password as you set in the previous section.
  7. You should see your Hello from Lambda message.

To test that the cookie was accurately set

  1. Check your browser network tab in the browser developer settings. You’ll see the /oauth2/callback request, as shown in Figure 15.
    Figure 15: Callback network request

    Figure 15: Callback network request

    The response headers should include a set-cookie header, as you specified in your Lambda function. With the set-cookie header, your OAuth2 access token is set as an HttpOnly cookie in the browser, and access is prohibited from any client-side code.

  2. Alternatively, you can inspect the cookie in the browser cookie storage, as shown in Figure 16.

  3. If you want to retry the authentication, navigate in your browser to your Amazon Cognito domain that you chose in the previous section and clear all site data in the browser developer tools. Do the same with your API Gateway invoke URL. Now you can restart the test with a clean state.

3. Deploying the authentication check

In this section, you’ll deploy the second part of your application: the authentication check. The authentication check makes it so that only authenticated users can access your protected backend. The authentication check works with the HttpOnly cookie, which is stored in the user’s cookie store.

3.1. Create the Lambda function oAuth2Authorizer

This Lambda function checks that requests are authenticated.

To create the Lambda function

  1. In the Lambda console, choose Create function.

    Note: Make sure to select your desired Region.

  2. For Function name, enter oAuth2Authorizer.
  3. For Runtime, select Node.js 16.x.
  4. For Architecture, select arm64.
  5. Choose Create function.

After you create the Lambda function, you need to add the code. Create a new folder on your local machine and open it with your preferred IDE. Add the package.json and index.js files as shown in the following examples.

package.json

{
  "name": "oAuth2Authorizer",
  "version": "0.0.1",
  "dependencies": {
    "aws-jwt-verify": "^3.1.0"
  }
}

In a terminal at the root of your created folder, run the following command.

$ npm install

In the index.js example code, be sure to replace the placeholders with your values.

index.js

const { CognitoJwtVerifier } = require("aws-jwt-verify");
function getAccessTokenFromCookies(cookiesArray) {
  // cookieStr contains the full cookie definition string: "accessToken=abc"
  for (const cookieStr of cookiesArray) {
    const cookieArr = cookieStr.split("accessToken=");
    // After splitting you should get an array with 2 entries: ["", "abc"] - Or only 1 entry in case it was a different cookie string: ["test=test"]
    if (cookieArr[1] != null) {
      return cookieArr[1]; // Returning only the value of the access token without cookie name
    }
  }
  return null;
}
// Create the verifier outside the Lambda handler (= during cold start),
// so the cache can be reused for subsequent invocations. Then, only during the
// first invocation, will the verifier actually need to fetch the JWKS.
const verifier = CognitoJwtVerifier.create({
  userPoolId: "<your user pool ID from Cognito>",
  tokenUse: "access",
  clientId: "<your client ID from Cognito>",
});
exports.handler = async (event) => {
  if (event.cookies == null) {
    console.log("No cookies found");
    return {
      isAuthorized: false,
    };
  }
  // Cookies array looks something like this: ["accessToken=abc", "otherCookie=Random Value"]
  const accessToken = getAccessTokenFromCookies(event.cookies);
  if (accessToken == null) {
    console.log("Access token not found in cookies");
    return {
      isAuthorized: false,
    };
  }
  try {
    await verifier.verify(accessToken);
    return {
      isAuthorized: true,
    };
  } catch (e) {
    console.error(e);
    return {
      isAuthorized: false,
    };
  }
};

After you add the package.json and index.js files, upload the code to the oAuth2Authorizer Lambda function as described in Upload a Lambda Function in the AWS Toolkit for VS Code User Guide.

3.2. Configure the Lambda authorizer in API Gateway

Next, you configure your authorizer Lambda function to protect your backend. This way you control access to your HTTP API.

To configure the authorizer Lambda function

  1. In the API Gateway console, under APIs, choose your API name. For me, the name is MyApp.
  2. Under Develop, choose Routes.
  3. Under / (a single forward slash) GET, choose Attach authorization.
  4. Choose Create and attach an authorizer.
  5. Choose Lambda.
  6. Enter or select the following values:
    • For Name, enter oAuth2Authorizer.
    • For Lambda function, choose oAuth2Authorizer.
    • Clear Authorizer caching. For this tutorial, you disable authorizer caching to make testing simpler. See the section Bonus: Enabling authorizer caching for more information about enabling caching to increase performance.
    • Under Identity sources, choose Remove.

      Note: Identity sources are ignored for your Lambda authorizer. These are only used for caching.

    • Choose Create and attach.
  7. Under Develop, choose Routes to inspect all routes.

Now your API Gateway route /oauth2/callback should be configured as shown in Figure 17.

Figure 17: API Gateway route configuration

Figure 17: API Gateway route configuration

4. Testing the OAuth2 authorizer

You did it! From your last test, you should still be authenticated. So, if you open the API Gateway Invoke URL in your browser, you’ll be greeted from your protected backend.

In case you are not authenticated anymore, you’ll have to follow the steps again from the section Testing the OAuth2 flow to authenticate.

When you inspect the HTTP request that your browser makes in the developer tools as shown in Figure 18, you can see that authentication works because the HttpOnly cookie is automatically attached to every request.

Figure 18: Browser requests include HttpOnly cookies

Figure 18: Browser requests include HttpOnly cookies

To verify that your authorizer Lambda function works correctly, paste the same Invoke URL you noted previously in an incognito window. Incognito windows do not share the cookie store with your browser session, so you see a {"message":"Forbidden"} error message with HTTP response code 403 – Forbidden.

Cleanup

Delete all unwanted resources to avoid incurring costs.

To delete the Amazon Cognito domain and user pool

  1. In the Amazon Cognito console, choose your user pool name. For me, the name is MyUserPool.
  2. Under the navigation tabs, choose App integration.
  3. Under Domain, choose Actions, then choose Delete Cognito domain.
  4. Confirm by entering your custom Amazon Cognito domain, and choose Delete.
  5. Choose Delete user pool.
  6. Confirm by entering your user pool name (in my case, MyUserPool), and then choose Delete.

To delete your API Gateway resource

  1. In the API Gateway console, select your API name. For me, the name is MyApp.
  2. Under Actions, choose Delete and confirm your deletion.

To delete the AWS Lambda functions

  1. In the Lambda console, select all three of the Lambda functions you created.
  2. Under Actions, choose Delete and confirm your deletion.

Bonus: Enabling authorizer caching

As mentioned earlier, you can enable authorizer caching to help improve your performance. When caching is enabled for an authorizer, API Gateway uses the authorizer’s identity sources as the cache key. If a client specifies the same parameters in identity sources within the configured Time to Live (TTL), then API Gateway uses the cached authorizer result, rather than invoking your Lambda function.

To enable caching, your authorizer must have at least one identity source. To cache by the cookie request header, you specify $request.header.cookie as the identity source. Be aware that caching will be affected if you pass along additional HttpOnly cookies apart from the access token.

For more information, see Working with AWS Lambda authorizers for HTTP APIs in the Amazon API Gateway Developer Guide.

Conclusion

In this blog post, you learned how to implement authentication by using HttpOnly cookies. You used Amazon API Gateway and AWS Lambda to persist and validate the HttpOnly cookies, and you used Amazon Cognito to issue OAuth2 access tokens. If you want to try an automated deployment of this solution with a script, see the api-gw-http-only-cookie-auth GitHub repository.

The application of this solution to protect your secrets from potential cross-site scripting (XSS) attacks is not limited to OAuth2. You can protect other kinds of tokens, sessions, or tracking IDs with HttpOnly cookies.

In this solution, you used NodeJS for your Lambda functions to implement authentication. But HttpOnly cookies are widely supported by many programing frameworks. You can find more implementation options on the OWASP Secure Cookie Attribute page.

Although this blog post gives you a tutorial on how to implement HttpOnly cookie authentication in API Gateway, it may not meet all your security and functional requirements. Make sure to check your business requirements and talk to your stakeholders before you adopt techniques from this blog post.

Furthermore, it’s a good idea to continuously test your web application, so that cookies are only set with your approved security attributes. For more information, see the OWASP Testing for Cookies Attributes page.

 
If you have feedback about this post, submit comments in the Comments section below. If you have questions about this post, start a new thread on the Amazon API Gateway re:Post or contact AWS Support.

Want more AWS Security news? Follow us on Twitter.

Marc Borntraeger

Marc Borntraeger

Marc is a Solutions Architect in healthcare, based in Zurich, Switzerland. He helps security-sensitive customers such as hospitals to re-innovate themselves with AWS.

Deliver Operational Insights to Atlassian Opsgenie using DevOps Guru

Post Syndicated from Brendan Jenkins original https://aws.amazon.com/blogs/devops/deliver-operational-insights-to-atlassian-opsgenie-using-devops-guru/

As organizations continue to grow and scale their applications, the need for teams to be able to quickly and autonomously detect anomalous operational behaviors becomes increasingly important. Amazon DevOps Guru offers a fully managed AIOps service that enables you to improve application availability and resolve operational issues quickly. DevOps Guru helps ease this process by leveraging machine learning (ML) powered recommendations to detect operational insights, identify the exhaustion of resources, and provide suggestions to remediate issues. Many organizations running business critical applications use different tools to be notified about anomalous events in real-time for the remediation of critical issues. Atlassian is a modern team collaboration and productivity software suite that helps teams organize, discuss, and complete shared work. You can deliver these insights in near-real time to DevOps teams by integrating DevOps Guru with Atlassian Opsgenie. Opsgenie is a modern incident management platform that receives alerts from your monitoring systems and custom applications and categorizes each alert based on importance and timing.

This blog post walks you through how to integrate Amazon DevOps Guru with Atlassian Opsgenie to
receive notifications for new operational insights detected by DevOps Guru with more flexibility and customization using Amazon EventBridge and AWS Lambda. The Lambda function will be used to demonstrate how to customize insights sent to Opsgenie.

Solution overview

Figure 1: Amazon EventBridge Integration with Opsgenie using AWS Lambda

Figure 1: Amazon EventBridge Integration with Opsgenie using AWS Lambda

Amazon DevOps Guru directly integrates with Amazon EventBridge to notify you of events relating to generated insights and updates to insights. To begin routing these notifications to Opsgenie, you can configure routing rules to determine where to send notifications. As outlined below, you can also use pre-defined DevOps Guru patterns to only send notifications or trigger actions that match that pattern. You can select any of the following pre-defined patterns to filter events to trigger actions in a supported AWS resource. Here are the following predefined patterns supported by DevOps Guru:

  • DevOps Guru New Insight Open
  • DevOps Guru New Anomaly Association
  • DevOps Guru Insight Severity Upgraded
  • DevOps Guru New Recommendation Created
  • DevOps Guru Insight Closed

By default, the patterns referenced above are enabled so we will leave all patterns operational in this implementation.  However, you do have flexibility to change which of these patterns to choose to send to Opsgenie. When EventBridge receives an event, the EventBridge rule matches incoming events and sends it to a target, such as AWS Lambda, to process and send the insight to Opsgenie.

Prerequisites

The following prerequisites are required for this walkthrough:

Push Insights using Amazon EventBridge & AWS Lambda

In this tutorial, you will perform the following steps:

  1. Create an Opsgenie integration
  2. Launch the SAM template to deploy the solution
  3. Test the solution

Create an Opsgenie integration

In this step, you will navigate to Opsgenie to create the integration with DevOps Guru and to obtain the API key and team name within your account. These parameters will be used as inputs in a later section of this blog.

  1. Navigate to Teams, and take note of the team name you have as shown below, as you will need this parameter in a later section.
Figure 2: Opsgenie team names

Figure 2: Opsgenie team names

  1. Click on the team to proceed and navigate to Integrations on the left-hand pane. Click on Add Integration and select the Amazon DevOps Guru option.
Figure 3: Integration option for DevOps Guru

Figure 3: Integration option for DevOps Guru

  1. Now, scroll down and take note of the API Key for this integration and copy it to your notes as it will be needed in a later section. Click Save Integration at the bottom of the page to proceed.

­­­

 Figure 4: API Key for DevOps Guru Integration

Figure 4: API Key for DevOps Guru Integration

  1. Now, the Opsgenie integration has been created and we’ve obtained the API key and team name. The email of any team member will be used in the next section as well.

Review & launch the AWS SAM template to deploy the solution

In this step, you will review & launch the SAM template. The template will deploy an AWS Lambda function that is triggered by an Amazon EventBridge rule when Amazon DevOps Guru generates a new event. The Lambda function will retrieve the parameters obtained from the deployment and pushes the events to Opsgenie via an API.

Reviewing the template

Below is the SAM template that will be deployed in the next step. This template launches a few key components specified earlier in the blog. The Transform section of the template allows us takes an entire template written in the AWS Serverless Application Model (AWS SAM) syntax and transforms and expands it into a compliant CloudFormation template. Under the Resources section this solution will deploy an AWS Lamba function using the Java runtime as well as an Amazon EventBridge Rule/Pattern. Another key aspect of the template are the Parameters. As shown below, the ApiKey, Email, and TeamName are parameters we will use for this CloudFormation template which will then be used as environment variables for our Lambda function to pass to OpsGenie.

Figure 5: Review of SAM Template

Figure 5: Review of SAM Template

Launching the Template

  1. Navigate to the directory of choice within a terminal and clone the GitHub repository with the following command:
  1. Change directories with the command below to navigate to the directory of the SAM template.
cd amazon-devops-guru-connector-opsgenie/OpsGenieServerlessTemplate
  1. From the CLI, use the AWS SAM to build and process your AWS SAM template file, application code, and any applicable language-specific files and dependencies.
sam build
  1. From the CLI, use the AWS SAM to deploy the AWS resources for the pattern as specified in the template.yml file.
sam deploy --guided
  1. You will now be prompted to enter the following information below. Use the information obtained from the previous section to enter the Parameter ApiKey, Parameter Email, and Parameter TeamName fields.
  •  Stack Name
  • AWS Region
  • Parameter ApiKey
  • Parameter Email
  • Parameter TeamName
  • Allow SAM CLI IAM Role Creation

Test the solution

  1. Follow this blog to enable DevOps Guru and generate an operational insight.
  2. When DevOps Guru detects a new insight, it will generate an event in EventBridge. EventBridge then triggers Lambda and sends the event to Opsgenie as shown below.
Figure 6: Event Published to Opsgenie with details such as the source, alert type, insight type, and a URL to the insight in the AWS console.

Figure 6: Event Published to Opsgenie with details such as the source, alert type, insight type, and a URL to the insight in the AWS console.enecccdgruicnuelinbbbigebgtfcgdjknrjnjfglclt

Cleaning up

To avoid incurring future charges, delete the resources.

  1. Delete resources deployed from this blog.
  2. From the command line, use AWS SAM to delete the serverless application along with its dependencies.
sam delete

Customizing Insights published using Amazon EventBridge & AWS Lambda

The foundation of the DevOps Guru and Opsgenie integration is based on Amazon EventBridge and AWS Lambda which allows you the flexibility to implement several customizations. An example of this would be the ability to generate an Opsgenie alert when a DevOps Guru insight severity is high. Another example would be the ability to forward appropriate notifications to the AIOps team when there is a serverless-related resource issue or forwarding a database-related resource issue to your DBA team. This section will walk you through how these customizations can be done.

EventBridge customization

EventBridge rules can be used to select specific events by using event patterns. As detailed below, you can trigger the lambda function only if a new insight is opened and the severity is high. The advantage of this kind of customization is that the Lambda function will only be invoked when needed.

{
  "source": [
    "aws.devops-guru"
  ],
  "detail-type": [
    "DevOps Guru New Insight Open"
  ],
  "detail": {
    "insightSeverity": [
         "high"
         ]
  }
}

Applying EventBridge customization

  1. Open the file template.yaml reviewed in the previous section and implement the changes as highlighted below under the Events section within resources (original file on the left, changes on the right hand side).
Figure 7: CloudFormation template file changed so that the EventBridge rule is only triggered when the alert type is "DevOps Guru New Insight Open" and insightSeverity is “high”.

Figure 7: CloudFormation template file changed so that the EventBridge rule is only triggered when the alert type is “DevOps Guru New Insight Open” and insightSeverity is “high”.

  1. Save the changes and use the following command to apply the changes
sam deploy --template-file template.yaml
  1. Accept the changeset deployment

Determining the Ops team based on the resource type

Another customization would be to change the Lambda code to route and control how alerts will be managed.  Let’s say you want to get your DBA team involved whenever DevOps Guru raises an insight related to an Amazon RDS resource. You can change the AlertType Java class as follows:

  1. To begin this customization of the Lambda code, the following changes need to be made within the AlertType.java file:
  • At the beginning of the file, the standard java.util.List and java.util.ArrayList packages were imported
  • Line 60: created a list of CloudWatch metrics namespaces
  • Line 74: Assigned the dataIdentifiers JsonNode to the variable dataIdentifiersNode
  • Line 75: Assigned the namespace JsonNode to a variable namespaceNode
  • Line 77: Added the namespace to the list for each DevOps Insight which is always raised as an EventBridge event with the structure detail►anomalies►0►sourceDetails►0►dataIdentifiers►namespace
  • Line 88: Assigned the default responder team to the variable defaultResponderTeam
  • Line 89: Created the list of responders and assigned it to the variable respondersTeam
  • Line 92: Check if there is at least one AWS/RDS namespace
  • Line 93: Assigned the DBAOps_Team to the variable dbaopsTeam
  • Line 93: Included the DBAOps_Team team as part of the responders list
  • Line 97: Set the OpsGenie request teams to be the responders list
Figure 8: java.util.List and java.util.ArrayList packages were imported

Figure 8: java.util.List and java.util.ArrayList packages were imported


Figure 9: AlertType Java class customized to include DBAOps_Team for RDS-related DevOps Guru insights.

Figure 9: AlertType Java class customized to include DBAOps_Team for RDS-related DevOps Guru insights.


  1. You then need to generate the jar file by using the mvn clean package command.
  • The function needs to be updated with:
    • FUNCTION_NAME=$(aws lambda
      list-functions –query ‘Functions[?contains(FunctionName, `DevOps-Guru`) ==
      `true`].FunctionName’ –output text)
    • aws lambda update-function-code –region
      us-east-1 –function-name $FUNCTION_NAME –zip-file fileb://target/Functions-1.0.jar
  1. As result, the DBAOps_Team will be assigned to the Opsgenie alert in the case a DevOps Guru Insight is related to RDS.
Figure 10: Opsgenie alert assigned to both DBAOps_Team and AIOps_Team.

Figure 10: Opsgenie alert assigned to both DBAOps_Team and AIOps_Team.

Conclusion

In this post, you learned how Amazon DevOps Guru integrates with Amazon EventBridge and publishes insights to Opsgenie using AWS Lambda. By creating an Opsgenie integration with DevOps Guru, you can now leverage Opsgenie strengths, incident management, team communication, and collaboration when responding to an insight. All of the insight data can be viewed and addressed in Opsgenie’s Incident Command Center (ICC).  By customizing the data sent to Opsgenie via Lambda, you can empower your organization even more by fine tuning and displaying the most relevant data thus decreasing the MTTR (mean time to resolve) of the responding operations team.

About the authors:

Brendan Jenkins

Brendan Jenkins is a solutions architect working with Enterprise AWS customers providing them with technical guidance and helping achieve their business goals. He has an area of interest around DevOps and Machine Learning technology. He enjoys building solutions for customers whenever he can in his spare time.

Pablo Silva

Pablo Silva is a Sr. DevOps consultant that guide customers in their decisions on technology strategy, business model, operating model, technical architecture, and investments.

He holds a master’s degree in Artificial Intelligence and has more than 10 years of experience with telecommunication and financial companies.

Joseph Simon

Joseph Simon is a solutions architect working with mid to large Enterprise AWS customers. He has been in technology for 13 years with 5 of those centered around DevOps. He has a passion for Cloud, DevOps and Automation and in his spare time, likes to travel and spend time with his family.