Post Syndicated from Kirankumar Chandrashekar original https://aws.amazon.com/blogs/devops/proactively-validate-your-aws-cloudformation-templates-with-aws-lambda/
AWS CloudFormation is a service that allows you to define, manage, and provision your AWS cloud infrastructure using code. To enhance this process and ensure your infrastructure meets your organization’s standards, AWS offers CloudFormation Hooks. These Hooks are extension points that allow you to invoke custom logic at specific points during CloudFormation stack operations, enabling you to perform validations, make modifications, or trigger additional processes. Among these, the Lambda hook is a powerful option provided by AWS. This managed hook allows you to use Lambda functions to validate your CloudFormation templates before deployment. By using a Lambda hook, you can invoke custom logic to check infrastructure configurations on create or update or delete CloudFormation resources or stacks or change sets, as well as create or update operations for AWS Cloud Control API (CCAPI) resources. This enables you to enforce defined policies for your infrastructure-as-code (IaC), preventing the deployment of non-compliant resources or emitting warnings for potential issues. In this blog post, you will explore how to use a Lambda hook to validate your CloudFormation templates before deployment, ensuring your infrastructure is compliant and secure from the start.
Introducing Lambda Hook
The Lambda hook is an AWS-provided managed hook with the type AWS::Hooks::LambdaHook. It simplifies the integration of custom logic into CloudFormation stacks. This powerful feature allows you to focus on building and testing your custom logic as a Lambda function, without the complexity of creating a hook from scratch.
By using the Lambda hook, you can activate a pre-built hook and deploy your custom logic into a Lambda function using familiar tools like AWS CLI or AWS Serverless Application Model (SAM) or AWS Cloud Development Kit (CDK). This approach reduces the number of components you need to manage in your workflow, allowing for more streamlined operations. The Lambda hook also offers flexible evaluation capabilities, enabling you to respond to specific template properties or configurations as needed.
One of the key advantages of the Lambda hook is the enhanced control it provides. You can benefit from features such as VPC integration, local logging, and granular resource management, all while leveraging the power of AWS Lambda functions. To get started with the Lambda hook, you’ll need to activate it in your AWS account. This activation process eliminates the need for authoring, testing, packaging, and deploying a custom hook using the AWS CloudFormation Command Line Interface (CFN-CLI), significantly simplifying your workflow.
Example Use Case: S3 Bucket Versioning Validation
This blog post demonstrates using the Lambda hook to validate S3 Bucket versioning before deployment. While focused on S3 buckets, this approach can be applied to other resource types, properties, stack, and change set operations.
By leveraging the Lambda hook, you’ll streamline custom logic integration into your CloudFormation stacks. The process involves:
- Activating Lambda hook of type
AWS::Hooks::LambdaHookin your account - Writing a Lambda function for validation
- Providing the Lambda ARN as input to the hook
This example showcases how to enhance your infrastructure-as-code practices, ensuring compliant and secure deployments from the start.
Architecture
This section shows you how the Lambda hook and Lambda function work together to enhance your CloudFormation deployments.
Lambda hook and Lambda function
First, you need to create a Lambda function with the business logic to respond to the hook. Then, you need to create an IAM execution role with the necessary permissions to invoke the Lambda Function. Once you have the Lambda function and the IAM execution role, you can activate the AWS provided Lambda hook. Follow the steps in the documentation to activate a Lambda hook from the AWS console. Alternatively, you can activate it using the AWS Command Line Interface (AWS CLI) by using the activate-type and set-type-configuration commands. Lastly, you can also use AWS::CloudFormation::LambdaHook as a CloudFormation resource to activate and configure Lambda hook from a CloudFormation template. You can share this resource across your other accounts and regions using AWS CloudFormation StackSets by following this blog.
Lambda hook in action
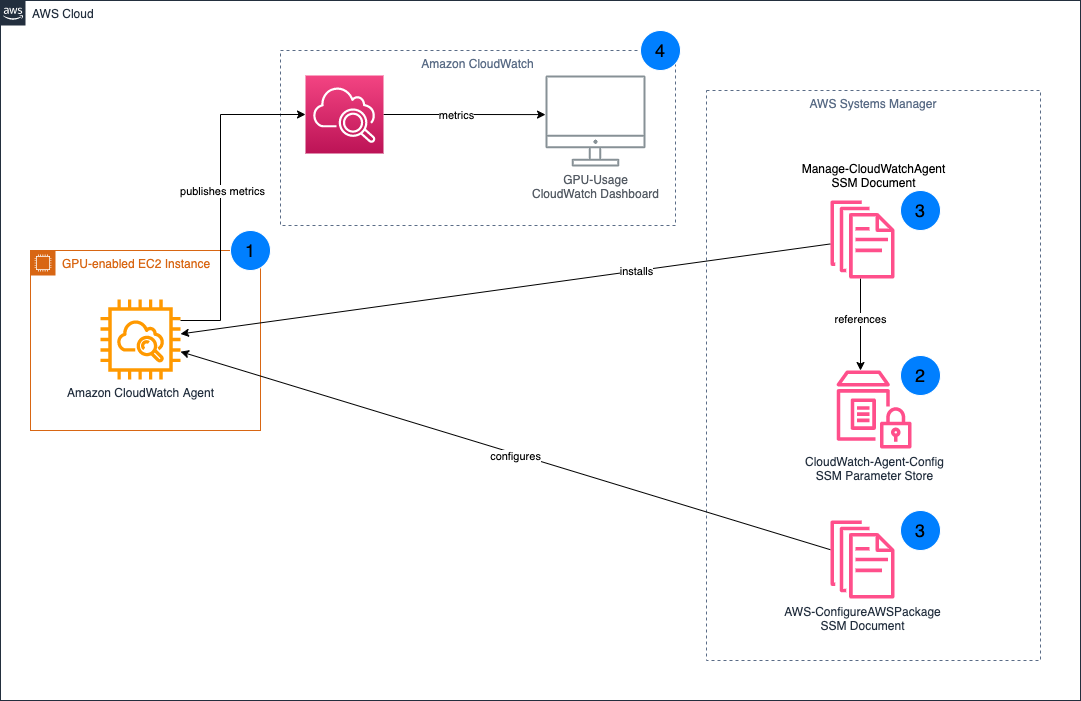
The following diagram and explanation illustrate the step-by-step workflow of how Lambda hook integrates with your CloudFormation operations, providing a visual representation of the process from template creation to resource deployment or modification.

Diagram 1: Lambda hooks in action
The architecture diagram illustrates the step-by-step flow of how the Lambda hook is used during a CloudFormation stack operation.
- Author a template: Author a CloudFormation template, including the necessary resources to configure.
- Create the stack: The CloudFormation stack creation process has started, but the process of creating the defined resources in the template has not yet begun.
- Request is received by CloudFormation service: When a resource creation, update, or deletion is requested, the CloudFormation service receives the request.
- Invoke the Hook: The CloudFormation service then invokes the Lambda hook.
- The hook invokes your the Lambda Function: The Lambda hook, in turn, triggers the execution of the Lambda function that was defined in the hook activation.
- The Lambda function processes the request and responds back to the Hook: The Lambda function processes the request, performing validation, or additional tasks as required. The Lambda function then responds back to the Lambda hook.
- The stack workflow progresses further in either continuing the resource creation/update/deletion with/without a warning or fails: Based on the Lambda function’s output, the Lambda hook either allows the stack operation to proceed with the resource operation (for example, creation of the resource), or deny the resource operation causing a rollback of the stack.
This workflow demonstrates how Lambda hook seamlessly integrates into the CloudFormation stack deployment process, allowing you to implement custom validations, enforce policies, and extend the capabilities of your infrastructure-as-code deployments through the power of Lambda functions. By leveraging the Lambda hook and the custom Lambda function, customers can extend the capabilities of their CloudFormation deployments, enabling advanced use cases such as resource validation, or additional task execution.
Sample Deployment
This section shows you how to enable the Lambda hook, which is of type AWS::Hooks::LambdaHook, and add the business logic in the Lambda function to validate the versioning configuration of an S3 bucket. The sample solution shown in this blog post demonstrates the hook triggering for the resource type AWS::S3::Bucket, and if you want to trigger this for every resource type, then you can use the Resource filter within Hook filters configuration that can take wildcard "AWS::*::*" as a value or multiple targets of resource types for example "AWS::S3::Bucket", "AWS::DynamoDB::Table", and you’ll also want to make sure that the Lambda Function has the logic to handle the additional resource type. You can also add additional Hook targets , for example to validate your STACK or CHANGE_SET.
In the example used in this blog post, you will configure the hook and activate on create and update operations operations. For more information about TargetFilters, see Hook configuration schema and for more information about Lambda hook see here. With these modifications, you need to consider two important points: First, you will need to handle the business logic to deal with different resource types in your Lambda function code. Second, additional pricing may apply based on your resource usage, for more details see the Lambda pricing page.
Creating the Lambda Function
You can create a Lambda function in several ways – on the AWS Console, using CloudFormation, using AWS CLI, or by directly invoking the API via SDK. In this section, we will cover creating a Lambda function with a few clicks on the AWS console. See Using Lambda with infrastructure as code (IaC) for deploying Lambda Function using SAM CLI, CDK or CloudFormation.
Create the Lambda function on the AWS console by following create a Lambda function with the console instructions and use the following sample Python code.
"""Example Lambda function called by AWS::Hooks::LambdaHook."""


import logging


HOOK_INVOCATION_POINTS = [
    "CREATE_PRE_PROVISION",
    "UPDATE_PRE_PROVISION",
    "DELETE_PRE_PROVISION",
]

TARGET_NAMES = [
    "AWS::S3::Bucket",
]

LOGGER = logging.getLogger()

LOGGER.setLevel("INFO")


def lambda_handler(event, context):
  """Define the entry point of the function."""
  try:
    request = event

    LOGGER.info(f"Request: {request}")

    invocation_point = request["actionInvocationPoint"]
    LOGGER.info(f"Invocation point: {invocation_point}")

    target_name = request["requestData"]["targetName"]
    LOGGER.info(f"Target name: {target_name}")

    clientRequestToken = request["clientRequestToken"]

    if (
      invocation_point not in HOOK_INVOCATION_POINTS
      or target_name not in TARGET_NAMES
    ):
      message = (
        f"Skipping {target_name} evaluation for {invocation_point}."
      )
      LOGGER.info(message)
      payload = {
        "clientRequestToken": clientRequestToken,
        "hookStatus": "SUCCESS",
        "errorCode": None,
        "message": message,
        "callbackContext": None,
        "callbackDelaySeconds": 0,
      }
      LOGGER.debug(payload)
      return payload

    target_model = request["requestData"]["targetModel"]

    resource_properties = (
      target_model.get("resourceProperties")
      if target_model and target_model.get("resourceProperties")
      else None
    )
    LOGGER.debug(f"Resource properties: {resource_properties}")

    versioning_configuration = (
      resource_properties.get("VersioningConfiguration")
      if resource_properties
      and resource_properties.get("VersioningConfiguration")
      else None
    )
    versioning_configuration_status = (
      versioning_configuration.get("Status")
      if versioning_configuration
      and versioning_configuration.get("Status")
      else None
    )
    if (
      not resource_properties
      or not versioning_configuration
      or not versioning_configuration_status
      or not versioning_configuration_status == "Enabled"
    ):
      message = "Versioning not set or not enabled for the S3 bucket."
      LOGGER.error(message)
      payload = {
        "clientRequestToken": clientRequestToken,
        "hookStatus": "FAILED",
        "errorCode": "NonCompliant",
        "message": message,
      }
    else:
      message = "Versioning is enabled for the S3 bucket."
      LOGGER.info(message)
      payload = {
        "clientRequestToken": clientRequestToken,
        "hookStatus": "SUCCESS",
        "errorCode": None,
        "message": message,
      }

    LOGGER.debug(payload)
    return payload
  except Exception as exception:
    message = str(exception)
    payload = {
      "clientRequestToken":  event["clientRequestToken"],
      "hookStatus": "FAILED",
      "errorCode": "InternalFailure",
      "message": message,
      "callbackContext": None,
      "callbackDelaySeconds": 0,
    }
    LOGGER.error(message)
    return payload
Example event sent to Lambda by the hook
Explanation of the Lambda Function code
The Lambda Function code is designed to process the event received from the Lambda hook and validate the versioning configuration of the target S3 bucket resource. Here’s a detailed explanation of the code:
- The function first extracts the relevant information from the event, including the invocation point and the target resource type.
- It then checks if the current invocation point is in the configured
HOOK_INVOCATION_POINTSlist and if the target resource type isAWS::S3::Bucket. If not, the function returns a success response, skipping the validation for this particular invocation.
Note: this code that skips the validation is put here as a fallback logic in the event the user has not chosen to use TargetFilters. As this is a wildcard hook, without TargetFilters the hook will always be invoked for any AWS resource type described in the template, and since the hook targets preCreate, preUpdate, and preDelete by default, the hook will be invoked for these invocation points by default. To narrow the scope and reduce costs by avoiding to invoke the hook for all AWS resource type targets and invocation points, use TargetFilters.
- Next, the function retrieves the resource properties from the event, specifically looking for the
VersioningConfigurationproperty and itsStatus. - If the
VersioningConfigurationproperty is not present or itsStatusis not set toEnabled, the function returns a failure response, indicating that the versioning is not enabled for the S3 bucket. - If the versioning is enabled, the function returns a success response.
- The function also includes a fallback mechanism to return a failure response in case of any other exceptions. By evaluating this sample code, you can validate the versioning configuration of the S3 bucket during the CloudFormation stack creation and update processes, with your infrastructure-as-code policies.
Enabling Lambda Hook in your AWS Account/Region
- Navigate to the AWS CloudFormation service on the AWS Console, then choose “Create Hook” → “with Lambda” from the main Hooks page:

Diagram 2: Create a Hook with Lambda console page
You will see the page explaining how the Lambda function work as a hook.

Diagram 3: Provide a Lambda function to Hook Console page
- Provide the Hooks details: the name, the Lambda function it should take, the type, and the mode. You can also create your execution role directly from the console by choosing “New execution role”.
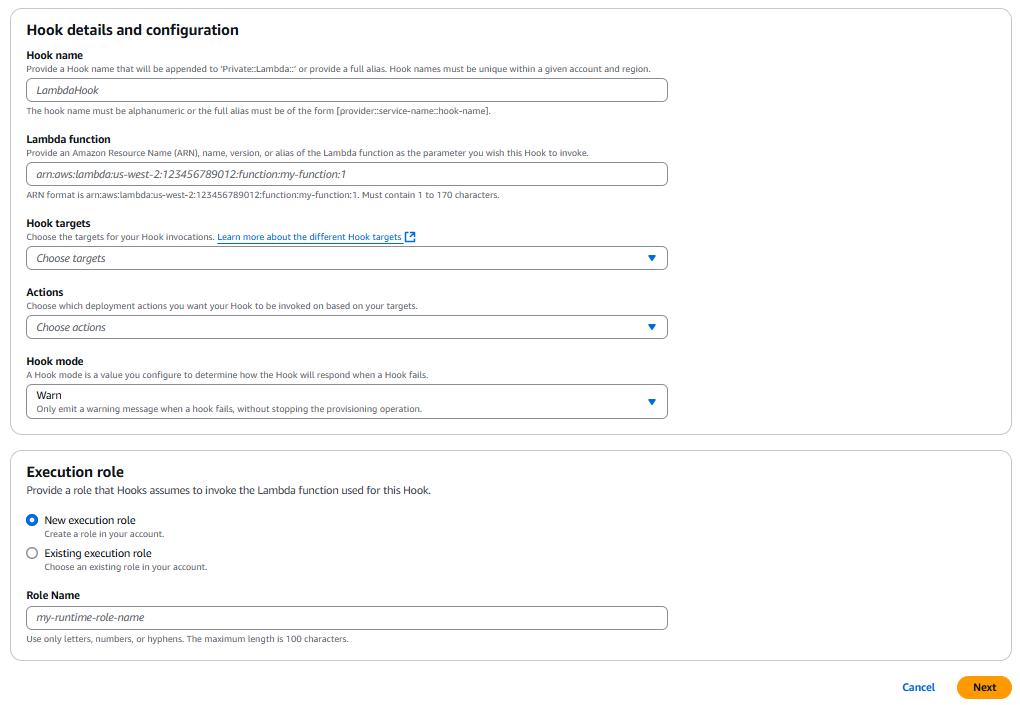
Diagram 3: Provide a Lambda function to Hook Console page
You can review the Lambda hook and activate it from the next page.

Diagram 4: Review Lambda hook Console page
Test a sample
In this section, you will test the hook and the Lambda Function that you activated for a S3 bucket resource.
Create an S3 Bucket without versioning
AWSTemplateFormatVersion: "2010-09-09"

Description: This CloudFormation template provisions an S3 Bucket without versioning enabled

Resources:
  S3Bucket:
    DeletionPolicy: Delete
    Type: AWS::S3::Bucket
    Properties:
      BucketName: !Sub test-bucket-versioning-1-${AWS::Region}-${AWS::AccountId}
You will see the hook invoking Lambda function and the Lambda Function responding back with a failure message since the Versioning is not enabled.
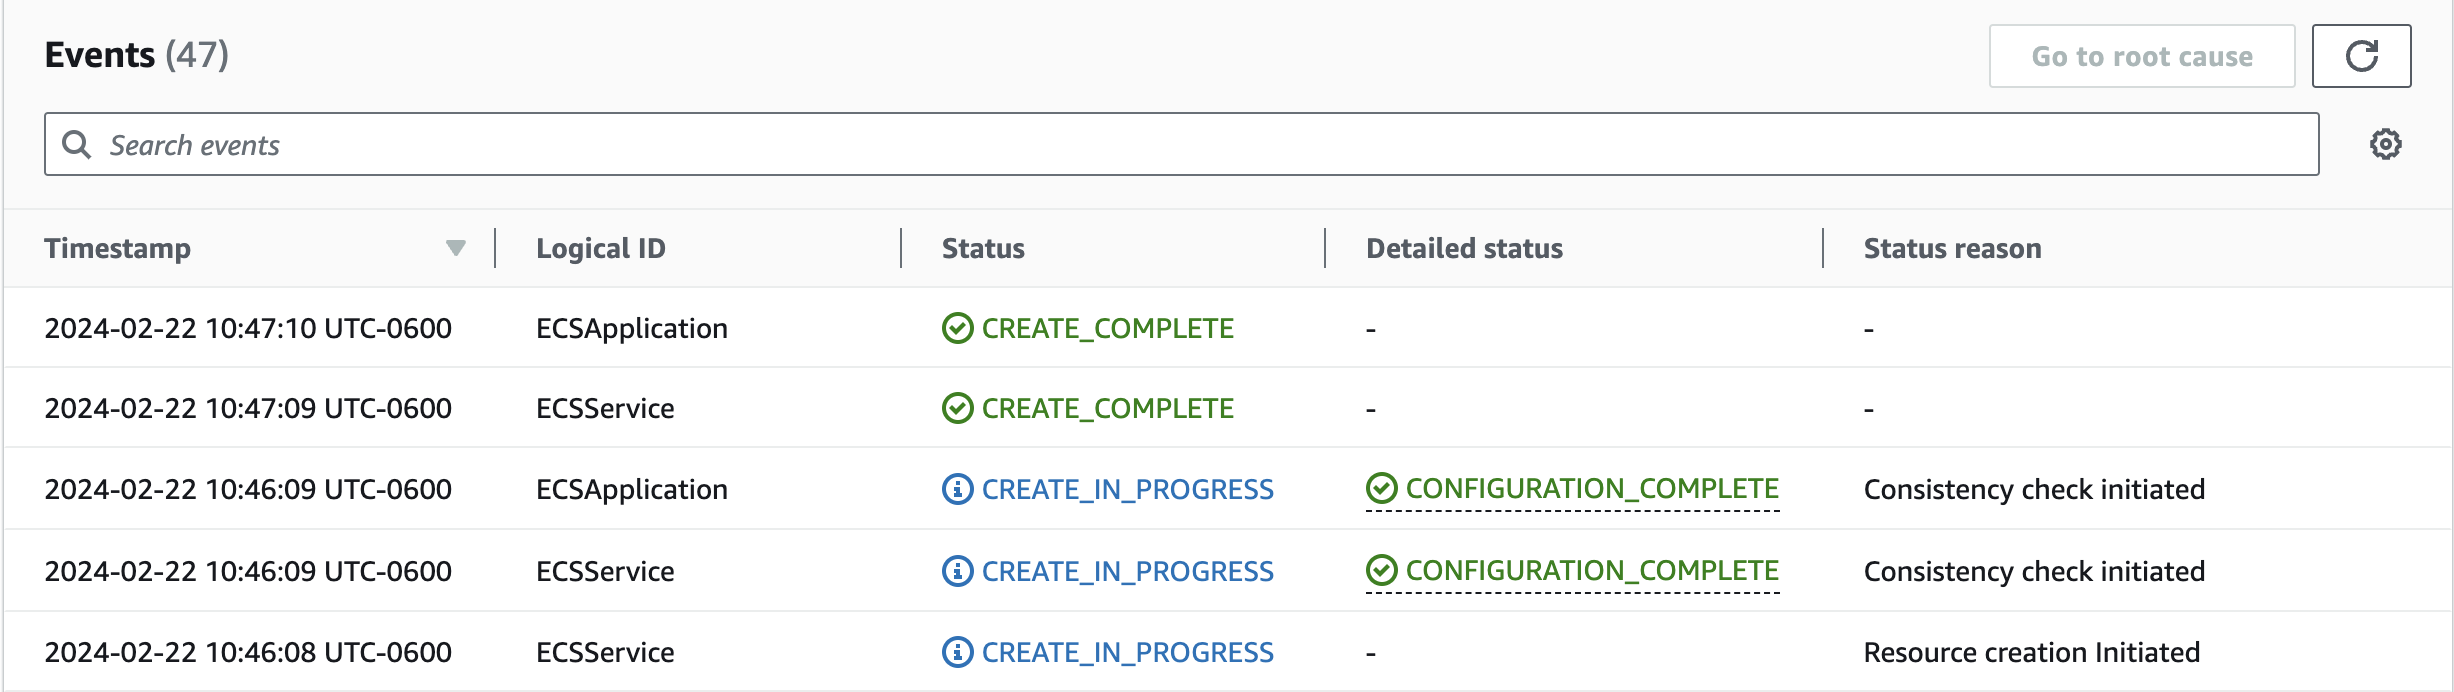
When you create or update a stack with the template above, the Lambda hook will be invoked, and the Lambda Function will respond with a failure message since bucket versioning is not enabled. The Lambda Function code will extract the resourceProperties from the event, check the VersioningConfiguration property, and find that the Status is not set to Enabled. As a result, if you use the example template above where you describe the S3 bucket without versioning enabled, the Lambda Function will send a failure response back to the hook, causing the CloudFormation stack operation to fail as shown in the following screenshot.

Diagram 5: Lambda Hook failure Stack
Create an S3 Bucket with versioning enabled You can try creating an S3 Bucket with versioning enabled to see how Hooks assessment succeeded.
AWSTemplateFormatVersion: "2010-09-09"

Description: This CloudFormation template provisions an S3 Bucket with Versioning enabled

Resources:
  S3Bucket:
    DeletionPolicy: Delete
    Type: AWS::S3::Bucket
    Properties:
      BucketName: !Sub test-bucket-versioning-2-${AWS::Region}-${AWS::AccountId}
      VersioningConfiguration:
        Status: Enabled
In this case, you will see the hook invoking the Lambda function and getting a success message since the Versioning is enabled
When you create a stack with this CloudFormation template, the Lambda hook will be invoked, and the Lambda Function will respond with a success message since the versioning is enabled. The Lambda Function code will extract the resourceProperties from the event, check the VersioningConfiguration property, and find that the Status is set to Enabled. As a result, the Lambda Function will send a success response back to the hook, allowing the CloudFormation stack operation to proceed as shown in the following screenshot.
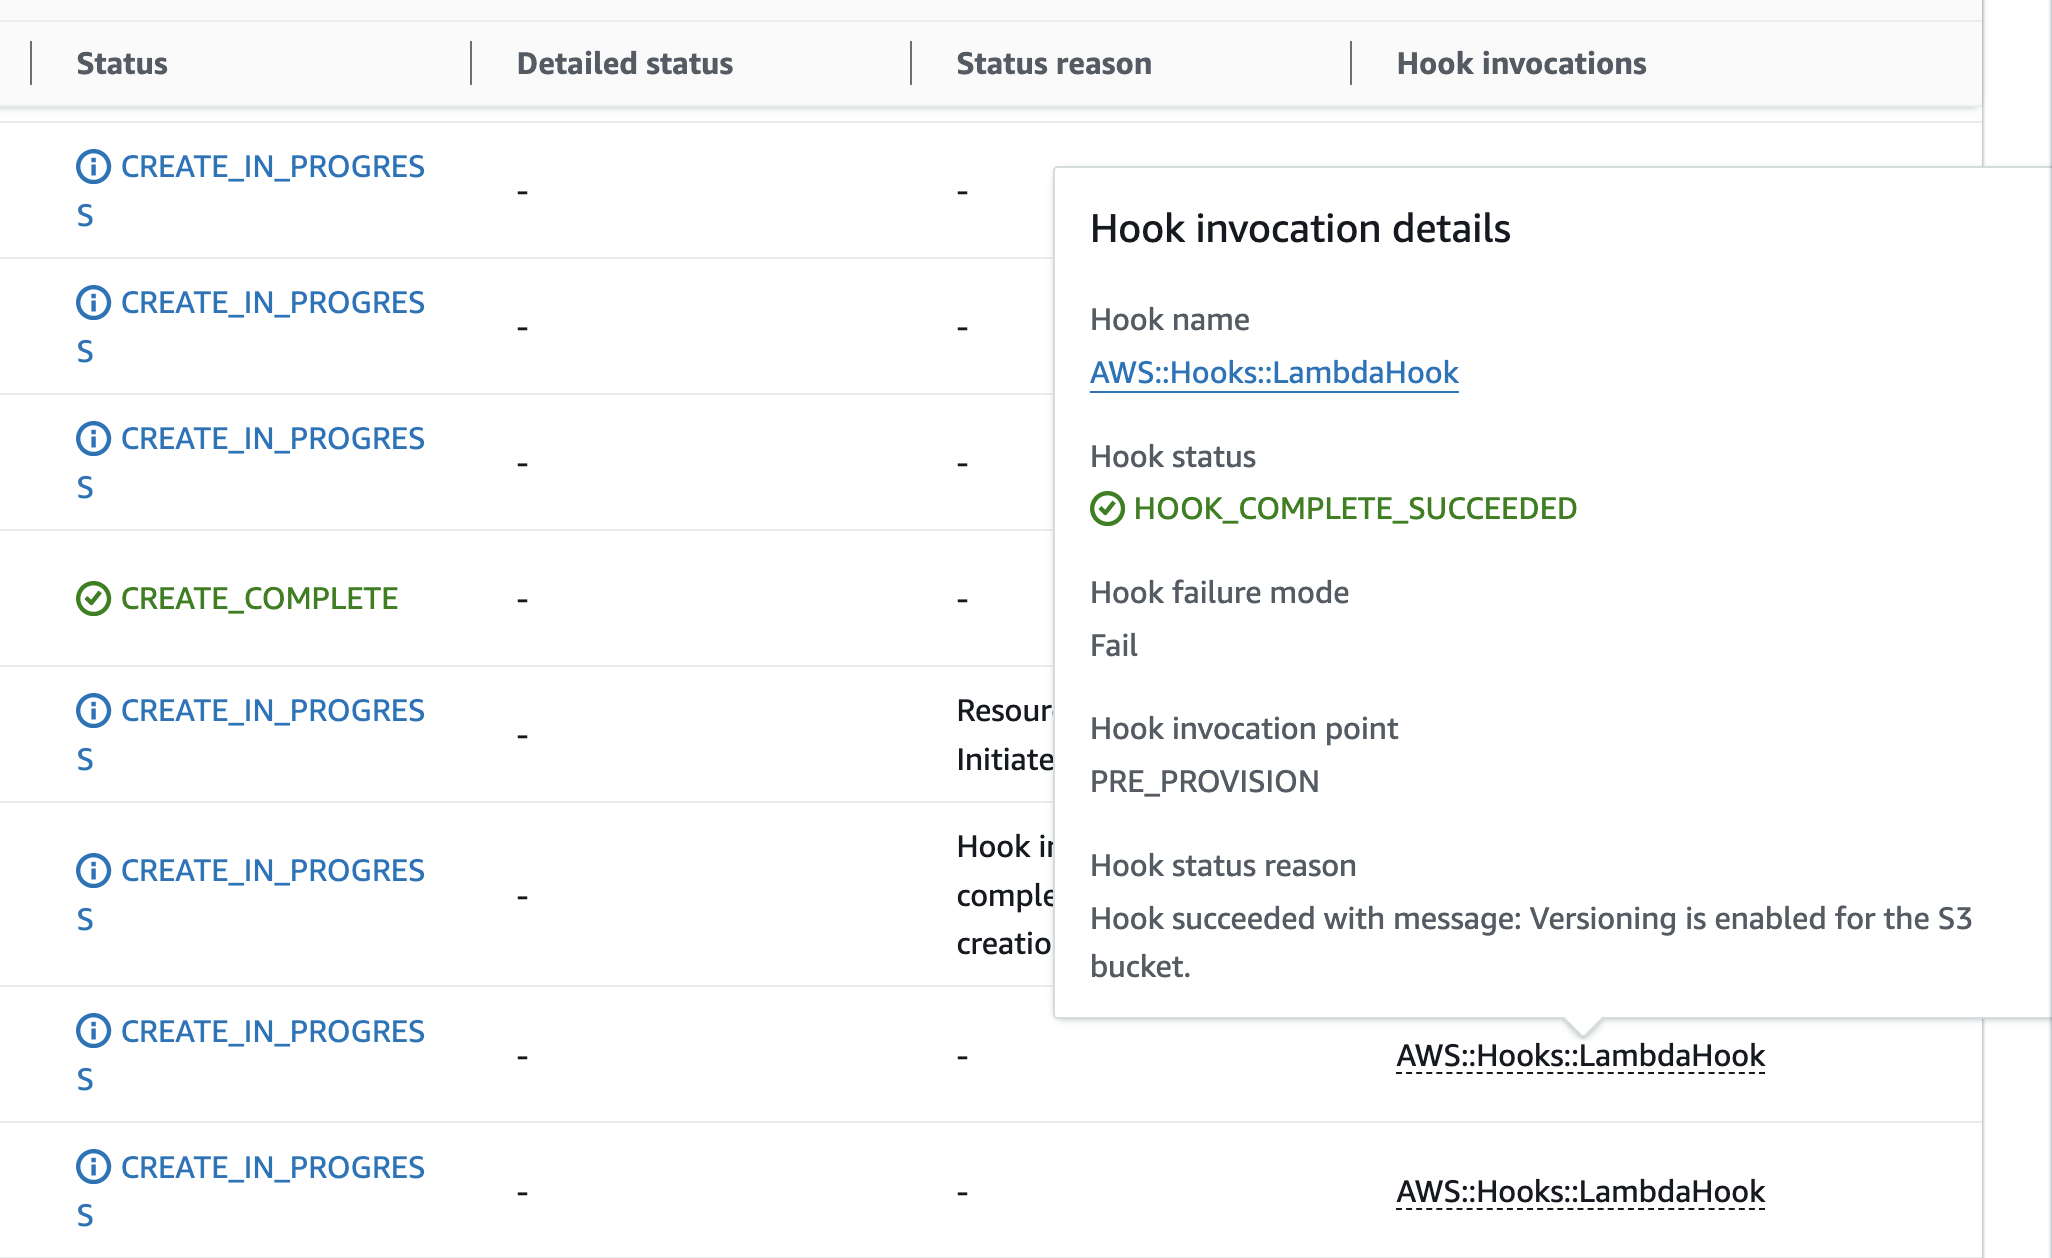
Diagram 6: Lambda Hook success Stack
By testing these two scenarios, you can verify that the Lambda hook and the associated Lambda Function are working as expected, enforcing the S3 bucket versioning policy during CloudFormation stack operations.
Clean up
To clean up, refer to the following documentation to delete CloudFormation Stacks: Deleting a stack on the AWS CloudFormation console or Deleting a stack using AWS CLI. Refer to documentation to deactivate the hook.
Conclusion
In this blog post, you explored the capabilities of CloudFormation Hooks and how they can be leveraged to extend the functionality of your infrastructure-as-code deployments. Specifically, you learned about the Lambda hook, a pre-built hook that simplifies the process of integrating custom logic into your CloudFormation stacks.
By activating the Lambda hook, and deploying a custom Lambda Function, you were able to validate the versioning configuration of an S3 bucket during the CloudFormation stack creation and update processes. This approach allows you to enforce infrastructure-as-code policies and ensure compliance at the point of deployment, rather than relying on post-deployment checks or indirect governance mechanisms. The ability to leverage familiar tools and workflows, such as the AWS CLI, AWS SAM, CI/CD pipelines, or the AWS CDK, makes it easier to incorporate custom logic into your CloudFormation deployments. This reduces the overhead and complexity associated with traditional hook orchestration and packaging, empowering you to streamline your infrastructure-as-code practices.
As you continue to build and deploy your cloud infrastructure, consider exploring the various CloudFormation Hooks available, for example, see aws-cloudformation/aws-cloudformation-samples and aws-cloudformation/community-registry-extensions GitHub repositories. The approach demonstrated in this blog post can be applied to other resource types supported by CloudFormation, allowing you to validate and enforce policies for a wide range of infrastructure components, from EC2 instances and VPCs to databases and application services.
About the Author

Kirankumar Chandrashekar is a Sr. Solutions Architect for Strategic Accounts at AWS. He focuses on leading customers in architecting DevOps, modernization using serverless, containers and container orchestration technologies like Docker, ECS, EKS to name a few. Kirankumar is passionate about DevOps, Infrastructure as Code, modernization and solving complex customer issues. He enjoys music, as well as cooking and traveling.
 Stella Hie is a Sr. Product Manager Technical for AWS Infrastructure as Code. She focuses on proactive control and governance space, working on delivering the best experience for customers to use AWS solutions safely. Outside of work, she enjoys hiking, playing piano, and watching live shows.


 Figure 3: CloudFormation’s create stack console wizard
 Figure 4: Real-time CloudFormation in-progress deployment timeline view
 Figure 6: CloudFormation completed deployment timeline view
  Figure 7: CloudFormation deployment timeline view – resource detail popover