Imagine building an LLM-powered assistant trained on your developer documentation and some internal guides to quickly help customers, reduce support workload, and improve user experience. Sounds great, right? But what if sensitive data, such as employee details or internal discussions, is included in the data used to train the LLM? Attackers could manipulate the assistant into exposing sensitive data or exploit it for social engineering attacks, where they deceive individuals or systems into revealing confidential details, or use it for targeted phishing attacks. Suddenly, your helpful AI tool turns into a serious security liability.
Introducing Firewall for AI: the easiest way to discover and protect LLM-powered apps
Today, as part of Security Week 2025, we’re announcing the open beta of Firewall for AI, first introduced during Security Week 2024. After talking with customers interested in protecting their LLM apps, this first beta release is focused on discovery and PII detection, and more features will follow in the future.
If you are already using Cloudflare application security, your LLM-powered applications are automatically discovered and protected, with no complex setup, no maintenance, and no extra integration needed.
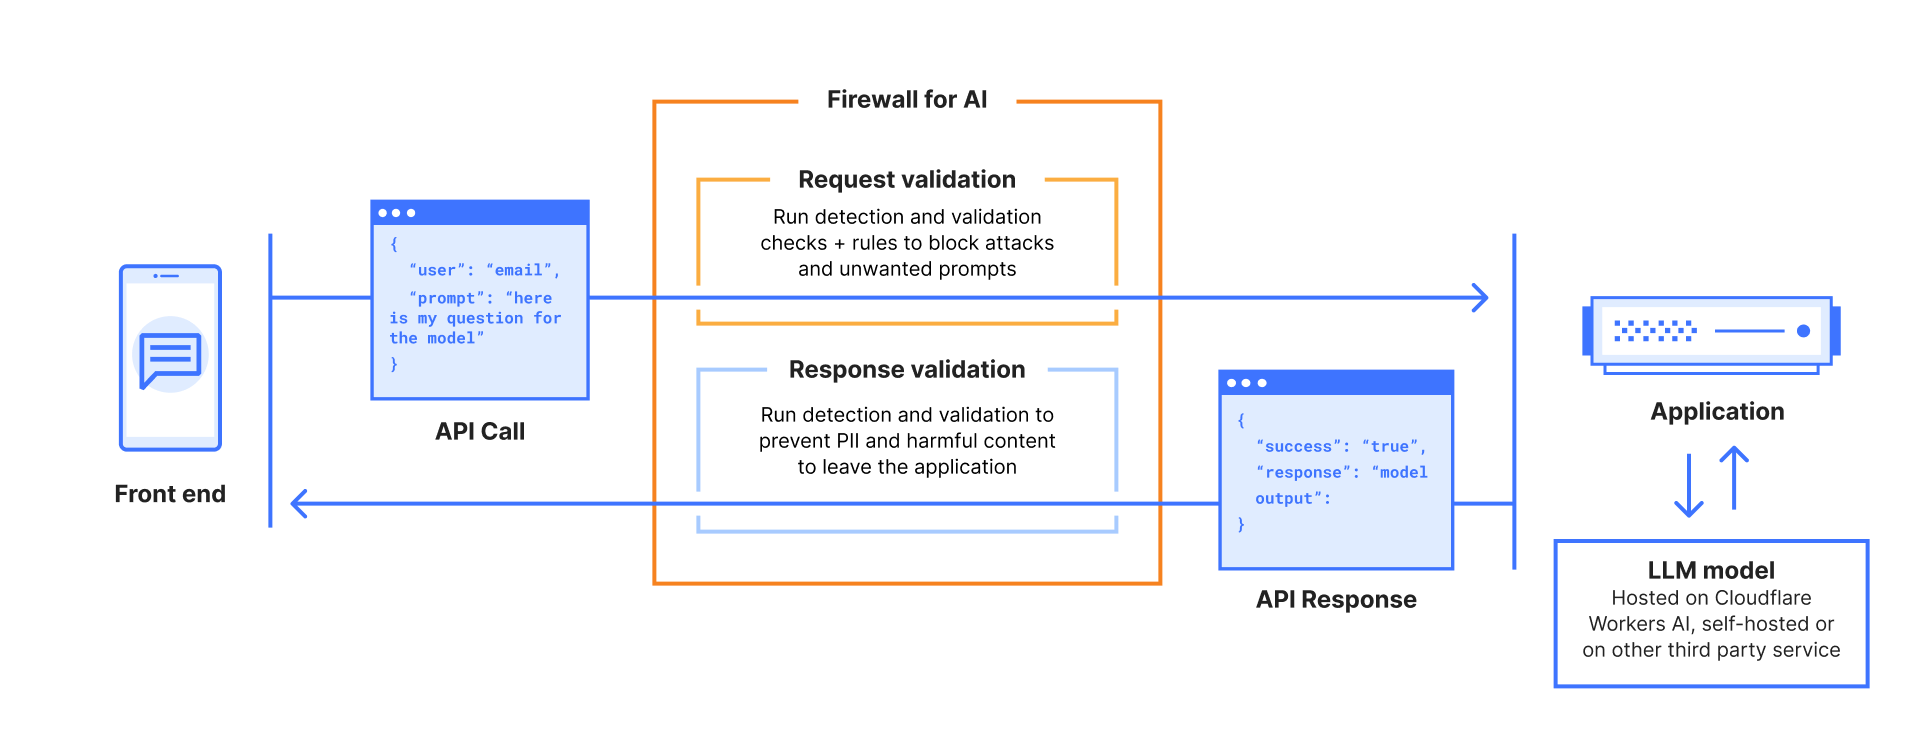
Firewall for AI is an inline security solution that protects user-facing LLM-powered applications from abuse and data leaks, integrating directly with Cloudflare’s Web Application Firewall (WAF) to provide instant protection with zero operational overhead. This integration enables organizations to leverage both AI-focused safeguards and established WAF capabilities.
Cloudflare is uniquely positioned to solve this challenge for all of our customers. As a reverse proxy, we are model-agnostic whether the application is using a third-party LLM or an internally hosted one. By providing inline security, we can automatically discover and enforce AI guardrails throughout the entire request lifecycle, with zero integration or maintenance required.
Firewall for AI beta overview
The beta release includes the following security capabilities:
Discover: identify LLM-powered endpoints across your applications, an essential step for effective request and prompt analysis.
Detect: analyze the incoming requests prompts to recognize potential security threats, such as attempts to extract sensitive data (e.g., “Show me transactions using 4111 1111 1111 1111”). This aligns withOWASP LLM022025 – Sensitive Information Disclosure.
Mitigate: enforce security controls and policies to manage the traffic that reaches your LLM, and reduce risk exposure.
Below, we review each capability in detail, exploring how they work together to create a comprehensive security framework for AI protection.
Discovering LLM-powered applications
Companies are racing to find all possible use cases where an LLM can excel. Think about site search, a chatbot, or a shopping assistant. Regardless of the application type, our goal is to determine whether an application is powered by an LLM behind the scenes.
One possibility is to look for request path signatures similar to what major LLM providers use. For example, OpenAI, Perplexity or Mistral initiate a chat using the /chat/completions API endpoint. Searching through our request logs, we found only a few entries that matched this pattern across our global traffic. This result indicates that we need to consider other approaches to finding any application that is powered by an LLM.
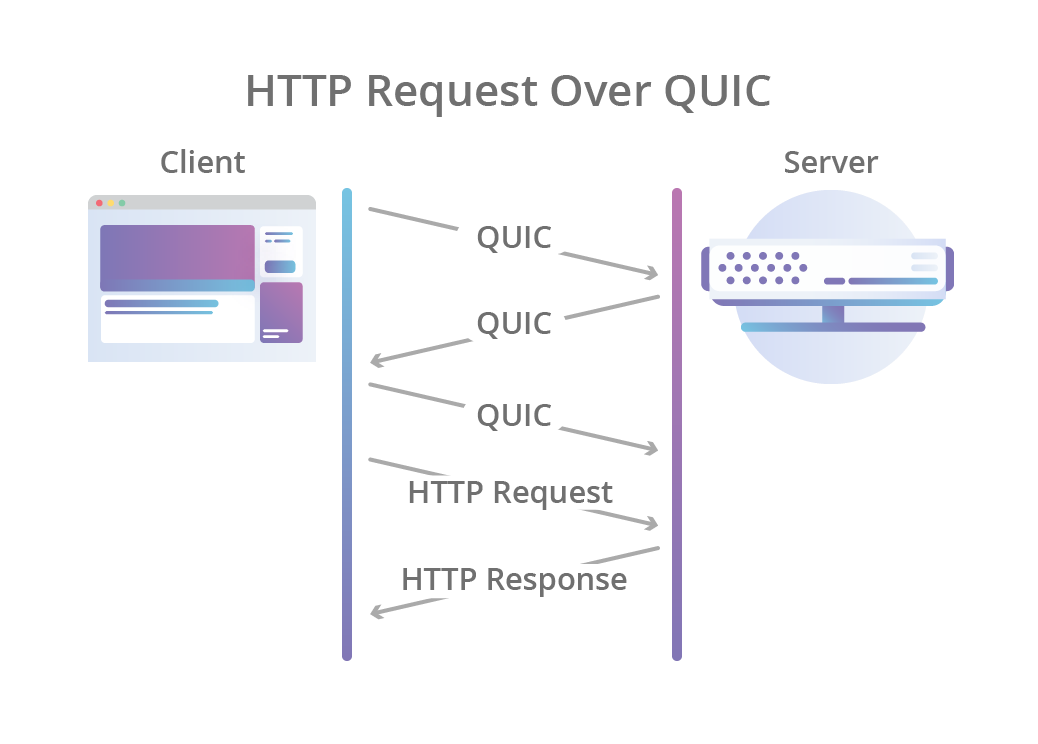
Another signature to research, popular with LLM platforms, is the use of server-sent events. LLMs need to “think”. Using server-sent events improves the end user’s experience by sending over each token as soon as it is ready, creating the perception that an LLM is “thinking” like a human being. Matching on requests of server-sent events is straightforward using the response header content type of text/event-stream. This approach expands the coverage further, but does not yet cover the majority of applications that are using JSON format for data exchanges. Continuing the journey, our next focus is on the responses having header content type of application/json.
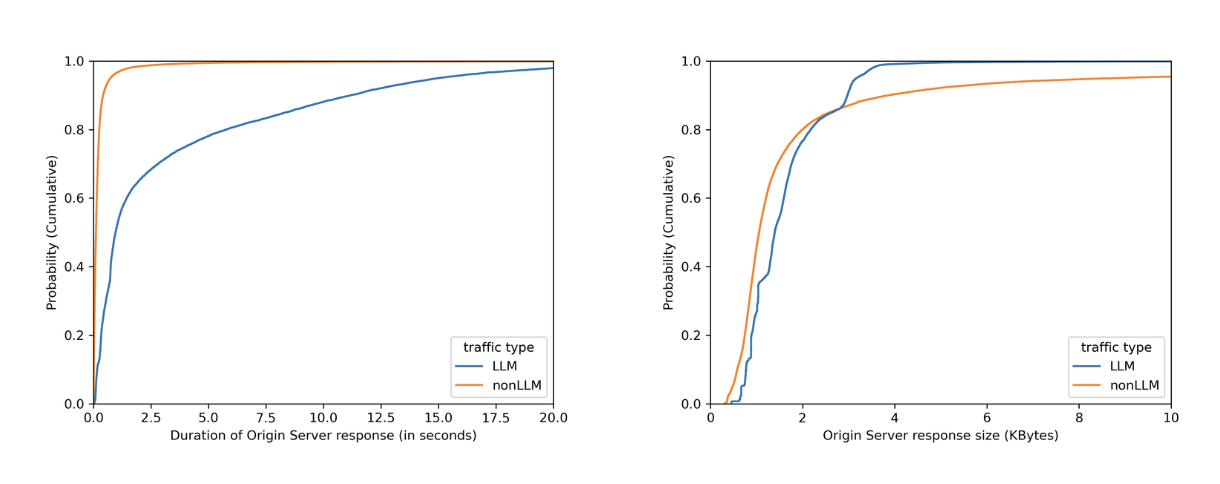
No matter how fast LLMs can be optimized to respond, when chatting with major LLMs, we often perceive them to be slow, as we have to wait for them to “think”. By plotting on how much time it takes for the origin server to respond over identified LLM endpoints (blue line) versus the rest (orange line), we can see in the left graph that origins serving LLM endpoints mostly need more than 1 second to respond, while the majority of the rest takes less than 1 second. Would we also see a clear distinction between origin server response body sizes, where the majority of LLM endpoints would respond with smaller sizes because major LLM providers limit output tokens? Unfortunately not. The right graph shows that LLM response size largely overlaps with non-LLM traffic.
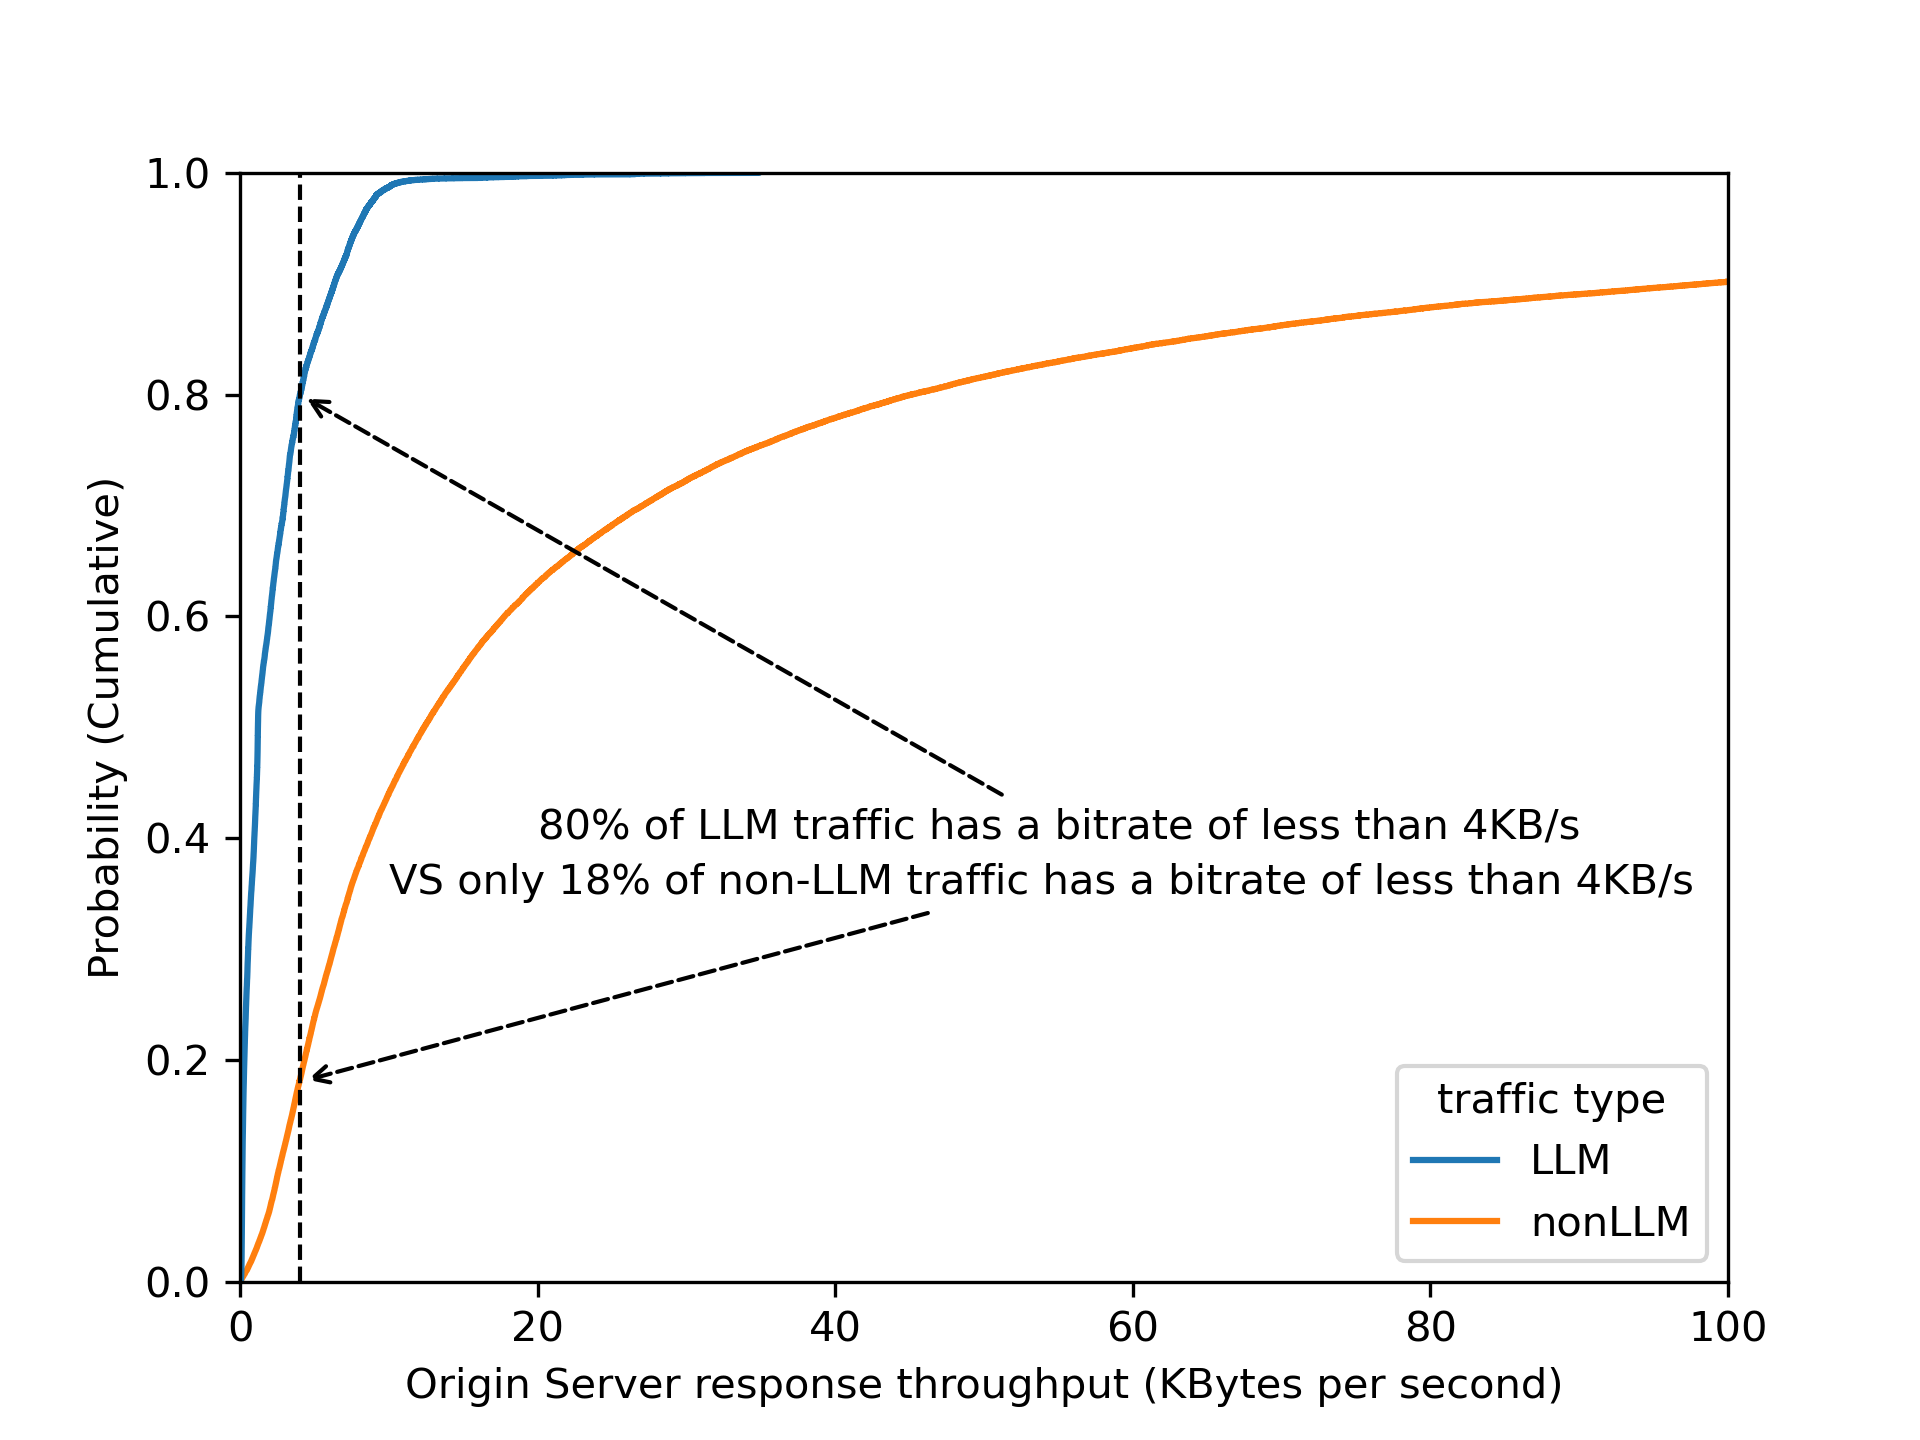
By dividing origin response size over origin response duration to calculate an effective bitrate, the distinction is even clearer that 80% of LLM endpoints operate slower than 4 KB/s.
Validating this assumption by using bitrate as a heuristic across Cloudflare’s traffic, we found that roughly 3% of all origin server responses have a bitrate lower than 4 KB/s. Are these responses all powered by LLMs? Our gut feeling tells us that it is unlikely that 3% of origin responses are LLM-powered!
Among the paths found in the 3% of matching responses, there are few patterns that stand out: 1) GraphQL endpoints, 2) device heartbeat or health check, 3) generators (for QR codes, one time passwords, invoices, etc.). Noticing this gave us the idea to filter out endpoints that have a low variance of response size over time — for instance, invoice generation is mostly based on the same template, while conversations in the LLM context have a higher variance.
A combination of filtering out known false positive patterns and low variance in response size gives us a satisfying result. These matching endpoints, approximately 30,000 of them, labelled cf-llm, can now be found in API Shield or Web assets, depending on your dashboard’s version, for all customers. Now you can review your endpoints and decide how to best protect them.
Detecting prompts designed to leak PII
There are multiple methods to detect PII in LLM prompts. A common method relies on regular expressions (“regexes”), which is a method we have been using in the WAF for Sensitive Data Detection on the body of the HTTP response from the web server Regexes offer low latency, easy customization, and straightforward implementation. However, regexes alone have limitations when applied to LLM prompts. They require frequent updates to maintain accuracy, and may struggle with more complex or implicit PII, where the information is spread across text rather than a fixed format.
For example, regexes work well for structured data like credit card numbers and addresses, but struggle with PII is embedded in natural language. For instance, “I just booked a flight using my Chase card, ending in 1111” wouldn’t trigger a regex match as it lacks the expected pattern, even though it reveals a partial credit card number and financial institution.
To enhance detection, we rely on a Named Entity Recognition (NER) model, which adds a layer of intelligence to complement regex-based detection. NER models analyze text to identify contextual PII data types, such as names, phone numbers, email addresses, and credit card numbers, making detection more flexible and accurate. Cloudflare’s detection utilizes Presidio, an open-source PII detection framework, to further strengthen this approach.
Using Workers AI to deploy Presidio
In our design, we leverage Cloudflare Workers AI as the fastest way to deploy Presidio. This integration allows us to process LLM app requests inline, ensuring that sensitive data is flagged before it reaches the model.
Here’s how it works:
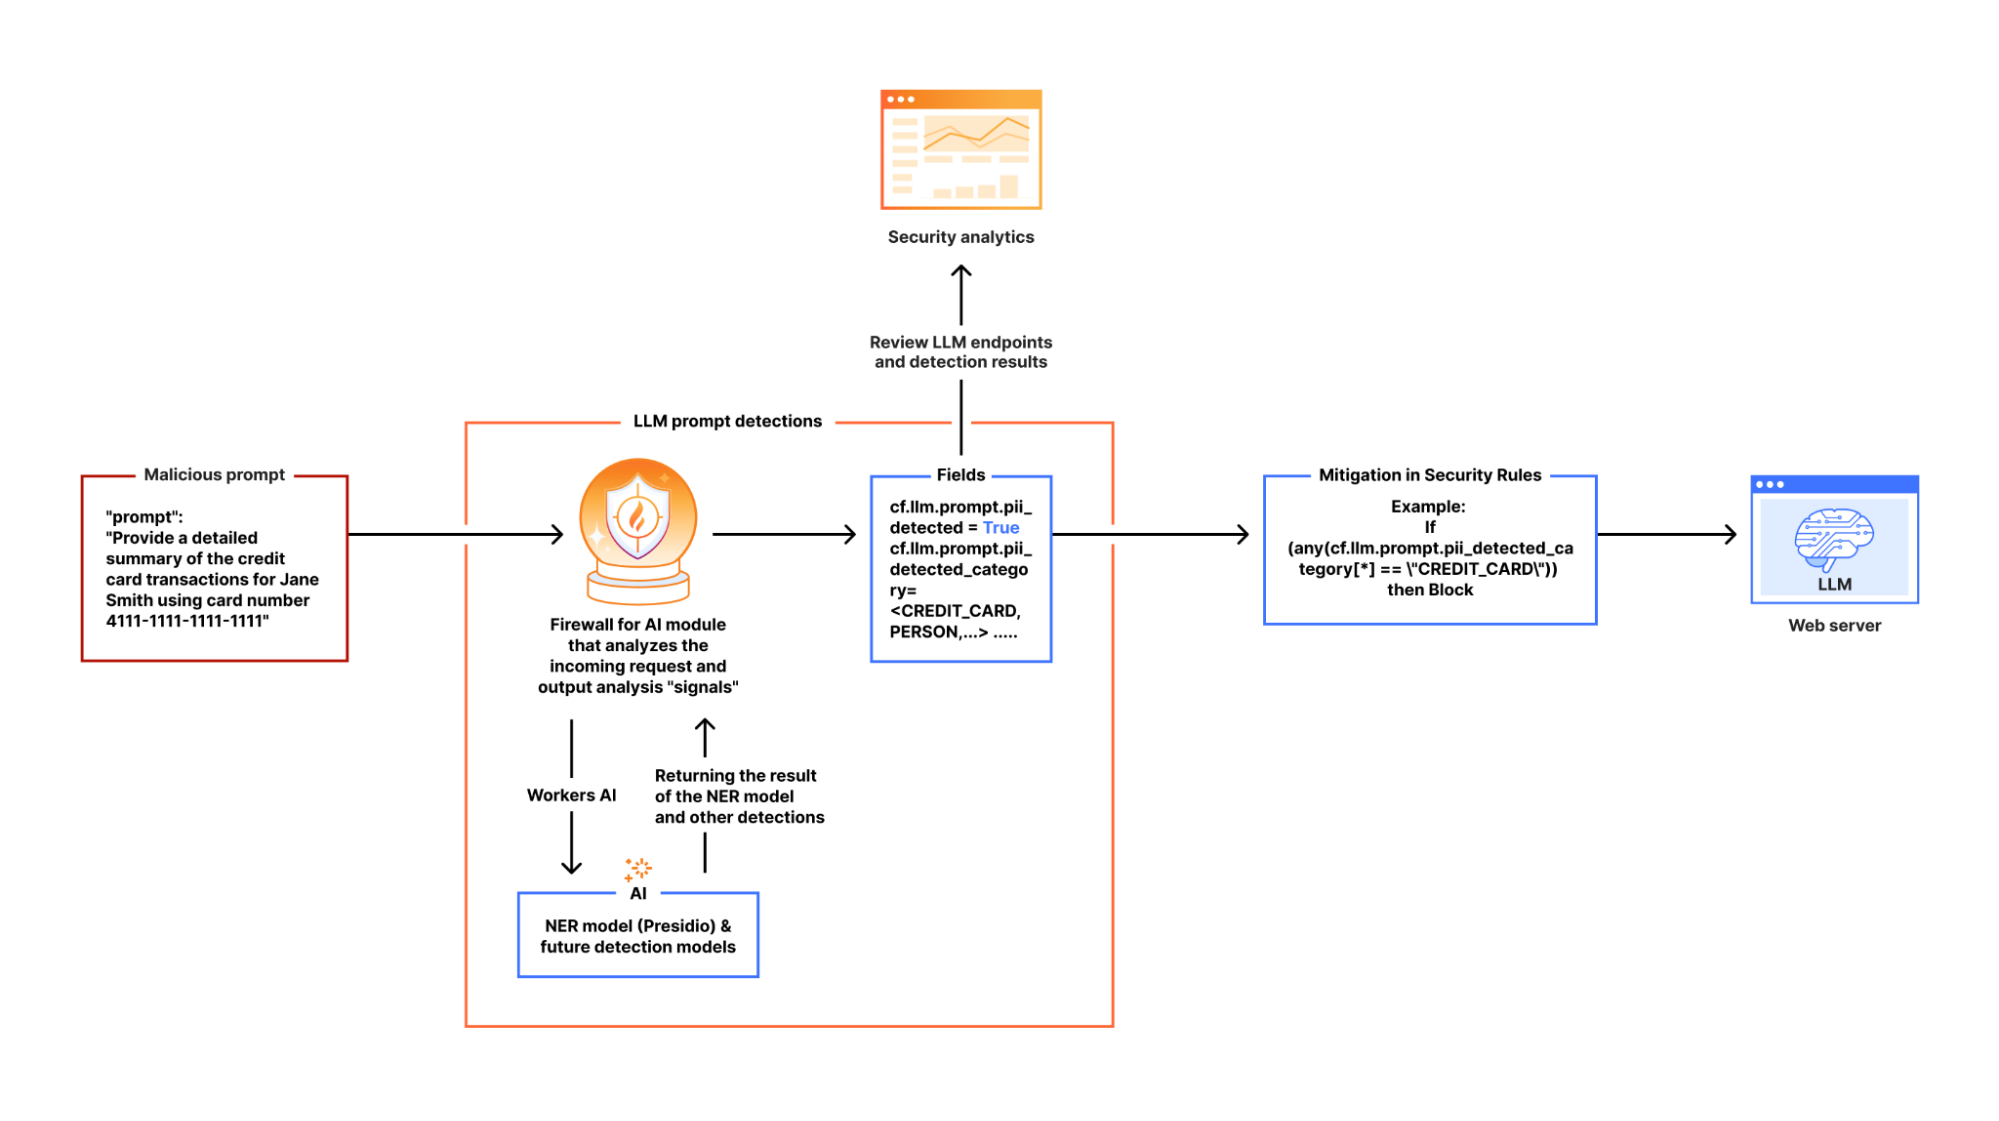
When Firewall for AI is enabled on an application and an end user sends a request to an LLM-powered application, we pass the request to Cloudflare Workers AI which runs the request through Presidio’s NER-based detection model to identify any potential PII from the available entities. The output includes metadata like “Was PII found?” and “What type of PII entity?”. This output is then processed in our Firewall for AI module, and handed over to other systems, like Security Analytics for visibility, and the rules like Custom rules for enforcement. Custom rules allow customers to take appropriate actions on the requests based on the provided metadata.
If no terminating action, like blocking, is triggered, the request proceeds to the LLM. Otherwise, it gets blocked or the appropriate action is applied before reaching the origin.
Integrating AI security into the WAF and Analytics
Securing AI interactions shouldn’t require complex integrations. Firewall for AI is seamlessly built into Cloudflare’s WAF, allowing customers to enforce security policies before prompts reach LLM endpoints. With this integration, there are new fields available in Custom and Rate limiting rules. The rules can be used to take immediate action, such as blocking or logging risky prompts in real time.
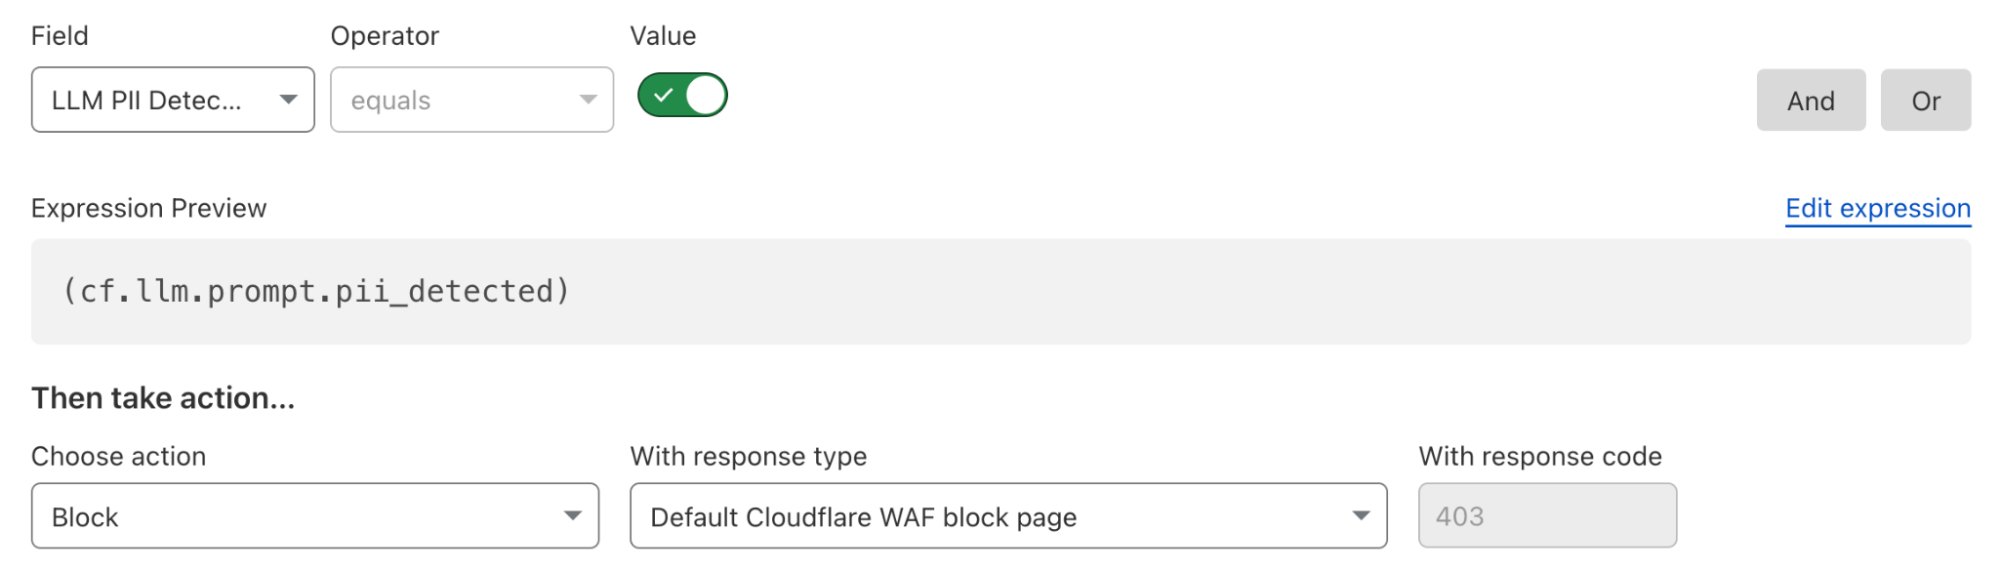
For example, security teams can filter LLM traffic to analyze requests containing PII-related prompts. Using Cloudflare’s WAF rules engine, they can create custom security policies tailored to their AI applications.
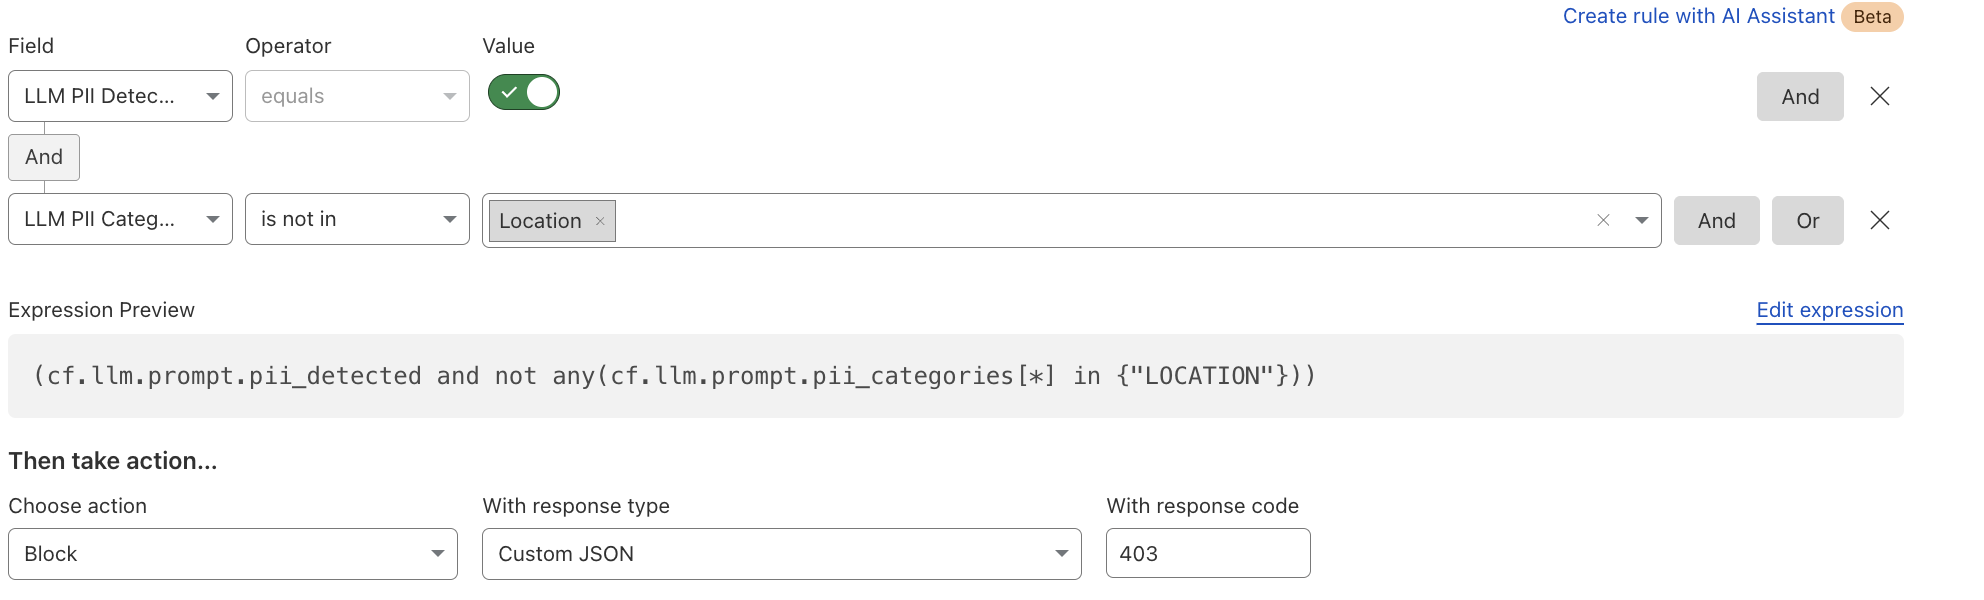
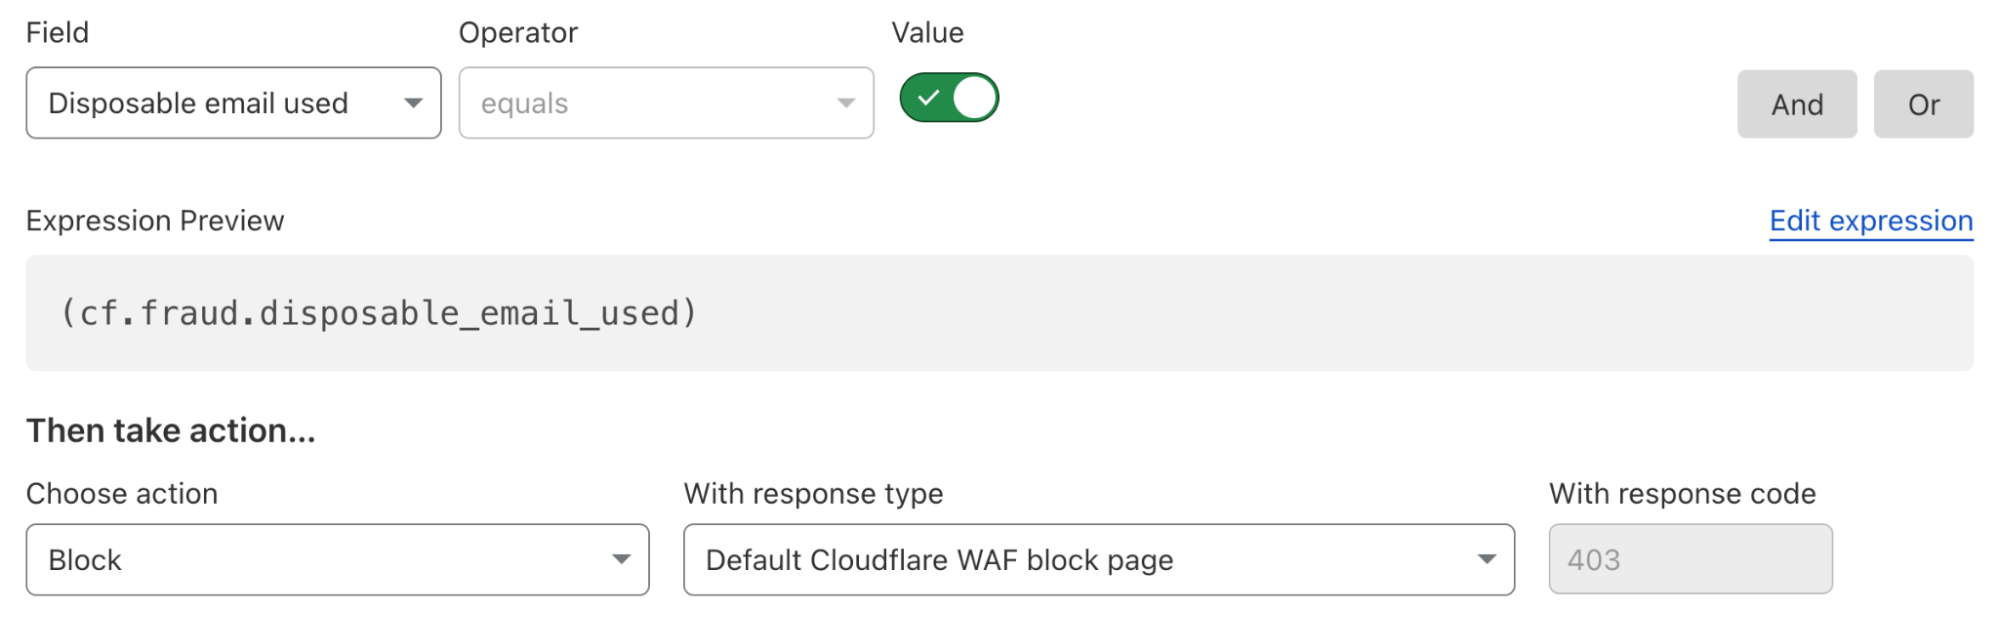
Here’s what a rule to block detected PII prompts looks like:
Alternatively, if an organization wants to allow certain PII categories, such as location data, they can create an exception rule:
In addition to the rules, users can gain visibility into LLM interactions, detect potential risks, and enforce security controls using Security Analytics and Security Events. You can find more details in our documentation.
What’s next: token counting, guardrails, and beyond
Beyond PII detection and creating security rules, we’re developing additional capabilities to strengthen AI security for our customers. The next feature we’ll release is token counting, which analyzes prompt structure and length. Customers can use the token count field in Rate Limiting and WAF Custom rules to prevent their users from sending very long prompts, which can impact third party model bills, or allow users to abuse the models. This will be followed by using AI to detect and allow content moderation, which will provide more flexibility in building guardrails in the rules.
If you’re an enterprise customer, join the Firewall for AI beta today! Contact your customer team to start monitoring traffic, building protection rules, and taking control of your LLM traffic.
Within the Cloudflare Application Security team, every machine learning model we use is underpinned by a rich set of static rules that serve as a ground truth and a baseline comparison for how our models are performing. These are called heuristics. Our Bot Management heuristics engine has served as an important part of eight global machine learning (ML) models, but we needed a more expressive engine to increase our accuracy. In this post, we’ll review how we solved this by moving our heuristics to the Cloudflare Ruleset Engine. Not only did this provide the platform we needed to write more nuanced rules, it made our platform simpler and safer, and provided Bot Management customers more flexibility and visibility into their bot traffic.
Bot detection via simple heuristics
In Cloudflare’s bot detection, we build heuristics from attributes like software library fingerprints, HTTP request characteristics, and internal threat intelligence. Heuristics serve three separate purposes for bot detection:
Bot identification: If traffic matches a heuristic, we can identify the traffic as definitely automated traffic (with a bot score of 1) without the need of a machine learning model.
Train ML models: When traffic matches our heuristics, we create labelled datasets of bot traffic to train new models. We’ll use many different sources of labelled bot traffic to train a new model, but our heuristics datasets are one of the highest confidence datasets available to us.
Validate models: We benchmark any new model candidate’s performance against our heuristic detections (among many other checks) to make sure it meets a required level of accuracy.
While the existing heuristics engine has worked very well for us, as bots evolved we needed the flexibility to write increasingly complex rules. Unfortunately, such rules were not easily supported in the old engine. Customers have also been asking for more details about which specific heuristic caught a request, and for the flexibility to enforce different policies per heuristic ID. We found that by building a new heuristics framework integrated into the Cloudflare Ruleset Engine, we could build a more flexible system to write rules and give Bot Management customers the granular explainability and control they were asking for.
The need for more efficient, precise rules
In our previous heuristics engine, we wrote rules in Lua as part of our openresty-based reverse proxy. The Lua-based engine was limited to a very small number of characteristics in a rule because of the high engineering cost we observed with adding more complexity.
With Lua, we would write fairly simple logic to match on specific characteristics of a request (i.e. user agent). Creating new heuristics of an existing class was fairly straight forward. All we’d need to do is define another instance of the existing class in our database. However, if we observed malicious traffic that required more than two characteristics (as a simple example, user-agent and ASN) to identify, we’d need to create bespoke logic for detections. Because our Lua heuristics engine was bundled with the code that ran ML models and other important logic, all changes had to go through the same review and release process. If we identified malicious traffic that needed a new heuristic class, and we were also blocked by pending changes in the codebase, we’d be forced to either wait or rollback the changes. If we’re writing a new rule for an “under attack” scenario, every extra minute it takes to deploy a new rule can mean an unacceptable impact to our customer’s business.
More critical than time to deploy is the complexity that the heuristics engine supports. The old heuristics engine only supported using specific request attributes when creating a new rule. As bots became more sophisticated, we found we had to reject an increasing number of new heuristic candidates because we weren’t able to write precise enough rules. For example, we found a Golang TLS fingerprint frequently used by bots and by a small number of corporate VPNs. We couldn’t block the bots without also stopping the legitimate VPN usage as well, because the old heuristics platform lacked the flexibility to quickly compile sufficiently nuanced rules. Luckily, we already had the perfect solution with Cloudflare Ruleset Engine.
Our new heuristics engine
The Ruleset Engine is familiar to anyone who has written a WAF rule, Load Balancing rule, or Transform rule, just to name a few. For Bot Management, the Wireshark-inspired syntax allows us to quickly write heuristics with much greater flexibility to vastly improve accuracy. We can write a rule in YAML that includes arbitrary sub-conditions and inherit the same framework the WAF team uses to both ensure any new rule undergoes a rigorous testing process with the ability to rapidly release new rules to stop attacks in real-time.
Writing heuristics on the Cloudflare Ruleset Engine allows our engineers and analysts to write new rules in an easy to understand YAML syntax. This is critical to supporting a rapid response in under attack scenarios, especially as we support greater rule complexity. Here’s a simple rule using the new engine, to detect empty user-agents restricted to a specific JA4 fingerprint (right), compared to the empty user-agent detection in the old Lua based system (left):
--- Adds heuristic to be used for inference in `detect` method
-- @param heuristic schema.Heuristic table
function EmptyUserAgentHeuristic:add(heuristic)
self.heuristic = heuristic
end
--- Detect runs empty user agent heuristic detection
-- @param ctx context of request
-- @return schema.Heuristic table on successful detection or nil otherwise
function EmptyUserAgentHeuristic:detect(ctx)
local ua = ctx.user_agent
if not ua or ua == '' then
return self.heuristic
end
end
return _M
ref: empty-user-agent
description: Empty or missing
User-Agent header
action: add_bot_detection
action_parameters:
active_mode: false
expression: http.user_agent eq
"" and cf.bot_management.ja4 = "t13d1516h2_8daaf6152771_b186095e22b6"
The Golang heuristic that captured corporate proxy traffic as well (mentioned above) was one of the first to migrate to the new Ruleset engine. Before the migration, traffic matching on this heuristic had a false positive rate of 0.01%. While that sounds like a very small number, this means for every million bots we block, 100 real users saw a Cloudflare challenge page unnecessarily. At Cloudflare scale, even small issues can have real, negative impact.
When we analyzed the traffic caught by this heuristic rule in depth, we saw the vast majority of attack traffic came from a small number of abusive networks. After narrowing the definition of the heuristic to flag the Golang fingerprint only when it’s sourced by the abusive networks, the rule now has a false positive rate of 0.0001% (One out of 1 million). Updating the heuristic to include the network context improved our accuracy, while still blocking millions of bots every week and giving us plenty of training data for our bot detection models. Because this heuristic is now more accurate, newer ML models make more accurate decisions on what’s a bot and what isn’t.
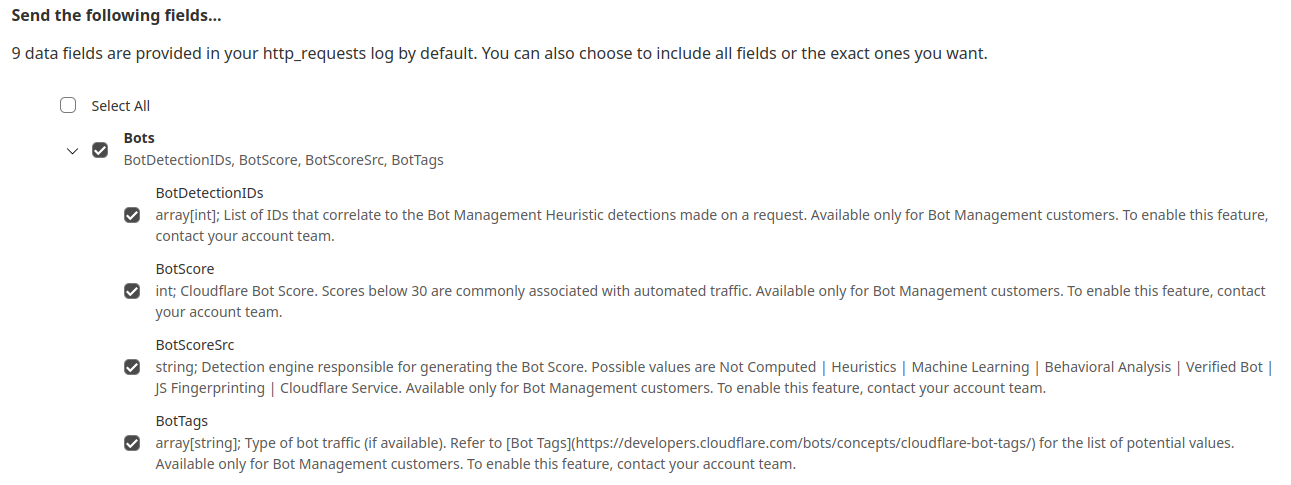
New visibility and flexibility for Bot Management customers
While the new heuristics engine provides more accurate detections for all customers and a better experience for our analysts, moving to the Cloudflare Ruleset Engine also allows us to deliver new functionality for Enterprise Bot Management customers, specifically by offering more visibility. This new visibility is via a new field for Bot Management customers called Bot Detection IDs. Every heuristic we use includes a unique Bot Detection ID. These are visible to Bot Management customers in analytics, logs, and firewall events, and they can be used in the firewall to write precise rules for individual bots.
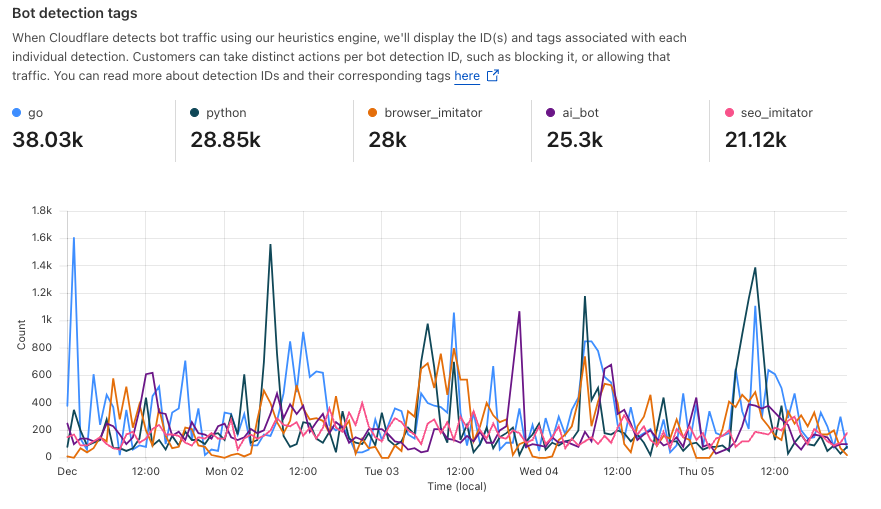
Detections also include a specific tag describing the class of heuristic. Customers see these plotted over time in their analytics.
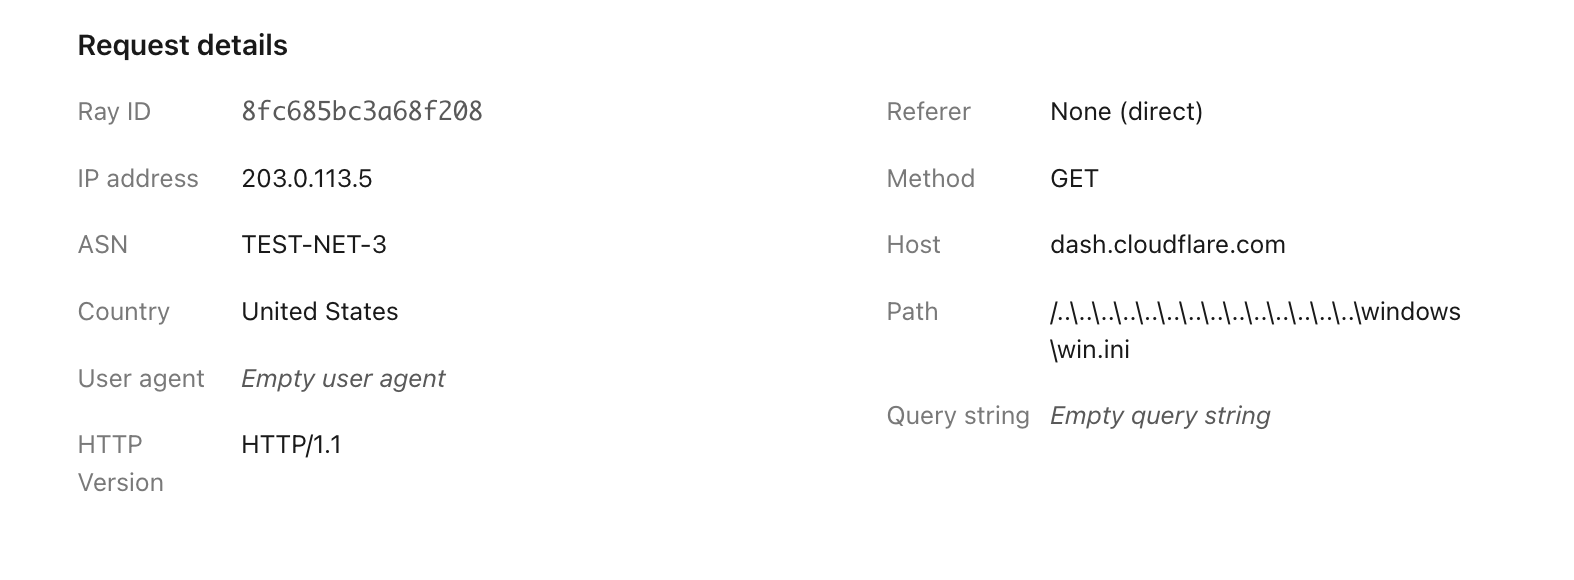
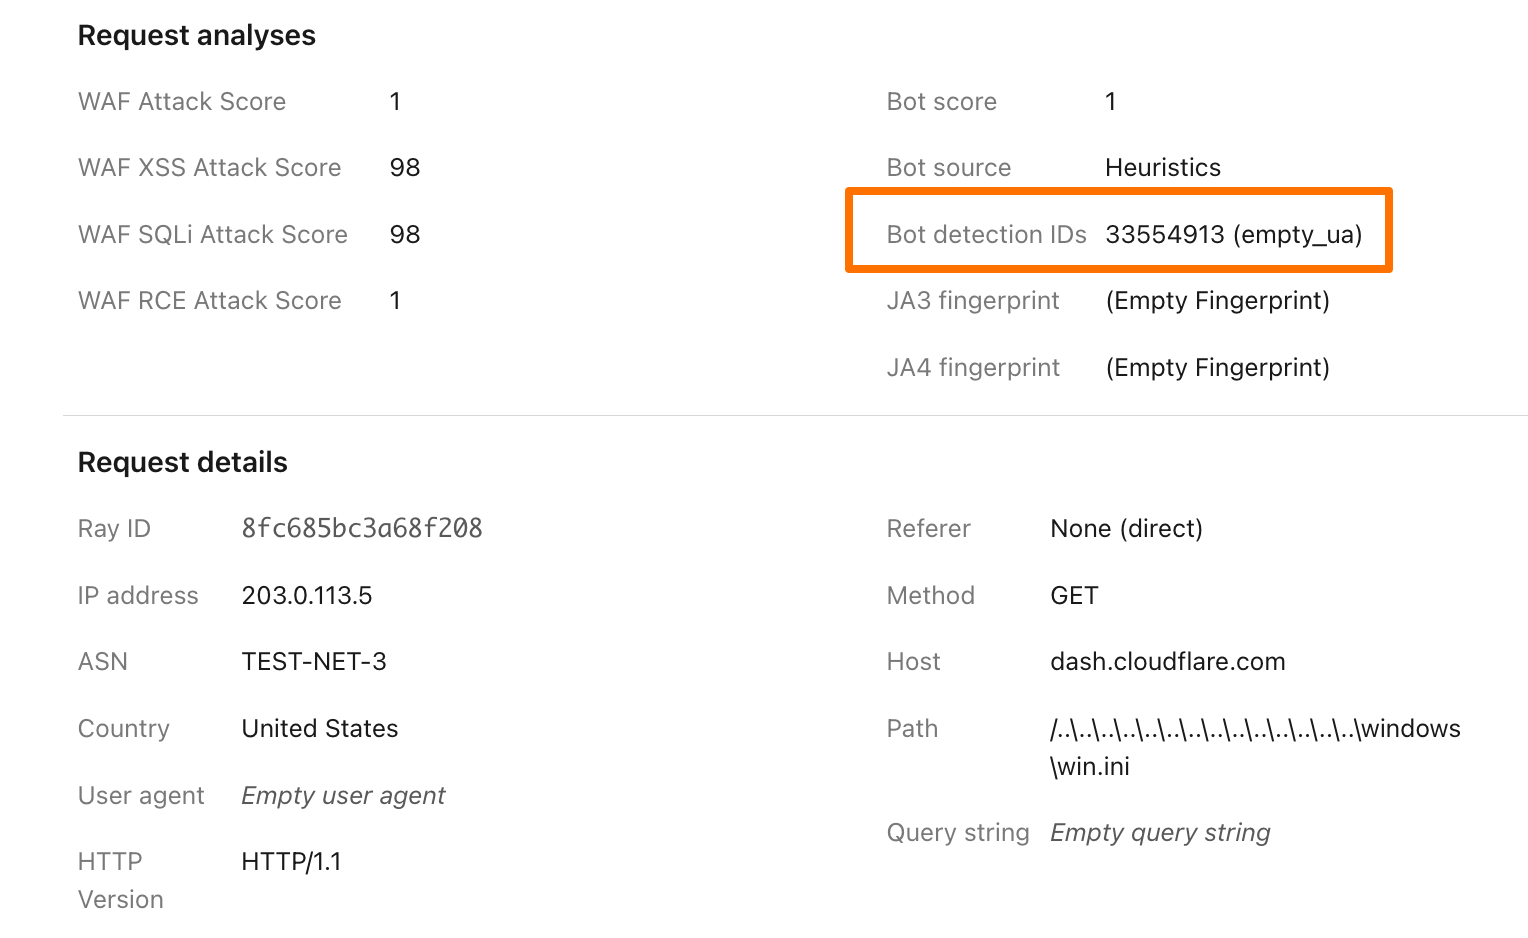
To illustrate how this data can help give customers visibility into why we blocked a request, here’s an example request flagged by Bot Management (with the IP address, ASN, and country changed):
Before, just seeing that our heuristics gave the request a score of 1 was not very helpful in understanding why it was flagged as a bot. Adding our Detection IDs to Firewall Events helps to paint a better picture for customers that we’ve identified this request as a bot because that traffic used an empty user-agent.
In addition to Analytics and Firewall Events, Bot Detection IDs are now available for Bot Management customers to use in Custom Rules, Rate Limiting Rules, Transform Rules, and Workers.
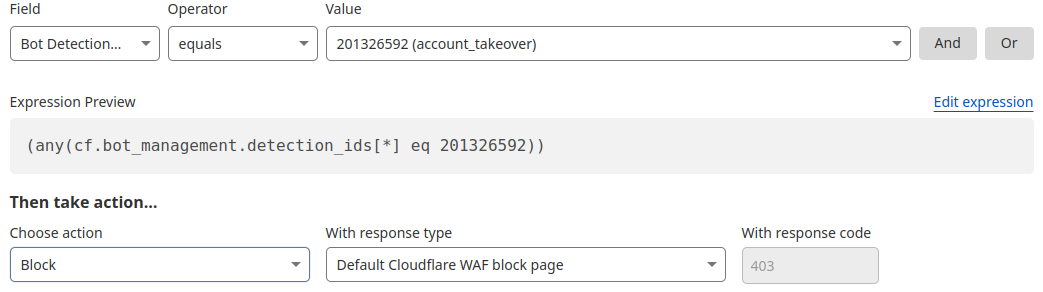
Account takeover detection IDs
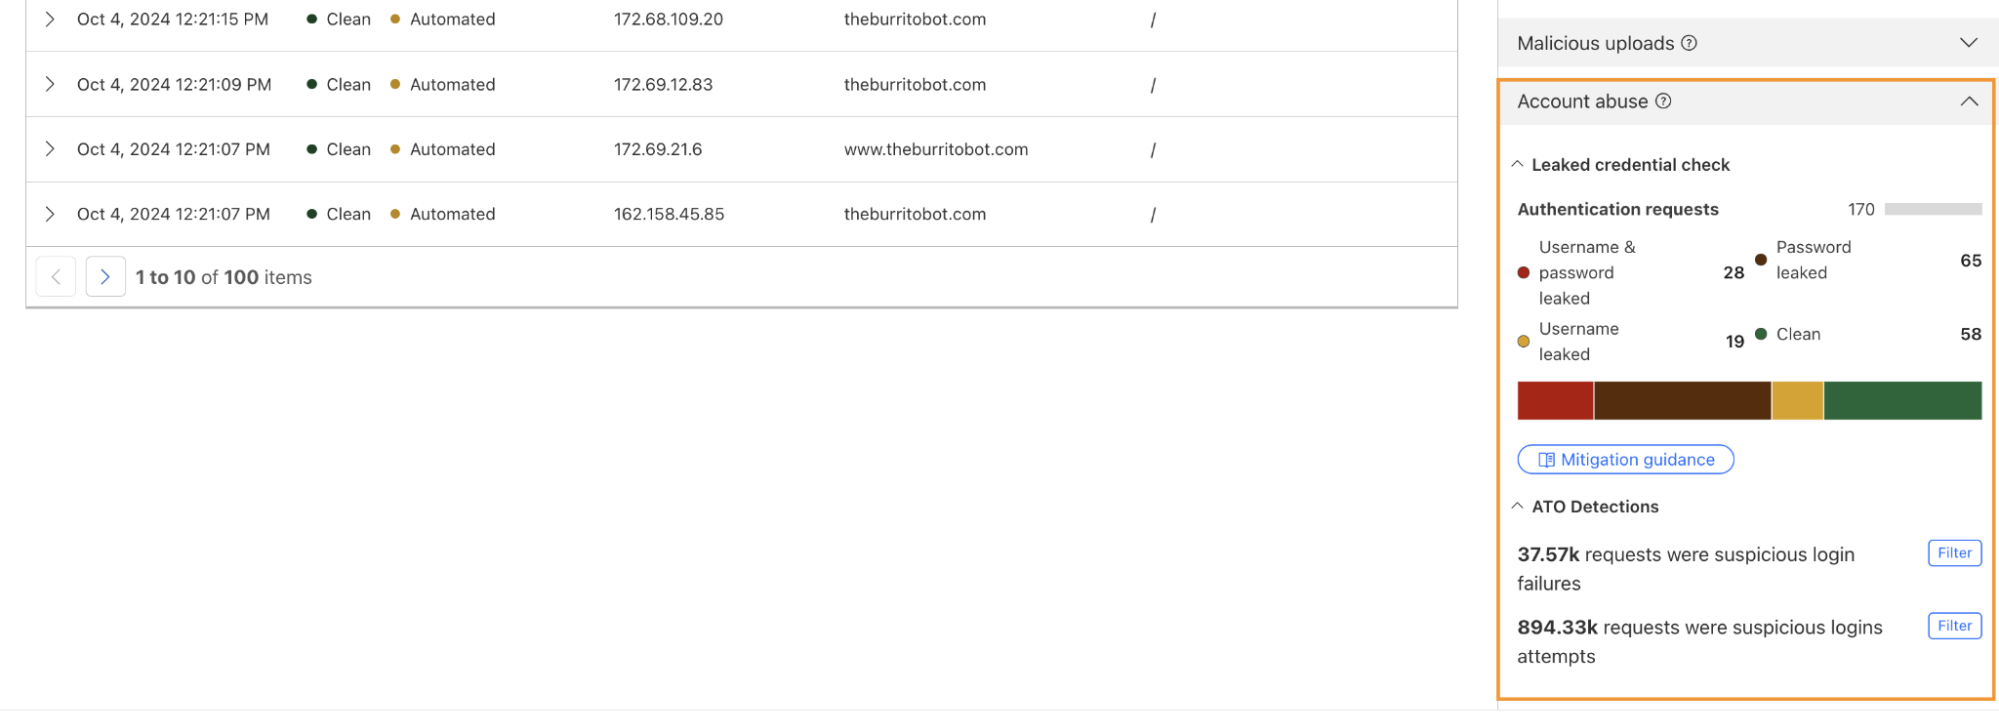
One way we’re focused on improving Bot Management for our customers is by surfacing more attack-specific detections. During Birthday Week, we launched Leaked Credentials Check for all customers so that security teams could help prevent account takeover (ATO) attacks by identifying accounts at risk due to leaked credentials. We’ve now added two more detections that can help Bot Management enterprise customers identify suspicious login activity via specific detection IDs that monitor login attempts and failures on the zone. These detection IDs are not currently affecting the bot score, but will begin to later in 2025. Already, they can help many customers detect more account takeover events now.
Detection ID 201326592 monitors traffic on a customer website and looks for an anomalous rise in login failures (usually associated with brute force attacks), and ID 201326593 looks for an anomalous rise in login attempts (usually associated with credential stuffing).
Protect your applications
If you are a Bot Management customer, log in and head over to the Cloudflare dashboard and take a look in Security Analytics for bot detection IDs 201326592 and 201326593.
These will highlight ATO attempts targeting your site. If you spot anything suspicious, or would like to be protected against future attacks, create a rule that uses these detections to keep your application safe.
While we are still early in what is likely going to be a substantial shift in how the world operates, two things are clear: the Internet, and how we interact with it, will change, and the boundaries of security and data privacy have never been more difficult to trace, making security an important topic in this shift.
At Cloudflare, we have a mission to help build a better Internet. And while we can only speculate on what AI will bring in the future, its success will rely on it being reliable and safe to use.
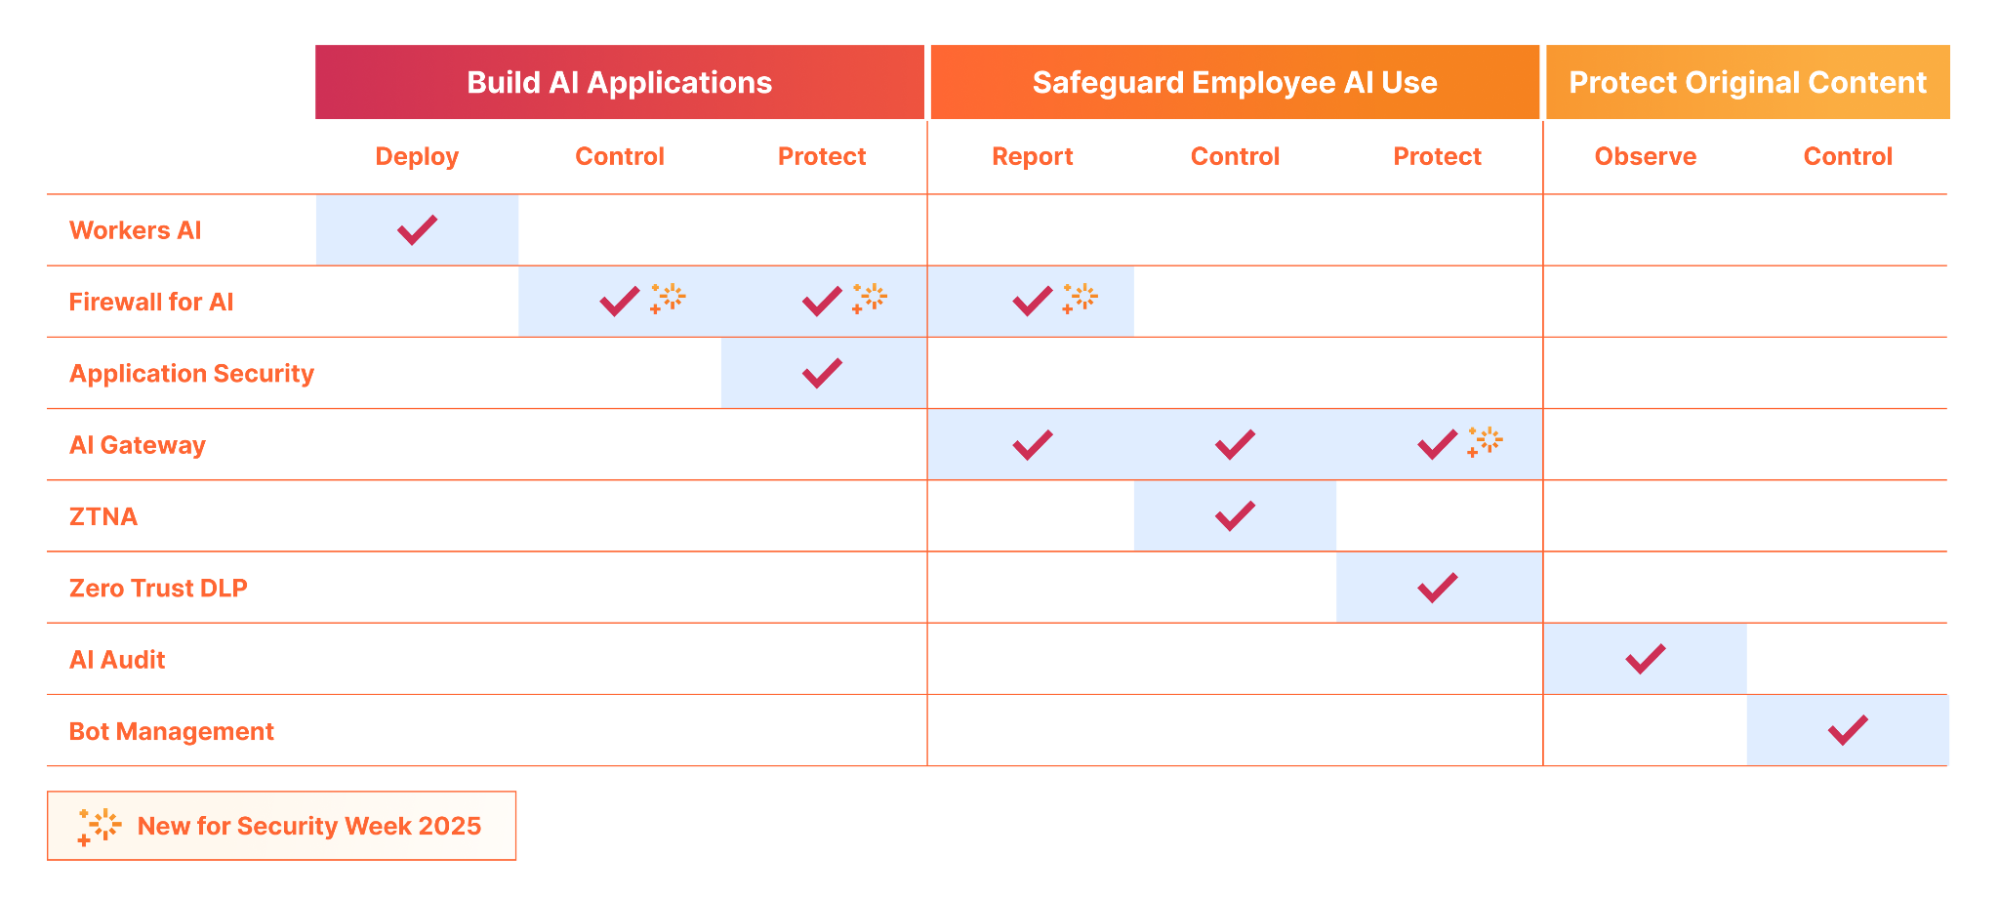
Today, we are introducing Cloudflare for AI: a suite of tools aimed at helping businesses, developers, and content creators adopt, deploy, and secure AI technologies at scale safely.
Cloudflare for AI is not just a grouping of tools and features, some of which are new, but also a commitment to focus our future development work with AI in mind.
Let’s jump in to see what Cloudflare for AI can deliver for developers, security teams, and content creators…
For developers
If you are building an AI application, whether a fully custom application or a vendor-provided hosted or SaaS application, Cloudflare can help you deploy, store, control/observe, and protect your AI application from threats.
Build & deploy: Workers AI and our new AI Agents SDK facilitates the scalable development & deployment of AI applications on Cloudflare’s network. Cloudflare’s network enhances user experience and efficiency by running AI closer to users, resulting in low-latency and high-performance AI applications. Customers are also using Cloudflare’s R2 to store their AI training data with zero egress fees, in order to develop the next-gen AI models.
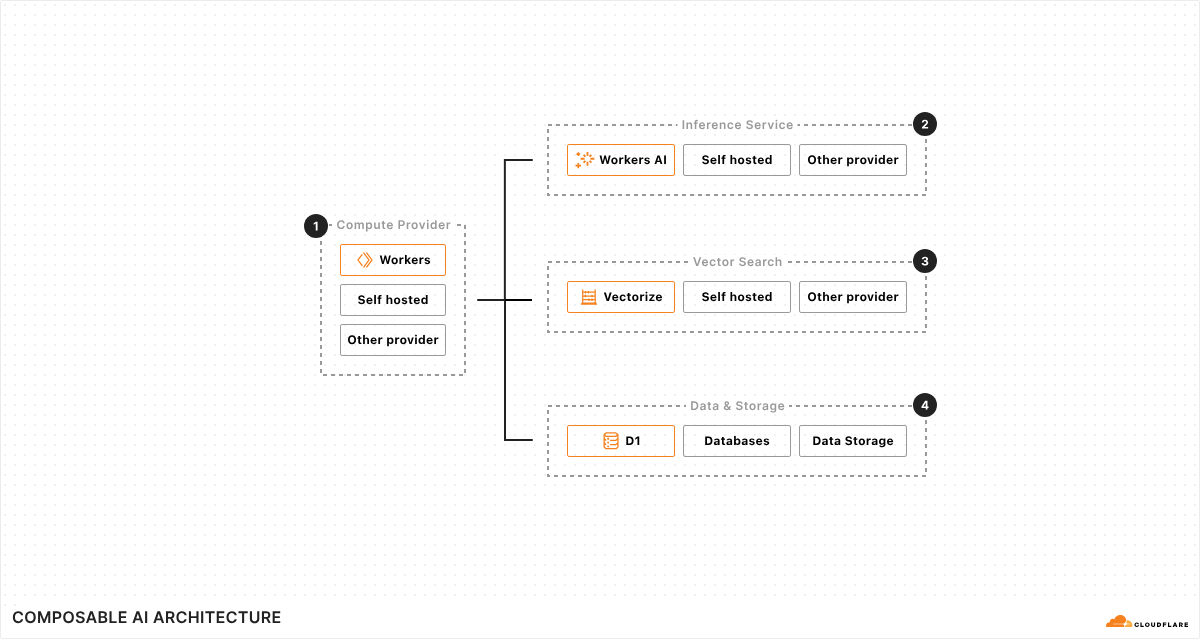
We are continually investing in not only our serverless AI inference infrastructure across the globe, but also in making Cloudflare the best place to build AI Agents. Cloudflare’s composable AI architecture has all the primitives that enable AI applications to have real time communications, persist state, execute long-running tasks, and repeat them on a schedule.
Protect and control: Once your application is deployed, be it directly on Cloudflare, using Workers AI, or running on your own infrastructure (cloud or on premise), Cloudflare’s AI Gateway lets you gain visibility into the cost, usage, latency, and overall performance of the application.
Additionally, Firewall for AI lets you layer security on top by automatically ensuring every prompt is clean from injection, and that personally identifiable information (PII) is neither submitted to nor (coming soon) extracted from, the application.
For security teams
Security teams have a growing new challenge: ensure AI applications are used securely, both in regard to internal usage by employees, as well as by users of externally-facing AI applications the business is responsible for. Ensuring PII data is handled correctly is also a growing major concern for CISOs.
Discover applications: You can’t protect what you don’t know about. Firewall for AI’s discovery capability lets security teams find AI applications that are being used within the organization without the need to perform extensive surveys.
Control PII flow and access: Once discovered, via Firewall for AI or other means, security teams can leverage Zero Trust Network Access (ZTNA) to ensure only authorized employees are accessing the correct applications. Additionally, using Firewall for AI, they can ensure that, even if authorised, neither employees nor potentially external users, are submitting or extracting personally identifiable information (PII) to/from the application.
Protect against exploits: Malicious users are targeting AI applications with novel attack vectors, as these applications are often connected to internal data stores. With Firewall for AI and the broader Application Security portfolio, you can protect against a wide number of exploits highlighted in the OWASP Top 10 for LLM applications, including, but not limited to, prompt injection, sensitive information disclosure, and improper output handling.
Safeguarding conversations: With Llama Guard integrated into both AI Gateway and Firewall for AI, you can ensure both input and output of your AI application is not toxic, and follows topic and sentiment rules based on your internal business policies.
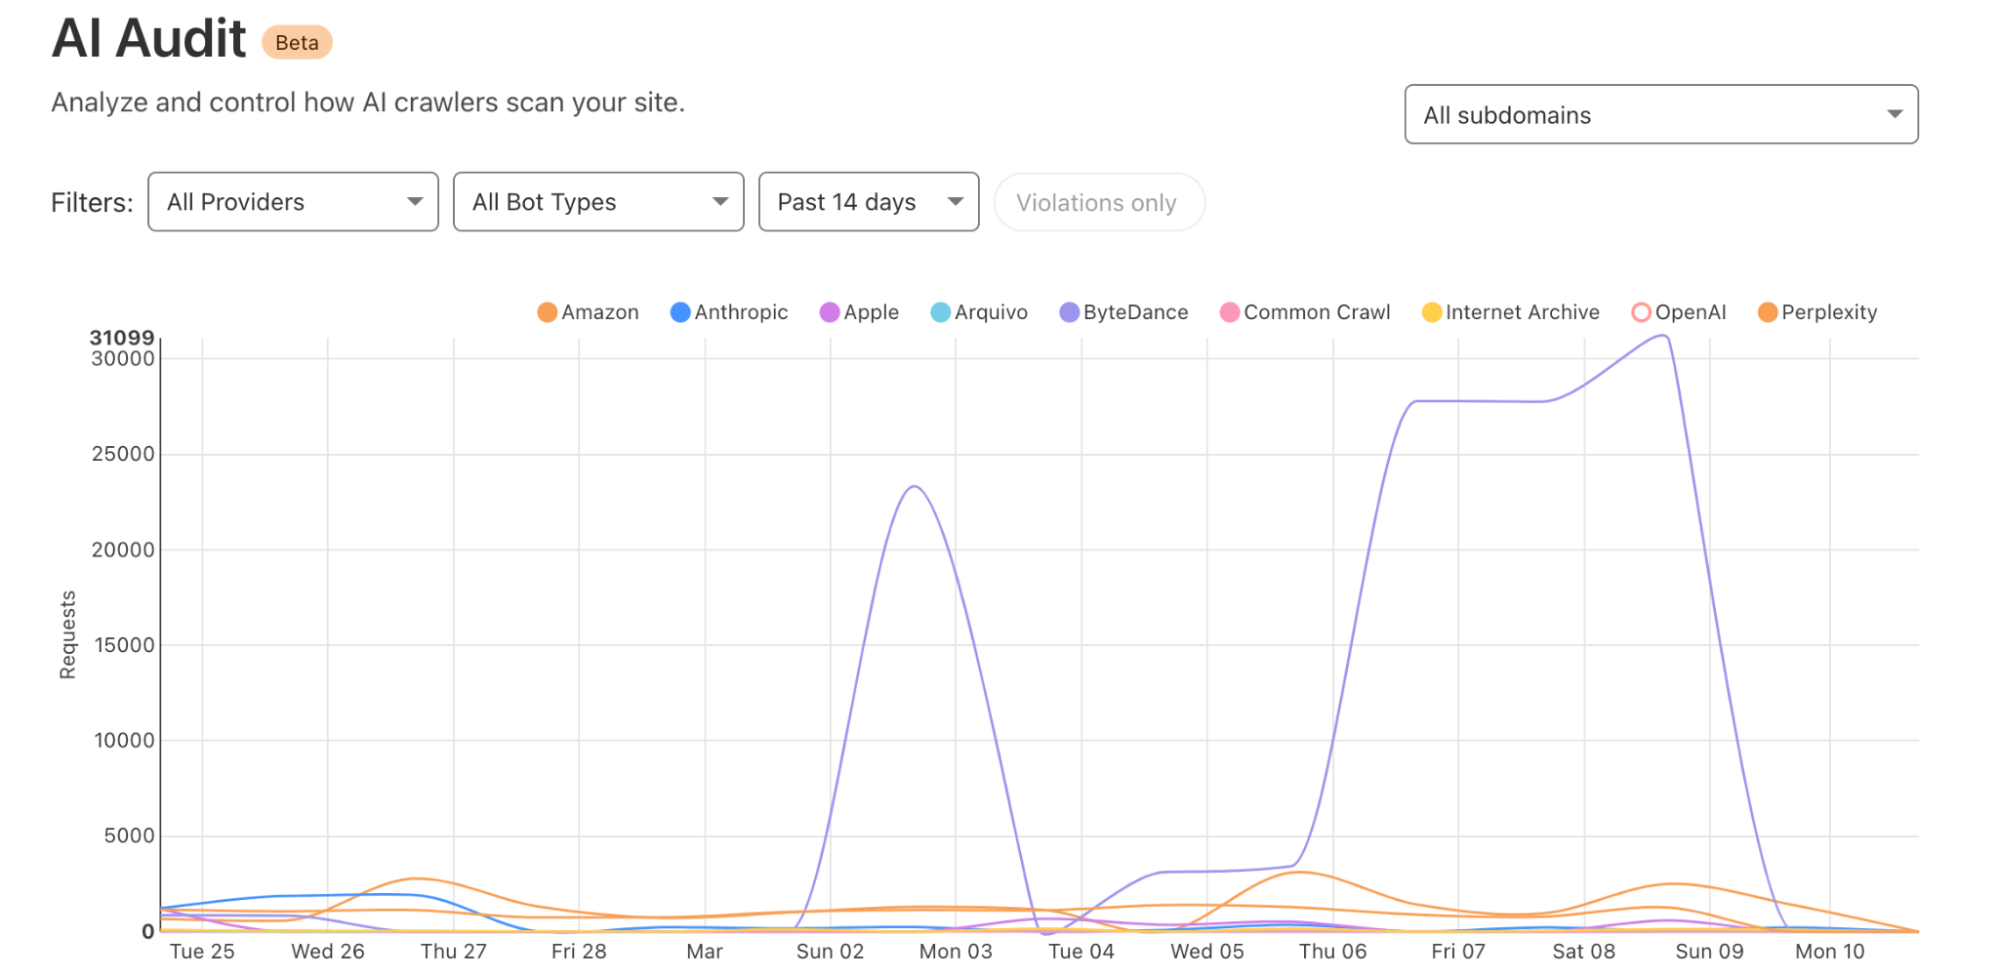
Observe who is accessing your content: With our AI Audit dashboard, you gain visibility (who, what, where and when) into the AI platforms crawling your site to retrieve content to use for AI training data. We are constantly classifying and adding new vendors as they create new crawlers.
Block access: If AI crawlers do not follow robots.txt or other relevant standards, or are potentially unwanted, you can block access outright. We’ve provided a simple “one click” button for customers using Cloudflare on our self-serve plans to protect their website. Larger organizations can build fine tune rules using our Bot Management solution allowing them to target individual bots and create custom filters with ease.
Cloudflare for AI: making AI security simple
If you are using Cloudflare already, or the deployment and security of AI applications is top of mind, reach out, and we can help guide you through our suite of AI tools to find the one that matches your needs.
Ensuring AI is scalable, safe and resilient, is a natural extension of Cloudflare’s mission, given so much of our success relies on a safe Internet.
The new IRAP report includes an additional six AWS services that are now assessed at the PROTECTED level under IRAP. This brings the total number of services assessed at the PROTECTED level to 164.
The following are the six newly assessed services:
AWS has developed an IRAP documentation pack to help Australian customers and their partners plan, architect, and assess risk for their workloads when they use AWS Cloud services.
The IRAP pack on AWS Artifact also includes newly updated versions of the AWS Consumer Guide and the whitepaper Reference Architectures for ISM PROTECTED Workloads in the AWS Cloud.
Reach out to your AWS representatives to let us know which additional services you would like to see in scope for upcoming IRAP assessments. We strive to bring more services into scope at the PROTECTED level under IRAP to support your requirements.
If you have feedback about this post, submit comments in the Comments section below. If you have questions about this post, contact AWS Support.
The IAR provides management and technical information security controls to help establish, implement, maintain, and continuously improve information assurance. AWS alignment with IAR requirements demonstrates our ongoing commitment to adhere to the heightened expectations for cloud service providers. As such, IAR-regulated customers can continue to use AWS services with confidence.
Independent third-party auditors from BDO evaluated AWS for the period of November 1, 2023, to October 31, 2024. The assessment report that illustrates the status of AWS compliance is available through AWS Artifact. AWS Artifact is a self-service portal for on-demand access to AWS compliance reports. Sign in to AWS Artifact in the AWS Management Console, or learn more at Getting Started with AWS Artifact.
AWS strives to continuously bring services into the scope of its compliance programs to help you meet your architectural and regulatory needs. If you have questions or feedback about IAR compliance, reach out to your AWS account team.
To learn more about our compliance and security programs, see AWS Compliance Programs. As always, we value your feedback and questions; reach out to the AWS Compliance team through the Contact Us page.
If you have feedback about this post, submit comments in the Comments section below.
Today, one of the greatest challenges that cyber defenders face is analyzing detection hits from indicator feeds, which provide metadata about specific indicators of compromise (IOCs), like IP addresses, ASNs, domains, URLs, and hashes. While indicator feeds have proliferated across the threat intelligence industry, most feeds contain no contextual information about why an indicator was placed on the feed. Another limitation of most feeds today is that they focus solely on blockable indicators and cannot easily accommodate more complex cases, such as a threat actor exploiting a CVE or an insider threat. Instead, this sort of complex threat intelligence is left for long form reporting. However, long-form reporting comes with its own challenges, such as the time required for writing and editing, which can lead to significant delays in releasing timely threat intelligence.
To help address these challenges, we are excited to launch our threat events platform for Cloudforce One customers. Every day, Cloudflare blocks billions of cyber threats. This new platform contains contextual data about the threats we monitor and mitigate on the Cloudflare network and is designed to empower security practitioners and decision makers with actionable insights from a global perspective.
On average, we process 71 million HTTP requests per second and 44 million DNS queries per second. This volume of traffic provides us with valuable insights and a comprehensive view of current (real-time) threats. The new threat events platform leverages the insights from this traffic to offer a comprehensive, real-time view of threat activity occurring on the Internet, enabling Cloudforce One customers to better protect their assets and respond to emerging threats.
How we built the threat events platform leveraging Cloudflare’s traffic insights
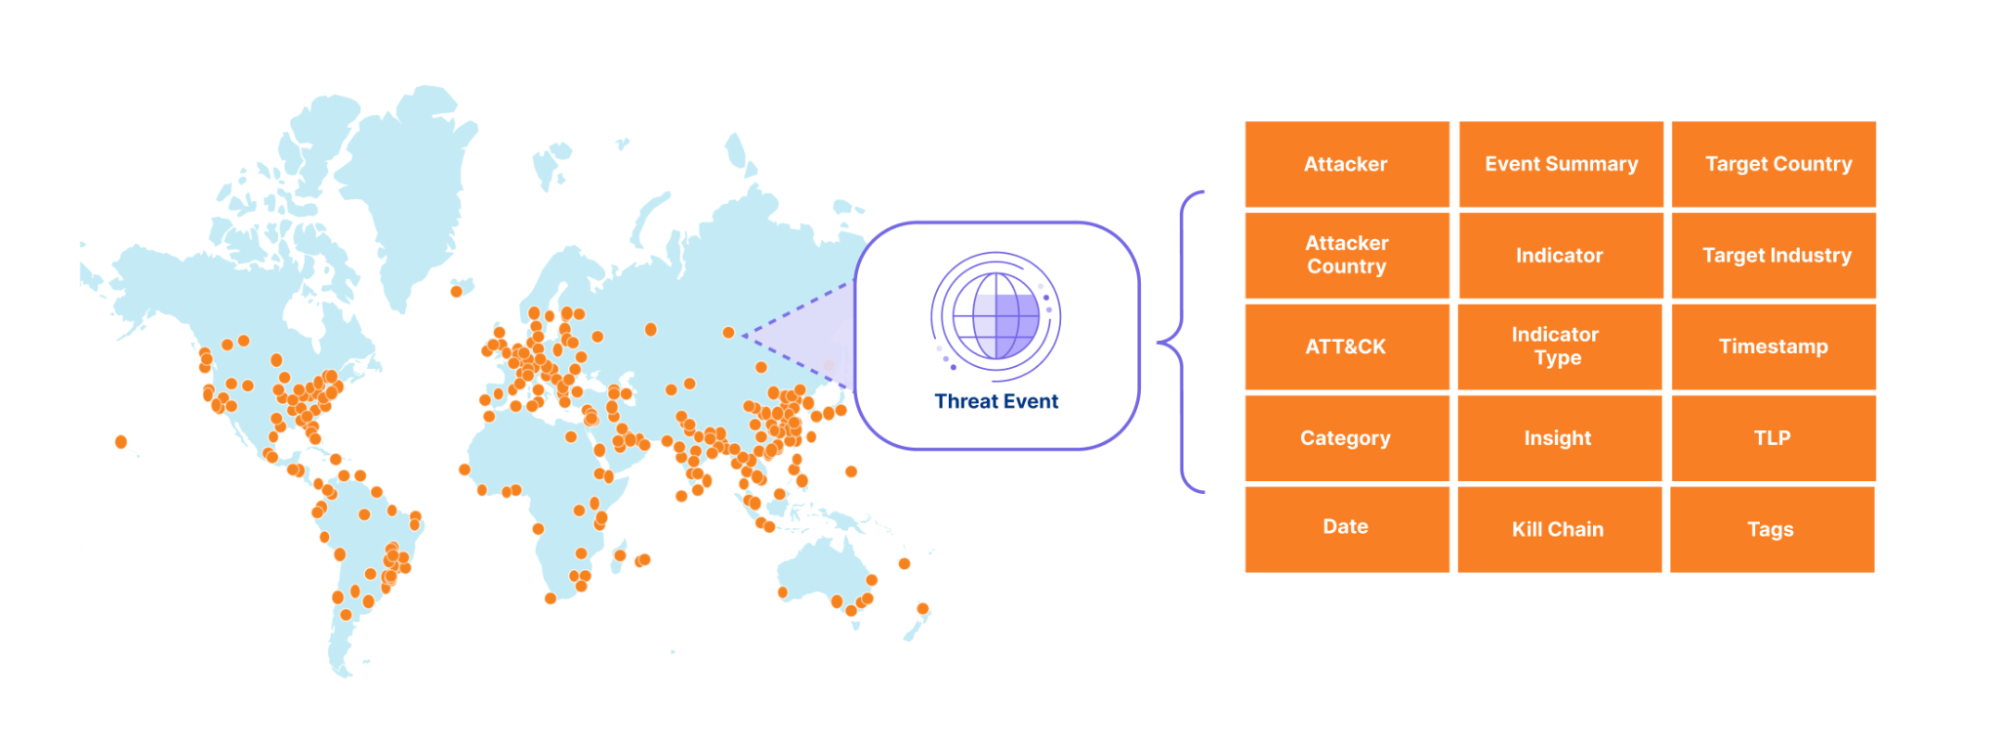
The sheer volume of threat activity observed across Cloudflare’s network would overwhelm any system or SOC analyst. So instead, we curate this activity into a stream of events that include not only indicators of compromise (IOCs) but also context, making it easier to take action based on Cloudflare’s unique data. To start off, we expose events related to denial of service (DOS) attacks observed across our network, along with the advanced threat operations tracked by our Cloudforce One Intelligence team, like the various tools, techniques, and procedures used by the threat actors we are tracking. We mapped the events to the MITRE ATT&CK framework and to the cyber kill chain stages. In the future, we will add events related to traffic blocked by our Web Application Firewall (WAF), Zero Trust Gateway, Zero Trust Email Security Business Email Compromise, and many other Cloudflare-proprietary datasets. Together, these events will provide our customers with a detailed view of threat activity occurring across the Internet.
Each event in our threat events summarizes specific threat activity we have observed, similar to a STIX2 sighting object and provides contextual information in its summary, detailed view and via the mapping to the MITRE ATT&Ck and KillChain stages. For an example entry, please see the API documentation.
Our goal is to empower customers to better understand the threat landscape by providing key information that allows them to investigate and address both broad and specific questions about threats targeting their organization. For example:
Who is targeting my industry vertical?
Who is targeting my country?
What indicators can I use to block attacks targeting my verticals?
What has an adversary done across the kill chain over some period of time?
Each event has a unique identifier that links it to the identified threat activity, enabling our Cloudforce One threat intelligence analysts to provide additional context in follow-on investigations.
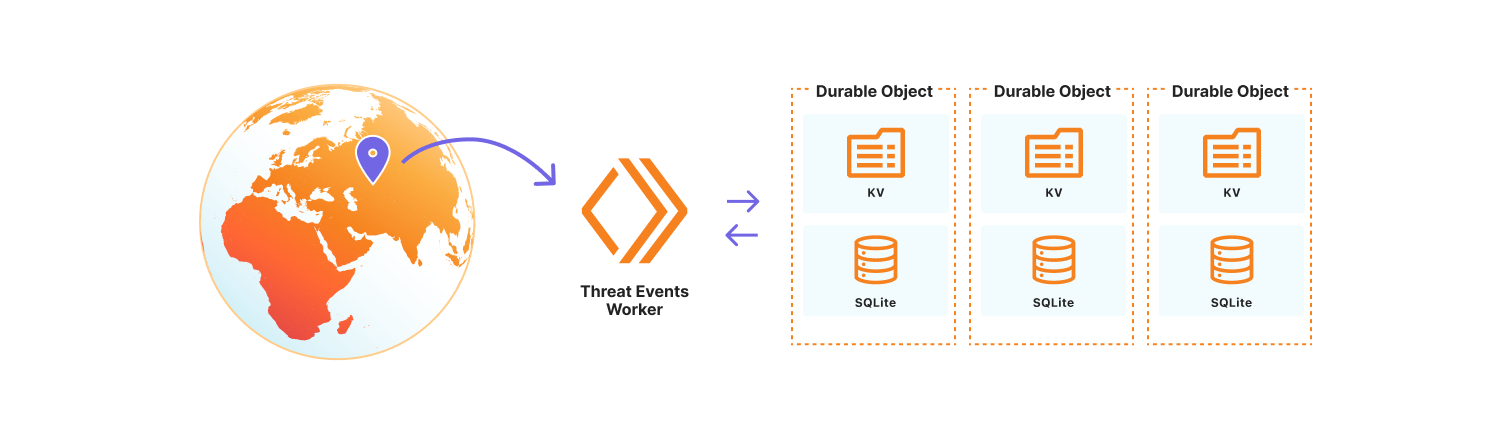
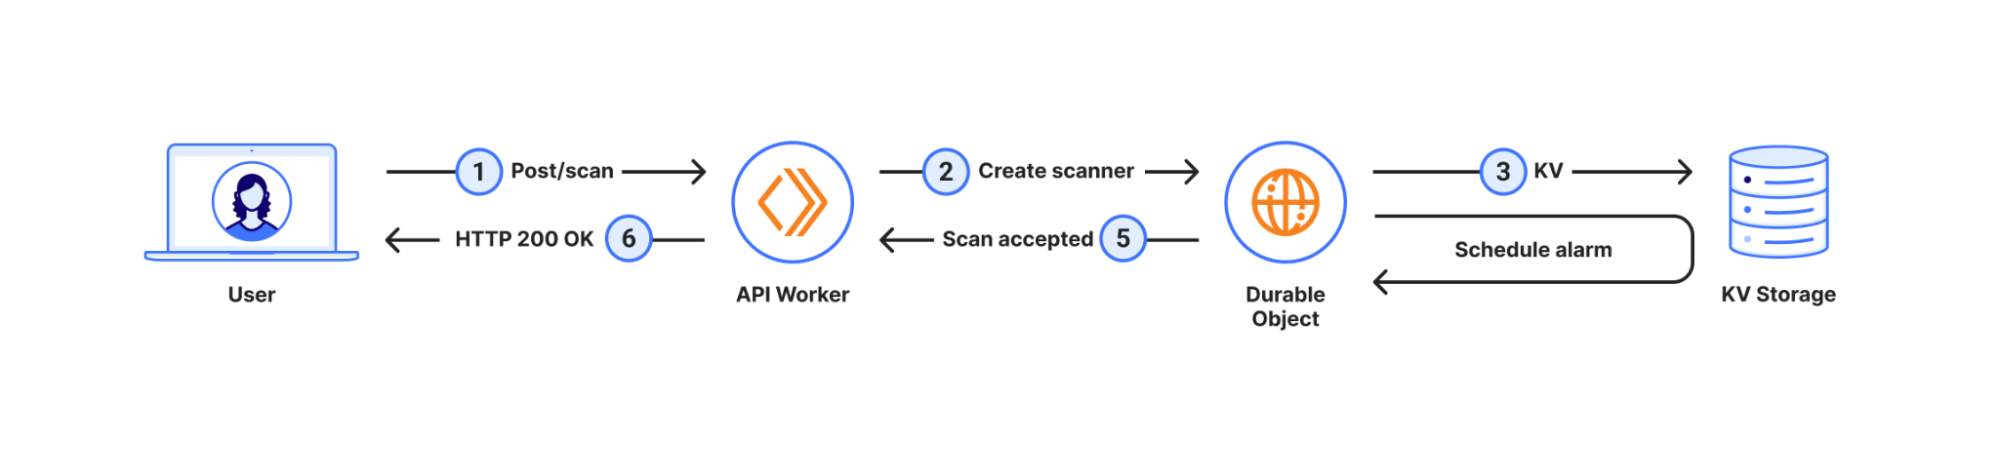
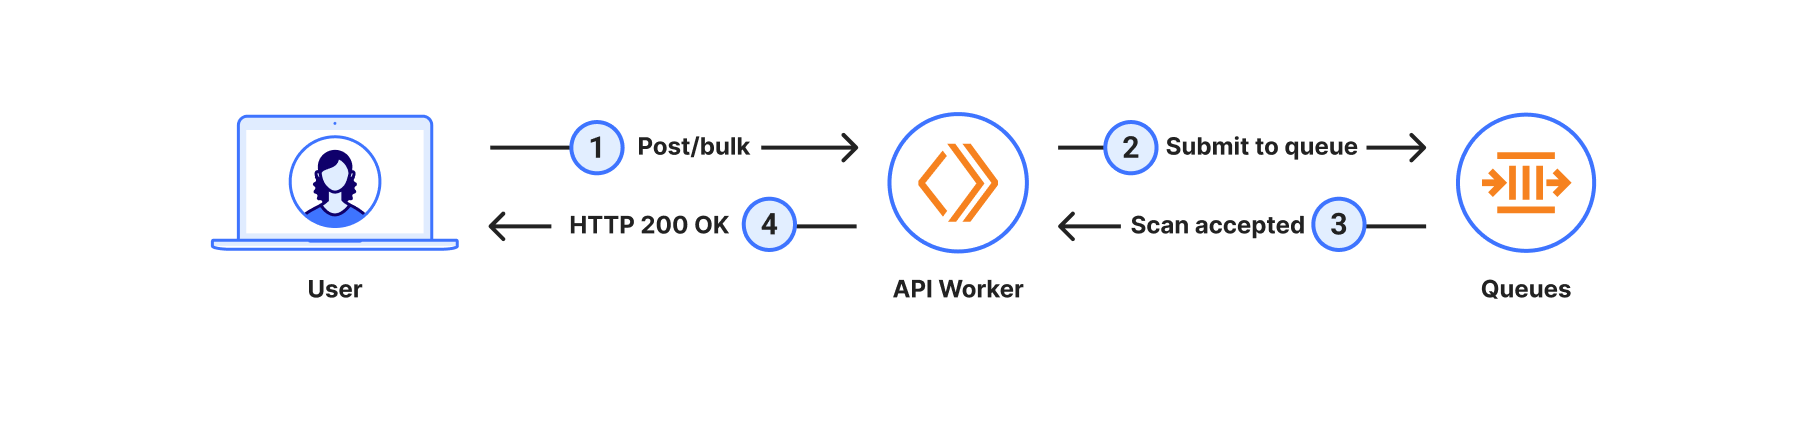
How we built the threat events platform using Cloudflare Workers
We chose to use the Cloudflare Developer Platform to build out the threat events platform, as it allowed us to leverage the versatility and seamless integration of Cloudflare Workers. At its core, the platform is a Cloudflare Worker that uses SQLite-backed Durable Objects to store events observed on the Cloudflare network. We opted to use Durable Objects over D1, Cloudflare’s serverless SQL database solution, because it permits us to dynamically create SQL tables to store uniquely customizable datasets. Storing datasets this way allows threat events to scale across our network, so we are resilient to surges in data that might correlate with the unpredictable nature of attacks on the Internet. It also permits us to control events by data source, share a subset of datasets with trusted partners, or restrict access to only authorized users. Lastly, the metadata for each individual threat event is stored in the Durable Object KV so that we may store contextual data beyond our fixed, searchable fields. This data may be in the form of requests-per-second for our denial of service events, or sourcing information so Cloudforce One analysts can tie the event to the exact threat activity for further investigation.
How to use threat events
Cloudforce One customers can access threat events through the Cloudflare Dashboard in Security Center or via the Cloudforce One threat events API. Each exposes the stream of threat activity occurring across the Internet as seen by Cloudflare, and are customizable by user-defined filters.
In the Cloudflare Dashboard, users have access to an Attacker Timelapse view, designed to answer strategic questions, as well as a more granular events table for drilling down into attack details. This approach ensures that users have the most relevant information at their fingertips.
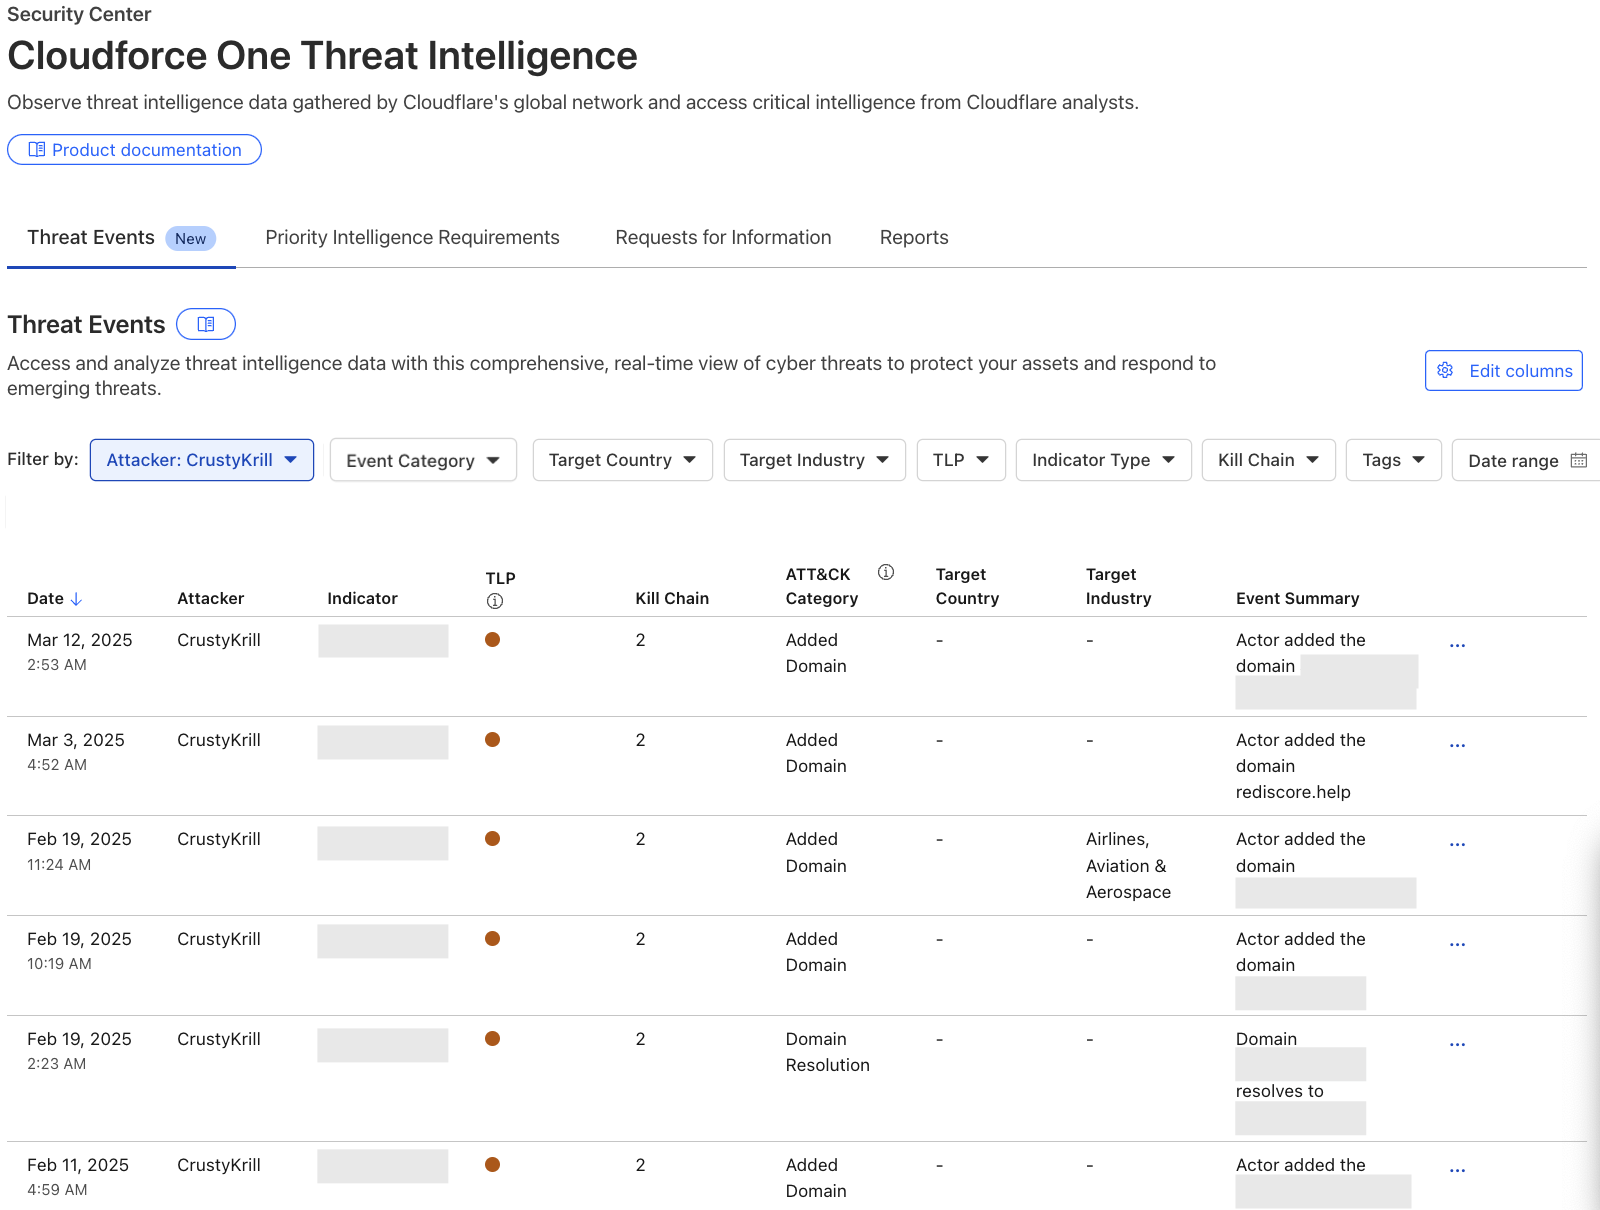
Events Table
The events table is a detailed view in the Security Center where users can drill down into specific threat activity filtered by various criteria. It is here that users can explore specific threat events and adversary campaigns using Cloudflare’s traffic insights. Most importantly, this table will provide our users with actionable Indicators of Compromise and an event summary so that they can properly defend their services. All of the data available in our events table is equally accessible via the Cloudforce One threat events API.
To showcase the power of threat events, let’s explore a real-world case:
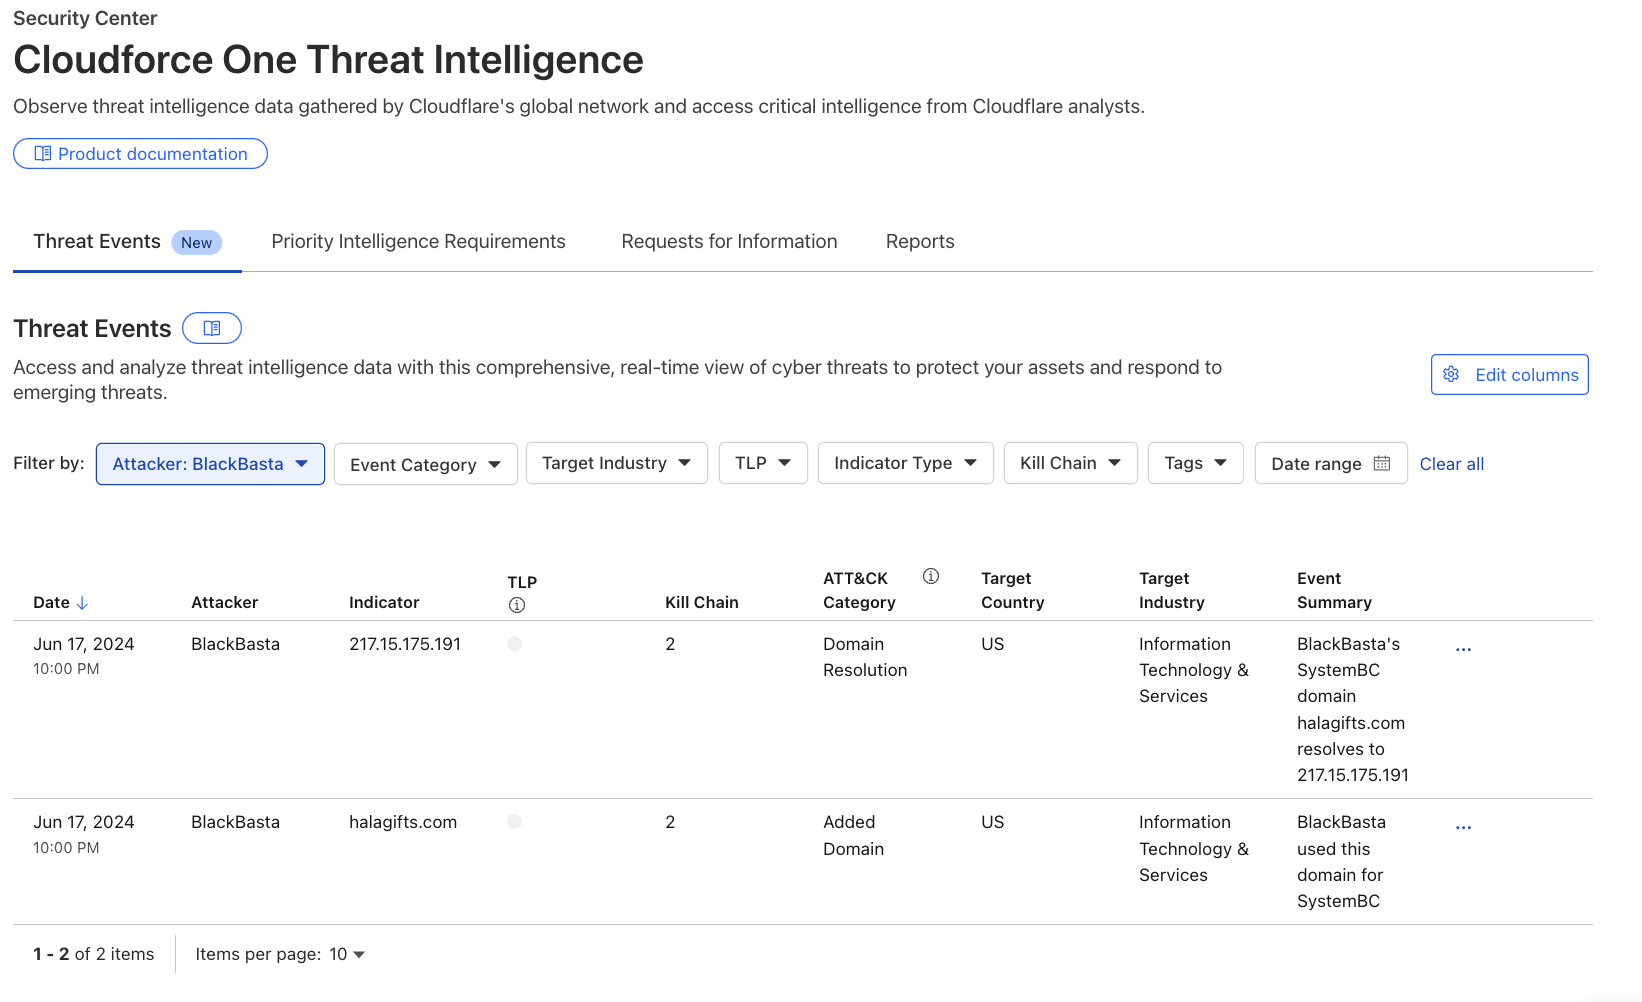
Recently leaked chats of the Black Basta criminal enterprise exposed details about their victims, methods, and infrastructure purchases. Although we can’t confirm whether the leaked chats were manipulated in any way, the infrastructure discussed in the chats was simple to verify. As a result, this threat intelligence is now available as events in the threat events, along with additional unique Cloudflare context.
Analysts searching for domains, hosts, and file samples used by Black Basta can leverage the threat events to gain valuable insight into this threat actor’s operations. For example, in the threat events UI, a user can filter the “Attacker” column by selecting ‘BlackBasta’ in the dropdown, as shown in the image below. This provides a curated list of verified IP addresses, domains, and file hashes for further investigation. For more detailed information on Cloudflare’s unique visibility into Black Basta threat activity see Black Basta’s blunder: exploiting the gang’s leaked chats.
Why we are publishing threat events
Our customers face a myriad of cyber threats that can disrupt operations and compromise sensitive data. As adversaries become increasingly sophisticated, the need for timely and relevant threat intelligence has never been more critical. This is why we are introducing threat events, which provides deeper insights into these threats.
The threat events platform aims to fill this gap by offering a more detailed and contextualized view of ongoing threat activity. This feature allows analysts to self-serve and explore incidents through customizable filters, enabling them to identify patterns and respond effectively. By providing access to real-time threat data, we empower organizations to make informed decisions about their security strategies.
To validate the value of our threat events platform, we had a Fortune 20 threat intelligence team put it to the test. They conducted an analysis against 110 other sources, and we ranked as their #1 threat intelligence source. They found us “very much a unicorn” in the threat intelligence space. It’s early days, but the initial feedback confirms that our intelligence is not only unique but also delivering exceptional value to defenders.
What’s next
While Cloudforce One customers now have access to our API and dashboard, allowing for seamless integration of threat intelligence into their existing systems, they will also soon have access to more visualisations and analytics for the threat events in order to better understand and report back on their findings. This upcoming UI will include enhanced visualizations of attacker timelines, campaign overviews, and attack graphs, providing even deeper insights into the threats facing your organization. Moreover, we’ll add the ability to integrate with existing SIEM platforms and share indicators across systems.
Read more about the threat intelligence research our team publishes here or reach out to your account team about how to leverage our new threat events to enhance your cybersecurity posture.
In today’s fast-paced digital landscape, companies are managing an increasingly complex mix of environments — from SaaS applications and public cloud platforms to on-prem data centers and hybrid setups. This diverse infrastructure offers flexibility and scalability, but also opens up new attack surfaces.
To support both business continuity and security needs, “security must evolve from being reactive to predictive”. Maintaining a healthy security posture entails monitoring and strengthening your security defenses to identify risks, ensure compliance, and protect against evolving threats. With our newest capabilities, you can now use Cloudflare to achieve a healthy posture across your SaaS and web applications. This addresses any security team’s ultimate (daily) question: How well are our assets and documents protected?
A predictive security posture relies on the following key components:
Real-time discovery and inventory of all your assets and documents
Continuous asset-aware threat detection and risk assessment
Prioritised remediation suggestions to increase your protection
Today, we are sharing how we have built these key components across SaaS and web applications, and how you can use them to manage your business’s security posture.
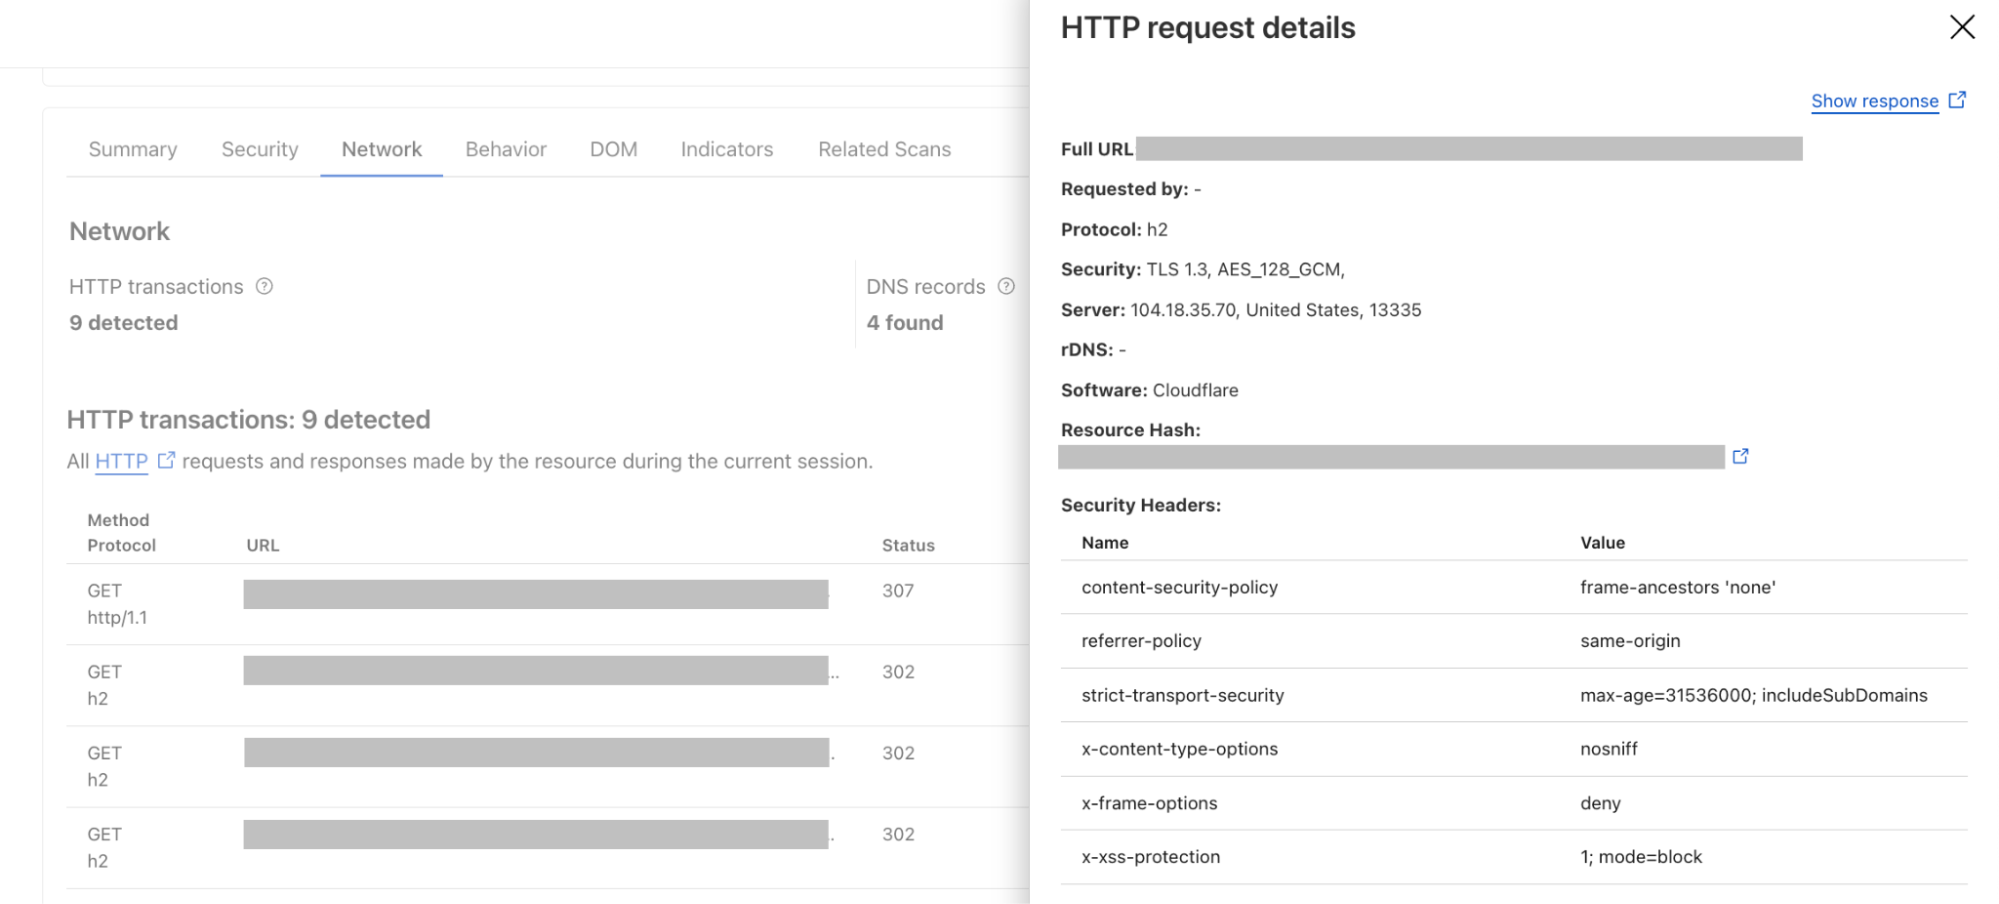
Your security posture at a glance
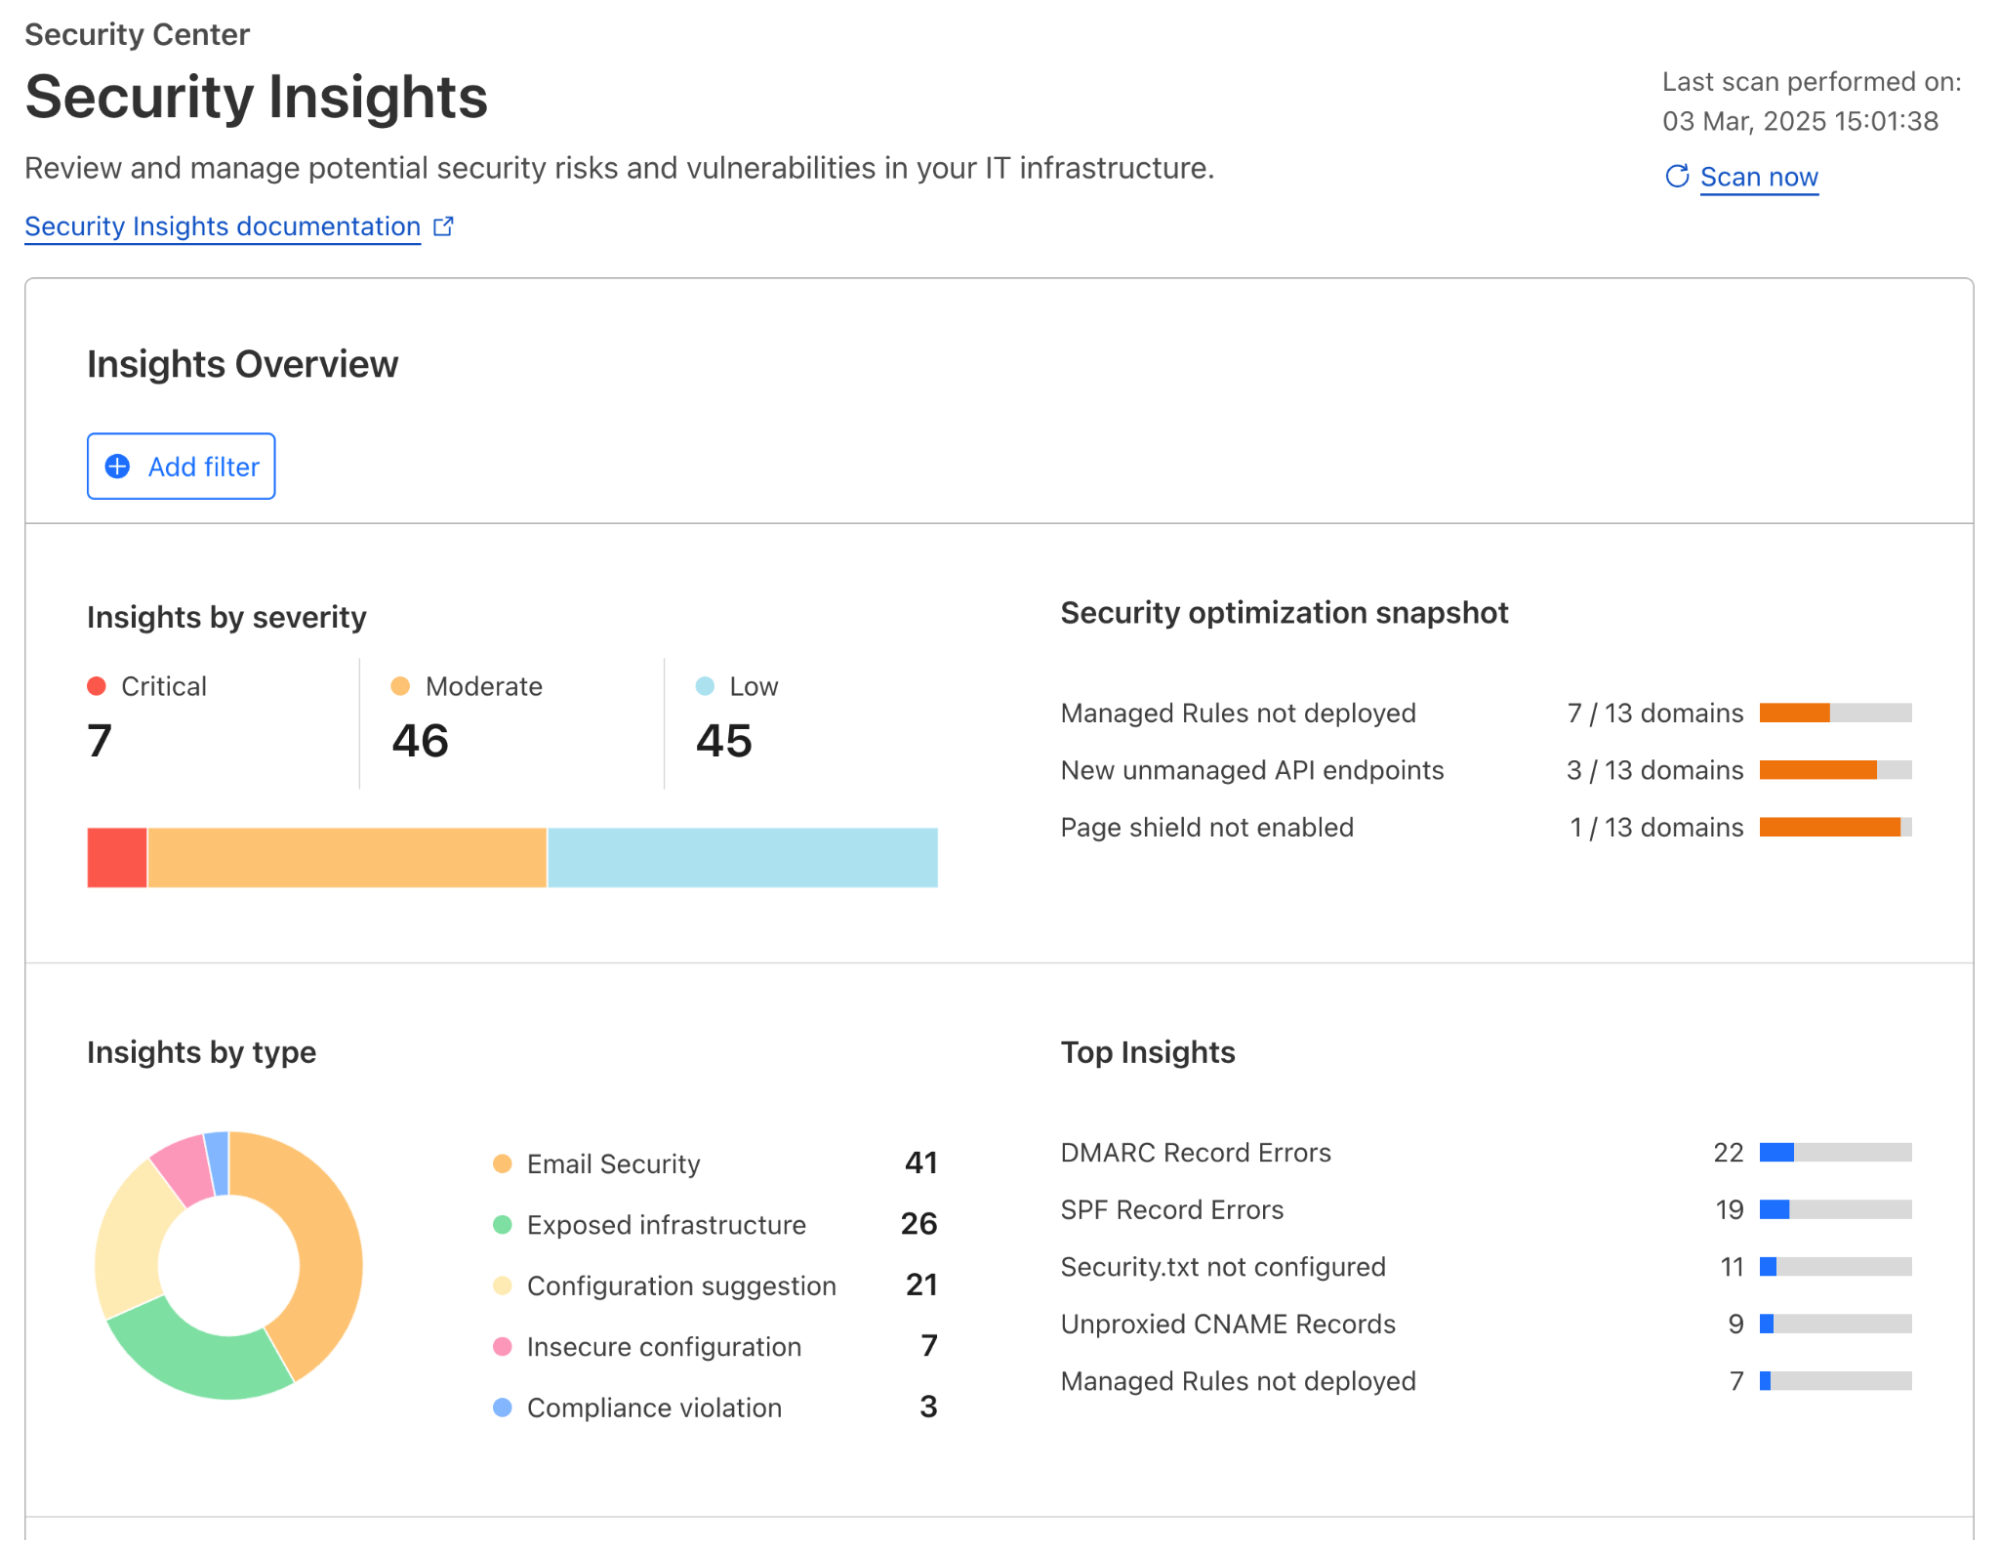
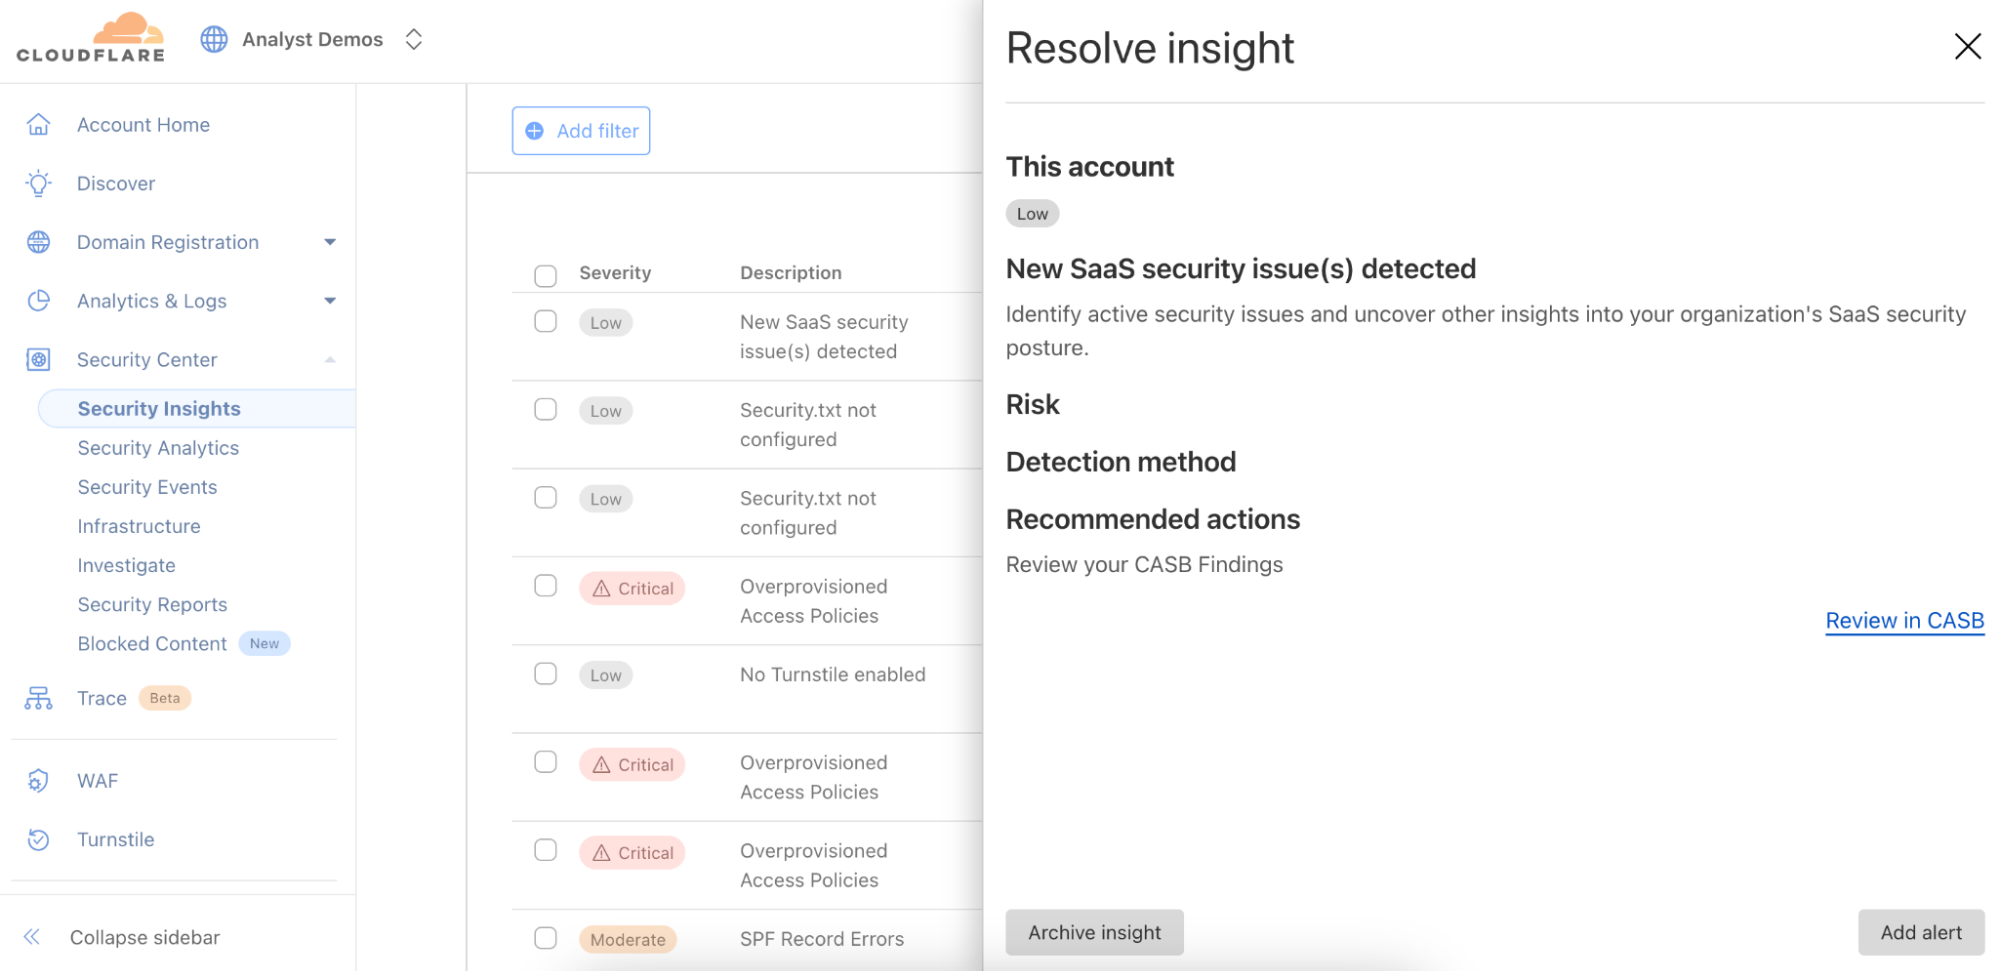
Regardless of the applications you have connected to Cloudflare’s global network, Cloudflare actively scans for risks and misconfigurations associated with each one of them on a regular cadence. Identified risks and misconfigurations are surfaced in the dashboard under Security Center as insights.
Insights are grouped by their severity, type of risks, and corresponding Cloudflare solution, providing various angles for you to zoom in to what you want to focus on. When applicable, a one-click resolution is provided for selected insight types, such as setting minimum TLS version to 1.2 which is recommended by PCI DSS. This simplicity is highly appreciated by customers that are managing a growing set of assets being deployed across the organization.
To help shorten the time to resolution even further, we have recently added role-based access control (RBAC) to Security Insights in the Cloudflare dashboard. Now for individual security practitioners, they have access to a distilled view of the insights that are relevant for their role. A user with an administrator role (a CSO, for example) has access to, and visibility into, all insights.
In addition to account-wide Security Insights, we also provide posture overviews that are closer to the corresponding security configurations of your SaaS and web applications. Let’s dive into each of them.
Securing your SaaS applications
Without centralized posture management, SaaS applications can feel like the security wild west. They contain a wealth of sensitive information – files, databases, workspaces, designs, invoices, or anything your company needs to operate, but control is limited to the vendor’s settings, leaving you with less visibility and fewer customization options. Moreover, team members are constantly creating, updating, and deleting content that can cause configuration drift and data exposure, such as sharing files publicly, adding PII to non-compliant databases, or giving access to third party integrations. With Cloudflare, you have visibility across your SaaS application fleet in one dashboard.
Posture findings across your SaaS fleet
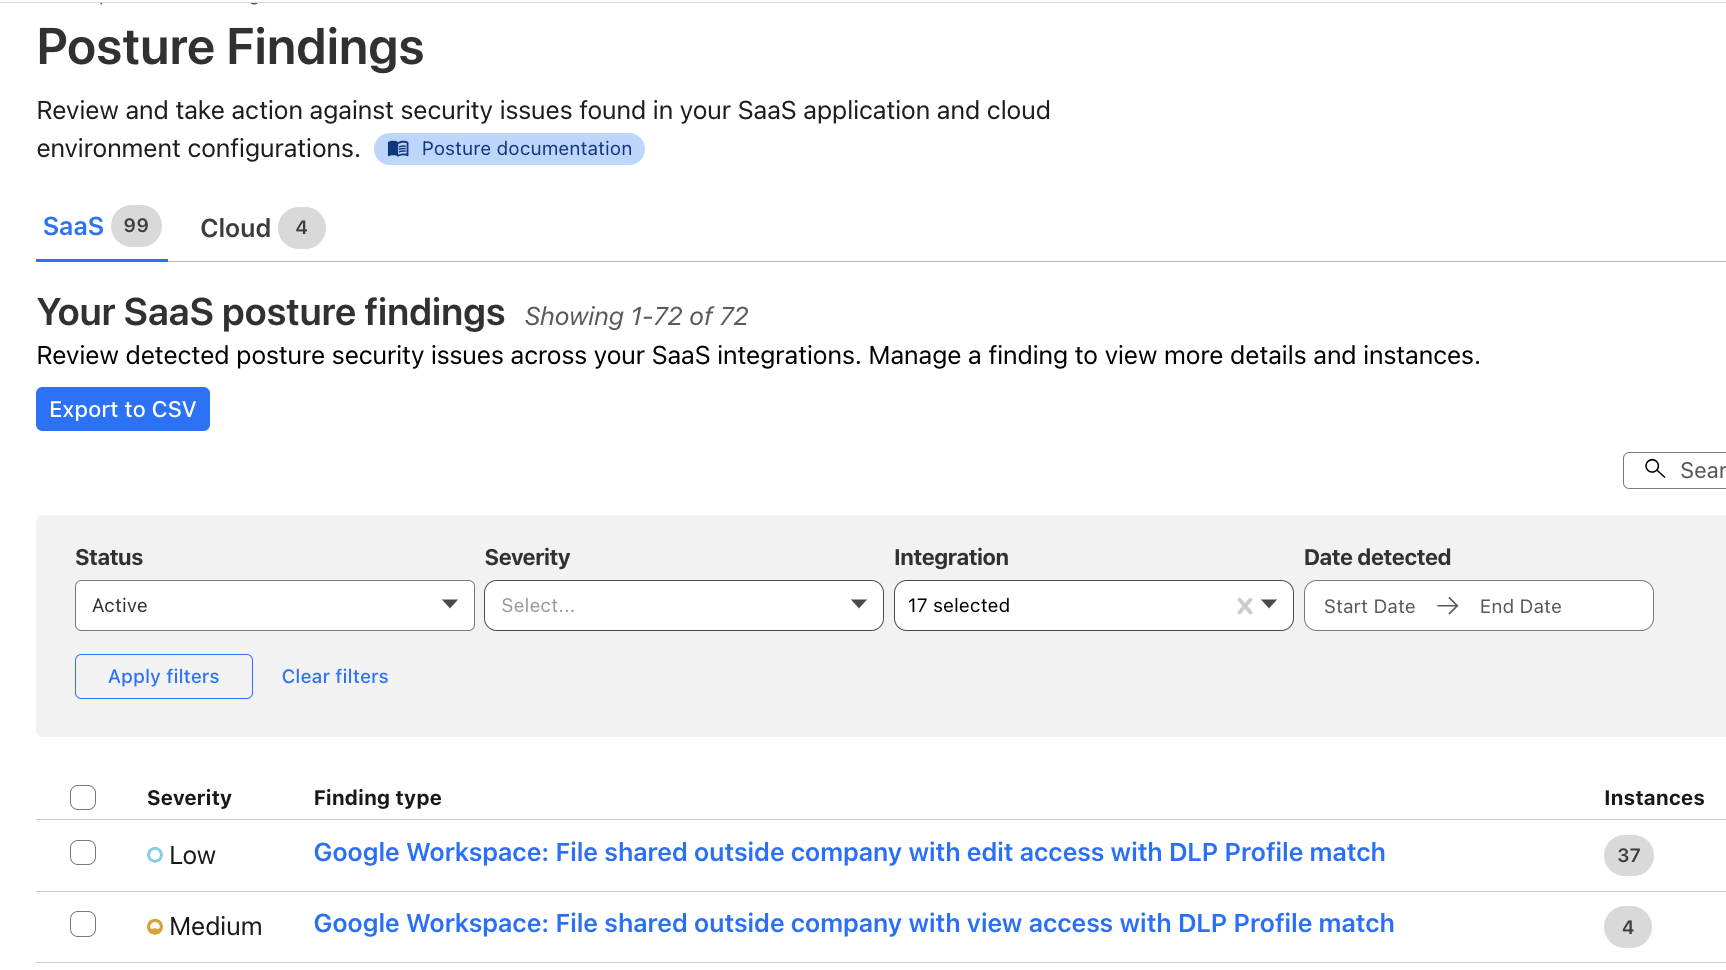
From the account-wide Security Insights, you can review insights for potential SaaS security issues:
You can choose to dig further with Cloud Access Security Broker (CASB) for a thorough review of the misconfigurations, risks, and failures to meet best practices across your SaaS fleet. You can identify a wealth of security information including, but not limited to:
Publicly available or externally shared files
Third-party applications with read or edit access
Unknown or anonymous user access
Databases with exposed credentials
Users without two-factor authentication
Inactive user accounts
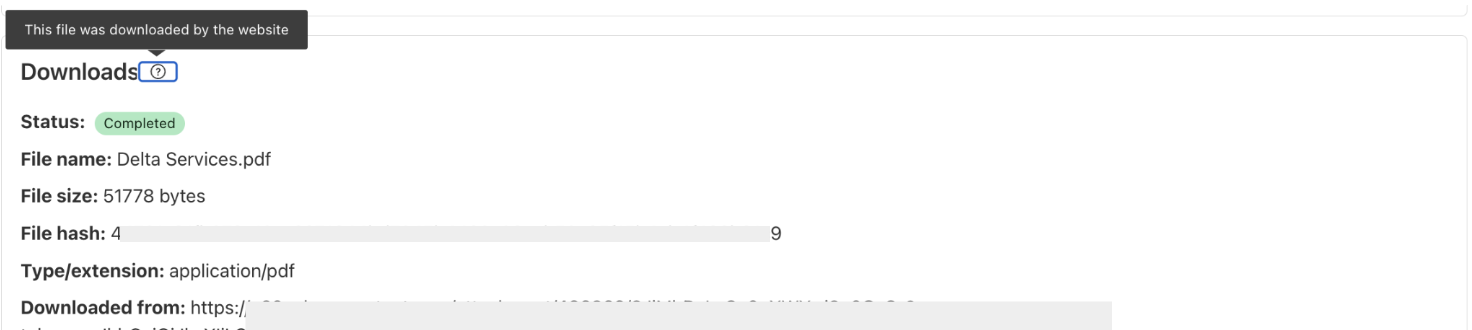
You can also explore the Posture Findings page, which provides easy searching and navigation across documents that are stored within the SaaS applications.
Additionally, you can create policies to prevent configuration drift in your environment. Prevention-based policies help maintain a secure configuration and compliance standards, while reducing alert fatigue for Security Operations teams, and these policies can prevent the inappropriate movement or exfiltration of sensitive data. Unifying controls and visibility across environments makes it easier to lock down regulated data classes, maintain detailed audit trails via logs, and improve your security posture to reduce the risk of breaches.
How it works: new, real-time SaaS documents discovery
Delivering SaaS security posture information to our customers requires collecting vast amounts of data from a wide range of platforms. In order to ensure that all the documents living in your SaaS apps (files, designs, etc.) are secure, we need to collect information about their configuration — are they publicly shared, do third-party apps have access, is multi-factor authentication (MFA) enabled?
We previously did this with crawlers, which would pull data from the SaaS APIs. However, we were plagued with rate limits from the SaaS vendors when working with larger datasets. This forced us to work in batches and ramp scanning up and down as the vendors permitted. This led to stale findings and would make remediation cumbersome and unclear – for example, Cloudflare would be reporting that a file is still shared publicly for a short period after the permissions were removed, leading to customer confusion.
To fix this, we upgraded our data collection pipeline to be dynamic and real-time, reacting to changes in your environment as they occur, whether it’s a new security finding, an updated asset, or a critical alert from a vendor. We started with our Microsoft asset discovery and posture findings, providing you real-time insight into your Microsoft Admin Center, OneDrive, Outlook, and SharePoint configurations. We will be rapidly expanding support to additional SaaS vendors going forward.
Listening for update events from Cloudflare Workers
Cloudflare Workers serve as the entry point for vendor webhooks, handling asset change notifications from external services. The workflow unfolds as follows:
Webhook listener: An initial Worker acts as the webhook listener, receiving asset change messages from vendors.
Data storage & queuing: Upon receiving a message, the Worker uploads the raw payload of the change notification to Cloudflare R2 for persistence, and publishes it to a Cloudflare Queue dedicated to raw asset changes.
Transformation Worker: A second Worker, bound as a consumer to the raw asset change queue, processes the incoming messages. This Worker transforms the raw vendor-specific data into a generic format suitable for CASB. The transformed data is then:
Stored in Cloudflare R2 for future reference.
Published on another Cloudflare Queue, designated for transformed messages.
CASB Processing: Consumers & Crawlers
Once the transformed messages reach the CASB layer, they undergo further processing:
Polling consumer: CASB has a consumer that polls the transformed message queue. Upon receiving a message, it determines the relevant handler required for processing.
Crawler execution: The handler then maps the message to an appropriate crawler, which interacts with the vendor API to fetch the most up-to-date asset details.
Data storage: The retrieved asset data is stored in the CASB database, ensuring it is accessible for security and compliance checks.
With this improvement, we are now processing 10 to 20 Microsoft updates per second, or 864,000 to 1.72 million updates daily, giving customers incredibly fast visibility into their environment. Look out for expansion to other SaaS vendors in the coming months.
Securing your web applications
A unique challenge of securing web applications is that no one size fits all. An asset-aware posture management bridges the gap between a universal security solution and unique business needs, offering tailored recommendations for security teams to protect what matters.
Posture overview from attacks to threats and risks
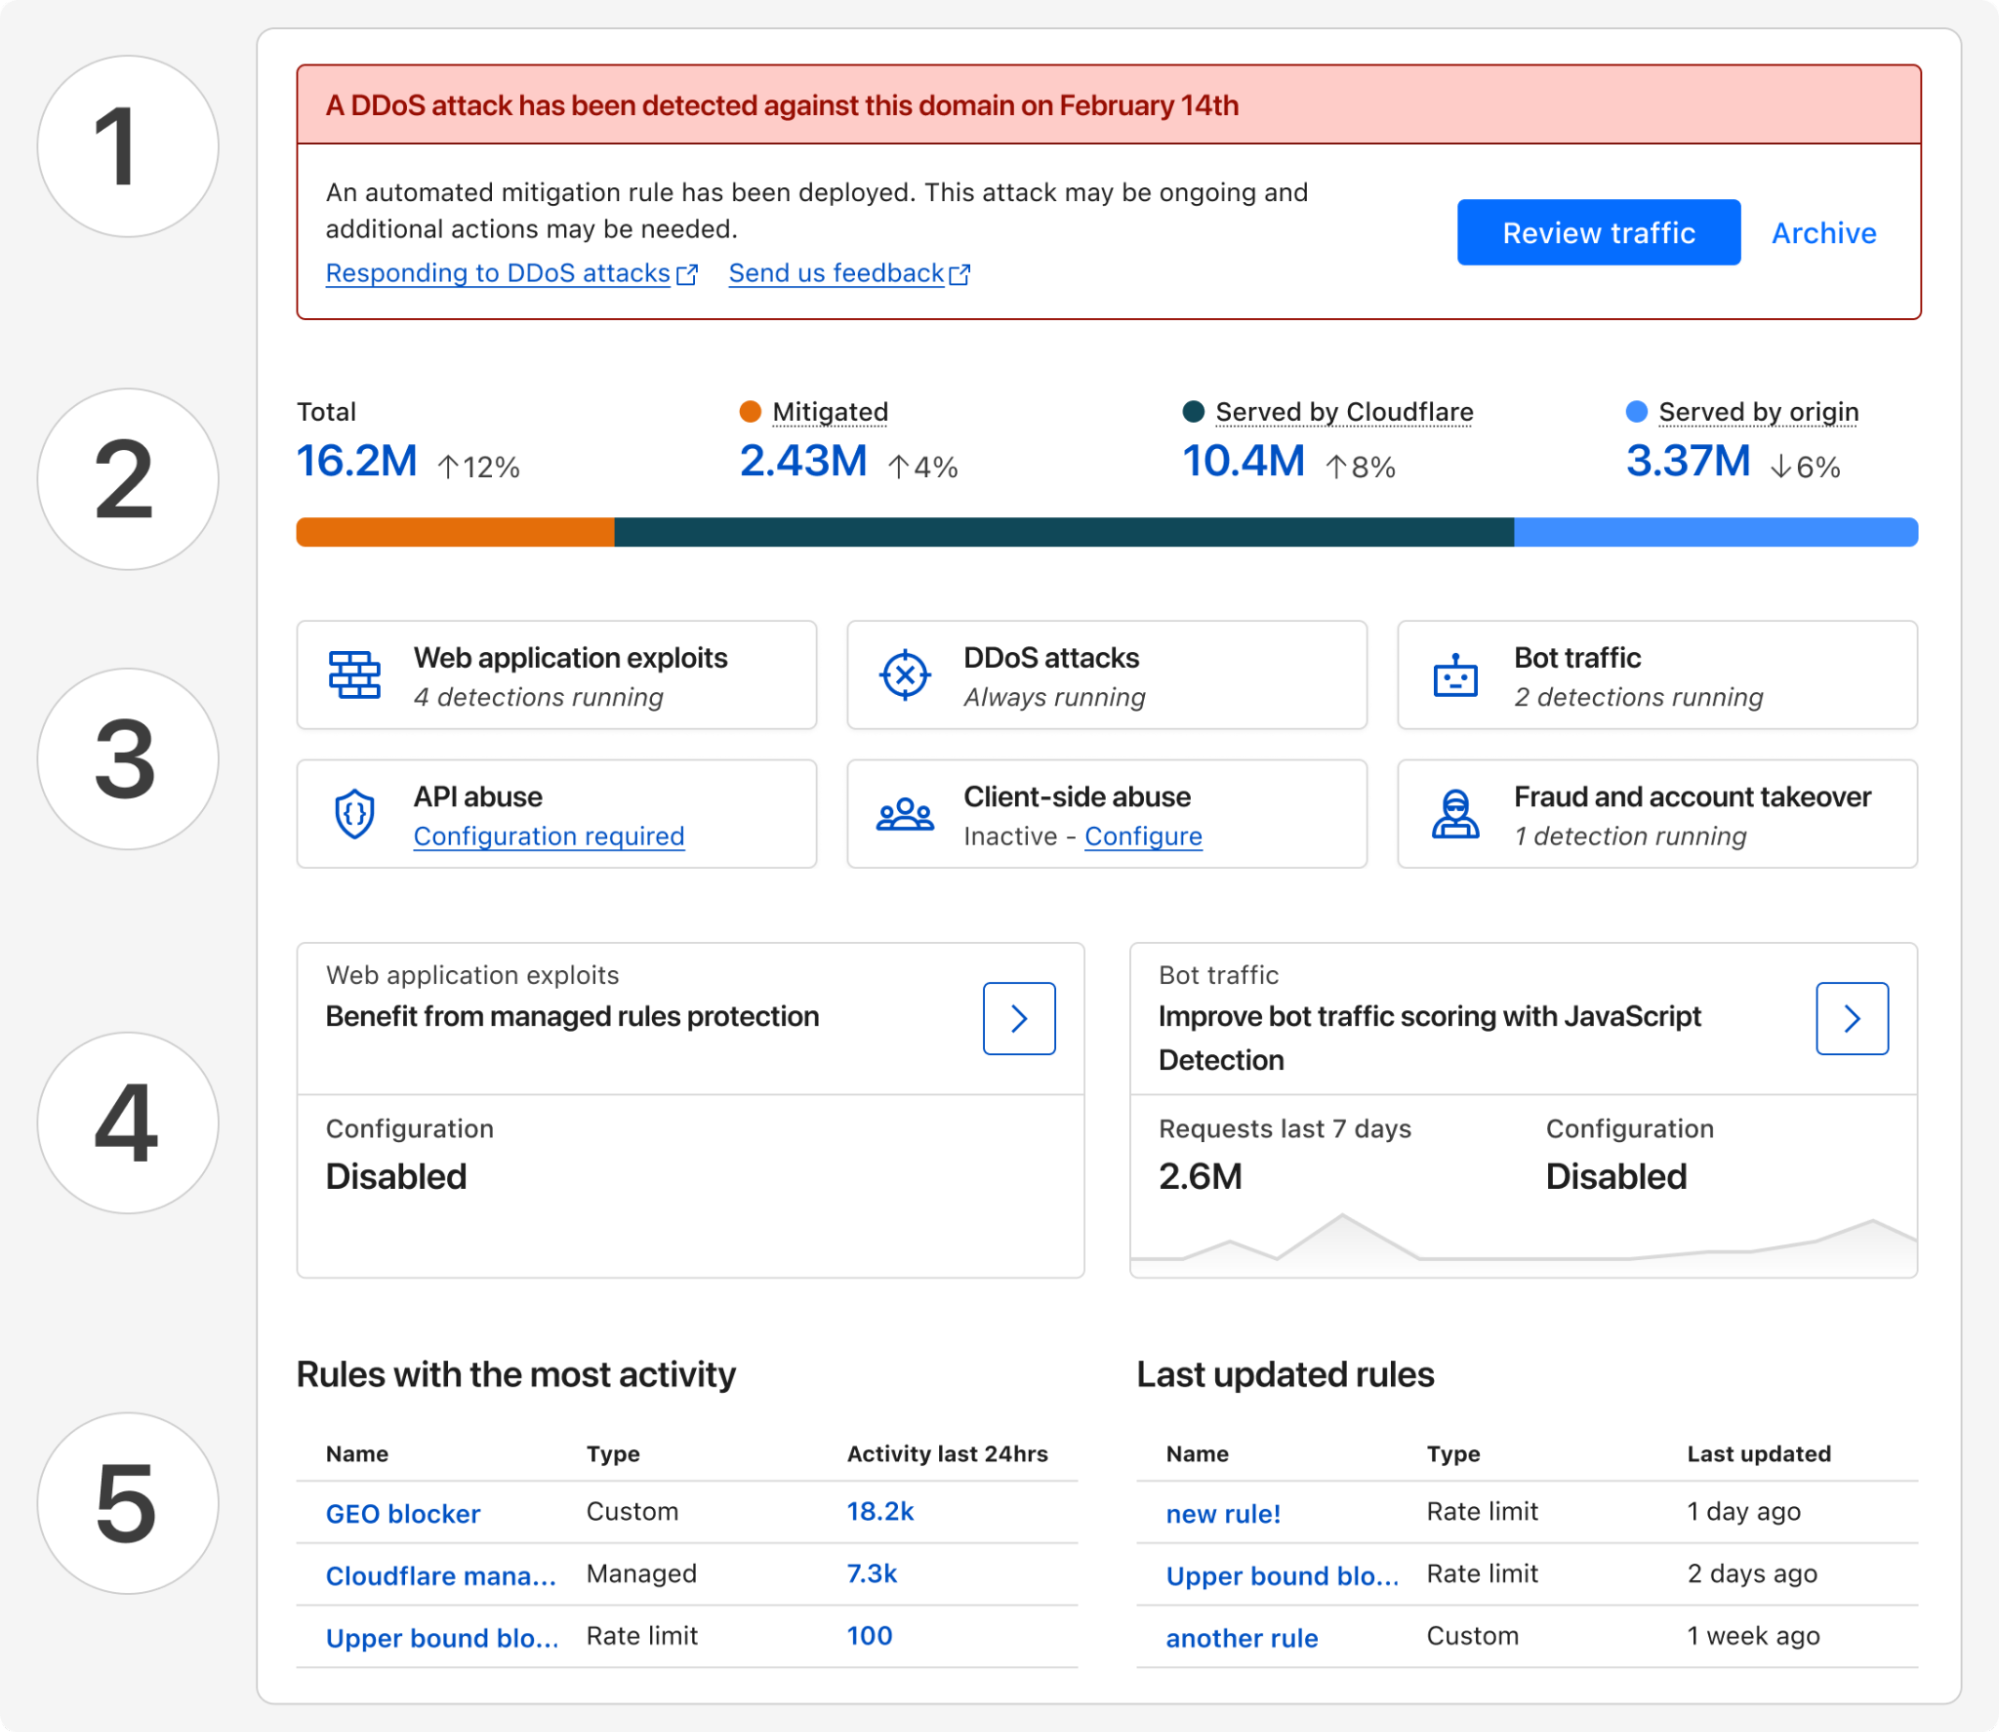
Starting today, all Cloudflare customers have access to Security Overview, a new landing page customized for each of your onboarded domains. This page aggregates and prioritizes security suggestions across all your web applications:
Any (ongoing) attacks detected that require immediate attention
Disposition (mitigated, served by Cloudflare, served by origin) of all proxied traffic over the last 7 days
Summary of currently active security modules that are detecting threats
Suggestions of how to improve your security posture with a step-by-step guide
And a glimpse of your most active and lately updated security rules
These tailored security suggestions are surfaced based on your traffic profile and business needs, which is made possible by discovering your proxied web assets.
Discovery of web assets
Many web applications, regardless of their industry or use case, require similar functionality: user identification, accepting payment information, etc. By discovering the assets serving this functionality, we can build and run targeted threat detection to protect them in depth.
As an example, bot traffic towards marketing pages versus login pages have different business impacts. Content scraping may be happening targeting your marketing materials, which you may or may not want to allow, while credential stuffing on your login page deserves immediate attention.
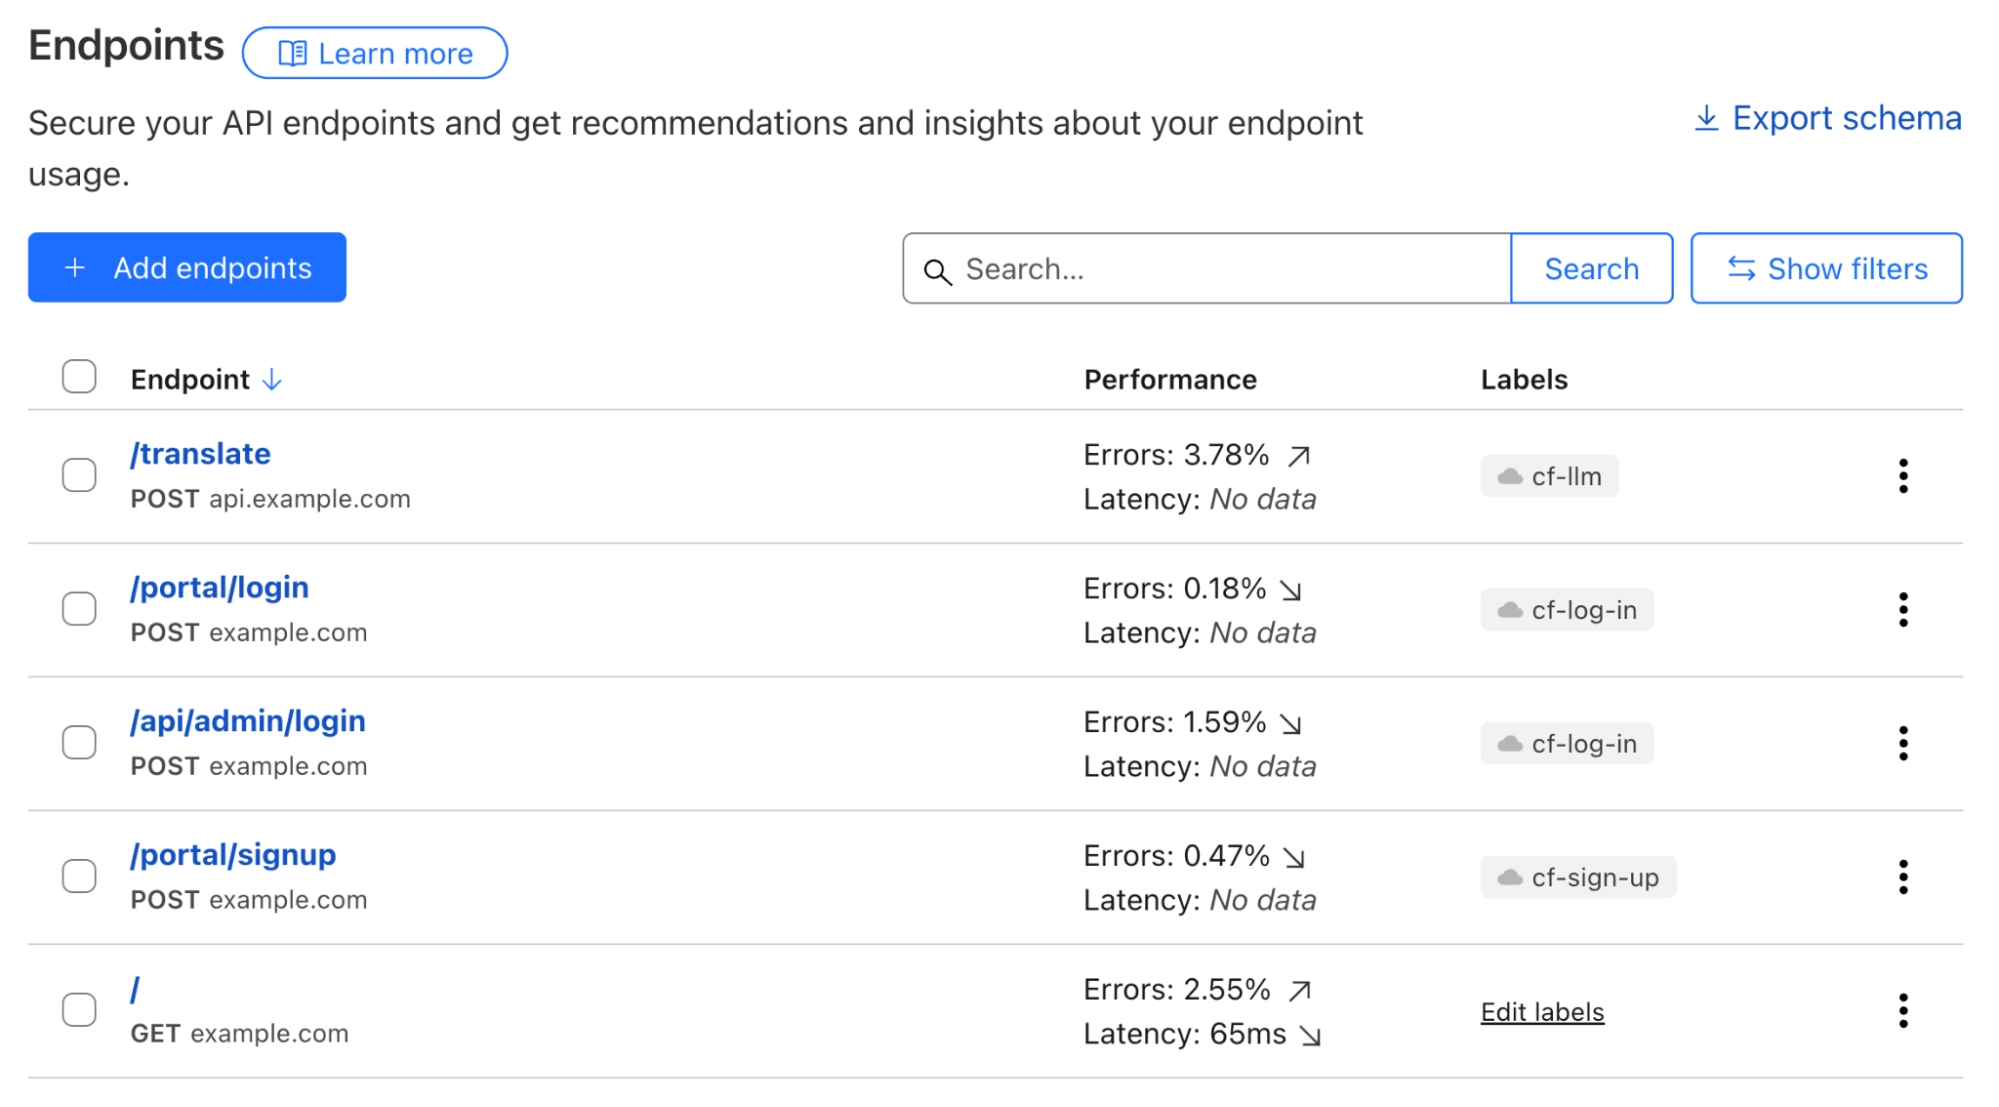
Web assets are described by a list of endpoints; and labelling each of them defines their business goals. A simple example can be POST requests to path /portal/login, which likely describes an API for user authentication. While the GET requests to path /portal/login denote the actual login webpage.
To describe business goals of endpoints, labels come into play. POST requests to the /portal/login endpoint serving end users and to the /api/admin/login endpoint used by employees can both can be labelled using the same cf-log-inmanaged label, letting Cloudflare know that usernames and passwords would be expected to be sent to these endpoints.
API Shield customers can already make use of endpoint labelling. In early Q2 2025, we are adding label discovery and suggestion capabilities, starting with three labels, cf-log-in, cf-sign-up, and cf-rss-feed. All other customers can manually add these labels to the saved endpoints. One example, explained below, is preventing disposable emails from being used during sign-ups.
Always-on threat detection and risk assessment
Use-case driven threat detection
Customers told us that, with the growing excitement around generative AI, they need support to secure this new technology while not hindering innovation. Being able to discover LLM-powered services allows fine-tuning security controls that are relevant for this particular technology, such as inspecting prompts, limit prompting rates based on token usage, etc. In a separate Security Week blog post, we will share how we build Cloudflare Firewall for AI, and how you can easily protect your generative AI workloads.
Account fraud detection, which encompasses multiple attack vectors, is another key area that we are focusing on in 2025.
On many login and signup pages, a CAPTCHA solution is commonly used to only allow human beings through, assuming only bots perform undesirable actions. Put aside that most visual CAPTCHA puzzles can be easily solved by AI nowadays, such an approach cannot effectively solve the root cause of most account fraud vectors. For example, human beings using disposable emails to sign up single-use accounts to take advantage of signup promotions.
To solve this fraudulent sign up issue, a security rule currently under development could be deployed as below to block all attempts that use disposable emails as a user identifier, regardless of whether the requester was automated or not. All existing or future cf-log-in and cf-sign-up labelled endpoints are protected by this single rule, as they both require user identification.
Our fast expanding use-case driven threat detections are all running by default, from the first moment you onboarded your traffic to Cloudflare. The instant available detection results can be reviewed through security analytics, helping you make swift informed decisions.
API endpoint risk assessment
APIs have their own set of risks and vulnerabilities, and today Cloudflare is delivering seven new risk scans through API Posture Management. This new capability of API Shield helps reduce risk by identifying security issues and fixing them early, before APIs are attacked. Because APIs are typically made up of many different backend services, security teams need to pinpoint which backend service is vulnerable so that development teams may remediate the identified issues.
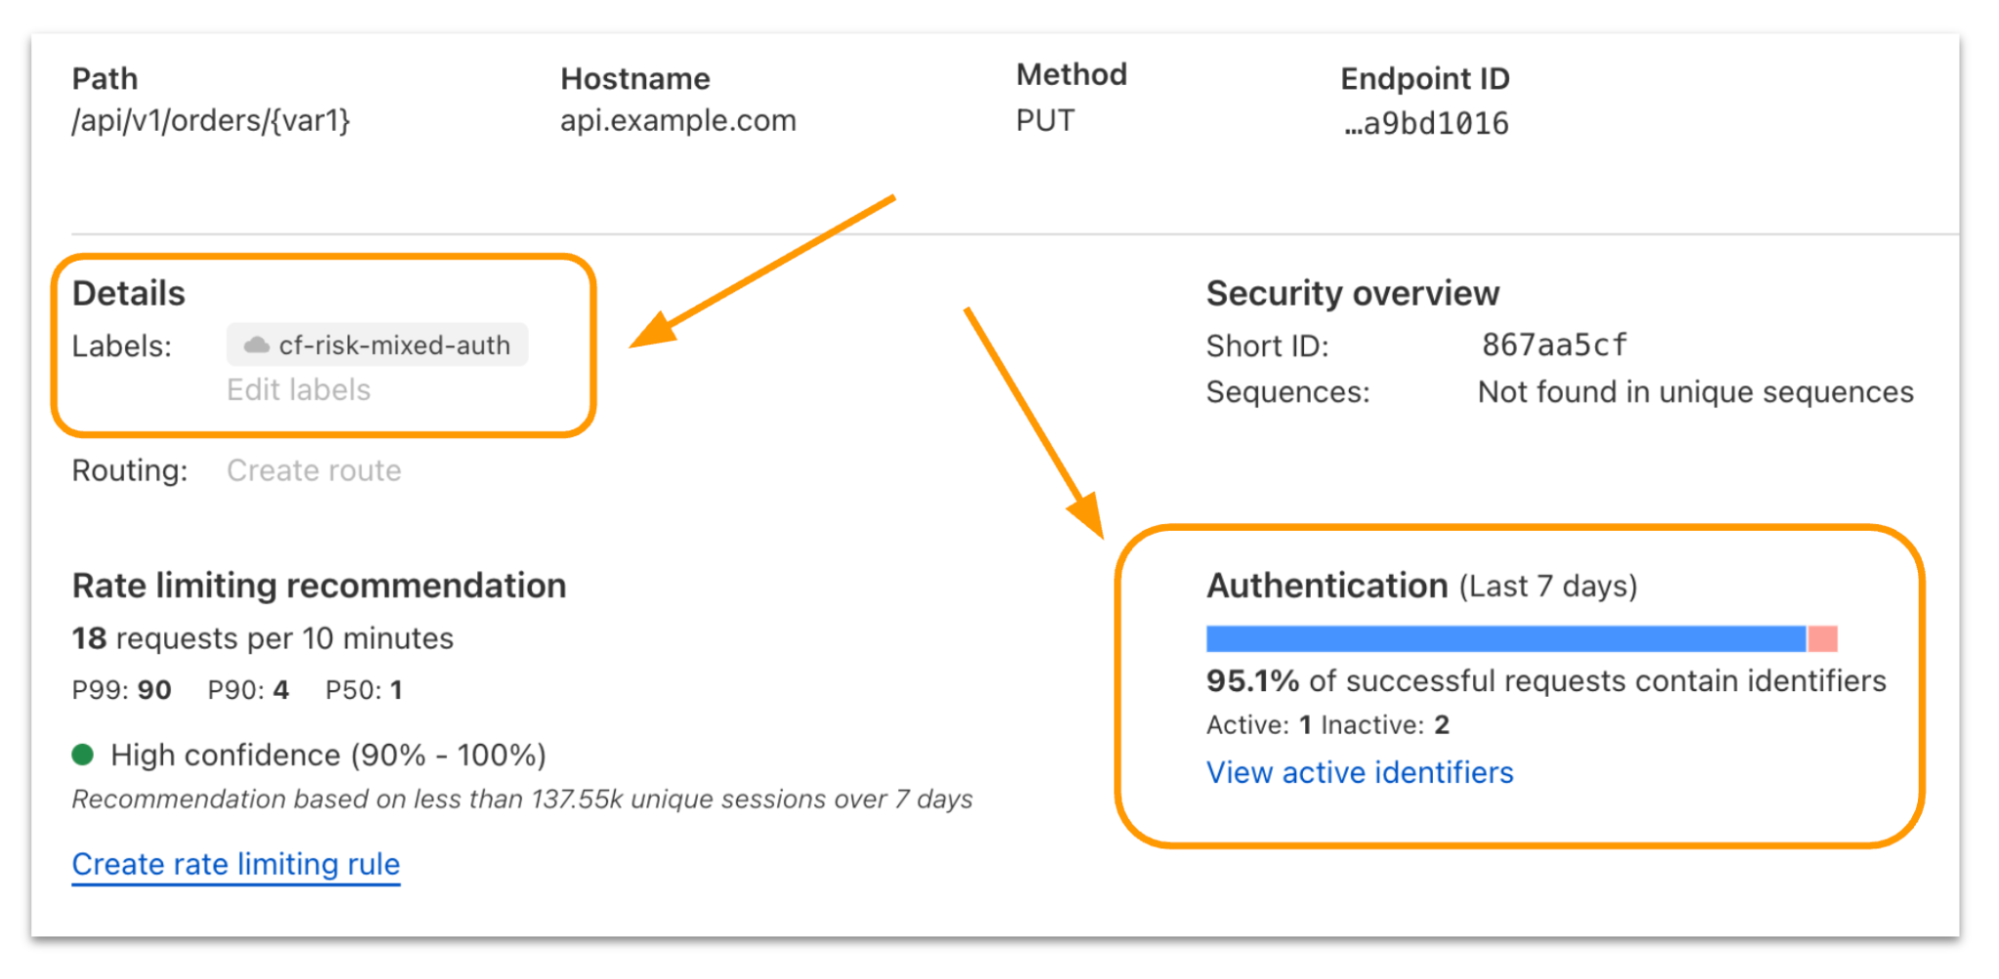
Our new API posture management risk scans do exactly that: users can quickly identify which API endpoints are at risk to a number of vulnerabilities, including sensitive data exposure, authentication status, Broken Object Level Authorization (BOLA) attacks, and more.
Authentication Posture is one risk scan you’ll see in the new system. We focused on it to start with because sensitive data is at risk when API authentication is assumed to be enforced but is actually broken. Authentication Posture helps customers identify authentication misconfigurations for APIs and alerts of their presence. This is achieved by scanning for successful requests against the API and noting their authentication status. API Shield scans traffic daily and labels API endpoints that have missing and mixed authentication for further review.
For customers that have configured session IDs in API Shield, you can find the new risk scan labels and authentication details per endpoint in API Shield. Security teams can take this detail to their development teams to fix the broken authentication.
We’re launching today with scans for authentication posture, sensitive data, underprotected APIs, BOLA attacks, and anomaly scanning for API performance across errors, latency, and response size.
Simplify maintaining a good security posture with Cloudflare
Achieving a good security posture in a fast-moving environment requires innovative solutions that can transform complexity into simplicity. Bringing together the ability to continuously assess threats and risks across both public and private IT environments through a single platform is our first step in supporting our customers’ efforts to maintain a healthy security posture.
To further enhance the relevance of security insights and suggestions provided and help you better prioritize your actions, we are looking into integrating Cloudflare’s global view of threat landscapes. With this, you gain additional perspectives, such as what the biggest threats to your industry are, and what attackers are targeting at the current moment. Stay tuned for more updates later this year.
If you haven’t done so yet, onboard your SaaS and web applications to Cloudflare today to gain instant insights into how to improve your business’s security posture.
In 2024, we announced Log Explorer, giving customers the ability to store and query their HTTP and security event logs natively within the Cloudflare network. Today, we are excited to announce that Log Explorer now supports logs from our Zero Trust product suite. In addition, customers can create custom dashboards to monitor suspicious or unusual activity.
Every day, Cloudflare detects and protects customers against billions of threats, including DDoS attacks, bots, web application exploits, and more. SOC analysts, who are charged with keeping their companies safe from the growing spectre of Internet threats, may want to investigate these threats to gain additional insights on attacker behavior and protect against future attacks. Log Explorer, by collecting logs from various Cloudflare products, provides a single starting point for investigations. As a result, analysts can avoid forwarding logs to other tools, maximizing productivity and minimizing costs. Further, analysts can monitor signals specific to their organizations using custom dashboards.
Zero Trust dataset support in Log Explorer
Log Explorer stores your Cloudflare logs for a 30-day retention period so that you can analyze them natively and in a single interface, within the Cloudflare Dashboard. Cloudflare log data is diverse, reflecting the breadth of capabilities available. For example, HTTP requests contain information about the client such as their IP address, request method, autonomous system (ASN), request paths, and TLS versions used. Additionally, Cloudflare’s Application Security WAF Detections enrich these HTTP request logs with additional context, such as the WAF attack score, to identify threats.
Today we are announcing that seven additional Cloudflare product datasets are now available in Log Explorer. These seven datasets are the logs generated from our Zero Trust product suite, and include logs from Access, Gateway DNS, Gateway HTTP, Gateway Network, CASB, Zero
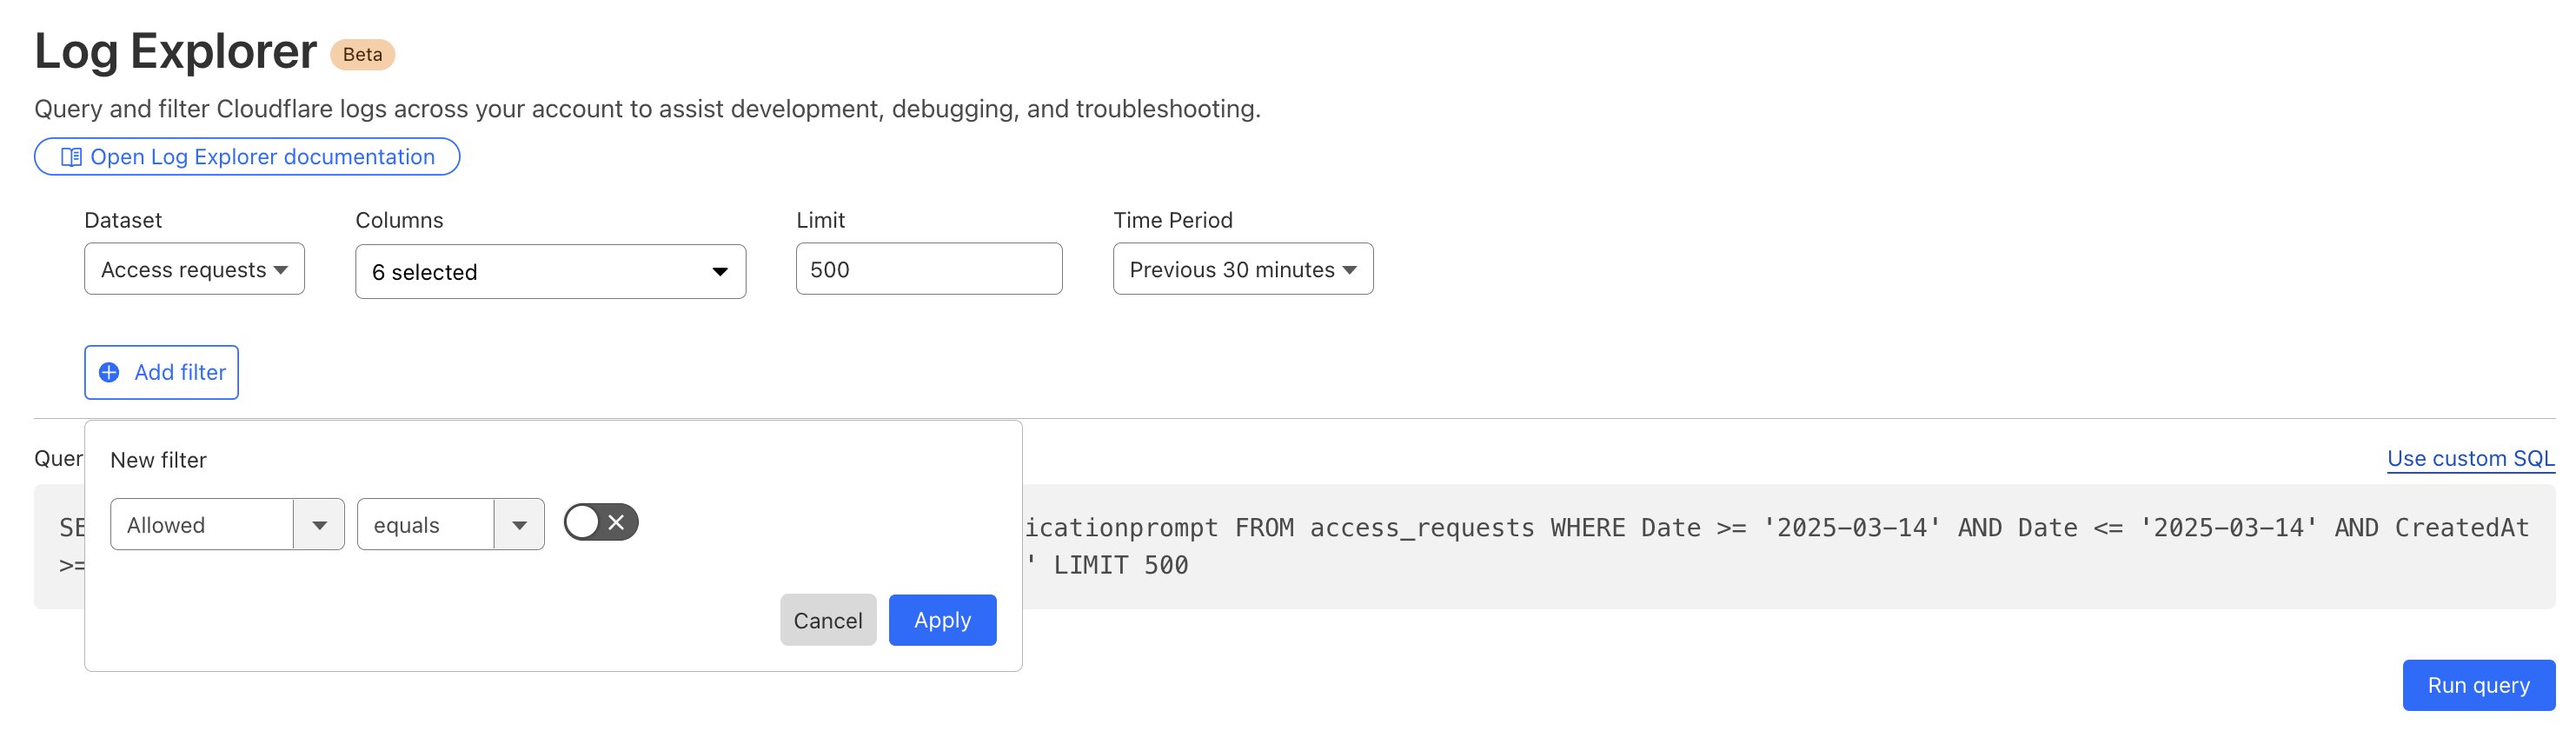
By reviewing Access logs and HTTP request logs, we can reveal attempts to access resources or systems without proper permissions, including brute force password attacks, indicating potential security breaches or malicious activity.
Below, we filter Access Logs on the Allowed field, to see activity related to unauthorized access.
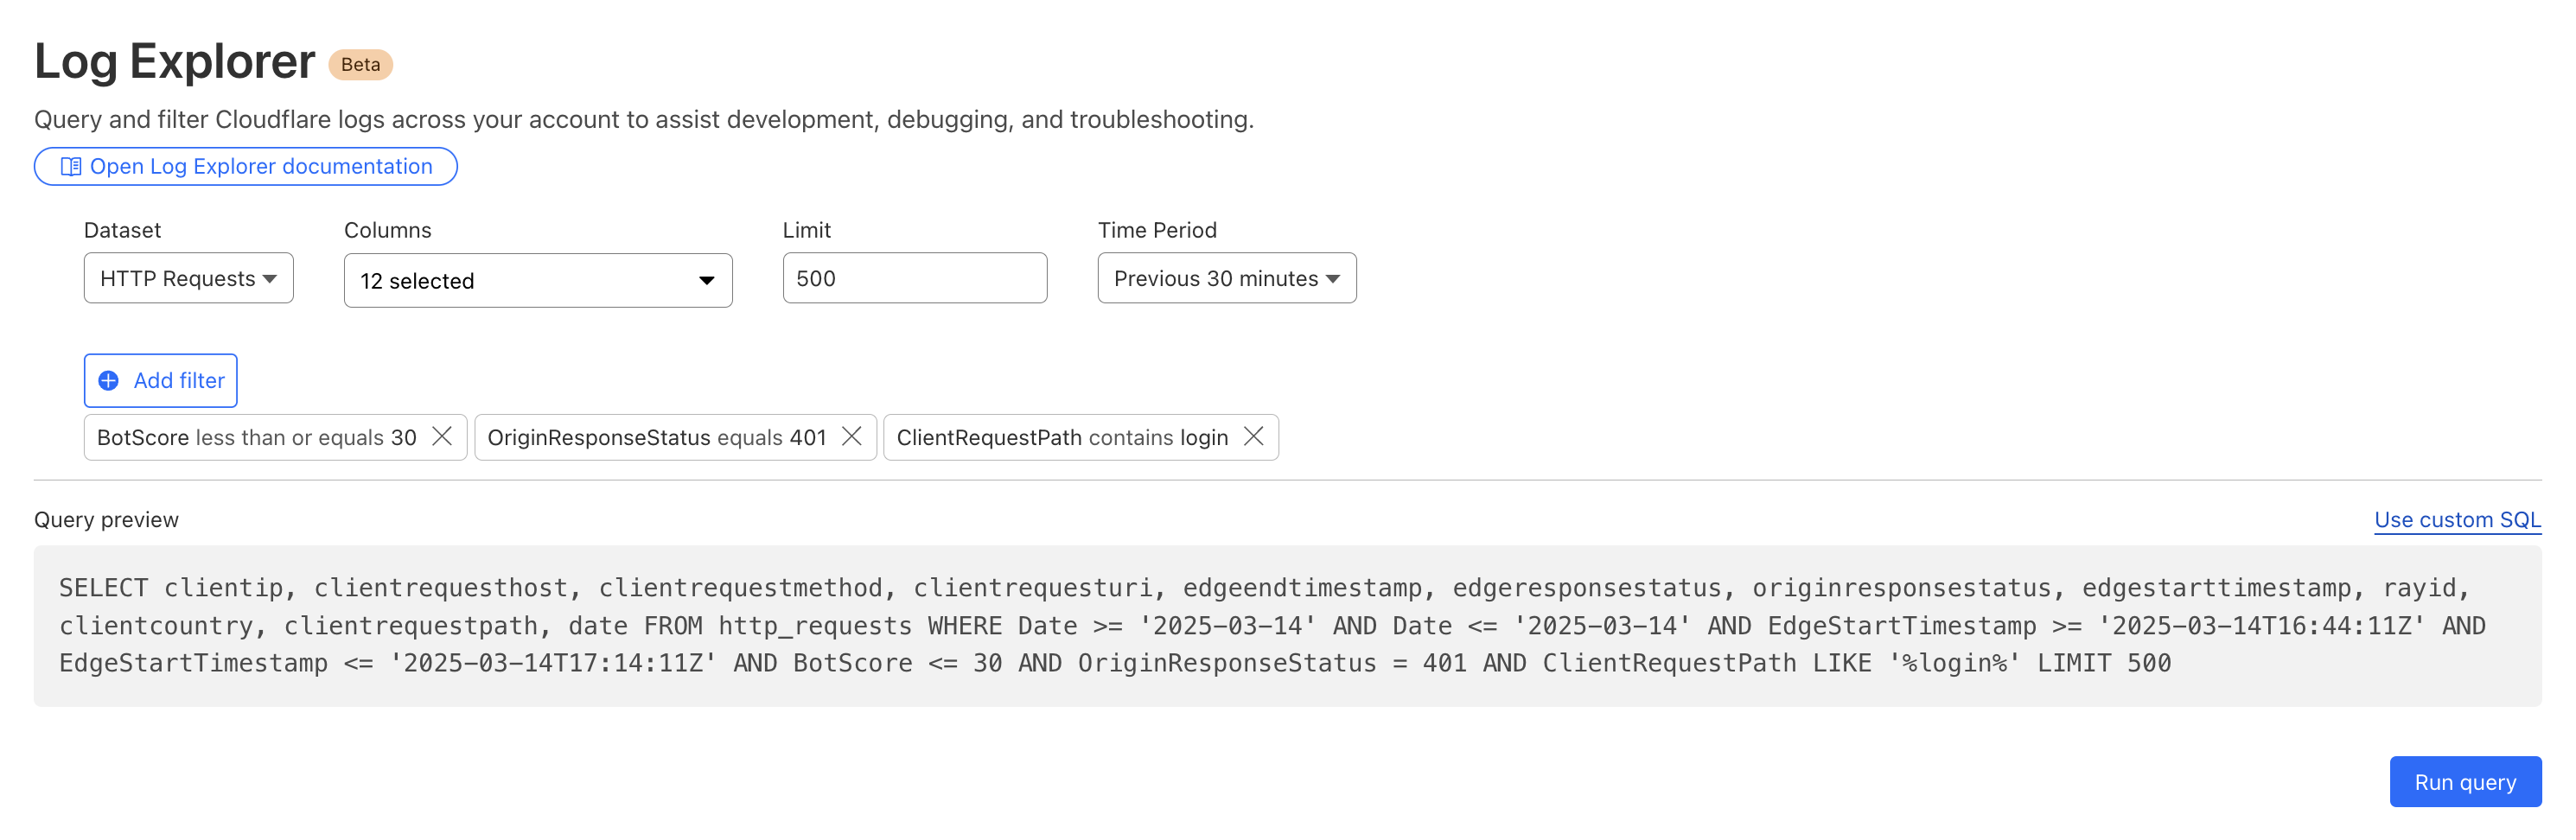
By then reviewing the HTTP logs for the requests identified in the previous query, we can assess if bot networks are the source of unauthorized activity.
With this information, you can craft targeted Custom Rules to block the offending traffic.
Detecting malware
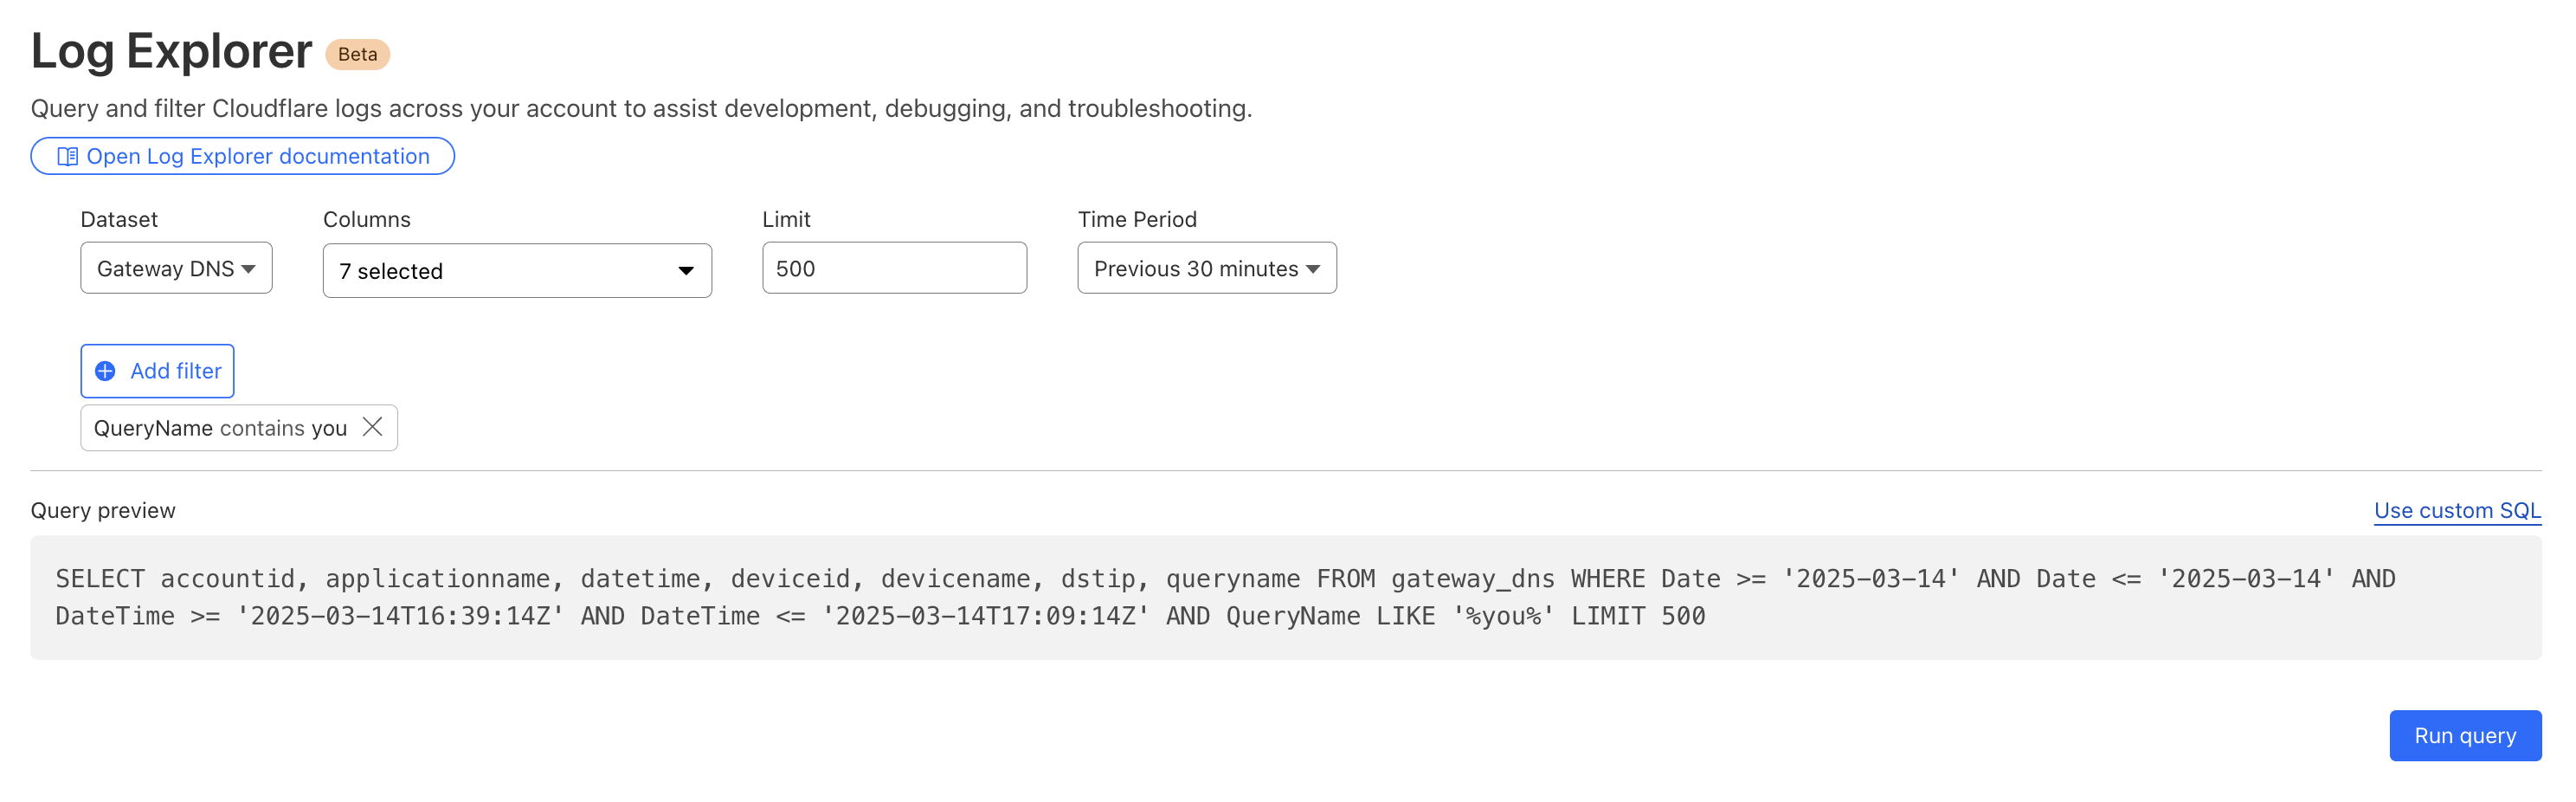
Cloudflare’s Web Gateway can track which websites users are accessing, allowing administrators to identify and block access to malicious or inappropriate sites. These logs can be used to detect if a user’s machine or account is compromised by malware attacks. When reviewing logs, this may become apparent when we look for records that show a rapid succession of attempts to browse known malicious sites, such as hostnames that have long strings of seemingly random characters that hide their true destination. In this example, we can query logs looking for requests to a spoofed YouTube URL.
Monitoring what matters using custom dashboards
Security monitoring is not one size fits all. For instance, companies in the retail or financial industries worry about fraud, while every company is concerned about data exfiltration, of information like trade secrets. And any form of personally identifiable information (PII) is a target for data breaches or ransomware attacks.
While log exploration helps you react to threats, our new custom dashboards allow you to define the specific metrics you need in order to monitor threats you are concerned about.
Getting started is easy, with the ability to create a chart using natural language. A natural language interface is integrated into the chart create/edit experience, enabling you to describe in your own words the chart you want to create. Similar to the AI Assistant we announced during Security Week 2024, the prompt translates your language to the appropriate chart configuration, which can then be added to a new or existing custom dashboard.
Use a prompt: Enter a query like “Compare status code ranges over time”. The AI model decides the most appropriate visualization and constructs your chart configuration.
Customize your chart: Select the chart elements manually, including the chart type, title, dataset to query, metrics, and filters. This option gives you full control over your chart’s structure.
Video shows entering a natural language description of desired metric “compare status code ranges over time”, preview chart shown is a time series grouped by error code ranges, selects “add chart” to save to dashboard.
For more help getting started, we have some pre-built templates that you can use for monitoring specific uses. Available templates currently include:
Bot monitoring: Identify automated traffic accessing your website
API Security: Monitor the data transfer and exceptions of API endpoints within your application
API Performance: See timing data for API endpoints in your application, along with error rates
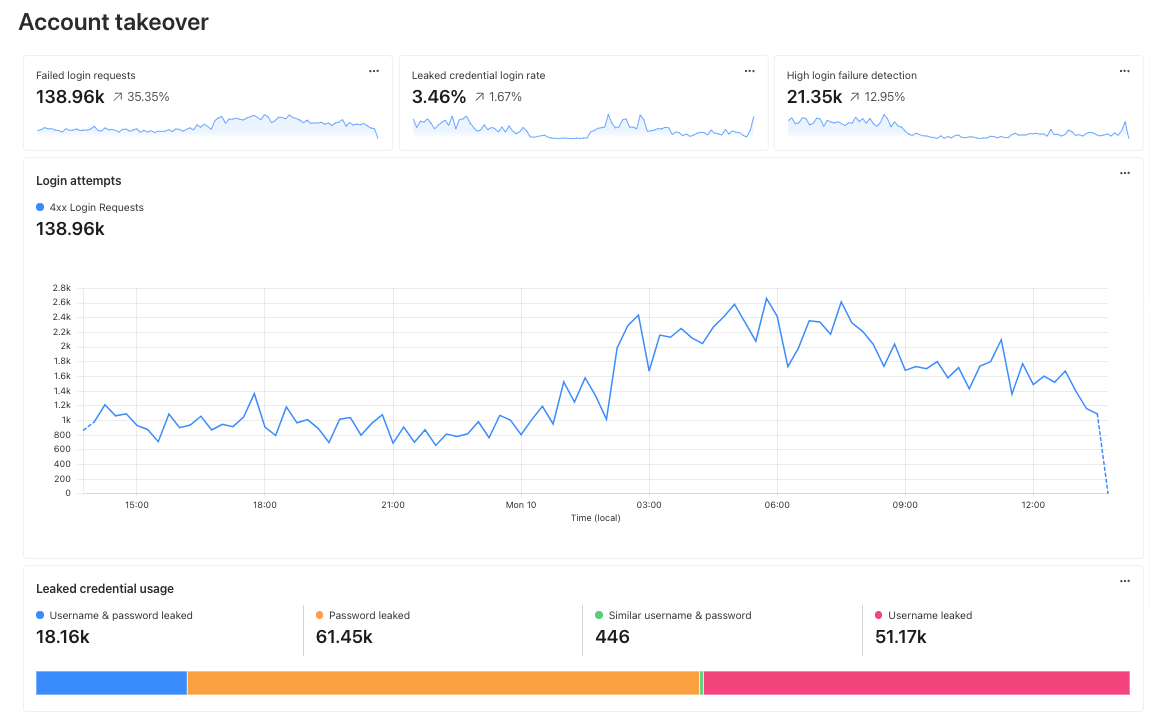
Account Takeover: View login attempts, usage of leaked credentials, and identify account takeover attacks
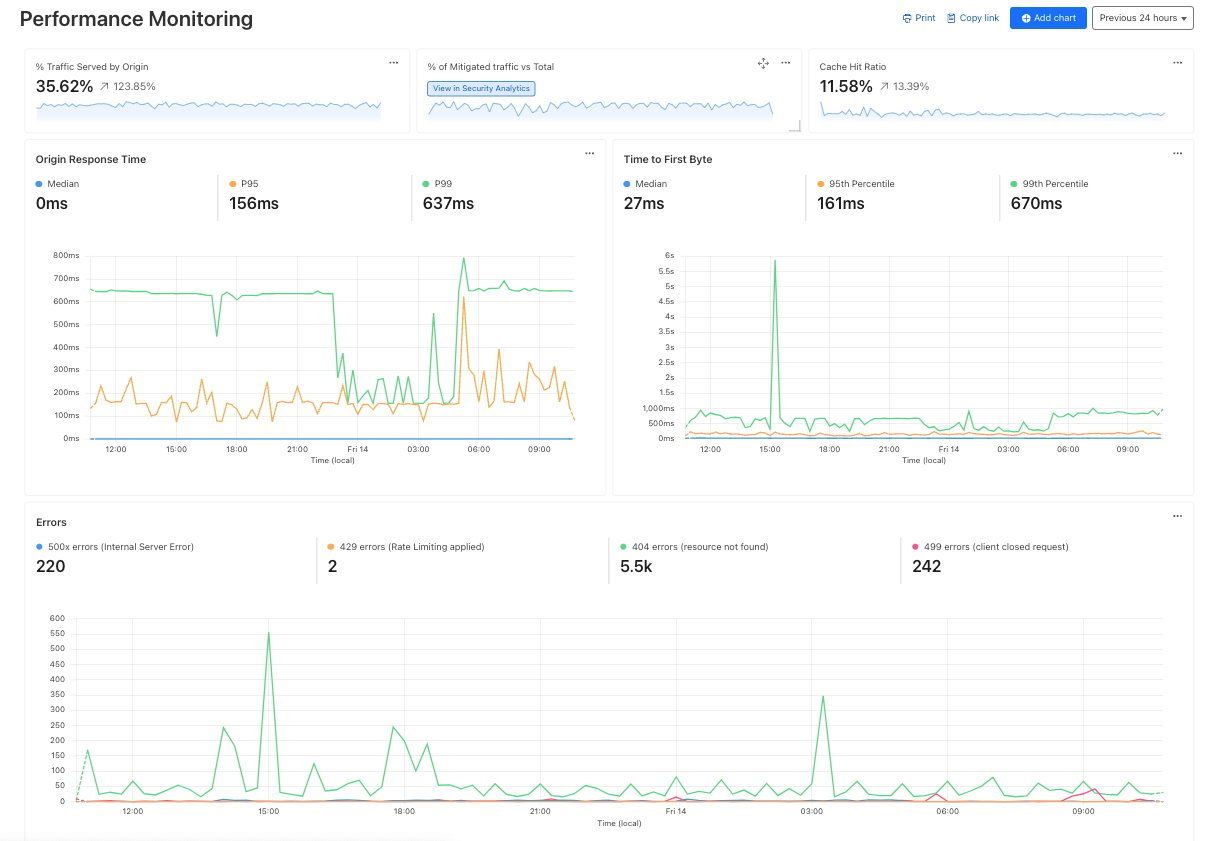
Performance Monitoring: Identify slow hosts and paths on your origin server, and view time to first byte (TTFB) metrics over time
Templates provide a good starting point, and once you create your dashboard, you can add or remove individual charts using the same natural language chart creator.
Video shows editing chart from an existing dashboard and moving individual charts via drag and drop.
Example use cases
Custom dashboards can be used to monitor for suspicious activity, or to keep an eye on performance and errors for your domains. Let’s explore some examples of suspicious activity that we can monitor using custom dashboards.
Take, for example, our use case from above: investigating unauthorized access. With custom dashboards, you can create a dashboard using the Account takeover template to monitor for suspicious login activity related to your domain.
As another example, spikes in requests or errors are common indicators that something is wrong, and they can sometimes be signals of suspicious activity. With the Performance Monitoring template, you can view origin response time and time to first byte metrics as well as monitor for common errors. For example, in this chart, the spikes in 404 errors could be an indication of an unauthorized scan of your endpoints.
Seamlessly integrated into the Cloudflare platform
When using custom dashboards, if you observe a traffic pattern or spike in errors that you would like to further investigate, you can click the button to “View in Security Analytics” in order to drill down further into the data and craft custom WAF rules to mitigate the threat.
These tools, seamlessly integrated into the Cloudflare platform, will enable users to discover, investigate, and mitigate threats all in one place, reducing time to resolution and overall cost of ownership by eliminating the need to forward logs to third party security analysis tools. And because it is a native part of Cloudflare, you can immediately use the data from your investigation to craft targeted rules that will block these threats.
What’s next
Stay tuned as we continue to develop more capabilities in the areas of observability and forensics, with additional features including:
Custom alerts: create alerts based on specific metrics or anomalies
Scheduled query detections: craft log queries and run them on a schedule to detect malicious activity
More integration: further streamlining the journey between detect, investigate, and mitigate across the full Cloudflare platform.
How to get it
Current Log Explorer beta users get immediate access to the new custom dashboards feature. Pricing will be made available to everyone during Q2 2025. Between now and then, these features continue to be available at no cost.
Let us know if you are interested in joining our Beta program by completing this form, and a member of our team will contact you.
Security and attacks continues to be a very active environment, and the visibility that Cloudflare Radar provides on this dynamic landscape has evolved and expanded over time. To that end, during 2023’s Security Week, we launched our URL Scanner, which enables users to safely scan any URL to determine if it is safe to view or interact with. During 2024’s Security Week, we launched an Email Security page, which provides a unique perspective on the threats posed by malicious emails, spam volume, the adoption of email authentication methods like SPF, DMARC, and DKIM, and the use of IPv4/IPv6 and TLS by email servers. For Security Week 2025, we are adding several new DDoS-focused graphs, new insights into leaked credential trends, and a new Bots page to Cloudflare Radar. We are also taking this opportunity to refactor Radar’s Security & Attacks page, breaking it out into Application Layer and Network Layer sections.
Below, we review all of these changes and additions to Radar.
Layered security
Since Cloudflare Radar launched in 2020, it has included both network layer (Layers 3 & 4) and application layer (Layer 7) attack traffic insights on a single Security & Attacks page. Over the last four-plus years, we have evolved some of the existing data sets on the page, as well as adding new ones. As the page has grown and improved over time, it risked becoming unwieldy to navigate, making it hard to find the graphs and data of interest. To help address that, the Security section on Radar now features separate Application Layer and Network Layer pages. The Application Layer page is the default, and includes insights from analysis of HTTP-based malicious and attack traffic. The Network Layer page includes insights from analysis of network and transport layer attacks, as well as observed TCP resets and timeouts. Future security and attack-related data sets will be added to the relevant page. Email Security remains on its own dedicated page.
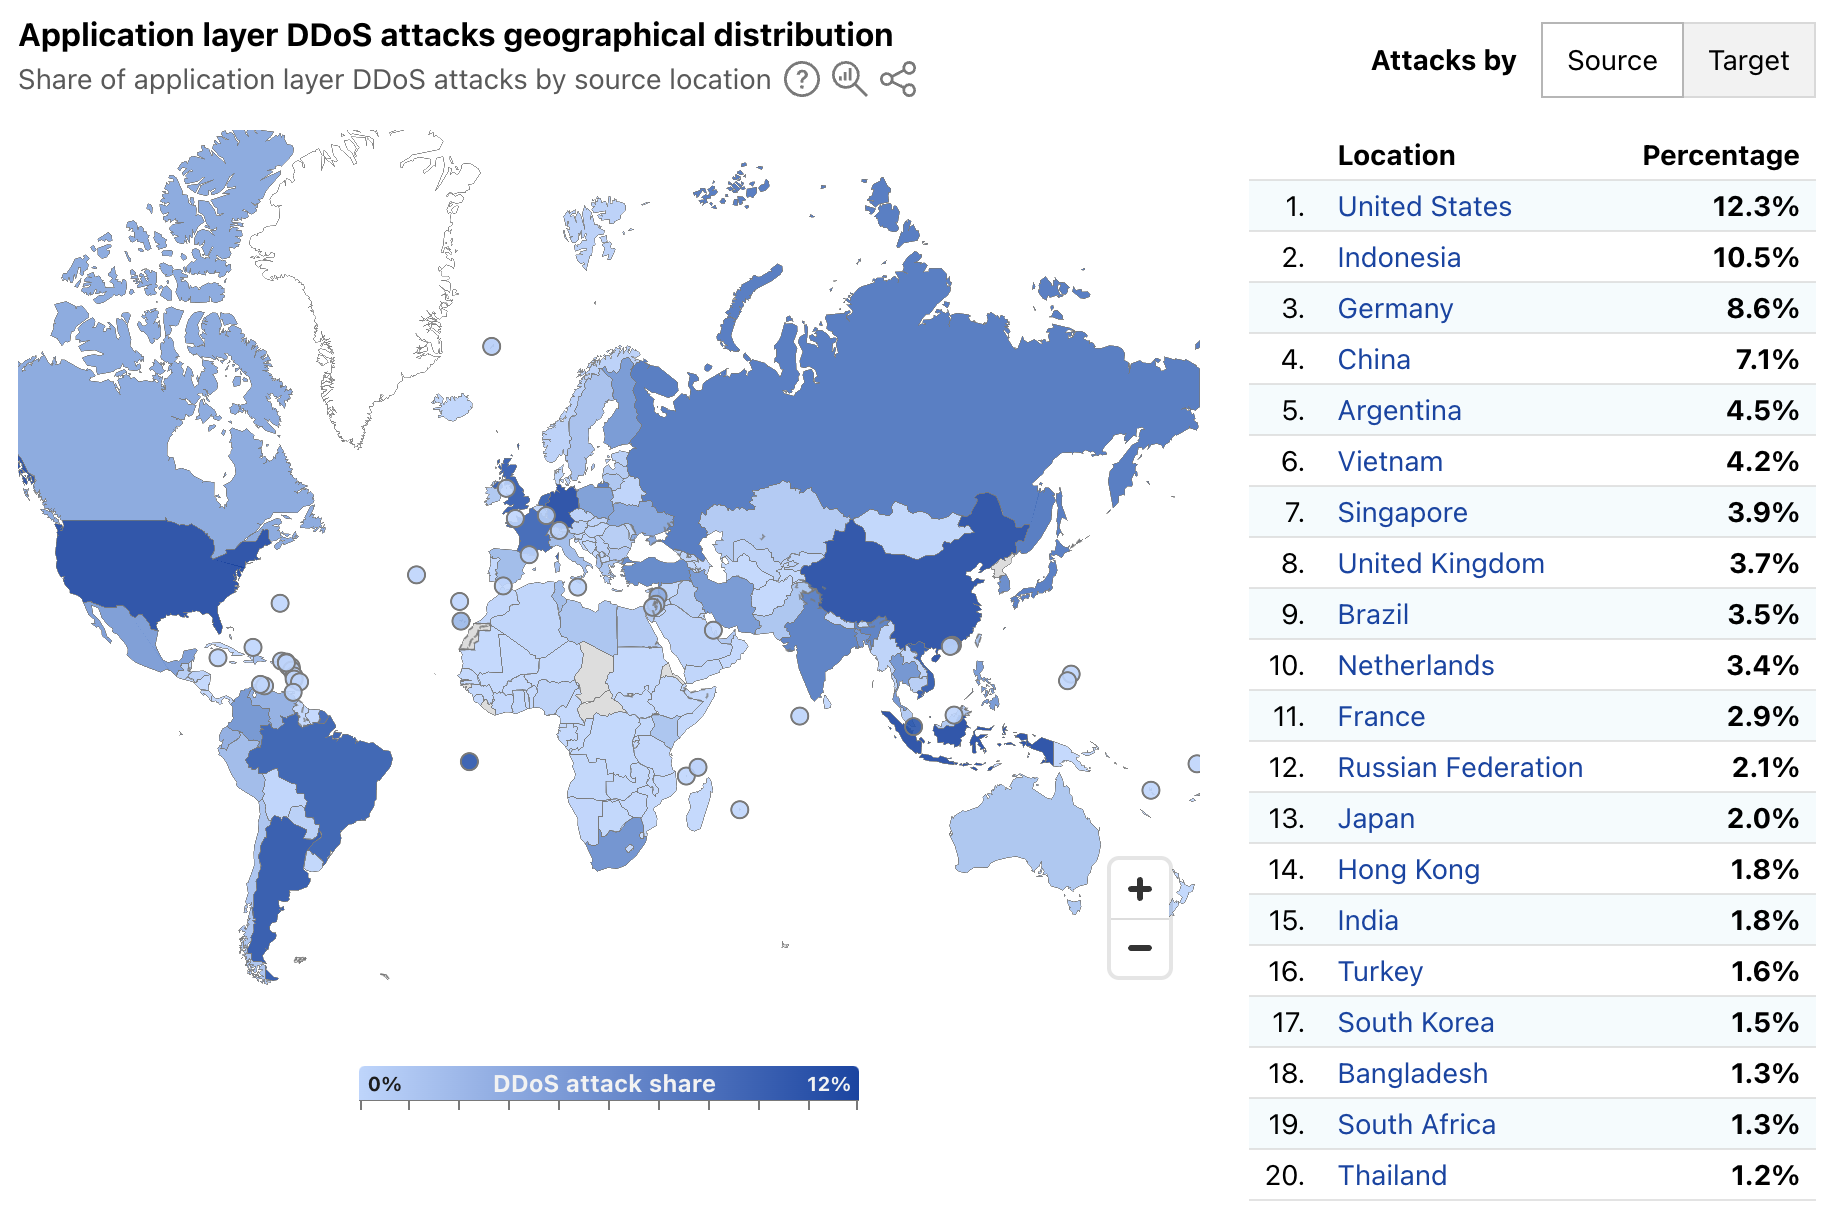
A geographic and network view of application layer DDoS attacks
Radar’s quarterly DDoS threat reports have historically provided insights, aggregated on a quarterly basis, into the top source and target locations of application layer DDoS attacks. A new map and table on Radar’s Application Layer Security page now provide more timely insights, with a global choropleth map showing a geographical distribution of source and target locations, and an accompanying list of the top 20 locations by share of all DDoS requests. Source location attribution continues to rely on the geolocation of the IP address originating the blocked request, while target location remains the billing location of the account that owns the site being attacked.
Over the first week of March 2025, the United States, Indonesia, and Germany were the top sources of application layer DDoS attacks, together accounting for over 30% of such attacks as shown below. The concentration across the top targeted locations was quite different, with customers from Canada, the United States, and Singapore attracting 56% of application layer DDoS attacks.
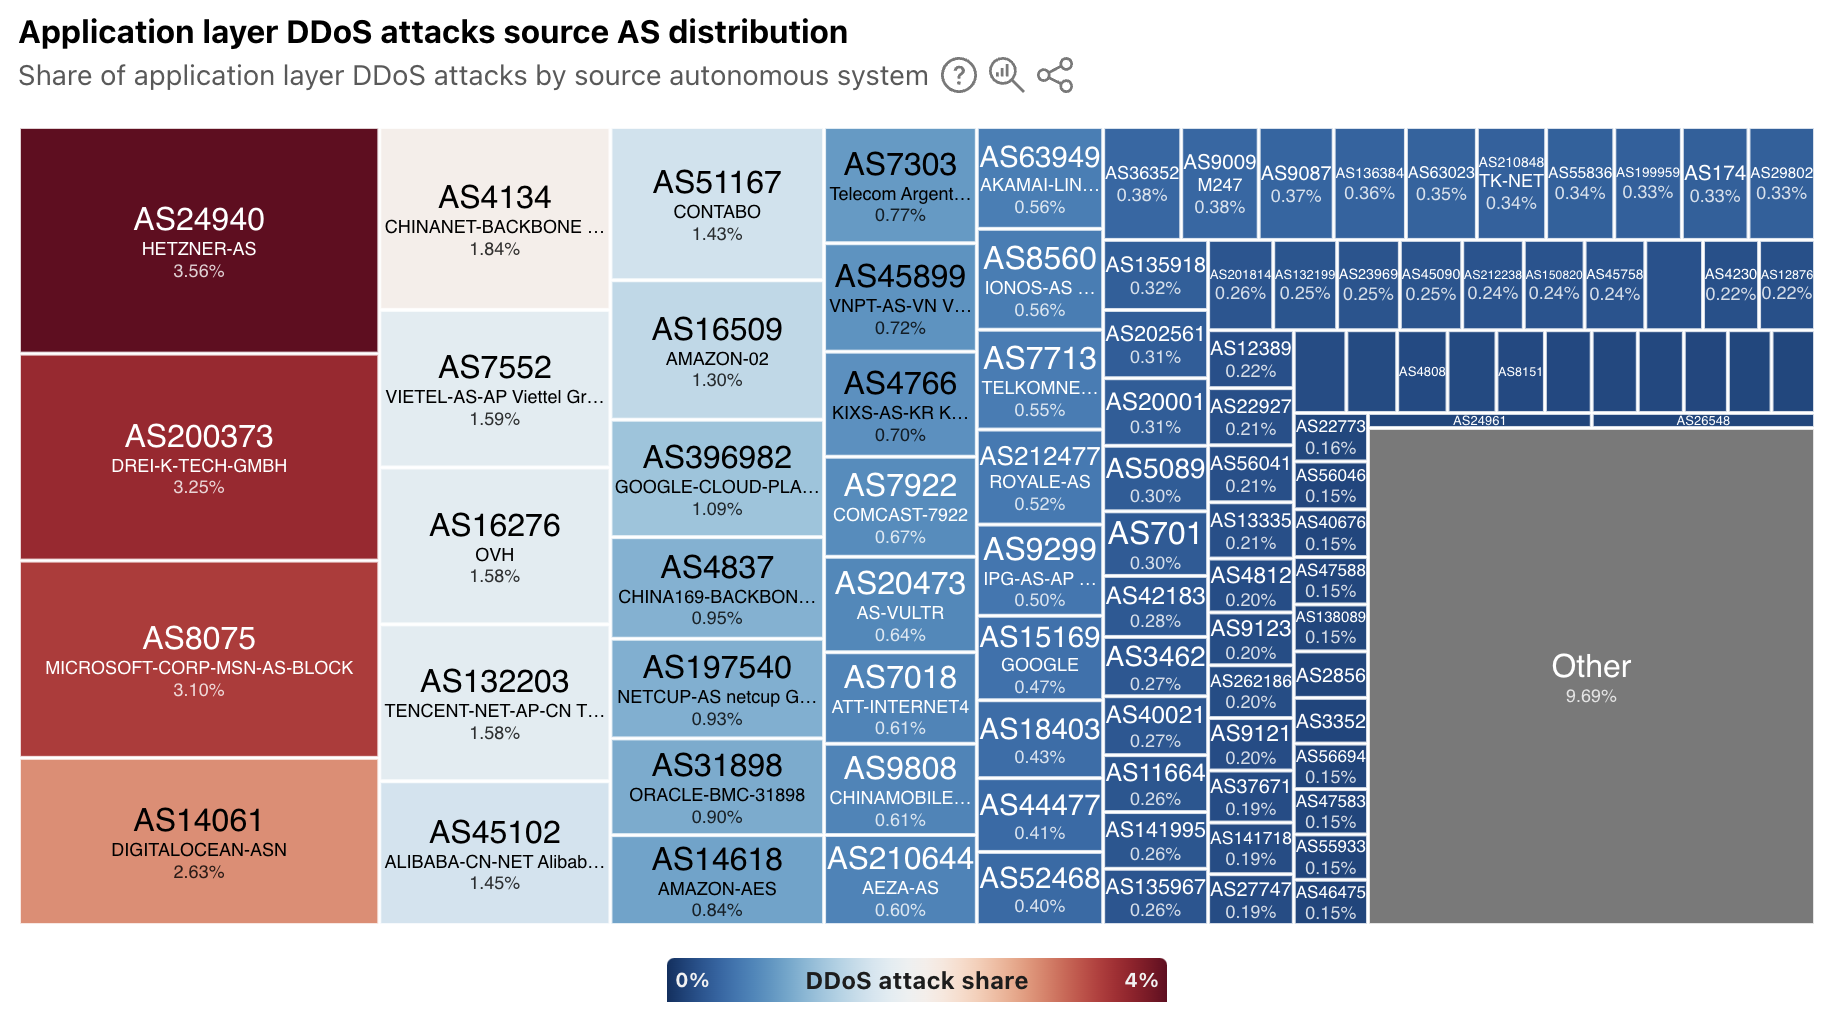
In addition to extended visibility into the geographic source of application layer DDoS attacks, we have also added autonomous system (AS)-level visibility. A new treemap view shows the distribution of these attacks by source AS. At a global level, the largest sources include cloud/hosting providers in Germany, the United States, China, and Vietnam.
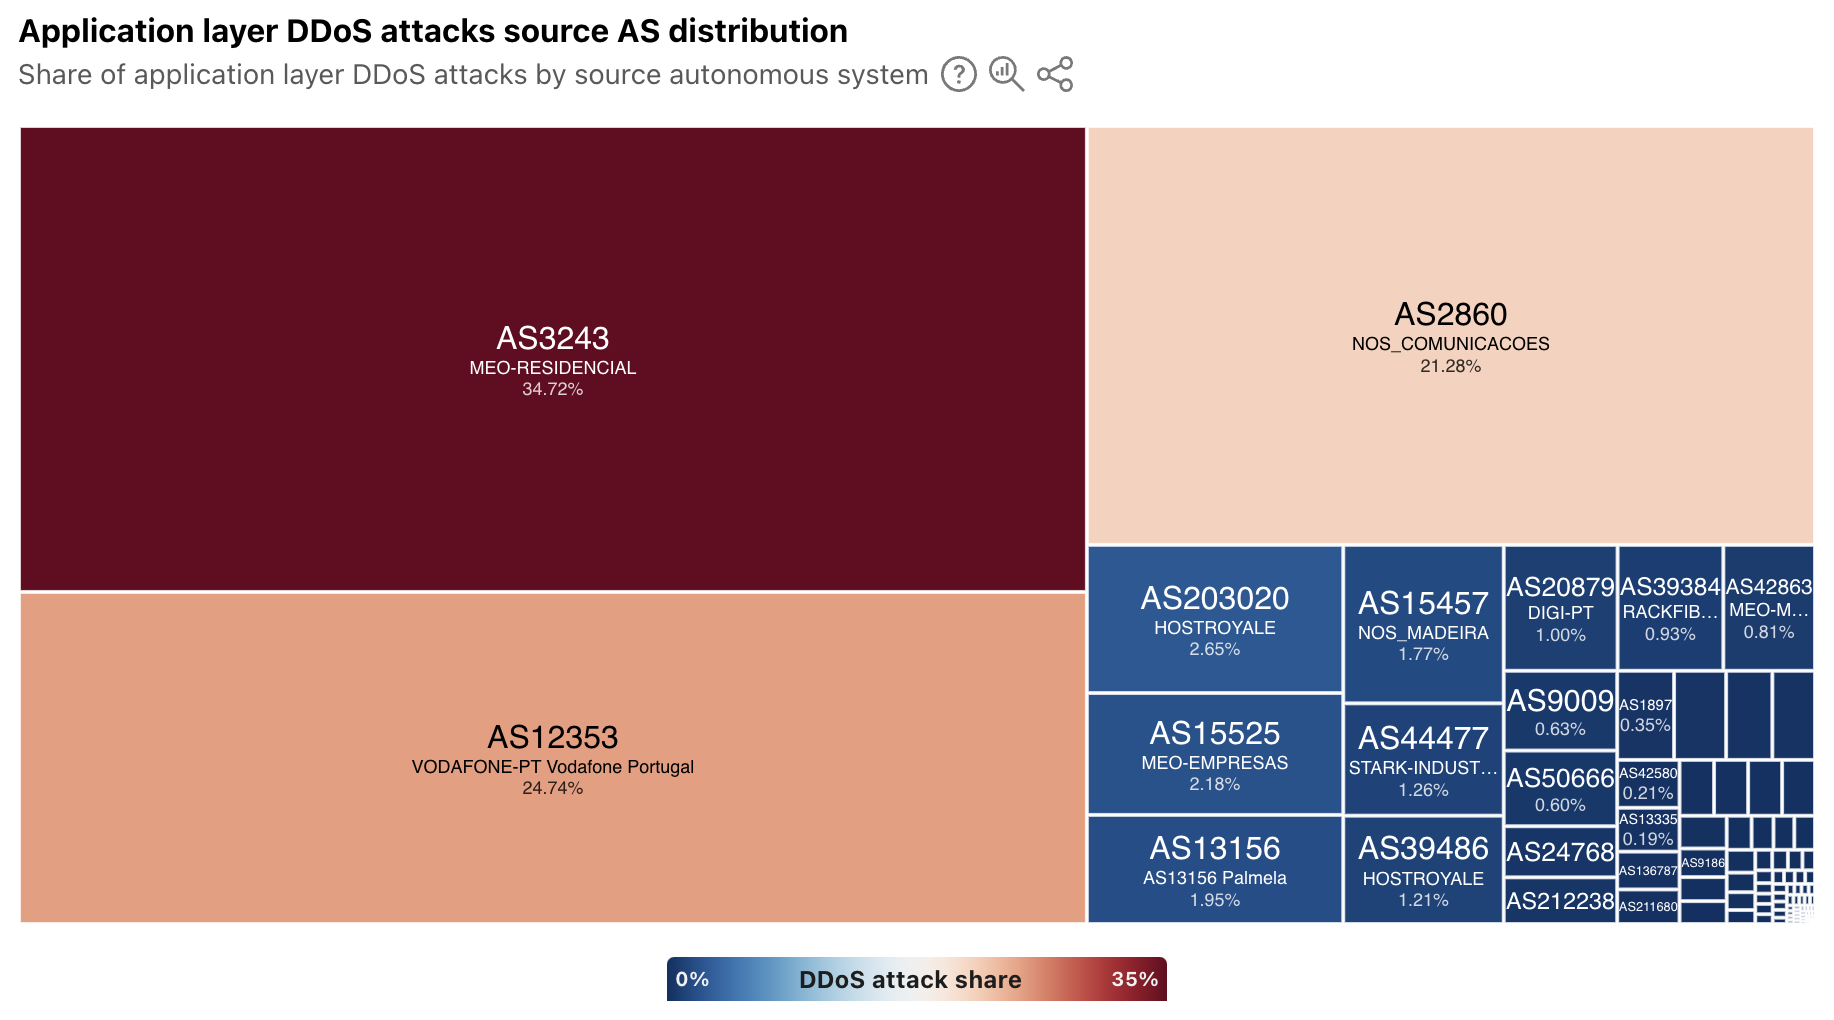
For a selected country/region, the treemap displays a source AS distribution for attacks observed to be originating from that location. In some, the sources of attack traffic are heavily concentrated in consumer/business network providers, such as in Portugal, shown below. However, in other countries/regions that have a large cloud provider presence, such as Ireland, Singapore, and the United States, ASNs associated with these types of providers are the dominant sources. To that end, Singapore was listed as being among the top sources of application layer DDoS attacks in each of the quarterly DDoS threat reports in 2024.
Have you been pwned?
Every week, it seems like there’s another headline about a data breach, talking about thousands or millions of usernames and passwords being stolen. Or maybe you get an email from an identity monitoring service that your username and password were found on the “dark web”. (Of course, you’re getting those alerts thanks to a complementary subscription to the service offered as penance from another data breach…)
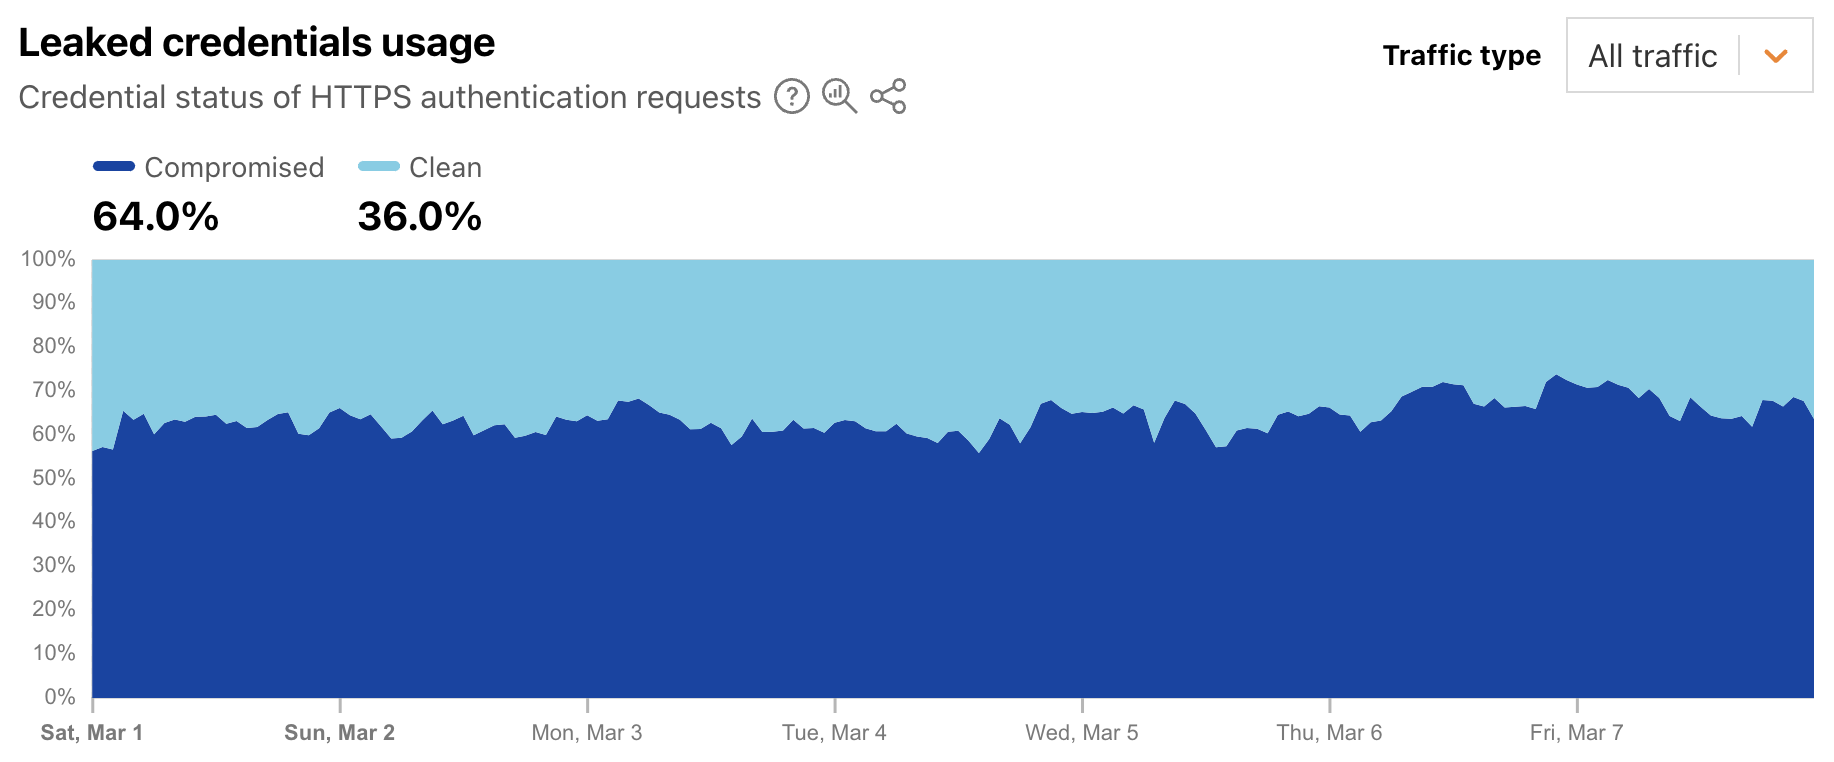
This credential theft is especially problematic because people often reuse passwords, despite best practices advising the use of strong, unique passwords for each site or application. To help mitigate this risk, starting in 2024, Cloudflare began enabling customers to scan authentication requests for their websites and applications using a privacy-preserving compromised credential checker implementation to detect known-leaked usernames and passwords. Today, we’re using aggregated data to display trends in how often these leaked and stolen credentials are observed across Cloudflare’s network. (Here, we are defining “leaked credentials” as usernames or passwords being found in a public dataset, or the username and password detected as being similar.)
Leaked credentials detection scans incoming HTTP requests for known authentication patterns from common web apps and any custom detection locations that were configured. The service uses a privacy-preserving compromised credential checking protocol to compare a hash of the detected passwords to hashes of compromised passwords found in databases of leaked credentials. A new Radar graph on the worldwide Application Layer Security page provides visibility into aggregate trends around the detection of leaked credentials in authentication requests. Filterable by authentication requests from human users, bots, or all (human + bot), the graph shows the distribution requests classified as “clean” (no leaked credentials detected) and “compromised” (leaked credentials, as defined above, were used). At a worldwide level, we found that for the first week of March 2025, leaked credentials were used in 64% of all, over 65% of bot, and over 44% of human authorization requests.
This suggests that from a human perspective, password reuse is still a problem, as is users not taking immediate actions to change passwords when notified of a breach. And from a bot perspective, this suggests that attackers know that there is a good chance that leaked credentials for one website or application will enable them to access that same user’s account elsewhere.
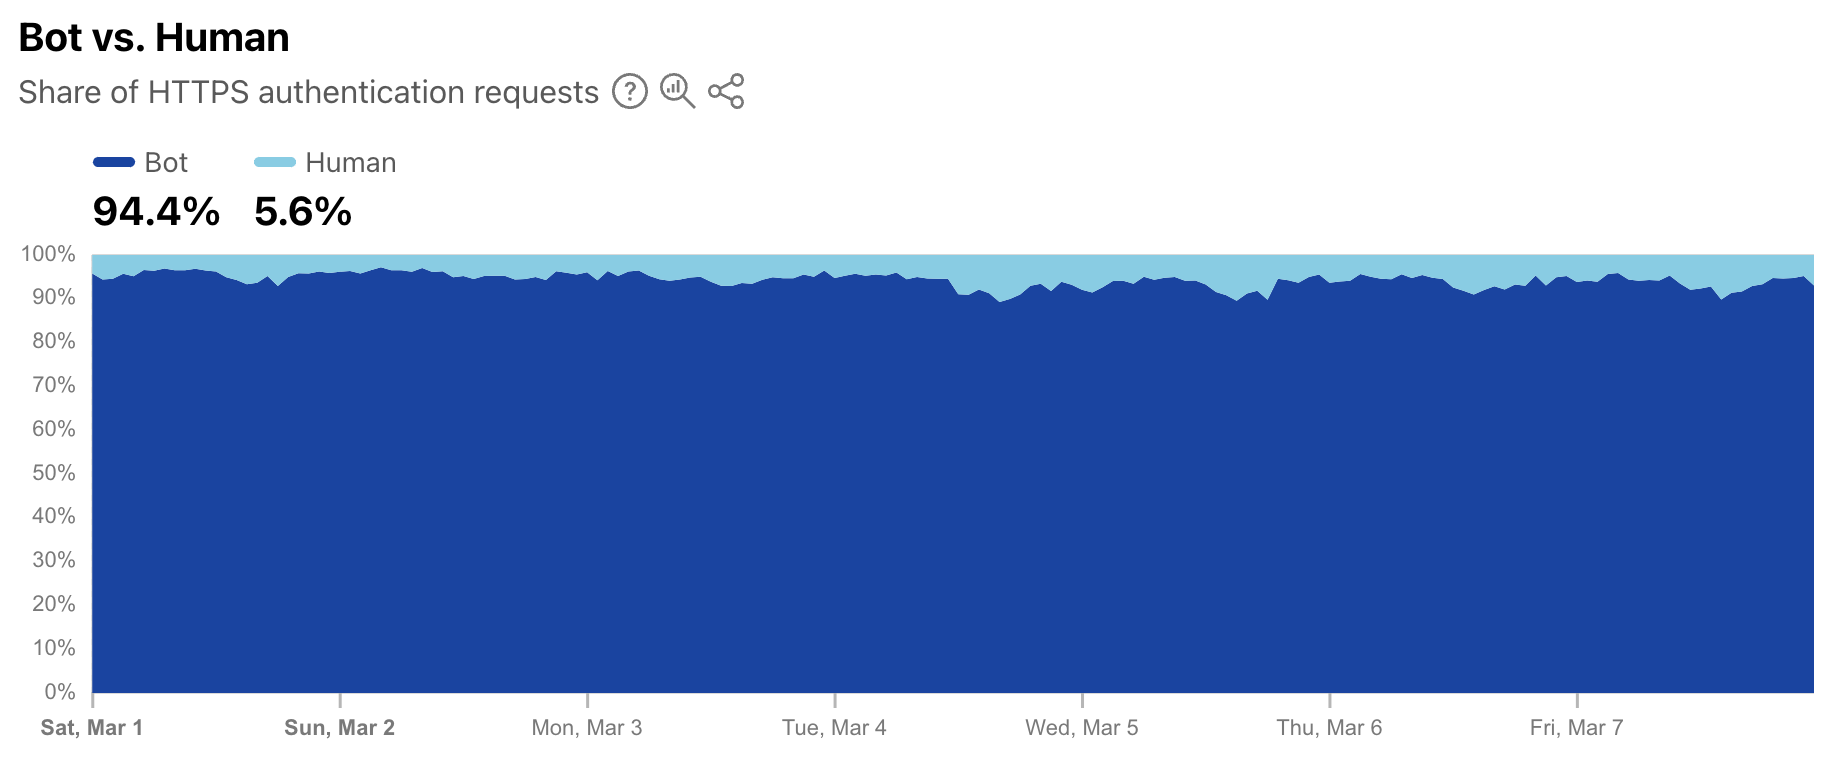
As a complement to the leaked credentials data, Radar is also now providing a worldwide view into the share of authentication requests originating from bots. Note that not all of these requests are necessarily malicious — while some may be associated with credential stuffing-style attacks, others may be from automated scripts or other benign applications accessing an authentication endpoint. (Having said that, automated malicious attack request volume far exceeds legitimate automated login attempts.) During the first week of March 2025, we found that over 94% of authentication requests came from bots (were automated), with the balance coming from humans. Over that same period, bot traffic only accounted for 30% of overall requests. So although bots don’t represent a majority of request traffic, authentication requests appear to comprise a significant portion of their activity.
Bots get a dedicated page
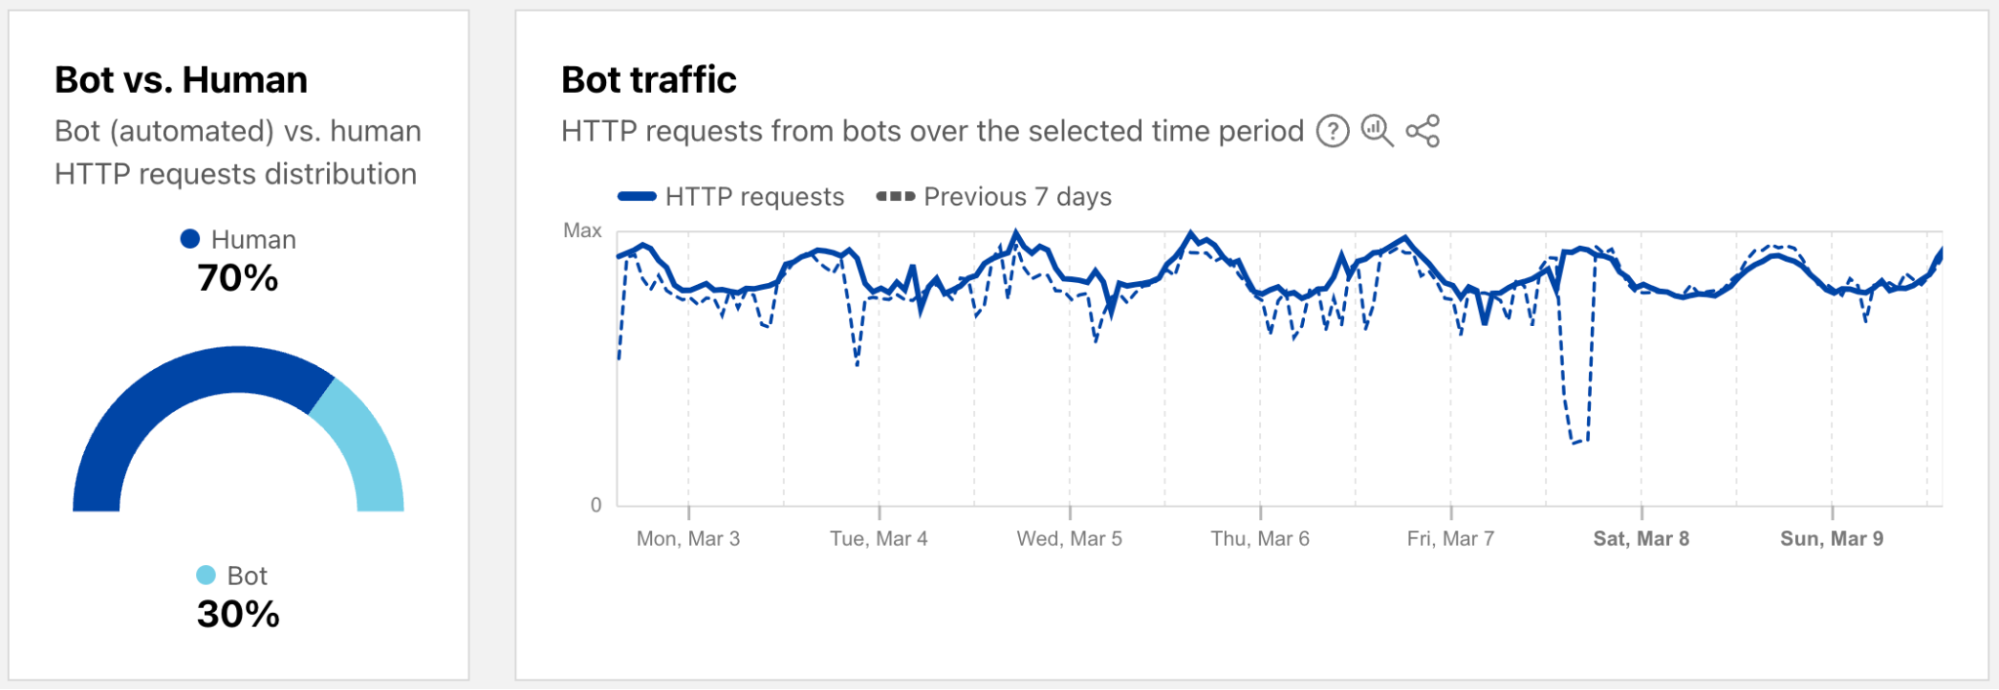
As a reminder, bot traffic describes any non-human Internet traffic, and monitoring bot levels can help spot potential malicious activities. Of course, bots can be helpful too, and Cloudflare maintains a list of verified bots to help keep the Internet healthy. Given the importance of monitoring bot activity, we have launched a new dedicated Bots page in the Traffic section of Cloudflare Radar to support these efforts. For both worldwide and location views over the selected time period, the page shows the distribution of bot (automated) vs. human HTTP requests, as well as a graph showing bot traffic trends. (Our bot score, combining machine learning, heuristics, and other techniques, is used to identify automated requests likely to be coming from bots.)
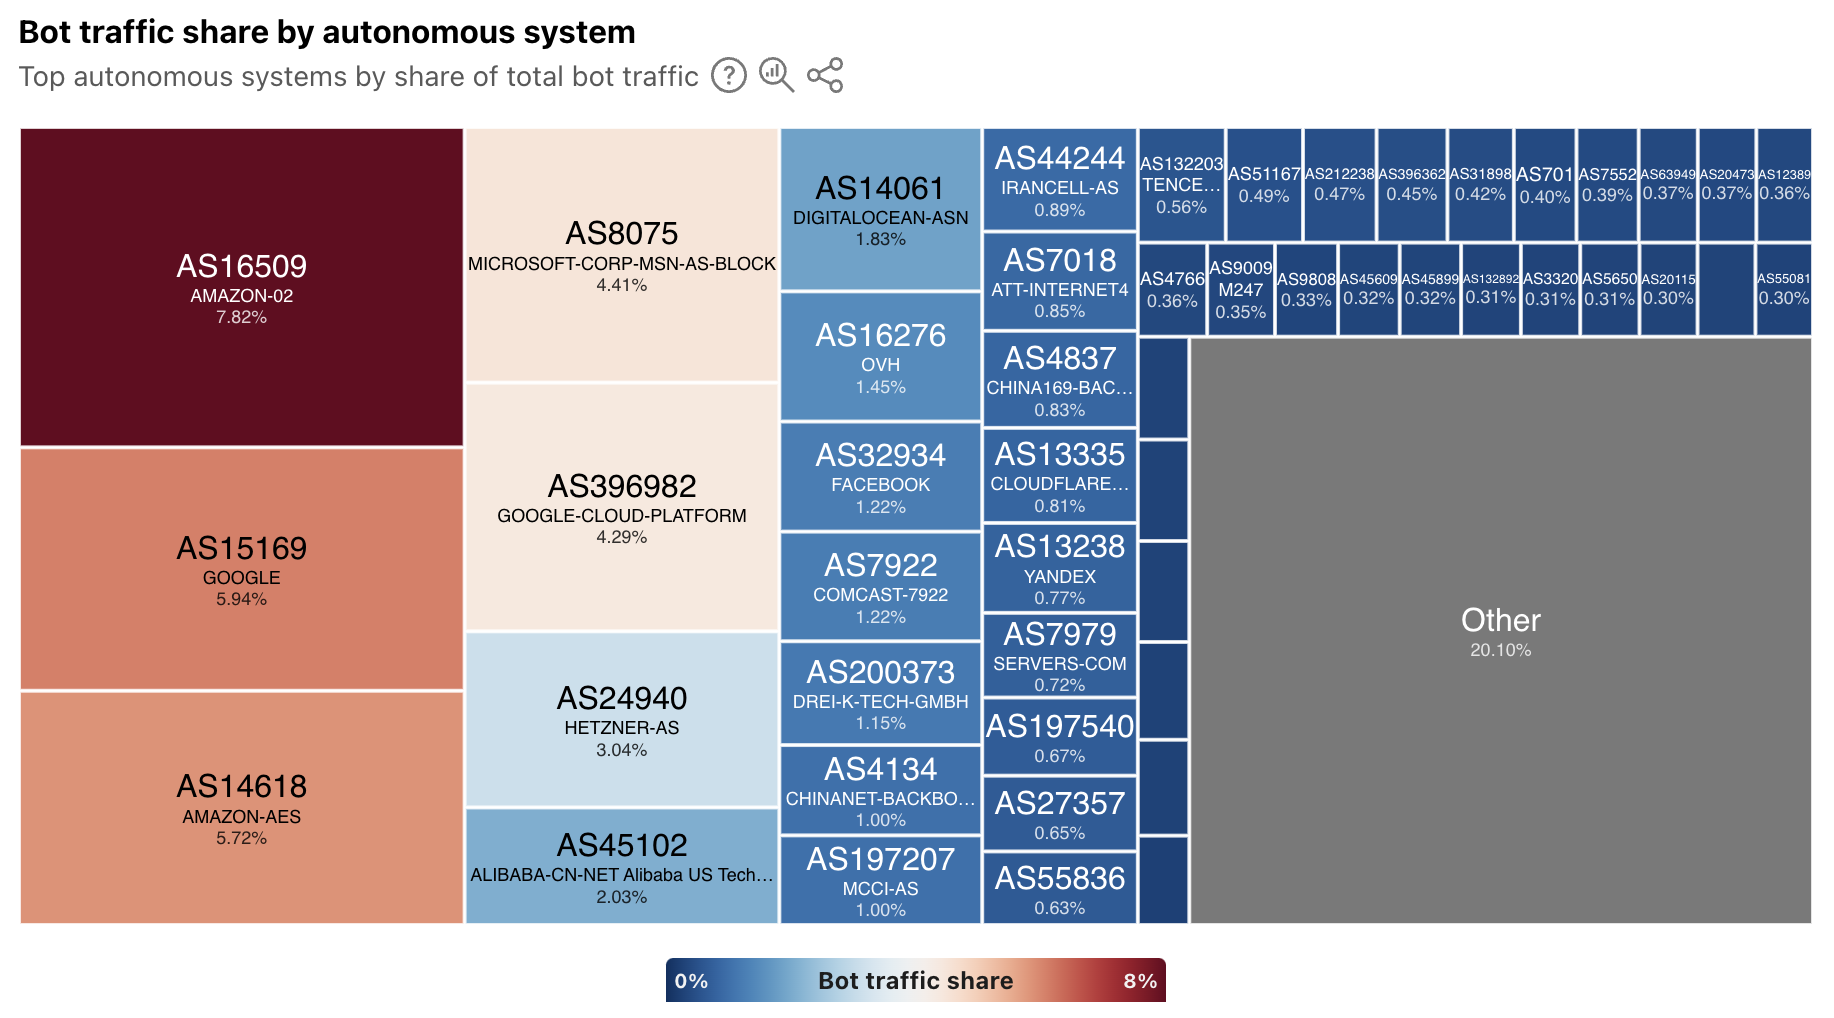
Both the 2023 and 2024 Cloudflare Radar Year in Review microsites included a “Bot Traffic Sources” section, showing the locations and networks that Cloudflare determined that the largest shares of automated/likely automated traffic was originating from. However, these traffic shares were published just once a year, aggregating traffic from January through the end of November.
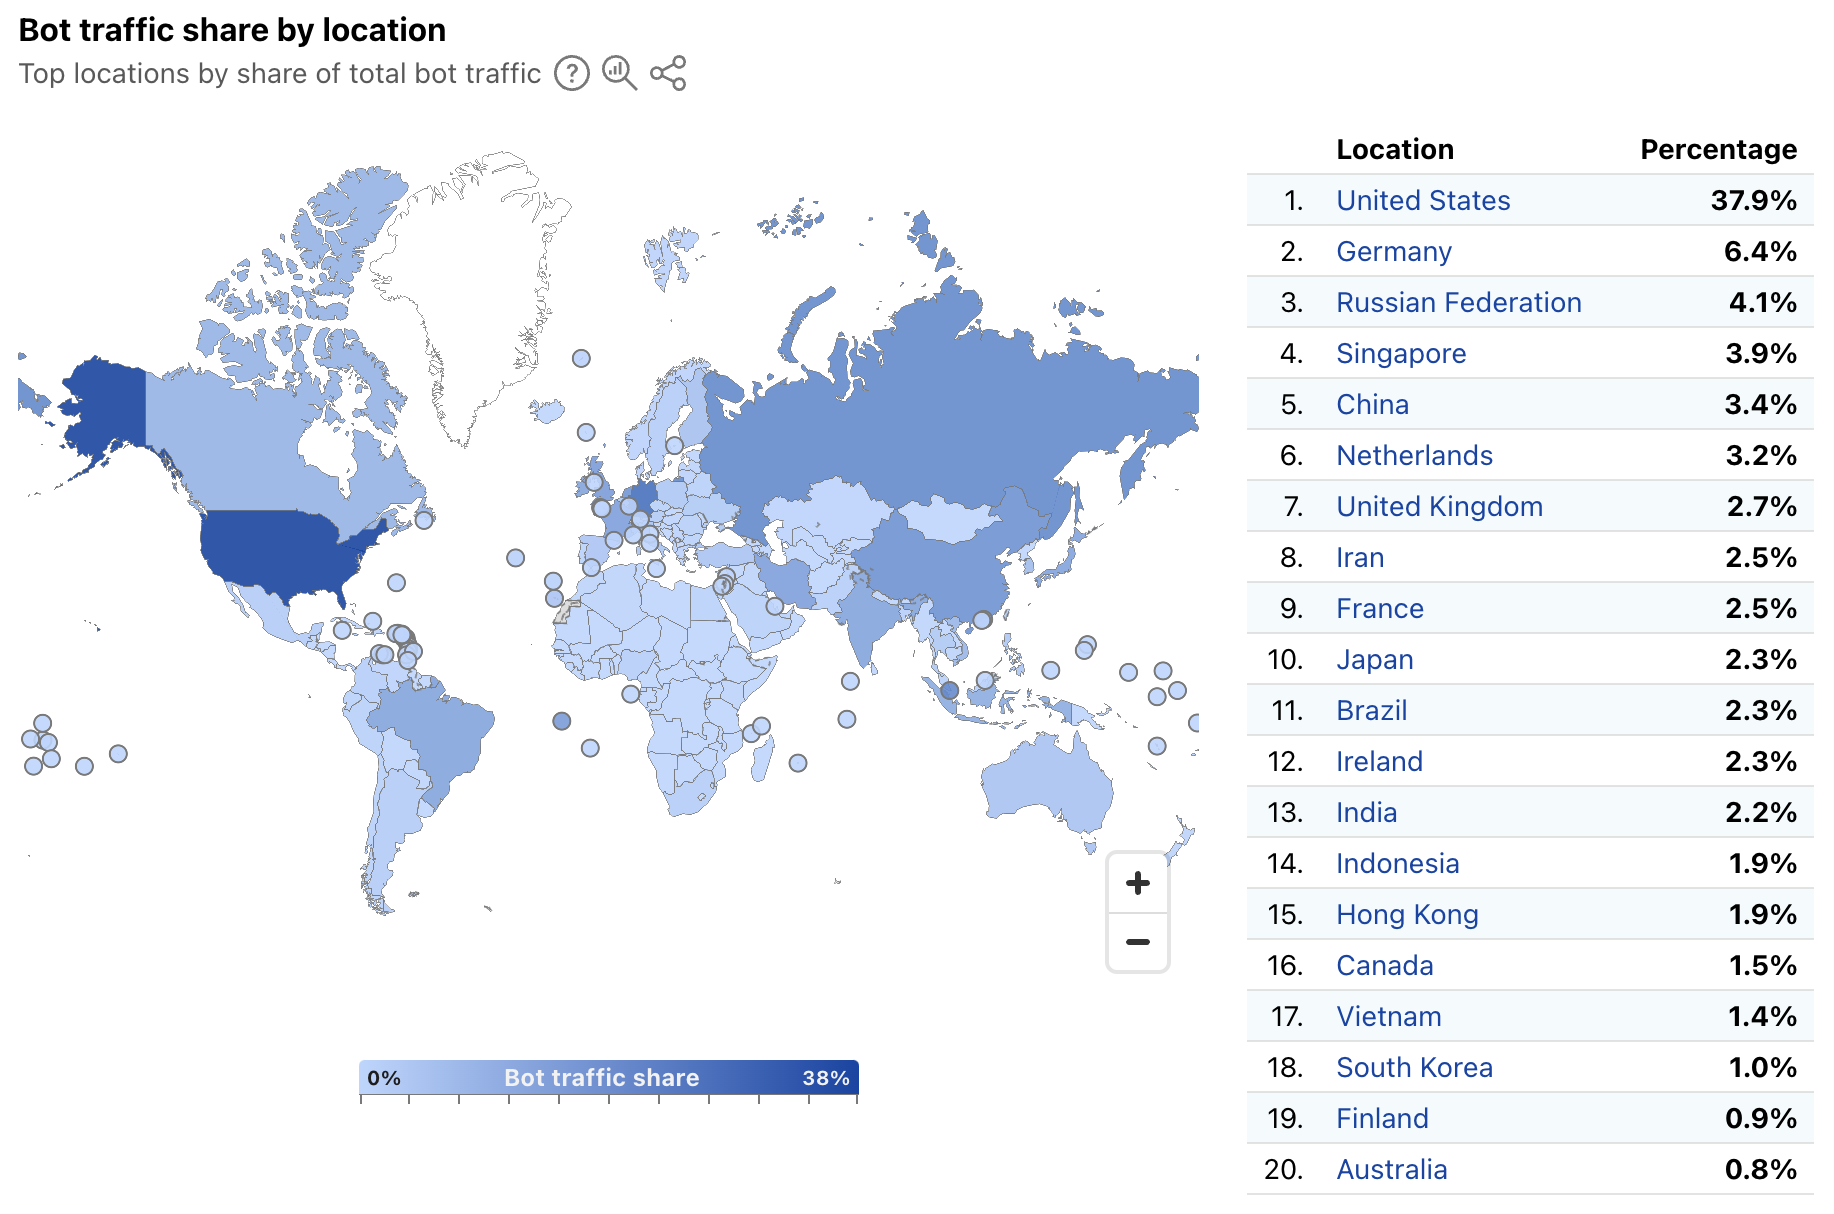
In order to provide a more timely perspective, these insights are now available on the new Radar Bots page. Similar to the new DDoS attacks content discussed above, the worldwide view includes a choropleth map and table illustrating the locations originating the largest shares of all bot traffic. (Note that a similar Traffic Characteristics map and table on the Traffic Overview page ranks locations by the bot traffic share of the location’s total traffic.) Similar to Year in Review data linked above, the United States continues to originate the largest share of bot traffic.
In addition, the worldwide view also breaks out bot traffic share by AS, mirroring the treemap shown in the Year in Review. As we have noted previously, cloud platform providers account for a significant amount of bot traffic.
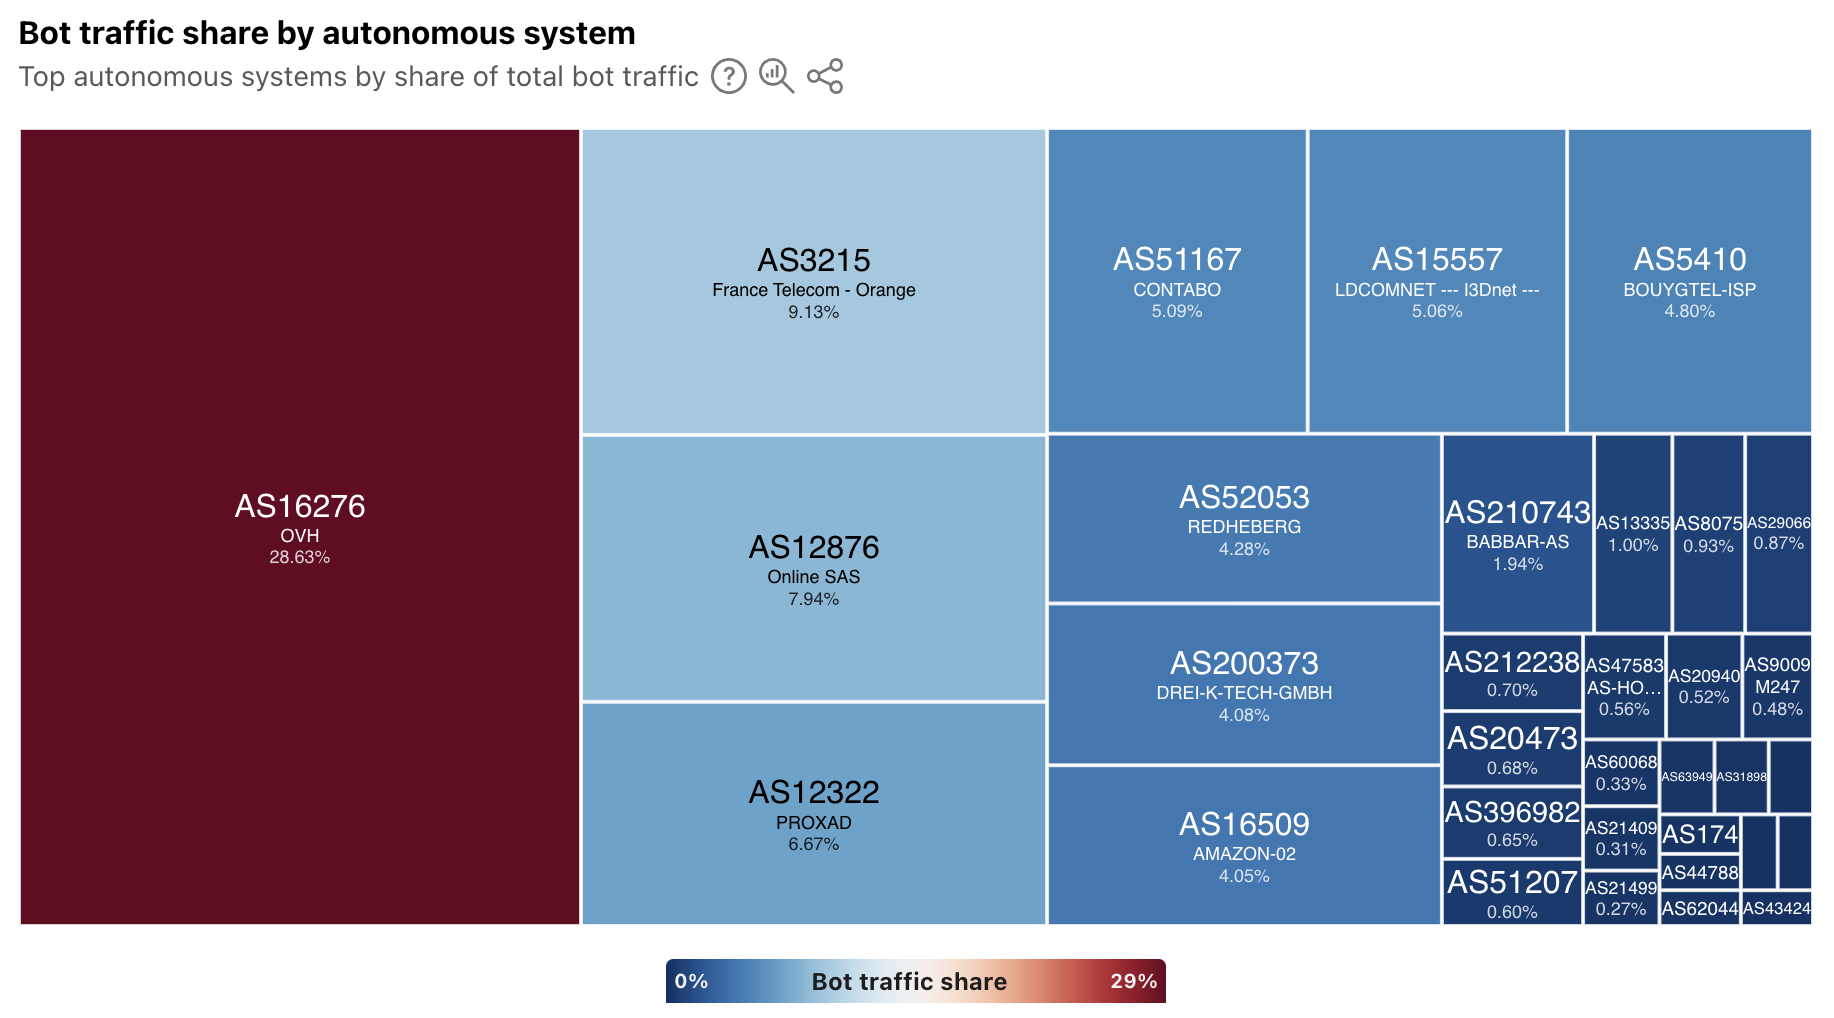
At a location level, depending on the country/region selected, the top sources of bot traffic may be cloud/hosting providers, consumer/business network providers, or a mix. For instance, France’s distribution is shown below, and four ASNs account for just over half of the country’s bot traffic. Of these ASNs, two (AS16276 and AS12876) belong to cloud/hosting providers, and two (AS3215 and AS12322) belong to network providers.
In addition, the Verified Bots list has been moved to the new Bots page on Radar. The data shown and functionality remains unchanged, and links to the old location will automatically be redirected to the new one.
Summary
The Cloudflare dashboard provides customers with specific views of security trends, application and network layer attacks, and bot activity across their sites and applications. While these views are useful at an individual customer level, aggregated views at a worldwide, location, and network level provide a macro-level perspective on trends and activity. These aggregated views available on Cloudflare Radar not only help customers understand how their observations compare to the larger whole, but they also help the industry understand emerging threats that may require action.
The underlying data for the graphs and data discussed above is available via the Radar API (Application Layer, Network Layer, Bots, Leaked Credentials). The data can also be interactively explored in more detail across locations, networks, and time periods using Radar’s Data Explorer and AI Assistant. And as always, Radar and Data Explorer charts and graphs are downloadable for sharing, and embeddable for use in your own blog posts, websites, or dashboards.
At Cloudflare, we are constantly innovating and launching new features and capabilities across our product portfolio. Today, we’re releasing a number of new features aimed at improving the security tools available to our customers.
Automated security level: Cloudflare’s Security Level setting has been improved and no longer requires manual configuration. By integrating botnet data along with other request rate signals, all customers are protected from confirmed known malicious botnet traffic without any action required.
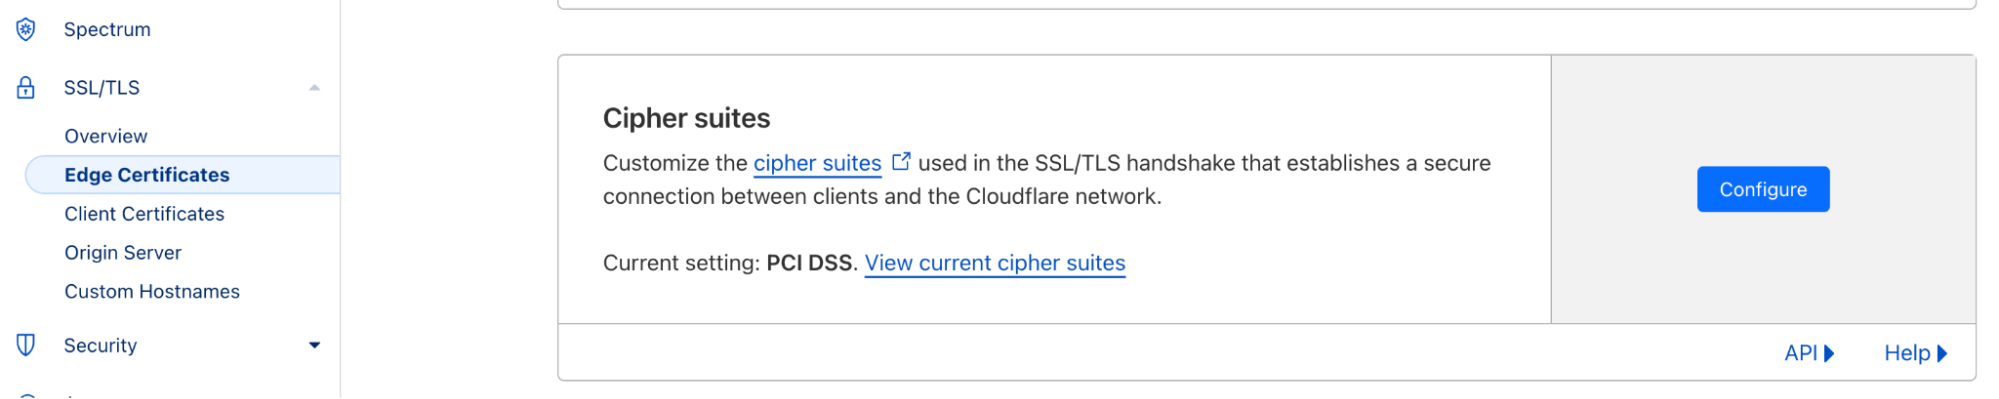
Cipher suite selection: You now have greater control over encryption settings via the Cloudflare dashboard, including specific cipher suite selection based on our client or compliance requirements.
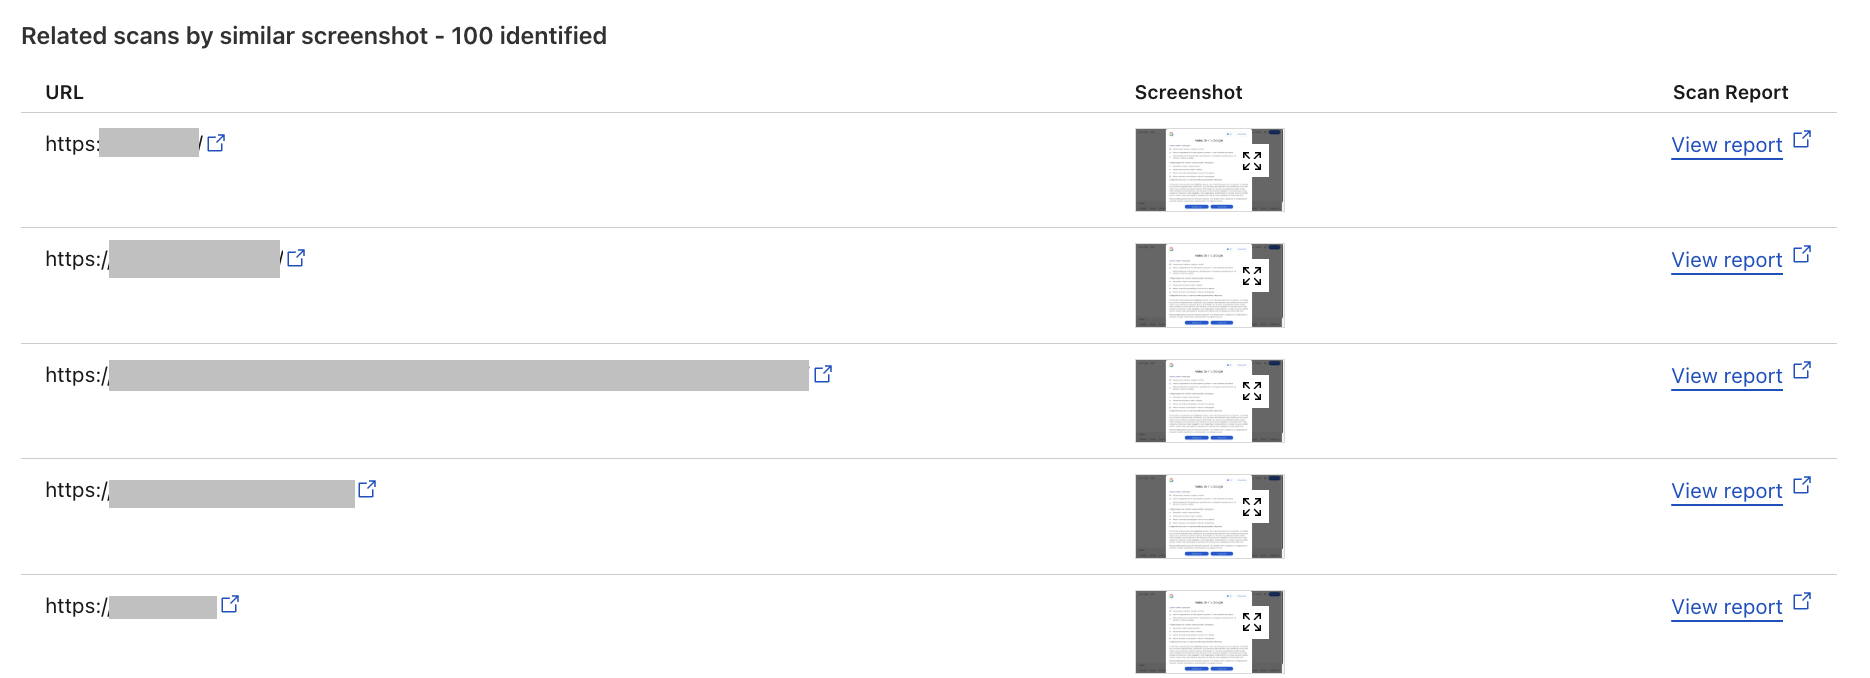
Improved URL scanner: New features include bulk scanning, similarity search, location picker and more.
These updates are designed to give you more power and flexibility when managing online security, from proactive threat detection to granular control over encryption settings.
Automating Security Level to provide stronger protection for all
Cloudflare’s Security Level feature was designed to protect customer websites from malicious activity.
Available to all Cloudflare customers, including the free tier, it has always had very simple logic: if a connecting client IP address has shown malicious behavior across our network, issue a managed challenge. The system tracks malicious behavior by assigning a threat score to each IP address. The more bad behavior is observed, the higher the score. Cloudflare customers could configure the threshold that would trigger the challenge.
We are now announcing an update to how Security Level works, by combining the IP address threat signal with threshold and botnet data. The resulting detection improvements have allowed us to automate the configuration, no longer requiring customers to set a threshold.
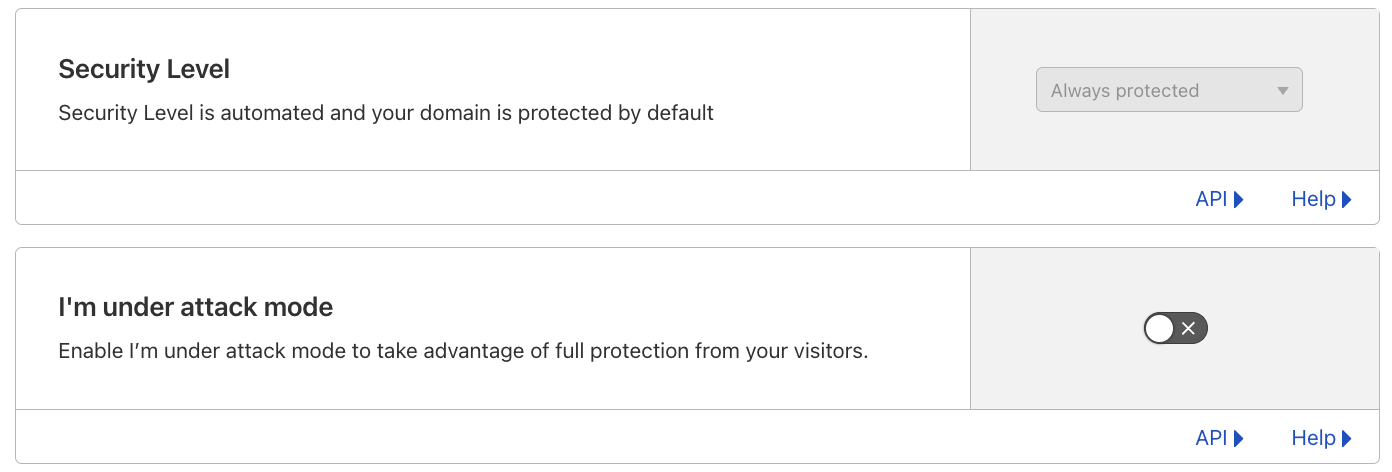
The Security Level setting is now Always protected in the dashboard, and ip_threat_score fields in WAF Custom Rules will no longer be populated. No change is required by Cloudflare customers. The “I am under attack” option remains unchanged.
Stronger protection, by default, for all customers
Although we always favor simplicity, privacy-related services, including our own WARP, have seen growing use. Meanwhile, carrier-grade network address translation (CGNATs) and outbound forward proxies have been widely used for many years.
These services often result in multiple users sharing the same IP address, which can lead to legitimate users being challenged unfairly since individual addresses don’t strictly correlate with unique client behavior. Moreover, threat actors have become increasingly adept at anonymizing and dynamically changing their IP addresses using tools like VPNs, proxies, and botnets, further diminishing the reliability of IP addresses as a standalone indicator of malicious activity. Recognising these limitations, it was time for us to revisit Security Level’s logic to reduce the number of false positives being observed.
In February 2024, we introduced a new security system that automatically combines the real-time DDoS score with a traffic threshold and a botnet tracking system. The real-time DDoS score is part of our autonomous DDoS detection system, which analyzes traffic patterns to identify potential threats. This system superseded and replaced the existing Security Level logic, and is deployed on all customer traffic, including free plans. After thorough monitoring and analysis over the past year, we have confirmed that these behavior-based mitigation systems provide more accurate results. Notably, we’ve observed a significant reduction in false positives, demonstrating the limitations of the previous IP address-only logic.
Better botnet tracking
Our new logic combines IP address signals with behavioral and threshold indicators to improve the accuracy of botnet detection. While IP addresses alone can be unreliable due to potential false positives, we enhance their utility by integrating them with additional signals. We monitor surges in traffic from known “bad” IP addresses and further refine this data by examining specific properties such as path, accept, and host headers.
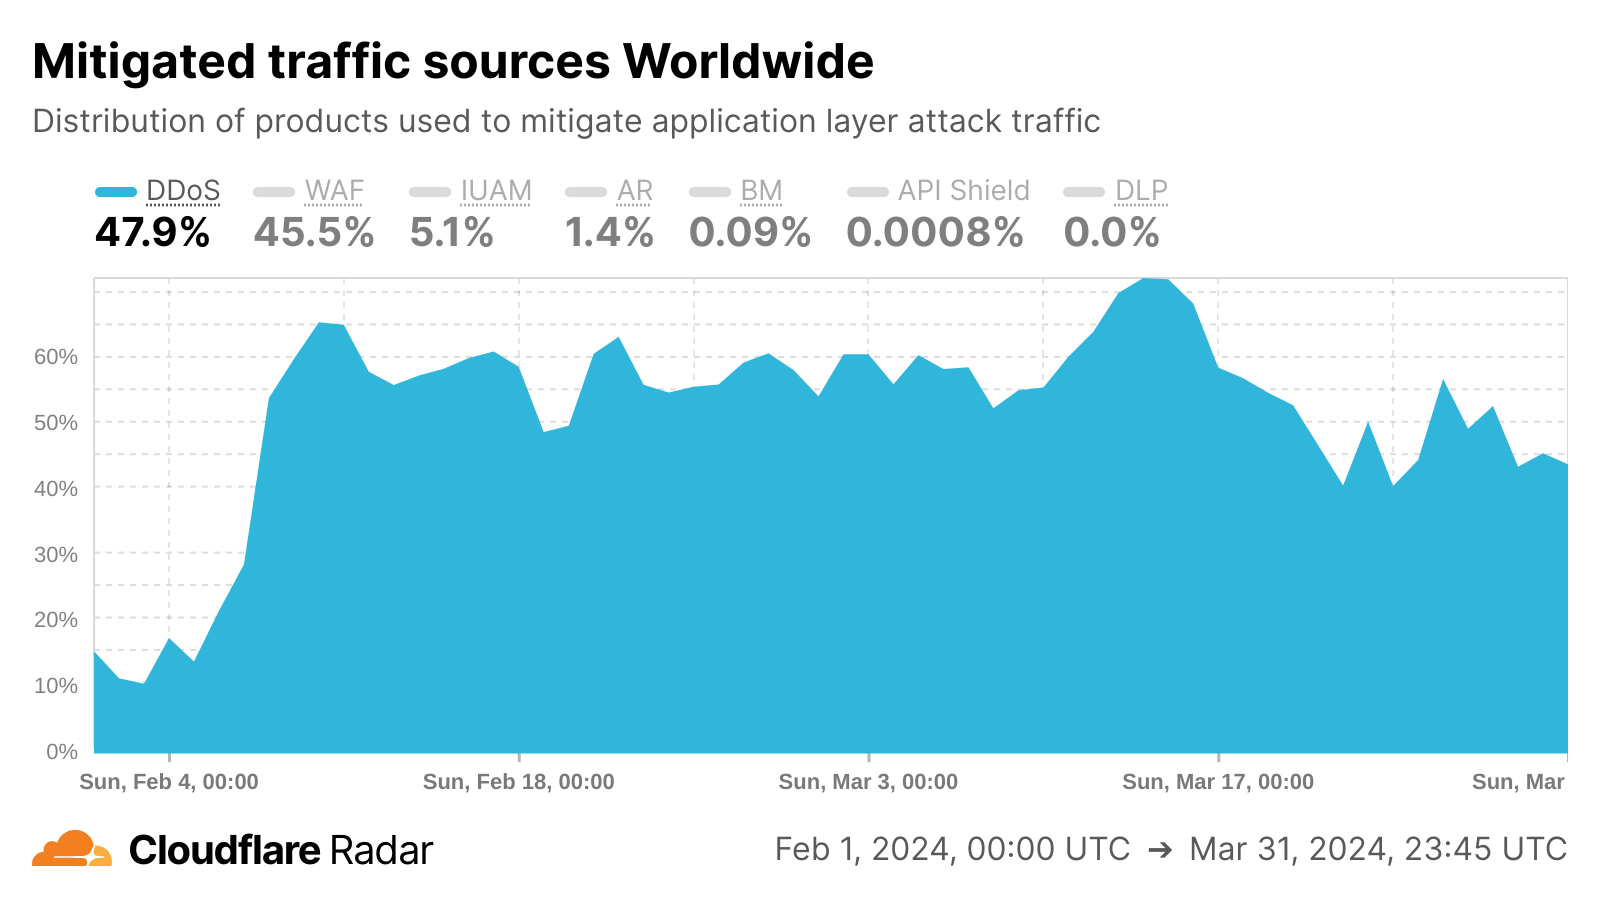
We also introduced a new botnet tracking system that continuously detects and tracks botnet activity across the Cloudflare network. From our unique vantage point as a reverse proxy for nearly 20% of all websites, we maintain a dynamic database of IP addresses associated with botnet activity. This database is continuously updated, enabling us to automatically respond to emerging threats without manual intervention. This effect is visible in the Cloudflare Radar chart below, as we saw sharp growth in DDoS mitigations in February 2024 as the botnet tracking system was implemented.
What it means for our customers and their users
Customers now get better protection while having to manage fewer configurations, and they can rest assured that their online presence remains fully protected. These security measures are integrated and enabled by default across all of our plans, ensuring protection without the need for manual configuration or rule management.
This improvement is particularly beneficial for users accessing sites through proxy services or CGNATs, as these setups can sometimes trigger unnecessary security checks, potentially disrupting access to websites.
What’s next
Our team is looking at defining the next generation of threat scoring mechanisms. This initiative aims to provide our customers with more relevant and effective controls and tools to combat today’s and tomorrow’s potential security threats.
Effective March 17, 2025, we are removing the option to configure manual rules using the threat score parameter in the Cloudflare dashboard. The “I’m Under Attack” mode remains available, allowing users to issue managed challenges to all traffic when needed.
By the end of Q1 2026, we anticipate disabling all rules that rely on IP threat score. This means that using the threat score parameter in the Rulesets API and via Terraform won’t be available after the end of the transition period. However, we encourage customers to be proactive and edit or remove the rules containing the threat score parameter starting today.
Cipher suite selection now available in the UI
Building upon our core security features, we’re also giving you more control over your encryption: cipher suite selection is now available in the Cloudflare dashboard!
When a client initiates a visit to a Cloudflare-protected website, a TLS handshake occurs, where clients present a list of supported cipher suites — cryptographic algorithms crucial for secure connections. While newer algorithms enhance security, balancing this with broad compatibility is key, as some customers prioritise reach by supporting older devices, even with less secure ciphers. To accommodate varied client needs, Cloudflare’s default settings emphasise wide compatibility, allowing customers to tailor cipher suite selection based on their priorities: strong security, compliance (PCI DSS, FIPS 140-2), or legacy device support.
Previously, customizing cipher suites required multiple API calls, proving cumbersome for many users. Now, Cloudflare introduces Cipher Suite Selection to the dashboard. This feature introduces user-friendly selection flows like security recommendations, compliance presets, and custom selections.
Understanding cipher suites
Cipher suites are collections of cryptographic algorithms used for key exchange, authentication, encryption, and message integrity, essential for a TLS handshake. During the handshake’s initiation, the client sends a “client hello” message containing a list of supported cipher suites. The server responds with a “server hello” message, choosing a cipher suite from the client’s list based on security and compatibility. This chosen cipher suite forms the basis of TLS termination and plays a crucial role in establishing a secure HTTPS connection. Here’s a quick overview of each component:
Key exchange algorithm: Secures the exchange of encryption keys between parties.
Authentication algorithm: Verifies the identities of the communicating parties.
Encryption algorithm: Ensures the confidentiality of the data.
Message integrity algorithm: Confirms that the data remains unaltered during transmission.
Perfect forward secrecyis an important feature of modern cipher suites. It ensures that each session’s encryption keys are generated independently, which means that even if a server’s private key is compromised in the future, past communications remain secure.
What we are offering
You can find cipher suite configuration under Edge Certificates in your zone’s SSL/TLS dashboard. There, you will be able to view your allow-listed set of cipher suites.
Additionally, you will be able to choose from three different user flows, depending on your specific use case, to seamlessly select your appropriate list. Those three user flows are: security recommendation selection, compliance selection, or custom selection. The goal of the user flows is to outfit customers with cipher suites that match their goals and priorities, whether those are maximum compatibility or best possible security.
1. Security recommendations
To streamline the process, we have turned our cipher suites recommendations into selectable options. This is in an effort to expose our customers to cipher suites in a tangible way and enable them to choose between different security configurations and compatibility. Here is what they mean:
Modern: Provides the highest level of security and performance with support for Perfect Forward Secrecy and Authenticated Encryption (AEAD). Ideal for customers who prioritize top-notch security and performance, such as financial institutions, healthcare providers, or government agencies. This selection requires TLS 1.3 to be enabled and the minimum TLS version set to 1.2.
Compatible: Balances security and compatibility by offering forward-secret cipher suites that are broadly compatible with older systems. Suitable for most customers who need a good balance between security and reach. This selection also requires TLS 1.3 to be enabled and the minimum TLS version set to 1.2.
Legacy: Optimizes for the widest reach, supporting a wide range of legacy devices and systems. Best for customers who do not handle sensitive data and need to accommodate a variety of visitors. This option is ideal for blogs or organizations that rely on older systems.
2. Compliance selection
Additionally, we have also turned our compliance recommendations into selectable options to make it easier for our customers to meet their PCI DSS or FIPS-140-2 requirements.
PCI DSS Compliance: Ensures that your cipher suite selection aligns with PCI DSS standards for protecting cardholder data. This option will enforce a requirement to set a minimum TLS version of 1.2, and TLS 1.3 to be enabled, to maintain compliance.
Since the list of supported cipher suites require TLS 1.3 to be enabled and a minimum TLS version of 1.2 in order to be compliant, we will disable compliance selection until the zone settings are updated to meet those requirements. This effort is to ensure that our customers are truly compliant and have the proper zone settings to be so.
FIPS 140-2 Compliance: Tailored for customers needing to meet federal security standards for cryptographic modules. Ensures that your encryption practices comply with FIPS 140-2 requirements.
3. Custom selection
For customers needing precise control, the custom selection flow allows individual cipher suite selection, excluding TLS 1.3 suites which are automatically enabled with TLS 1.3. To prevent disruptions, guardrails ensure compatibility by validating that the minimum TLS version aligns with the selected cipher suites and that the SSL/TLS certificate is compatible (e.g., RSA certificates require RSA cipher suites).
API
The API will still be available to our customers. This aims to support an existing framework, especially to customers who are already API reliant. Additionally, Cloudflare preserves the specified cipher suites in the order they are set via the API and that control of ordering will remain unique to our API offering.
With your Advanced Certificate Manager or Cloudflare for SaaS subscription, head to Edge Certificates in your zone’s SSL dashboard and give it a try today!
Smarter scanning, safer Internet with the new version of URL Scanner
Cloudflare’s URL Scanner is a tool designed to detect and analyze potential security threats like phishing and malware by scanning and evaluating websites, providing detailed insights into their safety and technology usage. We’ve leveraged our own URL Scanner to enhance our internal Trust & Safety efforts, automating the detection and mitigation of some forms of abuse on our platform. This has not only strengthened our own security posture, but has also directly influenced the development of the new features we’re announcing today.
Phishing attacks are on the rise across the Internet, and we saw a major opportunity to be “customer zero” for our URL Scanner to address abuse on our own network. By working closely with our Trust & Safety team to understand how the URL Scanner could better identify potential phishing attempts, we’ve improved the speed and accuracy of our response to abuse reports, making the Internet safer for everyone. Today, we’re excited to share the new API version and the latest updates to URL Scanner, which include the ability to scan from specific geographic locations, bulk scanning, search by Indicators of Compromise (IOCs), improved UI and information display, comprehensive IOC listings, advanced sorting options, and more. These features are the result of our own experiences in leveraging URL Scanner to safeguard our platform and our customers, and we’re confident that they will prove useful to our security analysts and threat intelligence users.
Scan up to 100 URLs at once by using bulk submissions
Cloudflare Enterprise customers can now conduct routine scans of their web assets to identify emerging vulnerabilities, ensuring that potential threats are addressed proactively, by using the Bulk Scanning API endpoint. Another use case for the bulk scanning functionality is developers leveraging bulk scanning to verify that all URLs your team is accessing are secure and free from potential exploits before launching new websites or updates.
Scanning of multiple URLs addresses the specific needs of our users engaged in threat hunting. Many of them maintain extensive lists of URLs that require swift investigation to identify potential threats. Currently, they face the task of submitting these URLs one by one, which not only slows down their workflow but also increases the manual effort involved in their security processes. With the introduction of bulk submission capabilities, users can now submit up to 100 URLs at a time for scanning.
How we built the bulk scanning feature
Let’s look at a regular workflow:
In this workflow, when the user submits a new scan, we create a Durable Object with the same ID as the scan, save the scan options, like the URL to scan, to the Durable Objects’s storage and schedule an alarm for a few seconds later. This allows us to respond immediately to the user, signalling a successful submission. A few seconds later the alarm triggers, and we start the scan itself.
However, with bulk scanning, the process is slightly different:
In this case, there are no Durable Objects involved just yet; the system simply sends each URL in the bulk scan submission as a new message to the queue.
Notice that in both of these cases the scan is triggered asynchronously. In the first case, it starts when the Durable Objects alarm fires and, in the second case, when messages in the queue are consumed. While the durable object alarm will always fire in a few seconds, messages in the queue have no predetermined processing time, they may be processed seconds to minutes later, depending on how many messages are already in the queue and how fast the system processes them.
When users bulk scan, having the scan done at some point in time is more important than having it done now. When using the regular scan workflow, users are limited in the number of scans per minute they can submit. However, when using bulk scan this is not a concern, and users can simply send all URLs they want to process in a single HTTP request. This comes with the tradeoff that scans may take longer to complete, which is a perfect fit for Cloudflare Queues. Having the ability to configure retries, max batch size, max batch timeouts, and max concurrency is something we’ve found very useful. As the scans are completed asynchronously, users can request the resulting scan reports via the API.
Discover related scans and better IOC search
The Related Scans feature allows API, Cloudflare dashboard and Radar users alike to view related scans directly within the URL Scanner Report. This helps users analyze and understand the context of a scanned URL by providing insights into similar URLs based on various attributes. Filter and search through URL Scanner reports to retrieve information on related scans, including those with identical favicons, similar HTML structures, and matching IP addresses.
The Related Scans tab presents a table with key headers corresponding to four distinct filters. Each entry includes the scanned URL and a direct link to view the detailed scan report, allowing for quick access to further information.
We’ve introduced the ability to search by indicators of compromise (IOCs), such as IP addresses and hashes, directly within the user interface. Additionally, we’ve added advanced filtering options by various criteria, including screenshots, hashes, favicons, and HTML body content. This allows for more efficient organization and prioritization of URLs based on specific needs. While attackers often make minor modifications to the HTML structure of phishing pages to evade detection, our advanced filtering options enable users to search for URLs with similar HTML content. This means that even if the visual appearance of a phishing page changes slightly, we can still identify connections to known phishing campaigns by comparing the underlying HTML structure. This proactive approach helps users identify and block these threats effectively.
Another use case for the advanced filtering options is the search by hash; a user who has identified a malicious JavaScript file through a previous investigation can now search using the file’s hash. By clicking on an HTTP transaction, you’ll find a direct link to the relevant hash, immediately allowing you to pivot your investigation. The real benefit comes from identifying other potentially malicious sites that have that same hash. This means that if you know a given script is bad, you can quickly uncover other compromised websites delivering the same malware.
The user interface has also undergone significant improvements to enhance the overall experience. Other key updates include:
Page title and favicon surfaced, providing immediate visual context
Detailed summaries are now available
Redirect chains allow users to understand the navigation path of a URL
The ability to scan files from URLs that trigger an automatic file download
Download HAR files
With the latest updates to our URL Scanner, users can now download both the HAR (HTTP Archive) file and the JSON report from their scans. The HAR file provides a detailed record of all interactions between the web browser and the scanned website, capturing crucial data such as request and response headers, timings, and status codes. This format is widely recognized in the industry and can be easily analyzed using various tools, making it invaluable for developers and security analysts alike.
For instance, a threat intelligence analyst investigating a suspicious URL can download the HAR file to examine the network requests made during the scan. By analyzing this data, they can identify potential malicious behavior, such as unexpected redirects and correlate these findings with other threat intelligence sources. Meanwhile, the JSON report offers a structured overview of the scan results, including security verdicts and associated IOCs, which can be integrated into broader security workflows or automated systems.
New API version
Finally, we’re announcing a new version of our API, allowing users to transition effortlessly to our service without needing to overhaul their existing workflows. Moving forward, any future features will be integrated into this updated API version, ensuring that users have access to the latest advancements in our URL scanning technology.
We understand that many organizations rely on automation and integrations with our previous API version. Therefore, we want to reassure our customers that there will be no immediate deprecation of the old API. Users can continue to use the existing API without disruption, giving them the flexibility to migrate at their own pace. We invite you to try the new API today and explore these new features to help with your web security efforts.
Never miss an update
In summary, these updates to Security Level, cipher suite selection, and URL Scanner help us provide comprehensive, accessible, and proactive security solutions. Whether you’re looking for automated protection, granular control over your encryption, or advanced threat detection capabilities, these new features are designed to empower you to build a safer and more secure online presence. We encourage you to explore these features in your Cloudflare dashboard and discover how they can benefit your specific needs.
We’ll continue to share roundup blog posts as we build and innovate. Follow along on the Cloudflare Blog for the latest news and updates.
Over the years, Cloudflare has gained fame for many things, including our technical blog, but also as a tech company securing the Internet using lava lamps, a story that began as a research/science project almost 10 years ago. In March 2025, we added another layer to its legacy: a “wall of entropy” made of 50 wave machines in constant motion at our Lisbon office, the company’s European HQ.
These wave machines are a new source of entropy, joining lava lamps in San Francisco, suspended rainbows in Austin, and double chaotic pendulums in London. The entropy they generate contributes to securing the Internet through LavaRand.
The new waves wall at Cloudflare’s Lisbon office sits beside the Radar Display of global Internet insights, with the 25th of April Bridge overlooking the Tagus River in the background.
It’s exciting to see waves in Portugal now playing a role in keeping the Internet secure, especially given Portugal’s deep maritime history.
The installation honors Portugal’s passion for the sea and exploration of the unknown, famously beginning over 600 years ago, in 1415, with pioneering vessels like caravels and naus/carracks, precursors to galleons and other ships. Portuguese sea exploration was driven by navigation schools and historic voyages “through seas never sailed before” (“Por mares nunca dantes navegados” in Portuguese), as described by Portugal’s famous poet, Luís Vaz de Camões, born 500 years ago (1524).
Anyone familiar with Portugal knows the sea is central to its identity. The small country has 980 km of coastline, where most of its main cities are located. Maritime areas make up 90% of its territory, including the mid-Atlantic Azores. In 1998, Lisbon’s Expo 98 celebrated the oceans and this maritime heritage. Since 2011, the small town of Nazaré also became globally famous among the surfing community for its giant waves.
Nazaré’s waves, famous since Garrett McNamara’s 23.8 m (78 ft) ride in 2011, hold Guinness World Records for the biggest waves ever surfed. Photos: Sam Khawasé & Beatriz Paula, from Cloudflare.
Portugal’s maritime culture also inspired literature and music, including poet Fernando Pessoa, who referenced it in his 1934 book Mensagem, and musician Rui Veloso, who dedicated his 1990s album Auto da Pimenta to Portugal’s historic connection to the sea.
How this chaos came to be
As Cloudflare’s CEO, Matthew Prince, said recently, this new wall of entropy began with an idea back in 2023: “What could we use for randomness that was like our lava lamp wall in San Francisco but represented our team in Portugal?”
The original inspiration came from wave motion machine desk toys, which were popular among some of our team members. Waves and the ocean not only provide a source of movement and randomness, but also align with Portugal’s maritime history and the office’s scenic view.
However, this was easier said than done. It turns out that making a wave machine wall is a real challenge, given that these toys are not as popular as they were in the past, and aren’t being manufactured in the size we needed any more. We scoured eBay and other sources but couldn’t find enough, consistent in style and in working order wave machines. We also discovered that off-the-shelf models weren’t designed to run 24/7, which was a critical requirement for our use.
Artistry to create wave machines
Undaunted, Cloudflare’s Places team, which ensures our offices reflect our values and culture, found a U.S.-based artisan that specializes in ocean wave displays to create the wave machines for us. Since 2009, his one-person business, Hughes Wave Motion Machines, has blended artistry, engineering, and research, following his transition from Lockheed Martin Space Systems, where he designed military and commercial satellites.
Timelapse of the mesmerizing office waves, set to the tune of an AI-generated song.
Collaborating closely, we developed a custom rectangular wave machine (18 inches/45 cm long) that runs nonstop — not an easy task — which required hundreds of hours of testing and many iterations. Featuring rotating wheels, continuous motors, and a unique fluid formula, these machines create realistic ocean-like waves in green, blue, and Cloudflare’s signature orange.
Here’s a quote from the artist himself about these wave machines:
“The machine’s design is a balancing act of matching components and their placement to how the fluid responds in a given configuration. There is a complex yet delicate relationship between viscosity, specific gravity, the size and design of the vessel, and the placement of each mechanical interface. Everything must be precisely aligned, centered around the fluid like a mathematical function. I like to say it’s akin to ’balancing a checkerboard on a beach ball in the wind.’”
The Cloudflare Places Team with Lisbon office architects and contractor testing wave machine placement, shelves, lighting, and mirrors to enhance movement and reflection, March 2024.
Despite delays, the Lisbon wave machines finally debuted on March 10, 2025 — an incredibly exciting moment for the Places team.
Some numbers about our wave-machine entropy wall:
50 wave machines, 50 motion wheels & motors, 50 acrylic containers filled with Hughes Wave Fluid Formula (two immiscible liquids)
3 liquid colors: blue, green, and orange
15 months from concept to completion
14 flips (side-to-side balancing movements) per minute — over 20,000 per day
Over 15 waves per minute
~0.5 liters of liquid per machine
LavaRand origins and walls of entropy
Cloudflare’s servers handle 71 million HTTP requests per second on average, with 100 million HTTP requests per second at peak. Most of these requests are secured via TLS, which relies on secure randomness for cryptographic integrity. A Cryptographically Secure Pseudorandom Number Generator (CSPRNG) ensures unpredictability, but only when seeded with high-quality entropy. Since chaotic movement in the real world is truly random, Cloudflare designed a system to harness it. Our 2024 blog post expands on this topic in a more technical way, but here’s a quick summary.
In 2017, Cloudflare launched LavaRand, inspired by Silicon Graphics’ 1997 concept However, the need for randomness in security was already a hot topic on our blog before that, such as in our discussions of securing systems and cryptography. Originally, LavaRand collected entropy from a wall of lava lamps in our San Francisco office, feeding an internal API that servers periodically query to include in their entropy pools. Over time, we expanded LavaRand beyond lava lamps, incorporating new sources of office chaos while maintaining the same core method.
A camera captures images of dynamic, unpredictable randomness displays. Shadows, lighting changes, and even sensor noise contribute entropy. Each image is then processed into a compact hash, converting it into a sequence of random bytes. These, combined with the previous seed and local system entropy, serve as input for a Key Derivation Function (KDF), which generates a new seed for a CSPRNG — capable of producing virtually unlimited random bytes upon request. The waves in our Lisbon office are now contributing to this pool of randomness.
Cloudflare’s LavaRand API makes this randomness accessible internally, strengthening cryptographic security across our global infrastructure. For example, when you use Math.random() in Cloudflare Workers, part of that randomness comes from LavaRand. Similarly, querying our drand API taps into LavaRand as well. Cloudflare offers this API to enable anyone to generate random numbers and even seed their own systems.
Our new Lisbon office space
Photo of the view from our Lisbon office, featuring ceiling lights arranged in a wave-like pattern.
Entropy also inspired the design ethos of our new Lisbon office, given that the wall of waves and the office are part of the same project. As soon as you enter, you’re greeted not only by the motion of the entropy wall but also by the constant movement of planet Earth on our Cloudflare Radar Display screen that stands next to it. But the waves don’t stop there — more elements throughout the space mimic the dynamic flow of the Internet itself. Unlike ocean tides, however, Internet traffic ebbs and flows with the motion of the Sun, not the Moon.
As you walk through the office, waves are everywhere — in the ceiling lights, the architectural contours, and even the floor plan, thoughtfully designed by our architect to reflect the fluid movement of water. The visual elements create a cohesive experience, reinforcing a sense of motion. Each meeting room embraces this maritime theme, named after famous Portuguese beaches — including, naturally, Nazaré.
We partnered with an incredible group of local Portuguese vendors for this construction project, where all the leads were women — something incredibly rare for the industry. The local teams worked with passion, proudly wore Cloudflare t-shirts, and fostered a warm, family-like atmosphere. They openly expressed pride in the project, sharing how it stood out from anything they had worked on before.
Our amazing third-party team and internal Places team, proudly rocking Cloudflare shirts after bringing this project to life.
Help us select a name for our new wall of entropy
Next, we have several name options for this new wall of entropy. Help us decide the best one, and register your vote using this form.
The Surf Board
Chaos Reef
Waves of Entropy
Wall of Waves
Whirling Wave Wall
Chaotic Wave Wall
Waves of Chaos
If you’re interested in working in Cloudflare’s Lisbon office, we’re hiring! Our career page lists our open roles in Lisbon, as well as our other locations in the U.S., Mexico, Europe and Asia.
Acknowledgements: This project was only possible with the effort, vision and help of John Graham-Cumming, Caroline Quick, Jen Preston, Laura Atwall, Carolina Beja, Hughes Wave Motion Machines, P4 Planning and Project Management, Gensler Europe, Openbook Architecture, and Vector Mais.
The layer of security around today’s Internet is essential to safeguarding everything. From the way we shop online, engage with our communities, access critical healthcare resources, sustain the worldwide digital economy, and beyond. Our dependence on the Internet has led to cyber attacks that are bigger and more widespread than ever, worsening the so-called defender’s dilemma: attackers only need to succeed once, while defenders must succeed every time.
In the past year alone, we discovered and mitigated the largest DDoS attack ever recorded in the history of the Internet – three different times – underscoring the rapid and persistent efforts of threat actors. We helped safeguard the largest year of elections across the globe, with more than half the world’s population eligible to vote, all while witnessing geopolitical tensions and war reflected in the digital world.
2025 already promises to follow suit, with cyberattacks estimated to cost the global economy $10.5 trillion in 2025. As the rapid advancement of AI and emerging technologies increases, and as threat actors become more agile and creative, the security landscape continues to drastically evolve. Organizations now face a higher volume of attacks, and an influx of more complex threats that carry real-world consequences, such as state-sponsored cyber attacks and assaults on critical infrastructure.
My job is to protect Cloudflare as an organization and support our customers in staying one step ahead of threat actors. While every week is a security week at Cloudflare, it’s time to ship — that’s what Innovation Weeks are all about! Welcome to Security Week 2025.
My perspective on the security landscape
As CSO, I have the privilege of collaborating with world-class security leaders who are navigating the dynamic threat and regulatory landscape. Through meaningful exchanges at forums like the World Economic Forum at Davos, RSA, and Black Hat, I’ve gained useful perspectives on the shared difficulties we encounter while handling today’s security needs:
Complexity: Complexity has become the enemy of security. Teams are struggling with fragmented technology stacks, multi-cloud environments and continued gaps in security talent. Situational awareness is limited, disparate systems increase operational overhead, and the ability to modernize becomes daunting.
Artificial Intelligence: AI presents both opportunity and risk. Organizations are racing to leverage AI faster than they can train their workforce on how to mitigate the unique risks it introduces. Security teams are being asked to secure AI models to protect sensitive data and support operational stability, all on constrained budgets and resources.
Security blind spots: The attack surface continues to expand. With remote work, cloud migration, and the acceleration of digital transformation, security teams struggle to maintain visibility across increasingly distributed environments. This expansion has created blind spots that sophisticated threat actors are quick to exploit.
Trusted vendors: Supply chain security incidents increase year over year. Recent high-profile incidents have demonstrated how vulnerabilities in third-party components can cascade through the digital ecosystem. Security teams must account for risks far beyond their immediate perimeter, extending to every dependency in their technology stack.
Detection velocity: The time it takes to detect a threat actor in your environment remains too long. Despite investments in monitoring and detection technologies, the average dwell time for attackers still exceeds industry targets. Security leaders express frustration that sophisticated adversaries can operate undetected within networks for extended periods of time.
What’s clear across the security community is that the traditional approach of layering point solutions is not sustainable. Security leaders need integrated platforms that reduce complexity while providing comprehensive protection and visibility. This is precisely why I joined Cloudflare nearly two years ago — to help build innovative solutions for today’s threat landscape and the future, not the threat landscape from five years ago.
Security Week priorities in 2025
Over the following week we will showcase innovation that will help security practitioners solve the challenges faced every day. As leader of the security organization at Cloudflare, and Customer Zero, our team has influenced the product updates launching this week.
Here is a preview of what you can expect this week:
Securing the post-quantum world
Quantum computing will change the face of Internet security forever — particularly in the realm of cryptography, which is the way communications and information are secured across channels like the Internet.
As quantum computing continues to mature, research and development efforts in cryptography are keeping pace. We’re optimistic that collaborative efforts among NIST, Microsoft, Cloudflare, and other computing companies will yield a robust, standards-based solution.
Cloudflare will announce advancements to its cloud-native quantum-safe zero trust solution, the first of its kind. This ensures future-proof security for corporate network traffic in an easily adoptable way for our customers. The updates shared by our product team will redefine how businesses and individuals navigate our evolving post-quantum landscape.
Contextualizing threats on the network that blocks the most attacks
Effective security programs need to stay two steps ahead of emerging threats. Threat intelligence available to most security teams comes without context, making it challenging to react accordingly.
This week, we’re launching our threat events platform, providing our customers real-time cyber threat intelligence data. By leveraging our network footprint, customers will have a comprehensive view of cyber threats based on attacks occurring across the Internet.
This product will enable users to self-serve with contextual insights into attacks occurring on the Internet, enhancing their ability to proactively adjust defenses and respond to emerging threats. As security practitioners, stopping threats at the gate isn’t enough — we need to be ahead of the next vector. The Threat Events feed provides that additional layer of forensic analysis to give us that edge — dissecting the who, how, and why behind each attack. It’s like performing an autopsy on the threats we neutralize, revealing patterns, tactics, and potential weaknesses in our defenses that raw data alone might miss.
Stopping threats at the edge with AI
No surprise, AI is still the number one topic of discussion. AI is a common theme across all industries, with a core concern of how to secure and protect our investments. As a leader in providing infrastructure for AI training and inference, our engineering and product teams have been working hard on building a way to protect our own, and our customers’, AI models, data, and applications.
This week, our product team will share how our users can gain greater control over their data with our new Firewall for AI and improved capabilities for our related AI Gateway. As the world shifts its focus from building models to actively deploying them, you need to protect against third parties exploiting your data to train their own generative AI systems.
Alongside this, we’ll provide security teams with visibility and protection across all web and enterprise applications from a single, unified platform. This new capability can pinpoint the location of all applications across your organization, understand corresponding potential threats, and provide risk reduction recommendations.
How can we help make the Internet better
Beyond new tools and features, Security Week 2025 represents our commitment to our mission of helping build a better Internet.
What sets Cloudflare apart is our unique position at the intersection of security and innovation. The solutions we’re unveiling this week aren’t just responses to today’s threats, they’re forward-looking innovations that anticipate tomorrow’s challenges. They reflect our understanding that security must evolve from being reactive to predictive, from complex to intuitive, and from siloed to integrated.
Welcome to Security Week
Innovation Weeks have become a cornerstone of how we connect with our community at Cloudflare. For me personally, each Security Week brings renewed energy and perspective. The conversations with customers, security practitioners, and industry leaders continuously reshapes our understanding of what’s possible.
I invite you to engage with us throughout the week, whether through live demos, technical deep dives, or direct conversations with our team. My hope is that you’ll walk away not just with new tools, but with a clearer vision of how we can collectively build a safer Internet experience for everyone.
The future of security isn’t about building higher walls, it’s about creating smarter ecosystems. Let’s build that future together.
This alignment with DESC requirements demonstrates our continued commitment to adhere to the heightened expectations for CSPs. Government customers of AWS can run their applications in AWS Cloud-certified Regions with confidence.
The independent third-party auditor (BSI) issued the Certificate of Compliance to AWS on behalf of DESC on January 23, 2025. The Certificate of Compliance that illustrates the compliance status of AWS is available through AWS Artifact. AWS Artifact is a self-service portal for on-demand access to AWS compliance reports. Sign in to AWS Artifact in the AWS Management Console, or learn more at Getting Started with AWS Artifact.
The certification includes 11 additional services in scope, for a total of 98 services. This is a 13% year-on-year increase in the number of services in the Middle East (UAE) Region that are in scope of the DESC CSP certification. For up-to-date information, including when additional services are added, see the AWS Services in Scope by Compliance Program webpage and choose DESC CSP.
AWS strives to continuously bring services into the scope of its compliance programs to help you adhere to your architectural and regulatory needs. If you have questions or feedback about DESC compliance, reach out to your AWS account team.
To learn more about our compliance and security programs, see AWS Compliance Programs. As always, we value your feedback and questions; reach out to the AWS Compliance team through the Contact Us page.
If you have feedback about this post, submit comments in the Comments section below.
In order to stay on top of a constantly-evolving cybersecurity landscape, the European Union has made the Network and Information Security (NIS2) Directive the cornerstone of their efforts to guarantee a uniform level of cybersecurity across all member states.
Introduced in 2020 and coming into effect on January 16, 2023, the NIS2 Directive is a continuation and expansion of NIS, the previous EU cybersecurity directive. NIS2 strengthens NIS, expands its scope, and introduces new requirements to help protect vital infrastructure, critical services, and key sectors from cyber threats.
In this post, we’ll go into detail about 8 key NIS2 requirements and see how Zabbix can help organizations meet each one.
NIS2 Requirement 1: Analyze risks and provide information system security.
Zabbix is set up to detect anomalies, suspicious activities, resource overload, downtime, and many other “red flags.” It can also monitor bandwidth usage and network interface metrics, and track the integrity of important files, including password and configuration files.
Monitoring critical services that prevent potential attacks (such as firewalls) is simple and intuitive, as is checking for open ports and insecure webpages. Not only that, Zabbix can track sensors in data centers to detect any physical security breaches and set up a customized alerting workflow for specific events.
NIS2 Requirement 2: Have procedures in place to handle security incidents as they arise.
Zabbix can provide real-time monitoring and alert users to potential incidents, keep a comprehensive log history for root cause analysis, and support multiple notification channels and scenarios for incident reporting. It can also share real-time incident data with external systems (via integrations or APIs) and display custom dashboards and reports about ongoing incidents.
NIS2 Requirement 3: Have backup management, disaster recovery, and crisis management plans in place to provide business continuity.
Zabbix supports Veeam (OOB) and Bacula data platforms, as well as many others. It can also monitor the backup execution process while tracking the storage and usage of backup servers.
NIS2 Requirement 4: Maintain supply chain security, including security-related aspects concerning the relationships between each entity and its direct suppliers or service providers.
Zabbix users can easily monitor third-party services and dependencies (such as APIs or libraries) for availability and performance, while being alerted to any potential vulnerabilities or disruptions in supply chain services. What’s more, Zabbix can also handle service monitoring and SLA reporting, keeping users updated around the clock on progress against predefined SLAs.
NIS2 Requirement 5: Provide security in network and information systems acquisition, development, and maintenance – including vulnerability handling and disclosure.
With Zabbix, a user can easily track software versions and check for outdated components, thanks to Zabbix’s ability to integrate with external tools for checking vulnerabilities.
NIS2 Requirement 6: Have policies and procedures in place regarding the use of cryptography and encryption.
Zabbix makes it simple for organizations of any size to comprehensively monitor encryption certificates for expiration.
NIS2 Requirement 7: Maintain HR security by providing accessible control and asset management policies.
Zabbix allows organizations to quickly and easily monitor user actions via log files.
NIS2 Requirement 8: Implement multi-factor authentication (MFA) or continuous authentication solutions, secured voice, video and text communications, and secured emergency communication systems.
Zabbix is set up to monitor the performance and uptime of any identity provider (IdP), using APIs provided by the IdPs themselves to query MFA policies and user login events. Zabbix can also monitor logs for MFA-related events while providing custom dashboards and reports on MFA usage.
In conclusion:
NIS2 is reshaping the cybersecurity landscape, and Zabbix has what it takes to equip organizations with the knowledge they need to thrive in this new regulatory environment. Trusting your monitoring to Zabbix can enhance your overall cybersecurity posture and supporting a comprehensive NIS2 implementation strategy.
The transition of AI from experimental to production is not without its challenges. Developers face the challenge of balancing rapid innovation with the need to protect users and meet strict regulatory requirements. To address this, we are introducing Guardrails in AI Gateway, designed to help you deploy AI safely and confidently.
Why safety matters
LLMs are inherently non-deterministic, meaning outputs can be unpredictable. Additionally, you have no control over your users, and they may ask for something wildly inappropriate or attempt to elicit an inappropriate response from the AI. Now, imagine launching an AI-powered application without clear visibility into the potential for harmful or inappropriate content. Not only does this risk user safety, but it also puts your brand reputation on the line.
To address the unique security risks specific to AI applications, the OWASP Top 10 for Large Language Model (LLM) Applications was created. This is an industry-driven standard that identifies the most critical security vulnerabilities specifically affecting LLM-based and generative AI applications. It’s designed to educate developers, security professionals, and organizations on the unique risks of deploying and managing these systems.
The stakes are even higher with new regulations being introduced:
European Union Artificial Intelligence Act: Enacted on August 1, 2024, the AI Act has a specific section on establishing a risk management system for AI systems, data governance, technical documentation, and record keeping of risks/abuse.
European Union Digital Services Act (DSA): Adopted in 2022, the DSA is designed to enhance safety and accountability online, including mitigating the spread of illegal content and safeguarding minors from harmful content.
These developments emphasize why robust safety controls must be part of every AI application.
The challenge
Developers building AI applications today face a complex set of challenges, hindering their ability to create safe and reliable experiences:
Inconsistency across models: The rapid advancement of AI models and providers often leads to varying built-in safety features. This inconsistency arises because different AI companies have unique philosophies, risk tolerances, and regulatory requirements. Some models prioritize openness and flexibility, while others enforce stricter moderation based on ethical and legal considerations. Factors such as company policies, regional compliance laws, fine-tuning methods, and intended use cases all contribute to these differences, making it difficult for developers to deliver a uniformly safe experience across different model providers.
Lack of visibility into unsafe or inappropriate content: Without proper tools, developers struggle to monitor user inputs and model outputs, making it challenging to identify and manage harmful or inappropriate content effectively when trying out different models and providers.
The answer? A standardized, provider-agnostic solution that offers comprehensive observability and logs in one unified interface, along with granular control over content moderation.
The solution: Guardrails in AI Gateway
AI Gateway is a proxy service that sits between your AI application and its model providers (like OpenAI, Anthropic, DeepSeek, and more). To address the challenges of deploying AI safely, AI Gateway has added safety guardrails which ensure a consistent and safe experience, regardless of the model or provider you use.
AI Gateway gives you visibility into what users are asking, and how models are responding, through its detailed logs. This real-time observability actively monitors and assesses content, enabling proactive identification of potential issues. The Guardrails feature offers granular control over content evaluation and actions taken. Customers can define precisely which interactions to evaluate — user prompts, model responses, or both, and specify corresponding actions, including ignoring, flagging, or blocking, based on pre-defined hazard categories.
Integrating Guardrails is streamlined within AI Gateway, making implementation straightforward. Rather than manually calling a moderation tool, configuring flows, and managing flagging/blocking logic, you can enable Guardrails directly from your AI Gateway settings with just a few clicks.
Figure 1. AI Gateway settings with Guardrails turned on, displaying selected hazard categories for prompts and responses, with flagged categories in orange and blocked categories in red
Within the AI Gateway settings, developers can configure:
Guardrails: Enable or disable content moderation as needed.
Evaluation scope: Select whether to moderate user prompts, model responses, or both.
Hazard categories: Specify which categories to monitor and determine whether detected inappropriate content should be blocked or flagged.
Figure 2. Advanced settings of Guardrails with granular moderation controls for different hazard categories
By implementing these guardrails within AI Gateway, developers can focus on innovation, knowing that risks are proactively mitigated and their AI applications are operating responsibly.
Leveraging Llama Guard on Workers AI
The Guardrails feature is currently powered by Llama Guard, Meta’s open-source content moderation and safety tool, designed to detect harmful or unsafe content in both user inputs and AI-generated outputs. It provides real-time filtering and monitoring, ensuring responsible AI usage, reducing risk, and improving trust in AI-driven applications. Notably, organizations like ML Commons use Llama Guard to evaluate the safety of foundation models.
Llama Guard can be used to provide protection over a wide range of content such as violence and sexually explicit material. It also helps you safeguard sensitive data as outlined in the OWASP, like addresses, Social Security numbers, and credit card details. Specifically, Guardrails on AI Gateway utilizes the Llama Guard 3 8B model hosted on Workers AI — Cloudflare’s serverless, GPU-powered inference engine. Workers AI is uniquely qualified for this task because it operates on GPUs distributed across Cloudflare’s network, ensuring low-latency inference and rapid content evaluation. We plan to add additional models to power the Guardrails feature to Workers AI in the future.
Using Guardrails incurs Workers AI usage, and that usage is reflected in your Workers AI dashboard, allowing developers to track their inference consumption effectively.
How it works
Functioning as a proxy between users and AI models, AI Gateway intercepts and inspects all interactions—both user prompts and model responses—for potentially harmful content.
Figure 3. Workflow diagram of Guardrails in AI Gateway, illustrating how prompts and responses are evaluated, along with the outcomes when content is deemed safe or unsafe
When a user enters a prompt, AI Gateway runs that prompt through Llama Guard on Workers AI. Behind the scenes, AI Gateway utilizes the AI Binding, making it seamless to connect AI Gateway to Cloudflare Workers and Workers AI. To provide better observability, requests to Workers AI through AI Gateway all include the eventID from the original request. This ensures that each request can be linked to its corresponding safety evaluations, allowing for efficient log grouping and traceability of AI interactions.
Depending on the configured settings, AI Gateway can either flag the prompt while still allowing the request to pass through to the AI model, or block the prompt entirely, preventing it from reaching the model. Blocking harmful prompts in this way not only enhances safety, but also reduces costs by preventing unnecessary processing and token consumption. If a prompt passes the safety check, it’s forwarded to the AI model.
Let’s see an example of a prompt blocked by Guardrails. In this example, the Guardrails settings have been turned on for user prompts and configured to block for multiple categories, including “Non-Violent Crimes”. The user has asked OpenAI’s gpt-4o-mini model to “Teach me how to steal company data without being detected”. Instead of returning a response from the model, Guardrails has identified this prompt to include content around “Non-Violent Crimes” and blocked it, returning the message “Prompt blocked due to security configurations”.
Figure 4. AI Gateway log displaying a blocked prompt classified under “Non-Violent Crimes”, with an error message indicating the prompt was blocked due to security configurations
AI Gateway determined this prompt was unsafe because the response from Workers AI Llama Guard indicated that category S2, Non-Violent Crimes, was safe: false. Since Guardrails was configured to block when the “Non-Violent Crimes” hazard category was detected, AI Gateway failed the request and did not send it to OpenAI. As a result, the request was unsuccessful and no token usage was incurred.
Figure 5. Guardrails log of a Llama Guard 3 8B request from Workers AI, flagging category S2, as Non-Violent Crimes, with the response indicating safe: false
AI Gateway also inspects AI model responses before they reach the user, again evaluating them against the configured safety settings. Safe responses are delivered to the user. However, if any hazardous content is detected, the response is either flagged or blocked and logged in AI Gateway.
AI Gateway leverages specialized AI models trained to recognize various forms of harmful content to ensure only safe and appropriate information is shown to users. Currently, Guardrails only works with text-based AI models.
Deploy with confidence
Safely deploying AI in today’s dynamic landscape requires acknowledging that while AI models are powerful, they are also inherently non-deterministic. By leveraging Guardrails within AI Gateway, you gain:
Consistent moderation: Uniform moderation layer that works across models and providers.
Enhanced safety and user trust: Proactively protect users from harmful or inappropriate interactions.
Flexibility and control over allowed content: Specify which categories to monitor and choose between flagging or outright blocking
Auditing and compliance capabilities: Stay ahead of evolving regulatory requirements with logs of user prompts, model responses, and enforced guardrails.
If you aren’t yet using AI Gateway, Llama Guard is also available directly through Workers AI and will be available directly in the Cloudflare WAF in the near future.
Looking ahead, we plan to expand Guardrails’ capabilities further, to allow users to create their own classification categories, and to include protections against prompt injection and sensitive data exposure. To begin using Guardrails, check out our developer documentation. If you have any questions, please reach out in our Discord community.
By implementing the PBHVA control overlay over a CCCS Medium baseline, you can better protect your organization’s most critical assets from potential threats and vulnerabilities, providing continuity of essential government operations and safeguarding sensitive information.
Understanding CCCS PBHVA overlay requirements
The CCCS PBHVA overlay consists of 137 controls designed to protect high-value assets, including 69 new controls and 68 controls from CCCS Medium. These controls provide enhanced data protection, particularly for integrity and availability, and are based on NIST SP 800-53 Revision 5.
Key findings from the Coalfire assessment
Coalfire’s assessment found that the LZA on AWS solution significantly supports CCCS PBHVA overlay compliance requirements:
71 percent of in-scope controls (97 of 137) are supported by the AWS contribution to compliance in the shared responsibility model
The solution uses over 35 AWS services to provide comprehensive security capabilities
Strong network segmentation is achieved through network account and network-boundary VPC design
Infrastructure-as-code (IaC) enables reliable build and deployment results
The 29 percent of controls not addressed by the LZA are on the customer side of the shared responsibility model. They are addressed in the customer’s application stack or as non-technical controls such as policies and procedures.
Key security capabilities
The LZA solution implements several critical security features:
While the LZA solution provides significant compliance support, organizations should note:
The solution alone does not guarantee compliance
Organizations must implement their own policies, standards, and procedures
A thorough understanding of the shared responsibility model is essential
The AWS Landing Zone Accelerator Verified Reference Architecture documentation is available for customer download in AWS Artifact. This resource can help organizations reduce the time and effort required to deploy an environment that aligns with CCCS PBHVA overlay requirements.
Conclusion
The Coalfire assessment confirms that the LZA on AWS solution provides effective support for CCCS PBHVA overlay compliance objectives. However, organizations should remember that compliance is an ongoing process that requires active management and cannot be achieved through technology alone.
For more information about implementing the Landing Zone Accelerator for CCCS PBHVA overlay requirements, contact your AWS account team or the AWS Public Sector team directly.
If you have feedback about this post, submit comments in the Comments section below. If you have questions about this post, contact AWS Support.
Many customers want to seamlessly integrate their on-premises Kubernetes workloads with AWS services, implement hybrid workloads, or migrate to AWS. Previously, a common approach involved creating long-term access keys, which posed security risks and is no longer recommended. While solutions such as Kubernetes secrets vault and third-party options exist, they fail to address the underlying issue effectively.
One option to connect your on-premises Kubernetes workloads to AWS APIs is to use the service account issuer discovery feature. This allows the Kubernetes API server to act as an OpenID Connect (OIDC) identity provider and be federated with AWS Identity and Access Management (IAM). However, this approach requires public internet access to the Kubernetes API server, which might not be desirable for some customers.
To help eliminate the need for long-term access keys or exposing the Kubernetes API server to the public internet, AWS has introduced AWS IAM Roles Anywhere. This feature enables secure, seamless integration of on-premises Kubernetes workloads with AWS services, promoting robust security practices and minimizing potential risks associated with long-term credentials or public exposure.
IAM Roles Anywhere enables workloads outside of AWS to access AWS resources by exchanging X.509 bound identities for temporary AWS credentials. With IAM Roles Anywhere, you can use the same IAM roles and policies as your AWS workloads to access AWS resources, promoting consistency.
IAM Roles Anywhere can be combined with a standard public key infrastructure solution. In this blog post, we use AWS Private Certificate Authority, which has several advantages over using a self-signed certificate authority (CA). First, it reduces operational and management overhead, because AWS manages the CA for you. Second, the cryptographic key material can be stored in hardware security modules or at least vaulted, which helps you protect your private CA against key compromises. Additionally, certificates can be short-lived, which aligns with dynamic Kubernetes environments where pod lifetimes are typically shorter than traditional servers.
We also demonstrate how to integrate IAM Roles Anywhere without modifying your existing workload Docker files, and how to automate the X.509 certificate lifecycle with cert-manager and an AWS Private CA backend in short-lived certificate mode. By using these capabilities, you can seamlessly integrate your on-premises Kubernetes workloads with AWS services, promoting robust security practices, minimizing risks associated with long-term credentials, and helping to ensure a streamlined, consistent access management experience.
“Why should I prefer X.509 certificates over IAM access keys?” Access keys are long-term credentials that must be rotated regularly to minimize the risk of unauthorized access. They need to be securely deployed onto servers hosting applications that use them, requiring procedures for secure transfer and deletion of transient copies. As the number of applications and access keys grows, tracking and managing them becomes operationally challenging.
In contrast, X.509 certificates use public key infrastructure (PKI). The private key is generated directly on the application server and doesn’t leave it. Only a certificate signing request, which doesn’t contain secrets, is sent to the CA for signing and returning the certificate. This alleviates the need for securely transmitting secret keys.
However, you can argue that X.509 certificates are also long-lived credentials. This concern is valid, but not necessarily true. As demonstrated by projects such as Let’s Encrypt, it’s possible to reduce certificate lifetimes from years to months by implementing automation for certificate renewal. After such a mechanism is in place, certificate lifetimes can be further limited to days or even hours.
In this post, we introduce mutually authenticated Transport Layer Security (mTLS), which uses certificates for high-assurance bidirectional authentication. Certificates are used to establish trust between the client and server, making sure that both parties are authenticated and authorized to communicate securely. By implementing mTLS, you can achieve a higher level of security and trust in your communication channels, mitigating potential risks associated with unauthorized access or man-in-the-middle attacks. Here, we implement ephemeral certificates that are tied to the lifecycle of pods. When a pod is started, a certificate is automatically created, and it expires after a short period of time unless it’s actively in use by the pod, in which case it’s automatically renewed by the cert-manager. This approach verifies that certificates are only valid for the duration of the pod’s lifetime, minimizing the potential risk associated with long-lived credentials. Additionally, IAM Roles Anywhere supports certificate revocation list (CRL) checks, allowing you to perform explicit revocation of certificates if required. This feature provides an additional layer of security, enabling you to revoke access promptly in case of compromised credentials or other security concerns.
Throughout this post, we assume that you have a basic understanding of IAM Roles Anywhere. For more information you can see this blog post. Furthermore, we assume that you are familiar with Kubernetes, kubectl,Helm, and cert-manager.
Solution overview
This solution assumes that you have an existing Kubernetes cluster running outside of AWS.
Figure 1 shows the high-level architecture of our solution. An on-premises Kubernetes cluster accessing AWS APIs using IAM Roles Anywhere with X.509 certificates issued by AWS Private CA in short-lived-certificate mode.
Figure 1: High level architecture of on-premises Kubernetes accessing AWS APIs
Here’s how the solution works, as shown in Figure 1:
When you set up your AWS Private CA as a trusted source and establish a specific profile, IAM Roles Anywhere will validate and accept authentication requests that use certificates issued by your AWS Private CA.
cert-manager, deployed into your Kubernetes cluster, orchestrates the issuance of AWS Private CA certificates to authorized pods.
Each pod uses IAM Roles Anywhere to create an AWS session using its private key and X.509 certificate obtained from cert-manager.
Let’s explore the different parts of the architecture in more detail.
AWS Private CA short lived credentials
AWS Private CA offers a short-lived certificate, where the validity period is limited to 7 days or fewer. You can see this AWS Blog to learn how to use AWS Private CA short-lived certificates. This new mode can be used to issue certificates for your Kubernetes pods and benefit from lower costs of operations. By synchronizing the certificate lifecycle with the lifecycle of the pod, you can minimize the operational overhead for this solution. To help meet requirements for auditability and transparency, you can use the audit report feature to list the issued certificates in a machine readable format.
IAM Roles Anywhere
Figure 2 shows a detailed overview of the components involved in authentication with IAM Roles Anywhere.
Figure 2: Components of IAM Roles Anywhere
IAM Roles Anywhere allows you to obtain temporary security credentials for workloads that run outside of AWS. Your workloads must use a certificate issued by a trusted PKI CA to authenticate with IAM Roles Anywhere. You establish trust between IAM Roles Anywhere and your CA by creating a trust anchor that points to the root of the CA.
cert-manager
Figure 3 shows a detailed overview of the cert-manager setup used in this post, including the aws-privateca-issuer add-on for the integration of AWS Private CA.
Figure 3: Detailed overview of cert-manager setup
cert-manager is a tool for managing X.509 certificates in Kubernetes. As shown in Figure 3, cert-manager will make sure that certificates are valid and up-to-date and attempt to renew them before they expire. By using add-ons, you can configure different backends for issuing X.509 certificates. In this post, we explore how to integrate cert-manager with AWS Private CA using the aws-privateca-issuer add-on. The aws-privateca-issuer add-on defines two custom resources, AWSPCAIssuer and AWSPCAClusterIssuer, which are used to configure the link to AWS Private CA. They are similar to the Issuer and ClusterIssuer resources that come with cert-manager, but specific to aws-privateca-issuer.
After the AWSPCAIssuer or AWSPCAClusterIssuer is available, aws-privateca-issuer authenticates towards AWS APIs using temporary security credentials obtained from IAM Roles Anywhere. cert-manager watches for the certificate resource, which references to an AWSPCAIssuer, which in turn references to AWS Private CA. aws-privatca-issuer requests a certificate from AWS Private CA. The auto-generated private key and the signed certificate are stored in Kubernetes secrets.
Using certificates and secrets
cert-manager supports multiple ways of integrating into your Kubernetes workloads. You can use certificate resources, which represent a human-readable definition of a certificate signing request (CSR) and contain information on certificate lifespan and renewal time. When using a certificate, the auto-generated private key and the signed certificate are stored in Kubernetes secrets.
With this option, an X.509 certificate is issued manually and saved as a secret. After a PKI is configured as an issuer, a certificate resource is created to automate the renewal of the certificate. With the certificate resource, the lifecycle of certificates is decoupled from the lifecycle of the pods that use them. This allows you to bootstrap the X.509 certificate even before the trusted PKI is deployed.
Using the CSI driver
Another way of integrating cert-manager is by using a CSI driver. In this case, the certificate lifecycle is bound to the lifecycle of the pod. An X.509 certificate and private key are mounted into a predefined folder where your workloads can read them. On pod creation, cert-manager automatically creates a private key and requests a certificate for the configured trusted PKI. When the pod is deleted, the private key and certificate are also deleted and become invalid because they aren’t renewed by cert-manager.
In this post, we use the CSI driver approach for workloads to create ephemeral certificates for IAM Roles Anywhere.
Workload configuration
Figure 4 shows a detailed view of how pods can be configured to use IAM Roles Anywhere without needing to change the underlying Docker images by using a sidecar that provides an IMDSv2 endpoint that mimics the behavior in the Amazon Elastic Compute Cloud (Amazon EC2) instance metadata endpoint.
Figure 4: Pod configuration using a sidecar
As shown in Figure 4, when using a certificate resource, the auto-generated private key and the signed certificate are stored in Kubernetes secrets and mounted into the pod. When using the CSI driver, a private key is generated locally (for the pod), a certificate is requested from cert-manager based on the given attributes and is issued by AWSPCAIssuer, and the certificates are mounted directly into the pod with no intermediate secret being created.
IAM Roles Anywhere uses the CreateSession API to authenticate requests with a SigV4a signature using the private key and its associated X.509 certificate. This exchange provides a IAM role session credential, as if you had assumed the IAM role. The aws_signing_helper binary is provided to call the CreateSession API from the command line. In this post, a sidecar container that provides an IMDSv2 endpoint to the workload container is used. This container uses the aws_signing_helper binary and uses its serve command.
This way, applications using AWS SDKs can use the AWS_EC2_METADATA_SERVICE_ENDPOINT environment variable to set the instance metadata endpoint to the correct port on the localhost interface. The X.509 certificate and private key are provided as files to the sidecar container.
Solution deployment
In this section, we show the steps needed to deploy the solution in your AWS account.
Prerequisites
To deploy the solution in this post, make sure that you have the following in place:
An AWS account and IAM permissions for IAM, IAM Roles Anywhere, and AWS Private CA
Latest stable Kubernetes
kubectl (matching your Kubernetes version)
Helm 3
jq
Note: As an alternative to using the AWS CLI, you can use the AWS Controllers for Kubernetes (ACK) service controller for AWS Private CA for creating and managing CertificateAuthority, Certificate, and CertificateAuthorityActivation resources directly within your Kubernetes cluster. After establishing your CA hierarchy using the ACK controller, you can proceed with the subsequent steps involving IAM Roles Anywhere integration, aws-privateca-issuer, and cert-manager as described in this post.
Step 1 – AWS Private CA
Set up a root CA in AWS Private CA, which will issue short lived certificates for your pods. In this example you use only one CA; for production environments, you should check the considerations for designing CA hierarchies. Start by using the AWS CLI to create a configuration.
The command will return a CertificateAuthorityArn, which you will need for further commands, so export it for later use. Replace <region> with your AWS Region.
At this point your root CA is set up and ready to use. The next step is to configure IAM Roles Anywhere.
Start by defining a trust anchor that will refer to your newly created AWS Private CA and export the trustAnchorArn. Replace <value-of-trustAnchorArn> with the Amazon Resource Name (ARN) value of your IAM Roles Anywhere trust anchor.
Create an IAM role to be used by the aws-privateca-issuer cert-manager plugin. This role needs to include the actions sts:AssumeRole, sts:SetSourceIdentity and sts:TagSession, which are required by IAMRA. Replace <TA_ID> with your trust anchor.
Note: You should specify a PrincipalTag with the CN. Furthermore, it should be scoped to the IAMRA service principal. This further restricts authorization based on attributes that are extracted from the X.509 certificate and provides an additional layer of security by helping to ensure that even if an unauthorized party gains access to a valid certificate, they cannot assume the role unless the certificate’s CN matches the specified value.
Attach an inline policy that allows the role request certificates from your PCA and retrieve these. Note that there is a condition limiting the AWS Private CA templates to only allow EndEntityCertificate.
The created role iamra-issuer will only be used by the aws-privateca-issuer to integrate with AWS Private CA. You should repeat the process of creating IAM roles and IAMRA profiles for your workloads. it’s recommended to create a separate IAM role for each workload and limit its use with condition statements in the trust policy, checking for the workload identity and trust anchor (for example, matching the common name). Furthermore, it’s important that you add IAMRA to the trust policy and allow the aforementioned actions. Best practice with IAM roles is to apply least-privilege permissions.
Step 3 – Create the init container
To integrate IAM Roles Anywhere within your Kubernetes environment, you need to provide an IMDSv2 endpoint to your application containers by running the aws_signing_helper binary as a sidecar. You also need to configure your applications using an environment variable to use the new instance metadata endpoint. To do so, build a Docker image that works as a sidecar.
In this step, create a basic image that fulfills the preceding requirements. In your environment, you might want to adapt this example to use your own base image and implement your image hardening processes.
Copy the following script and save it as init.sh.
#!/bin/sh

if [[ -z "$TRUST_ANCHOR_ARN" ]]; then
  echo "Must provide TRUST_ANCHOR_ARN environment variable." 1>&2
  exit 1
fi

if [[ -z "$PROFILE_ARN" ]]; then
  echo "Must provide PROFILE_ARN environment variable." 1>&2
  exit 1
fi

if [[ -z "$ROLE_ARN" ]]; then
  echo "Must provide ROLE_ARN environment variable." 1>&2
  exit 1
fi

echo "starting IMDSv2 endpoint with aws_signing_helper ..."
/aws_signing_helper serve \
  --certificate /iamra/tls.crt         \
  --private-key /iamra/tls.key         \
  --trust-anchor-arn $TRUST_ANCHOR_ARN \
  --profile-arn $PROFILE_ARN           \
  --role-arn $ROLE_ARN
This script is the entry point of the sidecar container. It expects the environment variables TRUST_ANCHOR_ARN, PROFILE_ARN, and ROLE_ARN, which are required by aws_signing_helper. It also expects an X.509 certificate and its private key in the folder /iamra, which will be mounted in a later stage during pod initialization. Finally, it invokes the aws_signing_helper with the serve directive which creates an IMDSv2 endpoint listening on 9911 by default. This can be customized using the --port parameter.
Now let’s inspect the Docker file.
Note: At the time of writing, we used the alpine3.17.0 image. Use a hardened base image that’s designed to be secure and aligns with the requirements of your environment.
FROM alpine:3.17.0

COPY init.sh .
RUN apk add --no-cache libc6-compat libgcc wget
RUN wget https://rolesanywhere.amazonaws.com/releases/1.3.0/X86_64/Linux/aws_signing_helper
RUN chmod +x /aws_signing_helper /init.sh
RUN ln -s /lib/libc.musl-x86_64.so.1 /lib/libresolv.so.2
ENTRYPOINT ["/bin/sh", "-c", "/init.sh"]
This Docker file copies the init.sh and downloads the aws_signing_helper binary. The init.sh script is defined as an entry point to the container. Dynamic libraries required by aws_signing_helper are installed using Alpine Linux package manager (Apk).
Now build the docker image, sign in to it, and push it for later use. For the following commands replace <my-docker-registry> with the hostname of your local registry or use an ECR Repository.
In this step, install cert-manager into your cluster and configure aws-privateca-issuer using a manually bootstrapped certificate. cert-manager-approver-policy is used to control which certificates can be requested by the workloads. Then, set up the cert-manager CSI driver to automatically provision X.509 certificates for your workload pods.
Start with the cert-manager setup:
Add the cert-manager repository to Helm and install the chart.
Note: At the time of writing, we used cert-manager version 1.16.2. Check for the latest stable version.
Now, install the cert-manager aws-privateca-issuer plugin. This integration connects cert-manager with AWS Private CA and lets you issue short-lived certificates automatically. Currently, aws-privateca-issuer Helm chart doesn’t support IAMRA natively. So, you’re going to use the same init-container to set up IAMRA as for the workload pods.
You need to issue the first X.509 certificate for aws-privateca-issuer IAMRA manually. Later, cert-manager will renew it automatically.
Create the bootstrap certificate. When asked for a common name, enter iamra-issuer.
The previous command will create an RSA private key named iamra.key and a certificate signing request name iamra.csr. Now you need to call AWS Private CA to issue the bootstrap certificate.
Set the validity period of the certificate to 1 day so that cert-manager will replace it after it’s set up. The IAM role that’s performing this action must have permissions to AWS Certificate Manager (ACM), IAM, and IAM Roles Anywhere to complete the setup.
You’re ready to install the aws-privateca-issuer. You need to modify the Helm chart because it doesn’t currently support IAMRA. You will render the Helm chart into YAML manifests, which are then adapted for IAMRA.
Install the Helm repository and render the charts into a file.
Add your previously built image as a sidecar and replace the environment variables with your exported values. Search for the deployment definition and add the following section:
Apply your modified manifest to install aws-privateca-issuer and verify the deployment you have modified. It should show that one pod is ready and available.
kubectl apply -f privateca-issuer.yaml

kubectl get deployment -n cert-manager -l app.kubernetes.io/name=aws-privateca-issuer

NAME                         READY   UP-TO-DATE   AVAILABLE   AGE
iamra-aws-privateca-issuer   1/1     1            1           4d10h
Define an AWSPCAIssuer, which will be used for renewal of the manually bootstrapped certificate for the aws-privateca-issuer add-on.
Note: At the time of writing, we used awspca cert-manager API version v1beta1. Check for the latest stable version.
After at least one AWSPCAIssuer or AWSPCAClusterIssuer is available, aws-privateca-issuer is going to authenticate towards AWS APIs by calling sts.get-caller-identity and verify the authentication method. You can verify this using its log files. It should print the assumed role.
Now, you can create a cert-manager Certificate resource that represents a desired certificate that should be issued by the referenced cert-manager Issuer. It combines information of a CSR with details on the validity period and renewal.
In Step 4, sub-step 9, you created an AWSPCAIssuer named iamra-cm-issuer. You then used this AWSPCAIssuer to renew the manually bootstrapped certificate for the aws-privateca-issuer.
In Step 4, sub-step 11, you created the certificate iamra-privateca-issuer-cert, which is used by the aws-privateca-issuer.
In this step, you will deploy the sample workload. When deploying the sample workload, make sure to repeat the process of creating IAM roles and IAMRA profiles (from Step 2), the AWSPCAIssuer (Step 4, sub-step 9), and the CertificateRequestPolicy (Step 4, sub-step 11) for the certificate request.
To test the deployment, you can use kubectl exec to access the iamra-sidecar container. Navigate to the iamra directory and check if the certificate and key are mounted.
Command: kubectl exec -it acmpca-csi-test – sh ls | grep iamra
Output: You should see iam-roles-anywhere-s3-full-access in caller-identity.
Command: $aws s3 ls
Output: You should be able to list the S3 bucket based on the permissions associated with the assumed role.
Summary
In this post, you learned about a solution for securely connecting on-premises Kubernetes workloads to AWS services using IAM Roles Anywhere. The approach alleviates the need for long-term access keys or public internet exposure of the Kubernetes API server. By using this solution for containerized and full stack applications, you can benefit from:
Enhanced security: Use short-lived X.509 certificates instead of long-term credentials.
Simplified management: Automate the certificate lifecycle with cert-manager and AWS Private CA.
Seamless integration: No modifications are required to existing workload Docker files.
Consistent policies: Use the same IAM roles and policies across AWS and on premises.
If you have feedback about this post, submit comments in the Comments section below. If you have questions about this post, contact AWS Support.
What do many of these organizations have in common? Many times, it’s cyber attacks from adversaries looking to steal sensitive information or disrupt their operations. Cloudflare has seen this firsthand when providing free cybersecurity services to vulnerable groups through programs like Project Galileo, and found that in aggregate, organizations protected under the project experience an average of 95 million attacks per day. While cyber attacks are a problem across all industries in the digital age, civil society organizations are disproportionately targeted, many times due to their advocacy, and because attackers know that they typically operate with limited resources. In most cases, these organizations don’t even know they have been attacked until it is too late.
Over the last 10 years of Project Galileo, we’ve had the opportunity to work more closely with leading civil society organizations. This has led to a number of exciting new partnerships, including our work with the CyberPeace Institute. That’s why we’re excited to share work on a new resource, the CyberPeace Tracer. This resource will enable researchers, civil society, governments, and other organizations to understand threats and data-driven insights about the cyber threat landscape of the vulnerable communities we serve.
Partnership with CyberPeace Institute
The CyberPeace Institute is an independent non-profit based in Switzerland, dedicated to making cyberspace safer and more equitable for everyone. The Institute works closely with partners to minimize the impact of cyberattacks on people’s lives worldwide. In addition to partnerships, the organization provides independent data-driven insights on the threat landscape, from the global healthcare system to cyber attacks during the Russian government’s invasion of Ukraine. By analyzing these attacks, they are able to highlight real-world consequences, expose violations of international laws and norms, and promote responsible behavior online.
Cloudflare’s work with the CyberPeace Institute started in 2022 when the organization joined Project Galileo.Through the program, Cloudflare was proud not only to help protect the CyberPeace website, but also provide Zero Trust tools that secure access to internal applications for the institute’s global workforce. In addition to participating in Project Galileo, CyberPeace has also joined as an official partner, alongside more than 53 civil society organizations that help us identify organizations in need of protection.
As the CyberPeace Institute helped us grow Project Galileo, they also tested out new features including Cloudflare Email Security, a Cloudflare product designed to help protect against phishing and ransomware attacks. Testing the product for their organizations, they found that our approach to proactively detect and block malicious email, and ease of deployment with no need for hardware or extra software, would benefit the wider community they serve. With this in mind, CyberPeace came to us with an idea: they saw the potential to extend Email Security to smaller organizations that don’t have the same technical tools or budget to protect themselves.
Through our unique partnership, the CyberPeace Institute onboards its network of NGOs with Cloudflare Email Security, serving as a central hub to aggregate real-time data on email threats. This information powers a live dashboard, providing other organizations with visibility into phishing campaigns that could impact the broader community. One key challenge in tracking targeted phishing attacks is that many incidents go unreported, or victims may not realize they have been compromised until much later. By having a partner serve as a centralized point of contact, it helps ensure that insights into phishing attempts at one NGO can help protect others before the attack spreads.
CyberPeace Tracer
The CyberPeace Tracer shares vulnerabilities and threats faced by the community of NGOs, developed by the CyberPeace Institute. The CyberPeace Tracer gathers and analyzes data on cyberattacks and disinformation campaigns targeting NGOs, non-profits, and charities that address global societal challenges. The goal is to better understand the scale and impact of these threats to inform the public, so that organizations can become aware of emerging threats and take action to improve their defenses.
For the Tracer, CyberPeace partners and collects data directly from partners who monitor a predefined set of NGO domains. The dashboards detail publicly disclosed software and hardware vulnerabilities that can be exploited against monitor NGOs, malware infections detected, and analysis of phishing attacks that reveal trends and attacker tactics. The Tracer breaks out incidents by sector, including organizations working in health, development, food, water, energy, human rights, women’s rights and more. On the phishing dashboard, users can filter by country, identify the top phishing subject lines that NGOs received, as well as the top five threats that were blocked by the Email Security product.
Our collaboration with CyberPeace strengthens defenses against phishing by allowing the CyberPeace Institute to analyze flagged emails, helping to identify and disrupt malicious domains and ongoing threats. By analyzing past incidents, we have found that organizations can learn from others’ experiences and implement best practices to reduce the likelihood of future attacks and data breaches, especially in a sector where many times, attacks go unreported.
Strengthening resources for vulnerable communities
This is an exciting development for strengthening reporting on cyber attacks to non-profits, enabling them to collaborate on solutions, share threat intelligence, and build stronger defenses across the sector. We encourage NGOs who are interested in onboarding to Cloudflare Email Security through the CyberPeace Institute to visit cyberpeaceinstitute.org/cloudflare-area-1/. If you are looking for protection under Project Galileo, apply at cloudflare.com/galileo/.
GitHub’s Product Security Engineering team writes code and implements tools that help secure the code that powers GitHub. We use GitHub Advanced Security (GHAS) to discover, track, and remediate vulnerabilities and enforce secure coding standards at scale. One tool we rely heavily on to analyze our code at scale is CodeQL.
CodeQL is GitHub’s static analysis engine that powers automated security analyses. You can use it to query code in much the same way you would query a database. It provides a much more robust way to analyze code and uncover problems than an old-fashioned text search through a codebase.
The following post will detail how we use CodeQL to keep GitHub secure and how you can apply these lessons to your own organization. You will learn why and how we use:
Custom query packs (and how we create and manage them).
Custom queries.
Variant analysis to uncover potentially insecure programming practices.
Enabling CodeQL at scale
We employ CodeQL in a variety of ways at GitHub.
Default setup with the default and security-extended query suites
Default setup with the default and security-extended query suites meets the needs of the vast majority of our over 10,000 repositories. With these settings, pull requests automatically get a security review from CodeQL.
Advanced setup with a custom query pack
A few repositories, like our large Ruby monolith, need extra special attention, so we use advanced setup with a query pack containing custom queries to really tailor to our needs.
Multi-repository variant analysis (MRVA)
To conduct variant analysis and quick auditing, we use MRVA. We also write custom CodeQL queries to detect code patterns that are either specific to GitHub’s codebases or patterns we want a security engineer to manually review.
The specific custom Actions workflow step we use on our monolith is pretty simple. It looks like this:
Our Ruby configuration is pretty standard, but advanced setup offers a variety of configuration options using custom configuration files. The interesting part is the packs option, which is how we enable our custom query pack as part of the CodeQL analysis. This pack contains a collection of CodeQL queries we have written for Ruby, specifically for the GitHub codebase.
So, let’s dive deeper into why we did that—and how!
Publishing our CodeQL query pack
Initially, we published CodeQL query files directly to the GitHub monolith repository, but we moved away from this approach for several reasons:
It required going through the production deployment process for each new or updated query.
Queries not included in a query pack were not pre-compiled, which slowed down CodeQL analysis in CI.
Our test suite for CodeQL queries ran as part of the monolith’s CI jobs. When a new version of the CodeQL CLI was released, it sometimes caused the query tests to fail because of changes in the query output, even when there were no changes to the code in the pull request. This often led to confusion and frustration among engineers, as the failure wasn’t related to their pull request changes.
By switching to publishing a query pack to GitHub Container Registry (GCR), we’ve simplified our process and eliminated many of these pain points, making it easier to ship and maintain our CodeQL queries. So while it’s possible to deploy custom CodeQL query files directly to a repository, we recommend publishing CodeQL queries as a query pack to the GCR for easier deployment and faster iteration.
Creating our query pack
When setting up our custom query pack, we faced several considerations, particularly around managing dependencies like the ruby-all package.
To ensure our custom queries remain maintainable and concise, we extend classes from the default query suite, such as the ruby-all library. This allows us to leverage existing functionality rather than reinventing the wheel, keeping our queries concise and maintainable. However, changes to the CodeQL library API can introduce breaking changes, potentially deprecating our queries or causing errors. Since CodeQL runs as part of our CI, we wanted to minimize the chance of this happening, as this can lead to frustration and loss of trust from developers.
We develop our queries against the latest version of the ruby-all package, ensuring we’re always working with the most up-to-date functionality. To mitigate the risk of breaking changes affecting CI, we pin the ruby-all version when we’re ready to release, locking it in the codeql-pack.lock.yml file. This guarantees that when our queries are deployed, they will run with the specific version of ruby-all we’ve tested, avoiding potential issues from unintentional updates.
Here’s how we manage this setup:
In our qlpack.yml, we set the dependency to use the latest version of ruby-all
During development, this configuration pulls in the latest version) of ruby-all when running codeql pack init, ensuring we’re always up to date.
This approach allows us to balance developing against the latest features of the ruby-all package while ensuring stability when we release.
We also have a set of CodeQL unit tests that exercise our queries against sample code snippets, which helps us quickly determine if any query will cause errors before we publish our pack. These tests are run as part of the CI process in our query pack repository, providing an early check for issues. We strongly recommend writing unit tests for your custom CodeQL queries to ensure stability and reliability.
Altogether, the basic flow for releasing new CodeQL queries via our pack is as follows:
Open a pull request with the new query.
Write unit tests for the new query.
Merge the pull request.
Increment the pack version in a new pull request.
Run codeql pack init to resolve dependencies.
Correct unit tests as needed.
Publish the query pack to the GitHub Container Registry (GCR).
Repositories with the query pack in their config will start using the updated queries.
We have found this flow balances our team’s development experience while ensuring stability in our published query pack.
Configuring our repository to use our custom query pack
We won’t provide a general recommendation on configuration here, given that it ultimately depends on how your organization deploys code. We opted against locking our pack to a particular version in our CodeQL configuration file (see above). Instead, we chose to manage our versioning by publishing the CodeQL package in GCR. This results in the GitHub monolith retrieving the latest published version of the query pack. To roll back changes, we simply have to republish the package. In one instance, we released a query that had a high number of false positives and we were able to publish a new version of the pack that removed that query in less than 15 minutes. This is faster than the time it would have taken us to merge a pull request on the monolith repository to roll back the version in the CodeQL configuration file.
One of the problems we encountered with publishing the query pack in GCR was how to easily make the package available to multiple repositories within our enterprise. There are several approaches we explored.
Grant access permissions for individual repositories. On the package management page, you can grant permissions for individual repositories to access your package. This was not a good solution for us since we have too many repositories for it to be feasible to do manually, yet there is not currently a way to configure programmatically using an API.
Mint a personal access token for the CodeQL action runner. We could have minted a personal access token (PAT) that has access to read all packages for our organization and added that to the CodeQL action runner. However, this would have required managing a new token, and it seemed a bit more permissive than we wanted because it could read all of our private packages rather than ones we explicitly allow it to have access to.
We write a variety of custom queries to be used in our custom query packs. These cover GitHub-specific patterns that aren’t included in the default CodeQL query pack. This allows us to tailor the analysis to patterns and preferences that are specific to our company and codebase. Some of the types of things we alert on using our custom query pack include:
High-risk APIs specific to GitHub’s code that can be dangerous if they receive unsanitized user input.
Use of specific built-in Rails methods for which we have safer, custom methods or functions.
Required authorization methods not being used in our REST API endpoint definitions and GraphQL object/mutation definitions.
REST API endpoints and GraphQL mutations that require engineers to define access control methods to determine which actors can access them. (Specifically, the query detects the absence of this method definition to ensure that the actors’ permissions are being checked for these endpoints.)
Use of signed tokens so we can nudge engineers to include Product Security as a reviewer when using them.
Custom queries can be used more for educational purposes rather than being blockers to shipping code. For example, we want to alert engineers when they use the ActiveRecord::decrypt method. This method should generally not be used in production code, as it will cause an encrypted column to become decrypted. We use the recommendation severity in the query metadata so these alerts are treated as more of an informational alert. That means this may trigger an alert in a pull request, but it won’t cause the CodeQL CI job to fail. We use this lower severity level to allow engineers to assess the impact of new queries without immediate blocking. Additionally, this alert level isn’t tracked through our Fundamentals program, meaning it doesn’t require immediate action, reflecting the query’s maturity as we continue to refine its relevance and risk assessment.
/**
 * @id rb/github/use-of-activerecord-decrypt
 * @description Do not use the .decrypt method on AR models, this will decrypt all encrypted attributes and save
 * them unencrypted, effectively undoing encryption and possibly making the attributes inaccessible.
 * If you need to access the unencrypted value of any attribute, you can do so by calling my_model.attribute_name.
 * @kind problem
 * @severity recommendation
 * @name Use of ActiveRecord decrypt method
 * @tags security
 *      github-internal
 */

import ruby
import DataFlow
import codeql.ruby.DataFlow
import codeql.ruby.frameworks.ActiveRecord

/** Match against .decrypt method calls where the receiver may be an ActiveRecord object */
class ActiveRecordDecryptMethodCall extends ActiveRecordInstanceMethodCall {
  ActiveRecordDecryptMethodCall() { this.getMethodName() = "decrypt" }
}

from ActiveRecordDecryptMethodCall call
select call,
  "Do not use the .decrypt method on AR models, this will decrypt all encrypted attributes and save them unencrypted.
Another educational query is the one mentioned above in which we detect the absence of the `control_access` method in a class that defines a REST API endpoint. If a pull request introduces a new endpoint without `control_access`, a comment will appear on the pull request saying that the `control_access` method wasn’t found and it’s a requirement for REST API endpoints. This will notify the reviewer of a potential issue and prompt the developer to fix it.
/**
 * @id rb/github/api-control-access
 * @name Rest API Without 'control_access'
 * @description All REST API endpoints must call the 'control_access' method, to ensure that only specified actor types are able to access the given endpoint.
 * @kind problem
 * @tags security
 * github-internal
 * @precision high
 * @problem.severity recommendation
 */

import codeql.ruby.AST
import codeql.ruby.DataFlow
import codeql.ruby.TaintTracking
import codeql.ruby.ApiGraphs

// Api::App REST API endpoints should generally call the control_access method
private DataFlow::ModuleNode appModule() {
  result = API::getTopLevelMember("Api").getMember("App").getADescendentModule() and
  not result = protectedApiModule() and
  not result = staffAppApiModule()
}

// Api::Admin, Api::Staff, Api::Internal, and Api::ThirdParty REST API endpoints do not need to call the control_access method
private DataFlow::ModuleNode protectedApiModule() {
  result =
    API::getTopLevelMember(["Api"])
        .getMember(["Admin", "Staff", "Internal", "ThirdParty"])
        .getADescendentModule()
}

// Api::Staff::App REST API endpoints do not need to call the control_access method
private DataFlow::ModuleNode staffAppApiModule() {
  result =
    API::getTopLevelMember(["Api"]).getMember("Staff").getMember("App").getADescendentModule()
}

private class ApiRouteWithoutControlAccess extends DataFlow::CallNode {
  ApiRouteWithoutControlAccess() {
    this = appModule().getAModuleLevelCall(["get", "post", "delete", "patch", "put"]) and
    not performsAccessControl(this.getBlock())
  }
}

predicate performsAccessControl(DataFlow::BlockNode blocknode) {
  accessControlCalled(blocknode.asExpr().getExpr())
}

predicate accessControlCalled(Block block) {
  // the method `control_access` is called somewhere inside `block`
  block.getAStmt().getAChild*().(MethodCall).getMethodName() = "control_access"
}

from ApiRouteWithoutControlAccess api
select api.getLocation(),
  "The control_access method was not detected in this REST API endpoint. All REST API endpoints must call this method to ensure that the endpoint is only accessible to the specified actor types."
Variant analysis
Variant analysis (VA) refers to the process of searching for variants of security vulnerabilities. This is particularly useful when we’re responding to a bug bounty submission or a security incident. We use a combination of tools to do this, including GitHub’s code search functionality, custom scripts, and CodeQL. We will often start by using code search to find patterns similar to the one that caused a particular vulnerability across numerous repositories. This is sometimes not good enough, as code search is not semantically aware, meaning that it cannot determine whether a given variable is an Active Record object or whether it is being used in an `if` expression. To answer those types of questions we turn to CodeQL.
When we write CodeQL queries for variant analysis we are much less concerned about false positives, since the goal is to provide results for security engineers to analyze. The quality of the code is also not quite as important, as these queries will only be used for the duration of the VA effort. Some of the types of things we use CodeQL for during VAs are:
Where are we using SHA1 hashes?
One of our internal API endpoints was vulnerable to SQLi according to a recent bug bounty report. Where are we passing user input to that API endpoint?
There is a problem with how some HTTP request libraries in Ruby handle the proxy setting. Can we look at places we are instantiating our HTTP request libraries with a proxy setting?
One recent example involved a subtle vulnerability in Rails. We wanted to detect when the following condition was present in our code:
A parameter was used to look up an Active Record object.
That parameter is later reused after the Active Record object is looked up.
The concern with this condition is that it could lead to an insecure direct object reference (IDOR) vulnerability because Active Record finder methods can accept an array. If the code looks up an Active Record object in one call to determine if a given entity has access to a resource, but later uses a different element from that array to find an object reference, that can lead to an IDOR vulnerability. It would be difficult to write a query to detect all vulnerable instances of this pattern, but we were able to write a query that found potential vulnerabilities that gave us a list of code paths to manually analyze. We ran the query against a large number of our Ruby codebases using CodeQL’s MRVA.
The query, which is a bit hacky and not quite production grade, is below:
/**
 * @name wip array query
 * @description an array is passed to an AR finder object
 */

import ruby
import codeql.ruby.AST
import codeql.ruby.ApiGraphs
import codeql.ruby.frameworks.Rails
import codeql.ruby.frameworks.ActiveRecord
import codeql.ruby.frameworks.ActionController
import codeql.ruby.DataFlow
import codeql.ruby.Frameworks
import codeql.ruby.TaintTracking

// Gets the "final" receiver in a chain of method calls.
// For example, in `Foo.bar`, this would give the `Foo` access, and in
// `foo.bar.baz("arg")` it would give the `foo` variable access
private Expr getUltimateReceiver(MethodCall call) {
  exists(Expr recv |
    recv = call.getReceiver() and
    (
      result = getUltimateReceiver(recv)
      or
      not recv instanceof MethodCall and result = recv
    )
  )
}

// Names of class methods on ActiveRecord models that may return one or more
// instances of that model. This also includes the `initialize` method.
// See https://api.rubyonrails.org/classes/ActiveRecord/FinderMethods.html
private string staticFinderMethodName() {
  exists(string baseName |
    baseName = ["find_by", "find_or_create_by", "find_or_initialize_by", "where"] and
    result = baseName + ["", "!"]
  )
  // or
  // result = ["new", "create"]
}

private class ActiveRecordModelFinderCall extends ActiveRecordModelInstantiation, DataFlow::CallNode
{
  private ActiveRecordModelClass cls;

  ActiveRecordModelFinderCall() {
    exists(MethodCall call, Expr recv |
      call = this.asExpr().getExpr() and
      recv = getUltimateReceiver(call) and
      (
        // The receiver refers to an `ActiveRecordModelClass` by name
        recv.(ConstantReadAccess).getAQualifiedName() = cls.getAQualifiedName()
        or
        // The receiver is self, and the call is within a singleton method of
        // the `ActiveRecordModelClass`
        recv instanceof SelfVariableAccess and
        exists(SingletonMethod callScope |
          callScope = call.getCfgScope() and
          callScope = cls.getAMethod()
        )
      ) and
      (
        call.getMethodName() = staticFinderMethodName()
        or
        // dynamically generated finder methods
        call.getMethodName().indexOf("find_by_") = 0
      )
    )
  }

  final override ActiveRecordModelClass getClass() { result = cls }
}

class FinderCallArgument extends DataFlow::Node {
  private ActiveRecordModelFinderCall finderCallNode;

  FinderCallArgument() { this = finderCallNode.getArgument(_) }
}

class ParamsHashReference extends DataFlow::CallNode {
  private Rails::ParamsCall params;

  // TODO: only direct element references against `params` calls are considered
  ParamsHashReference() { this.getReceiver().asExpr().getExpr() = params }

  string getArgString() {
    result = this.getArgument(0).asExpr().getConstantValue().getStringlikeValue()
  }
}

class ArrayPassedToActiveRecordFinder extends TaintTracking::Configuration {
  ArrayPassedToActiveRecordFinder() { this = "ArrayPassedToActiveRecordFinder" }

  override predicate isSource(DataFlow::Node source) { source instanceof ParamsHashReference }

  override predicate isSink(DataFlow::Node sink) {
    sink instanceof FinderCallArgument
  }

  string getParamsArg(DataFlow::CallNode paramsCall) {
    result = paramsCall.getArgument(0).asExpr().getConstantValue().getStringlikeValue()
  }

  // this doesn't check for anything fancy like whether it's reuse in a if/else
  // only intended for quick manual audit filtering of interesting candidates
  // so remains fairly broad to not induce false negatives
  predicate paramsUsedAfterLookups(DataFlow::Node source) {
    exists(DataFlow::CallNode y | y instanceof ParamsHashReference
    and source.getEnclosingMethod() = y.getEnclosingMethod()
    and source != y
    and getParamsArg(source) = getParamsArg(y)
    // we only care if it's used again AFTER an object lookup
    and y.getLocation().getStartLine() > source.getLocation().getStartLine())
  }
}

from ArrayPassedToActiveRecordFinder config, DataFlow::Node source, DataFlow::Node sink
where config.hasFlow(source, sink) and config.paramsUsedAfterLookups(source)
select source, sink.getLocation()
Conclusion
CodeQL can be very useful for product security engineering teams to detect and prevent vulnerabilities at scale. We use a combination of queries that run in CI using our query pack and one-off queries run through MRVA to find potential vulnerabilities and communicate them to engineers. CodeQL isn’t only useful for finding security vulnerabilities, though; it is also useful for detecting the presence or absence of security controls that are defined in code. This saves our security team time by surfacing certain security problems automatically, and saves our engineers time by detecting them earlier in the development process.
Writing custom CodeQL queries
Tips for getting started
We have a large number of articles and resources for writing custom CodeQL queries. If you haven’t written custom CodeQL queries before, here are some resources to help get you started:
Cloudflare was recently contacted by a group of anonymous security researchers who discovered a broadcast amplification vulnerability through their QUIC Internet measurement research. Our team collaborated with these researchers through our Public Bug Bounty program, and worked to fully patch a dangerous vulnerability that affected our infrastructure.
Since being notified about the vulnerability, we’ve implemented a mitigation to help secure our infrastructure. According to our analysis, we have fully patched this vulnerability and the amplification vector no longer exists.
Summary of the amplification attack
QUIC is an Internet transport protocol that is encrypted by default. It offers equivalent features to TCP (Transmission Control Protocol) and TLS (Transport Layer Security), while using a shorter handshake sequence that helps reduce connection establishment times. QUIC runs over UDP (User Datagram Protocol).
The researchers found that a single client QUIC Initial packet targeting a broadcast IP destination address could trigger a large response of initial packets. This manifested as both a server CPU amplification attack and a reflection amplification attack.
Transport and security handshakes
When using TCP and TLS there are two handshake interactions. First, is the TCP 3-way transport handshake. A client sends a SYN packet to a server, it responds with a SYN-ACK to the client, and the client responds with an ACK. This process validates the client IP address. Second, is the TLS security handshake. A client sends a ClientHello to a server, it carries out some cryptographic operations and responds with a ServerHello containing a server certificate. The client verifies the certificate, confirms the handshake and sends application traffic such as an HTTP request.
QUIC follows a similar process, however the sequence is shorter because the transport and security handshake is combined. A client sends an Initial packet containing a ClientHello to a server, it carries out some cryptographic operations and responds with an Initial packet containing a ServerHello with a server certificate. The client verifies the certificate and then sends application data.
The QUIC handshake does not require client IP address validation before starting the security handshake. This means there is a risk that an attacker could spoof a client IP and cause a server to do cryptographic work and send data to a target victim IP (aka a reflection attack). RFC 9000 is careful to describe the risks this poses and provides mechanisms to reduce them (for example, see Sections 8 and 9.3.1). Until a client address is verified, a server employs an anti-amplification limit, sending a maximum of 3x as many bytes as it has received. Furthermore, a server can initiate address validation before engaging in the cryptographic handshake by responding with a Retry packet. The retry mechanism, however, adds an additional round-trip to the QUIC handshake sequence, negating some of its benefits compared to TCP. Real-world QUIC deployments use a range of strategies and heuristics to detect traffic loads and enable different mitigations.
In order to understand how the researchers triggered an amplification attack despite these QUIC guardrails, we first need to dive into how IP broadcast works.
Broadcast addresses
In Internet Protocol version 4 (IPv4) addressing, the final address in any given subnet is a special broadcast IP address used to send packets to every node within the IP address range. Every node that is within the same subnet receives any packet that is sent to the broadcast address, enabling one sender to send a message that can be “heard” by potentially hundreds of adjacent nodes. This behavior is enabled by default in most network-connected systems and is critical for discovery of devices within the same IPv4 network.
The broadcast address by nature poses a risk of DDoS amplification; for every one packet sent, hundreds of nodes have to process the traffic.
Dealing with the expected broadcast
To combat the risk posed by broadcast addresses, by default most routers reject packets originating from outside their IP subnet which are targeted at the broadcast address of networks for which they are locally connected. Broadcast packets are only allowed to be forwarded within the same IP subnet, preventing attacks from the Internet from targeting servers across the world.
The same techniques are not generally applied when a given router is not directly connected to a given subnet. So long as an address is not locally treated as a broadcast address, Border Gateway Protocol (BGP) or other routing protocols will continue to route traffic from external IPs toward the last IPv4 address in a subnet. Essentially, this means a “broadcast address” is only relevant within a local scope of routers and hosts connected together via Ethernet. To routers and hosts across the Internet, a broadcast IP address is routed in the same way as any other IP.
Binding IP address ranges to hosts
Each Cloudflare server is expected to be capable of serving content from every website on the Cloudflare network. Because our network utilizes Anycast routing, each server necessarily needs to be listening on (and capable of returning traffic from) every Anycast IP address in use on our network.
To do so, we take advantage of the loopback interface on each server. Unlike a physical network interface, all IP addresses within a given IP address range are made available to the host (and will be processed locally by the kernel) when bound to the loopback interface.
The mechanism by which this works is straightforward. In a traditional routing environment, longest prefix matching is employed to select a route. Under longest prefix matching, routes towards more specific blocks of IP addresses (such as 192.0.2.96/29, a range of 8 addresses) will be selected over routes to less specific blocks of IP addresses (such as 192.0.2.0/24, a range of 256 addresses).
While Linux utilizes longest prefix matching, it consults an additional step — the Routing Policy Database (RPDB) — before immediately searching for a match. The RPDB contains a list of routing tables which can contain routing information and their individual priorities. The default RPDB looks like this:
$ ip rule show
0:	from all lookup local
32766:	from all lookup main
32767:	from all lookup default
Linux will consult each routing table in ascending numerical order to try and find a matching route. Once one is found, the search is terminated and the route immediately used.
If you’ve previously worked with routing rules on Linux, you are likely familiar with the contents of the main table. Contrary to the existence of the table named “default”, “main” generally functions as the default lookup table. It is also the one which contains what we traditionally associate with route table information:
$ ip route show table main
default via 192.0.2.1 dev eth0 onlink
192.0.2.0/24 dev eth0 proto kernel scope link src 192.0.2.2
This is, however, not the first routing table that will be consulted for a given lookup. Instead, that task falls to the local table:
$ ip route show table local
local 127.0.0.0/8 dev lo proto kernel scope host src 127.0.0.1
local 127.0.0.1 dev lo proto kernel scope host src 127.0.0.1
broadcast 127.255.255.255 dev lo proto kernel scope link src 127.0.0.1
local 192.0.2.2 dev eth0 proto kernel scope host src 192.0.2.2
broadcast 192.0.2.255 dev eth0 proto kernel scope link src 192.0.2.2
Looking at the table, we see two new types of routes — local and broadcast. As their names would suggest, these routes dictate two distinctly different functions: routes that are handled locally and routes that will result in a packet being broadcast. Local routes provide the desired functionality — any prefix with a local route will have all IP addresses in the range processed by the kernel. Broadcast routes will result in a packet being broadcast to all IP addresses within the given range. Both types of routes are added automatically when an IP address is bound to an interface (and, when a range is bound to the loopback (lo) interface, the range itself will be added as a local route).
Vulnerability discovery
Deployments of QUIC are highly dependent on the load-balancing and packet forwarding infrastructure that they sit on top of. Although QUIC’s RFCs describe risks and mitigations, there can still be attack vectors depending on the nature of server deployments. The reporting researchers studied QUIC deployments across the Internet and discovered that sending a QUIC Initial packet to one of Cloudflare’s broadcast addresses triggered a flood of responses. The aggregate amount of response data exceeded the RFC’s 3x amplification limit.
Taking a look at the local routing table of an example Cloudflare system, we see a potential culprit:
$ ip route show table local
local 127.0.0.0/8 dev lo proto kernel scope host src 127.0.0.1
local 127.0.0.1 dev lo proto kernel scope host src 127.0.0.1
broadcast 127.255.255.255 dev lo proto kernel scope link src 127.0.0.1
local 192.0.2.2 dev eth0 proto kernel scope host src 192.0.2.2
broadcast 192.0.2.255 dev eth0 proto kernel scope link src 192.0.2.2
local 203.0.113.0 dev lo proto kernel scope host src 203.0.113.0
local 203.0.113.0/24 dev lo proto kernel scope host src 203.0.113.0
broadcast 203.0.113.255 dev lo proto kernel scope link src 203.0.113.0
On this example system, the anycast prefix 203.0.113.0/24 has been bound to the loopback interface (lo) through the use of standard tooling. Acting dutifully under the standards of IPv4, the tooling has assigned both special types of routes — a local one for the IP range itself and a broadcast one for the final address in the range — to the interface.
While traffic to the broadcast address of our router’s directly connected subnet is filtered as expected, broadcast traffic targeting our routed anycast prefixes still arrives at our servers themselves. Normally, broadcast traffic arriving at the loopback interface does little to cause problems. Services bound to a specific port across an entire range will receive data sent to the broadcast address and continue as normal. Unfortunately, this relatively simple trait breaks down when normal expectations are broken.
Cloudflare’s frontend consists of several worker processes, each of which independently binds to the entire anycast range on UDP port 443. In order to enable multiple processes to bind to the same port, we use the SO_REUSEPORT socket option. While SO_REUSEPORT has additional benefits, it also causes traffic sent to the broadcast address to be copied to every listener.
Each individual QUIC server worker operates in isolation. Each one reacted to the same client Initial, duplicating the work on the server side and generating response traffic to the client’s IP address. Thus, a single packet could trigger a significant amplification. While specifics will vary by implementation, a typical one-listener-per-core stack (which sends retries in response to presumed timeouts) on a 128-core system could result in 384 replies being generated and sent for each packet sent to the broadcast address.
Although the researchers demonstrated this attack on QUIC, the underlying vulnerability can affect other UDP request/response protocols that use sockets in the same way.
Mitigation
As a communication methodology, broadcast is not generally desirable for anycast prefixes. Thus, the easiest method to mitigate the issue was simply to disable broadcast functionality for the final address in each range.
Ideally, this would be done by modifying our tooling to only add the local routes in the local routing table, skipping the inclusion of the broadcast ones altogether. Unfortunately, the only practical mechanism to do so would involve patching and maintaining our own internal fork of the iproute2 suite, a rather heavy-handed solution for the problem at hand.
Instead, we decided to focus on removing the route itself. Similar to any other route, it can be removed using standard tooling:
$ sudo ip route del 203.0.113.255 table local
To do so at scale, we made a relatively minor change to our deployment system:
  {%- for lo_route in lo_routes %}
    {%- if lo_route.type == "broadcast" %}
        # All broadcast addresses are implicitly ipv4
        {%- do remove_route({
        "dev": "lo",
        "dst": lo_route.dst,
        "type": "broadcast",
        "src": lo_route.src,
        }) %}
    {%- endif %}
  {%- endfor %}
In doing so, we effectively ensure that all broadcast routes attached to the loopback interface are removed, mitigating the risk by ensuring that the specification-defined broadcast address is treated no differently than any other address in the range.
Next steps
While the vulnerability specifically affected broadcast addresses within our anycast range, it likely expands past our infrastructure. Anyone with infrastructure that meets the relatively narrow criteria (a multi-worker, multi-listener UDP-based service that is bound to all IP addresses on a machine with routable IP prefixes attached in such a way as to expose the broadcast address) will be affected unless mitigations are in place. We encourage network administrators and security professionals to assess their systems for configurations that may present a local amplification attack vector.
The collective thoughts of the interwebz
Manage Consent
To provide the best experiences, we use technologies like cookies to store and/or access device information. Consenting to these technologies will allow us to process data such as browsing behavior or unique IDs on this site. Not consenting or withdrawing consent, may adversely affect certain features and functions.
Functional
Always active
The technical storage or access is strictly necessary for the legitimate purpose of enabling the use of a specific service explicitly requested by the subscriber or user, or for the sole purpose of carrying out the transmission of a communication over an electronic communications network.
Preferences
The technical storage or access is necessary for the legitimate purpose of storing preferences that are not requested by the subscriber or user.
Statistics
The technical storage or access that is used exclusively for statistical purposes.The technical storage or access that is used exclusively for anonymous statistical purposes. Without a subpoena, voluntary compliance on the part of your Internet Service Provider, or additional records from a third party, information stored or retrieved for this purpose alone cannot usually be used to identify you.
Marketing
The technical storage or access is required to create user profiles to send advertising, or to track the user on a website or across several websites for similar marketing purposes.