Tag Archives: Amazon Elastic Kubernetes Service

Improving platform resilience at Cash App

Post Syndicated from Dustin Ellis original https://aws.amazon.com/blogs/architecture/improving-platform-resilience-at-cash-app/

This post was coauthored with engineers at Cash App, including Ben Apprederisse (Platform Engineering Technical Lead), Jan Zantinge (Traffic Engineer), and Rachel Sheikh (Compute Engineer).

Cash App, a leading peer-to-peer payments and digital wallet service from Block, Inc., has grown to serve over 57 million users since its launch in 2013. Providing diverse offerings like instant money transfers, debit cards, stock and bitcoin investments, personal loans, and tax filing, Cash App continuously strives to make money more relatable, accessible, and secure. To meet this mission, their platform built on AWS must remain highly scalable and resilient.

Cash App has implemented resilience improvements across the entire technology stack, but for this post, we explore two enhancements implemented in 2024. First, we discuss how Cash App improved the resilience of its compute platform built on Amazon Elastic Kubernetes Service (Amazon EKS) by implementing a dual-cluster topology to reduce single points of failure. We also discuss how Cash App used AWS Fault Injection Service (AWS FIS) to conduct an Availability Zone power interruption scenario in non-production environments, preparing the platform team for real-world failures and ongoing regulatory requirements.

Moving to Amazon EKS

Cash App has used Amazon EKS as a shared platform for years, and in 2024, we migrated the last of our biggest and most critical services to it, driven by the ease of management and our strategy to run workloads in the cloud. This shift empowered our teams to focus more on application delivery and less on cluster management, abstracting away some of the complexity in operating Kubernetes clusters. With Amazon EKS, AWS is responsible for managing the Kubernetes control plane, which includes the control plane nodes, the ETCD database, and other infrastructure necessary for AWS to deliver a service offering with enhanced security features. As a consumer of Amazon EKS, we are still responsible for things like AWS Identity and Access Management (IAM), pod security, runtime security, networking, and cluster automatic scaling in the data plane for worker nodes. AWS refers to this as the Shared Responsibility Model; for more details, refer to Best Practices for Security. For a while, maintaining a single shared EKS cluster for each environment and AWS Region was acceptable and met our technical requirements.

Scaling challenges with a single shared EKS cluster

As Cash App’s shared EKS cluster grew and onboarded hundreds of microservices, we became an early adopter of the Karpenter Cluster Autoscaler, which improved application availability and cluster efficiency. Karpenter was designed to enhance node lifecycle management within Kubernetes clusters. It automates provisioning and deprovisioning of nodes based on the specific scheduling needs of pods, allowing for efficient scaling and cost optimization. We also reviewed and adopted many of the Amazon EKS Best Practices Guides for Reliability, Security, Networking, and Scalability.

Despite these efforts, in 2023, we realized having a single shared EKS cluster with hundreds of worker nodes had become a critical dependency in our cloud platform architecture, whereby standard operations like cluster upgrades posed a risk of impacting production traffic or causing downtime. Although we had a staging environment that allowed us to test new features and changes before rolling them out in production, it didn’t always reflect real traffic patterns that could allow impactful changes to go unnoticed in lower environments. For example, in late 2023, production traffic was briefly impacted due to a relatively new Kubernetes feature called API Priority and Fairness (APF) that introduced temporary control plane throttling following a cluster upgrade.

As a leader in the financial services industry, any interruption to our services directly impacts customers’ ability to transact and participate in the economy, so round-the-clock availability of our platform is essential. Following this incident, we reviewed and implemented the Kubernetes Control Plane best practices pertaining to APF and set up new detections in our observability platform to monitor things like FlowSchemas and queue depth. We also created a business case for investing in platform evolution and moving towards a multi-cluster topology. The desired state was to have a safer way to upgrade clusters, such that traffic is always serviceable regardless of the state of a single cluster in the fleet.

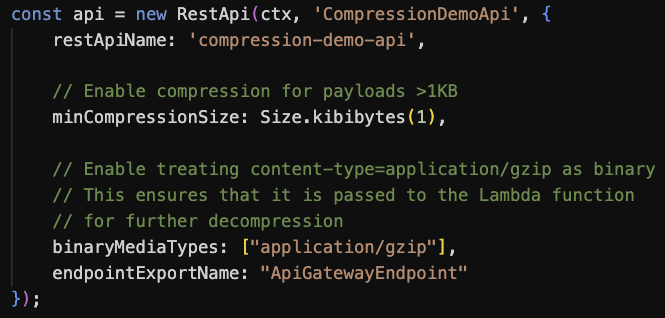
The following diagram illustrates our basic architecture in late 2023, portraying a single, Multi-AZ EKS cluster at Cash App. We had two ingress paths: for public ingress, we used Amazon Route 53 to a Network Load Balancer (NLB). For internal ingress across Amazon Virtual Private Cloud (Amazon VPC) networks (for example, from other business units), we set up a VPC endpoint service. Other components (such as service dependencies like database clusters and other Regions) are intentionally omitted from the diagram for simplicity.

Enterprise network architecture showcasing secure cross-VPC communication via PrivateLink to shared EKS cluster with public/internal ingress

Enterprise network architecture showcasing secure cross-VPC communication via PrivateLink to shared EKS cluster with public/internal ingress

Platform enhancements

In 2024, our cloud platform team implemented architectural changes to improve the reliability of the shared Amazon EKS platform, which was already running hundreds of services and over 10,000 pods. In the process, we also recognized the importance of chaos engineering to provide controlled failure testing and preparedness, which is also an evolving regulatory requirement for financial institutions. Our team has made multiple resilience improvements to apply long-term scalability; the rest of this post focuses on two enhancements we believe other AWS customers can benefit from.

Enhancement 1: Implementing a dual-cluster topology

When researching multi-cluster topologies and interacting with AWS specialists, we learned about architectural patterns to improve platform resilience with varying degrees of complexity. This included cell-based architecture, Route 53 weighted routing, and NLB chaining, among other patterns. Our initial requirements for the multi-cluster architecture were as follows:

  • Effortlessly deploy a service across two or more clusters
  • Serve production traffic from multiple clusters at the same time if needed
  • Seamlessly upgrade a production cluster without impacting production traffic
  • Have the ability to take a cluster out of the traffic flow during planned and unplanned events
  • Achieve reliability improvements with minimal architectural and cost changes

Based on these initial requirements and the complexity required to properly implement a cell-based architecture, we decided to start with Route 53 weighted routing for public ingress, and NLB chaining for internal ingress to achieve immediate improvements. Although we plan to implement a cell-based architecture in the future, it requires careful consideration and engineering investment (for example, creating a cell router and cell provisioning system). At the time, we needed a simpler, short-term solution that could improve overall scalability and reliability. From a Kubernetes perspective, we started with two Multi-AZ clusters in our production environment, each operating independently, such that a planned or unplanned event in one cluster would not affect the other cluster. Existing pipelines were extended to deploy the same Kubernetes resources into both clusters, which would actively serve ingress traffic using an NLB. If needed, we could divert all ingress traffic to one cluster during planned or unplanned events by updating the weights in Route 53 (for public ingress) or updating the listener rules and target groups on the frontend NLB (for internal ingress). In the following sections, we dive deeper into both approaches.

Public ingress changes

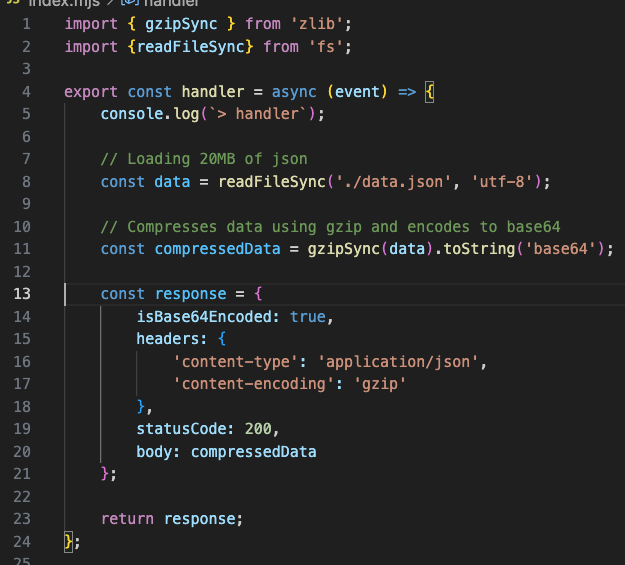
For public ingress, requests are still handled by Route 53. With the introduction of weighted routing, requests can be evenly routed between the two backend NLBs (one per cluster). This setup allows Cash App to split traffic evenly across clusters or temporarily route all traffic to one cluster during upgrades. As an example, during cluster A’s upgrade, we can direct ingress traffic to cluster B, enabling a sequential upgrade process with minimal disruption. This dual-cluster approach helps mitigate single points of failure and establishes a foundation for reliability improvements. The following diagram illustrates this architecture.

Highly available AWS Cash App architecture using Route 53 for 50/50 traffic distribution to dual NLB and EKS clusters across three AZs

Highly available architecture using Route 53 for 50/50 traffic distribution to dual NLB and EKS clusters across three AZs

Internal ingress changes

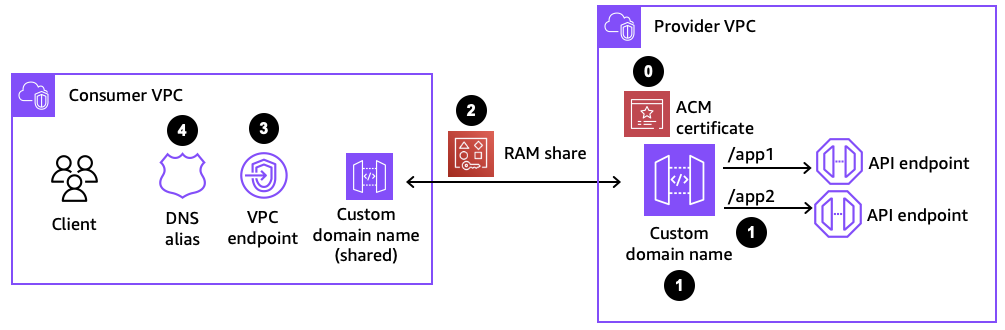
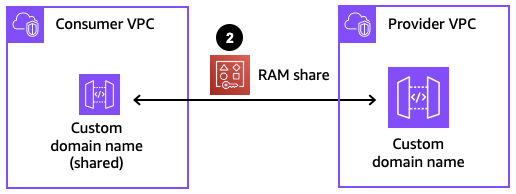
Cash App works closely with other business units like Square, and therefore needs to have a secure and scalable ingress path for cross-VPC traffic. To support these use cases, internal ingress requests are still routed from other business unit VPCs to the NLB associated with our VPC endpoint service. From there, requests are load balanced roughly evenly to two backend NLBs (one per cluster) using the listener rules. The following diagram illustrates this architecture.

Enterprise AWS Cash App architecture featuring secure VPC peering, tiered load balancing, and redundant EKS clusters for high availability

Cash App architecture featuring secure VPC peering, tiered load balancing, and redundant EKS clusters for high availability

Key considerations

Consider the following when assessing these approaches:

  • The NLB chaining approach used for internal ingress enables controlled failover and maintenance with minimal disruption by adjusting NLB listeners and target groups, and reduces single points of failure by distributing requests across two or more clusters.
  • Although this pattern met our initial requirements and made it possible to shift traffic from one cluster to another, it’s not as granular as we would like (for example, shift traffic for only service A to cluster B, and leave all other traffic on cluster A). We will continue to evolve the architecture and implement a more intelligent ingress router and cell provisioning system. Furthermore, at the time of writing, NLB doesn’t support weighted target group routing.
  • Using the NLB chaining approach adds additional cost due to multiple NLBs in the traffic path. With NLBs, you’re charged for each hour or partial hour that an NLB is running, and the number of Network Load Balancer Capacity Units (NLCUs) used by the NLB per hour.
  • The NLB chaining approach doesn’t achieve the full benefits of a cell-based architecture, which provides greater isolation and fault isolation boundaries. Moving to a cell-based architecture requires more complexity and coordination, so we decided to start with NLB chaining and Route 53 weighted routing for immediate improvements and minimal re-architecture.

Looking forward, we plan to implement a cell-based architecture that aligns with Block’s compute strategy. This will consist of a cell management layer (to create, update, and delete cells) and a cell routing layer (to route requests to the correct cell), which allows for fine-grained traffic routing.

Enhancement 2: Using AWS FIS for Availability Zone power interruption

After moving to a dual-cluster topology, we researched ways to test ongoing platform resilience. Specifically, we wanted to test what would happen to our environment during single Availability Zone impairments and how our services and data stores would recover. This led us to AWS FIS, which we could use to conduct an Availability Zone power interruption scenario in our staging environment. AWS FIS is a fully managed service for running fault injection experiments on AWS infrastructure, making it straightforward to get started with chaos engineering. Chaos engineering is the practice of stressing an application in testing or production environments by creating disruptive events, such as a sudden increase in CPU or memory consumption, observing how the system responds, and implementing improvements.

Our initial AWS FIS experiment used multiple actions, including network disruption, database failover (targeting Amazon Aurora and Amazon ElastiCache clusters), and EKS worker node disruption (pod eviction and rescheduling). For the full list of AWS FIS actions, refer to AZ Availability: Power Interruption. For our initial experiment, we targeted infrastructure in a single staging account; however, AWS FIS supports multi-account experiments by setting up an orchestrator account that enables centralized configuration, management, and logging. The orchestrator account owns the AWS FIS experiment template. For future AWS FIS experiments, we plan to target more accounts and resources, operating within the constraints of AWS FIS quotas and limits.

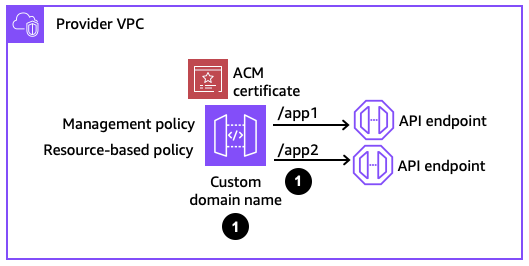
For clear communication during the AWS FIS experiment, our platform team coordinated with internal application stakeholders and our AWS account team, monitoring metrics to gauge failover and recovery responses. After the experiment, we debriefed with AWS teams and submitted product feature requests to support ongoing service evolution. Moving forward, we plan to conduct AWS FIS experiments at least twice a year to reinforce reliability best practices and adhere to ongoing regulatory requirements. We will also diversify the types of fault injection experiments we perform, and expand beyond the single Availability Zone failure tests. For example, we might introduce a capability that allows application teams to perform one-time AWS FIS experiments just for their service and backend database infrastructure in a controlled, self-service fashion. An added benefit of using AWS FIS is that there is no agent or infrastructure to deploy or manage, and you’re only billed for the duration of the experiment. This made it both straightforward and affordable to get started with chaos engineering. The following diagram illustrates the architecture of the Availability Zone power interruption scenario targeting subnets, compute, and database clusters.

AWS Fault Injection Service AZ Availability: Power Interruption scenario

AWS Fault Injection Service AZ Availability: Power Interruption scenario

Key considerations

Setting up the AWS FIS experiment required us to modify default service limits and quotas to accommodate the scale and scope, such as the number of target resources for ElastiCache, Amazon Relational Database Service (Amazon RDS), and subnets. We recommend reviewing the quotas, service limits, and supported services prior to conducting your own experiment, and collaborate with your AWS account team to achieve a seamless experience.

We also learned that certain failures, such as database failover, require more than network disruption actions alone—specific failover actions had to be configured in the AWS FIS experiment template to trigger the desired behavior, as outlined further in the service documentation. If you’re starting with the Availability Zone power interruption scenario, be sure to include all of the required actions to achieve the desired outcome. Finally, we recommend using AWS FIS in lower environments because AWS FIS actions will have real impact on the targeted resource state and availability.

Conclusion

Through these enhancements, Cash App has improved overall resilience posture and laid the groundwork for future improvements. On the Amazon EKS side, we aim to implement an ingress routing layer through cell-based architecture patterns, enabling more granular traffic routing and improved fault isolation boundaries. We will continue to use Karpenter for cluster automatic scaling, and are in the process of rolling out AWS Graviton based instances to further improve resource efficiency. Finally, we will continue using AWS FIS for chaos engineering at both the platform and application level, performing larger-scale AWS FIS experiments with more complexity.

For other blog posts and related resources, refer to:


About the authors

AWS Weekly Roundup: Claude 4 in Amazon Bedrock, EKS Dashboard, community events, and more (May 26, 2025)

Post Syndicated from Veliswa Boya original https://aws.amazon.com/blogs/aws/aws-weekly-roundup-claude-4-in-amazon-bedrock-eks-dashboard-community-events-and-more-may-26-2025/

As the tech community we continue to have many opportunities to learn and network with other like-minded folks. This past week AWS customers attended the AWS Summit Dubai for an action-packed day featuring live demos, hands-on experiences with cutting-edge AI/ML tools, and more. Right here in South Africa I attended the Data & AI Community in Durban for a day of inspiration and learning from the community. In India, the AWS Community Day Bengaluru brought together hundreds of passionate tech enthusiasts for a day of learning and networking.

Last week’s launches
Here are the launches that got my attention:

For a full list of AWS announcements, be sure to keep an eye on the What’s New with AWS? page.

Additional updates
Here are some additional projects, blog posts, and news items that you might find interesting:

Upcoming AWS events
Check your calendars and sign up for these upcoming AWS events:

  • AWS Summits – Join free online and in-person events that bring the cloud computing community together to connect, collaborate, and learn about AWS. Register in your nearest city: Tel Aviv (May 28), Singapore (May 29), Stockholm (June 4), Sydney (June 4–5), Washington (June 10-11), and Madrid (June 11).
  • AWS re:Inforce – Mark your calendars for AWS re:Inforce (June 16–18) in Philadelphia, PA. AWS re:Inforce is a learning conference focused on AWS security solutions, cloud security, compliance, and identity.
  • AWS Community Days – Join community-led conferences that feature technical discussions, workshops, and hands-on labs led by expert AWS users and industry leaders from around the world: Milwaukee, USA (June 5), and Nairobi, Kenya (June 14).

That’s all for this week. Check back next Monday for another Weekly Roundup!

Veliswa.

Centralize visibility of Kubernetes clusters across AWS Regions and accounts with EKS Dashboard

Post Syndicated from Micah Walter original https://aws.amazon.com/blogs/aws/centralize-visibility-of-kubernetes-clusters-across-aws-regions-and-accounts-with-eks-dashboard/

Today, we are announcing EKS Dashboard, a centralized display that enables cloud architects and cluster administrators to maintain organization-wide visibility across their Kubernetes clusters. With EKS Dashboard, customers can now monitor clusters deployed across different AWS Regions and accounts through a unified view, making it easier to track cluster inventory, assess compliance, and plan operational activities like version upgrades.

As organizations scale their Kubernetes deployments, they often run multiple clusters across different environments to enhance availability, ensure business continuity, or maintain data sovereignty. However, this distributed approach can make it challenging to maintain visibility and control, especially in decentralized setups spanning multiple Regions and accounts. Today, many customers resort to third-party tools for centralized cluster visibility, which adds complexity through identity and access setup, licensing costs, and maintenance overhead.

EKS Dashboard simplifies this experience by providing native dashboard capabilities within the AWS Console. The Dashboard provides insights into 3 different resources including clusters, managed node groups, and EKS add-ons, offering aggregated insights into cluster distribution by Region, account, version, support status, forecasted extended support EKS control plane costs, and cluster health metrics. Customers can drill down into specific data points with automatic filtering, enabling them to quickly identify and focus on clusters requiring attention.

Setting up EKS Dashboard

Customers can access the Dashboard in EKS console through AWS Organizations’ management and delegated administrator accounts. The setup process is straightforward and includes simply enabling trusted access as a one-time setup in the Amazon EKS console’s organizations settings page. Trusted access is available from the Dashboard settings page. Enabling trusted access will allow the management account to view the Dashboard. For more information on setup and configuration, see the official AWS Documentation.

Screenshot of EKS Dashboard settings

A quick tour of EKS Dashboard

The dashboard provides both graphical, tabular, and map views of your Kubernetes clusters, with advanced filtering, and search capabilities. You can also export data for further analysis or custom reporting.

Screenshot of EKS Dashboard interface

EKS Dashboard overview with key info about your clusters.

Screenshot of EKS Dashboard interface

There is a wide variety of available widgets to help visualize your clusters.

Screenshot of EKS Dashboard interface

You can visualize your managed node groups by instance type distribution, launch templates, AMI versions, and more

Screenshot of EKS Dashboard interface

There is even a map view where you can see all of your clusters across the globe.

Beyond EKS clusters

EKS Dashboard isn’t limited to just Amazon EKS clusters; it can also provide visibility into connected Kubernetes clusters running on-premises or on other cloud providers. While connected clusters may have limited data fidelity compared to native Amazon EKS clusters, this capability enables truly unified visibility for organizations running hybrid or multi-cloud environments.

Available now

EKS Dashboard is available today in the US East (N. Virginia) Region and is able to aggregate data from all commercial AWS Regions. There is no additional charge for using the EKS Dashboard. To learn more, visit the Amazon EKS documentation.

This new capability demonstrates our continued commitment to simplifying Kubernetes operations for our customers, enabling them to focus on building and scaling their applications rather than managing infrastructure. We’re excited to see how customers use EKS Dashboard to enhance their Kubernetes operations.

— Micah;

How to automate incident response for Amazon EKS on Amazon EC2

Post Syndicated from Jonathan Nguyen original https://aws.amazon.com/blogs/security/how-to-automate-incident-response-for-amazon-eks-on-amazon-ec2/

Triaging and quickly responding to security events is important to minimize impact within an AWS environment. Acting in a standardized manner is equally important when it comes to capturing forensic evidence and quarantining resources. By implementing automated solutions, you can respond to security events quickly and in a repeatable manner. Before implementing automated security solutions, it’s important for your security team to have a defined process and understanding of which actions to take for specific AWS resources.

In a previous two-part post, we discussed using Amazon GuardDuty and Amazon Detective to detect security issues for an Amazon Elastic Kubernetes Service (Amazon EKS) cluster. In this post, we walk through the differences of Amazon Elastic Cloud Compute (Amazon EC2) and EKS clusters on EC2 when responding to security events. By understanding the differences between the two AWS resource types, you can enhance your existing EC2 incident response (IR) automation to include EKS. Then, we walk you through the deployment and use of a sample solution based on the Automated Forensics Orchestrator for Amazon EC2 solution to automate the end-to-end incident response process for EKS, which includes acquisition, isolation, investigation and reporting.

If you’re familiar with the differences between responding and investigating Amazon EC2 and Amazon EKS resources and want to skip to the solution, skip to the Solution prerequisites.

Note: Amazon EKS on AWS Fargate, which is an AWS managed serverless computing engine, isn’t covered in this post.

Amazon EC2 compared to Amazon EKS resources for incident response

Although Amazon EKS clusters are running on EC2 instances, it’s important to understand the differences between the two and how to handle incident response automation for each resource type. EC2 is a virtual machine where you can install customized applications and packages to complete a task. Amazon EKS is an AWS managed service that you can use to run Kubernetes on EC2 instances without needing to install, operate, and maintain your own Kubernetes control plane or nodes. You can use existing plugins and tooling from the Kubernetes community. EKS clusters can have managed node groups, which create and manage the underlying EC2 instances. Because of Kubernetes cluster architecture, multiple EC2 instances within a node group can be tied to a single EKS cluster. There can also be multiple pods—each running different processes—running on an EC2 instance. GuardDuty can monitor and detect security events for EKS resources and provide information to help identify which resources are impacted, such as EKS cluster name, Kubernetes workload details, tags, and AWS Identity and Access Management (IAM) principals.

For incident response automation purposes, security teams need to understand the relationship between Amazon EKS and Amazon EC2 to determine the appropriate response to a possible security event. For example, if GuardDuty identifies Execution:Kubernetes/AnomalousBehavior.ExecInPod, you might want to investigate the command invoked on the identified pod along with other pods within the EKS cluster. To expand the investigation, you would need to capture and investigate evidence on the entire EKS cluster, which can include multiple EC2 instances.

Accessing Amazon EKS clusters using kubectl

To collect relevant forensic evidence, such as volatile memory, there might be instances where you need to run commands on Amazon EKS clusters. Kubectl is a command line tool that you can use to manage and run commands on EKS clusters using the Kubernetes API. Access with kubectl is limited to the container environment and doesn’t provide full shell access to the host. Although AWS Systems Manager (AWS SSM) can be used to interact with an EKS cluster’s EC2 instances, kubectl allows administrators to manage pods, scale applications, and view cluster logs. We dive into specific actions where kubectl is used in the later sections of this post.

When automating the workflow of response actions to an Amazon EKS cluster, you can incorporate the kubectl commands within Amazon Lambda functions. To invoke commands using kubectl, you need to get credentials for the EKS cluster to:

  1. Authenticate to an IAM principal authorized to work with Amazon EKS
  2. Obtain the EKS cluster endpoint
  3. Verify the certificate authority data for the EKS endpoint
  4. Generate a bearer token from the IAM principal
  5. Create a kubeconfig configuration dictionary

For more detailed information, see A Container-Free Way to Configure Kubernetes Using AWS Lambda and a deep dive into simplified Amazon EKS access management.

Capturing volatile memory on EKS

Volatile memory (RAM) in a memory dump is important because it contains the EC2 instance’s in-progress operations. Volatile memory is extremely important in determining the root cause of a security event. Although the commands for capturing volatile memory between EC2 instances and Amazon EKS clusters are similar, there is one important difference to keep in mind. For Linux operating systems, you can use the insmod command with the appropriate LiME kernel module (.ko file) to capture volatile memory:

sudo insmod $lime.ko "path=/path/to/dump.mem format=lime"

For Amazon EKS cluster EC2 instances, there can be multiple pods on a single EC2 instance. Knowing which process ID (PID) is associated to a pod is important to map the actions that could have resulted in a security event or compromise.

Figure 1: EKS cluster node list

Figure 1: EKS cluster node list

To get a list of PIDs on the EC2 instance, as shown in Figure 1, the following crictl command needs to be invoked:

crictl inspect $(crictl ps | grep [pod-name] | awk '{print $1}') | grep -i pid

After the crictl command is invoked, you will see the output of existing PIDs for the EC2 instance to use in the nsenter command, as shown in the following figure.

Figure 2: EKS node process ID list

Figure 2: EKS node process ID list

To create a mapping between a pod and the PID from a memory dump, the following nsenter command needs to be invoked on the target EC2 instance:

nsenter -t $PID -u hostname

After the nsenter command is invoked, you will see the output of pod and PID information for the EC2 instance, as shown in the following figure.

Figure 3: EKS node process ID to pod mapping commands

Figure 3: EKS node process ID to pod mapping commands

After you have the pod-to-PID mapping, you can export that information for later investigation. If you skip this step, the memory dump output will still have the PID information, but you won’t be able to map it back to previously running pods. It’s important to work with your security teams during forensic investigations to determine if this information is used during an investigation and update the automated workflow accordingly.

Network segmentation on EKS

After relevant forensic artifacts, such as volatile memory, disk volumes, and application logs, are collected from an Amazon EKS cluster, you might want to isolate compromised resources from the rest of your application resources. During resource isolation, EC2 instances can be isolated using security groups and network access control lists (NACLs). For EKS clusters, you can cordon the worker node, which makes the node tainted and unschedulable. When a node is cordoned, the Kubernetes scheduler is also blocked from placing new pods on the node. Another mechanism for isolating the EKS cluster is applying a Network Policy to deny ingress or egress traffic to the pod. Network policies, like NACLs, are stateless and control network traffic at the IP address or port level in an EKS cluster.

Depending on the scope of isolation, you can take the following approaches to isolating a pod on an EKS cluster in your automation.

  • Apply a network policy – You can add a network policy rule to limit ingress or egress from your pod. This will not impact other pods in the cluster unless there are additional rules applied. You would use this option if you’re sure that the compromise hasn’t gained access to the underlying EC2 instance.
  • Cordon the node – Removing the node won’t impact other nodes on the cluster but will block the scheduling of pods on the node. It doesn’t affect other nodes within the cluster.
  • Apply a security group – Applying a security group can impact the entire EC2 instance and limit traffic between Amazon EKS cluster nodes, the Kubernetes control plane, the cluster’s worker nodes, and external destinations. This is an option if you believe the underlying EC2 instance has been compromised.
  • Add a NACL rule – Like the security group option, this will impact the entire EC2 instance. Depending on the rule, it can also affect non-EKS workloads within the subnet.

Identity and access management for EKS

In addition to the IAM role associated to an EC2 instance profile, Amazon EKS uses service-linked IAM roles and Kubernetes role-based authorization control (RBAC) configuration. The IAM principal that creates the EKS cluster has system:masters permissions within the RBAC configuration on the EKS cluster. RBAC provides Kubernetes identities access for cluster-specific components and workflows. In addition to default identities created on EKS clusters, application-specific roles can be used within an EKS cluster. For example, IAM roles for service accounts (IRSA) can be used to associate an IAM role with a Kubernetes service account and assigned to containers within an EKS Pod. IRSA can help implement least privilege by restricting the Pod’s container to retrieve credentials for the IAM role associated with the Kubernetes service account. For a deeper dive into EKS IAM and how IAM roles are used within EKS, see Identity and access management for Amazon EKS.

Deciding how to revoke Amazon EKS permissions using automation can be challenging because revoking the AWS Security Token Service (AWS STS) credentials or changing the instance profile on the EC2 instance will impact all pods on the EC2 instance. Updating or changing the RBAC configurations on an EKS cluster requires application-specific knowledge to determine which identities are authorized to have specific permissions. It’s important to discuss with your application and security teams how permissions should be handled in the event of a compromised EKS cluster.

Moving to automated EKS incident response

Now that you understand the nuances of Amazon EKS on Amazon EC2 as it relates to incident response, you can decide how to incorporate functionality to respond to EKS in an existing solution your team might be using. It’s also important to understand where a human-in-the-loop needs to be incorporated to follow internal processes and procedures. Before incorporating automation into IR capabilities, you should walk through each step and verify the action the automation takes to make sure that the security and application teams are aligned. In this post, we incorporated Amazon EKS IR capabilities across acquisition, isolation, and investigation into the Automated Forensics Orchestrator for Amazon EC2 solution.

Solution prerequisites

For this walkthrough, you need to have the following elements in place:

Solution overview

The solution follows a similar pattern and workflow as the Automated Forensics Orchestrator for Amazon EC2 but has been customized for Amazon EKS.

Figure 4: Automated Forensics Orchestrator for Amazon EKS architecture

Figure 4: Automated Forensics Orchestrator for Amazon EKS architecture

The workflow, as shown in Figure 4, is:

  1. In the AWS application account, GuardDuty monitors for malicious activities that are specific to Amazon EKS resources. For example, a pod within an EKS cluster is invoking API commands using an unauthenticated system:anonymous user. GuardDuty findings are sent to Security Hub in the security account using native integration.
  2. Security Hub custom actions send finding information to Amazon EventBridge to invoke automated downstream workflows.
  3. For a specified event, EventBridge provides the EKS resource information for the forensics process to target and initiates an AWS Step Functions workflow.
  4. Step Functions triages the request as follows:
    1. Gets the EKS information, including which EC2 instances the pod is hosted on.
    2. Determines if isolation is required based on the Security Hub custom action.
    3. Determines if acquisition is required based on tags associated with the EC2 instance. The current tag that is evaluated is the following:
      • Tag name: IsTriageRequired
      • Tag key: true or false
    4. Initiates the acquisition flow based on triaging output
  5. Triaging details are stored in Amazon DynamoDB.
  6. The following two acquisition flows are initiated in parallel:
    1. Memory forensics flow – The Step Functions workflow captures the memory data and stores it in Amazon Simple Storage Service (Amazon S3). Post memory acquisition completion, the node is isolated by cordoning the node, creating a network policy, and applying a restricted security group to the cluster. To help maintain the chain of custody, a new security group is attached to the targeted instance and removes access for users, admins, or developers.
    2. Note: The isolation action is initiated based on the selected Security Hub custom action.

    3. Disk forensics flow – The Step Functions workflow takes a snapshot of the Amazon Elastic Block Storage (Amazon EBS) volume and shares it with the forensic account.
  7. Acquisition details are stored in DynamoDB.
  8. After the disk or memory acquisition process is complete, and the evidence has been captured successfully, a notification is sent to an investigation Step Functions state machine to begin the automated investigation of the captured data.
  9. The investigation Step Functions starts a forensic instance from a forensic AMI loaded with customer forensic tools:
    1. Loads the memory data from Amazon S3 for memory investigation.
    2. Creates an Amazon EBS volume from the snapshot and attaches it for disk analysis.
  10. Systems Manager documents (SSM documents) are used to run a forensic investigation.
  11. DynamoDB stores the state of the forensic tasks and their result when the jobs are complete. Investigation job details are stored in DynamoDB.
  12. Investigation details are shared with customers using Amazon Simple Notification Service (Amazon SNS).
  13. Forensic AMI is used by investigation Step Functions to perform memory and disk investigation.

Solution deployment

You can deploy the Amazon EKS IR automation solution using the AWS CDK or synthesizing a CDK into AWS CloudFormation templates and deploying them using AWS Management Console. Although the solution can be deployed in a single AWS account, the AWS Security Reference Architecture (AWS SRA) recommends that you use separate AWS accounts for forensic evidence and security tooling. The solution deployment follows AWS SRA recommendations.

The latest code for the Amazon EKS IR automation solution can be found at sample-eks-incident-response-automation, where you can also contribute to the sample code. For instructions and more information about using the AWS CDK, see Getting Started with AWS CDK.

Deploy the automation that collects, stores, and investigates forensic artifacts in the forensic AWS account:

  1. To build the app when navigating to the project’s root folder, use the following commands.
    • npm ci
    • npm run-build-lambda
  2. Run the following commands in your terminal while authenticated in your forensic solution AWS account. Be sure to replace <INSERT_AWS_ACCOUNT> with your account number and replace <INSERT_REGION> with the AWS Region that you want the solution deployed to.
  3. cdk bootstrap aws://<INSERT_AWS_ACCOUNT>/<INSERT_REGION>
    
    cdk deploy --all -c account=<INSERT Forensic AWS Account> -c region=<INSERT_FORENSIC_SOLUTION_REGION> --require-approval=never -c secHubAccount=<INSERT SECURITY_HUB_AGGREGATOR_AWS_ACCOUNT> -c STACK_BUILD_TARGET_ACCT=forensicAccount
    

    Example:

    cdk deploy —all -c account=1234567890 -c region=us-east-1 —require-approval=never -c secHubAccount=0987654321 -c STACK_BUILD_TARGET_ACCT=forensicAccount

Deploy the Security Hub custom action and EventBridge in the Security Hub Region of the delegated administrator account where security findings are consolidated:

  1. To build the app when navigating to the project’s root folder, use the following commands.
    • npm ci
    • npm run build-lambda
  2. Run the following commands in your terminal while authenticated in your Security Hub aggregator AWS account. Be sure to replace <INSERT_AWS_ACCOUNT> with your account number and replace <INSERT_REGION> with the AWS Region that you want the solution deployed to.
  3. cdk bootstrap aws://<INSERT_AWS_ACCOUNT>/<INSERT_REGION>
    	
    	cdk deploy --all -c account=<INSERT_SECURITY_HUB_AGGREGATOR_AWS_ACCOUNT> -c region=<INSERT_FORENSIC_SOLUTION_REGION> --require-approval=never -c forensicAccount=<INSERT_FORENSIC_SOLUTION_AWS_ACCOUNT> -c STACK_BUILD_TARGET_ACCT=securityHubAccount -c sechubregion=<INSERT_SECURITY_HUB_AGGREGRATOR_REGION>
    

    Example:

    cdk deploy --all -c account=0987654321 -c region=us-east-1 --require-approval=never -c forensicAccount=1234567890 -c STACK_BUILD_TARGET_ACCT=securityHubAccount -c sechubregion=us-east-1

Deploy the cross-account IAM role the security automation will use in the application AWS account where the EKS workload exists:

  1. Sign in to the AWS CloudFormation console of the application AWS account.
  2. Launch the CloudFormation cross-account-role.yml stack.
  3. Pass the following CloudFormation input parameters:
    1. solutionInstalledAccount=<Forensic Solution AWS Account Number>
    2. solutionAccountRegion=<Region of solution deployment>
    3. kmsKey=<ARN of the application account EBS volume encryption KMS key>

Use the solution to respond to an EKS GuardDuty alert

You can now use the automated solution on an Amazon EKS cluster with a GuardDuty finding that’s integrated with Security Hub. If you need to create GuardDuty findings, see How to generate security findings to help your security team with incident response simulations.

After you have an EKS security finding, you can go through either one of the IR workflows:

  • Forensic triage – This workflow evaluates in-scope EKS resources, collects volatile and non-volatile memory, conducts an investigation, and exports investigation artifacts to a forensic S3 bucket.
  • Forensic isolation – In addition to components of the previous workflow, the in-scope EKS resources are quarantined at the network and IAM layers.

In this example, you’ll use the forensic isolation workflow because that covers the end-to-end capabilities of the solution.

Run the forensic isolation workflow:

  1. Open the AWS Security Hub console in the Security Hub aggregator account.
  2. Choose Findings in the navigation pane and then select a security finding for Amazon EKS.
  3. Select the custom action for Forensic Isolation. This will start the workflow in the Security Hub aggregator account and invoke the Step Functions in the forensic account.
  4. Open the AWS Step Functions console in the forensic account.
  5. In the navigation pane, choose State Machines and then select the Forensic-Triage-Function to view the workflow graph status. In the following figure, the Step Functions workflow has successfully completed.
    Figure 5: EKS triage Step Functions graph view

    Figure 5: EKS triage Step Functions graph view

    1. In the Get Resource Info Case step, the pod name from the GuardDuty finding is extracted to identify the EKS cluster it’s part of and the related EC2 resources.
    2. Note: Per the solution, a guardrail is added to block action on an EC2 instance that is part of an EKS cluster with the IsTriageRequired tag with a value set to false. If automation is invoked against a protected EC2 instance resource, acquisitionFlow is skipped and a notification will be sent to the SNS topic.

  6. Because the EKS cluster isn’t excluded through the IsTriageRequired tag, a parallel invocation of Step Functions is invoked to capture forensic evidence.
  7. Select the Disk-Forensics-Acquisition-Function. The workflow here is similar to a normal EC2 incident response flow to capture snapshots and EBS volumes with the caveat that the EKS cluster can have multiple EC2 instances. In the following figure, the Step Functions workflow has successfully completed.
    Figure 6: Disk forensics acquisition Step Functions graph view

    Figure 6: Disk forensics acquisition Step Functions graph view

  8. Select the Memory-Forensics-Acquisition-Function; In the following figure, the Step Function workflow has successfully completed.
    Figure 7: Memory forensics acquisition Step Functions graph view

    Figure 7: Memory forensics acquisition Step Functions graph view

    1. As previously mentioned, you will need to determine if you want to map pods to process ID (PID) as part of this workflow. The automation captures the volatile memory where you will be able see the PIDs on the EC2 instance but does not map the PID to node for deeper investigation.
    2. Note: One reason you might not want to automatically map pods to PIDs is to minimize interaction with the possibly compromised cluster and quickly move towards isolation.

    3. After the Is Memory Acquisition Complete step is complete and if the Security Hub custom action for Forensic Isolation was selected, the isolation workflow of the EKS cluster begins. The isolation workflow will go through EKS-specific steps to:
      1. Label the affected pods on the EKS cluster.
      2. Apply a network policy to the affected pods.
      3. Revoke IAM role sessions.
      4. Cordon the node.
  9. Note: Depending on your desired workflow, you can edit these steps or add additional isolation steps to change instance profiles, security groups, or NACL rules.

  10. To expedite the investigation process, the Forensic-Investigation-Function is invoked when the Memory-Forensics-Acquisition-Function is completed and separately by the Disk-Forensics-Acquisition-Function. This is because of the disk and memory forensic evidence collection completing at different times. A forensic EC2 instance will be launched and begin conducting the investigation on the forensic artifacts. The completed investigation artifacts will be sent to Amazon S3 as they’re completed.
    1. You can use the console to view EKS artifacts within the dedicated S3 bucket in the forensic AWS account.
    2. Figure 8: Completed memory investigation artifacts for EKS

      Figure 8: Completed memory investigation artifacts for EKS

    3. The forensic investigation results from the automated workflow are also saved to the dedicated S3 bucket in the forensic AWS account.
Figure 9: Completed disk investigation artifacts for EKS

Figure 9: Completed disk investigation artifacts for EKS

As part of the automation, the forensic investigation EC2 instance in the forensic account is terminated after investigation is completed. The automation can be updated to retain the EC2 instance to so that your security teams can continue their investigation and review investigation artifacts to expedite root cause analysis.

As previously mentioned, the workflow you just went through encompasses both investigation and isolation of Amazon EKS resources. If your security teams want to conduct a more thorough investigation prior to isolating EKS resources, select the Forensic Triage custom action in Security Hub. Additionally, if you want to update the solution to be invoked from your security incident and event management (SIEM) tool, you can directly invoke the Forensic-Triage-Function Step Functions from your SIEM.

Clean up

For the cross-account IAM role in the application account, you can:

  1. Go to the AWS CloudFormation console for the application account and Region where you deployed the cross-account IAM role, select the cross-account-role stack.
  2. Choose the option to Delete the stack.

To clean up the CDK stacks, run the following command in the source folder in the Security Hub aggregator account and forensic account.

cdk destroy --all

Conclusion

In this post, we showed you the differences between Amazon EKS and Amazon EC2 resources and how to handle EKS automation for incident response. Even though EKS clusters are on EC2 instances, it’s important to understand the differences before implementing an automated solution that will affect EKS resources. We also walked through the deployment of an EKS-customized Automated Forensics Orchestrator for Amazon EC2 solution and showed you the end-to-end IR lifecycle to respond to a possible EKS compromise. The same approach to customize existing EC2 IR automated solutions can be used to expand support for EKS resources within your AWS environment to increase your security posture.

If you have feedback about this post, submit comments in the comments section that follows. If you have questions about this post, start a thread on re:Post.

Jonathan Nguyen
Jonathan Nguyen

Jonathan is a Principal Security Solution Architect at AWS. He helps large financial services customers develop a comprehensive security strategy and solutions to meet their security and compliance requirements in AWS.
Gopinath Jagadesan
Gopinath Jagadesan

Gopi is a Senior Solution Architect at AWS. In his role, he works with Amazon as his customer helping design, build, and deploy well architected solutions on AWS. He holds a master’s degree in electrical and computer engineering from the University of Illinois at Chicago. Outside of work, he enjoys playing soccer and spending time with his family and friends.

AWS Weekly Roundup: Amazon Nova Premier, Amazon Q Developer, Amazon Q CLI, Amazon CloudFront, AWS Outposts, and more (May 5, 2025)

Post Syndicated from Donnie Prakoso original https://aws.amazon.com/blogs/aws/aws-weekly-roundup-amazon-nova-premier-amazon-q-developer-amazon-q-cli-amazon-cloudfront-aws-outposts-and-more-may-5-2025/

Last week I went to Thailand to attend the AWS Summit Bangkok. It was an energizing and exciting event. We hosted the Developer Lounge, where developers can meet, discuss ideas, enjoy lightning talks, win SWAGs at AWS Builder ID Prize Wheel, take a challenge at Amazon Q Developer Coding Challenge, or learn Generative AI at Learn Amazon Bedrock booth.

Here’s a quick look:

Thank you to AWS Heroes, AWS Community Builders, AWS User Group leaders and developers for your collaboration.

Coming up next in ASEAN is AWS Summit Singapore—make sure you don’t miss it by registering now.

Last Week’s Launches
Here are some launches last week that caught my attention:

  • Amazon Nova Premier Now Generally Available — Amazon Nova Premier, our most capable model for complex tasks and teacher for model distillation, is now generally available in Amazon Bedrock. It excels at complex tasks requiring deep context understanding and multistep planning, while processing text, images, and videos with a 1M token context length. With Nova Premier and Amazon Bedrock Model Distillation, you can create highly capable, cost-effective, and low-latency versions of Nova Pro, Lite, and Micro, for your specific needs.

  • Amazon Q Developer elevates the IDE experience with new agentic coding experience — This new interactive, agentic coding experience for Visual Studio Code allows Q Developer to intelligently take actions on behalf of the developer. Amazon Q Developer introduces an interactive coding experience in Visual Studio Code, offering real-time collaboration for coding, documentation, and testing. It provides transparent reasoning, and supports automated or step-by-step changes in multiple languages.

  • New Foundation Models in Amazon Bedrock — Amazon Bedrock expands its model offerings with two significant additions:
    • Writer’s Palmyra X5 and X4 models feature extensive context windows (1M and 128K tokens respectively) and excel in complex reasoning for enterprise applications. They support multistep tool-calling and adaptive thinking with high reliability standards.
    • Meta’s Llama 4 Scout 17B and Maverick 17B models offer natively multimodal capabilities using mixture-of-experts architecture for enhanced reasoning and image understanding. They support multiple languages and extended context processing, with simplified integration through the Bedrock Converse API.
  • Second-Generation AWS Outposts Racks Released AWS announces the general availability of second-generation Outposts racks with significant enhancements including the latest x86 EC2 instances, simplified networking, and accelerated networking options. These improvements deliver doubled vCPU, memory, and network bandwidth, 40% better performance, and support for ultra-low latency workloads, making them ideal for demanding on-premises deployments.

  • Amazon CloudFront SaaS Manager Launches — Amazon CloudFront SaaS Manager helps SaaS providers and web hosting platforms efficiently manage content delivery across multiple customer domains. The service dramatically reduces operational complexity while providing high-performance content delivery and enterprise-grade security for every customer domain.

  • Amazon Aurora Now Supports PostgreSQL 17 — Amazon Aurora now supports PostgreSQL 17.4, offering community improvements and Aurora-specific enhancements like optimized memory management and faster failovers. The release includes new features for Babelfish, security fixes, and updated extensions, available in all AWS Regions.
  • CloudWatch Introduces Tiered Pricing for Lambda Logs — Amazon CloudWatch launches tiered pricing for AWS Lambda logs and new delivery destinations. Pricing in US East starts at $0.50/GB for CloudWatch and $0.25/GB for S3 and Firehose, both tiering down to $0.05/GB. This update enhances flexibility in log management across all supporting Regions.
  • RDS for MySQL Updates Minor VersionsAmazon RDS for MySQL now supports minor versions 8.0.42 and 8.4.5, delivering security fixes, bug fixes, and performance improvements. Users can upgrade automatically during maintenance windows or use Blue/Green deployments for safer updates.
  • Amazon Bedrock Model Distillation Generally AvailableAmazon Bedrock Model Distillation is now generally available, supporting new models like Amazon Nova and Claude 3.5. It enables smaller models to accurately predict function calling for Agents, delivering up to 500% faster responses and 75% lower costs with minimal accuracy loss for RAG use cases. The service includes automated workflows for data synthesis and student model training.
  • AI Search Flow Builder for Amazon OpenSearch Service Amazon OpenSearch Service now offers an AI search flow builder for OpenSearch 2.19+ domains. This low-code designer enables creation of sophisticated AI-enhanced search flows using AWS and third-party services, supporting use cases like RAG, query rewriting, and semantic encoding.

From Community.AWS
Here’s my personal favorites posts from community.aws:

Upcoming AWS events
Check your calendars and sign up for these upcoming AWS events:

  • AWS Summit — Join free online and in-person events that bring the cloud computing community together to connect, collaborate, and learn about AWS. Register in your nearest city: Poland (6 May), Bengaluru (May 7 – 8), Hong Kong (May 8), Seoul (May 14-15), Singapore (May 29), and Sydney (June 4–5).
  • AWS re:Inforce – Mark your calendars for AWS re:Inforce (June 16–18) in Philadelphia, PA. AWS re:Inforce is a learning conference focused on AWS security solutions, cloud security, compliance, and identity. You can subscribe for event updates now!
  • AWS Partners Events – You’ll find a variety of AWS Partner events that will inspire and educate you, whether you are just getting started on your cloud journey or you are looking to solve new business challenges.
  • AWS Community Days – Join community-led conferences that feature technical discussions, workshops, and hands-on labs led by expert AWS users and industry leaders from around the world: Yerevan, Armenia (May 24), Zurich, Switzerland (May 25), and Bengaluru, India (May 25).

You can browse all upcoming in-person and virtual events.

That’s all for this week. Check back next Monday for another Weekly Roundup!


How is the News Blog doing? Take this 1 minute survey!

(This survey is hosted by an external company. AWS handles your information as described in the AWS Privacy Notice. AWS will own the data gathered via this survey and will not share the information collected with survey respondents.)

AWS Weekly Review: Amazon EKS, Amazon OpenSearch, Amazon API Gateway, and more (April 7, 2025)

Post Syndicated from Sébastien Stormacq original https://aws.amazon.com/blogs/aws/aws-weekly-review-amazon-eks-amazon-opensearch-amazon-api-gateway-and-more-april-7-2025/

AWS Summit season starts this week! These free events are now rolling out worldwide, bringing our cloud computing community together to connect, collaborate, and learn. Whether you prefer joining us online or in-person, these gatherings offer valuable opportunities to expand your AWS knowledge. I will be attending the Summit in Paris this week, the biggest cloud conference in France, and the London Summit at the end of the month. We will have a small podcast recording studio where I will interview French and British customers to produce new episodes for the AWS Developers Podcast and le podcast 🎙 AWS ☁ en 🇫🇷.

Register today!

But for now, let’s look at last week’s new announcements.

Last week’s launches
At KubeCon London, we introduced the EKS Community Add-Ons Catalog, making it simpler for Kubernetes users to enhance their Amazon EKS clusters with powerful open-source tools. This catalog streamlines the installation of essential add-ons like metrics-serverkube-state-metricsprometheus-node-exportercert-manager, and external-dns. By integrating these community-driven add-ons directly into the EKS console and AWS command line interface (AWS CLI), customers can reduce operational complexity and accelerate deployment while maintaining flexibility and security. This launch reflects AWS’s commitment to the Kubernetes community, providing seamless access to trusted open-source solutions without the overhead of manual installation and maintenance.

Amazon Q Developer now integrates with Amazon OpenSearch Service to enhance operational analytics by enabling natural language exploration and AI-assisted data visualization. This integration simplifies the process of querying and visualizing operational data, reducing the learning curve associated with traditional query languages and tools. During incident responses, Amazon Q Developer offers contextual summaries and insights directly within the alerts interface, facilitating quicker analysis and resolution. This advancement allows engineers to focus more on innovation by streamlining troubleshooting processes and improving monitoring infrastructure.

Amazon API Gateway now supports dual-stack (IPv4 and IPv6) endpoints across all endpoint types, custom domains, and management APIs in both commercial and AWS GovCloud (US) Regions. This enhancement allows REST, HTTP, and WebSocket APIs, as well as custom domains, to handle requests from both IPv4 and IPv6 clients, facilitating a smoother transition to IPv6 and addressing IPv4 address scarcity. Additionally, AWS continues its commitment to IPv6 adoption with recent updates, including AWS Identity and Access Management (IAM) introducing dual-stack public endpoints for seamless connections over IPv4 and IPv6, and AWS Resource Access Manager (RAM) enabling customers to manage resource shares using IPv6 addresses. Amazon Security Lake customers can also now use Internet Protocol version 6 (IPv6) addresses via new dual-stack endpoints to configure and manage the service. These advancements collectively ensure broader compatibility and future-proofing of network infrastructure.

Amazon SES has introduced support for email attachments in its v2 APIs, enabling users to include files like PDFs and images directly in their emails without manually constructing MIME messages. This enhancement simplifies the process of sending rich email content and reduces implementation complexity. Amazon Simple Email Service (Amazon SES) supports attachments in all AWS Regions where the service is available.

Amazon Neptune has updated its Service Level Agreement (SLA) to offer a 99.99% Monthly Uptime Percentage for Multi-AZ DB Instance, Multi-AZ DB Cluster, and Multi-AZ Graph configurations, up from the previous 99.9%. This enhancement demonstrates the commitment AWS has to providing highly available and reliable graph database services for mission-critical applications. The improved SLA is now available in all AWS Regions where Amazon Neptune is offered.

For a full list of AWS announcements, be sure to keep an eye on the What’s New at AWS page.

Other AWS events
Check your calendar and sign up for upcoming AWS events.

AWS GenAI Lofts are collaborative spaces and immersive experiences that showcase AWS expertise in cloud computing and AI. They provide startups and developers with hands-on access to AI products and services, exclusive sessions with industry leaders, and valuable networking opportunities with investors and peers. Find a GenAI Loft location near you and don’t forget to register.

Browse all upcoming AWS led in-person and virtual events here.

That’s all for this week. Check back next Monday for another Weekly Roundup!

— seb

This post is part of our Weekly Roundup series. Check back each week for a quick roundup of interesting news and announcements from AWS!


How is the News Blog doing? Take this 1 minute survey!

(This survey is hosted by an external company. AWS handles your information as described in the AWS Privacy Notice. AWS will own the data gathered via this survey and will not share the information collected with survey respondents.)

Optimizing network footprint in serverless applications

Post Syndicated from Chris McPeek original https://aws.amazon.com/blogs/compute/optimizing-network-footprint-in-serverless-applications/

This post is authored by Anton Aleksandrov, Principal Solution Architect, AWS Serverless and Daniel Abib, Senior Specialist Solutions Architect, AWS

Serverless application developers may commonly encounter scenarios where they need to transport large payloads, especially when building modern cloud applications that need rich data. Examples include analytics services with detailed reports, e-commerce platforms with extensive product catalogs, healthcare applications transmitting patient records, or financial services aggregating transactional data.

Many serverless services have a well-defined maximum payload size. For example, AWS Lambda maximum request/response payload size is 6 MB, and Amazon Simple Queue Service (Amazon SQS) and Amazon EventBridge maximum message size is 256 KB. In this post, you will learn how to use data compression techniques to reduce your network footprint and transport larger payloads under existing constraints.

Overview

Cloud applications evolve continuously and need to be adjusted frequently for new requirements, such as new business features or new Service Level Objectives (SLO) for higher throughput and lower latency. As new use cases and data patterns are added, it is common to see request and response payload sizes increase. At some point, you might hit the maximum service payload size limits, such as 6 MB for synchronous Lambda function invokes, 10 MB for Amazon API Gateway, and 256 KB for Amazon SQS, EventBridge, and asynchronous Lambda invokes.

There are several techniques you can apply when dealing with large payloads. If your payloads are tens of MBs or more, or you need to transport large binary objects with API Gateway, you can store the payload on Amazon Simple Storage Service (Amazon S3) and use pre-signed URLs for clients to directly upload and download from S3.

A sample of architecture for handling large payloads.

Figure 1. A sample of architecture for handling large payloads

Lambda function URLs response streaming supports up to 20 MB responses. For handling large messages with services such as SQS or EventBridge, you can store the message in S3 and pass a reference. The downstream consumer will use the reference to download the message directly from S3. One common characteristic of these techniques is that they introduce architectural complexity and may necessitate modifications to your existing solution architecture and data flow patterns.

Furthermore, as your payloads grow in size, you will see increased data transfer costs, especially if your solution is transporting data through Amazon Virtual Private Cloud (VPC) NAT Gateways, VPC endpoints, or sending data across AWS Regions. For example, it is common for VPC-based solutions to have Lambda functions in their architecture. A container running on Amazon Elastic Kubernetes Service (Amazon EKS) might need to invoke a Lambda function, or a VPC-attached Lambda function might need to reach out to the public internet.

Examples of using virtual network appliances with serverless applications.

Figure 2. Examples of using virtual network appliances with serverless applications

Both NAT Gateway and VPC Endpoint are billed per GB of data processed, which makes data compression a valuable optimization technique. Go to NAT Gateway pricing and VPC Endpoint pricing for details.

The following sections explore data compression techniques and demonstrate how to apply them in your serverless applications. You can learn how to send larger payloads within the existing payload size boundaries and reduce your network footprint without significant architectural changes. This post discusses compression techniques in the context of Lambda and API Gateway, but the same principles can be applied to other services, such as SQS, EventBridge, and AWS AppSync. Understanding compression concepts better equips you to optimize your application’s data-handling capabilities.

What is data compression?

Compression is a widely used approach to reduce data size in order to improve cost-effectiveness and performance for data storage and transmission. Many tools and frameworks incorporate data compression techniques, such as gzip or zstd. It is thoroughly documented in the official IANA specification and IETF RFC 9110. Browsers such as Chrome and Firefox, HTTP toolkits such as curl and Postman, and runtimes such as Node.js and Python natively handle compression, often without user involvement.

Consider HTTP protocol. When a client wants to send a compressed payload, it specifies it in the Content-Type header. To receive a compressed response, the client specifies supported compression methods in the Accept-Encoding request header.

Accept-Encoding request header specifying supported compression methods.

Figure 3. Accept-Encoding request header specifying supported compression methods

The server compresses the response payload using one of the supported methods and uses the Content-Encoding response header to indicate the method to the client.

Content-Encoding response header specifying compression method.

Figure 4. Content-Encoding response header specifying compression method

This mechanism can accelerate client-server communications by reducing the number of bytes transmitted over the network. Compression efficiency depends on the data type. Text-based formats like JSON, XML, HTML, and YAML compress well, while binary data such as PDF and JPEG generally compress less effectively.

Data compression with API Gateway

API Gateway provides built-in compression support. Use the minimumCompressionSize configuration to set the smallest payload size to compress automatically. The value can be between 0 bytes to 10 MB. Compressing very small payloads might actually increase the final payload size, and you should always test with your real payload patterns to determine the optimal threshold.

Handling data compression in API Gateway.

Figure 5. Handling data compression in API Gateway

API Gateway enables clients to interact with your API using compressed payloads through supported content encodings. The compression mechanism works bi-directionally. For JSON payloads, API Gateway seamlessly handles compression and decompression, maintaining compatibility with mapping templates. It decompresses incoming payloads before applying request mapping templates and compresses outgoing responses after applying response mapping templates. This automated compression optimizes data transfer:

  • When sending compressed data, clients supply the appropriate Content-Encoding header. API Gateway handles the decompression and applies configured mapping templates before forwarding the request to the integration.
  • When API Gateway receives an integration response and compression is enabled, it compresses the response payload and returns it to the client, provided that the client has included a matching Accept-Encoding header.

A sample test using the compression technique with API Gateway and JSON payload yielded the following results.

  • Compression disabled. Response size = 1 MB, response latency = 660 ms
  • Compression enabled. Response size = 220 KB, response latency = 550 ms

Compressing data resulted in 78% network footprint reduction and improved latency by 110 ms.

This configuration-based technique uses the API Gateway native compression. However, payloads are decompressed before being delivered to downstream integrations, thus they still remain subject to Lambda’s 6 MB max payload size. To address this, you can configure binaryMediaTypes in the API Gateway to pass compressed payloads to Lambda directly, enabling the function to handle decompression.

CDK code to configure API Gateway for data compression and binary data passthrough.

Figure 6. CDK code to configure API Gateway for data compression and binary data passthrough

Handling compressed data in Lambda functions

The Lambda Invoke API supports payloads in plain-text formats, such as JSON. The maximum payload size is 6 MB for synchronous invocations and 256 KB for asynchronous. Although the Invoke API supports uncompressed text-based payloads, you can introduce data compression in your function code and use API Gateway or Function URLs to facilitate content conversion, as illustrated in the following figure.

Transporting compressed payloads in a serverless applications.

Figure 7. Transporting compressed payloads in a serverless applications

Handling data compression in your Lambda function code can be done through libraries commonly embedded in the runtime. The following code snippet shows the compressing response payload using Node.js. Similar techniques can be applied to other runtimes.

Sample code implementing response payload compression in a Lambda function.

Figure 8. Sample code implementing response payload compression in a Lambda function

  • Line 1: Import gzip functionality from the zlib module.
  • Lines 11: Compress and Base64-encode data. Gzip compression, similar to many other compression methods, produces a binary stream. Base64 encoding converts it to the text-based format expected by the Lambda service
  • Lines 13-21: Response object is created with isBase64Encoded=true and response headers telling the client that the response is a gzip-encoded JSON object.

The following screenshot shows the result: 20 MB uncompressed JSON returned from a Lambda function as a 2.5 MB compressed response body. Network footprint reduced by over 80%.

A screenshot from Postman showing the original and compressed payload size.

Figure 9. A screenshot from Postman showing the original and compressed payload size

Using this technique, you can reduce your network footprint and transport payload sizes several times higher than the Lambda maximum payload size.

Using Function URLs with compressed payloads

Transporting compressed payloads through Lambda Function URLs doesn’t necessitate any extra configuration. For handler responses, your code needs to compress and Base64-encode the data as shown in the preceding figure. For invocation requests, the Function URL endpoint recognizes the incoming compressed payload as binary and passes it to your handler as a Base64 encoded string in the event body.

Sample code implementing request payload decompression in a Lambda function.

Figure 10. Sample code implementing request payload decompression in a Lambda function

Trade-offs and testing results

Compressing data in function code is a CPU-intensive activity, potentially increasing invocation duration and, as a result, function cost. This, however, can be balanced by the benefits of data compression. As you’ve seen in previous sections, while compressing data adds compute latency, transporting smaller payloads over the network reduces network latency. The following section summarizes a series of tests performed to estimate the impact of data compression on Lambda function invocation duration, Lambda function invocation cost, and data transfer savings with both NAT Gateway and VPC Endpoint. The tests were performed with several assumptions and randomly generated JSON data. You can see full testing results in the sample GitHub.com repo.

Test results demonstrated that the impact on function latency and cost primarily depends on two key factors: payload size and allocated memory (which determines vCPU capacity). Using a Node.js runtime with ARM architecture as an example, compressing a 1 MB JSON object in a function with 1 GB of allocated memory resulted in 124 ms of added processing time on average. For 10 million invocations, this extra processing time adds approximately $16. At the same time, the compression yielded a 70% reduction in payload size. With the same number of invocations, this translates to approximately $300 in savings when using NAT Gateway and $70 in savings when using VPC Endpoints (depending on the number of Availability Zones (AZs)).

AWS Service pricing is updated regularly, you should always consult the respective pricing pages for the latest information. Moreover, you should conduct your own performance and cost estimates using payloads that represent your workloads. Compression effectiveness varies significantly depending on the data type: payloads with low compression rates might not benefit from this technique.

Sample application

Follow the instructions in this GitHub repository to provision the sample in your AWS account. The project creates two Lambda functions to demonstrate receiving and returning compressed JSON using Function URLs and API Gateway.

The sample shows how to GET and POST JSON payloads using gzip compression to reduce the network footprint by over 80%.

A screenshot from Postman showing the original and compressed payload size.

Figure 11. A screenshot from Postman showing the original and compressed payload size

Conclusion

Data compression enables larger payload transfers and reduces network footprint. It can help to lower network latencies and optimize data transfer costs. When implementing compression within Lambda functions, it is important to consider its CPU-bound nature, which may increase function duration and costs. You should always evaluate the added compute cost against potential data transfer savings to make sure the technique benefits your use case.

Compression is most effective for handling large text-based payloads and when a slight increase in compute latency balanced by reduced network latency is acceptable.

To learn more about Serverless architectures and asynchronous Lambda invocation patterns, see Serverless Land.

Manage authorization within a containerized workload using Amazon Verified Permissions

Post Syndicated from Manuel Heinkel original https://aws.amazon.com/blogs/security/manage-authorization-within-a-containerized-workload-using-amazon-verified-permissions/

Containerization offers organizations significant benefits such as portability, scalability, and efficient resource utilization. However, managing access control and authorization for containerized workloads across diverse environments—from on-premises to multi-cloud setups—can be challenging.

This blog post explores four architectural patterns that use Amazon Verified Permissions for application authorization in Kubernetes environments. Verified Permissions is a scalable permissions management and fine-grained authorization service for your applications.

In this blog post, we cover the following patterns and discuss their trade-offs:

  • Calling Verified Permissions from an Amazon API Gateway API fronting your application in Kubernetes
  • Calling Verified Permissions from a Kubernetes Ingress controller component
  • Calling Verified Permissions from a sidecar container running in the same pod as the application container
  • Calling Verified Permissions from the application container

Understanding these patterns and their implications can help you implement secure and consistent authorization mechanisms across your entire infrastructure without compromising the scalability, portability, and resource efficiency of your containerized workloads.

Consistent authorization through centralized policy management

Access to application resources can be secured more effectively with a centralized and consistent approach to authorization. Especially in containerized environments with distributed architectures and shared resources, traditional access control methods, like embedding authorization logic within individual application code or relying on local access control policies, can become difficult to manage and prone to errors. This becomes even more challenging when you have a combination of on-premises and cloud setups.

A centralized authorization solution empowers developers to implement consistent access control across individual components of an application efficiently. Benefits include reduced duplicate work, an improved security posture, and lower complexity in managing and enforcing access control policies.

Verified Permissions benefits in a containerized environment

Amazon Verified Permissions provides several key benefits as an external authorization service:

  • Benefits for the platform engineering team – Centralized authorization enables platform engineering teams to implement, maintain, and govern authorization policies across the organization without requiring changes to individual applications. This aligns with modern platform engineering practices, where platform engineering teams can provide authorization as a service to application teams, promoting consistent security standards while reducing the operational burden on development teams.
  • Consistent authorization across environments – With Verified Permissions, you can define and manage access control policies in a centralized location. This makes it easier to apply consistent authorization rules across your entire infrastructure, including on-premises deployments and different cloud environments.
  • Simplified application development – Externalizing authorization logic from applications reduces development complexity. Developers can focus on core application functionality without having to implement and maintain authorization mechanisms within each service or component. This separation of concerns promotes code modularity, reusability, and faster iteration cycles.
  • Scalable and highly available – Verified Permissions is a managed service, designed to be scalable and highly available out of the box. As your containerized workloads grow in scale and complexity, Verified Permissions can handle increasing authorization request volumes while maintaining performance and availability.
  • Fine-grained access control – Verified Permissions supports attribute-based access control (ABAC) and role-based access control (RBAC). This allows you to define granular policies in the open source Cedar language based on various attributes like user roles, resource properties, environmental factors, and more.

Integration patterns for authorization

Kubernetes provides many options for architecting applications. Therefore, there are multiple locations in a typical architecture where authorization decisions can be enforced, as shown in Figure 1.

Figure 1: Integration points for authorization in containerized workloads

Figure 1: Integration points for authorization in containerized workloads

The workflow is as follows:

  1. API Gateway. Organizations can use entry points to the application outside of the Kubernetes cluster, such as an API gateway, to obtain an authorization decision. In AWS, Amazon API Gateway enables customers to use authorizer Lambda functions to send an authorization request to Verified Permissions.
  2. Ingress controller. The Kubernetes API defines Ingress objects, which provide load balancing and routing functions on layer 7. Common Ingress controllers like Traefik offer the option to integrate external authorization services.
  3. Sidecar proxy container. You can intercept every request routed to the application by using a sidecar container running in the same pod as the application container. This sidecar container calls Verified Permissions for authorization decisions.
  4. Application container. Developers can use the Amazon SDK to communicate with Verified Permissions from inside the application when an authorization decision is needed.

In the following sections, we explore each of these patterns in detail, examining their implementation, use cases, and specific considerations. At the end of our discussion, we provide a comprehensive comparison table to help you choose the most appropriate pattern based on factors such as scalability, performance, maintenance overhead, and specific use case requirements. This will help you make an informed decision about which pattern best suits your application’s needs.

Authorization workflow

Independent of which of the four mentioned options for authorization you choose, the overall authorization workflow, shown in Figure 2, will stay the same.

Figure 2: Authorization workflow with Amazon Verified Permissions

Figure 2: Authorization workflow with Amazon Verified Permissions

The workflow is as follows:

  1. Authentication. The user first authenticates with an identity provider to obtain a JSON Web Token (JWT). You can configure the identity provider to write relevant information like user roles, tenant ID, or other needed user attributes into the JWT. You can then use this information later to make an authorization decision.
  2. API request. The user makes a request to your application that includes the JWT.
  3. Authorization information. Your application extracts the relevant information that is needed to make an authorization decision from the request. This can include principal information from the JWT, information about the resource that the user requests, and what action the user wants to perform.
  4. (Optional) Policy information point lookup. Depending on your policies, you might need additional information in order for Verified Permissions to make an authorization decision. For example, you can query ownership details for a document from a database.
  5. Authorization decision. You then send the relevant information to Verified Permissions, which returns a decision stating whether the request is permitted or forbidden.
  6. Authorization enforcement. You then enforce the decision from Verified Permissions in your application by allowing or denying an action. For a REST API, this would result in sending back an HTTP 403 forbidden status if the request was denied, or processing the request if it was allowed and sending an HTTP 200 OK status.

Authorization outside of the cluster by using Amazon API Gateway

In this pattern, authorization decisions are made at the API gateway layer before requests reach the Kubernetes cluster. When a request arrives at the API gateway, it triggers an authorization check with Verified Permissions to evaluate the request against defined policies. Based on the Verified Permissions response, the gateway either forwards the request to the containerized application or denies access.

This pattern excels in scenarios where you need coarse-grained access control that can be enforced with information accessible at the API level (such as an HTTP header or ID or access token) and that supports RBAC and ABAC. Consider a document management application where different users have access to different documents based on group membership or identity attribute.

This approach to authorization works consistently regardless of whether your application runs in containers, virtual machines, or serverless environments. The API gateway acts as a unified control point for enforcing access policies across backend services.

For implementations that use Amazon API Gateway specifically, you can use Lambda authorizers to integrate with Verified Permissions. For each incoming API request, API Gateway invokes the authorizer Lambda function, which makes a call to Verified Permissions to evaluate the request against the defined authorization policies, as shown in Figure 3.

Figure 3: Integration of Amazon Verified Permissions in Amazon API Gateway

Figure 3: Integration of Amazon Verified Permissions in Amazon API Gateway

AWS provides a quick-start solution that demonstrates this integration by using Amazon API Gateway and Amazon Cognito, making it easier to implement this pattern. The setup process is detailed in the blog post Authorize API Gateway APIs using Amazon Verified Permissions and Amazon Cognito or bring your own identity provider.

Authorization in a Kubernetes Ingress

Another option to implement coarse-grained access control in use cases as described in the previous section is to use a Kubernetes Ingress layer. Some customers prefer Kubernetes-native solutions, especially if they need to run Kubernetes clusters within and outside of AWS.

Kubernetes provides an API to create and maintain Ingress objects, operating at layer 7 (the application layer), which enables routing decisions based on HTTP attributes. This layer 7 capability makes Ingress controllers ideal for implementing authorization checks.

One Kubernetes Ingress controller that supports external authorization is Traefik Proxy. With this feature, you can delegate authorization decisions to an external service like Verified Permissions before routing requests to the application container.

Assuming that the authorization endpoint is backed by a service in the same Kubernetes cluster, the architecture looks as shown in Figure 4.

Figure 4: Integration of Amazon Verified Permissions in a Kubernetes Ingress

Figure 4: Integration of Amazon Verified Permissions in a Kubernetes Ingress

The workflow is as follows:

  1. Authenticated users access the service through an Elastic Load Balancer of type Network Load Balancer (NLB).
  2. The NLB—operating at layer 4—exposes a Kubernetes Ingress inside the cluster that provides layer 7 capabilities. The Ingress object is implemented by an Ingress controller that supports external authorization, as described earlier.
  3. The Ingress forwards the request—or parts of it—that needs authorization to a local authorization service in the cluster. We use a dedicated authorization service in this architecture because the Ingress backend service allows an external endpoint to be called for authorization.
  4. The authorization service is deployed into its own Kubernetes namespace with a dedicated Kubernetes service account. EKS Pod Identity provides the ability to link the service account in this namespace to an AWS Identity and Access Management (IAM) role that grants access to Verified Permissions by injecting temporary AWS access credentials into the pod at runtime.
  5. The authorization service extracts relevant information from the request and sends it to Verified Permissions for an authorization decision.
  6. The Ingress for the backend service awaits the response of the authorization service and forwards it to the backend service, if access is granted. The Ingress expects the authorization service to respond with HTTP status code 200 for authorized requests. If the Ingress receives HTTP status code 403, the requester is not allowed to access the requested resource, and the Ingress will block the request at this stage.
  7. Only authorized requests are forwarded to registered backend pods.

Because integration with external authorization services is not part of the Kubernetes Ingress API, you need to consult the documentation of the Ingress controller that you decide to use to determine the availability of this feature and its implementation details. Forward authentication of the Traefik Kubernetes Ingress supports this pattern and can be configured with the vendor-specific annotations described in the Traefik documentation.

Authorization in sidecar containers

Not all Ingress controllers support integration with an external authorization service. Amazon Elastic Kubernetes Service (Amazon EKS) customers might prefer the AWS Load Balancer Controller to manage the lifecycle of NLBs and ALBs for their services. Customers can continue using their existing Ingress controller, even if it does not support calling external authorization services today. You can move the authorization of requests behind the Ingress layer with the sidecar container pattern.

Sidecar containers are a common pattern for extending an application’s functionality in Kubernetes. A sidecar is a container running in the same pod as the application it relates to. This means that the sidecar and application follow the same lifecycle and share resources, such as the network ID. This pattern is a good fit when the authorization logic is service-specific. Because the authorization service is deployed alongside the application, this pattern also provides better support in situations where changes to the application demand changes in the authorization logic.

Consider a document management system where access control depends on document metadata and team structures. When a user attempts to edit a document, the sidecar queries the document’s metadata, such as the classification level, tags, and department ownership. The sidecar can also check the organizational team hierarchy to understand reporting relationships and access privileges. This context enables fine-grained authorization decisions that consider not just who the user is, but also, for example, their organizational context or the individual document’s metadata.

Although it’s possible to configure sidecar proxies such as Envoy for individual pods manually, the more convenient option is to introduce a service mesh. A service mesh provides a control plane to manage proxies, including centralized configuration, automated injection of sidecars, and an Ingress layer for traffic routing. Istio is a popular option for a service mesh in Kubernetes.

The diagram in Figure 5 shows the deployment architecture to implement authorization with Verified Permissions in a service mesh.

Figure 5: Integration of Amazon Verified Permissions in a Kubernetes Ingress

Figure 5: Integration of Amazon Verified Permissions in a Kubernetes Ingress

The workflow is as follows:

  1. Authenticated users access the application through an NLB.
  2. The request is routed through an Ingress in the Kubernetes cluster.
  3. The Ingress forwards the request directly to the backend service.
  4. Pods of the backend service consist of multiple containers. Each request is routed through an Envoy proxy first.
  5. The Envoy proxy forwards the request to a co-located container running the authorization service.
  6. Pod Identity is used to map an IAM role to a Kubernetes service account bound to the pod, which enables the authorization sidecar to invoke Verified Permissions for an authorization decision. Note that each container in this pod has access to the IAM credentials that are mapped to the service account.
  7. The Envoy proxy awaits the response of the authorization sidecar and blocks or forwards the request to the backend container, depending on the Verified Permissions authorization decision.

When Istio is deployed into a Kubernetes cluster, it introduces Custom Resource Definitions (CRDs) for managing the service mesh. The authorization workflow can be implemented using the ServiceEntry CRD and an Istio Authorization Policy. The authorization service running as a local container in the application pod becomes a registered service entry in the mesh. This service entry can then be configured in an authorization policy as the target for request authorization in the proxy. For more details, see the External Authorization section in the Istio documentation.

Application container

When it comes to integrating Verified Permissions directly within your application container, you have the advantage of fine-grained control over authorization decisions at the application level. This approach allows for more context-aware authorization checks and can be useful when you need to make authorization decisions based on application-specific data that you can query from a policy information point.

Unlike the sidecar pattern, where authorization happens before the request reaches your application code, this approach lets you gather the necessary context from your application state, databases, or other services before making the authorization call. This is particularly valuable when the authorization logic is deeply intertwined with business logic or requires data that’s only available within the application context. This pattern also supports minimizing the number of authorization requests, if, for example, only a subset of requests processed by a monolithic service require authorization.

However, it’s important to note that this tight coupling between authorization and business logic makes the system more brittle and susceptible to breakage when functional or business logic changes occur. This means that modifications to your application code might require careful consideration of their impact on the authorization logic, potentially increasing maintenance complexity.

The architecture for authorization requests from the application container is shown in Figure 6.

Figure 6: Integration of Amazon Verified Permissions in the application container

Figure 6: Integration of Amazon Verified Permissions in the application container

The workflow is as follows:

  1. Authenticated users access the application through an Elastic Load Balancer—either Application Load Balancer (ALB) or NLB depending on workload requirements.
  2. The Kubernetes service or Ingress for the backend application is directly registered at the ALB or NLB by the AWS Load Balancer Controller.
  3. Requests are directly routed to a pod that is backing the service.
  4. The backend application’s logic is responsible for identifying whether a request needs authorization. The backend uses an IAM role injected at runtime through Pod Identity, when an authorization decision from Verified Permission is needed. The backend application returns HTTP status code 403 if the decision is a deny; otherwise it will continue processing the request.

See the Simplify fine-grained authorization with Amazon Verified Permissions and Amazon Cognito blog post for details on calling Verified Permissions within an application.

Choosing the right pattern for your app

You now have a set of patterns to introduce authorization into your containerized workloads. You need to consider multiple factors and understand the trade-offs that come with each pattern to identify the best option for a given scenario. In the following table, we list certain areas with influence on your architectural decisions.

Granularity of authorization decisions
API gateway
  • Authorization on API or service level
  • Decision based on information from HTTP request
  • Suitable for consistent coarse-grained authorization
Ingress controller
  • Authorization on API or service level
  • Decision based on information from HTTP request
  • Suitable for consistent coarse-grained authorization
Sidecar proxy
  • Authorization on service level
  • Decision based on information from HTTP request and service domain (such as policy information point or static service-specific rules)
  • Suitable for service-specific authorization with low or mid-level complexity for decisions
Application container
  • Authorization on code level
  • Decision based on information from HTTP request and arbitrary business logic
  • Suitable for highly complex decision logic
Resource overhead
API gateway
  • No cluster resources needed for authorization
  • Unauthorized requests don’t consume cluster resources
Ingress controller
  • Central Ingress pods consume cluster resources
  • Unauthorized requests don’t consume application pod resources
Sidecar proxy
  • Authorization services increases resource demand of each pod in the cluster
  • Unauthorized requests consume application pod resources
Application container
  • Authorization service consumes resources only when authorization is performed
  • Unauthorized requests consume CPU cycles of application logic until the authorization logic is triggered
Scalability
API gateway
  • Fully managed serverless service
Ingress controller
  • Scaling of Ingress pods needs to be defined
  • Cluster auto-scaling or capacity planning for compute resources in cluster needed
Sidecar proxy
  • Existing scaling policies can be leveraged
Application container
  • Existing scaling policies can be leveraged
Performance
API gateway
  • Invokes Verified Permission in AWS for each request that needs authorization
  • Supports caching to reduce number of requests to Verified Permission out of the box
Ingress controller
  • Invokes Verified Permission in AWS for each request that needs authorization
  • (Optional) Integration of avp-local-agent to minimize number of requests to Verified Permissions
Sidecar proxy
  • Invokes Verified Permissions in AWS for each request that needs authorization
  • (Optional) Integration of avp-local-agent to minimize number of requests to Verified Permissions
Application container
  • Invokes Verified Permissions in AWS only if the business logic processing a request requires authorization
  • (Optional) Integration of avp-local-agent to minimize number of requests to Verified Permissions
Cost
API gateway
  • Consumption-based costs depending on requests received and data transferred out, and optionally cache size
  • Consumption-based costs to invoke Verified Permissions
  • Enabling a cache potentially reduces costs per requests
Ingress controller
  • Adds to infrastructure costs depending on the underlying compute resources needed to run the fleet of pods for Ingress and authorization service
  • Consumption-based costs to invoke Verified Permissions, which can be minimized by integrating avp-local-agent
Sidecar proxy
  • Adds to infrastructure costs depending on the underlying compute resources needed to run the sidecar containers for the proxy and authorization service in each pod
  • Consumption-based costs to invoke Verified Permissions, which can be minimized by integrating avp-local-agent
Application container
  • Typically minimal additional costs, since authorization code shares the application’s resources
  • Consumption-based costs to invoke Verified Permissions, which can be minimized by integrating avp-local-agent
Portability
API gateway
  • Portability is limited and depends on API Gateway with functionality for custom authorization
Ingress controller
  • Portable across Kubernetes environments with Ingress controller supporting external authorization
Sidecar proxy
  • Portable across Kubernetes environments
Application container
  • Highly portable without dependencies to underlying components
Complexity
API gateway
  • Offered as central component by platform engineering team to offload complexity of authorization from product teams
  • Changes in authorization service impact product teams
Ingress controller
  • Offered as central component by platform engineering team to offload complexity of authorization from product teams
  • Changes in authorization service impact product teams
Sidecar proxy
  • Platform engineering teams provide standardized patterns (and optionally implementation) for authorization that can be integrated and implemented by product teams
  • Increases autonomy of individual teams
Application container
  • Full responsibility for authorization lies with the product teams
  • Increases autonomy of individual teams

Not all services have the same requirements for authorization. You can also combine the patterns discussed in this post. You can, for example, put a basic authorization workflow with coarse-grained access control in front of the majority of your services. You can then rely on sidecar proxies with policy information points to inject additional, dynamic context into authorization decisions for specific services. Lastly, if certain use cases of a service demand complex authorization decisions, you can fall back to application-level authorization for specific parts of your code base.

Conclusion

In this blog post, we explored four patterns for integrating Verified Permissions into a containerized environment. We discussed the benefits and considerations of implementing Verified Permissions at different levels: from an API gateway outside of Kubernetes clusters, by means of Ingress controllers and sidecar proxies as network components inside the Kubernetes cluster, to authorization within the application itself. We saw how each pattern offers unique advantages. We also discussed considerations for finding a suitable option for your situation and when to combine patterns.

By using Verified Permissions, organizations can implement consistent, fine-grained authorization across their containerized workloads, whether they’re running on-premises, in the cloud, or in hybrid environments. This centralized approach to authorization can enhance security and simplify policy management and application development.

To learn more about implementing these patterns and best practices, visit the Amazon Verified Permissions User Guide. For hands-on experience, we recommend exploring the Verified Permissions workshop, which provides practical examples and guided exercises.

 
If you have feedback about this post, submit comments in the Comments section below. If you have questions about this post, contact AWS Support.
 

Manuel Heinkel
Manuel Heinkel

Manuel is a Solutions Architect at AWS, working with software companies in Germany to build innovative and secure applications in the cloud. He supports customers in solving business challenges and achieving success with AWS. Manuel has a track record of diving deep into security and SaaS topics. Outside of work, he enjoys spending time with his family and exploring the mountains.
Markus Kokott
Markus Kokott

Markus is a Senior Solutions Architect at AWS, specializing in guiding software companies to become successful SaaS providers. With over a decade of experience in consulting as well as designing, building, and operating software products, he excels in bridging the gap between business and technology. Markus is passionate about containers, platform engineering, and DevOps in general, using his expertise to drive innovation and efficiency.

How Nielsen uses serverless concepts on Amazon EKS for big data processing with Spark workloads

Post Syndicated from Shani Adadi Kazaz original https://aws.amazon.com/blogs/architecture/how-nielsen-uses-serverless-concepts-on-amazon-eks-for-big-data-processing-with-spark-workloads/

Nielsen Marketing Cloud, a leading ad tech company, processes in one of their pipelines 25 TB of data and 30 billion events daily. As their data volumes grew, so did the challenges of scaling their Apache Spark workloads efficiently.

Nielsen’s team faced a scenario in which, as they scaled up their cluster by adding more instances, the performance per instance degraded. The degradation resulted in a decrease in the amount of work done per hour by each instance, and drove costs per GB of data processed up.

Furthermore, they encountered occasional data skew issues. Data skew, where data is unevenly distributed across partitions, created processing bottlenecks and further reduced cluster efficiency. In extreme cases, these combined factors led to cluster failures.

In this post, we follow Nielsen’s journey to build a robust and scalable architecture while enjoying linear scaling. We start by examining the initial challenges Nielsen faced and the root causes behind these issues. Then, we explore Nielsen’s solution: running Spark on Amazon Elastic Kubernetes Service (Amazon EKS) while adopting serverless concepts.

Evolving from a Spark cluster to Spark pods on Amazon EKS

Nielsen’s Marketing Cloud architecture began as a typical Spark cluster on Amazon EMR, receiving a constant stream of files of varying sizes to process. As both data volume and cluster size grew, the team noticed a degradation in performance per instance, as illustrated in the following graphs. Beyond the slower processing and the higher costs, Nielsen occasionally suffered production issues caused by data skew.

GB/Instance/Hour Compared to Cluster SizeCost to Process 1 GB of Data

The team realized the problem was the growing number of remote shuffles between instances as the cluster grew. Remote shuffle, a process in Spark where data is redistributed across partitions, involves significant data transfer over the network and can become a major bottleneck. Due to the streaming nature of the data in their scenario, Nielsen realized they could instead process data in smaller batches. This meant they didn’t have to lean on the distributed processing capabilities of Spark by using large Spark clusters, and opt for small ones instead.

To address the performance degradation, the team decided to change its growth strategy: instead of scaling up their single Spark cluster, they scaled out using multiple local mode Spark clusters (a single node cluster) running on Amazon EKS. When compared to Spark cluster mode, local mode provides better performance for small analytics workloads. Each local mode is running a limited, smaller amount of data, requiring no remote shuffle and no interaction with other Spark instances.

Moreover, the pods running on Amazon EKS can scale up and down based on the amount of pending work, meaning Nielsen could stop resources when they are not needed.

The new solution scales linearly, is 55% cheaper, and handles data faster, even under large burst conditions.

Why shuffle matters

Remote shuffle is triggered when data needs to be exchanged between Spark instances. Some transformations, like join or repartition, necessitate a shuffle of data. Remote shuffle is an order of magnitude slower than in-memory computations because it requires moving data over the network. It could slow down processing significantly, sometimes adding 100–200% to the total processing time.

The problem Nielsen ran into was that as cluster size grew, the amount of data shuffled grew proportionally to the cluster size. The following graph shows why this happens. It calculates the amount of data exchanged for a randomly distributed dataset as cluster size grows.

The following graph illustrates that the correlation is to the size of the cluster and not to the size of the data.

% of Data Shuffled vs Cluster Size

Addressing shuffle

The team hypothesized that minimizing shuffle could lead to substantial performance improvements. Nielsen’s engineers decided to implement ideas from serverless patterns by drastically reducing the size of each cluster to a minimum while at the same time adding more of these smaller clusters to compensate for the lower capacity of each one. This approach promised to eliminate remote shuffle entirely for each data work item, as illustrated in the preceding graph.

Although this strategy promised performance gains, it also introduced a constraint: a limit on the amount of data per work item.

Designing the new system based on serverless patterns

Nielsen’s team developed a new architecture that uses two core concepts:

  • A queue of work items to pull from
  • A group of local mode Spark modules pulling work items from the queue

They had the following design goals:

  • Keep the Spark modules busy at all times
  • Stop modules when not needed
  • Make sure all work items are processed successfully

The following diagram illustrates the workflow.

Work items Queue

Final design

The final design includes the following components:

  • File metadata storage – An Amazon Relational Database Service (Amazon RDS) cluster runs the PostgreSQL engine to store and manage statistics about each file entering the system.
  • Work manager – An AWS Lambda function is used to periodically pull waiting files from the database, prepare work items comprised of one or multiple files, and publish the work items to an Amazon Simple Queue Service (Amazon SQS) message queue.
  • Work queue – An SQS message queue is used for work items waiting to be pulled for processing.
  • Processing units – Local mode Spark instances run as pods on an EKS cluster. They pull work items from the SQS queue. As long as there are waiting work items in the queue, the pods are constantly busy.
  • Metrics adaptor – An adaptor (Kubernetes-cloudwatch-adapter) provides Amazon CloudWatch metrics to the Kubernetes Horizontal Pod Autoscaler.
  • Kubernetes Horizontal Pod Autoscaler – Horizontal Pod Autoscaler (HPA) uses a scaling rule to scale pods up or down based on the metrics from CloudWatch. It scales according to the number of messages (work items) visible in the queue, which are proportional to the work waiting to be processed. In Nielsen’s system, HPA scales the pods by targetValue = {SQS length/2}. .
  • Work completion queue – A second SQS message queue is used for reporting completion of work items. The completions get pulled by another Lambda function and get updated in the PostgreSQL database.

The following diagram illustrates the architecture of the final system.

Full architecture

⁠Analyzing the results

The following graphs demonstrate the EKS pods scaling based on the amount of work items. The active pods pick up new work items as soon as they finish their previous ones.

Analyzing - Messages and Spark Pods

The following graph shows a large burst of data coming in. The system reacts quickly and scales up to process the added work. It quickly scales down when work is complete.

Analyzing - Messages, Spark Pods and EC2 Instances

Analyzing the performance achieved per instance, the new system demonstrated a significant improvement. Performance per instance increased by approximately 130% while growing linearly and maintaining close to constant costs per GB processed.

The comparison of performance between the new system and the old system can be seen in the following graph.

Throughput - MB/Hour

The new system’s costs are 55% lower for the same amount of data processed.

The following graphs compare the costs before and after the implementation.

Cost Comparison

Conclusion

Nielsen’s journey from a traditional architecture to a serverless-inspired architecture on Amazon EKS exemplifies the power of rethinking established patterns in big data processing.

By addressing the core challenges of data shuffle and scaling, Nielsen not only achieved performance gains and cost reductions, but also demonstrated the potential for linear scaling in large-scale data operations.

If you have big data processing jobs that that can be broken down into many independent small parts, consider using similar ideas over Amazon EKS to achieve linear scaling and large cost savings.

This post was copyedited for grammar, spelling, capitalization, punctuation, terminology, and legal issues. Other important issues are noted in comments, and you should consider revising the content accordingly before publication.


About the Authors

Top Architecture Blog Posts of 2024

Post Syndicated from Andrea Courtright original https://aws.amazon.com/blogs/architecture/top-architecture-blog-posts-of-2024/

Well, it’s been another historic year! We’ve watched in awe as the use of real-world generative AI has changed the tech landscape, and while we at the Architecture Blog happily participated, we also made every effort to stay true to our channel’s original scope, and your readership this last year has proven that decision was the right one.

AI/ML carries itself in the top posts this year, but we’re also happy to see that foundational topics like resiliency and cost optimization are still of great interest to our audience.

(By the way, if you were hoping for more AI/ML content, head on over to our sister channel, the AWS Machine Learning Blog!).

Without further ado, here are our top posts from 2024!

#10 Deploy Stable Diffusion ComfyUI on AWS elastically and efficiently

This post helps you get started using ComfyUI, and was so successful that we followed it up later in the year with How to build custom nodes workflow with ComfyUI on EKS!

Architecture for deploying stable diffusion on ComfyUI

Figure 1. Architecture for deploying stable diffusion on ComfyUI

#9 Let’s Architect! Designing Well-Architected systems

In keeping with Let’s Architect! series, we have our first of three favorites for the year. This set of resources helps you apply Well-Architected standards in practice.

Let's Architect

Figure 2. Let’s Architect

#8 Let’s Architect! Learn About Machine Learning on AWS

As I said, Let’s Architect! has a winning series, and they’ve got a finger on the pulse of the tech world. This post about machine learning showcases some of the most exciting things happening at AWS.

Let's Architect

Figure 3. Let’s Architect

If you’re more interested in generative AI, you can also take a look at another post from 2024: Let’s Architect! GenAI

#7 Creating an organizational multi-Region failover strategy

Preparedness is another common theme in this year’s favorites. Michael, John, and Saurabh are well-versed in multi-Region architecture, and they’re here to share some strategies to contain failure impact.

When the application experiences an impairment using S3 resources in the primary Region, it fails over to use an S3 bucket in the secondary Region.

Figure 4. When the application experiences an impairment using S3 resources in the primary Region, it fails over to use an S3 bucket in the secondary Region.

#6 Building a three-tier architecture on a budget

Let’s talk cost optimization. This post about a three-tier architecture that relies on the AWS Free Tier is a must-read for anyone looking for tips to help them avoid unnecessary costs (and that’s everyone).

Example of a three-tier architecture on AWS

Figure 5. Example of a three-tier architecture on AWS

#5 Announcing updates to the AWS Well-Architected Framework guidance

As usual, Haleh & team are pros at making sure the Well-Architected Framework is current and relevant. Take a look at the enhanced and expanded guidance in all six pillars.

Well-Architected logo

Figure 6. Well-Architected logo

#4 Let’s Architect! Serverless developer experience in AWS

One more winning post from Luca, Federica, Vittorio, and Zamira! This collection of developer resources includes new ideas in AWS Lambda, Amazon Q Developer, and Amazon DynamoDB.

Let's Architect

Figure 7. Let’s Architect

#3 London Stock Exchange Group uses chaos engineering on AWS to improve resilience

This post from April 1 was not an April Fool’s joke! See how LSEG designed failure scenarios to test their resilience and observability.

Chaos engineering pattern for hybrid architecture (3-tier application)

Figure 8. Chaos engineering pattern for hybrid architecture (3-tier application)

#2 Achieving Frugal Architecture using the AWS Well-Architected Framework Guidance

Frugality AND Well-Architected? What a winning combo! This post, inspired by the 2023 re:Invent keynote, outlines the seven laws of Frugal Architecture.

Well-Architected logo

Figure 9. Well-Architected logo

#1 How an insurance company implements disaster recovery of 3-tier applications

And finally, our number one post of the year! Amit and Luiz showcase a customer solution with real-world applications that builds on the guidelines of other posts in this list! Well done!

The Pilot Light scenario for a 3-tier application that has application servers and a database deployed in two Regions

Figure 10. The Pilot Light scenario for a 3-tier application that has application servers and a database deployed in two Regions

Thank you!

As always, thanks to our contributors for their dedication and desire to share, and to you, our readers! We would be nothing with you. Literally.

For other top post lists, see our Top 10 and Top 5 posts from previous years.

Use your on-premises infrastructure in Amazon EKS clusters with Amazon EKS Hybrid Nodes

Post Syndicated from Channy Yun (윤석찬) original https://aws.amazon.com/blogs/aws/use-your-on-premises-infrastructure-in-amazon-eks-clusters-with-amazon-eks-hybrid-nodes/

Today, we’re announcing the general availability of Amazon Elastic Kubernetes Service (Amazon EKS) Hybrid Nodes, a new feature that you can use to attach your on-premises and edge infrastructure as nodes to EKS clusters in the cloud.

With Amazon EKS Hybrid Nodes, you can unify Kubernetes management across cloud and on-premises environments and take advantage of the scale and availability of Amazon EKS in all the places your applications need to run. You can use your existing on-premises hardware, while offloading the responsibility for managing Kubernetes control planes to EKS and conserving on-premises capacity for your workloads. Using Amazon EKS Hybrid Nodes, you can adopt consistent operational practices and tooling across your cloud and on-premises environments.

Amazon EKS Hybrid Nodes expands our support for hybrid Kubernetes deployments, adding to Amazon EKS on AWS Outposts and Amazon EKS Anywhere, which we introduced previously. You can compare how Kubernetes and hardware components are managed with each of the EKS hybrid deployment options.

Component EKS on Outposts EKS Hybrid Nodes EKS Anywhere
Hardware Managed by AWS Managed by customer
Kubernetes control plane Hosted and managed by AWS Hosted and managed by customer
Kubernetes nodes Amazon EC2 Customer-managed physical or virtual machines

When you use Amazon EKS Hybrid Nodes to attach your on-premises and edge infrastructure to EKS clusters, you can use other Amazon EKS features and integrations, including Amazon EKS add-ons, Pod Identities, cluster access entries, cluster insights, and extended Kubernetes version support. Amazon EKS Hybrid Nodes inherently integrates with AWS services including AWS Systems Manager, AWS IAM Roles Anywhere, Amazon Managed Service for Prometheus, Amazon CloudWatch, and Amazon GuardDuty for centralized monitoring, logging, and identity management.

Get started with Amazon EKS Hybrid Nodes
Here are steps to use Amazon EKS Hybrid Nodes. First, create an EKS cluster and specify your on-premises node and pod subnets. After setting up network connectivity and AWS Identity and Access Management (AWS IAM) permissions for your on-premises environment, run the Amazon EKS Hybrid Nodes CLI (nodeadm) on each host that will join the cluster. When hybrid nodes join your cluster, required networking components, such as kube-proxy and CoreDNS, are automatically installed. Before your hybrid nodes become ready to serve applications, you must install a compatible Container Network Interface (CNI) driver. The Cilium and Calico CNI drivers are supported for use with Amazon EKS Hybrid Nodes.

1. Prerequisites

You must have certain prerequisites in place before your on-premises infrastructure can join your EKS cluster as hybrid nodes, including the following:

  • Hybrid network connectivity from your on-premises environment to and from AWS using with AWS Site-to-Site VPN, AWS Direct Connect, or another virtual private network (VPN) solution
  • A virtual private cloud (VPC) with routes in its routing table for your on-premises node and, optionally, pod networks, with your virtual private gateway (VGW) or transit gateway (TGW) as the target
  • Infrastructure in the form of physical or virtual machines
  • Operating system that is compatible with hybrid nodes
  • Either AWS IAM Roles Anywhere or AWS Systems Manager set up to authenticate your hybrid nodes with the control plane
  • An EKS cluster IAM role and an EKS Hybrid Nodes IAM role

You can use Amazon Linux 2023, Ubuntu 20.04, Ubuntu 22.04, Ubuntu 24.04, or Red Hat Enterprise Linux (RHEL) 8 and 9 as the node operating system for your hybrid nodes. AWS supports the hybrid nodes integration with these operating systems but doesn’t provide support for the operating systems themselves. You’re responsible for operating system provisioning and management.

To learn more, visit Prerequisites for EKS Hybrid Nodes in the Amazon EKS User Guide.

2. Create EKS cluster and enable hybrid nodes

Go to the Amazon EKS console and start to create your EKS cluster. In the Step 2 Specify networking screen, turn on Specify the CIDR blocks for your on-premises environments that you will use for hybrid nodes in the Configure remote networks to enable hybrid nodes option.

The Classless Inter-Domain Routing (CIDRs) of remote nodes and pods need to be RFC-1918 IPv4 IPv4 addresses, and they can’t overlap with the VPC CIDR or the EKS cluster Kubernetes service CIDR. Additionally, the remote node CIDR and the remote pod CIDR can’t overlap. Specifying a pod CIDR block is required if you will run webhooks on your nodes or if your CNI doesn’t use NAT for pod addresses as pod traffic leaves your nodes.

You can also create an EKS cluster using AWS Comand Line Interface (AWS CLI), eksctl, and AWS CloudFormation. To enable your cluster for Amazon EKS Hybrid Nodes, use the remote-network-config flag to specify your remote node and, optionally, your remote pod CIDR blocks.

$ aws eks create-cluster --name channy-hybrid-cluster --region=us-east-1 \
    --role-arn arn:aws:iam::012345678910:role/eks-cluster-role \
    --resources-vpc-config subnetIds=subnet-1234a11a,subnet-5678b11b \
    --remote-network-config \
{"remoteNodeNetworks":[{"cidrs":["10.80.0.0/16"]}],"remotePodNetworks":[{"cidrs":["10.85.0.0/16"]}]}}

Your cluster must be configured with API or API_AND_CONFIG_MAP cluster access authentication modes. Create an Amazon EKS access entry for your EKS Hybrid Nodes IAM role to enable nodes to join the cluster.

$ aws eks create-access-entry \
  --cluster-name my-hybrid-cluster \
  --principal-arn arn:aws:iam::012345678910:role/eksHybridNodesRole \ 
  --type HYBRID_LINUX

Amazon EKS Hybrid Nodes use temporary IAM credentials provisioned by AWS Systems Manager hybrid activations or AWS IAM Roles Anywhere to authenticate with the EKS cluster. Before connecting your on-premises nodes, you must either create an AWS Systems Manager hybrid activation or add certificates and keys to your nodes for use with AWS IAM Roles Anywhere. To learn more, visit Prepare credentials for EKS Hybrid Nodes in the Amazon EKS User Guide.

3. Connect your hybrid nodes to the EKS cluster

You’re now ready to connect Amazon EKS Hybrid Nodes to your EKS cluster. You can use the Amazon EKS Hybrid Nodes CLI (nodeadm) to simplify the installation, configuration, and registration of your hosts as hybrid nodes. nodeadm automatically installs the required AWS Systems Manager or IAM Roles Anywhere components when you run the nodeadm install command.

You can run the nodeadm install process on each running host, or you can run nodeadm install as part of your operating system build pipelines to produce an image with the components needed to join your host to an EKS cluster.

$ nodeadm install 1.31 --credential-provider <ssm, iam-ra>
{"level":"info","ts":...,"caller":"...","msg":"Loading configuration","configSource":"file://nodeConfig.yaml"}
{"level":"info","ts":...,"caller":"...","msg":"Validating configuration"}
{"level":"info","ts":...,"caller":"...","msg":"Validating Kubernetes version","kubernetes version":"1.30"}
{"level":"info","ts":...,"caller":"...","msg":"Using Kubernetes version","kubernetes version":"1.30.0"}
{"level":"info","ts":...,"caller":"...","msg":"Installing SSM agent installer..."}
{"level":"info","ts":...,"caller":"...","msg":"Installing kubelet..."}
{"level":"info","ts":...,"caller":"...","msg":"Installing kubectl..."}
{"level":"info","ts":...,"caller":"...","msg":"Installing cni-plugins..."}
{"level":"info","ts":...,"caller":"...","msg":"Installing image credential provider..."}
{"level":"info","ts":...,"caller":"...","msg":"Installing IAM authenticator..."}
{"level":"info","ts":...,"caller":"...","msg":"Finishing up install..."}

Create a nodeConfig.yaml file on each host that contains the information required to connect to your EKS cluster. Here is an example nodeConfig.yaml that uses AWS Systems Manager hybrid activations.

apiVersion: node.eks.aws/v1alpha1
kind: NodeConfig
metadata:
  name: hybrid-node
spec:
  cluster:
    name: my-cluster
    region: us-east-1
  hybrid:
    roleArn: arn:aws:iam:012345678910:role/eksHybridNodesRole
    ssm:
      activationCode: <activation-code>
      activationId: <activation-id>

Now, run nodeadm on each host.

$ nodeadm init -c file:/// nodeConfig.yaml

If the preceding command is completed successfully, your hybrid node has joined your EKS cluster. You can verify this in the Amazon EKS console or with the kubectl get nodes command. Before your hybrid nodes have status as Ready, you must install a compatible CNI. To learn more, visit Install CNI for EKS Hybrid Nodes in the Amazon EKS User Guide.

4. View and manage connected your hybrid nodes in EKS console

Now that the nodes are ready, you can view your hybrid nodes and the resources running on them in the EKS console.

You’re responsible for managing your hybrid nodes and updating the software they run. You can update to the latest version of the Amazon EKS Hybrid Nodes CLI to pull in the latest fixes and updates and upgrade Kubernetes versions. To learn more, visit Upgrade EKS Hybrid Nodes in the Amazon EKS User Guide.

Now available
Amazon EKS Hybrid Nodes is now available in all AWS Regions except the AWS GovCloud (US) Regions and the China Regions.

There are no upfront commitments or minimum fees, and you pay for the hourly usage of your EKS cluster and EKS Hybrid Nodes as you use them. EKS clusters with your hybrid nodes have the same per cluster per hour cost as EKS clusters with nodes running in AWS Cloud for both standard and extended support. Additionally, EKS clusters with your hybrid nodes incur an hourly fee per hybrid node vCPU. To learn more, visit the Amazon EKS pricing page.

Give EKS Hybrid Nodes a try in the Amazon EKS console. To learn more, visit the EKS Hybrid Nodes documentation and send feedback to AWS re:Post for EKS or through your usual AWS Support contacts.

Channy

Streamline Kubernetes cluster management with new Amazon EKS Auto Mode

Post Syndicated from Channy Yun (윤석찬) original https://aws.amazon.com/blogs/aws/streamline-kubernetes-cluster-management-with-new-amazon-eks-auto-mode/

Today, we’re announcing the general availability of Amazon Elastic Kubernetes Service (Amazon EKS) Auto Mode, a new capability to streamline Kubernetes cluster management for compute, storage, and networking, from provisioning to on-going maintenance with a single click. You can achieve higher agility, performance, and cost-efficiency by eliminating the operational overhead of managing the cluster infrastructure required to run production-grade Kubernetes applications at scale on Amazon Web Services (AWS).

Customers choose Amazon EKS because they can use the open standards and portability of Kubernetes with the security, scalability, and availability of AWS cloud. While Kubernetes gives advanced customers deep controls over application operations, other customers find managing the components required for production-grade Kubernetes applications to be complex and labor-intensive.

With the EKS Auto Mode, you can automate cluster management without deep Kubernetes expertise, because it selects optimal compute instances, dynamically scales resources, continuously optimizes costs, manages core add-ons, patches operating systems, and integrates with AWS security services. AWS expands its operational responsibility in EKS Auto Mode compared to customer-managed infrastructure in your EKS clusters. In addition to the EKS control plane, AWS will configure, manage, and secure the AWS infrastructure in EKS clusters that your applications need to run.

You can now get started quickly, improve performance, and reduce overhead, enabling you to focus on building applications that drive innovation instead of on cluster management tasks. EKS Auto Mode also reduces the work required to acquire and run cost-efficient GPU-accelerated instances so that your generative AI workloads have the capacity they need when they need it.

Get started with Amazon EKS Auto Mode
To get started, go to the Amazon EKS console and start to create your EKS cluster. You’ll have two options, Quick configuration (with EKS Auto Mode) and Custom configuration.

After you choose quick configuration, enter your cluster name and Kubernetes version, IAM roles, VPC subnets. You can view configuration default values in EKS Auto Mode whether you can edit after the cluster is created.

EKS Auto Mode enables the following Kubernetes capabilities in your EKS cluster:

  • Compute auto scaling and management
  • Application load balancing management
  • Pod and service networking and network policies
  • Cluster DNS and GPU support
  • Block storage volume support

When you choose Create, your EKS cluster with Auto Mode will be deployed in minutes with a single click.

If you choose the custom configuration option, you can customize other aspects of your cluster. You can use EKS Auto Mode in this option too.

You can also create an EKS Auto Mode cluster using AWS Command Line Interface (AWS CLI), eksctl, and AWS CloudFormation. Run the following eksctl command to create a new EKS Auto Mode cluster with:

$ eksctl create cluster --name=<cluster-name> --enable-auto-mode

To learn more, visit Create cluster with EKS Auto Mode in the Amazon EKS User Guide.

If you want to enable EKS Auto Mode for an existing EKS cluster, choose Manage in the EKS Auto Mode section of the Overview tab in the EKS cluster detail page.

Select the box next to Use EKS Auto Mode to enable the EKS Auto Mode. You can unselect the EKS Auto Mode that will be configured in the cluster. The default is to create both a system and a default node pool and a node class.

You can also migrate from Karpenter, EKS Managed Node Groups, and EKS Fargate to EKS Auto Mode. To learn more, visit Enable EKS Auto Mode on existing EKS clusters in the Amazon EKS User Guide.

To meet your workload requirements, you can configure specific aspects of your EKS Auto Mode clusters. While EKS Auto Mode manages most infrastructure components automatically, you can customize node networking settings, node compute resources, storage class settings, and application load balancing behaviors while maintaining the benefits of automated infrastructure management. To learn more, visit Change EKS Auto cluster settings in the Amazon EKS User Guide.

Now, you can deploy different types of workloads to Amazon EKS clusters running in EKS Auto Mode. We provide key workload patterns including sample applications, load-balanced web applications, stateful workloads using persistent storage, and workloads with specific node placement requirements. Each example includes complete manifests and step-by-step deployment instructions that you can use as templates for your own applications. To learn more, visit Run workloads in EKS Auto Mode clusters in the Amazon EKS User Guide.

Now available
Amazon EKS Auto Mode is now available in all commercial AWS Regions except China Regions where Amazon EKS is available. You can enable EKS Auto Mode in any EKS cluster running Kubernetes 1.29 and above with no upfront fees or commitments—you pay for the management of the compute resources provisioned, in addition to your regular EC2 costs. To learn more, visit Amazon EKS pricing page.

Please register for the online webinar: Simplifying Kubernetes operations with Amazon EKS Auto Mode on December 12, 2024 to learn more about how EKS Auto Mode can accelerate your time to deploy workloads to production and reduce the operational overheads of Kubernetes. To learn more, visit Automate cluster infrastructure with EKS Auto Mode in the Amazon EKS User Guide.

Give EKS Auto Mode a try in the Amazon EKS console and send feedback to AWS re:Post for EKS or through your usual AWS Support contacts.

Channy

Implementing custom domain names for private endpoints with Amazon API Gateway

Post Syndicated from Chris McPeek original https://aws.amazon.com/blogs/compute/implementing-custom-domain-names-for-private-endpoints-with-amazon-api-gateway/

This post is written by Heeki Park, Principal Solutions Architect

Amazon API Gateway is introducing custom domain name support for private REST API endpoints. Customers choose private REST API endpoints when they want endpoints that are only callable from within their Amazon VPC. Custom domain names are simpler and more intuitive URLs that you can use with your applications and were previously only supported with public REST API endpoints. Now you can use custom domain names to map to private REST APIs and share those custom domain names across accounts using AWS Resource Access Manager (AWS RAM).

Overview of API Gateway connectivity

When considering network connectivity with API Gateway, two aspects are important to keep in mind: the integration type and the connectivity type. The following diagram shows examples of those considerations.

Overall architecture diagram showing custom domains for private endpoints.

Figure 1: Overall architecture

The first aspect is the distinction between frontend integrations and backend integrations. Frontend integrations are how API clients like mobile devices, web browsers, or client applications connect to the API endpoint. Backend integrations are the API services to which your API Gateway endpoint proxies requests, like applications running on Amazon Elastic Compute Cloud (EC2) instances, Amazon Elastic Kubernetes Service (EKS) or Amazon Elastic Container Service (ECS) containers, or as AWS Lambda functions. The second aspect is whether that connectivity is via the public internet or via your private VPC.

Calling private REST API endpoints

In order to send requests to a private REST API endpoint, clients must operate within a VPC that is configured with a VPC endpoint. Once a VPC endpoint is configured, a client has three different options within the VPC for connecting to the API endpoint, depending on how the VPC and the VPC endpoint are configured.

If the VPC endpoint has private DNS enabled, the client can send requests to the standard endpoint URL: https://{api-id}.execute-api.{region}.amazonaws.com/{stage}. These requests resolve to the VPC endpoint, which then get routed to the appropriate API Gateway endpoint.

VPC endpoint configured with private DNS names enabled.

Figure 2: VPC endpoint configured with private DNS names enabled

Alternatively, if the VPC endpoint has private DNS disabled, the client can send requests to the VPC endpoint URL: https://{vpce-id}.execute-api.{region}.amazonaws.com/{stage}. One of the following headers also needs to be sent along with that request.

Host: {api-id}.execute-api.us-east-1.amazonaws.com
x-apigw-api-id: {api-id}

Finally, if the VPC endpoint has private DNS disabled and the private REST API endpoint is associated with the VPC endpoint, the client can send requests to the following URL: https://{api-id}-{vpce-id}.execute-api.{region}.amazonaws.com/{stage}. To associate a VPC endpoint with a private API, the following property configures that association.

      EndpointConfiguration:
        Type: PRIVATE
        VPCEndpointIds:
          - !Ref vpcEndpointId

You can see that configuration in the console, as follows.

Optional VPC endpoint configuration with private REST API endpoints.

Figure 3: Optional VPC endpoint configuration with private REST API endpoints

To simplify access to your private REST API endpoints, you can now also configure custom domain names, which functions as a stable vanity URL for your private APIs.

Implementing custom domain names for private endpoints

Before setting up a custom domain name for your private REST API endpoints, a VPC endpoint for API Gateway, an AWS Certificate Manager (ACM) certificate, an Amazon Route 53 private hosted zone, and one or more private REST API endpoints need to be configured.

Once those pre-requisites are set up, a custom domain name can be setup with the following steps:

  1. In the API provider account, create a custom domain name and base path mapping.
  2. In the provider account, use AWS RAM to create a resource share for the custom domain name. In the consumer account, accept the resource share request. This step is only required if the provider and consumer are in different AWS accounts.
  3. In the consumer account, associate the custom domain name to a VPC endpoint.
  4. In the consumer account, create a Route 53 alias to map the custom domain to the VPC endpoint.

Components for configuring a custom domain name.

Figure 4: Components for configuring a custom domain name

Step 1: Creating a private custom domain name

When configuring a custom domain name, two policies are used to manage permissions to the private custom domain name resource. Management policies specify which principals are allowed to associate a private custom domain name to a VPC endpoint. Resource-based policies specify which API consumers are allowed to invoke your private custom domain name.

Creating a private custom domain name.
Figure 5: Creating a private custom domain name

This is an example CloudFormation definition for a private custom domain name.

  DomainName:
    DependsOn: Certificate
    Type: AWS::ApiGateway::DomainNameV2
    Properties:
      CertificateArn: !Ref certificateArn
      DomainName: api.internal.example.com
      EndpointConfiguration:
        Types:
          - PRIVATE
      ManagementPolicy:
        Fn::ToJsonString:
          Statement:
            - Effect: Allow
              Principal:
                AWS:
                  - '123456789012'
              Action: apigateway:CreateAccessAssociation
              Resource: 'arn:aws:apigateway:us-east-1::/domainnames/*'
      Policy:
        Fn::ToJsonString:
          Statement:
            - Effect: Deny
              Principal: '*'
              Action: execute-api:Inovke
              Resource:
                - execute-api:/*
              Condition:
                StringNotEquals:
                  aws:SourceVpce: !Ref vpceEndpointId
            - Effect: Allow
              Principal:
                AWS:
                  - '123456789012'
              Action: execute-api:Invoke
              Resource:
                - execute-api:/*
      SecurityPolicy: TLS_1_2

In this example, the management policy specifies that the account 123456789012 is allowed to associate a private custom domain name with a VPC endpoint. The resource-based policy then denies any request that does not come from a particular VPC endpoint and only allows invoke requests that come from that same account 123456789012.

The private custom domain name then needs to be mapped to a private REST API.

  Mapping:
    DependsOn: DomainName
    Type: AWS::ApiGateway::BasePathMappingV2
    Properties:
      BasePath: app1
      DomainName: api.internal.example.com
      DomainNameId: abcde12345
      RestApiId: !Ref apiId
      Stage: !Ref stageName

In this example, the BasePath is set to app1. If the Stage is set as dev, then the private endpoint can be accessed via https://api.internal.example.com/app1/dev. The domain id is the identifier for the private custom domain name.

Note that with public custom domain names, the domain name has to be unique in the region, since they are resolved publicly. With private custom domain names, since they are resolved within a VPC, a private custom domain name with the same name can be created in different accounts. The private custom domain name is then resolved to the VPC endpoint in that account’s VPC.

Step 2: Sharing the private custom domain name using AWS RAM

In order for API consumers to access the private custom domain name from another account, the custom domain name needs to be shared with the consumer accounts using RAM. If the API provider and API consumer are in the same account, this step with RAM can be skipped.

Sharing the private custom domain name.
Figure 6: Sharing the private custom domain name

The following CloudFormation definition creates a resource share in the provider account.

  Share:
    Type: AWS::RAM::ResourceShare
    Properties:
      Name: private-custom-domain-name
      Principals: 
        - '123456789012'
      ResourceArns: 
        - 'arn:aws:apigateway:us-east-1::/domainnames/api.internal.example.com+abcde12345'

The allowed Principals for the resource share specifies the consumer account ids. The ResourceArns specify the ARN of the private custom domain name.

In the consumer account, an administrator receives a notification to accept the resource share. This request must be accepted to allow the consumer account to see the private custom domain name. This handshake acts as a mutual agreement between the accounts to allow the private custom domain name to be exposed from the provider account to the consumer account. If the provider and consumer accounts are in the same AWS Organization, the share is automatically accepted on behalf of consumers.

Step 3: Associating the private custom domain name to a VPC endpoint

The private custom domain name is now visible in the consumer account. Next, associate the private custom domain name with a VPC endpoint in the consumer account and in the VPC where the client applications reside.

Associating the private custom domain name to a VPC endpoint.
Figure 7: Associating the private custom domain name to a VPC endpoint

  Association:
    DependsOn: DomainName
    Type: AWS::ApiGateway::DomainNameAccessAssociation
    Properties:
      AccessAssociationSource: vpce-abcdefgh123456789
      AccessAssociationSourceType: VPCE
      DomainNameArn: 'arn:aws:apigateway:us-east-1::/domainnames/api.internal.example.com+abcde12345'

The AccessAssociationSource is the VPC endpoint id, and the DomainNameArn is the same ARN that is used in the RAM resource share.

Step 4: Creating a Route 53 alias for the custom domain name

The final step before being able to test the custom domain name in the consumer account is setting up a Route 53 alias. That alias is configured in a private hosted zone that is associated with the VPC where the VPC endpoint and client applications reside. The alias resolves the fully qualified domain name (FQDN) to the VPC endpoint DNS name.

Creating a Route 53 alias.
Figure 8: Creating a Route 53 alias

The following CloudFormation definition creates that alias.

  Alias:
    Type: AWS::Route53::RecordSet
    Properties:
      HostedZoneId: !Ref privateZoneId
      Name: api.internal.example.com
      ResourceRecords:
        - vpce-abcdefgh123456789-abcd1234.execute-api.us-east-1.vpce.amazonaws.com
      TTL: 300
      Type: CNAME

The ResourceRecords point to the FQDN of the VPC endpoint to which our private custom domain name is associated. Once this alias is created, your client applications can test if it can successfully send requests to the private custom domain name.

Optional: Cleaning up the resources

If you’ve configured a test environment with these resources, you can clean up the deployment by following the steps in reverse order.

  1. In the consumer account, delete the Route 53 alias.
  2. In the consumer account, delete the association.
  3. In both the consumer and provider account, remove the RAM resource share.
  4. In the provider account, delete the custom domain name and base path mapping.

Conclusion

In this post, you learned about how clients can connect to private REST API endpoints with API Gateway. With custom domain names, your applications connect to stable URLs that can forward requests to many different private API backends. Furthermore, your application teams can deploy resources in separate line of business AWS accounts and access the private custom domain name as a central shared resource, using AWS RAM resource sharing. This allows your application teams to build secure, private API applications and expose them to API consumers securely and across multiple AWS accounts.

For more details, refer to the API Gateway documentation and check out patterns with API Gateway on Serverless Land.

How to build custom nodes workflow with ComfyUI on Amazon EKS

Post Syndicated from Wang Rui original https://aws.amazon.com/blogs/architecture/how-to-build-custom-nodes-workflow-with-comfyui-on-amazon-eks/

ComfyUI is an open-source node-based workflow solution for Stable Diffusion and increasingly being used by many creators. We previously published a blog and solution about how to deploy ComfyUI on AWS.

Typically, ComfyUI users use various custom nodes, which extend the capabilities of ComfyUI, to build their own workflows, often using ComfyUI-Manager to conveniently install and manage their custom nodes.

Following our blog post, we received numerous customer requests to integrate ComfyUI custom nodes into our solution. This post will guide you through the process of integrating custom nodes within ComfyUI-on-EKS.

Architecture overview

Architecture diagram showing the ComfyUI integration with Amazon EKS

Figure 1. Architecture diagram showing the ComfyUI integration with Amazon EKS

To integrate custom nodes within ComfyUI-on-EKS solution, we need to prepare custom nodes codes and environment, as well as needed models:

  • Code and Environment: Custom node code is placed in $HOME/ComfyUI/custom_nodes, and the environment is prepared by running pip install -r on all requirements.txt files in the custom node directories (any dependency conflicts between custom nodes need to be handled separately). Additionally, any system packages required by the custom nodes also should be installed. All these operations are performed through the Dockerfile, building an image containing the required custom nodes.
  • Models: Models used by custom nodes are placed in different directories under s3://comfyui-models-{account_id}-{region}. This triggers a Lambda function to send commands to all GPU nodes to synchronize the newly uploaded models to local instance store.

We’ll use the Stable Video Diffusion (SVD) – Image to video generation with high FPS workflow as an example to illustrate how to integrate custom nodes (you can also use your own workflow).

Build docker image

When loading this workflow, it will display the missing custom nodes. Next, we will build the missing custom nodes into the docker image.

Error message showing the missing node types

Figure 2. Error message showing the missing node types

There are two ways to build the image:

  • Build from GitHub: In the Dockerfile, download the code for each custom node and set up the environment and dependencies separately.
  • Build locally: Copy all the custom nodes from your local Dev environment into the image and set up the environment and dependencies.

Before building the image, please switch to the corresponding branch

git clone https://github.com/aws-samples/comfyui-on-eks ~/comfyui-on-eks
cd ~/comfyui-on-eks && git checkout custom_nodes_demo

Build from GitHub

Install custom nodes and dependencies with RUN command in the Dockerfile. You’ll need to find the GitHub URLs for all missing custom nodes.

...
RUN apt-get update && apt-get install -y \
    git \
    python3.10 \
    python3-pip \
    # needed by custom node ComfyUI-VideoHelperSuite
    libsm6 \
    libgl1 \
    libglib2.0-0
...
# Custom nodes demo of https://comfyworkflows.com/workflows/bf3b455d-ba13-4063-9ab7-ff1de0c9fa75

## custom node ComfyUI-Stable-Video-Diffusion
RUN cd /app/ComfyUI/custom_nodes && git clone https://github.com/thecooltechguy/ComfyUI-Stable-Video-Diffusion.git && cd ComfyUI-Stable-Video-Diffusion/ && python3 install.py
## custom node ComfyUI-VideoHelperSuite
RUN cd /app/ComfyUI/custom_nodes && git clone https://github.com/Kosinkadink/ComfyUI-VideoHelperSuite.git && pip3 install -r ComfyUI-VideoHelperSuite/requirements.txt
## custom node ComfyUI-Frame-Interpolation
RUN cd /app/ComfyUI/custom_nodes && git clone https://github.com/Fannovel16/ComfyUI-Frame-Interpolation.git && cd ComfyUI-Frame-Interpolation/ && python3 install.py
...

Refer to comfyui-on-eks/comfyui_image/Dockerfile.github for the complete Dockerfile.

Run following command to build and push Docker image

region="us-west-2" # Modify the region to your current region.
cd ~/comfyui-on-eks/comfyui_image/ && bash build_and_push.sh $region Dockerfile.github

Building from GitHub provides a clear understanding of the installation method, version, and environmental dependencies for each custom node, providing better control over the entire ComfyUI environment.

However, when there are too many custom nodes, installation and management can be time-consuming, and you need to find the URL for each custom node yourself (on the other hand, this can also be seen as a pro, as it makes you more familiar with the entire ComfyUI environment).

Build locally

Often, we use ComfyUI-Manager to install missing custom nodes. ComfyUI-Manager hides the installation details, and we cannot clearly know which custom nodes have been installed. In this case, we can build the image by COPY the entire ComfyUI directory (except the input, output, models, and other directories) into the Dockerfile.

The prerequisite for building the image locally is that you already have a working ComfyUI environment with custom nodes. In the same directory as ComfyUI, create a .dockerignore file and add the following content to ignore these directories when building the Docker image

ComfyUI/models
ComfyUI/input
ComfyUI/output
ComfyUI/custom_nodes/ComfyUI-Manager

Copy the two files comfyui-on-eks/comfyui_image/Dockerfile.local and comfyui-on-eks/comfyui_image/build_and_push.sh to the same directory as your local ComfyUI, like this:

ubuntu@comfyui:~$ ll
-rwxrwxr-x  1 ubuntu ubuntu       792 Jul 16 10:27 build_and_push.sh*
drwxrwxr-x 19 ubuntu ubuntu      4096 Jul 15 08:10 ComfyUI/
-rw-rw-r--  1 ubuntu ubuntu       784 Jul 16 10:41 Dockerfile.local
-rw-rw-r--  1 ubuntu ubuntu        81 Jul 16 10:45 .dockerignore
...

The Dockerfile.local builds the image by COPY the directory

...
# Python Evn
RUN pip3 install torch torchvision torchaudio --extra-index-url https://download.pytorch.org/whl/cu121
COPY ComfyUI /app/ComfyUI
RUN pip3 install -r /app/ComfyUI/requirements.txt

# Custom Nodes Env, may encounter some conflicts
RUN find /app/ComfyUI/custom_nodes -maxdepth 2 -name "requirements.txt"|xargs -I {} pip install -r {}
...

Refer to comfyui-on-eks/comfyui_image/Dockerfile.local for the complete Dockerfile.

Run the following command to build and upload the Docker image

region="us-west-2" # Modify the region to your current region.
bash build_and_push.sh $region Dockerfile.local

With this method, you can easily and quickly build your local Dev environment into an image for deployment, without paying attention to the installation, version, and dependency details of custom nodes when there are many of them.

However, not paying attention to the deployment environment of custom nodes may cause conflicts or missing dependencies, which need to be manually tested and resolved.

Upload models

Upload all the models needed for the workflow to the s3://comfyui-models-{account_id}-{region} corresponding directory using your preferred method. The GPU nodes will automatically sync from Amazon S3 (triggered by Lambda). If the models are large and numerous, you might need to wait. You can log into the GPU nodes using the aws ssm start-session --target ${instance_id} command and use the ps command to check the progress of the aws s3 sync process.

To set up this demo, you need to download the following models to s3://comfyui-models-{account_id}-{region}/svd/:

Test the Docker image locally (optional)

Since there are many types of custom nodes with different dependencies and versions, the runtime environment is quite complex. We recommend testing the Docker image locally after building it to ensure it runs correctly.

Refer to the code in comfyui-on-eks/comfyui_image/test_docker_image_locally.sh. Prepare the models and input directories (assuming the models and input images are stored in /home/ubuntu/ComfyUI/models and /home/ubuntu/ComfyUI/input respectively), and run the script to test the Docker image:

bash comfyui-on-eks/comfyui_image/test_docker_image_locally.sh

Rolling update K8S pods

Use your preferred method to perform a rolling update of the image for the online K8S pods, and then test the service.

Note, to run this demo, you need to:

  • use g5.2xlarge GPU node
  • set lower num_frames in Load Stable Video Diffusion Model (for example to 6)
  • set lower decoding_t in Stable Video Diffusion Decoder node (for example to 1)
Screenshot showing the rolling update demo

Figure 3. Screenshot showing the rolling update demo

Conclusion

Custom nodes empower creators to unleash the full potential of ComfyUI by seamlessly integrating a wide range of capabilities into their own workflows.

This article demonstrate how to build custom nodes into ComfyUI-on-EKS solution, you can build your own ComfyUI CI/CD pipeline following the instructions.

AWS Weekly Roundup: Agentic workflows, Amazon Transcribe, AWS Lambda insights, and more (October 21, 2024)

Post Syndicated from Antje Barth original https://aws.amazon.com/blogs/aws/aws-weekly-roundup-agentic-workflows-amazon-transcribe-aws-lambda-insights-and-more-october-21-2024/

Agentic workflows are quickly becoming a cornerstone of AI innovation, enabling intelligent systems to autonomously handle and refine complex tasks in a way that mirrors human problem-solving. Last week, we launched Serverless Agentic Workflows with Amazon Bedrock, a new short course developed in collaboration with Dr. Andrew Ng and DeepLearning.AI.

Serverless Agentic Workflows with Amazon Bedrock

This hands-on course, taught by my colleague Mike Chambers, teaches how to build serverless agents that can handle complex tasks without the hassle of managing infrastructure. You will learn everything you need to know about integrating tools, automating workflows, and deploying responsible agents with built-in guardrails on Amazon Web Services (AWS) with Amazon Bedrock. The hands-on labs provided with the course let you apply your knowledge directly in an AWS environment, hosted by AWS Partner Vocareum. Find more information and enroll for free on the DeepLearning.AI course page.

Now, let’s turn our attention to other exciting news in the AWS universe from last week.

Last week’s launches
Here are some launches that got my attention:

Amazon Transcribe now supports streaming transcription in 30 additional languagesAmazon Transcribe has expanded its support to include 30 additional languages, bringing the total number of supported languages to 54. This enhancement helps you reach a broader global audience and improves accessibility across various industries, including contact centers, broadcasting, and e-learning. The expanded language support allows for more efficient content moderation, improved agent productivity, and automatic subtitling for live events and meetings.

AWS Lambda console now surfaces key function insights and supports real-time log analytics – The AWS Lambda console now features a built-in Amazon CloudWatch Metrics Insights dashboard and supports CloudWatch Logs Live Tail, providing instant visibility into critical function metrics and real-time log streaming. You can now identify and troubleshoot errors or performance issues for your Lambda functions without leaving the console, as well as view and analyze logs in real time as they become available. You can reduce context switching and accelerate the development and troubleshooting processes for serverless applications. Check out the launch post for more details.

Amazon Bedrock Model Evaluation now supports evaluating custom model import models – You can now evaluate custom models you’ve imported to Amazon Bedrock using the model evaluation feature. This helps you to complete the full cycle of selecting, customizing, and evaluating models before deploying them. To evaluate an imported model, select the custom model from the list of models to evaluate in the model selector tool when creating an evaluation job.

Amazon Q in AWS Supply Chain – You can now use Amazon Q, an interactive AI assistant, to analyze your supply chain data in AWS Supply Chain and get insights to operate your supply chain more efficiently. Amazon Q can answer your supply chain questions by diving into your data. This reduces the time spent searching for information and streamlines finding answers to improve your supply chain operations.

For a full list of AWS announcements, be sure to keep an eye on the What’s New at AWS page.

Other AWS news
Here are some additional news items and posts that you might find interesting:

New Amazon OpenSearch Service YouTube channel – The channel offers bite-sized tutorials, curated content, and organized playlists on topics such as log analytics, semantic search, vector databases, and operational best practices. You can also provide feedback to influence future channel content and the OpenSearch Service roadmap. Check out the launch post for more details and subscribe to the Amazon OpenSearch Service YouTube channel.

Deploying Generative AI Applications with NVIDIA NIM Microservices on Amazon Elastic Kubernetes Service (Amazon EKS) – This post shows you how to use Amazon EKS to orchestrate the deployment of pods containing NVIDIA NIM microservices, to enable quick-to-setup and optimized large-scale large language model (LLM) inference on Amazon EC2 G5 instances. It also demonstrates how to scale (both pod and cluster) by monitoring for custom metrics through Prometheus, and how you can load balance using an Application Load Balancer.

Instant Well-Architected CDK Resources with Solutions Constructs Factories – You can now create well-architected AWS resources such as Amazon Simple Storage Service (Amazon S3) buckets and AWS Step Functions state machines with a single function call using the new AWS Solutions Constructs Factories. These factories handle all the best practices configuration for you while still allowing customization. Try using a Constructs factory the next time you need to deploy one of the supported resources.

Upcoming AWS events
Check your calendars and sign up for these AWS events:

AWS GenAI LoftsAWS GenAI LoftsAWS GenAI Lofts are about more than just the tech, they bring together startups, developers, investors, and industry experts. Whether you’re looking to gain deep insights, or get your questions answered by generative AI pros, our GenAI Lofts have you covered and provide everything you need to start building your next innovation. Join events in London (through October 25), Seoul (October 30–November 6), São Paulo (through November 20), and Paris (through November 25).

AWS Community DaysAWS Community Days – Join community-led conferences that feature technical discussions, workshops, and hands-on labs led by expert AWS users and industry leaders from around the world: Malta (November 8), Chile (November 9), and Kochi, India (December 14).

AWS re:Invent 2024AWS re:InventRegistration is now open for the annual tech extravaganza, taking place December 2–6 in Las Vegas. At re:Invent 2024, you’ll get a front row seat to hear real stories from customers and AWS leaders about navigating pressing topics, such as generative AI. Learn about new product launches, watch demos, and get behind-the-scenes insights during five headline-making keynotes.

You can browse all upcoming in-person and virtual events.

That’s all for this week. Check back next Monday for another Weekly Roundup!

— Antje

This post is part of our Weekly Roundup series. Check back each week for a quick roundup of interesting news and announcements from AWS!

Hybrid Cloud Journey using Amazon Outposts and AWS Local Zones

Post Syndicated from Arun Chellappa Ganesan original https://aws.amazon.com/blogs/architecture/hybrid-cloud-journey-using-amazon-outposts-and-aws-local-zones/

This post was co-written with Amy Flanagan, Vice President of Architecture and leader of the Virtual Architecture Team (VAT) at athenahealth, and Anusha Dharmalingam, Executive Director and Senior Architect at athenahealth.

athenahealth has embarked on an ambitious journey to modernize its technology stack by leveraging AWS’s hybrid cloud solutions. This transformation aims to enhance scalability, performance, and developer productivity, ultimately improving the quality of care provided to its patients.

athenahealth’s core products, including revenue cycle management, electronic health records, and patient engagement portals, have been built and refined over 25 years. The company initially deployed its Perl-based web application stack centrally in data centers, allowing it to scale horizontally to meet the growing demands of healthcare providers. However, as the company expanded, it encountered significant scaling and operational challenges in maintaining legal applications due to its monolithic architecture and tightly coupled codebase.

The need for modernization

With a legacy system acting as a multi-purpose database, athenahealth faced issues with developer productivity and operational efficiency. The monolithic architecture led to complex dependencies and made it difficult to implement new features. Realizing the need to modernize, athenahealth decided to refactor its applications and move to the cloud, taking advantage of AWS’s robust infrastructure and services.

Decomposing monoliths to microservices

athenahealth adopted the strangler fig pattern to decompose its monolithic applications into microservices. Starting with peripheral services, they gradually moved to core services, using containers and modern development practices. 80% of athenahealth’s AWS footprint are containerized workloads deployed on Amazon Elastic Container Service (Amazon ECS). Java became the primary language for these microservices, with purpose-built databases like Amazon DynamoDB, Amazon RDS for PostgreSQL, and Amazon OpenSearch.

Event-driven communication between services was facilitated through Amazon EventBridge, Amazon Managed Streaming for Apache Kafka (Amazon MSK), and Amazon Simple Queue Service (Amazon SQS). A data lake was established on Amazon Simple Storage Service (Amazon S3), fed by change data capture from relational databases. Despite progress, refactoring core services proved time-consuming and challenging.

Introducing AWS Outposts and AWS Local Zones

To address these challenges, athenahealth leveraged AWS Local Zones and AWS Outposts, extending AWS infrastructure and services to their on-premises data centers. This hybrid cloud approach allowed athenahealth to deploy modernized code while maintaining low-latency access to existing databases. Deployment across both AWS Local Zones close to the datacenter and AWS Outposts in the datacenter enabled athenahealth to get a highly available hybrid architecture. Local Zones offers additional elasticity, making it suitable for specific use cases. Additionally, the combination of deployment solutions enables optimal access to athenahealth on-premises services and AWS Regional services.

Benefits of AWS Outposts and AWS Local Zones

  • Scalability and performance: Outposts and Local Zones enabled athenahealth to curb the growth of their monolithic codebase, allowing for seamless integration of modern microservices with existing systems.
  • Developer productivity: Developers were able to focus on container-based workloads, using familiar tools and environments, thereby reducing context switching and improving efficiency.
  • Operational efficiency: By running containerized applications on Outposts and Local Zones, athenahealth achieved consistent performance and reliability, crucial for healthcare applications.

Hybrid cloud architecture

athenahealth’s hybrid cloud architecture includes two data centers geographically distributed for high availability and disaster recovery. As shown in Figure 1, the company operates two data centers that are geographically distributed, each housing two Outposts and connecting to two Local Zones. This configuration not only supports geo-proximity-based traffic distribution for optimal performance but also establishes a primary and standby setup for disaster recovery purposes. By connecting these Outposts to separate AWS Regions, athenahealth achieves additional redundancy, enhancing their system’s resilience and ensuring continuous operation. In addition, within a single Region the deployment across Outpost and Local Zone provides high availability for the applications. This hybrid setup enables athenahealth to seamlessly integrate their legacy monolithic application with modernized microservices. By using AWS Outposts and AWS Local Zones as an extension of their data centers, athenahealth can run containerized applications with low-latency access to on-premises databases. This architecture supports the company’s goals of curbing the growth of their monolithic codebase and improving developer productivity by allowing for consistent performance and reliability across their infrastructure. With two Outposts and two Local Zones deployed, athenahealth ensures that their critical healthcare services remain available and reliable, meeting the stringent demands of the industry.

AWS Outposts and AWS Local Zones at athenahealth

Figure 1. AWS Outposts and AWS Local Zones at athenahealth

Application deployment

athenahealth’s hybrid cloud architecture is designed to optimize the deployment of containerized workloads while ensuring efficient use of AWS Outposts’ capacity and elastic AWS Local Zone capacity. By leveraging Amazon Elastic Kubernetes Service (EKS), athenahealth deploys application containers on Outposts and AWS Local Zones, enabling low-latency access to on-premises databases. The control plane for these applications is managed in the AWS Region, while the worker nodes run locally on the Outposts and Local Zones. This setup ensures that critical applications requiring immediate data access can operate with minimal latency, thereby maintaining high performance and reliability.

To further optimize the use of AWS resources, athenahealth deploys non-latency-sensitive services, such as logging, monitoring, and CI/CD, directly in AWS Regions, as shown in Figure 2. These services do not require direct access to on-premises databases, allowing athenahealth to preserve the limited capacity of Outposts for applications that truly benefit from low-latency access. By strategically dividing the deployment of applications between Outposts and Local Zones and AWS Regions, athenahealth achieves a balanced, efficient, and scalable hybrid cloud environment that supports the company’s ongoing modernization efforts.

Amazon EKS on Amazon Outposts

Figure 2. Amazon EKS on Amazon Outposts

Primary use cases

athenahealth’s primary use cases for their hybrid cloud architecture focus on curbing the growth of their monolithic codebase while facilitating modernization and cloud migration. By leveraging AWS Outposts and AWS Local Zones, they supported two key use cases:

  • Enabling microservices running in AWS Regions to access on-premises databases with low latency
  • Offloading certain features of their monolithic application to Outposts and Local Zones, as shown in Figure 3

This approach reduces the load on legacy systems and enhances service delivery. These strategies allow athenahealth to maintain efficient operations and accelerate their transition to a hybrid cloud-based infrastructure.

Microservices running in AWS Regions interact with on-premises databases through Outposts and Local Zones, ensuring low-latency data access

Figure 3. Microservices running in AWS Regions interact with on-premises databases through Outposts and Local Zones, ensuring low-latency data access

Conclusion

This technology transformation is a significant step forward, enabling athenahealth to be more agile, efficient, and responsive to the evolving needs of its vast network of healthcare providers and patients. athenahealth’s journey to AWS hybrid cloud showcases the transformative power of modernizing legacy systems. With increased scalability, improved application performance, and streamlined developer workflows, the company can now focus even more on its core mission of delivering innovative, patient-centric solutions that improve health outcomes. As athenahealth progresses, it will continue to refine its hybrid cloud strategy, ensuring the delivery of high-quality healthcare services to clinicians and patients alike.

Further reading

Use Batch Processing Gateway to automate job management in multi-cluster Amazon EMR on EKS environments

Post Syndicated from Umair Nawaz original https://aws.amazon.com/blogs/big-data/use-batch-processing-gateway-to-automate-job-management-in-multi-cluster-amazon-emr-on-eks-environments/

AWS customers often process petabytes of data using Amazon EMR on EKS. In enterprise environments with diverse workloads or varying operational requirements, customers frequently choose a multi-cluster setup due to the following advantages:

  • Better resiliency and no single point of failure – If one cluster fails, other clusters can continue processing critical workloads, maintaining business continuity
  • Better security and isolation – Increased isolation between jobs enhances security and simplifies compliance
  • Better scalability – Distributing workloads across clusters enables horizontal scaling to handle peak demands
  • Performance benefits – Minimizing Kubernetes scheduling delays and network bandwidth contention improves job runtimes
  • Increased flexibility – You can enjoy straightforward experimentation and cost optimization through workload segregation to multiple clusters

However, one of the disadvantages of a multi-cluster setup is that there is no straightforward method to distribute workloads and support effective load balancing across multiple clusters. This post proposes a solution to this challenge by introducing the Batch Processing Gateway (BPG), a centralized gateway that automates job management and routing in multi-cluster environments.

Challenges with multi-cluster environments

In a multi-cluster environment, Spark jobs on Amazon EMR on EKS need to be submitted to different clusters from various clients. This architecture introduces several key challenges:

  • Endpoint management – Clients must maintain and update connections for each target cluster
  • Operational overhead – Managing multiple client connections individually increases the complexity and operational burden
  • Workload distribution – There is no built-in mechanism for job routing across multiple clusters, which impacts configuration, resource allocation, cost transparency, and resilience
  • Resilience and high availability – Without load balancing, the environment lacks fault tolerance and high availability

BPG addresses these challenges by providing a single point of submission for Spark jobs. BPG automates job routing to the appropriate EMR on EKS clusters, providing effective load balancing, simplified endpoint management, and improved resilience. The proposed solution is particularly beneficial for customers with multi-cluster Amazon EMR on EKS setups using the Spark Kubernetes Operator with or without Yunikorn scheduler.

However, although BPG offers significant benefits, it is currently designed to work only with Spark Kubernetes Operator. Additionally, BPG has not been tested with the Volcano scheduler, and the solution is not applicable in environments using native Amazon EMR on EKS APIs.

Solution overview

Martin Fowler describes a gateway as an object that encapsulates access to an external system or resource. In this case, the resource is the EMR on EKS clusters running Spark. A gateway acts as a single point to confront this resource. Any code or connection interacts with the interface of the gateway only. The gateway then translates the incoming API request into the API offered by the resource.

BPG is a gateway specifically designed to provide a seamless interface to Spark on Kubernetes. It’s a REST API service to abstract the underlying Spark on EKS clusters details from users. It runs in its own EKS cluster communicating to Kubernetes API servers of different EKS clusters. Spark users submit an application to BPG through clients, then BPG routes the application to one of the underlying EKS clusters.

The process for submitting Spark jobs using BPG for Amazon EMR on EKS is as follows:

  1. The user submits a job to BPG using a client.
  2. BPG parses the request, translates it into a custom resource definition (CRD), and submits the CRD to an EMR on EKS cluster according to predefined rules.
  3. The Spark Kubernetes Operator interprets the job specification and initiates the job on the cluster.
  4. The Kubernetes scheduler schedules and manages the run of the jobs.

The following figure illustrates the high-level details of BPG. You can read more about BPG in the GitHub README.

Image showing the high-level details of Batch Processing Gateway

The proposed solution involves implementing BPG for multiple underlying EMR on EKS clusters, which effectively resolves the drawbacks discussed earlier. The following diagram illustrates the details of the solution.

Image showing the end to end architecture of of Batch Processing Gateway

Source Code

You can find the code base in the AWS Samples and Batch Processing Gateway GitHub repository.

In the following sections, we walk through the steps to implement the solution.

Prerequisites

Before you deploy this solution, make sure the following prerequisites are in place:

Clone the repositories to your local machine

We assume that all repositories are cloned into the home directory (~/). All relative paths provided are based on this assumption. If you have cloned the repositories to a different location, adjust the paths accordingly.

  1. Clone the BPG on EMR on EKS GitHub repo with the following command:
cd ~/
git clone [email protected]:aws-samples/batch-processing-gateway-on-emr-on-eks.git

The BPG repository is currently under active development. To provide a stable deployment experience consistent with the provided instructions, we have pinned the repository to the stable commit hash aa3e5c8be973bee54ac700ada963667e5913c865.

Before cloning the repository, verify any security updates and adhere to your organization’s security practices.

  1. Clone the BPG GitHub repo with the following command:
git clone [email protected]:apple/batch-processing-gateway.git
cd batch-processing-gateway
git checkout aa3e5c8be973bee54ac700ada963667e5913c865

Create two EMR on EKS clusters

The creation of EMR on EKS clusters is not the primary focus of this post. For comprehensive instructions, refer to Running Spark jobs with the Spark operator. However, for your convenience, we have included the steps for setting up the EMR on EKS virtual clusters named spark-cluster-a-v and spark-cluster-b-v in the GitHub repo. Follow these steps to create the clusters.

After successfully completing the steps, you should have two EMR on EKS virtual clusters named spark-cluster-a-v and spark-cluster-b-v running on the EKS clusters spark-cluster-a and spark-cluster-b, respectively.

To verify the successful creation of the clusters, open the Amazon EMR console and choose Virtual clusters under EMR on EKS in the navigation pane.

Image showing the Amazon EMR on EKS setup

Set up BPG on Amazon EKS

To set up BPG on Amazon EKS, complete the following steps:

  1. Change to the appropriate directory:
cd ~/batch-processing-gateway-on-emr-on-eks/bpg/
  1. Set up the AWS Region:
export AWS_REGION="<AWS_REGION>"
  1. Create a key pair. Make sure you follow your organization’s best practices for key pair management.
aws ec2 create-key-pair \
--region "$AWS_REGION" \
--key-name ekskp \
--key-type ed25519 \
--key-format pem \
--query "KeyMaterial" \
--output text > ekskp.pem
chmod 400 ekskp.pem
ssh-keygen -y -f ekskp.pem > eks_publickey.pem
chmod 400 eks_publickey.pem

Now you’re ready to create the EKS cluster.

By default, eksctl creates an EKS cluster in dedicated virtual private clouds (VPCs). To avoid reaching the default soft limit on the number of VPCs in an account, we use the --vpc-public-subnets parameter to create clusters in an existing VPC. For this post, we use the default VPC for deploying the solution. Modify the following code to deploy the solution in the appropriate VPC in accordance with your organization’s best practices. For official guidance, refer to Create a VPC.

  1. Get the public subnets for your VPC:
export DEFAULT_FOR_AZ_SUBNET=$(aws ec2 describe-subnets --region "$AWS_REGION" --filters "Name=default-for-az,Values=true" --query "Subnets[?AvailabilityZone != 'us-east-1e'].SubnetId" | jq -r '. | map(tostring) | join(",")')
  1. Create the cluster:
eksctl create cluster \
--name bpg-cluster \
--region "$AWS_REGION" \
--vpc-public-subnets "$DEFAULT_FOR_AZ_SUBNET" \
--with-oidc \
--ssh-access \
--ssh-public-key eks_publickey.pem \
--instance-types=m5.xlarge \
--managed
  1. On the Amazon EKS console, choose Clusters in the navigation pane and check for the successful provisioning of the bpg-cluster

Image showing the Amazon EKS based BPG cluster setup

In the next steps, we make the following changes to the existing batch-processing-gateway code base:

For your convenience, we have provided the updated files in the batch-processing-gateway-on-emr-on-eks repository. You can copy these files into the batch-processing-gateway repository.

  1. Replace POM xml file:
cp ~/batch-processing-gateway-on-emr-on-eks/bpg/pom.xml ~/batch-processing-gateway/pom.xml
  1. Replace DAO java file:
cp ~/batch-processing-gateway-on-emr-on-eks/bpg/LogDao.java ~/batch-processing-gateway/src/main/java/com/apple/spark/core/LogDao.java
  1. Replace the Dockerfile:
cp ~/batch-processing-gateway-on-emr-on-eks/bpg/Dockerfile ~/batch-processing-gateway/Dockerfile

Now you’re ready to build your Docker image.

  1. Create a private Amazon Elastic Container Registry (Amazon ECR) repository:
aws ecr create-repository --repository-name bpg --region "$AWS_REGION"
  1. Get the AWS account ID:
export AWS_ACCOUNT_ID=$(aws sts get-caller-identity --query "Account" --output text)

  1. Authenticate Docker to your ECR registry:
aws ecr get-login-password --region "$AWS_REGION" | docker login --username AWS --password-stdin "$AWS_ACCOUNT_ID".dkr.ecr."$AWS_REGION".amazonaws.com
  1. Build your Docker image:
cd ~/batch-processing-gateway/
docker build \
--platform linux/amd64 \
--build-arg VERSION="1.0.0" \
--build-arg BUILD_TIME=$(date -u +"%Y-%m-%dT%H:%M:%SZ") \
--build-arg GIT_COMMIT=$(git rev-parse HEAD) \
--progress=plain \
--no-cache \
-t bpg:1.0.0 .
  1. Tag your image:
docker tag bpg:1.0.0 "$AWS_ACCOUNT_ID".dkr.ecr."$AWS_REGION".amazonaws.com/bpg:1.0.0
  1. Push the image to your ECR repository:
docker push "$AWS_ACCOUNT_ID".dkr.ecr."$AWS_REGION".amazonaws.com/bpg:1.0.0

The ImagePullPolicy in the batch-processing-gateway GitHub repo is set to IfNotPresent. Update the image tag in case you need to update the image.

  1. To verify the successful creation and upload of the Docker image, open the Amazon ECR console, choose Repositories under Private registry in the navigation pane, and locate the bpg repository:

Image showing the Amazon ECR setup

Set up an Amazon Aurora MySQL database

Complete the following steps to set up an Amazon Aurora MySQL-Compatible Edition database:

  1. List all default subnets for the given Availability Zone in a specific format:
DEFAULT_FOR_AZ_SUBNET_RFMT=$(aws ec2 describe-subnets --region "$AWS_REGION" --filters "Name=default-for-az,Values=true" --query "Subnets[*].SubnetId" | jq -c '.')
  1. Create a subnet group. Refer to create-db-subnet-group for more details.
aws rds create-db-subnet-group \
--db-subnet-group-name bpg-rds-subnetgroup \
--db-subnet-group-description "BPG Subnet Group for RDS" \
--subnet-ids "$DEFAULT_FOR_AZ_SUBNET_RFMT" \
--region "$AWS_REGION"
  1. List the default VPC:
export DEFAULT_VPC=$(aws ec2 describe-vpcs --region "$AWS_REGION" --filters "Name=isDefault,Values=true" --query "Vpcs[0].VpcId" --output text)
  1. Create a security group:
aws ec2 create-security-group \
--group-name bpg-rds-securitygroup \
--description "BPG Security Group for RDS" \
--vpc-id "$DEFAULT_VPC" \
--region "$AWS_REGION"
  1. List the bpg-rds-securitygroup security group ID:
export BPG_RDS_SG=$(aws ec2 describe-security-groups --filters "Name=group-name,Values=bpg-rds-securitygroup" --query "SecurityGroups[*].GroupId" --output text)
  1. Create the Aurora DB Regional cluster. Refer to create-db-cluster for more details.
aws rds create-db-cluster \
--database-name bpg \
--db-cluster-identifier bpg \
--engine aurora-mysql \
--engine-version 8.0.mysql_aurora.3.06.1 \
--master-username admin \
--manage-master-user-password \
--db-subnet-group-name bpg-rds-subnetgroup \
--vpc-security-group-ids "$BPG_RDS_SG" \
--region "$AWS_REGION"
  1. Create a DB Writer instance in the cluster. Refer to create-db-instance for more details.
aws rds create-db-instance \
--db-instance-identifier bpg \
--db-cluster-identifier bpg \
--db-instance-class db.r5.large \
--engine aurora-mysql \
--region "$AWS_REGION"

  1. To verify the successful creation of the RDS Regional cluster and Writer instance, on the Amazon RDS console, choose Databases in the navigation pane and check for the bpg database.

Image showing the RDS setup

Set up network connectivity

Security groups for EKS clusters are typically associated with the nodes and the control plane (if using managed nodes). In this section, we configure the networking to allow the node security group of the bpg-cluster to communicate with spark-cluster-a, spark-cluster-b, and the bpg Aurora RDS cluster.

  1. Identify the security groups of bpg-cluster, spark-cluster-a, spark-cluster-b, and the bpg Aurora RDS cluster:
# Identify Node Security Group of the bpg-cluster
BPG_CLUSTER_NODEGROUP_SG=$(aws ec2 describe-instances \
--filters Name=tag:eks:cluster-name,Values=bpg-cluster \
--query "Reservations[*].Instances[*].SecurityGroups[?contains(GroupName, 'eks-cluster-sg-bpg-cluster-')].GroupId" \
--region "$AWS_REGION" \
--output text | uniq)

# Identify Cluster security group of spark-cluster-a and spark-cluster-b
SPARK_A_CLUSTER_SG=$(aws eks describe-cluster --name spark-cluster-a --query "cluster.resourcesVpcConfig.clusterSecurityGroupId" --output text)
SPARK_B_CLUSTER_SG=$(aws eks describe-cluster --name spark-cluster-b --query "cluster.resourcesVpcConfig.clusterSecurityGroupId" --output text)

# Identify Cluster security group of bpg Aurora RDS cluster Writer Instance
BPG_RDS_WRITER_SG=$(aws ec2 describe-security-groups --filters "Name=group-name,Values=bpg-rds-securitygroup" --query "SecurityGroups[*].GroupId" --output text)

  1. Allow the node security group of the bpg-cluster to communicate with spark-cluster-a, spark-cluster-b, and the bpg Aurora RDS cluster:
# spark-cluster-a
aws ec2 authorize-security-group-ingress --group-id "$SPARK_A_CLUSTER_SG" --protocol tcp --port 443 --source-group "$BPG_CLUSTER_NODEGROUP_SG"

# spark-cluster-b
aws ec2 authorize-security-group-ingress --group-id "$SPARK_B_CLUSTER_SG" --protocol tcp --port 443 --source-group "$BPG_CLUSTER_NODEGROUP_SG"

# bpg-rds
aws ec2 authorize-security-group-ingress --group-id "$BPG_RDS_WRITER_SG" --protocol tcp --port 3306 --source-group "$BPG_CLUSTER_NODEGROUP_SG"

Deploy BPG

We deploy BPG for weight-based cluster selection. spark-cluster-a-v and spark-cluster-b-v are configured with a queue named dev and weight=50. We expect statistically equal distribution of jobs between the two clusters. For more information, refer to Weight Based Cluster Selection.

  1. Get the bpg-cluster context:
BPG_CLUSTER_CONTEXT=$(kubectl config view --output=json | jq -r '.contexts[] | select(.name | contains("bpg-cluster")) | .name')
kubectl config use-context "$BPG_CLUSTER_CONTEXT"

  1. Create a Kubernetes namespace for BPG:
kubectl create namespace bpg

The helm chart for BPG requires a values.yaml file. This file includes various key-value pairs for each EMR on EKS clusters, EKS cluster, and Aurora cluster. Manually updating the values.yaml file can be cumbersome. To simplify this process, we’ve automated the creation of the values.yaml file.

  1. Run the following script to generate the values.yaml file:
cd ~/batch-processing-gateway-on-emr-on-eks/bpg
chmod 755 create-bpg-values-yaml.sh
./create-bpg-values-yaml.sh
  1. Use the following code to deploy the helm chart. Make sure the tag value in both values.template.yaml and values.yaml matches the Docker image tag specified earlier.
cp ~/batch-processing-gateway/helm/batch-processing-gateway/values.yaml ~/batch-processing-gateway/helm/batch-processing-gateway/values.yaml.$(date +'%Y%m%d%H%M%S') \
&& cp ~/batch-processing-gateway-on-emr-on-eks/bpg/values.yaml ~/batch-processing-gateway/helm/batch-processing-gateway/values.yaml \
&& cd ~/batch-processing-gateway/helm/batch-processing-gateway/

kubectl config use-context "$BPG_CLUSTER_CONTEXT"

helm install batch-processing-gateway . --values values.yaml -n bpg

  1. Verify the deployment by listing the pods and viewing the pod logs:
kubectl get pods --namespace bpg
kubectl logs <BPG-PODNAME> --namespace bpg
  1. Exec into the BPG pod and verify the health check:
kubectl exec -it <BPG-PODNAME> -n bpg -- bash 
curl -u admin:admin localhost:8080/skatev2/healthcheck/status

We get the following output:

{"status":"OK"}

BPG is successfully deployed on the EKS cluster.

Test the solution

To test the solution, you can submit multiple Spark jobs by running the following sample code multiple times. The code submits the SparkPi Spark job to the BPG, which in turn submits the jobs to the EMR on EKS cluster based on the set parameters.

  1. Set the kubectl context to the bpg cluster:
kubectl config get-contexts | awk 'NR==1 || /bpg-cluster/'
kubectl config use-context "<CONTEXT_NAME>"
  1. Identify the bpg pod name:
kubectl get pods --namespace bpg
  1. Exec into the bpg pod:

kubectl exec -it "<BPG-PODNAME>" -n bpg -- bash

  1. Submit multiple Spark jobs using the curl. Run the below curl command to submit jobs to spark-cluster-a and spark-cluster-b:
curl -u user:pass localhost:8080/skatev2/spark -i -X POST \
-H 'Content-Type: application/json' \
-d '{
"applicationName": "SparkPiDemo",
"queue": "dev",
"sparkVersion": "3.5.0",
"mainApplicationFile": "local:///usr/lib/spark/examples/jars/spark-examples.jar",
"mainClass":"org.apache.spark.examples.SparkPi",
"driver": {
"cores": 1,
"memory": "2g",
"serviceAccount": "emr-containers-sa-spark",
"labels":{
"version": "3.5.0"
}
},
"executor": {
"instances": 1,
"cores": 1,
"memory": "2g",
"labels":{
"version": "3.5.0"
}
}
}'

After each submission, BPG will inform you of the cluster to which the job was submitted. For example:

HTTP/1.1 200 OK
Date: Sat, 10 Aug 2024 16:17:15 GMT
Content-Type: application/json
Content-Length: 67
{"submissionId":"spark-cluster-a-f72a7ddcfde14f4390194d4027c1e1d6"}
{"submissionId":"spark-cluster-a-d1b359190c7646fa9d704122fbf8c580"}
{"submissionId":"spark-cluster-b-7b61d5d512bb4adeb1dd8a9977d605df"}
  1. Verify that the jobs are running in the EMR cluster spark-cluster-a and spark-cluster-b:
kubectl config get-contexts | awk 'NR==1 || /spark-cluster-(a|b)/'
kubectl get pods -n spark-operator --context "<CONTEXT_NAME>"

You can view the Spark Driver logs to find the value of Pi as shown below:

kubectl logs <SPARK-DRIVER-POD-NAME> --namespace spark-operator --context "<CONTEXT_NAME>"

After successful completion of the job, you should be able to see the below message in the logs:

Pi is roughly 3.1452757263786317

We have successfully tested the weight-based routing of Spark jobs across multiple clusters.

Clean up

To clean up your resources, complete the following steps:

  1. Delete the EMR on EKS virtual cluster:
VIRTUAL_CLUSTER_ID=$(aws emr-containers list-virtual-clusters --region="$AWS_REGION" --query "virtualClusters[?name=='spark-cluster-a-v' && state=='RUNNING'].id" --output text)
aws emr-containers delete-virtual-cluster --region="$AWS_REGION" --id "$VIRTUAL_CLUSTER_ID"
VIRTUAL_CLUSTER_ID=$(aws emr-containers list-virtual-clusters --region="$AWS_REGION" --query "virtualClusters[?name=='spark-cluster-b-v' && state=='RUNNING'].id" --output text)
aws emr-containers delete-virtual-cluster --region="$AWS_REGION" --id "$VIRTUAL_CLUSTER_ID"

  1. Delete the AWS Identity and Access Management (IAM) role:
aws iam delete-role-policy --role-name sparkjobrole --policy-name EMR-Spark-Job-Execution
aws iam delete-role --role-name sparkjobrole

  1. Delete the RDS DB instance and DB cluster:
aws rds delete-db-instance \
--db-instance-identifier bpg \
--skip-final-snapshot

aws rds delete-db-cluster \
--db-cluster-identifier bpg \
--skip-final-snapshot

  1. Delete the bpg-rds-securitygroup security group and bpg-rds-subnetgroup subnet group:
BPG_SG=$(aws ec2 describe-security-groups --filters "Name=group-name,Values=bpg-rds-securitygroup" --query "SecurityGroups[*].GroupId" --output text)
aws ec2 delete-security-group --group-id "$BPG_SG"
aws rds delete-db-subnet-group --db-subnet-group-name bpg-rds-subnetgroup

  1. Delete the EKS clusters:
eksctl delete cluster --region="$AWS_REGION" --name=bpg-cluster
eksctl delete cluster --region="$AWS_REGION" --name=spark-cluster-a
eksctl delete cluster --region="$AWS_REGION" --name=spark-cluster-b

  1. Delete bpg ECR repository:
aws ecr delete-repository --repository-name bpg --region="$AWS_REGION" --force

  1. Delete the key pairs:
aws ec2 delete-key-pair --key-name ekskp
aws ec2 delete-key-pair --key-name emrkp

Conclusion

In this post, we explored the challenges associated with managing workloads on EMR on EKS cluster and demonstrated the advantages of adopting a multi-cluster deployment pattern. We introduced Batch Processing Gateway (BPG) as a solution to these challenges, showcasing how it simplifies job management, enhances resilience, and improves horizontal scalability in multi-cluster environments. By implementing BPG, we illustrated the practical application of the gateway architecture pattern for submitting Spark jobs on Amazon EMR on EKS. This post provides a comprehensive understanding of the problem, the benefits of the gateway architecture, and the steps to implement BPG effectively.

We encourage you to evaluate your existing Spark on Amazon EMR on EKS implementation and consider adopting this solution. It allows users to submit, examine, and delete Spark applications on Kubernetes with intuitive API calls, without needing to worry about the underlying complexities.

For this post, we focused on the implementation details of the BPG. As a next step, you can explore integrating BPG with clients such as Apache Airflow, Amazon Managed Workflows for Apache Airflow (Amazon MWAA), or Jupyter notebooks. BPG works well with the Apache Yunikorn scheduler. You can also explore integrating BPG to use Yunikorn queues for job submission.


About the Authors

Image of Author: Umair NawazUmair Nawaz is a Senior DevOps Architect at Amazon Web Services. He works on building secure architectures and advises enterprises on agile software delivery. He is motivated to solve problems strategically by utilizing modern technologies.

Image of Author: Ravikiran RaoRavikiran Rao is a Data Architect at Amazon Web Services and is passionate about solving complex data challenges for various customers. Outside of work, he is a theater enthusiast and amateur tennis player.

Image of Author: Sri PotluriSri Potluri is a Cloud Infrastructure Architect at Amazon Web Services. He is passionate about solving complex problems and delivering well-structured solutions for diverse customers. His expertise spans across a range of cloud technologies, ensuring scalable and reliable infrastructure tailored to each project’s unique challenges.

Image of Author: Suvojit DasguptaSuvojit Dasgupta is a Principal Data Architect at Amazon Web Services. He leads a team of skilled engineers in designing and building scalable data solutions for AWS customers. He specializes in developing and implementing innovative data architectures to address complex business challenges.

How ZS built a clinical knowledge repository for semantic search using Amazon OpenSearch Service and Amazon Neptune

Post Syndicated from Abhishek Pan original https://aws.amazon.com/blogs/big-data/how-zs-built-a-clinical-knowledge-repository-for-semantic-search-using-amazon-opensearch-service-and-amazon-neptune/

In this blog post, we will highlight how ZS Associates used multiple AWS services to build a highly scalable, highly performant, clinical document search platform. This platform is an advanced information retrieval system engineered to assist healthcare professionals and researchers in navigating vast repositories of medical documents, medical literature, research articles, clinical guidelines, protocol documents, activity logs, and more. The goal of this search platform is to locate specific information efficiently and accurately to support clinical decision-making, research, and other healthcare-related activities by combining queries across all the different types of clinical documentation.

ZS is a management consulting and technology firm focused on transforming global healthcare. We use leading-edge analytics, data, and science to help clients make intelligent decisions. We serve clients in a wide range of industries, including pharmaceuticals, healthcare, technology, financial services, and consumer goods. We developed and host several applications for our customers on Amazon Web Services (AWS). ZS is also an AWS Advanced Consulting Partner as well as an Amazon Redshift Service Delivery Partner. As it relates to the use case in the post, ZS is a global leader in integrated evidence and strategy planning (IESP), a set of services that help pharmaceutical companies to deliver a complete and differentiated evidence package for new medicines.

ZS uses several AWS service offerings across the variety of their products, client solutions, and services. AWS services such as Amazon Neptune and Amazon OpenSearch Service form part of their data and analytics pipelines, and AWS Batch is used for long-running data and machine learning (ML) processing tasks.

Clinical data is highly connected in nature, so ZS used Neptune, a fully managed, high performance graph database service built for the cloud, as the database to capture the ontologies and taxonomies associated with the data that formed the supporting a knowledge graph. For our search requirements, We have used OpenSearch Service, an open source, distributed search and analytics suite.

About the clinical document search platform

Clinical documents comprise of a wide variety of digital records including:

  • Study protocols
  • Evidence gaps
  • Clinical activities
  • Publications

Within global biopharmaceutical companies, there are several key personas who are responsible to generate evidence for new medicines. This evidence supports decisions by payers, health technology assessments (HTAs), physicians, and patients when making treatment decisions. Evidence generation is rife with knowledge management challenges. Over the life of a pharmaceutical asset, hundreds of studies and analyses are completed, and it becomes challenging to maintain a good record of all the evidence to address incoming questions from external healthcare stakeholders such as payers, providers, physicians, and patients. Furthermore, almost none of the information associated with evidence generation activities (such as health economics and outcomes research (HEOR), real-world evidence (RWE), collaboration studies, and investigator sponsored research (ISR)) exists as structured data; instead, the richness of the evidence activities exists in protocol documents (study design) and study reports (outcomes). Therein lies the irony—teams who are in the business of knowledge generation struggle with knowledge management.

ZS unlocked new value from unstructured data for evidence generation leads by applying large language models (LLMs) and generative artificial intelligence (AI) to power advanced semantic search on evidence protocols. Now, evidence generation leads (medical affairs, HEOR, and RWE) can have a natural-language, conversational exchange and return a list of evidence activities with high relevance considering both structured data and the details of the studies from unstructured sources.

Overview of solution

The solution was designed in layers. The document processing layer supports document ingestion and orchestration. The semantic search platform (application) layer supports backend search and the user interface. Multiple different types of data sources, including media, documents, and external taxonomies, were identified as relevant for capture and processing within the semantic search platform.

Document processing solution framework layer

All components and sub-layers are orchestrated using Amazon Managed Workflows for Apache Airflow. The pipeline in Airflow is scaled automatically based on the workload using Batch. We can broadly divide layers here as shown in the following figure:

This diagram represents document processing solution framework layers. It provide details of Orchestration Pipeline which is hosted in Amazon MWAA and which contains components like Data Crawling, Data Ingestion, NLP layer and finally Database Ingestion.

Document Processing Solution Framework Layers

Data crawling:

In the data crawling layer, documents are retrieved from a specified source SharePoint location and deposited into a designated Amazon Simple Storage Service (Amazon S3) bucket. These documents could be in variety of formats, such as PDF, Microsoft Word, and Excel, and are processed using format-specific adapters.

Data ingestion:

  • The data ingestion layer is the first step of the proposed framework. At this later, data from a variety of sources smoothly enters the system’s advanced processing setup. In the pipeline, the data ingestion process takes shape through a thoughtfully structured sequence of steps.
  • These steps include creating a unique run ID each time a pipeline is run, managing natural language processing (NLP) model versions in the versioning table, identifying document formats, and ensuring the health of NLP model services with a service health check.
  • The process then proceeds with the transfer of data from the input layer to the landing layer, creation of dynamic batches, and continuous tracking of document processing status throughout the run. In case of any issues, a failsafe mechanism halts the process, enabling a smooth transition to the NLP phase of the framework.

Database ingestion:

The reporting layer processes the JSON data from the feature extraction layer and converts it into CSV files. Each CSV file contains specific information extracted from dedicated sections of documents. Subsequently, the pipeline generates a triple file using the data from these CSV files, where each set of entities signifies relationships in a subject-predicate-object format. This triple file is intended for ingestion into Neptune and OpenSearch Service. In the full document embedding module, the document content is segmented into chunks, which are then transformed into embeddings using LLMs such as llama-2 and BGE. These embeddings, along with metadata such as the document ID and page number, are stored in OpenSearch Service. We use various chunking strategies to enhance text comprehension. Semantic chunking divides text into sentences, grouping them into sets, and merges similar ones based on embeddings.

Agentic chunking uses LLMs to determine context-driven chunk sizes, focusing on proposition-based division and simplifying complex sentences. Additionally, context and document aware chunking adapts chunking logic to the nature of the content for more effective processing.

NLP:

The NLP layer serves as a crucial component in extracting specific sections or entities from documents. The feature extraction stage proceeds with localization, where sections are identified within the document to narrow down the search space for further tasks like entity extraction. LLMs are used to summarize the text extracted from document sections, enhancing the efficiency of this process. Following localization, the feature extraction step involves extracting features from the identified sections using various procedures. These procedures, prioritized based on their relevance, use models like Llama-2-7b, mistral-7b, Flan-t5-xl, and Flan-T5-xxl to extract important features and entities from the document text.

The auto-mapping phase ensures consistency by mapping extracted features to standard terms present in the ontology. This is achieved through matching the embeddings of extracted features with those stored in the OpenSearch Service index. Finally, in the Document Layout Cohesion step, the output from the auto-mapping phase is adjusted to aggregate entities at the document level, providing a cohesive representation of the document’s content.

Semantic search platform application layer

This layer, shown in the following figure, uses Neptune as the graph database and OpenSearch Service as the vector engine.

Semantic search platform application layer

Semantic search platform application layer

Amazon OpenSearch Service:

OpenSearch Service served the dual purpose of facilitating full-text search and embedding-based semantic search. The OpenSearch Service vector engine capability helped to drive Retrieval-Augmented Generation (RAG) workflows using LLMs. This helped to provide a summarized output for search after the retrieval of a relevant document for the input query. The method used for indexing embeddings was FAISS.

OpenSearch Service domain details:

  • Version of OpenSearch Service: 2.9
  • Number of nodes: 1
  • Instance type: r6g.2xlarge.search
  • Volume size: Gp3: 500gb
  • Number of Availability Zones: 1
  • Dedicated master node: Enabled
  • Number of Availability Zones: 3
  • No of master Nodes: 3
  • Instance type(Master Node) : r6g.large.search

To determine the nearest neighbor, we employ the Hierarchical Navigable Small World (HNSW) algorithm. We used the FAISS approximate k-NN library for indexing and searching and the Euclidean distance (L2 norm) for distance calculation between two vectors.

Amazon Neptune:

Neptune enables full-text search (FTS) through the integration with OpenSearch Service. A native streaming service for enabling FTS provided by AWS was established to replicate data from Neptune to OpenSearch Service. Based on the business use case for search, a graph model was defined. Considering the graph model, subject matter experts from the ZS domain team curated custom taxonomy capturing hierarchical flow of classes and sub-classes pertaining to clinical data. Open source taxonomies and ontologies were also identified, which would be part of the knowledge graph. Sections and entities were identified to be extracted from clinical documents. An unstructured document processing pipeline developed by ZS processed the documents in parallel and populated triples in RDF format from documents for Neptune ingestion.

The triples are created in such a way that semantically similar concepts are linked—hence creating a semantic layer for search. After the triples files are created, they’re stored in an S3 bucket. Using the Neptune Bulk Loader, we were able to load millions of triples to the graph.

Neptune ingests both structured and unstructured data, simplifying the process to retrieve content across different sources and formats. At this point, we were able to discover previously unknown relationships between the structured and unstructured data, which was then made available to the search platform. We used SPARQL query federation to return results from the enriched knowledge graph in the Neptune graph database and integrated with OpenSearch Service.

Neptune was able to automatically scale storage and compute resources to accommodate growing datasets and concurrent API calls. Presently, the application sustains approximately 3,000 daily active users. Concurrently, there is an observation of approximately 30–50 users initiating queries simultaneously within the application environment. The Neptune graph accommodates a substantial repository of approximately 4.87 million triples. The triples count is increasing because of our daily and weekly ingestion pipeline routines.

Neptune configuration:

  • Instance Class: db.r5d.4xlarge
  • Engine version: 1.2.0.1

LLMs:

Large language models (LLMs) like Llama-2, Mistral and Zephyr are used for extraction of sections and entities. Models like Flan-t5 were also used for extraction of other similar entities used in the procedures. These selected segments and entities are crucial for domain-specific searches and therefore receive higher priority in the learning-to-rank algorithm used for search.

Additionally, LLMs are used to generate a comprehensive summary of the top search results.

The LLMs are hosted on Amazon Elastic Kubernetes Service (Amazon EKS) with GPU-enabled node groups to ensure rapid inference processing. We’re using different models for different use cases. For example, to generate embeddings we deployed a BGE base model, while Mistral, Llama2, Zephyr, and others are used to extract specific medical entities, perform part extraction, and summarize search results. By using different LLMs for distinct tasks, we aim to enhance accuracy within narrow domains, thereby improving the overall relevance of the system.

Fine tuning :

Already fine-tuned models on pharma-specific documents were used. The models used were:

  • PharMolix/BioMedGPT-LM-7B (finetuned LLAMA-2 on medical)
  • emilyalsentzer/Bio_ClinicalBERT
  • stanford-crfm/BioMedLM
  • microsoft/biogpt

Re ranker, sorter, and filter stage:

Remove any stop words and special characters from the user input query to ensure a clean query. Upon pre-processing the query, create combinations of search terms by forming combinations of terms with varying n-grams. This step enriches the search scope and improves the chances of finding relevant results. For instance, if the input query is “machine learning algorithms,” generating n-grams could result in terms like “machine learning,” “learning algorithms,” and “machine learning algorithms”. Run the search terms simultaneously using the search API to access both Neptune graph and OpenSearch Service indexes. This hybrid approach broadens the search coverage, tapping into the strengths of both data sources. Specific weight is assigned to each result obtained from the data sources based on the domain’s specifications. This weight reflects the relevance and significance of the result within the context of the search query and the underlying domain. For example, a result from Neptune graph might be weighted higher if the query pertains to graph-related concepts, i.e. the search term is related directly to the subject or object of a triple, whereas a result from OpenSearch Service might be given more weightage if it aligns closely with text-based information. Documents that appear in both Neptune graph and OpenSearch Service receive the highest priority, because they likely offer comprehensive insights. Next in priority are documents exclusively sourced from the Neptune graph, followed by those solely from OpenSearch Service. This hierarchical arrangement ensures that the most relevant and comprehensive results are presented first. After factoring in these considerations, a final score is calculated for each result. Sorting the results based on their final scores ensures that the most relevant information is presented in the top n results.

Final UI

An evidence catalogue is aggregated from disparate systems. It provides a comprehensive repository of completed, ongoing and planned evidence generation activities. As evidence leads make forward-looking plans, the existing internal base of evidence is made readily available to inform decision-making.

The following video is a demonstration of an evidence catalog:

Customer impact

When completed, the solution provided the following customer benefits:

  • The search on multiple data source (structured and unstructured documents) enables visibility of complex hidden relationships and insights.
  • Clinical documents often contain a mix of structured and unstructured data. Neptune can store structured information in a graph format, while the vector database can handle unstructured data using embeddings. This integration provides a comprehensive approach to querying and analyzing diverse clinical information.
  • By building a knowledge graph using Neptune, you can enrich the clinical data with additional contextual information. This can include relationships between diseases, treatments, medications, and patient records, providing a more holistic view of healthcare data.
  • The search application helped in staying informed about the latest research, clinical developments, and competitive landscape.
  • This has enabled customers to make timely decisions, identify market trends, and help positioning of products based on a comprehensive understanding of the industry.
  • The application helped in monitoring adverse events, tracking safety signals, and ensuring that drug-related information is easily accessible and understandable, thereby supporting pharmacovigilance efforts.
  • The search application is currently running in production with 3000 active users.

Customer success criteria

The following success criteria were use to evaluate the solution:

  • Quick, high accuracy search results: The top three search results were 99% accurate with an overall latency of less than 3 seconds for users.
  • Identified, extracted portions of the protocol: The sections identified has a precision of 0.98 and recall of 0.87.
  • Accurate and relevant search results based on simple human language that answer the user’s question.
  • Clear UI and transparency on which portions of the aligned documents (protocol, clinical study reports, and publications) matched the text extraction.
  • Knowing what evidence is completed or in-process reduces redundancy in newly proposed evidence activities.

Challenges faced and learnings

We faced two main challenges in developing and deploying this solution.

Large data volume

The unstructured documents were required to be embedded completely and OpenSearch Service helped us achieve this with the right configuration. This involved deploying OpenSearch Service with master nodes and allocating sufficient storage capacity for embedding and storing unstructured document embeddings entirely. We stored up to 100 GB of embeddings in OpenSearch Service.

Inference time reduction

In the search application, it was vital that the search results were retrieved with lowest possible latency. With the hybrid graph and embedding search, this was challenging.

We addressed high latency issues by using an interconnected framework of graphs and embeddings. Each search method complemented the other, leading to optimal results. Our streamlined search approach ensures efficient queries of both the graph and the embeddings, eliminating any inefficiencies. The graph model was designed to minimize the number of hops required to navigate from one entity to another, and we improved its performance by avoiding the storage of bulky metadata. Any metadata too large for the graph was stored in OpenSearch, which served as our metadata store for graph and vector store for embeddings. Embeddings were generated using context-aware chunking of content to reduce the total embedding count and retrieval time, resulting in efficient querying with minimal inference time.

The Horizontal Pod Autoscaler (HPA) provided by Amazon EKS, intelligently adjusts pod resources based on user-demand or query loads, optimizing resource utilization and maintaining application performance during peak usage periods.

Conclusion

In this post, we described how to build an advanced information retrieval system designed to assist healthcare professionals and researchers in navigating through a diverse range of medical documents, including study protocols, evidence gaps, clinical activities, and publications. By using Amazon OpenSearch Service as a distributed search and vector database and Amazon Neptune as a knowledge graph, ZS was able to remove the undifferentiated heavy lifting associated with building and maintaining such a complex platform.

If you’re facing similar challenges in managing and searching through vast repositories of medical data, consider exploring the powerful capabilities of OpenSearch Service and Neptune. These services can help you unlock new insights and enhance your organization’s knowledge management capabilities.


About the authors

Abhishek Pan is a Sr. Specialist SA-Data working with AWS India Public sector customers. He engages with customers to define data-driven strategy, provide deep dive sessions on analytics use cases, and design scalable and performant analytical applications. He has 12 years of experience and is passionate about databases, analytics, and AI/ML. He is an avid traveler and tries to capture the world through his lens.

Gourang Harhare is a Senior Solutions Architect at AWS based in Pune, India. With a robust background in large-scale design and implementation of enterprise systems, application modernization, and cloud native architectures, he specializes in AI/ML, serverless, and container technologies. He enjoys solving complex problems and helping customer be successful on AWS. In his free time, he likes to play table tennis, enjoy trekking, or read books

Kevin Phillips is a Neptune Specialist Solutions Architect working in the UK. He has 20 years of development and solutions architectural experience, which he uses to help support and guide customers. He has been enthusiastic about evangelizing graph databases since joining the Amazon Neptune team, and is happy to talk graph with anyone who will listen.

Sandeep Varma is a principal in ZS’s Pune, India, office with over 25 years of technology consulting experience, which includes architecting and delivering innovative solutions for complex business problems leveraging AI and technology. Sandeep has been critical in driving various large-scale programs at ZS Associates. He was the founding member the Big Data Analytics Centre of Excellence in ZS and currently leads the Enterprise Service Center of Excellence. Sandeep is a thought leader and has served as chief architect of multiple large-scale enterprise big data platforms. He specializes in rapidly building high-performance teams focused on cutting-edge technologies and high-quality delivery.

Alex Turok has over 16 years of consulting experience focused on global and US biopharmaceutical companies. Alex’s expertise is in solving ambiguous, unstructured problems for commercial and medical leadership. For his clients, he seeks to drive lasting organizational change by defining the problem, identifying the strategic options, informing a decision, and outlining the transformation journey. He has worked extensively in portfolio and brand strategy, pipeline and launch strategy, integrated evidence strategy and planning, organizational design, and customer capabilities. Since joining ZS, Alex has worked across marketing, sales, medical, access, and patient services and has touched over twenty therapeutic categories, with depth in oncology, hematology, immunology and specialty therapeutics.

Amazon SageMaker HyperPod introduces Amazon EKS support

Post Syndicated from Elizabeth Fuentes original https://aws.amazon.com/blogs/aws/amazon-sagemaker-hyperpod-introduces-amazon-eks-support/

Today, we are pleased to announce Amazon Elastic Kubernetes Service (EKS) support in Amazon SageMaker HyperPod — purpose-built infrastructure engineered with resilience at its core for foundation model (FM) development. This new capability enables customers to orchestrate HyperPod clusters using EKS, combining the power of Kubernetes with Amazon SageMaker HyperPod‘s resilient environment designed for training large models. Amazon SageMaker HyperPod helps efficiently scale across more than a thousand artificial intelligence (AI) accelerators, reducing training time by up to 40%.

Amazon SageMaker HyperPod now enables customers to manage their clusters using a Kubernetes-based interface. This integration allows seamless switching between Slurm and Amazon EKS for optimizing various workloads, including training, fine-tuning, experimentation, and inference. The CloudWatch Observability EKS add-on provides comprehensive monitoring capabilities, offering insights into CPU, network, disk, and other low-level node metrics on a unified dashboard. This enhanced observability extends to resource utilization across the entire cluster, node-level metrics, pod-level performance, and container-specific utilization data, facilitating efficient troubleshooting and optimization.

Launched at re:Invent 2023, Amazon SageMaker HyperPod has become a go-to solution for AI startups and enterprises looking to efficiently train and deploy large scale models. It is compatible with SageMaker’s distributed training libraries, which offer Model Parallel and Data Parallel software optimizations that help reduce training time by up to 20%. SageMaker HyperPod automatically detects and repairs or replaces faulty instances, enabling data scientists to train models uninterrupted for weeks or months. This allows data scientists to focus on model development, rather than managing infrastructure.

The integration of Amazon EKS with Amazon SageMaker HyperPod uses the advantages of Kubernetes, which has become popular for machine learning (ML) workloads due to its scalability and rich open-source tooling. Organizations often standardize on Kubernetes for building applications, including those required for generative AI use cases, as it allows reuse of capabilities across environments while meeting compliance and governance standards. Today’s announcement enables customers to scale and optimize resource utilization across more than a thousand AI accelerators. This flexibility enhances the developer experience, containerized app management, and dynamic scaling for FM training and inference workloads.

Amazon EKS support in Amazon SageMaker HyperPod strengthens resilience through deep health checks, automated node recovery, and job auto-resume capabilities, ensuring uninterrupted training for large scale and/or long-running jobs. Job management can be streamlined with the optional HyperPod CLI, designed for Kubernetes environments, though customers can also use their own CLI tools. Integration with Amazon CloudWatch Container Insights provides advanced observability, offering deeper insights into cluster performance, health, and utilization. Additionally, data scientists can use tools like Kubeflow for automated ML workflows. The integration also includes Amazon SageMaker managed MLflow, providing a robust solution for experiment tracking and model management.

At a high level, Amazon SageMaker HyperPod cluster is created by the cloud admin using the HyperPod cluster API and is fully managed by the HyperPod service, removing the undifferentiated heavy lifting involved in building and optimizing ML infrastructure. Amazon EKS is used to orchestrate these HyperPod nodes, similar to how Slurm orchestrates HyperPod nodes, providing customers with a familiar Kubernetes-based administrator experience.

Let’s explore how to get started with Amazon EKS support in Amazon SageMaker HyperPod
I start by preparing the scenario, checking the prerequisites, and creating an Amazon EKS cluster with a single AWS CloudFormation stack following the Amazon SageMaker HyperPod EKS workshop, configured with VPC and storage resources.

To create and manage Amazon SageMaker HyperPod clusters, I can use either the AWS Management Console or AWS Command Line Interface (AWS CLI). Using the AWS CLI, I specify my cluster configuration in a JSON file. I choose the Amazon EKS cluster created previously as the orchestrator of the SageMaker HyperPod Cluster. Then, I create the cluster worker nodes that I call “worker-group-1”, with a private Subnet, NodeRecovery set to Automatic to enable automatic node recovery and for OnStartDeepHealthChecks I add InstanceStress and InstanceConnectivity to enable deep health checks.

cat > eli-cluster-config.json << EOL
{
    "ClusterName": "example-hp-cluster",
    "Orchestrator": {
        "Eks": {
            "ClusterArn": "${EKS_CLUSTER_ARN}"
        }
    },
    "InstanceGroups": [
        {
            "InstanceGroupName": "worker-group-1",
            "InstanceType": "ml.p5.48xlarge",
            "InstanceCount": 32,
            "LifeCycleConfig": {
                "SourceS3Uri": "s3://${BUCKET_NAME}",
                "OnCreate": "on_create.sh"
            },
            "ExecutionRole": "${EXECUTION_ROLE}",
            "ThreadsPerCore": 1,
            "OnStartDeepHealthChecks": [
                "InstanceStress",
                "InstanceConnectivity"
            ],
        },
  ....
    ],
    "VpcConfig": {
        "SecurityGroupIds": [
            "$SECURITY_GROUP"
        ],
        "Subnets": [
            "$SUBNET_ID"
        ]
    },
    "ResilienceConfig": {
        "NodeRecovery": "Automatic"
    }
}
EOL

You can add InstanceStorageConfigs to provision and mount an additional Amazon EBS volumes on HyperPod nodes.

To create the cluster using the SageMaker HyperPod APIs, I run the following AWS CLI command:

aws sagemaker create-cluster \ 
--cli-input-json file://eli-cluster-config.json

The AWS command returns the ARN of the new HyperPod cluster.

{
"ClusterArn": "arn:aws:sagemaker:us-east-2:ACCOUNT-ID:cluster/wccy5z4n4m49"
}

I then verify the HyperPod cluster status in the SageMaker Console, awaiting until the status changes to InService.

Alternatively, you can check the cluster status using the AWS CLI running the describe-cluster command:

aws sagemaker describe-cluster --cluster-name my-hyperpod-cluster

Once the cluster is ready, I can access the SageMaker HyperPod cluster nodes. For most operations, I can use kubectl commands to manage resources and jobs from my development environment, using the full power of Kubernetes orchestration while benefiting from SageMaker HyperPod’s managed infrastructure. On this occasion, for advanced troubleshooting or direct node access, I use AWS Systems Manager (SSM) to log into individual nodes, following the instructions in the Access your SageMaker HyperPod cluster nodes page.

To run jobs on the SageMaker HyperPod cluster orchestrated by EKS, I follow the steps outlined in the Run jobs on SageMaker HyperPod cluster through Amazon EKS page. You can use the HyperPod CLI and the native kubectl command to find avaible HyperPod clusters and submit training jobs (Pods). For managing ML experiments and training runs, you can use Kubeflow Training Operator, Kueue and Amazon SageMaker-managed MLflow.

Finally, in the SageMaker Console, I can view the Status and Kubernetes version of recently added EKS clusters, providing a comprehensive overview of my SageMaker HyperPod environment.

And I can monitor cluster performance and health insights using Amazon CloudWatch Container.

Things to know
Here are some key things you should know about Amazon EKS support in Amazon SageMaker HyperPod:

Resilient Environment – This integration provides a more resilient training environment with deep health checks, automated node recovery, and job auto-resume. SageMaker HyperPod automatically detects, diagnoses, and recovers from faults, allowing you to continually train foundation models for weeks or months without disruption. This can reduce training time by up to 40%.

Enhanced GPU Observability Amazon CloudWatch Container Insights provides detailed metrics and logs for your containerized applications and microservices. This enables comprehensive monitoring of cluster performance and health.

Scientist-Friendly Tool – This launch includes a custom HyperPod CLI for job management, Kubeflow Training Operators for distributed training, Kueue for scheduling, and integration with SageMaker Managed MLflow for experiment tracking. It also works with SageMaker’s distributed training libraries, which provide Model Parallel and Data Parallel optimizations to significantly reduce training time. These libraries, combined with auto-resumption of jobs, enable efficient and uninterrupted training of large models.

Flexible Resource Utilization – This integration enhances developer experience and scalability for FM workloads. Data scientists can efficiently share compute capacity across training and inference tasks. You can use your existing Amazon EKS clusters or create and attach new ones to HyperPod compute, bring your own tools for job submission, queuing and monitoring.

To get started with Amazon SageMaker HyperPod on Amazon EKS, you can explore resources such as the SageMaker HyperPod EKS Workshop, the aws-do-hyperpod project, and the awsome-distributed-training project. This release is generally available in the AWS Regions where Amazon SageMaker HyperPod is available except Europe(London). For pricing information, visit the Amazon SageMaker Pricing page.

This blog post was a collaborative effort. I would like to thank Manoj Ravi, Adhesh Garg, Tomonori Shimomura, Alex Iankoulski, Anoop Saha, and the entire team for their significant contributions in compiling and refining the information presented here. Their collective expertise was crucial in creating this comprehensive article.

– Eli.

Making sense of secrets management on Amazon EKS for regulated institutions

Post Syndicated from Piyush Mattoo original https://aws.amazon.com/blogs/security/making-sense-of-secrets-management-on-amazon-eks-for-regulated-institutions/

Amazon Web Services (AWS) customers operating in a regulated industry, such as the financial services industry (FSI) or healthcare, are required to meet their regulatory and compliance obligations, such as the Payment Card Industry Data Security Standard (PCI DSS) or Health Insurance Portability and Accountability Act (HIPPA).

AWS offers regulated customers tools, guidance and third-party audit reports to help meet compliance requirements. Regulated industry customers often require a service-by-service approval process when adopting cloud services to make sure that each adopted service aligns with their regulatory obligations and risk tolerance. How financial institutions can approve AWS services for highly confidential data walks through the key considerations that customers should focus on to help streamline the approval of cloud services. In this post we cover how regulated customers, especially FSI customers, can approach secrets management on Amazon Elastic Kubernetes Service (Amazon EKS) to help meet data protection and operational security requirements. Amazon EKS gives you the flexibility to start, run, and scale Kubernetes applications in the AWS Cloud or on-premises.

Applications often require sensitive information such as passwords, API keys, and tokens to connect to external services or systems. Kubernetes has secrets objects for managing these types of sensitive information. Additional tools and approaches have evolved to supplement the Kubernetes Secrets to help meet the compliance requirements of regulated organizations. One of the driving forces behind the evolution of these tools for regulated customers is that the native Kubernetes Secrets values aren’t encrypted but encoded as base64 strings; meaning that their values can be decoded by a threat actor with either API access or authorization to create a pod in a namespace containing the secret. There are options such as GoDaddy Kubernetes External Secrets, AWS Secrets and Configuration Provider (ASCP) for the Kubernetes Secrets Store CSI Driver, Hashicorp Vault, and Bitnami Sealed secrets that you can use to can help to improve the security, management, and audibility of your secrets usage.

In this post, we cover some of the key decisions involved in choosing between External Secrets Operator (ESO), Sealed Secrets, and ASCP for the Kubernetes Secrets Store Container Storage Interface (CSI) Driver, specifically for FSI customers with regulatory demands. These decision points are also broadly applicable to customers operating in other regulated industries.

AWS Shared Responsibility Model

Security and compliance is a shared responsibility between AWS and the customer. The AWS Shared Responsibility Model describes this as security of the cloud and security in the cloud:

  • AWS responsibility – Security of the cloud: AWS is responsible for protecting the infrastructure that runs the services offered in the AWS Cloud. For Amazon EKS, AWS is responsible for the Kubernetes control plane, which includes the control plane nodes and etcd database. Amazon EKS is certified by multiple compliance programs for regulated and sensitive applications. The effectiveness of the security controls are regularly tested and verified by third-party auditors as part of the AWS compliance programs.
  • Customer responsibility – Security in the cloud: Customers are responsible for the security and compliance of customer configured systems and services deployed on AWS. This includes responsibility for securely deploying, configuring and managing ESO within their Amazon EKS cluster. For Amazon EKS, the customer responsibility depends upon the worker nodes you pick to run your workloads and cluster configuration as shown in Figure 1. In the case of Amazon EKS deployment using Amazon Elastic Compute Cloud (Amazon EC2) hosts, the customer responsibility includes the following areas:
    • The security configuration of the data plane, including the configuration of the security groups that allow traffic to pass from the Amazon EKS control plane into the customer virtual private cloud (VPC).
    • The configuration of the nodes and the containers themselves.
    • The nodes’ operating system, including updates and security patches.
    • Other associated application software:
    • The sensitivity of your data, such as personally identifiable information (PII), keys, passwords, and tokens
      • Customers are responsible for enforcing access controls to protect their data and secrets.
      • Customers are responsible for monitoring and logging activities related to secrets management including auditing access, detecting anomalies and responding to security incidents.
    • Your company’s requirements, applicable laws and regulations
    • When using AWS Fargate, the operational overhead for customers is reduced in the following areas:
      • The customer is not responsible for updating or patching the host system.
      • Fargate manages the placement and scaling of containers.
Figure 1: AWS Shared Responsibility Model with Fargate and Amazon EC2 based workflows

Figure 1: AWS Shared Responsibility Model with Fargate and Amazon EC2 based workflows

As an example of the Shared Responsibility Model in action, consider a typical FSI workload accepting or processing payments cards and subject to PCI DSS requirements. PCI DSS v4.0 requirement 3 focuses on guidelines to secure cardholder data while at rest and in transit:

Control ID Control description
3.6 Cryptographic keys used to protect stored account data are secured.
3.6.1.2 Store secret and private keys used to encrypt and decrypt cardholder data in one (or more) of the following forms:

  • Encrypted with a key-encrypting key that is at least as strong as the data-encrypting key, and that is stored separately from the data-encrypting key.
  • Stored within a secure cryptographic device (SCD), such as a hardware security module (HSM) or PTS-approved point-of-interaction device.
  • Has at least two full-length key components or key shares, in accordance with an industry-accepted method. Note: It is not required that public keys be stored in one of these forms.
3.6.1.3 Access to cleartext cryptographic key components is restricted to the fewest number of custodians necessary.

NIST frameworks and controls are also broadly adopted by FSI customers. NIST Cyber Security Framework (NIST CSF) and NIST SP 800-53 (Security and Privacy Controls for Information Systems and Organizations) include the following controls that apply to secrets:

Regulation or framework Control ID Control description
NIST CSF PR.AC-1 Identities and credentials are issued, managed, verified, revoked, and audited for authorized devices, users and processes.
NIST CSF PR.DS-1 Data-at-rest is protected.
NIST 800-53.r5 AC-2(1)
AC-3(15)
Secrets should have automatic rotation enabled.
Delete unused secrets.

Based on the preceding objectives, the management of secrets can be categorized into two broad areas:

  • Identity and access management ensures separation of duties and least privileged access.
  • Strong encryption, using a dedicated cryptographic device, introduces a secure boundary between the secrets data and keys, while maintaining appropriate management over the cryptographic keys.

Choosing your secrets management provider

To help choose a secrets management provider and apply compensating controls effectively, in this section we evaluate three different options based on the key objectives derived from the PCI DSS and NIST controls described above and other considerations such as operational overhead, high availability, resiliency, and developer or operator experience.

Architecture and workflow

The following architecture and component descriptions highlight the different architectural approaches and responsibilities of each solution’s components, ranging from controllers and operators, command-line interface (CLI) tools, custom resources, and CSI drivers working together to facilitate secure secrets management within Kubernetes environments.

External Secrets Operator (ESO) extends the Kubernetes API using a custom resource definition (CRD) for secret retrieval. ESO enables integration with external secrets management systems such as AWS Secrets Manager, HashiCorp Vault, Google Secrets Manager, Azure Key Vault, IBM Cloud Secrets Manager, and various other systems. ESO watches for changes to an external secret store and keeps Kubernetes secrets in sync. These services offer features that aren’t available with native Kubernetes Secrets, such as fine-grained access controls, strong encryption, and automatic rotation of secrets. By using these purpose-built tools outside of a Kubernetes cluster, you can better manage risk and benefit from central management of secrets across multiple Amazon EKS clusters. For more information, see the detailed walkthrough of using ESO to synchronize secrets from Secrets Manager to your Amazon EKS Fargate cluster.

ESO is comprised of a cluster-side controller that automatically reconciles the state within the Kubernetes cluster and updates the related secrets anytime the external API’s secret undergoes a change.

Figure 2: ESO workflow

Figure 2: ESO workflow

Sealed Secrets is an open source project by Bitnami comprised of a Kubernetes controller coupled with a client-side CLI tool with the objective to store secrets in Git in a secure fashion. Sealed Secrets encrypts your Kubernetes secret into a SealedSecret, which can also be deployed to a Kubernetes cluster using kubectl. For more information, see the detailed walkthough of using tools from the Sealed Secrets open source project to manage secrets in your Amazon EKS clusters.

Sealed Secrets comprises of three main components: First, there is an operator or a controller which is deployed onto a Kubernetes cluster. The controller is responsible for decrypting your secrets. Second, you have a CLI tool called Kubeseal that takes your secret and encrypts it. Third, you have a CRD. Instead of creating regular secrets, you create SealedSecrets, which is a CRD defined within Kubernetes. That is how the operator knows when to perform the decryption process within your Kubernetes cluster.

Upon startup, the controller looks for a cluster-wide private-public key pair and generates a new 4096-bit RSA public-private key pair if one doesn’t exist. The private key is persisted in a secret object in the same namespace as the controller. The public key portion of this is made publicly available to anyone wanting to use Sealed Secrets with this cluster.

Figure 3: Sealed Secrets workflow

Figure 3: Sealed Secrets workflow

The AWS Secrets Manager and Config Provider (ASCP) for Secret Store CSI driver is an open source tool from AWS that allows secrets from Secrets Manager and Parameter Store, a capability of AWS Systems Manager, to be mounted as files inside Amazon EKS pods. It uses a CRD called SecretProviderClass to specify which secrets or parameters to mount. Upon a pod start or restart, the CSI driver retrieves the secrets or parameters from AWS and writes them to a tmpfs volume mounted in the pod. The volume is automatically cleaned up when the pod is deleted, making sure that secrets aren’t persisted. For more information, see the detailed walkthrough on how to set up and configure the ASCP to work with Amazon EKS.

ASCP comprises of a cluster-side controller acting as the provider, allowing secrets from Secrets Manager, and parameters from Parameter Store to appear as files mounted in Kubernetes pods. Secrets Store CSI Driver is a DaemonSet with three containers: node-driver-registrar, which registers the CSI driver with Kubelet; secrets-store, which implements the CSI Node service gRPC services for mounting and unmounting volumes during pod creation and deletion; and  liveness-probe, which monitors the health of the CSI driver and reports to Kubernetes for automatic issue detection and pod restart.

Figure 4: AWS Secrets Manager and configuration provider

Figure 4: AWS Secrets Manager and configuration provider

In the next section, we cover some of the key decisions involved in choosing whether to use ESO, Sealed Secrets, or ASCP for regulated customers to help meet their regulatory and compliance needs.

Comparing ESO, Sealed Secrets, and ASCP objectives

All three solutions address different aspects of secure secrets management and aim to help FSI customers meet their regulatory compliance requirements while upholding the protection of sensitive data in Kubernetes environments.

ESO synchronizes secrets from external APIs into Kubernetes, targeting the cluster operator and application developer personas. The cluster operator is responsible for setting up ESO and managing access policies. The application developer is responsible for defining external secrets and the application configuration.

Sealed Secrets encrypts your Kubernetes secrets before storing them in version control systems such as public Git repositories. This is the case if you decide to check in your Kubernetes manifest to a Git repository granting access to your sensitive secrets to anyone who has access to the Git repository. This is ultimately the reason why Sealed Secrets was created and the sealed secret can be decrypted only by the controller running in the target cluster.

Using ASCP, you can securely store and manage your secrets in Secrets Manager and retrieve them through your applications running on Kubernetes without having to write custom code. Secrets Manager provides features such as rotation, auditing, and access control that can help FSI customers meet regulatory compliance requirements and maintain a robust security posture.

Installation

The deployment and configuration details that follow highlight the different approaches and resources used by each solution to integrate with Kubernetes and external secret stores, catering to the specific requirements of secure secrets management in containerized environments.

ESO provides Helm charts for ease of operator deployment. External Secrets provides custom resources like SecretStore and ExternalSecret for configuring the required operator functionality to synchronize external secrets to your cluster. For instance, SecretStore can be used by the cluster operator to be able to connect to AWS Secrets Manager using appropriate credentials to pull in the secrets.

To install Sealed Secrets, you can deploy the Sealed Secrets Controller onto the Kubernetes cluster. You can deploy the manifest by itself or you can use a Helm chart to deploy the Sealed Secrets Controller for you. After the controller is installed, you use the Kubeseal client-side utility to encrypt secrets using asymmetric cryptography. If you don’t already have the Kubeseal CLI installed, see the installation instructions.

ASCP provides Helm charts to assist in operator deployment. The ASCP operator provides custom resources such as SecretProviderClass to provide provider-specific parameters to the CSI driver. During pod start and restart, the CSI driver will communicate with the provider using gRPC to retrieve the secret content from the external secret store you specified in the SecretProviderClass custom resource. Then the volume is mounted in the pod as tmpfs and the secret contents are written to the volume.

Encryption and key management

These solutions use robust encryption mechanisms and key management practices provided by external secret stores and AWS services such as AWS Key Management Service (AWS KMS) and Secrets Manager. However, additional considerations and configurations might be required to meet specific regulatory requirements, such as PCI DSS compliance for handling sensitive data.

ESO relies on encryption features within the external secrets management system. For instance, Secrets Manager supports envelope encryption with AWS KMS which is FIPS 140-2 Level 3 certified. Secrets Manager has several compliance certifications making it a great fit for regulated workloads. FIPS 140-2 Level 3 ensures only strong encryption algorithms approved by NIST can be used to protect data. It also defines security requirements for the cryptographic module, creating logical and physical boundaries.

Both AWS KMS and Secrets Manager help you to manage key lifecycle and to integrate with other AWS Services. In terms of key rotation, both provide automatic rotation of secrets that runs on a schedule (which you define), and abstract the complexity of managing different versions of keys. For AWS managed keys, the key rotation happens automatically once every year by default. With customer managed keys (CMKs), automatic key rotation is available but not enabled by default.

When using SealedSecrets, you use the Kubeseal tool to convert a standard Kubernetes Secret into a Sealed Secrets resource. The contents of the Sealed Secrets are encrypted with the public key served by the Sealed Secrets Controller as described in the Sealed Secrets project homepage.

In the absence of cloud native secrets management integration, you might have to add compensating controls to achieve the regulatory standards required by your organization. In cases where the underlying SealedSecrets data is sensitive in nature, such as cardholder PII, PCI requires that you store sensitive secrets in a cryptographic device such as a hardware security module (HSM). You can use Secrets Manager to store the master key generated to seal the secrets. However, this you will have to enable additional integration with Amazon EKS APIs to fetch the master key securely from the EKS cluster. You will also have to modify your deployment process to use a master key from Secrets Manager. The applications running in the EKS cluster must have permissions to fetch the SealedSecret and master key from Secrets Manager. This might involve configuring the application to interact with Amazon EKS APIs and Secrets Manager. For non-sensitive data, Kubeseal can be used directly within the EKS cluster to manage secrets and sealing keys.

For key rotation, you can store the controller generated private key in Parameter Store as a SecureString. You can use the advanced tier in Parameter Store if the file containing the private keys exceeds the Standard tier limit of up to 4,096 characters. In addition, if you want to add key rotation, you can use AWS KMS.

The ASCP relies on encryption features within the chosen secret store, such as Secrets Manager. Secrets Manager supports integration with AWS KMS for an additional layer of security by storing encryption keys separately. The Secrets Store CSI Driver facilitates secure interaction with the secret store, but doesn’t directly encrypt secrets. Encrypting mounted content can provide further protection, but introduces operational overhead related to key management.

ASCP relies on Secrets Manager and AWS KMS for encryption and decryption capabilities. As a recommendation, you can encrypt mounted content to further protect the secrets. However, this introduces the additional operational overhead of managing encryption keys and addressing key rotation.

Additional considerations

These solutions address various aspects of secure secrets management, ranging from centralized management, compliance, high availability, performance, developer experience, and integration with existing investments, catering to the specific needs of FSI customers in their Kubernetes environments.

ESO can be particularly useful when you need to manage an identical set of secrets across multiple Kubernetes clusters. Instead of configuring, managing, and rotating secrets at each cluster level individually, you can synchronize your secrets across your clusters. This simplifies secrets management by providing a single interface to manage secrets across multiple clusters and environments.

External secrets management systems typically offer advanced security features such as encryption at rest, access controls, audit logs, and integration with identity providers. This helps FSI customers ensure that sensitive information is stored and managed securely in accordance with regulatory requirements.

FSI customers usually have existing investments in their on-premises or cloud infrastructure, including secrets management solutions. ESO integrates seamlessly with existing secrets management systems and infrastructure, allowing FSI customers to use their investment in these systems without requiring significant changes to their workflow or tooling. This makes it easier for FSI customers to adopt and integrate ESO into their existing Kubernetes environments.

ESO provides capabilities for enforcing policies and governance controls around secrets management such as access control, rotation policies, and audit logging when using services like Secrets Manager. For FSI customers, audits and compliance are critical and ESO verifies that access to secrets is tracked and audit trails are maintained, thereby simplifying the process of demonstrating adherence to regulatory standards. For instance, secrets stored inside Secrets Manager can be audited for compliance with AWS Config and AWS Audit Manager. Additionally, ESO uses role-based access control (RBAC) to help prevent unauthorized access to Kubernetes secrets as documented in the ESO security best practices guide.

High availability and resilience are critical considerations for mission critical FSI applications such as online banking, payment processing, and trading services. By using external secrets management systems designed for high availability and disaster recovery, ESO helps FSI customers ensure secrets are available and accessible in the event of infrastructure failure or outages, thereby minimizing service disruption and downtime.

FSI workloads often experience spikes in transaction volumes, especially during peak days or hours. ESO is designed to efficiently managed a large volume of secrets by using external secrets management that’s optimized for performance and scalability.

In terms of monitoring, ESO provides Prometheus metrics to enable fine-grained monitoring of access to secrets. Amazon EKS pods offer diverse methods to grant access to secrets present on external secrets management solutions. For example, in non-production environments, access can be granted through IAM instance profiles assigned to the Amazon EKS worker nodes. For production, using IAM roles for service accounts (IRSA) is recommended. Furthermore, you can achieve namespace level fine-grained access control by using annotations.

ESO also provides options to configure operators to use a VPC endpoint to comply with FIPS requirements.

Additional developer productivity benefits provided by ESO include support for JSON objects (Secret key/value in the AWS Management console) or strings (Plaintext in the console). With JSON objects, developers can programmatically update multiple values atomically when rotating a client certificate and private key.

The benefit of Sealed Secrets, as discussed previously, is when you upload your manifest to a Git repository. The manifest will contain the encrypted SealedSecrets and not the regular secrets. This assures that no one has access to your sensitive secrets even when they have access to your Git repository. Sealed Secrets offer a few benefits to developers in terms of developer experience. Sealed Secrets gives you access to manage your secrets, making them more readily available to developers. Sealed Secrets offers VSCode extension to assist in integrating it into the software development lifecycle (SDLC). Using Sealed Secrets, you can store the encrypted secrets in the version control systems such as Gitlab and GitHub. Sealed Secrets can reduce operational overhead related to updating dependent objects because whenever a secret resource is updated, the same update is applied to the dependent objects.

ASCP integration with the Kubernetes Secrets Store CSI Driver on Amazon EKS offers enhanced security through seamless integration with Secrets Manager and Parameter Store, ensuring encryption, access control, and auditing. It centralizes management of sensitive data, simplifying operations and reducing the risk of exposure. The dynamic secrets injection capability facilitates secure retrieval and injection of secrets into Kubernetes pods, while automatic rotation provides up-to-date credentials without manual intervention. This combined solution streamlines deployment and management, providing a secure, scalable, and efficient approach to handling secrets and configuration settings in Kubernetes applications.

Consolidated threat model

We created a threat model based on the architecture of the three solution offerings. The threat model provides a comprehensive view of the potential threats and corresponding mitigations for each solution, allowing organizations to proactively address security risks and ensure the secure management of secrets in their Kubernetes environments.

X = Mitigations applicable to the solution

Threat Mitigations ESO Sealed Secrets ASCP
Unauthorized access or modification of secrets
  • Implement least privilege access principles
  • Rotate and manage credentials securely
  • Enable RBAC and auditing in Kubernetes
X X X
Insider threat (for example, a rogue administrator who has legitimate access)
  • Implement least privilege access principles
  • Enable auditing and monitoring
  • Enforce separation of duties and job rotation
X X
Compromise of the deployment process
  • Secure and harden the deployment pipeline
  • Implement secure coding practices
  • Enable auditing and monitoring
X
Unauthorized access or tampering of secrets during transit
  • Enable encryption in transit using TLS
  • Implement mutual TLS authentication between components
  • Use private networking or VPN for secure communication
X X X
Compromise of the Kubernetes API server because of vulnerabilities or misconfiguration
  • Secure and harden the Kubernetes API server
  • Enable authentication and authorization mechanisms (for example, mutual TLS and RBAC)
  • Keep Kubernetes components up-to-date and patched
  • Enable Kubernetes audit logging and monitoring
X
Vulnerability in the external secrets controller leading to privilege escalation or data exposure
  • Keep the external secrets controller up-to-date and patched
  • Regularly monitor for and apply security updates
  • Implement least privilege access principles
  • Enable auditing and monitoring
X
Compromise of the Secrets Store CSI Driver, node-driver-registrar, Secrets Store CSI Provider, kubelet, or Pod could lead to unauthorized access or exposure of secrets
  • Implement least privilege principles and role-based access controls
  • Regularly patch and update the components
  • Monitor and audit the component activities
X
Unauthorized access or data breach in Secrets Manager could expose sensitive secrets
  • Implement strong access controls and access logging for Secrets Manager
  • Encrypt secrets at rest and in transit
  • Regularly rotate and update secrets
X X

Shortcomings and limitations

The following limitations and drawbacks highlight the importance of carefully evaluating the specific requirements and constraints of your organization before adopting any of these solutions. You should consider factors such as team expertise, deployment environments, integration needs, and compliance requirements to promote a secure and efficient secrets management solution that aligns with your organization’s needs.

ESO doesn’t include a default way to restrict network traffic to and from ESO using network policies or similar network or firewall mechanisms. The application team is responsible for properly configuring network policies to improve the overall security posture of ESO within your Kubernetes cluster.

Any time an external secret associated with ESO is rotated, you must restart the deployment that uses that particular external secret. Given the inherent risks associated with integrating an external entity or third-party solution into your system, including ESO, it’s crucial to implement a comprehensive threat model similar to the Kubernetes Admission Control Threat Model.

Also, ESO set up is complicated and the controller must be installed on the Kubernetes cluster.

SealedSecrets cannot be reused across namespaces unless they’re re-encrypted or made cluster-wide, which makes it challenging to manage secrets across multiple namespaces consistently. The need to manually rotate and re-encrypt SealedSecrets with new keys can introduce operational overhead, especially in large-scale environments with numerous secrets. The old sealing keys pose a potential risk of misuse by unauthorized users, which increases the risk. To mitigate both risks (high overhead and old secrets), you should implement additional controls such as deleting older keys as part of the key rotation process or periodically rotate sealing keys and make sure that old sealed secret resources are re-encrypted with the new keys. Sealed Secrets doesn’t support external secret stores such as HashiCorp Vault, or cloud provider services such as Secrets Manager, Parameter Store, or Azure Key Vault. Sealed Secrets requires a Kubeseal client-side binary to encrypt secrets. This can be a concern in FSI environments where client-side tools are restricted by security policies.

While ASCP provides seamless integration with Secrets Manager and Parameter Store, teams unfamiliar with these AWS services might need to invest some additional effort to fully realize the benefits. This additional effort is justified by the long-term benefits of centralized secrets management and access control provided by these services. Additionally, relying primarily on AWS services for secrets management can potentially limit flexibility in deploying to alternative cloud providers or on-premises environments in the future. These factors should be carefully evaluated based on the specific needs and constraints of the application and deployment environment.

Conclusion

We have provided a summary of three options for managing secrets in Amazon EKS, ESO, Sealed Secrets, and AWS Secrets and Configuration Provider (ASCP), and the key considerations for FSI customers when choosing between them. The choice depends on several factors including existing investments in secrets management systems, specific security needs and compliance requirements, preference for a Kubernetes native solution or willingness to accept vendor lock-in.

The guidance provided here covers the strengths, limitations, and trade-offs of each option, allowing regulated institutions to make an informed decision based on their unique requirements and constraints. This guidance can be adapted and tailored to fit the specific needs of an organization, providing a secure and efficient secrets management solution for their Amazon EKS workloads, while aligning with the stringent security and compliance standards of the regulated institutions.

 
If you have feedback about this post, submit comments in the Comments section below. If you have questions about this post, contact AWS Support.

Piyush Mattoo

Piyush Mattoo
Piyush is a Senior Solution Architect for Financial Services Data Provider segment at Amazon Web Services. He is a software technology leader with over a decade long experience building scalable and distributed software systems to enable business value through the use of technology. He is based out of Southern California and current interests include outdoor camping and nature walks.

Ruy Cavalcanti

Ruy Cavalcanti
Ruy is a Senior Security Architect for the Latin American Financial market at AWS. He has been working in IT and Security for over 19 years, helping customers create secure architectures in the AWS Cloud. Ruy’s interests include jamming on his guitar, firing up the grill for some Brazilian-style barbecue, and enjoying quality time with his family and friends.

Chetan Pawar

Chetan Pawar
Chetan is a Cloud Architect specializing in infrastructure within AWS Professional Services. As a member of the Containers Technical Field Community, he provides strategic guidance on enterprise Infrastructure and DevOps for clients across multiple industries. He has an 18-year track record building large-scale Infrastructure and containerized platforms. Outside of work, he is an avid traveler and motorsport enthusiast.