Post Syndicated from Joseph Keating original https://aws.amazon.com/blogs/devops/deploying-cis-level-1-hardened-amis-with-amazon-ec2-image-builder/

The NFL, an AWS Professional Services partner, is collaborating with NFL’s Player Health and Safety team to build the Digital Athlete Program. The Digital Athlete Program is working to drive progress in the prevention, diagnosis, and treatment of injuries; enhance medical protocols; and further improve the way football is taught and played. The NFL, in conjunction with AWS Professional Services, delivered an Amazon EC2 Image Builder pipeline for automating the production of Amazon Machine Images (AMIs). Following similar practices from the Digital Athlete Program, this post demonstrates how to deploy an automated Image Builder pipeline.
“AWS Professional Services faced unique environment constraints, but was able to deliver a modular pipeline solution leveraging EC2 Image Builder. The framework serves as a foundation to create hardened images for future use cases. The team also provided documentation and knowledge transfer sessions to ensure our team was set up to successfully manage the solution.”
—Joseph Steinke, Director, Data Solutions Architect, National Football League
A common scenario AWS customers face is how to build processes that configure secure AWS resources that can be leveraged throughout the organization. You need to move fast in the cloud without compromising security best practices. Amazon Elastic Compute Cloud (Amazon EC2) allows you to deploy virtual machines in the AWS Cloud. EC2 AMIs provide the configuration utilized to launch an EC2 instance. You can use AMIs for several use cases, such as configuring applications, applying security policies, and configuring development environments. Developers and system administrators can deploy configuration AMIs to bring up EC2 resources that require little-to-no setup. Often times, multiple patterns are adopted for building and deploying AMIs. Because of this, you need the ability to create a centralized, automated pattern that can output secure, customizable AMIs.
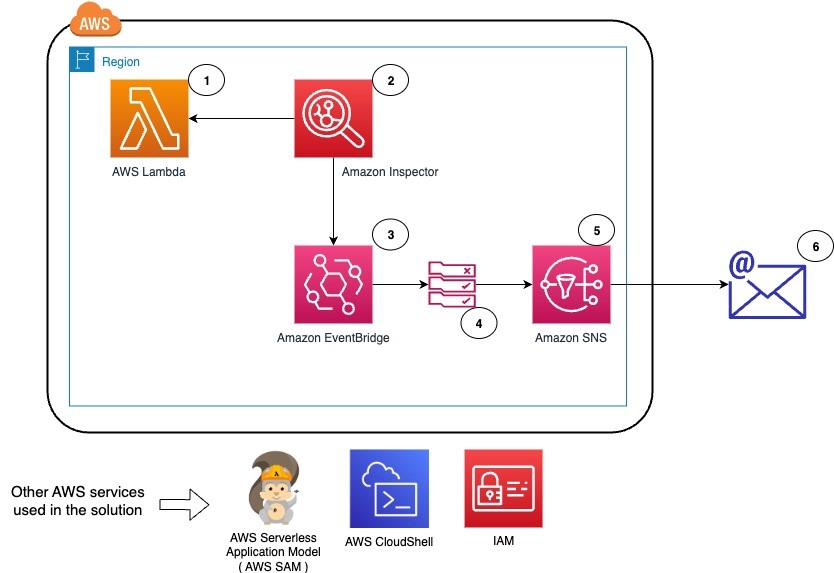
In this post, we demonstrate how to create an automated process that builds and deploys Center for Internet Security (CIS) Level 1 hardened AMIs. The pattern that we deploy includes Image Builder, a CIS Level 1 hardened AMI, an application running on EC2 instances, and Amazon Inspector for security analysis. You deploy the AMI configured with the Image Builder pipeline to an application stack. The application stack consists of EC2 instances running Nginx. Lastly, we show you how to re-hydrate your application stack with a new AMI utilizing AWS CloudFormation and Amazon EC2 launch templates. You use Amazon Inspector to scan the EC2 instances launched from the Image Builder-generated AMI against the CIS Level 1 Benchmark.
After going through this exercise, you should understand how to build, manage, and deploy AMIs to an application stack. The infrastructure deployed with this pipeline includes a basic web application, but you can use this pattern to fit many needs. After running through this post, you should feel comfortable using this pattern to configure an AMI pipeline for your organization.
The project we create in this post addresses the following use case: you need a process for building and deploying CIS Level 1 hardened AMIs to an application stack running on Amazon EC2. In addition to demonstrating how to deploy the AMI pipeline, we also illustrate how to refresh a running application stack with a new AMI. You learn how to deploy this configuration with the AWS Command Line Interface (AWS CLI) and AWS CloudFormation.
AWS services used
Image Builder allows you to develop an automated workflow for creating AMIs to fit your organization’s needs. You can streamline the creation and distribution of secure images, automate your patching process, and define security and application configuration into custom AWS AMIs. In this post, you use the following AWS services to implement this solution:
- AWS CloudFormation – AWS CloudFormation allows you to use domain-specific languages or simple text files to model and provision, in an automated and secure manner, all the resources needed for your applications across all Regions and accounts. You can deploy AWS resources in a safe, repeatable manner, and automate the provisioning of infrastructure.
- AWS KMS – Amazon Key Management Service (AWS KMS) is a fully managed service for creating and managing cryptographic keys. These keys are natively integrated with most AWS services. You use a KMS key in this post to encrypt resources.
- Amazon S3 – Amazon Simple Storage Service (Amazon S3) is an object storage service utilized for storing and encrypting data. We use Amazon S3 to store our configuration files.
- AWS Auto Scaling – AWS Auto Scaling allows you to build scaling plans that automate how groups of different resources respond to changes in demand. You can optimize availability, costs, or a balance of both. We use Auto Scaling to manage Nginx on Amazon EC2.
- Launch templates – Launch templates contain configurations such as AMI ID, instance type, and security group. Launch templates enable you to store launch parameters so that they don’t have to be specified every time instances are launched.
- Amazon Inspector – This automated security assessment service improves the security and compliance of applications deployed on AWS. Amazon Inspector automatically assesses applications for exposures, vulnerabilities, and deviations from best practices.
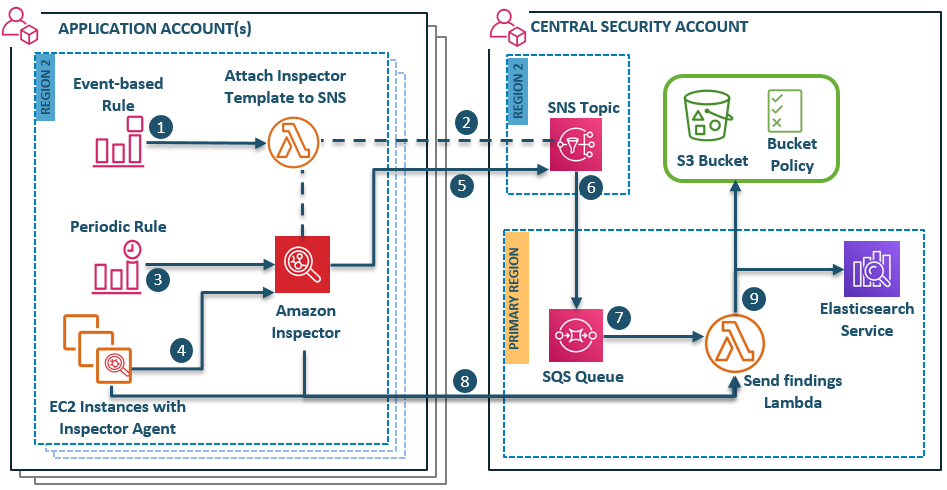
Architecture overview
We use Ansible as a configuration management component alongside Image Builder. The CIS Ansible Playbook applies a Level 1 set of rules to the local host of which the AMI is provisioned on. For more information about the Ansible Playbook, see the GitHub repo. Image Builder offers AMIs with Security Technical Implementation Guides (STIG) levels low-high as part of its pipeline build.
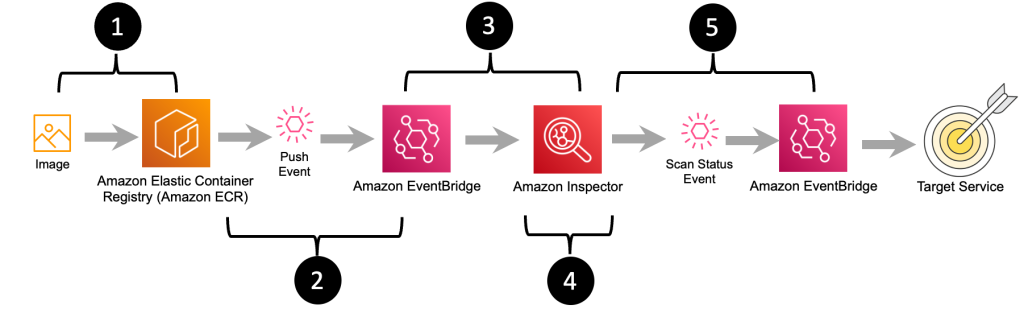
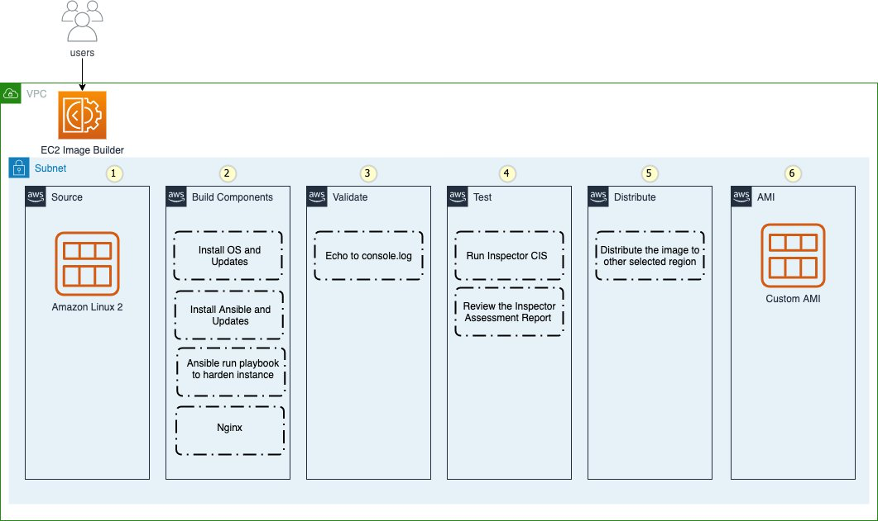
The following diagram depicts the phases of the Image Builder pipeline for building a Nginx web server. The numbers 1–6 represent the order of when each phase runs in the build process:
- Source
- Build components
- Validate
- Test
- Distribute
- AMI

Figure: Shows the EC2 Image Builder steps
The workflow includes the following steps:
- Deploy the CloudFormation templates.
- The template creates an Image Builder pipeline.
- AWS Systems Manager completes the AMI build process.
- Amazon EC2 starts an instance to build the AMI.
- Systems Manager starts a test instance build after the first build is successful.
- The AMI starts provisioning.
- The Amazon Inspector CIS benchmark starts.
CloudFormation templates
You deploy the following CloudFormation templates. These CloudFormation templates have a great deal of configurations. They deploy the following resources:
- vpc.yml – Contains all the core networking configuration. It deploys the VPC, two private subnets, two public subnets, and the route tables. The private subnets utilize a NAT gateway to communicate to the internet. The public subnets have full outbound access to the IGW.
- kms.yml – Contains the AWS KMS configuration that we use for encrypting resources. The KMS key policy is also configured in this template.
- s3-iam-config.yml – Contains the launch configuration and autoscaling groups for the initial Nginx launch. For updates and patching to Nginx, we use Image Builder to build those changes.
- infrastructure-ssm-params.yml – Contains the Systems Manager parameter store configuration. The parameters are populated by using outputs from other CloudFormation templates.
- nginx-config.yml – Contains the configuration for Nginx. Additionally, this template contains the network load balancer, target groups, security groups, and EC2 instance AWS Identity and Access Management (IAM) roles.
- nginx-image-builder.yml – Contains the configuration for the Image Builder pipeline that we use to build AMIs.
Prerequisites
To follow the steps to provision the pipeline deployment, you must have the following prerequisites:
Deploying the CloudFormation templates
To deploy your templates, complete the following steps:
1. Clone the source code repository found in the following location:
git clone https://github.com/aws-samples/deploy-cis-level-1-hardened-ami-with-ec2-image-builder-pipeline.git
You now use the AWS CLI to deploy the CloudFormation templates. Make sure to leave the CloudFormation template names as we have written in this post.
2. Deploy the VPC CloudFormation template:
aws cloudformation create-stack \
--stack-name vpc-config \
--template-body file://Templates/vpc.yml \
--parameters file://Parameters/vpc-params.json  \
--capabilities CAPABILITY_IAM \
--region us-east-1
The output should look like the following code:
{

    "StackId": "arn:aws:cloudformation:us-east-1:123456789012:stack/vpc-config/7faaab30-247f-11eb-8712-0e65b6fb18f9"
}
3. Open the Parameters/kms-params.json file and update the UserARN parameter with your account ID:
[
  {
      "ParameterKey": "KeyName",
      "ParameterValue": "DemoKey"
  },
  {
    "ParameterKey": "UserARN",
    "ParameterValue": "arn:aws:iam::<input_your_account_id>:root"
  }
]
4. Deploy the KMS key CloudFormation template:
aws cloudformation create-stack \
--stack-name kms-config \
--template-body file://Templates/kms.yml \
--parameters file://Parameters/kms-params.json \
--capabilities CAPABILITY_IAM \
--region us-east-1
The output should look like the following:
{
"StackId": "arn:aws:cloudformation:us-east-1:123456789012:stack/kms-config/f65aca80-08ff-11eb-8795-12275bc6e1ef"
}
5. Open the Parameters/s3-iam-config.json file and update the DemoConfigS3BucketName parameter to a unique name of your choosing:
[
  {
    "ParameterKey" : "Environment",
    "ParameterValue" : "dev"
  },
  {
    "ParameterKey": "NetworkStackName",
    "ParameterValue" : "vpc-config"
  },
  {
    "ParameterKey" : "KMSStackName",
    "ParameterValue" : "kms-config"
  },
  {
    "ParameterKey": "DemoConfigS3BucketName",
    "ParameterValue" : "<input_your_unique_bucket_name>"
  },
  {
    "ParameterKey" : "EC2InstanceRoleName",
    "ParameterValue" : "EC2InstanceRole"
  }
]
6. Deploy the IAM role configuration template:
aws cloudformation create-stack \
--stack-name s3-iam-config \
--template-body file://Templates/s3-iam-config.yml \
--parameters file://Parameters/s3-iam-config.json \
--capabilities CAPABILITY_NAMED_IAM \
--region us-east-1
The output should look like the following:
{
"StackId": "arn:aws:cloudformation:us-east-1:123456789012:stack/s3-iam-config/9be9f990-0909-11eb-811c-0a78092beb51"
}
Configuring IAM roles and policies
This solution uses a couple of service-linked roles. Let’s generate these roles using the AWS CLI.
1. Run the following commands:
aws iam create-service-linked-role --aws-service-name autoscaling.amazonaws.com
aws iam create-service-linked-role --aws-service-name imagebuilder.amazonaws.com
If you see a message similar to following code, it means that you already have the service-linked role created in your account and you can move on to the next step:
An error occurred (InvalidInput) when calling the CreateServiceLinkedRole operation: Service role name AWSServiceRoleForImageBuilder has been taken in this account, please try a different suffix.
Now that you have generated the IAM roles used in this post, you add them to the KMS key policy. This allows the roles to encrypt and decrypt the KMS key.
2. Open the Parameters/kms-params.json file:
[
  {
      "ParameterKey": "KeyName",
      "ParameterValue": "DemoKey"
  },
  {
    "ParameterKey": "UserARN",
    "ParameterValue": "arn:aws:iam::12345678910:root"
  }
]
3. Add the following values as a comma-separated list to the UserARN parameter key:
arn:aws:iam::<input_your_aws_account_id>:role/EC2InstanceRole
 arn:aws:iam::<input_your_aws_account_id>:role/EC2ImageBuilderRole
 arn:aws:iam::<input_your_aws_account_id>:role/NginxS3PutLambdaRole
 arn:aws:iam::<input_your_aws_account_id>:role/aws-service-role/imagebuilder.amazonaws.com/AWSServiceRoleForImageBuilder
 arn:aws:iam::<input_your_aws_account_id>:role/aws-service-role/autoscaling.amazonaws.com/AWSServiceRoleForAutoScaling
When finished, the file should look similar to the following:
[
  {
      "ParameterKey": "KeyName",
      "ParameterValue": "DemoKey"
  },
  {
    "ParameterKey": "UserARN",
    "ParameterValue": "arn:aws:iam::123456789012:role/aws-service-role/autoscaling.amazonaws.com/AWSServiceRoleForAutoScaling,arn:aws:iam::<input_your_aws_account_id>:role/NginxS3PutLambdaRole,arn:aws:iam::123456789012:role/aws-service-role/imagebuilder.amazonaws.com/AWSServiceRoleForImageBuilder,arn:aws:iam::12345678910:role/EC2InstanceRole,arn:aws:iam::12345678910:role/EC2ImageBuilderRole,arn:aws:iam::12345678910:root"
  }
]
Updating the CloudFormation stack
Now that the AWS KMS parameter file has been updated, you update the AWS KMS CloudFormation stack.
1. Run the following command to update the kms-config stack:
aws cloudformation update-stack \
--stack-name kms-config \
--template-body file://Templates/kms.yml \
--parameters file://Parameters/kms-params.json \
--capabilities CAPABILITY_IAM \
--region us-east-1
The output should look like the following:
{
"StackId": "arn:aws:cloudformation:us-east-1:123456789012:stack/kms-config/6e84b750-0905-11eb-b543-0e4dccb471bf"
}
2. Open the AnsibleConfig/component-nginx.yml file and update the <input_s3_bucket_name> value with the bucket name you generated from the s3-iam-config stack:
# Copyright Amazon.com, Inc. or its affiliates. All Rights Reserved.
# SPDX-License-Identifier: MIT-0
name: 'Ansible Playbook Execution on Amazon Linux 2'
description: 'This is a sample component that demonstrates how to download and execute an Ansible playbook against Amazon Linux 2.'
schemaVersion: 1.0
constants:
  - s3bucket:
      type: string
      value: <input_s3_bucket_name>
phases:
  - name: build
    steps:
      - name: InstallAnsible
        action: ExecuteBash
        inputs:
          commands:
           - sudo amazon-linux-extras install -y ansible2
      - name: CreateDirectory
        action: ExecuteBash
        inputs:
          commands:
            - sudo mkdir -p /ansibleloc/roles
      - name: DownloadLinuxCis
        action: S3Download
        inputs:
          - source: 's3://{{ s3bucket }}/components/linux-cis.zip'
            destination: '/ansibleloc/linux-cis.zip'
      - name: UzipLinuxCis
        action: ExecuteBash
        inputs:
          commands:
            - unzip /ansibleloc/linux-cis.zip -d /ansibleloc/roles
            - echo "unzip linux-cis file"
      - name: DownloadCisPlaybook
        action: S3Download
        inputs:
          - source: 's3://{{ s3bucket }}/components/cis_playbook.yml'
            destination: '/ansibleloc/cis_playbook.yml'
      - name: InvokeCisAnsible
        action: ExecuteBinary
        inputs:
          path: ansible-playbook
          arguments:
            - '{{ build.DownloadCisPlaybook.inputs[0].destination }}'
            - '--tags=level1'
      - name: DeleteCisPlaybook
        action: ExecuteBash
        inputs:
          commands:
            - rm '{{ build.DownloadCisPlaybook.inputs[0].destination }}'
      - name: DownloadNginx
        action: S3Download
        inputs:
          - source: s3://{{ s3bucket }}/components/nginx.zip'
            destination: '/ansibleloc/nginx.zip'
      - name: UzipNginx
        action: ExecuteBash
        inputs:
          commands:
            - unzip /ansibleloc/nginx.zip -d /ansibleloc/roles
            - echo "unzip Nginx file"
      - name: DownloadNginxPlaybook
        action: S3Download
        inputs:
          - source: 's3://{{ s3bucket }}/components/nginx_playbook.yml'
            destination: '/ansibleloc/nginx_playbook.yml'
      - name: InvokeNginxAnsible
        action: ExecuteBinary
        inputs:
          path: ansible-playbook
          arguments:
            - '{{ build.DownloadNginxPlaybook.inputs[0].destination }}'
      - name: DeleteNginxPlaybook
        action: ExecuteBash
        inputs:
          commands:
            - rm '{{ build.DownloadNginxPlaybook.inputs[0].destination }}'

  - name: validate
    steps:
      - name: ValidateDebug
        action: ExecuteBash
        inputs:
          commands:
            - sudo echo "ValidateDebug section"

  - name: test
    steps:
      - name: TestDebug
        action: ExecuteBash
        inputs:
          commands:
            - sudo echo "TestDebug section"
      - name: Download_Inspector_Test
        action: S3Download
        inputs:
          - source: 's3://ec2imagebuilder-managed-resources-us-east-1-prod/components/inspector-test-linux/1.0.1/InspectorTest'
            destination: '/workdir/InspectorTest'
      - name: Set_Executable_Permissions
        action: ExecuteBash
        inputs:
          commands:
            - sudo chmod +x /workdir/InspectorTest
      - name: ExecuteInspectorAssessment
        action: ExecuteBinary
        inputs:
          path: '/workdir/InspectorTest'
Adding files to your S3 buckets
Now you assume a role you generated from one of the previous CloudFormation stacks. This allows you to add files to the encrypted S3 bucket.
1. Run the following command and make sure to update the role to use your AWS account ID number:
aws sts assume-role --role-arn "arn:aws:iam::<input_your_aws_account_id>:role/EC2ImageBuilderRole" --role-session-name AWSCLI-Session
You see an output similar to the following:
{
    "Credentials": {
        "AccessKeyId": "<AWS_ACCESS_KEY_ID>",
        "SecretAccessKey": "<AWS_SECRET_ACCESS_KEY_ID>",
        "SessionToken": "<AWS_SESSION_TOKEN>",
        "Expiration": "2020-11-20T02:54:17Z"
    },
    "AssumedRoleUser": {
        "AssumedRoleId": "ACPATGCCLSNJCNSJCEWZ:AWSCLI-Session",
        "Arn": "arn:aws:sts::123456789012:assumed-role/EC2ImageBuilderRole/AWSCLI-Session"
    }
}
You now assume the EC2ImageBuilderRole IAM role from the command line. This role allows you to create objects in the S3 bucket generated from the s3-iam-config stack. Because this bucket is encrypted with AWS KMS, any user or IAM role requires specific permissions to decrypt the key. You have already accounted for this in a previous step by adding the EC2ImageBuilderRole IAM role to the KMS key policy.
2. Create the following environment variable to use the EC2ImageBuilderRole role. Update the values with the output from the previous step:
export AWS_ACCESS_KEY_ID=AccessKeyId
export AWS_SECRET_ACCESS_KEY=SecretAccessKey
export AWS_SESSION_TOKEN=SessionToken
3. Check to make sure that you have actually assumed the role EC2ImageBuilderRole:
aws sts get-caller-identity
You should see an output similar to the following:
{
    "UserId": "AROATG5CKLSWENUYOF6A4:AWSCLI-Session",
    "Account": "123456789012",
    "Arn": "arn:aws:sts::123456789012:assumed-role/EC2ImageBuilderRole/AWSCLI-Session"
}
4. Create a folder inside of the encrypted S3 bucket generated in the s3-iam-config stack:
aws s3api put-object --bucket <input_your_bucket_name> --key components
5. Zip the configuration files that you use in the Image Builder pipeline process:
zip -r linux-cis.zip LinuxCis/
zip -r nginx.zip Nginx/
6. Upload the configuration files to S3 bucket. Update the bucket name with the S3 bucket name you generated in the s3-iam-config stack.
aws s3 cp linux-cis.zip s3://<input_your_bucket_name>/components/

aws s3 cp nginx.zip s3://<input_your_bucket_name>/components/

aws s3 cp AnsibleConfig/cis_playbook.yml s3://<input_your_bucket_name>/components/

aws s3 cp AnsibleConfig/nginx_playbook.yml s3://<input_your_bucket_name>/components/

aws s3 cp AnsibleConfig/component-nginx.yml s3://<input_your_bucket_name>/components/
Deploying your pipeline
You’re now ready to deploy your pipeline.
1. Switch back to the original IAM user profile you used before assuming the EC2ImageBuilderRole. For instructions, see How do I assume an IAM role using the AWS CLI?
2. Open the Parameters/nginx-image-builder-params.json file and update the ImageBuilderBucketName parameter with the S3 bucket name generated in the s3-iam-config stack:
[
  {
    "ParameterKey": "Environment",
    "ParameterValue": "dev"
  },
  {
    "ParameterKey": "ImageBuilderBucketName",
    "ParameterValue": "<input_your_bucket_name>"
  },
  {
    "ParameterKey": "NetworkStackName",
    "ParameterValue": "vpc-config"
  },
  {
    "ParameterKey": "KMSStackName",
    "ParameterValue": "kms-config"
  },
  {
    "ParameterKey": "S3ConfigStackName",
    "ParameterValue": "s3-iam-config"
  }
]
3. Deploy the nginx-image-builder.yml template:
aws cloudformation create-stack \
--stack-name cis-image-builder \
--template-body file://Templates/nginx-image-builder.yml \
--parameters file://Parameters/nginx-image-builder-params.json \
--capabilities CAPABILITY_NAMED_IAM \
--region us-east-1
The template takes around 35 minutes to complete. Deploying this template starts the Image Builder pipeline.
Monitoring the pipeline
You can get more details about the pipeline on the AWS Management Console.
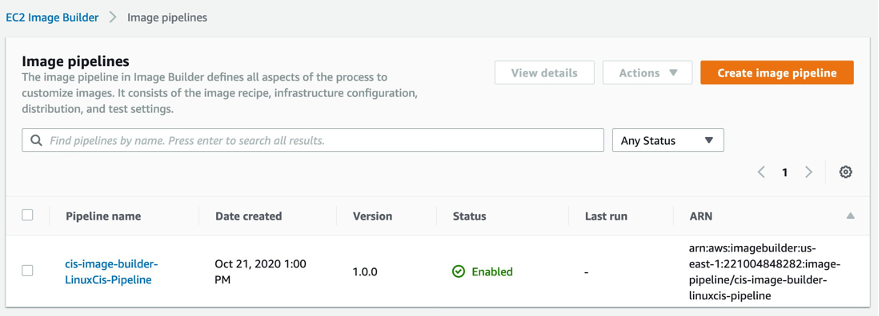
1. On the Image Builder console, choose Image pipelines to see the status of the pipeline.

Figure: Shows the EC2 Image Builder Pipeline status
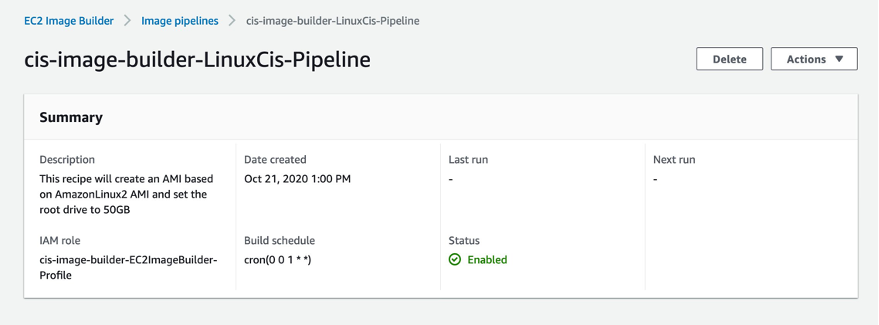
2. Choose the pipeline (for this post, cis-image-builder-LinuxCis-Pipeline)
On the pipeline details page, you can view more information and make updates to its configuration.

Figure: Shows the Image Builder Pipeline metadata
At this point, the Image Builder pipeline has started running the automation document in Systems Manager. Here you can monitor the progress of the AMI build.
3. On the Systems Manager console, choose Automation.
4. Choose the execution ID of the arn:aws:ssm:us-east-1:123456789012:document/ImageBuilderBuildImageDocument document.

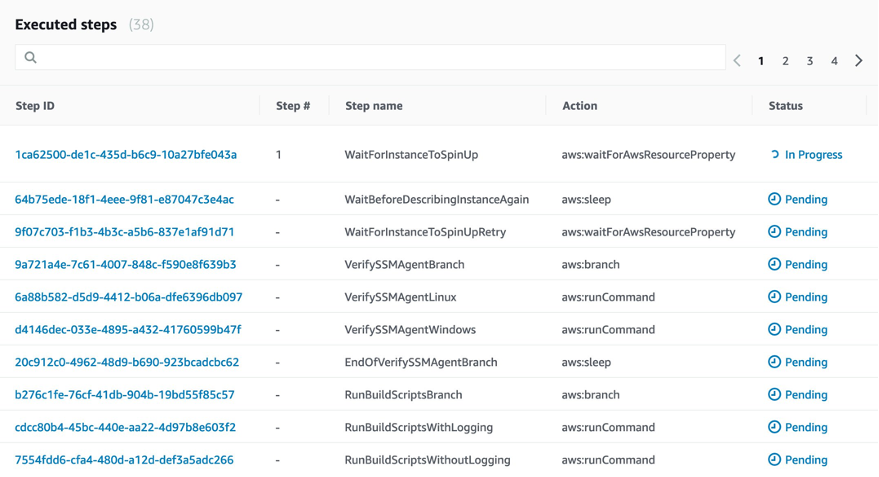
Figure: Shows the Image Builder Pipeline Systems Manager Automation steps
5. Choose the step ID to see what is happening in each step.
At this point, the Image Builder pipeline is bringing up an Amazon Linux 2 EC2 instance. From there, we run Ansible playbooks that configure the security and application settings. The automation is pulling its configuration from the S3 bucket you deployed in a previous step. When the Ansible run is complete, the instance stops and an AMI is generated from this instance. When this is complete, a cleanup is initiated that ends the EC2 instance. The final result is a CIS Level 1 hardened Amazon Linux 2 AMI running Nginx.
Updating parameters
When the stack is complete, you retrieve some new parameter values.
1. On the Systems Manager console, choose Automation.
2. Choose the execution ID of the arn:aws:ssm:us-east-1:123456789012:document/ImageBuilderBuildImageDocument document.
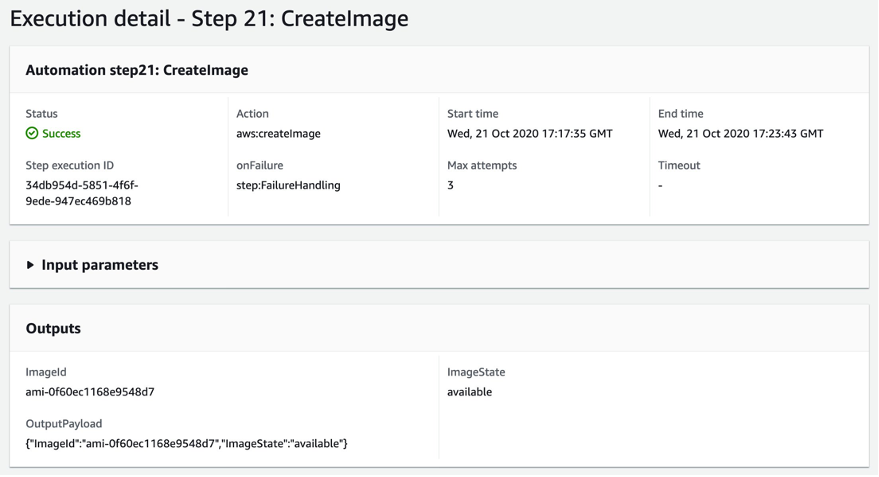
3. Choose step 21.
The following screenshot shows the output of this step.
Figure: Shows step of EC2 Image Builder Pipeline
4. Open the Parameters/nginx-config.json file and update the AmiId parameter with the AMI ID generated from the previous step:
[
  {
    "ParameterKey" : "Environment",
    "ParameterValue" : "dev"
  },
  {
    "ParameterKey": "NetworkStackName",
    "ParameterValue" : "vpc-config"
  },
  {
    "ParameterKey" : "S3ConfigStackName",
    "ParameterValue" : "s3-iam-config"
  },
  {
    "ParameterKey": "AmiId",
    "ParameterValue" : "<input_the_cis_hardened_ami_id>"
  },
  {
    "ParameterKey": "ApplicationName",
    "ParameterValue" : "Nginx"
  },
  {
    "ParameterKey": "NLBName",
    "ParameterValue" : "DemoALB"
  },
  {
    "ParameterKey": "TargetGroupName",
    "ParameterValue" : "DemoTG"
  }
]
5. Deploy the nginx-config.yml template:
aws cloudformation create-stack \
--stack-name nginx-config \
--template-body file://Templates/nginx-config.yml \
--parameters file://Parameters/nginx-config.json \
--capabilities CAPABILITY_NAMED_IAM \
--region us-east-1
The output should look like the following:
{
    "StackId": "arn:aws:cloudformation:us-east-1:123456789012:stack/nginx-config/fb2b0f30-24f6-11eb-ad7c-0a3238f55eb3"
}
6. Deploy the infrastructure-ssm-params.yml template:
aws cloudformation create-stack \
--stack-name ssm-params-config \
--template-body file://Templates/infrastructure-ssm-params.yml \
--parameters file://Parameters/infrastructure-ssm-parameters.json \
--capabilities CAPABILITY_NAMED_IAM \
--region us-east-1
Verifying Nginx is running
Let’s verify that our Nginx service is up and running properly. You use Session Manager to connect to a testing instance.
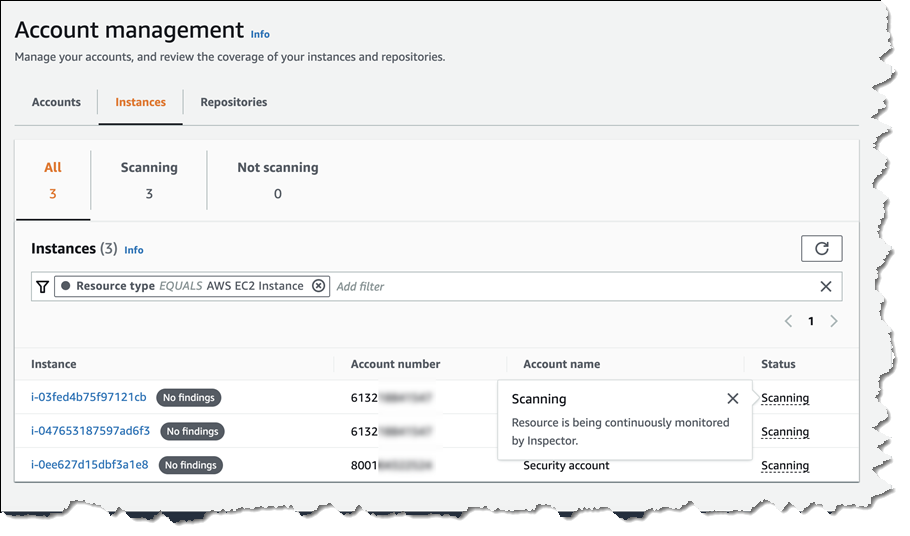
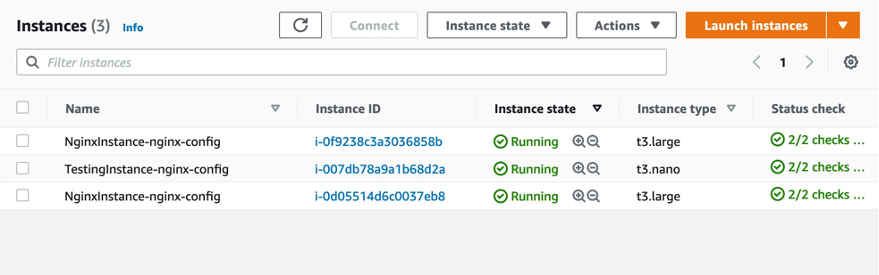
1. On the Amazon EC2 console, choose Instances.
You should see three instances, as in the following screenshot.

Figure: Shows the Nginx EC2 instances
You can connect to either one of the Nginx instances.
2. Select the testing instance.
3. On the Actions menu, choose Connect.
4. Choose Session Manager.
5. Choose Connect.
A terminal on the EC2 instance opens, similar to the following screenshot.

Figure: Shows the Session Manager terminal
6. Run the following command to ensure that Nginx is running properly:
curl localhost:8080
You should see an output similar to the following screenshot.

Figure: Shows Nginx output from terminal
Reviewing resources and configurations
Now that you have deployed the core services that for the solution, take some time to review the services that you have just deployed.
IAM roles
This project creates several IAM roles that are used to manage AWS resources. For example, EC2ImageBuilderRole is used to configure new AMIs with the Image Builder pipeline. This role contains only the permissions required to manage the Image Builder process. Adopting this pattern enforces the practice of least privilege. Additionally, many of the IAM polices attached to the IAM roles are restricted down to specific AWS resources. Let’s look at a couple of examples of managing IAM permissions with this project.
The following policy restricts Amazon S3 access to a specific S3 bucket. This makes sure that the role this policy is attached to can only access this specific S3 bucket. If this role needs to access any additional S3 buckets, the resource has to be explicitly added.
Policies:
  - PolicyName: GrantS3Read
    PolicyDocument:
      Statement:
        - Sid: GrantS3Read
          Effect: Allow
          Action:
            - s3:List*
            - s3:Get*
            - s3:Put*
          Resource: !Sub 'arn:aws:s3:::${S3Bucket}*'
Let’s look at the EC2ImageBuilderRole. A common scenario that occurs is when you need to assume a role locally in order to perform an action on a resource. In this case, because you’re using AWS KMS to encrypt the S3 bucket, you need to assume a role that has access to decrypt the KMS key so that artifacts can be uploaded to the S3 bucket. In the following AssumeRolePolicyDocument, we allow Amazon EC2 and Systems Manager services to be assumed by this role. Additionally, we allow IAM users to assume this role as well.
AssumeRolePolicyDocument:
  Version: 2012-10-17
  Statement:
    - Effect: Allow
      Principal:
        Service:
          - ec2.amazonaws.com
          - ssm.amazonaws.com
          - imagebuilder.amazonaws.com
        AWS: !Sub 'arn:aws:iam::${AWS::AccountId}:root'
      Action:
        - sts:AssumeRole
The principle !Sub 'arn:aws:iam::${AWS::AccountId}:root allows for any IAM user in this account to assume this role locally. Normally, this role should be scoped down to specific IAM users or roles. For the purpose of this post, we grant permissions to all users of the account.
Nginx configuration
The AMI built from the Image Builder pipeline contains all of the application and security configurations required to run Nginx as a web application. When an instance is launched from this AMI, no additional configuration is required.
We use Amazon EC2 launch templates to configure the application stack. The launch templates contain information such as the AMI ID, instance type, and security group. When a new AMI is provisioned, you simply update the launch template CloudFormation parameter with the new AMI and update the CloudFormation stack. From here, you can start an Auto Scaling group instance refresh to update the application stack to use the new AMI. The Auto Scaling group is updated with instances running on the updated AMI by bringing down one instance at a time and replacing it.
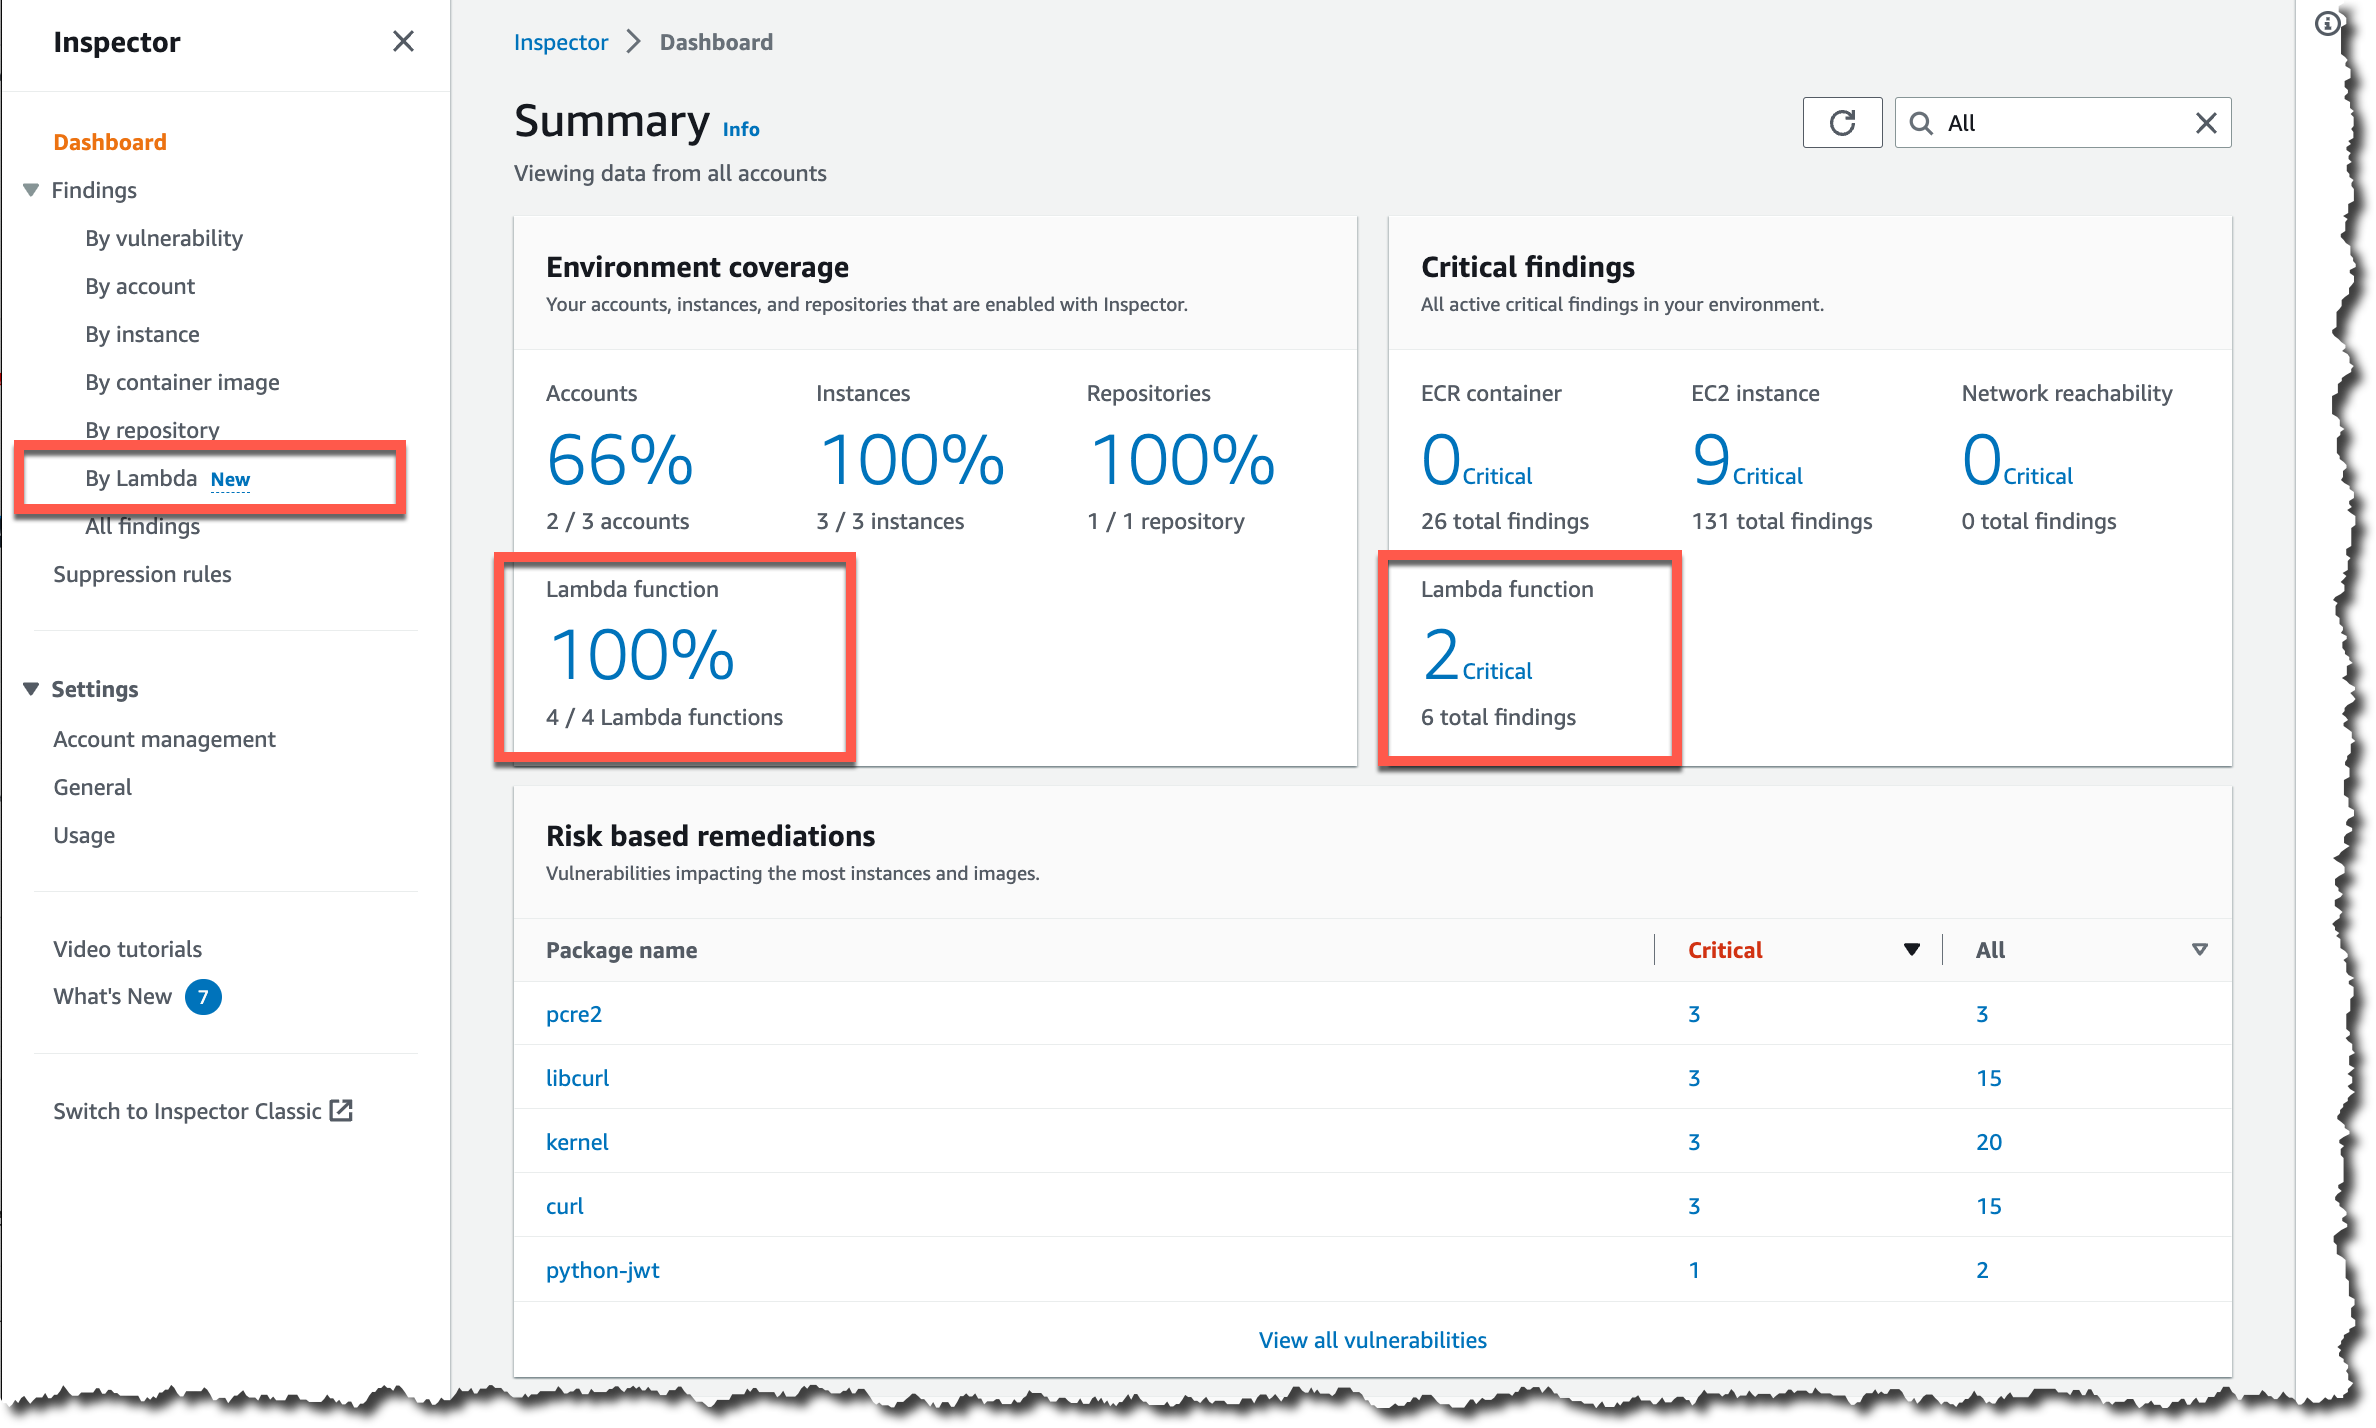
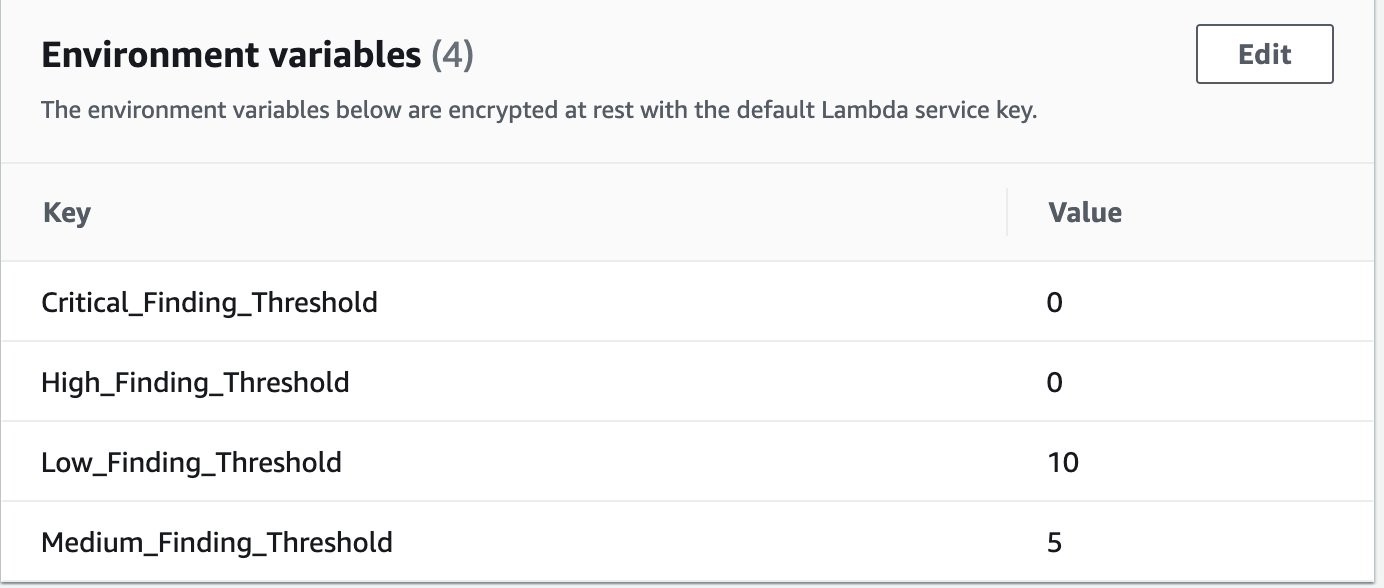
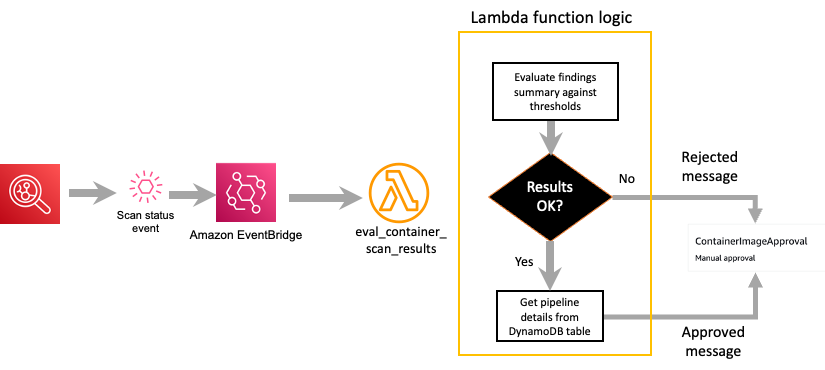
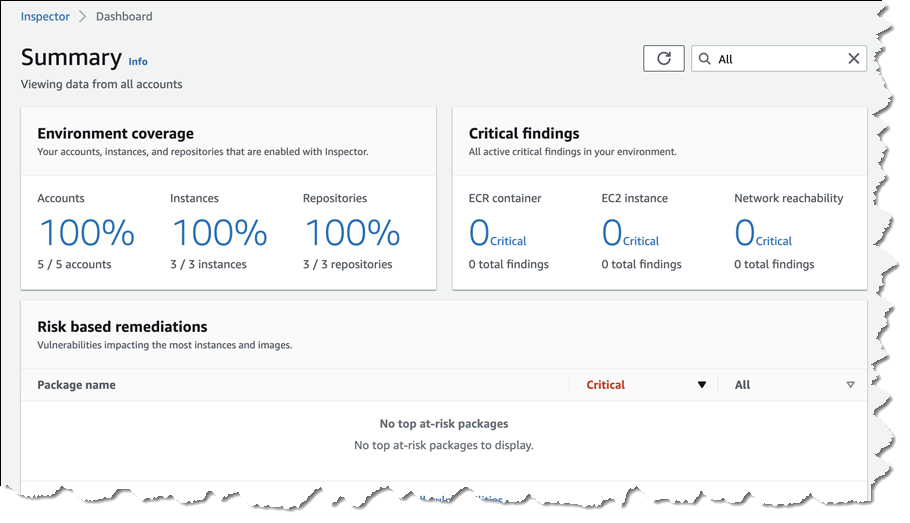
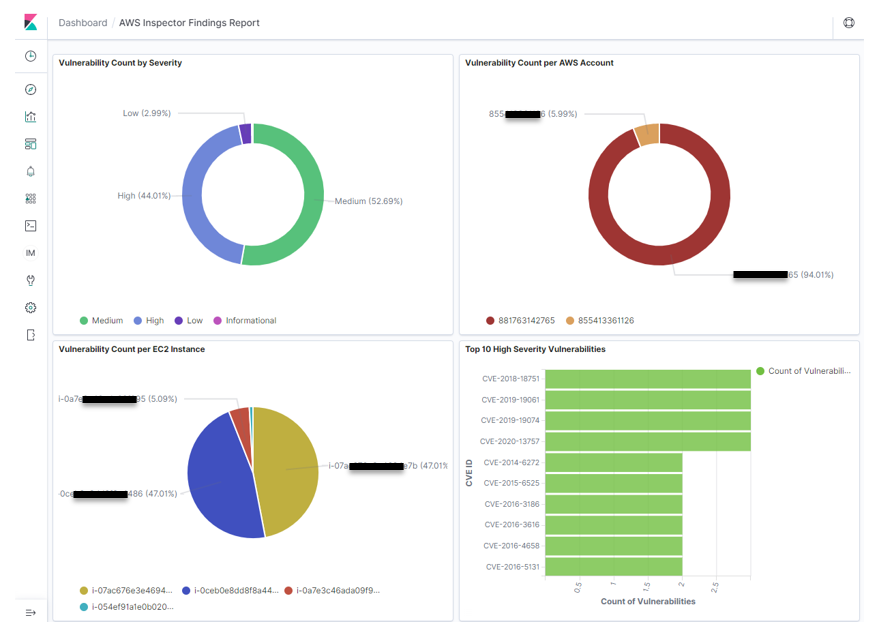
Amazon Inspector configuration
Amazon Inspector is an automated security assessment service that helps improve the security and compliance of applications deployed on AWS. With Amazon Inspector, assessments are generated for exposure, vulnerabilities, and deviations from best practices.
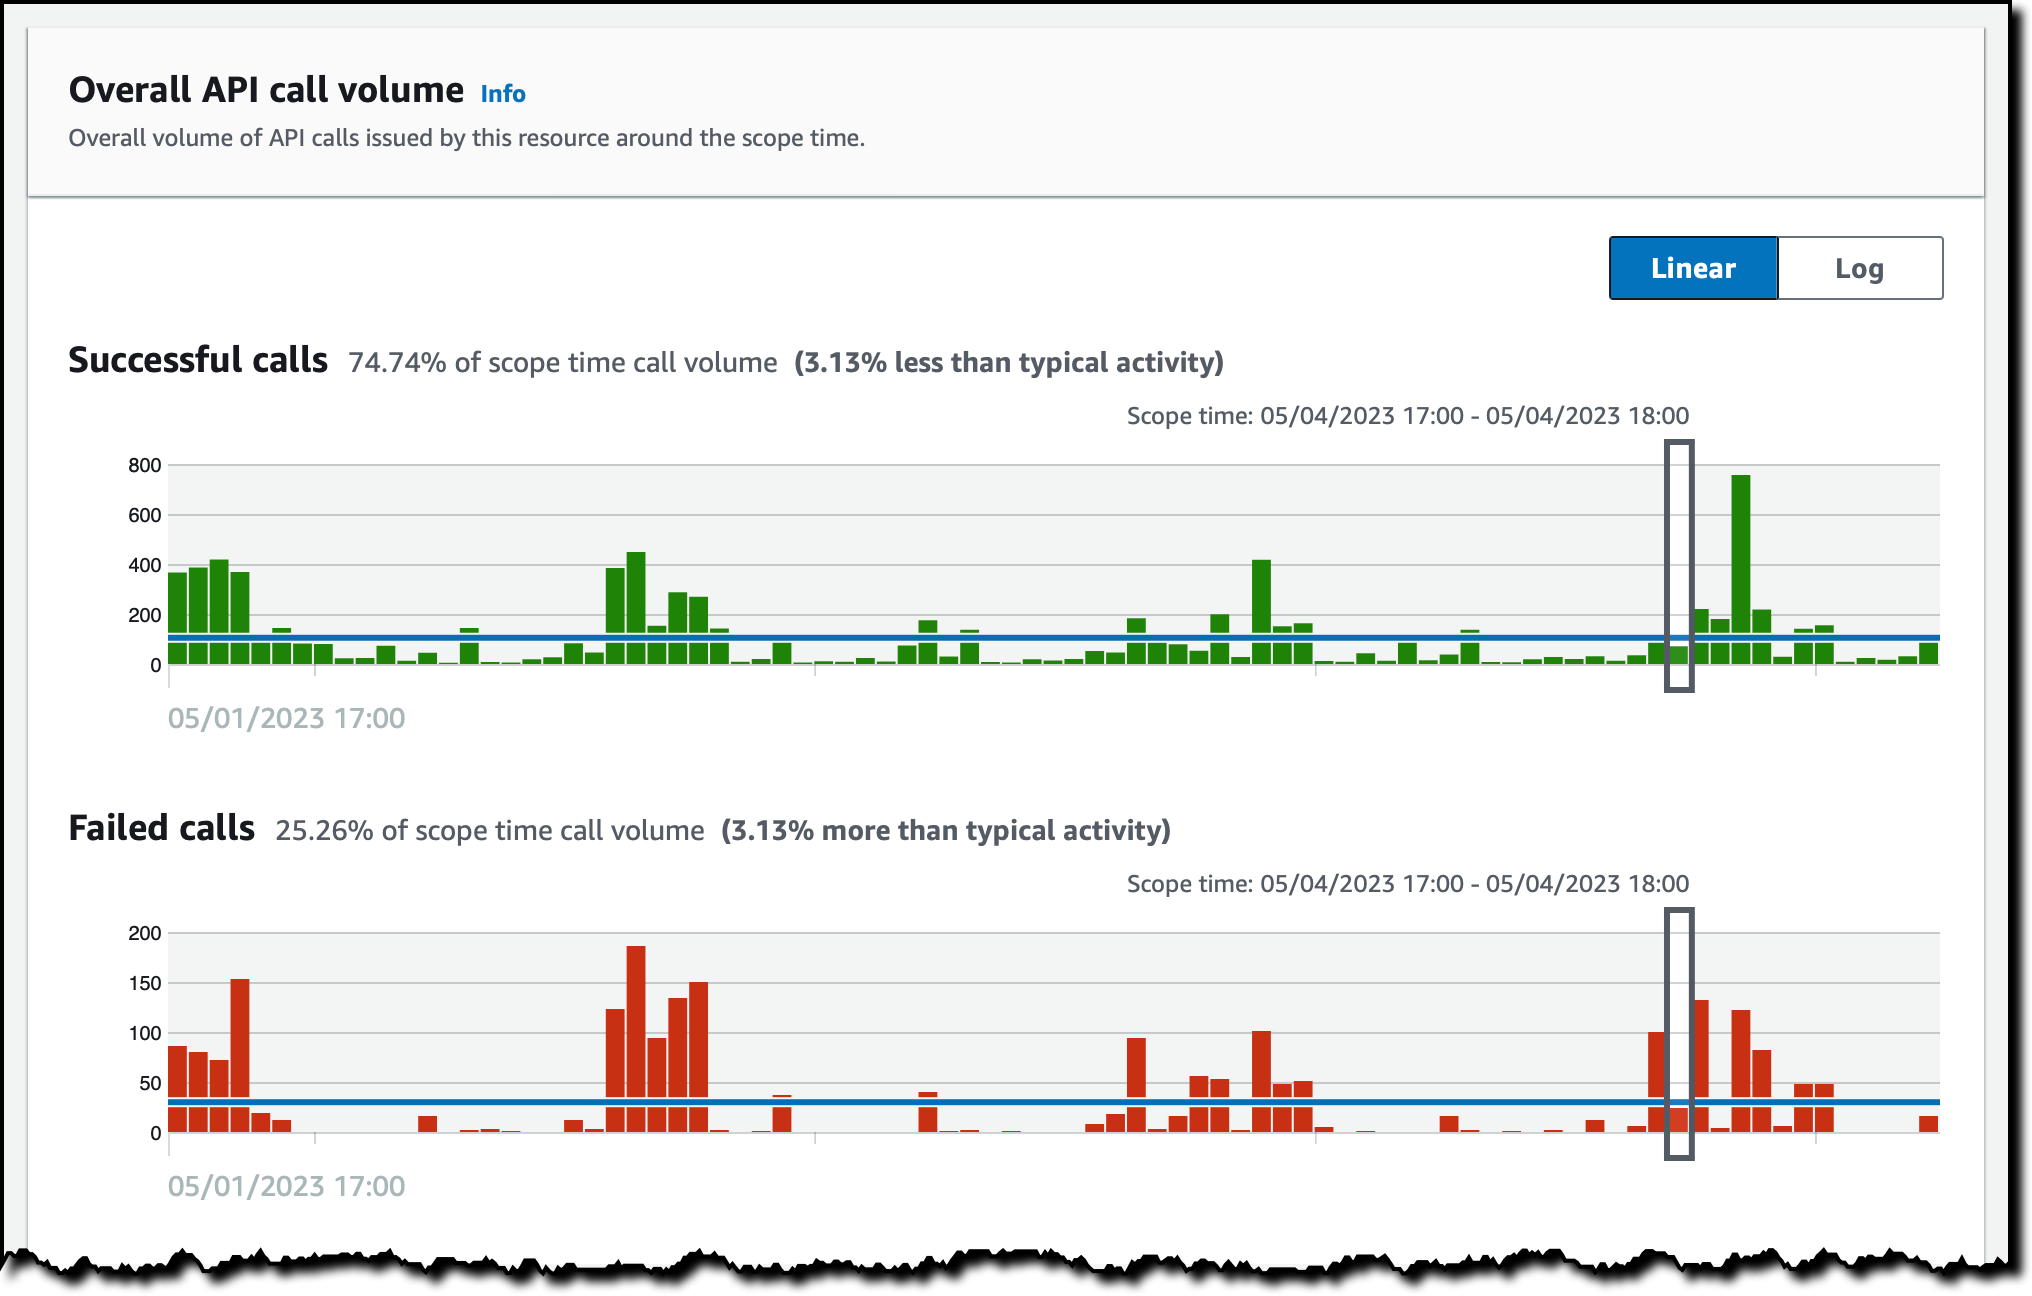
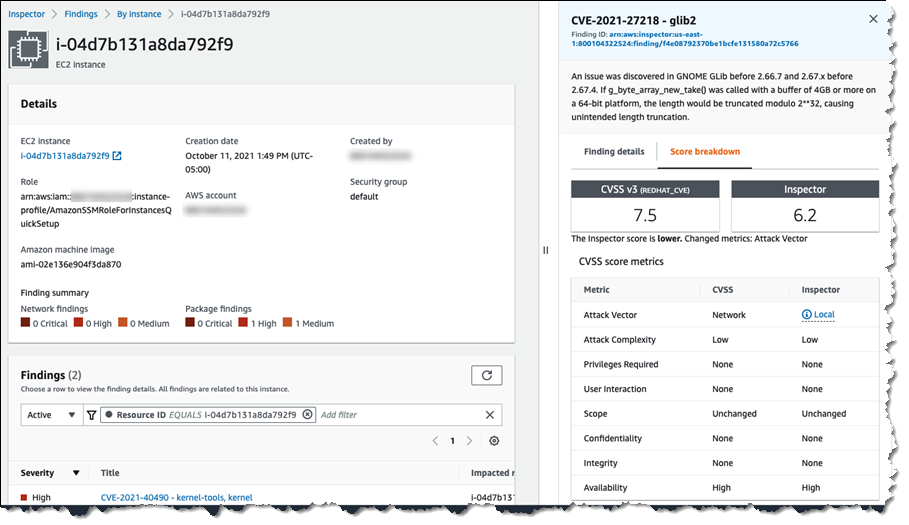
After performing an assessment, Amazon Inspector produces a detailed list of security findings prioritized by level of severity. These findings can be reviewed directly or as part of detailed assessment reports that are available via the Amazon Inspector console or API. We can use Amazon Inspector to assess our security posture against the CIS Level 1 standard that we use our Image Builder pipeline to provision. Let’s look at how we configure Amazon Inspector.
A resource group defines a set of tags that, when queried, identify the AWS resources that make up the assessment target. Any EC2 instance that is launched with the tag specified in the resource group is in scope for Amazon Inspector assessment runs. The following code shows our configuration:
ResourceGroup:
  Type: "AWS::Inspector::ResourceGroup"
  Properties:
    ResourceGroupTags:
      - Key: "ResourceGroup"
        Value: "Nginx"

AssessmentTarget:
  Type: AWS::Inspector::AssessmentTarget
  Properties:
    AssessmentTargetName : "NginxAssessmentTarget"
    ResourceGroupArn : !Ref ResourceGroup
In the following code, we specify the tag set in the resource group, which makes sure that when an instance is launched from this AMI, it’s under the scope of Amazon Inspector:
IBImage:
  Type: AWS::ImageBuilder::Image
  Properties:
    ImageRecipeArn: !Ref Recipe
    InfrastructureConfigurationArn: !Ref Infrastructure
    DistributionConfigurationArn: !Ref Distribution
    ImageTestsConfiguration:
      ImageTestsEnabled: false
      TimeoutMinutes: 60
    Tags:
      ResourceGroup: 'Nginx'
Building and deploying a new image with Amazon Inspector tests enabled
For this final portion of this post, we build and deploy a new AMI with an Amazon Inspector evaluation.
1. In your text editor, open Templates/nginx-image-builder.yml and update the pipeline and IBImage resource property ImageTestsEnabled to true.
The updated configuration should look like the following:
IBImage:
  Type: AWS::ImageBuilder::Image
  Properties:
    ImageRecipeArn: !Ref Recipe
    InfrastructureConfigurationArn: !Ref Infrastructure
    DistributionConfigurationArn: !Ref Distribution
    ImageTestsConfiguration:
      ImageTestsEnabled: true
      TimeoutMinutes: 60
    Tags:
      ResourceGroup: 'Nginx'
2. Update the stack with the new configuration:
aws cloudformation update-stack \
--stack-name cis-image-builder \
--template-body file://Templates/nginx-image-builder.yml \
--parameters file://Parameters/nginx-image-builder-params.json \
--capabilities CAPABILITY_NAMED_IAM \
--region us-east-1
This starts a new AMI build with an Amazon Inspector evaluation. The process can take up to 2 hours to complete.
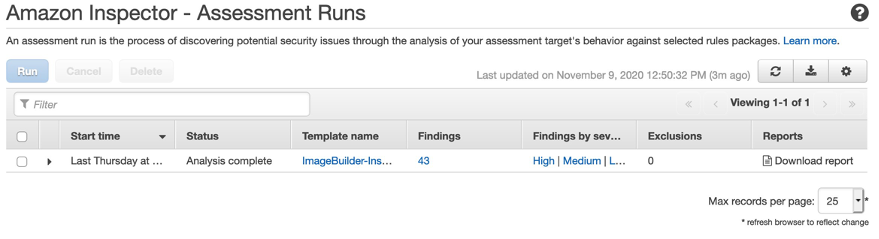
3. On the Amazon Inspector console, choose Assessment Runs.

Figure: Shows Amazon Inspector Assessment Run
4. Under Reports, choose Download report.
5. For Select report type, select Findings report.
6. For Select report format, select PDF.
7. Choose Generate report.

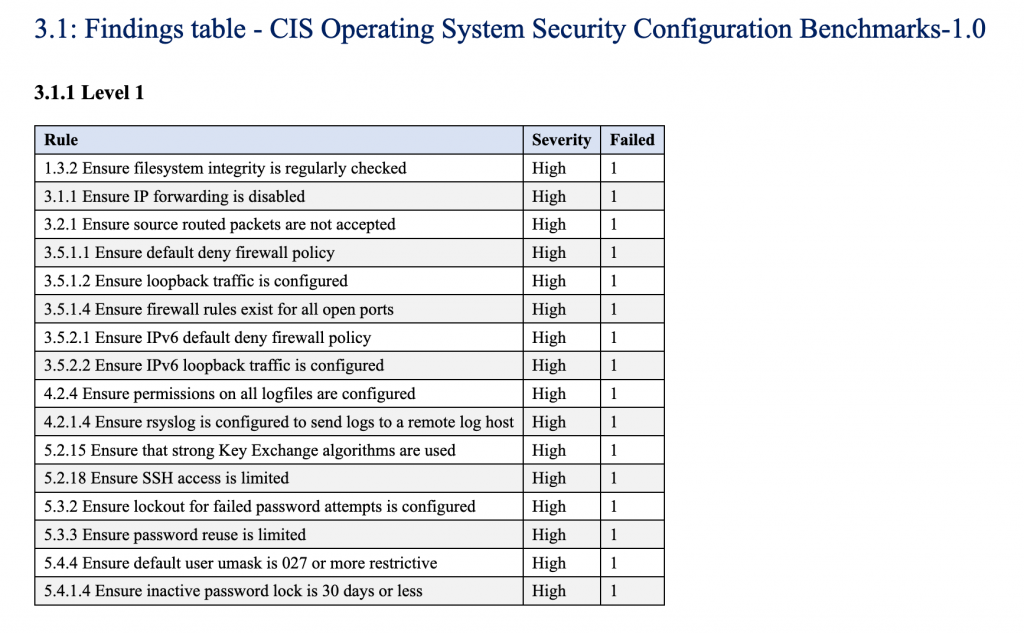
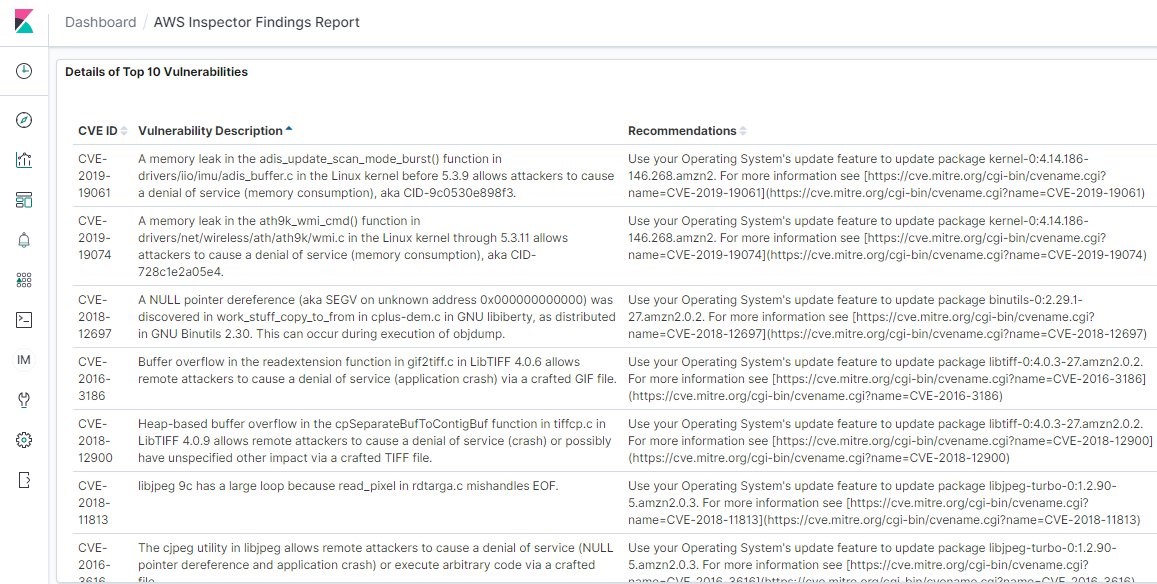
The following screenshot shows the findings report from the Amazon Inspector run.

This report generates an assessment against the CIS Level 1 standard. Any policies that don’t comply with the CIS Level 1 standard are explicitly called out in this report.
Section 3.1 lists any failed policies.

Figure: Shows Inspector findings
These failures are detailed later in the report, along with suggestions for remediation.
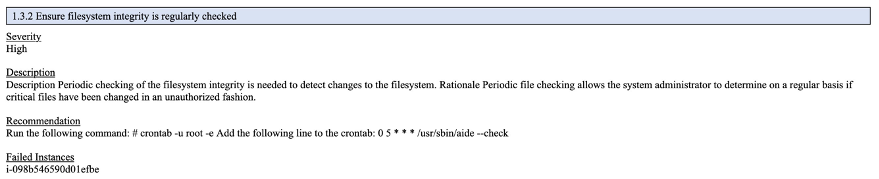
In section 4.1, locate the entry 1.3.2 Ensure filesystem integrity is regularly checked. This section shows the details of a failure from the Amazon Inspector findings report. You can also see suggestions on how to remediate the issue. Under Recommendation, the findings report suggests a specific command that you can use to remediate the issue.

Figure: Shows Inspector findings issue
You can use the Image Builder pipeline to simply update the Ansible playbooks with this setting, then run the Image Builder pipeline to build a new AMI, deploy the new AMI to an EC2 Instance, and run the Amazon Inspector report to ensure that the issue has been resolved. Finally, we can see the specific instances that have been assessed that have this issue.
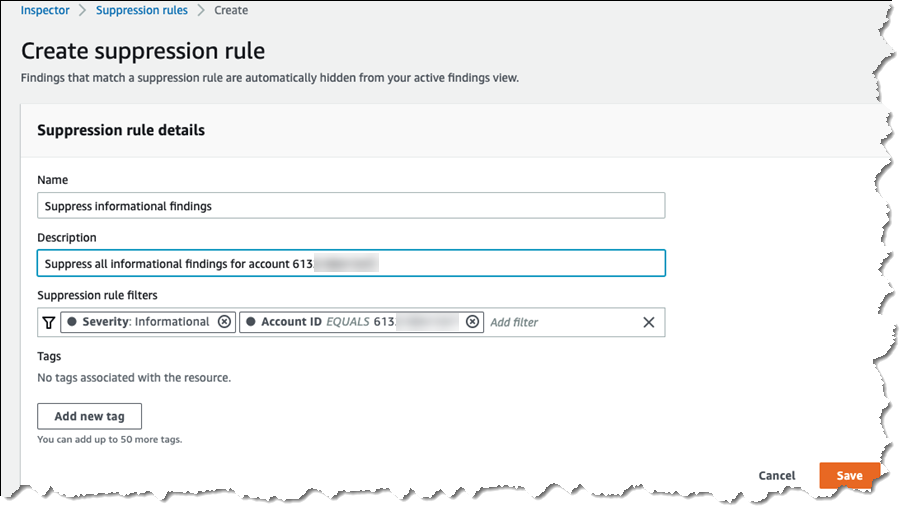
Organizations often customize security settings based off of a given use case. Your organization may choose CIS Level 1 as a standard but elect to not apply all the recommendations. For example, you might choose to not use the FirewallD service on your Linux instances, because you feel that using Amazon EC2 security groups gives you enough networking security in place that you don’t need an additional firewall. Disabling FirewallD causes a high severity failure in the Amazon Inspector report. This is expected and can be ignored when evaluating the report.
Conclusion
In this post, we showed you how to use Image Builder to automate the creation of AMIs. Additionally, we also showed you how to use the AWS CLI to deploy CloudFormation stacks. Finally, we walked through how to evaluate resources against CIS Level 1 Standard using Amazon Inspector.
About the Authors

Joe Keating is a Modernization Architect in Professional Services at Amazon Web Services. He works with AWS customers to design and implement a variety of solutions in the AWS Cloud. Joe enjoys cooking with a glass or two of wine and achieving mediocrity on the golf course.

Virginia Chu is a Sr. Cloud Infrastructure Architect in Professional Services at Amazon Web Services. She works with enterprise-scale customers around the globe to design and implement a variety of solutions in the AWS Cloud.