Post Syndicated from Benjamin Smith original https://aws.amazon.com/blogs/compute/icymi-serverless-preinvent-2022/
During the last few weeks, the AWS serverless team has been releasing a wave of new features in the build-up to AWS re:Invent 2022. This post recaps some of the most important releases for serverless developers building event-driven applications.
AWS Lambda
Lambda Support for Node.js 18
You can now develop Lambda functions using the Node.js 18 runtime. This version is in active LTS status and considered ready for general use. When creating or updating functions, specify a runtime parameter value of nodejs18.x or use the appropriate container base image to use this new runtime. Lambda’s Node.js runtimes include the AWS SDK for JavaScript.
This enables customers to use the AWS SDK to connect to other AWS services from their function code, without having to include the AWS SDK in their function deployment. This is especially useful when creating functions in the AWS Management Console. It’s also useful for Lambda functions deployed as inline code in CloudFormation templates. This blog post explains the major changes available with the Node.js 18 runtime in Lambda.
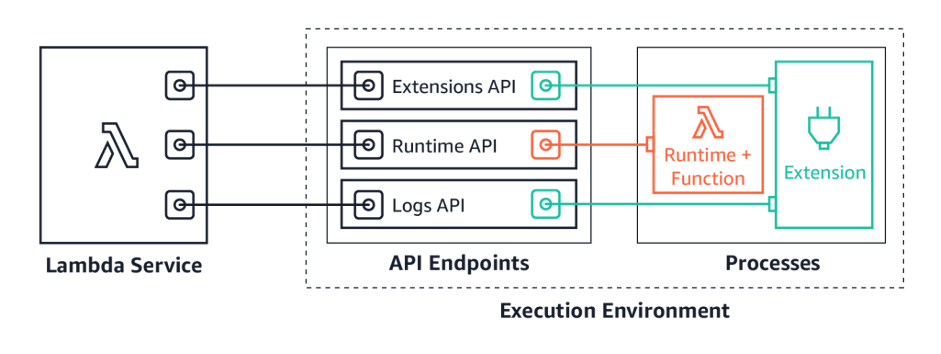
Lambda Telemetry API
The AWS Lambda team launched Lambda Telemetry API to provide an easier way to receive enhanced function telemetry directly from the Lambda service and send it to custom destinations. This makes it easier for developers and operators using third-party observability extensions to monitor and observe their Lambda functions.
The Lambda Telemetry API is an enhanced version of Logs API, which enables extensions to receive platform events, traces, and metrics directly from Lambda in addition to logs. This enables tooling vendors to collect enriched telemetry from their extensions, and send to any destination.
To see how the Telemetry API works, try the demos in the GitHub repository. Build your own extensions using the Telemetry API today, or use extensions provided by the Lambda observability partners.
.NET tooling
Lambda launched tooling support to enable applications running .NET 7 to be built and deployed on AWS Lambda. This includes applications compiled using .NET 7 native AOT. .NET 7 is the latest version of .NET and brings many performance improvements and optimizations. Customers can use .NET 7 with Lambda in two ways. First, Lambda has released a base container image for .NET 7, enabling customers to build and deploy .NET 7 functions as container images. Second, you can use Lambda’s custom runtime support to run functions compiled to native code using .NET 7 native AOT.
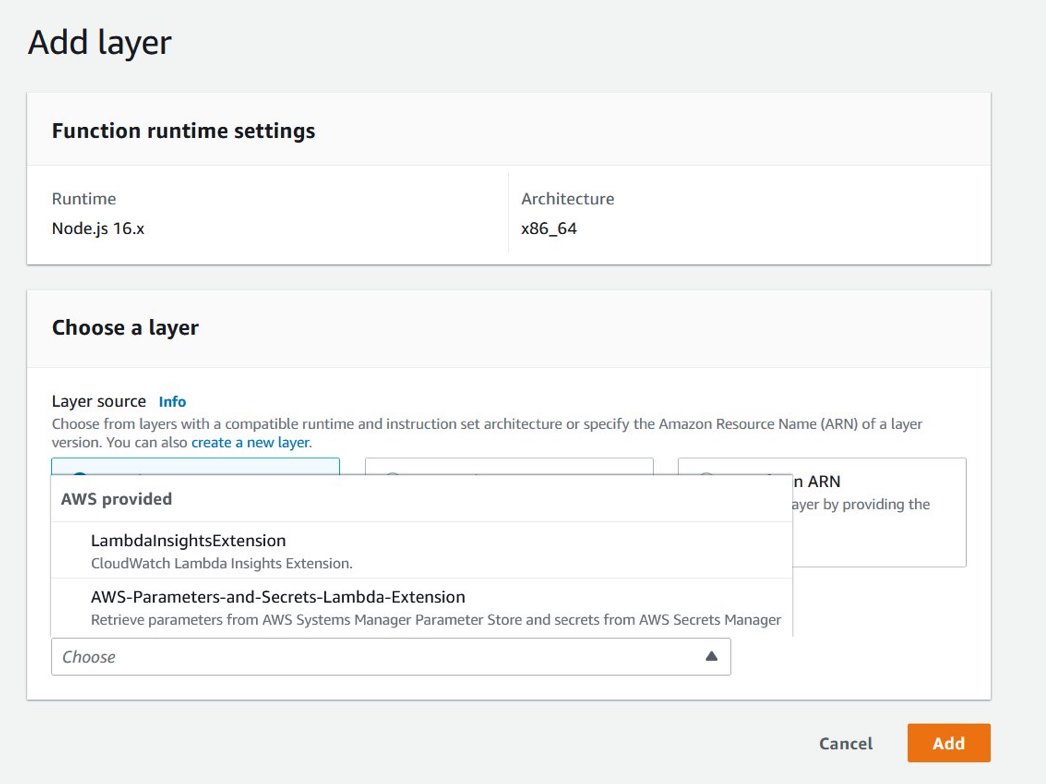
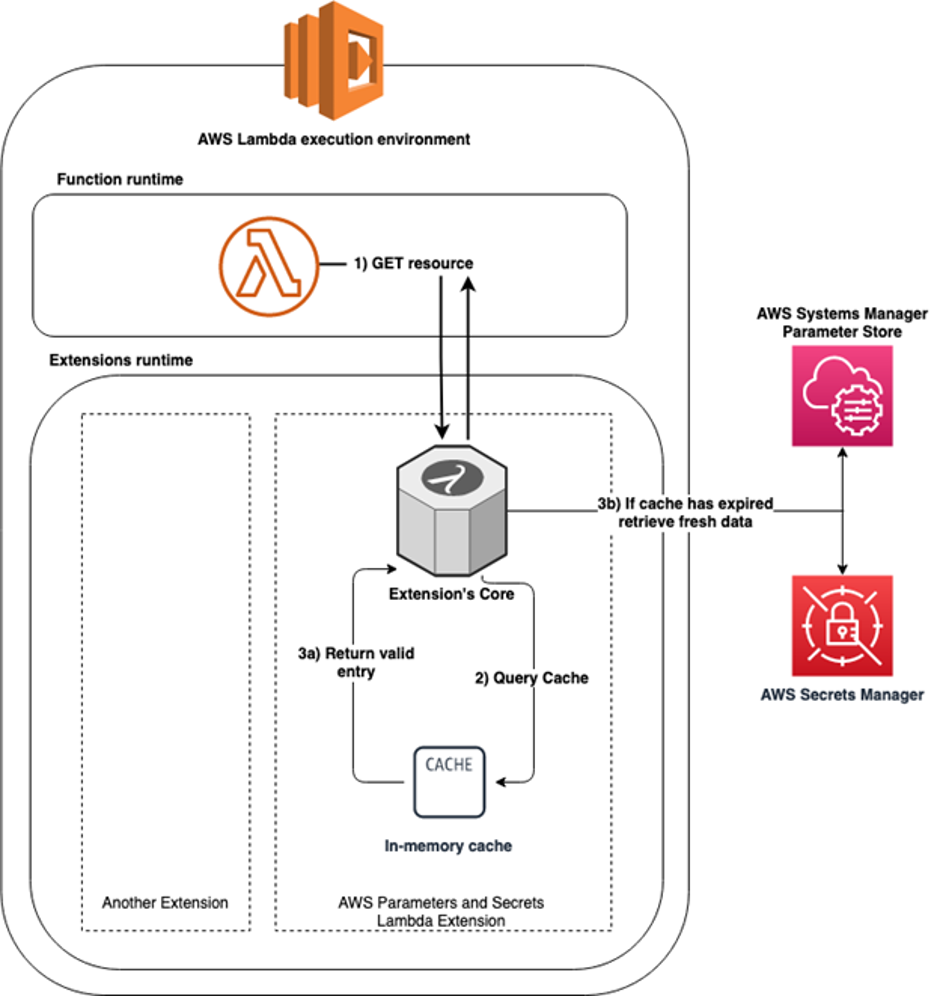
The new AWS Parameters and Secrets Lambda Extension provides a convenient method for Lambda users to retrieve parameters from AWS Systems Manager Parameter Store and secrets from AWS Secrets Manager. Use the extension to improve application performance by reducing latency and cost of retrieving parameters and secrets. The extension caches parameters and secrets, and persists them throughout the lifecycle of the Lambda function.
Amazon EventBridge
Amazon EventBridge Scheduler
Amazon EventBridge announced Amazon EventBridge Scheduler, a new capability that allows you to create, run, and manage scheduled tasks at scale. With EventBridge Scheduler, you can schedule one-time or recurrently tens of millions of tasks across many AWS services without provisioning or managing underlying infrastructure.
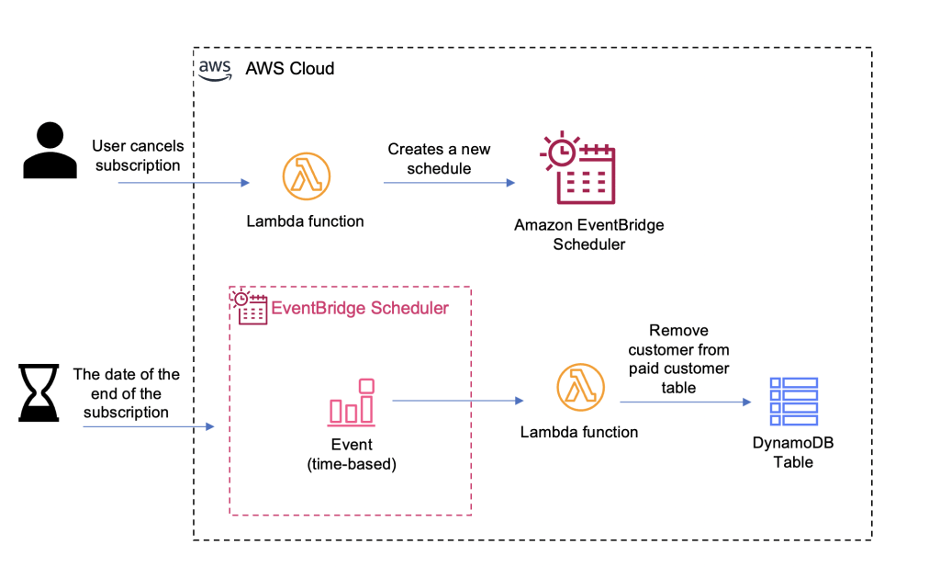
With EventBridge Scheduler, you can create schedules that trigger over 200 services with more than 6,000 APIs. EventBridge Scheduler allows you to configure schedules with a minimum granularity of one minute. It is priced per one million invocations, and the service is included in the AWS Free Tier. See the pricing page for more information. Visit the launch blog post to get started with EventBridge scheduler.
EventBridge now supports enhanced filtering capabilities including the ability to match against characters at the end of a value (suffix filtering), to ignore case sensitivity (equals-ignore-case), and to have a single EventBridge rule match if any conditions across multiple separate fields are true (OR matching). The bounds supported for numeric values has also been increased from -5e9 to 5e9 from -1e9 to 1e9. The new filtering capabilities further reduce the need to write and manage custom filtering code in downstream services.
AWS Step Functions
Intrinsic Functions
We have added 14 new intrinsic functions to AWS Step Functions. These are Amazon States Language (ASL) functions that perform basic data transformations. Intrinsic functions allow you to reduce the use of other services, such as AWS Lambda or AWS Fargate to perform basic data manipulation. This helps to reduce the amount of code and maintenance in your application. Intrinsics can also help reduce the cost of running your workflows by decreasing the number of states, number of transitions, and total workflow duration.
Standard Workflows, Express Workflows, and synchronous Express Workflows all support the new intrinsic functions, which can be grouped into six categories:
- Intrinsics for arrays
- Intrinsics for JSON data manipulation
- Intrinsics for data encoding and decoding
- Intrinsics for math operations
- Intrinsic for string operations
- Intrinsic for unique identifier generation
The intrinsic functions documentation contains the complete list of intrinsics.
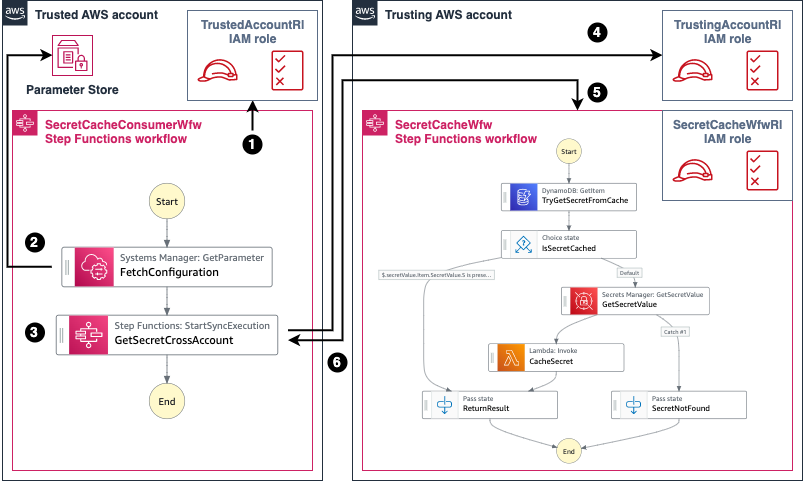
Cross-account access capabilities
Now, customers can take advantage of identity-based policies in Step Functions so your workflow can directly invoke resources in other AWS accounts, allowing cross-account service API integrations. The compute blog post demonstrates how to use cross-account capability using two AWS accounts.
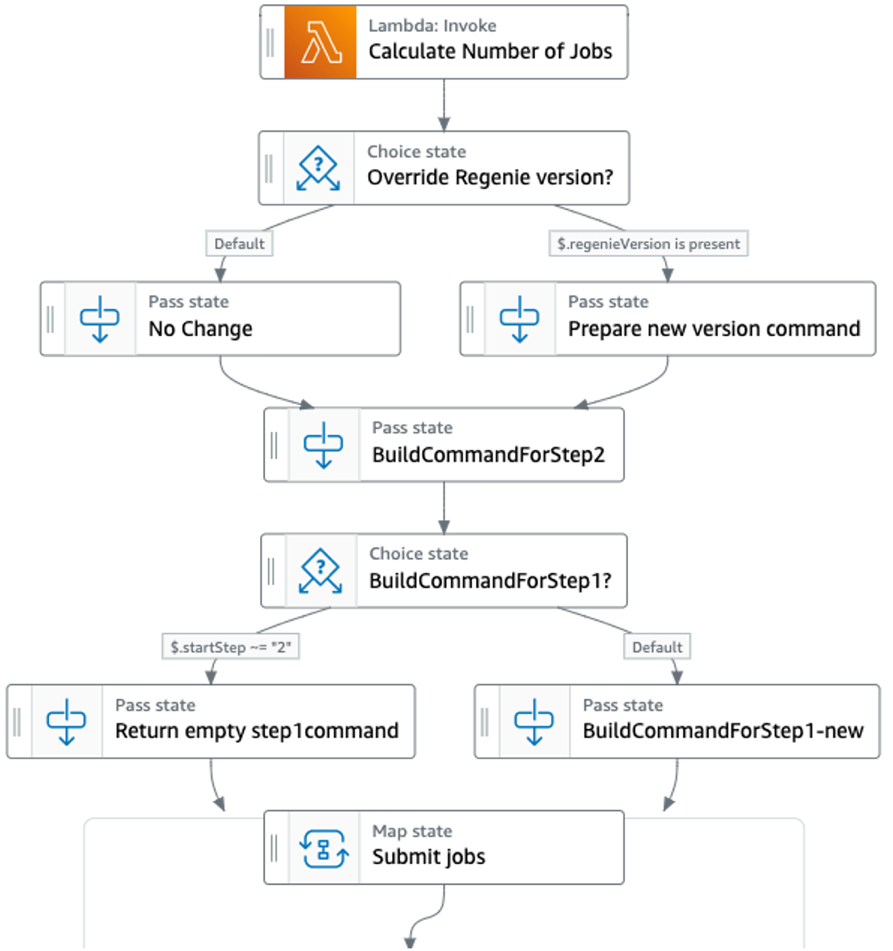
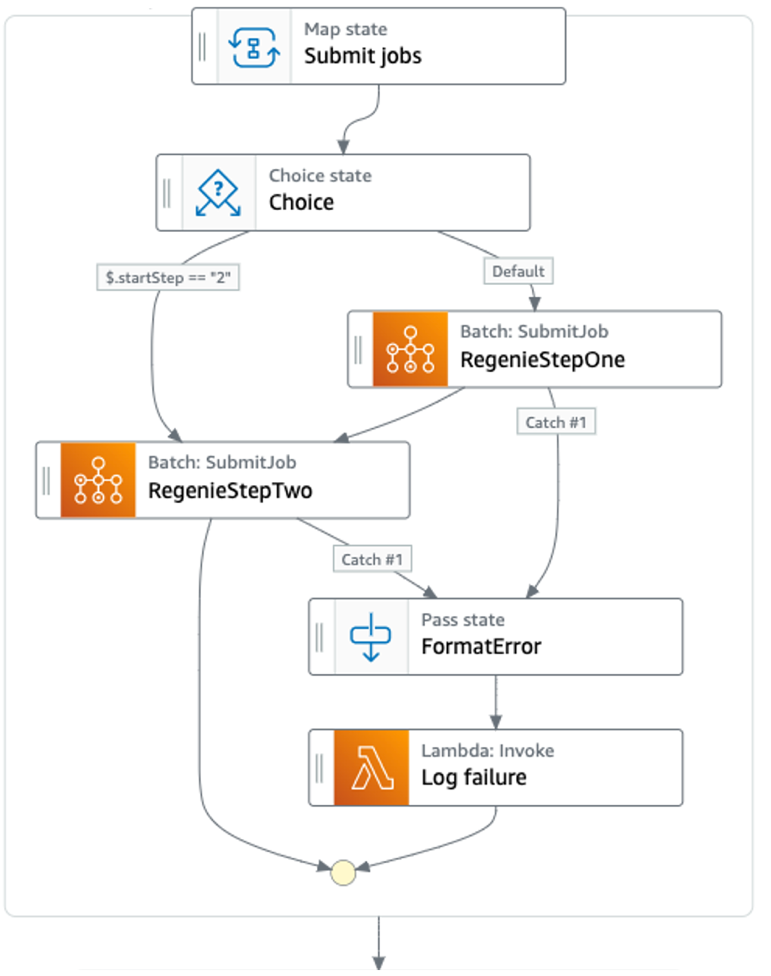
New executions experience for Express Workflows
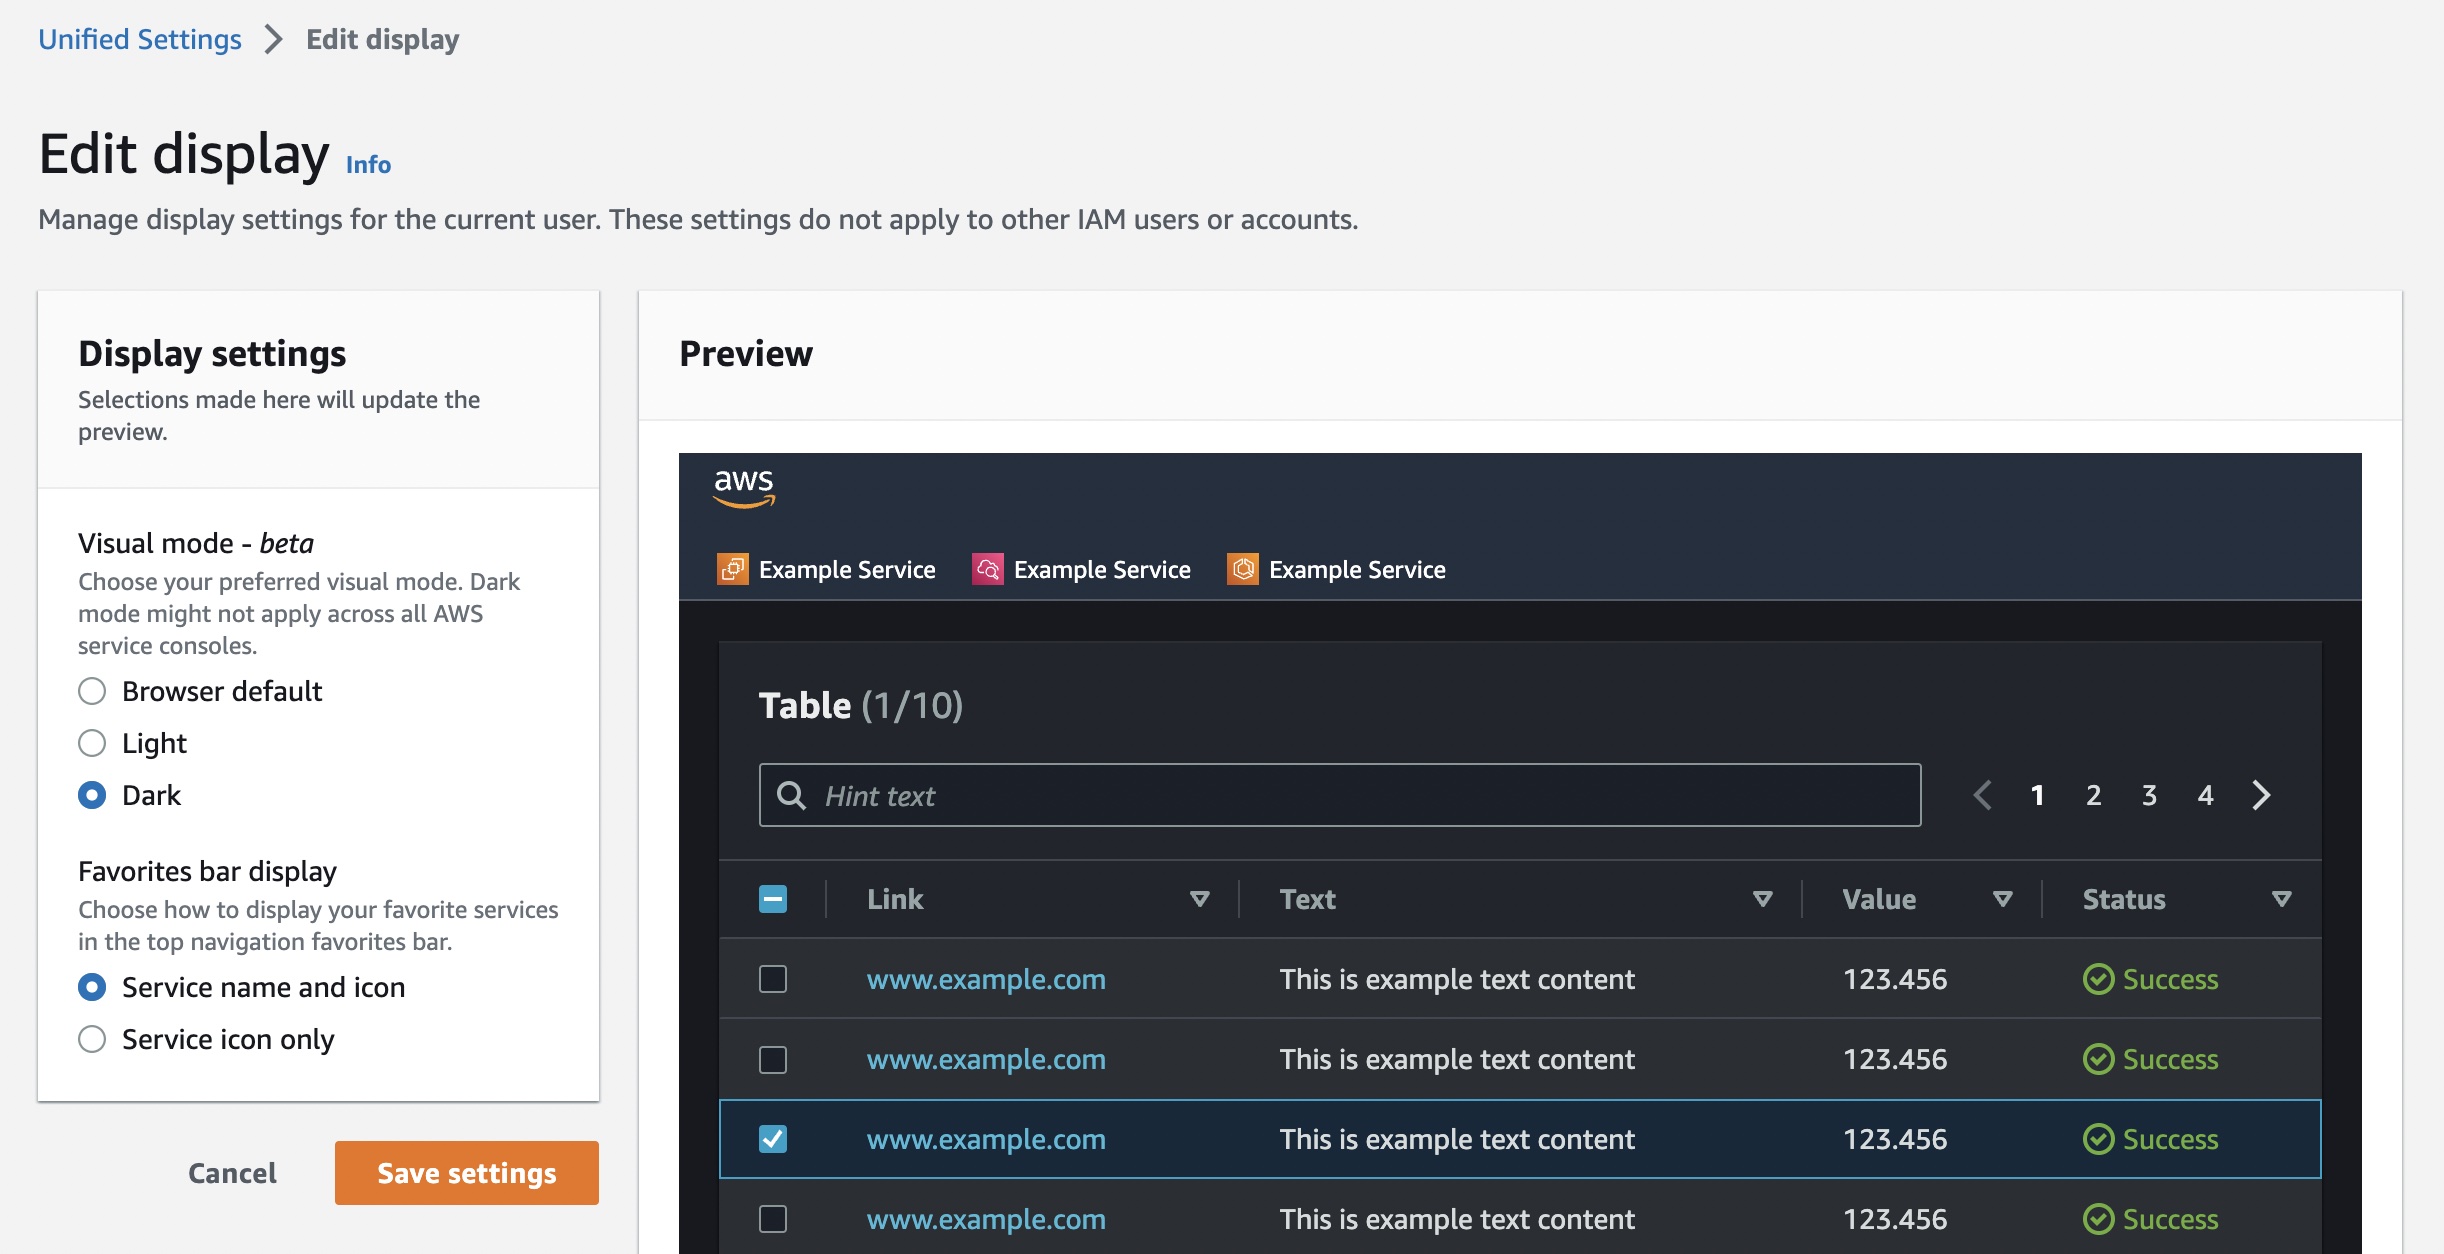
Step Functions now provides a new console experience for viewing and debugging your Express Workflow executions that makes it easier to trace and root cause issues in your executions.
You can opt in to the new console experience of Step Functions, which allows you to inspect executions using three different views: graph, table, and event view, and add many new features to enhance the navigation and analysis of the executions. You can search and filter your executions and the events in your executions using unique attributes such as state name and error type. Errors are now easier to root cause as the experience highlights the reason for failure in a workflow execution.
The new execution experience for Express Workflows is now available in all Regions where AWS Step Functions is available. For a complete list of Regions and service offerings, see AWS Regions.
Step Functions Workflows Collection
The AWS Serverless Developer Advocate team created the Step Functions Workflows Collection, a fresh experience that makes it easier to discover, deploy, and share Step Functions workflows. Use the Step Functions workflows collection to find simple “building blocks”, reusable patterns, and example applications to help build your serverless applications with Step Functions. All Step Functions builders are invited to contribute to the collection. This is done by submitting a pull request to the Step Functions Workflows Collection GitHub repository. Each submission is reviewed by the Serverless Developer advocate team for quality and relevancy before publishing.
AWS Serverless Application Model (AWS SAM)
AWS SAM Connector
Speed up serverless development while maintaining secure best practices using new AWS SAM connector. AWS SAM Connector allows builders to focus on the relationships between components without expert knowledge of AWS Identity and Access Management (IAM) or direct creation of custom policies. AWS SAM connector supports AWS Step Functions, Amazon DynamoDB, AWS Lambda, Amazon SQS, Amazon SNS, Amazon API Gateway, Amazon EventBridge and Amazon S3, with more resources planned in the future.
Connectors are best for those getting started and who want to focus on modeling the flow of data and events within their applications. Connectors will take the desired relationship model and create the permissions for the relationship to exist and function as intended.
View the Developer Guide to find out more about AWS SAM connectors.
SAM CLI Pipelines now supports Open ID Connect Protocol
SAM Pipelines make it easier to create continuous integration and deployment (CI/CD) pipelines for serverless applications with Jenkins, GitLab, GitHub Actions, Atlassian Bitbucket Pipelines, and AWS CodePipeline. With this launch, SAM Pipelines can be configured to support OIDC authentication from providers supporting OIDC, such as GitHub Actions, GitLab and BitBucket. SAM Pipelines will use the OIDC tokens to configure the AWS Identity and Access Management (IAM) identity providers, simplifying the setup process.
AWS SAM CLI Terraform support
You can now use AWS SAM CLI to test and debug serverless applications defined using Terraform configurations. This public preview allows you to build locally, test, and debug Lambda functions defined in Terraform. Support for the Terraform configuration is currently in preview, and the team is asking for feedback and feature request submissions. The goal is for both communities to help improve the local development process using AWS SAM CLI. Submit your feedback by creating a GitHub issue here.
Still looking for more?
Get your free online pass to watch all the biggest AWS news and updates from this year’s re:Invent.
For more learning resources, visit Serverless Land.


 Do not delete unsent messages from the queues. These messages will become visible after their queue’s visibility timeout is reached.