At AWS, we tirelessly innovate to allow you to focus on your business, not its underlying IT infrastructure. Sometimes we launch a new service or a major capability. Sometimes we focus on details that make your professional life easier.
Today, I’m happy to announce one of these small details that makes a difference: VPC security group rule IDs.
A security group acts as a virtual firewall for your cloud resources, such as an Amazon Elastic Compute Cloud (Amazon EC2) instance or a Amazon Relational Database Service (RDS) database. It controls ingress and egress network traffic. Security groups are made up of security group rules, a combination of protocol, source or destination IP address and port number, and an optional description.
When you use the AWS Command Line Interface (CLI) or API to modify a security group rule, you must specify all these elements to identify the rule. This produces long CLI commands that are cumbersome to type or read and error-prone. For example:
What’s New? A security group rule ID is an unique identifier for a security group rule. When you add a rule to a security group, these identifiers are created and added to security group rules automatically. Security group IDs are unique in an AWS Region. Here is the Edit inbound rules page of the Amazon VPC console:
As mentioned already, when you create a rule, the identifier is added automatically. For example, when I’m using the CLI:
We’re also adding two API actions: DescribeSecurityGroupRules and ModifySecurityGroupRules to the VPC APIs. You can use these to list or modify security group rules respectively.
What are the benefits ? The first benefit of a security group rule ID is simplifying your CLI commands. For example, the RevokeSecurityGroupEgress command used earlier can be now be expressed as:
The second benefit is that security group rules can now be tagged, just like many other AWS resources. You can use tags to quickly list or identify a set of security group rules, across multiple security groups.
In the previous example, I used the tag-on-create technique to add tags with --tag-specifications at the time I created the security group rule. I can also add tags at a later stage, on an existing security group rule, using its ID:
Let’s say my company authorizes access to a set of EC2 instances, but only when the network connection is initiated from an on-premises bastion host. The security group rule would be IpProtocol=tcp, FromPort=22, ToPort=22, IpRanges='[{1.2.3.4/32}]' where 1.2.3.4 is the IP address of the on-premises bastion host. This rule can be replicated in many security groups.
What if the on-premises bastion host IP address changes? I need to change the IpRanges parameter in all the affected rules. By tagging the security group rules with usage : bastion, I can now use the DescribeSecurityGroupRules API action to list the security group rules used in my AWS account’s security groups, and then filter the results on the usage : bastion tag. By doing so, I was able to quickly identify the security group rules I want to update.
As usual, you can manage results pagination by issuing the same API call again passing the value of NextToken with --next-token.
Availability Security group rule IDs are available for VPC security groups rules, in all commercial AWS Regions, at no cost.
It might look like a small, incremental change, but this actually creates the foundation for future additional capabilities to manage security groups and security group rules. Stay tuned!
Earlier today a cybersecurity advisory was published by international security agencies identifying widespread attacks against government and private sector targets worldwide. You can read the full report here, which discusses widespread, distributed, and anonymized brute force access attempts since mid-2019 and still active through early 2021.
Today, we have rolled out WAF mitigations to protect our customers against these types of attacks.
And we are making the exposed credential check feature of Account Takeover Protection available to all paid plans at no additional charge today. We had been planning to release these features later this month to a subset of our customers, but when we were informed of this ongoing attack we accelerated the release timeline and expanded those eligible to use the protections.
The attack which we are now protecting against was carried out in three main steps:
Initial account compromise performed via brute force attacks against authentication endpoints;
Once access was gained, network traversal was performed leveraging several publicly known vulnerabilities, including but not limited to CVE 2020-0688 and CVE 2020-17144 that widely affected Microsoft Exchange Servers;
Deployment of remote shells, such as a variant of the reGeorg web shell, and network reconnaissance to gather additional information;
Detecting Brute Force Login Attempts
The findings in the report highlight the increasing problem of password reuse and compromise that affects online applications, including government and large private sector online properties.
In March 2021, during Security Week, we launched a beta program for a new feature called Exposed Credential Checks. This feature allows website administrators to be notified whenever a login attempt is performed using a breached username and password credential pair. This is a very strong signal to enforce two factor authentication, a password reset, or simply increase user logging for the duration of the session.
Starting today, all paid plans (i.e., Pro and above) can enable the exposed credential check feature of Account Takeover Protection. We made the decision to give this to more customers due to the severity of the report and ongoing nature of the exploitation attempts.
While we work to accelerate the automatic deployment of the capability across these plans, you can file a support ticket with “Account Takeover Protections activation request” in the subject line to have it manually enabled today for your domains.
Customers who are not yet running the new WAF announced during Security Week will first be upgraded to this version; all accounts created after May 6, 2021, are already on the new version. The exposed credential managed ruleset can then be turned on with a single click, and supports the following applications out of the box:
WordPress
Joomla
Drupal
Ghost
Magento
Plone
Microsoft Exchange
When turned on, whenever a compromised credential is detected the following header will be added to the request to the origin server:
Exposed-Credential-Check: 1
This header alone won’t provide additional security, but can be used by the origin server to enforce additional measures, for example forcing a two factor authentication or password reset flow. The feature can also be deployed in logging mode to easily identify brute force attacks targeting your application using the Firewall Analytics dashboard.
If your application is not in the default set of protected applications, as long as your login endpoints conform to one of our generic rules, the feature will work as expected. We currently have two options:
A JSON endpoint (application/json) that submits credentials with 'email' and 'password' keys, for example {“email”:”[email protected]”, “password”:”pass”}
A standard login HTML form (application/x-www-form-urlencoded), under a URL that contains “login”. The form fields should be named username and password respectively;
In addition to exposed credential checks, we have implemented improvements to the following WAF rules effective immediately:
Improved rule 100197
Added a new rule 100197B (default disabled)
These rules will match against request payloads that contain the reGeorg shell variant mentioned in the report. The rule improvements were based on, but not limited to, the Yara rule found in the security advisory. In summary the rule will block payloads which contain the following signatures and similar variations:
In addition to monitoring and defending against credential stuffing attacks using datasets of compromised credentials, security administrators should implement additional best practices for their authentication endpoints. For example, multi-factor authentication, account time-out and lock-out features, and stronger methods of authentication that require “having” something such as a hard token or client certificate—not just “knowing” something such as a username and password.
Cloudflare has a number of additional features that customers are also advised to deploy where possible on their environments to strengthen their security posture:
Cloudflare Access can be used to provide strong, multi-factor authentication for both internal and external facing applications, and integrates directly with your organization’s SSO and identity providers (IdP);
Where possible, implementing Mutual TLS rules (mTLS) in front of authentication endpoints will increase an application security posture considerably by avoiding the use of passwords. This can be done both as a Firewall Rule or as an option when setting up Cloudflare Access;
We recently announced a Managed IP list that will contain Open Proxy endpoints identified by Cloudflare’s intelligence – this list can be used when creating Firewall Rules to protect authentication endpoints by issuing Captcha (or other) challenges;
The use of our Bot Management detection has recently been expanded to all self-serve paid plans via our Super Bot Fight Mode product – this product allows customers to set up rules to challenge/block automated traffic, such as bots attempting brute force attacks, while letting verified bots access Internet properties normally.
Conclusion
Brute force attacks are a prevalent and successful means to gain initial access to private networks, especially when applications require only username and password pairs for authentication. The report released today reinforced the widespread use of these credential stuffing attacks to gain access and then pivot to additional sensitive resources and data using other vulnerabilities.
Cloudflare customers are protected against these automated attacks by two new WAF rules, and also through the exposed credential check feature of our Account Takeover Protection offering. We have made the exposed credential check feature available today, to all paid plans, in advance of our planned launch later this month. Reach out to our support team immediately if you would like this feature enabled as we work to turn it on for everyone.
DevSecOps software factory implementation can significantly vary depending on the application, infrastructure, architecture, and the services and tools used. In a previous post, I provided an end-to-end DevSecOps pipeline for a three-tier web application deployed with AWS Elastic Beanstalk. The pipeline used cloud-native services along with a few open-source security tools. This solution is similar, but instead uses a containers-based approach with additional security analysis stages. It defines a software factory using Kubernetes along with necessary AWS Cloud-native services and open-source third-party tools. Code is provided in the GitHub repo to build this DevSecOps software factory, including the integration code for third-party scanning tools.
DevOps is a combination of cultural philosophies, practices, and tools that combine software development with information technology operations. These combined practices enable companies to deliver new application features and improved services to customers at a higher velocity. DevSecOps takes this a step further by integrating and automating the enforcement of preventive, detective, and responsive security controls into the pipeline.
In a DevSecOps factory, security needs to be addressed from two aspects: security of the software factory, and security in the software factory. In this architecture, we use AWS services to address the security of the software factory, and use third-party tools along with AWS services to address the security in the software factory. This AWS DevSecOps reference architecture covers DevSecOps practices and security vulnerability scanning stages including secret analysis, SCA (Software Composite Analysis), SAST (Static Application Security Testing), DAST (Dynamic Application Security Testing), RASP (Runtime Application Self Protection), and aggregation of vulnerability findings into a single pane of glass.
The focus of this post is on application vulnerability scanning. Vulnerability scanning of underlying infrastructure such as the Amazon Elastic Kubernetes Service (Amazon EKS) cluster and network is outside the scope of this post. For information about infrastructure-level security planning, refer to Amazon Guard Duty, Amazon Inspector, and AWS Shield.
You can deploy this pipeline in either the AWS GovCloud (US) Region or standard AWS Regions. All listed AWS services are authorized for FedRamp High and DoD SRG IL4/IL5.
Security and compliance
Thoroughly implementing security and compliance in the public sector and other highly regulated workloads is very important for achieving an ATO (Authority to Operate) and continuously maintain an ATO (c-ATO). DevSecOps shifts security left in the process, integrating it at each stage of the software factory, which can make ATO a continuous and faster process. With DevSecOps, an organization can deliver secure and compliant application changes rapidly while running operations consistently with automation.
Security and compliance are shared responsibilities between AWS and the customer. Depending on the compliance requirements (such as FedRamp or DoD SRG), a DevSecOps software factory needs to implement certain security controls. AWS provides tools and services to implement most of these controls. For example, to address NIST 800-53 security controls families such as access control, you can use AWS Identity Access and Management (IAM) roles and Amazon Simple Storage Service (Amazon S3) bucket policies. To address auditing and accountability, you can use AWS CloudTrail and Amazon CloudWatch. To address configuration management, you can use AWS Config rules and AWS Systems Manager. Similarly, to address risk assessment, you can use vulnerability scanning tools from AWS.
The following table is the high-level mapping of the NIST 800-53 security control families and AWS services that are used in this DevSecOps reference architecture. This list only includes the services that are defined in the AWS CloudFormation template, which provides pipeline as code in this solution. You can use additional AWS services and tools or other environmental specific services and tools to address these and the remaining security control families on a more granular level.
#
NIST 800-53 Security Control Family – Rev 5
AWS Services Used (In this DevSecOps Pipeline)
1
AC – Access Control
AWS IAM, Amazon S3, and Amazon CloudWatch are used.
Not implemented, but services like AWS Lambda, and Amazon CloudWatch Events can be used.
13
MA – Maintenance
N/A
14
MP – Media Protection
N/A
15
PS – Personnel Security
N/A
16
PE – Physical and Environmental Protection
N/A
17
PL – Planning
N/A
18
PM – Program Management
N/A
19
PT – PII Processing and Transparency
N/A
20
SR – SupplyChain Risk Management
N/A
Services and tools
In this section, we discuss the various AWS services and third-party tools used in this solution.
CI/CD services
For continuous integration and continuous delivery (CI/CD) in this reference architecture, we use the following AWS services:
AWS CodeBuild – A fully managed continuous integration service that compiles source code, runs tests, and produces software packages that are ready to deploy.
AWS CodePipeline – A fully managed continuous delivery service that helps you automate your release pipelines for fast and reliable application and infrastructure updates.
AWS Lambda – A service that lets you run code without provisioning or managing servers. You pay only for the compute time you consume.
Amazon Simple Notification Service – Amazon SNS is a fully managed messaging service for both application-to-application (A2A) and application-to-person (A2P) communication.
Amazon S3 – Amazon S3 is storage for the internet. You can use Amazon S3 to store and retrieve any amount of data at any time, from anywhere on the web.
AWS Systems Manager Parameter Store – Parameter Store provides secure, hierarchical storage for configuration data management and secrets management.
Continuous testing tools
The following are open-source scanning tools that are integrated in the pipeline for the purpose of this post, but you could integrate other tools that meet your specific requirements. You can use the static code review tool Amazon CodeGuru for static analysis, but at the time of this writing, it’s not yet available in AWS GovCloud and currently supports Java and Python.
Anchore (SCA and SAST) – Anchore Engine is an open-source software system that provides a centralized service for analyzing container images, scanning for security vulnerabilities, and enforcing deployment policies.
Amazon Elastic Container Registry image scanning – Amazon ECR image scanning helps in identifying software vulnerabilities in your container images. Amazon ECR uses the Common Vulnerabilities and Exposures (CVEs) database from the open-source Clair project and provides a list of scan findings.
Git-Secrets (Secrets Scanning) – Prevents you from committing sensitive information to Git repositories. It is an open-source tool from AWS Labs.
OWASP ZAP (DAST) – Helps you automatically find security vulnerabilities in your web applications while you’re developing and testing your applications.
Snyk (SCA and SAST) – Snyk is an open-source security platform designed to help software-driven businesses enhance developer security.
Sysdig Falco (RASP) – Falco is an open source cloud-native runtime security project that detects unexpected application behavior and alerts on threats at runtime. It is the first runtime security project to join CNCF as an incubation-level project.
You can integrate additional security stages like IAST (Interactive Application Security Testing) into the pipeline to get code insights while the application is running. You can use AWS partner tools like Contrast Security, Synopsys, and WhiteSource to integrate IAST scanning into the pipeline. Malware scanning tools, and image signing tools can also be integrated into the pipeline for additional security.
Continuous logging and monitoring services
The following are AWS services for continuous logging and monitoring used in this reference architecture:
Amazon CloudWatch Events – Delivers a near-real-time stream of system events that describe changes in AWS resources
The following are AWS auditing and governance services used in this reference architecture:
AWS CloudTrail – Enables governance, compliance, operational auditing, and risk auditing of your AWS account.
AWS Config – Allows you to assess, audit, and evaluate the configurations of your AWS resources.
AWS Identity and Access Management – Enables you to manage access to AWS services and resources securely. With IAM, you can create and manage AWS users and groups, and use permissions to allow and deny their access to AWS resources.
Operations services
The following are the AWS operations services used in this reference architecture:
AWS CloudFormation – Gives you an easy way to model a collection of related AWS and third-party resources, provision them quickly and consistently, and manage them throughout their lifecycles, by treating infrastructure as code.
Amazon ECR – A fully managed container registry that makes it easy to store, manage, share, and deploy your container images and artifacts anywhere.
Amazon EKS – A managed service that you can use to run Kubernetes on AWS without needing to install, operate, and maintain your own Kubernetes control plane or nodes. Amazon EKS runs up-to-date versions of the open-source Kubernetes software, so you can use all of the existing plugins and tooling from the Kubernetes community.
AWS Security Hub – Gives you a comprehensive view of your security alerts and security posture across your AWS accounts. This post uses Security Hub to aggregate all the vulnerability findings as a single pane of glass.
AWS Systems Manager Parameter Store – Provides secure, hierarchical storage for configuration data management and secrets management. You can store data such as passwords, database strings, Amazon Machine Image (AMI) IDs, and license codes as parameter values.
Pipeline architecture
The following diagram shows the architecture of the solution. We use AWS CloudFormation to describe the pipeline as code.
Kubernetes DevSecOps Pipeline Architecture
The main steps are as follows:
When a user commits the code to CodeCommit repository, a CloudWatch event is generated, which triggers CodePipeline to orchestrate the events.
CodeBuild packages the build and uploads the artifacts to an S3 bucket.
CodeBuild scans the code with git-secrets. If there is any sensitive information in the code such as AWS access keys or secrets keys, CodeBuild fails the build.
CodeBuild creates the container image and perform SCA and SAST by scanning the image with Snyk or Anchore. In the provided CloudFormation template, you can pick one of these tools during the deployment. Please note, CodeBuild is fully enabled for a “bring your own tool” approach.
(4a) If there are any vulnerabilities, CodeBuild invokes the Lambda function. The function parses the results into AWS Security Finding Format (ASFF) and posts them to Security Hub. Security Hub helps aggregate and view all the vulnerability findings in one place as a single pane of glass. The Lambda function also uploads the scanning results to an S3 bucket.
(4b) If there are no vulnerabilities, CodeBuild pushes the container image to Amazon ECR and triggers another scan using built-in Amazon ECR scanning.
CodeBuild retrieves the scanning results.
(5a) If there are any vulnerabilities, CodeBuild invokes the Lambda function again and posts the findings to Security Hub. The Lambda function also uploads the scan results to an S3 bucket.
(5b) If there are no vulnerabilities, CodeBuild deploys the container image to an Amazon EKS staging environment.
After the deployment succeeds, CodeBuild triggers the DAST scanning with the OWASP ZAP tool (again, this is fully enabled for a “bring your own tool” approach).
(6a) If there are any vulnerabilities, CodeBuild invokes the Lambda function, which parses the results into ASFF and posts it to Security Hub. The function also uploads the scan results to an S3 bucket (similar to step 4a).
If there are no vulnerabilities, the approval stage is triggered, and an email is sent to the approver for action via Amazon SNS.
After approval, CodeBuild deploys the code to the production Amazon EKS environment.
During the pipeline run, CloudWatch Events captures the build state changes and sends email notifications to subscribed users through Amazon SNS.
CloudTrail tracks the API calls and sends notifications on critical events on the pipeline and CodeBuild projects, such as UpdatePipeline, DeletePipeline, CreateProject, and DeleteProject, for auditing purposes.
AWS Config tracks all the configuration changes of AWS services. The following AWS Config rules are added in this pipeline as security best practices:
CODEBUILD_PROJECT_ENVVAR_AWSCRED_CHECK – Checks whether the project contains environment variables AWS_ACCESS_KEY_ID and AWS_SECRET_ACCESS_KEY. The rule is NON_COMPLIANT when the project environment variables contain plaintext credentials. This rule ensures that sensitive information isn’t stored in the CodeBuild project environment variables.
CLOUD_TRAIL_LOG_FILE_VALIDATION_ENABLED – Checks whether CloudTrail creates a signed digest file with logs. AWS recommends that the file validation be enabled on all trails. The rule is noncompliant if the validation is not enabled. This rule ensures that pipeline resources such as the CodeBuild project aren’t altered to bypass critical vulnerability checks.
Security of the pipeline is implemented using IAM roles and S3 bucket policies to restrict access to pipeline resources. Pipeline data at rest and in transit is protected using encryption and SSL secure transport. We use Parameter Store to store sensitive information such as API tokens and passwords. To be fully compliant with frameworks such as FedRAMP, other things may be required, such as MFA.
Security in the pipeline is implemented by performing the Secret Analysis, SCA, SAST, DAST, and RASP security checks. Applicable AWS services provide encryption at rest and in transit by default. You can enable additional controls on top of these wherever required.
In the next section, I explain how to deploy and run the pipeline CloudFormation template used for this example. As a best practice, we recommend using linting tools like cfn-nag and cfn-guard to scan CloudFormation templates for security vulnerabilities. Refer to the provided service links to learn more about each of the services in the pipeline.
Prerequisites
Before getting started, make sure you have the following prerequisites:
An EKS cluster environment with your application deployed. In this post, we use PHP WordPress as a sample application, but you can use any other application.
Sysdig Falco installed on an EKS cluster. Sysdig Falco captures events on the EKS cluster and sends those events to CloudWatch using AWS FireLens. For implementation instructions, see Implementing Runtime security in Amazon EKS using CNCF Falco. This step is required only if you need to implement RASP in the software factory.
An Amazon ECR repo to store container images and scan for vulnerabilities. Enable vulnerability scanning on image push in Amazon ECR. You can enable or disable the automatic scanning on image push via the Amazon ECR
The provided buildspec-*.yml files for git-secrets, Anchore, Snyk, Amazon ECR, OWASP ZAP, and your Kubernetes deployment .yml files uploaded to the root of the application code repository. Please update the Kubernetes (kubectl) commands in the buildspec files as needed.
A Snyk API key if you use Snyk as a SAST tool.
The Lambda function uploaded to an S3 bucket. We use this function to parse the scan reports and post the results to Security Hub.
An OWASP ZAP URL and generated API key for dynamic web scanning.
An application web URL to run the DAST testing.
An email address to receive approval notifications for deployment, pipeline change notifications, and CloudTrail events.
To deploy the pipeline, complete the following steps:
Download the CloudFormation template and pipeline code from the GitHub repo.
Sign in to your AWS account if you have not done so already.
On the CloudFormation console, choose Create Stack.
Choose the CloudFormation pipeline template.
Choose Next.
Under Code, provide the following information:
Code details, such as repository name and the branch to trigger the pipeline.
The Amazon ECR container image repository name.
Under SAST, provide the following information:
Choose the SAST tool (Anchore or Snyk) for code analysis.
If you select Snyk, provide an API key for Snyk.
Under DAST, choose the DAST tool (OWASP ZAP) for dynamic testing and enter the API token, DAST tool URL, and the application URL to run the scan.
Under Lambda functions, enter the Lambda function S3 bucket name, filename, and the handler name.
For STG EKS cluster, enter the staging EKS cluster name.
For PRD EKS cluster, enter the production EKS cluster name to which this pipeline deploys the container image.
Under General, enter the email addresses to receive notifications for approvals and pipeline status changes.
Choose Next.
Complete the stack.
After the pipeline is deployed, confirm the subscription by choosing the provided link in the email to receive notifications.
Pipeline CloudFormation Parameters
The provided CloudFormation template in this post is formatted for AWS GovCloud. If you’re setting this up in a standard Region, you have to adjust the partition name in the CloudFormation template. For example, change ARN values from arn:aws-us-gov to arn:aws.
Running the pipeline
To trigger the pipeline, commit changes to your application repository files. That generates a CloudWatch event and triggers the pipeline. CodeBuild scans the code and if there are any vulnerabilities, it invokes the Lambda function to parse and post the results to Security Hub.
When posting the vulnerability finding information to Security Hub, we need to provide a vulnerability severity level. Based on the provided severity value, Security Hub assigns the label as follows. Adjust the severity levels in your code based on your organization’s requirements.
0 – INFORMATIONAL
1–39 – LOW
40– 69 – MEDIUM
70–89 – HIGH
90–100 – CRITICAL
The following screenshot shows the progression of your pipeline.
DevSecOps Kubernetes CI/CD Pipeline
Secrets analysis scanning
In this architecture, after the pipeline is initiated, CodeBuild triggers the Secret Analysis stage using git-secrets and the buildspec-gitsecrets.yml file. Git-Secrets looks for any sensitive information such as AWS access keys and secret access keys. Git-Secrets allows you to add custom strings to look for in your analysis. CodeBuild uses the provided buildspec-gitsecrets.yml file during the build stage.
SCA and SAST scanning
In this architecture, CodeBuild triggers the SCA and SAST scanning using Anchore, Snyk, and Amazon ECR. In this solution, we use the open-source versions of Anchore and Snyk. Amazon ECR uses open-source Clair under the hood, which comes with Amazon ECR for no additional cost. As mentioned earlier, you can choose Anchore or Snyk to do the initial image scanning.
Scanning with Anchore
If you choose Anchore as a SAST tool during the deployment, the build stage uses the buildspec-anchore.yml file to scan the container image. If there are any vulnerabilities, it fails the build and triggers the Lambda function to post those findings to Security Hub. If there are no vulnerabilities, it proceeds to next stage.
Anchore Lambda Code Snippet
Scanning with Snyk
If you choose Snyk as a SAST tool during the deployment, the build stage uses the buildspec-snyk.yml file to scan the container image. If there are any vulnerabilities, it fails the build and triggers the Lambda function to post those findings to Security Hub. If there are no vulnerabilities, it proceeds to next stage.
Snyk Lambda Code Snippet
Scanning with Amazon ECR
If there are no vulnerabilities from Anchore or Snyk scanning, the image is pushed to Amazon ECR, and the Amazon ECR scan is triggered automatically. Amazon ECR lists the vulnerability findings on the Amazon ECR console. To provide a single pane of glass view of all the vulnerability findings and for easy administration, we retrieve those findings and post them to Security Hub. If there are no vulnerabilities, the image is deployed to the EKS staging cluster and next stage (DAST scanning) is triggered.
ECR Lambda Code Snippet
DAST scanning with OWASP ZAP
In this architecture, CodeBuild triggers DAST scanning using the DAST tool OWASP ZAP.
After deployment is successful, CodeBuild initiates the DAST scanning. When scanning is complete, if there are any vulnerabilities, it invokes the Lambda function, similar to SAST analysis. The function parses and posts the results to Security Hub. The following is the code snippet of the Lambda function.
Zap Lambda Code Snippet
The following screenshot shows the results in Security Hub. The highlighted section shows the vulnerability findings from various scanning stages.
Vulnerability Findings in Security Hub
We can drill down to individual resource IDs to get the list of vulnerability findings. For example, if we drill down to the resource ID of SASTBuildProject*, we can review all the findings from that resource ID.
SAST Vulnerabilities in Security Hub
If there are no vulnerabilities in the DAST scan, the pipeline proceeds to the manual approval stage and an email is sent to the approver. The approver can review and approve or reject the deployment. If approved, the pipeline moves to next stage and deploys the application to the production EKS cluster.
Aggregation of vulnerability findings in Security Hub provides opportunities to automate the remediation. For example, based on the vulnerability finding, you can trigger a Lambda function to take the needed remediation action. This also reduces the burden on operations and security teams because they can now address the vulnerabilities from a single pane of glass instead of logging into multiple tool dashboards.
Along with Security Hub, you can send vulnerability findings to your issue tracking systems such as JIRA, Systems Manager SysOps, or can automatically create an incident management ticket. This is outside the scope of this post, but is one of the possibilities you can consider when implementing DevSecOps software factories.
RASP scanning
Sysdig Falco is an open-source runtime security tool. Based on the configured rules, Falco can detect suspicious activity and alert on any behavior that involves making Linux system calls. You can use Falco rules to address security controls like NIST SP 800-53. Falco agents on each EKS node continuously scan the containers running in pods and send the events as STDOUT. These events can be then sent to CloudWatch or any third-party log aggregator to send alerts and respond. For more information, see Implementing Runtime security in Amazon EKS using CNCF Falco. You can also use Lambda to trigger and automatically remediate certain security events.
The following screenshot shows Falco events on the CloudWatch console. The highlighted text describes the Falco event that was triggered based on the default Falco rules on the EKS cluster. You can add additional custom rules to meet your security control requirements. You can also trigger responsive actions from these CloudWatch events using services like Lambda.
Falco alerts in CloudWatch
Cleanup
This section provides instructions to clean up the DevSecOps pipeline setup:
In this post, I presented an end-to-end Kubernetes-based DevSecOps software factory on AWS with continuous testing, continuous logging and monitoring, auditing and governance, and operations. I demonstrated how to integrate various open-source scanning tools, such as Git-Secrets, Anchore, Snyk, OWASP ZAP, and Sysdig Falco for Secret Analysis, SCA, SAST, DAST, and RASP analysis, respectively. To reduce operations overhead, I explained how to aggregate and manage vulnerability findings in Security Hub as a single pane of glass. This post also talked about how to implement security of the pipeline and in the pipeline using AWS Cloud-native services. Finally, I provided the DevSecOps software factory as code using AWS CloudFormation.
Srinivas Manepalli is a DevSecOps Solutions Architect in the U.S. Fed SI SA team at Amazon Web Services (AWS). He is passionate about helping customers, building and architecting DevSecOps and highly available software systems. Outside of work, he enjoys spending time with family, nature and good food.
Amazon CodeGuru allows you to automate code reviews and improve code quality, and thanks to the new pricing model announced in April you can get started with a lower and fixed monthly rate based on the size of your repository (up to 90% less expensive). CodeGuru Reviewer helps you detect potential defects and bugs that are hard to find in your Java and Python applications, using the AWS Management Console, AWS SDKs, and AWS CLI.
Today, I’m happy to announce that CodeGuru Reviewer natively integrates with the tools that you use every day to package and deploy your code. This new CI/CD experience allows you to trigger code quality and security analysis as a step in your build process using GitHub Actions.
Although the CodeGuru Reviewer console still serves as an analysis hub for all your onboarded repositories, the new CI/CD experience allows you to integrate CodeGuru Reviewer more deeply with your favorite source code management and CI/CD tools.
And that’s not all! Today we’re also releasing 20 new security detectors for Java to help you identify even more issues related to security and AWS best practices.
A New CI/CD Experience for CodeGuru Reviewer As a developer or development team, you push new code every day and want to identify security vulnerabilities early in the development cycle, ideally at every push. During a pull-request (PR) review, all the CodeGuru recommendations will appear as a comment, as if you had another pair of eyes on the PR. These comments include useful links to help you resolve the problem.
When you push new code or schedule a code review, recommendations will appear in the Security > Code scanning alerts tab on GitHub.
Let’s see how to integrate CodeGuru Reviewer with GitHub Actions.
First of all, create a .yml file in your repository under .github/workflows/ (or update an existing action). This file will contain all your actions’ step. Let’s go through the individual steps.
The first step is configuring your AWS credentials. You want to do this securely, without storing any credentials in your repository’s code, using the Configure AWS Credentials action. This action allows you to configure an IAM role that GitHub will use to interact with AWS services. This role will require a few permissions related to CodeGuru Reviewer and Amazon S3. You can attach the AmazonCodeGuruReviewerFullAccess managed policy to the action role, in addition to s3:GetObject, s3:PutObject and s3:ListBucket.
The CodeGuru Reviewer action requires two input parameters:
build_path: Where your build artifacts are in the repository.
s3_bucket: The name of an S3 bucket that you’ve created previously, used to upload the build artifacts and analysis results. It’s a customer-owned bucket so you have full control over access and permissions, in case you need to share its content with other systems.
It’s important to remember that the S3 bucket name needs to start with codeguru_reviewer- and that these actions can be configured to run with the pull_request, push, or schedule triggers (check out the GitHub Actions documentation for the full list of events that trigger workflows). Also keep in mind that there are minor differences in how you configure GitHub-hosted runners and self-hosted runners, mainly in the credentials configuration step. For example, if you run your GitHub Actions in a self-hosted runner that already has access to AWS credentials, such as an EC2 instance, then you don’t need to provide any credentials to this action (check out the full documentation for self-hosted runners).
Now when you push a change or open a PR CodeGuru Reviewer will comment on your code changes with a few recommendations.
Or you can schedule a daily or weekly repository scan and check out the recommendations in the Security > Code scanning alerts tab.
New Security Detectors for Java In December last year, we launched the Java Security Detectors for CodeGuru Reviewer to help you find and remediate potential security issues in your Java applications. These detectors are built with machine learning and automated reasoning techniques, trained on over 100,000 Amazon and open-source code repositories, and based on the decades of expertise of the AWS Application Security (AppSec) team.
For example, some of these detectors will look at potential leaks of sensitive information or credentials through excessively verbose logging, exception handling, and storing passwords in plaintext in memory. The security detectors also help you identify several web application vulnerabilities such as command injection, weak cryptography, weak hashing, LDAP injection, path traversal, secure cookie flag, SQL injection, XPATH injection, and XSS (cross-site scripting).
The new security detectors for Java can identify security issues with the Java Servlet APIs and web frameworks such as Spring. Some of the new detectors will also help you with security best practices for AWS APIs when using services such as Amazon S3, IAM, and AWS Lambda, as well as libraries and utilities such as Apache ActiveMQ, LDAP servers, SAML parsers, and password encoders.
Available Today at No Additional Cost The new CI/CD integration and security detectors for Java are available today at no additional cost, excluding the storage on S3 which can be estimated based on size of your build artifacts and the frequency of code reviews. Check out the CodeGuru Reviewer Action in the GitHub Marketplace and the Amazon CodeGurupricing page to find pricing examples based on the new pricing model we launched last month.
We’re looking forward to hearing your feedback, launching more detectors to help you identify potential issues, and integrating with even more CI/CD tools in the future.
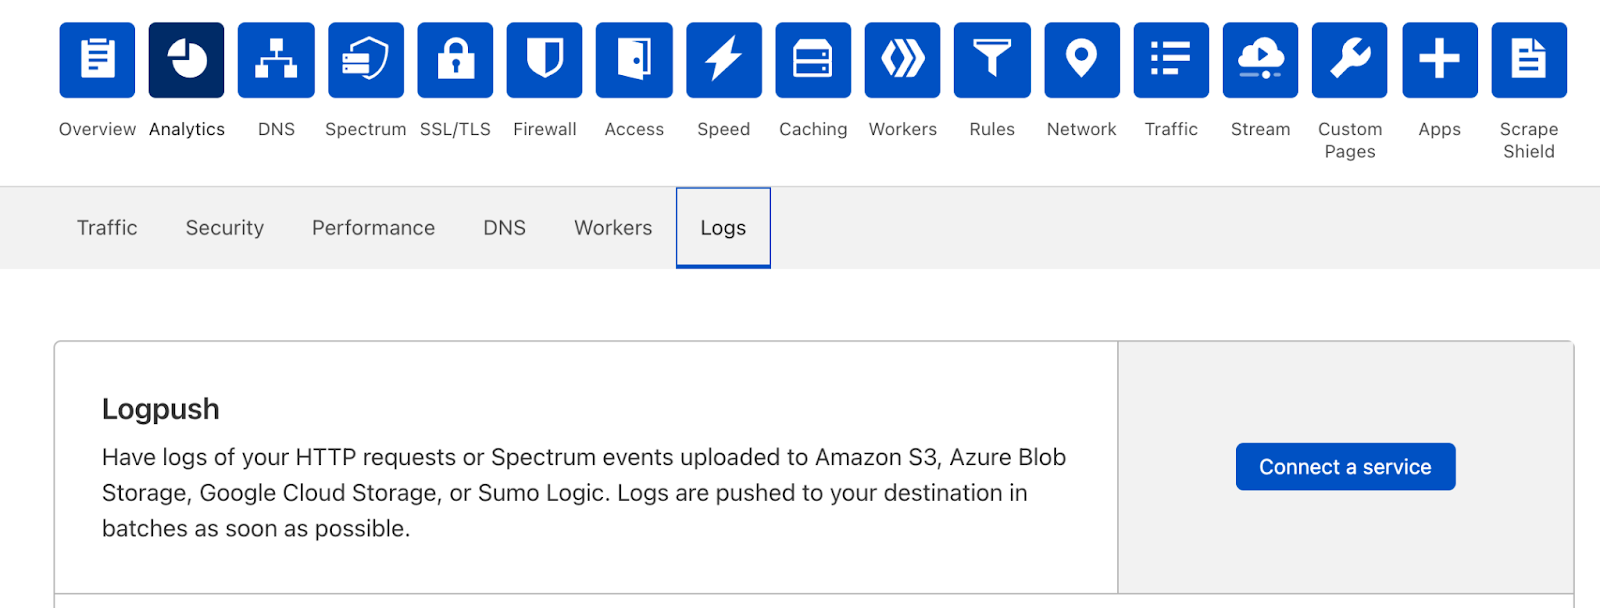
We are excited to announce a new look and new capabilities for Cloudflare Logs! Customers on our Enterprise plan can now configure Logpush for Firewall Events and Network Error Logs Reports directly from the dashboard. Additionally, it’s easier to send Logs directly to our analytics partners Microsoft Azure Sentinel, Splunk, Sumo Logic, and Datadog. This blog post discusses how customers use Cloudflare Logs, how we’ve made it easier to consume logs, and tours the new user interface.
New data sets for insight into more products
Cloudflare Logs are almost as old as Cloudflare itself, but we have a few big improvements: new datasets and new destinations.
Cloudflare has a large number of products, and nearly all of them can generate Logs in different data sets. We have “HTTP Request” Logs, or one log line for every L7 HTTP request that we handle (whether cached or not). We also provide connection Logs for Spectrum, our proxy for any TCP or UDP based application. Gateway, part of our Cloudflare for Teams suite, can provide Logs for HTTP and DNS traffic.
Today, we are introducing two new data sets:
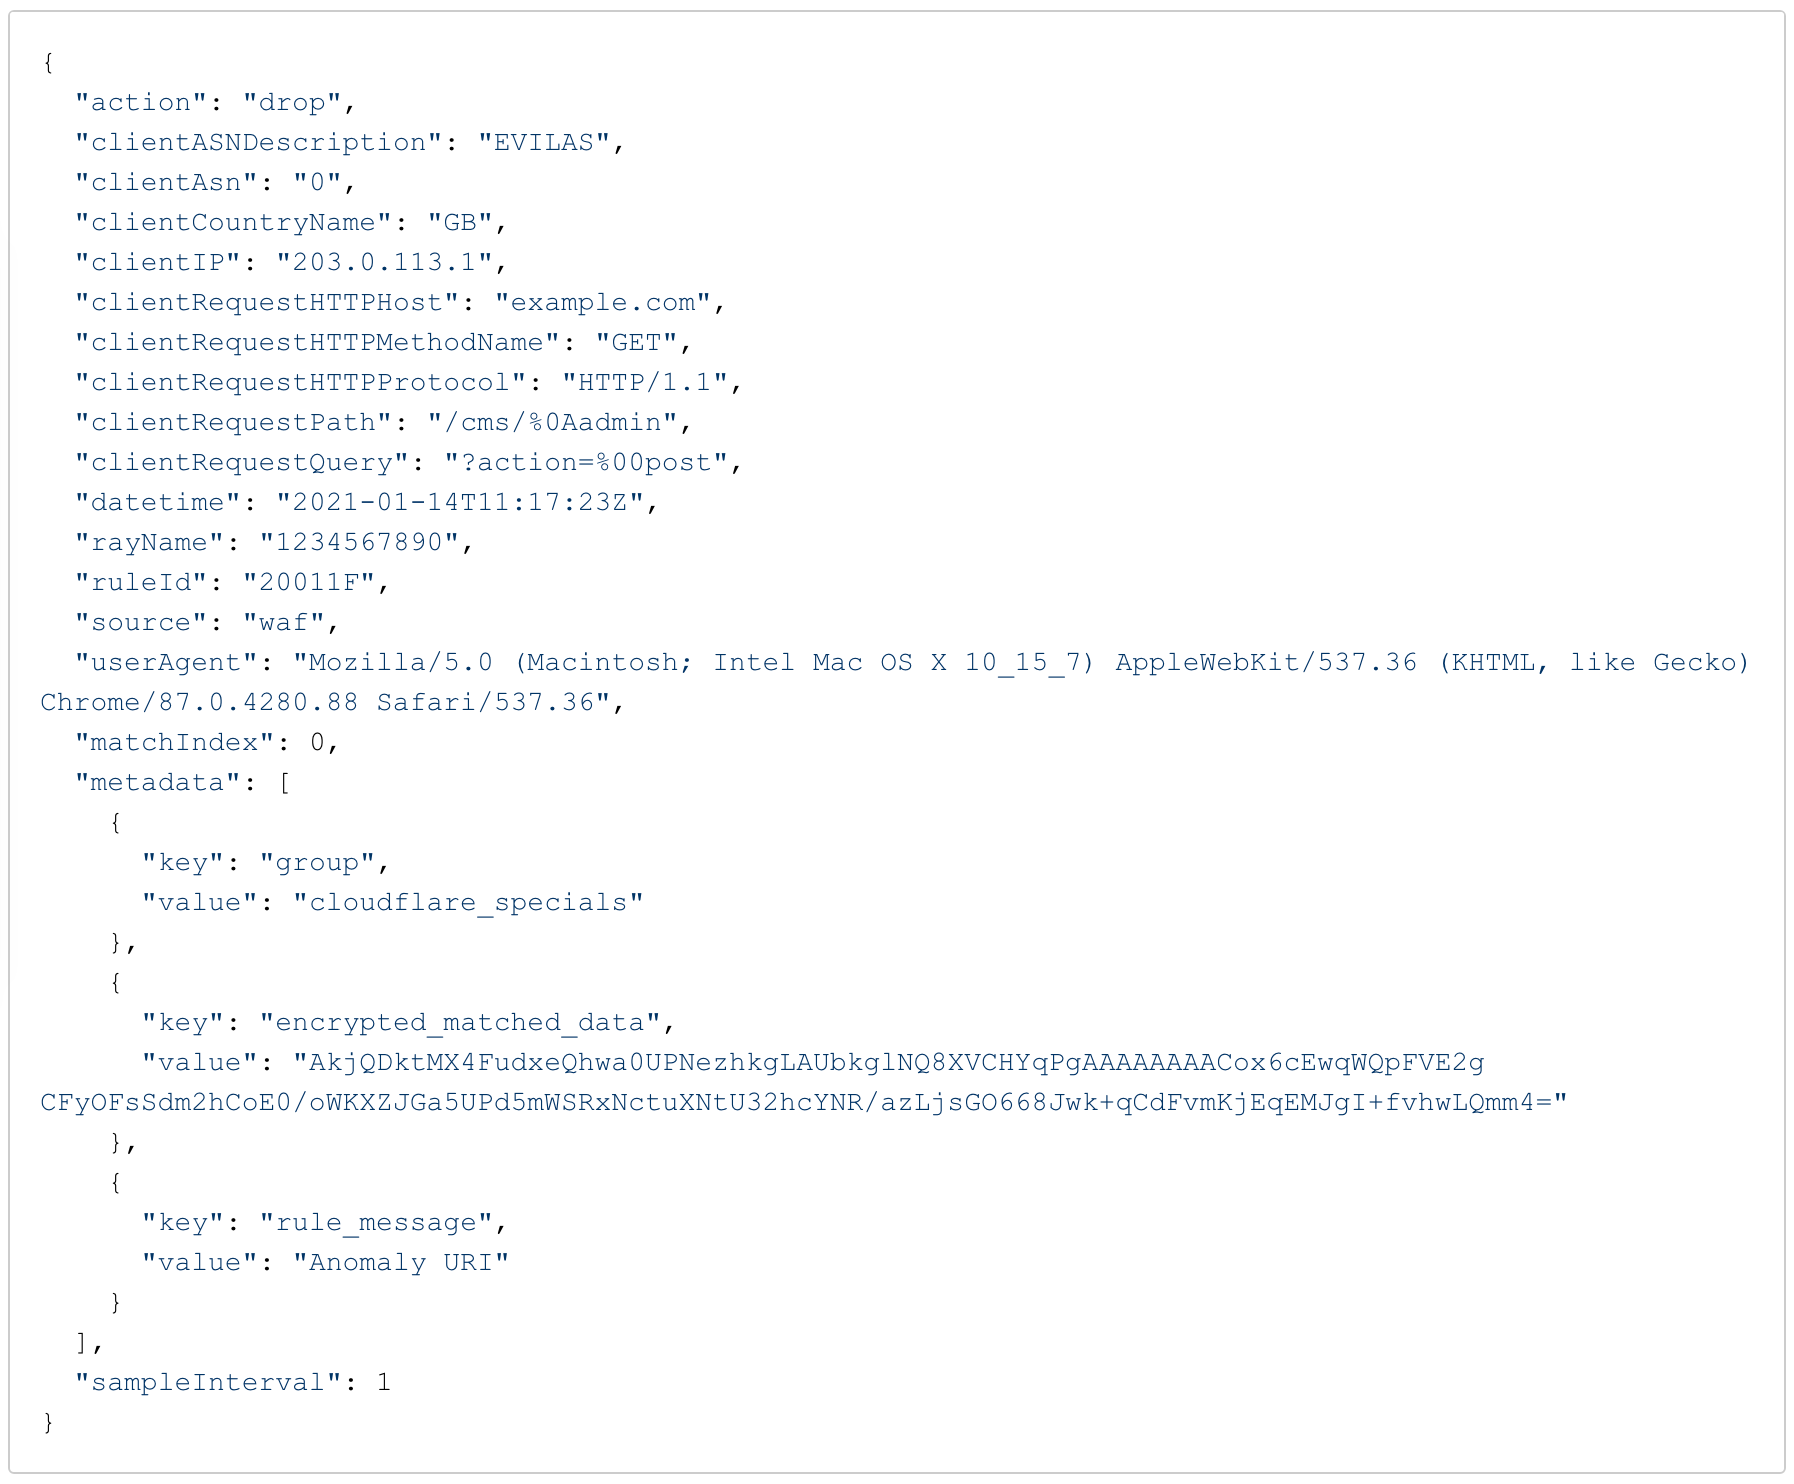
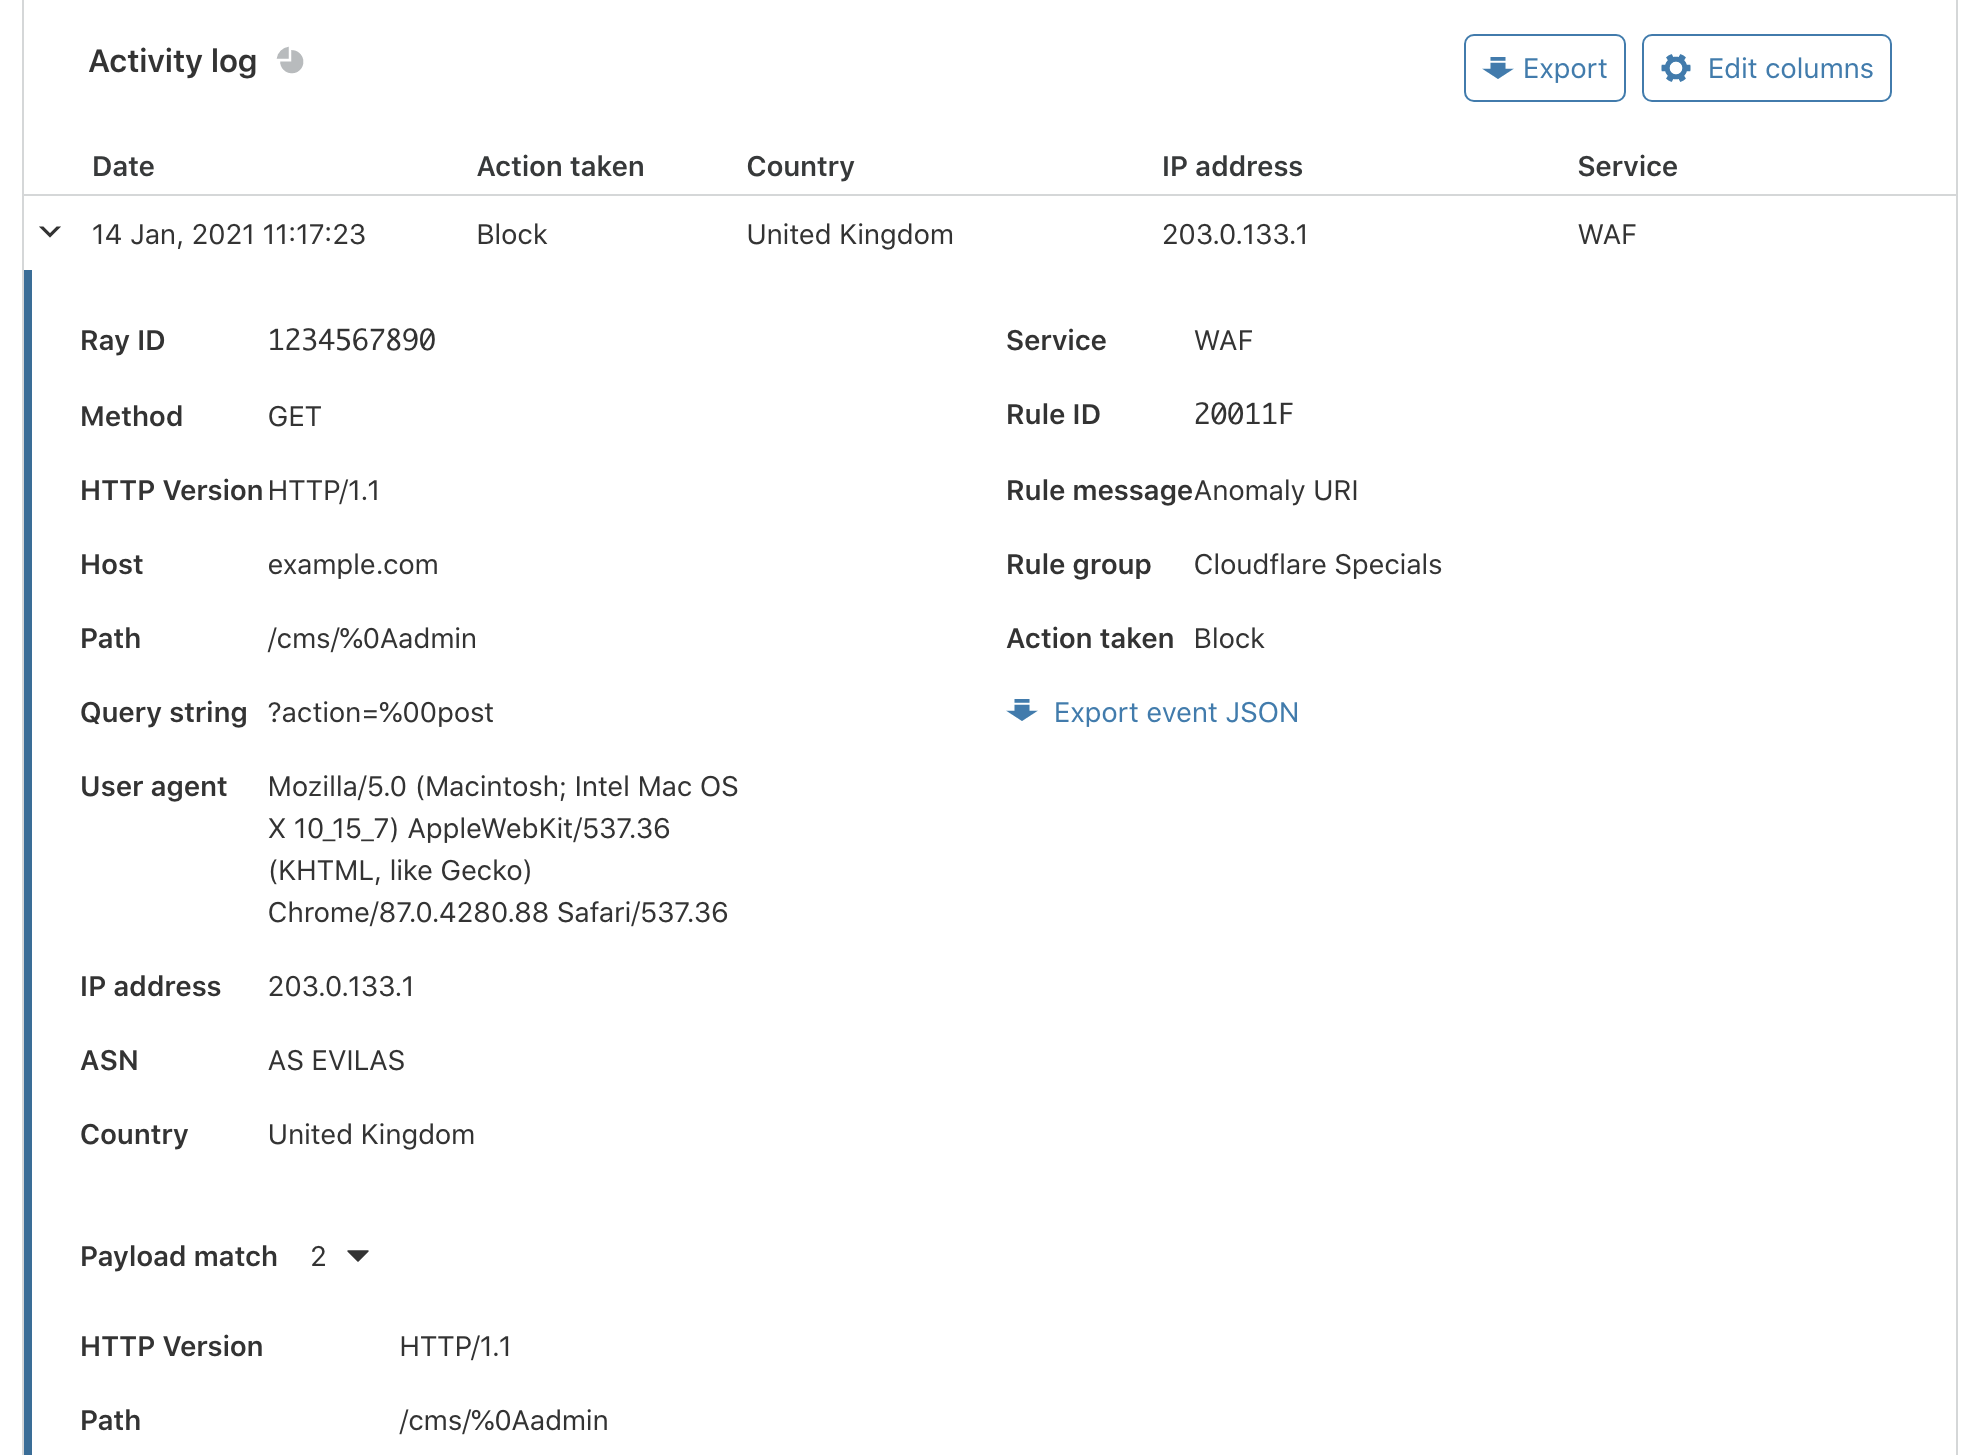
Firewall Events gives insight into malicious traffic handled by Cloudflare. It provides detailed information about everything our WAF does. For example, Firewall Events shows whether a request was blocked outright or whether we issued a CAPTCHA challenge. About a year ago we introduced the ability to send Firewall Events directly to your SIEM; starting today, I’m thrilled to share that you can enable this directly from the dashboard!
Network Error Logging(NEL) Reports provides information about clients that can’t reach our network. To enable NEL Reports for your zone and start seeing where clients are having issues reaching our network, reach out to your account manager.
Take your Logs anywhere with an S3-compatible API
To start using logs, you need to store them first. Cloudflare has long supported AWS, Azure, and Google Cloud as storage destinations. But we know that customers use a huge variety of storage infrastructure, which could be hosted on-premise or with one of our Bandwidth Alliance partners.
Starting today, we support any storage destination with an S3-compatible API. This includes:
And best of all, it’s super easy to get data into these locations using our new UI!
“As always, we love that our partnership with Cloudflare allows us to seamlessly offer customers our easy, plug and play storage solution, Backblaze B2 Cloud Storage. Even better is that, as founding members of the Bandwidth Alliance, we can do it all with free egress.” — Nilay Patel, Co-founder and VP of Solutions Engineering and Sales, Backblaze.
Push Cloudflare Logs directly to our analytics partners
While many customers like to store Logs themselves, we’ve also heard that many customers want to get Logs into their analytics provider directly — without going through another layer. Getting high volume log data out of object storage and into an analytics provider can require building and maintaining a costly, time-consuming, and fragile integration.
Because of this, we now provide direct integrations with four analytics platforms: Microsoft Azure Sentinel, Sumo Logic, Splunk, and Datadog. And starting today, you can push Logs directly into Sumo Logic, Splunk and Datadog from the UI! Customers can add Cloudflare to Azure Sentinel using the Azure Marketplace.
“Organizations are in a state of digital transformation on a journey to the cloud. Most of our customers deploy services in multiple clouds and have legacy systems on premise. Splunk provides visibility across all of this, and more importantly, with SOAR we can automate remediation. We are excited about the Cloudflare partnership, and adding their data into Splunk drives the outcomes customers need to modernize their security operations.” — Jane Wong, Vice President, Product Management, Security at Splunk
“Securing enterprise IT environments can be challenging – from devices, to users, to apps, to data centers on-premises or in the cloud. In today’s environment of increasingly sophisticated cyber-attacks, our mutual customers rely on Microsoft Azure Sentinel for a comprehensive view of their enterprise. Azure Sentinel enables SecOps teams to collect data at cloud scale and empowers them with AI and ML to find the real threats in those signals, reducing alert fatigue by as much as 90%. By integrating directly with Cloudflare Logs we are making it easier and faster for customers to get complete visibility across their entire stack.” — Sarah Fender, Partner Group Program Manager, Azure Sentinel at Microsoft
“As a long time Cloudflare partner we’ve worked together to help joint customers analyze events and trends from their websites and applications to provide end-to-end visibility to improve digital experiences. We’re excited to expand our partnership as part of the Cloudflare Analytics Ecosystem to provide comprehensive real-time insights for both observability and the security of mission-critical applications and services with our Cloud SIEM solution.” — John Coyle, Vice President of Business Development for Sumo Logic
“Knowing that applications perform as well in the real world as they do in the datacenter is critical to ensuring great digital experiences. Combining Cloudflare Logs with Datadog telemetry about application performance in a single pane of glass ensures teams will have a holistic view of their application delivery.” — Michael Gerstenhaber, Sr. Director of Product, Datadog
Why Cloudflare Logs?
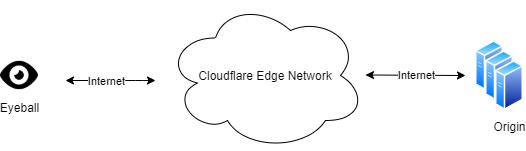
Cloudflare’s mission is to help build a better Internet. We do that by providing a massive global network that protects and accelerates our customers’ infrastructure. Because traffic flows across our network before reaching our customers, it means we have a unique vantage point into that traffic. In many cases, we have visibility that our customers don’t have — whether we’re telling them about the performance of our cache, the malicious HTTP requests we drop at our edge, a spike in L3 data flows, the performance of their origin, or the CPU used by their serverless applications.
To provide this ability, we have analytics throughout our dashboard to help customers understand their network traffic, firewall, cache, load balancer, and much more. We also provide alerts that can tell customers when they see an increase in errors or spike in DDoS activity.
But some customers want more than what we currently provide with our analytics products. Many of our enterprise customers use SIEMs like Splunk and Sumo Logic or cloud monitoring tools like Datadog. These products can extend the capabilities of Cloudflare by showcasing Cloudflare data in the context of customers’ other infrastructure and providing advanced functionality on this data.
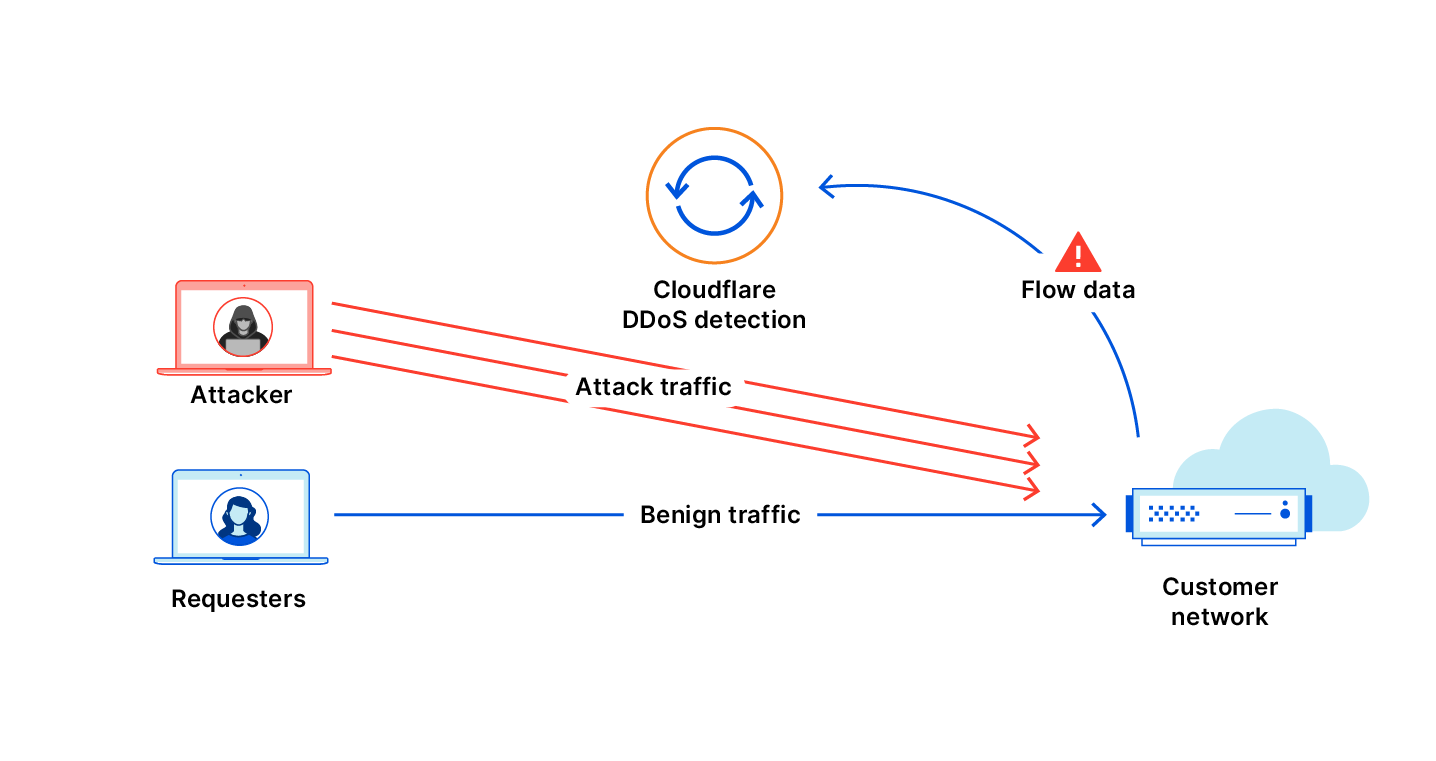
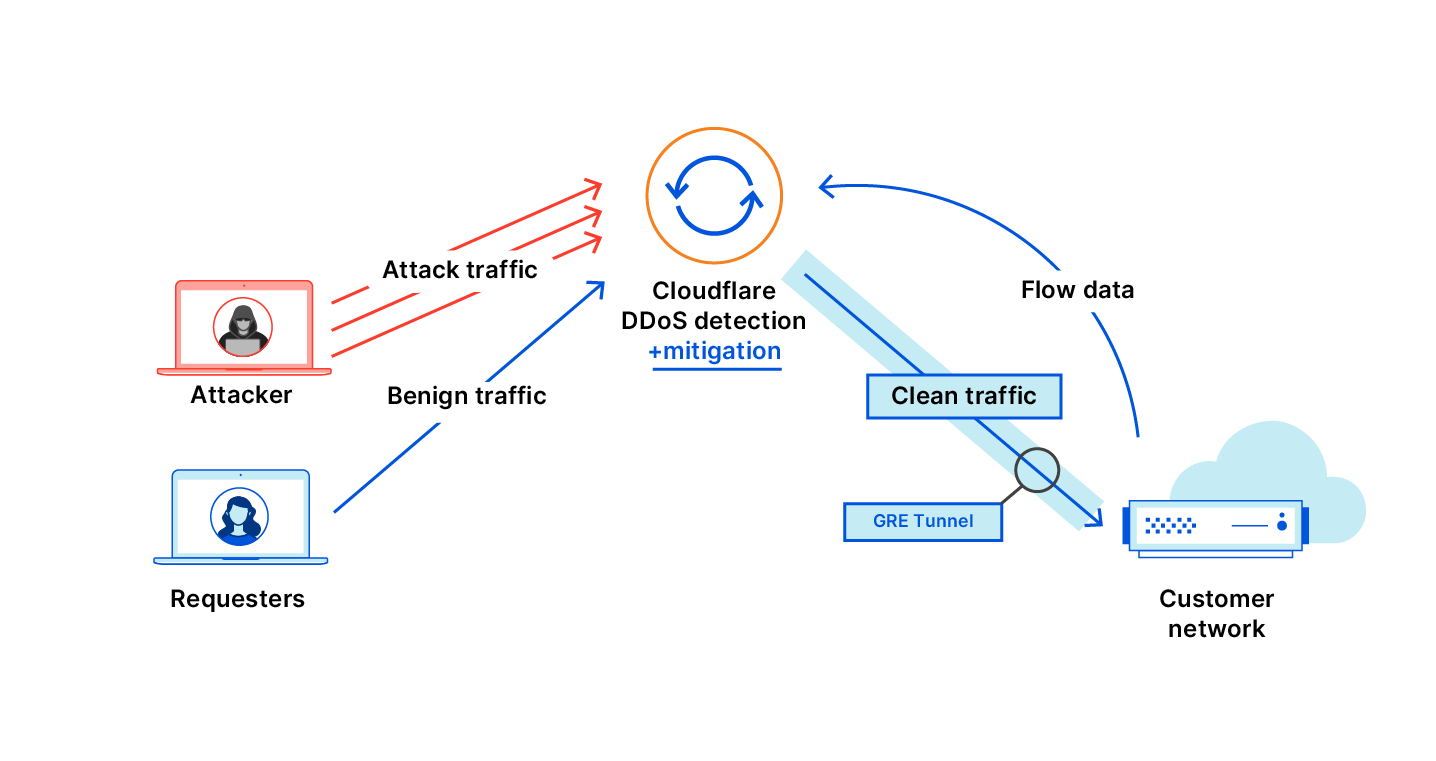
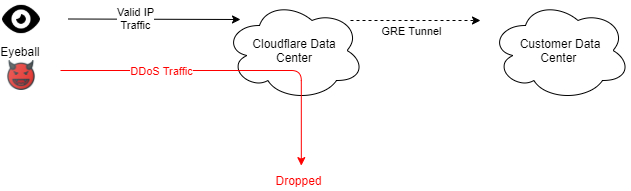
To understand how this works, consider a typical L7 DDoS attack against one of our customers. Very commonly, an attack like this might originate from a small number of IP addresses and a customer might choose to block the source IPs completely. After blocking the IP addresses, customers may want to:
Search through their Logs to see all the past instances of activity from those IP addresses.
Search through Logs from all their other applications and infrastructure to see all activity from those IP addresses
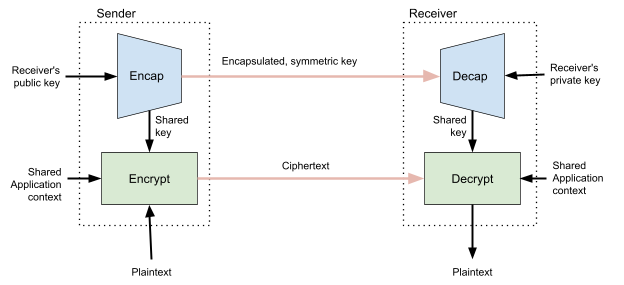
Understand exactlywhat that attacker was trying to do by looking at the request payload blocked in our WAF (securely encrypted thanks to HPKE!)
Set an alert for similar activity, to be notified if something similar happens again
All these are made possible using SIEMs and infrastructure monitoring tools. For example, our customer NOV uses Splunk to “monitor our network and applications by alerting us to various anomalies and high-fidelity incidents”.
“One of the most valuable sources of data is Cloudflare,” said John McLeod, Chief Information Security Officer at NOV. “It provides visibility into network and application attacks. With this integration, it will be easier to get Cloudflare Logs into Splunk, saving my team time and money.”
A new UI for our growing product base
With so many new data sets and new destinations, we realized that our existing user interface was not good enough. We went back to the drawing board to design a more intuitive user experience to help you quickly and easily set up Logpush.
You can still set up Logpush in the same place in the dashboard, in the Analytics > Logs tab:
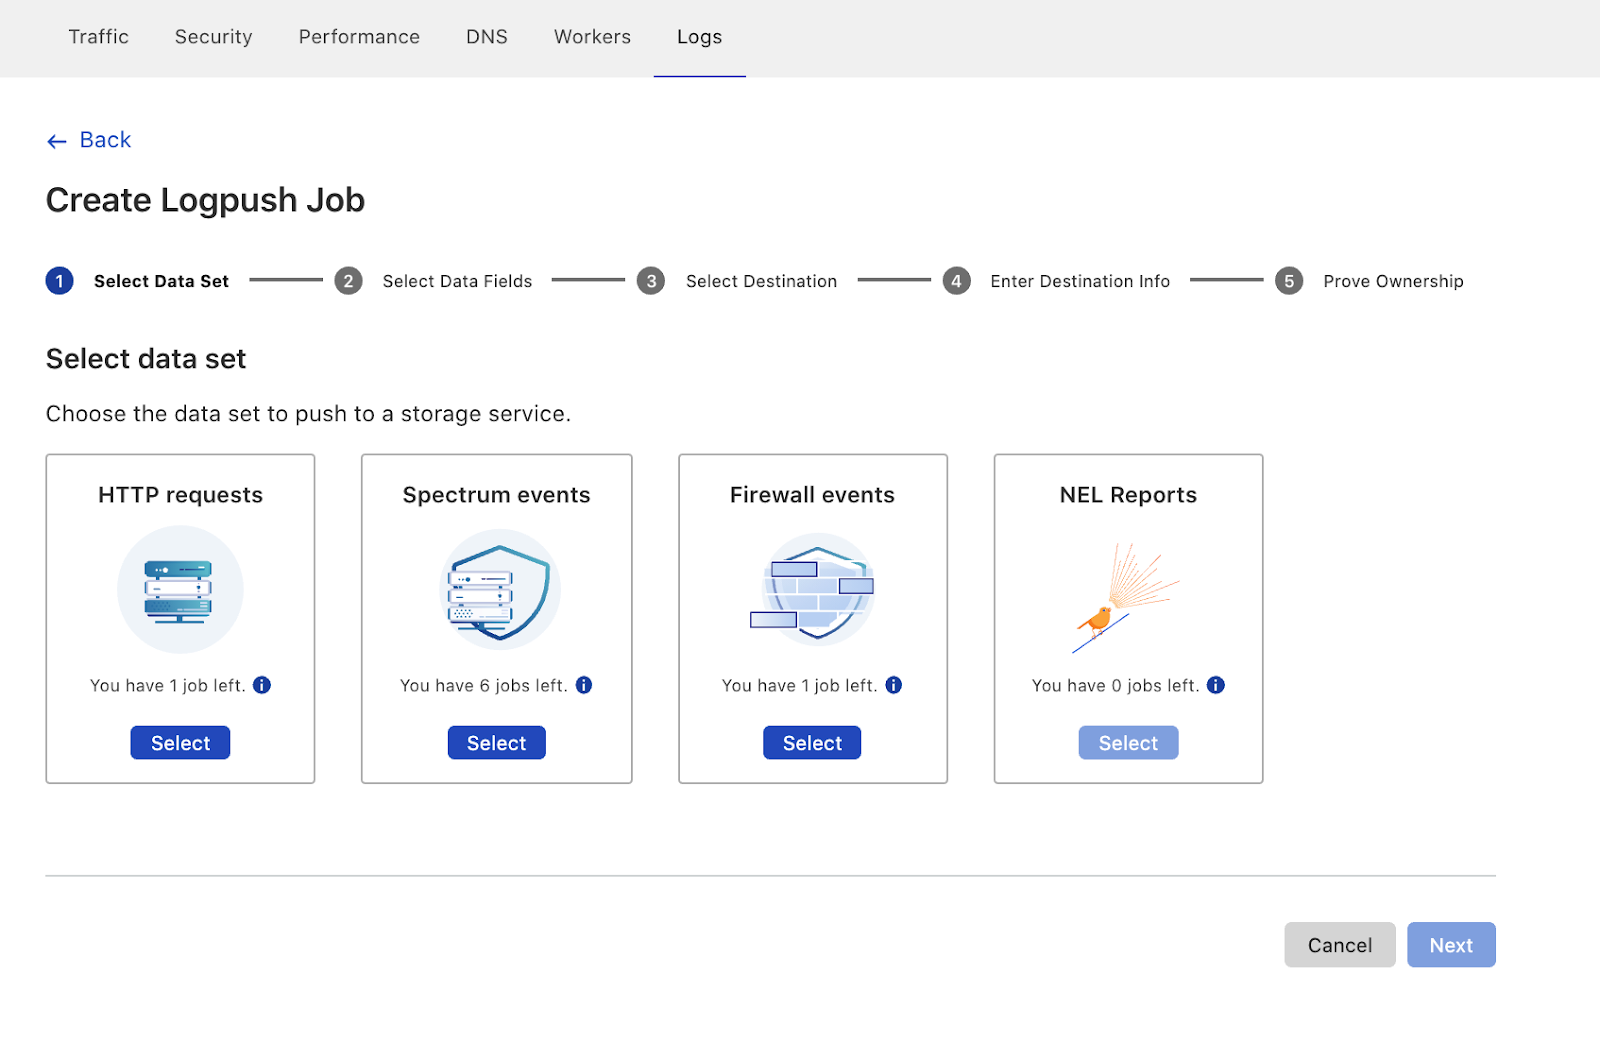
The new UI first prompts users to select the data set to push. Here you’ll also notice that we’ve added support for Firewall Events and NEL Reports!
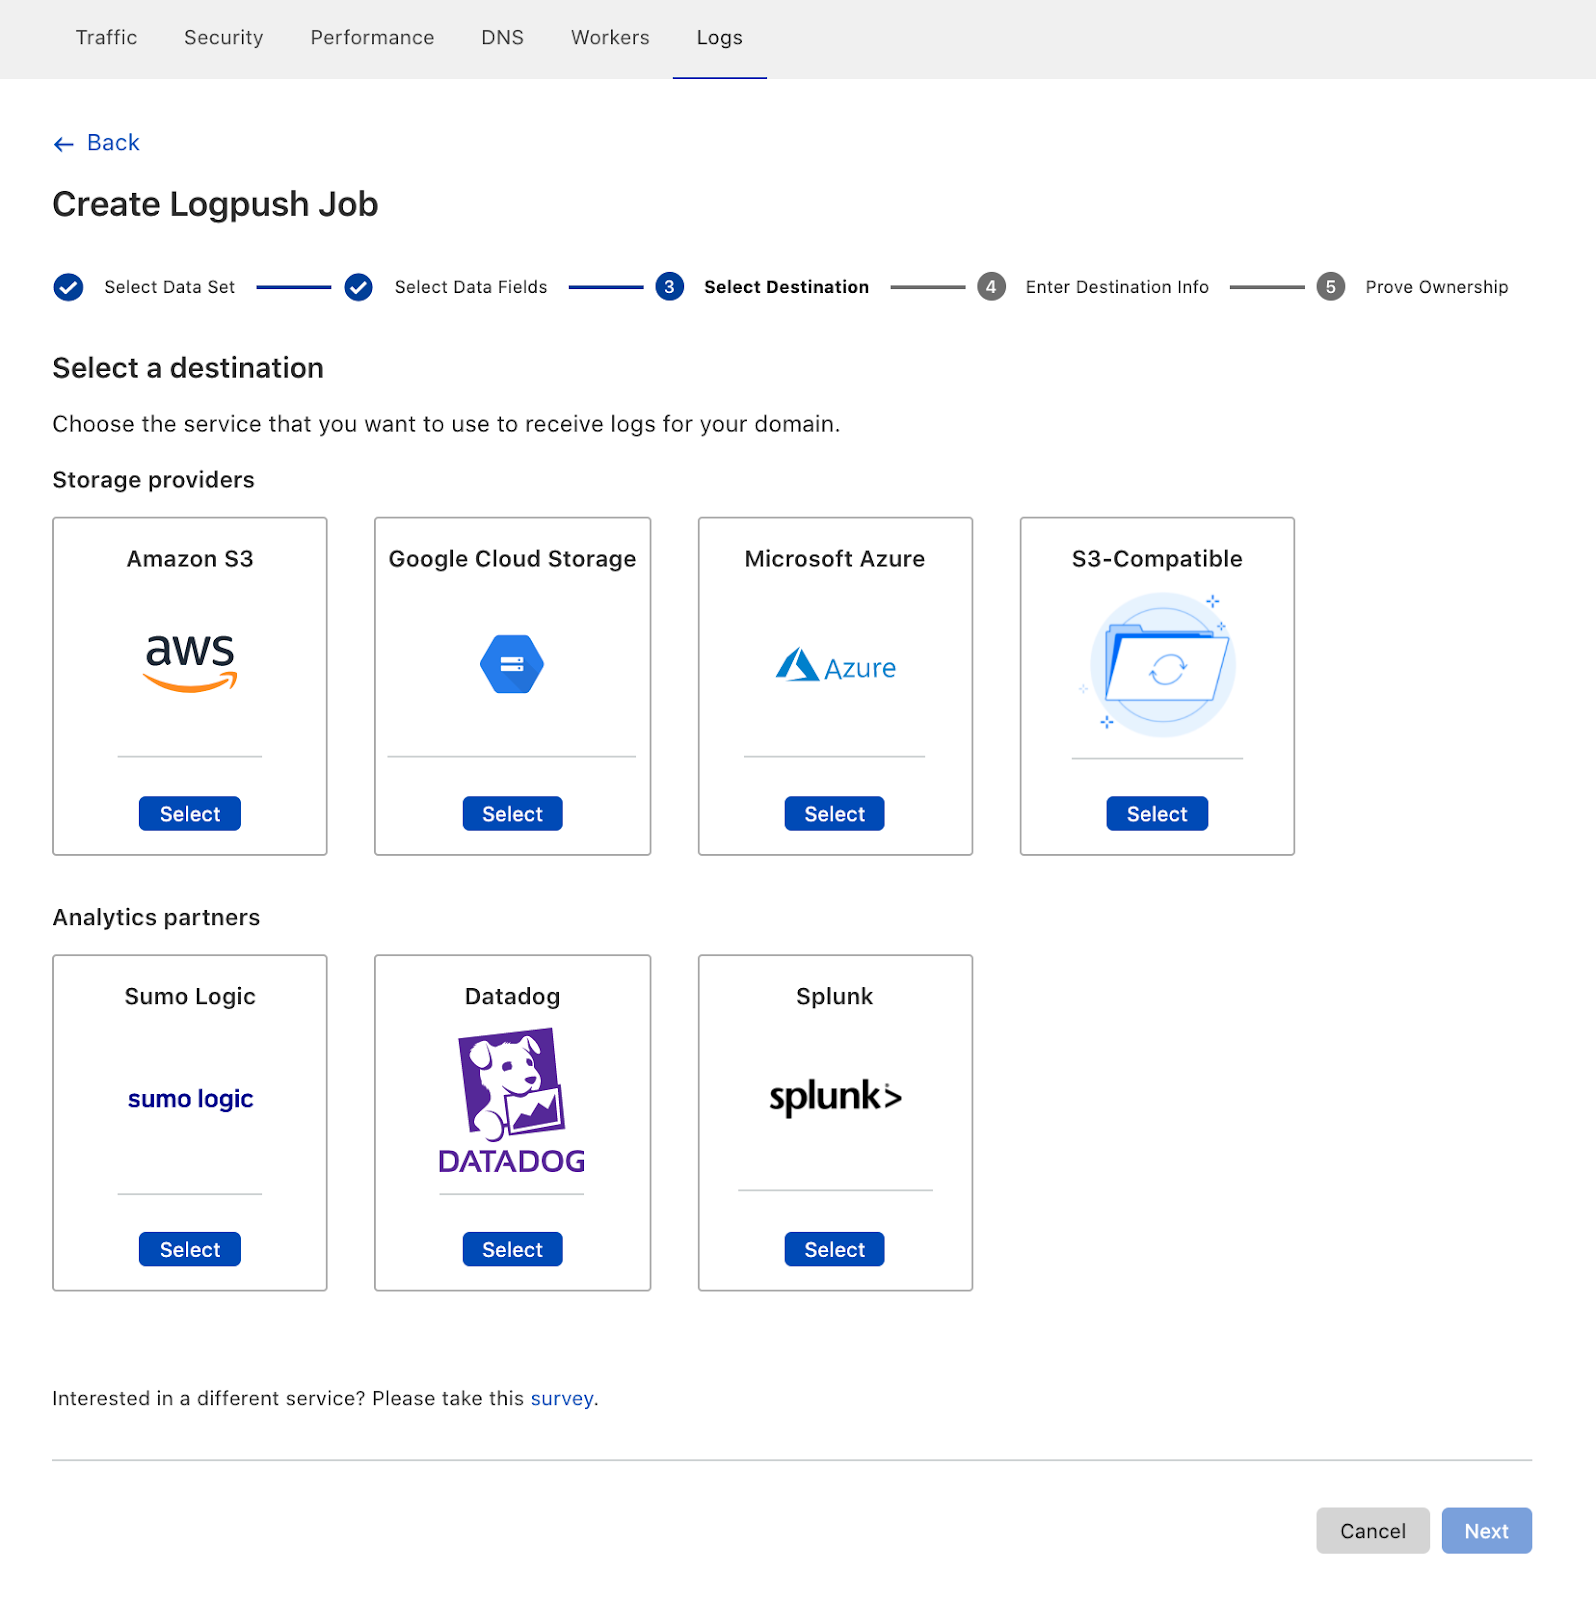
After configuring details like which fields to push, customers can then select where the Logs are going. Here you can see our three new destinations, S3-compatible storage, Sumo Logic, Datadog and Splunk:
Coming soon
Of course, we’re not done yet! We have more Cloudflare products in the pipeline and more destinations planned where customers can send their Logs. Additionally, we’re working on adding more flexibility to our logging pipeline so that customers can configure to send Logs for the entire account, plus filter Logs to just send error codes, for example.
Ultimately, we want to make working with Cloudflare Logs as useful as possible — on Cloudflare itself! We’re working to help customers solve their performance and security challenges with data at massive scale. If that sounds interesting, please join us! We’re hiring Systems Engineers for the Data team.
For enterprises of all sizes, email is a critical piece of infrastructure that supports large volumes of communication from an organization. As such, companies need a robust solution to deal with the complexities this may introduce. In some cases, companies have multiple domains that support several different business units and need a distributed way of managing email sending for those domains. For example, you might want different business units to have the ability to send emails from subdomains, or give a marketing company the ability to send emails on your behalf. Amazon Simple Email Service (Amazon SES) is a cost-effective, flexible, and scalable email service that enables developers to send mail from any application. One of the benefits of Amazon SES is that you can configure Amazon SES to authorize other users to send emails from addresses or domains that you own (your identities) using their own AWS accounts. When allowing other accounts to send emails from your domain, it is important to ensure this is done securely. Amazon SES allows you to send emails to your users using popular authentication methods such as DMARC. In this blog, we walk you through 1/ how to comply with DMARC when using Amazon SES and 2/ how to enable other AWS accounts to send authenticated emails from your domain.
DMARC: what is it, why is it important?
DMARC stands for “Domain-based Message Authentication, Reporting & Conformance”, and it is an email authentication protocol (DMARC.org). DMARC gives domain owners and email senders a way to protect their domain from being used by malicious actors in phishing or spoofing attacks. Email spoofing can be used as a way to compromise users’ financial or personal information by taking advantage of their trust of well-known brands. DMARC makes it easier for senders and recipients to determine whether or not an email was actually sent by the domain that it claims to have been sent by.
Solution Overview
In this solution, you will learn how to set up DKIM signing on Amazon SES, implement a DMARC Policy, and enable other accounts in your organization to send emails from your domain using Sending Authorization. When you set up DKIM signing, Amazon SES will attach a digital signature to all outgoing messages, allowing recipients to verify that the email came from your domain. You will then set your DMARC Policy, which tells an email receiver what to do if an email is not authenticated. Lastly, you will set up Sending Authorization so that other AWS accounts can send authenticated emails from your domain.
Prerequisites
In order to complete the example illustrated in this blog post, you will need to have:
A domain in an Amazon Route53 Hosted Zone or third-party provider. Note: You will need to add/update records for the domain. For this blog we will be using Route53.
A second AWS account to send Amazon SES Emails within a different AWS Organizations OU. If you have not worked with AWS Organizations before, review the Organizations Getting Started Guide
How to comply with DMARC (DKIM and SPF) in Amazon SES
In order to comply with DMARC, you must authenticate your messages with either DKIM (DomainKeys Identified Mail), SPF (Sender Policy Framework), or both. DKIM allows you to send email messages with a cryptographic key, which enables email providers to determine whether or not the email is authentic. SPF defines what servers are allowed to send emails for their domain. To use SPF for DMARC compliance you need to set up a custom MAIL FROM domain in Amazon SES. To authenticate your emails with DKIM in Amazon SES, you have the option of:
Setting up a sending identity, so that Amazon SES automatically adds a DKIM signature to your messages
Select Verify a New Domain and type the name of your domain in
Select Generate DKIM Settings
Choose Verify This Domain
This will generate the DNS records needed to complete domain verification, DKIM signing, and routing incoming mail.
Note: When you initiate domain verification using the Amazon SES console or API, Amazon SES gives you the name and value to use for the TXT record. Add a TXT record to your domain’s DNS server using the specified Name and Value. Amazon SES domain verification is complete when Amazon SES detects the existence of the TXT record in your domain’s DNS settings.
If you are using Route 53 as your DNS provider, choose the Use Route 53 button to update the DNS records automatically
If you are not using Route 53, go to your third-party provider and add the TXT record to verify the domain as well as the three CNAME records to enable DKIM signing. You can also add the MX record at the end to route incoming mail to Amazon SES.
A list of common DNS Providers and instructions on how to update the DNS records can be found in the Amazon SES documentation
Choose Create Record Sets if you are using Route53 as shown below or choose Close after you have added the necessary records to your third-party DNS provider.
Note: in the case that you previously verified a domain, but did NOT generate the DKIM settings for your domain, follow the steps below. Skip these steps if this is not the case:
Choose Generate DKIM Settings and copy the three values in the record set shown
You may also download the record set as a CSV file
Navigate to the Route53 console or your third-party DNS provider. Instructions on how to update the DNS records in your third-party can be found in the Amazon SES documentation
Select the domain you are using
Choose Create Record
Enter the values that Amazon SES has generated for you, and add the three CNAME records to your domain
Wait a few minutes, and go back to your domain in the Amazon SES Console
Check that the DKIM status is verified
You also want to set up a custom MAIL FROM domain that you will use later on. To do so, follow the steps in the documentation.
Setting up a DMARC policy on your domain
DMARC policies are TXT records you place in DNS to define what happens to incoming emails that don’t align with the validations provided when setting up DKIM and SPF. With this policy, you can choose to allow the email to pass through, quarantine the email into a folder like junk or spam, or reject the email.
As a best practice, you should start with a DMARC policy that doesn’t reject all email traffic and collect reports on emails that don’t align to determine if they should be allowed. You can also set a percentage on the DMARC policy to perform filtering on a subset of emails to, for example, quarantine only 50% of the emails that don’t align. Once you are in a state where you can begin to reject non-compliant emails, flip the policy to reject failed authentications. When you set the DMARC policy for your domain, any subdomains that are authorized to send on behalf of your domain will inherit this policy and the same rule will apply. For more information on setting up a DMARC policy, see our documentation.
In a scenario where you have multiple subdomains sending emails, you should be setting the DMARC policy for the organizational domain that you own. For example, if you own the domain example.com and also want to use the sub-domain sender.example.com to send emails you can set the organizational DMARC policy (as a DNS TXT record) to:
This DMARC policy states that 50% of emails coming from example.com that fail authentication should be quarantined and you want to send a report of those failures to [email protected]. For your sender.example.com sub-domain, this policy will be inherited unless you specify another DMARC policy for our sub-domain. In the case where you want to be stricter on the sub-domain you could add another DMARC policy like you see in the following table.
This policy would apply to emails coming from sender.example.com and would reject any email that fails authentication. It would also send aggregate feedback to [email protected] and detailed message-specific failure information to [email protected] for further analysis.
Sending Authorization in Amazon SES – Allowing Other Accounts to Send Authenticated Emails
Now that you have configured Amazon SES to comply with DMARC in the account that owns your identity, you may want to allow other accounts in your organization the ability to send emails in the same way. Using Sending Authorization, you can authorize other users or accounts to send emails from identities that you own and manage. An example of where this could be useful is if you are an organization which has different business units in that organization. Using sending authorization, a business unit’s application could send emails to their customers from the top-level domain. This application would be able to leverage the authentication settings of the identity owner without additional configuration. Another advantage is that if the business unit has its own subdomain, the top-level domain’s DKIM settings can apply to this subdomain, so long as you are using Easy DKIM in Amazon SES and have not set up Easy DKIM for the specific subdomains.
Setting up sending authorization across accounts
Before you set up sending authorization, note that working across multiple accounts can impact bounces, complaints, pricing, and quotas in Amazon SES. Amazon SES documentation provides a good understanding of the impacts when using multiple accounts. Specifically, delegated senders are responsible for bounces and complaints and can set up notifications to monitor such activities. These also count against the delegated senders account quotas. To set up Sending Authorization across accounts:
Navigate to the Amazon SES Console from the account that owns the Domain
Select Domains under Identity Management
Select the domain that you want to set up sending authorization with
Select View Details
Expand Identity Policies and Click Create Policy
You can either create a policy using the policy generator or create a custom policy. For the purposes of this blog, you will create a custom policy.
For the custom policy, you will allow a particular Organization Unit (OU) from our AWS Organization access to our domain. You can also limit access to particular accounts or other IAM principals. Use the following policy to allow a particular OU to access the domain:
9. Make sure to replace the escaped values with your Verified Domain ARN and the Org path of the OU you want to limit access to.
You can find more policy examples in the documentation. Note that you can configure sending authorization such that all accounts under your AWS Organization are authorized to send via a certain subdomain.
Testing
You can now test the ability to send emails from your domain in a different AWS account. You will do this by creating a Lambda function to send a test email. Before you create the Lambda function, you will need to create an IAM role for the Lambda function to use.
Give the function a name of your choosing (Ex: TestSESfunction)
In this demo, you will be using Python 3.8 runtime, but feel free to modify to your language of choice
Select the Change default execution role dropdown, and choose the Use an existing role radio button
Under Existing Role, choose the role that you created in the previous step, and create the function
Edit the function
Navigate to the Function Code portion of the page and open the function python file
Replace the default code with the code shown below, ensuring that you put your own values in based on your resources
Values needed:
Test Email Address: an email address you have access to
NOTE: If you are still operating in the Amazon SES Sandbox, this will need to be a verified email in Amazon SES. To verify an email in Amazon SES, follow the process here. Alternatively, here is how you can move out of the Amazon SES Sandbox
SourceArn: The arn of your domain. This can be found in Amazon SES Console → Domains → <YourDomain> → Identity ARN
ReturnPathArn: The same as your Source ARN
Source: This should be your Mail FROM Domain @ your domain
Your Mail FROM Domain can be found under Domains → <YourDomain> → Mail FROM Domain dropdown
import json import boto3 from botocore.exceptions import ClientError
client = boto3.client('ses') def lambda_handler(event, context): # Try to send the email. try: #Provide the contents of the email. response = client.send_email( Destination={ 'ToAddresses': [ '<[email protected]>', ], }, Message={ 'Body': { 'Html': { 'Charset': 'UTF-8', 'Data': 'This email was sent with Amazon SES.', }, }, 'Subject': { 'Charset': 'UTF-8', 'Data': 'Amazon SES Test', }, }, SourceArn='<your-ses-identity-ARN>', ReturnPathArn='<your-ses-identity-ARN>', Source='<[email protected]>', ) # Display an error if something goes wrong. except ClientError as e: print(e.response['Error']['Message']) else: print("Email sent! Message ID:"), print(response['ResponseMetadata']['RequestId'])
Once you have replaced the appropriate values, choose the Deploy button to deploy your changes
Run a Test invocation
After you have deployed your changes, select the “Test” Panel above your function code
You can leave all of these keys and values as default, as the function does not use any event parameters
Choose the Invoke button in the top right corner
You should see this above the test event window:
Verifying that the Email has been signed properly
Depending on your email provider, you may be able to check the DKIM signature directly in the application. As an example, for Outlook, right click on the message, and choose View Source from the menu. You should see line that shows the Authentication Results and whether or not the DKIM/SPF signature passed. For Gmail, go to your Gmail Inbox on the Gmail web app. Choose the message you wish to inspect, and choose the More Icon. Choose View Original from the drop-down menu. You should then see the SPF and DKIM “PASS” Results.
Select the function that you created in this exercise
Select Actions and delete the function
Conclusion
In this blog post, we demonstrated how to delegate sending and management of your sub-domains to other AWS accounts while also complying with DMARC when using Amazon SES. In order to do this, you set up a sending identity so that Amazon SES automatically adds a DKIM signature to your messages. Additionally, you created a custom MAIL FROM domain to comply with SPF. Lastly, you authorized another AWS account to send emails from a sub-domain managed in a different account, and tested this using a Lambda function. Allowing other accounts the ability to manage and send email from your sub-domains provides flexibility and scalability for your organization without compromising on security.
Now that you have set up DMARC authentication for multiple accounts in your enviornment, head to the AWS Messaging & Targeting Blog to see examples of how you can combine Amazon SES with other AWS Services!
If you have more questions about Amazon Simple Email Service, check out our FAQs or our Developer Guide.
If you have feedback about this post, submit comments in the Comments section below.
This series of posts discusses making informed decisions when choosing to implement open-source tools on AWS services, adopt managed AWS services to satisfy the same needs, or use a combination of both.
We look at key considerations for evaluating open-source software and AWS services using the perspectives of a startup company and a mature company as examples. You can use these two different points of view to compare to your own organization. To make this investigation easier we will use Continuous Integration (CI) and Continuous Delivery (CD) capabilities as the target of our investigation.
In two related posts, we follow two AWS customers, Iponweb and BigHat Biosciences, as they share their CI/CD journeys, their perspectives, the decisions they made, and why. To end the series, we explore an example reference architecture showing the benefits AWS provides regardless of your emphasis on open-source tools or managed AWS services.
Why CI/CD?
Until your creations are in the hands of your customers, investment in development has provided no return. The faster valuable changes enter production, the greater positive impact you can have on your customer. In today’s highly competitive world, the ability to frequently and consistently deliver value is a competitive advantage. The Operational Excellence (OE) pillar of the AWS Well-Architected Framework recognizes this impact and focuses on the capabilities of CI/CD in two dedicated sections.
The concepts in CI/CD originate from software engineering but apply equally to any form of content. The goal is to support development, integration, testing, deployment, and delivery to production. For example, making changes to an application, updating your machine learning (ML) models, changing your multimedia assets, or referring to the AWS Well-Architected Framework.
Adopting CI/CD and the best practices from the Operational Excellence pillar can help you address risks in your environment, and limit errors from manual processes. More importantly, they help free your teams from the related manual processes, so they can focus on satisfying customer needs, differentiating your organization, and accelerating the flow of valuable changes into production.
How do you decide what you need?
The first question in the Operational Excellence pillar is about understanding needs and making informed decisions. To help you frame your own decision-making process, we explore key considerations from the perspective of a fictional startup company and a fictional mature company. In our two related posts, we explore these same considerations with Iponweb and BigHat.
The key considerations include:
Functional requirements – Providing specific features and capabilities that deliver value to your customers.
Non-functional requirements – Enabling the safe, effective, and efficient delivery of the functional requirements. Non-functional requirements include security, reliability, performance, and cost requirements.
Without security, you can’t earn customer trust. If your customers can’t trust you, you won’t have customers.
Without reliability you aren’t available to serve your customers. If you can’t serve your customers, you won’t have customers.
Performance is focused on timely and efficient delivery of value, not delivering as fast as possible.
Cost is focused on optimizing the value received for the resources spent (for example, money, time, or effort), not minimizing expense.
Operational requirements – Enabling you to effectively and efficiently support, maintain, sustain, and improve the delivery of value to your customers. When you “Design with Ops in Mind,” you’re enabling effective and efficient support for your business outcomes.
These non-feature-related key considerations are why Operational Excellence, Security, Reliability, Performance Efficiency, and Cost Optimization are the five pillars of the AWS Well-Architected Framework.
The startup company
Any startup begins as a small team of inspired people working together to realize the unique solution they believe solves an unsolved problem.
For our fictional small team, everyone knows each other personally and all speak frequently. We share processes and procedures in discussions, and everyone know what needs to be done. Our team members bring their expertise and dedicate it, and the majority of their work time, to delivering our solution. The results of our efforts inform changes we make to support our next iteration.
However, our manual activities are error-prone and inconsistencies exist in the way we do them. Performing these tasks takes time away from delivering our solution. When errors occur, they have the potential to disrupt everyone’s progress.
We have capital available to make some investments. We would prefer to bring in more team members who can contribute directly to developing our solution. We need to iterate faster if we are to achieve a broadly viable product in time to qualify for our next round of funding. We need to decide what investments to make.
Goals – Reach the next milestone and secure funding to continue development
Needs – Reduce or eliminate the manual processes and associated errors
Priority – Rapid iteration
CI/CD emphasis – Baseline CI/CD capabilities and non-functional requirements are emphasized over a rich feature set
The mature company
Our second fictional company is a large and mature organization operating in a mature market segment. We’re focused on consistent, quality customer experiences to serve and retain our customers.
Our size limits the personal relationships between our service and development teams. The process to make requests, and the interfaces between teams and their systems, are well documented and understood.
However, the systems we have implemented over time, as needs were identified and addressed, aren’t well documented. Our existing tool chain includes some in-house scripting and both supported and unsupported versions of open-source tools. There are limited opportunities for us to acquire new customers.
When conditions change and new features are desired, we want to be able to rapidly implement and deploy those features as fast as possible. If we can differentiate our services, however briefly, we may be able to win customers away from our competitors. Our other path to improved profitability is to evolve our processes, maximizing integration and efficiencies, and capturing cost reductions.
Goals – Differentiate ourselves in the marketplace with desired new features
Needs – Address the risks of poorly documented systems and unsupported software
Priority – Evolve efficiency
CI/CD emphasis – Rich feature set and integrations are emphasized over improving the existing non-functional capabilities
Open-source tools on AWS vs. AWS services
The choice of open-source tools or AWS service is not binary. You can select the combination of solutions that provides the greatest value. You can implement open-source tools for their specific benefits where they outweigh the costs and operational burden, using underlying AWS services like Amazon Elastic Compute Cloud (Amazon EC2) to host them. You can then use AWS managed services, like AWS CodeBuild, for the undifferentiated features you need, without additional cost or operational burden.
Feature Set
Our fictional organizations both want to accelerate the flow of beneficial changes into production and are evaluating CI/CD alternatives to support that outcome. Our startup company wants a working solution—basic capabilities, author/code, build, and deploy, so that they can focus on development. Our mature company is seeking every advantage—a rich feature set, extensive opportunities for customization, integration capabilities, and fine-grained control.
Open-source tools
Open-source tools often excel at meeting functional requirements. When a new functionality, capability, or integration is desired, any developer can implement it for themselves, and then contribute their code back to the project. As the user community for an open-source project expands the number of use cases and the features identified grows, so does the number of potential solutions and potential contributors. Developers are using these tools to support their efforts and implement new features that provide value to them.
However, features may be released in unsupported versions and then later added to the supported feature set. Non-functional requirements take time and are less appealing because they don’t typically bring immediate value to the product. Non-functional capabilities may lag behind the feature set.
Consider the following:
Open-source tools may have more features and existing integrations to other tools
The pace of feature set delivery may be extremely rapid
The features delivered are those desired and created by the active members of the community
You are free to implement the features your company desires
There is no commitment to long-term support for the project or any given feature
You can implement open-source tools on multiple cloud providers or on premises
If the project is abandoned, you’re responsible for maintaining your implementation
AWS services
AWS services are driven by customer needs. Services and features are supported by dedicated teams. These customer-obsessed teams focus on all customer needs, with security being their top priority. Both functional and non-functional requirements are addressed with an emphasis on enabling customer outcomes while minimizing the effort they expend to achieve them.
Consider the following:
The pace of delivery of feature sets is consistent
The feature roadmap is driven by customer need and customer requests
The AWS service team is dedicated to support of the service
AWS services are available on the AWS Cloud and on premises through AWS Outposts
Cost Optimization
Why are we discussing cost after the feature set? Security and reliability are fundamentally more important. Leadership naturally gravitates to following the operational excellence best practice of evaluating trade-offs. Having looked at the potential benefits from the feature set, the next question is typically, “What is this going to cost?” Leadership defines the priorities and allocates the resources necessary (capital, time, effort). We review cost optimization second so that leadership can make a comparison of the expected benefits between CI/CD investments, and investments in other efforts, so they can make an informed decision.
Our organizations are both cost conscious. Our startup is working with finite capital and time. In contrast, our mature company can plan to make investments over time and budget for the needed capital. Early investment in a robust and feature-rich CI/CD tool chain could provide significant advantages towards the startup’s long-term success, but if the startup fails early, the value of that investment will never be realized. The mature company can afford to realize the value of their investment over time and can make targeted investments to address specific short-term needs.
Open-source tools
Open-source software doesn’t have to be purchased, but there are costs to adopt. Open-source tools require appropriate skills in order to be implemented, and to perform management and maintenance activities. Those skills must be gained through dedicated training of team members, team member self-study, or by hiring new team members with the existing skills. The availability of skilled practitioners of open-source tools varies with how popular a tool is and how long it has had an active community. Loss of skilled team members includes the loss of their institutional knowledge and intimacy with the implementation. Skills must be maintained with changes to the tools and as team members join or leave. Time is required from skilled team members to support management and maintenance activities. If commercial support for the tool is desired, it may be available through third-parties at an additional cost.
The time to value of an open-source implementation includes the time to implement and configure the resources and software. Additional value may be realized through investment of time configuring or implementing desired integrations and capabilities. There may be existing community-supported integrations or capabilities that reduce the level of effort to achieve these.
Consider the following:
No cost to acquire the software.
The availability of skill practitioners of open-source tools may be lower. Cost (capital and time) to acquire, establish, or maintain skill set may be higher.
There is an ongoing cost to maintain the team member skills necessary to support the open-source tools.
There is an ongoing cost of time for team members to perform management and maintenance activities.
Additional commercial support for open-source tools may be available at additional cost
Time to value includes implementation and configuration of resources and the open-source software. There may be more predefined community integrations.
AWS services
AWS services are provided pay-as-you-go with no required upfront costs. As of August 2020, more than 400,000 individuals hold active AWS Certifications, a number that grew more than 85% between August 2019 and August 2020.
Time to value for AWS services is extremely short and limited to the time to instantiate or configure the service for your use. Additional value may be realized through the investment of time configuring or implementing desired integrations. Predefined integrations for AWS services are added as part of the service development roadmap. However, there may be fewer existing integrations to reduce your level of effort.
Consider the following:
No cost to acquire the software; AWS services are pay-as-you-go for use.
AWS skill sets are broadly available. Cost (capital and time) to acquire, establish, or maintain skill sets may be lower.
AWS services are fully managed, and service teams are responsible for the operation of the services.
Time to value is limited to the time to instantiate or configure the service. There may be fewer predefined integrations.
Additional support for AWS services is available through AWS Support. Cost for support varies based on level of support and your AWS utilization.
Open-source tools on AWS services
Open-source tools on AWS services don’t impact these cost considerations. Migration off of either of these solutions is similarly not differentiated. In either case, you have to invest time in replacing the integrations and customizations you wish to maintain.
Security
Both organizations are concerned about reputation and customer trust. They both want to act to protect their information systems and are focusing on confidentiality and integrity of data. They both take security very seriously. Our startup wants to be secure by default and wants to trust the vendor to address vulnerabilities within the service. Our mature company has dedicated resources that focus on security, and the company practices defense in depth across internal organizations.
The startup and the mature company both want to know whether a choice is safe, secure, and can validate the security of their choice. They also want to understand their responsibilities and the shared responsibility model that applies.
Open-source tools
Open-source tools are the product of the contributors and may contain flaws or vulnerabilities. The entire community has access to the code to test and validate. There are frequently many eyes evaluating the security of the tools. A company or individual may perform a validation for themselves. However, there may be limited guidance on secure configurations. Controls in the implementer’s environment may reduce potential risk.
Consider the following:
You’re responsible for the security of the open-source software you implement
You control the security of your data within your open-source implementation
You can validate the security of the code and act as desired
AWS services
AWS service teams make security their highest priority and are able to respond rapidly when flaws are identified. There is robust guidance provided to support configuring AWS services securely.
Consider the following:
AWS is responsible for the security of the cloud and the underlying services
You are responsible for the security of your data in the cloud and how you configure AWS services
You must rely on the AWS service team to validate the security of the code
Open-source tools on AWS services
Open-source tools on AWS services combine these considerations; the customer is responsible for the open-source implementation and the configuration of the AWS services it consumes. AWS is responsible for the security of the AWS Cloud and the managed AWS services.
Reliability
Everyone wants reliable capabilities. What varies between companies is their appetite for risk, and how much they can tolerate the impact of non-availability. The startup emphasized the need for their systems to be available to support their rapid iterations. The mature company is operating with some existing reliability risks, including unsupported open-source tools and in-house scripts.
The startup and the mature company both want to understand the expected reliability of a choice, meaning what percentage of the time it is expected to be available. They both want to know if a choice is designed for high availability and will remain available even if a portion of the systems fails or is in a degraded state. They both want to understand the durability of their data, how to perform backups of their data, and how to perform recovery in the event of a failure.
Both companies need to determine what is an acceptable outage duration, commonly referred to as a Recovery Time Objective (RTO), and for what quantity of elapsed time it is acceptable to lose transactions (including committing changes), commonly referred to as Recovery Point Objective (RPO). They need to evaluate if they can achieve their RTO and RPO objectives with each of the choices they are considering.
Open-source tools
Open-source reliability is dependent upon the effectiveness of the company’s implementation, the underlying resources supporting the implementation, and the reliability of the open-source software. Open-source tools are the product of the contributors and may or may not incorporate high availability features. Depending on the implementation and tool, there may be a requirement for downtime for specific management or maintenance activities. The ability to support RTO and RPO depends on the teams supporting the company system, the implementation, and the mechanisms implemented for backup and recovery.
Consider the following:
You are responsible for implementing your open-source software to satisfy your reliability needs and high availability needs
Open-source tools may have downtime requirements to support specific management or maintenance activities
You are responsible for defining, implementing, and testing the backup and recovery mechanisms and procedures
You are responsible for the satisfaction of your RTO and RPO in the event of a failure of your open-source system
AWS services
AWS services are designed to support customer availability needs. As managed services, the service teams are responsible for maintaining the health of the services.
Consider the following:
AWS services are fully managed and service teams are responsible for the health of the services.
Open-source tools on AWS services combine these considerations; the customer is responsible for the open-source implementation (including data durability, backup, and recovery) and the configuration of the AWS services it consumes. AWS is responsible for the health of the AWS Cloud and the managed services.
Performance
What defines timely and efficient delivery of value varies between our two companies. Each is looking for results before an engineer becomes idled by having to wait for results. The startup iterates rapidly based on the results of each prior iteration. There is limited other activity for our startup engineer to perform before they have to wait on actionable results. Our mature company is more likely to have an outstanding backlog or improvements that can be acted upon while changes moves through the pipeline.
Open-source tools
Open-source performance is defined by the resources upon which it is deployed. Open-source tools that can scale out can dynamically improve their performance when resource constrained. Performance can also be improved by scaling up, which is required when performance is constrained by resources and scaling out isn’t supported. The performance of open-source tools may be constrained by characteristics of how they were implemented in code or the libraries they use. If this is the case, the code is available for community or implementer-created improvements to address the limitation.
Consider the following:
You are responsible for managing the performance of your open-source tools
The performance of open-source tools may be constrained by the resources they are implemented upon; the code and libraries used; their system, resource, and software configuration; and the code and libraries present within the tools
AWS services
AWS services are designed to be highly scalable. CodeCommit has a highly scalable architecture, and CodeBuild scales up and down dynamically to meet your build volume. CodePipeline allows you to run actions in parallel in order to increase your workflow speeds.
Consider the following:
AWS services are fully managed, and service teams are responsible for the performance of the services.
AWS services are designed to scale automatically.
Your configuration of the services you consume can affect the performance of those services.
AWS services quotas exist to prevent unexpected costs. You can make changes to service quotas that may affect performance and costs.
Open-source tools on AWS services
Open-source tools on AWS services combine these considerations; the customer is responsible for the open-source implementation (including the selection and configuration of the AWS Cloud resources) and the configuration of the AWS services it consumes. AWS is responsible for the performance of the AWS Cloud and the managed AWS services.
Operations
Our startup company wants to limit its operations burden as much as possible in order to focus on development efforts. Our mature company has an established and robust operations capability. In both cases, they perform the management and maintenance activities necessary to support their needs.
Open-source tools
Open-source tools are supported by their volunteer communities. That support is voluntary, without any obligation or commitment from the users. If either company adopts open-source tools, they’re responsible for the management and maintenance of the system. If they want additional support with an obligation and commitment to support their implementation, third parties may provide commercial support at additional cost.
Consider the following:
You are responsible for supporting your implementation.
The open-source community may provide volunteer support for the software.
There is no commitment to support the software by the open-source community.
There may be less documentation, or accepted best practices, available to support open-source tools.
Early adoption of open-source tools, or the use of development builds, includes the chance of encountering unidentified edge cases and unanticipated issues.
The complexity of an implementation and its integrations may increase the difficulty to support open-source tools. The time to identify contributing factors may be extended by the complexity during an incident. Maintaining a set of skilled team members with deep understanding of your implementation may help mitigate this risk.
You may be able to acquire commercial support through a third party.
AWS services
AWS services are committed to providing long-term support for their customers.
Consider the following:
There is long-term commitment from AWS to support the service
As a managed service, the service team maintains current documentation
Additional levels of support are available through AWS Support
Support for AWS is available through partners and third parties
Open-source tools on AWS services
Open-source tools on AWS services combine these considerations. The company is responsible for operating the open-source tools (for example, software configuration changes, updates, patching, and responding to faults). AWS is responsible for the operation of the AWS Cloud and the managed AWS services.
Conclusion
In this post, we discussed how to make informed decisions when choosing to implement open-source tools on AWS services, adopt managed AWS services, or use a combination of both. To do so, you must examine your organization and evaluate the benefits and risks.
Examine your organization
You can make an informed decision about the capabilities you adopt. The insight you need can be gained by examining your organization to identify your goals, needs, and priorities, and discovering what your current emphasis is. Ask the following questions:
What are the major challenges your organization faces?
What are the challenges you face managing development?
What problems are you trying to solve with CI/CD tools?
What do you want to achieve with CI/CD tools?
Evaluate benefits and risk
Armed with that knowledge, the next step is to explore the trade-offs between open-source options and managed AWS services. Then evaluate the benefits and risks in terms of the key considerations:
Features
Cost
Security
Reliability
Performance
Operations
When asked “What is the correct answer?” the answer should never be “It depends.” We need to change the question to “What is our use case and what are our needs?” The answer will emerge from there.
Make an informed decision
A Well-Architected solution can include open-source tools, AWS Services, or any combination of both! A Well-Architected choice is an informed decision that evaluates trade-offs, balances benefits and risks, satisfies your requirements, and most importantly supports the achievement of your business outcomes.
Read the other posts in this series and take this journey with BigHat Biosciences and Iponweb as they share their perspectives, the decisions they made, and why.
Resources
Want to learn more? Check out the following CI/CD and developer tools on AWS:
Brian is the global Operational Excellence lead for the AWS Well-Architected program. Formerly the technical lead for an international network, Brian works with customers and partners researching the operations best practices with the greatest positive impact and produces guidance to help you achieve your goals.
Over the past year, Cloudflare Gateway has grown from a DNS filtering solution to a Secure Web Gateway. That growth has allowed customers to protect their organizations with fine-grained identity-based HTTP policies and malware protection wherever their users are. But what about other Internet-bound, non-HTTP traffic that users generate every day — like SSH?
Today we’re excited to announce the ability for administrators to configure network-based policies in Cloudflare Gateway. Like DNS and HTTP policy enforcement, organizations can use network selectors like IP address and port to control access to any network origin.
Because Cloudflare for Teams integrates with your identity provider, it also gives you the ability to create identity-based network policies. This means you can now control access to non-HTTP resources on a per-user basis regardless of where they are or what device they’re accessing that resource from.
A major goal for Cloudflare One is to expand the number of on-ramps to Cloudflare — just send your traffic to our edge however you wish and we’ll make sure it gets to the destination as quickly and securely as possible. We released Magic WAN and Magic Firewall to let administrators replace MPLS connections, define routing decisions, and apply packet-based filtering rules on network traffic from entire sites. When coupled with Magic WAN, Gateway allows customers to define network-based rules that apply to traffic between whole sites, data centers, and that which is Internet-bound.
Solving Zero Trust networking problems
Until today, administrators could only create policies that filtered traffic at the DNS and HTTP layers. However, we know that organizations need to control the network-level traffic leaving their endpoints. We kept hearing two categories of problems from our users and we’re excited that today’s announcement addresses both.
First, organizations want to replace their legacy network firewall appliances. Those appliances are complex to manage, expensive to maintain, and force users to backhaul traffic. Security teams deploy those appliances in part to control the ports and IPs devices can use to send traffic. That level of security helps prevent devices from sending traffic over non-standard ports or to known malicious IPs, but customers had to deal with the downsides of on-premise security boxes.
Second, moving to a Zero Trust model for named resources is not enough. Cloudflare Access provides your team with Zero Trust controls over specific applications, including non-HTTP applications, but we know that customers who are migrating to this model want to bring that level of Zero Trust control to all of their network traffic.
How it works
Cloudflare Gateway, part of Cloudflare One, helps organizations replace legacy firewalls and upgrade to Zero Trust networking by starting with the endpoint itself. Wherever your users do their work, they can connect to a private network running on Cloudflare or the public Internet without backhauling traffic.
First, administrators deploy the Cloudflare WARP agent on user devices, whether those devices are MacOS, Windows, iOS, Android and (soon) Linux. The WARP agent can operate in two modes:
DNS filtering: WARP becomes a DNS-over-HTTPS (DoH) client and sends all DNS queries to a nearby Cloudflare data center where Cloudflare Gateway can filter those queries for threats like websites that host malware or phishing campaigns.
Proxy mode: WARP creates a WireGuard tunnel from the device to Cloudflare’s edge and sends all network traffic through the tunnel. Cloudflare Gateway can then inspect HTTP traffic and apply policies like URL-based rules and virus scanning.
Today’s announcement relies on the second mode. The WARP agent will send all TCP traffic leaving the device to Cloudflare, along with the identity of the user on the device and the organization in which the device is enrolled. The Cloudflare Gateway service will take the identity and then review the TCP traffic against four criteria:
Source IP or network
Source Port
Destination IP or network
Destination Port
Before allowing the packets to proceed to their destination, Cloudflare Gateway checks the organization’s rules to determine if they should be blocked. Rules can apply to all of an organization’s traffic or just specific users and directory groups. If the traffic is allowed, Cloudflare Gateway still logs the identity and criteria above.
Cloudflare Gateway accomplishes this without slowing down your team. The Gateway service runs in every Cloudflare data center in over 200 cities around the world, giving your team members an on-ramp to the Internet that does not backhaul or hairpin traffic. We enforce rules using Cloudflare’s Rust-based Wirefilter execution engine, taking what we’ve learned from applying IP-based rules in our reverse proxy firewall at scale and giving your team the performance benefits.
Building a Zero Trust networking rule
SSH is a versatile protocol that allows users to connect to remote machines and even tunnel traffic from a local machine to a remote machine before reaching the intended destination. That’s great but it also leaves organizations with a gaping hole in their security posture. At first, an administrator could configure a rule that blocks all outbound SSH traffic across the organization.
As soon as you save that policy, the phone rings and it’s an engineer asking why they can’t use a lot of their development tools. Right, engineers use SSH a lot so we should use the engineering IdP group to allow just our engineers to use SSH.
You take advantage of rule precedence and place that rule above the existing rule that affects all users to allow engineers to SSH outbound but not any other users in the organization.
It doesn’t matter which corporate device engineers are using or where they are located, they will be allowed to use SSH and all other users will be blocked.
One more thing
Last month, we announced the ability for customers to create private networks on Cloudflare. Using Cloudflare Tunnel, organizations can connect environments they control using private IP space and route traffic between sites; better, WARP users can connect to those private networks wherever they’re located. No need for centralized VPN concentrators and complicated configurations–connect your environment to Cloudflare and configure routing.
Today’s announcement gives administrators the ability to configure network access policies to control traffic within those private networks. What if the engineer above wasn’t trying to SSH to an Internet-accessible resource but to something an organization deliberately wants to keep within an internal private network (e.g., a development server)? Again, not everyone in the organization should have access to that either. Now administrators can configure identity-based rules that apply to private networks built on Cloudflare.
What’s next?
We’re laser-focused on our Cloudflare One goal to secure organizations regardless of how their traffic gets to Cloudflare. Applying network policies to both WARP users and routing between private networks is part of that vision.
We’re excited to release these building blocks to Zero Trust Network Access policies to protect an organization’s users and data. We can’t wait to dig deeper into helping organizations secure applications that use private hostnames and IPs like they can today with their publicly facing applications.
We’re just getting started–follow this link so you can too.
Security and compliance standards are of paramount importance for organizations in many industries. There is a growing need to seamlessly integrate these standards in an application release cycle. From a DevOps standpoint, an application can be subject to these standards during two phases:
Pre-deployment – Standards are enforced in an application deployment pipeline prior to the deployment of the workload. This follows a shift-left testing approach of catching defects early in the release cycle and preventing security vulnerabilities and compliance issues from being deployed into your AWS account. Example of service/tool providing this capability are Amazon CodeGuru Reviewer and AWS CloudFormation Guard for security static analysis.
Post-deployment – Standards are deployed in application-specific AWS accounts. They only operate and report on resources deployed in those accounts. Example of a service providing this capability is AWS Config for runtime compliance checks.
For this post, we focus on pre-deployment security and compliance standards.
As a security and compliance engineer, you’re responsible for introducing guardrails based on your organizations’ security policies, ensuring continuous compliance of the workloads and preventing noncompliant workloads from being promoted to production. The process of releasing security and compliance guardrails to the individual application development teams who have to incorporate them into their release cycle can become challenging from a scalability standpoint.
You need a process with the following features:
A place to develop and test the guardrails before promotion or activation
Visibility into potential noncompliant resources before activating the guardrails (observation mode)
The ability to notify delivery teams if a noncompliant resource is found in their workload, allowing them time to remediate before guardrail activation
A defined deadline for the delivery teams to mitigate the issues
The ability to add exclusions to guardrails
The ability to enable the guardrail in production in active mode, causing the delivery pipeline to break if a noncompliant resource is found
In this post, we propose a continuous compliance workflow that uses the pattern of continuous integration and continuous deployment (CI/CD) to implement these capabilities. We discuss this solution from the perspective of a security and compliance engineer, and assume that you’re aware of application development terminologies and practices such as CI/CD, infrastructure as code (IaC), behavior-driven development (BDD), and negative testing.
Our continuous compliance workflow is technology agnostic. You can implement it using any combination of CI/CD tools and IaC frameworks such as AWS CloudFormation / AWS CDK as IaC and AWS CloudFormation Guard as policy-as-code tool.
This is part one of a two-part series; in this post, we focus on the continuous compliance workflow and not on its implementation. In Part 2, we focus on the technical implementation of the workflow using AWS Developer Tools, Terraform, and Terraform-Compliance, an open-source compliance framework for Terraform.
Continuous compliance workflow
The security and compliance team is responsible for releasing guardrails implementing compliance policies. Application delivery pipelines are enforced to carry out compliance checks by subjecting their workloads to these guardrails. However, as the guardrails are released and enforced in application delivery pipelines, there should not be an element of surprise for the application teams in which new guardrails suddenly break their pipelines without any warning. A critical ingredient of the continuous compliance workflow is the CI/CD pipeline, which allows for a controlled release of the guardrails to the application delivery pipelines.
To help facilitate this process, we introduce the workflow shown in the following diagram.
The security and compliance team implements compliance as code using a framework of their choice. The following is an example of compliance as code:
Scenario: Ensure all resources have tags
  Given I have resource that supports tags defined
  Then it must contain tags
  And its value must not be null
This compliance check ensures that all AWS resources created have the tags property defined. It’s written using an open-source compliance framework for Terraform called Terraform-Compliance. The framework uses BDD syntax to define the guardrails.
The guardrail is then checked into the feature branch of the repository where all the compliance guardrails reside. This triggers the security and compliance continuous integration (CI) process. The CI flow runs all the guardrails (including newly introduced ones) against the application workload code. Because this occurs in the security and compliance CI pipeline and not the application delivery pipeline, it’s not visible to the application delivery team and doesn’t impact them. This is called observation mode. The security and compliance team can observe the results of their new guardrails against application code without impacting the application delivery team. This allows for notification to the application delivery team to fix any noncompliant resources if found.
Actions taken for compliant workloads
If the workload is compliant with the newly introduced guardrail, the pipeline automatically merges the guardrail to the mainline branch and moves it to active mode. When a guardrail is in active mode, it impacts the application delivery pipelines by breaking them if any noncompliant resources are introduced in the application workload.
Actions taken for noncompliant workloads
If the workload is found to be noncompliant, the pipeline stops the automatic merge. At this point, an alternate path of the workflow takes over, in which the application delivery team is notified and asked to fix the compliance issues before an established deadline. After the deadline, the compliance code is manually merged into the mainline branch, thereby activating it.
The application delivery team may have a valid reason for being noncompliant with one or more guardrails, in which case they have to take their request to the security and compliance team so that the noncompliant resource is added to the exclusion list for that guardrail. If approved, the security and compliance team modifies the guardrail and updates the exclusion list, and the pipeline merges the changes to the mainline branch. The exclusion list is owned and managed by the security and compliance team—only they can approve an exclusion.
Application delivery pipelines run the compliance checks by first pulling guardrails from the mainline branch of the security and compliance repository and subjecting their respective terraform workloads to these guardrails. Only the guardrails in active mode are pulled, which is ensured by pulling the guardrails from the mainline branch only. This workflow implements the integration of the application delivery pipelines with the security and compliance repository, allowing it to pull the guardrails from the compliance repository on every run of the application pipeline. This integration enforces each AWS resource created in the terraform code to be subjected to the guardrails. If any resource isn’t in line with the guardrails, it’s found to be noncompliant and the pipeline stops deployment.
Customer testimonials
Truist Financial Corporation is an American bank holding company headquartered in Charlotte, North Carolina. The company was formed in December 2019 as the result of the merger of BB&T and SunTrust Banks. With AWS Professional Services, Truist implemented the Continuous Compliance Workflow using their own tool stack. Below is what the leadership had to say about the implementation:
“The continuous compliance workflow helped us scale our security and operational compliance checks across all our development teams in a short period of time with a limited staff. We implemented this at Truist using our own tool stack, as the workflow itself is tech stack agnostic. It helped us with shifting left of the development and implementation of compliance checks, and the observation mode in the workflow provided us with an early insight into our workload compliance report before activating the checks to start impacting pipelines of development teams. The workflow allows the development team to take ownership of their workload compliance, while at the same time having a centralized view of the compliance/noncompliance reports allows us to crowdsource learning and share remediations across the teams.”
—Gary Smith, Group Vice President (GPV) Digital Enablement and Quality Engineering, Truist Financial Corporation
“The continuous compliance workflow provided us with a framework over which we are able to roll out any industry standard compliance sets—CIS, PCI, NIST, etc. It provided centralized visibility around policy adherence to these standards, which helped us with our audits. The centralized view also provided us with patterns across development teams of most common noncompliance issues, allowing us to create a knowledge base to help new teams as we on-boarded them. And being self-service, it reduced the friction of on-boarding development teams, therefore improving adoption.”
—David Jankowski, SVP Digital Application Support Services, Truist Financial Corporation
Conclusion
In this two-part series, we introduce the continuous compliance workflow that outlines how you can seamlessly integrate security and compliance guardrails into an application release cycle. This workflow can benefit enterprises with stringent requirements around security and compliance of AWS resources being deployed into cloud.
Be on the lookout for Part 2, in which we implement the continuous compliance workflow using AWS CodePipeline and the Terraform-Compliance framework.
About the authors
Damodar Shenvi Wagle is a Cloud Application Architect at AWS Professional Services. His areas of expertise include architecting serverless solutions, ci/cd and automation.
Sumit Mishra is Senior DevOps Architect at AWS Professional Services. His area of expertise include IaC, Security in pipeline, ci/cd and automation.
David Jankowski is the group head and leads Channel and innovations build and support of DevSecOps Services, Quality Engineering practices, Production Operations and Cloud Migration and Enablement at TRUIST
Gary Smith is the Quality Engineering practice lead for the Channels and Innovations SupportServices organization and was directly responsible for working with our AWS partners on building and implementing the continuous compliance process at TRUIST
GitHub has been at the forefront of security key adoption for many years. We were an early adopter of Universal 2nd Factor (“U2F”) and were also one of the first sites to transition to Webauthn. We’re always on the lookout for new standards that both increase security and usability. Today we’re taking the next step by shipping support for security keys when using Git over SSH.
What are security keys and how do they work?
Security keys, such as the YubiKey, are portable and transferable between machines in a convenient form factor. Most security keys connect via USB, NFC, or Bluetooth. When used in a web browser with two-factor authentication enabled, security keys provide a strong, convenient, and phishing-proof alternative to one-time passwords provided by applications or SMS. Much of the data on the key is protected from external access and modification, ensuring the secrets cannot be taken from the security key. Security keys should be protected as a credential, so keep track of them and you can be confident that you have usable, strong authentication. As long as you retain access to the security key, you can be confident that it can’t be used by anyone else for any other purpose.
Use your existing security key for Git operations
When used for SSH operations, security keys move the sensitive part of your SSH key from your computer to a secure external security key. SSH keys that are bound to security keys protect you from accidental private key exposure and malware. You perform a gesture, such as a tap on the security key, to indicate when you intend to use the security key to authenticate. This action provides the notion of “user presence.”
Security keys are not limited to a single application, so the same individual security key is available for both web and SSH authentication. You don’t need to acquire a separate security key for each use case. And unlike web authentication, two-factor authentication is not a requirement when using security keys to authenticate to Git. As always, we recommend using a strong password, enrolling in two-factor authentication, and setting up account recovery mechanisms. Conveniently, security keys themselves happen to be a great recovery option for securely retaining access to your two-factor-enabled account if you lose access to your phone and backup codes.
The same SSH keys you already know and love, just a little different
Generating and using security keys for SSH is quite similar to how you generated and used SSH keys in the past. You can password-protect your key and require a security key! According to our data, you likely either use an RSA or ed25519 key. Now you can use two additional key types: ecdsa-sk and ed25519-sk, where the “sk” suffix is short for “security key.”
$ ssh-keygen -t ecdsa-sk -C <email address>
Generating public/private ecdsa-sk key pair.
You may need to touch your authenticator to authorize key generation.
Once generated, you add these new keys to your account just like any other SSH key. You’ll still create a public and private key pair, but secret bits are generated and stored in the security key, with the public part stored on your machine like any other SSH public key. There is a private key file stored on your machine, but your private SSH key is a reference to the security key device itself. If your private key file on your computer is stolen, it would be useless without the security key. When using SSH with a security key, none of the sensitive information ever leaves the physical security key device. If you’re the only person with physical access to your security key, it’s safe to leave plugged in at all times.
Safer Git access and key management
With security keys, you can achieve a higher level of account security and protection from account takeover. You can take things a step further by removing your previously registered SSH keys, using only SSH keys backed by security keys. Using only SSH keys backed by security keys gives you strong assurance that you are the only person pulling your Git data via SSH as long as you keep the security key safe like any other private key.
Security keys provide meaningful safety assurances even if you only access Git on trusted, consistent systems. At the other end of the spectrum, you might find yourself working in numerous unfamiliar environments where you need to perform Git operations. Security keys dramatically reduce the impact of inadvertent exposure without the need to manage each SSH key on your account carefully. You can confidently generate and leave SSH keys on any system for any length of time and not have to worry about removing access later. We’ll remove unused keys from your account, making key management even easier. Remember to periodically use keys you want to retain over time so we don’t delete them for you.
Protecting against unintended operations
Every remote Git operation will require an additional key tap to ensure that malware cannot initiate requests without your approval. You can still perform local operations, such as checkout, branch, and merge, without interruption. When you’re happy with your code or ready to receive updates, remote operations like push, fetch, and pull will require that you tap your security key before continuing. As always, SSH keys must be present and optionally unlocked with a password for all Git operations. Unlike password-protected SSH keys, clients do not cache security key taps for multiple operations.
$ git clone [email protected]:github/secure_headers.git
Cloning into 'secure_headers'...
Confirm user presence for key ECDSA-SK SHA256:xzg6NAJDyJB1ptnbRNy8UxD6mdm7J/YBdu2p5+fCUa0
User presence confirmed
Already familiar with using SSH keys backed by security keys? In that case, you might wonder why we require verification (via the security key “tap”) when you can configure your security key to allow operations to proceed as long as the security key is present. While we understand the appeal of removing the need for the taps, we determined our current approach to require presence and intention is the best balance between usability and security.
Towards a future with fewer passwords
Today, you can use a password, a personal access token (PAT), or an SSH key to access Git at GitHub. Later this year, as we continue to iterate toward more secure authentication patterns, passwords will no longer be supported for Git operations. We recognize that passwords are convenient, but they are a consistentsource of account security challenges. We believe passwords represent the present and past, but not the future. We would rather invest in alternatives, like our Personal Access Tokens, by adding features such as fine-grained access and more control over expiration. It’s a long journey, but every effort to reduce the use of passwords has improved the security of the entire GitHub ecosystem.
By removing password support for Git, as we already successfully did for our API, we will raise the baseline security hygiene for every user and organization, and for the resulting software supply chain. By adding SSH security key support, we have provided a new, more secure, and easy-to-use way to strongly authenticate with Git while preventing unintended and potentially malicious access. If you are ready to make the switch, log in to your account and follow the instructions in our documentation to create a new key and add it to your account.
We wanted to extend our gratitude to Yubico, with whom we’ve partnered several times over the years, for being an early collaborator with us on this feature and providing us valuable feedback to ensure we continue to improve developer security.
Syslog. You’ve probably heard about that, especially if you are into monitoring or security. Syslog is perceived to be the common, unified way that systems can send logs to other systems. Linux supports syslog, many network and security appliances support syslog as a way to share their logs. On the other side, a syslog server is receiving all syslog messages. It sounds great in theory – having a simple, common way to represent logs messages and send them across systems.
Reality can’t be further from that. Syslog is not one thing – there are multiple “standards”, and each of those is implemented incorrectly more often than not. Many vendors have their own way of representing data, and it’s all a big mess.
First, the RFCs. There are two RFCs – RFC3164 (“old” or “BSD” syslog) and RFC5424 (the new variant that obsoletes 3164). RFC3164 is not a standard, while RFC5424 is (mostly).
Those RFCs concern the contents of a syslog message. Then there’s RFC6587 which is about transmitting a syslog message over TCP. It’s also not a standard, but rather “an observation”. Syslog is usually transmitted over UDP, so fitting it into TCP requires some extra considerations. Now add TLS on top of that as well.
Then there are content formats. RFC5424 defines a key-value structure, but RFC 3164 does not – everything after the syslog header is just a non-structured message string. So many custom formats exist. For example firewall vendors tend to define their own message formats. At least they are often documented (e.g. check WatchGuard and SonicWall), but parsing them requires a lot of custom knowledge about that vendor’s choices. Sometimes the documentation doesn’t fully reflect the reality, though.
Instead of vendor-specific formats, there are also de-facto standards like CEF and the less popular LEEF. They define a structure of the message and are actually syslog-independent (you can write CEF/LEEF to a file). But when syslog is used for transmitting CEF/LEEF, the message should respect RFC3164.
And now comes the “fun” part – incorrect implementations. Many vendors don’t really respect those documents. They come up with their own variations of even the simplest things like a syslog header. Date formats are all over the place, hosts are sometimes missing, priority is sometimes missing, non-host identifiers are used in place of hosts, colons are placed frivolously.
Parsing all of that mess is extremely “hacky”, with tons of regexes trying to account for all vendor quirks. I’m working on a SIEM, and our collector is open source – you can check our syslog package. Some vendor-specific parsers are yet missing, but we are adding new ones constantly. The date formats in the CEF parser tell a good story.
If it were just two RFCs with one de-facto message format standard for one of them and a few option for TCP/UDP transmission, that would be fine. But what makes things hell is the fact that too many vendors decided not to care about what is in the RFCs, they decided that “hey, putting a year there is just fine” even though the RFC says “no”, that they don’t really need to set a host in the header, and that they didn’t really need to implement anything new after their initial legacy stuff was created.
Too many vendors (of various security and non-security software) came up with their own way of essentially representing key-value pairs, too many vendors thought their date format is the right one, too many vendors didn’t take the time to upgrade their logging facility in the past 12 years.
Unfortunately that’s representative of our industry (yes, xkcd). Someone somewhere stitches something together and then decades later we have an incomprehensible patchwork of stringly-typed, randomly formatted stuff flying around whatever socket it finds suitable. And it’s never the right time and the right priority to clean things up, to get up to date, to align with others in the field. We, as an industry (both security and IT in general) are creating a mess out of everything. Yes, the world is complex, and technology is complex as well. Our job is to make it all palpable, abstracted away, simplified and standardized. And we are doing the opposite.
As a founder of a security company, I’m constantly looking for open source tools to either incorporate in our offering, or get inspiration from, or provide integration with. And there are dozens of great open source security tools, so I decided to publish a list of them. This plethora of options is one of the reasons that security is so hard – they are many different ways to achieve something and it almost always involves headaches with configuring and connecting various “point solutions” (as marketers call them). So here’s the list in on apparent order (note that I’ve listed only defensive tools, offensive ones like metasploit, nmap, wireshark, etc. probably deserve a separate post):
I’m sure there are more (and I’d be happy to add them, e.g. this list suggested in reddit, or others in the reddit thread). Assessing each individual tool, its ease of use, its compliance aspects and the combination between multiple tools is a hard task (here’s a SANS paper on “stitching” multiple tools together). And making sense of the whole landscape (as I’ve tried previously) hints about the complexity of a security professional’s job.
Network-layer DDoS attacks are on the rise, prompting security teams to rethink their L3 DDoS mitigation strategies to prevent business impact. Magic Transit protects customers’ entire networks from DDoS attacks by placing our network in front of theirs, either always on or on demand. Today, we’re announcing new functionality to improve the experience for on-demand Magic Transit customers: flow-based monitoring. Flow-based monitoring allows us to detect threats and notify customers when they’re under attack so they can activate Magic Transit for protection.
Magic Transit is Cloudflare’s solution to secure and accelerate your network at the IP layer. With Magic Transit, you get DDoS protection, traffic acceleration, and other network functions delivered as a service from every Cloudflare data center. With Cloudflare’s global network (59 Tbps capacity across 200+ cities) and <3sec time to mitigate at the edge, you’re covered from even the largest and most sophisticated attacks without compromising performance. Learn more about Magic Transit here.
Using Magic Transit on demand
With Magic Transit, Cloudflare advertises customers’ IP prefixes to the Internet with BGP in order to attract traffic to our network for DDoS protection. Customers can choose to use Magic Transit always on or on demand. With always on, we advertise their IPs and mitigate attacks all the time; for on demand, customers activate advertisement only when their networks are under active attack. But there’s a problem with on demand: if your traffic isn’t routed through Cloudflare’s network, by the time you notice you’re being targeted by an attack and activate Magic Transit to mitigate it, the attack may have already caused impact to your business.
On demand with flow-based monitoring
Flow-based monitoring solves the problem with on-demand by enabling Cloudflare to detect and notify you about attacks based on traffic flows from your data centers. You can configure your routers to continuously send NetFlow or sFlow (coming soon) to Cloudflare. We’ll ingest your flow data and analyze it for volumetric DDoS attacks.
Send flow data from your network to Cloudflare for analysis
When an attack is detected, we’ll notify you automatically (by email, webhook, and/or PagerDuty) with information about the attack.
Cloudflare detects attacks based on your flow data
You can choose whether you’d like to activate IP advertisement with Magic Transit manually – we support activation via the Cloudflare dashboard or API – or automatically, to minimize the time to mitigation. Once Magic Transit is activated and your traffic is flowing through Cloudflare, you’ll receive only the clean traffic back to your network over your GRE tunnels.
Activate Magic Transit for DDoS protection
Using flow-based monitoring with Magic Transit on demand will provide your team peace of mind. Rather than acting in response to an attack after it impacts your business, you can complete a simple one-time setup and rest assured that Cloudflare will notify you (and/or start protecting your network automatically) when you’re under attack. And once Magic Transit is activated, Cloudflare’s global network and industry-leading DDoS mitigation has you covered: your users can continue business as usual with no impact to performance.
Example flow-based monitoring workflow: faster time to mitigate for Acme Corp
Let’s walk through an example customer deployment and workflow with Magic Transit on demand and flow-based monitoring. Acme Corp’s network was hit by a large ransom DDoS attack recently, which caused downtime for both external-facing and internal applications. To make sure they’re not impacted again, the Acme network team chose to set up on-demand Magic Transit. They authorize Cloudflare to advertise their IP space to the Internet in case of an attack, and set up Anycast GRE tunnels to receive clean traffic from Cloudflare back to their network. Finally, they configure their routers at each data center to send NetFlow data to a Cloudflare Anycast IP.
Cloudflare receives Acme’s NetFlow data at a location close to the data center sending it (thanks, Anycast!) and analyzes it for DDoS attacks. When traffic exceeds attack thresholds, Cloudflare triggers an automatic PagerDuty incident for Acme’s NOC team and starts advertising Acme’s IP prefixes to the Internet with BGP. Acme’s traffic, including the attack, starts flowing through Cloudflare within minutes, and the attack is blocked at the edge. Clean traffic is routed back to Acme through their GRE tunnels, causing no disruption to end users – they’ll never even know Acme was attacked. When the attack has subsided, Acme’s team can withdraw their prefixes from Cloudflare with one click, returning their traffic to its normal path.
When the attack subsides, withdraw your prefixes from Cloudflare to return to normal
Get started
To learn more about Magic Transit and flow-based monitoring, contact us today.
The Managed Rules team was recently given the task of allowing Enterprise users to debug Firewall Rules by viewing the part of a request that matched the rule. This makes it easier to determine what specific attacks a rule is stopping or why a request was a false positive, and what possible refinements of a rule could improve it.
The fundamental problem, though, was how to securely store this debugging data as it may contain sensitive data such as personally identifiable information from submissions, cookies, and other parts of the request. We needed to store this data in such a way that only the user who is allowed to access it can do so. Even Cloudflare shouldn’t be able to see the data, following our philosophy that any personally identifiable information that passes through our network is a toxic asset.
This means we needed to encrypt the data in such a way that we can allow the user to decrypt it, but not Cloudflare. This means public key encryption.
Now we needed to decide on which encryption algorithm to use. We came up with some questions to help us evaluate which one to use:
What requirements do we have for the algorithm?
What language do we implement it in?
How do we make this as secure as possible for users?
Here’s how we made those decisions.
Algorithm Requirements
While we knew we needed to use public key encryption, we also needed to keep an eye on performance. This led us to select Hybrid Public Key Encryption (HPKE) early on as it has a best-of-both-worlds approach to using symmetric as well as public-key cryptography to increase performance. While these best-of-both-worlds schemes aren’t new [1][2][3], HPKE aims to provide a single, future-proof, robust, interoperable combination of a general key encapsulation mechanism and a symmetric encryption algorithm.
HPKE is an emerging standard developed by the Crypto Forum Research Group (CFRG), the research body that supports the development of Internet standards at the IETF. The CFRG produces specifications called RFCs (such as RFC 7748 for elliptic curves) that are then used in higher level protocols including two we talked about previously: ODoH and ECH. Cloudflare has long been a supporter of Internet standards, so HPKE was a natural choice to use for this feature. Additionally, HPKE was co-authored by one of our colleagues at Cloudflare.
How HPKE Works
HPKE combines an asymmetric algorithm such as elliptic curve Diffie-Hellman and a symmetric cipher such as AES. One of the upsides of HPKE is that the algorithms aren’t dictated to the implementer, but making a combination that’s provably secure and meets the developer’s intuitive notions of security is important. All too often developers reach for a scheme without carefully understanding what it does, resulting in security vulnerabilities.
HPKE solves these problems by providing a high level of security in a generic manner and providing necessary hooks to tie messages to the context in which they are generated. This is the application of decades of research into the correct security notions and schemes.
HPKE is built in stages. First it turns a Diffie-Hellman key agreement into a Key Encapsulation Mechanism. A key encapsulation mechanism has two algorithms: Encap and Decap. The Encap algorithm creates a symmetric secret and wraps it in a public key, so that only the holder of the private key can unwrap it. An attacker with the encapsulation cannot recover the random key. Decap takes the encapsulation and the private key associated to the public key, and computes the same random key. This translation gives HPKE the flexibility to work almost unchanged with any kind of public key encryption or key agreement algorithm.
HPKE mixes this key with an optional info argument, as well as information relating to the cryptographic parameters used by each side. This ensures that attackers cannot modify messages’ meaning by taking them out of context. A postcard marked “So happy to see you again soon” is ominous from the dentist and endearing from one’s grandmother.
The specification for HPKE is open and available on the IETF website. It is on its way to becoming an RFC after passing multiple rounds of review and analysis by cryptography experts at the CFRG. HPKE is already gaining adoption in IETF protocols like ODoH, ECH, and the new Messaging Layer Security (MLS) protocol. HPKE is also designed with the post-quantum future since it is built to work with any KEM, including all the NIST finalists for post-quantum public-key encryption.
Implementation Language
Once we had an encryption scheme selected, we needed to settle on an implementation. HPKE is still fairly new, so the libraries aren’t quite mature yet. There is a reference implementation, and we’re in the process of developing an implementation in Go as part of CIRCL. However, in the absence of a clear “go to” that is widely known to be the best, we decided to go with an implementation leveraging the same language already powering much of the Firewall code running at the Cloudflare edge – Rust.
Aside from this, the language benefits from features like native primitives, and crucially the ability to easily compile to WebAssembly (WASM).
As we mentioned in a previous blog post, customers are able to generate a key pair and decrypt payloads either from the dashboard UI or from a CLI. Instead of writing and maintaining two different codebases for these, we opted to reuse the same implementation across the edge component that encrypts the payloads and the UI and CLI that decrypt them. To achieve this we compile our library to target WASM so it can be used in the dashboard UI code that runs in the browser. While this approach may yield a slightly larger JavaScript bundle size and relatively small computational overhead, we found it preferable to spending a significant amount of time securely re-implementing HPKE using JavaScript WebCrypto primitives.
The HPKE implementation we decided on comes with the caveat of not yet being formally audited, so we performed our own internal security review. We analyzed the cryptography primitives being used and the corresponding libraries. Between the composition of said primitives and secure programming practices like correctly zeroing memory and safe usage of random number generators, we found no security issues.
Making It Secure For Users
To encrypt on behalf of users, we need them to provide us with a public key. To make this as easy as possible, we built a CLI tool along with the ability to do it right in the browser. Either option allows the user to generate a public/private key pair without needing to talk to Cloudflare servers at all.
In our API, we specifically do not accept the private key of the key pair — we don’t want it! We don’t need and don’t want to be able to decrypt the data we’re storing.
For the dashboard, once the user provides the private key for decryption, the key is held in a temporary JavaScript variable and used for the in-browser decryption. This allows the user to not constantly have to provide the key while browsing the Firewall event logs. The private key is also not persisted in any way in the browser, so any action that refreshes the page such as refreshing or navigating away will require the user to provide the key again. We believe this is an acceptable usability compromise for better security.
How Payload Extraction Works
After deciding how to encrypt the data, we just had to figure out the rest of the feature: what data to encrypt, how to store and transmit it, and how to allow users to decrypt it.
When an HTTP request reaches the L7 Firewall, it is evaluated against a set of rulesets. Each of these rulesets contain several rules written in the wirefilter syntax.
An example of one such rule would be:
http.request.version eq "HTTP/1.1"
and
(
    http.request.uri.path matches "\n+."
    or
    http.request.uri.query matches "\x00+."
)
This expression evaluates to a boolean “true” for HTTP/1.1 requests that either contain one or more newlines followed by a character in the request path or one or more NULL bytes followed by a character in the query string.
Say we had the following request that would match the rule above:
GET /cms/%0Aadmin?action=%00post HTTP/1.1
Host: example.com
If matched data logging is enabled, the rules that match would be executed again in a special context that tags all fields that are accessed during execution. We do this second execution because this tagging adds a noticeable computational overhead, and since the vast majority of requests don’t trigger a rule at all we would be unnecessarily adding overhead to each request. Requests that do match any rules will only match a few rules as well, so we don’t need to re-execute a large portion of the ruleset.
You may notice that although http.request.uri.query matches "\x00+." evaluates to true for this request, it won’t be executed, because the expression short-circuits with the first or condition that also matches. This results in only http.request.version and http.request.uri.path being tagged as accessed:
Having gathered the fields that were accessed, the Firewall engine does some post-processing; removing fields that are a subset of others (e.g., the query string and the full URI), or truncating fields that are beyond a certain character length.
Finally, these get serialized as JSON, encrypted with the customer’s public key, serialized again as a set of bytes, and prefixed with a version number should we need to change/update it in the future. To simplify consumption of these blobs, our APIs display a base64 encoded version of the bytes:
Now that we have encrypted the data at the edge and persisted it in ClickHouse, we need to allow users to decrypt it. As part of the setup of turning this feature on, users generated a key-pair: the public key which was used to encrypt the payloads and a private key which is used to decrypt them. Decryption is done completely offline via either the command line using cloudflare/matched-data-cli:
Since our CLI tool is open-source and HPKE is interoperable, it can also be used in other tooling as part of a user’s logging pipeline, for example in security information and event management (SIEM) software.
Conclusion
This was a team effort with help from our Research and Security teams throughout the process. We relied on them for recommendations on how best to evaluate the algorithms as well as vetting the libraries we wanted to use.
We’re very pleased with how HPKE has worked out for us from an ease-of-implementation and performance standpoint. It was also an easy choice for us to make due to its impending standardization and best-of-both-worlds approach to security.
The thought of downtime can bring a chill to the bones of any IT team. Depending on the online demand you have for your products or services, even an hour or two of downtime can result in significant financial losses or catastrophic consequences of various other kinds.
As such, avoiding downtime should be a high priority item for any IT or Operations Manager. So, is the AWS cloud completely immune to downtime? We’ll discuss the various aspects of this question below.
The true cost of downtime
The true cost of downtime will vary from business to business, but whether you’re an SMB or an enterprise, all businesses that have critical services on the cloud should design their services from the ground up for high availability.
Gartner has reported the average cost of downtime to be $5,600 per minute. This varies between businesses, as no single business is run the exact same way or has the exact same setup, so at the low end this average could be more like $140,000 per hour, and $300,000 per hour on the high end.
To further break down their findings, Gartner’s research showed that 98% of organisations experience costs over $100,000 from a single hour of downtime. 81% of respondents said that 60 minutes of downtime costs their business in excess of $300,000. And 33% of enterprises found that that one hour of downtime cost them anywhere between $1-5 million.
Some of the causes for such a huge loss during and after a business experiences downtime can include some of the following:
Loss of sales
Certain business-critical data can become corrupted, depending on the outage
Costs of reviewing and resolving systems issues and processes
Detrimental reputational effect with stakeholders and customers
A drop in employee morale
A reduction in employee productivity
The always-online cloud services fallacy
Many businesses have migrated to the cloud and assumed that high availability is all a part of the cloud package, and doesn’t require any further expertise, investigation or implementation – however, this is not the case. To ensure high availability and uptime of internal systems and tools, a business must plan for this during its initial implementation. Properly setting up a business AWS environment for high availability requires an in-depth understanding of all that AWS has to offer, which is where a business can benefit greatly from outsourcing to an MSP that specialises in AWS cloud services.
Your business could experience more downtime with AWS than you would with a traditional hosting service.
Many people are surprised to learn that simply migrating to the cloud doesn’t automatically mean that their services will effectively become bullet-proof. In fact, the opposite can often be true.
AWS cloud services are complex and require extensive experience and in-depth knowledge to properly manage. This means there is a far greater chance for error when AWS services are being configured by an inexperienced user, leaving the services more vulnerable to security threats or performance issues that could ultimately result in downtime.
However, on the other hand, when AWS cloud services have been properly planned and configured from the ground up by certified professionals, the cloud can offer significantly greater availability and protection from downtime than traditional hosting services.
High Availability, Redundancy and Backups
‘High Availability’ is a term often attributed to cloud services, and refers to having multiple geographical regions where your website or application can be accessed from (as opposed to end-users always relaying requests back to a single server in one location). Because of the dynamic and data replicating nature of the cloud, some businesses mistake high availability for being inclusive of redundancy and backups.
High availability can refer to redundancy in the sense that should one geographical access point suffer an outage, and another can automatically step in to cater to an end-user’s request. However, it does not mean that your website or application does not still also require an effective backup and disaster recovery plan.
Should something go wrong with your cloud services, or certain parts of your environment become unavailable, you will need to rely on your own plan for replication or recovery. AWS offers a range of options to cater to this, and these should always be carefully considered and implemented during the planning and building phases.
How can you best protect your business from downtime?
So, to answer the question “Are AWS cloud services immune to downtime?”, the answer is no, as it would be for any form of technology. At this time, there is no technology that can truly claim to be entirely failsafe. However, AWS cloud services can get your business as close to failsafe as it is possible to get – if it’s done right.
For businesses that are serious about ensuring their online operations are available as much as possible, such as those involved in providing critical care, high demand eCommerce environments, or enterprise-level tools and systems, it’s essential to have your cloud services designed by a team of certified AWS professionals who have the correct credentials and expertise. If you’re interested in discussing this further, please don’t hesitate to get in touch with our expert team for a free consultation.
As most developers can attest, dealing with security protocols and identity tokens, as well as user and device authentication, can be challenging. Imagine having multiple protocols, multiple tokens, 200M+ users, and thousands of device types, and the problem can explode in scope. A few years ago, we decided to address this complexity by spinning up a new initiative, and eventually a new team, to move the complex handling of user and device authentication, and various security protocols and tokens, to the edge of the network, managed by a set of centralized services, and a single team. In the process, we changed end-to-end identity propagation within the network of services to use a cryptographically-verifiable token-agnostic identity object.
Read on to learn more about this journey and how we have been able to:
Reduce complexity for service owners, who no longer need to have knowledge of and responsibility for terminating security protocols and dealing with myriad security tokens,
Improve security by delegating token management to services and teams with expertise in this area, and
Improve audit-ability and forensic analysis.
How We Got Here
Netflix started as a website that allowed members to manage their DVD queue. This website was later enhanced with the capability to stream content. Streaming devices came a bit later, but these initial devices were limited in capability. Over time, devices increased in capability and functions that were once only accessible on the website became accessible through streaming devices. Scale of the Netflix service was growing rapidly, with over 2000 device types supported.
Services supporting these functions now had an increased burden of being able to understand multiple tokens and security protocols in order to identify the user and device and authorize access to those functions. The whole system was quite complex, and starting to become brittle. Plus, the architecture of the Edge tier was evolving to a PaaS (platform as a service) model, and we had some tough decisions to make about how, and where, to handle identity token handling.
To demonstrate the complexity of the system, following is a description of how the user login flow worked prior to the changes described in this article:
At the highest level, the steps involved in this (greatly simplified) flow are as follows:
User enters their credentials and the Netflix client transmits the credentials, along with the ESN of the device to the Edge gateway, AKA Zuul.
Zuul redirects the user call to the API /login endpoint.
The API server orchestrates backend systems to authenticate the user.
Upon successful authentication of the claims provided, the API server sends a cookie response back upstream, including the customerId (a Long), the ESN (a String) and an expiration directive.
Zuul sends the Cookies back to the Netflix client.
This model had some problems, e.g.:
Externally valid tokens were being minted deep down in the stack and they needed to be propagated all the way upstream, opening possibilities for them to be logged inappropriately or potentially mismanaged.
Upstream systems had to reopen the tokens to identify the user logging in and potentially manage multiple parallel identity data structures, which could easily get out of sync.
Multiple Protocols & Tokens
The example above shows one flow, dealing with one protocol (HTTP/S) and one type of token (Cookies). There are several protocols and tokens in use across the Netflix streaming product, as summarized below:
These tokens were consumed by, and potentially mutated by, several systems within the Netflix streaming ecosystem, for example:
To complicate things further, there were multiple methods for transmitting these tokens, or the data contained therein, from system to system. In some cases, tokens were cracked open and identity data elements extracted as simple primitives or strings to be used in API calls, or passed from system to system via request context headers, or even as URL parameters. There were no checks in place to ensure the integrity of the tokens or the data contained therein.
At Netflix Scale
Meanwhile, the scale at which Netflix operated grew exponentially. At the time of this article, Netflix has 200M+ subscribers, with over a billion devices. We are serving over 2.5 million requests per second, a large percentage of which require some form of authentication. In the old architecture, each of these requests resulted in an API call to authenticate the claims presented with the request, as shown:
EdgePaas Enters the Picture
To further complicate the situation, the Edge Engineering team was in the middle of migrating from an old API server architecture to a new PaaS-based approach. As we migrated to EdgePaaS, front-end services were moved from the Java-based API to a BFF (backend for frontend), aka NodeQuark, as shown:
This model enables front-end engineers to own and operate their services outside of the core API framework. However, this introduced another layer of complexity — how would these NodeQuark services deal with identity tokens? NodeQuark services are written in JavaScript and terminating a protocol as complex as MSL would have been difficult and wasteful, as would replicating all of the logic for token management.
So, Where Were We Again?
To summarize, we found ourselves with a complex and inefficient solution for handling authentication and identity tokens at massive scale. We had multiple types and sources of identity tokens, each requiring special handling, the logic for which was replicated in various systems. Critical identity data was being propagated throughout the server ecosystem in an inconsistent fashion.
Edge Authentication to the Rescue
We realized that in order to solve this problem, a unified identity model was needed. We would need to process authentication tokens (and protocols) further upstream. We did this by moving authentication and protocol termination to the edge of the network, and created a new integrity-protected token-agnostic identity object to propagate throughout the server ecosystem.
Moving Authentication to the Edge
Keeping in mind our objectives to improve security and reduce complexity, and ultimately provide a better user experience, we strategized on how to centralize device authentication operations and user identification and authentication token management to the services edge.
At a high-level, Zuul (cloud gateway) was to become the termination point for token inspection and payload encryption/decryption. In the case that Zuul would be unable to handle these operations (a small percentage), e.g., if tokens were not present, needed to be renewed, or were otherwise invalid, Zuul would delegate those operations to a new set of Edge Authentication Services to handle cryptographic key exchange and token creation or renewal.
Edge Authentication Services
Edge Authentication Services (EAS) is both an architectural concept of moving authentication and identification of devices and users higher up on the stack to the cloud edge, as well as a suite of services that have been developed to handle each token type.
EAS is functionally a series of filters that run in Zuul, which may call out to external services to support their domain, e.g., to a service to handle MSL tokens or another for Cookies. EAS also covers the read-only processing of tokens to create Passports (more on that later).
The basic pattern for how EAS handles requests is as follows:
For each request coming into the Netflix service, the EAS Inbound Filter in Zuul inspects the tokens provided by the device client and either passes through the request to the Passport Injection Filter, or delegates to one of the Edge Authentication Services to process. The Passport Injection Filter generates a token-agnostic identity to propagate down through the rest of the server ecosystem. On the response path, the EAS Outbound Filter determines, with help from the Edge Authentication Services as needed, generates the tokens needed to send back to the client device.
The system architecture now takes the form of:
Notice that tokens never traverse past the Edge gateway / EAS boundary. The MSL security protocol is terminated at the Edge and all tokens are cracked open and identity data is propagated through the server ecosystem in a token-agnostic manner.
A Note on Resilience
On the happy path, Zuul is able to process the large percentage of tokens that are valid and not expired, and the Edge Auth Services handle the remainder of the requests.
The EAS services are designed to be fault tolerant, e.g., in the case where Zuul identifies that Cookies are valid, but expired, and the renewal call to EAS fails or is latent:
In this failure scenario, the EAS filter in Zuul will be lenient and allow the resolved identity to be propagated and will indicate that the renewal call should be rescheduled on the next request.
Token-Agnostic Identity (Passport)
An easily mutable identity structure would not suffice because that would mean passing less trusted identities from service to service. A token-agnostic identity structure was needed.
We introduced an identity structure called “Passport” which allowed us to propagate the user and device identity information in a uniform way. The Passport is also a kind of token, but there are many benefits to using an internal structure that differs from external tokens. However, downstream systems still need access to the user and device identity.
A Passport is a short-lived identity structure created at the Edge for each request, i.e., it is scoped to the life of the request and it is completely internal to the Netflix ecosystem. These are generated in Zuul via a set of Identity Filters. A Passport contains both user & device identity, is in protobuf format, and is integrity protected by HMAC.
Passport Structure
As noted above, the Passport is modeled as a Protocol Buffer. At the highest level, the definition of the Passport is as follows:
messagePassport {
Header header = 1;
UserInfo user_info = 2;
DeviceInfo device_info = 3;
Integrity user_integrity = 4;
Integrity device_integrity = 5;
}
The Header element communicates the name of the service that created the Passport. What’s more interesting is what is propagated related to the user and device.
User & Device Information
The UserInfo element contains all of the information required to identify the user on whose behalf requests are being made, with the DeviceInfo element containing all of the information required for the device on which the user is visiting Netflix:
Both UserInfo and DeviceInfo carry the Source and PassportAuthenticationLevel for the request. The Source list is a classification of claims, with the protocol being used and the services used to validate the claims. The PassportAuthenticationLevel is the level of trust that we put into the authentication claims.
enum Source {
NONE = 0;
COOKIE = 1;
COOKIE_INSECURE = 2;
MSL = 3;
PARTNER_TOKEN = 4;
…
}
enum PassportAuthenticationLevel {
LOW = 1; // untrusted transport
HIGH = 2; // secure tokens over TLS
HIGHEST = 3; // MSL or user credentials
}
Downstream applications can use these values to make Authorization and/or user experience decisions.
Passport Integrity
The integrity of the Passport is protected via an HMAC (hash-based message authentication code), which is a specific type of MAC involving a crytographic hash function and a secret cryptographic key. It may be used to simultaneously verify both the data integrity and authenticity of a message.
User and device integrity are defined as:
messageIntegrity {
int32 version = 1;
string key_name = 2;
bytes hmac = 3;
}
Version 1 of the Integrity element uses SHA-256 for the HMAC, which is encoded as a ByteArray. Future versions of Integrity may use a different has function or encoding. In version 1, the HMAC field contains the 256 bits from MacSpec.SHA_256.
Integrity protection guarantees that Passport field are not mutated after the Passport is created. Client applications can use the Passport Introspector to check the integrity of the Passport before using any of the values contained therein.
Passport Introspector
The Passport object itself is opaque; clients can use the Passport Introspector to extract the Passport from the headers and retrieve the contents inside it. The Passport Introspector is a wrapper over the Passport binary data. Clients create an Introspector via a factory and then have access to basic accessor methods:
public interface PassportIntrospector {
Long getCustomerId();
Long getAccountOwnerId();
String getEsn();
Integer getDeviceTypeId();
String getPassportAsString();
…
}
Passport Actions
In the Passport protocol buffer definition shown above, there are Passport Actions defined:
messageUserInfo {
repeated UserAction actions = 12;
…
}
messageDeviceInfo {
repeated DeviceAction actions = 7;
…
}
Passport Actions are explicit signals sent by downstream services, when an update to user or device identity has been performed. The signal is used by EAS to either create or update the corresponding type of token.
Login Flow, Revisited
Let’s wrap up with an example of all of these solutions working together.
With the movement of authentication and protocol termination to the Edge, and the introduction of Passports as identity, the Login Flow described earlier has morphed into the following:
User enters their credentials and the Netflix client transmits the credentials, along with the ESN of the device to the Edge gateway, AKA Zuul.
Identity filters running in Zuul generate a device-bound Passport and pass it along to the API /login endpoint.
The API server propagates the Passport to the mid-tier services responsible for authentication the user.
Upon successful authentication of the claims provided, these services create a Passport Action and send it, along with the original Passport, back up stream to API and Zuul.
Zuul makes a call to the Cookie Service to resolve the Passport and Passport Actions and sends the Cookies back to the Netflix client.
Key Benefits and Learnings
Simplified Authorization
One of the reasons there were external tokens flowing into downstream systems was because authorization decisions often depend on authentication claims in tokens and the trust associated with each token type. In our Passport structure, we have assigned levels to this trust, meaning that systems requiring authorization decisions can write sensible rules around the Passport instead of replicating the trust rules in code across many services.
An Explicit and Extensible Identity Model
Having a structure that is the canonical identity is very useful. Alternatives where identity primitives are passed around are brittle and hard to debug. If the customer identity changed from service A to service D in a call chain, who changed it? Once the identity structure is passed through all key systems, it is relatively easy to add new external token types, new trust levels, or new ways to represent identity.
Operational Concerns and Visibility
Having a structure, like Passport, allows you to define the services that can write a Passport and other services can validate it. When the Passport is propagated and when we see it in logs, we can open it up, validate it, and know what the identity is. We also know the provenance of the Passport, and can trace it back to where it entered the system. This makes the debugging of any identity-related anomalies much easier.
Reduced Downstream System Complexity & Load
Passing a uniform structure to downstream systems means that those systems can easily look up the device and user identity, using an introspection library. Instead of having separate handling for each type of external token, they can use the common structure.
By offloading token processing from these systems to the central Edge Authentication Services, downstream systems saw significant gains in CPU, request latency, and garbage collection metrics, all of which help reduce cluster footprint and cloud costs. The following examples of these gains are from the primary API service.
In the prior implementation, it was necessary to incur decryption/termination costs twice per request because we needed the ability to route at the edge but also needed rich termination in the downstream service. Some of the performance improvement is due to consolidation of this — MSL requests now only need to be processed once.
CPU to RPS Ratio
Offloading token processing resulted in a 30% reduction in CPU cost per request and a 40% reduction in load average. The following graph shows the CPU to RPS ratio, where lower is better:
API Response Time
Response times for all calls on the API service showed significant improvement, with a 30% reduction in average latency and a 20% drop in 99th percentile latency:
Garbage Collection
The API service also saw a significant reduction in GC pressure and GC pause times, as shown in the Stop The World Garbage Collection metrics:
Developer Velocity
Abstracting these authentication and identity-related concerns away from the developers of microservices means that they can focus on their core domain. Changes in this area are now done once, and in one set of specialized services, versus being distributed across multiple.
What’s Next?
Strong(er) Authentication
We are currently expanding the Edge Authentication Services to support Multi-Factor Authentication via a new service called “Resistor”. We selectively introduce the second factor for connections that are suspicious, based on machine learning models. As we onboard new flows, we are introducing new factors, e.g., one-time passwords (OTP) sent to email or phone, push notifications to mobile devices, and third-party authenticator applications. We may also explore opt-in Multi-Factor Authentication for users who desire the added security on their accounts.
Flexible Authorization
Now that we have a verified identity flowing through the system, we can use that as a strong signal for authorization decisions. Last year, we started to explore a new Product Access Strategy (PACS) and are currently working on moving it into production for several new experiences in the Netflix streaming product. PACS recently powered the experience access control for the Streamfest, a weekend of free Netflix in India.
Want More?
Team members presented this work at QCon San Francisco (and were two of the top three attended talks at the conference!):
I love building products that solve real problems for our customers. These days I don’t get to do so as much directly with our Engineering teams. Instead, about half my time is spent with customers listening to and learning from their security challenges, while the other half of my time is spent with other Cloudflare Product Managers (PMs) helping them solve these customer challenges as simply and elegantly as possible. While I miss the deeply technical engineering discussions, I am proud to have the opportunity to look back every year on all that we’ve shipped across our application security teams.
Taking the time to reflect on what we’ve delivered also helps to reinforce my belief in the Cloudflare approach to shipping product: release early, stay close to customers for feedback, and iterate quickly to deliver incremental value. To borrow a term from the investment world, this approach brings the benefits of compounded returns to our customers: we put new products that solve real-world problems into their hands as quickly as possible, and then reinvest the proceeds of our shared learnings immediately back into the product.
It is these sustained investments that allow us to release a flurry of small improvements over the course of a year, and be recognized by leading industry analyst firms for the capabilities we’ve accumulated and distributed to our customers. Today we’re excited to announce that Frost & Sullivan has named Cloudflare the Innovation Leader in their Frost Radar™: Global Holistic Web Protection Market Report. Frost & Sullivan’s view that this market “will gradually absorb the markets formed around legacy and point solutions” is consistent with our view of the world, and we’re leading the way in “the consolidation of standalone WAF, DDoS mitigation, and Bot Risk Management solutions” they believe is “poised to happen before 2025”.
We are honored to receive this recognition, based on the analysis of 10 providers’ competitive strengths and opportunities as assessed by Frost & Sullivan. The rest of this post explains some of the capabilities that we shipped in 2020 across our Web Application Firewall (WAF), Bot Management, and Distributed Denial-of-Service product lines—the scope of Frost & Sullivan’s report. Get a copy of the Frost & Sullivan Frost Radar report to see why Cloudflare was named the Innovation Leader here.
2020 Web Security Themes and Roundup
Before jumping into specific product and feature launches, I want to briefly explain how we think about building and delivering our web security capabilities. The most important “product” by far that’s been built at Cloudflare over the past 10 years is the massive global network that moves bits securely around the world, as close to the speed of light as possible. Building our features atop this network allows us to reject the legacy tradeoff of performance or security. And equipping customers with the ability to program and extend the network with Cloudflare Workers and Firewall Rules allows us to focus on quickly delivering useful security primitives such as functions, operators, and ML-trained data—then later packaging them up in streamlined user interfaces.
We talk internally about building up the “toolbox” of security controls so customers can express their desired security posture, and that’s how we think about many of the releases over the past year that are discussed below. We begin by providing the saw, hammer, and nails, and let expert builders construct whatever defenses they see fit. By watching how these tools are put to use and observing the results of billions of attempts to evade the erected defenses, we learn how to improve and package them together as a whole for those less inclined to build from components. Most recently we did this with API Shield, providing a guided template to create “positive security” models within Firewall Rules using existing primitives plus new data structures for strong authentication such as Cloudflare-managed client SSL/TLS certificates. Each new tool added to the toolbox increases the value of the existing tools. Each new web request—good or bad—improves the models that our threat intelligence and Bot Management capabilities depend upon.
Web application firewall (WAF) usability at scale
Last year we spoke with many customers about our plan to decouple configuration from the zone/domain model and allow rules to be set for arbitrary paths and groups of services across an account. In 4Q2020 we put this granular control in the hands of a few developers and some of our most sophisticated enterprise customers, and we’re currently collecting and incorporating feedback before defaulting the capabilities on for new customers.
Rules are great, especially with increased flexibility, but without data structures and request enrichment at the edge (such as the Bot Management techniques described below) they cannot act on anything beyond static properties of the request. In 3Q2020 we released our IP Lists capabilities and customers have been steadily uploading their home-grown and third-party subscription lists. These lists can be referenced anywhere in a customer’s account as named variables and then combined with all other attributes of the request, even Bot Management scores, e.g., http.request.uri.path contains “/login” and (not ip.src in $pingdom_probes and cf.bot_management.score < 30) is a Firewall Rule filter that blocks all bots except Pingdom from accessing the login endpoint.
Built predominantly in 4Q2020 and currently being tested in the Firewall Rules engine is a brand new implementation of our Rate Limiting engine. By moving this matching and enforcement logic from a standalone tool to a component within a performant, memory-safe, expressive engine built in Rust, we have increased the utility of existing functions. Additional examples of improving this library of capabilities include the work completed in 1Q2020 to add HMAC functions and regex-based HTTP header and body inspection to the engine.
Bots and machine learning (ML)
In addition to making edge data sets accessible for request evaluation, we continued to invest heavily within our Bot Management team to provide actionable data so that our customers could decide what (if any) automated traffic they wanted to allow to interact with their applications. Our highest priority for Bot research and development has always been efficacy, and last year was no different. A significant portion of our engineering effort was dedicated to our detection engines — both updating and iterating on existing systems or creating entirely new detection engines from scratch.
In 1Q2020 we completed a total rewrite of our Machine Learning engine, and are continually focused on improving the efficacy of our ML engines. To do this, we draw on one of our major competitive advantages: the massive amount of data flowing through Cloudflare’s network. The early 2020 upgrade to our ML model nearly doubled the number of features we use to evaluate and score requests. And to help customers better understand why requests are flagged as bots, we have recently complemented the bot likelihood score in our logs with attribution to the specific engine that generated the score.
Also in 1Q2020, we upgraded our behavioral analysis engine to incorporate more features and increase overall accuracy. This engine conducts histogram-based outlier scoring and is now fully deployed to nearly all Bot Management zones.
In 2Q2020, we developed a lightweight JavaScript element that further advanced our browser fingerprinting capabilities and aids in detection. Specifically, we now silently challenge browsers and detect if a browser is misrepresenting its User Agent. This technique will be incorporated into our ML models and combined with our heuristics engine for more accurate browser fingerprinting. This feature is entirely optional and can be enabled or disabled by customers through our UI and API. Customers with extremely performance sensitive zones or traffic types that are unsuitable for JavaScript (such as API or some mobile app traffic) can still be accurately scored by our Bot Management engine.
In addition to detection, we also spent (and will continue to spend) engineering effort on mitigation. Our entire JavaScript and CAPTCHA challenge platform was rewritten in the last year and deployed to our customer zones in a staged fashion in the second half of 2020. Our new platform is faster and more robust at detecting automated systems attempting to solve the challenges. More importantly, this platform allows us to further invest in new challenge types and modes as we enter 2021.
The biggest and most well received feature released in 2020 was our dedicated Bot Management analytics, released in 3Q2020. We now present informative graphs that double as diagnostic tools. Customers have found that analytics are far more than interesting charts and statistics: in the case of Bot Management, analytics are essential to spotting and subsequently eliminating false positives.
Last but definitely not least, we announced the deprecation of the __cfduid cookie in 4Q2020 which was used primarily to detect bots but caused confusion for some customers including questions about whether they needed to display a cookie banner because of what we do.
To get a sense of the Bot Attack trends we saw in the first half of 2020, take a read through this blog post. And if you’re curious about how our ML models and heuristic engines work to keep your properties safe, this deep dive by Alex Bocharov, Machine Learning Tech Lead on the Bots team, is an excellent guide.
API and IoT security and protection
At the beginning of 4Q2020, we released a product called API Shield that was purpose built to secure, protect, and accelerate API traffic — and will eventually provide much of the common functionality expected in traditional API Gateways. The UI for API Shield was built on top of Firewall Rules for maximum flexibility, and will serve as the jump-off point for configuring additional API security features we have planned this year.
As part of API Shield, every customer now gets a fully managed, domain-scoped private CA generated for each of their zones, and we plan to continue working closely with the SSL/TLS team to expand CA management options based on feedback. Since the release, we’ve seen great adoption from in particular IoT companies focused on locking down their APIs using short-lived client certificates distributed out to devices. Customers can also now upload OpenAPI schemas to be matched against incoming requests from these devices, with bad requests being dropped at the edge rather than passed on to origin infrastructure.
Another capability we released in 4Q2020 was support for gRPC-based API traffic. Since that release, customers have expressed significant interest in using Cloudflare as a secure API gateway between easy-to-use customer-facing JSON endpoints and internal-facing gRPC or GraphQL endpoints. Like most customer challenges at Cloudflare, early adopters are looking to solve these use cases initially with Cloudflare Workers, but we’re keeping an eye on whether there are aspects for which we’ll want to provide first-class feature support.
Distributed Denial-of-Service (DDoS) protections for web applications and APIs
The application-layer security of a web application or API is of minimal importance if the service itself is not available due to a persistent DDoS attack at L3-L7. While mitigating such attacks has long been one of Cloudflare’s strengths, attack methodologies evolve and we continued to invest heavily in 2020 to drop attacks more quickly, more efficiently, and more precisely; as a result, automatic mitigation techniques are applied immediately and most malicious traffic is blocked in less than 3 seconds.
Early in 2020 we responded to a persistent increase in smaller, more localized attacks by fine-tuning a system that can autonomously detect attacks on any server in any datacenter. In the month prior to us first posting about this tool, it mitigated almost 300,000 network-layer attacks, roughly 55 times greater than the tool we previously relied upon. This new tool, dubbed “dosd”, leverages Linux’s eXpress Data Path (XDP) and allows our system to quickly — and automatically — deploy rules eBPF rules that run on each packet received. We further enhanced our edge mitigation capabilities in 3Q2020 by developing and releasing a protection layer that can operate even in environments where we only see one side of the TCP flow. These network layer protections help protect our customers who leverage both Magic Transit to protect their IP ranges and our WAF to protect their applications and APIs.
To document and provide visibility into these attacks, we released a GraphQL-backed interface in 1Q2020 called Network Analytics. Network Analytics extends the visibility of attacks against our customers’ services from L7 to L3, and includes detailed attack logs containing data such as top source and destination IPs and ports, ASNs, data centers, countries, bit rates, protocol and TCP flag distributions. A litany of improvements made to this graphical rendering engine over the course of 2020 have benefitted all analytics tools using the same front-end. In 4Q2020, Network Analytics was extended to provide traffic and attack insights into Cloudflare Spectrum-protected applications, which are terminated at L4 (TCP/UDP).
2020 was a tough year around the world. Throughout what has also been, and continues to be, a period of heightened cyberattacks and breaches, we feel proud that our teams were able to release a steady flow of new and improved capabilities across several critical security product areas reviewed by Frost & Sullivan. These releases culminated in far greater protections for customers at the end of the year than the beginning, and a recognition for our sustained efforts.
We are pleased to have been named the Innovation Leader in their Frost Radar™: Global Holistic Web Protection Market Report, which “addresses organizations’ demand for consolidated, single pane of glass solutions, which not only reduce the security gaps of legacy products but also provide simplified management capabilities”.
As we look towards 2021 we plan to continue releasing early and often, listening to feedback from our customers, and delivering incremental value along the way. If you have ideas on what additional capabilities you’d like to use to protect your applications and networks, we’d love to hear them below in the comments.
Serving more than approximately25 million Internet properties is not an easy thing, and neither is serving 20 million requests per second on average. At Cloudflare, we achieve this by running a homogeneous edge environment: almost every Cloudflare server runs all Cloudflare products.
Figure 1. Typical Cloudflare service model: when an end-user (a browser/mobile/etc) visits an origin (a Cloudflare customer), traffic is routed via the Internet to the Cloudflare edge network, and Cloudflare communicates with the origin servers from that point.
As we offer more and more products and enjoy the benefit of horizontal scalability, our edge stack continues to grow in complexity. Originally, we only operated at the application layer with our CDN service and DoS protection. Then we launched transport layer products, such as Spectrum and Argo. Now we have further expanded our footprint into the IP layer and physical link with Magic Transit. They all run on every machine we have. The work of our engineers enables our products to evolve at a fast pace, and to serve our customers better.
However, such software complexity presents a sheer challenge to operation: the more changes you make, the more likely it is that something is going to break. And we don’t tolerate any of our mistakes slipping into the production environment and affecting our customers.
In this article, we will discuss one of the techniques we use to fight such software complexity: simulations. Simulations are basically system tests that run with synthesized customer traffic and applications. We would like to introduce our simulation system, SOAR, i.e. Simulation for Observability, reliAbility, and secuRity.
What is SOAR? Simply put, it’s a data center built specifically for simulations. It runs the same software stack as our production data centers, but without any production traffic. Within SOAR, there are end-user servers, product servers, and origin servers (Figure 2). The product servers behave exactly the same as servers in our production edge network, and they are the targets that we want to test. End-user servers and origin servers run applications that try to simulate customer behaviors. The simplest case is to run network benchmarks through product servers, in order to evaluate how effective the corresponding products are. Instead of sending test traffic over the Internet, everything happens in the LAN environment that Cloudflare tightly controls. This gives us great flexibility in testing network features such as bring-your-own-IP (BYOIP) products.
Figure 2. SOAR architectural view: by simulating the end users and origin on Cloudflare servers in the same VLAN, we can focus on examining the problems occurring in our edge network.
To demonstrate how this works, let’s go through a running example using Magic Transit.
Magic Transit is a product that provides IP layer protection and acceleration. One of the main functions of Magic Transit is to shield customers from DDoS attacks.
Figure 3. Magic Transit workflow in a nutshell
Customers bring their IP ranges to advertise from Cloudflare edge. When attackers initiate a DoS attack, Cloudflare absorbs all the customer’s traffic, drops the attack traffic, and encapsulates clean traffic to customers. For this product, operational concerns are multifold, and here are some examples:
Have we properly configured our data plane so that traffic can reach customers? Is BGP ready? Are ECMP routes programmed correctly? Are health probes working correctly?
Do we have any untested corner cases that only manifest with a large amount of traffic?
Is our DoS system dropping malicious traffic as intended? How effective
Will any other team’s changes break Magic Transit as our edge keeps growing?
To ease these concerns, we run simulated customers with SOAR. Yes, simulated, not real. For example, assume a customer Alice onboarded an IP range 192.0.2.0/24 to Magic Transit. To simulate this customer, in SOAR we can configure a test application (e.g. iperf server) on one origin server to represent Alice’s service. We also bring up a product server to run Magic Transit. This product server will filter traffic toward a.b.c.0/24, and GRE encapsulated cleansed traffic to Alice’s specified GRE endpoint. To make it work, we also add routing rules to forward packets destined to 192.0.2.0/24 to go through the product server above. Similarly, we add routing rules to deliver GRE packets from the product server to the origin servers. Lastly, we start running test clients as eyeballs to evaluate the functional correctness, performance metrics, and resource usage.
For the rest of this article, we will talk about the design and implementation of this simulation system, as well as several real cases in which it helped us catch problems early or avoid problems altogether.
System Design
From performance simulation to config simulation
Before we created SOAR, we had already built a “performance simulation” for our layer 7 services. It is based on SaltStack, our configuration management software. All the simulation cases are system test cases against Cloudflare-owned HTTP sites. These cases are statically configured and run non-stop. Each simulation case produces multiple Prometheus metrics such as requests per second and latency. We monitor these metrics daily on our Grafana dashboard.
While this simulation system is very useful, it becomes less efficient as we have more and more simulation cases and products to run and analyze.
Isolation and Coordination
As more types of simulations are onboarded, it is critical to ensure each simulation runs in a clean environment, and all tasks of a simulation run together. This challenge is specific to providers like Cloudflare, whose products are not virtualized because we want to maximize our edge performance. As a result, we have to isolate simulations and clean up by ourselves; otherwise, different simulations may cross-affect each other.
For example, for Magic Transit simulations, we need to create a GRE tunnel on an origin server and set up several routes on all three servers, to make sure simulated traffic can flow as real Magic Transit customers would. We cannot leave these routes after the simulation finishes, or there might be a conflict. We once ran into a situation where different simulations required different source IP addresses to the same destination. In our original performance simulation environment, we will have to modify simulation applications to avoid these conflicts. This approach is less desirable as different engineering teams have to pay attention to other teams’ code.
Moreover, the performance simulation addresses only the most basic system test cases: a client sends traffic to a server and measures the performance characteristics like request per second and latency quantile. But the situation we want to simulate and validate in our production environment can be far more complex.
In our previous example of Magic Transit, customers can configure complicated network topology. Figure 4 is one simplified case. Let’s say Alice establishes four GRE tunnels with Cloudflare; two connect to her data center 1, and traffic will be ECMP hashed between these two tunnels. Similarly, she also establishes another two tunnels to her data center 2 with similar ECMP settings. She would like to see traffic hit data center 1 normally and fail over to data center 2 when tunnels 1 and 2 are both down.
Figure 4. The customer configured Magic Transit to establish four tunnels to her two data centers. Traffic to data center 1 is hashed between tunnel 1 and 2 using ECMP, and traffic to data center 2 is hashed between tunnel 3 and 4. Data center 1 is the primary one, and traffic should failover to data center 2 if tunnels 1 and 2 are both down. Note the number “2” is purely symbolic, as real customers can have more than just 2 data centers, or 2 paths per ECMP route.
In order to examine the effectiveness of route failover, we would need to inject errors on the product servers only after the traffic on the eyeball server has started. But this type of coordination is not achievable with statically defined simulations.
Engineer friendliness and Interactiveness
Our performance simulation is not engineer-friendly. Not just because it is all statically configured in SaltStack (most engineering teams do not possess Salt expertise), but it is also not integrated with an engineer’s daily routine. Can engineers trigger a simulation on every branch build? Can simulation results get back in time to inform that a performance problem occurs? The answer is no, it is not possible with our static configuration. An engineer can submit a Salt PR to config a new simulation, but this simulation may have to wait for several hours because all other unfinished simulations need to complete first (recall it is just a static loop). Nor can an engineer add a test to the team’s repository to run on every build, as it needs to reside in the SRE-managed Salt repository, making it unmanageable as the number of simulations grows.
The Architecture
To address the above limitations, we designed SOAR.
Figure 5. The Architecture of SOAR
The architecture is a performance simulation structure, extended. We created an internal coordinator service to:
Interface with engineers, so they could now submit one-time simulations from their laptop or within the building pipeline, or view previous execution results.
Dispatch and coordinate simulation tasks to each simulation server, where a simulation agent executes these tasks. The coordinator will isolate simulations properly so none of them contends on system resources. For example, the simplest policy we implemented is to never run two simulations on the same server at the same time.
The coordinator is secured by Cloudflare Access, so that only employees can visit this service. The coordinator will serve two types of simulations: one-time simulation to be run in an ad-hoc way and mainly on a per pull request manner, to ease development testing. It’s also callable from our CI system. Another type is repetitive simulations that are stored in the coordinator’s persistent storage. These simulations serve daily monitoring purposes and will be executed periodically.
Each simulation server runs a simulation agent. This agent will execute two types of tasks received from the coordinator: system tasks and user tasks. System tasks change the system-wide configurations and will be reverted after each simulation terminates. These will include but are not limited to route change, link change, address change, ipset change and iptables change.
User tasks, on the other hand, run benchmarks that we are interested in evaluating, and will be terminated if it exceeds an allocated execution budget. Each user task is isolated in a cgroup, and the agent will ensure all user tasks are executed with dedicated resources. The generic runtime metrics of user tasks is monitored by Cadvisor and sent to Prometheus and Alert Manager. A user task can export its own metrics to Prometheus as well.
For SOAR to run reliably, we provisioned a dedicated environment that enforces the same settings for the production environment and operates it as a production system: hardened security, standard alerts on watch, no engineer access except approved tools. This to a large extent allows us to run simulations as a stable source of anomaly detection.
Simulating with customer-specific configuration
An important ability of SOAR is to simulate for a specific customer. This will provide the customer with more guarantees that both their configurations and our services are battle-tested with traffic before they go live. It can also be used to bisect problems during a customer escalation, helping customer support to rule out unrelated factors more easily.
All of our edge servers know how to dispatch an incoming customer packet. This factor greatly reduces difficulties in simulating a specific customer. What we need to do in simulation is to mock routing and domain translation on simulated eyeballs and origins, so that they will correctly send traffic to designated product servers. And the problem is solved—magic!
The actual implementation is also straightforward: as simulations run in a LAN environment, we have tight control over how to route packets (servers are on the same broadcast domain). Any eyeball, origin, or product server can just use a direct routing rule and a static DNS entry in /etc/hosts to redirect packets to go to the correct destination.
Running a simulation this way allows us to separate customer configuration management from the simulation service: our products will manage it, so any time a customer configuration is changed, they will already reflect in simulations without special care.
Implementation and Integration
All SOAR components are built with Golang from scratch on Linux servers. It took three engineer-months to build the prototype and onboard the first engineering use case. While there are other mature platforms for job scheduling, task isolation, and monitoring, building our own allows us to better absorb new requirements from engineering teams, which is much easier and quicker than an external dependency.
In addition, we are currently integrating the simulation service into our release pipeline. Cloudflare built a release manager internally to schedule product version changes in controlled steps: a new product is first deployed into dogfooding data centers. After the product has been trialed by Cloudflare employees, it moves to several canary data centers with limited customer traffic. If nothing bad happens, in an hour or so, it starts to land in larger data centers spread across three tiers. Tier-3 will receive the changes an hour earlier than tier-2, and the same applies to tier-2 and tier-1. This ensures a product would be battle-tested enough before it can serve the majority of Cloudflare customers.
Now we move this further by adding a simulation step even before dogfooding. In this step, all changes are deployed into the simulation environment, and engineering teams will configure which simulations to run. Dogfooding starts only when there is no performance regression or functional breakage. Here performance regression is based on Prometheus metrics, where each engineering team can define their own Prometheus query to interpret the performance results. All configured simulations will run periodically to detect problems in releases that do not tie to a specific product, e.g. a Linux kernel upgrade. SREs receive notifications asynchronously if any issue is discovered.
Simulations at Cloudflare: Case Studies
Simulations are very useful inside Cloudflare. Let’s see some real experiences we had in the past.
Detecting an anomaly on data center specific releases
In our Magic Transit example, the engineering team was about to release physical network interconnect (PNI) support. With PNI, customer data centers physically peer with Cloudflare routers.
Figure 6. The Magic Transit service flow for a customer without PNI support. Any Cloudflare data center can receive eyeball traffic. After mitigating a DoS attack traffic, valid traffic is encapsulated to the customer data center from any of the handling Cloudflare data centers.Figure 7. Magic Transit with PNI support. Traffic received from any data center will be moved to the PNI data center that the customer connects to. The PNI data center becomes a choke point.
However, this PNI functionality introduces a problem in our normal release process. However, PNI data centers are typically different from our dogfooding and canary data centers. If we still release with the normal process, then two critical phases are skipped. And what’s worse, the PNI data center could be a choke point in front of that customer’s traffic. If the PNI data center is taken down, no other data center can replace its role.
SOAR in this case is an important utility to help. The basic idea is to configure a server with PNI information. This server will act as if it runs in a PNI data center. Then we run simulated eyeball and origin to examine if there is any functional breakage:
Figure 8. SOAR configures a server with PNI information and runs simulated eyeball and origin on this server. If a PNI related code release has a problem, then with proper simulation traffic it will be caught before rolling into production.
With such simulation capability, we were able to detect several problems early on and before releasing. For example, we caught a problem that impacts checksum offloading, which could encapsulate TCP packets with the wrong inner checksum and cause the packets to be dropped at the origin side. This problem does not exist in our virtualized testing environment and integration tests; it only happens when production hardware comes into play. We then use this simulation as a success indicator to test various fixes until we get the packet flow running normally again.
Continuously monitor performance on the edge stack
When a team configures a simulation, it runs on the same stack where all other teams run their products as well. This means when a simulation starts to show unhealthy results, it may or may not directly relate to the product associated with that simulation.
But with continuous simulations, we will have more chances to detect issues before things go south, or at least it will serve as a hint to quickly react to emerging problems. In an example early this year, we noticed one of our performance simulation dashboards showed that some HTTP request throughput was dropping by 20%. After digging into the case, we found our bot detection system had made a change that affected related requests. Luckily enough we moved fast thanks to the hint from the simulation (and some other useful tools like Opentracing).
Our recent enhancement from just HTTP performance simulation to SOAR makes it even more useful for customers. This is because we are now able to simulate with customer-specific configurations, so we might expose customer-specific problems. We are still dogfooding this, and hopefully, we can deploy it to our customers soon.
DoS Attacks as Simulations
When we started to develop Magic Transit, a question worth monitoring was how effective our mitigation pipeline is, and how to apply thresholds for different customers. For our new ACK flood mitigation system, flowtrackd, we onboarded its performance simulation cases together with tunable ACK flood. Combined with customer-specific configuration, this allows us to compare the throughput result under different volumes of attacks, and systematically tune our mitigation threshold.
Another important factor that we will be able to achieve with our “attack simulation” system is to mount attacks we have seen in the past, making sure the development of our mitigation pipelines won’t ever pass on these known attacks to our customers.
Conclusion
In this article, we introduced Cloudflare’s simulation system, SOAR. While simulation is not a new tool, we can use it to improve reliability, observability, and security. Our adoption of SOAR is still in its early stages, but we are pretty confident that, by fully leveraging simulations, we will push our quality of service to a new level.
Amazon Web Services (AWS) customers who establish shared infrastructure services in a multi-account environment through AWS Organizations and AWS Resource Access Manager (RAM) may find that the default permissions assigned to the management account are too broad. This may allow organizational accounts to share virtual private clouds (VPCs) with other accounts that shouldn’t have access. Many AWS customers, such as those in regulated industries or who handle sensitive data, may need tighter control of which AWS accounts can share VPCs and which accounts can access shared VPCs.
This blog post describes a mechanism for using service control policies (SCPs) to provide that granular control when you create VPC subnet resource shares within AWS Organizations. These organization policies create a preventative guardrail for controlling which accounts in AWS Organizations can share VPC resources, and with whom. The approach outlined here helps to ensure that your AWS accounts comply with your organization’s access control guidelines for VPC sharing.
A VPC sharing scenario in a multi-account environment
When you set up a multi-account environment in AWS, you can create a good foundation to support your cloud projects by incorporating AWS best practices. AWS Control Tower can automate the implementation of best practices and help your organization achieve its centralized governance and business agility goals. One AWS best practice is to create a shared service network account to consolidate networking components, such as subnets, that can be used by the rest of the organization without duplication of resources and costs. AWS RAM provides the ability to share VPC subnets across accounts. This helps to leverage the implicit routing within a VPC for applications that require a high degree of interconnectivity. VPC subnet sharing across accounts allows individual teams to co-locate their microservice application stacks in a single VPC, and provides several advantages:
Easier administration and management of VPCs in a central network account.
Separation of duties—in other words, network admins retain control over management of VPCs, network access control lists (network ACLs), and security groups, while application teams have permissions to deploy resources and workloads in those VPCs.
High density of Classless Inter-Domain Routing (CIDR) block usage for VPC subnets and avoidance of the problem of CIDR overlap that is encountered with multiple VPCs.
Reuse of network address translation (NAT) gateways, VPC interface endpoints, and avoidance of inter-VPC connectivity costs.
In order to allow for VPC subnets to be shared, you must turn on resource sharing from the management account for your AWS Organizations structure. See Shared VPC prerequisites for more information. This allows sharing of VPC subnets across any accounts within AWS Organizations. However, RAM resource sharing does not provide granular control over VPC shared access.
Let’s consider a customer organization that has set up a multi-account environment with AWS Organizations. The organization consists of segmented accounts and organization units (OUs). The following diagram shows such a multi-OU multi-account environment for a customer who has several teams using the AWS environment for their applications and initiatives.
Figure 1: VPC sharing in a customer’s multi-account AWS environment
The AWS environment is structured as follows:
The Infrastructure OU consists of AWS accounts that contain shared resources for the organization. This OU contains a central network account that contains all the networking resources to be shared with other AWS Organization accounts. Network administrators create a VPC in the networking account with a public and private subnet. This VPC is created for the purpose of sharing the subnets with other teams that need access for their workloads.
The Applications OU consists of AWS accounts that are used by several application teams. These are external and internal application stacks that require a VPC-based infrastructure.
The Data Science OU consists of AWS accounts that are used by teams working on data analytics applications and business intelligence (BI) tools. These applications use serverless data analytics tools for Extract-Transform-Load (ETL) pipelines and big data processing workloads. They have third-party BI tools that need to be hosted in AWS and used by the BI team of the organization for reporting.
Cloud administrators turn on resource sharing in AWS RAM from the management account for their organization. The network administrators operating within the network account create a resource share for the two subnets by using AWS RAM, and share them with the Applications OU so that the application teams can use the shared subnets.
However, this approach opens the door to sharing AWS VPC subnets from any AWS account to any other AWS account as long as the admin users of individual accounts have access to AWS RAM. An example of such unintended or unwanted sharing is when the Application OU account could share a resource with the Data Science OU account, bypassing the centralized network account to satisfy one-off project requests or Proof of Concepts (POCs) that violate the centralized VPC sharing policy.
As a security best practice, cloud administrators should follow the principle of least privilege and use granular controls for VPC sharing. The cloud administrator in this example wants to limit AWS Identity and Access Management (IAM) users with policies that restrict users’ access to AWS RAM to create resource shares. However, this setup can be cumbersome to manage when there are several OUs and numerous AWS accounts. For a more efficient way to have granular control over VPC sharing, you can enable security guardrails by using service control policies (SCPs), as described in the next section. We will walk you through example SCP policies that restrict VPC sharing within AWS Organizations.
Use service control policies to control VPC sharing
In the scenario we described earlier, cloud admins want to allow VPC sharing with the following constraints:
Allow only VPC subnet shares created from a network account
Allow VPC subnet shares to be shared only with certain OUs or AWS accounts
You can achieve these constraints by using the following service control policies.
Both of these service control policies are attached at the root of AWS Organizations, so they are applied to all underlying OUs and accounts. When a network administrator who has logged into the network account tries to create a VPC subnet resource share and associate it with the Application OU, the resource share is successfully created and available to both the Internalapp and Externalapp AWS accounts. However, when the network admin tries to associate the resource share with the DataAnalytics account (which lies outside of the permitted Application OU), the RAMControl2 SCP prevents that action, based on the first condition in the policy statement. The second condition on the RAMControl2 SCP prevents action for specific AWS accounts. In that case, you will see the following error.
Figure 2 Resource share creation is blocked by the SCP
Likewise, when an AWS account administrator of the Externalapp account creates a VPC in that account and tries to share it with the Internalapp account, an error is displayed and the SCP prevents that action. The RAMControl1 SCP prevents the action because it allows only the network account to create and associate resource shares.
Considerations
When you use service control policies within a multi-account structure, it’s important to keep in mind the following considerations:
Customers apply SCPs for several governance and guardrail requirements. The SCPs mentioned here will be evaluated in conjunction with all other SCPs applied at that level in the hierarchy or inherited from above in the hierarchy. See How to use SCPs in AWS Organizations for more information.
AWS strongly recommends that you don’t attach SCPs to the root of your organization without thoroughly testing to ensure that you don’t inadvertently lock users out of key services thereby impacting AWS production environments.
While the example here specifies applying SCPs at the root level, you can take a similar approach if you want to control VPC sharing within a specific OU.
SCPs can be applied to shared resources other than VPC subnets for similar control. To find the complete list of resources that can be specified by using ram: RequestedResourceType, see How AWS RAM works with IAM.
VPC subnets can be shared with AWS accounts and OUs only within an organization. For more information, see the Limitations section in Working with shared VPCs.
Summary
This blog post provides a starting point for learning how to use SCPs to create a granular governance control for VPC sharing. See the IAM conditions keys for AWS RAM and Example SCPs for AWS RAM for more information that can help you implement this preventative guardrail in a way that’s suitable for your AWS environment.
Adding granular governance controls using SCP limits overly permissive sharing and prevents unauthorized resource sharing. Granular control of VPC sharing also helps you follow the AWS security best practice, the principle of least privilege, for access to VPCs. You can take advantage of organization-level SCPs for granular control of resources, which doesn’t require that you turn on resource sharing in AWS Organizations for services such as AWS Transit Gateway or Amazon Route 53 resolver rules.
If you have feedback about this post, submit comments in the Comments section below.
Want more AWS Security how-to content, news, and feature announcements? Follow us on Twitter.
Content-Security-Policy is important for web security. Yet, it’s not mainstream yet, it’s syntax is hard, it’s rather prohibitive and tools rarely have flexible support for it.
While Spring Security does have a built-in Content Security Policy (CSP) configuration, it allows you to specify the policy a a string, not build it dynamically. And in some cases you need more than that.
In particular, CSP discourages the user of inline javascript, because it introduces vulnerabilities. If you really need it, you can use unsafe-inline but that’s a bad approach, as it negates the whole point of CSP. The alternative presented on that page is to use hash or nonce.
I’ll explain how to use nonce with spring security, if you are using .and().headers().contentSecurityPolicy(policy). The policy string is static, so you can’t generate a random nonce for each request. And having a static nonce is useless. So first, you define a CSP nonce filter:
public class CSPNonceFilter extends GenericFilterBean {
    private static final int NONCE_SIZE = 32; //recommended is at least 128 bits/16 bytes
    private static final String CSP_NONCE_ATTRIBUTE = "cspNonce";

    private SecureRandom secureRandom = new SecureRandom();

    @Override
    public void doFilter(ServletRequest req, ServletResponse res, FilterChain chain) throws IOException, ServletException {
        HttpServletRequest request = (HttpServletRequest) req;
        HttpServletResponse response = (HttpServletResponse) res;

        byte[] nonceArray = new byte[NONCE_SIZE];

        secureRandom.nextBytes(nonceArray);

        String nonce = Base64.getEncoder().encodeToString(nonceArray);
        request.setAttribute(CSP_NONCE_ATTRIBUTE, nonce);

        chain.doFilter(request, new CSPNonceResponseWrapper(response, nonce));
    }

    /**
     * Wrapper to fill the nonce value
     */
    public static class CSPNonceResponseWrapper extends HttpServletResponseWrapper {
        private String nonce;

        public CSPNonceResponseWrapper(HttpServletResponse response, String nonce) {
            super(response);
            this.nonce = nonce;
        }

        @Override
        public void setHeader(String name, String value) {
            if (name.equals("Content-Security-Policy") && StringUtils.isNotBlank(value)) {
                super.setHeader(name, value.replace("{nonce}", nonce));
            } else {
                super.setHeader(name, value);
            }
        }

        @Override
        public void addHeader(String name, String value) {
            if (name.equals("Content-Security-Policy") && StringUtils.isNotBlank(value)) {
                super.addHeader(name, value.replace("{nonce}", nonce));
            } else {
                super.addHeader(name, value);
            }
        }
    }
}
And then you configure it with spring security using: .addFilterBefore(new CSPNonceFilter(), HeaderWriterFilter.class).
The policy string should containt `nonce-{nonce}` which would get replaced with a random nonce on each request.
The filter is set before the HeaderWriterFilter so that it can wrap the response and intercept all calls to setting headers. Why it can’t be done by just overriding the headers after they are set by the HeaderWriterFiilter, using response.setHeader(..) – because the response is already committed and overriding does nothing.
Then in your pages where you for some reason need inline scripts, you can use:
<script nonce="{{ cspNonce }}">...</script>
(I’m using the Pebble template syntax; but you can use any template to output the request attribute “csp-nonce”)
Once again, inline javascript is rarely a good idea, but sometimes it’s necessary, at least temporarily – if you are adding a CSP to a legacy application, for example, and can’t rewrite everything).
We should have CSP everywhere, but building the policy should be aided by the frameworks we use, otherwise it’s rather tedious to write a proper policy that doesn’t break your application and is secure at the same time.
To provide the best experiences, we use technologies like cookies to store and/or access device information. Consenting to these technologies will allow us to process data such as browsing behavior or unique IDs on this site. Not consenting or withdrawing consent, may adversely affect certain features and functions.
Functional
Always active
The technical storage or access is strictly necessary for the legitimate purpose of enabling the use of a specific service explicitly requested by the subscriber or user, or for the sole purpose of carrying out the transmission of a communication over an electronic communications network.
Preferences
The technical storage or access is necessary for the legitimate purpose of storing preferences that are not requested by the subscriber or user.
Statistics
The technical storage or access that is used exclusively for statistical purposes.The technical storage or access that is used exclusively for anonymous statistical purposes. Without a subpoena, voluntary compliance on the part of your Internet Service Provider, or additional records from a third party, information stored or retrieved for this purpose alone cannot usually be used to identify you.
Marketing
The technical storage or access is required to create user profiles to send advertising, or to track the user on a website or across several websites for similar marketing purposes.


 Srinivas Manepalli is a DevSecOps Solutions Architect in the U.S. Fed SI SA team at Amazon Web Services (AWS). He is passionate about helping customers, building and architecting DevSecOps and highly available software systems. Outside of work, he enjoys spending time with family, nature and good food.