Tag Archives: Thought Leadership

Derive operational insights from application logs using Automated Data Analytics on AWS

Post Syndicated from Aparajithan Vaidyanathan original https://aws.amazon.com/blogs/big-data/derive-operational-insights-from-application-logs-using-automated-data-analytics-on-aws/

Automated Data Analytics (ADA) on AWS is an AWS solution that enables you to derive meaningful insights from data in a matter of minutes through a simple and intuitive user interface. ADA offers an AWS-native data analytics platform that is ready to use out of the box by data analysts for a variety of use cases. With ADA, teams can ingest, transform, govern, and query diverse datasets from a range of data sources without requiring specialist technical skills. ADA provides a set of pre-built connectors to ingest data from a wide range of sources including Amazon Simple Storage Service (Amazon S3), Amazon Kinesis Data Streams, Amazon CloudWatch, Amazon CloudTrail, and Amazon DynamoDB as well as many others.

ADA provides a foundational platform that can be used by data analysts in a diverse set of use cases including IT, finance, marketing, sales, and security. ADA’s out-of-the-box CloudWatch data connector allows data ingestion from CloudWatch logs in the same AWS account in which ADA has been deployed, or from a different AWS account.

In this post, we demonstrate how an application developer or application tester is able to use ADA to derive operational insights of applications running in AWS. We also demonstrate how you can use the ADA solution to connect to different data sources in AWS. We first deploy the ADA solution into an AWS account and set up the ADA solution by creating data products using data connectors. We then use the ADA Query Workbench to join the separate datasets and query the correlated data, using familiar Structured Query Language (SQL), to gain insights. We also demonstrate how ADA can be integrated with business intelligence (BI) tools such as Tableau to visualize the data and to build reports.

Solution overview

In this section, we present the solution architecture for the demo and explain the workflow. For the purposes of demonstration, the bespoke application is simulated using an AWS Lambda function that emits logs in Apache Log Format at a preset interval using Amazon EventBridge. This standard format can be produced by many different web servers and be read by many log analysis programs. The application (Lambda function) logs are sent to a CloudWatch log group. The historical application logs are stored in an S3 bucket for reference and for querying purposes. A lookup table with a list of HTTP status codes along with the descriptions is stored in a DynamoDB table. These three serve as sources from which data is ingested into ADA for correlation, query, and analysis. We deploy the ADA solution into an AWS account and set up ADA. We then create the data products within ADA for the CloudWatch log group, S3 bucket, and DynamoDB. As the data products are configured, ADA provisions data pipelines to ingest the data from the sources. With the ADA Query Workbench, you can query the ingested data using plain SQL for application troubleshooting or issue diagnosis.

The following diagram provides an overview of the architecture and workflow of using ADA to gain insights into application logs.

The workflow includes the following steps:

  1. A Lambda function is scheduled to be triggered at 2-minute intervals using EventBridge.
  2. The Lambda function emits logs that are stored at a specified CloudWatch log group under /aws/lambda/CdkStack-AdaLogGenLambdaFunction. The application logs are generated using the Apache Log Format schema but stored in the CloudWatch log group in JSON format.
  3. The data products for CloudWatch, Amazon S3, and DynamoDB are created in ADA. The CloudWatch data product connects to the CloudWatch log group where the application (Lambda function) logs are stored. The Amazon S3 connector connects to an S3 bucket folder where the historical logs are stored. The DynamoDB connector connects to a DynamoDB table where the status codes that are referred by the application and historical logs are stored.
  4. For each of the data products, ADA deploys the data pipeline infrastructure to ingest data from the sources. When the data ingestion is complete, you can write queries using SQL via the ADA Query Workbench.
  5. You can log in to the ADA portal and compose SQL queries from the Query Workbench to gain insights in to the application logs. You can optionally save the query and share the query with other ADA users in the same domain. The ADA query feature is powered by Amazon Athena, which is a serverless, interactive analytics service that provides a simplified, flexible way to analyze petabytes of data.
  6. Tableau is configured to access the ADA data products via ADA egress endpoints. You then create a dashboard with two charts. The first chart is a heat map that shows the prevalence of HTTP error codes correlated with the application API endpoints. The second chart is a bar chart that shows the top 10 application APIs with a total count of HTTP error codes from the historical data.

Prerequisites

For this post, you need to complete the following prerequisites:

  1. Install the AWS Command Line Interface (AWS CLI), AWS Cloud Development Kit (AWS CDK) prerequisites, TypeScript-specific prerequisites, and git.
  2. Deploy the ADA solution in your AWS account in the us-east-1 Region.
    1. Provide an admin email while launching the ADA AWS CloudFormation stack. This is needed for ADA to send the root user password. An admin phone number is required to receive a one-time password message if multi-factor authentication (MFA) is enabled. For this demo, MFA is not enabled.
  3. Build and deploy the sample application (available on the GitHub repo) solution so that the following resources can be provisioned in your account in the us-east-1 Region:
    1. A Lambda function that simulates the logging application and an EventBridge rule that invokes the application function at 2-minute intervals.
    2. An S3 bucket with the relevant bucket policies and a CSV file that contains the historical application logs.
    3. A DynamoDB table with the lookup data.
    4. Relevant AWS Identity and Access Management (IAM) roles and permissions required for the services.
  4. Optionally, install Tableau Desktop, a third-party BI provider. For this post, we use Tableau Desktop version 2021.2. There is a cost involved in using a licensed version of the Tableau Desktop application. For additional details, refer to the Tableau licensing information.

Deploy and set up ADA

After ADA is deployed successfully, you can log in using the admin email provided during the installation. You then create a domain named CW_Domain. A domain is a user-defined collection of data products. For example, a domain might be a team or a project. Domains provide a structured way for users to organize their data products and manage access permissions.

  1. On the ADA console, choose Domains in the navigation pane.
  2. Choose Create domain.
  3. Enter a name (CW_Domain) and description, then choose Submit.

Set up the sample application infrastructure using AWS CDK

The AWS CDK solution that deploys the demo application is hosted on GitHub. The steps to clone the repo and to set up the AWS CDK project are detailed in this section. Before you run these commands, be sure to configure your AWS credentials. Create a folder, open the terminal, and navigate to the folder where the AWS CDK solution needs to be installed. Run the following code:

gh repo clone aws-samples/operational-insights-with-automated-data-analytics-on-aws
cd operational-insights-with-automated-data-analytics-on-aws
npm install
npm run build
cdk synth
cdk deploy

These steps perform the following actions:

  • Install the library dependencies
  • Build the project
  • Generate a valid CloudFormation template
  • Deploy the stack using AWS CloudFormation in your AWS account

The deployment takes about 1–2 minutes and creates the DynamoDB lookup table, Lambda function, and S3 bucket containing the historical log files as outputs. Copy these values to a text editing application, such as Notepad.

Create ADA data products

We create three different data products for this demo, one for each data source that you’ll be querying to gain operational insights. A data product is a dataset (a collection of data such as a table or a CSV file) that has been successfully imported into ADA and that can be queried.

Create a CloudWatch data product

First, we create a data product for the application logs by setting up ADA to ingest the CloudWatch log group for the sample application (Lambda function). Use the CdkStack.LambdaFunction output to get the Lambda function ARN and locate the corresponding CloudWatch log group ARN on the CloudWatch console.

Then complete the following steps:

  1. On the ADA console, navigate to the ADA domain and create a CloudWatch data product.
  2. For Name¸ enter a name.
  3. For Source type, choose Amazon CloudWatch.
  4. Disable Automatic PII.

ADA has a feature that automatically detects personally identifiable information (PII) data during import that is enabled by default. For this demo, we disable this option for the data product because the discovery of PII data is not in the scope of this demo.

  1. Choose Next.
  2. Search for and choose the CloudWatch log group ARN copied from the previous step.
  3. Copy the log group ARN.
  4. On the data product page, enter the log group ARN.
  5. For CloudWatch Query, enter a query that you want ADA to get from the log group.

In this demo, we query the @message field because we’re interested in getting the application logs from the log group.

  1. Select how the data updates are triggered after initial import.

ADA can be configured to ingest the data from the source at flexible intervals (up to 15 minutes or later) or on demand. For the demo, we set the data updates to run hourly.

  1. Choose Next.

Next, ADA will connect to the log group and query the schema. Because the logs are in Apache Log Format, we transform the logs into separate fields so that we can run queries on the specific log fields. ADA provides four default transformations and supports custom transformation through a Python script. In this demo, we run a custom Python script to transform the JSON message field into Apache Log Format fields.

  1. Choose Transform schema.
  2. Choose Create new transform.
  3. Upload the apache-log-extractor-transform.py script from the /asset/transform_logs/ folder.
  4. Choose Submit.

ADA will transform the CloudWatch logs using the script and present the processed schema.

  1. Choose Next.
  2. In the last step, review the steps and choose Submit.

ADA will start the data processing, create the data pipelines, and prepare the CloudWatch log groups to be queried from the Query Workbench. This process will take a few minutes to complete and will be shown on the ADA console under Data Products.

Create an Amazon S3 data product

We repeat the steps to add the historical logs from the Amazon S3 data source and look up reference data from the DynamoDB table. For these two data sources, we don’t create custom transforms because the data formats are in CSV (for historical logs) and key attributes (for reference lookup data).

  1. On the ADA console, create a new data product.
  2. Enter a name (hist_logs) and choose Amazon S3.
  3. Copy the Amazon S3 URI (the text after arn:aws:s3:::) from the CdkStack.S3 output variable and navigate to the Amazon S3 console.
  4. In the search box, enter the copied text, open the S3 bucket, select the /logs folder, and choose Copy S3 URI.

The historical logs are stored in this path.

  1. Navigate back to the ADA console and enter the copied S3 URI for S3 location.
  2. For Update Trigger, select On Demand because the historical logs are updated at an unspecified frequency.
  3. For Update Policy, select Append to append newly imported data to the existing data.
  4. Choose Next.

ADA processes the schema for the files in the selected folder path. Because the logs are in CSV format, ADA is able to read the column names without requiring additional transformations. However, the columns status_code and request_size are inferred as long type by ADA. We want to keep the column data types consistent among the data products so that we can join the data tables and query the data. The column status_code will be used to create joins across the data tables.

  1. Choose Transform schema to change the data types of the two columns to string data type.

Note the highlighted column names in the Schema preview pane prior to applying the data type transformations.

  1. In the Transform plan pane, under Built-in transforms, choose Apply Mapping.

This option allows you to change the data type from one type to another.

  1. In the Apply Mapping section, deselect Drop other fields.

If this option is not disabled, only the transformed columns will be preserved and all other columns will be dropped. Because we want to retain all the columns, we disable this option.

  1. Under Field Mappings¸ for Old name and New name, enter status_code and for New type, enter string.
  2. Choose Add Item.
  3. For Old name and New name¸ enter request_size and for New data type, enter string.
  4. Choose Submit.

ADA will apply the mapping transformation on the Amazon S3 data source. Note the column types in the Schema preview pane.

  1. Choose View sample to preview the data with the transformation applied.

ADA will display the PII data acknowledgement to ensure that either only authorized users can view the data or that the dataset doesn’t contain any PII data.

  1. Choose Agree to continue to view the sample data.

Note that the schema is identical to the CloudWatch log group schema because both the current application and historical application logs are in Apache Log Format.

  1. In the final step, review the configuration and choose Submit.

ADA starts processing the data from the Amazon S3 source, creates the backend infrastructure, and prepares the data product. This process takes a few minutes depending upon the size of the data.

Create a DynamoDB data product

Lastly, we create a DynamoDB data product. Complete the following steps:

  1. On the ADA console, create a new data product.
  2. Enter a name (lookup) and choose Amazon DynamoDB.
  3. Enter the Cdk.DynamoDBTable output variable for DynamoDB Table ARN.

This table contains key attributes that will be used as a lookup table in this demo. For the lookup data, we are using the HTTP codes and long and short descriptions of the codes. You can also use PostgreSQL, MySQL, or a CSV file source as an alternative.

  1. For Update Trigger, select On-Demand.

The updates will be on demand because the lookup is mostly for reference purpose while querying and any updates to the lookup data can be updated in ADA using on-demand triggers.

  1. Choose Next.

ADA reads the schema from the underlying DynamoDB schema and presents the column name and type for optional transformation. We will proceed with the default schema selection because the column types are consistent with the types from the CloudWatch log group and Amazon S3 CSV data source. Having data types that are consistent across the data sources allows us to write queries to fetch records by joining the tables using the column fields. For example, the column key in the DynamoDB schema corresponds to the status_code in the Amazon S3 and CloudWatch data products. We can write queries that can join the three tables using the column name key. An example is shown in the next section.

  1. Choose Continue with current schema.
  2. Review the configuration and choose Submit.

ADA will process the data from the DynamoDB table data source and prepare the data product. Depending upon the size of the data, this process takes a few minutes.

Now we have all the three data products processed by ADA and available for you to run queries.

Use the Query Workbench to query the data

ADA allows you to run queries against the data products while abstracting the data source and making it accessible using SQL (Structured Query Language). You can write queries and join the tables just as you would query against tables in a relational database. We demonstrate ADA’s querying capability via two user scenarios. In both the scenarios, we join an application log dataset to the error codes lookup table. In the first use case, we query the current application logs to identify the top 10 most accessed application endpoints along with the corresponding HTTP status codes:

--Query the top 10 Application endpoints along with the corresponding HTTP request type and HTTP status code.

SELECT logs.endpoint AS Application_EndPoint, logs.http_request AS REQUEST, count(logs.endpoint) as Endpoint_Count, ref.key as HTTP_Status_Code, ref.short as Description
FROM cw_domain.cloud_watch_application_logs logs
INNER JOIN cw_domain.lookup ref ON logs.status_code = ref.key
where logs.status_code LIKE '4%%' OR logs.status_code LIKE '5%%' -- = '/v1/server'
GROUP BY logs.endpoint, logs.http_request, ref.key, ref.short
ORDER BY Endpoint_Count DESC
LIMIT 10

In the second example, we query the historical logs table to get the top 10 application endpoints with the most errors to understand the endpoint call pattern:

-- Query Historical Logs to get the top 10 Application Endpoints with most number of errors along with an explanation of the error code.

SELECT endpoint as Application_EndPoint, count(status_code) as Error_Count, ref.long as Description FROM cw_domain.hist_logs hist
INNER JOIN cw_domain.lookup ref ON hist.status_code = ref.key
WHERE hist.status_code LIKE '4%%' OR hist.status_code LIKE '5%%'
GROUP BY endpoint, status_code, ref.long
ORDER BY Error_Count desc
LIMIT 10

In addition to querying, you can optionally save the query and share the saved query with other users in the same domain. The shared queries are accessible directly from the Query Workbench. The query results can also be exported to CSV format.

Visualize ADA data products in Tableau

ADA offers the ability to connect to third-party BI tools to visualize data and create reports from the ADA data products. In this demo, we use ADA’s native integration with Tableau to visualize the data from the three data products we configured earlier. Using Tableau’s Athena connector and following the steps in Tableau configuration, you can configure ADA as a data source in Tableau. After a successful connection has been established between Tableau and ADA, Tableau will populate the three data products under the Tableau catalog cw_domain.

We then establish a relationship across the three databases using the HTTP status code as the joining column, as shown in the following screenshot. Tableau allows us to work in online and offline mode with the data sources. In online mode, Tableau will connect to ADA and query the data products live. In offline mode, we can use the Extract option to extract the data from ADA and import the data in to Tableau. In this demo, we import the data in to Tableau to make the querying more responsive. We then save the Tableau workbook. We can inspect the data from the data sources by choosing the database and Update Now.

With the data source configurations in place in Tableau, we can create custom reports, charts, and visualizations on the ADA data products. Let’s consider two use cases for visualizations.

As shown in the following figure, we visualized the frequency of the HTTP errors by application endpoints using Tableau’s built-in heat map chart. We filtered out the HTTP status codes to only include error codes in the 4xx and 5xx range.

We also created a bar chart to depict the application endpoints from the historical logs ordered by the count of HTTP error codes. In this chart, we can see that the /v1/server/admin endpoint has generated the most HTTP error status codes.

Clean up

Cleaning up the sample application infrastructure is a two-step process. First, to remove the infrastructure provisioned for the purposes of this demo, run the following command in the terminal:

cdk destroy

For the following question, enter y and AWS CDK will delete the resources deployed for the demo:

Are you sure you want to delete: CdkStack (y/n)? y

Alternatively, you can remove the resources via the AWS CloudFormation console by navigating to the CdkStack stack and choosing Delete.

The second step is to uninstall ADA. For instructions, refer to Uninstall the solution.

Conclusion

In this post, we demonstrated how to use the ADA solution to derive insights from application logs stored across two different data sources. We demonstrated how to install ADA on an AWS account and deploy the demo components using AWS CDK. We created data products in ADA and configured the data products with the respective data sources using the ADA’s built-in data connectors. We demonstrated how to query the data products using standard SQL queries and generate insights on the log data. We also connected the Tableau Desktop client, a third-party BI product, to ADA and demonstrated how to build visualizations against the data products.

ADA automates the process of ingesting, transforming, governing, and querying diverse datasets and simplifying the lifecycle management of data. ADA’s pre-built connectors allow you to ingest data from diverse data sources. Software teams with basic knowledge of AWS products and services will be able to set up an operational data analytics platform in a few hours and provide secure access to the data. The data can then be easily and quickly queried using an intuitive and standalone web user interface.

Try out ADA today to easily manage and gain insights from data.


About the authors

Aparajithan Vaidyanathan is a Principal Enterprise Solutions Architect at AWS. He supports enterprise customers migrate and modernize their workloads on AWS cloud. He is a Cloud Architect with 23+ years of experience designing and developing enterprise, large-scale and distributed software systems. He specializes in Machine Learning & Data Analytics with focus on Data and Feature Engineering domain. He is an aspiring marathon runner and his hobbies include hiking, bike riding and spending time with his wife and two boys.

Rashim Rahman is a Software Developer based out of Sydney, Australia with 10+ years of experience in software development and architecture. He works primarily on building large scale open-source AWS solutions for common customer use cases and business problems. In his spare time, he enjoys sports and spending time with friends and family.

Hafiz Saadullah is a Principal Technical Product Manager at Amazon Web Services. Hafiz focuses on AWS Solutions, designed to help customers by addressing common business problems and use cases.

Let’s Architect! Security in software architectures

Post Syndicated from Luca Mezzalira original https://aws.amazon.com/blogs/architecture/lets-architect-security-in-software-architectures/

Security is fundamental for each product and service you are building with. Whether you are working on the back-end or the data and machine learning components of a system, the solution should be securely built.

In 2022, we discussed security in our post Let’s Architect! Architecting for Security. Today, we take a closer look at general security practices for your cloud workloads to secure both networks and applications, with a mix of resources to show you how to architect for security using the services offered by Amazon Web Services (AWS).

In this edition of Let’s Architect!, we share some practices for protecting your workloads from the most common attacks, introduce the Zero Trust principle (you can learn how AWS itself is implementing it!), plus how to move to containers and/or alternative approaches for managing your secrets.

A deep dive on the current security threat landscape with AWS

This session from AWS re:Invent, security engineers guide you through the most common threat vectors and vulnerabilities that AWS customers faced in 2022. For each possible threat, you can learn how it’s implemented by attackers, the weaknesses attackers tend to leverage, and the solutions offered by AWS to avert these security issues. We describe this as fundamental architecting for security: this implies adopting suitable services to protect your workloads, as well as follow architectural practices for security.

Take me to this re:Invent 2022 session!

Statistics about common attacks and how they can be launched

Statistics about common attacks and how they can be launched

Zero Trust: Enough talk, let’s build better security

What is Zero Trust? It is a security model that produces higher security outcomes compared with the traditional network perimeter model.

How does Zero Trust work in practice, and how can you start adopting it? This AWS re:Invent 2022 session defines the Zero Trust models and explains how to implement one. You can learn how it is used within AWS, as well as how any architecture can be built with these pillars in mind. Furthermore, there is a practical use case to show you how Delphix put Zero Trust into production.

Take me to this re:Invent 2022 session!

AWS implements the Zero Trust principle for managing interactions across different services

AWS implements the Zero Trust principle for managing interactions across different services

A deep dive into container security on AWS

Nowadays, it’s vital to have a thorough understanding of a container’s underlying security layers. AWS services, like Amazon Elastic Kubernetes Service and Amazon Elastic Container Service, have harnessed these Linux security-layer protections, keeping a sharp focus on the principle of least privilege. This approach significantly minimizes the potential attack surface by limiting the permissions and privileges of processes, thus upholding the integrity of the system.

This re:Inforce 2023 session discusses best practices for securing containers for your distributed systems.

Take me to this re:Inforce 2023 session!

Fundamentals and best practices to secure containers

Fundamentals and best practices to secure containers

Migrating your secrets to AWS Secrets Manager

Secrets play a critical role in providing access to confidential systems and resources. Ensuring the secure and consistent management of these secrets, however, presents a challenge for many organizations.

Anti-patterns observed in numerous organizational secrets management systems include sharing plaintext secrets via unsecured means, such as emails or messaging apps, which can allow application developers to view these secrets in plaintext or even neglect to rotate secrets regularly. This detailed guidance walks you through the steps of discovering and classifying secrets, plus explains the implementation and migration processes involved in transferring secrets to AWS Secrets Manager.

Take me to this AWS Security Blog post!

An organization's perspectives and responsibilities when building a secrets management solution

An organization’s perspectives and responsibilities when building a secrets management solution

Conclusion

We’re glad you joined our conversation on building secure architectures! Join us in a couple of weeks when we’ll talk about cost optimization on AWS.

To find all the blogs from this series, visit the Let’s Architect! list of content on the AWS Architecture Blog.

Cost considerations and common options for AWS Network Firewall log management

Post Syndicated from Sharon Li original https://aws.amazon.com/blogs/security/cost-considerations-and-common-options-for-aws-network-firewall-log-management/

When you’re designing a security strategy for your organization, firewalls provide the first line of defense against threats. Amazon Web Services (AWS) offers AWS Network Firewall, a stateful, managed network firewall that includes intrusion detection and prevention (IDP) for your Amazon Virtual Private Cloud (VPC).

Logging plays a vital role in any firewall policy, as emphasized by the National Institute of Standards and Technology (NIST) Guidelines on Firewalls and Firewall Policy. Logging enables organizations to take proactive measures to help prevent and recover from failures, maintain proper firewall security configurations, and gather insights for effectively responding to security incidents.

Determining the optimal logging approach for your organization should be approached on a case-by-case basis. It involves striking a balance between your security and compliance requirements and the costs associated with implementing solutions to meet those requirements.

This blog post walks you through logging configuration best practices, discusses three common architectural patterns for Network Firewall logging, and provides guidelines for optimizing the cost of your logging solution. This information will help you make a more informed choice for your organization’s use case.

Stateless and stateful rules engines logging

When discussing Network Firewall best practices, it’s essential to understand the distinction between stateful and stateless rules. Note that stateless rules don’t support firewall logging, which can make them difficult to work with in use cases that depend on logs.

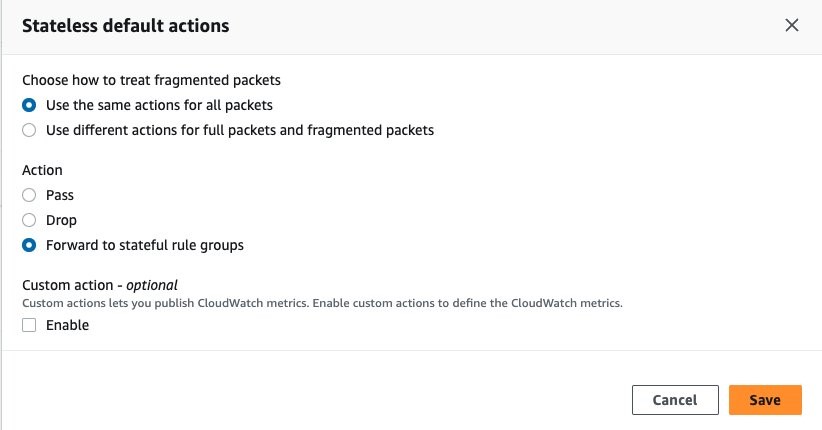
To verify that traffic is forwarded to the stateful inspection engine that generates logs, you can add a custom-defined stateless rule group that covers the traffic you need to monitor, or you can set a default action for stateless traffic to be forwarded to stateful rule groups in the firewall policy, as shown in the following figure.

Figure 1: Set up stateless default actions to forward to stateful rule groups

Figure 1: Set up stateless default actions to forward to stateful rule groups

Alert logs and flow logs

Network Firewall provides two types of logs:

  • Alert — Sends logs for traffic that matches a stateful rule whose action is set to Alert or Drop.
  • Flow — Sends logs for network traffic that the stateless engine forwards to the stateful rules engine.

To grasp the use cases of alert and flow logs, let’s begin by understanding what a flow is from the view of the firewall. For the network firewall, network flow is a one-way series of packets that share essential IP header information. It’s important to note that the Network Firewall flow log differs from the VPC flow log, as it captures the network flow from the firewall’s perspective and it is summarized in JSON format.

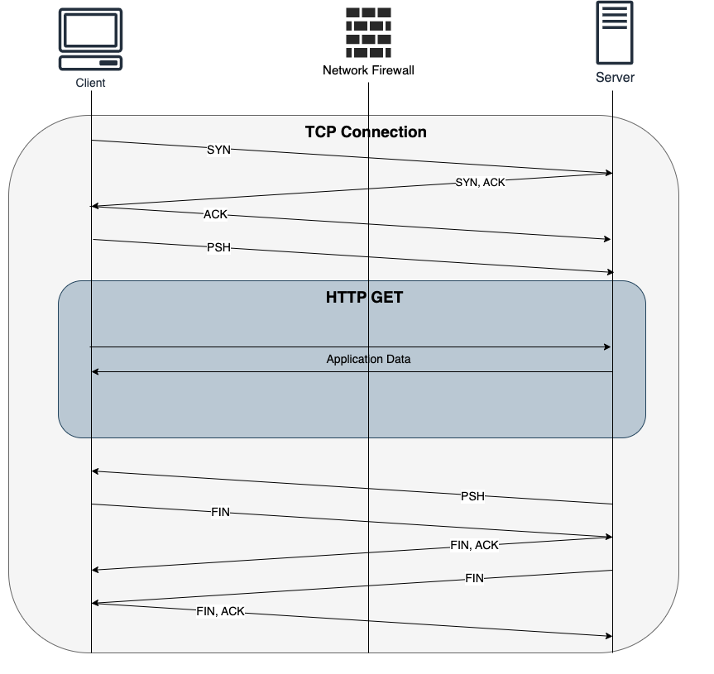
For example, the following sequence shows how an HTTP request passes through the Network Firewall.

Figure 2: HTTP request passes through Network Firewall

Figure 2: HTTP request passes through Network Firewall

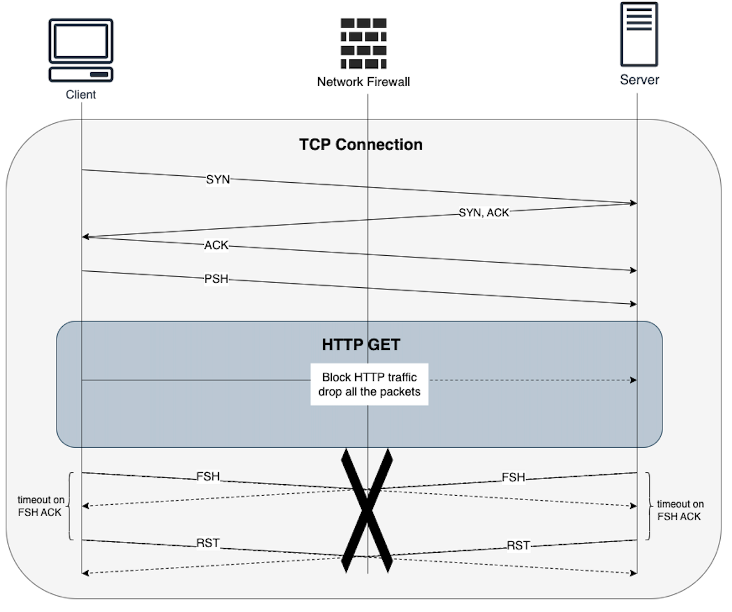
When you’re using a stateful rule to block egress HTTP traffic, the TCP connection will be established initially. When an HTTP request comes in, it will be evaluated by the stateful rule. Depending on the rule’s action, the firewall may send a TCP reset to the sender when a Reject action is configured, or it may drop the packets to block them if a Drop action is configured. In the case of a Drop action, shown in Figure 3, the Network Firewall decides not to forward the packets at the HTTP layer, and the closure of the connection is determined by the TCP timers on both the client and server sides.

Figure 3: HTTP request blocked by Network Firewall

Figure 3: HTTP request blocked by Network Firewall

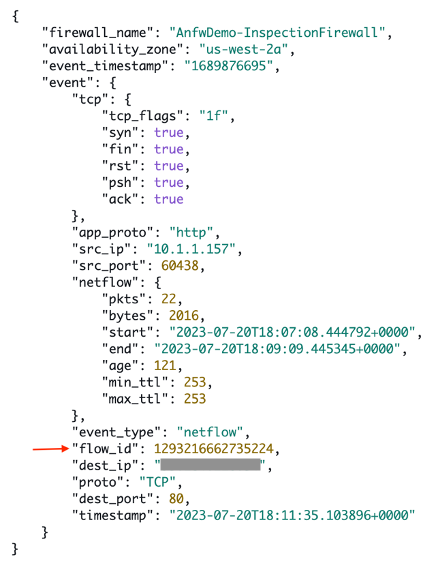
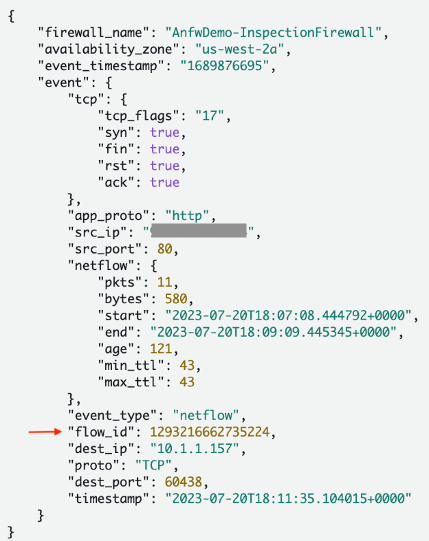
In the given example, the Network Firewall generates a flow log that provides information like IP addresses, port numbers, protocols, timestamps, number of packets, and bytes of the traffic. However, it doesn’t include details about the stateful inspection, such as whether the traffic was blocked or allowed.

Figure 4 shows the inbound flow log.

Figure 4: Inbound flow log

Figure 4: Inbound flow log

Figure 5 shows the outbound flow log.

Figure 5: Outbound flow log

Figure 5: Outbound flow log

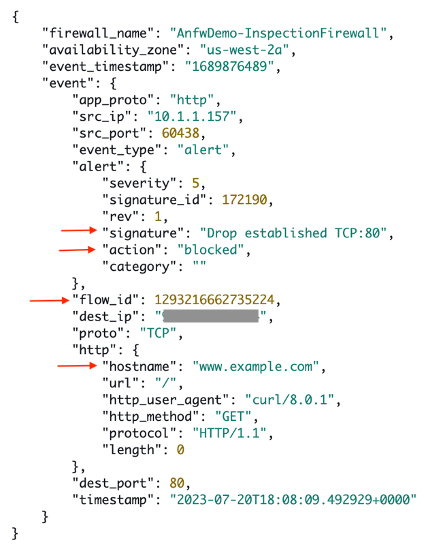
The alert log entry complements the flow log by containing stateful inspection details. The entry includes information about whether the traffic was allowed or blocked and also provides the hostname associated with the traffic. This additional information enhances the understanding of network activities and security events, as shown in Figure 6.

Figure 6: Alert log

Figure 6: Alert log

In summary, flow logs provide stateless information and are valuable for identifying trends, like monitoring IP addresses that transmit the most data over time in your network. On the other hand, alert logs contain stateful inspection details, making them helpful for troubleshooting and threat hunting purposes.

Keep in mind that flow logs can become excessive. When you’re forwarding traffic to a stateful inspection engine, flow logs capture the network flows crossing your Network Firewall endpoints. Because log volume affects overall costs, it’s essential to choose the log type that suits your use case and security needs. If you don’t need flow logs for traffic flow trends, consider only enabling alert logs to help reduce expenses.

Effective logging with alert rules

When you write stateful rules using the Suricata format, set the alert rule to be evaluated before the pass rule to log allowed traffic. Be aware that:

  • You must enable strict rule evaluation order to allow the alert rule to be evaluated before the pass rule. Otherwise the order of evaluation by default is pass rules first, then drop, then alert. The engine stops processing rules when it finds a match.
  • When you use pass rules, it’s recommended to add a message to remind anyone looking at the policy that these rules do not generate messages. This will help when developing and troubleshooting your rules.

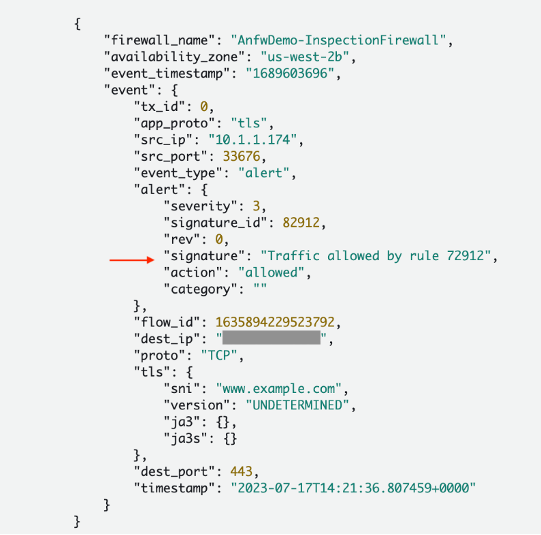
For example, the rules below will allow traffic to a target with a specific Server Name Indication (SNI) and log the traffic that was allowed. As you can see in the pass rule, it includes a message to remind the firewall policy maker that pass rules don’t alert. The alert rule evaluated before the pass rule logs a message to tell the log viewer which rule allows the traffic. This way you can see allowed domains in the logs.


alert tls $HOME_NET any -> $EXTERNAL_NET any (tls.sni; content:"www.example.com"; nocase; startswith; endswith; msg:"Traffic allowed by rule 72912"; flow:to_server, established; sid:82912;)
pass tls $HOME_NET any -> $EXTERNAL_NET any (tls.sni; content:"www.example.com"; nocase; startswith; endswith; msg:"Pass rules don't alert"; flow:to_server, established; sid:72912;)

This way you can see allowed domains in the alert logs.

Figure 7: Allowed domain in the alert log

Figure 7: Allowed domain in the alert log

Log destination considerations

Network Firewall supports the following log destinations:

You can select the destination that best fits your organization’s processes. In the next sections, we review the most common pattern for each log destination and walk you through the cost considerations, assuming a scenario in which you generate 15 TB Network Firewall logs in us-east-1 Region per month.

Amazon S3

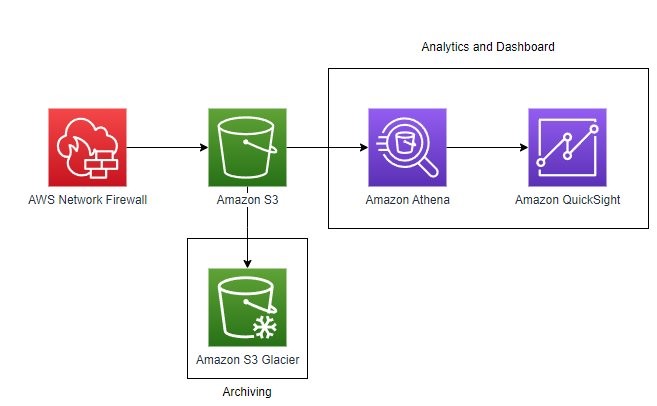
Network Firewall is configured to inspect traffic and send logs to an S3 bucket in JSON format using Amazon CloudWatch vended logs, which are logs published by AWS services on behalf of the customer. Optionally, logs in the S3 bucket can then be queried using Amazon Athena for monitoring and analysis purposes. You can also create Amazon QuickSight dashboards with an Athena-based dataset to provide additional insight into traffic patterns and trends, as shown in Figure 8.

Figure 8: Architecture diagram showing AWS Network Firewall logs going to S3

Figure 8: Architecture diagram showing AWS Network Firewall logs going to S3

Cost considerations

Note that Network Firewall logging charges for the pattern above are the combined charges for CloudWatch Logs vended log delivery to the S3 buckets and for using Amazon S3.

CloudWatch vended log pricing can influence overall costs significantly in this pattern, depending on the amount of logs generated by Network Firewall, so it’s recommended that your team be aware of the charges described in Amazon CloudWatch Pricing – Amazon Web Services (AWS). From the CloudWatch pricing page, navigate to Paid Tier, choose the Logs tab, select your Region and then under Vended Logs, see the information for Delivery to S3.

For Amazon S3, go to Amazon S3 Simple Storage Service Pricing – Amazon Web Services, choose the Storage & requests tab, and view the information for your Region in the Requests & data retrievals section. Costs will be dependent on storage tiers and usage patterns and the number of PUT requests to S3.

In our example, 15 TB is converted and compressed to approximately 380 GB in the S3 bucket. The total monthly cost in the us-east-1 Region is approximately $3800.

Long-term storage

There are additional features in Amazon S3 to help you save on storage costs:

Analytics and reporting

Athena and QuickSight can be used for analytics and reporting:

  • Athena can perform SQL queries directly against data in the S3 bucket where Network Firewall logs are stored. In the Athena query editor, a single query can be run to set up the table that points to the Network Firewall logging bucket.
  • After data is available in Athena, you can use Athena as a data source for QuickSight dashboards. You can use QuickSight to visualize data from your Network Firewall logs, taking advantage of AWS serverless services.
  • Please note that using Athena to scan firewall data in S3 might increase costs, as can the number of authors, users, reports, alerts, and SPICE data used in QuickSight.

Amazon CloudWatch Logs

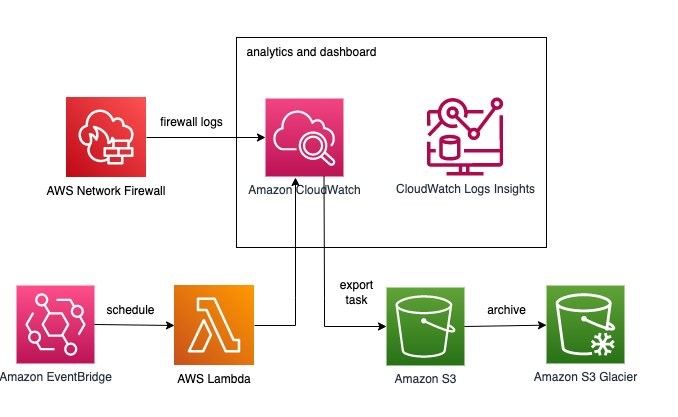
In this pattern, shown in Figure 9, Network Firewall is configured to send logs to Amazon CloudWatch as a destination. Once the logs are available in CloudWatch, CloudWatch Log Insights can be used to search, analyze, and visualize your logs to generate alerts, notifications, and alarms based on specific log query patterns.

Figure 9: Architecture diagram using CloudWatch for Network Firewall Logs

Figure 9: Architecture diagram using CloudWatch for Network Firewall Logs

Cost considerations

Configuring Network Firewall to send logs to CloudWatch incurs charges based on the number of metrics configured, metrics collection frequency, the number of API requests, and the log size. See Amazon CloudWatch Pricing for additional details.

In our example of 15 TB logs, this pattern in the us-east-1 Region results in approximately $6900.

CloudWatch dashboards offers a mechanism to create customized views of the metrics and alarms for your Network Firewall logs. These dashboards incur an additional charge of $3 per month for each dashboard.

Contributor Insights and CloudWatch alarms are additional ways that you can monitor logs for a pre-defined query pattern and take necessary corrective actions if needed. Contributor Insights are charged per Contributor Insights rule. To learn more, go to the Amazon CloudWatch Pricing page, and under Paid Tier, choose the Contributor Insights tab. CloudWatch alarms are charged based on the number of metric alarms configured and the number of CloudWatch Insights queries analyzed. To learn more, navigate to the CloudWatch pricing page and navigate to the Metrics Insights tab.

Long-term storage

CloudWatch offers the flexibility to retain logs from 1 day up to 10 years. The default behavior is never expire, but you should consider your use case and costs before deciding on the optimal log retention period. For cost optimization, the recommendation is to move logs that need to be preserved long-term or for compliance from CloudWatch to Amazon S3. Additional cost optimization can be achieved through S3 tiering. To learn more, see Managing your storage lifecycle in the S3 User Guide.

AWS Lambda with Amazon EventBridge, as shown in the following sample code, can be used to create an export task to send logs from CloudWatch to Amazon S3 based on an event rule, pattern matching rule, or scheduled time intervals for long-term storage and other use cases.

import boto3
import os
import datetime


GROUP_NAME = "/AnfwDemo/Anfw/Alert"
DESTINATION_BUCKET = "cwexportlogs-blog"
PREFIX = "network-logs"
NDAYS = 1
nDays = int(NDAYS)

currentTime = datetime.datetime.now()
StartDate = currentTime - datetime.timedelta(days=nDays)
EndDate = currentTime - datetime.timedelta(days=nDays - 1)


fromDate = int(StartDate.timestamp() * 1000)
toDate = int(EndDate.timestamp() * 1000)

BUCKET_PREFIX = os.path.join(PREFIX, StartDate.strftime('%Y{0}%m{0}%d').format(os.path.sep))

def lambda_handler(event, context):
    client = boto3.client('logs')
    response = client.create_export_task(
         logGroupName=GROUP_NAME,
         fromTime=fromDate,
         to=toDate,
         destination=DESTINATION_BUCKET,
         destinationPrefix=BUCKET_PREFIX
        )
    print(response)

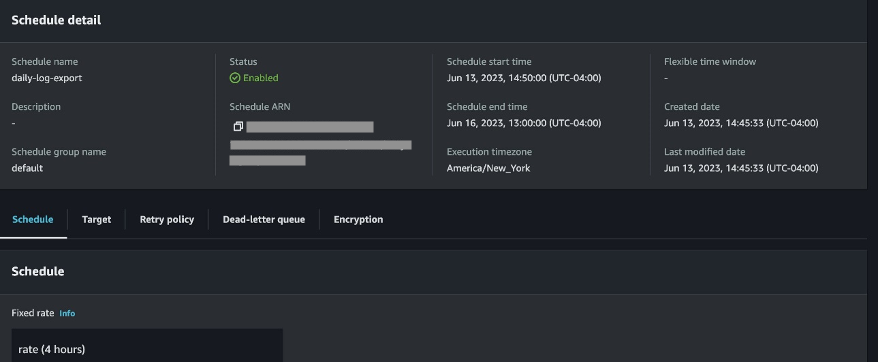
Figure 10 shows how EventBridge is configured to trigger the Lambda function periodically.

Figure 10: EventBridge scheduler for daily export of CloudWatch logs

Figure 10: EventBridge scheduler for daily export of CloudWatch logs

Analytics and reporting

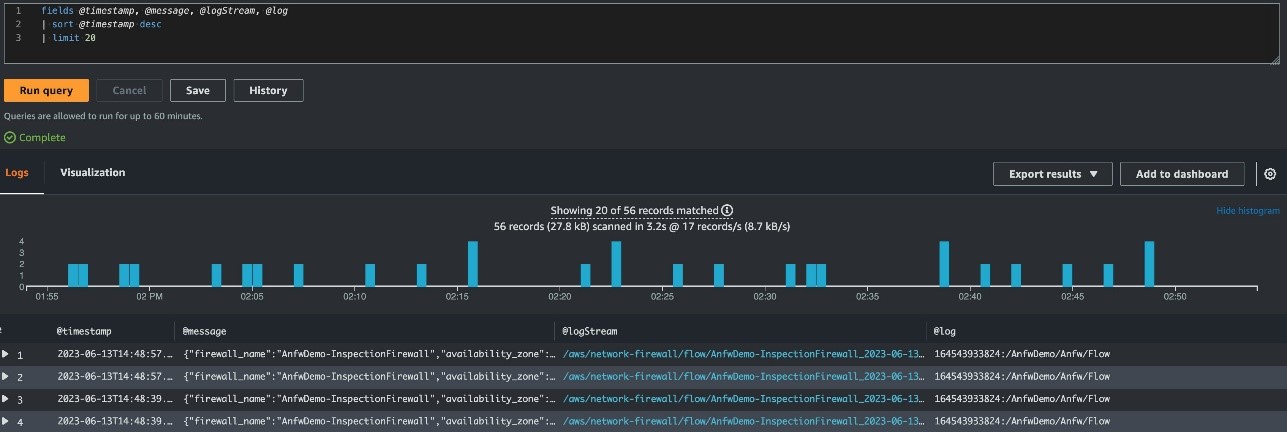
CloudWatch Insights offers a rich query language that you can use to perform complex searches and aggregations on your Network Firewall log data stored in log groups as shown in Figure 11.

The query results can be exported to CloudWatch dashboard for visualization and operational decision making. This will help you quickly identify patterns, anomalies, and trends in the log data to create the alarms for proactive monitoring and corrective actions.

Figure 11: Network Firewall logs ingested into CloudWatch and analyzed through CloudWatch Logs Insights

Figure 11: Network Firewall logs ingested into CloudWatch and analyzed through CloudWatch Logs Insights

Amazon Kinesis Data Firehose

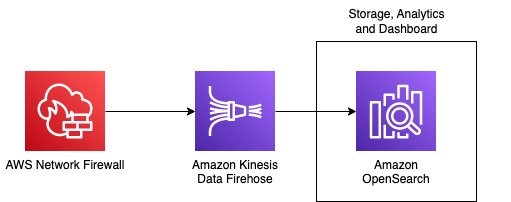
For this destination option, Network Firewall sends logs to Amazon Kinesis Data Firehose. From there, you can choose the destination for your logs, including Amazon S3, Amazon Redshift, Amazon OpenSearch Service, and an HTTP endpoint that’s owned by you or your third-party service providers. The most common approach for this option is to deliver logs to OpenSearch, where you can index log data, visualize, and analyze using dashboards as shown in Figure 12.

In the blog post How to analyze AWS Network Firewall logs using Amazon OpenSearch Service, you learn how to build network analytics and visualizations using OpenSearch in detail. Here, we discuss only some cost considerations of using this pattern.

Figure 12: Architecture diagram showing AWS Network Firewall logs going to OpenSearch

Figure 12: Architecture diagram showing AWS Network Firewall logs going to OpenSearch

Cost considerations

The charge when using Kinesis Data Firehose as a log destination is for CloudWatch Logs vended log delivery. Ingestion pricing is tiered and billed per GB ingested in 5 KB increments. See Amazon Kinesis Data Firehose Pricing under Vended Logs as source. There are no additional Kinesis Data Firehose charges for delivery unless optional features are used.

For 15 TB of log data, the cost of CloudWatch delivery and Kinesis Data Firehose ingestion is approximately $5400 monthly in the us-east-1 Region.

The cost for Amazon OpenSearch Service is based on three dimensions:

  • Instance hours, which are the number of hours that an instance is available to you for use
  • The amount of storage you request
  • The amount of data transferred in and out of OpenSearch Service

Storage pricing depends on the storage tier and type of instance that you choose. See pricing examples of using OpenSearch Service. When creating your OpenSearch domain, see Sizing Amazon OpenSearch Service domains to help you right-size your OpenSearch domain. Other cost optimization best practices include choosing the right storage tier and using AWS Graviton2 instances to improve performance.

For instance, allocating approximately 15 TB of UltraWarm storage in the us-east-1 Region will result in a monthly cost of $4700. Keep in mind that in addition to storage costs, you should also account for compute instances and hot storage.

In short, the estimated total cost for log ingestion and storage in the us-east-1 Region for this pattern is at least $10,100.

Leveraging OpenSearch will enable you to promptly investigate, detect, analyze, and respond to security threats.

Summary

The following table shows a summary of the expenses and advantages of each solution. Since storing logs is a fundamental aspect of log management, we use the monthly cost of using Amazon S3 as the log delivery destination as our baseline when making these comparisons.

Pattern Log delivery and storage cost as a multiple of the baseline cost Functionalities Dependencies
Amazon S3, Athena, QuickSight 1 The most economical option for log analysis. The solution requires security engineers to have a good analytics skillset. Familiarity with Athena query and query running time will impact the incident response time and the cost.
Amazon CloudWatch 1.8 Log analysis, dashboards, and reporting can be implemented from the CloudWatch console. No additional service is needed. The solution requires security engineers to be comfortable with CloudWatch Logs Insights query syntax. The CloudWatch Logs Insights query will impact the incident response time and the cost.
Amazon Kinesis Data Firehose, OpenSearch 2.7+ Investigate, detect, analyze, and respond to security threats quickly with OpenSearch. The solution requires you to invest in managing the OpenSearch cluster.

You have the flexibility to select distinct solutions for flow logs and alert logs based on your requirements. For flow logs, opting for Amazon S3 as the destination offers a cost-effective approach. On the other hand, for alert logs, using the Kinesis Data Firehose and OpenSearch solution allows for quick incident response. Minimizing the time required to address ongoing security challenges can translate to reduced business risk at different costs.

Conclusion

This blog post has explored various patterns for Network Firewall log management, highlighting the cost considerations associated with each approach. While cost is a crucial factor in designing an efficient log management solution, it’s important to consider other factors such as real-time requirements, solution complexity, and ownership. Ultimately, the key is to adopt a log management pattern that aligns with your operational needs and budgetary constraints. Network security is an iterative practice, and by optimizing your log management strategy, you can enhance your overall security posture while effectively managing costs.

For more information about working with Network Firewall, see What is AWS Network Firewall?

 
If you have feedback about this post, submit comments in the Comments section below. If you have questions about this post, contact AWS Support.

Want more AWS Security news? Follow us on Twitter.

Sharon Li

Sharon Li

Sharon is an Enterprise Solutions Architect at Amazon Web Services based in Boston, with a passion for designing and building secure workloads on AWS. Prior to her current role at AWS, Sharon worked as a software development engineer at Amazon, where she played a key role in bringing security into the development process.

Larry Tewksbury

Larry Tewksbury

Larry is an AWS Technical Account Manager based in New Hampshire. He works with enterprise customers in the Northeast to understand, scale, and optimize their cloud operations. Outside of work, he enjoys spending time with his family, hiking, and tech-based hobbies.

Shashidhar Makkapati

Shashidhar Makkapati

Shashidhar is an Enterprise Solutions Architect at Amazon Web Services, based in Charlotte, NC. With over two decades of experience as an enterprise architect, he has a keen focus on cloud adoption and digital transformation in the financial services industry. Shashidhar supports enterprise customers in the US Northeast. In his free time, he enjoys reading, traveling, and spending time with his family.

The art and science of data product portfolio management

Post Syndicated from Faris Haddad original https://aws.amazon.com/blogs/big-data/the-art-and-science-of-data-product-portfolio-management/

This post is the first in a series dedicated to the art and science of practical data mesh implementation (for an overview of data mesh, read the original whitepaper The data mesh shift). The series attempts to bridge the gap between the tenets of data mesh and its real-life implementation by deep-diving into the functional and non-functional capabilities essential to a working operating model, laying out the decisions that need to be made for each capability, and describing the key business and technical processes required to implement them. Taken together, the posts in this series lay out some possible operating models for data mesh within an organization.

Kudzu

Kudzu—or kuzu (クズ)—is native to Japan and southeast China. First introduced to the southeastern United States in 1876 as a promising solution for erosion control, it now represents a cautionary tale about unintended consequences, as Kudzu’s speed of growth outcompetes everything from native grasses to tree systems by growing over and shading them from the sunlight they need to photosynthesize—eventually leading to species extinction and loss of biodiversity. The story of Kudzu offers a powerful analogy to the dangers and consequences of implementing data mesh architectures without fully understanding or appreciating how they are intended to be used. When the “Kudzu” of unmanaged pseudo-data products (methods of sharing data that masquerade as data products while failing to fulfill the myriad obligations associated with them) has overwhelmed the local ecosystem of true data products, eradication is costly and prone to failure, and can represent significant wasted effort and resources, as well as lost time.

Desert

While Kudzu was taking over the south in the 1930s, desertification caused by extensive deforestation was overwhelming the Midwest, with large tracts of land becoming barren and residents forced to leave and find other places to make a living. In the same way, overly restrictive data governance practices that either prevent data products from taking root at all, or pare them back too aggressively (deforestation), can over time create “data deserts” that drive both the producers and consumers of data within an organization to look elsewhere for their data needs. At the same time, unstructured approaches to data mesh management that don’t have a vision for what types of products should exist and how to ensure they are developed are at high risk of creating the same effect through simple neglect. This is due to a  common misconception about data mesh as a data strategy, which is that it is effectively self-organizing—meaning that once presented with the opportunity, data owners within the organization will spring to the responsibilities and obligations associated with publishing high-quality data products. In reality, the work of a data producer is often thankless, and without clear incentive strategies, organizations may end up with data deserts that create more data governance issues as producers and consumers go elsewhere to seek out the data they need to perform work.

Bonsai

Bonsai (盆栽) is an art form originating from an ancient Chinese tradition called penjing (盆景), and later shaped by the minimalist teachings of Zen Buddhism into the practice we know and recognize today. The patient practice of Bonsai offers useful analogies to the concepts and processes required to avoid the chaos of Kudzu as well as the specter of organizational data deserts. Bonsai artists carefully observe the naturally occurring buds that are produced by the tree and encourage those that add to the overall aesthetics of the tree, while pruning those that don’t work well with their neighbors. The same ideas apply equally well to data products within a data mesh—by encouraging the growth and adoption of those data products that add value to our data mesh, and continuously pruning those that do not, we maximize the value and sustainability of our data mesh implementations. In a similar vein, Bonsai artists must balance their vision for the shape of the tree with a respect for the natural characteristics and innate structure of the species they have chosen to work with—to ignore the biology of the tree would be disastrous to the longevity of the tree, as well as to the quality of the art itself. In the same way, organizations seeking to implement successful data mesh strategies must respect the nature and structure (legal, political, commercial, technology) of their organizations in their implementation.

Of the key capabilities proposed for the implementation of a sustainable data mesh operating model, the one that is most relevant to the problems we’ve described—and explore later in this post—is data product portfolio management.

Overview of data product portfolio management

Data mesh architectures are, by their nature, ideal for implementation within federated organizations, with decentralized ownership of data and clear legal, regulatory, or commercial boundaries between entities or lines of business. The same organizational characteristics that make data mesh architectures valuable, however, also put them at risk of turning into one of the twin nightmares of Kudzu or data deserts.

To define the shape and nature of an organizational data mesh, a number of key questions need to be answered, including but not limited to:

  • What are the key data domains within the organization? What are the key data products within these domains needed to solve current business problems? How do we iterate on this discovery process to add value while we are mapping our domains?
  • Who are the consumers in our organization, and what logical, regulatory, physical, or commercial boundaries might separate them from producers and their data products?
  • How do we encourage the development and maintenance of key data products in a decentralized organization?
  • How do we monitor data products against their SLAs, and ensure alerting and escalation on failure so that the organization is protected from bad data?
  • How do we enable those we see as being autonomous producers and consumers with the right skills, the right tools, and the right mindset to actually want to (and be able to) take more ownership of independently publishing data as a product and consuming it responsibly?
  • What is the lifecycle of a data product? When do new data products get created, and who is allowed to create them? When are data products deprecated, and who is accountable for the consequences to their consumers?
  • How do we define “risk” and “value” in the context of data products, and how can we measure this? Whose responsibility is it to justify the existence of a given data product?

To answer questions such as these and plan accordingly, organizations must implement data product portfolio management (DPPM). DPPM does not exist in a vacuum—by its nature, DPPM is closely related to and interdependent with enterprise architecture practices like business capability management and project portfolio management. DPPM itself may therefore also be considered, in part, an enterprise architecture practice.

As an enterprise architecture practice, DPPM is responsible for its implementation, which should reside within a function whose remit is appropriately global and cross-functional. This may be within the CDO office for those organizations that have a CDO or equivalent central data function, or the enterprise architecture team in organizations that do not.

Goals of DPPM

The goals of DPPM can be summarized as follows:

  • Protect value – DPPM protects the value of the organizational data strategy by developing, implementing, and enforcing frameworks to measure the contribution of data products to organizational goals in objective terms. Examples may include associated revenue, savings, or reductions in operational losses. Earlier in their lifecycle, data products may be measured by alternative metrics, including adoption (number of consumers) and level of activity (releases, interaction with consumers, and so on). In the pursuit of this goal, the DPPM capability is accountable for engaging with the business to continuously priorities where data as a product can add value and align delivery priority accordingly. Strategies for measuring value and prioritizing data products are explored later in this post.
  • Manage risk – All data products introduce risk to the organization—risk of wasted money and effort through non-adoption, risk of operational loss associated with improper use, and risk of failure on the part of the data product to meet requirements on availability, completeness, or quality. These risks are exacerbated in the case of proliferation of low-quality or unsupervised data products. DPPM seeks to understand and measure these risks on an individual and aggregated basis. This is a particularly challenging goal because what constitutes risk associated with the existence of a particular data product is determined largely by its consumers and is likely to change over time (though like entropy, is only ever likely to increase).
  • Guide evolution – The final goal of DPPM is to guide the evolution of the data product landscape to meet overarching organizational data goals, such as mutually exclusive or collectively exhaustive domains and data products, the identification and enablement of single-threaded ownership of product definitions, or the agile inclusion of new sources of data and creation of products to serve tactical or strategic business goals. Some principles for the management of data mesh evolution, and the evaluation of data products against organizational goals, are explored later in this post.

Challenges of DPPM

In this section, we explore some of the challenges of DPPM, and the pragmatic ways some of these challenges could be addressed.

Infancy

Data mesh as a concept is still relatively new. As such, there is little standardization associated with practical operating models for building and managing data mesh architectures, and no access to fully fledged out-of-the-box reference operating models, frameworks, or tools to support the practice of DPPM.

Some elements of DPPM are supported in disparate tools (for example, some data catalogs include basic community features that contribute to measuring value), but not in a holistic way. Over time, standardization of the processes associated with DPPM will likely occur as a side-effect of commoditization, driven by the popularity and adoption of new services that take on and automate more of the undifferentiated heavy lifting associated with mesh supervision. In the meantime, however, organizations adopting data mesh architectures are left largely to their own devices around how to operate them effectively.

Resistance

The purest expression of democracy is anarchy, and the more federated an organization is (itself a supporting factor in choosing data mesh architectures), the more resistance may be observed to any forms of centralized governance. This is a challenge for DPPM, because in some way it must come together in one place. Just as the Bonsai artist knows the vision for the entire tree, there must be a cohesive vision for and ability to guide the evolution of a data mesh, no matter how broadly federated and autonomous individual domains or data products might be.

Balancing this with the need to respect the natural shape (and culture) of an organization, however, requires organizations that implement DPPM to think about how to do so in a way that doesn’t conflict with the reality of the organization. This might mean, for example, that DPPM may need to happen at several layers—at minimum within data domains, possibly within lines of business, and then at an enterprise level through appropriate data committees, guilds, or other structures that bring stakeholders together. All of this complicates the processes and collaboration needed to perform DPPM effectively.

Maturity

Data mesh architectures, and therefore DPPM, presume relatively high levels of data maturity within an organization—a clear data strategy, understanding of data ownership and stewardship, principles and policies that govern the use of data, and a moderate-to-high level of education and training around data within the organization. A lack of data maturity within the organization, or a weak or immature enterprise architecture function, will face significant hurdles in the implementation of any data mesh architecture, let alone a strong and useful DPPM practice.

In reality, however, data maturity is not uniform across organizations. Even in seemingly low-maturity organizations, there are often teams who are more mature and have a higher appetite to engage. By leaning into these teams and showing value through them first, then using them as evangelists, organizations can gain maturity while benefitting earlier from the advantages of data mesh strategies.

The following sections explore the implementation of DPPM along the lines of people, process, and technology, as well as describing the key characteristics of data products—scope, value, risk, uniqueness, and fitness—and how they relate to data mesh practices.

People

To implement DPPM effectively, a wide variety of stakeholders in the organization may need to be involved in one capacity or another. The following table suggests some key roles, but it’s up to an individual organization to determine how and if these map to their own roles and functions.

Function RACI Role Responsibility
Senior Leadership A Chief Data Officer Ultimately accountable for organizational data strategy and implementation. Approves changes to DPPM principles and operating model. Acts as chair of, and appoints members to, the data council.
. R Data Council** Stakeholder body representing organizational governance around data strategy. Acts as steering body for the governance of DPPM as a practice (KPI monitoring, maturity assessments, auditing, and so on). Approves changes to guidelines and methodologies. Approves changes to data product portfolio (discussed later in this post). Approves and governs centrally funded and prioritized data product development activities.
Enterprise Architecture AR Head of Enterprise Architecture Responsible for development and enforcement of data strategy. Accountable and responsible for the design and implementation of DPPM as an organizational capability.
. R Domain Architect Responsible for the implementing screening, data product analysis, periodic evaluation, and optimal portfolio selection practices. Responsible for the development of methodologies and their selection criteria.
Legal & Compliance C Legal & Compliance Officer Consults on permissibility of data products with reference to local regulation. Consults on permissibility of data sharing with reference to local regulation or commercial agreements.
. C Data Privacy Officer Consults on permissibility of data use with reference to local data privacy law. Consults on permissibility of cross-entity or border data sharing with reference to data privacy law.
Information Security RC Information Security Officer Consults on maturity assessments (discussed later in this post) for information security-relevant data product capabilities. Approves changes to data product technology architecture. Approves changes to IAM procedures relating to data products.
Business Functions A Data Domain Owner Ultimately accountable for the appropriate use of domain data, as well as its quality and availability. Accountable for domain data products. Approves changes to the domain data model and domain data product portfolio.
c R Data Domain Steward Responsible for implementing data domain responsibilities, including operational (day-to-day) governance of domain data products. Approves use of domain data in new data products, and performs regular (such as yearly) attestation of data products using domain data.
. A Data Owner Ultimately accountable for the appropriate use of owned data (for example, CRM data), as well as its quality and availability.
. R Data Steward Responsible for implementing data responsibilities. Approves use of owned data in new data products, and performs regular (such as yearly) attestation of data products using owned data.
. AR Data Product Owner Accountable and responsible for the design, development, and delivery of data products against their stated SLOs. Contributes to data product analysis and portfolio adjustment practices for own data products.

** The data council typically consists of permanent representatives from each function (data domain owners), enterprise architecture, and the chief data officer or equivalent.

Process

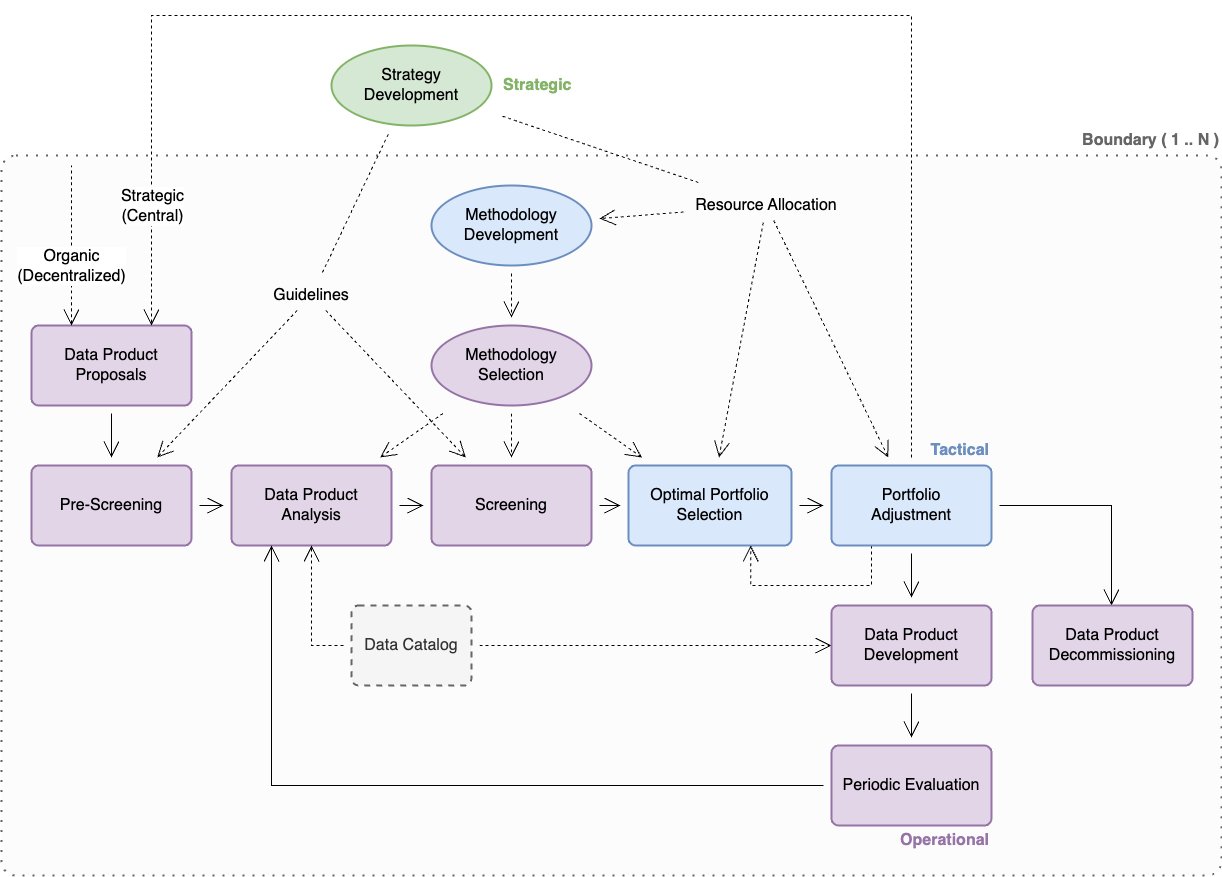
The following diagram illustrates the strategic, tactical, and operational practices associated with DPPM. Some considerations for the implementation of these practices is explored in more detail in this post, though their specific interpretation and implementation is dependent on the individual organization.

Boundaries

When reading this section, it’s important to bear in mind the impact of boundaries—although strategy development may be established as a global practice, other practices within DPPM must respect relevant organizational boundaries (which may be physical, geographical, operational, legal, commercial, or regulatory in nature). In some cases, the existence of boundaries may require some or all tactical and operational practices to be duplicated within each associated boundary. For example, an insurance company with a property and casualty legal entity in North America and a life entity in Germany may need to implement DPPM separately within each entity.

Strategy development

This practice deals with answering questions associated with the overall data mesh strategy, including the following:

  • The overall scope (data domains, participating entities, and so on) of the data mesh
  • The degree of freedom of participating entities in their definition and implementation of the data mesh (for example, a mesh of meshes vs. a single mesh)
  • The distribution of responsibilities for activities and capabilities associated with the data mesh (degree of democratization)
  • The definition and documentation of key performance indicators (KPIs) against which the data mesh should be governed (such as risk and value)
  • The governance operating model (including this practice)

Key deliverables include the following:

  • Organizational guidelines for operational processes around pre-screening and screening of data products
  • Well-defined KPIs that guide methodology development and selection for practices like data product analysis, screening, and optimal portfolio selection
  • Allocation of organizational resources (people, budget, time) to the implementation of tactical processes around methodology development, optimal portfolio selection, and portfolio adjustment

Key considerations

In this section, we discuss some key considerations for strategy development.

Data mesh structure

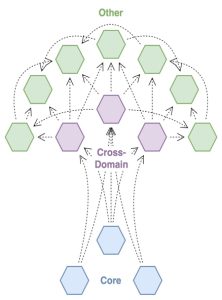
This diagram illustrates the analogous relationship between data products in a data mesh, and the structure of the mesh itself.

The following considerations relate to screening, data product analysis, and optimal portfolio selection.

  • Trunk (core data products) – Core data products are those that are central to the organization’s ability to function, and from which the majority of other data products are derived. These may be data products consumed in the implementation of key business activities, or associated with critical processes such as regulatory reporting and risk management. Organizational governance for these data products typically favors availability and data accuracy over agility.
  • Branch (cross-domain data products) – Cross-domain data products represent the most common cross-domain use cases for data (for example, joining customer data with product data). These data products may be widely used across business functions to support reporting and analytics, and—to a lesser extent—operational processes. Because these data products may consume a variety of sources, organizational governance may favor a balanced view on agility vs. reliability, accepting some degree of risk in return for being able to adapt to changes in data sources. Data product versioning can offer mitigation of risks associated with change.
  • Leaf (everything else) – These are the myriad data products that may arise within a data mesh, either as permanent additions to support individual teams and use cases or as temporary data products to fill data gaps or support time-limited initiatives. Because the number of these data products may be high and risks are typically limited to a single process or a small part of the organization, organizational governance typically favors a light touch and may prefer to govern through guidelines and best practices, rather than through active participation in the data product lifecycle.

Data products vs. data definitions

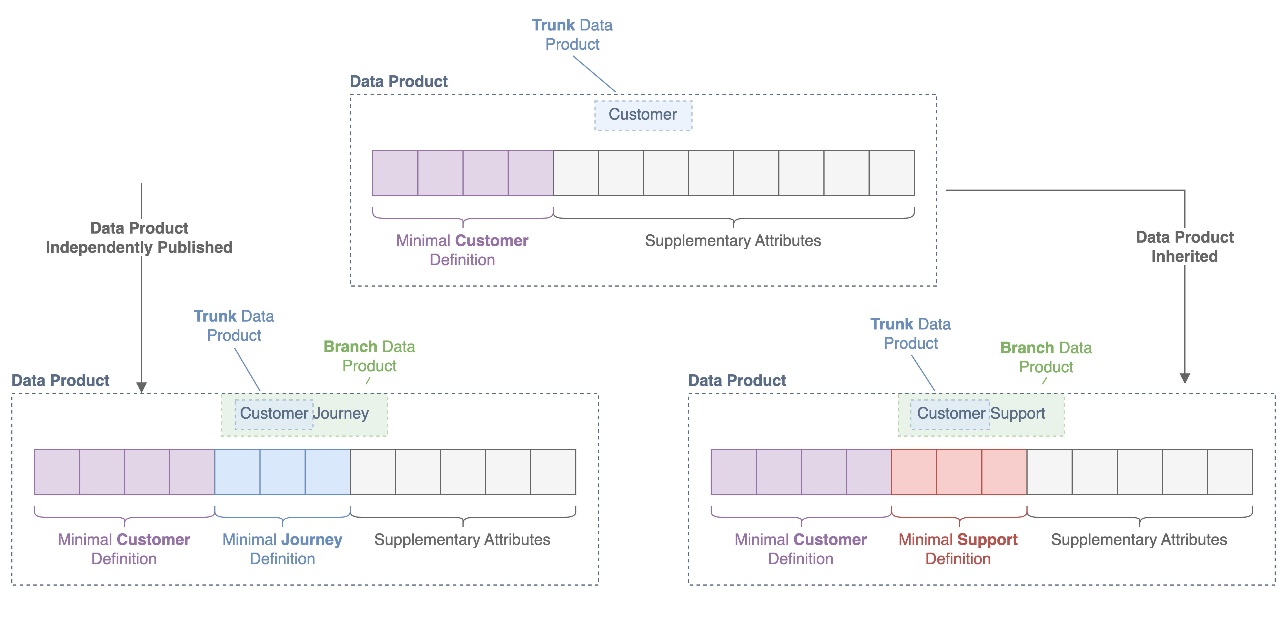
The following figure illustrates how data definitions are defined and inherited throughout the lineage of data products.

In a data mesh architecture, data products may inherit data from each other (one data product consumes another in its data pipeline) or independently publish data within (or related to) the same domain. For example, a customer data product may be inherited by a customer support data product, while another the customer journey data product may directly publish customer-relevant data from independent sources. When no standards are applied to how domain data attributes are used and published, data products even within the same data domain may lose interoperability because it becomes difficult or impossible to join them together for reporting or analytics purposes.

To prevent this, it can be useful to distinguish between data products and data definitions. Typically, organizations will select a single-threaded owner (often a data owner or steward, or a domain data owner or steward) who is responsible for defining minimal data definitions for common and reusable data entities within data domains. For example, a data owner responsible for the sales and marketing data domain may identify a customer data product as a reusable data entity within the domain and publish a minimal data definition that all producers of customer-relevant data must incorporate within their data products, to ensure that all data products associated with customer data are interoperable.

DPPM can assist in the identification and production of data definitions as part of its data product analysis activities, as well as enforce their incorporation as part of oversight of data product development.

Service management thinking

These considerations relate to data product analysis, periodic evaluation, and methodology selection.

Data products are services provided to the organization or externally to customers and partners. As such, it may make sense to adapt a service management framework like ITIL, in combination with the ITIL Maturity Model, for use in evaluating the fitness of data products for their scope and audience, as well as in describing the roles, processes, and acceptable technologies that should form the operating model for any data product.

At the operational level, the stakeholders required to implement each practice may change depending on the scope of the data product. For example, the release management practice for a core data product may require involvement of the data council, whereas the same practice for a team data product may only involve the team or functional head. To avoid creating decision-making bottlenecks, organizations should aim to minimize the number of stakeholders in each case and focus on single-threaded owners wherever possible.

The following table proposes a subset of capabilities and how they might be applied to data products of different scopes. Suggested target maturity levels, between 1 and 5, are included for each scope. (1= Initial, 5= Optimizing)

Target Maturity Data Product Scope.
4 – 5 3 – 4 2 – 3 2
Capability    Core
  Cross-Domain
  Function / Team
  Personal
Information Security Management X X X X
Knowledge Management X X X .
Release Management X X X .
Service-Level Management X X X .
Measurement and Reporting X X . .
Availability Management X X . .
Capacity and Performance Management X X . .
Incident Management X X . .
Monitoring and Event Management X X . .
Service Validation and Testing X X . .

Methodology development

This practice deals with the development of concrete, objective frameworks, metrics, and processes for the measurement of data product value and risk. Because the driving factors behind risk and value are not necessarily the same between products, it may be necessary to develop several methodologies or variants thereof.

Key deliverables include the following:

  • Well-defined frameworks for measuring risk and value of data products, as well as for determining the optimal portfolio of data products
  • Operationally feasible, measurable metrics associated with value and risk

Key considerations

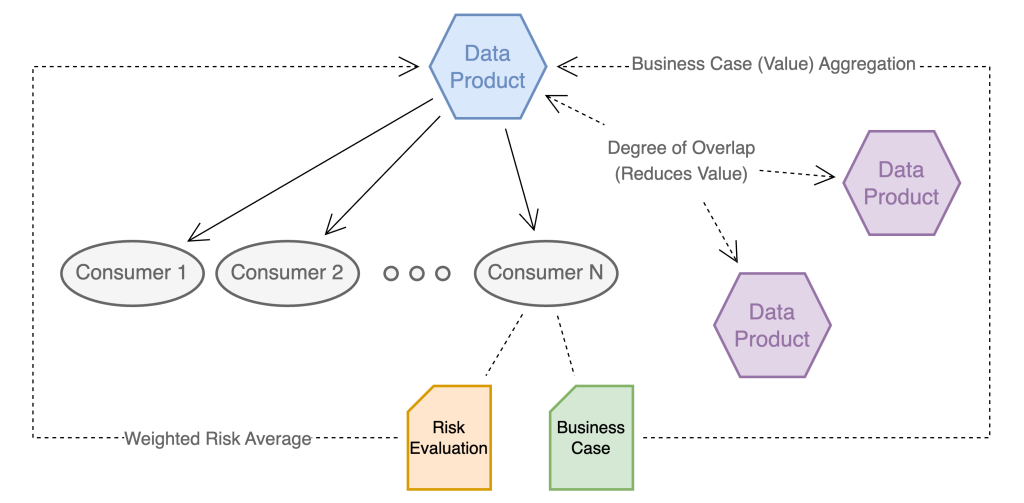
A key consideration for assessing data products is that of consumer value or risk vs. uniqueness. The following diagram illustrates how value and risk of a data product are driven by its consumers.

Data products don’t inherently present risk or add value, but rather indirectly pose—in an aggregated fashion—the risk and value created by their consumers.

In a consumer-centric value and risk model, governance of consumers ensures that all data use meets the following requirements:

  • Is associated with a business case justifying the use of data (for example, new business, cost reduction through business process automation, and so on)
  • Is regularly evaluated with reference to the risk associated with the use case (for example, regulatory reporting

The value and risk associated with the linked data products are then calculated as an aggregation. Where organizations already track use cases associated with data, either as part of data privacy governance or as a by-product of the access approval process, these existing systems and databases can be reused or extended.

Conversely, where data products overlap with each other, their value to the organization is reduced accordingly, because redundancies between data products represent an inefficient use of resources and increase organizational complexity associated with data quality management.

To ensure that the model is operationally feasible (see the key deliverables of methodology development), it may be sufficient to consider simple aggregations, rather than attempting to calculate value and risk attribution at a product or use case level.

Optimal portfolio selection

This practice deals with the determination of which combination of data products (existing, new, or potential) would best meet the organization’s current and known future needs. This practice takes input from data product analysis and data product proposals, as well as other enterprise architecture practices (for example, business architecture), and considers trade-offs between data-debt and time-to-value, as well as other considerations such as redundancy between data products to determine the optimal mix of permanent and temporary data products at any given point in time.

Because the number of data products in an organization may become significant over time, it may be useful to apply heuristics to the problem of optimal portfolio selection. For example, it may be sufficient to consider core and cross-domain data products (trunk and branches) during quarterly portfolio reviews, with other data products (leaves) audited on a yearly basis.

Key deliverables include the following:

  • A target state definition for the data mesh, including all relevant data products
  • An indication of organizational priorities for use by the portfolio adjustment practice

Key considerations

The following are key considerations regarding the data product half-life:

  • Long-term or strategic data products – These data products fill a long-term organizational need, are often associated with key source systems in various domains, and anchor the overall data strategy. Over time, as an organization’s data mesh matures, long-term data products should form the bulk of the mesh.
  • Time-bound data products – These data products fill a gap in data strategy and allow the organization to move on data opportunities until core data products can be updated. An example of this might be data products created and used in the context of mergers and acquisitions transactions and post-acquisition, to provide consistent data for reporting and business intelligence until mid-term and long-term application consolidation has taken place. Time-bound data products are considered as data-debt and should be managed accordingly.
  • Purpose-driven data products – These data products serve a narrow, finite purpose. Purpose-driven data products may or may not be time-bound, but are characterized primarily by a strict set of consumers known in advance. Examples of this might include:
    • Data products developed to support system-of-record harmonization between lines of business (for example, deduplication of customer records between insurance lines of business using separate CRM systems
    • Data products created explicitly for the monitoring of other data products (data quality, update frequency, and so on)

Portfolio adjustment

This practice implements the feasibility analysis, planning and project management, as well as communication and organizational change management activities associated with changes to the optimal portfolio. As part of this practice, a gap analysis is conducted between the current and target data product portfolio, and a set of required actions and estimated time and effort prepared for review by the organization. During such a period, data products may be marked for development (new data products to fill a need), changes, consolidation (merging two or more data products into a single data product), or deprecation. Several iterations of optimal portfolio selection and portfolio adjustment may be required to find an appropriate balance between optimality and feasibility of implementation.

Key deliverables include the following:

  • A gap analysis between the current and target data product portfolio, as well as proposed remediation activities
  • High-level project plans and effort or budget assessments associated with required changes, for approval by relevant stakeholders (such as the data council)

Data product proposals

This practice organizes the collection and prioritization of requests for new, or changes to existing, data products within the organization. Its implementation may be adapted from or managed by existing demand management processes within the organization.

Key deliverables include a registry of demand against new or existing data products, including metadata on source systems, attributes, known use cases, proposed data product owners, and suggested organizational priority.

Methodology selection

This practice is associated with the identification and application of the most appropriate methodologies (such as value and risk) during data product analysis, screening, and optimal portfolio selection. The selection of an appropriate methodology for the type, maturity, and scope of a data product (or an entire portfolio) is a key element in avoiding either a “Kudzu” mesh or a “data desert.”

Key deliverables include reusable selection criteria for mapping methodologies to data products during data product analysis, screening, and optimal portfolio selection.

Pre-screening

This optional practice is primarily a mechanism to avoid unnecessary time and effort in the comparatively expensive practice of data product analysis by offering simple self-service applications of guidelines to the evaluation of data products. An example might include the automated approval of data products that fall under the classification of personal data products, requiring only attestation on the part of the requester that they will uphold the relevant portions of the guideline that governs such data products.

Key deliverables include tools and checklists for the self-service evaluation of data products against guidelines and automated registration of approved data products.

Data product analysis

This practice incorporates guidelines, methodologies, as well as (where available) metadata relating to data products (performance against SLOs, service management metrics, degree of overlap with other data products) to establish an understanding of the value and risk associated with individual data products, as well as gaps between current and target capability maturities, and compliance with published product definitions and standards.

Key deliverables include a summary of findings for a particular data product, including scores for relevant value, risk, and maturity metrics, as well as operational gaps requiring remediation and recommendations on next steps (repair, enhance, decommission, and so on).

Screening

This optional practice is a mechanism to reduce complexity in optimal portfolio selection by ensuring the early removal of data products from consideration that fail to meet value or risk targets, or have been identified as redundant to other data products already available in the organization.

Key deliverables include a list of data products that should be slated for removal (direct-to-decommissioning).

Data product development

This practice is not performed directly under DPPM, but is managed in part by the portfolio adjustment practice, and may be governed by standards that are developed as part of DPPM. In the context of DPPM, this practice is primarily associated with ensuring that data products are developed according to the specifications agreed as part of portfolio adjustment.

Key deliverables include project management and software or service development deliverables and artefacts.

Data product decommissioning

This practice manages the decommissioning of data products and the migration of affected consumers to new or other data products where relevant. Unmanaged decommissioning of data products, especially those with many downstream consumers, can threaten the stability of the entire data mesh, as well as have significant consequences to business functions.

Key deliverables include a decommissioning plan, including stakeholder assessment and sign-off, timelines, migration plans for affected consumers, and back-out strategies.

Periodic evaluation

This practice manages the calendar and implementation of periodic reviews of the data mesh, both in its entirety as well as at the data product level, and is primarily an exercise in project management.

Key deliverables include the following:

  • yearly review calendar, published and made available to all data product owners and affected stakeholders
  • Project management deliverables and artefacts, including evidence of evaluations having been performed against each data product

Technology

Although most practices within DPPM don’t rely heavily on technology and automation, some key supporting applications and services are required to implement DPPM effectively:

  • Data catalog – Core to the delivery of DPPM is the organizational data catalog. Beyond providing transparency into what data products exist within an organization, a data catalog can provide key insights into data lineage between data products (key to the implementation of portfolio adjustment) and adoption of data products by the organization. The data catalog can also be used to capture and make available both the documented as well as the realized SLO for any given data product, and—through the use of a business glossary—assist in the identification of redundancy between data products.
  • Service management – Service management solutions (such as ServiceNOW) used in the context of data product management offer important insights into the fitness of data products by capturing and tracking incidents, problems, requests, and other metrics against data products.
  • Demand management – A demand management solution supports self-service implementation and automation of data product proposal and pre-screening activities, as well as prioritization activities associated with selection and development of data products.

Conclusion

Although this post focused on implementing DPPM in the context of a data mesh, this capability—like data product thinking—is not exclusive to data mesh architectures. The practices outlined here can be practiced at any scale to ensure that the production and use of data within the organization is always in line with its current and future needs, that governance is implemented in a consistent way, and that the organization can have Bonsai, not Kudzu.

For more information about data mesh and data management, refer to the following:

In upcoming posts, we will cover other aspects of data mesh operating models, including data mesh supervision and service management models for data product owners.


About the Authors


Maximilian Mayrhofer
is a Principal Solutions Architect working in the AWS Financial Services EMEA Go-to-Market team. He has over 12 years experience in digital transformation within private banking and asset management. In his free time, he is an avid reader of science fiction and enjoys bouldering.


Faris Haddad
is the Data & Insights Lead in the AABG Strategic Pursuits team. He helps enterprises successfully become data-driven.
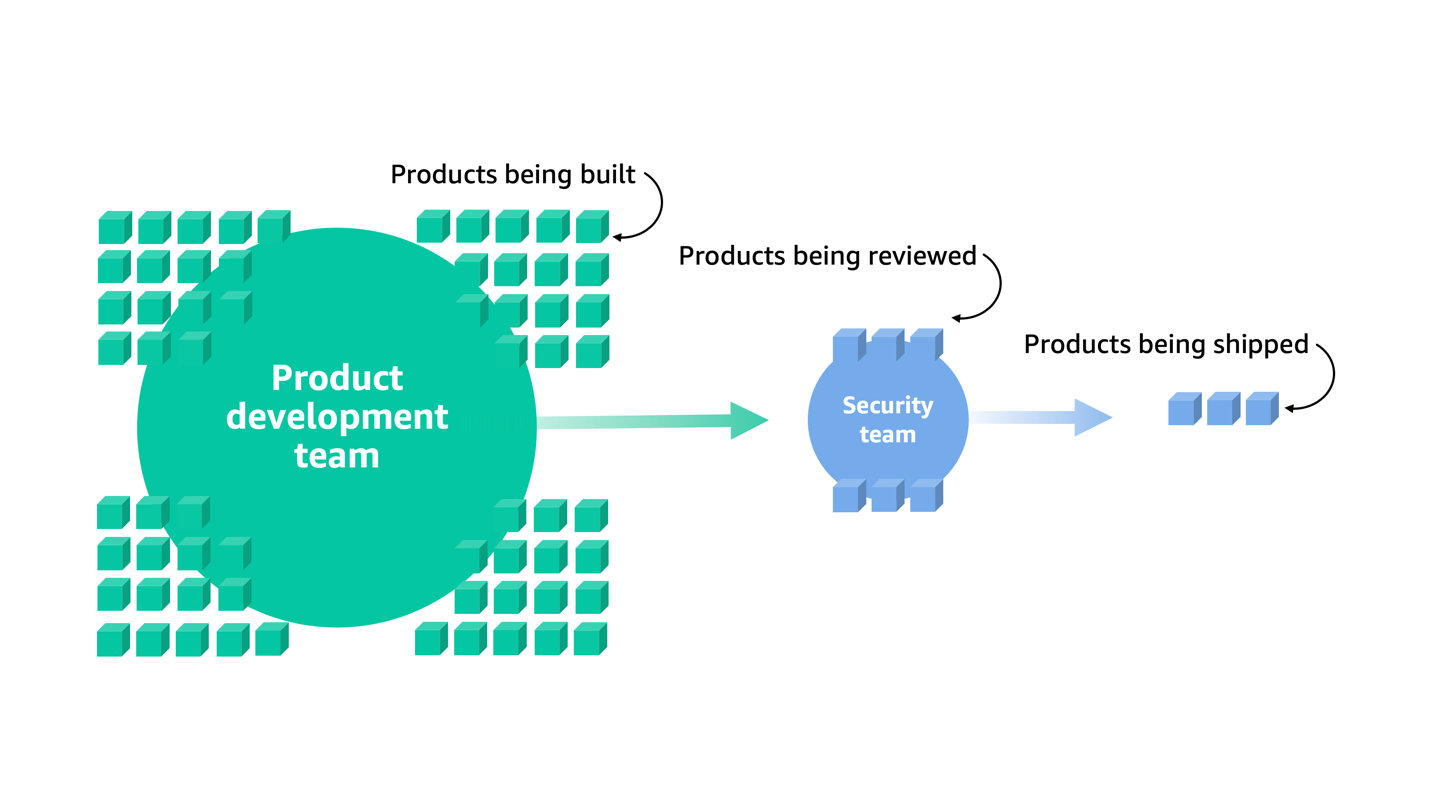
AWS Security Profile: Get to know the AWS Identity Solutions team

Post Syndicated from Maddie Bacon original https://aws.amazon.com/blogs/security/aws-security-profile-get-to-know-the-aws-identity-solutions-team/

Remek Hetman, Principal Solutions Architect on the Identity Solutions team

Remek Hetman, Principal Solutions Architect on the Identity Solutions team

In this profile, I met with Ilya Epshteyn, Senior Manager of the AWS Identity Solutions team, to chat about his team and what they’re working on.


Let’s start with the basics. What does the Identity Solutions team do?
We are a team of specialist solutions architects (SAs) who are in the AWS Identity organization. At AWS, we have SAs who directly support customers, and we have SAs who are embedded in internal engineering teams—we are the latter. As SAs, we work on complex customer scenarios, build solutions, and create deep technical content on identity topics, including identity and access management—like blog posts, workshops, and sessions at our global events. A significant portion of our time is spent working internally with AWS product and engineering teams to help bring the customer experience perspective. Identity touches everything — it’s the fabric of every AWS service — and we want to help achieve a consistent identity experience for customers. To help do this, we use different tooling to proactively identify challenges in customers’ experience with identity across AWS.

What is the mission of the Identity Solutions team?
Our mission is to make it easier for customers to implement access controls that protect their data in a straightforward and consistent manner across AWS services. A consistent experience simplifies the implementation and validation of security controls. We help identify customer’s pain points and work with our service teams to improve their experiences. We also provide highly prescriptive guidance to customers around identity. We don’t want to just say, “here’s an option.” Our guidance comes from a place of knowing how it will be operationalized and implemented. We won’t recommend something to customers unless we’ve tried it ourselves.

In order to literally “try it ourselves,” we built and operate a large-scale AWS environment called Mirror World, in which we use AWS services from the perspective of an AWS customer. The environment allows us to create different controls and use them in conjunction with other tools and services, truly putting ourselves in the shoes of the customer. This is in line with our mission of “active empathy,” our #1 team tenet.

Interesting! Tell us more about Mirror World.
There are three main use cases for Mirror World:

  • We use it to understand and proactively identify challenges with the customer experience for existing and new AWS services and features. As new features are launched, we get early access and test them out so that we can improve the documentation and prescriptive guidance that we provide to customers.
  • We vend accounts in it. Internal field teams can request accounts and get their hands on a large-scale AWS environment with real customer setups, including organization-wide security controls and networking.
  • AWS service teams use this environment to see how customers experience their AWS service.

What are your other major focus areas right now?
Data perimeters — set of preventive guardrails in your AWS environment to help ensure that only your trusted identities are accessing trusted resources from expected networks — are a big focus for us. Because data perimeters touch so many different aspects of identity and access management, our team is helping to organize what the user experience will look like, and helping to define the future state of data perimeters. Team members Tatyana Yatskevich and Matt Luttrell went into more detail about this in their profiles.

What are some of the common questions you hear from customers?
Customers who have already been operating in the cloud for several years often tell us that they’re looking for opportunities to optimize their environment at scale. They’re maturing and managing hundreds or even thousands of accounts, so they commonly ask us for ways to simplify and scale their environment. For customers earlier in their journey, a common question is what lessons we have learned while working with more experienced customers so that they can benefit from their journey. Like Andy Jassy says, “There is no compression algorithm for experience.”

What do you wish customers would ask about more?
How to get rid of their long-term credentials to significantly reduce the chances of credentials becoming compromised. We realize that for some customers it’s an effort to move away from IAM users and long-term credentials. We’d love to hear from more customers how they’re moving away from them or what’s stopping them from doing so. We’ve done a better job setting newer customers on the right path with short-term credentials and IAM roles instead of users, but for more tenured customers, there’s still an opportunity to improve in this area.

Looking ahead, what are your goals for the team?
We’re lucky that our team has individuals with diverse backgrounds and skillsets that have enabled us to deliver on our mission. But if we want to make a bigger impact, we need to scale. We will continue to utilize Mirror World, do more with automation, and expand our team collaboration to further the consistent identity experience for our customers. We also recently launched a repo containing recommended service control policies, which we plan to continue expanding. And we’re going to continue to build end-to-end solutions for identity use cases, such as IAM Policy Validator for AWS CloudFormation. We will also continue identity enablement on complex topics, such as the data perimeter blog series and workshop, so that we can reach even more customers with prescriptive guidance. Stay tuned for more blog posts from our team coming soon here! If you’re interested in any of the topics mentioned in this post and would like to start a conversation, please reach out to your account team.

 
If you have feedback about this post, submit comments in the Comments section below. If you have questions about this post, contact AWS Support.

Want more AWS Security news? Follow us on Twitter.

Author

Maddie Bacon

Maddie (she/her) is a technical writer for Amazon Security with a passion for creating meaningful content that focuses on the human side of security and encourages a security-first mindset. She previously worked as a reporter and editor, and has a BA in Mathematics. In her spare time, she enjoys reading, traveling, and staunchly defending the Oxford comma.

Author

Ilya Epshteyn

Ilya is a Senior Manager of Identity Solutions in AWS Identity. He helps customers to innovate on AWS by building highly secure, available, and scalable architectures. He enjoys spending time outdoors and building Lego creations with his kids.

Let’s Architect! Resiliency in architectures

Post Syndicated from Luca Mezzalira original https://aws.amazon.com/blogs/architecture/lets-architect-resiliency-in-architectures/

What is “resiliency”, and why does it matter? When we discussed this topic in an early 2022 edition of Let’s Architect!, we referenced the AWS Well-Architected Framework, which defines resilience as having “the capability to recover when stressed by load, accidental or intentional attacks, and failure of any part in the workload’s components.” Businesses rely heavily on the availability and performance of their digital services. Resilience has emerged as critical for any efficiently architected system, which is why it is a fundamental role in ensuring the reliability and availability of workloads hosted on the AWS Cloud platform.

In this newer edition of Let’s Architect!, we share some best practices for putting together resilient architectures, focusing on providing continuous service and avoiding disruptions. Ensuring uninterrupted operations is likely a primary objective when it comes to building a resilient architecture.

Understand resiliency patterns and trade-offs to architect efficiently in the cloud

In this AWS Architecture Blog post, the authors introduce five resilience patterns. Each of these patterns comes with specific strengths and trade-offs, allowing architects to personalize their resilience strategies according to the unique requirements of their applications and business needs. By understanding these patterns and their implications, organizations can design resilient cloud architectures that deliver high availability and efficient recovery from potential disruptions.

Take me to this Architecture Blog post!

Resilience patterns and tradeoffs

Resilience patterns and tradeoffs

Timeouts, retries, and backoff with jitter

Marc Broker discusses the inevitability of failures and the importance of designing systems to withstand them. He highlights three essential tools for building resilience: timeouts, retries, and backoff. By embracing these three techniques, we can create robust systems that maintain high availability in the face of failures. Timeouts, backoff, and jitter are fundamental to spread the traffic coming from clients and avoid overloading your systems. Building resilience is a fundamental aspect of ensuring the reliability and performance of AWS services in the ever-changing and dynamic technological landscape.

Take me to the Amazon Builders’ Library!

The Amazon Builder’s Library is a collection of technical resources produced by engineers at Amazon

The Amazon Builder’s Library is a collection of technical resources produced by engineers at Amazon

Prepare & Protect Your Applications From Disruption With AWS Resilience Hub

The AWS Resilience Hub not only protects businesses from potential downtime risks but also helps them build a robust foundation for their applications, ensuring uninterrupted service delivery to customers and users.

In this AWS Online Tech Talk, led by the Principal Product Manager of AWS Resilience Hub, the importance of a resilience hub to protect mission-critical applications from downtime risks is emphasized. The AWS Resilience Hub is showcased as a centralized platform to define, validate, and track application resilience. The talk includes strategies to avoid disruptions caused by software, infrastructure, or operational issues, plus there’s also a demo demonstrating how to apply these techniques effectively.

If you are interested in delving deeper into the services discussed in the session, AWS Resilience Hub is a valuable resource for monitoring and implementing resilient architectures.

Take me to this AWS Online Tech Talk!

AWS Resilience Hub recommendations

AWS Resilience Hub recommendations

Data resiliency design patterns with AWS

In this re:Invent 2022 session, data resiliency, why it matters to customers, and how you can incorporate it into your application architecture is discussed in depth. This session kicks off with the comprehensive overview of data resiliency, breaking down its core components and illustrating its critical role in modern application development. It, then, covers application data resiliency and protection designs, plus extending from the native data resiliency capabilities of AWS storage through DR solutions using AWS Elastic Disaster Recovery.

Take me to this re:Invent 2022 video!

Asynchronous cross-region replication

Asynchronous cross-region replication

See you next time!

Thanks for joining our discussion on architecture resiliency! See you in two weeks when we’ll talk about security on AWS.

To find all the blogs from this series, visit the Let’s Architect! list of content on the AWS Architecture Blog.

How Amazon CodeGuru Security helps you effectively balance security and velocity

Post Syndicated from Leo da Silva original https://aws.amazon.com/blogs/security/how_amazon_codeguru_security_helps_effectively_balance_security_and_velocity/

Software development is a well-established process—developers write code, review it, build artifacts, and deploy the application. They then monitor the application using data to improve the code. This process is often repeated many times over. As Amazon Web Services (AWS) customers embrace modern software development practices, they sometimes face challenges with the use of third-party code security tools, such as an overwhelming number of findings, high rates of false positives among those findings, and the logistics of tracking open issues across code versions.

Customers tell us they need help to identify the top risks in their application code as it is being built and to receive actionable recommendations to mitigate these risks. In this blog post, we demonstrate how the new Amazon CodeGuru Security service and its fully managed, machine learning (ML)-powered code security analysis capabilities provide intelligent recommendations to improve code security and quality. Amazon CodeGuru Security enhances the overall security posture of applications that are deployed in your environment while reducing the time to deploy in production.

Amazon CodeGuru Security is a managed static application security tool (SAST) service that is also available through Amazon CodeGuru Reviewer, Amazon CodeWhisperer security scanning, the Amazon SageMaker Studio CodeGuru extension, and Amazon Inspector code scanning.

Solution overview

In this blog post, we introduce you to the features and capabilities of Amazon CodeGuru Security. Amazon CodeGuru Security helps you focus on security risks that are relevant to your environment, along with contextually relevant remediation suggestions (provided as code diffs). Integration, centralization, and scalability of the service are facilitated by using an API-based design, plus bug tracking to automatically detect code fixes and close findings without user intervention. Amazon CodeGuru Security currently supports applications that are written in Python, Java, and JavaScript, along with associated artifacts like scripts, configuration, and documentation files.

Created to improve the security posture of applications that were built for the cloud, Amazon CodeGuru Security rules are developed in partnership with Amazon application security teams, applying learnings and adhering to best practices that govern the development of Amazon internal systems and services.

Amazon CodeGuru Security offers multiple integration points:

In Figure 1, you can see one of the proposed architecture patterns that supports the integration of Amazon CodeGuru Security into your existing application deployment pipeline. In this scenario, developers write application code and get it committed into Amazon CodeCommit. This event causes AWS CodeBuild to start building the application and the static security code analysis of the application code, using a pre-build hook. The code and build artifacts are copied to a local Amazon S3 bucket within your account, and Amazon CodeGuru Security scans the application assets.

Figure 1: Example of CodeGuru Security integration with deployment pipeline

Figure 1: Example of CodeGuru Security integration with deployment pipeline

Amazon CodeGuru detection engine

At the core of the CodeGuru detector design is the idea of user action in response to findings. Detectors flag security risks or quality issues with a high degree of precision, such that action can be taken directly to remediate the finding. With this goal in mind, we have designed the Guru Query Language (GQL) toolkit. GQL enables precise expression of scenario-centric micro-analyzers that check specific properties (for example, misuse of a particular Java cryptography library or API) through a wide range of analysis constructs (more than 200 at the time of publication).

Among these constructs are capabilities such as type inference (determining the precise types of variables and fields), inter-procedural analysis (analyzing across function boundaries), and advanced taint tracking capabilities, where untrusted data (from taint sources) is tracked through the application to determine whether it reaches security-sensitive operations (known as taint sinks) without being sanitized.

By using GQL, the rule author can combine constructs as building blocks to precisely match the vulnerable patterns that are being targeted. As an example, you can specify taint sources and sinks in a contextual way so that only data read from remote (as opposed to local) files is considered untrusted.

We benchmark detectors against ever-growing datasets, and improve them based on feedback from our partner security teams and customers, as well as metrics that we collect. Detectors are subjected to a rigorous quality control process. Starting from the detector specification, we work closely with subject matter experts (SMEs) to make sure that the suggestions cover the most important application surfaces and are not overly defensive in the warnings they raise. Moving from specification to implementation, detections are reviewed and sampled from shadow runs on live codebases with the same SMEs as well as internal CodeGuru users. If detectors meet an internal performance bar, they are launched internally at AWS. After they are launched, the detectors are monitored by using weekly metrics. A detector graduates into the commercial CodeGuru service only if it meets a high quality bar for several weeks.

Amazon CodeGuru Security uses a detection engine to find security issues in the application code that is scanned. The engine uses a Detector Library, which is a resource that contains detailed information about the CodeGuru security and code quality detectors, to help you build secure and efficient applications. Each detection page within the Detector Library contains descriptions, compliant and non-compliant example code snippets, severities, and additional information that helps you mitigate risks (such as Common Weakness Enumeration (CWE) numbers). The materials presented in the Amazon CodeGuru Detector Library are intended to be a high-level summary of the service’s capabilities, but might not be inclusive of all detectors or their functionality.

Bug Fix Tracking and code fixes

With user action as the ultimate goal, an important metric to us is whether code fixes are made in response to our recommendations. As such, AWS has designed a novel Bug Fix Tracking (BFT) algorithm, whose key functionality is to relate CodeGuru findings across revisions of a given codebase or application. If, for example, CodeGuru reports misuse of a cryptographic API on version V1 of codebase C, then BFT detects whether that misuse issue is still present when version V2 of C is scanned.

Tracking bugs and bug fixes are nontrivial. Code can be refactored into different locations within a file, and sometimes also into different files. In addition, syntax may be adjusted in ways that are orthogonal to fixing an issue (for example, if variables are renamed). The CodeGuru BFT algorithm constructs a bi-partite graph to relate a pair of findings across revisions, or otherwise declare a finding as either closed (no match in V2) or new (no match in V1).

Figure 2 shows the process that is used by BFT in tracking application bugs. After the application version being scanned is identified and the bug detection verification starts, BFT updates the database with its findings, validating the existing issues with findings uncovered in version N-1.

Figure 2: Overview of the Bug Fix Tracking algorithm

Figure 2: Overview of the Bug Fix Tracking algorithm

The algorithm is staged, starting from the simple case of 1:1 correspondence between findings, through cases where findings might have drifted to a new location but are otherwise the same. For the final, most complex scenario of fuzzy matching, we use advanced hashing techniques to establish the mapping.

BFT provides a metric that guides our own rule development and tuning process on an ongoing basis. Data about BFT findings is available to our customers through the CodeGuru Security API. With gathered data about fixes, security engineers and leaders can measure exposure to security risks, quantify the lifetime of high and critical security issues, monitor burn rate for security issues, and form other insights from the raw data.

Actionable recommendations and concrete remediation

To align with our goal of encouraging user action in response to our recommendations, we’ve added a feature powered by automated reasoning for including concrete remediation advice as part of CodeGuru recommendations. This comes in the form of a code diff, which you can apply mechanically by using standard utilities like patch.

The screenshot in Figure 3 shows how this functionality creates an important bridge between security engineers and software engineers—the former have the necessary security expertise, while the latter are often responsible for carrying out the code fix. Recommendations that are accompanied by concrete fix suggestions can cut through multiple correspondences, alignment issues, and validation cycles, which can help accelerate remediation.

Figure 3: Example of recommendation showing difference between compliant and non-compliant code

Figure 3: Example of recommendation showing difference between compliant and non-compliant code

To enable the reasoning illustrated in Figure 3, where the data reaching the addObject call goes through sanitization in the form of an HtmlUtils::htmlEscape call, the underlying algorithm performs several steps. First, a formal representation of the code, known as its Abstract Syntax Tree (AST), is constructed. The AST is then visited by one or more transformation “recipes,” whose goal is to manipulate the program such that the vulnerability is mitigated.

Code transformation is done in a contextual manner, so that syntax (for example, variable names) and formatting (for example, indentation levels) are preserved. To verify that the transformation is valid, the algorithm further runs post-processing checks on the resulting code structure and syntax.

An important refinement of the remediation capability is that Amazon CodeGuru Security performs pre-analysis ahead of running the security scan to classify code artifacts into application- versus library-dependencies. It’s more feasible to take action on a recommendation for code owned by you, compared to code in a third-party library. The classification algorithm has been trained on hundreds of thousands of open-source libraries to disassemble code artifacts, including bundling application and library content in the same file, and focus downstream analysis on the most pertinent scanning surfaces.

Critical security issues have been shown to sometimes take hundreds of days to address (as discussed in this study). Internal studies that look at use of CodeGuru have seen a steep drop in time to fix issues thanks to concrete fix suggestions, which is value that the service excited to share with you.

Conclusion

Amazon CodeGuru Security is a static application security testing (SAST) tool that combines ML and automated reasoning to identify security issues in your code. Amazon CodeGuru detection capabilities that use GQL (Guru Query Language), Bug Fix Tracking (BFT), and efficacy mechanisms and AppSec expertise can help you precisely identify code security issues with a low rate of false positives. High signal-to-noise ratio is a key enabler in integrating SAST into the daily work of security engineers and software developers.

In addition, Amazon CodeGuru Security provides thorough fix recommendations, which your development teams can use to improve the overall time to remediate application security issues. At the same time, the recommendations can help you to implement security best practices based on an ML model that was trained on millions of lines of code and vulnerability assessments performed within Amazon. Get started with Amazon CodeGuru Security.

 
If you have feedback about this post, submit comments in the Comments section below. If you have questions about this post, contact AWS Support.

Want more AWS Security news? Follow us on Twitter.

Leo da Silva

Leo da Silva

Leo is a Security Specialist Solutions Architect at AWS who uses his knowledge to help customers better utilize cloud services and technologies securely. Over the years, Leo has had the opportunity to work in large, complex environments, designing, architecting, and implementing highly scalable and secure solutions for global companies. He is passionate about football, BBQ, and Jiu Jitsu—the Brazilian version of them all.

Omer Tripp

Omer Tripp

Omer is a Principal Applied Scientist on the Amazon CodeGuru team. His research work is at the intersection of programming languages, machine learning, and security. Outside of work, Omer likes to stay physically active (through tennis, basketball, skiing, and various other activities), as well as tour the US and the world with his family.

Let’s Architect! DevOps Best Practices on AWS

Post Syndicated from Luca Mezzalira original https://aws.amazon.com/blogs/architecture/lets-architect-devops-best-practices-on-aws/

DevOps has revolutionized software development and operations by fostering collaboration, automation, and continuous improvement. By bringing together development and operations teams, organizations can accelerate software delivery, enhance reliability, and achieve faster time-to-market.

In this blog post, we will explore the best practices and architectural considerations for implementing DevOps with Amazon Web Services (AWS), enabling you to build efficient and scalable systems that align with DevOps principles. The Let’s Architect! team wants to share useful resources that help you to optimize your software development and operations.

DevOps revolution

Distributed systems are adopted from enterprises more frequently now. When an organization wants to leverage distributed systems’ characteristics, it requires a mindset and approach shift, akin to a new model for software development lifecycle.

In this re:Invent 2021 video, Emily Freeman, now Head of Community Engagement at AWS, shares with us the insights gained in the trenches when adapting a new software development lifecycle that will help your organization thrive using distributed systems.

Take me to this re:Invent 2021 video!

Operationalizing the DevOps revolution

Operationalizing the DevOps revolution

My CI/CD pipeline is my release captain

Designing effective DevOps workflows is necessary for achieving seamless collaboration between development and operations teams. The Amazon Builders’ Library offers a wealth of guidance on designing DevOps workflows that promote efficiency, scalability, and reliability. From continuous integration and deployment strategies to configuration management and observability, this resource covers various aspects of DevOps workflow design. By following the best practices outlined in the Builders’ Library, you can create robust and scalable DevOps workflows that facilitate rapid software delivery and smooth operations.

Take me to this resource!

A pipeline coordinates multiple inflight releases and promotes them through three stages

A pipeline coordinates multiple inflight releases and promotes them through three stages

Using Cloud Fitness Functions to Drive Evolutionary Architecture

Cloud fitness functions provide a powerful mechanism for driving evolutionary architecture within your DevOps practices. By defining and measuring architectural fitness goals, you can continuously improve and evolve your systems over time.

This AWS Architecture Blog post delves into how AWS services, like AWS Lambda, AWS Step Functions, and Amazon CloudWatch can be leveraged to implement cloud fitness functions effectively. By integrating these services into your DevOps workflows, you can establish an architecture that evolves in alignment with changing business needs: improving system resilience, scalability, and maintainability.

Take me to this AWS Architecture Blog post!

Fitness functions provide feedback to engineers via metrics

Fitness functions provide feedback to engineers via metrics

Multi-Region Terraform Deployments with AWS CodePipeline using Terraform Built CI/CD

Achieving consistent deployments across multiple regions is a common challenge. This AWS DevOps Blog post demonstrates how to use Terraform, AWS CodePipeline, and infrastructure-as-code principles to automate Multi-Region deployments effectively. By adopting this approach, you can demonstrate the consistent infrastructure and application deployments, improving the scalability, reliability, and availability of your DevOps practices.

The post also provides practical examples and step-by-step instructions for implementing Multi-Region deployments with Terraform and AWS services, enabling you to leverage the power of infrastructure-as-code to streamline DevOps workflows.

Take me to this AWS DevOps Blog post!

Multi-Region AWS deployment with IaC and CI/CD pipelines

Multi-Region AWS deployment with IaC and CI/CD pipelines

See you next time!

Thanks for joining our discussion on DevOps best practices! Next time we’ll talk about how to create resilient workloads on AWS.

To find all the blogs from this series, check out the Let’s Architect! list of content on the AWS Architecture Blog. See you soon!

Build a serverless log analytics pipeline using Amazon OpenSearch Ingestion with managed Amazon OpenSearch Service

Post Syndicated from Hajer Bouafif original https://aws.amazon.com/blogs/big-data/build-a-serverless-log-analytics-pipeline-using-amazon-opensearch-ingestion-with-managed-amazon-opensearch-service/

In this post, we show how to build a log ingestion pipeline using the new Amazon OpenSearch Ingestion, a fully managed data collector that delivers real-time log and trace data to Amazon OpenSearch Service domains. OpenSearch Ingestion is powered by the open-source data collector Data Prepper. Data Prepper is part of the open-source OpenSearch project. With OpenSearch Ingestion, you can filter, enrich, transform, and deliver your data for downstream analysis and visualization. OpenSearch Ingestion is serverless, so you don’t need to worry about scaling your infrastructure, operating your ingestion fleet, and patching or updating the software.

For a comprehensive overview of OpenSearch Ingestion, visit Amazon OpenSearch Ingestion, and for more information about the Data Prepper open-source project, visit Data Prepper.

In this post, we explore the logging infrastructure for a fictitious company, AnyCompany. We explore the components of the end-to-end solution and then show how to configure OpenSearch Ingestion’s main parameters and how the logs come in and out of OpenSearch Ingestion.

Solution overview

Consider a scenario in which AnyCompany collects Apache web logs. They use OpenSearch Service to monitor web access and identify possible root causes to error logs of type 4xx and 5xx. The following architecture diagram outlines the use of every component used in the log analytics pipeline: Fluent Bit collects and forwards logs; OpenSearch Ingestion processes, routes, and ingests logs; and OpenSearch Service analyzes the logs.

The workflow contains the following stages:

  1. Generate and collectFluent Bit collects the generated logs and forwards them to OpenSearch Ingestion. In this post, you create fake logs that Fluent Bit forwards to OpenSearch Ingestion. Check the list of supported clients to review the required configuration for each client supported by OpenSearch Ingestion.
  2. Process and ingest – OpenSearch Ingestion filters the logs based on response value, processes the logs using a grok processor, and applies conditional routing to ingest the error logs to an OpenSearch Service index.
  3. Store and analyze – We can analyze the Apache httpd error logs using OpenSearch Dashboards.

Prerequisites

To implement this solution, make sure you have the following prerequisites:

Configure OpenSearch Ingestion

First, you define the appropriate AWS Identity and Access Management (IAM) permissions to write to and from OpenSearch Ingestion. Then you set up the pipeline configuration in the OpenSearch Ingestion. Let’s explore each step in more detail.

Configure IAM permissions

OpenSearch Ingestion works with IAM to secure communications into and out of OpenSearch Ingestion. You need two roles, authenticated using AWS Signature V4 (SigV4) signed requests. The originating entity requires permissions to write to OpenSearch Ingestion. OpenSearch Ingestion requires permissions to write to your OpenSearch Service domain. Finally, you must create an access policy using OpenSearch Service’s fine-grained access control, which allows OpenSearch Ingestion to create indexes and write to them in your domain.

The following diagram illustrates the IAM permissions to allow OpenSearch Ingestion to write to an OpenSearch Service domain. Refer to Setting up roles and users in Amazon OpenSearch Ingestion to get more details on roles and permissions required to use OpenSearch Ingestion.

In the demo, you use the AWS Cloud9 EC2 instance profile’s credentials to sign requests sent to OpenSearch Ingestion. You use Fluent Bit to fetch the credentials and assume the role you pass in the aws_role_arn you configure later.

  1. Create an ingestion role (called IngestionRole) to allow Fluent Bit to ingest the logs into your pipeline.

Create a trust relationship to allow Fluent Bit to assume the ingestion role, as shown in the following code. Fluent Bit attempts to fetch the credentials in the following order. In configuring the access policy for this role, you grant permission for the osis:Ingest.

{
    "Version": "2012-10-17",
    "Statement": [
        {
            "Effect": "Allow",
            "Principal": {
                "AWS": "{your-account-id}"
            },
            "Action": "sts:AssumeRole"
        }
    ]
}
  1. Create a pipeline role (called PipelineRole) with a trust relationship for OpenSearch Ingestion to assume that role. The domain-level access policy of the OpenSearch domain grants the pipeline role access to the domain.
  1. Finally, configure your domain’s security plugin to enable OpenSearch Ingestion’s assumed role to create indexes and write data to the domain.

In this demo, the OpenSearch Service domain uses fine-grained access control for authentication, so you need to map the OpenSearch Ingestion pipeline role to the OpenSearch backend role all_access. For instructions, refer to Step 2: Include the pipeline role in the domain access policy page.

Create the pipeline in OpenSearch Ingestion

To create an OpenSearch Ingestion pipeline, complete the following steps:

  1. On the OpenSearch Service console, choose Pipelines in the navigation pane.
  2. Choose Create pipeline.
  3. For Pipeline name, enter a name.

  1. Input the minimum and maximum Ingestion OpenSearch Compute Units (Ingestion OCUs). In this example, we use the default pipeline capacity settings of minimum 1 Ingestion OCU and maximum 4 Ingestion OCUs.

Each OCU is a combination of approximately 8 GB of memory and 2 vCPUs that can handle an estimated 8 GiB per hour. OpenSearch Ingestion supports up to 96 OCUs, and it automatically scales up and down based on your ingest workload demand.

  1. In the Pipeline configuration section, configure Data Prepper to process your data by choosing the appropriate blueprint configuration template on the Configuration blueprints menu. For this post, we choose AWS-LogAggregationWithConditionalRouting.

The OpenSearch Ingestion pipeline configuration consists of four sections:

  • Source – This is the input component of a pipeline. It defines the mechanism through which a pipeline consumes records. In this post, you use the http_source plugin and provide the Fluent Bit output URI value within the path attribute.
  • Processors – This represents an intermediate processing to filter, transform, and enrich your input data. Refer to Supported plugins for more details on the list of operations supported in OpenSearch Ingestion. In this post, we use the grok processor COMMONAPACHELOG, which matches input logs against the common Apache log pattern and makes it easy to query in OpenSearch Service.
  • Sink – This is the output component of a pipeline. It defines one or more destinations to which a pipeline publishes records. In this post, you define an OpenSearch Service domain and index as sink.
  • Route – This is the part of a processor that allows the pipeline to route the data into different sinks based on specific conditions. In this example, you create four routes based in the response field value of the log. If the response field value of the log line matches 2xx or 3xx, the log is sent to the OpenSearch Service index aggregated_2xx_3xx. If the response field value matches 4xx, the log is sent to the index aggregated_4xx. If the response field value matches 5xx, the log is sent to the index aggregated_5xx.
  1. Update the blueprint based on your use case. The following code shows an example of the pipeline configuration YAML file:
version: "2"
log-aggregate-pipeline:
  source:
    http:
      # Provide the FluentBit output URI value.
      path: "/log/ingest"
  processor:
    - date:
        from_time_received: true
        destination: "@timestamp"
    - grok:
        match:
          log: [ "%{COMMONAPACHELOG_DATATYPED}" ]
  route:
    - 2xx_status: "/response >= 200 and /response < 300"
    - 3xx_status: "/response >= 300 and /response < 400"
    - 4xx_status: "/response >= 400 and /response < 500"
    - 5xx_status: "/response >= 500 and /response < 600"
  sink:
    - opensearch:
        # Provide an AWS OpenSearch Service domain endpoint
        hosts: [ "{your-domain-endpoint}" ]
        aws:
          # Provide a Role ARN with access to the domain. This role should have a trust relationship with osis-pipelines.amazonaws.com
          sts_role_arn: "arn:aws:iam::{your-account-id}:role/PipelineRole"
          # Provide the region of the domain.
          region: "{AWS_Region}"
        index: "aggregated_2xx_3xx"
        routes:
          - 2xx_status
          - 3xx_status
    - opensearch:
        # Provide an AWS OpenSearch Service domain endpoint
        hosts: [ "{your-domain-endpoint}"  ]
        aws:
          # Provide a Role ARN with access to the domain. This role should have a trust relationship with osis-pipelines.amazonaws.com
          sts_role_arn: "arn:aws:iam::{your-account-id}:role/PipelineRole"
          # Provide the region of the domain.
          region: "{AWS_Region}"
        index: "aggregated_4xx"
        routes:
          - 4xx_status
    - opensearch:
        # Provide an AWS OpenSearch Service domain endpoint
        hosts: [ "{your-domain-endpoint}"  ]
        aws:
          # Provide a Role ARN with access to the domain. This role should have a trust relationship with osis-pipelines.amazonaws.com
          sts_role_arn: "arn:aws:iam::{your-account-id}:role/PipelineRole"
          # Provide the region of the domain.
          region: "{AWS_Region}"
        index: "aggregated_5xx"
        routes:
          - 5xx_status

Provide the relevant values for your domain endpoint, account ID, and Region related to your configuration.

  1. Check the health of your configuration setup by choosing Validate pipeline when you finish the update.

When designing a production workload, deploy your pipeline within a VPC. For instructions, refer to Securing Amazon OpenSearch Ingestion pipelines within a VPC.

  1. For this post, select Public access under Network.

  1. In the Log publishing options section, select Publish to CloudWatch logs and Create new group.

OpenSearch Ingestion uses the log levels of INFO, WARN, ERROR, and FATAL. Enabling log publishing helps you monitor your pipelines in production.

  1. Choose Next and Create pipeline.
  2. Select the pipeline and choose View details to see the progress of the pipeline creation.

Wait until the status changes to Active to start using the pipeline.

Send logs to the OpenSearch Ingestion pipeline

To start sending logs to the OpenSearch Ingestion pipeline, complete the following steps:

  1. On the AWS Cloud9 console, create a Fluent Bit configuration file and update the following attributes:
    • Host – Enter the ingestion URL of your OpenSearch Ingestion pipeline.
    • aws_service – Enter osis.
    • aws_role_arn – Enter the ARN of the IAM role IngestionRole.

The following code shows an example of the Fluent-bit.conf file:

[SERVICE]
    parsers_file          ./parsers.conf
    
[INPUT]
    name                  tail
    refresh_interval      5
    path                  /var/log/*.log
    read_from_head        true
[FILTER]
    Name parser
    Key_Name log
    Parser apache
[OUTPUT]
    Name http
    Match *
    Host {Ingestion URL}
    Port 443
    URI /log/ingest
    format json
    aws_auth true
    aws_region {AWS_region}
    aws_role_arn arn:aws:iam::{your-account-id}:role/IngestionRole
    aws_service osis
    Log_Level trace
    tls On
  1. In the AWS Cloud9 environment, create a docker-compose YAML file to deploy Fluent Bit and Flog containers:
version: '3'
services:
  fluent-bit:
    container_name: fluent-bit
    image: docker.io/amazon/aws-for-fluent-bit
    volumes:
      - ./fluent-bit.conf:/fluent-bit/etc/fluent-bit.conf
      - ./apache-logs:/var/log
  flog:
    container_name: flog
    image: mingrammer/flog
    command: flog -t log -f apache_common -o web/log/test.log -w -n 100000 -d 1ms -p 1000
    volumes:
      - ./apache-logs:/web/log

Before you start the Docker containers, you need to update the IAM EC2 instance role in AWS Cloud9 so it can sign the requests sent to OpenSearch Ingestion.

  1. For demo purposes, create an IAM service-linked role and choose EC2 under Use case to allow the AWS Cloud9 EC2 instance to call OpenSearch Ingestion on your behalf.
  2. Add the OpenSearch Ingestion policy, which is the same policy you used with IngestionRole.
  3. Add the AdministratorAccess permission policy to the role as well.

Your role definition should look like the following screenshot.

  1. After you create the role, go back to AWS Cloud9, select your demo environment, and choose View details.
  2. On the EC2 instance tab, choose Manage EC2 instance to view the details of the EC2 instance attached to your AWS Cloud9 environment.

  1. On the Amazon EC2 console, replace the IAM role of your AWS Cloud9 EC2 instance with the new role.
  2. Open a terminal in AWS Cloud9 and run the command docker-compose up.

Check the output in the terminal—if everything is working correctly, you get status 200.

Fluent Bit collects logs from the /var/log repository in the container and pushes the data to the OpenSearch Ingestion pipeline.

  1. Open OpenSearch Dashboards, navigate to Dev Tools, and run the command GET _cat/indices to validate that the data has been delivered by OpenSearch Ingestion to your OpenSearch Service domain.

You should see the three indexes created: aggregated_2xx_3xx, aggregated_4xx, and aggregated_5xx.

Now you can focus on analyzing your log data and reinvent your business without having to worry about any operational overhead regarding your ingestion pipeline.

Best practices for monitoring

You can monitor the Amazon CloudWatch metrics made available to you to maintain the right performance and availability of your pipeline. Check the list of available pipeline metrics related to the source, buffer, processor, and sink plugins.

Navigate to the Metrics tab for your specific OpenSearch Ingestion pipeline to explore the graphs available to each metric, as shown in the following screenshot.

In your production workloads, make sure to configure the following CloudWatch alarms to notify you when the pipeline metrics breach a specific threshold so you can promptly remediate each issue.

Managing cost

While OpenSearch Ingestion automatically provisions and scales the OCUs for your spiky workloads, you only pay for the compute resources actively used by your pipeline to ingest, process, and route data. Therefore, setting up a maximum capacity of Ingestion OCUs allows you to handle your workload peak demand while controlling cost.

For production workloads, make sure to configure a minimum of 2 Ingestion OCUs to ensure 99.9% availability for the ingestion pipeline. Check the sizing recommendations and learn how OpenSearch Ingestion responds to workload spikes.

Clean up

Make sure you clean up unwanted AWS resources created during this post in order to prevent additional billing for these resources. Follow these steps to clean up your AWS account:

  1. On the AWS Cloud9 console, choose Environments in the navigation pane.
  2. Select the environment you want to delete and choose Delete.
  3. On the OpenSearch Service console, choose Domains under Managed clusters in the navigation pane.
  4. Select the domain you want to delete and choose Delete.
  5. Select Pipelines under Ingestion in the navigation pane.
  6. Select the pipeline you want to delete and on the Actions menu, choose Delete.

Conclusion

In this post, you learned how to create a serverless ingestion pipeline to deliver Apache access logs to an OpenSearch Service domain using OpenSearch Ingestion. You learned the IAM permissions required to start using OpenSearch Ingestion and how to use a pipeline blueprint instead of creating a pipeline configuration from scratch.

You used Fluent Bit to collect and forward Apache logs, and used OpenSearch Ingestion to process and conditionally route the log data to different indexes in OpenSearch Service. For more examples about writing to OpenSearch Ingestion pipelines, refer to Sending data to Amazon OpenSearch Ingestion pipelines.

Finally, the post provided you with recommendations and best practices to deploy OpenSearch Ingestion pipelines in a production environment while controlling cost.

Follow this post to build your serverless log analytics pipeline, and refer to Top strategies for high volume tracing with Amazon OpenSearch Ingestion to learn more about high volume tracing with OpenSearch Ingestion.


About the authors

Hajer Bouafif is an Analytics Specialist Solutions Architect at Amazon Web Services. She focuses on OpenSearch Service and helps customers design and build well-architected analytics workloads in diverse industries. Hajer enjoys spending time outdoors and discovering new cultures.

Francisco Losada is an Analytics Specialist Solutions Architect based out of Madrid, Spain. He works with customers across EMEA to architect, implement, and evolve analytics solutions at AWS. He advocates for OpenSearch, the open-source search and analytics suite, and supports the community by sharing code samples, writing content, and speaking at conferences. In his spare time, Francisco enjoys playing tennis and running.

Muthu Pitchaimani is a Search Specialist with Amazon OpenSearch Service. He builds large-scale search applications and solutions. Muthu is interested in the topics of networking and security, and is based out of Austin, Texas.

Automated Code Review on Pull Requests using AWS CodeCommit and AWS CodeBuild

Post Syndicated from Verinder Singh original https://aws.amazon.com/blogs/devops/automated-code-review-on-pull-requests-using-aws-codecommit-and-aws-codebuild/

Pull Requests play a critical part in the software development process. They ensure that a developer’s proposed code changes are reviewed by relevant parties before code is merged into the main codebase. This is a standard procedure that is followed across the globe in different organisations today. However, pull requests often require code reviewers to read through a great deal of code and manually check it against quality and security standards. These manual reviews can lead to problematic code being merged into the main codebase if the reviewer overlooks any problems.

To help solve this problem, we recommend using Amazon CodeGuru Reviewer to assist in the review process. CodeGuru Reviewer identifies critical defects and deviation from best practices in your code. It provides recommendations to remediate its findings as comments in your pull requests, helping reviewers miss fewer problems that may have otherwise made into production. You can easily integrate your repositories in AWS CodeCommit with Amazon CodeGuru Reviewer following these steps.

The purpose of this post isn’t, however, to show you CodeGuru Reviewer. Instead, our aim is to help you achieve automated code reviews with your pull requests if you already have a code scanning tool and need to continue using it. In this post, we will show you step-by-step how to add automation to the pull request review process using your code scanning tool with AWS CodeCommit (as source code repository) and AWS CodeBuild (to automatically review code using your code reviewer). After following this guide, you should be able to give developers automatic feedback on their code changes and augment manual code reviews so fewer problems make it into your main codebase.

Solution Overview

The solution comprises of the following components:

  1. AWS CodeCommit: AWS service to host private Git repositories.
  2. Amazon EventBridge: AWS service to receive pullRequestCreated and pullRequestSourceBranchUpdated events and trigger Amazon EventBridge rule.
  3. AWS CodeBuild: AWS service to perform code review and send the result to AWS CodeCommit repository as pull request comment.

The following diagram illustrates the architecture:

Figure 1: This architecture diagram illustrates the workflow where developer raises a Pull Request and receives automated feedback on the code changes using AWS CodeCommit, AWS CodeBuild and Amazon EventBridge rule

Figure 1. Architecture Diagram of the proposed solution in the blog

  1. Developer raises a pull request against the main branch of the source code repository in AWS CodeCommit.
  2. The pullRequestCreated event is received by the default event bus.
  3. The default event bus triggers the Amazon EventBridge rule which is configured to be triggered on pullRequestCreated and pullRequestSourceBranchUpdated events.
  4. The EventBridge rule triggers AWS CodeBuild project.
  5. The AWS CodeBuild project runs the code quality check using customer’s choice of tool and sends the results back to the pull request as comments. Based on the result, the AWS CodeBuild project approves or rejects the pull request automatically.

Walkthrough

The following steps provide a high-level overview of the walkthrough:

  1. Create a source code repository in AWS CodeCommit.
  2. Create and associate an approval rule template.
  3. Create AWS CodeBuild project to run the code quality check and post the result as pull request comment.
  4. Create an Amazon EventBridge rule that reacts to AWS CodeCommit pullRequestCreated and pullRequestSourceBranchUpdated events for the repository created in step 1 and set its target to AWS CodeBuild project created in step 3.
  5. Create a feature branch, add a new file and raise a pull request.
  6. Verify the pull request with the code review feedback in comment section.

1. Create a source code repository in AWS CodeCommit

Create an empty test repository in AWS CodeCommit by following these steps. Once the repository is created you can add files to your repository following these steps. If you create or upload the first file for your repository in the console, a branch is created for you named main. This branch is the default branch for your repository. If you are using a Git client instead, consider configuring your Git client to use main as the name for the initial branch. This blog post assumes the default branch is named as main.

2. Create and associate an approval rule template

Create an AWS CodeCommit approval rule template and associate it with the code repository created in step 1 following these steps.

3. Create AWS CodeBuild project to run the code quality check and post the result as pull request comment

This blog post is based on the assumption that the source code repository has JavaScript code in it, so it uses jshint as a code analysis tool to review the code quality of those files. However, users can choose a different tool as per their use case and choice of programming language.

Create an AWS CodeBuild project from AWS Management Console following these steps and using below configuration:

  • Source: Choose the AWS CodeCommit repository created in step 1 as the source provider.
  • Environment: Select the latest version of AWS managed image with operating system of your choice. Choose New service role option to create the service IAM role with default permissions.
  • Buildspec: Use below build specification. Replace <NODEJS_VERSION> with the latest supported nodejs runtime version for the image selected in previous step. Replace <REPOSITORY_NAME> with the repository name created in step 1. The below spec installs the jshint package, creates a jshint config file with a few sample rules, runs it against the source code in the pull request commit, posts the result as comment to the pull request page and based on the results, approves or rejects the pull request automatically.
version: 0.2
phases:
  install:
    runtime-versions:
      nodejs: <NODEJS_VERSION>
    commands:
      - npm install jshint --global
  build:
    commands:
      - echo \{\"esversion\":6,\"eqeqeq\":true,\"quotmark\":\"single\"\} > .jshintrc
      - CODE_QUALITY_RESULT="$(echo \`\`\`) $(jshint .)"; EXITCODE=$?
      - aws codecommit post-comment-for-pull-request --pull-request-id $PULL_REQUEST_ID --repository-name <REPOSITORY_NAME> --content "$CODE_QUALITY_RESULT" --before-commit-id $DESTINATION_COMMIT_ID --after-commit-id $SOURCE_COMMIT_ID --region $AWS_REGION	
      - |
        if [ $EXITCODE -ne 0 ]
        then
          PR_STATUS='REVOKE'
        else
          PR_STATUS='APPROVE'
        fi
      - REVISION_ID=$(aws codecommit get-pull-request --pull-request-id $PULL_REQUEST_ID | jq -r '.pullRequest.revisionId')
      - aws codecommit update-pull-request-approval-state --pull-request-id $PULL_REQUEST_ID --revision-id $REVISION_ID --approval-state $PR_STATUS --region $AWS_REGION

Once the AWS CodeBuild project has been created successfully, modify its IAM service role by following the below steps:

  • Choose the CodeBuild project’s Build details tab.
  • Choose the Service role link under the Environment section which should navigate you to the CodeBuild’s IAM service role in IAM console.
  • Expand the default customer managed policy and choose Edit.
  • Add the following actions to the existing codecommit actions:
"codecommit:CreatePullRequestApprovalRule",
"codecommit:GetPullRequest",
"codecommit:PostCommentForPullRequest",
"codecommit:UpdatePullRequestApprovalState"

  • Choose Next.
  • On the Review screen, choose Save changes.

4. Create an Amazon EventBridge rule that reacts to AWS CodeCommit pullRequestCreated and pullRequestSourceBranchUpdated events for the repository created in step 1 and set its target to AWS CodeBuild project created in step 3

Follow these steps to create an Amazon EventBridge rule that gets triggered whenever a pull request is created or updated using the following event pattern. Replace the <REGION>, <ACCOUNT_ID> and <REPOSITORY_NAME> placeholders with the actual values. Select target of the event rule as AWS CodeBuild project created in step 3.

Event Pattern

{
    "detail-type": ["CodeCommit Pull Request State Change"],
    "resources": ["arn:aws:codecommit:<REGION>:<ACCOUNT_ID>:<REPOSITORY_NAME>"],
    "source": ["aws.codecommit"],
    "detail": {
      "isMerged": ["False"],
      "pullRequestStatus": ["Open"],
      "repositoryNames": ["<REPOSITORY_NAME>"],
      "destinationReference": ["refs/heads/main"],
      "event": ["pullRequestCreated", "pullRequestSourceBranchUpdated"]
    },
    "account": ["<ACCOUNT_ID>"]
  }

Follow these steps to configure the target input using the below input path and input template.

Input transformer – Input path

{
    "detail-destinationCommit": "$.detail.destinationCommit",
    "detail-pullRequestId": "$.detail.pullRequestId",
    "detail-sourceCommit": "$.detail.sourceCommit"
}

Input transformer – Input template

{
    "sourceVersion": <detail-sourceCommit>,
    "environmentVariablesOverride": [
        {
            "name": "DESTINATION_COMMIT_ID",
            "type": "PLAINTEXT",
            "value": <detail-destinationCommit>
        },
        {
            "name": "SOURCE_COMMIT_ID",
            "type": "PLAINTEXT",
            "value": <detail-sourceCommit>
        },
        {
            "name": "PULL_REQUEST_ID",
            "type": "PLAINTEXT",
            "value": <detail-pullRequestId>
        }
    ]
}

5. Create a feature branch, add a new file and raise a pull request

Create a feature branch following these steps. Push a new file called “index.js” to the root of the repository with the below content.

function greet(dayofweek) {
  if (dayofweek == "Saturday" || dayofweek == "Sunday") {
    console.log("Have a great weekend");
  } else {
    console.log("Have a great day at work");
  }
}

Now raise a pull request using the feature branch as source and main branch as destination following these steps.

6. Verify the pull request with the code review feedback in comment section

As soon as the pull request is created, the AWS CodeBuild project created in step 3 above will be triggered which will run the code quality check and post the results as a pull request comment. Navigate to the AWS CodeCommit repository pull request page in AWS Management Console and check under the Activity tab to confirm the automated code review result being displayed as the latest comment.

The pull request comment submitted by AWS CodeBuild highlights 6 errors in the JavaScript code. The errors on lines first and third are based on the jshint rule “eqeqeq”. It recommends to use strict equality operator (“===”) instead of the loose equality operator (“==”) to avoid type coercion. The errors on lines second, fourth and fifth are based on jshint rule “quotmark” which recommends to use single quotes with strings instead of double quotes for better readability. These jshint rules are defined in AWS CodeBuild project’s buildspec in step 3 above.

Figure 2: The image shows the AWS CodeCommit pull request's Activity tab with code review results automatically posted by the automated code reviewer

Figure 2. Pull Request comments updated with automated code review results.

Conclusion

In this blog post we’ve shown how using AWS CodeCommit and AWS CodeBuild services customers can automate their pull request review process by utilising Amazon EventBridge events and using their own choice of code quality tool. This simple solution also makes it easier for the human reviewers by providing them with automated code quality results as input and enabling them to focus their code review more on business logic code changes rather than static code quality issues.

About the authors

Blog post's primary author's image

Verinder Singh

Verinder Singh is an experienced Solution’s Architect based out of Sydney, Australia with 16+ years of experience in software development and architecture. He works primarily on building large scale open-source AWS solutions for common customer use cases and business problems. In his spare time, he enjoys vacationing and watching movies with his family.

Blog post's secondary author's image

Deenadayaalan Thirugnanasambandam

Deenadayaalan Thirugnanasambandam is a Principal Cloud Architect at AWS. He provides prescriptive architectural guidance and consulting that enable and accelerate customers’ adoption of AWS.

Let’s Architect! Governance best practices

Post Syndicated from Luca Mezzalira original https://aws.amazon.com/blogs/architecture/lets-architect-governance-best-practices/

Governance plays a crucial role in AWS environments, as it ensures compliance, security, and operational efficiency.

In this Let’s Architect!, we aim to provide valuable insights and best practices on how to configure governance appropriately within a company’s AWS infrastructure. By implementing these best practices, you can establish robust controls, enhance security, and maintain compliance, enabling your organization to fully leverage the power of AWS services while mitigating risks and maximizing operational efficiency.

If you are hungry for more information on governance, check out the Architecture Center’s management and governance page, where you can find a collection of AWS solutions, blueprints, and best practices on this topic.

How Global Payments scales on AWS with governance and controls

As global financial and regulated industry organizations increasingly turn to AWS for scaling their operations, they face the critical challenge of balancing growth with stringent governance and control regulatory requirements.

During this re:Invent 2022 session, Global Payments sheds light on how they leverage AWS cloud operations services to address this challenge head-on. By utilizing AWS Service Catalog, they streamline the deployment of pre-approved, compliant resources and services across their AWS accounts. This not only expedites the provisioning process but also ensures that all resources meet the required regulatory standards.

Take me to this re:Invent 2022 video!

The combination of AWS Service Catalog and AWS Organizations empowers Global Payments to establish robust governance and control mechanisms

The combination of AWS Service Catalog and AWS Organizations empowers Global Payments to establish robust governance and control mechanisms

Governance and security with infrastructure as code

Maintaining security and compliance throughout the entire deployment process is critical.

In this video, you will discover how cfn-guard can be utilized to validate your deployment pipelines built using AWS CloudFormation. By defining and applying custom rules, cfn-guard empowers you to enforce security policies, prevent misconfigurations, and ensure compliance with regulatory requirements. Moreover, by leveraging cdk-nag, you can catch potential security vulnerabilities and compliance risks early in the development process.

Take me to this governance video!

Learn how to use AWS CloudFormation and the AWS Cloud Development Kit to deploy cloud applications in regulated environments while enforcing security controls

Learn how to use AWS CloudFormation and the AWS Cloud Development Kit to deploy cloud applications in regulated environments while enforcing security controls

Get more out of service control policies in a multi-account environment

AWS customers often utilize AWS Organizations to effectively manage multiple AWS accounts. There are numerous advantages to employing this approach within an organization, including grouping workloads with shared business objectives, ensuring compliance with regulatory frameworks, and establishing robust isolation barriers based on ownership. Customers commonly utilize separate accounts for development, testing, and production purposes. However, as the number of these accounts grows, the need arises for a centralized approach to establish control mechanisms and guidelines.

In this AWS Security Blog post, we will guide you through various techniques that can enhance the utilization of AWS Organizations’ service control policies (SCPs) in a multi-account environment.

Take me to this AWS Security Blog post!

A sample organization showing the maximum number of SCPs applicable at each level (root, OU, account)

A sample organization showing the maximum number of SCPs applicable at each level (root, OU, account)

Centralized Logging on AWS

Having a single pane of glass where all Amazon CloudWatch Logs are displayed is crucial for effectively monitoring and understanding the overall performance and health of a system or application.

The AWS Centralized Logging solution facilitates the aggregation, examination, and visualization of CloudWatch Logs through a unified dashboard.

This solution streamlines the consolidation, administration, and analysis of log files originating from diverse sources, including access audit logs, configuration change records, and billing events. Furthermore, it enables the collection of CloudWatch Logs from numerous AWS accounts and Regions.

Take me to this AWS solution!

The Centralized Logging on AWS solution contains the following components log ingestion, indexing, and visualization

The Centralized Logging on AWS solution contains the following components log ingestion, indexing, and visualization

See you next time!

Thanks for joining our discussion on governance best practices! We’ll be back in 2 weeks, when we’ll explore DevOps best practices.

To find all the blogs from this series, you can check the Let’s Architect! list of content on the AWS Architecture Blog.

Three ways to accelerate incident response in the cloud: insights from re:Inforce 2023

Post Syndicated from Anne Grahn original https://aws.amazon.com/blogs/security/three-ways-to-accelerate-incident-response-in-the-cloud-insights-from-reinforce-2023/

AWS re:Inforce took place in Anaheim, California, on June 13–14, 2023. AWS customers, partners, and industry peers participated in hundreds of technical and non-technical security-focused sessions across six tracks, an Expo featuring AWS experts and AWS Security Competency Partners, and keynote and leadership sessions.

The threat detection and incident response track showcased how AWS customers can get the visibility they need to help improve their security posture, identify issues before they impact business, and investigate and respond quickly to security incidents across their environment.

With dozens of service and feature announcements—and innumerable best practices shared by AWS experts, customers, and partners—distilling highlights is a challenge. From an incident response perspective, three key themes emerged.

Proactively detect, contextualize, and visualize security events

When it comes to effectively responding to security events, rapid detection is key. Among the launches announced during the keynote was the expansion of Amazon Detective finding groups to include Amazon Inspector findings in addition to Amazon GuardDuty findings.

Detective, GuardDuty, and Inspector are part of a broad set of fully managed AWS security services that help you identify potential security risks, so that you can respond quickly and confidently.

Using machine learning, Detective finding groups can help you conduct faster investigations, identify the root cause of events, and map to the MITRE ATT&CK framework to quickly run security issues to ground. The finding group visualization panel shown in the following figure displays findings and entities involved in a finding group. This interactive visualization can help you analyze, understand, and triage the impact of finding groups.

Figure 1: Detective finding groups visualization panel

Figure 1: Detective finding groups visualization panel

With the expanded threat and vulnerability findings announced at re:Inforce, you can prioritize where to focus your time by answering questions such as “was this EC2 instance compromised because of a software vulnerability?” or “did this GuardDuty finding occur because of unintended network exposure?”

In the session Streamline security analysis with Amazon Detective, AWS Principal Product Manager Rich Vorwaller, AWS Senior Security Engineer Rima Tanash, and AWS Program Manager Jordan Kramer demonstrated how to use graph analysis techniques and machine learning in Detective to identify related findings and resources, and investigate them together to accelerate incident analysis.

In addition to Detective, you can also use Amazon Security Lake to contextualize and visualize security events. Security Lake became generally available on May 30, 2023, and several re:Inforce sessions focused on how you can use this new service to assist with investigations and incident response.

As detailed in the following figure, Security Lake automatically centralizes security data from AWS environments, SaaS providers, on-premises environments, and cloud sources into a purpose-built data lake stored in your account. Security Lake makes it simpler to analyze security data, gain a more comprehensive understanding of security across an entire organization, and improve the protection of workloads, applications, and data. Security Lake automates the collection and management of security data from multiple accounts and AWS Regions, so you can use your preferred analytics tools while retaining complete control and ownership over your security data. Security Lake has adopted the Open Cybersecurity Schema Framework (OCSF), an open standard. With OCSF support, the service normalizes and combines security data from AWS and a broad range of enterprise security data sources.

Figure 2: How Security Lake works

Figure 2: How Security Lake works

To date, 57 AWS security partners have announced integrations with Security Lake, and we now have more than 70 third-party sources, 16 analytics subscribers, and 13 service partners.

In Gaining insights from Amazon Security Lake, AWS Principal Solutions Architect Mark Keating and AWS Security Engineering Manager Keith Gilbert detailed how to get the most out of Security Lake. Addressing questions such as, “How do I get access to the data?” and “What tools can I use?,” they demonstrated how analytics services and security information and event management (SIEM) solutions can connect to and use data stored within Security Lake to investigate security events and identify trends across an organization. They emphasized how bringing together logs in multiple formats and normalizing them into a single format empowers security teams to gain valuable context from security data, and more effectively respond to events. Data can be queried with Amazon Athena, or pulled by Amazon OpenSearch Service or your SIEM system directly from Security Lake.

Build your security data lake with Amazon Security Lake featured AWS Product Manager Jonathan Garzon, AWS Product Solutions Architect Ross Warren, and Global CISO of Interpublic Group (IPG) Troy Wilkinson demonstrating how Security Lake helps address common challenges associated with analyzing enterprise security data, and detailing how IPG is using the service. Wilkinson noted that IPG’s objective is to bring security data together in one place, improve searches, and gain insights from their data that they haven’t been able to before.

“With Security Lake, we found that it was super simple to bring data in. Not just the third-party data and Amazon data, but also our on-premises data from custom apps that we built.” — Troy Wilkinson, global CISO, Interpublic Group

Use automation and machine learning to reduce mean time to response

Incident response automation can help free security analysts from repetitive tasks, so they can spend their time identifying and addressing high-priority security issues.

In How LLA reduces incident response time with AWS Systems Manager, telecommunications provider Liberty Latin America (LLA) detailed how they implemented a security framework to detect security issues and automate incident response in more than 180 AWS accounts accessed by internal stakeholders and third-party partners by using AWS Systems Manager Incident Manager, AWS Organizations, Amazon GuardDuty, and AWS Security Hub.

LLA operates in over 20 countries across Latin America and the Caribbean. After completing multiple acquisitions, LLA needed a centralized security operations team to handle incidents and notify the teams responsible for each AWS account. They used GuardDuty, Security Hub, and Systems Manager Incident Manager to automate and streamline detection and response, and they configured the services to initiate alerts whenever there was an issue requiring attention.

Speaking alongside AWS Principal Solutions Architect Jesus Federico and AWS Principal Product Manager Sarah Holberg, LLA Senior Manager of Cloud Services Joaquin Cameselle noted that when GuardDuty identifies a critical issue, it generates a new finding in Security Hub. This finding is then forwarded to Systems Manager Incident Manager through an Amazon EventBridge rule. This configuration helps ensure the involvement of the appropriate individuals associated with each account.

“We have deployed a security framework in Liberty Latin America to identify security issues and streamline incident response across over 180 AWS accounts. The framework that leverages AWS Systems Manager Incident Manager, Amazon GuardDuty, and AWS Security Hub enabled us to detect and respond to incidents with greater efficiency. As a result, we have reduced our reaction time by 90%, ensuring prompt engagement of the appropriate teams for each AWS account and facilitating visibility of issues for the central security team.” — Joaquin Cameselle, senior manager, cloud services, Liberty Latin America

How Citibank (Citi) advanced their containment capabilities through automation outlined how the National Institute of Standards and Technology (NIST) Incident Response framework is applied to AWS services, and highlighted Citi’s implementation of a highly scalable cloud incident response framework designed to support the 28 AWS services in their cloud environment.

After describing the four phases of the incident response process — preparation and prevention; detection and analysis; containment, eradication, and recovery; and post-incident activity—AWS ProServe Global Financial Services Senior Engagement Manager Harikumar Subramonion noted that, to fully benefit from the cloud, you need to embrace automation. Automation benefits the third phase of the incident response process by speeding up containment, and reducing mean time to response.

Citibank Head of Cloud Security Operations Elvis Velez and Vice President of Cloud Security Damien Burks described how Citi built the Cloud Containment Automation Framework (CCAF) from the ground up by using AWS Step Functions and AWS Lambda, enabling them to respond to events 24/7 without human error, and reduce the time it takes to contain resources from 4 hours to 15 minutes. Velez described how Citi uses adversary emulation exercises that use the MITRE ATT&CK Cloud Matrix to simulate realistic attacks on AWS environments, and continuously validate their ability to effectively contain incidents.

Innovate and do more with less

Security operations teams are often understaffed, making it difficult to keep up with alerts. According to data from CyberSeek, there are currently 69 workers available for every 100 cybersecurity job openings.

Effectively evaluating security and compliance posture is critical, despite resource constraints. In Centralizing security at scale with Security Hub and Intuit’s experience, AWS Senior Solutions Architect Craig Simon, AWS Senior Security Hub Product Manager Dora Karali, and Intuit Principal Software Engineer Matt Gravlin discussed how to ease security management with Security Hub. Fortune 500 financial software provider Intuit has approximately 2,000 AWS accounts, 10 million AWS resources, and receives 20 million findings a day from AWS services through Security Hub. Gravlin detailed Intuit’s Automated Compliance Platform (ACP), which combines Security Hub and AWS Config with an internal compliance solution to help Intuit reduce audit timelines, effectively manage remediation, and make compliance more consistent.

“By using Security Hub, we leveraged AWS expertise with their regulatory controls and best practice controls. It helped us keep up to date as new controls are released on a regular basis. We like Security Hub’s aggregation features that consolidate findings from other AWS services and third-party providers. I personally call it the super aggregator. A key component is the Security Hub to Amazon EventBridge integration. This allowed us to stream millions of findings on a daily basis to be inserted into our ACP database.” — Matt Gravlin, principal software engineer, Intuit

At AWS re:Inforce, we launched a new Security Hub capability for automating actions to update findings. You can now use rules to automatically update various fields in findings that match defined criteria. This allows you to automatically suppress findings, update the severity of findings according to organizational policies, change the workflow status of findings, and add notes. With automation rules, Security Hub provides you a simplified way to build automations directly from the Security Hub console and API. This reduces repetitive work for cloud security and DevOps engineers and can reduce mean time to response.

In Continuous innovation in AWS detection and response services, AWS Worldwide Security Specialist Senior Manager Himanshu Verma and GuardDuty Senior Manager Ryan Holland highlighted new features that can help you gain actionable insights that you can use to enhance your overall security posture. After mapping AWS security capabilities to the core functions of the NIST Cybersecurity Framework, Verma and Holland provided an overview of AWS threat detection and response services that included a technical demonstration.

Bolstering incident response with AWS Wickr enterprise integrations highlighted how incident responders can collaborate securely during a security event, even on a compromised network. AWS Senior Security Specialist Solutions Architect Wes Wood demonstrated an innovative approach to incident response communications by detailing how you can integrate the end-to-end encrypted collaboration service AWS Wickr Enterprise with GuardDuty and AWS WAF. Using Wickr Bots, you can build integrated workflows that incorporate GuardDuty and third-party findings into a more secure, out-of-band communication channel for dedicated teams.

Evolve your incident response maturity

AWS re:Inforce featured many more highlights on incident response, including How to run security incident response in your Amazon EKS environment and Investigating incidents with Amazon Security Lake and Jupyter notebooks code talks, as well as the announcement of our Cyber Insurance Partners program. Content presented throughout the conference made one thing clear: AWS is working harder than ever to help you gain the insights that you need to strengthen your organization’s security posture, and accelerate incident response in the cloud.

To watch AWS re:Inforce sessions on demand, see the AWS re:Inforce playlists on YouTube.

 
If you have feedback about this post, submit comments in the Comments section below. If you have questions about this post, contact AWS Support.

Want more AWS Security news? Follow us on Twitter.

Anne Grahn

Anne Grahn

Anne is a Senior Worldwide Security GTM Specialist at AWS based in Chicago. She has more than a decade of experience in the security industry, and focuses on effectively communicating cybersecurity risk. She maintains a Certified Information Systems Security Professional (CISSP) certification.

Author

Himanshu Verma

Himanshu is a Worldwide Specialist for AWS Security Services. In this role, he leads the go-to-market creation and execution for AWS Security Services, field enablement, and strategic customer advisement. Prior to AWS, he held several leadership roles in Product Management, engineering and development, working on various identity, information security, and data protection technologies. He obsesses brainstorming disruptive ideas, venturing outdoors, photography, and trying various “hole in the wall” food and drinking establishments around the globe.

Jesus Federico

Jesus Federico

Jesus is a Principal Solutions Architect for AWS in the telecommunications vertical, working to provide guidance and technical assistance to communication service providers on their cloud journey. He supports CSPs in designing and implementing secure, resilient, scalable, and high-performance applications in the cloud.

With a zero-ETL approach, AWS is helping builders realize near-real-time analytics

Post Syndicated from Swami Sivasubramanian original https://aws.amazon.com/blogs/big-data/realizing-near-real-time-analytics-with-a-zero-etl-future/

Data is at the center of every application, process, and business decision. When data is used to improve customer experiences and drive innovation, it can lead to business growth. According to Forrester, advanced insights-driven businesses are 8.5 times more likely than beginners to report at least 20% revenue growth. However, to realize this growth, managing and preparing the data for analysis has to get easier.

That’s why AWS is investing in a zero-ETL future so that builders can focus more on creating value from data, instead of preparing data for analysis.

Challenges with ETL

What is ETL? Extract, Transform, Load is the process data engineers use to combine data from different sources. ETL can be challenging, time-consuming, and costly. Firstly, it invariably requires data engineers to create custom code. Next, DevOps engineers have to deploy and manage the infrastructure to make sure the pipelines scale with the workload. In case the data sources change, data engineers have to manually make changes in their code and deploy it again. While all of this is happening—a process that can take days—data analysts can’t run interactive analysis or build dashboards, data scientists can’t build machine learning (ML) models or run predictions, and end-users can’t make data-driven decisions.

Furthermore, the time required to build or change pipelines makes the data unfit for near-real-time use cases such as detecting fraudulent transactions, placing online ads, and tracking passenger train schedules. In these scenarios, the opportunity to improve customer experiences, address new business opportunities, or lower business risks can simply be lost.

On the flip side, when organizations can quickly and seamlessly integrate data that is stored and analyzed in different tools and systems, they get a better understanding of their customers and business. As a result, they can make data-driven predictions with more confidence, improve customer experiences, and promote data-driven insights across the business.

AWS is bringing its zero-ETL vision to life

We have been making steady progress towards bringing our zero-ETL vision to life. For example, customers told us that they want to ingest streaming data into their data stores for doing analytics—all without delving into the complexities of ETL.

With Amazon Redshift Streaming Ingestion, organizations can configure Amazon Redshift to directly ingest high-throughput streaming data from Amazon Managed Streaming for Apache Kafka (Amazon MSK) or Amazon Kinesis Data Streams and make it available for near-real-time analytics in just a few seconds. They can connect to multiple data streams and pull data directly into Amazon Redshift without staging it in Amazon Simple Storage Service (Amazon S3). After running analytics, the insights can be made available broadly across the organization with Amazon QuickSight, a cloud-native, serverless business intelligence service. QuickSight makes it incredibly simple and intuitive to get to answers with Amazon QuickSight Q, which allows users to ask business questions about their data in natural language and receive answers quickly through data visualizations.

Another example of AWS’s investment in zero-ETL is providing the ability to query a variety of data sources without having to worry about data movement. Using federated query in Amazon Redshift and Amazon Athena, organizations can run queries across data stored in their operational databases, data warehouses, and data lakes so that they can create insights from across multiple data sources with no data movement. Data analysts and data engineers can use familiar SQL commands to join data across several data sources for quick analysis, and store the results in Amazon S3 for subsequent use. This provides a flexible way to ingest data while avoiding complex ETL pipelines.

More recently, AWS introduced Amazon Aurora zero-ETL integration with Amazon Redshift at AWS re:Invent 2022. Check out the following video:

We learned from customers that they spend significant time and resources building and managing ETL pipelines between transactional databases and data warehouses. For example, let’s say a global manufacturing company with factories in a dozen countries uses a cluster of Aurora databases to store order and inventory data in each of those countries. When the company executives want to view all of the orders and inventory, the data engineers would have to build individual data pipelines from each of the Aurora clusters to a central data warehouse so that the data analysts can query the combined dataset. To do this, the data integration team has to write code to connect to 12 different clusters and manage and test 12 production pipelines. After the team deploys the code, it has to constantly monitor and scale the pipelines to optimize performance, and when anything changes, they have to make updates across 12 different places. It is quite a lot of repetitive work.

No more need for custom ETL pipelines between Aurora and Amazon Redshift

The Aurora zero-ETL integration with Amazon Redshift brings together the transactional data of Aurora with the analytics capabilities of Amazon Redshift. It minimizes the work of building and managing custom ETL pipelines between Aurora and Amazon Redshift. Unlike the traditional systems where data is siloed in one database and the user has to make a trade-off between unified analysis and performance, data engineers can replicate data from multiple Aurora database clusters into the same or new Amazon Redshift instance to derive holistic insights across many applications or partitions. Updates in Aurora are automatically and continuously propagated to Amazon Redshift so the data engineers have the most recent information in near-real time. The entire system can be serverless and dynamically scales up and down based on data volume, so there’s no infrastructure to manage. Now, organizations get the best of both worlds—fast, scalable transactions in Aurora together with fast, scalable analytics in Amazon Redshift—all in one seamless system. With near-real-time access to transactional data, organizations can leverage Amazon Redshift’s analytics and capabilities such as built-in ML, materialized views, data sharing, and federated access to multiple data stores and data lakes to derive insights from transactional and other data.

Improving the zero-ETL performance is a continuous goal for AWS. For instance, one of our early zero-ETL preview customers observed that the hundreds of thousands of transactions produced every minute from their Amazon Aurora MySQL databases appeared in less than 10 seconds into their Amazon Redshift warehouse. Previously, they had more than a 2-hour delay moving data from their ETL pipeline into Amazon Redshift. With the zero-ETL integration between Aurora and Redshift, they are now able to achieve near-real time analytics.

This integration is now available in Public Preview. To learn more, refer to Getting started guide for near-real-time analytics using Amazon Aurora zero-ETL integration with Amazon Redshift.

Zero-ETL makes data available to data engineers at the point of use through direct integrations between services and direct querying across a variety of data stores. This frees the data engineers to focus on creating value from the data, instead of spending time and resources building pipelines. AWS will continue investing in its zero-ETL vision so that organizations can accelerate their use of data to drive business growth.


About the Author

Swami Sivasubramanian is the Vice President of AWS Data and Machine Learning.

Amazon OpenSearch Service’s vector database capabilities explained

Post Syndicated from Jon Handler original https://aws.amazon.com/blogs/big-data/amazon-opensearch-services-vector-database-capabilities-explained/

OpenSearch is a scalable, flexible, and extensible open-source software suite for search, analytics, security monitoring, and observability applications, licensed under the Apache 2.0 license. It comprises a search engine, OpenSearch, which delivers low-latency search and aggregations, OpenSearch Dashboards, a visualization and dashboarding tool, and a suite of plugins that provide advanced capabilities like alerting, fine-grained access control, observability, security monitoring, and vector storage and processing. Amazon OpenSearch Service is a fully managed service that makes it simple to deploy, scale, and operate OpenSearch in the AWS Cloud.

As an end-user, when you use OpenSearch’s search capabilities, you generally have a goal in mind—something you want to accomplish. Along the way, you use OpenSearch to gather information in support of achieving that goal (or maybe the information is the original goal). We’ve all become used to the “search box” interface, where you type some words, and the search engine brings back results based on word-to-word matching. Let’s say you want to buy a couch in order to spend cozy evenings with your family around the fire. You go to Amazon.com, and you type “a cozy place to sit by the fire.” Unfortunately, if you run that search on Amazon.com, you get items like fire pits, heating fans, and home decorations—not what you intended. The problem is that couch manufacturers probably didn’t use the words “cozy,” “place,” “sit,” and “fire” in their product titles or descriptions.

In recent years, machine learning (ML) techniques have become increasingly popular to enhance search. Among them are the use of embedding models, a type of model that can encode a large body of data into an n-dimensional space where each entity is encoded into a vector, a data point in that space, and organized such that similar entities are closer together. An embedding model, for instance, could encode the semantics of a corpus. By searching for the vectors nearest to an encoded document — k-nearest neighbor (k-NN) search — you can find the most semantically similar documents. Sophisticated embedding models can support multiple modalities, for instance, encoding the image and text of a product catalog and enabling similarity matching on both modalities.

A vector database provides efficient vector similarity search by providing specialized indexes like k-NN indexes. It also provides other database functionality like managing vector data alongside other data types, workload management, access control and more. OpenSearch’s k-NN plugin provides core vector database functionality for OpenSearch, so when your customer searches for “a cozy place to sit by the fire” in your catalog, you can encode that prompt and use OpenSearch to perform a nearest neighbor query to surface that 8-foot, blue couch with designer arranged photographs in front of fireplaces.

Using OpenSearch Service as a vector database

With OpenSearch Service’s vector database capabilities, you can implement semantic search, Retrieval Augmented Generation (RAG) with LLMs, recommendation engines, and search rich media.

Semantic search

With semantic search, you improve the relevance of retrieved results using language-based embeddings on search documents. You enable your search customers to use natural language queries, like “a cozy place to sit by the fire” to find their 8-foot-long blue couch. For more information, refer to Building a semantic search engine in OpenSearch to learn how semantic search can deliver a 15% relevance improvement, as measured by normalized discounted cumulative gain (nDCG) metrics compared with keyword search. For a concrete example, our Improve search relevance with ML in Amazon OpenSearch Service workshop explores the difference between keyword and semantic search, based on a Bidirectional Encoder Representations from Transformers (BERT) model, hosted by Amazon SageMaker to generate vectors and store them in OpenSearch. The workshop uses product question answers as an example to show how keyword search using the keywords/phrases of the query leads to some irrelevant results. Semantic search is able to retrieve more relevant documents by matching the context and semantics of the query. The following diagram shows an example architecture for a semantic search application with OpenSearch Service as the vector database.

Architecture diagram showing how to use Amazon OpenSearch Service to perform semantic search to improve relevance

Retrieval Augmented Generation with LLMs

RAG is a method for building trustworthy generative AI chatbots using generative LLMs like OpenAI, ChatGPT, or Amazon Titan Text. With the rise of generative LLMs, application developers are looking for ways to take advantage of this innovative technology. One popular use case involves delivering conversational experiences through intelligent agents. Perhaps you’re a software provider with knowledge bases for product information, customer self-service, or industry domain knowledge like tax reporting rules or medical information about diseases and treatments. A conversational search experience provides an intuitive interface for users to sift through information through dialog and Q&A. Generative LLMs on their own are prone to hallucinations—a situation where the model generates a believable but factually incorrect response. RAG solves this problem by complementing generative LLMs with an external knowledge base that is typically built using a vector database hydrated with vector-encoded knowledge articles.

As illustrated in the following diagram, the query workflow starts with a question that is encoded and used to retrieve relevant knowledge articles from the vector database. Those results are sent to the generative LLM whose job is to augment those results, typically by summarizing the results as a conversational response. By complementing the generative model with a knowledge base, RAG grounds the model on facts to minimize hallucinations. You can learn more about building a RAG solution in the Retrieval Augmented Generation module of our semantic search workshop.

Architecture diagram showing how to use Amazon OpenSearch Service to perform retrieval-augmented generation

Recommendation engine

Recommendations are a common component in the search experience, especially for ecommerce applications. Adding a user experience feature like “more like this” or “customers who bought this also bought that” can drive additional revenue through getting customers what they want. Search architects employ many techniques and technologies to build recommendations, including Deep Neural Network (DNN) based recommendation algorithms such as the two-tower neural net model, YoutubeDNN. A trained embedding model encodes products, for example, into an embedding space where products that are frequently bought together are considered more similar, and therefore are represented as data points that are closer together in the embedding space. Another possibility
is that product embeddings are based on co-rating similarity instead of purchase activity. You can employ this affinity data through calculating the vector similarity between a particular user’s embedding and vectors in the database to return recommended items. The following diagram shows an example architecture of building a recommendation engine with OpenSearch as a vector store.

Architecture diagram showing how to use Amazon OpenSearch Service as a recommendation engine

Media search

Media search enables users to query the search engine with rich media like images, audio, and video. Its implementation is similar to semantic search—you create vector embeddings for your search documents and then query OpenSearch Service with a vector. The difference is you use a computer vision deep neural network (e.g. Convolutional Neural Network (CNN)) such as ResNet to convert images into vectors. The following diagram shows an example architecture of building an image search with OpenSearch as the vector store.

Architecture diagram showing how to use Amazon OpenSearch Service to search rich media like images, videos, and audio files

Understanding the technology

OpenSearch uses approximate nearest neighbor (ANN) algorithms from the NMSLIB, FAISS, and Lucene libraries to power k-NN search. These search methods employ ANN to improve search latency for large datasets. Of the three search methods the k-NN plugin provides, this method offers the best search scalability for large datasets. The engine details are as follows:

  • Non-Metric Space Library (NMSLIB) – NMSLIB implements the HNSW ANN algorithm
  • Facebook AI Similarity Search (FAISS) – FAISS implements both HNSW and IVF ANN algorithms
  • Lucene – Lucene implements the HNSW algorithm

Each of the three engines used for approximate k-NN search has its own attributes that make one more sensible to use than the others in a given situation. You can follow the general information in this section to help determine which engine will best meet your requirements.

In general, NMSLIB and FAISS should be selected for large-scale use cases. Lucene is a good option for smaller deployments, but offers benefits like smart filtering where the optimal filtering strategy—pre-filtering, post-filtering, or exact k-NN—is automatically applied depending on the situation. The following table summarizes the differences between each option.

.

NMSLIB-HNSW

FAISS-HNSW

FAISS-IVF

Lucene-HNSW

Max Dimension

16,000

16,000

16,000

1024

Filter

Post filter

Post filter

Post filter

Filter while search

Training Required

No

No

Yes

No

Similarity Metrics

l2, innerproduct, cosinesimil, l1, linf

l2, innerproduct

l2, innerproduct

l2, cosinesimil

Vector Volume

Tens of billions

Tens of billions

Tens of billions

< Ten million

Indexing latency

Low

Low

Lowest

Low

Query Latency & Quality

Low latency & high quality

Low latency & high quality

Low latency & low quality

High latency & high quality

Vector Compression

Flat

Flat

Product Quantization

Flat

Product Quantization

Flat

Memory Consumption

High

High

Low with PQ

Medium

Low with PQ

High

Approximate and exact nearest-neighbor search

The OpenSearch Service k-NN plugin supports three different methods for obtaining the k-nearest neighbors from an index of vectors: approximate k-NN, score script (exact k-NN), and painless extensions (exact k-NN).

Approximate k-NN

The first method takes an approximate nearest neighbor approach—it uses one of several algorithms to return the approximate k-nearest neighbors to a query vector. Usually, these algorithms sacrifice indexing speed and search accuracy in return for performance benefits such as lower latency, smaller memory footprints, and more scalable search. Approximate k-NN is the best choice for searches over large indexes (that is, hundreds of thousands of vectors or more) that require low latency. You should not use approximate k-NN if you want to apply a filter on the index before the k-NN search, which greatly reduces the number of vectors to be searched. In this case, you should use either the score script method or painless extensions.

Score script

The second method extends the OpenSearch Service score script functionality to run a brute force, exact k-NN search over knn_vector fields or fields that can represent binary objects. With this approach, you can run k-NN search on a subset of vectors in your index (sometimes referred to as a pre-filter search). This approach is preferred for searches over smaller bodies of documents or when a pre-filter is needed. Using this approach on large indexes may lead to high latencies.

Painless extensions

The third method adds the distance functions as painless extensions that you can use in more complex combinations. Similar to the k-NN score script, you can use this method to perform a brute force, exact k-NN search across an index, which also supports pre-filtering. This approach has slightly slower query performance compared to the k-NN score script. If your use case requires more customization over the final score, you should use this approach over score script k-NN.

Vector search algorithms

The simple way to find similar vectors is to use k-nearest neighbors (k-NN) algorithms, which compute the distance between a query vector and the other vectors in the vector database. As we mentioned earlier, the score script k-NN and painless extensions search methods use the exact k-NN algorithms under the hood. However, in the case of extremely large datasets with high dimensionality, this creates a scaling problem that reduces the efficiency of the search. Approximate nearest neighbor (ANN) search methods can overcome this by employing tools that restructure indexes more efficiently and reduce the dimensionality of searchable vectors. There are different ANN search algorithms; for example, locality sensitive hashing, tree-based, cluster-based, and graph-based. OpenSearch implements two ANN algorithms: Hierarchical Navigable Small Worlds (HNSW) and Inverted File System (IVF). For a more detailed explanation of how the HNSW and IVF algorithms work in OpenSearch, see blog post “Choose the k-NN algorithm for your billion-scale use case with OpenSearch”.

Hierarchical Navigable Small Worlds

The HNSW algorithm is one of the most popular algorithms out there for ANN search. The core idea of the algorithm is to build a graph with edges connecting index vectors that are close to each other. Then, on search, this graph is partially traversed to find the approximate nearest neighbors to the query vector. To steer the traversal towards the query’s nearest neighbors, the algorithm always visits the closest candidate to the query vector next.

Inverted File

The IVF algorithm separates your index vectors into a set of buckets, then, to reduce your search time, only searches through a subset of these buckets. However, if the algorithm just randomly split up your vectors into different buckets, and only searched a subset of them, it would yield a poor approximation. The IVF algorithm uses a more elegant approach. First, before indexing begins, it assigns each bucket a representative vector. When a vector is indexed, it gets added to the bucket that has the closest representative vector. This way, vectors that are closer to each other are placed roughly in the same or nearby buckets.

Vector similarity metrics

All search engines use a similarity metric to rank and sort results and bring the most relevant results to the top. When you use a plain text query, the similarity metric is called TF-IDF, which measures the importance of the terms in the query and generates a score based on the number of textual matches. When your query includes a vector, the similarity metrics are spatial in nature, taking advantage of proximity in the vector space. OpenSearch supports several similarity or distance measures:

  • Euclidean distance – The straight-line distance between points.
  • L1 (Manhattan) distance – The sum of the differences of all of the vector components. L1 distance measures how many orthogonal city blocks you need to traverse from point A to point B.
  • L-infinity (chessboard) distance – The number of moves a King would make on an n-dimensional chessboard. It’s different than Euclidean distance on the diagonals—a diagonal step on a 2-dimensional chessboard is 1.41 Euclidean units away, but 2 L-infinity units away.
  • Inner product – The product of the magnitudes of two vectors and the cosine of the angle between them. Usually used for natural language processing (NLP) vector similarity.
  • Cosine similarity – The cosine of the angle between two vectors in a vector space.
  • Hamming distance – For binary-coded vectors, the number of bits that differ between the two vectors.

Advantage of OpenSearch as a vector database

When you use OpenSearch Service as a vector database, you can take advantage of the service’s features like usability, scalability, availability, interoperability, and security. More importantly, you can use OpenSearch’s search features to enhance the search experience. For example, you can use Learning to Rank in OpenSearch to integrate user clickthrough behavior data into your search application and improve search relevance. You can also combine OpenSearch text search and vector search capabilities to search documents with keyword and semantic similarity. You can also use other fields in the index to filter documents to improve relevance. For advanced users, you can use a hybrid scoring model to combine OpenSearch’s text-based relevance score, computed with the Okapi BM25 function and its vector search score to improve the ranking of your search results.

Scale and limits

OpenSearch as vector database support billions of vector records. Keep in mind the following calculator regarding number of vectors and dimensions to size your cluster.

Number of vectors

OpenSearch VectorDB takes advantage of the sharding capabilities of OpenSearch and can scale to billions of vectors at single-digit millisecond latencies by sharding vectors and scale horizontally by adding more nodes. The number of vectors that can fit in a single machine is a function of the off-heap memory availability on the machine. The number of nodes required will depend on the amount of memory that can be used for the algorithm per node and the total amount of memory required by the algorithm. The more nodes, the more memory and better performance. The amount of memory available per node is computed as memory_available = (node_memoryjvm_size) * circuit_breaker_limit, with the following parameters:

  • node_memory – The total memory of the instance.
  • jvm_size – The OpenSearch JVM heap size. This is set to half of the instance’s RAM, capped at approximately 32 GB.
  • circuit_breaker_limit – The native memory usage threshold for the circuit breaker. This is set to 0.5.

Total cluster memory estimation depends on total number of vector records and algorithms. HNSW and IVF have different memory requirements. You can refer to Memory Estimation for more details.

Number of dimensions

OpenSearch’s current dimension limit for the vector field knn_vector is 16,000 dimensions. Each dimension is represented as a 32-bit float. The more dimensions, the more memory you’ll need to index and search. The number of dimensions is usually determined by the embedding models that translate the entity to a vector. There are a lot of options to choose from when building your knn_vector field. To determine the correct methods and parameters to choose, refer to Choosing the right method.

Customer stories:

Amazon Music

Amazon Music is always innovating to provide customers with unique and personalized experiences. One of Amazon Music’s approaches to music recommendations is a remix of a classic Amazon innovation, item-to-item collaborative filtering, and vector databases. Using data aggregated based on user listening behavior, Amazon Music has created an embedding model that encodes music tracks and customer representations into a vector space where neighboring vectors represent tracks that are similar. 100 million songs are encoded into vectors, indexed into OpenSearch, and served across multiple geographies to power real-time recommendations. OpenSearch currently manages 1.05 billion vectors and supports a peak load of 7,100 vector queries per second to power Amazon Music recommendations.

The item-to-item collaborative filter continues to be among the most popular methods for online product recommendations because of its effectiveness at scaling to large customer bases and product catalogs. OpenSearch makes it easier to operationalize and further the scalability of the recommender by providing scale-out infrastructure and k-NN indexes that grow linearly with respect to the number of tracks and similarity search in logarithmic time.

The following figure visualizes the high-dimensional space created by the vector embedding.

A visualization of the vector encoding of Amazon Music entries in the large vector space

Brand protection at Amazon

Amazon strives to deliver the world’s most trustworthy shopping experience, offering customers the widest possible selection of authentic products. To earn and maintain our customers’ trust, we strictly prohibit the sale of counterfeit products, and we continue to invest in innovations that ensure only authentic products reach our customers. Amazon’s brand protection programs build trust with brands by accurately representing and completely protecting their brand. We strive to ensure that public perception mirrors the trustworthy experience we deliver. Our brand protection strategy focuses on four pillars: (1) Proactive Controls (2) Powerful Tools to Protect Brands (3) Holding Bad Actors Accountable (4) Protecting and Educating Customers. Amazon OpenSearch Service is a key part of Amazon’s Proactive Controls.

In 2022, Amazon’s automated technology scanned more than 8 billion attempted changes daily to product detail pages for signs of potential abuse. Our proactive controls found more than 99% of blocked or removed listings before a brand ever had to find and report it. These listings were suspected of being fraudulent, infringing, counterfeit, or at risk of other forms of abuse. To perform these scans, Amazon created tooling that uses advanced and innovative techniques, including the use of advanced machine learning models to automate the detection of intellectual property infringements in listings across Amazon’s stores globally. A key technical challenge in implementing such automated system is the ability to search for protected intellectual property within a vast billion-vector corpus in a fast, scalable and cost effective manner. Leveraging Amazon OpenSearch Service’s scalable vector database capabilities and distributed architecture, we successfully developed an ingestion pipeline that has indexed a total of 68 billion, 128- and 1024-dimension vectors into OpenSearch Service to enable brands and automated systems to conduct infringement detection, in real-time, through a highly available and fast (sub-second) search API.

Conclusion

Whether you’re building a generative AI solution, searching rich media and audio, or bringing more semantic search to your existing search-based application, OpenSearch is a capable vector database. OpenSearch supports a variety of engines, algorithms, and distance measures that you can employ to build the right solution. OpenSearch provides a scalable engine that can support vector search at low latency and up to billions of vectors. With OpenSearch and its vector DB capabilities, your users can find that 8-foot-blue couch easily, and relax by a cozy fire.


About the Authors

Jon Handler is a Senior Principal Solutions Architect with AWSJon Handler is a Senior Principal Solutions Architect at Amazon Web Services based in Palo Alto, CA. Jon works closely with OpenSearch and Amazon OpenSearch Service, providing help and guidance to a broad range of customers who have search and log analytics workloads that they want to move to the AWS Cloud. Prior to joining AWS, Jon’s career as a software developer included four years of coding a large-scale, eCommerce search engine. Jon holds a Bachelor of the Arts from the University of Pennsylvania, and a Master of Science and a Ph. D. in Computer Science and Artificial Intelligence from Northwestern University.

Jianwei Li is a Principal Analytics Specialist TAM at Amazon Web Services. Jianwei provides consultant service for customers to help customer design and build modern data platform. Jianwei has been working in big data domain as software developer, consultant and tech leader.

Dylan Tong is a Senior Product Manager at AWS. He works with customers to help drive their success on the AWS platform through thought leadership and guidance on designing well architected solutions. He has spent most of his career building on his expertise in data management and analytics by working for leaders and innovators in the space.

Vamshi Vijay Nakkirtha is a Software Engineering Manager working on the OpenSearch Project and Amazon OpenSearch Service. His primary interests include distributed systems. He is an active contributor to various plugins, like k-NN, GeoSpatial, and dashboard-maps.

Let’s Architect! Open-source technologies on AWS

Post Syndicated from Vittorio Denti original https://aws.amazon.com/blogs/architecture/lets-architect-open-source-technologies-on-aws/

We brought you a Let’s Architect! blog post about open-source on AWS that covered some technologies with development led by AWS/Amazon, as well as well-known solutions available on managed AWS services. Today, we’re following the same approach to share more insights about the process itself for developing open-source. That’s why the first topic we discuss in this post is a re:Invent talk from Heitor Lessa, Principal Solutions Architect at AWS, explaining some interesting approaches for developing and scaling successful open-source projects.

This edition of Let’s Architect! also touches on observability with Open Telemetry, Apache Kafka on AWS, and Infrastructure as Code with an hands-on workshop on AWS Cloud Development Kit (AWS CDK).

Powertools for AWS Lambda: Lessons from the road to 10 million downloads

Powertools for AWS Lambda is an open-source library to help engineering teams implement serverless best practices. In two years, Powertools went from an initial prototype to a fast-growing project in the open-source world. Rapid growth along with support from a wide community led to challenges from balancing new features with operational excellence to triaging bug reports and RFCs and scaling and redesigning documentation.

In this session, you can learn about Powertools for AWS Lambda to understand what it is and the problems it solves. Moreover, there are many valuable lessons to learn how to create and scale a successful open-source project. From managing the trade-off between releasing new features and achieving operational stability to measuring the impact of the project, there are many challenges in open-source projects that require careful thought.

Take me to this video!

Heitor Lessa describing one the key lessons: development and releasing new features should be as important as the other activities (governance, operational excellence, and more)

Heitor Lessa describing one of the key lessons: development and releasing new features should be as important as the other activities (governance, operational excellence, and more).

Observability the open-source way

The recent blog post Let’s Architect! Monitoring production systems at scale talks about the importance of monitoring. Setting up observability is critical to maintain application and infrastructure health, but instrumenting applications to collect monitoring signals such as metrics and logs can be challenging when using vendor-specific SDKs.

This video introduces you to OpenTelemetry, an open-source observability framework. OpenTelemetry provides a flexible, single vendor-agnostic SDK based on open-source specifications that developers can use to instrument and collect signals from applications. This resource explains how it works in practice and how to monitor microservice-based applications with the OpenTelemetry SDK.

Take me to this video!

With AWS Distro for OpenTelemetry, you can collect data from your AWS resources.

With AWS Distro for OpenTelemetry, you can collect data from your AWS resources.

Best practices for right-sizing your Apache Kafka clusters to optimize performance and cost

Apache Kafka is an open-source streaming data store that decouples applications producing streaming data (producers) into its data store from applications consuming streaming data (consumers) from its data store. Amazon Managed Streaming for Apache Kafka (Amazon MSK) allows you to use the open-source version of Apache Kafka with the service managing infrastructure and operations for you.

This blog post explains how the underlying infrastructure configuration can affect Apache Kafka performance. You can learn strategies on how to size the clusters to meet the desired throughput, availability, and latency requirements. This resource helps you discover strategies to find the optimal sizing for your resources, and learn the mental models adopted to conduct the investigation and derive the conclusions.

Take me to this blog!

Comparisons of put latencies for three clusters with different broker sizes

Comparisons of put latencies for three clusters with different broker sizes

AWS Cloud Development Kit workshop

AWS Cloud Development Kit (AWS CDK) is an open-source software development framework that allows you to provision cloud resources programmatically (Infrastructure as Code or IaC) by using familiar programming languages such as Python, Typescript, Javascript, Java, Go, and C#/.Net.

CDK allows you to create reusable template and assets, test your infrastructure, make deployments repeatable, and make your cloud environment stable by removing manual (and error-prone) operations. This workshop introduces you to CDK, where you can learn how to provision an initial simple application as well as become familiar with more advanced concepts like CDK constructs.

Take me to this workshop!

This construct can be attached to any Lambda function that is used as an API Gateway backend. It counts how many requests were issued to each URL.

This construct can be attached to any Lambda function that is used as an API Gateway backend. It counts how many requests were issued to each URL.

See you next time!

Thanks for joining our conversation! To find all the blogs from this series, you can check out the Let’s Architect! list of content on the AWS Architecture Blog.

Removing header remapping from Amazon API Gateway, and notes about our work with security researchers

Post Syndicated from Mark Ryland original https://aws.amazon.com/blogs/security/removing-header-remapping-from-amazon-api-gateway-and-notes-about-our-work-with-security-researchers/

At Amazon Web Services (AWS), our APIs and service functionality are a promise to our customers, so we very rarely make breaking changes or remove functionality from production services. Customers use the AWS Cloud to build solutions for their customers, and when disruptive changes are made or functionality is removed, the downstream impacts can be significant. As builders, we’ve felt the impact of these types of changes ourselves, and we work hard to avoid these situations whenever possible.

When we do need to make breaking changes, we try to provide a smooth path forward for customers who were using the old functionality. Often that means changing the behavior for new users or new deployments, and then allowing a transition window for existing customers to migrate from the old to the new behavior. There are many examples of this pattern, such as an update to IAM role trust policy behavior that we made last year.

This post explains one such recent change that we’ve made in Amazon API Gateway. We also discuss how we work with the security research community to improve things for customers.

Summary and customer impact

Recently, researchers at Omegapoint disclosed an edge case issue with how API Gateway handled HTTP header remapping with custom authorizers based on AWS Lambda. As is often the case with security research, this work generated a second, tangentially related authorization-caching issue that the Omegapoint team also reported.

After analyzing these reports, the API Gateway team decided to remove a documented feature from the service and to adjust another behavior to improve service behavior. We’ve made the appropriate changes to the API Gateway documentation.

As of June 14, 2023, the header remapping feature is no longer available in API Gateway. Customers can still use Velocity Template Language-based (VTL) transformations for header remapping, because this approach wasn’t impacted by the reported issue. If you’re using this design pattern in API Gateway and have questions about this change, reach out to your AWS support team.

The authorization-caching behavior was working as originally designed; but based on the report, we’ve adjusted it to better meet customer expectations.

The team at Omegapoint has published their findings in the blog post Writeup: AWS API Gateway header smuggling and cache confusion.

Before we removed the feature, we contacted customers who were using the direct HTTP header remapping feature through email and the AWS Health Dashboard. If you haven’t been contacted, no action is required on your part.

More details

The main issue that Omegapoint reported was related to a documented, client-controlled HTTP header remapping feature in API Gateway. This feature allowed customers to use one set of header values in the interaction between their clients and API Gateway, and a different set of header values from API Gateway to the backend. The client could send two sets of header values: one for API Gateway and one for the backend. API Gateway would process both sets, but then remap (overwrite) one set of values with another set. This feature was especially useful when allowing newly created API Gateway clients to continue to work with legacy servers whose header-handling logic couldn’t be modified.

The report from Omegapoint highlighted that customers who relied on Lambda authorizers for request-based authorization could be surprised when the remapping feature was used to overwrite header values that were used for further authorization on the backend, which could potentially lead to unintended access. The Lambda authorizer itself worked as expected on unmapped headers, but if there was additional authorization logic in the backend, it could be impacted by a misbehaving client.

The second issue that Omegapoint reported was related to the caching behavior in API Gateway for authorization policies. Previously, the caching method might reuse a cached authorization with a different value when the <method.request.multivalueheader.*> value was used in the request header within the time-to-live (TTL) of the cached value. This was the expected behavior of the wildcard value.

However, after reviewing the report, we agreed that it could surprise customers, and potentially allow misbehaving clients to bypass expected authorization. We were able to change this behavior without customer impact, because there is no evidence of customers relying on this behavior. So now, cached authorizations are no longer used in the <multivalueheader> case.

How we work with researchers

Security researchers regularly submit vulnerability reports to AWS Security. Some researchers are independent, some work in academic institutions, and others work in AWS partner or customer organizations. Our Outreach team triages submissions rapidly. Upon receipt, we start a conversation and work closely with researchers to understand their concerns, give our perspective, and agree on the best path forward.

If technical changes are required, our services and security teams work together to determine and implement the appropriate remediations based on the potential impact. They work with affected customers to reduce or eliminate impacts, and they work with the researchers to coordinate the publication of their findings.

Often these reports highlight situations where the designed and documented behavior might result in a surprising outcome for some customers. In those cases, we work with the researcher to make the appropriate updates to the documentation, if needed, and help ensure that the researcher’s finding is published with customer education as the primary goal.

In other cases, where warranted, we communicate about security issues to the broader customer and security community by using a security bulletin. Finally, we publish security blog posts in cases where providing more context makes sense, such as the current issue.

Security is our top priority, and working with the community to make our customers and the AWS Cloud safer is a key part of that. Clear communication helps build understanding and trust.

Working together

We removed the direct remapping feature because not many customers were using it, and we felt that documentation warning against the impacted design choices provided insufficient visibility and protection for customers. We designed and released the feature in an era when it was reasonable to assume that an API Gateway client would be well-behaved, but as times change, it now makes sense that an API client could be potentially negligent or even hostile. There are multiple alternative approaches that can provide the same outcome for customers, but in a more expected and controlled manner, which made this a simpler process to work through.

When researchers report potential security findings, we work through our process to determine the best outcome for our customers. In most cases, we can adjust designs to address the issue, while maintaining the affected features.

In rare cases, such as this one, the more effective path forward is to sunset a feature in favor of a more expected and secure approach. This is a core principle of evolving architectures and building resilient systems. It’s something that we practice regularly at AWS and a key principle that we share with our customers and the community through the AWS Well-Architected Framework.

Our thanks to the team at Omegapoint for reporting these issues, and to all of the researchers who continue to work with us to help make the AWS Cloud safer for our customers.

Want more AWS Security news? Follow us on Twitter.

Mark Ryland

Mark Ryland

Mark is the director of the Office of the CISO for AWS. He has over 30 years of experience in the technology industry, and has served in leadership roles in cybersecurity, software engineering, distributed systems, technology standardization, and public policy. Previously, he served as the Director of Solution Architecture and Professional Services for the AWS World Public Sector team.

Amazon SES – Set up notifications for bounces and complaints

Post Syndicated from Vinay Ujjini original https://aws.amazon.com/blogs/messaging-and-targeting/amazon-ses-set-up-notifications-for-bounces-and-complaints/

Why is it important to monitor bounces and complaints when using Amazon Simple Email Service?

Amazon Simple Email Service (Amazon SES) is a scalable cloud email service provider that is cost-effective and flexible. Amazon SES allows businesses and individuals to send bulk emails to their customers and subscribers. However, as with any email service, there is always a risk of emails bouncing or being marked as spam by recipients. These bounces and complaints can have serious consequences for your email deliverability and can even lead to your email account being suspended or blocked. That’s why it’s important to monitor bounces and complaints when using Amazon SES for email sending. By using Simple Notification Services (Amazon SNS) notifications, you can set up notifications and proactively address any issues and ensure that your emails are delivered successfully to your intended recipients. In this blog, we’ll show how to set up notifications for bounces and complaints in Amazon SES, so you can stay on top of your email deliverability and maintain a positive sender reputation.

Understanding bounces and complaints:

Understanding bounces and complaints is crucial when it comes to email marketing. In simple terms, a bounce occurs when an email is undeliverable and is returned to the sender. There are two types of bounces: soft bounces and hard bounces. A soft bounce is a temporary issue, such as a full inbox or a server error, and the email may be delivered successfully on a subsequent attempt. A hard bounce, on the other hand, is a permanent issue, such as an invalid email address, and the email will never be delivered. On the other hand, a complaint occurs when a recipient marks an email as spam or unwanted. Complaints can be particularly damaging to your email deliverability and can lead to your emails being blocked or sent to the recipient’s spam folder. By monitoring bounces and complaints and taking appropriate action, you can maintain a positive sender reputation and ensure that your emails are delivered successfully to your intended recipients.

Amazon SES provides tools like Virtual Deliverability Manager (VDM) to manage the deliverability at the ISP, sub-domain or configuration set level. You can see the details in this blog.

Solution walkthrough:

This post gives detailed instructions on how to use Amazon Simple Notification Service SNS to monitor and receive notifications on bounces and complaints in Amazon SES. This blog also has FAQs and troubleshooting tips if you are not receiving notifications following the setup: (below are the steps with detailed instructions and screenshots)

Prerequisites:

For this walkthrough, you should have the following prerequisites:

  1. An active AWS account.
  2. A verified identity (Email address or Domain) in Amazon SES.
  3. Administrative Access to Amazon SES Console and Amazon SNS Console.

Step 1: Create an Amazon SNS topic and subscription:

      1. Sign in to the Amazon SNS console.
      2. Under Amazon SNS homepage provide a Topic name and click on Next steps:
      3. SNS topic image
      4. For Type, choose a topic type Standard.
        Note: Standard topics are better suited for use cases that require higher message publish and delivery throughput rates which fits the SES bounces and complaints monitoring.
      5. SNS standard queue
      6. (Optional) Expand the Encryption section if you would like to encrypt the SNS topic.
        • Choose Enable encryption.
        • Specify the AWS KMS key. For more information, see Key terms.
        • For each KMS type, the Description, Account, and KMS ARN are displayed.
      7. Encryption image
      8. Scroll to the end of the form and choose Create topic. The topic is created and the console opens the new topic’s Details page.
      9. To create the subscription on the Subscriptions page, choose Create subscription.
      10. SNS Subscription page
      11. On the Create subscription page, choose the Topic ARN that you created in the previous step.
      12. For Protocol, choose Email. There are multiple protocols available to use and it depends on where you would like to receive the SNS notifications for bounces and complaints. Please refer to list of available protocols.
      13. For Endpoint, enter an email address that can receive notifications.
        Note: this should be existing email address with accessible mailbox.
      14. SNS Subscription details
      15. Scroll to the bottom and click Create subscription. The console opens the new subscription’s Details page.
      16. After your subscription is created, you need to confirm it through the email address provided above.
      17. Check your email inbox you provided in the endpoint in previous step and and choose Confirm subscription in the email from AWS Notifications. The sender ID is usually “[email protected]“.
      18. AWS Notification email
      19. Amazon SNS opens your web browser and displays a subscription confirmation with your subscription ID.
      20. Subscription confirmation email
      21. After subscription is confirmed, refresh the subscription’s Details page and the subscription status will move from Pending to Confirmed.
      22. Subscription details
  • Step 2: Configure Amazon SES to send bounces and complaints to the Amazon SNS topic created:

In this step, I am presenting two methods to monitor your bounces and complaints. Follow Demo 1, if you are looking for a simple way to monitor bounces and complaints events for a specific email identity. Follow Demo 2, if you have many email identities and you want to monitor bounces and complaints along with other events using configuration sets “groups of rules that you can apply to all your verified identities”.

Demo 1: Configure Amazon SES to monitor bounces and complaints for specific email identity (Email, Domain):

The domain/sub-domain/email identity must have a Verified status. If the identity is not in verified status, refer to steps to verify identity with Amazon SES before continuing further.

Prior to starting this demo, it is important to know if you have a verified domain, subdomain, or an email address that shares the root domain. The identity settings (such as SNS and feedback notifications) apply at the most granular level you have set up the verification. Hierarchy is as below:

  • Verified email address identity settings override verified domain identity settings.
  • Verified subdomain identity settings override verified domain identity settings. (lower-level subdomain settings override higher-level subdomain settings).

Hence, if you want to monitor bounces and complaints for all email addresses under one domain, it is recommended to verify the domain identity with SES and apply this setting at the domain identity level. If you want to monitor bounces and complaints for specific email address under a verified domain identity, verify this email address explicitly with SES and apply this settings into the email identity level.

  1. Sign in to the Amazon SES console.
  2. In the navigation pane, under Configuration, choose Verified identities.
  3. Verified email identities
  4. Select the verified identity in which you want to monitor for bounces and complaints notifications.
  5. In the details screen of the verified identity you selected, choose the Notifications tab and select Edit in the Feedback notifications container.
  6. Notifications
  7. Expand the SNS topic list box of bounce and complaint feedback type and select the SNS topic you created in Step 1.
    (Optional) If you want your topic notification to include the headers from the original email, check the Include original email headers box directly underneath the SNS topic name of each feedback type then click on save changes.
  8. SNS topics
  9. After configured SNS topic for bounces and complaints, you can disable Email Feedback Forwarding notifications to avoid receive double notifications through Email Feedback Forwarding and SNS notifications.
  10. To Disable it, under the Notifications tab on the details screen of the verified identity, in the Email Feedback Forwarding container, choose Edit, uncheck the Enabled box, and choose Save changes.
  11. Feedback forwarding disabled

Demo 2: Configure Amazon SES to monitor bounces and complaints for emails sent with a configuration set using Amazon SES event publishing.

Configuration sets in SES are groups of rules, that you can apply to your verified identities. When you apply a configuration set to an email, all of the rules in that configuration set are applied to the email. You can use different type of rules with a configuration set. This demo will use event destination, which will allow you to publish bounces and complaints to the SNS topic.

Note: You must pass the name of the configuration set when sending an email. This can be done by either specifying the configuration set name in the headers of emails, or specifying it as a default configuration set. This can be done at the time of identity creation, or later while editing a verified identity.

  1. Sign in to the Amazon SES console.
  2. In the navigation pane, under Configuration, choose Configuration sets. Choose Create set.
  3. Configuration set image
  4. Enter Configuration set name, leave the rest of fields to default, scroll to the send and click on Create set.
  5. Create configuration set
  6. After Configuration set is created, you now need to create Amazon SES event destinations as shown below. Amazon SES sends all bounce and complaint notifications to event destination. In this blog the event destination is Amazon SNS topic.
  7. Navigate to the configuration set you created in step 3. Under configuration set home page click on Event destinations and select Add destination.
  8. Event destinations
  9. Under Select event types, check hard bounces and complaints boxes and click Next.
  10. Event types selection
  11. Specify destination for receiving bounce and complaints notifications, there’s couple of destinations types to choose from. in this demo, we will use Amazon SNS.
  12. Name – enter the name of the destination for this configuration set. The name can include letters, numbers, dashes, and hyphens.
  13. Event publishing – to turn on event publishing for this destination, select the Enabled check box.
  14. Under Amazon Simple Notification Service (SNS) topic , Expand the SNS topic list box and select the SNS topic you created in Step 1 and click Next.
  15. Use SES as destination
  16. Review, When you are satisfied that your entries are correct, choose Add destination to add your event destination.
  17. Once you choose Add destination , the summary of event destination will show a “Successfully validated SNS topic for Amazon SES event publishing” email.
  18. Successful notification

Step 3: Using Amazon SES Mailbox Simulator to test send and receive a bounce notification via SNS topic:

Test 1: Send a test email to test Demo 1 “Configure Amazon SES to monitor bounces and complaints for specific email identity (Email, Domain) ” in previous step

In this test, I will send a test message from my verified identity which configured to send any bounce and complaint notifications it receives to SNS topic and email address subscribed to the topic. I will use SES mailbox simulator to simulate a bounce message to test this setup.

  1. Sign in to the Amazon SES console.
  2. In the navigation pane, under Configuration, choose Verified identities.
  3. Select the verified identity you configured SNS notifications for bounces and complaints in Demo 1. In this test, I selected a verified domain identity.
  4. Click on Send test email from the upper right corner.
  5. Sending test email
  6. Under send message details, in From-address enter the first part of email address under this verified domain (from-address could be pre-populated).
  7. For Scenario, Expand the simulated scenarios and select Bounce scenario to test send a bounce message.
  8. For Subject, enter the desired email subject. For Body, type an optional body text then leave the rest of options as a default. Click on Send test email to send the email.
  9. Message details
  10. You should have an email from AWS notifications with bounce notification and details on the bounce.
  11. Content of bounce message includes the notificationType “Bounce/Complaint”, bouncedRecipients, diagnosticCode “reason the message bounced”, remoteMtaIp “IP of the recipient MTA rejected the message”, SourceIp “IP of the sender application”, callerIdentity “IAM user sending this message”. These details can help in identifying the reason behind why email is not delivered and bounced and will help you avoid such bounces in the future. Refer this document for additional content on bounce events.
  12. AWS notification message

Test 2: Send a test email to test Demo 2 “Configure Amazon SES to monitor bounces and complaints for emails sent with a configuration set using Amazon SES event publishing” in previous step

In this test, you can send a test message from any verified identity and by using the configuration set created in Step 2 which is configured to send any bounce and complaint notifications to SNS topic and email address subscribed to the topic. You can use SES mailbox simulator to simulate a bounce message to test this setup.

  1. Sign in to the Amazon SES console.
  2. In the navigation pane, under Configuration, choose Verified identities.
  3. Select any verified identity you want to send emails from. In this test, I selected a verified domain identity.
  4. Click on Send test email from the upper right corner.
  5. Under send message details From-address enter the first part of email address under this verified domain.
  6. For Scenario, Expand the simulated scenarios and select Bounce scenario to test send a bounce message.
  7. For Subject, enter the desired email subject. For Body, type an optional body text.
  8. For Configuration set, Expand the drop-down list and choose the configuration set you created in Demo 2.
  9. Click on Send test email to send the email.
  10. Message details
  11. You will find an email from AWS notifications with bounce notification and all details of the bounce.
  12. Content of bounce message includes the EventType “Bounce/Complaint”, bouncedRecipients, diagnosticCode “reason the message bounced” , remoteMTA “IP of the recipient MTA rejected the message”, SourceIp “IP of the sender application”, callerIdentity “IAM user sending this message”, ses:configuration-set “name of the configuration set you use when sending the email” all of this details can help you to identify the reason behind why email is not delivered and bounced and will help you to avoid such bounces in the future. Refer this document for more details on contents of bounce events.
  13. SES notification email

FAQ on this set up:

I configured SNS topic with KMS encryption and I am not receiving bounce or complain notifications for emails:
If your Amazon SNS topic uses AWS Key Management Service (AWS KMS) for server-side encryption, you have to add permissions to the AWS KMS key policy to allow SES service access the KMS key, an example policy can be found here.

I followed Demo 2. However, when I try to send emails from any verified identity, I don’t receive bounce or complain notifications for emails:
When sending the email, make sure to select the configuration set you configured for bounce and complaints notification. If you followed demo 2 and you sent the email without explicitly using the configuration set in email headers, you will lose tracking for bounce and complaints events.

I am testing the setup. After I sent an email to the bounce simulator, I am not receiving don’t receive any bounce notification emails:
Check the SNS topic subscription if its in pending status and make sure you confirm the topic subscription via subscription email sent to you. If the topic subscription is confirmed, make sure you have access to the inbox of subscription email address and you are not applying any email filters.

Cleaning up:

You should have now successfully setup SNS notifications to monitor bounce and complaints for you Amazon SES emails. To avoid incurring any extra charges, remember to delete any resources created manually if you no longer need them for monitoring.

Resources to delete from SES console:

  1. In the navigation pane, under Configuration, choose the verified identity you configured for SNS notifications.
  2. In the details screen of the verified identity you selected, choose the Notifications tab and select Edit in the Feedback notifications container.
  3. Choose No SNS topic from bounce and complaint feedback dropdown menu and click Save changes.
  4. Under the same Notifications tab on the details screen of the verified identity, in the Email Feedback Forwarding container, choose Edit, check the Enabled box, and choose Save changes.
  5. In the navigation pane, under Configuration, choose Configuration sets.
  6. Check the box beside Configuration set you created and select Delete.

Resources to delete from SNS console:

  1. In the navigation pane, from the left side menu, choose Topics.
  2. Check the radio button beside the SNS topic you created and select Delete.
  3. Confirm the topic deletion by writing “delete me”.

Conclusion:

Monitoring bounces and complaints is an essential part of maintaining a successful email sending system, using Amazon SES. By setting up SNS notifications for bounces and complaints, you can quickly identify any issues and take appropriate action to ensure that your emails are delivered successfully to your subscribers. By proactively managing your email deliverability, you can maintain a positive sender reputation and avoid any negative impact on your email marketing efforts.

About the authors:

 Alaa Hammad

Alaa Hammad is a Senior Cloud Support Engineer at AWS and subject matter expert in Amazon Simple Email Service and AWS Backup service. She has a 10 years of diverse experience in supporting enterprise customers across different industries. She enjoys cooking and try new recipes from different cuisines.

 Vinay Ujjini 

Vinay Ujjini is an Amazon Pinpoint and Amazon Simple Email Service Worldwide Principal Specialist Solutions Architect at AWS. He has been solving customer’s omni-channel challenges for over 15 years. He is an avid sports enthusiast and in his spare time, enjoys playing tennis & cricket.

Choosing an open table format for your transactional data lake on AWS

Post Syndicated from Shana Schipers original https://aws.amazon.com/blogs/big-data/choosing-an-open-table-format-for-your-transactional-data-lake-on-aws/

A modern data architecture enables companies to ingest virtually any type of data through automated pipelines into a data lake, which provides highly durable and cost-effective object storage at petabyte or exabyte scale. This data is then projected into analytics services such as data warehouses, search systems, stream processors, query editors, notebooks, and machine learning (ML) models through direct access, real-time, and batch workflows. Data in customers’ data lakes is used to fulfil a multitude of use cases, from real-time fraud detection for financial services companies, inventory and real-time marketing campaigns for retailers, or flight and hotel room availability for the hospitality industry. Across all use cases, permissions, data governance, and data protection are table stakes, and customers require a high level of control over data security, encryption, and lifecycle management.

This post shows how open-source transactional table formats (or open table formats) can help you solve advanced use cases around performance, cost, governance, and privacy in your data lakes. We also provide insights into the features and capabilities of the most common open table formats available to support various use cases.

You can use this post for guidance when looking to select an open table format for your data lake workloads, facilitating the decision-making process and potentially narrowing down the available options. The content of this post is based on the latest open-source releases of the reviewed formats at the time of writing: Apache Hudi v0.13.0, Apache Iceberg 1.2.0, and Delta Lake 2.3.0.

Advanced use cases in modern data lakes

Data lakes offer one of the best options for cost, scalability, and flexibility to store data, allowing you to retain large volumes of structured and unstructured data at a low cost, and to use this data for different types of analytics workloads—from business intelligence reporting to big data processing, real-time analytics, and ML—to help guide better decisions.

Despite these capabilities, data lakes are not databases, and object storage does not provide support for ACID processing semantics, which you may require to effectively optimize and manage your data at scale across hundreds or thousands of users using a multitude of different technologies. For example:

  • Performing efficient record-level updates and deletes as data changes in your business
  • Managing query performance as tables grow to millions of files and hundreds of thousands of partitions
  • Ensuring data consistency across multiple concurrent writers and readers
  • Preventing data corruption from write operations failing partway through
  • Evolving table schemas over time without (partially) rewriting datasets

These challenges have become particularly prevalent in use cases such as CDC (change data capture) from relational database sources, privacy regulations requiring deletion of data, and streaming data ingestion, which can result in many small files. Typical data lake file formats such as CSV, JSON, Parquet, or Orc only allow for writes of entire files, making the aforementioned requirements hard to implement, time consuming, and costly.

To help overcome these challenges, open table formats provide additional database-like functionality that simplifies the optimization and management overhead of data lakes, while still supporting storage on cost-effective systems like Amazon Simple Storage Service (Amazon S3). These features include:

  • ACID transactions – Allowing a write to completely succeed or be rolled back in its entirety
  • Record-level operations – Allowing for single rows to be inserted, updated, or deleted
  • Indexes – Improving performance in addition to data lake techniques like partitioning
  • Concurrency control – Allowing for multiple processes to read and write the same data at the same time
  • Schema evolution – Allowing for columns of a table to be added or modified over the life of a table
  • Time travel – Enabling you to query data as of a point in time in the past

In general, open table formats implement these features by storing multiple versions of a single record across many underlying files, and use a tracking and indexing mechanism that allows an analytics engine to see or modify the correct version of the records they are accessing. When records are updated or deleted, the changed information is stored in new files, and the files for a given record are retrieved during an operation, which is then reconciled by the open table format software. This is a powerful architecture that is used in many transactional systems, but in data lakes, this can have some side effects that have to be addressed to help you align with performance and compliance requirements. For instance, when data is deleted from an open table format, in some cases only a delete marker is stored, with the original data retained until a compaction or vacuum operation is performed, which performs a hard deletion. For updates, previous versions of the old values of a record may be retained until a similar process is run. This can mean that data that should be deleted isn’t, or that you store a significantly larger number of files than you intend to, increasing storage cost and slowing down read performance. Regular compaction and vacuuming must be run, either as part of the way the open table format works, or separately as a maintenance procedure.

The three most common and prevalent open table formats are Apache Hudi, Apache Iceberg, and Delta Lake. AWS supports all three of these open table formats, and in this post, we review the features and capabilities of each, how they can be used to implement the most common transactional data lake use cases, and which features and capabilities are available in AWS’s analytics services. Innovation around these table formats is happening at an extremely rapid pace, and there are likely preview or beta features available in these file formats that aren’t covered here. All due care has been taken to provide the correct information as of time of writing, but we also expect this information to change quickly, and we’ll update this post frequently to contain the most accurate information. Also, this post focuses only on the open-source versions of the covered table formats, and doesn’t speak to extensions or proprietary features available from individual third-party vendors.

How to use this post

We encourage you to use the high-level guidance in this post with the mapping of functional fit and supported integrations for your use cases. Combine both aspects to identify what table format is likely a good fit for a specific use case, and then prioritize your proof of concept efforts accordingly. Most organizations have a variety of workloads that can benefit from an open table format, but today no single table format is a “one size fits all.” You may wish to select a specific open table format on a case-by-case basis to get the best performance and features for your requirements, or you may wish to standardize on a single format and understand the trade-offs that you may encounter as your use cases evolve.

This post doesn’t promote a single table format for any given use case. The functional evaluations are only intended to help speed up your decision-making process by highlighting key features and attention points for each table format with each use case. It is crucial that you perform testing to ensure that a table format meets your specific use case requirements.

This post is not intended to provide detailed technical guidance (e.g. best practices) or benchmarking of each of the specific file formats, which are available in AWS Technical Guides and benchmarks from the open-source community respectively.

Choosing an open table format

When choosing an open table format for your data lake, we believe that there are two critical aspects that should be evaluated:

  • Functional fit – Does the table format offer the features required to efficiently implement your use case with the required performance? Although they all offer common features, each table format has a different underlying technical design and may support unique features. Each format can handle a range of use cases, but they also offer specific advantages or trade-offs, and may be more efficient in certain scenarios as a result of its design.
  • Supported integrations – Does­ the table format integrate seamlessly with your data environment? When evaluating a table format, it’s important to consider supported engine integrations on dimensions such as support for reads/writes, data catalog integration, supported access control tools, and so on that you have in your organization. This applies to both integration with AWS services and with third-party tools.

General features and considerations

The following table summarizes general features and considerations for each file format that you may want to take into account, regardless of your use case. In addition to this, it is also important to take into account other aspects such as the complexity of the table format and in-house skills.

. Apache Hudi Apache Iceberg Delta Lake
Primary API
  • Spark DataFrame
  • SQL
  • Spark DataFrame
Write modes
  • Copy On Write approach only
Supported data file formats
  • Parquet
  • ORC
  • HFile
  • Parquet
  • ORC
  • Avro
  • Parquet
File layout management
  • Compaction to reorganize data (sort) and merge small files together
Query optimization
S3 optimizations
  • Metadata reduces file listing operations
Table maintenance
  • Automatic within writer
  • Separate processes
  • Separate processes
  • Separate processes
Time travel
Schema evolution
Operations
  • Hudi CLI for table management, troubleshooting, and table inspection
  • No out-of-the-box options
Monitoring
  • No out-of-the-box options that are integrated with AWS services
  • No out-of-the-box options that are integrated with AWS services
Data Encryption
  • Server-side encryption on Amazon S3 supported
  • Server-side encryption on Amazon S3 supported
Configuration Options
  • High configurability:

Extensive configuration options for customizing read/write behavior (such as index type or merge logic) and automatically performed maintenance and optimizations (such as file sizing, compaction, and cleaning)

  • Medium configurability:

Configuration options for basic read/write behavior (Merge On Read or Copy On Write operation modes)

  • Low configurability:

Limited configuration options for table properties (for example, indexed columns)

Other
  • Savepoints allow you to restore tables to a previous version without having to retain the entire history of files
  • Iceberg supports S3 Access Points in Spark, allowing you to implement failover across AWS Regions using a combination of S3 access points, S3 cross-Region replication, and the Iceberg Register Table API
  • Shallow clones allow you to efficiently run tests or experiments on Delta tables in production, without creating copies of the dataset or affecting the original table.
AWS Analytics Services Support*
Amazon EMR Read and write Read and write Read and write
AWS Glue Read and write Read and write Read and write
Amazon Athena (SQL) Read Read and write Read
Amazon Redshift (Spectrum) Read Currently not supported Read
AWS Glue Data Catalog Yes Yes Yes

* For table format support in third-party tools, consult the official documentation for the respective tool.
Amazon Redshift only supports Delta Symlink tables (see Creating external tables for data managed in Delta Lake for more information).
Refer to Working with other AWS services in the Lake Formation documentation for an overview of table format support when using Lake Formation with other AWS services.

Functional fit for common use cases

Now let’s dive deep into specific use cases to understand the capabilities of each open table format.

Getting data into your data lake

In this section, we discuss the capabilities of each open table format for streaming ingestion, batch load and change data capture (CDC) use cases.

Streaming ingestion

Streaming ingestion allows you to write changes from a queue, topic, or stream into your data lake. Although your specific requirements may vary based on the type of use case, streaming data ingestion typically requires the following features:

  • Low-latency writes – Supporting record-level inserts, updates, and deletes, for example to support late-arriving data
  • File size management – Enabling you to create files that are sized for optimal read performance (rather than creating one or more files per streaming batch, which can result in millions of tiny files)
  • Support for concurrent readers and writers – Including schema changes and table maintenance
  • Automatic table management services – Enabling you to maintain consistent read performance

In this section, we talk about streaming ingestion where records are just inserted into files, and you aren’t trying to update or delete previous records based on changes. A typical example of this is time series data (for example sensor readings), where each event is added as a new record to the dataset. The following table summarizes the features.

. Apache Hudi Apache Iceberg Delta Lake
Functional fit
Considerations Hudi’s default configurations are tailored for upserts, and need to be tuned for append-only streaming workloads. For example, Hudi’s automatic file sizing in the writer minimizes operational effort/complexity required to maintain read performance over time, but can add a performance overhead at write time. If write speed is of critical importance, it can be beneficial to turn off Hudi’s file sizing, write new data files for each batch (or micro-batch), then run clustering later to create better sized files for read performance (using a similar approach as Iceberg or Delta).
  • Iceberg doesn’t optimize file sizes or run automatic table services (for example, compaction or clustering) when writing, so streaming ingestion will create many small data and metadata files. Frequent table maintenance needs to be performed to prevent read performance from degrading over time.
  • Delta doesn’t optimize file sizes or run automatic table services (for example, compaction or clustering) when writing, so streaming ingestion will create many small data and metadata files. Frequent table maintenance needs to be performed to prevent read performance from degrading over time.
Supported AWS integrations
  • Amazon EMR (Spark Structured Streaming (streaming sink and forEachBatch), Flink, Hudi DeltaStreamer)
  • AWS Glue (Spark Structured Streaming (streaming sink and forEachBatch), Hudi DeltaStreamer)
  • Amazon Kinesis Data Analytics
  • Amazon Managed Streaming for Apache Kafka (MSK Connect)
  • Amazon EMR (Spark Structured Streaming (only forEachBatch), Flink)
  • AWS Glue (Spark Structured Streaming (only forEachBatch))
  • Amazon Kinesis Data Analytics
Conclusion Good functional fit for all append-only streaming when configuration tuning for append-only workloads is acceptable. Good fit for append-only streaming with larger micro-batch windows, and when operational overhead of table management is acceptable. Good fit for append-only streaming with larger micro-batch windows, and when operational overhead of table management is acceptable.

When streaming data with updates and deletes into a data lake, a key priority is to have fast upserts and deletes by being able to efficiently identify impacted files to be updated.

. Apache Hudi Apache Iceberg Delta Lake
Functional fit
  • Iceberg offers a Merge On Read strategy to enable fast writes.
  • Streaming upserts into Iceberg tables are natively supported with Flink, and Spark can implement streaming ingestion with updates and deletes using a micro-batch approach with MERGE INTO.
  • Using column statistics, Iceberg offers efficient updates on tables that are sorted on a “key” column.
  • Streaming ingestion with updates and deletes into OSS Delta Lake tables can be implemented using a micro-batch approach with MERGE INTO.
  • Using data skipping with column statistics, Delta offers efficient updates on tables that are sorted on a “key” column.
Considerations
  • Hudi’s automatic optimizations in the writer (for example, file sizing) add performance overhead at write time.
  • Reading from Merge On Read tables is generally slower than Copy On Write tables due to log files. Frequent compaction can be used to optimize read performance.
  • Iceberg uses a MERGE INTO approach (a join) for upserting data. This is more resource intensive and less performant for streaming data ingestion with frequent commits on (large unsorted) tables, because full table or partition scans would be performed on unsorted tables.
  • Iceberg does not optimize file sizes or run automatic table services (for example, compaction) when writing, so streaming ingestion will create many small data and metadata files. Frequent table maintenance needs to be performed to prevent read performance from degrading over time.
  • Reading from tables using the Merge On Read approach is generally slower than tables using only the Copy On Write approach due to delete files. Frequent compaction can be used to optimize read performance.
  • Iceberg Merge On Read currently does not support dynamic file pruning using its column statistics during merges and updates. This has impact on write performance, resulting in full table joins.
  • Delta uses a Copy On Write strategy that is not optimized for fast (streaming) writes, as it rewrites entire files for record updates.
  • Delta uses a MERGE INTO approach (a join). This is more resource intensive (less performant) and not suited for streaming data ingestion with frequent commits on large unsorted tables, because full table or partition scans would be performed on unsorted tables.
  • No auto file sizing is performed; separate table management processes are required (which can impact writes).
Supported AWS integrations
  • Amazon EMR (Spark Structured Streaming (streaming sink and forEachBatch), Flink, Hudi DeltaStreamer)
  • AWS Glue (Spark Structured Streaming (streaming sink and forEachBatch), Hudi DeltaStreamer)
  • Amazon Kinesis Data Analytics
  • Amazon Managed Streaming for Apache Kafka (MSK Connect)
  • Amazon EMR (Spark Structured Streaming (only forEachBatch), Flink)
  • Amazon Kinesis Data Analytics
  • Amazon EMR (Spark Structured Streaming (only forEachBatch))
  • AWS Glue (Spark Structured Streaming (only forEachBatch))
  • Amazon Kinesis Data Analytics
Conclusion Good fit for lower-latency streaming with updates and deletes thanks to native support for streaming upserts, indexes for upserts, and automatic file sizing and compaction. Good fit for streaming with larger micro-batch windows and when the operational overhead of table management is acceptable. Can be used for streaming data ingestion with updates/deletes if latency is not a concern, because a Copy-On-Write strategy may not deliver the write performance required by low latency streaming use cases.

Change data capture

Change data capture (CDC) refers to the process of identifying and capturing changes made to data in a database and then delivering those changes in real time to a downstream process or system—in this case, delivering CDC data from databases into Amazon S3.

In addition to the aforementioned general streaming requirements, the following are key requirements for efficient CDC processing:

  • Efficient record-level updates and deletes – With the ability to efficiently identify files to be modified (which is important to support late-arriving data).
  • Native support for CDC – With the following options:
  • CDC record support in the table format – The table format understands how to process CDC-generated records and no custom preprocessing is required for writing CDC records to the table.
  • CDC tools natively supporting the table format – CDC tools understand how to process CDC-generated records and apply them to the target tables. In this case, the CDC engine writes to the target table without another engine in between.

Without support for the two CDC options, processing and applying CDC records correctly into a target table will require custom code. With a CDC engine, each tool likely has its own CDC record format (or payload). For example, Debezium and AWS Database Migration Service (AWS DMS) each have their own specific record formats, and need to be transformed differently. This must be considered when you are operating CDC at scale across many tables.

All three table formats allow you to implement CDC from a source database into a target table. The difference for CDC with each format lies mainly in the ease of implementing CDC pipelines and supported integrations.

. Apache Hudi Apache Iceberg Delta Lake
Functional fit
  • Hudi’s DeltaStreamer utility provides a no-code/low-code option to efficiently ingest CDC records from different sources into Hudi tables.
  • Upserts using indexes allow you to quickly identify the target files for updates, without having to perform a full table join.
  • Unique record keys and deduplication natively enforce source databases’ primary keys and prevent duplicates in the data lake.
  • Out of order records are handled via the pre-combine feature.
  • Native support (through record payload formats) is offered for CDC formats like AWS DMS and Debezium, eliminating the need to write custom CDC preprocessing logic in the writer application to correctly interpret and apply CDC records to the target table. Writing CDC records to Hudi tables is as simple as writing any other records to a Hudi table.
  • Partial updates are supported, so the CDC payload format does not need to include all record columns.
  • Flink CDC is the most convenient way to set up CDC from downstream data sources into Iceberg tables. It supports upsert mode and can interpret CDC formats such as Debezium natively.
  • Using column statistics, Iceberg offers efficient updates on tables that are sorted on a “key” column.
  • CDC into Delta tables can be implemented using third-party tools or using Spark with custom processing logic.
  • Using data skipping with column statistics, Delta offers efficient updates on tables that are sorted on a “key” column.
Considerations
  • Natively supported payload formats can be found in the Hudi code repo. For other formats, consider creating a custom payload or adding custom logic to the writer application to correctly process and apply CDC records of that format to target Hudi tables.
  • Iceberg uses a MERGE INTO approach (a join) for upserting data. This is more resource intensive and less performant, particularly on large unsorted tables where a MERGE INTO operation could require a full table scan.
  • Regular compaction should be implemented to maintain sort order over time in order to prevent MERGE INTO performance degrading.
  • Iceberg has no native support for CDC payload formats (for example, AWS DMS or Debezium). When using other engines than Flink CDC (such as Spark), custom logic needs to be added to the writer application in order to correctly process and apply CDC records to target Iceberg tables (for example, deduplication or ordering based on operation).
  • Deduplication to enforce primary key constraints needs to be handled in the Iceberg writer application.
  • No support for out of order records handling.
  • Delta does not use indexes for upserts, but uses a MERGE INTO approach instead (a join). This is more resource intensive and less performant on large unsorted tables because those would require full table or partition scans.
  • Regular clustering should be implemented to maintain sort order over time in order to prevent MERGE INTO performance degrading.
  • Delta Lake has no native support for CDC payload formats (for example, AWS DMS or Debezium). When using Spark for ingestion, custom logic needs to be added to the writer application in order to correctly process and apply CDC records to target Delta tables (for example, deduplication or ordering based on operation).
  • Record updates on unsorted Delta tables results in full table or partition scans
  • No support for out of order records handling.
Natively supported CDC formats
  • AWS DMS
  • Debezium
  • None
  • None
CDC tool integrations
  • DeltaStreamer
  • Flink CDC
  • Debezium
  • Flink CDC
  • Debezium
  • Debezium
Conclusion All three formats can implement CDC workloads. Apache Hudi offers the best overall technical fit for CDC workloads as well as the most options for efficient CDC pipeline design: no-code/low-code with DeltaStreamer, third-party CDC tools offering native Hudi integration, or a Spark/Flink engine using CDC record payloads offered in Hudi.

Batch loads

If your use case requires only periodic writes but frequent reads, you may want to use batch loads and optimize for read performance.

Batch loading data with updates and deletes is perhaps the simplest use case to implement with any of the three table formats. Batch loads typically don’t require low latency, allowing them to benefit from the operational simplicity of a Copy On Write strategy. With Copy On Write, data files are rewritten to apply updates and add new records, minimizing the complexity of having to run compaction or optimization table services on the table.

. Apache Hudi Apache Iceberg Delta Lake
Functional fit
  • Copy On Write is supported.
  • Automatic file sizing while writing is supported, including optimizing previously written small files by adding new records to them.
  • Multiple index types are provided to optimize update performance for different workload patterns.
  • Copy On Write is supported.
  • File size management is performed within each incoming data batch (but it is not possible to optimize previously written data files by adding new records to them).
  • Copy On Write is supported.
  • File size can be indirectly managed within each data batch by setting the max number of records per file (but it is not possible to optimize previously written data files by adding new records to them).
Considerations
  • Configuring Hudi according to your workload pattern is imperative for good performance (see Apache Hudi on AWS for guidance).
  • Data deduplication needs to be handled in the writer application.
  • If a single data batch does not contain sufficient data to reach a target file size, compaction can be performed to merge smaller files together afterwards.
  • Ensuring data is sorted on a “key” column is imperative for good update performance. Regular sorting compaction should be considered to maintain sorted data over time.
  • Data deduplication needs to be handled in the writer application.
  • If a single data batch does not contain sufficient data to reach a target file size, compaction can be performed to merge smaller files together afterwards.
  • Ensuring data is sorted on a “key” column is imperative for good update performance. Regular clustering should be considered to maintain sorted data over time.
Supported AWS integrations
  • Amazon EMR (Spark)
  • AWS Glue (Spark)
  • Amazon EMR (Spark, Presto, Trino, Hive)
  • AWS Glue (Spark)
  • Amazon Athena (SQL)
  • Amazon EMR (Spark, Trino)
  • AWS Glue (Spark)
Conclusion All three formats are well suited for batch loads. Apache Hudi supports the most configuration options and may increase the effort to get started, but provides lower operational effort due to automatic table management. On the other hand, Iceberg and Delta are simpler to get started with, but require some operational overhead for table maintenance.

Working with open table formats

In this section, we discuss the capabilities of each open table format for common use cases when working with open table formats: optimizing read performance, incremental data processing and processing deletes to comply with privacy regulations.

Optimizing read performance

The preceding sections primarily focused on write performance for specific use cases. Now let’s explore how each open table format can support optimal read performance. Although there are some cases where data is optimized purely for writes, read performance is typically a very important dimension on which you should evaluate an open table format.

Open table format features that improve query performance include the following:

  • Indexes, (column) statistics, and other metadata – Improves query planning and file pruning, resulting in reduced data scanned
  • File layout optimization – Enables query performance:
  • File size management – Properly sized files provide better query performance
  • Data colocation (through clustering) according to query patterns – Reduces the amount of data scanned by queries
. Apache Hudi Apache Iceberg Delta Lake
Functional fit
  • Auto file sizing when writing results in good file sizes for read performance. On Merge On Read tables, automatic compaction and clustering improves read performance.
  • Metadata tables eliminate slow S3 file listing operations. Column statistics in the metadata table can be used for better file pruning in query planning (data skipping feature).
  • Clustering data for better data colocation with hierarchical sorting or z-ordering.
  • Hidden partitioning prevents unintentional full table scans by users, without requiring them to specify partition columns explicitly.
  • Column and partition statistics in manifest files speed up query planning and file pruning, and eliminate S3 file listing operations.
  • Optimized file layout for S3 object storage using random prefixes is supported, which minimizes chances of S3 throttling.
  • Clustering data for better data colocation with hierarchical sorting or z-ordering.
  • File size can be indirectly managed within each data batch by setting the max number of records per file (but not optimizing previously written data files by adding new records to existing files).
  • Generated columns avoid full table scans.
  • Data skipping is automatically used in Spark.
  • Clustering data for better data colocation using z-ordering.
Considerations
  • Data skipping using metadata column stats has to be supported in the query engine (currently only in Apache Spark).
  • Snapshot queries on Merge On Read tables have higher query latencies than on Copy On Write tables. This latency impact can be reduced by increasing the compaction frequency.
  • Separate table maintenance needs to be performed to maintain read performance over time.
  • Reading from tables using a Merge On Read approach is generally slower than tables using only a Copy On Write approach due to delete files. Frequent compaction can be used to optimize read performance.
  • Currently, only Apache Spark can use data skipping.
  • Separate table maintenance needs to be performed to maintain read performance over time.
Optimization & Maintenance Processes
  • Compaction of log files in Merge On Read tables can be run as part of the writing application or as a separate job using Spark on Amazon EMR or AWS Glue. Compaction does not interfere with other jobs or queries.
  • Clustering runs as part of the writing application or in a separate job using Spark on Amazon EMR or AWS Glue because clustering can interfere with other transactions.
  • See Apache Hudi on AWS for guidance.
  • Compaction API in Delta Lake can group small files or cluster data, and it can interfere with other transactions.
  • This process has to be scheduled separately by the user on a time or event basis.
  • Spark can be used to perform compaction in services like Amazon EMR or AWS Glue.
Conclusion For achieving good read performance, it’s important that your query engine supports the optimization features offered by the table formats. When using Spark, all three formats provide good read performance when properly configured. When using Trino (and therefore Athena as well), Iceberg will likely provide better query performance because the data skipping feature of Hudi and Delta is not supported in the Trino engine. Make sure to evaluate this feature support for your query engine of choice.

Incremental processing of data on the data lake

At a high level, incremental data processing is the movement of new or fresh data from a source to a destination. To implement incremental extract, transform, and load (ETL) workloads efficiently, we need to be able to retrieve only the data records that have been changed or added since a certain point in time (incrementally) so we don’t need to reprocess unnecessary data (such as entire partitions). When your data source is an open table format table, we can take advantage of incremental queries to facilitate more efficient reads in these table formats.

. Apache Hudi Apache Iceberg Delta Lake
Functional fit
  • Full incremental pipelines can be built using Hudi’s incremental queries, which capture record-level changes on a Hudi table (including updates and deletes) without the need to store and manage change data records.
  • Hudi’s DeltaStreamer utility offers simple no-code/low-code options to build incremental Hudi pipelines.
  • Iceberg incremental queries can only read new records (no updates) from upstream Iceberg tables and replicate to downstream tables.
  • Incremental pipelines with record-level changes (including updates and deletes) can be implemented using the changelog view procedure.
  • Full incremental pipelines can be built using Delta’s Change Data Feed (CDF) feature, which captures record-level changes (including updates and deletes) using change data records.
Considerations
  • ETL engine used needs to support Hudi’s incremental query type.
  • A view has to be created to incrementally read data between two table snapshots containing updates and deletes.
  • A new view has to be created (or recreated) for reading changes from new snapshots.
  • Record-level changes can only be captured from the moment CDF is turned on.
  • CDF stores change data records on storage, so a storage overhead is incurred and lifecycle management and cleaning of change data records is required.
Supported AWS integrations Incremental queries are supported in:

  • Amazon EMR (Spark, Flink, Hive, Hudi DeltaStreamer)
  • AWS Glue (Spark, Hudi DeltaStreamer)
  • Amazon Kinesis Data Analytics
Incremental queries supported in:

  • Amazon EMR (Spark, Flink)
  • AWS Glue (Spark)
  • Amazon Kinesis Data Analytics

CDC view supported in:

  • Amazon EMR (Spark)
  • AWS Glue (Spark)
CDF supported in:

  • Amazon EMR (Spark)
  • AWS Glue (Spark)
Conclusion Best functional fit for incremental ETL pipelines using a variety of engines, without any storage overhead. Good fit for implementing incremental pipelines using Spark if the overhead of creating views is acceptable. Good fit for implementing incremental pipelines using Spark if the additional storage overhead is acceptable.

Processing deletes to comply with privacy regulations

Due to privacy regulations like the General Data Protection Regulation (GDPR) and California Consumer Privacy Act (CCPA), companies across many industries need to perform record-level deletes on their data lake for “right to be forgotten” or to correctly store changes to consent on how their customers’ data can be used.

The ability to perform record-level deletes without rewriting entire (or large parts of) datasets is the main requirement for this use case. For compliance regulations, it’s important to perform hard deletes (deleting records from the table and physically removing them from Amazon S3).

. Apache Hudi Apache Iceberg Delta Lake
Functional fit Hard deletes are performed by Hudi’s automatic cleaner service. Hard deletes can be implemented as a separate process. Hard deletes can be implemented as a separate process.
Considerations Hudi cleaner needs to be configured according to compliance requirements to automatically remove older file versions in time (within a compliance window), otherwise time travel or rollback operations could recover deleted records. Previous snapshots need to be (manually) expired after the delete operation, otherwise time travel operations could recover deleted records. The vacuum operation needs to be run after the delete, otherwise time travel operations could recover deleted records.
Conclusion This use case can be implemented using all three formats, and in each case, you must ensure that your configuration or background pipelines implement the cleanup procedures required to meet your data retention requirements.

Conclusion

Today, no single table format is the best fit for all use cases, and each format has its own unique strengths for specific requirements. It’s important to determine which requirements and use cases are most crucial and select the table format that best meets those needs.

To speed up the selection process of the right table format for your workload, we recommend the following actions:

  • Identify what table format is likely a good fit for your workload using the high-level guidance provided in this post
  • Perform a proof of concept with the identified table format from the previous step to validate its fit for your specific workload and requirements

Keep in mind that these open table formats are open source and rapidly evolve with new features and enhanced or new integrations, so it can be valuable to also take into consideration product roadmaps when deciding on the format for your workloads.

AWS will continue to innovate on behalf of our customers to support these powerful file formats and to help you be successful with your advanced use cases for analytics in the cloud. For more support on building transactional data lakes on AWS, get in touch with your AWS Account Team, AWS Support, or review the following resources:


About the Authors

Shana Schipers is an Analytics Specialist Solutions Architect at AWS, focusing on big data. She supports customers worldwide in building transactional data lakes using open table formats like Apache Hudi, Apache Iceberg and Delta Lake on AWS.

Ian Meyers is a Director of Product Management for AWS Analytics Services. He works with many of AWS largest customers on emerging technology needs, and leads several data and analytics initiatives within AWS including support for Data Mesh.


Carlos Rodrigues is a Big Data Specialist Solutions Architect at AWS. He helps customers worldwide building transactional data lakes on AWS using open table formats like Apache Hudi and Apache Iceberg.

AWS Security Profile: Matthew Campagna, Senior Principal, Security Engineering, AWS Cryptography

Post Syndicated from Roger Park original https://aws.amazon.com/blogs/security/security-profile-matthew-campagna-aws-cryptography/

In the AWS Security Profile series, we interview Amazon Web Services (AWS) thought leaders who help keep our customers safe and secure. This interview features Matt Campagna, Senior Principal, Security Engineering, AWS Cryptography, and re:Inforce 2023 session speaker, who shares thoughts on data protection, cloud security, post-quantum cryptography, and more. Matthew was first profiled on the AWS Security Blog in 2019. This is part 1 of 3 in a series of interviews with our AWS Cryptography team.


What do you do in your current role and how long have you been at AWS?

I started at Amazon in 2013 as the first cryptographer at AWS. Today, my focus is on the cryptographic security of our customers’ data. I work across AWS to make sure that our cryptographic engineering meets our most sensitive customer needs. I lead our migration to quantum-resistant cryptography, and help make privacy-preserving cryptography techniques part of our security model.

How did you get started in the data protection and cryptography space? What about it piqued your interest?

I first learned about public-key cryptography (for example, RSA) during a math lesson about group theory. I found the mathematics intriguing and the idea of sending secret messages using only a public value astounding. My undergraduate and graduate education focused on group theory, and I started my career at the National Security Agency (NSA) designing and analyzing cryptologics. But what interests me most about cryptography is its ability to enable business by reducing risks. I look at cryptography as a financial instrument that affords new business cases, like e-commerce, digital currency, and secure collaboration. What enables Amazon to deliver for our customers is rooted in cryptography; our business exists because cryptography enables trust and confidentiality across the internet. I find this the most intriguing aspect of cryptography.

AWS has invested in the migration to post-quantum cryptography by contributing to post-quantum key agreement and post-quantum signature schemes to protect the confidentiality, integrity, and authenticity of customer data. What should customers do to prepare for post-quantum cryptography?

Our focus at AWS is to help ensure that customers can migrate to post-quantum cryptography as fast as prudently possible. This work started with inventorying our dependencies on algorithms that aren’t known to be quantum-resistant, like integer-factorization-based cryptography, and discrete-log-based cryptography, like ECC. Customers can rely on AWS to assist with transitioning to post-quantum cryptography for their cloud computing needs.

We recommend customers begin inventorying their dependencies on algorithms that aren’t quantum-resistant, and consider developing a migration plan, to understand if they can migrate directly to new post-quantum algorithms or if they should re-architect them. For the systems that are provided by a technology provider, customers should ask what their strategy is for post-quantum cryptography migration.

AWS offers post-quantum TLS endpoints in some security services. Can you tell us about these endpoints and how customers can use them?

Our open source TLS implementation, s2n-TLS, includes post-quantum hybrid key exchange (PQHKEX) in its mainline. It’s deployed everywhere that s2n is deployed. AWS Key Management Service, AWS Secrets Manager, and AWS Certificate Manager have enabled PQHKEX cipher suites in our commercial AWS Regions. Today customers can use the AWS SDK for Java 2.0 to enable PQHKEX on their connection to AWS, and on the services that also have it enabled, they will negotiate a post-quantum key exchange method. As we enable these cipher suites on additional services, customers will also be able to connect to these services using PQHKEX.

You are a frequent contributor to the Amazon Science Blog. What were some of your recent posts about?

In 2022, we published a post on preparing for post-quantum cryptography, which provides general information on the broader industry development and deployment of post-quantum cryptography. The post links to a number of additional resources to help customers understand post-quantum cryptography. The AWS Post-Quantum Cryptography page and the Science Blog are great places to start learning about post-quantum cryptography.

We also published a post highlighting the security of post-quantum hybrid key exchange. Amazon believes in evidencing the cryptographic security of the solutions that we vend. We are actively participating in cryptographic research to validate the security that we provide in our services and tools.

What’s been the most dramatic change you’ve seen in the data protection and post-quantum cryptography landscape since we talked to you in 2019?

Since 2019, there have been two significant advances in the development of post-quantum cryptography.

First, the National Institute of Standards and Technology (NIST) announced their selection of PQC algorithms for standardization. NIST expects to finish the standardization of a post-quantum key encapsulation mechanism (Kyber) and digital signature scheme (Dilithium) by 2024 as part of the Federal Information Processing Standard (FIPS). NIST will also work on standardization of two additional signature standards (FALCON and SPHINCS+), and continue to consider future standardization of the key encapsulation mechanisms BIKE, HQC, and Classical McEliece.

Second, the NSA announced their Commercial National Security Algorithm (CNSA) Suite 2.0, which includes their timelines for National Security Systems (NSS) to migrate to post-quantum algorithms. The NSA will begin preferring post-quantum solutions in 2025 and expect that systems will have completed migration by 2033. Although this timeline might seem far away, it’s an aggressive strategy. Experience shows that it can take 20 years to develop and deploy new high-assurance cryptographic algorithms. If technology providers are not already planning to migrate their systems and services, they will be challenged to meet this timeline.

What makes cryptography exciting to you?

Cryptography is a dynamic area of research. In addition to the business applications, I enjoy the mathematics of cryptography. The state-of-the-art is constantly progressing in terms of new capabilities that cryptography can enable, and the potential risks to existing cryptographic primitives. This plays out in the public sphere of cryptographic research across the globe. These advancements are made public and are accessible for companies like AWS to innovate on behalf of our customers, and protect our systems in advance of the development of new challenges to our existing crypto algorithms. This is happening now as we monitor the advancements of quantum computing against our ability to define and deploy new high-assurance quantum-resistant algorithms. For me, it doesn’t get more exciting than this.

Where do you see the cryptography and post-quantum cryptography space heading to in the future?

While NIST transitions from their selection process to standardization, the broader cryptographic community will be more focused on validating the cryptographic assurances of these proposed schemes for standardization. This is a critical part of the process. I’m optimistic that we will enter 2025 with new cryptographic standards to deploy.

There is a lot of additional cryptographic research and engineering ahead of us. Applying these new primitives to the cryptographic applications that use classical asymmetric schemes still needs to be done. Some of this work is happening in parallel, like in the IETF TLS working group, and in the ETSI Quantum-Safe Cryptography Technical Committee. The next five years should see the adoption of PQHKEX in protocols like TLS, SSH, and IKEv2 and certification of new FIPS hardware security modules (HSMs) for establishing new post-quantum, long-lived roots of trust for code-signing and entity authentication.

I expect that the selected primitives for standardization will also be used to develop novel uses in fields like secure multi-party communication, privacy preserving machine learning, and cryptographic computing.

With AWS re:Inforce 2023 around the corner, what will your session focus on? What do you hope attendees will take away from your session?

Session DAP302 – “Post-quantum cryptography migration strategy for cloud services” is about the challenge quantum computers pose to currently used public-key cryptographic algorithms and how the industry is responding. Post-quantum cryptography (PQC) offers a solution to this challenge, providing security to help protect against quantum computer cybersecurity events. We outline current efforts in PQC standardization and migration strategies. We want our customers to leave with a better understanding of the importance of PQC and the steps required to migrate to it in a cloud environment.

Is there something you wish customers would ask you about more often?

The question I am most interested in hearing from our customers is, “when will you have a solution to my problem?” If customers have a need for a novel cryptographic solution, I’m eager to try to solve that with them.

How about outside of work, any hobbies?

My main hobbies outside of work are biking and running. I wish I was as consistent attending to my hobbies as I am to my work desk. I am happier being able to run every day for a constant speed and distance as opposed to running faster or further tomorrow or next week. Last year I was fortunate enough to do the Cycle Oregon ride. I had registered for it twice before without being able to find the time to do it.

If you have feedback about this post, submit comments in the Comments section below. If you have questions about this post, contact AWS Support.

Want more AWS Security news? Follow us on Twitter.

Roger Park

Roger Park

Roger is a Senior Security Content Specialist at AWS Security focusing on data protection. He has worked in cybersecurity for almost ten years as a writer and content producer. In his spare time, he enjoys trying new cuisines, gardening, and collecting records.

Campagna bio photo

Matthew Campagna

Matthew is a Sr. Principal Engineer for Amazon Web Services’s Cryptography Group. He manages the design and review of cryptographic solutions across AWS. He is an affiliate of Institute for Quantum Computing at the University of Waterloo, a member of the ETSI Security Algorithms Group Experts (SAGE), and ETSI TC CYBER’s Quantum Safe Cryptography group. Previously, Matthew led the Certicom Research group at BlackBerry managing cryptographic research, standards, and IP, and participated in various standards organizations, including ANSI, ZigBee, SECG, ETSI’s SAGE, and the 3GPP-SA3 working group. He holds a Ph.D. in mathematics from Wesleyan University in group theory, and a bachelor’s degree in mathematics from Fordham University.

How organizations are modernizing for cloud operations

Post Syndicated from Adam Keller original https://aws.amazon.com/blogs/devops/how-organizations-are-modernizing-for-cloud-operations/

Over the past decade, we’ve seen a rapid evolution in how IT operations teams and application developers work together. In the early days, there was a clear division of responsibilities between the two teams, with one team focused on providing and maintaining the servers and various components (i.e., storage, DNS, networking, etc.) for the application to run, while the other primarily focused on developing the application’s features, fixing bugs, and packaging up their artifacts for the operations team to deploy. Ultimately, this division led to a siloed approach which presented glaring challenges. These siloes hindered communication between the teams, which would often result in developers being ready to ship code and passing it over to the operations teams with little to no collaboration prior. In turn, operations teams were often left scrambling trying to deliver on the requirements at the last minute. This would lead to bottlenecks in software delivery, delaying features and bug fixes from being shipped. Aside from software delivery, operations teams were primarily responsible for handling on-call duties, which encompassed addressing issues arising from both applications and infrastructure. Consequently, when incidents occurred, the operations teams were the ones receiving alerts, irrespective of the source of the problem. This raised the question: what motivates the software developers to create resilient and dependable software? Terms such as “throw it over the wall” and “it works on my laptop” were coined because of this and are still commonly referenced in discussion today.

The DevOps movement emerged in response to these challenges, aiming to build a bridge between developers and operations teams. DevOps focuses on collaboration between the two teams through communication and integration by fostering a culture of shared responsibility. This approach promotes the use of automation of infrastructure and application code leveraging continuous integration (CI) and continuous delivery (CD), microservices architectures, and visibility through monitoring, logging and tracing. The end result of operating in a DevOps model provides quicker and more reliable release cycles. While the ideology is well intentioned, implementing a DevOps practice is not easy as organizations struggle to adapt and adhere to the cultural expectations. In addition, teams can struggle to find the right balance between speed and stability, which often times results in reverting back to old behaviors due to fear of downtime and instability of their environments. While DevOps is very focused on culture through collaboration and automation, not all developers want to be involved in operations and vice versa. This poses the question: how do organizations centralize a frictionless developer experience, with guardrails and best practices baked in, while providing a golden path for developers to self serve? This is where platform engineering comes in.

Platform engineering has emerged as a critical discipline for organizations, which is driving the next evolution of infrastructure and operations, while simultaneously empowering developers to create and deliver robust, scalable applications. It aims to improve developer experience by providing self service mechanisms that provide some level of abstraction for provisioning resources, with good practices baked in. This builds on top of DevOps practices by enabling the developer to have full control of their resources through self service, without having to throw it over the wall. There are various ways that platform engineering teams implement these self service interfaces, from leveraging a GitOps focused strategy to building Internal Developer Platforms with a UI and/or API. With the increasing demand for faster and more agile development, many organizations are adopting this model to streamline their operations, gain visibility, reduce costs, and lower the friction of onboarding new applications.

In this blog post, we will explore the common operational models used within organizations today, where platform engineering fits within these models, the common patterns used to build and develop these self-service platforms, and what lies ahead for this emerging field.

Operational Models

It’s important for us to start by understanding how we see technology teams operate today and the various ways they support development teams from instantiating infrastructure to defining pipelines and deploying application code. In the below diagram we highlight the four common operational models and will discuss each to understand the benefits and challenges they bring. This is also critical in understanding where platform teams fit, and where they don’t.

This image shows a sliding scale of the various provisioning models. For each model it shows the interaction between developers and the platform team.

Centralized Provisioning

In a centralized provisioning model, the responsibility for architecting, deploying, and managing infrastructure falls primarily on a centralized team. Organizations assign enforcement of controls into specific roles with narrow scope, including release management, process management, and segmentation of siloed teams (networking, compute, pipelines, etc). The request model generally requires a ticket or request to be sent to the central or dedicated siloed team, ticket enters a backlog, and the developers wait until resources can be provisioned on their behalf. In an ideal world, the central teams can quickly provision the resources and pipelines to get the developers up and running; but, in reality these teams are busy with work and have to prioritize accordingly which often times leaves development teams waiting or having to predict what they need well in advance.

While this model provides central control over resource provisioning, it introduces bottlenecks into the delivery process and generally results in slower deployment cycles and feedback loops. This model becomes especially challenging when supporting a large number of development teams with varying requirements and use cases. Ultimately this model can lead to frustration and friction between teams and hence why organizations after some time look to move away from operating in this model. This leads us to segue into the next model, which is the Platform-enabled Golden Path.

Platform-enabled Golden Path

The platform-enabled golden path model is an approach that allows for developer to have some form of customization while still maintaining consistency by following a set of standards. In this model, platform engineers clearly lay out “preferred” standards with sane defaults, guardrails, and good practices based on common architectures that development teams can use as-is. Sophisticated platform teams may implement their own customizations on top of this framework in the following ways:

The platform engineering team is responsible for creating and updating the templates, with maintenance responsibilities typically being shared. This approach strikes a balance between consistency and flexibility, allowing for some customization while still maintaining standards. However, it can be challenging to maintain visibility across the organization, as development teams have more freedom to customize their infrastructure. This becomes especially challenging when platform teams want a change to propagate across resources deployed by the various development teams building on top of these patterns.

Embedded DevOps

Embedded DevOps is a model in which DevOps engineers are directly aligned with development teams to define, provision, and maintain their infrastructure. There are a couple of common patterns around how organizations use this model.

  • Floating model: A central DevOps team can leverage a floating model where a DevOps engineer will be directly embedded onto a development team early in the development process to help build out the required pipelines and infrastructure resources, and jump to another team once everything is up and running.
  • Permanent embedded model: Alternatively, a development team can have a permanent DevOps engineer on the team to help support early iterations as well as maintenance as the application evolves. The DevOps engineer is ideally there from the beginning of the project and continues to support and improve the infrastructure and automation based on feature requests and bug fixes.

A central platform and/or architecture team may define the acceptable configurations and resources, while DevOps engineers decide how to best use them to meet the needs of their development team. Individual teams are responsible for maintenance and updating of the templates and pipelines. This model offers greater agility and flexibility, but also requires the funding to hire DevOps engineers per development team, which can become costly as development teams scale. It’s important that when operating in this model to maintain collaboration between members of the DevOps team to ensure that best practices can be shared.

Decentralized DevOps

Lastly, the decentralized DevOps model gives development teams full end-to-end ownership and responsibility for defining and managing their infrastructure and pipelines. A central team may be focused on building out guardrails and boundaries to ensure that they limit the blast radius within the boundaries. They can also create a process to ensure that infrastructure deployed meets company standards, while ensuring development teams are free to make design decisions and remain autonomous. This approach offers the greatest agility and flexibility, but also the highest risk of inconsistency, errors, and security vulnerabilities. Additionally, this model requires a cultural shift in the organization because the development teams now own the entire stack, which results in more responsibility. This model can be a deterrent to developers, especially if they are unfamiliar with building resources in the cloud and/or don’t want to do it.

Overall, each model has its strengths and weaknesses, and the purpose of this blog is to educate on the patterns that are emerging. Ultimately the right approach depends on the organization’s specific needs and goals as well as their willingness to shift culturally. Of the above patterns, the two that are emerging as the most common are Platform-enabled Golden Path and Decentralized DevOps. Furthermore, we’re seeing that more often than not platform teams are finding themselves going back and forth between the two patterns within the same organization. This is in part due to technology making infrastructure creation in the cloud more accessible through abstraction and automation (think of tools like the AWS Cloud Development Kit (CDK), AWS Serverless Application Model (SAM) CLI, AWS Copilot, Serverless framework, etc). Let’s now look at the technology patterns that are emerging to support these use cases.

Emerging patterns

Of the trends that are on the rise, Internal Developer Platforms and GitOps practices are becoming increasingly popular in the industry due to their ability to streamline the software development process and improve collaboration between development and platform teams. Internal Developer Platforms provide a centralized platform for developers to access resources and tools needed to build, test, deploy, and monitor applications and associated infrastructure resources. By providing a self-service interface with pre-approved patterns (via UI, API, or Git), internal developer platforms empower development teams to work independently and collaborate with one another more effectively. This reduces the burden on IT and operations teams while also increasing the agility and speed of development as developers aren’t required to wait in line to get resources provisioned. The paradigm shifts with Internal Developer Platforms because the platform teams are focused on building the blueprints and defining the standards for backend resources that development teams centrally consume via the provided interfaces. The platform team should view the internal developer platform as a product and look at developers as their customer.

While internal developer platforms provide a lot of value and abstraction through a UI and API’s, some organizations prefer to use Git as the center of deployment orchestration, and this is where leveraging GitOps can help. GitOps is a methodology that leverages Git as the source of orchestrating and managing the deployment of infrastructure and applications. With GitOps, infrastructure is defined declaratively as code, and changes are tracked in Git, allowing for a more standardized and automated deployment process. Using git for deployment orchestration is not new, but there are some concepts with GitOps that take Git orchestration to a new level.

Let’s look at the principles of GitOps, as defined by OpenGitOps:

  • Declarative
    • A system managed by GitOps must have its desired state expressed declaratively.
  • Versioned and Immutable
    • Desired state is stored in a way that enforces immutability, versioning and retains a complete version history.
  • Pulled Automatically
    • Software agents automatically pull the desired state declarations from the source.
  • Continuously Reconciled
    • Software agents continuously observe actual system state and attempt to apply the desired state.

GitOps helps to reduce the risk of errors and improve consistency across the organization as all change is tracked centrally. Additionally this provides developers with a familiar interface in git as well as the ability to store the desired state of their infrastructure and applications in one place. Lastly, GitOps is focused on ensuring that the desired state in git is always maintained, and if drift occurs, an external process will reconcile the state of the resources. GitOps was born in the Kubernetes ecosystem using tools like Flux and ArgoCD.

The final emerging trend to discuss is particularly relevant to teams functioning within a decentralized DevOps model, possessing end-to-end responsibility for the stack, encompassing infrastructure and application delivery. The amount of cognitive load required to connect the underlying cloud resources together while also being an expert in building out business logic for the application is extremely high, and hence why teams look to harness the power of abstraction and automation for infrastructure provisioning. While this may appear analogous to previously mentioned practices, the key distinction lies in the utilization of tools specifically designed to enhance the developer experience. By abstracting various components (such as networking, identity, and stitching everything together), these tools eliminate the necessity for interaction with centralized teams, empowering developers to operate autonomously and assume complete ownership of the infrastructure. This trend is exemplified by the adoption of innovative tools such as AWS App Composer, AWS CodeCatalyst, SAM CLI, AWS Copilot CLI, and the AWS Cloud Development Kit (CDK).

Looking ahead

If there is one thing that we can ascertain it’s that the journey to successful developer enablement is ongoing, and it’s clear that finding that balance of speed, security, and flexibility can be difficult to achieve. Throughout all of these evolutionary trends in technology, Git has remained as the nucleus of infrastructure and application deployment automation. This is not new; however, the processes being built around Git such as GitOps are. The industry continues to gravitate towards this model, and at AWS we are looking at ways to enable builders to leverage git as the source of truth with simple integrations. For example, AWS Proton has built integrations with git for central template storage with a feature called template sync and recently released a feature called service sync, which allows developers to configure and deploy their Proton services using Git. These features empower the platform team and developers to seamlessly store their templates and desired infrastructure resource states within Git, requiring no additional effort beyond the initial setup.

We also see that interest in building internal developer platforms is on a sharp incline, and it’s still in the early days. With tools like AWS Proton, AWS Service Catalog, Backstage, and other SaaS providers, platform teams are able to define patterns centrally for developers to self serve patterns via a library or “shopping cart”. As mentioned earlier, it’s vital that the teams building out the internal developer platforms think of ways to enable the developer to deploy supplemental resources that aren’t defined in the central templates. While the developer platform can solve the majority of the use cases, it’s nearly impossible to solve them all. If you can’t enable developers to deploy resources on top of their platform deployed services, you’ll find that you’re back to the original problem statement outlined in the beginning of this blog which can ultimately result in a failed implementation. AWS Proton solves this through a feature we call components, which enables developers to bring their own IaC templates to deploy on top of their services deployed through Proton.

The rising popularity of the aforementioned patterns reveals an unmet need for developers who seek to tailor their cloud resources according to the specific requirements of their applications and the demands of platform/central teams that require governance. This is particularly prevalent in serverless workloads, where developers often integrate their application and infrastructure code, utilizing services such as AWS Step Functions to transfer varying degrees of logic from the application layer to the managed service itself. Centralizing these resources becomes increasingly challenging due to their dynamic nature, which adapts to the evolving requirements of business logic. Consequently, it is nearly impossible to consolidate these patterns into a universally applicable blueprint for reuse across diverse business scenarios.

As the distinction between cloud resources and application code becomes increasingly blurred, developers are compelled to employ tools that streamline the underlying logic, enabling them to achieve their desired outcomes swiftly and securely. In this context, it is crucial for platform teams to identify and incorporate these tools, ensuring that organizational safeguards and expectations are upheld. By doing so, they can effectively bridge the gap between developers’ preferences and the essential governance required by the platform or central team.

Wrapping up

We’ve explored the various operating models and emerging trends designed to facilitate these models. Platform Engineering represents the ongoing evolution of DevOps, aiming to enhance the developer experience for rapid and secure deployments. It is crucial to recognize that developers possess varying skill sets and preferences, even within the same organization. As previously discussed, some developers prefer complete ownership of the entire stack, while others concentrate solely on writing code without concerning themselves with infrastructure. Consequently, the platform engineering practice must continuously adapt to accommodate these patterns in a manner that fosters enablement rather than posing as obstacles. To achieve this, the platform must be treated as a product, with developers as its customers, ensuring that their needs and preferences are prioritized and addressed effectively.

To determine where your organization fits within the discussed operational models, we encourage you to initiate a self-assessment and have internal discussions. Evaluate your current infrastructure provisioning, deployment processes, and development team support. Consider the benefits and challenges of each model and how they align with your organization’s specific needs, goals, and cultural willingness to shift.

To facilitate this process, gather key stakeholders from various teams, including leadership, platform engineering, development, and DevOps, for a collaborative workshop. During this workshop, review the four operational models (Centralized Provisioning, Platform-enabled Golden Path, Embedded DevOps, and Decentralized DevOps) and discuss the following:

  • How closely does each model align with your current organizational structure and processes?
  • What are the potential benefits and challenges of adopting or transitioning to each model within your organization?
  • What challenges are you currently facing with the model that you operate under?
  • How can technology be leveraged to optimize infrastructure creation and deployment automation?

By conducting this self-assessment and engaging in open dialogue, your organization can identify the most suitable operational model and develop a strategic plan to optimize collaboration, efficiency, and agility within your technology teams. If a more guided approach is preferred, reach out to our solutions architects and/or AWS partners to assist.

Adam Keller

Adam is a Senior Developer Advocate @ AWS working on all things related to IaC, Platform Engineering, DevOps, and modernization. Reach out to him on twitter @realadamjkeller.