Tag Archives: Amazon Bedrock AgentCore

Automate root cause analysis across Datadog and Elasticsearch with AWS DevOps Agent

Post Syndicated from Bhuvan Jain original https://aws.amazon.com/blogs/devops/automate-root-cause-analysis-across-datadog-and-elasticsearch-with-aws-devops-agent/

Modern distributed systems route business transactions through dozens of microservices, message queues, and event streams. When a message fails to process or processing exceeds SLA thresholds, troubleshooting requires correlating logs from tools like Elasticsearch, metrics from Datadog, and infrastructure change events in AWS CloudTrail. Correlating these signals manually across heterogeneous backends, each with different query languages, schemas, and time granularities, can take hours per incident and demands deep institutional knowledge of the system topology.

This post shows how AWS DevOps Agent, combined with a custom Model Context Protocol (MCP) server for Elasticsearch and native Datadog integration, automates end-to-end root cause analysis. When a Datadog alert fires, AWS DevOps Agent automatically initiates an investigation, correlates signals across all observability backends, and delivers root cause findings in minutes, without manual intervention.

In this post, we walk through the architecture, configuration steps, and a real-world scenario demonstrating how AWS DevOps Agent dramatically reduces mean time to identify (MTTI) for distributed system failures. DevOps engineers, site reliability engineers (SREs), and operations leaders managing containerized workloads will learn how to implement alert-triggered automated investigations that eliminate manual correlation and accelerate root cause identification in their own environments.

Challenges in correlating telemetry signals at scale

At scale, correlating telemetry signals across distributed systems is a key challenge. A platform processing billions of communications for regulated industries must track every message through its full lifecycle — ingestion, transformation, policy evaluation, archival, and retrieval — across dozens of production clusters, thousands of worker nodes, and terabytes of daily telemetry spread across multiple observability backends. A single message ID can generate log entries across multiple indices, correlated metrics in monitoring systems, and change events in audit trails. When a message goes missing or processing stalls, the operations team must pinpoint which cluster processed it, which log store holds the evidence, whether a recent deployment preceded the failure, and whether the issue is isolated or systemic — all while context-switching across tools with different query languages and data schemas. Before AWS DevOps Agent, this process routinely took hours per incident, and longer for complex multi-service failures.

The core difficulty is not the volume of data. It is the correlation of signals across heterogeneous systems that use different identifiers, different time granularities, and different data schemas. A message ID in Elasticsearch logs must be correlated to:

  • A trace ID in application performance monitoring (APM) systems
  • A pod name and namespace in Kubernetes event logs
  • A container image tag in Amazon Elastic Container Registry (ECR) push events
  • Metric anomalies (error rate spikes, pod restarts, CPU/memory deviations) in Datadog
  • Deployment events captured in AWS CloudTrail logs

Manual correlation requires engineers to maintain mental models of these relationships while executing queries across multiple systems. It is error-prone, non-repeatable, and heavily dependent on institutional knowledge. When the engineer with the deepest system familiarity is unavailable, resolution times increases.

Prerequisites

Complete the following prerequisites before configuring the integrations:

  1. The AWS Command Line Interface (AWS CLI) version 2. For installation instructions, see installing or updating to the latest version of the AWS CLI.
  2. Helm – the Kubernetes package manager used to deploy the sample application.
  3. Kubectl – the Kubernetes command-line tool used to deploy Filebeat and manage cluster resources.
  4. An EKS cluster with Control plane logs enabled.
  5. AWS DevOps Agent Agentspace. For installation instructions, refer to Creating an Agent Space.
  6. Elasticsearch cluster deployed and accessible (EC2-hosted, Amazon OpenSearch Service, or self-managed). Filebeat configured as a DaemonSet to collect pod logs and forward to Elasticsearch.
  7. Datadog account with API key and application key. To create, see API & Applications key.

Solution Architecture

The solution presented in this post combines three integrated components to deliver automated end-to-end message ID traceability:

  • AWS DevOps Agent as the intelligent investigation orchestrator
  • A custom ELK MCP Server providing structured access to Elasticsearch log data
  • Native Datadog integration for metrics, events, and alert-triggered investigations

Together, these components form an autonomous investigation pipeline that activates when an alert fires, correlates signals across all observability sources, builds a topological understanding of the affected services, and delivers a structured root cause analysis, without manual intervention.

In our implementation, application pods are instrumented to emit custom metrics to Datadog, including per-message-ID processing status, trace ID labels, and endpoint-level error counters. This instrumentation provides AWS DevOps Agent with the ability to correlate a specific message ID from an alert payload to its corresponding trace ID in application performance data, a correlation that previously required manual cross-referencing.

Webhook-Based Alert Triggering

A critical aspect of the architecture is the automated triggering of investigations when alerts fire. Rather than requiring manual investigation initiation, the solution configures Datadog alerting webhooks to invoke AWS DevOps Agent directly.

When a Datadog monitor enters an alert state, it fires a webhook to the AWS DevOps Agent endpoint, including:

  • The message ID associated with the processing failure
  • The trace ID for APM correlation
  • The alert timestamp and alert condition
  • The triggering monitor name and severity

AWS DevOps Agent authenticates the webhook using a bearer token and immediately initiates an investigation in the configured Agent Space. The Datadog webhook payload serves as the investigation’s initial context, seeding the agent with the specific identifiers it needs to perform targeted queries rather than broad searches across the full data volume.

Architecture Diagram

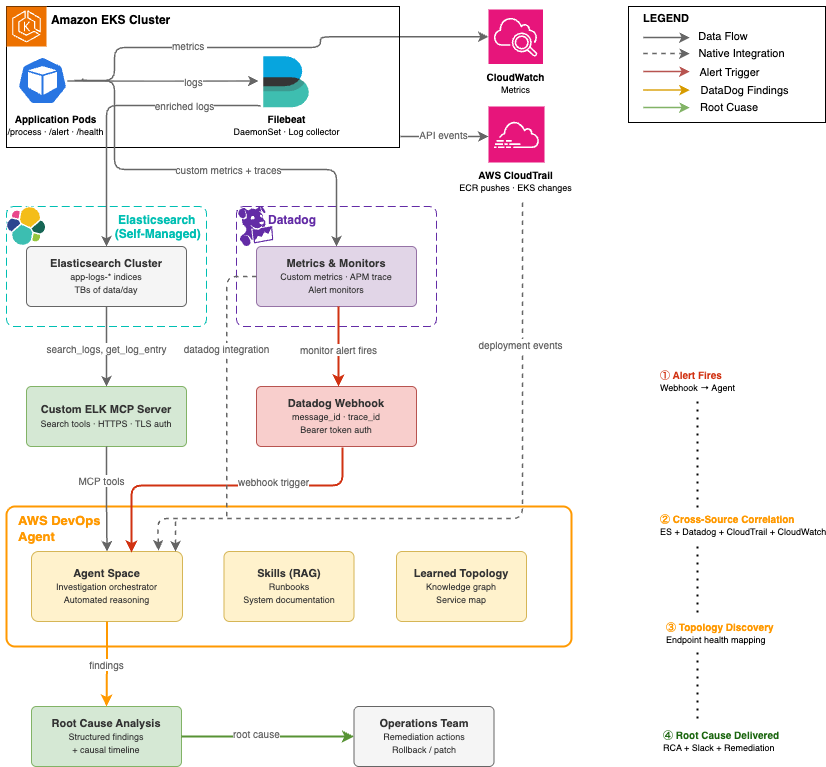
Architecture diagram showing the automated root cause analysis pipeline. A Datadog alert fires a webhook to AWS DevOps Agent, which queries three sources: an ELK MCP Server connected to Elasticsearch for log data, native Datadog integration for metrics, and AWS CloudTrail for deployment events. Results flow back to the Agent Space for correlated root cause analysis.
Figure 1:
Automated root cause analysis pipeline — from Datadog alert to AWS DevOps Agent investigation across Elasticsearch, Datadog, and AWS CloudTrail

Implementation Walkthrough

The following walkthrough describes the end-to-end setup required to replicate the message ID traceability solution in your own environment.

Step 1: Configure EKS Cluster Access for AWS DevOps Agent

AWS DevOps Agent requires an access entry in each EKS cluster it will investigate. This enables the agent to describe Kubernetes objects, retrieve pod logs, and access cluster events.

  1. In the AWS DevOps Agent console, navigate to your Agent Space and select the Capabilities tab.
  2. Under the Cloud section, select the primary source and choose Edit. Note the Role Name shown in the Role Name field, this is the IAM role that requires EKS access.
  3. In the Amazon EKS console, select each cluster and open the Access tab.
  4. Under IAM Access Entries, choose Create to add a new access entry.
  5. Set the IAM Principal ARN to the Agent Space role noted in step 2.
  6. Under Access Policies, select AmazonAIOpsAssistantPolicy with Cluster scope. Choose Add Policy, then Next.
  7. Review and create the access entry.

At scale: For environments with 50+ clusters, use the AWS CLI, Terraform, or a GitOps pipeline to automate access entry creation across all clusters. The following CLI command creates an access entry for a single cluster:

aws eks create-access-entry --cluster-name <CLUSTER_NAME> --principal-arn <AGENTSPACE_ROLE_ARN> --region <REGION>
aws eks associate-access-policy --cluster-name <CLUSTER_NAME> --principal-arn <AGENTSPACE_ROLE_ARN> --policy-arn arn:aws:eks::aws:cluster-access-policy/AmazonAIOpsAssistantPolicy --access-scope type=cluster --region <REGION>

Step 2: Configure Datadog Integration in AWS DevOps Agent

AWS DevOps Agent includes native Datadog integration. Configuration requires your Datadog API credentials and designates the integration as a data source in the Agent Space. In the AWS DevOps Agent console, navigate to Integrations and choose Add Integration and follow the steps.

After configuration, AWS DevOps Agent can query Datadog metrics, monitors, and events during investigations. Custom application metrics (message throughput, error rates, processing status per message ID) are automatically accessible once the integration is active.

Step 3: Deploy and Configure the Custom ELK MCP Server

The Elasticsearch MCP server bridges AWS DevOps Agent to your self-managed Elasticsearch deployment. The MCP server is deployed as a publicly accessible endpoint with TLS authentication, enabling AWS DevOps Agent to call Elasticsearch APIs securely without requiring direct network access to the actual Elasticsearch/Kibana instances.

Note: For basic Elasticsearch integration, the official Elasticsearch MCP server provides a ready-to-use option. For this use case, we built a custom Python MCP server using FastMCP to expose investigation-specific tools — trace ID correlation, time-window log retrieval, and latency analysis — tailored to our message traceability workflow.

The custom server implementation provides the thirteen tools required for log search, index discovery, and aggregation.

Table: ELK MCP Server tools access by AWS DevOps Agent during investigations
MCP Tool Description
search_logs Search by Lucene query string, time range, and log level
get_error_summary Top recurring errors within a time window
get_recent_logs Fetch most recent log entries from an index
get_logs_by_service Filter logs by service or application name
count_logs_by_level Breakdown of log counts by level (ERROR, WARN, INFO, DEBUG)
get_slow_requests Find requests exceeding a latency threshold
get_logs_around_time Fetch logs within ±N minutes of a specific timestamp
search_by_trace_id Find all logs for a specific trace, request, or correlation ID
get_unique_errors Get distinct error messages in a time window
list_indices List all available Elasticsearch indices with doc counts and health
get_index_stats Get size, document count, and health of a specific index
get_logs_by_host Filter logs by the hostname that sent them via Filebeat
get_logs_by_file Filter logs by the source log file path
  1. Launch an Ubuntu instance (t4g.medium or larger) with a security group allowing inbound TCP 443 from AWS DevOps Agent service endpoints.Note: The single-instance deployment described here is intended for demonstration purposes and does not provide high availability. For production workloads requiring managed infrastructure, automatic scaling, and built-in resilience for your MCP servers, consider using Amazon Bedrock AgentCore Runtime.
  2. Install dependencies and obtain a TLS certificate:
    sudo apt update &&sudo apt install -y python3 python3-venv certbot
    python3 -m venv ~/elk-mcp-venv
    source ~/elk-mcp-venv/bin/activate
    pip install mcp elasticsearch uvicorn starlette
    sudo certbot certonly --standalone -d elk-mcp.yourcompany.com
  3. Create the MCP server. The key architectural decisions are: FastMCP for the Streamable HTTP transport, Starlette middleware for API key authentication, and environment variables for configuration:
    import json, os
    from mcp.server.fastmcp import FastMCP
    from elasticsearch import Elasticsearch
    from starlette.middleware.base import BaseHTTPMiddleware
    from starlette.responses import JSONResponse
    
    ES_HOST = os.environ.get("ES_HOST", "http://localhost:9200")
    API_KEY = os.environ.get("MCP_API_KEY", "YOUR_API_KEY")
    es = Elasticsearch(hosts=[ES_HOST])
    mcp = FastMCP("elk-logs", host="elk-mcp.yourcompany.com")
    
    # API key authentication middleware
    class APIKeyMiddleware(BaseHTTPMiddleware):
        async def dispatch(self, request, call_next):
            if request.headers.get("x-api-key") != API_KEY:
                return JSONResponse({"error": "Unauthorized"}, status_code=401)
            return await call_next(request)
    
    # Example: trace ID correlation tool
    @mcp.tool
    def search_by_trace_id(trace_id: str, index: str, size: int = 100) -> str:
        """Find all logs for a specific request or trace ID."""
        result = es.search(index=index, body={
            "query": {"multi_match": {
                "query": trace_id,
                "fields": ["trace_id", "request_id", "correlation_id", "traceId"]
            }},
            "sort": [{"@timestamp": "asc"}],
            "size": size
        })
        return json.dumps([h["_source"] for h in result["hits"]["hits"]], indent=2)
    
    # ... additional tools follow the same pattern
    
    app = mcp.streamable_http_app()
    app.add_middleware(APIKeyMiddleware)
    
    if __name__ == "__main__":
        import uvicorn
        uvicorn.run(app, host="0.0.0.0", port=443,
            ssl_keyfile="/etc/letsencrypt/live/elk-mcp.yourcompany.com/privkey.pem",
            ssl_certfile="/etc/letsencrypt/live/elk-mcp.yourcompany.com/fullchain.pem")
  4. Start the server:
    sudo -E ES_HOST=http://<ELASTICSEARCH_IP>:9200 MCP_API_KEY=<YOUR_API_KEY> nohup ~/elk-mcp-venv/bin/python ~/elk_mcp_server.py > ~/mcp.log 2>&1 &
  5. Register in AWS DevOps Agent:
    1. In the AWS DevOps Agent console, navigate to Integrations -> Add MCP Integration.
    2. Enter the endpoint URL: https://elk-mcp.yourcompany.com:443/mcp
    3. Enter the API key for authentication.
    4. Verify the integration shows all available tools in the integration detail view.
    5. Add the MCP integration to your Agent Space under the Integrations tab.

Note: The MCP server must be publicly accessible over HTTPS. If your Elasticsearch cluster is in a private VPC, deploy the MCP server with network access to the cluster (e.g., in the same VPC or a peered VPC) while exposing only the MCP server endpoint publicly. Use security group rules to restrict access to AWS DevOps Agent’s known egress IP ranges where possible.

Step 4: Deploy the Application and Configure Filebeat on EKS

Filebeat runs as a Kubernetes DaemonSet on each EKS cluster, collecting pod logs and enriching them with Kubernetes metadata before forwarding to Elasticsearch. The following pipeline configuration ensures that message IDs and trace IDs are preserved as indexed fields, enabling efficient targeted queries during investigations.

  1. Clone the Repository and Build the Container Image:
    # Clone the DevOps agent sample repository
    git clone https://github.com/aws-samples/Amazon-prometheus-bedrock-agent-example.git
    
    # Navigate to the smart demo directory
    cd devops-agent/smart-demo-main/
    
    # Authenticate Docker to your ECR registry
    aws ecr get-login-password --region us-west-2 | docker login --username AWS --password-stdin <your-account-id>.dkr.ecr.us-west-2.amazonaws.com
    
    # Build the container image
    docker build -t sample-app .
    
    # Tag the image for ECR
    docker tag sample-app:latest <your-account-id>.dkr.ecr.us-west-2.amazonaws.com/smart-demp:latest
    
    # Push the image to ECR
    docker push <your-account-id>.dkr.ecr.us-west-2.amazonaws.com/smart-demp:latest
  2. Deploy the Application to EKS:
    # Deploy the sample application to EKS using Helm
    helm install sample-app ./helm --set image.repository=<your-account-id>.dkr.ecr.us-west-2.amazonaws.com/smart-demp --set image.tag=latest
  3. Deploy Filebeat as DaemonSet:
    # Navigate to the Filebeat directory
    cd filebeat
    
    # Apply the Filebeat ConfigMap (autodiscovery, JSON parsing, K8s metadata enrichment, Logstash output)
    kubectl apply -f filebeat-configmap.yaml
    
    # Deploy Filebeat as a DaemonSet on every node in the cluster
    kubectl apply -f filebeat-ds.yaml

Step 5: Configure Datadog Webhook for Automatic Investigation Triggering

We will automatically trigger AWS DevOps Agent investigations when Datadog alerts fire. This eliminates the human latency between alert detection and investigation initiation.

Retrieve the AWS DevOps Agent webhook URL and secret:

  1. In the AWS DevOps Agent console, navigate to your Agent Space and open the Capabilities tab.
  2. Under the Webhook section, choose Configure, then Generate webhook.
  3. Save the webhook URL and HMAC secret. These credentials are used to authenticate webhook requests from Datadog.

In Datadog, configure a webhook integration:

  1. Navigate to Integrations -> Webhooks and create a new webhook.
  2. Set the URL to the AWS DevOps Agent webhook endpoint.
  3. Add the Authorization header with the bearer token from step 3.
  4. Configure the payload to include the message ID, trace ID, and alert context:
    {
    "title": "Message Processing Failure - $EVENT_TITLE",
    "description": "$EVENT_MSG",
    "alert_id": "$ALERT_ID",
    "alert_status": "$ALERT_STATUS",
    "timestamp": "$TIMESTAMP",
    "message_id": "$tags.message_id",
    "trace_id": "$tags.trace_id",
    "service": "$tags.service",
    "cluster": "$tags.cluster_name",
    "severity": "$ALERT_PRIORITY"
    }
  5. Associate the webhook with the Datadog monitors that detect message processing failures by adding @webhook-webhook-name to the monitor notification message.

Step 6: Configure Agent Space Skills (Optional but Recommended)

AWS DevOps Agent Skills provide a Retrieval-Augmented Generation (RAG) knowledge base that gives the agent organization-specific context during investigations. Even a brief skills document (2-3 paragraphs) that identifies your application’s purpose, its key components, and its observability backends can reduce AWS DevOps Agent investigation time by helping the agent understand context before executing its first queries.

In our implementation, the skills document described the sample message-processing application, identified Elasticsearch as the logging backend, and identified Datadog as the metrics backend.

Real-World Investigation: Message Processing Failure Diagnosed in 6 Minutes

The following walkthrough and the scenario represent a common class of incident in distributed systems: a silent functional regression introduced through a new container image deployment that causes specific message types to fail processing without immediately obvious symptoms.

The Scenario

The production EKS cluster runs a message-processing application (sample-app) with four HTTP endpoints:

  • /health – Application health check
  • /metrics – Prometheus metrics endpoint
  • /process – Core message processing endpoint
  • /alert – Alert notification endpoint (newly introduced in recent deployment)

A new container image was pushed to Amazon ECR with a new /alert endpoint. However, the endpoint implementation was incomplete when called; it returned an HTTP 404 response and silently dropped the associated message. The Filebeat DaemonSet collected pod logs and sent them into Elasticsearch. Datadog captured application metrics with message ID and trace ID labels. A Datadog monitor detected the elevated error rate and fired.

Phase 1: Alert Fires and Investigation Initiates (T+0:00)

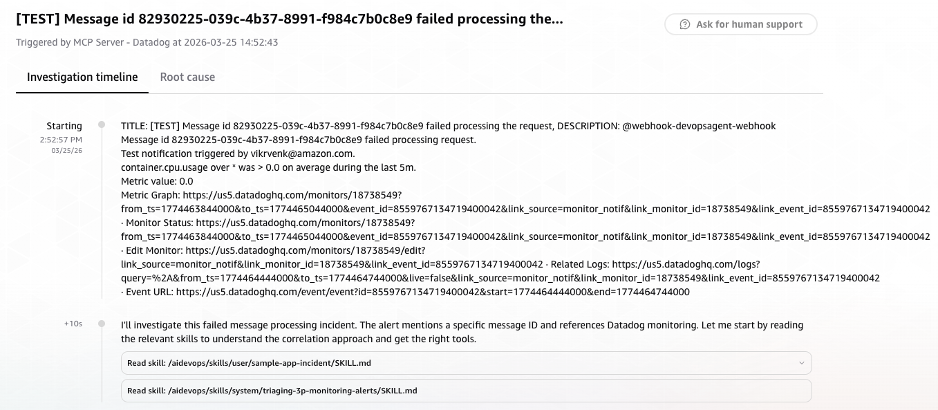
At 14:52:57 UTC, a Datadog monitor detected an elevated rate of failed message processing requests on the /alert endpoint. The monitor fired a webhook to the AWS DevOps Agent endpoint with the alert payload context.

Within 10 seconds, the Agent read its investigation skills (sample-app-incident and triaging-3p-monitoring-alerts) and began planning the investigation approach.

Screenshot of AWS DevOps Agent console showing an investigation automatically initiated via Datadog webhook. The alert payload context includes message ID, trace ID, and alert timestamp. Investigation skills sample-app-incident and triaging-3p-monitoring-alerts are loaded
Figure 2: AWS DevOps Agent investigation initiated automatically via Datadog webhook, showing alert payload context and investigation skills loaded

Phase 2: Cross-Source Signal Correlation (T+0:10 – T+2:30)

AWS DevOps Agent began its investigation by using the message ID from the alert payload as its primary search key. It decided its investigation strategy: extract the trace_id from Elasticsearch using the message_id, get Datadog monitor details, and search for errors around the alert time.

Elasticsearch Log Search
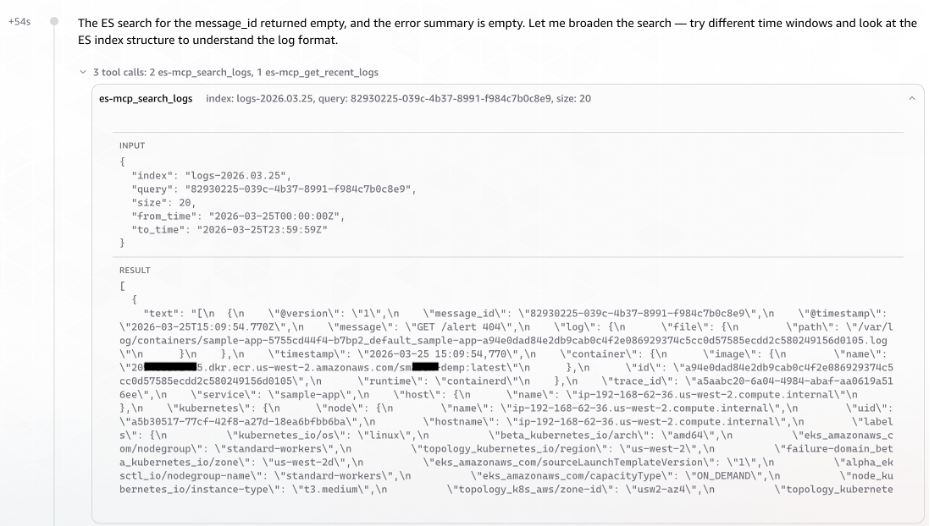
The agent invoked the ELK MCP server to list available indices and identify the relevant log store for the message-processor application. It then executed a targeted search and identified the relevant Elasticsearch index (logs-2026.03.25):

Screenshot of AWS DevOps Agent querying the ELK MCP Server to correlate a message ID to a trace ID across Elasticsearch indices. The agent identifies the relevant log index logs and retrieves matching log entries
Figure 3: AWS DevOps Agent querying the ELK MCP Server to correlate message ID to trace ID across Elasticsearch indices

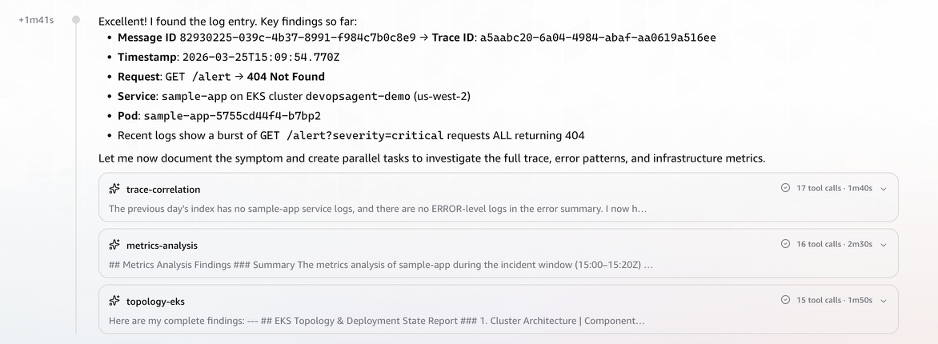
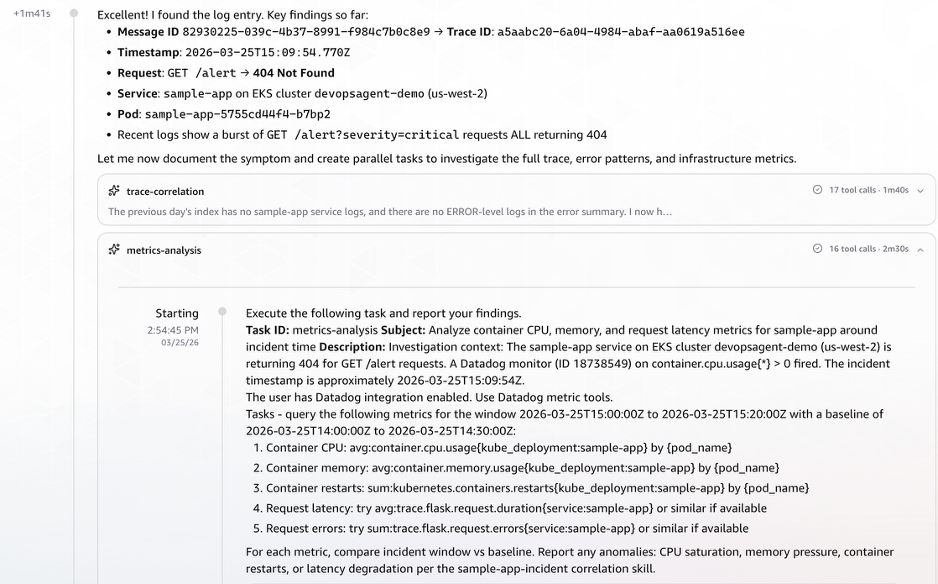
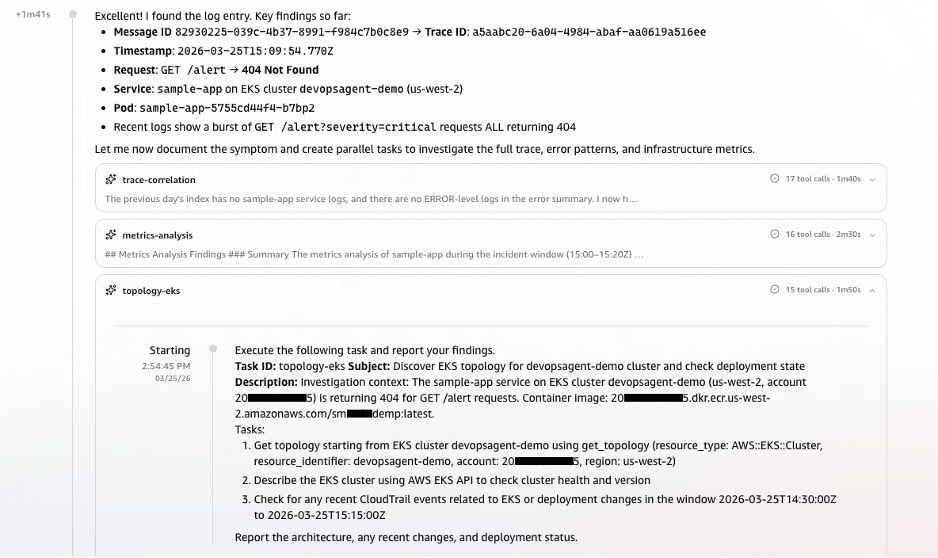
AWS DevOps Agent surfaced the Message ID to Trace ID correlation without any explicit cross-referencing instruction. It recognized the relationship from the log structure. At T+1:41, the DevOps Agent launched three parallel tasks simultaneously, rather than investigating sequentially.

Screenshot showing the trace ID successfully resolved from the Elasticsearch log structure, triggering three parallel investigation tasks: Datadog metrics correlation, EKS topology analysis, and CloudTrail event correlation.Figure 4: Trace ID successfully resolved from log structure, triggering three parallel investigation tasks

Datadog Metrics Correlation
Using the trace ID extracted from the Elasticsearch logs, the agent queried Datadog for correlated metrics. It retrieved CPU and memory utilization, pod count, restart metrics and enhanced metrics for request latency and errors.

Screenshot of Datadog metrics retrieved by AWS DevOps Agent using the extracted trace ID, showing CPU utilization, memory usage, pod restart counts, and request latency metrics for the affected service.
Figure 5: Datadog metrics correlation showing CPU, memory, pod restarts, and request latency retrieved using the extracted trace ID

AWS EKS Topology & CloudTrail Event Correlation
AWS DevOps Agent queried AWS CloudTrail for deployment and configuration change events in the time window preceding the alert.

Screenshot of AWS CloudTrail event correlation identifying deployment and configuration change events in the time window preceding the alert, including ECR image push and EKS rolling deployment events
Figure 6: AWS CloudTrail event correlation identifying deployment and configuration changes in the alert time window

With the initial timeline established, AWS DevOps Agent examined all endpoints and their response patterns. This revealed that the application was fundamentally healthy, with three of four endpoints returned consistent 200 responses. However, it also revealed the anomaly was isolated to the /alert endpoint, which had never successfully served a request in its observable history.

Screenshot of AWS DevOps Agent endpoint analysis showing three healthy endpoints returning HTTP 200 responses (health, metrics, process) and the alert endpoint returning consistent HTTP 404 failures, isolating the anomaly to the newly deployed alert endpoint.
Figure 7: AWS DevOps Agent endpoint analysis revealing isolated 404 failures on the /alert endpoint while other endpoints remain healthy

Phase 3: Observation Streaming from Parallel Tasks (T+2:30 – T+3:54)

As the three tasks ran simultaneously, observations streamed in chronologically:

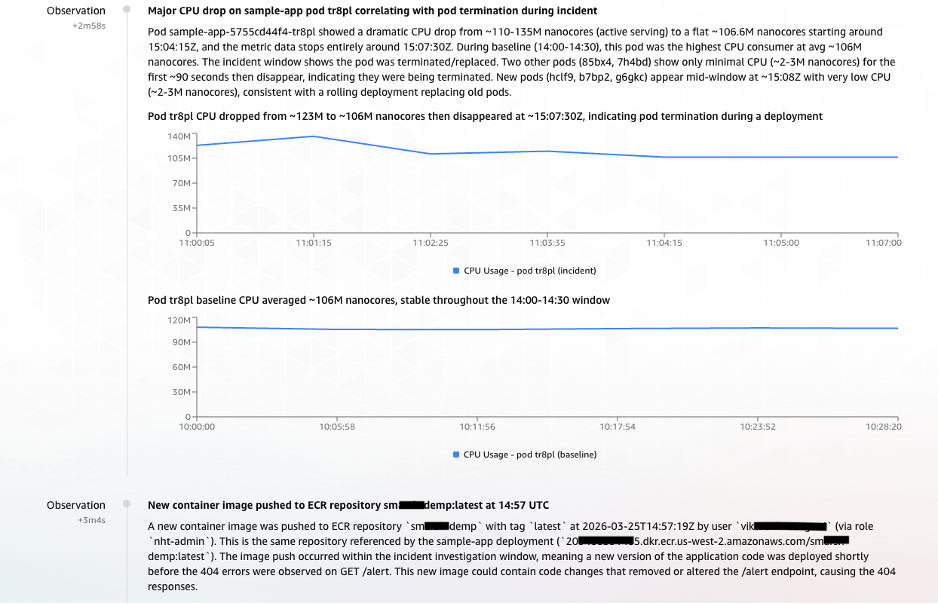
T+2:58 – Observation: Anomalous CPU Behavior Signals Pod Disruption

The first sign of trouble came from pod tr8pl. Its CPU usage dropped sharply. Around the same time, two unfamiliar pods (85bx4, 7h4bd) briefly appeared with minimal CPU. Shortly after, three new pods (hclf9, b7bp2, g6gkc) spun up. This pattern of old pods dying, short-lived intermediaries, and fresh containers starting up pointed strongly toward a rolling deployment in progress.

T+3:04 – Observation: ECR Image Push Traced as the Trigger

With the deployment pattern established, the next question was: what initiated it? CloudTrail provided the answer. At 14:57:19 UTC, a user vik**** (via role nht-admin) pushed a new container image to ECR repository sm***demp:latest (ECR image tag). The timeline now made sense:

  1. ECR image push at 14:57:19 UTC
  2. Rolling deployment (pods replaced)
  3. /alert endpoint 404 errors begin
  4. Datadog alert fires

Screenshot showing parallel task observations streaming into AWS DevOps Agent. Anomalous CPU behavior indicates pod disruption from a rolling deployment, and CloudTrail evidence links an ECR image push by user vik at 14:57:19 UTC to the deployment that introduced the failing endpoint.
Figure 8: Parallel task observations streaming into AWS DevOps Agent – anomalous CPU behavior indicating pod disruption and CloudTrail evidence linking the ECR image push to the rolling deployment

Phase 4: Findings Documented – Causal Chain Established (T+3:55 – T+5:08)

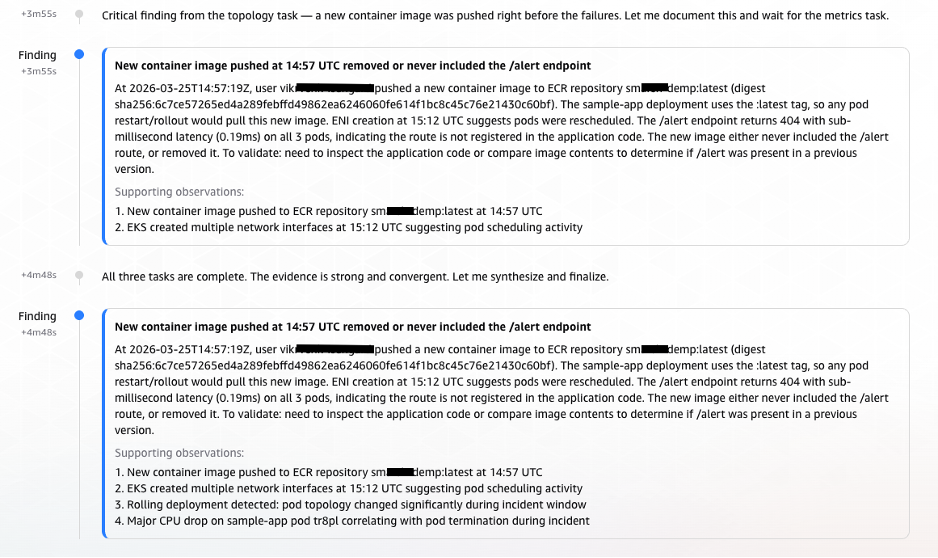
At T+3:55, the Agent documented its first formal Finding (elevated from Observation):

Screenshot of AWS DevOps Agent documenting its formal finding, establishing the causal chain: ECR image push triggered rolling deployment, new container image contained incomplete alert endpoint implementation, endpoint returns 404 and drops messages.
Figure 9: AWS DevOps Agent formal finding documenting the causal chain from ECR image push to alert endpoint failure

Phase 5: Root Cause Confirmation and Infrastructure Validation (T+5:10 – T+5:30)

AWS DevOps Agent validated infrastructure health. The complete absence of infrastructure issues, combined with the timeline evidence from CloudTrail and the historical 404 pattern on the /alert endpoint, allowed AWS DevOps Agent to deliver a high-confidence root cause identification.

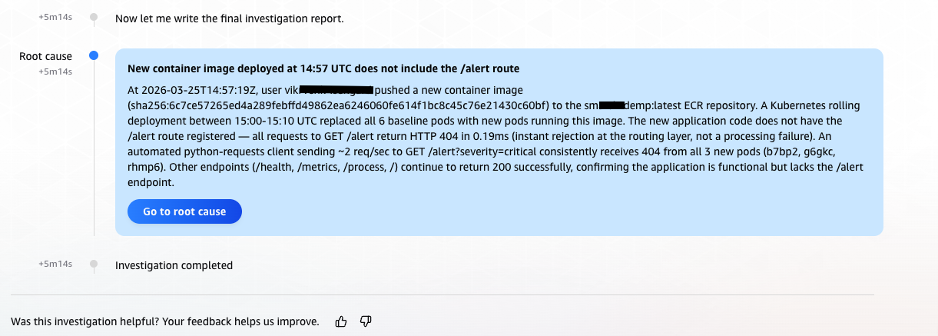
At 14:58:12 UTC, exactly 5 minutes and 14 seconds (under 6 minutes) after the investigation began, AWS DevOps Agent delivered its root cause analysis:

Screenshot of the final root cause analysis delivered by AWS DevOps Agent at 14:58:12 UTC, 5 minutes and 14 seconds after investigation began. Root cause identified as an incomplete alert endpoint in the newly deployed container image that returns HTTP 404 and silently drops associated messages.
Figure 10: Final root cause analysis delivered by AWS DevOps Agent, identifying the incomplete alert endpoint in the newly deployed container image

Clean-up

Step 1: Delete the AWS DevOps Agent AgentSpace

  1. In the AWS DevOps Agent console, navigate to Agent Spaces.
  2. Select the Agent Space you created for this walkthrough.
  3. Remove all integrations (Datadog, ELK MCP Server) from the Agent Space by navigating to the Capabilities tab and choosing Remove for each.
  4. Choose Delete Agent Space from Actions dropdown and confirm the deletion.

Step 2: Terminate the Microservices and Delete the EKS Cluster

First, remove the application workloads and Filebeat DaemonSet deployed on the cluster:

# Uninstall the sample application Helm release
helm uninstall sample-app

# Delete the Filebeat DaemonSet and ConfigMap
kubectl delete -f filebeat/filebeat-ds.yaml
kubectl delete -f filebeat/filebeat-configmap.yaml

Once the workloads are removed, delete the EKS cluster.

Step 3: Terminate EC2 Instances

Terminate the EC2 instances hosting both the MCP server and the Elasticsearch cluster. You can do this from the AWS Management Console or the AWS CLI:

# Terminate the MCP server EC2 instance
aws ec2 terminate-instances --instance-ids <MCP_SERVER_INSTANCE_ID> --region <REGION>

# Terminate the Elasticsearch EC2 instances
aws ec2 terminate-instances --instance-ids <ELASTICSEARCH_INSTANCE_ID> --region <REGION>

Conclusion

Distributed systems have created a correlation problem that scales faster than the human capacity to solve it. As microservices architectures grow to span dozens of clusters, hundreds of services, and terabytes of daily telemetry, the manual investigation practices that worked at smaller scale become the primary obstacle in maintaining operational quality.

AWS DevOps Agent addresses this challenge at its root by automating the multi-source correlation that previously required experienced engineers working across multiple systems. The combination of native Datadog integration, custom ELK MCP server connectivity, and AWS CloudTrail access enables AWS DevOps Agent to build the complete picture of an incident: from the first metric anomaly, through the log evidence, to the deployment event that caused it. The scenario described in this post demonstrates that a message processing incident that previously consumed hours can be diagnosed to root cause in under six minutes automatically, without manual intervention, and with the full investigation documented for audit and learning purposes.

About the Authors

Bhuvan Jain

Bhuvan Jain

Bhuvan is a Senior Technical Account Manager at Amazon Web Services, supporting independent software vendor (ISV) customers. He is passionate about helping customers build Well-Architected solutions on AWS, with a focus on enterprise-scale networking. As a subject matter expert, Bhuvan offers guidance on designing network architectures that are highly available, resilient, and cost-effective. He holds a Master’s degree in Electrical and Computer Engineering from the University of Illinois at Chicago (UIC). In his free time, he enjoys playing basketball and volleyball, as well as watching movies and TV series.

Vikram Venkataraman

Vikram Venkataraman

Vikram Venkataraman is a Principal Specialist Solutions Architect at Amazon Web Services. He helps customers modernize, scale, and adopt best practices for containerized workloads on Amazon EKS. With the emergence of AI-powered automation, Vikram has been actively working with customers to leverage AWS AI/ML services to solve complex operational challenges, streamline monitoring workflows, and enhance incident response through intelligent automation. He designed and built the POC architecture described in this post and is a co-author of the EKS knowledge graphs blog.

Agentic application modernization at scale with Strands and Amazon Transform custom

Post Syndicated from Kanishk Mahajan original https://aws.amazon.com/blogs/devops/use-generative-ai-agents-for-application-modernization-at-scale-with-strands-amazon-transform-custom-and-amazon-bedrock-agentcore/

Introduction

Modernizing applications by upgrading language runtimes, migrating SDKs, and refactoring frameworks is important for cloud adoption but can be labor-intensive at scale. Each repository requires analysis of dependencies and transformation needs; custom transformation logic must be built and validated, and changes are often executed sequentially across codebases. If you have hundreds of applications, this stretches timelines from months to years, while introducing inconsistency across your teams.

To address this, Amazon Web Services (AWS) provides a composable set of building blocks. AWS Transform custom enables reusable, CLI-driven code transformations for upgrading runtimes, SDKs, and frameworks consistently across large portfolios. Strands Agents provides a framework for building multi-agent systems that coordinate complex transformation workflows. Amazon Bedrock AgentCore delivers the managed runtime, memory, and observability to operate these agents reliably in production. Together, they replace manual, sequential modernization with an intelligent, automated approach that scales.

In this post, we show you how to combine these services to build a generative AI–powered, agentic modernization system that can automatically analyze application repositories, determine required changes, create missing transformations, and execute them in parallel at scale.

Solution overview

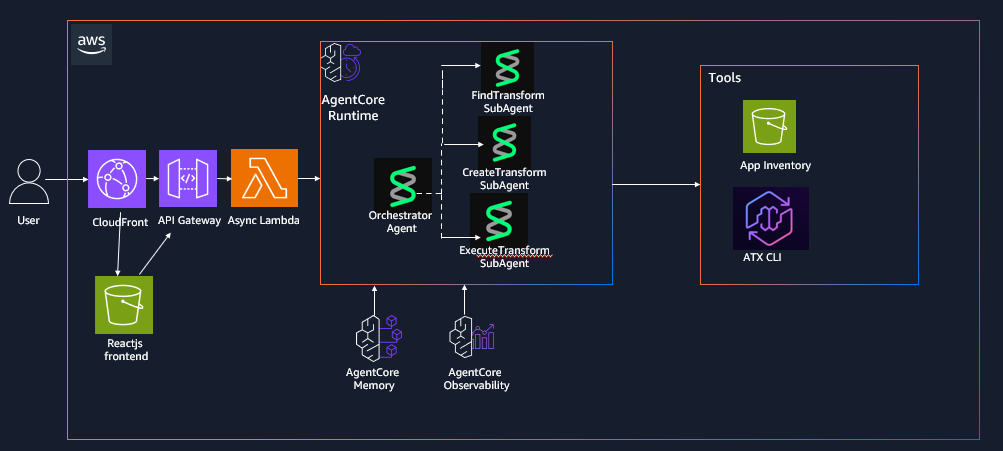
The solution uses an agentic architecture that separates intelligent decision-making from deterministic execution, enabling automation at scale while maintaining consistency and control. In this post, you will build an AI-driven application modernization system that demonstrates how multi-agent workflows can be applied to large-scale code transformation scenarios. You interact with the system through a React-based frontend or API interface, submitting individual repositories or batch workloads via CSV inputs. Requests are processed asynchronously through an API layer that invokes an orchestrator agent running on Amazon Bedrock AgentCore, which coordinates specialized agents to analyze codebases, identify transformation requirements, and manage execution workflows. Results are stored and surfaced through the interface, allowing users to track progress and review outputs in real time.The workflow begins with repository analysis, where the system inspects application codebases to identify languages, dependencies, and required upgrades such as runtime version changes or SDK migrations. Based on this analysis, the system maps each application to an existing transformation when available. If no suitable transformation exists, a creation agent dynamically generates one using natural language instructions and publishes it to a centralized registry for reuse, creating a continuously improving system where transformation coverage expands over time.

Once transformations are identified or created, an execution agent runs them at scale by invoking AWS Batch jobs that execute the AWS Transform custom CLI, enabling parallel processing across multiple repositories. The orchestrator coordinates all agents, maintains workflow state using Amazon Bedrock AgentCore Memory, and ensures reliable execution through structured task decomposition, tool invocation, and error handling. While the example focuses on application re-platforming, the same architectural pattern can be applied to other large-scale code analysis and automation workflows.

The following architecture diagram (Figure 1) illustrates the various components of our solution as outlined in this section:architecture diagram describing the multi agent strands and agentcore deployment

Figure 1: AWS Transform custom Agentic Orchestration Architecture using Strands agents and Amazon Bedrock AgentCore

Prerequisites

Complete the following prerequisites:

  1. Install the AWS Command Line Interface (AWS CLI).
  2. Install the AWS SAM CLI v1.100.0+
  3. Install Docker v20.x+.
  4. Install Node.js v18.x+
  5. Install Python v3.11+
  6. Install the AWS CDK CLI
  7. Enable access to a Bedrock model for the orchestrator in your deployment region. The default model can be configured through the Amazon Bedrock model access console. To use a different model, set `BEDROCK_MODEL_ID` in `deployment/config.env` before Step 3 and enable access to that model instead. Model access approval can take a few minutes in some accounts, so complete this step before deploying.

Dependencies

The Strands Agents implementation has the following dependencies that are packaged in the DockerFile:

  1. Strands multi-agent framework: strands-agents
  2. Strands agent tools and utilities: strands-agents-tools
  3. HTTP library for API calls: requests
  4. Amazon Bedrock AgentCore SDK: bedrock-agentcore
  5. AWS SDK for Python: boto3

Deploy the solution

The solution is available for download on the GitHub repo. This post walks through the CDK + SAM deployment path (Option A in the repository README). The repository also includes a CDK-only option (Option B); see the repository README for details.

Step 1: Clone the repository

git clone https://github.com/aws-samples/aws-transform-custom-samples.git

cd aws-transform-custom-samples/agentic-atx-platform

Step 2: Configure AWS Credentials

# Configure AWS CLI

aws configure

# Verify credentials

aws sts get-caller-identity

Step 3: Deploy ATX CLI Container image and frontend using AWS CDK

# Copy configuration template (defaults work for most setups; edit only to change region or Bedrock model)

cd deployment

cp config.env.template config.env

# Authenticate with Amazon ECR Public (required for the Docker base image pull)

aws ecr-public get-login-password --region us-east-1 | docker login --username AWS --password-stdin public.ecr.aws

# Build the UI placeholder so CDK’s UI stack has ui/dist/ to deploy

cd ../ui && npm install && npx vite build

# Install CDK dependencies and bootstrap (run once per account/region)

cd ../cdk

npm install cdk bootstrap

# Build TypeScript and deploy the three stacks

npx tsc

CDK_DEFAULT_ACCOUNT=$(aws sts get-caller-identity --query Account --output text)

cdk deploy AtxContainerStack AtxInfrastructureStack AtxUiStack --require-approval never

# Note for accounts without a default VPC , pass the VPC context flags to `cdk deploy`:

cdk deploy AtxContainerStack AtxInfrastructureStack AtxUiStack --require-approval never

cdk deploy AtxContainerStack AtxInfrastructureStack AtxUiStack --require-approval never -c existingVpcId=vpc-xxx -c existingSubnetIds=subnet-aaa,subnet-bbb -c existingSecurityGroupId=sg-ccc

# Subnets must be public (auto-assign public IP enabled) or private with a NAT gateway so Fargate tasks can reach Amazon ECR, Amazon S3, and Git repositories.

Step 4: Deploy Strands Agents to AgentCore runtime using AWS SAM

cd ../sam./deploy.sh

# Invoke the deploy Lambda to create the AgentCore Runtime via the bedrock-agentcore-control SDK (takes 2-5 minutes)

aws lambda invoke --function-name atx-deploy-agentcore \ --region us-east-1 \ --cli-binary-format raw-in-base64-out \ --payload '{"action":"deploy"}' \ --cli-read-timeout 900 /tmp/deploy-output.jsoncat /tmp/deploy-output.json

Step 5: Wire the AgentCore runtime ARN into the async invoke Lambda

ACCOUNT_ID=$(aws sts get-caller-identity --query Account --output text)

RUNTIME_ARN=$(python3 -c "import json; print(json.loads(json.load(open('/tmp/deploy-output.json'))['body'])['runtime_arn'])")aws lambda update-function-configuration \ --function-name atx-async-invoke-agent \ --region us-east-1 \ --environment "Variables={AGENT_RUNTIME_ARN=${RUNTIME_ARN},RESULT_BUCKET=atx-custom-output-${ACCOUNT_ID},JOBS_TABLE=atx-transform-jobs}"

Step 6: Rebuild and deploy the frontend with AgentCore API endpoint

# Update the React application with the deployed API endpoint and redeploy it.

API_URL=$(aws cloudformation describe-stacks \ --stack-name AtxAgentCoreSAM \ --region us-east-1 \ --query 'Stacks[0].Outputs[?OutputKey==`ApiEndpoint`].OutputValue' \ --output text)

cd ../ui

VITE_API_ENDPOINT=$API_URL npx vite build./deploy-aws.sh

# This rebuilds the React application with the correct API endpoint, uploads it to Amazon S3, and invalidates the Amazon CloudFront distribution.

Step 7: Access the application

# After deployment completes, retrieve the CloudFront distribution URL from the AWS CloudFormation outputs and open it in your browser to access the application UI.

aws cloudformation describe-stacks \ --stack-name AtxUiStack \ --region us-east-1 \ --query 'Stacks[0].Outputs[?OutputKey==`WebsiteUrl`].OutputValue' \ --output text

Using the application

The UI exposes five tabs covering the complete modernization workflow: browsing available transformations, executing a transformation on a single repository, creating a new custom transformation with natural language, batch-processing a CSV of repositories, and tracking job status. This section walks through two of the most common flows.

Create a custom transformation from natural language

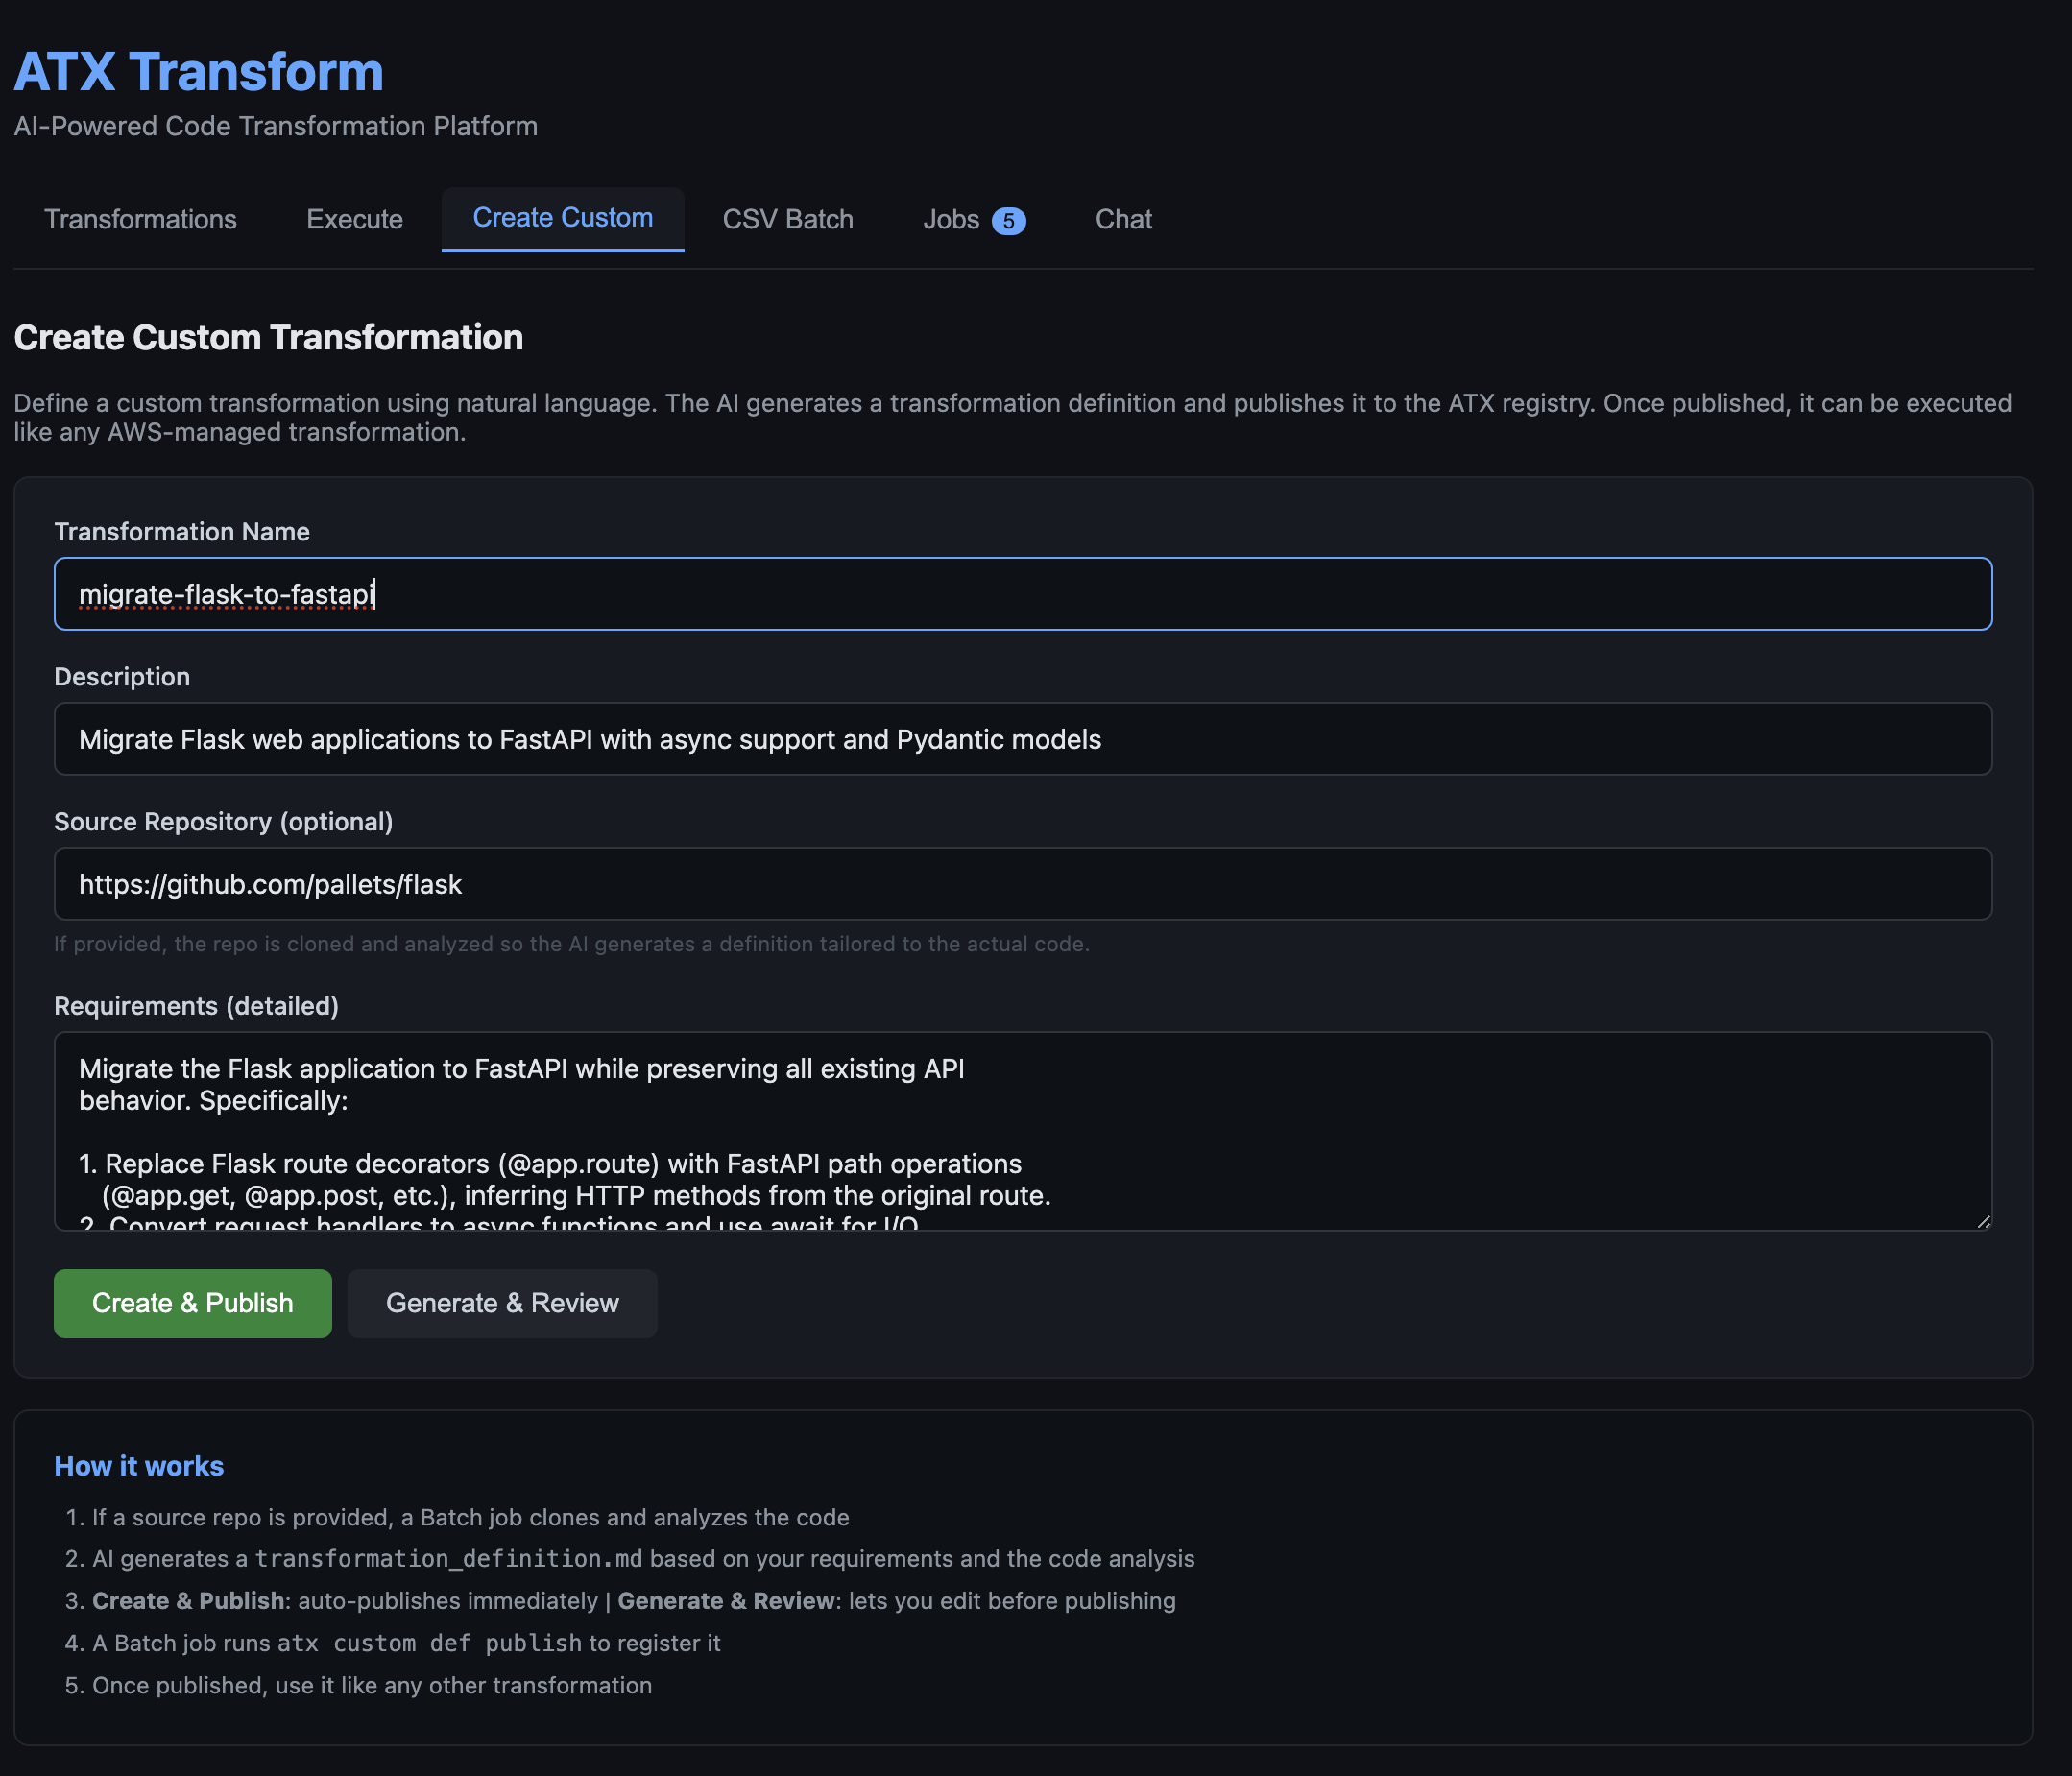
Open the Create Custom tab, describe the transformation in plain English (for example, “Upgrade Spring Boot 2 applications to Spring Boot 3”), and optionally provide a reference repository URL. The creation agent analyzes the source, generates a transformation definition, and publishes it to the ATX registry for reuse across the portfolio.

Describing a custom transformation in plain English. The form accepts a name, description, optional reference repository, and natural-language requirements.

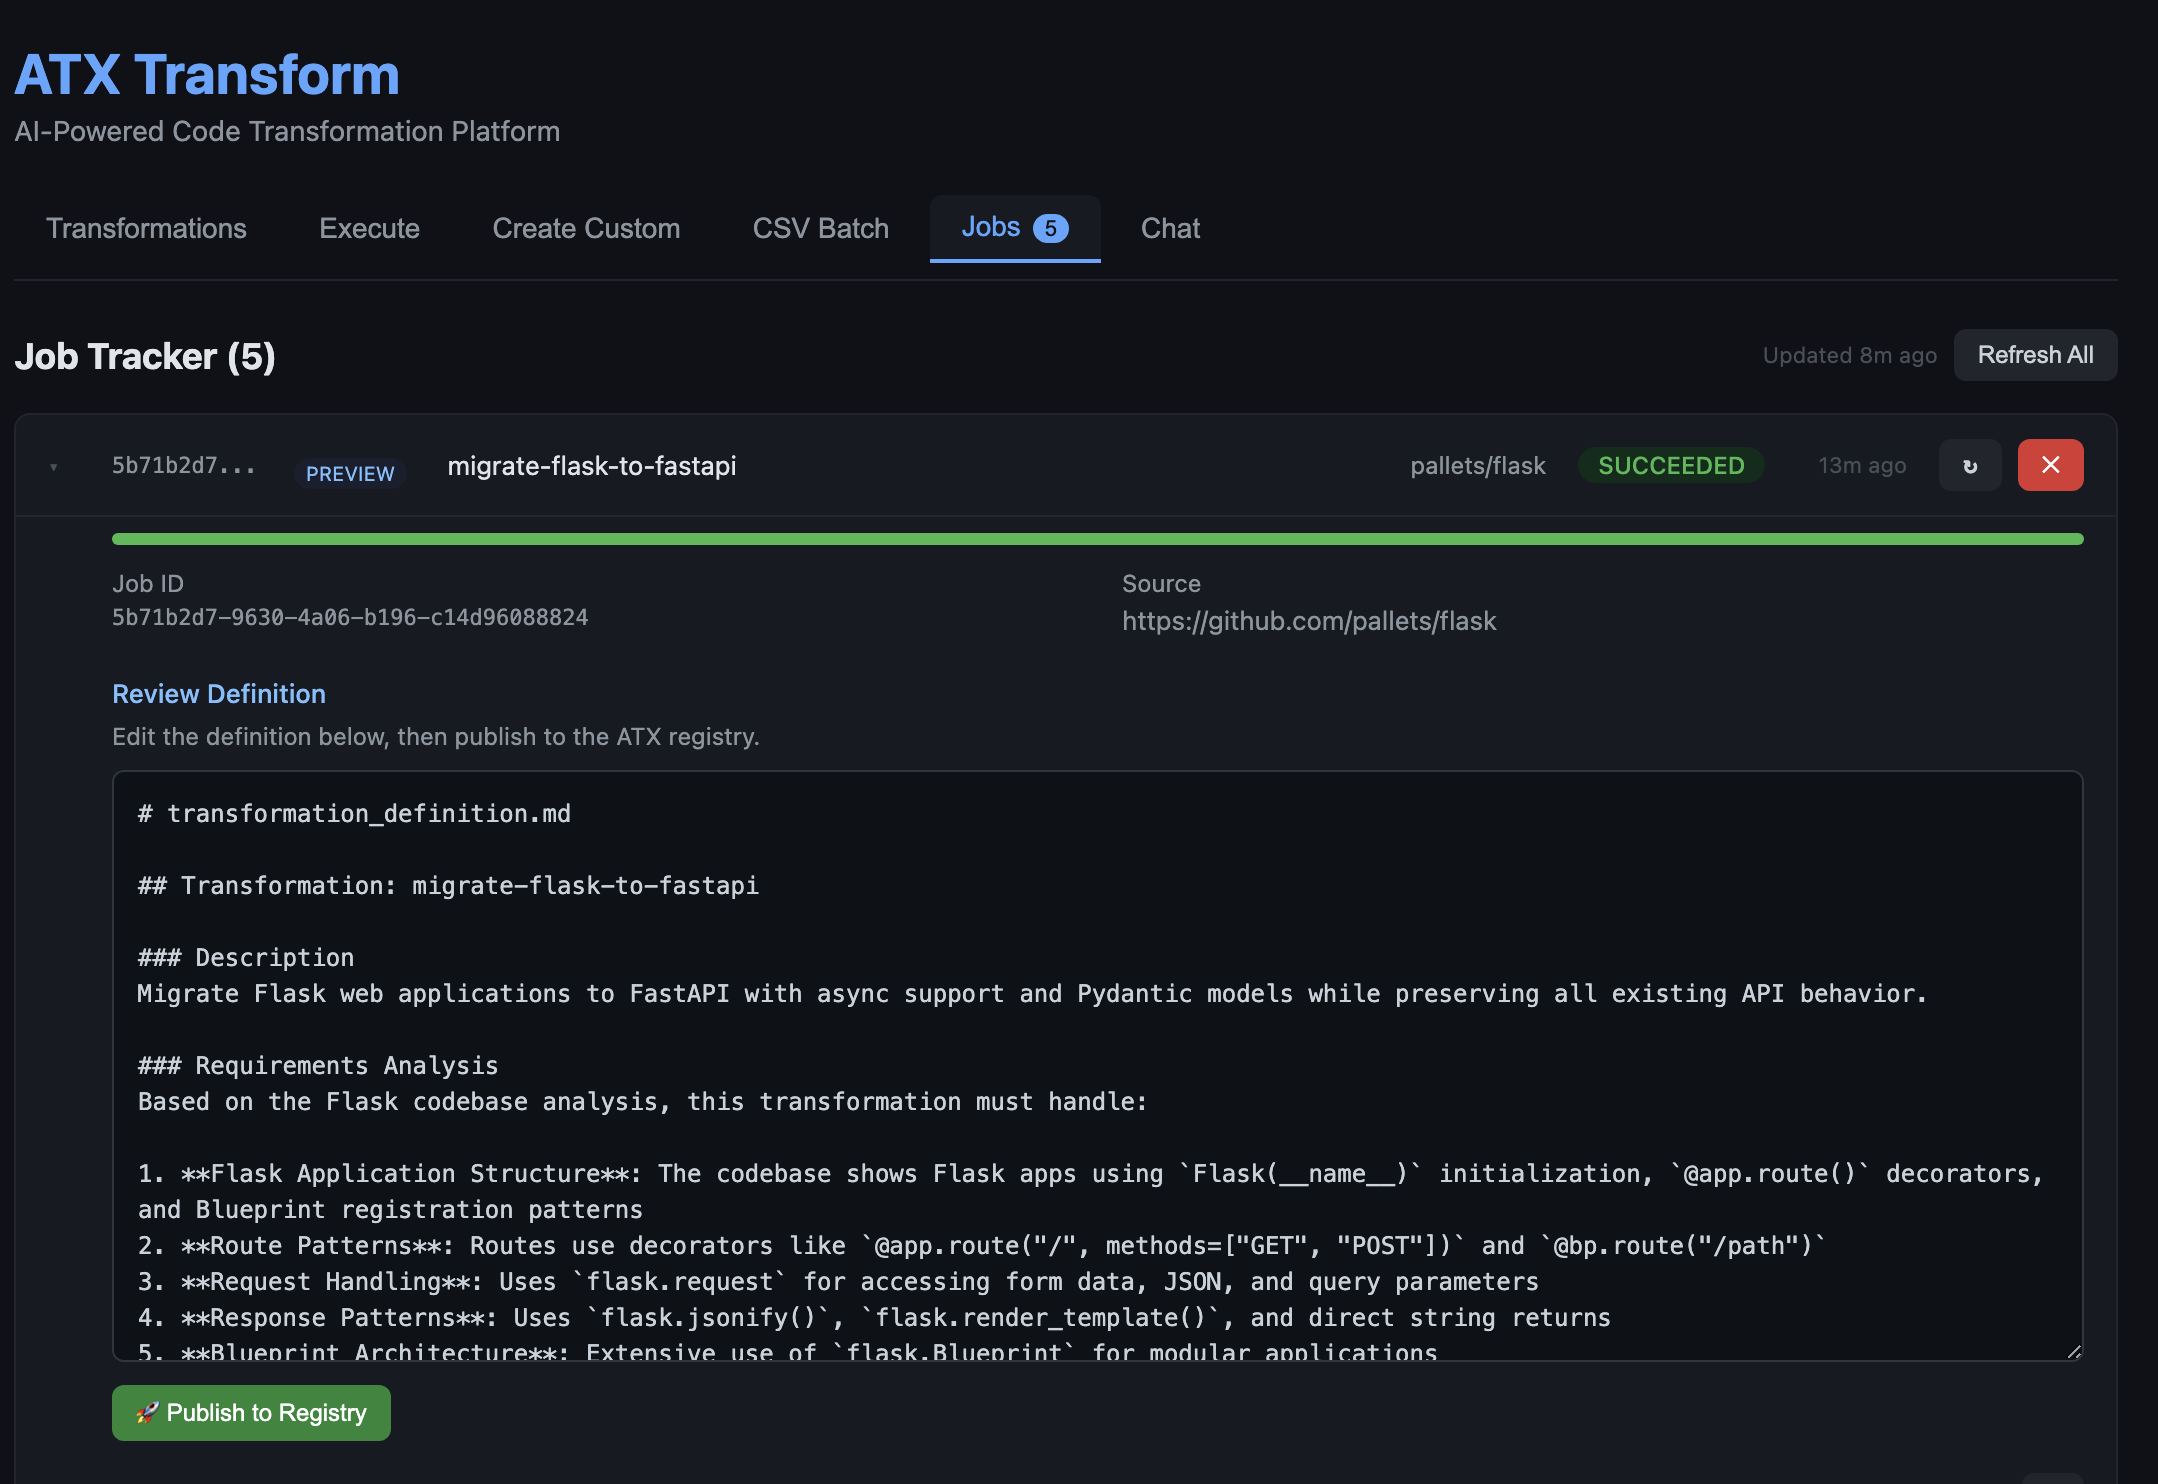
Figure 2: Describing a custom transformation in plain English. The form accepts a name, description, optional reference repository, and natural-language requirements.After submitting, the orchestrator clones the reference repository, analyzes the source, and generates a transformation definition tailored to the actual code patterns found in the codebase. This takes 1–5 minutes depending on repository size. The generated definition is then shown for review in the Jobs tab, where it can be edited before publishing to the ATX registry.

Figure 3: The AI-generated transformation definition shown for review in the Jobs tab. The agent analyzed the Flask codebase and produced a detailed definition covering routes, request handling, response patterns, and Blueprint architecture. The user can edit the definition in-place and click Publish to Registry when ready.Once published, the new transformation appears in the Transformations tab alongside AWS-managed transformations and can be executed the same way on any repository.

Run a batch of repositories from a CSV

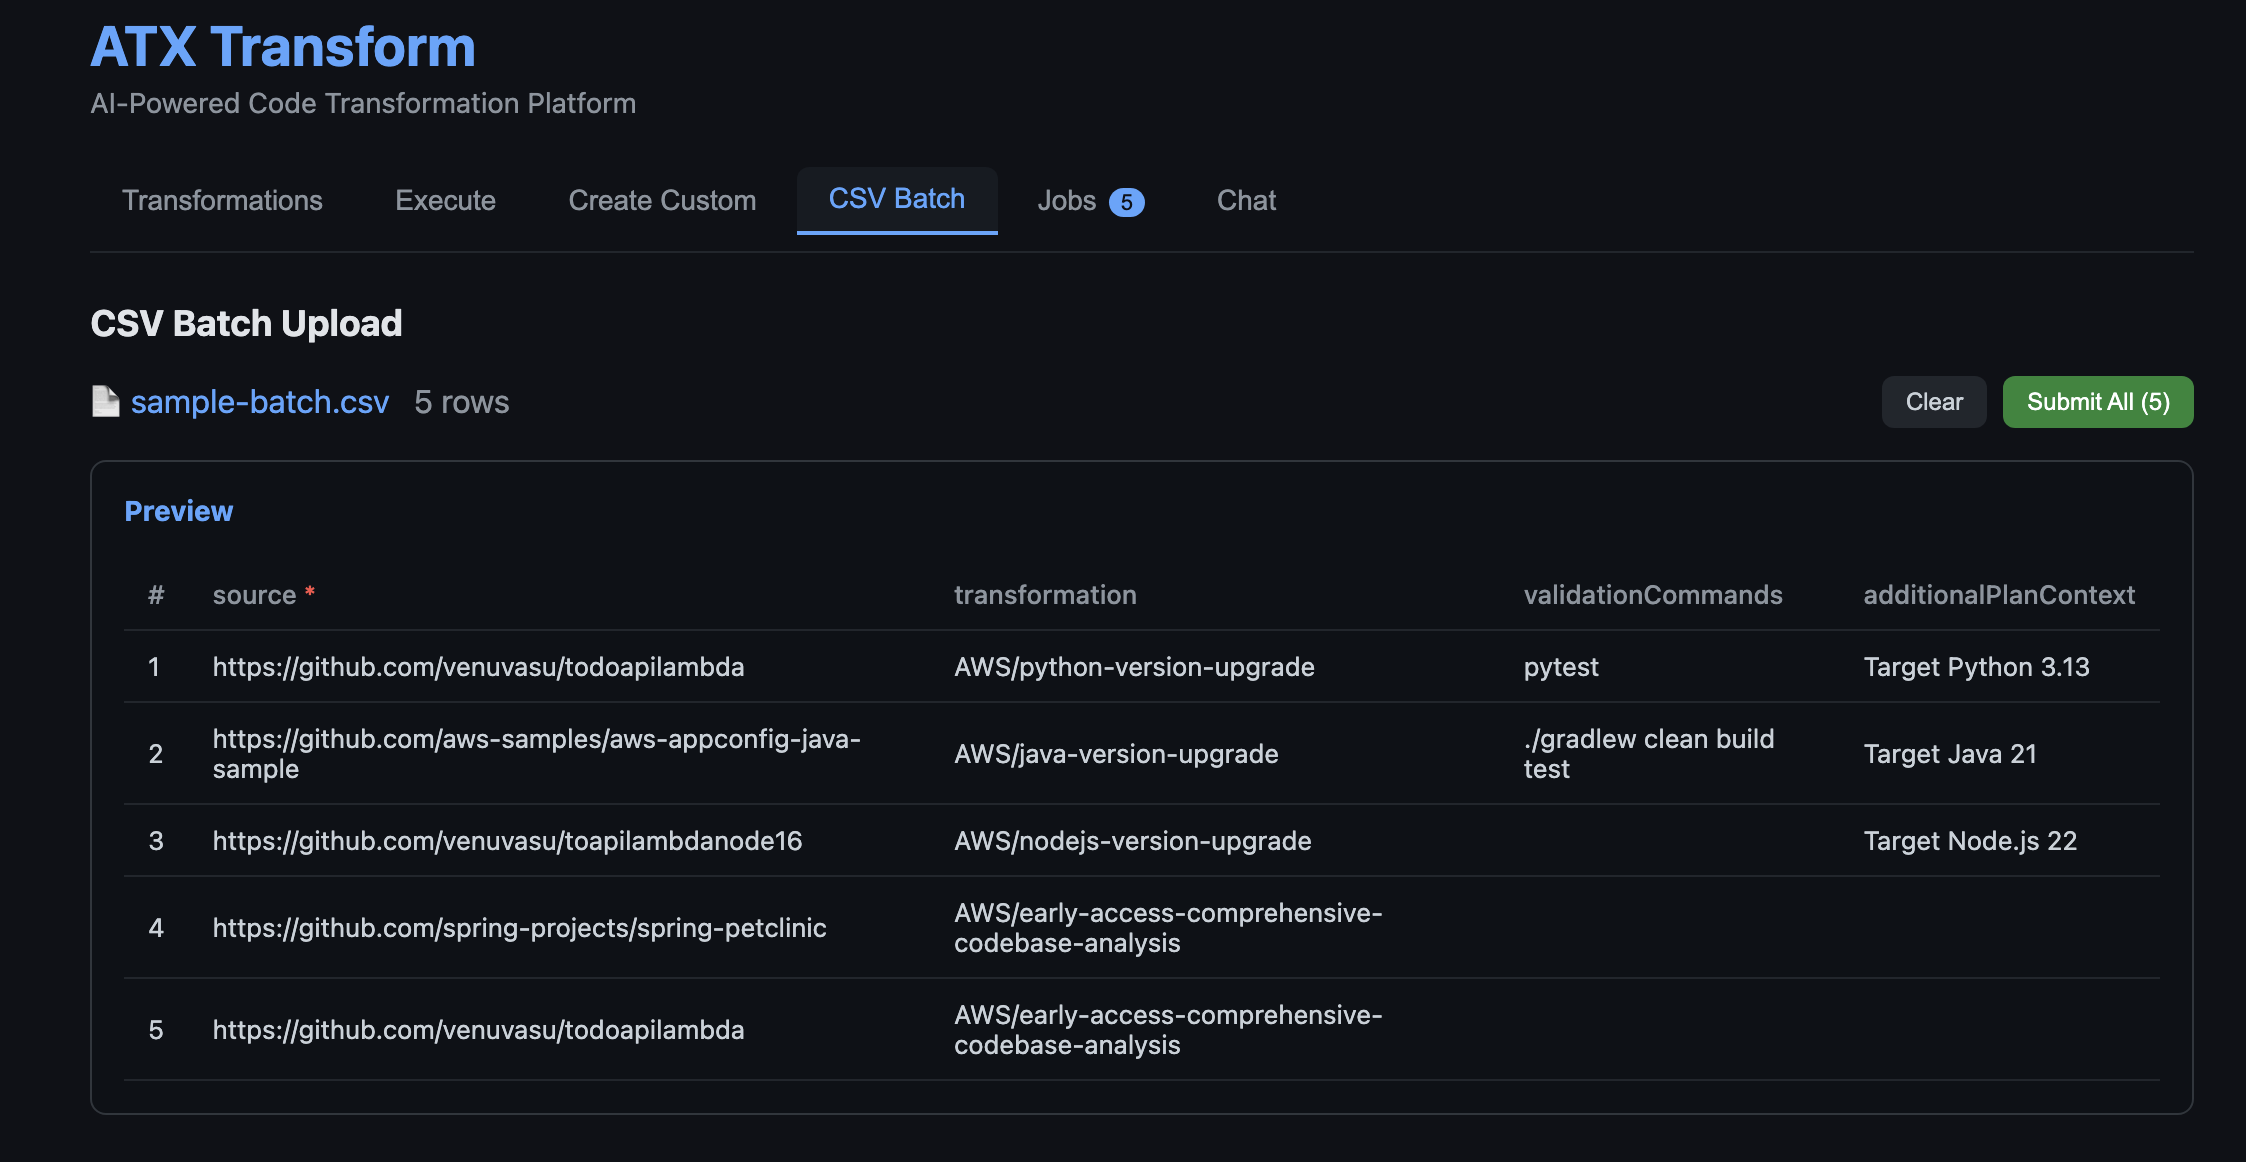
Open the CSV Batch tab and upload a CSV listing repository URLs and target transformations. A sample `sample-batch.csv` is included in the repository at `agentic-atx-platform/ui/sample-batch.csv`. The preview shows the parsed rows before submission. On Submit All, each row becomes a separate AWS Batch job running in parallel, and the Jobs tab shows live status as repositories complete.

Uploading a batch of repositories for parallel processing. The CSV lists a source repository URL, target transformation, optional validation commands, and additional plan context per row.

Figure 4: Uploading a batch of repositories for parallel processing. The CSV lists a source repository URL, target transformation, optional validation commands, and additional plan context per row. Each row becomes an independent AWS Batch job on submission.

Clean up

To avoid recurring charges, remove the resources after trying the solution.

Step 1: Delete the SAM Stack

sam delete --stack-name AtxAgentCoreSAM --region us-east-1 --no-prompts

Step 2: Delete the CDK Stacks

Remove the three CDK stacks in reverse order. The S3 buckets are configured with `autoDeleteObjects: true`, so CDK will empty them before deletion.

cd cdk

npx cdk destroy AtxUiStack AtxInfrastructureStack AtxContainerStack --force

Conclusion

In this post, you learned how to build a generative AI–powered, agentic system for application modernization that can analyze application repositories, determine required code changes, create missing transformations, and execute those transformations at scale. By combining AWS Transform Custom for transformation execution with Amazon Bedrock AgentCore for orchestration, and Strands Agents for multi-agent coordination and AWS Transform container solution for parallel processing, this approach demonstrates how intelligent automation can be applied to large-scale code transformation workflows.

This solution directly addresses the challenges of traditional modernization approaches. It reduces manual effort by automating repository analysis and transformation mapping, eliminates gaps in transformation coverage by dynamically generating reusable transformations, and significantly improves scalability through parallel execution using AWS Batch.

By introducing a centralized, agent-driven workflow with built-in observability and state management, organizations can achieve faster, more consistent, and governed modernization across large application portfolios. To get started, deploy the solution in your AWS environment, test it with a sample repository or batch workload, and extend it by creating custom transformations tailored to your applications. You can further integrate this approach into your CI/CD pipelines to enable continuous modernization and accelerate your cloud migration initiatives.


About the authors

Kanishk Mahajan is Principal – AI/ML with AWS Professional Services. In this role, he leads GenAI and agentic transformations for some of AWS largest customers in Telco and Media & Entertaintment.

Sandeep Batchu is a Senior Security Architect at Amazon Web Services, with extensive experience in software engineering, solutions architecture, and cybersecurity. Passionate about bridging business outcomes with technological innovation, Sandeep guides customers through their cloud and generative AI journey, helping them design and implement secure, scalable, and resilient architectures in the era of AI-driven transformation.


Venugopalan Vasudeven (Venu) is a Principal Specialist Solutions Architect at AWS, where he leads Agentic AI initiatives focused on AWS Transform. He helps customers adopt and scale AI-powered developer and modernization solutions to accelerate innovation and business outcomes.

AWS Weekly Roundup: What’s Next with AWS 2026, Amazon Quick, OpenAI partnership, and more (May 4, 2026)

Post Syndicated from Esra Kayabali original https://aws.amazon.com/blogs/aws/aws-weekly-roundup-whats-next-with-aws-2026-amazon-quick-openai-partnership-and-more-may-4-2026/

Last week, I took some time off in York, England, often described as the most haunted city in the country. I wandered through the ruins of abbeys that have stood for nearly a thousand years, walked along medieval walls, and spent an evening on a ghost tour hearing stories passed down through centuries. There’s something grounding about standing in a place that has witnessed so much history. Now I’m back at my desk, and the contrast is hard to miss: those abbey stones have stood for a thousand years largely unchanged, while in the span of a single week away, the pace of technological change has moved forward yet again.

The ruins of Whitby Abbey in North Yorkshire. Stones that have seen a thousand years, while this week alone brought another wave of change.

Now, let’s get into this week’s AWS news.

Headlines
On April 28, Matt Garman, CEO of AWS, Colleen Aubrey, SVP Amazon Applied AI Solutions, Julia White, CMO of AWS, and OpenAI leaders took the stage to share how customers are changing the way businesses operate with agents. The event brought a packed slate of announcements across Amazon Quick, Amazon Connect, and a deeper partnership with OpenAI. Here’s a roundup of the biggest announcements from the event.

Amazon Quick expands with a desktop app, new pricing plans, and visual asset generation – Amazon Quick is an AI assistant for work that connects to your apps, learns what matters to you, and takes action on your behalf. This week, Quick introduced a new desktop app (Preview) that keeps you connected to your local files, calendar, and communications without opening a browser. You can sign up within minutes using your personal email address or existing Google, Apple, Github, or Amazon credentials—no AWS account required. Quick can now generate polished documents, presentations, infographics, and images directly from the chat interface, and native integrations expand to include Google Workspace, Zoom, Airtable, Dropbox, and Microsoft Teams. A new Build custom apps with Quick capability (Preview) lets you create intelligent apps, dashboards, and web pages connected to the rest of your business using natural language.

Amazon Connect expands into four agentic AI solutions – Amazon Connect is expanding from a single product into a set of four agentic AI solutions designed to work within your existing workflows. Amazon Connect Decisions is a supply chain planning and intelligence solution that shifts teams from crisis management to proactive planning, combining 30 years of Amazon operational science with more than 25 specialized supply chain tools. Amazon Connect Talent (Preview) is an agentic AI hiring solution that delivers AI-led interviews, science-backed assessments, and consistent evaluation for talent acquisition leaders managing scaled hiring. Amazon Connect Customer, previously known as Amazon Connect, delivers personalized customer experiences across voice, chat, and digital channels, with new configuration capabilities that enable organizations to set up conversational AI in weeks rather than months. Amazon Connect Health delivers agentic patient verification, appointment management, patient insights, ambient documentation, and medical coding, giving patients faster access to care and clinicians more time to deliver it.

AWS and OpenAI expand their partnership across Amazon Bedrock – AWS and OpenAI are bringing the latest OpenAI models to Amazon Bedrock, launching Codex on Amazon Bedrock, and introducing Amazon Bedrock Managed Agents powered by OpenAI — all in limited preview. OpenAI models on Amazon Bedrock (Limited preview) brings the latest OpenAI models, including GPT-5.5 and GPT-5.4, to the Bedrock APIs you already use, with unified security, governance, and cost controls. No additional infrastructure to configure, no new security model to learn. Codex on Amazon Bedrock (Limited preview) lets you access the OpenAI coding agent within your existing AWS environments, authenticating with your AWS credentials, processing inference through Bedrock, and applying Codex usage toward your AWS cloud commitments. Codex on Bedrock is available through the Bedrock API, starting with the Codex CLI, the Codex desktop app, and a Visual Studio Code extension. Amazon Bedrock Managed Agents, powered by OpenAI (Limited preview) combines OpenAI frontier models with AWS infrastructure to build production-ready OpenAI-powered agents in the cloud, built with the OpenAI harness for faster execution, sharper reasoning, and reliable steering of long-running tasks.

To learn more, visit Top announcements of the What’s Next with AWS, 2026.

Last week’s launches
Here are some launches and updates from this past week that caught my attention:

  • Amazon EC2 M8in and M8ib instances are now generally available – Powered by custom 6th-gen Intel Xeon Scalable processors and 6th-gen AWS Nitro cards, these instances deliver up to 43% higher performance over M6in and M6ib. M8in offers 600 Gbps network bandwidth, while M8ib delivers up to 300 Gbps EBS bandwidth. Available in US East (N. Virginia), US West (Oregon), Asia Pacific (Tokyo), and Europe (Spain).
  • Amazon EC2 R8in and R8ib instances are now generally available – Memory-optimized instances built on the same 6th-gen Intel Xeon Scalable processors and Nitro cards, with the same 600 Gbps network and 300 Gbps EBS bandwidth profiles. Well-suited for large commercial databases, data lakes, and in-memory databases such as SAP HANA. Available in US East (N. Virginia, Ohio), US West (Oregon), and Europe (Spain).
  • Amazon EC2 C8ine and M8ine instances are now generally available – Network-optimized instances offering up to 2.5x higher packet performance per vCPU and up to 2x higher network throughput for traffic through internet gateways compared to C6in and M6in. Designed for security and network virtual appliances including virtual firewalls, load balancers, and 5G UPF workloads. Available in US East (N. Virginia), US West (Oregon), and Asia Pacific (Tokyo) for C8ine; US East (N. Virginia) and US West (Oregon) for M8ine.
  • Amazon Bedrock AgentCore adds optimization capabilities (Preview) – AgentCore now offers recommendations, batch evaluations, and A/B tests to complete the observe-evaluate-improve loop for agents in production. Recommendations analyze production traces and evaluation outputs to propose optimized system prompts and tool descriptions, which you can validate with batch evaluations against pre-defined test cases or A/B tests against live traffic. Every recommendation requires your approval before it ships.
  • AWS Lambda adds support for Ruby 4.0 – Ruby 4.0, the latest LTS release, is available as a Lambda managed runtime and container base image. It includes support for Lambda advanced logging controls, including JSON structured logs, configurable logging levels, and target CloudWatch log group configuration. Available in all AWS Regions, including China Regions and AWS GovCloud (US).

For a full list of AWS announcements, be sure to keep an eye on the What’s New with AWS page.

Other AWS news
Here are some additional posts and resources that you might find interesting:

  • Amazon Q Developer end-of-support announcement – Amazon Q Developer IDE plugins and paid subscriptions will reach end of support on April 30, 2027, giving customers 12 months to transition to Kiro. New signups will be blocked starting May 15, 2026, although existing subscriptions can continue to add users. Starting May 29, 2026, Opus 4.6 will no longer be available on Q Developer Pro; Opus 4.5 and other existing models remain available, and the latest coding models including Opus 4.7 are available exclusively on Kiro. Amazon Q Developer in the AWS Management Console and first-party AWS experiences (documentation, mobile app, Slack, and Microsoft Teams) are not affected.
  • AWS 10,000 AIdeas Competition: Meet the Winners – AWS announced the 20 winners of the 10,000 AIdeas Competition, a global challenge where builders submitted AI applications built entirely with Kiro and the AWS Free Tier, with submissions from 115 countries narrowed down through four rounds of evaluation and two rounds of community voting. Winners span Global Champions, Regional Champions, Innovation Awards, and Creative Track categories, with cash prizes and AWS credits awarded across each tier.
  • AWS Student Builder Groups – AWS Cloud Clubs is evolving to AWS Student Builder Groups. The community now spans 600+ colleges and universities across 63 countries. Existing Cloud Club memberships, badges, and progress carry forward, and Cloud Club Captains become Group Leaders. Membership is open to any learner 18 or older. You can find a group near you on AWS Builder Center or apply to launch a new group on your campus.

Upcoming AWS events
Check your calendar and sign up for upcoming AWS events:

Visit the AWS Builder Center to meet other builders, contribute solutions, and find resources that help you keep building. You can also browse upcoming AWS-led in-person and virtual events, plus developer-focused sessions.

— Esra

This post is part of our Weekly Roundup series. Check back each week for a quick roundup of interesting news and announcements from AWS!

Security posture improvement in the AI era

Post Syndicated from Celeste Bishop original https://aws.amazon.com/blogs/security/security-posture-improvement-in-the-ai-era/

It’s only been a few weeks since Anthropic announced the Claude Mythos Preview model and launched Project Glasswing with AWS and other leading organizations. This has generated a lot of discussion about the future of cybersecurity and what the ever-increasing capabilities of foundation models mean to organizations.

As AWS CISO Amy Herzog pointed out in the Project Glasswing announcement, “At AWS, we build defenses before threats emerge, from our custom silicon up through the technology stack. Security isn’t a phase for us; it’s continuous and embedded in everything we do.”

Read more from Amy about this in Building AI defenses at scale: Before the threats emerge.

While the discussion around the future of cybersecurity is important, the only thing we know for certain is that organizations need to be able to react quickly to the rapid changes AI is bringing to technology and business in general. And you can’t react quickly if your security fundamentals aren’t dialed in.

The security hygiene gap

It’s easy to assume you have the foundational security elements covered, or to overlook some completely. Basic security use cases like identity management, threat detection, vulnerability management, data protection, and network security can be inconsistently implemented across cloud environments. While AI is reshaping the security landscape, strong security fundamentals continue to be essential for every organization, regardless of size or industry.

These are the security basics that matter whether or not you’re adopting AI: patching consistently, enforcing least-privilege access, enabling logging and monitoring, encrypting data at rest and in transit, and reviewing security configurations regularly. When these fundamentals are in place, you’re better positioned to take advantage of AI-driven tools and respond to newly discovered vulnerabilities, wherever they come from.

While the concepts that drive security fundamentals are universal, implementing them in your environment is best done with an understanding of the context unique to your organization. That’s why we have a multitude of freely available materials—like the AWS Well-Architected Framework—that you can use to help ask the right questions and implement changes in your environment. We also offer programs like the Security Health Improvement Program (SHIP) to help you improve your security posture through prescriptive guidance and continuous improvement.

What is the Security Health Improvement Program (SHIP)?

SHIP is a no-cost program available to every AWS customer, regardless of support tier. SHIP provides a proven, data-driven methodology to:

  • Assess your current security posture using data from your AWS environment
  • Identify specific opportunities to improve across 10 core security use cases
  • Build a prioritized action plan tailored to your environment
  • Establish a mechanism for continuous security improvement

The program is led by AWS Solutions Architects and Technical Account Managers who take you through a personalized report, contextualize findings for your environment, and help you build a prioritized action plan.

Why SHIP matters in the AI era

Project Glasswing highlights an important shift: AI-powered tools are accelerating the pace of vulnerability discovery, which means organizations need to be prepared to assess and respond to findings and changing situations faster than before. In addition to external factors, as organizations adopt AI—whether deploying foundation models, building agentic workflows, or using AI-powered services—how they implement their security controls must change as well. A strong security foundation is what makes confident AI adoption possible.

Here’s how SHIP helps:

Address foundational security gaps proactively

SHIP uses a data-driven methodology to identify opportunities to improve and optimize across 10 core security use cases: threat detection, cloud security posture management, application security testing, configuration management, access governance, vulnerability management, application protection, network security, encryption, and secrets management. The program includes a SHIP assessment to identify critical security findings related to your current security posture, so your team can build a prioritized roadmap for improvement tailored to your environment.

Establish the security baseline AI workloads require

Before you deploy your first model on Amazon Bedrock or build agentic workflows with Amazon Bedrock AgentCore, you need confidence that your underlying infrastructure follows security best practices. SHIP uses actual data from your environment to provide prescriptive, specific guidance rather than generic security recommendations. This is especially relevant as AI-driven vulnerability discovery tools become more widely available: organizations with strong baselines will be able to act on new findings quickly and effectively.

Build a mechanism for continuous security improvement

As AI capabilities evolve, organizations benefit from having a repeatable process to assess and strengthen their security posture over time. SHIP establishes the methodology and mechanisms for your team to continuously assess, prioritize, and improve. By building this operational capability, you’re strengthening your organization’s ability to adapt and contributing to broader industry resilience. As the cybersecurity community integrates AI into defense strategies, SHIP helps you maintain foundational best practices so you can adopt these innovations effectively and with confidence.

Getting started is straightforward

SHIP is available today, at no cost, to every AWS customer. Here’s how to get started:

  1. Talk to your AWS account team. Ask about scheduling a SHIP engagement, or request one directly on the SHIP page.
  2. Attend a SHIP Activation Day. AWS regularly hosts hands-on workshops where you can run the SHIP assessment with AWS Solutions Architects and start building your improvement plan.
  3. Explore the prescriptive guidance. Consult the AWS Well-Architected Framework – Security Lens for documentation, reference architectures, and implementation guides you can start using today.

Take the next step together

AWS is committed to being the most secure cloud, from our participation in Project Glasswing to the security embedded in every layer of our infrastructure. Security is a shared responsibility, and programs like SHIP give customers the tools, guidance, and support to strengthen their security foundations so they can build confidently, no matter what comes next.

Ready to improve your security posture? Contact your AWS account team to schedule a SHIP engagement, or visit the SHIP resources page to learn more.

Celeste Bishop

Celeste Bishop

Celeste is a Senior Security Specialist at AWS, based in Austin, Texas. Over the past five years, she has held a range of security-focused roles spanning field and product marketing, developer relations, and executive engagement. She partners closely with customers, security leaders, and field teams to help organizations operate securely in the cloud. Celeste holds a Bachelor’s in Economics from the University of Texas at Austin.

Serverless ICYMI Q1 2026

Post Syndicated from Julian Wood original https://aws.amazon.com/blogs/compute/serverless-icymi-q1-2026/

Stay current with the latest serverless innovations that can improve your applications. In this 32nd quarterly recap, discover the most impactful AWS serverless launches, features, and resources from Q1 2026 that you might have missed.

In case you missed our last ICYMI, check out what happened in Q4 2025.

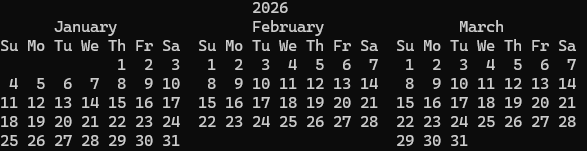
2026 Q1 calendar

2026 Q1 calendar

Serverless with Mama J


Serverless with Mama J

If you really want to know whether you understand something, try explaining it to your mom!

That’s exactly what Eric Johnson did. His mom, everyone calls her Mama J, wanted to know what serverless actually means and why it matters. So he walked her through it: what servers do, why they’re a headache to manage, and how AWS Lambda lets you skip all that by running code only when it’s needed, scaling automatically, and charging you nothing when nobody’s using it.

Watch the video on the AWS Developers YouTube channel.

Build serverless apps faster with AI

AWS is providing a growing set of AI-powered tools to bring serverless expertise directly into your coding assistants. From Model Context Protocol (MCP) servers and Anthropic Claude plugins to Kiro Powers. These tools provide contextual guidance for architecture decisions, implementation patterns, and deployment automation across the full serverless development lifecycle.

For more information on the tools available, see the resources page.

Serverless Patterns Collection

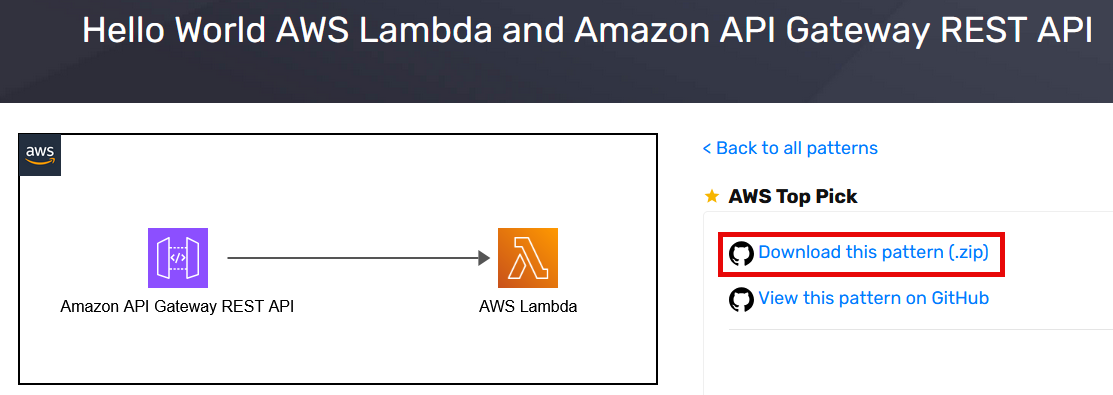
The open source Serverless Patterns Collection on Serverless Land now provides a direct link to download pattern .zip files. You can also clone the whole repo and explore more patterns.

Serverless Patterns .zip download

Serverless Patterns .zip download

AWS Lambda

Build fault-tolerant, long-running applications using familiar programming patterns using AWS Lambda durable functions. You can use Lambda durable functions to write multi-step workflows in your preferred programming language, using built-in methods that automatically handle progress checkpointing and error recovery. This can improve your architecture so that you can focus on your business logic and optimize costs by charging only for active compute time.

You can build durable functions in Python and TypeScript and there is a durable execution SDK for Java in preview with the code available on GitHub.

Eric Johnson has a new video deep dive showing how to upload videos and scan them with AI. Learn how to coordinate multiple AWS services like Amazon Rekognition and Amazon Transcribe, implement human-in-the-loop approval workflows, and crate a live dashboard for real-time updates.

To find out how durable functions work, see the blog post which also provides testing and best practices guidance. You can also watch the re:Invent Breakout Session video: Deep Dive on AWS Lambda durable functions (CNS380)

Lambda now supports the .NET 10 runtime, including support for file-based apps. Developers can take advantage of the latest .NET 10 performance improvements, new language features, and improved startup times for Lambda functions.

You can now see Availability Zone (AZ) metadata in function execution environments. This allows you to determine the AZ ID (e.g., use1-az1) of the AZ your function is running in. This helps build functions that can make AZ-aware routing decisions, such as preferring same-AZ endpoints for downstream services to reduce cross-AZ latency. Operators can also implement AZ-aware resilience patterns like AZ-specific fault injection testing.

Payload size increase

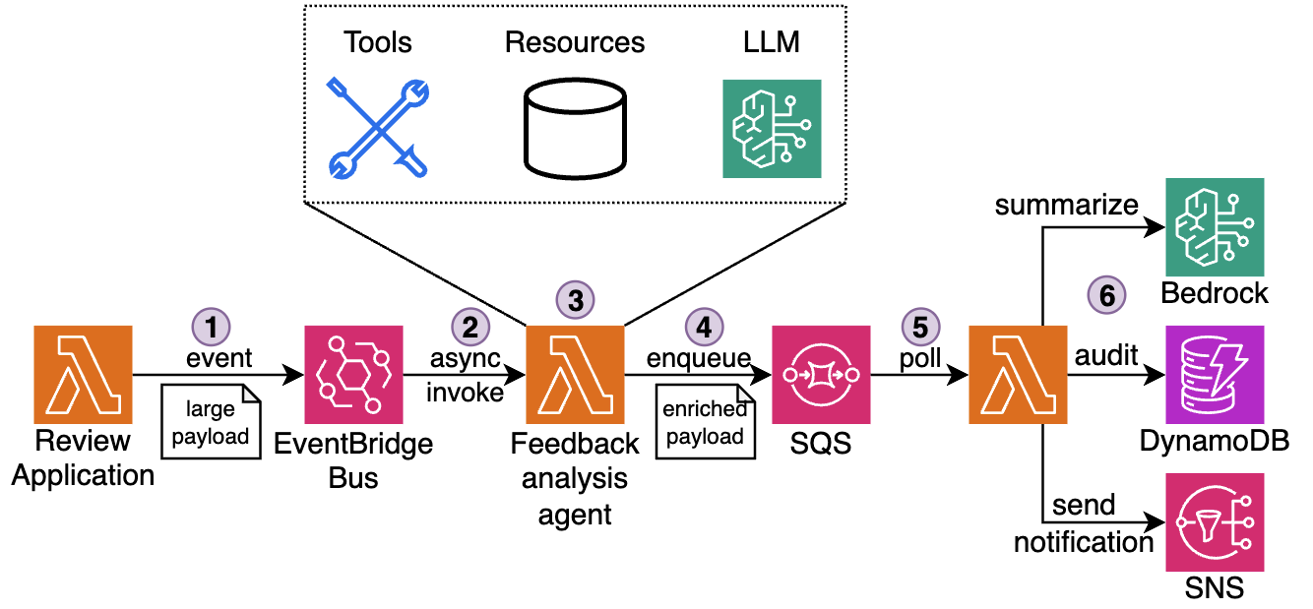
AWS has increased the maximum payload size from 256 KB to 1 MB for a number of services such as asynchronous Lambda invocations, Amazon SQS, and Amazon EventBridge. This gives you more room to build and maintain context-rich event-driven systems and reduce the need for complex workarounds such as data chunking or external large object storage.

This blog post explores a real-world example using rich event context in agentic event-driven architectures

Payload size increase workflow

Payload size increase workflow

Amazon Bedrock

Amazon Bedrock expanded its model availability with a new set of fully managed open-weight models spanning frontier reasoning and agentic coding. Other model releases include Anthropic Claude Opus 4.6 and Claude Sonnet 4.6, and NVIDIA Nemotron 3 Super. You can invoke them through the unified Amazon Bedrock API without managing any underlying infrastructure, making it straightforward to experiment and swap models as your workload evolves.

Amazon Bedrock AgentCore is the infrastructure layer for securely deploying and operating AI agents. It works with popular open source frameworks, including Strands Agents, LangGraph and CrewAI, giving you the flexibility to build with your preferred tools without vendor lock-in.

AgentCore Gateway now includes semantic tool search, so you can discover the right tool for a task using natural language queries instead of manually browsing a catalogue. It also adds custom KMS encryption, debugging messages, and resource tagging to give you stronger governance over tool integrations.

Policy in Bedrock AgentCore allows you to define precise boundaries on agent actions and run continuous quality monitoring. This helps you maintain predictable, auditable agent behavior in production without embedding guardrail logic inside each individual agent.

AgentCore Runtime now supports stateful MCP server features, allowing agents to maintain session context across tool calls for richer, more coherent multi-step interactions.

Strands Agents

Strands Agents SDK

Strands Agents SDK

Strands Agents is an open source SDK for building and running AI agents in just a few lines of code, working with models available in Amazon Bedrock. Strands Labs is a new dedicated GitHub organization for experimental agent projects, including robotics and code agents. This gives you early access to cutting-edge agentic techniques before they reach production frameworks. See the introduction blog post for more information.

AWS Step Functions

AWS Step Functions introduces an enhanced TestState API that enables API-based testing for validating workflows before deployment. The new API supports testing individual states in isolation or complete workflows end-to-end, making it easier to verify state machine logic without incurring runtime costs.

By integrating TestState API testing into CI/CD pipelines, you can validate workflow logic before deployment, reducing the risk of production issues. Find complete code examples and testing framework in the GitHub repository.

Amazon EventBridge

Amazon EventBridge Scheduler now provides resource count metrics to help you monitor quota usage. These new metrics make it easier to track the number of schedules and schedule groups in your account and proactively manage service quotas.

Amazon DynamoDB

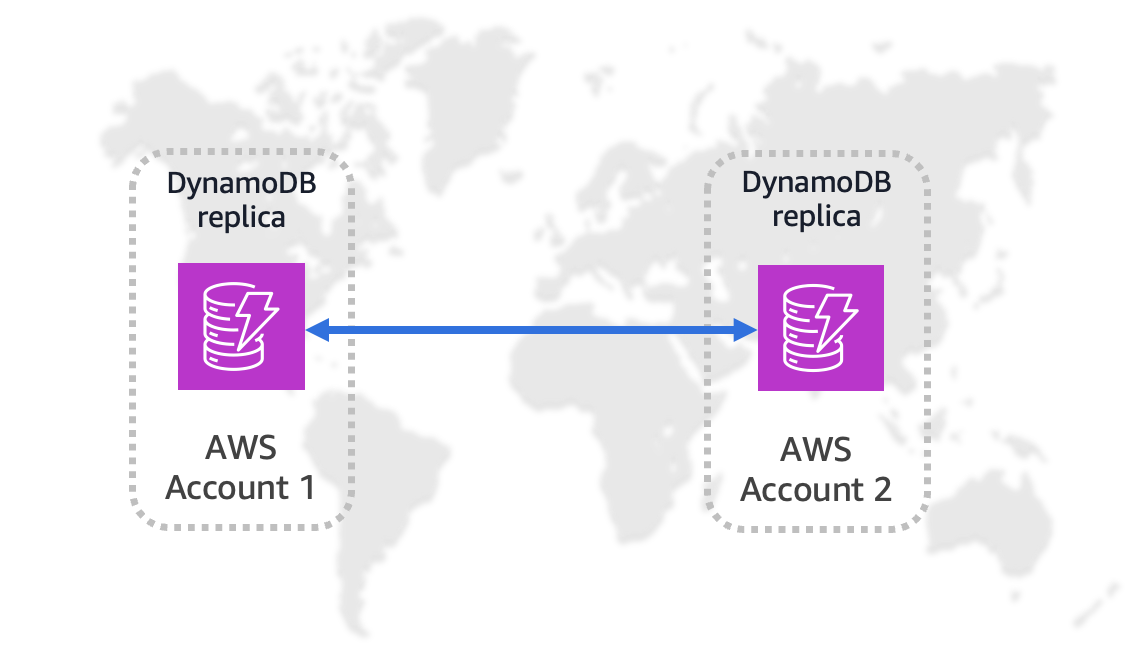
You can replicate Amazon DynamoDB table data across multiple AWS accounts and Regions. This enhances resiliency through account-level isolation, supports tailored security and data-perimeter controls. You can align workloads by business unit or environment and simplify governance requirements.

Amazon DynamoDB global replication

Amazon DynamoDB global replication

Amazon ECS

Amazon ECS Managed Instances can now integrate with Amazon EC2 Capacity Reservations. This allows you to make sure there is capacity availability for your container workloads while benefiting from the management automation of ECS Managed Instances.

ECS also now supports Network Load Balancer (NLB) for linear and canary deployment strategies. This helps you perform gradual traffic shifting using NLBs, providing more flexibility in deployment pipelines for latency-sensitive applications.

Serverless blog posts

January

February

March

Serverless Office Hours

Join our livestream every Tuesday at 11 AM PT for live discussions, Q&A sessions, and deep dives into serverless technologies. Watch episodes on-demand at serverlessland.com/office-hours.

January

February

March

Still looking for more?

The Serverless landing page has overall information about building serverless applications. The Lambda resources page contains case studies, webinars, whitepapers, customer stories, reference architectures, and even more Getting Started tutorials.

You can also follow the Developer Advocacy team to see the latest news, follow conversations, and interact with the team.

And finally, visit Serverless Land  for your serverless needs.

AWS Weekly Roundup: Anthropic & Meta partnership, AWS Lambda S3 Files, Amazon Bedrock AgentCore CLI, and more (April 27, 2026)

Post Syndicated from Daniel Abib original https://aws.amazon.com/blogs/aws/aws-weekly-roundup-anthropic-meta-partnership-aws-lambda-s3-files-amazon-bedrock-agentcore-cli-and-more-april-27-2026/

Late March took me to Seattle for the Specialist Tech Conference, one of the most energizing gatherings of AWS specialists from around the world. It was an incredible opportunity to connect with peers, exchange experiences, and go deep on the latest advancements in Generative AI and Amazon Bedrock — and a powerful reminder of something I truly believe in: when specialists come together to challenge each other, explore edge cases, and co-create solutions, the impact goes far beyond the meeting room. In a fast-moving space like AI, having a strong internal community isn’t a nice-to-have — it’s a competitive advantage.

Now, let’s get into this week’s AWS news…

Headlines

Anthropic partnership: Claude on AWS Trainium and Graviton, and Claude Cowork in Amazon Bedrock – This week, AWS and Anthropic deepened their product collaboration in meaningful ways for builders. Anthropic is now training its most advanced foundation models on AWS Trainium and Graviton infrastructure, co-engineering directly at the silicon level with Annapurna Labs to maximize computational efficiency from the hardware up through the full stack.

Claude Cowork is now available in Amazon Bedrock — Claude Cowork brings Anthropic’s collaborative AI capabilities directly to enterprise builders within the AWS ecosystem, enabling teams to work alongside Claude as a true collaborator, not just a tool. You can now deploy Claude Cowork within your existing Amazon Bedrock environment, keeping your data secure within AWS while leveraging the full power of Claude for team-based AI workflows.

Claude Platform on AWS (Coming soon) — A unified developer experience to build, deploy, and scale Claude-powered applications without leaving AWS. If you’re building with Generative AI on AWS, this is a significant step forward in what you’ll be able to do with Claude directly through Amazon Bedrock.

Meta signs agreement with AWS to power agentic AI on Amazon’s Graviton chips — Meta has signed an agreement to deploy AWS Graviton processors at scale, starting with tens of millions of Graviton cores to power CPU-intensive agentic AI workloads — including real-time reasoning, code generation, search, and multi-step task orchestration.

Last week’s launches

Here are some launches and updates from this past week that caught my attention:

  • AWS Lambda functions can now mount Amazon S3 buckets as file systems with S3 Files — You can now mount Amazon S3 buckets as file systems in AWS Lambda using S3 Files, enabling your functions to perform standard file operations without downloading data for processing. Built on Amazon EFS, S3 Files provides the simplicity of a file system with the scalability, durability, and cost-effectiveness of S3 — and multiple Lambda functions can connect to the same file system simultaneously, sharing data through a common workspace. This is particularly valuable for AI and machine learning workloads where agents need to persist memory and share state across pipeline steps.
  • Amazon EKS Hybrid Nodes gateway for hybrid Kubernetes networking — Amazon Elastic Kubernetes Service now offers the Amazon EKS Hybrid Nodes gateway, which automates networking between your EKS cluster VPC and Kubernetes Pods running on EKS Hybrid Nodes. You can now eliminate the need to make on-premises pod networks routable or coordinate network infrastructure changes, greatly simplifying hybrid Kubernetes environments. The gateway automatically enables pod-to-pod traffic across cloud and on-premises environments, control plane-to-webhook communication, and connectivity for AWS services like Application Load Balancers, and is available at no additional charge.
  • Amazon Aurora Serverless: Up to 30% better performance, smarter scaling, and still scales to zero — Amazon Aurora Serverless just got faster and smarter, with up to 30% better performance than the previous version and an enhanced scaling algorithm designed to handle workloads where multiple tasks compete for resources — like busy APIs and agentic AI applications with bursts of activity and long idle windows. You can now run even more demanding workloads serverlessly, paying only for what you use, and automatically scaling to zero when not in use. All improvements are available in platform version 4 at no additional cost.
  • Amazon Bedrock AgentCore adds new features to help developers build agents faster — Amazon Bedrock AgentCore introduces a managed harness (preview), the AgentCore CLI, and AgentCore skills for coding assistants, helping developers go from idea to working agent prototype faster. The managed harness lets you define an agent by specifying a model, system prompt, and tools and run it immediately with no orchestration code required — and when you’re ready for full control, you can export the harness orchestration as Strands-based code. The AgentCore CLI deploys your agents with the governance and auditability of infrastructure-as-code (AWS CDK today, Terraform coming soon), and is available in 14 AWS Regions at no additional charge.

For a full list of AWS announcements, be sure to keep an eye on the What’s New with AWS page.

Other AWS news

Here are some additional posts and resources that you might find interesting:

  • Introducing granular cost attribution for Amazon Bedrock — This post walks through how Amazon Bedrock’s granular cost attribution works and covers practical example cost tracking scenarios. You can now tag and track Bedrock usage costs at a finer level of detail — useful for organizations running multiple teams or projects on Bedrock who need precise cost visibility and chargeback capabilities.
  • Automating Incident Investigation with AWS DevOps Agent and Salesforce MCP Server — This post (co-written with Salesforce) shows how AWS DevOps Agent, integrated with the Salesforce MCP Server, automates the full lifecycle of infrastructure incident investigation — from identifying issues and diagnosing root causes to notifying customers through Salesforce Service Cloud. It’s a compelling real-world example of how AI agents and MCP-based tool connectivity are reshaping DevOps workflows in production, dramatically reducing mean time to resolution.
  • Microcredentials from AWS are now free — Here’s why that matters — You can now access AWS microcredentials at no cost through AWS Skill Builder in all countries where the platform is offered. Unlike traditional multiple-choice certifications, microcredentials are hands-on assessments that place builders in simulated business scenarios where they configure, troubleshoot, and optimize directly in a live AWS environment — the same way they would on the job. A great opportunity to validate real cloud skills without a cost barrier.
  • Amazon SageMaker AI now supports optimized generative AI inference recommendations — You can now use Amazon SageMaker AI to automatically identify optimized deployment configurations for your generative AI models, including instance type, container, and inference parameters. This new capability takes the guesswork out of tuning inference infrastructure, helping you reduce costs and improve latency for your AI applications in production.

Upcoming AWS events

Check your calendar and sign up for upcoming AWS events:

  • What’s Next with AWS — Tune in on April 28 for What’s Next with AWS, a virtual event featuring the latest announcements and product updates directly from AWS teams. A great opportunity to get up to speed on what’s new before diving into the week’s launches.
  • AWS Summits — AWS Summits are free in-person events where you can explore the latest in cloud and AI innovation, learn best practices, and network with builders and experts. Coming up in May: Singapore (May 6), Tel Aviv (May 6), Warsaw (May 6), Stockholm (May 7), Sydney (May 13–14), Hamburg (May 20), Seoul (May 20), Amsterdam (May 27), Bangkok (May 28), Milan (May 28), and Mumbai (May 28). And in June, join us in Los Angeles (June 10). Check the full schedule and register at the link above.
  • AWS Community Days — Community-led conferences where content is planned, sourced, and delivered by community leaders, featuring technical discussions, workshops, and hands-on labs. Upcoming events include Athens, Greece (April 28), Vancouver, Canada (May 1), İstanbul, Türkiye (May 9), and Panama City, Panama (May 23). If you’re in Latin America, mark your calendar for the AWS Community Day Belo Horizonte (August 22) — registration is open at awscommunityday.com.br.

Join the AWS Builder Center to connect with builders, share solutions, and access content that supports your development. Browse here for upcoming AWS-led in-person and virtual events and developer-focused events.

That’s all for this week. Check back next Monday for another Weekly Roundup!

— Daniel Abib

This post is part of our Weekly Roundup series. Check back each week for a quick roundup of interesting news and announcements from AWS!

AWS Weekly Roundup: Claude Mythos Preview in Amazon Bedrock, AWS Agent Registry, and more (April 13, 2026)

Post Syndicated from Micah Walter original https://aws.amazon.com/blogs/aws/aws-weekly-roundup-claude-mythos-preview-in-amazon-bedrock-aws-agent-registry-and-more-april-13-2026/

In my last Week in Review post, I mentioned how much time I’ve been spending on AI-Driven Development Lifecycle (AI-DLC) workshops with customers this year. A common theme in those sessions is the need for better cost visibility. Teams are moving fast with AI, but as they go from experimenting to full production, finance and leadership really need to know who is using which resources and at what cost. That’s why I was so excited to see the launch of Amazon Bedrock new support for cost allocation by IAM user and role this week. This lets you tag IAM principals with attributes like team or cost center and then activate those tags in your Billing and Cost Management console. The resulting cost data flows into AWS Cost Explorer and the detailed Cost and Usage Report, giving you a clear line of sight into model inference spending. Whether you’re scaling agents across teams, tracking foundation model use by department, or running tools like Claude Code on Amazon Bedrock, this new feature is a game changer for tracking and managing your AI investments. You can get all the details on setting this up in the IAM principal cost allocation documentation.

Now, let’s get into this week’s AWS news…

Headlines
Amazon Bedrock now offers Claude Mythos Preview Anthropic’s most sophisticated AI model to date is now available on Amazon Bedrock as a gated research preview through Project Glasswing. Claude Mythos introduces a new model class focused on cybersecurity, capable of identifying sophisticated security vulnerabilities in software, analyzing large codebases, and delivering state of the art performance across cybersecurity, coding, and complex reasoning tasks. Security teams can use it to discover and address vulnerabilities in critical software before threats emerge. Access is currently limited to allowlisted organizations, with Anthropic and AWS prioritizing internet critical companies and open source maintainers.

AWS Agent Registry for centralized agent discovery and governance now in preview AWS launched Agent Registry through Amazon Bedrock AgentCore, providing organizations with a private catalog for discovering and managing AI agents, tools, skills, MCP servers, and custom resources. The registry helps teams locate existing capabilities rather than duplicating them, with semantic and keyword search, approval workflows, and CloudTrail audit trails. It is accessible via the AgentCore Console, AWS CLI, SDK, and as an MCP server queryable from IDEs.

Last week’s launches
Here are some launches and updates from this past week that caught my attention:

  • Announcing Amazon S3 Files, making S3 buckets accessible as file systems — Amazon S3 Files transforms S3 buckets into shared file systems that connect any AWS compute resource directly with your S3 data. Built on Amazon EFS technology, it delivers full file system semantics with low latency performance, caching actively used data and providing multiple terabytes per second of aggregate read throughput. Applications can access S3 data through both file system and S3 APIs simultaneously without code modifications or data migration.
  • Amazon OpenSearch Service supports Managed Prometheus and agent tracing —Amazon OpenSearch Service now provides a unified observability platform that consolidates metrics, logs, traces, and AI agent tracing into a single interface. The update includes native Prometheus integration with direct PromQL query support, RED metrics monitoring, and OpenTelemetry GenAI semantic convention support for LLM execution visibility. Operations teams can correlate slow traces to logs and overlay Prometheus metrics on dashboards without switching between tools.
  • Amazon WorkSpaces Advisor now available for AI powered troubleshooting— AWS launched Amazon WorkSpaces Advisor, an AI powered administrative tool that uses generative AI to help IT administrators troubleshoot Amazon WorkSpaces Personal deployments. It analyzes WorkSpace configurations, detects problems automatically, and provides actionable recommendations to restore service and optimize performance.
  • Amazon Braket adds support for Rigetti’s 108 qubit Cepheus QPU — Amazon Braket now offers access to Rigetti’s Cepheus-1-108Q device, the first 100+ qubit superconducting quantum processor on the platform. The modular design features twelve 9 qubit chiplets with CZ gates that offer enhanced resilience to phase errors. It supports multiple frameworks including Braket SDK, Qiskit, CUDA-Q, and Pennylane, with pulse level control for researchers.

For a full list of AWS announcements, be sure to keep an eye on the What’s New with AWS page.

Other AWS news
Here are some additional posts and resources that you might find interesting:

Upcoming AWS events
Check your calendar and sign up for upcoming AWS events:

  • What’s Next with AWS (April 28, Virtual) Join this livestream at 9am PT for a candid discussion about how agentic AI is transforming how businesses operate. Featuring AWS CEO Matt Garman, SVP Colleen Aubrey, and OpenAI leaders discussing emerging agent capabilities, Amazon’s internal experiences, and new agentic solutions and platform capabilities.

Browse here for upcoming AWS led in person and virtual events, startup events, and developer focused events.


That’s all for this week. Check back next Monday for another Weekly Roundup!

~ micah

Agentic AI for observability and troubleshooting with Amazon OpenSearch Service

Post Syndicated from Muthu Pitchaimani original https://aws.amazon.com/blogs/big-data/agentic-ai-for-observability-and-troubleshooting-with-amazon-opensearch-service/

Amazon OpenSearch Service powers observability workflows for organizations, giving their Site Reliability Engineering (SRE) and DevOps teams a single pane of glass to aggregate and analyze telemetry data. During incidents, correlating signals and identifying root causes demand deep expertise in log analytics and hours of manual work. Identifying the root cause remains largely manual. For many teams, this is the bottleneck that delays service recovery and burns engineering resources.

We recently showed how to build an Observability Agent using Amazon OpenSearch Service and Amazon Bedrock to reduce Mean time to Resolution (MTTR).  Now, Amazon OpenSearch Service brings many of these functions to the OpenSearch UI—no additional infrastructure required. Three new agentic AI features are offered to streamline and accelerate MTTR:

  • An Agentic Chatbot that can access the context and the underlying data that you’re looking at, apply agentic reasoning, and use tools to query data and generate insights on your behalf.
  • An Investigation Agent that deep-dives across signal data with hypothesis-driven analysis, explaining its reasoning at every step.
  • An Agentic Memory that supports both agents, so their accuracy and speed improve the more you use them.

In this post, we show how these capabilities work together to help engineers go from alert to root cause in minutes. We also walk through a sample scenario where the Investigation Agent automatically correlates data across multiple indices to surface a root cause hypothesis.

How the agentic AI capabilities work together

These AI capabilities are accessible from OpenSearch UI through an Ask AI button, as shown in the following diagram, which gives an entry point for the Agentic Chatbot.

Agentic Chatbot

To open the chatbot interface, choose Ask AI.

The chatbot understands the context of the current page, so it understands what you’re looking at before you ask a question. You can ask questions about your data, initiate an investigation, or ask the chatbot to explain a concept. After it understands your request, the chatbot plans and uses tools to access data, including generating and running queries in the Discover page, and applies reasoning to produce a data-driven answer. You can also use the chatbot in the Dashboard page, initiating conversations from a particular visualization to get a summary as shown in the following image.

Investigation agent

Many incidents are too complex to resolve with one or two queries. Now you can get the help of the investigation agent to handle these complex situations. The investigation agent uses the plan-execute-reflect agent, which is designed for solving complex tasks that require iterative reasoning and step-by-step execution. It uses a Large Language Model (LLM) as a planner and another LLM as an executor. When an engineer identifies a suspicious observation, like an error rate spike or a latency anomaly, they can ask the investigation agent to investigate. One of the important steps the investigation agent performs is re-evaluation. The agent, after executing each step, reevaluates the plan using the planner and the intermediate results. The planner can adjust the plan if necessary or skip a step or dynamically add steps based on this new information. Using the planner, the agent generates a root cause analysis report led by the most likely hypothesis and recommendations, with full agent traces showing every reasoning step, all findings, and how they support the final hypotheses. You can provide feedback, add your own findings, iterate on the investigation goal, and review and validate each step of the agent’s reasoning. This approach mirrors how experienced incident responders work, but completes automatically in minutes. You can also use the “/investigate” slash command to initiate an investigation directly from the chatbot, building on an ongoing conversation or starting with a different investigation goal.

Agent in action

Automatic query generation

Consider a situation where you’re an SRE or DevOps engineer and received an alert that a key service is experiencing elevated latency. You log in to the OpenSearch UI, navigate to the Discover page, and select the Ask AI button. Without any expertise in the Piped Processing Language (PPL) query language, you enter the question “find all requests with latency greater than 10 seconds”. The chatbot understands the context and the data that you’re looking at, thinks through the request, generates the right PPL command, and updates it in the query bar to get you the results. And if the query runs into any errors, the chatbot can learn about the error, self-correct, and iterate on the query to get the results for you.

Investigation and investigation management

For complex incidents that normally require manually analyzing and correlating multiple logs for the possible root cause, you can choose Start Investigation to initiate the investigation agent. You can provide a goal for the investigation, along with any context or hypothesis that you want to instruct the investigation. For example, “identify the root cause of widespread high latency across services. Use TraceIDs from slow spans to correlate with detailed log entries in the related log indices. Analyze affected services, operations, error patterns, and any infrastructure or application-level bottlenecks without sampling”.

The agent, as part of the conversation, will offer to investigate any issue that you’re trying to debug.

The agent sets goals for itself along with any other relevant information like indices, associated time range, and other, and asks for your confirmation before creating a Notebook for this investigation. A Notebook is a way within the OpenSearch UI to develop a rich report that’s live and collaborative. This helps with the management of the investigation and allows for reinvestigation at a later date if necessary.

After the investigation starts, the agent will perform a quick analysis by log sequence and data distribution to surface outliers. Then, it will plan for the investigation into a series of actions, and then performs each action, such as query for a specific log type and time range. It will reflect on the results at every step, and iterate on the plan until it reaches the most likely hypotheses. Intermediate results will appear on the same page as the agent works so that you can follow the reasoning in real time. For example, you find that the Investigation Agent accurately mapped out the service topology and used it as a key intermediary steps for the investigation.

As the investigation completes, the investigation agent concludes that the most likely hypothesis is a fraud detection timeout. The associated finding shows a log entry from the payment service: “currency amount is too big, waiting for fraud detection”. This matches a known system design where large transactions trigger a fraud detection call that blocks the request until the transaction is scored and assessed. The agent arrived at this finding by correlating data across two separate indices, a metrics index where the original duration data lived, and a correlated log index where the payment service entries were stored. The agent linked these indices using trace IDs, connecting the latency measurement to the specific log entry that explained it.

After reviewing the hypothesis and the supporting evidence, you find the result reasonable and aligns with your domain knowledge and past experiences with similar issues. You can now accept the hypothesis and review the request flow topology for the affected traces that were provided as part of the hypothesis investigation.

Alternatively, if you find that the initial hypothesis wasn’t helpful, you can review the alternative hypothesis at the bottom of the report and select any of the alternative hypotheses if there’s one that’s more accurate. You can also trigger a re-investigation with additional inputs, or corrections from previous input so that the Investigation Agent can rework it.

Getting started

You can use any of the new agentic AI features (limits apply) in the OpenSearch UI at no cost. You will find the new agentic AI features ready to use in your OpenSearch UI applications, unless you have previously disabled AI features in any OpenSearch Service domains in your account. To enable or disable the AI features, you can navigate to the details page of the OpenSearch UI application in AWS Management Console and update the AI settings from there. Alternatively, you can also use the registerCapability API to enable the AI features or use the deregisterCapability API to disable them. Learn more at Agentic AI in Amazon OpenSearch Services.

The agentic AI feature uses the identity and permissions of the logged in users for authorizing access to the connected data sources. Make sure that your users have the necessary permissions to access the data sources. For more information, see Getting Started with OpenSearch UI.

The investigation results are saved in the metadata system of OpenSearch UI and encrypted with a service managed key. Optionally, you can configure a customer managed key to encrypt all of the metadata with your own key. For more information, see Encryption and Customer Managed Key with OpenSearch UI.

The AI features are powered by Claude Sonnet 4.6 model in Amazon Bedrock. Learn more at Amazon Bedrock Data Protection.

Conclusion

The new agentic AI capabilities announced for Amazon OpenSearch Service help reduce Mean Time to Resolution by providing context-aware agentic chatbot for assistance, hypothesis-driven investigations with full explainability, and agentic memory for context consistency. With the new agentic AI capabilities, your engineering team can spend less time writing queries and correlating signals, and more time acting on confirmed root causes. We invite you to explore these capabilities and experiment with your applications today.


About the authors

Muthu Pitchaimani

Muthu is a Search Specialist with Amazon OpenSearch Service. He builds large-scale search applications and solutions. Muthu is interested in the topics of networking and security, and is based out of Austin, Texas.

Hang (Arthur) Zuo

Arthur is a Senior Product Manager with Amazon OpenSearch Service. Arthur leads OpenSearch UI platform and agentic AI features for observability and search use cases. Arthur is interested in the topics of Agentic AI and data products.

Mikhail Vaynshteyn

Mikhail is a Solutions Architect with Amazon Web Services. Mikhail works with healthcare and life sciences customers and specializes in data analytics services. Mikhail has more than 20 years of industry experience covering a wide range of technologies and sectors.

AWS Weekly Roundup: NVIDIA Nemotron 3 Super on Amazon Bedrock, Nova Forge SDK, Amazon Corretto 26, and more (March 23, 2026)

Post Syndicated from Daniel Abib original https://aws.amazon.com/blogs/aws/aws-weekly-roundup-nvidia-nemotron-3-super-on-amazon-bedrock-nova-forge-sdk-amazon-corretto-26-and-more-march-23-2026/

Hello! I’m Daniel Abib, and this is my first AWS Weekly Roundup. I’m a Senior Specialist Solutions Architect at AWS, focused on the generative AI and Amazon Bedrock. With over 28 years of experience in solution architecture, software development, and cloud architecture, I help Startups & Enterprises harness the power of generative AI with Amazon Bedrock. I’ve been at AWS for more than six and a half years, working closely with customers across Latin America, and I’m also passionate about Serverless technologies.

Outside of work and endurance sports, I’m a dedicated father to Cecília (7) and Rafael (4), who keep me busier—and happier— than any distributed system ever could. I’m based in São Paulo, you can find me on LinkedIn and X (@DCABib), where I share insights about generative AI, Amazon Bedrock, AWS serverless services, and the occasional Ironman throwback.

Now, let’s get into this week’s AWS news…

Last week’s launches
Here are some launches and updates from this past week that caught my attention:

  • Amazon Redshift increases performance for new queries in dashboards and ETL workloads by up to 7x — Amazon Redshift now delivers up to 7x faster performance for new queries in dashboards and ETL workloads. Queries you run for the first time — without cached results — now execute significantly faster, reducing wait times for interactive dashboards and accelerating your ETL pipelines. This is particularly impactful for workloads with high query variability where cache hits are less frequent.
  • NVIDIA Nemotron 3 Super now available on Amazon Bedrock — NVIDIA Nemotron 3 Super is now available in Amazon Bedrock, expanding the lineup of foundation models you can access through the unified Bedrock API. Nemotron 3 Super is a high-performance language model optimized for tasks such as text generation, complex reasoning, summarization, and code generation. You can now invoke Nemotron 3 Super alongside other foundation models in your existing Bedrock workflows, without managing any infrastructure.
  • Introducing Nova Forge SDK, a seamless way to customize Nova models for enterprise AI — Nova Forge SDK provides a streamlined way to fine-tune and customize Amazon Nova models for enterprise use cases. You can adapt Nova models to your domain-specific data and deploy them directly within Amazon Bedrock, reducing the complexity of building tailored AI solutions. The SDK handles the heavy lifting of model customization, letting you focus on your business logic rather than the underlying infrastructure.
  • Amazon Corretto 26 is now generally available — Amazon Corretto 26, the latest long-term support (LTS) release of the no-cost, production-ready distribution of OpenJDK, is now generally available. Corretto 26 includes the latest Java language features, performance improvements, and security patches, all backed by long-term support from AWS. You can use it across development and production environments on Amazon Linux, Windows, macOS, and Docker images.
  • AWS Lambda now supports Availability Zone metadata — AWS Lambda now provides Availability Zone metadata for your function invocations. You can now identify which Availability Zone your Lambda function is running in, enabling better observability, more informed architectural decisions, and simplified troubleshooting for latency-sensitive and multi-AZ workloads. This is particularly useful when correlating Lambda execution with other AZ-aware services in your architecture.
  • Amazon CloudWatch Logs now supports log ingestion using HTTP-based protocol — Amazon CloudWatch Logs now supports ingesting logs using an HTTP-based protocol, making it simpler to send logs from applications and services that use standard HTTP endpoints. You can now route logs to CloudWatch Logs without requiring custom agents or additional SDK integrations, lowering the barrier to centralized log management across your workloads.
  • Amazon EKS announces 99.99% Service Level Agreement and new 8XL scaling tier for Provisioned Control Plane clusters — Amazon EKS now offers a 99.99% Service Level Agreement (SLA) for clusters running on Provisioned Control Plane, up from the 99.95% SLA offered on standard control plane. EKS is also introducing the 8XL scaling tier, the largest available Provisioned Control Plane tier, which doubles the Kubernetes API server request processing capacity of the next lower 4XL tier — ideal for large-scale workloads like AI/ML training, high-performance computing (HPC), and large-scale data processing.

Other AWS news
Here are some additional posts and resources that you might find interesting:

  • Kiro for students — Kiro is now available for students, giving the next generation of builders access to AI-powered development tools at no cost. As Swami Sivasubramanian shared on LinkedIn, “Students are the future decision-makers shaping technology” — and Kiro gives them hands-on experience building with AI from day one. If you’re a student or know someone who is, this is a great opportunity to start building with AI-assisted development.
  • Strands Steering Hooks achieved 100% agent accuracy — The Strands Agents team published results showing that Steering Hooks can achieve 100% agent accuracy, outperforming both prompt engineering and rigid workflow approaches for controlling agent behavior. As Swami highlighted on LinkedIn, building reliable AI agents often means rethinking how we guide model behavior — and Steering Hooks offer a compelling new path to agent reliability.
  • Introducing Badges on AWS Builder Center — AWS Builder Center now features badges that recognize your contributions and achievements within the builder community. You can earn badges by sharing solutions, participating in challenges, and engaging with fellow builders. It’s a great way to showcase your expertise and track your growth.
  • Keep Building Together: The Power of Community — A thoughtful read on the power of community-driven learning and collaboration in the AWS ecosystem. Whether you’re just getting started with AWS or you’ve been building for years, the builder community is a place to connect, share knowledge, and grow together. I highly recommend checking it out.

Upcoming AWS events
Check your calendar and sign up for upcoming AWS events:

  • AWS Summits — Join AWS Summits in 2026, free in-person events where you can explore emerging cloud and AI technologies, learn best practices, and network with industry peers and experts. Upcoming Summits include Paris (April 1), London (April 22), Bengaluru (April 23–24), Singapore (May 6), Tel Aviv (May 6), and Stockholm (May 7).
  • AWS Community Days — Community-led conferences where content is planned, sourced, and delivered by community leaders, featuring technical discussions, workshops, and hands-on labs. Upcoming events include San Francisco (April 10) and Romania (April 23–24).
  • AWSome Women Summit LATAM — Taking place on March 28 in Mexico City, this event celebrates and empowers women in cloud technology across Latin America. A fantastic initiative for the LATAM tech community.

Join the AWS Builder Center to connect with builders, share solutions, and access content that supports your development. Browse the AWS Events and Webinars for upcoming AWS-led in-person and virtual events and developer-focused events.

That’s all for this week. Check back next Monday for another Weekly Roundup!

This post is part of our Weekly Roundup series. Check back each week for a quick roundup of interesting news and announcements from AWS!

AWS Weekly Roundup: Amazon S3 turns 20, Amazon Route 53 Global Resolver general availability, and more (March 16, 2026)

Post Syndicated from Esra Kayabali original https://aws.amazon.com/blogs/aws/aws-weekly-roundup-amazon-s3-turns-20-amazon-route-53-global-resolver-general-availability-and-more-march-16-2026/

Twenty years ago this past week, Amazon S3 launched publicly on March 14, 2006. While Amazon Simple Storage Service is often considered the foundational storage service that defined cloud infrastructure, what began as a simple object storage service has grown into something far larger in scope and scale.

As of March 2026, S3 stores more than 500 trillion objects, serves more than 200 million requests per second globally across hundreds of exabytes of data, and the price has dropped to just over 2 cents per gigabyte — an approximately 85% reduction since launch. My colleague Sébastien Stormacq wrote a detailed look at the engineering and the road ahead in Twenty years of Amazon S3 and building what’s next, and if you want to read about those earliest customers and how they shaped what AWS became, I recommend How three startups helped Amazon invent cloud computing and paved the way for AI. Twenty years is worth pausing to celebrate.

Alongside the 20th anniversary of S3, Channy Yun also wrote about a new S3 feature this week: Account regional namespaces for Amazon S3 general purpose buckets. With this feature, you can create general purpose buckets in your own account regional namespace by appending your account’s unique suffix to your requested bucket name, ensuring your desired names are always reserved exclusively for your account. You can enforce adoption across your organization using AWS IAM policies and AWS Organizations service control policies with the new s3:x-amz-bucket-namespace condition key. Read Channy’s post to learn more about account regional namespaces for Amazon S3 general purpose buckets.

This week’s featured launch is one I have a personal connection to: the general availability of Amazon Route 53 Global Resolver. I wrote about the preview of this capability back in December at re:Invent 2025, and I had a great time putting that post together, so I am happy to hear that it’s generally available now.

Amazon Route 53 Global Resolver is an internet-reachable anycast DNS resolver that provides DNS resolution for authorized clients from any location. It is now generally available across 30 AWS Regions, with support for both IPv4 and IPv6 DNS query traffic. Route 53 Global Resolver gives authorized clients in your organization anycast DNS resolution of public internet domains and private domains associated with Route 53 private hosted zones — from any location, not just from within a specific VPC or Region. It also provides DNS query filtering to block potentially malicious domains, domains that are not safe for work, and domains associated with advanced DNS threats such as DNS tunneling and Domain Generation Algorithms (DGA). Centralized query logging is included as well. With general availability, Global Resolver adds protection against Dictionary DGA threats.

Last week’s launches
Here are some of the other announcements from last week:

  • Amazon Bedrock AgentCore Runtime now supports stateful MCP server features — Amazon Bedrock AgentCore Runtime now supports stateful Model Context Protocol (MCP) server features, enabling developers to build MCP servers that use elicitation, sampling, and progress notifications alongside existing support for resources, prompts, and tools. With stateful MCP sessions, each user session runs in a dedicated microVM with isolated resources, and the server maintains session context across multiple interactions using an Mcp-Session-Id header. Elicitation enables server-initiated, multi-turn conversations to gather structured input from users during tool execution. Sampling allows servers to request LLM-generated content from the client for tasks such as personalized recommendations. Progress notifications keep clients informed during long-running operations. To learn more, see the Amazon Bedrock AgentCore documentation.
  • Amazon WorkSpaces now supports Microsoft Windows Server 2025 — New bundles powered by Microsoft Windows Server 2025 are now available for Amazon WorkSpaces Personal and Amazon WorkSpaces Core. These bundles include security capabilities such as Trusted Platform Module 2.0 (TPM 2.0), Unified Extensible Firmware Interface (UEFI) Secure Boot, Secured-core server, Credential Guard, Hypervisor-protected Code Integrity (HVCI), and DNS-over-HTTPS. Existing Windows Server 2016, 2019, and 2022 bundles remain available. You can use the managed Windows Server 2025 bundles or create a custom bundle and image. This support is available in all AWS Regions where Amazon WorkSpaces is available. For more information, visit the Amazon WorkSpaces FAQs.
  • AWS Builder ID now supports Sign in with GitHub and Amazon — AWS Builder ID now supports two additional social login options: GitHub and Amazon. These options join the existing Google and Apple sign-in capabilities. With this update, developers can access their AWS Builder ID profile — and services including AWS Builder Center, AWS Training and Certification, and Kiro — using their existing GitHub or Amazon account credentials, without managing a separate set of credentials. To learn more and get started, visit the AWS Builder ID documentation.
  • Amazon Redshift introduces reusable templates for COPY operations — Amazon Redshift now supports templates for the COPY command, allowing you to store and reuse frequently used COPY parameters. Templates help maintain consistency across data ingestion operations, reduce the effort required to execute COPY commands, and simplify maintenance by applying template updates automatically to all future uses. Support for COPY templates is available in all AWS Regions where Amazon Redshift is available, including the AWS GovCloud (US) Regions. To get started, see the documentation or read the Standardize Amazon Redshift operations using Templates blog.

For a full list of AWS announcements, be sure to keep an eye on our News Blog channel the What’s New with AWS page.

Upcoming AWS events
Check your calendar and sign up for upcoming AWS events:

AWS Summits – Join AWS Summits in 2026, free in-person events where you can explore emerging cloud and AI technologies, learn best practices, and network with industry peers and experts. Upcoming Summits include Paris (April 1), London (April 22), and Bengaluru (April 23–24).

AWS Community Days – Community-led conferences where content is planned, sourced, and delivered by community leaders, featuring technical discussions, workshops, and hands-on labs. Upcoming events include Pune (March 21), San Francisco (April 10), and Romania (April 23-24).

AWS at NVIDIA GTC 2026 — Join us at our AWS sessions, booths, demos, and ancillary events in NVIDIA GTC 2026 on March 16 – 19, 2026 in San Jose. You can receive 20% off event passes through AWS and request a 1:1 meeting at GTC.

AWS Community GameDay Europe — Taking place on March 17, 2026, AWS Community GameDay Europe is a team-based, hands-on AWS challenge event running simultaneously across 50+ cities in Europe. Your team is dropped into a broken AWS environment — misconfigured services, failing architectures, and security gaps — and has two hours to fix as much as possible. Find your nearest city and sign up at awsgameday.eu.

Join the AWS Builder Center to connect with builders, share solutions, and access content that supports your development. Browse here for upcoming AWS-led in-person and virtual events and developer-focused events.

That’s all for this week. Check back next Monday for another Weekly Roundup!

— Esra

This post is part of our Weekly Roundup series. Check back each week for a quick roundup of interesting news and announcements from AWS!

AWS Weekly Roundup: Amazon Connect Health, Bedrock AgentCore Policy, GameDay Europe, and more (March 9, 2026)

Post Syndicated from Sébastien Stormacq original https://aws.amazon.com/blogs/aws/aws-weekly-roundup-amazon-connect-health-bedrock-agentcore-policy-gameday-europe-and-more-march-9-2026/

Fiti AWS Student Community Kenya!

Last week was an incredible whirlwind: a round of meetups, hands-on workshops, and career discussions across Kenya that culminated with the AWS Student Community Day at Meru University of Science and Technology, with keynotes from my colleagues Veliswa and Tiffany, and sessions on everything from GitOps to cloud-native engineering, and a whole lot of AI agent building.

JAWS Days 2026 is the largest AWS Community Day in the world, with over 1,500 attendees on March 7th. This event started with a keynote speech on building an AI-driven development team by Jeff Barr, and included over 100 technical and community experience sessions, lightning talks, and workshops such as Game Days, Builders Card Challenges, and networking parties.

Now, let’s get into this week’s AWS news…

Last week’s launches
Here are some launches and updates from this past week that caught my attention:

  • Introducing Amazon Connect Health, Agentic AI Built for Healthcare — Amazon Connect Health is now generally available with five purpose-built AI agents for healthcare: patient verification, appointment management, patient insights, ambient documentation, and medical coding. All features are HIPAA-eligible and deployable within existing clinical workflows in days.
  • Policy in Amazon Bedrock AgentCore is now generally available — You can now use centralized, fine-grained controls for agent-tool interactions that operate outside your agent code. Security and compliance teams can define tool access and input validation rules using natural language that automatically converts to Cedar, the AWS open-source policy language.
  • Introducing OpenClaw on Amazon Lightsail to run your autonomous private AI agents — You can deploy a private AI assistant on your own cloud infrastructure with built-in security controls, sandboxed agent sessions, one-click HTTPS, and device pairing authentication. Amazon Bedrock serves as the default model provider, and you can connect to Slack, Telegram, WhatsApp, and Discord.
  • AWS announces pricing for VPC Encryption Controls — Starting March 1, 2026, VPC Encryption Controls transitions from free preview to a paid feature. You can audit and enforce encryption-in-transit of all traffic flows within and across VPCs in a region, with monitor mode to detect unencrypted traffic and enforce mode to prevent it.
  • Database Savings Plans now supports Amazon OpenSearch Service and Amazon Neptune Analytics — You can save up to 35% on eligible serverless and provisioned instance usage with a one-year commitment. Savings Plans automatically apply regardless of engine, instance family, size, or AWS Region.
  • AWS Elastic Beanstalk now offers AI-powered environment analysis — When your environment health is degraded, Elastic Beanstalk can now collect recent events, instance health, and logs and send them to Amazon Bedrock for analysis, providing step-by-step troubleshooting recommendations tailored to your environment’s current state.
  • AWS simplifies IAM role creation and setup in service workflows — You can now create and configure IAM roles directly within service workflows through a new in-console panel, without switching to the IAM console. The feature supports Amazon EC2, Lambda, EKS, ECS, Glue, CloudFormation, and more.
  • Accelerate Lambda durable functions development with new Kiro power — You can now build resilient, long-running multi-step applications and AI workflows faster with AI agent-assisted development in Kiro. The power dynamically loads guidance on replay models, step and wait operations, concurrent execution patterns, error handling, and deployment best practices.
  • Amazon GameLift Servers launches DDoS Protection — You can now protect session-based multiplayer games against DDoS attacks with a co-located relay network that authenticates client traffic using access tokens and enforces per-player traffic limits, at no additional cost to GameLift Servers customers.

For a full list of AWS announcements, be sure to keep an eye on the What’s New with AWS page.

From AWS community
Here are my personal favorite posts from AWS community and my colleagues:

  • I Built a Portable AI Memory Layer with MCP, AWS Bedrock, and a Chrome Extension — Learn how to build a persistent memory layer for AI agents using MCP and Amazon Bedrock, packaged as a Chrome extension that carries context across sessions and applications.
  • When the Model Is the Machine — Mike Chambers built an experimental app where an AI agent generates a complete, interactive web application at runtime from a single prompt — no codebase, no framework, no persistent state. A thought-provoking exploration of what happens when the model becomes the runtime.

Upcoming AWS events
Check your calendar and sign up for upcoming AWS events:

  • AWS Community GameDay Europe — Think you know AWS? Prove it at the AWS Community GameDay Europe on March 17, a gamified learning event where teams compete to solve real-world technical challenges using AWS services.
  • AWS at NVIDIA GTC 2026 — Join us at our AWS sessions, booths, demos, and ancillary events in NVIDIA GTC 2026 on March 16 – 19, 2026 in San Jose. You can receive 20% off event passes through AWS and request a 1:1 meeting at GTC.
  • AWS Summits — Join AWS Summits in 2026: free in-person events where you can explore emerging cloud and AI technologies, learn best practices, and network with industry peers and experts. Upcoming Summits include Paris (April 1), London (April 22), and Bengaluru (April 23–24).
  • AWS Community Days — Community-led conferences where content is planned, sourced, and delivered by community leaders. Upcoming events include Slovakia (March 11), Pune (March 21), and the AWSome Women Summit LATAM in Mexico City (March 28)

Browse here for upcoming AWS led in-person and virtual events, startup events, and developer-focused events.

That’s all for this week. Check back next Monday for another Weekly Roundup!

— seb

How CyberArk uses Apache Iceberg and Amazon Bedrock to deliver up to 4x support productivity

Post Syndicated from Moshiko Ben Abu original https://aws.amazon.com/blogs/big-data/how-cyberark-uses-apache-iceberg-and-amazon-bedrock-to-deliver-up-to-4x-support-productivity/

This post is co-written with Moshiko Ben Abu, Software Engineer at CyberArk.

CyberArk achieved up to 95% reduction in case resolution time using Amazon Bedrock and Apache Iceberg.

This improvement addresses a challenge in technical support workflow: when a support engineer receives a new customer case, the biggest bottleneck is often not diagnosing the problem but preparing the data. Customer logs arrive in different formats from multiple vendors, and each new log format typically requires manual integration and correlation before an investigation can begin. For simple cases, this process can take hours. For more complex investigations, it can take days, slowing resolution and reducing overall engineer productivity.

CyberArk is a global leader in identity security. Centered on intelligent privilege controls, it provides comprehensive security for human, machine, and AI identities across business applications, distributed workforces, and hybrid cloud environments.

In this post, we show you how CyberArk redesigned their support operations by combining Iceberg’s intelligent metadata management with AI-powered automation from Amazon Bedrock. You’ll learn how to simplify data processing flows, automate log parsing for diverse formats, and build autonomous investigation workflows that scale automatically.

To achieve these results, CyberArk needed a solution that could ingest customer logs, automatically structure them, establish relationships between related events, and make everything queryable in minutes, not days. The architecture had to be serverless to handle unpredictable support volumes, secure enough to protect customer Personally Identifiable Information (PII), and fast enough to allow same day case resolution.

The legacy architecture: Bottlenecks and manual workflows

When support engineers received customer cases, they would upload log files to the data lake stored in Amazon Simple Storage Service (Amazon S3). The original design then suffered from the complexity of multi-step raw data processing.

First, CyberArk’s custom parsing logic running on AWS Fargate would parse these uploaded log files and transform the raw data. During this stage, the system also had to scan for PII and mask sensitive data to protect customer privacy.

Next, a separate process converted the processed data into Parquet format.

Finally, AWS Glue crawlers were required to discover new partitions and update table metadata for processed Parquet files. This dependency became the most complex and time-consuming part of the pipeline. Crawlers ran as asynchronous batch jobs rather than in real time, often introducing delays of minutes to hours before support engineers could query the data.

But the inefficiency went deeper than just architectural complexity. CyberArk supports customers running diverse product environments across multiple vendors. Each vendor and product produces logs in different formats with unique schemas, field names, and structures. Adding support for a new vendor meant days of integration work to understand their log format and build custom parsers.

CyberArk Legacy Logs Ingestion Flow

Figure 1: Legacy log ingestion architecture diagram showing the flow from S3 upload through AWS Fargate processing with AWS Glue Crawler

Beyond ingestion, the investigation process itself was manual and time consuming. Support engineers would manually query data, correlate events across different log sources, search through product documentation, and piece together root cause analysis through trial and error. This process required deep product expertise and could take hours or days depending on issue complexity. The new architecture addresses these inefficiencies through three key innovations:

  1. Single stage serverless processing: AWS Fargate with PyIceberg directly creates Iceberg tables from raw logs in one pass, removing intermediate processing steps and crawler dependencies entirely.
  2. AI powered dynamic parsing: Amazon Bedrock automatically generates grok patterns for log parsing by analyzing file schemas, transforming what was once a manual, time consuming process into a fully automated workflow.
  3. Autonomous investigation with AI Agents: AI Agents autonomously perform complete root cause analysis by querying log data, analyzing product knowledge bases, identifying event flows, and recommending solutions, transforming hours of manual investigation into minutes of automated intelligence.

The solution: AI-powered automation meets single-stage Iceberg processing

The new system delivers zero touch log processing from upload to query. Support engineers simply upload customer log ZIP files to the system. Here’s where the transformation happens: CyberArk’s custom processing logic still runs on AWS Fargate, but now it uses Amazon Bedrock to intelligently understand the data.

Zero-touch log processing workflow

The system extracts sample log entries from the uploaded log files and sends them to Amazon Bedrock along with context about the log source and table schema from AWS Glue Data Catalog. Amazon Bedrock analyzes the samples, understands the structure, and automatically generates grok patterns optimized for the specific log format.

Grok patterns are structured expressions that define how to extract meaningful fields from unstructured log text. For example, the following grok pattern specifies that a timestamp appears first, followed by a severity level, then a message body %{TIMESTAMP_ISO8601:timestamp} %{LOGLEVEL:severity} %{GREEDYDATA:message}

The system validates these grok patterns against additional samples to verify accuracy before applying them to parse the complete log file. Successfully validated grok patterns are stored in Amazon DynamoDB, creating a repository of known patterns. When the system encounters similar log formats in future uploads, it can retrieve these patterns directly from Amazon DynamoDB, avoiding redundant grok pattern generation. Amazon Bedrock processes log samples in real-time without retaining customer data or using it for model training, maintaining data privacy.

This entire process invokes Claude 3.7 Sonnet model from Amazon Bedrock and is orchestrated by AWS Fargate tasks with retry logic for reliability. The processing uses these AI-generated grok patterns to parse the logs and create or update Iceberg tables using PyIceberg APIs without human intervention.

This automation reduced logs onboarding time from days to minutes, enabling CyberArk to handle diverse customer environments without manual intervention.

Figure 2: Log ingestion architecture diagram showing the flow from S3 upload through AWS Fargate processing with Amazon Bedrock integration to Iceberg table creation

Figure 2: Log ingestion architecture diagram showing the flow from S3 upload through AWS Fargate processing with Amazon Bedrock integration to Iceberg table creation

Apache Iceberg: Simplified architecture, faster queries

Iceberg simplified and improved CyberArk’s data lake architecture by addressing the two primary bottlenecks in the legacy system: slow schema management and inefficient query performance.

Built-in schema evolution removes crawler dependency

In the legacy architecture, AWS Glue crawlers became a source of operational overhead and latency. Even when triggered on demand, crawlers ran as batch jobs over S3 prefixes to discover partitions and update metadata. As data volumes grew and datasets diversified across vendors and schemas, teams had to manage and operate a growing number of crawler jobs. The resulting delays, often ranging from minutes to hours, slowed data availability and downstream investigation workflows.

Iceberg removes this entire layer of complexity. Iceberg’s intelligent metadata layer automatically tracks table structure, schema changes, and partition information as data is written. When CyberArk’s processing creates or updates Iceberg tables through PyIceberg, the metadata is updated instantly and atomically. There’s no waiting for crawlers jobs to complete, and no risk of stale metadata. The moment data is written, it’s immediately queryable in Amazon Athena.

PyIceberg: Making Iceberg accessible beyond Apache Spark

Working with Iceberg usually involved Apache Spark and the complexity of distributed data processing. PyIceberg changed that by letting CyberArk create and manage Iceberg tables using a simple Python library. CyberArk’s data engineers could write straightforward Python code running on AWS Fargate to create Iceberg tables directly from parsed logs, without spinning up Spark clusters.

This accessibility was essential for CyberArk’s serverless architecture. PyIceberg enabled single stage processing where AWS Fargate tasks could parse logs, apply PII masking, and create Iceberg tables in one pass. The result was simpler code and lower operational overhead.

Metadata-driven query optimization delivers speed

In addition to removing crawlers, Iceberg significantly improved query performance through its intelligent metadata architecture. Iceberg maintains detailed statistics about data files, including min/max values, null counts, and partition information. When support engineers query data in Athena, Iceberg’s metadata layer supports partition pruning and file skipping, making sure queries only read the specific files containing relevant data. For CyberArk’s use case, where tables are partitioned by case ID, this means a query for a specific support case only reads the files for that case, ignoring potentially thousands of irrelevant files. This metadata driven optimization reduced query execution time from minutes to seconds, allowing support engineers to interactively explore data rather than waiting for results.

ACID transactions maintain data consistency

In a multi user support environment where multiple engineers may be analyzing overlapping cases or uploading logs simultaneously, data consistency is essential. Iceberg’s ACID transaction support helps verify that concurrent writes do not corrupt data or create inconsistent states. Each table update is atomic, isolated, and durable, providing the reliability CyberArk needed for production support operations.

Time travel enables historical analysis

Iceberg’s built-in versioning allows support engineers to query historical states of data, essential for understanding how customer issues evolved over time. If an engineer needs to see what the logs looked like when a case was first opened versus after a customer applied a patch, Iceberg’s time travel capabilities make this straightforward. This feature proved essential for complex troubleshooting scenarios where understanding the timeline of events was critical to resolution.

Automated table optimization with AWS Glue

Iceberg tables require periodic maintenance to maintain query performance.

CyberArk enabled AWS Glue automatic table optimization for their Iceberg tables, which handles compaction and expired snapshot cleanup in the background.

For CyberArk’s continuous upload workflow, this automation avoids performance degradation over time. Tables stay optimized without manual intervention from the engineering team.

AI Agents: Autonomous investigation workflow

While the Claude 3.7 Sonnet model from Amazon Bedrock automates grok pattern generation for log ingestion, the more advanced use of Amazon Bedrock comes in the investigation workflow. We use AI agents with Bedrock models to change how support engineers analyze and resolve customer issues.

From manual analysis to AI powered investigation

In the legacy workflow, support engineers would manually query data, correlate events across different log sources, search through product documentation, and piece together root cause analysis through trial and error. This process required deep product expertise and could take hours or days depending on issue complexity. AI Agents automate this entire investigation process. Support engineers use an internal portal to ask questions in natural language about customer issues, questions like
“Show me authentication errors for case 12345 in the last 24 hours”, “What were the most common errors across cases opened this week?” or “Compare the error patterns between case 12345 and case 12346.”

Behind the scenes, the system fires specialized AI Agents that autonomously perform thorough analysis.

How support agents work

Each AI Agent operates as an intelligent investigator with a clear mission: understand what happened, determine why it happened, and recommend how to fix it. When a support engineer asks a question, the agent collects relevant data by querying Athena to retrieve log data from Iceberg tables, filtering for the specific case and time period relevant to the investigation. The agent then accesses CyberArk’s internal knowledge base for the specific product involved, understanding known issues, common error patterns, and documented solutions. The agent then performs the following analysis:

  • Flow identification: Analyzes the sequence of events in the logs to understand what actually happened during the customer’s issue
  • Root cause determination: Correlates log events with product knowledge to identify the underlying cause of the problem
  • Solution recommendations: Suggests specific remediation steps based on the root cause analysis and known resolution patterns

This entire process happens in minutes, delivering advanced analysis that would have taken support engineers hours to perform manually.

For complex cases where a solution is not found, the support agent escalates to another, specialized agent that interacts with service engineers to collect additional inputs and expertise. This human-in-the-loop approach makes sure that even the most challenging cases receive appropriate attention while still benefiting from the automated investigation workflow. The insights gathered from these escalated cases are automatically fed back into CyberArk’s knowledge base, continuously improving the system’s ability to handle similar issues autonomously in the future.

Amazon Bedrock never shares customer data with model providers or uses it to train foundation models, case data and investigation insights remain within CyberArk’s environment.

Concurrent agent execution at scale

When multiple support engineers investigate different cases simultaneously, the solution runs specialized agents concurrently. CyberArk currently uses Claude 3.7 Sonnet as the foundation model for these agents. Each agent works independently on its assigned investigation, operating in parallel without resource contention. This concurrent execution allows the investigation workflow to scale automatically with support volume, handling peak loads without performance degradation.

AI-powered investigation advantage

This AI-powered investigation workflow delivers two key advantages.

Investigations that took hours now complete in minutes, enabling support engineers to resolve up to 4x more cases per day.

The system also creates a continuous learning feedback loop. When cases require manual resolution by engineers, these resolutions are automatically recorded and fed back into the knowledge base. Future investigations benefit from this accumulated expertise, with agents applying lessons learned from previous manual resolutions to similar cases. Amazon Bedrock doesn’t use customer data to train foundation models. Case data and investigation insights remain within CyberArk’s environment.
This automated feedback mechanism means the investigation workflow becomes more effective over time, continuously improving resolution accuracy and speed.

CyberArk - AI Powered Logs Investigation Flow

Figure 3: Investigation workflow diagram showing natural language query through AI Agents to Athena queries and knowledge base analysis

Scaling without proportional engineering growth

The business impact of this AI automation is significant. CyberArk can expand its vendor coverage and product portfolio without adding data engineering headcount. The same system that handles today’s log types will automatically handle tomorrow’s additions, whether that’s ten new formats or thousands, significantly reducing time to market for new product and vendor integrations.

The results: Significant improvements in resolution time and productivity

The transformation delivered measurable improvements across every key metric.

Resolution time: CyberArk achieved up to 95% reduction in time from case assignment to resolution. Simple cases that used to take 4 to 6 hours now take just 15 to 30 minutes. Complex cases that previously took up to 15 days are now completed in 2 to 4 hours.

Engineer productivity: Support engineers now handle 8 to 12 cases per day, compared to just 2 to 3 cases before. This means each engineer is helping up to 4x more customers.

Data availability: Logs are queryable within minutes of upload instead of waiting hours or days. Support engineers can start investigating issues almost immediately after receiving customer data.

Operational efficiency: The system requires zero manual intervention for new log formats or schema changes. Cases that used to require days of data engineering work now happen automatically.

Cost optimization: The serverless architecture alleviated idle infrastructure costs while scaling automatically with demand. CyberArk only pays for what they use, when they use it.

Customer satisfaction: Faster resolution times and proactive issue identification significantly improved the customer experience. Problems get solved in hours instead of days, and customers spend less time waiting for answers.

What’s next?

While AWS continues to innovate across both data lake management and agentic AI infrastructure, the following capabilities align well with CyberArk’s architecture and may offer additional operational benefits as the system scale.

Agent infrastructure maturity

As the agent-based architecture scales to handle thousands of concurrent investigations, CyberArk is transitioning to Amazon Bedrock AgentCore for future agent deployments. AgentCore provides a managed runtime for production AI agents with enhanced observability through AWS X-Ray integration, intelligent memory for context retention across sessions, and streamlined operational workflows. While the current AI Agents implementation delivers the performance and reliability CyberArk needs today, AgentCore represents a natural evolution path as operational requirements grow, offering framework-agnostic deployment, automatic scaling, and comprehensive monitoring capabilities without infrastructure management overhead.

Amazon S3 Tables

CyberArk’s current architecture uses Iceberg tables stored in Amazon S3 buckets. Amazon S3 Tables offers fully managed Iceberg tables with built-in optimization.

As CyberArk continue to scale with hundreds of Iceberg tables and rapid data growth, CyberArk is exploring a migration to Amazon S3 Tables to further reduce operational overhead.

S3 Tables remove the need to set up and monitor AWS Glue maintenance jobs. It automatically performs maintenance to enhance the performance of Iceberg tables, including unreferenced file removal, file compaction, and snapshot management. Additionally, S3 Tables provides Intelligent-Tiering that automatically moves data between storage classes based on access patterns, optimizing storage costs without manual intervention.

Because S3 Tables uses Iceberg open table format, migration would not require changes to existing Athena queries and PyIceberg code. This flexibility allows CyberArk to evaluate and adopt S3 Tables when the operational and cost benefits align with their business needs.

Conclusion

CyberArk’s transformation demonstrates how combining modern data lake architecture with AI automation can significantly change operational economics. By combining Iceberg’s intelligent metadata management with AI-powered automation from Amazon Bedrock, CyberArk transformed case resolution from days to minutes while enabling support operations to scale automatically with business growth. Support engineers now spend their time solving customer problems instead of wrangling data, customers receive faster resolutions, and the system scales automatically with the business.

To learn more about Iceberg on AWS, refer to Working with Amazon S3 Tables and table buckets and Using Apache Iceberg on AWS. To learn more about Amazon Bedrock AgentCore, refer to Amazon Bedrock AgentCore.


About the authors

Moshiko Ben Abu

Moshiko Ben Abu

Moshiko is a Software Engineer at CyberArk, specializing in architecting cloud-native applications and building AI-powered solutions. Moshiko advocates for a shift-left approach where security is built in from day one. His drive for innovation has been recognized across the company, earning him the Innovator culture award at CyberArk’s Global Kickoff.

Riki Nizri

Riki Nizri

Riki is a Solutions Architect at AWS. Collaborating with AWS ISV customers, Riki helps them leverage AWS services to build modern, efficient solutions that drive measurable business outcomes.

Sofia Zilberman

Sofia Zilberman

Sofia works as a Senior Streaming Solutions Architect at AWS, helping customers design and optimize real-time data pipelines using open-source technologies like Apache Flink, Kafka, and Apache Iceberg. With experience in both streaming and batch data processing, she focuses on making data workflows efficient, observable, and high-performing.

Reduce Mean Time to Resolution with an observability agent

Post Syndicated from Muthu Pitchaimani original https://aws.amazon.com/blogs/big-data/reduce-mean-time-to-resolution-with-an-observability-agent/

Customers of all sizes have been successfully using Amazon OpenSearch Service to power their observability workflows and gain visibility into their applications and infrastructure. During incident investigation, Site Reliability Engineers (SREs) and operations center personnel rely on OpenSearch Service to query logs, examine visualizations, analyze patterns, correlate traces to find the root cause of the incident, and reduce Mean Time to Resolution (MTTR). When an incident happens that triggers alerts, SREs typically jump between multiple dashboards, write specific queries, check recent deployments, and correlate between logs and traces to piece together a timeline of events. Not only is this process largely manual, but it also creates a cognitive load on these personnel, even when all the data is readily available. This is where agentic AI can help, by being an intelligent assistant that can understand how to query, interpret various telemetry signals, and systematically investigate an incident.

In this post, we present an observability agent using OpenSearch Service and Amazon Bedrock AgentCore that can help surface root cause and get insights faster, handle multiple query-correlation cycles, and ultimately reduce MTTR even further.

Solution overview

The following diagram shows the overall architecture for the observability agent.

Applications and infrastructure emit telemetry signals in the form of logs, traces, and metrics. These signals are then gathered by OpenTelemetry Collector (Step 1) and exported to Amazon OpenSearch Ingestion using individual pipelines for every signal: logs, traces, and metrics (Step 2). These pipelines deliver the signal data to an OpenSearch Service domain and Amazon Managed Service for Prometheus (Step 3).

OpenTelemetry is the standard for instrumentation, and provides vendor-neutral data collection across a broad range of languages and frameworks. Enterprises of various sizes are adopting this architecture pattern using OpenTelemetry for their observability needs, especially those committed to open source tools. More notably, this architecture builds on open source foundations, helping enterprises avoid vendor lock-in, benefit from the open source community, and implement it across on-premises and various cloud environments.

For this post, we use the OpenTelemetry Demo application to demonstrate our observability use case. This is an ecommerce application powered by about 20 different microservices, and generates realistic telemetry data together with feature sets to generate load and simulate failures.

Model Context Protocol servers for observability signal data

The Model Context Protocol (MCP) provides a standardized mechanism to connect agents to external data sources and tools. In this solution, we built three distinct MCP servers, one for each type of signal.

The Logs MCP server exposes tool functions for searching, filtering, and selecting log data that is stored in an OpenSearch Service domain for log data. This enables the agent to query the logs using various criteria like simple keyword matching, service name filter, log level, or time ranges. This mimics the typical queries you would run during an investigation. The following snippet shows a pseudo code of what the tool function can look like:

# Logs MCP Server - Key Functions
search_otel_logs(
    query: string,           # Text search query for log messages
    service: string,         # Service name to filter logs
    severity: string,        # Log level (INFO, WARN, ERROR)
    startTime: string,       # Start time (ISO format or relative e.g., 'now-1h')
    endTime: string,         # End time (ISO format or relative e.g., 'now')
    size: number             # Number of results to return
)
get_logs_by_trace_id(
    traceId: string,         # Trace ID to retrieve all correlated logs
    size: number             # Maximum number of logs to return
)

The Traces MCP server exposes tool functions for searching and retrieving information about distributed traces. These functions can help look up traces by trace ID and find traces for a particular service, the spans belonging to a trace, the service map information constructed based on the spans, and the rate, error, and duration (also known as RED metrics). This enables the agent to follow a request’s path across the services and pinpoint where failures happened or latency originated.

# Traces MCP Server - Key Functions
get_otel_spans(
    serviceName: string,     # Service name to filter spans
    traceId: string,         # Trace ID to filter spans
    spanId: string,          # Span ID to retrieve a specific span
    operationName: string,   # Operation/span name to filter
    startTime: string,       # Start time (ISO format or relative)
    endTime: string,         # End time (ISO format or relative)
    size: number             # Number of results to return
)
get_spans_by_trace_id(
    traceId: string,         # Trace ID to retrieve all spans for
    size: number             # Maximum number of spans to return
)
get_otel_service_map(
    serviceName: string,     # Service name to filter service map
    startTime: string,       # Start time
    endTime: string,         # End time
    size: number             # Number of results to return
)
get_otel_rate_error_duration_metrics(
    startTime: string,       # Start time (default: 'now-5m')
    endTime: string          # End time (default: 'now')
)

The Metrics MCP server exposes tool functions for querying time series metrics. The agent can use these functions to check error rate percentiles and resource utilization, which are key signals for understanding the overall health of the system and identifying anomalous behavior.

# Metrics MCP Server - Key Functions
query_instant(
    query: string,           # PromQL query expression
    time: string,            # Evaluation timestamp (optional)
    timeout: string          # Evaluation timeout (optional)
)
query_range(
    query: string,           # PromQL query expression
    start: string,           # Start timestamp
    end: string,             # End timestamp
    step: string,            # Query resolution step (e.g., '15s', '1m')
    timeout: string          # Evaluation timeout (optional)
)
get_timeseries(
    metric: string,          # Metric name or PromQL expression
    duration: string,        # Time duration to look back (e.g., '1h', '6h')
    step: string             # Step size (optional)
)
search_metrics(
    pattern: string          # Search pattern (supports regex e.g., 'http.*')
)
explore_metric(
    metric: string           # Metric name to explore (metadata + samples)
)

These three MCP servers span across the different types of data used by investigation engineers, providing a complete working set for an agent to conduct investigations with autonomous correlation across logs, traces, and metrics to determine the possible root causes for an issue. Additionally, a custom MCP server exposes tool functions over business data on revenue, sales, and other business metrics. For the OpenTelemetry demo application, you can develop synthetic data to aid in providing context for impact and other business level metrics. For brevity, we don’t show that server as a part of this architecture.

Observability agent

The observability agent is central to the solution. It is built to help with incident investigation. Traditional automations and manual runbooks typically follow predefined operating procedures, but with an observability agent, you don’t need to define them. The agent can analyze, reason based on the data available to it, and adapt its strategy based on what it discovers. It correlates findings across logs, traces, and metrics to arrive at a root cause.

The observability agent is built with the Strands Agent SDK, an open source framework that simplifies development of AI agents. The SDK provides a model-driven approach with flexibility to handle underlying orchestration and reasoning (the agent loop) by invoking exposed tools and maintaining coherent, turn-based interactions. This implementation also discovers tools dynamically, so if there is a change in the capabilities, the agent can make decisions based on up-to-date information.

The agent runs on Amazon Bedrock AgentCore Runtime, which provides fully managed infrastructure for hosting and running agents. The runtime supports popular agent frameworks, including Stands, LangGraph, and CrewAI. The runtime also provides scaling availability and compute that many enterprises require to run production-grade agents.

We use Amazon Bedrock AgentCore Gateway to connect to all three MCP servers. When deploying agents at scale, gateways are indispensable components to reduce management tasks like custom code development, infrastructure provisioning, comprehensive ingress and egress security, and unified access. These are essential enterprise functions needed when bringing a workload to production. In this application, we create gateways that connect all three MCP servers as targets using server-sent events. Gateways work alongside Amazon Bedrock AgentCore Identities to provide secure credentials management and secure identity propagation from the user to the communicating entities. The sample application uses AWS Identity and Access Management (IAM) for identity management and propagation.

Incident investigation is often a multi-step process. It involves iterative hypothesis testing, multiple rounds of querying, and building context over time. We use Amazon Bedrock AgentCore Memory for this purpose. In this solution, we use session-based namespaces to maintain separate conversation threads for different investigations. For example, when a user asks “What about Payment service?” during an investigation, the agent retrieves recent conversation history from memory to maintain awareness of prior findings. We store both user questions and agent responses with timestamps to help the agent reconstruct the conversation chronologically and reason about already completed findings.

We configured the observability agent to use Anthropic’s Claude Sonnet v4.5 in Amazon Bedrock for reasoning. The model interprets questions, decides which MCP tool to invoke, analyzes the results, and formulates the set of questions or conclusions. We use a system prompt to instruct the model to think like an experienced SRE or an operation center engineer: “Starting with a high-level check, narrowing down affected components, correlate across telemetry signal types and derive conclusion with substantiation. You ask the model to also suggest logical next steps such as performing a drill down to investigate inter service dependencies.” This makes the agent versatile to analyze and reason about common varieties of incident investigations.

Observability agent in action

We built a real-time RED (rate, errors, duration) metrics dashboards for the entire application, as shown in the following figure.

To establish a baseline, we asked the agent the following question: “Are there any errors in my application in the last five minutes?”The agent queries the traces and metrics, analyzes the results, and responds saying there are no errors in the system. It notes that all the services are active, traces are healthy, and the system is processing requests normally. The agent also proactively suggests next steps that might be useful for further investigation.

Introducing failures

The OpenTelemetry demo application has a feature flag that we can use to introduce deliberate failures in the system. It also includes load generation so these errors can surface prominently. We use these features to introduce a few failures with the payment service. The real-time RED metrics dashboards in the previous figure reflect the impact and show the error rates climbing.

Investigation and root cause analysis

Now that we are generating errors, we engage the agent again. This is typically the start of the investigation session. Also, we have workflows like alarms triggering or pages going out that will trigger the starting of an investigation.

We ask the question “Users are complaining that it is taking a long time to buy items. Can you check to see what is going on?”

The agent retrieves the conversation history from memory (if there is any), invokes tools to query RED metrics across services, and analyzes the results. It identifies a critical purchase flow performance issue: payment service is in a connectivity crisis and completely unavailable, with extreme latency observed in fraud detection, ad service, and recommendation service. The agent provides immediate action recommendations—restore payment service connectivity as the top priority—and suggests next steps, including investigating payment service logs.

Following the agent’s suggestion, we ask it to investigate the logs: “Investigate payment service logs to understand the connectivity issue.”

The agent searches logs for the checkout and payment services, correlates them with trace data, and analyzes service dependencies from the service map. It confirms that although cart service, product catalog service, and currency service are healthy, the payment service is completely unreachable, successfully identifying the root cause of our deliberately introduced failure.

Beyond root cause: Analyzing business impact

As mentioned earlier, we have synthetic business sales and revenue data in a separate MCP server, so when the user asks the agent “Analyze the business impact of the checkout and payment service failures,” the agent uses this business data, examines the transaction data from traces, calculates estimated revenue impact, and assesses customer abandonment rates due to checkout failures. This shows how the agent can go beyond identifying the root cause and provide help with operational activities like creating a runbook for issue resolution in the future, which can be first the step to providing automatic remediation without involving SREs.

Benefits and results

Although the failure scenario in this post is simplified for illustration, it highlights several key benefits that directly contribute to reducing MTTR.

Accelerated investigation cycles

Traditional workflows for troubleshooting involve multiple iterations of hypotheses, verification, querying, and data analysis at each step, requiring context switching and consuming hours of effort. The observability agent reduces these drastically to a few minutes by autonomous reasoning, correlation, and actioning, which in turn reduces MTTR.

Handling complex workflows

Real-world production scenarios often involve cascading failures and multiple system failures. The observability agent’s capabilities can extend to these scenarios by using historical data and pattern recognition. For instance, it can distinguish related issues from false positives using temporal or identity-based correlation, dependency graphs, and other techniques, helping SREs avoid wasted investigation effort on unrelated anomalies.

Rather than provide a single answer, the agent can provide probabilistic distribution across potential root causes, helping SREs prioritize remediation methods; for example:

  • Payment service network connectivity issue: 75%
  • Downstream payment gateway timeout: 15%
  • Database connection pool exhaustion: 8%
  • Other/Unknown: 2%

The agent can compare current symptoms against past incidents, identifying whether similar patterns have happened in the past, thereby evolving from a reactive query tool into a proactive diagnostic assistant.

Conclusion

Incident investigation remains largely manual. SREs juggle dashboards, craft queries, and correlate signals under pressure, even when all the data is readily available. In this post, we showed how an observability agent built with Amazon Bedrock AgentCore and OpenSearch Service can alleviate this cognitive burden by autonomously querying logs, traces, and metrics; correlating findings; and guiding SREs toward root cause faster. Although this pattern represents one approach, the flexibility of Amazon Bedrock AgentCore combined with the search and analytics capabilities of OpenSearch Service enables agents to be designed and deployed in numerous ways—at different stages of the incident lifecycle, with varying levels of autonomy, or focused on specific investigation tasks—to suit your organization’s unique operational needs. Agentic AI doesn’t replace existing observability investment, but amplifies them by providing an effective way to use your data during incident investigations.


About the authors

Muthu Pitchaimani

Muthu Pitchaimani

Muthu is a Search Specialist with Amazon OpenSearch Service. He builds large-scale search applications and solutions. Muthu is interested in the topics of networking and security, and is based out of Austin, Texas.

Jon Handler

Jon Handler

Jon is Director of Solutions Architecture for Search Services at AWS. Based in Palo Alto, CA. Jon works closely with OpenSearch and Amazon OpenSearch Service, providing help and guidance to a broad range of customers who have generative AI, search, and log analytics workloads for OpenSearch.