Post Syndicated from Dmitriy Novikov original https://aws.amazon.com/blogs/security/introducing-the-aws-waf-traffic-overview-dashboard/
For many network security operators, protecting application uptime can be a time-consuming challenge of baselining network traffic, investigating suspicious senders, and determining how best to mitigate risks. Simplifying this process and understanding network security posture at all times is the goal of most IT organizations that are trying to scale their applications without also needing to scale their security operations center staff. To help you with this challenge, AWS WAF introduced traffic overview dashboards so that you can make informed decisions about your security posture when your application is protected by AWS WAF.
In this post, we introduce the new dashboards and delve into a few use cases to help you gain better visibility into the overall security of your applications using AWS WAF and make informed decisions based on insights from the dashboards.
Introduction to traffic overview dashboards
The traffic overview dashboard in AWS WAF displays an overview of security-focused metrics so that you can identify and take action on security risks in a few clicks, such as adding rate-based rules during distributed denial of service (DDoS) events. The dashboards include near real-time summaries of the Amazon CloudWatch metrics that AWS WAF collects when it evaluates your application web traffic.
These dashboards are available by default and require no additional setup. They show metrics—total requests, blocked requests, allowed requests, bot compared to non-bot requests, bot categories, CAPTCHA solve rate, top 10 matched rules, and more—for each web access control list (web ACL) that you monitor with AWS WAF.
You can access default metrics such as the total number of requests, blocked requests, and common attacks blocked, or you can customize your dashboard with the metrics and visualizations that are most important to you.
These dashboards provide enhanced visibility and help you answer questions such as these:
- What percent of the traffic that AWS WAF inspected is getting blocked?
- What are the top originating countries for the traffic that’s getting blocked?
- What are common attacks that AWS WAF detects and protects me from?
- How do my traffic patterns from this week compare with last week?
The dashboard has native and out-of-the-box integration with CloudWatch. Using this integration, you can navigate back and forth between the dashboard and CloudWatch; for example, you can get a more granular metric overview by viewing the dashboard in CloudWatch. You can also add existing CloudWatch widgets and metrics to the traffic overview dashboard, bringing your tried-and-tested visibility structure into the dashboard.
With the introduction of the traffic overview dashboard, one AWS WAF tool—Sampled requests—is now a standalone tab inside a web ACL. In this tab, you can view a graph of the rule matches for web requests that AWS WAF has inspected. Additionally, if you have enabled request sampling, you can see a table view of a sample of the web requests that AWS WAF has inspected.
The sample of requests contains up to 100 requests that matched the criteria for a rule in the web ACL and another 100 requests for requests that didn’t match rules and thus had the default action for the web ACL applied. The requests in the sample come from the protected resources that have received requests for your content in the previous three hours.
The following figure shows a typical layout for the traffic overview dashboard. It categorizes inspected requests with a breakdown of each of the categories that display actionable insights, such as attack types, client device types, and countries. Using this information and comparing it with your expected traffic profile, you can decide whether to investigate further or block the traffic right away. For the example in Figure 1, you might want to block France-originating requests from mobile devices if your web application isn’t supposed to receive traffic from France and is a desktop-only application.
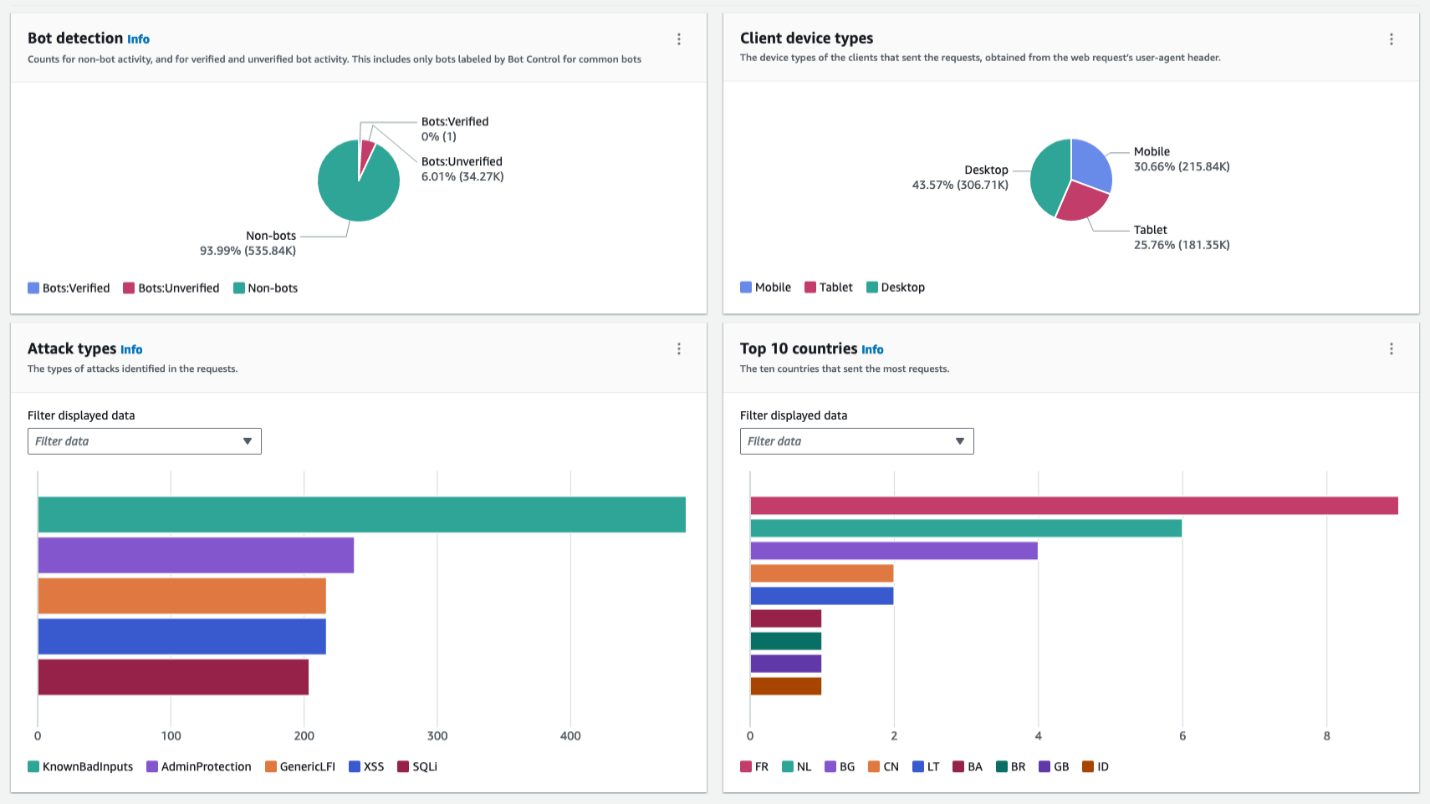
Figure 1: Dashboard with sections showing multiple categories serves as a single pane of glass
Use case 1: Analyze traffic patterns with the dashboard
In addition to visibility into your web traffic, you can use the new dashboard to analyze patterns that could indicate potential threats or issues. By reviewing the dashboard’s graphs and metrics, you can spot unusual spikes or drops in traffic that deserve further investigation.
The top-level overview shows the high-level traffic volume and patterns. From there, you can drill down into the web ACL metrics to see traffic trends and metrics for specific rules and rule groups. The dashboard displays metrics such as allowed requests, blocked requests, and more.
Notifications or alerts about a deviation from expected traffic patterns provide you a signal to explore the event. During your exploration, you can use the dashboard to understand the broader context and not just the event in isolation. This makes it simpler to detect a trend in anomalies that could signify a security event or misconfigured rules. For example, if you normally get 2,000 requests per minute from a particular country, but suddenly see 10,000 requests per minute from it, you should investigate. Using the dashboard, you can look at the traffic across various dimensions. The spike in requests alone might not be a clear indication of a threat, but if you see an additional indicator, such as an unexpected device type, this could be a strong reason for you to take follow-up action.
The following figure shows the actions taken by rules in a web ACL and which rule matched the most.
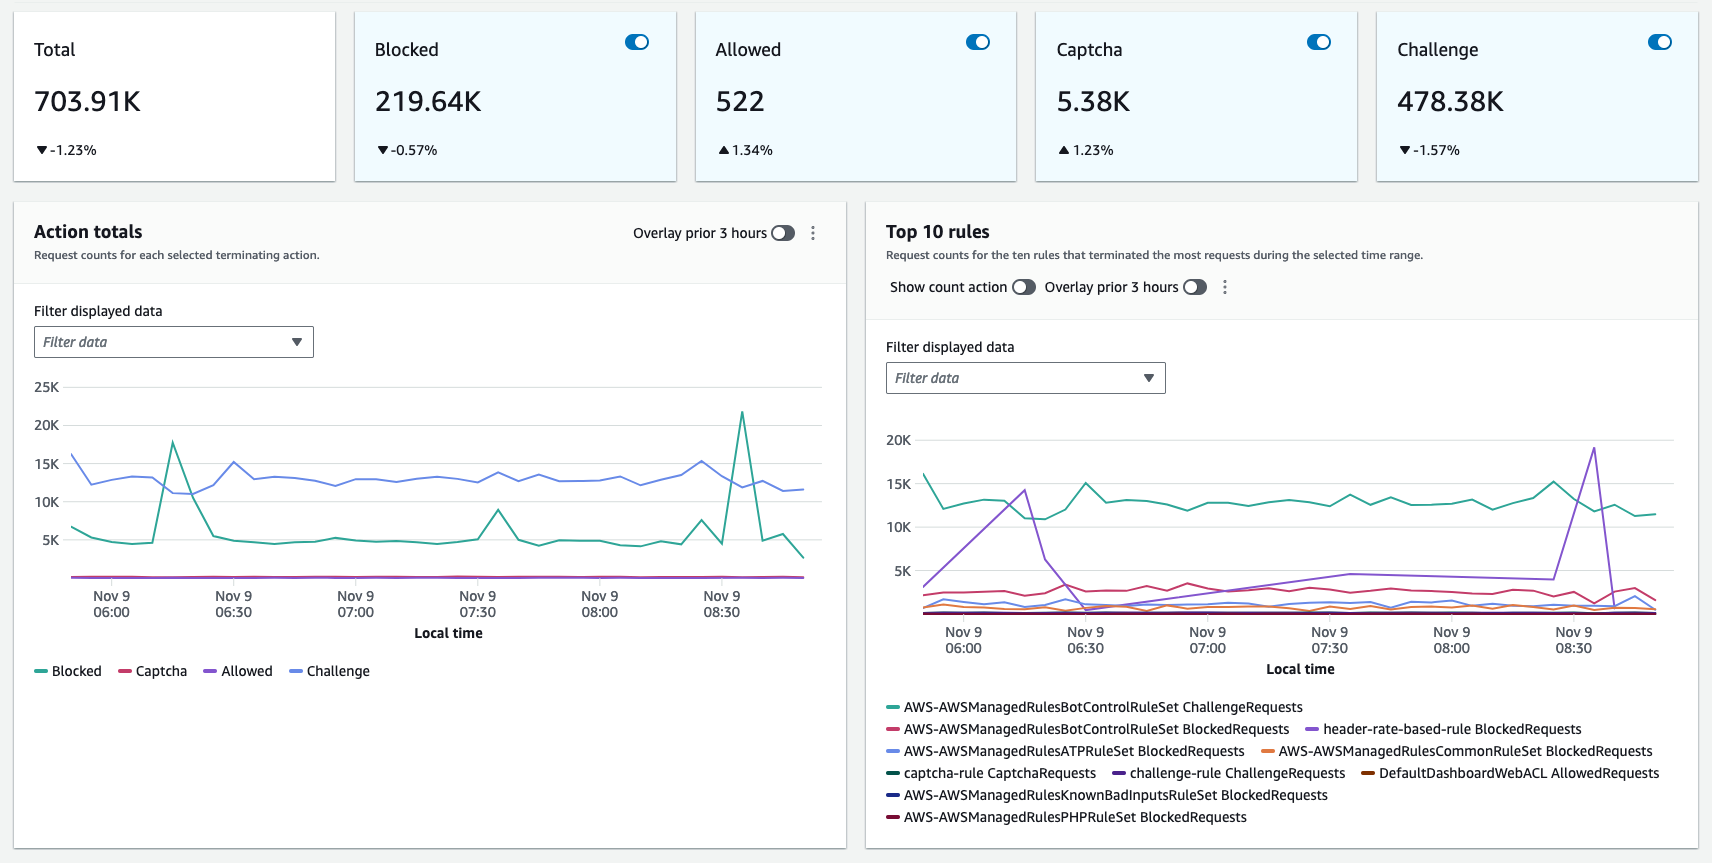
Figure 2: Multidimensional overview of the web requests
The dashboard also shows the top blocked and allowed requests over time. Check whether unusual spikes in blocked requests correspond to spikes in traffic from a particular IP address, country, or user agent. That could indicate attempted malicious activity or bot traffic.
The following figure shows a disproportionately larger number of matches to a rule indicating that a particular vector is used against a protected web application.
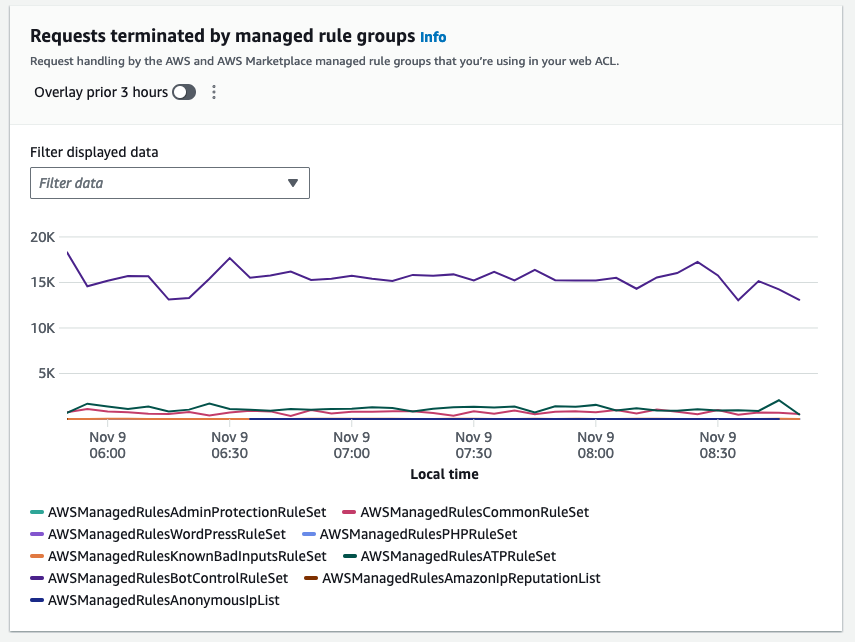
Figure 3: The top terminating rule could indicate a particular vector of an attack
Likewise, review the top allowed requests. If you see a spike in traffic to a specific URL, you should investigate whether your application is working properly.
Next steps after you analyze traffic
After you’ve analyzed the traffic patterns, here are some next steps to consider:
- Tune your AWS WAF rules to better match legitimate or malicious traffic based on your findings. You might be able to fine-tune rules to reduce false positives or false negatives. Tune rules that are blocking legitimate traffic by adjusting regular expressions or conditions.
- Configure AWS WAF logging, and if you have a dedicated security information and event management (SIEM) solution, integrate the logging to enable automated alerting for anomalies.
- Set up AWS WAF to automatically block known malicious IPs. You can maintain an IP block list based on identified threat actors. Additionally, you can use the Amazon IP reputation list managed rule group, which the Amazon Threat Research Team regularly updates.
- If you see spikes in traffic to specific pages, check that your web applications are functioning properly to rule out application issues driving unusual patterns.
- Add new rules to block new attack patterns that you spot in the traffic flows. Then review the metrics to help confirm the impact of the new rules.
- Monitor source IPs for DDoS events and other malicious spikes. Use AWS WAF rate-based rules to help mitigate these spikes.
- If you experience traffic floods, implement additional layers of protection by using CloudFront with DDoS protection.
The new dashboard gives you valuable insight into the traffic that reaches your applications and takes the guesswork out of traffic analysis. Using the insights that it provides, you can fine-tune your AWS WAF protections and block threats before they affect availability or data. Analyze the data regularly to help detect potential threats and make informed decisions about optimizing.
As an example, if you see an unexpected spike of traffic, which looks conspicuous in the dashboard compared to historical traffic patterns, from a country where you don’t anticipate traffic originating from, you can create a geographic match rule statement in your web ACL to block this traffic and prevent it from reaching your web application.
The dashboard is a great tool to gain insights and to understand how AWS WAF managed rules help protect your traffic.
Use case 2: Understand bot traffic during onboarding and fine-tune your bot control rule group
With AWS WAF Bot Control, you can monitor, block, or rate limit bots such as scrapers, scanners, crawlers, status monitors, and search engines. If you use the targeted inspection level of the rule group, you can also challenge bots that don’t self-identify, making it harder and more expensive for malicious bots to operate against your website.
On the traffic overview dashboard, under the Bot Control overview tab, you can see how much of your current traffic is coming from bots, based on request sampling (if you don’t have Bot Control enabled) and real-time CloudWatch metrics (if you do have Bot Control enabled).
During your onboarding phase, use this dashboard to monitor your traffic and understand how much of it comes from various types of bots. You can use this as a starting point to customize your bot management. For example, you can enable common bot control rule groups in count mode and see if desired traffic is being mislabeled. Then you can add rule exceptions, as described in AWS WAF Bot Control example: Allow a specific blocked bot.
The following figure shows a collection of widgets that visualize various dimensions of requests detected as generated by bots. By understanding categories and volumes, you can make an informed decision to either investigate by further delving into logs or block a specific category if it’s clear that it’s unwanted traffic.
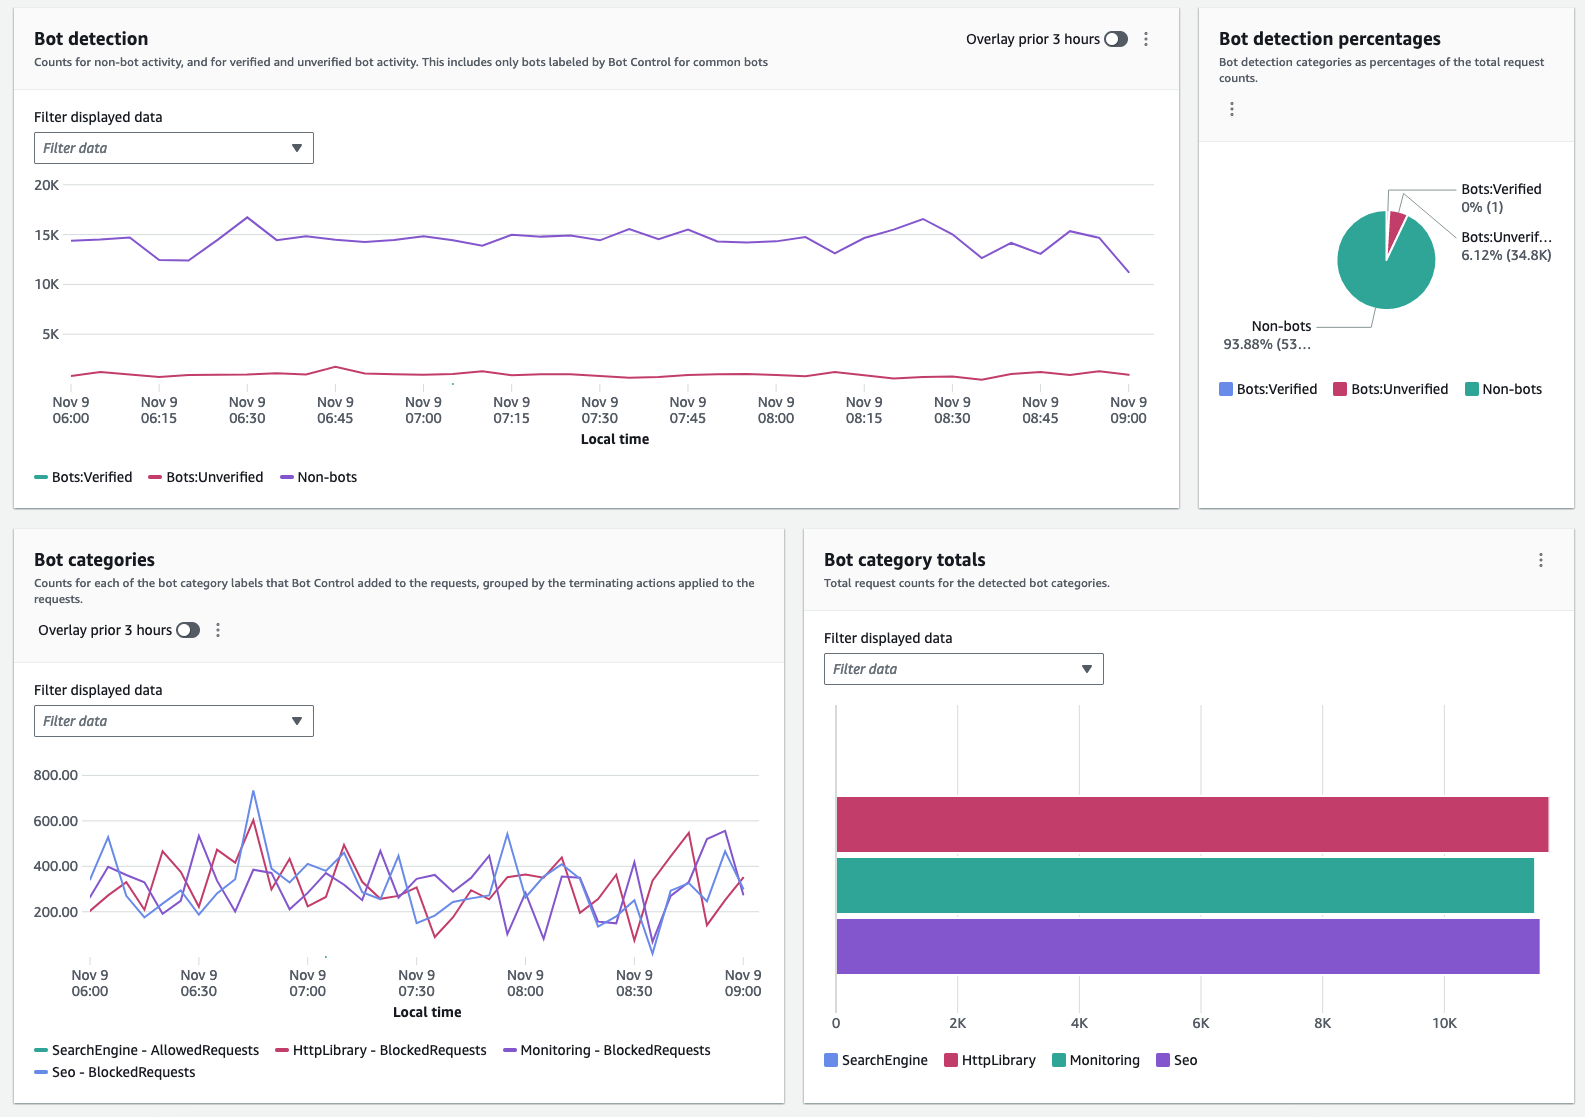
Figure 4: Collection of bot-related metrics on the dashboard
After you get started, you can use the same dashboard to monitor your bot traffic and evaluate adding targeted detection for sophisticated bots that don’t self-identify. Targeted protections use detection techniques such as browser interrogation, fingerprinting, and behavior heuristics to identify bad bot traffic. AWS WAF tokens are an integral part of these enhanced protections.
AWS WAF creates, updates, and encrypts tokens for clients that successfully respond to silent challenges and CAPTCHA puzzles. When a client with a token sends a web request, it includes the encrypted token, and AWS WAF decrypts the token and verifies its contents.
In the Bot Control dashboard, the token status pane shows counts for the various token status labels, paired with the rule action that was applied to the request. The IP token absent thresholds pane shows data for requests from IPs that sent too many requests without a token. You can use this information to fine-tune your AWS WAF configuration.
For example, within a Bot Control rule group, it’s possible for a request without a valid token to exit the rule group evaluation and continue to be evaluated by the web ACL. To block requests that are missing their token or for which the token is rejected, you can add a rule to run immediately after the managed rule group to capture and block requests that the rule group doesn’t handle for you. Using the Token status pane, illustrated in Figure 5, you can also monitor the volume of requests that acquire tokens and decide if you want to rate limit or block such requests.
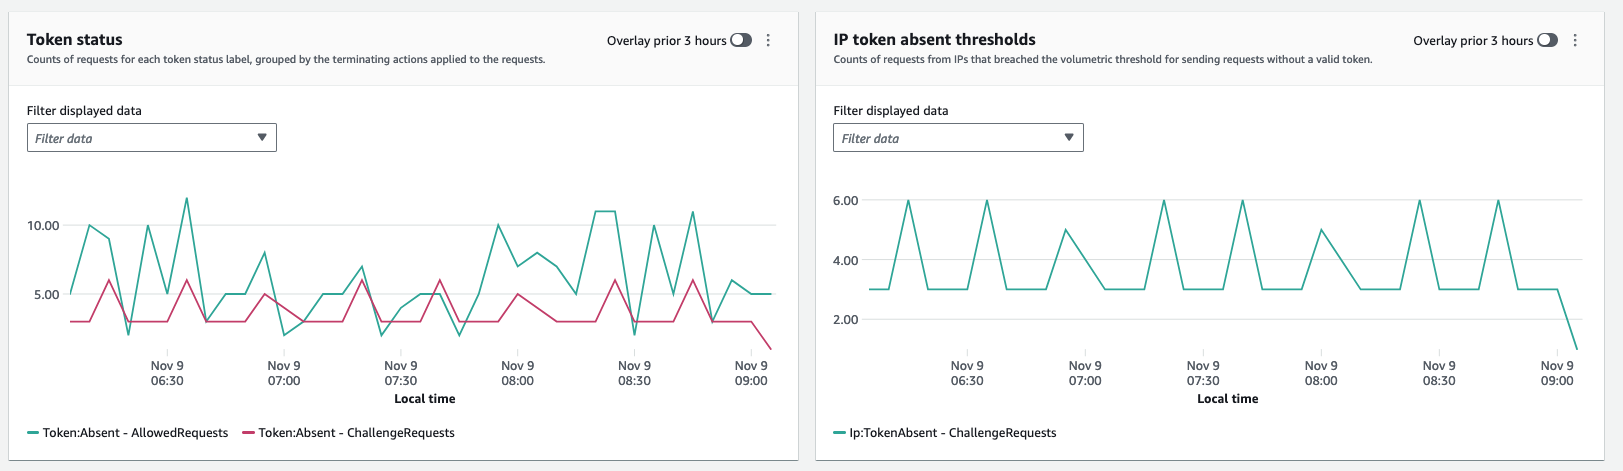
Figure 5: Token status enables monitoring of the volume of requests that acquire tokens
Comparison with CloudFront security dashboard
The AWS WAF traffic overview dashboard provides enhanced overall visibility into web traffic reaching resources that are protected with AWS WAF. In contrast, the CloudFront security dashboard brings AWS WAF visibility and controls directly to your CloudFront distribution. If you want the detailed visibility and analysis of patterns that could indicate potential threats or issues, then the AWS WAF traffic overview dashboard is the best fit. However, if your goal is to manage application delivery and security in one place without navigating between service consoles and to gain visibility into your application’s top security trends, allowed and blocked traffic, and bot activity, then the CloudFront security dashboard could be a better option.
Availability and pricing
The new dashboards are available in the AWS WAF console, and you can use them to better monitor your traffic. These dashboards are available by default, at no cost, and require no additional setup. CloudWatch logging has a separate pricing model and if you have full logging enabled you will incur CloudWatch charges. See here for more information about CloudWatch charges. You can customize the dashboards if you want to tailor the displayed data to the needs of your environment.
Conclusion
With the AWS WAF traffic overview dashboard, you can get actionable insights on your web security posture and traffic patterns that might need your attention to improve your perimeter protection.
In this post, you learned how to use the dashboard to help secure your web application. You walked through traffic patterns analysis and possible next steps. Additionally, you learned how to observe traffic from bots and follow up with actions related to them according to the needs of your application.
The AWS WAF traffic overview dashboard is designed to meet most use cases and be a go-to default option for security visibility over web traffic. However, if you’d prefer to create a custom solution, see the guidance in the blog post Deploy a dashboard for AWS WAF with minimal effort.
If you have feedback about this post, submit comments in the Comments section below. If you have questions about this post, contact AWS Support.


 Sebastian Vlad is a Senior Partner Solutions Architect with Amazon Web Services, with a passion for data and analytics solutions and customer success. Sebastian works with enterprise customers to help them design and build modern, secure, and scalable solutions to achieve their business outcomes.
 Sharad Pai is a Lead Technical Consultant at AWS. He specializes in streaming analytics and helps customers build scalable solutions using Amazon MSK and Amazon Kinesis. He has over 16 years of industry experience and is currently working with media customers who are hosting live streaming platforms on AWS, managing peak concurrency of over 50 million. Prior to joining AWS, Sharad’s career as a lead software developer included 9 years of coding, working with open source technologies like JavaScript, Python, and PHP.


 Michael Greenshtein is an Analytics Specialist Solutions Architect for the Public Sector.
 Gonzalo Herreros is a Senior Big Data Architect on the AWS Glue team.


 Stefano Sandona is a Senior Big Data Solution Architect at AWS. He loves data, distributed systems and security. He helps customers around the world architecting secure, scalable and reliable big data platforms.
 Adnan Hemani is a Software Development Engineer at AWS working with the EMR team. He focuses on the security posture of applications running on EMR clusters. He is interested in modern Big Data applications and how customers interact with them.
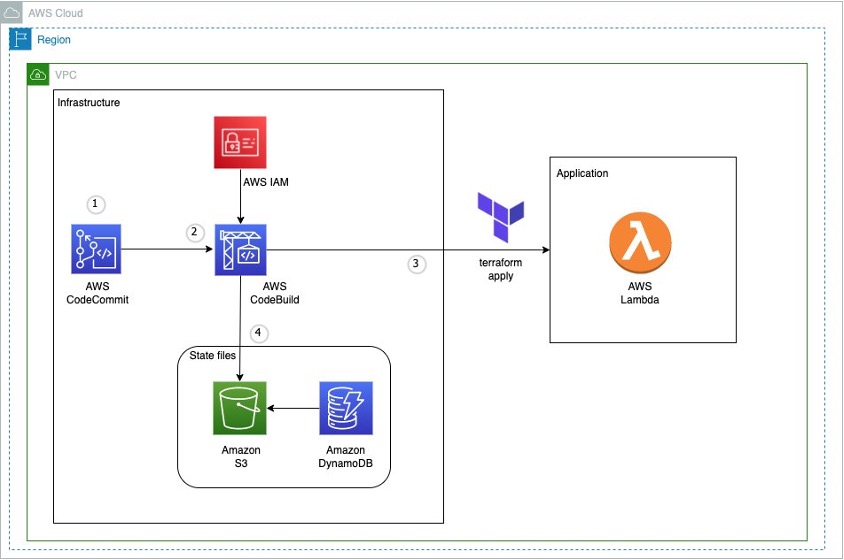


 Ryan Waldorf is a Senior Product Manager at Amazon Redshift. Ryan focuses on features that enable customers to define and scale compute including data sharing and concurrency scaling.
 Harshida Patel is a Analytics Specialist Principal Solutions Architect, with Amazon Web Services (AWS).


 Tamer Soliman is a Senior Solutions Architect at AWS. He helps Independent Software Vendor (ISV) customers innovate, build, and scale on AWS. He has over two decades of industry experience, and is an inventor with three granted patents. His experience spans multiple technology domains including telecom, networking, application integration, data analytics, AI/ML, and cloud deployments. He specializes in AWS Networking and has a profound passion for machine leaning, AI, and Generative AI.


 Diagram 4: S3 Bucket creation success with hooks execution


 Deepthi Mohan is a Principal PMT on the Amazon Managed Service for Apache Flink team.
 Francisco Morillo is a Streaming Solutions Architect at AWS. Francisco works with AWS customers, helping them design real-time analytics architectures using AWS services, supporting Amazon Managed Streaming for Apache Kafka (Amazon MSK) and Amazon Managed Service for Apache Flink.


 Prashant Agrawal is a Senior Search Specialist Solutions Architect with Amazon OpenSearch Service. He works closely with customers to help them migrate their workloads to the cloud and helps existing customers fine-tune their clusters to achieve better performance and save on cost. Before joining AWS, he helped various customers use OpenSearch and Elasticsearch for their search and log analytics use cases. When not working, you can find him traveling and exploring new places. In short, he likes doing Eat → Travel → Repeat.
 Satish Nandi is a Senior Product Manager with Amazon OpenSearch Service. He is focused on OpenSearch Serverless and has years of experience in networking, security and ML/AI. He holds a Bachelor degree in Computer Science and an MBA in Entrepreneurship. In his free time, he likes to fly airplanes, hang gliders and ride his motorcycle.