In the context of Retrieval-Augmented Generation (RAG), knowledge retrieval plays a crucial role, because the effectiveness of retrieval directly impacts the maximum potential of large language model (LLM) generation.
Currently, in RAG retrieval, the most common approach is to use semantic search based on dense vectors. However, dense embeddings do not perform well in understanding specialized terms or jargon in vertical domains. A more advanced method is to combine traditional inverted-index(BM25) based retrieval, but this approach requires spending a considerable amount of time customizing lexicons, synonym dictionaries, and stop-word dictionaries for optimization.
In this post, instead of using the BM25 algorithm, we introduce sparse vector retrieval. This approach offers improved term expansion while maintaining interpretability. We walk through the steps of integrating sparse and dense vectors for knowledge retrieval using Amazon OpenSearch Service and run some experiments on some public datasets to show its advantages. The full code is available in the github repo aws-samples/opensearch-dense-spase-retrieval.
What’s Sparse vector retrieval
Sparse vector retrieval is a recall method based on an inverted index, with an added step of term expansion. It comes in two modes: document-only and bi-encoder. For more details about these two terms, see Improving document retrieval with sparse semantic encoders.
Simply put, in document-only mode, term expansion is performed only during document ingestion. In bi-encoder mode, term expansion is conducted both during ingestion and at the time of query. Bi-encoder mode improves performance but may cause more latency. The following figure demonstrates its effectiveness.
Neural sparse search in OpenSearch achieves 12.7%(document-only) ~ 20%(bi-encoder) higher NDCG@10, comparable to the TAS-B dense vector model.
With neural sparse search, you don’t need to configure the dictionary yourself. It will automatically expand terms for the user. Additionally, in an OpenSearch index with a small and specialized dataset, while hit terms are generally few, the calculated term frequency may also lead to unreliable term weights. This may lead to significant bias or distortion in BM25 scoring. However, sparse vector retrieval first expands terms, greatly increasing the number of hit terms compared to before. This helps produce more reliable scores.
Although the absolute metrics of the sparse vector model can’t surpass those of the best dense vector models, it possesses unique and advantageous characteristics. For instance, in terms of the NDCG@10 metric, as mentioned in Improving document retrieval with sparse semantic encoders, evaluations on some datasets reveal that its performance could be better than state-of-the-art dense vector models, such as in the DBPedia dataset. This indicates a certain level of complementarity between them. Intuitively, for some extremely short user inputs, the vectors generated by dense vector models might have significant semantic uncertainty, where overlaying with a sparse vector model could be beneficial. Additionally, sparse vector retrieval still maintains interpretability, and you can still observe the scoring calculation through the explanation command. To take advantage of both methods, OpenSearch has already introduced a built-in feature called hybrid search.
How to combine dense and sparse?
1. Deploy a dense vector model
To get more valuable test results, we selected Cohere-embed-multilingual-v3.0, which is one of several popular models used in production for dense vectors. We can access it through Amazon Bedrock and use the following two functions to create a connector for bedrock-cohere and then register it as a model in OpenSearch. You can get its model ID from the response.
2.1 On the OpenSearch Service console, choose Integrations in the navigation pane.
2.2 Under Integration with Sparse Encoders through Amazon SageMaker, choose to configure a VPC domain or public domain.
Next, you configure the AWS CloudFormation template.
2.3 Enter the parameters as shown in the following screenshot.
2.4 Get the sparse model ID from the stack output.
3. Set up pipelines for ingestion and search
Use the following code to create pipelines for ingestion and search. With these two pipelines, there’s no need to perform model inference, just text field ingestion.
4. Create an OpenSearch index with dense and sparse vectors
Use the following code to create an OpenSearch index with dense and sparse vectors. You must specify the default_pipeline as the ingestion pipeline created in the previous step.
For retrieval evaluation, we used to use the datasets from BeIR. But not all datasets from BeIR are suitable for RAG. To mimic the knowledge retrieval scenario, we choose BeIR/fiqa and squad_v2 as our experimental datasets. The schema of its data is shown in the following figures.
The following is a data preview of squad_v2.
The following is a query preview of BeIR/fiqa.
The following is a corpus preview of BeIR/fiqa.
You can find question and context equivalent fields in the BeIR/fiqa datasets. This is almost the same as the knowledge recall in RAG. In subsequent experiments, we input the context field into the index of OpenSearch as text content, and use the question field as a query for the retrieval test.
2. Test data ingestion
The following script ingests data into the OpenSearch Service domain:
import json
from setup_model_and_pipeline import get_aos_client
from beir.datasets.data_loader import GenericDataLoader
from beir import LoggingHandler, util

aos_client = get_aos_client(aos_endpoint)

def ingest_dataset(corpus, aos_client, index_name, bulk_size=50):
    i=0
    bulk_body=[]
    for _id , body in tqdm(corpus.items()):
        text=body["title"]+" "+body["text"]
        bulk_body.append({ "index" : { "_index" : index_name, "_id" : _id } })
        bulk_body.append({ "content" : text })
        i+=1
        if i % bulk_size==0:
            response=aos_client.bulk(bulk_body,request_timeout=100)
            try:
                assert response["errors"]==False
            except:
                print("there is errors")
                print(response)
                time.sleep(1)
                response = aos_client.bulk(bulk_body,request_timeout=100)
            bulk_body=[]

    response=aos_client.bulk(bulk_body,request_timeout=100)
    assert response["errors"]==False
    aos_client.indices.refresh(index=index_name)

url = f"https://public.ukp.informatik.tu-darmstadt.de/thakur/BEIR/datasets/{dataset_name}.zip"
data_path = util.download_and_unzip(url, data_root_dir)
corpus, queries, qrels = GenericDataLoader(data_folder=data_path).load(split="test")
ingest_dataset(corpus, aos_client=aos_client, index_name=index_name)
3. Performance evaluation of retrieval
In RAG knowledge retrieval, we usually focus on the relevance of top results, so our evaluation uses recall@4 as the metric indicator. The whole test will include various retrieval methods to compare, such as bm25_only, sparse_only, dense_only, hybrid_sparse_dense, and hybrid_dense_bm25.
The following script uses hybrid_sparse_dense to demonstrate the evaluation logic:
In the context of RAG, usually the developer doesn’t pay attention to the metric NDCG@10; the LLM will pick up the relevant context automatically. We care more about the recall metric. Based on our experience of RAG, we measured recall@1, recall@4, and recall@10 for your reference.
The dataset BeIR/fiqa is mainly used for evaluation of retrieval, whereas squad_v2 is mainly used for evaluation of reading comprehension. In terms of retrieval, squad_v2 is much less complicated than BeIR/fiqa. In the real RAG context, the difficulty of retrieval may not be as high as with BeIR/fiqa, so we evaluate both datasets.
The hybird_dense_sparse metric is always beneficial. The following table shows our results.
Dataset
BeIR/fiqa
squad_v2
Method\Metric
Recall@1
Recall@4
Recall@10
Recall@1
Recall@4
Recall@10
bm25
0.112
0.215
0.297
0.59
0.771
0.851
dense
0.156
0.316
0.398
0.671
0.872
0.925
sparse
0.196
0.334
0.438
0.684
0.865
0.926
hybird_dense_sparse
0.203
0.362
0.456
0.704
0.885
0.942
hybird_dense_bm25
0.156
0.316
0.394
0.671
0.871
0.925
Conclusion
The new neural sparse search feature in OpenSearch Service version 2.11, when combined with dense vector retrieval, can significantly improve the effectiveness of knowledge retrieval in RAG scenarios. Compared to the combination of bm25 and dense vector retrieval, it’s more straightforward to use and more likely to achieve better results.
OpenSearch Service version 2.12 has recently upgraded its Lucene engine, significantly enhancing the throughput and latency performance of neural sparse search. But the current neural sparse search only supports English. In the future, other languages might be supported. As the technology continues to evolve, it stands to become a popular and widely applicable way to enhance retrieval performance.
About the Author
YuanBo Li is a Specialist Solution Architect in GenAI/AIML at Amazon Web Services. His interests include RAG (Retrieval-Augmented Generation) and Agent technologies within the field of GenAI, and he dedicated to proposing innovative GenAI technical solutions tailored to meet diverse business needs.
Charlie Yang is an AWS engineering manager with the OpenSearch Project. He focuses on machine learning, search relevance, and performance optimization.
River Xie is a Gen AI specialist solution architecture at Amazon Web Services. River is interested in Agent/Mutli Agent workflow, Large Language Model inference optimization, and passionate about leveraging cutting-edge Generative AI technologies to develop modern applications that solve complex business challenges.
Ren Guo is a manager of Generative AI Specialist Solution Architect Team for the domains of AIML and Data at AWS, Greater China Region.
According to the Well-Architected DevOps Guidance, “A peer review process for code changes is a strategy for ensuring code quality and shared responsibility. To support separation of duties in a DevOps environment, every change should be reviewed and approved by at least one other person before merging.” Development teams often implement the peer review process in their Software Development Lifecycle (SDLC) by leveraging Pull Requests (PRs). Amazon CodeCatalyst has recently released three new features to facilitate a robust peer review process. Pull Request Approval Rules enforce a minimum number of approvals to ensure multiple peers review a proposed change prior to a progressive deployment. Amazon Q pull request summaries can automatically summarize code changes in a PR, saving time for both the creator and reviewer. Lastly, Nested Comments allows teams to organize conversations and feedback left on a PR to ensure efficient resolution.
This blog will demonstrate how a DevOps lead can leverage new features available in CodeCatalyst to accomplish the following requirements covering best practices: 1. Require at least two people to review every PR prior to deployment, and 2. Reduce the review time to merge (RTTM).
Prerequisites
If you are using CodeCatalyst for the first time, you’ll need the following to follow along with the steps outlined in the blog post:
A Project in a CodeCatalyst Space. If you don’t have one, you can create a new space.
Approval rules can be configured for branches in a repository. When you create a PR whose destination branch has an approval rule configured for it, the requirements for the rule must be met before the PR can be merged.
In this section, you will implement approval rules on the default branch (main in this case) in the application’s repository to implement the new ask from leadership requiring that at least two people review every PR before deployment.
Step 1: Creating the application Pull Request approval rules work with every project but in this blog, we’ll leverage the Modern three-tier web application blueprint for simplicity to implement PR approval rules for merging to the main branch.
Figure 1: Creating a new Modern three-tier application Blueprint
First, within your space click “Create Project” and select the Modern three-tier web application CodeCatalyst Blueprint as shown above in Figure 1.
Enter a Project name and select: Lambda for the Compute Platform and Amplify Hosting for Frontend Hosting Options. Additionally, ensure your AWS account is selected along with creating a new IAM Role.
Finally, click Create Project and a new project will be created based on the Blueprint.
Once the project is successfully created, the application will deploy via a CodeCatalyst workflow, assuming the AWS account and IAM role were setup correctly. The deployed application will be similar to the Mythical Mysfits website.
Step 2: Creating an approval rule
Next, to satisfy the new requirement of ensuring at least two people review every PR before deployment, you will create the approval rule for members when they create a pull request to merge into the main branch.
Navigate to the project you created in the previous step.
In the navigation pane, choose Code, and then choose Source repositories.
Next, choose the mysfits repository that was created as part of the Blueprint.
On the overview page of the repository, choose Branches.
For the main branch, click View under the Approval Rules column.
In Minimum number of approvals, the number corresponds to the number of approvals required before a pull request can be merged to that branch.
Now, you’ll change the approval rule to satisfy the requirement to ensure at least 2 people review every PR. Choose Manage settings. On the settings page for the source repository, in Approval rules, choose Edit.
In Destination Branch, from the drop-down list, choose main as the name of the branch to configure an approval rule. In Minimum number of approvals, enter 2, and then choose Save.
Figure 2: Creating a new approval rule
Note: You must have the Project administrator role to create and manage approval rules in CodeCatalyst projects. You cannot create approval rules for linked repositories.
When implementing approval rules and branch restrictions in your repositories, ensure you take into consideration the following best practices:
For branches deemed critical or important, ensure only highly privileged users are allowed to Push to the Branch and Delete the Branch in the branch rules. This prevents accidental deletion of critical or important branches as well as ensuring any changes introduced to the branch are reviewed before deployment.
Ensure Pull Request approval rules are in place for branches your team considers critical or important. While there is no specific recommended number due to varying team size and project complexity, the minimum number of approvals is recommended to be at least one and research has found the optimal number to be two.
In this section, you walked through the steps to create a new approval rule to satisfy the requirement of ensuring at least two people review every PR before deployment on your CodeCatalyst repository.
Amazon Q pull request summaries
Now, you begin exploring ways that can help development teams reduce MTTR. You begin reading about Amazon Q pull request summaries and how this feature can automatically summarize code changes and start to explore this feature in further detail.
While creating a pull request, in Pull request description, you can leverage the Write description for me feature, as seen in Figure 5 below, to have Amazon Q create a description of the changes contained in the pull request.
Figure 3: Amazon Q write description for me feature
Once the description is generated, you can Accept and add to description, as seen in Figure 6 below. As a best practice, once Amazon Q has generated the initial PR summary, you should incorporate any specific organizational or team requirements into the summary before creating the PR. This allows developers to save time and reduce MTTR in generating the PR summary while ensuring all requirements are met.
Figure 4: PR Summary generated by Amazon Q
CodeCatalyst offers an Amazon Q feature that summarizes pull request comments, enabling developers to quickly grasp key points. When many comments are left by reviewers, it can be difficult to understand common themes in the feedback, or even be sure that you’ve addressed all the comments in all revisions. You can use the Create comment summary feature to have Amazon Q analyze the comments and provide a summary for you, as seen in Figure 5 below.
Figure 5: Comment summary
Nested Comments
When reviewing various PRs for the development teams, you notice that feedback and subsequent conversations often happen within disparate and separate comments. This makes reviewing, understanding and addressing the feedback cumbersome and time consuming for the individual developers. Nested Comments in CodeCatalyst can organize conversations and reduce MTTR.
You’ll leverage the existing project to walkthrough how to use the Nested Comments feature:
Step 1: Creating the PR
Click the mysifts repository, and on the overview page of the repository, choose More, and then choose Create branch.
Edit the file to update the text in the <title> block to Mythical Mysfits new title update! and Commit the changes.
Create a pull request by using test-branch as the Source branch and main as the Destination branch. Your PR should now look similar to Figure 6 below:
Figure 6: Pull Request with updated Title
Step 2: Review PR and add Comments
Review the PR, ensure you are on the Changes tab (similar to Figure 3), click the Comment icon and leave a comment. Normally this would be done by the Reviewer but you will simulate being both the Reviewer and Developer in this walkthrough.
With the comment still open, hit Reply and add another comment as a response to the initial comment. The PR should now look similar to Figure 7 below.
Figure 7: PR with Nested Comments
When leaving comments on PR in CodeCatalyst, ensure you take into consideration the following best practices :
Feedback or conversation focused on a specific topic or piece of code should leverage the nested comments feature. This will ensure the conversation can be easily followed and that context and intent are not lost in a sea of individual comments.
Author of the PR should address all comments by either making updates to the code or replying to the comment. This indicates to the reviewer that each comment was reviewed and addressed accordingly.
Feedback should be constructive in nature on PRs. Research has found that, “destructive criticism had a negative impact on participants’ moods and motivation to continue working.”
Clean-up
As part of following the steps in this blog post, if you upgraded your space to Standard or Enterprise tier, please ensure you downgrade to the Free tier to avoid any unwanted additional charges. Additionally, delete any projects you may have created during this walkthrough.
Conclusion
In today’s fast-paced software development environment, maintaining a high standard for code changes is crucial. With its recently introduced features, including Pull Request Approval Rules, Amazon Q pull request summaries, and nested comments, CodeCatalyst empowers development teams to ensure a robust pull request review process is in place. These features streamline collaboration, automate documentation tasks, and facilitate organized discussions, enabling developers to focus on delivering high-quality code while maximizing productivity. By leveraging these powerful tools, teams can confidently merge code changes into production, knowing that they have undergone rigorous review and meet the necessary standards for reliability and performance.
Amazon Managed Workflows for Apache Airflow (Amazon MWAA) is a managed service for Apache Airflow that allows you to orchestrate data pipelines and workflows at scale. With Amazon MWAA, you can design Directed Acyclic Graphs (DAGs) that describe your workflows without managing the operational burden of scaling the infrastructure. In this post, we provide guidance on how you can optimize performance and save cost by following best practices.
Amazon MWAA environments include four Airflow components hosted on groups of AWS compute resources: the scheduler that schedules the work, the workers that implement the work, the web server that provides the UI, and the metadata database that keeps track of state. For intermittent or varying workloads, optimizing costs while maintaining price and performance is crucial. This post outlines best practices to achieve cost optimization and efficient performance in Amazon MWAA environments, with detailed explanations and examples. It may not be necessary to apply all of these best practices for a given Amazon MWAA workload; you can selectively choose and implement relevant and applicable principles for your specific workloads.
Right-sizing your Amazon MWAA environment
Right-sizing your Amazon MWAA environment makes sure you have an environment that is able to concurrently scale across your different workloads to provide the best price-performance. The environment class you choose for your Amazon MWAA environment determines the size and the number of concurrent tasks supported by the worker nodes. In Amazon MWAA, you can choose from five different environment classes. In this section, we discuss the steps you can follow to right-size your Amazon MWAA environment.
Monitor resource utilization
The first step in right-sizing your Amazon MWAA environment is to monitor the resource utilization of your existing setup. You can monitor the underlying components of your environments using Amazon CloudWatch, which collects raw data and processes data into readable, near real-time metrics. With these environment metrics, you have greater visibility into key performance indicators to help you appropriately size your environments and debug issues with your workflows. Based on the concurrent tasks needed for your workload, you can adjust the environment size as well as the maximum and minimum workers needed. CloudWatch will provide CPU and memory utilization for all the underlying AWS services utilize by Amazon MWAA. Refer to Container, queue, and database metrics for Amazon MWAA for additional details on available metrics for Amazon MWAA. These metrics also include the number of base workers, additional workers, schedulers, and web servers.
Analyze your workload patterns
Next, take a deep dive into your workflow patterns. Examine DAG schedules, task concurrency, and task runtimes. Monitor CPU/memory usage during peak periods. Query CloudWatch metrics and Airflow logs. Identify long-running tasks, bottlenecks, and resource-intensive operations for optimal environment sizing. Understanding the resource demands of your workload will help you make informed decisions about the appropriate Amazon MWAA environment class to use.
Choose the right environment class
Match requirements to Amazon MWAA environment class specifications (mw1.small to mw1.2xlarge) that can handle your workload efficiently. You can vertically scale up or scale down an existing environment through an API, the AWS Command Line Interface (AWS CLI), or the AWS Management Console. Be aware that a change in the environment class requires a scheduled downtime.
Fine tune configuration parameters
Fine-tuning configuration parameters in Apache Airflow is crucial for optimizing workflow performance and cost reductions. It allows you to tune settings such as Auto scaling, parallelism, logging, and DAG code optimizations.
Auto scaling
Amazon MWAA supports worker auto scaling, which automatically adjusts the number of running worker and web server nodes based on your workload demands. You can specify the minimum and maximum number of Airflow workers that run in your environment. For worker node auto scaling, Amazon MWAA uses RunningTasks and QueuedTasks metrics, where (tasks running + tasks queued) / (tasks per worker) = (required workers). If the required number of workers is greater than the current number of running workers, Amazon MWAA will add additional worker instances using AWS Fargate, up to the maximum value specified by the maximum worker configuration.
Auto scaling in Amazon MWAA will gracefully downscale when there are more additional workers than required. For example, let’s assume a large Amazon MWAA environment with a minimum of 1 worker and a maximum of 10, where each large Amazon MWAA worker can support up to 20 tasks. Let’s say, each day at 8:00 AM, DAGs start up that use 190 concurrent tasks. Amazon MWAA will automatically scale to 10 workers, because the required workers = 190 requested tasks (some running, some queued) / 20 (tasks per worker) = 9.5 workers, rounded up to 10. At 10:00 AM, half of the tasks complete, leaving 85 running. Amazon MWAA will then downscale to 6 workers (95 tasks/20 tasks per worker = 5.25 workers, rounded up to 6). Any workers that are still running tasks remain protected during downscaling until they’re complete, and no tasks will be interrupted. As the queued and running tasks decrease, Amazon MWAA will remove workers without affecting running tasks, down to the minimum specified worker count.
Web server auto scaling in Amazon MWAA allows you to automatically scale the number of web servers based on CPU utilization and active connection count. Amazon MWAA makes sure your Airflow environment can seamlessly accommodate increased demand, whether from REST API requests, AWS CLI usage, or more concurrent Airflow UI users. You can specify the maximum and minimum web server count while configuring your Amazon MWAA environment.
Logging and metrics
In this section, we discuss the steps to select and set the appropriate log configurations and CloudWatch metrics.
Choose the right log levels
If enabled, Amazon MWAA will send Airflow logs to CloudWatch. You can view the logs to determine Airflow task delays or workflow errors without the need for additional third-party tools. You need to enable logging to view Airflow DAG processing, tasks, scheduler, web server, and worker logs. You can enable Airflow logs at the INFO, WARNING, ERROR, or CRITICAL level. When you choose a log level, Amazon MWAA sends logs for that level and higher levels of severity. Standard CloudWatch logs charges apply, so reducing log levels where possible can reduce overall costs. Use the most appropriate log level based on environment, such as INFO for dev and UAT, and ERROR for production.
You can choose which Airflow metrics are sent to CloudWatch by using the Amazon MWAA configuration option metrics.statsd_allow_list. Refer to the complete list of available metrics. Some metrics such as schedule_delay and duration_success are published per DAG, whereas others such as ti.finish are published per task per DAG.
Therefore, the cumulative number of DAGs and tasks directly influence your CloudWatch metric ingestion costs. To control CloudWatch costs, choose to publish selective metrics. For example, the following will only publish metrics that start with scheduler and executor:
An effective practice is to utilize regular expression (regex) pattern matching against the entire metric name instead of only matching the prefix at the beginning of the name.
Monitor CloudWatch dashboards and set up alarms
Create a custom dashboard in CloudWatch and add alarms for a particular metric to monitor the health status of your Amazon MWAA environment. Configuring alarms allows you to proactively monitor the health of the environment.
Optimize AWS Secrets Manager invocations
Airflow has a mechanism to store secrets such as variables and connection information. By default, these secrets are stored in the Airflow meta database. Airflow users can optionally configure a centrally managed location for secrets, such as AWS Secrets Manager. When specified, Airflow will first check this alternate secrets backend when a connection or variable is requested. If the alternate backend contains the needed value, it is returned; if not, Airflow will check the meta database for the value and return that instead. One of the factors affecting the cost to use Secrets Manager is the number of API calls made to it.
On the Amazon MWAA console, you can configure the backend Secrets Manager path for the connections and variables that will be used by Airflow. By default, Airflow searches for all connections and variables in the configured backend. To reduce the number of API calls Amazon MWAA makes to Secrets Manager on your behalf, configure it to use a lookup pattern. By specifying a pattern, you narrow the possible paths that Airflow will look at. This will help in lowering your costs when using Secrets Manager with Amazon MWAA.
To use a secrets cache, enable AIRFLOW_SECRETS_USE_CACHE with TTL to help to reduce the Secrets Manager API calls.
For example, if you want to only look up a specific subset of connections, variables, or config in Secrets Manager, set the relevant *_lookup_pattern parameter. This parameter takes a regex as a string as value. To lookup connections starting with m in Secrets Manager, your configuration file should look like the following code:
Schedulers and workers are two components that are involved in parsing the DAG. After the scheduler parses the DAG and places it in a queue, the worker picks up the DAG from the queue. At the point, all the worker knows is the DAG_id and the Python file, along with some other info. The worker has to parse the Python file in order to run the task.
DAG parsing is run twice, once by the scheduler and then by the worker. Because the workers are also parsing the DAG, the amount of time it takes for the code to parse dictates the number of workers needed, which adds cost of running those workers.
For example, for a total of 200 DAGs having 10 tasks each, taking 60 seconds per task to parse, we can calculate the following:
Total tasks across all DAGs = 2,000
Time per task = 60 seconds + 20 seconds (parse DAG)
Total time = 2000 * 80 = 160,000 seconds
Total time per worker = 72,000 seconds
Number of workers needs = Total time/Total time per worker = 160,000/72,000 = ~3
Now, let’s increase the time taken to parse the DAGs to 100 seconds:
Total tasks across all DAGs = 2,000
Time per task = 60 seconds + 100 seconds
Total time = 2,000 *160 = 320,000 seconds
Total time per worker = 72,000 seconds
Number of workers needs = Total time/Total time per worker = 320,000/72,000 = ~5
As you can see, when the DAG parsing time increased from 20 seconds to 100 seconds, the number of worker nodes needed increased from 3 to 5, thereby adding compute cost.
To reduce the time it takes for parsing the code, follow the best practices in the subsequent sections.
Remove top-level imports
Code imports will run every time the DAG is parsed. If you don’t need the libraries being imported to create the DAG objects, move the import to the task level instead of defining it at the top. After it’s defined in the task, the import will be called only when the task is run.
Avoid multiple calls to databases like the meta database or external system database. Variables are used within the DAG that are defined in the meta database or a backend system like Secrets Manager. Use templating (Jinja) wherein calls to populate the variables are only made at task runtime and not at task parsing time.
For example, see the following code:
import pendulum
from airflow import DAG
from airflow.decorators import task
import numpy as np  # <-- DON'T DO THAT!

with DAG(
    dag_id="example_python_operator",
    schedule=None,
    start_date=pendulum.datetime(2021, 1, 1, tz="UTC"),
    catchup=False,
    tags=["example"],
) as dag:

    @task()
    def print_array():
        """Print Numpy array."""
        import numpy as np  # <-- INSTEAD DO THIS!
        a = np.arange(15).reshape(3, 5)
        print(a)
        return a
    print_array()
The following code is another example:
# Bad example
from airflow.models import Variable

foo_var = Variable.get("foo")  # DON'T DO THAT

bash_use_variable_bad_1 = BashOperator(
    task_id="bash_use_variable_bad_1", bash_command="echo variable foo=${foo_env}", env={"foo_env": foo_var}
)

bash_use_variable_bad_2 = BashOperator(
    task_id="bash_use_variable_bad_2",
    bash_command=f"echo variable foo=${Variable.get('foo')}",  # DON'T DO THAT
)

bash_use_variable_bad_3 = BashOperator(
    task_id="bash_use_variable_bad_3",
    bash_command="echo variable foo=${foo_env}",
    env={"foo_env": Variable.get("foo")},  # DON'T DO THAT
)

# Good example
bash_use_variable_good = BashOperator(
    task_id="bash_use_variable_good",
    bash_command="echo variable foo=${foo_env}",
    env={"foo_env": "{{ var.value.get('foo') }}"},
)

@task
def my_task():
    var = Variable.get("foo")  # this is fine, because func my_task called only run task, not scan DAGs.
print(var)
Writing DAGs
Complex DAGs with a large number of tasks and dependencies between them can impact performance of scheduling. One way to keep your Airflow instance performant and well utilized is to simplify and optimize your DAGs.
For example, a DAG that has simple linear structure A → B → C will experience less delays in task scheduling than a DAG that has a deeply nested tree structure with an exponentially growing number of dependent tasks.
Dynamic DAGs
In the following example, a DAG is defined with hardcoded table names from a database. A developer has to define N number of DAGs for N number of tables in a database.
# Bad example
dag_params = getData()
no_of_dags = int(dag_params["no_of_dags"]['N'])
# build a dag for each number in no_of_dags
for n in range(no_of_dags):
    dag_id = 'dynperf_t1_{}'.format(str(n))
default_args = {'owner': 'airflow','start_date': datetime(2022, 2, 2, 12, n)}
To reduce verbose and error-prone work, use dynamic DAGs. The following definition of the DAG is created after querying a database catalog, and creates as many DAGs dynamically as there are tables in the database. This achieves the same objective with less code.
Running all DAGs simultaneously or within a short interval in your environment can result in a higher number of worker nodes required to process the tasks, thereby increasing compute costs. For business scenarios where the workload is not time-sensitive, consider spreading the schedule of DAG runs in a way that maximizes the utilization of available worker resources.
DAG folder parsing
Simpler DAGs are usually only in a single Python file; more complex DAGs might be spread across multiple files and have dependencies that should be shipped with them. You can either do this all inside of the DAG_FOLDER , with a standard filesystem layout, or you can package the DAG and all of its Python files up as a single .zip file. Airflow will look into all the directories and files in the DAG_FOLDER. Using the .airflowignore file specifies which directories or files Airflow should intentionally ignore. This will increase the efficiency of finding a DAG within a directory, improving parsing times.
Deferrable operators
You can run deferrable operators on Amazon MWAA. Deferrable operators have the ability to suspend themselves and free up the worker slot. No tasks in the worker means fewer required worker resources, which can lower the worker cost.
For example, let’s assume you’re using a large number of sensors that wait for something to occur and occupy worker node slots. By making the sensors deferrable and using worker auto scaling improvements to aggressively downscale workers, you will immediately see an impact where fewer worker nodes are needed, saving on worker node costs.
Dynamic Task Mapping
Dynamic Task Mapping allows a way for a workflow to create a number of tasks at runtime based on current data, rather than the DAG author having to know in advance how many tasks would be needed. This is similar to defining your tasks in a for loop, but instead of having the DAG file fetch the data and do that itself, the scheduler can do this based on the output of a previous task. Right before a mapped task is run, the scheduler will create N copies of the task, one for each input.
Stop and start the environment
You can stop and start your Amazon MWAA environment based on your workload requirements, which will result in cost savings. You can perform the action manually or automate stopping and starting Amazon MWAA environments. Refer to Automating stopping and starting Amazon MWAA environments to reduce cost to learn how to automate the stop and start of your Amazon MWAA environment retaining metadata.
Conclusion
In conclusion, implementing performance optimization best practices for Amazon MWAA can significantly reduce overall costs while maintaining optimal performance and reliability. Key strategies include right-sizing environment classes based on CloudWatch metrics, managing logging and monitoring costs, using lookup patterns with Secrets Manager, optimizing DAG code, and selectively stopping and starting environments based on workload demands. Continuously monitoring and adjusting these settings as workloads evolve can maximize your cost-efficiency.
About the Authors
Sriharsh Adari is a Senior Solutions Architect at AWS, where he helps customers work backward from business outcomes to develop innovative solutions on AWS. Over the years, he has helped multiple customers on data platform transformations across industry verticals. His core area of expertise includes technology strategy, data analytics, and data science. In his spare time, he enjoys playing sports, binge-watching TV shows, and playing Tabla.
Retina Satish is a Solutions Architect at AWS, bringing her expertise in data analytics and generative AI. She collaborates with customers to understand business challenges and architect innovative, data-driven solutions using cutting-edge technologies. She is dedicated to delivering secure, scalable, and cost-effective solutions that drive digital transformation.
Jeetendra Vaidya is a Senior Solutions Architect at AWS, bringing his expertise to the realms of AI/ML, serverless, and data analytics domains. He is passionate about assisting customers in architecting secure, scalable, reliable, and cost-effective solutions.
On November 1, 2023, the New York State Department of Financial Services (NYDFS) issued its Second Amendment (the Amendment) to its Cybersecurity Requirements for Financial Services Companies adopted in 2017, published within Section 500 of 23 NYCRR 500 (the Cybersecurity Requirements; the Cybersecurity Requirements as amended by the Amendment, the Amended Cybersecurity Requirements). In the introduction to its Cybersecurity Resource Center, the Department explains that the revisions are aimed at addressing the changes in the increasing sophistication of threat actors, the prevalence of and relative ease in running cyberattacks, and the availability of additional controls to manage cyber risks.
This blog post focuses on the revision to the encryption in transit requirement under section 500.15(a). It outlines the encryption capabilities and secure connectivity options offered by Amazon Web Services (AWS) to help customers demonstrate compliance with this updated requirement. The post also provides best practices guidance, emphasizing the shared responsibility model. This enables organizations to design robust data protection strategies that address not only the updated NYDFS encryption requirements but potentially also other security standards and regulatory requirements.
The target audience for this information includes security leaders, architects, engineers, and security operations team members and risk, compliance, and audit professionals.
Note that the information provided here is for informational purposes only; it is not legal or compliance advice and should not be relied on as legal or compliance advice. Customers are responsible for making their own independent assessments and should obtain appropriate advice from their own legal and compliance advisors regarding compliance with applicable NYDFS regulations.
500.15 Encryption of nonpublic information
The updated requirement in the Amendment states that:
As part of its cybersecurity program, each covered entity shall implement a written policy requiring encryption that meets industry standards, to protect nonpublic information held or transmitted by the covered entity both in transit over external networks and at rest.
To the extent a covered entity determines that encryption of nonpublic information at rest is infeasible, the covered entity may instead secure such nonpublic information using effective alternative compensating controls that have been reviewed and approved by the covered entity’s CISO in writing. The feasibility of encryption and effectiveness of the compensating controls shall be reviewed by the CISO at least annually.
This section of the Amendment removes the covered entity’s chief information security officer’s (CISO) discretion to approve compensating controls when encryption of nonpublic information in transit over external networks is deemed infeasible. The Amendment mandates that, effective November 2024, organizations must encrypt nonpublic information transmitted over external networks without the option of implementing alternative compensating controls. While the use of security best practices such as network segmentation, multi-factor authentication (MFA), and intrusion detection and prevention systems (IDS/IPS) can provide defense in depth, these compensating controls are no longer sufficient to replace encryption in transit over external networks for nonpublic information.
However, the Amendment still allows for the CISO to approve the use of alternative compensating controls where encryption of nonpublic information at rest is deemed infeasible. AWS is committed to providing industry-standard encryption services and capabilities to help protect customer data at rest in the cloud, offering customers the ability to add layers of security to their data at rest, providing scalable and efficient encryption features. This includes the following services:
Flexible key management options, including AWS Key Management Service (AWS KMS), which allow you to choose whether to have AWS manage the encryption keys or keep complete control over your keys.
Dedicated, hardware-based cryptographic key storage using AWS CloudHSM, to help you adhere to compliance requirements
While the above highlights encryption-at-rest capabilities offered by AWS, the focus of this blog post is to provide guidance and best practice recommendations for encryption in transit.
AWS guidance and best practice recommendations
Cloud network traffic encompasses connections to and from the cloud and traffic between cloud service provider (CSP) services. From an organization’s perspective, CSP networks and data centers are deemed external because they aren’t under the organization’s direct control. The connection between the organization and a CSP, typically established over the internet or dedicated links, is considered an external network. Encrypting data in transit over these external networks is crucial and should be an integral part of an organization’s cybersecurity program.
AWS implements multiple mechanisms to help ensure the confidentiality and integrity of customer data during transit and at rest across various points within its environment. While AWS employs transparent encryption at various transit points, we strongly recommend incorporating encryption by design into your architecture. AWS provides robust encryption-in-transit capabilities to help you adhere to compliance requirements and mitigate the risks of unauthorized disclosure and modification of nonpublic information in transit over external networks.
Additionally, AWS recommends that financial services institutions adopt a secure by design (SbD) approach to implement architectures that are pre-tested from a security perspective. SbD helps establish control objectives, security baselines, security configurations, and audit capabilities for workloads running on AWS.
Security and Compliance is a shared responsibility between AWS and the customer. Shared responsibility can vary depending on the security configuration options for each service. You should carefully consider the services you choose because your organization’s responsibilities vary depending on the services used, the integration of those services into your IT environment, and applicable laws and regulations. AWS provides resources such as service user guides and AWS Customer Compliance Guides, which map security best practices for individual services to leading compliance frameworks, including NYDFS.
Protecting connections to and from AWS
We understand that customers place a high priority on privacy and data security. That’s why AWS gives you ownership and control over your data through services that allow you to determine where your content will be stored, secure your content in transit and at rest, and manage access to AWS services and resources for your users. When architecting workloads on AWS, classifying data based on its sensitivity, criticality, and compliance requirements is essential. Proper data classification allows you to implement appropriate security controls and data protection mechanisms, such as Transport Layer Security (TLS) at the application layer, access control measures, and secure network connectivity options for nonpublic information over external networks. When it comes to transmitting nonpublic information over external networks, it’s a recommended practice to identify network segments traversed by this data based on your network architecture. While AWS employs transparent encryption at various transit points, it’s advisable to implement encryption solutions at multiple layers of the OSI model to establish defense in depth and enhance end-to-end encryption capabilities. Although requirement 500.15 of the Amendment doesn’t mandate end-to-end encryption, implementing such controls can provide an added layer of security and can help demonstrate that nonpublic information is consistently encrypted during transit.
AWS offers several options to achieve this. While not every option provides end-to-end encryption on its own, using them in combination helps to ensure that nonpublic information doesn’t traverse open, public networks unprotected. These options include:
Client-side encryption of data before sending it to AWS
AWS Direct Connect with MACsec encryption
AWS Direct Connect provides direct connectivity to the AWS network through third-party colocation facilities, using a cross-connect between an AWS owned device and either a customer- or partner-owned device. Direct Connect can reduce network costs, increase bandwidth throughput, and provide a more consistent network experience than internet-based connections. Within Direct Connect connections (a physical construct) there will be one or more virtual interfaces (VIFs). These are logical entities and are reflected as industry-standard 802.1Q VLANs on the customer equipment terminating the Direct Connect connection. Depending on the type of VIF, they will use either public or private IP addressing. There are three different types of VIFs:
Public virtual interface – Establish connectivity between AWS public endpoints and your data center, office, or colocation environment.
Transit virtual interface – Establish private connectivity between AWS Transit Gateways and your data center, office, or colocation environment. Transit Gateways is an AWS managed high availability and scalability regional network transit hub used to interconnect Amazon Virtual Private Cloud (Amazon VPC) and customer networks.
Private virtual interface – Establish private connectivity between Amazon VPC resources and your data center, office, or colocation environment.
By default, a Direct Connect connection isn’t encrypted from your premises to the Direct Connect location because AWS cannot assume your on-premises device supports the MACsec protocol. With MACsec, Direct Connect delivers native, near line-rate, point-to-point encryption, ensuring that data communications between AWS and your corporate network remain protected. MACsec is supported on 10 Gbps and 100 Gbps dedicated Direct Connect connections at selected points of presence. Using Direct Connect with MACsec-enabled connections and combining it with the transparent physical network encryption offered by AWS from the Direct Connect location through the AWS backbone not only benefits you by allowing you to securely exchange data with AWS, but also enables you to use the highest available bandwidth. For additional information on MACsec support and cipher suites, see the MACsec section in the Direct Connect FAQs.
Figure 1: Sample architecture for using Direct Connect with MACsec encryption
In the sample architecture, you can see that Layer 2 encryption through MACsec only encrypts the traffic from your on-premises systems to the AWS device in the Direct Connect location, and therefore you need to consider additional encryption solutions at Layer 3, 4, or 7 to get closer to end-to-end encryption to the device where you’re comfortable for the packets to be decrypted. In the next section, let’s review an option for using network layer encryption using AWS Site-to-Site VPN.
Direct Connect with Site-to-Site VPN
AWS Site-to-Site VPN is a fully managed service that creates a secure connection between your corporate network and your Amazon VPC using IP security (IPsec) tunnels over the internet. Data transferred between your VPC and the remote network routes over an encrypted VPN connection to help maintain the confidentiality and integrity of data in transit. Each VPN connection consists of two tunnels between a virtual private gateway or transit gateway on the AWS side and a customer gateway on the on-premises side. Each tunnel supports a maximum throughput of up to 1.25 Gbps. See Site-to-Site VPN quotas for more information.
You can use Site-to-Site VPN over Direct Connect to achieve secure IPsec connection with the low latency and consistent network experience of Direct Connect when reaching resources in your Amazon VPCs.
Figure 2: Encrypted connections between the AWS Cloud and a customer’s network using VPN
While Direct Connect with MACsec and Site-to-Site VPN with IPsec can provide encryption at the physical and network layers respectively, they primarily secure the data in transit between your on-premises network and the AWS network boundary. To further enhance the coverage for end-to-end encryption, it is advisable to use TLS encryption. In the next section, let’s review mechanisms for securing API endpoints on AWS using TLS encryption.
Secure API endpoints
APIs act as the front door for applications to access data, business logic, or functionality from other applications and backend services.
While requests to public AWS service API endpoints use HTTPS by default, a few services, such as Amazon S3 and Amazon DynamoDB, allow using either HTTP or HTTPS. If the client or application chooses HTTP, the communication isn’t encrypted. Customers are responsible for enforcing HTTPS connections when using such AWS services. To help ensure secure communication, you can establish an identity perimeter by using the IAM policy condition key aws:SecureTransport in your IAM roles to evaluate the connection and mandate HTTPS usage.
As enterprises increasingly adopt cloud computing and microservices architectures, teams frequently build and manage internal applications exposed as private API endpoints. Customers are responsible for managing the certificates on private customer-owned endpoints. AWS helps you deploy private customer-owned identities (that is, TLS certificates) through the use of AWS Certificate Manager (ACM)private certificate authorities (PCA) and the integration with AWS services that offer private customer-owned TLS termination endpoints.
ACM is a fully managed service that lets you provision, manage, and deploy public and private TLS certificates for use with AWS services and internal connected resources. ACM minimizes the time-consuming manual process of purchasing, uploading, and renewing TLS certificates. You can provide certificates for your integrated AWS services either by issuing them directly using ACM or by importing third-party certificates into the ACM management system. ACM offers two options for deploying managed X.509 certificates. You can choose the best one for your needs.
AWS Certificate Manager (ACM) – This service is for enterprise customers who need a secure web presence using TLS. ACM certificates are deployed through Elastic Load Balancing (ELB), Amazon CloudFront, Amazon API Gateway, and other integrated AWS services. The most common application of this type is a secure public website with significant traffic requirements. ACM also helps to simplify security management by automating the renewal of expiring certificates.
AWS Private Certificate Authority (Private CA) – This service is for enterprise customers building a public key infrastructure (PKI) inside the AWS Cloud and is intended for private use within an organization. With AWS Private CA, you can create your own certificate authority (CA) hierarchy and issue certificates with it for authenticating users, computers, applications, services, servers, and other devices. Certificates issued by a private CA cannot be used on the internet. For more information, see the AWS Private CA User Guide.
You can use a centralized API gateway service, such as Amazon API Gateway, to securely expose customer-owned private API endpoints. API Gateway is a fully managed service that allows developers to create, publish, maintain, monitor, and secure APIs at scale. With API Gateway, you can create RESTful APIs and WebSocket APIs, enabling near real-time, two-way communication applications. API Gateway operations must be encrypted in-transit using TLS, and require the use of HTTPS endpoints. You can use API Gateway to configure custom domains for your APIs using TLS certificates provisioned and managed by ACM. Developers can optionally choose a specific TLS version for their custom domain names. For use cases that require mutual TLS (mTLS) authentication, you can configure certificate-based mTLS authentication on your custom domains.
Pre-encryption of data to be sent to AWS
Depending on the risk profile and sensitivity of the data that’s being transferred to AWS, you might want to choose encrypting data in an application running on your corporate network before sending it to AWS (client-side encryption). AWS offers a variety of SDKs and client-side encryption libraries to help you encrypt and decrypt data in your applications. You can use these libraries with the cryptographic service provider of your choice, including AWS Key Management Service or AWS CloudHSM, but the libraries do not require an AWS service.
The AWS Encryption SDK is a client-side encryption library that you can use to encrypt and decrypt data in your application and is available in several programming languages, including a command-line interface. You can use the SDK to encrypt your data before you send it to an AWS service. The SDK offers advanced data protection features, including envelope encryption and additional authenticated data (AAD). It also offers secure, authenticated, symmetric key algorithm suites, such as 256-bit AES-GCM with key derivation and signing.
The AWS Database Encryption SDK is a set of software libraries developed in open source that enable you to include client-side encryption in your database design. The SDK provides record-level encryption solutions. You specify which fields are encrypted and which fields are included in the signatures that help ensure the authenticity of your data. Encrypting your sensitive data in transit and at rest helps ensure that your plaintext data isn’t available to a third party, including AWS. The AWS Database Encryption SDK for DynamoDB is designed especially for DynamoDB applications. It encrypts the attribute values in each table item using a unique encryption key. It then signs the item to protect it against unauthorized changes, such as adding or deleting attributes or swapping encrypted values. After you create and configure the required components, the SDK transparently encrypts and signs your table items when you add them to a table. It also verifies and decrypts them when you retrieve them. Searchable encryption in the AWS Database Encryption SDK enables you search encrypted records without decrypting the entire database. This is accomplished by using beacons, which create a map between the plaintext value written to a field and the encrypted value that is stored in your database. For more information, see the AWS Database Encryption SDK Developer Guide.
The Amazon S3 Encryption Client is a client-side encryption library that enables you to encrypt an object locally to help ensure its security before passing it to Amazon S3. It integrates seamlessly with the Amazon S3 APIs to provide a straightforward solution for client-side encryption of data before uploading to Amazon S3. After you instantiate the Amazon S3 Encryption Client, your objects are automatically encrypted and decrypted as part of your Amazon S3 PutObject and GetObject requests. Your objects are encrypted with a unique data key. You can use both the Amazon S3 Encryption Client and server-side encryption to encrypt your data. The Amazon S3 Encryption Client is supported in a variety of programming languages and supports industry-standard algorithms for encrypting objects and data keys. For more information, see the Amazon S3 Encryption Client developer guide.
Encryption in-transit inside AWS
AWS implements responsible and sophisticated technical and physical controls that are designed to help prevent unauthorized access to or disclosure of your content. To protect data in transit, traffic traversing through the AWS network that is outside of AWS physical control is transparently encrypted by AWS at the physical layer. This includes traffic between AWS Regions (except China Regions), traffic between Availability Zones, and between Direct Connect locations and Regions through the AWS backbone network.
Network segmentation
When you create an AWS account, AWS offers a virtual networking option to launch resources in a logically isolated virtual private network (VPN), Amazon Virtual Private Cloud (Amazon VPC). A VPC is limited to a single AWS Region and every VPC has one or more subnets. VPCs can be connected externally using an internet gateway (IGW), VPC peering connection, VPN, Direct Connect, or Transit Gateways. Traffic within the your VPC is considered internal because you have complete control over your virtual networking environment, including selection of your own IP address range, creation of subnets, and configuration of route tables and network gateways.
As a customer, you maintain ownership of your data, and you select which AWS services can process, store, and host your data, and you choose the Regions in which your data is stored. AWS doesn’t automatically replicate data across Regions, unless the you choose to do so. Data transmitted over the AWS global network between Regions and Availability Zones is automatically encrypted at the physical layer before leaving AWS secured facilities. Cross-Region traffic that uses Amazon VPC and Transit Gateway peering is automatically bulk-encrypted when it exits a Region.
Encryption between instances
AWS provides secure and private connectivity between Amazon Elastic Compute Cloud (Amazon EC2) instances of all types. The Nitro System is the underlying foundation for modern Amazon EC2 instances. It’s a combination of purpose-built server designs, data processors, system management components, and specialized firmware that provides the underlying foundation for EC2 instances launched since the beginning of 2018. Instance types that use the offload capabilities of the underlying Nitro System hardware automatically encrypt in-transit traffic between instances. This encryption uses Authenticated Encryption with Associated Data (AEAD) algorithms, with 256-bit encryption and has no impact on network performance. To support this additional in-transit traffic encryption between instances, instances must be of supported instance types, in the same Region, and in the same VPC or peered VPCs. For a list of supported instance types and additional requirements, see Encryption in transit.
Conclusion
The second Amendment to the NYDFS Cybersecurity Regulation underscores the criticality of safeguarding nonpublic information during transmission over external networks. By mandating encryption for data in transit and eliminating the option for compensating controls, the Amendment reinforces the need for robust, industry-standard encryption measures to protect the confidentiality and integrity of sensitive information.
AWS provides a comprehensive suite of encryption services and secure connectivity options that enable you to design and implement robust data protection strategies. The transparent encryption mechanisms that AWS has built into services across its global network infrastructure, secure API endpoints with TLS encryption, and services such as Direct Connect with MACsec encryption and Site-to-Site VPN, can help you establish secure, encrypted pathways for transmitting nonpublic information over external networks.
By embracing the principles outlined in this blog post, financial services organizations can address not only the updated NYDFS encryption requirements for section 500.15(a) but can also potentially demonstrate their commitment to data security across other security standards and regulatory requirements.
When you use Amazon OpenSearch Service for time-bound data like server logs, service logs, application logs, clickstreams, or event streams, storage cost is one of the primary drivers for the overall cost of your solution. Over the last year, OpenSearch Service has released features that have opened up new possibilities for storing your log data in various tiers, enabling you to trade off data latency, durability, and availability. In October 2023, OpenSearch Service announced support for im4gn data nodes, with NVMe SSD storage of up to 30 TB. In November 2023, OpenSearch Service introduced or1, the OpenSearch-optimized instance family, which delivers up to 30% price-performance improvement over existing instances in internal benchmarks and uses Amazon Simple Storage Service (Amazon S3) to provide 11 nines of durability. Finally, in May 2024, OpenSearch Service announced general availability for Amazon OpenSearch Service zero-ETL integration with Amazon S3. These new features join OpenSearch’s existing UltraWarm instances, which provide an up to 90% reduction in storage cost per GB, and UltraWarm’s cold storage option, which lets you detach UltraWarm indexes and durably store rarely accessed data in Amazon S3.
This post works through an example to help you understand the trade-offs available in cost, latency, throughput, data durability and availability, retention, and data access, so that you can choose the right deployment to maximize the value of your data and minimize the cost.
Examine your requirements
When designing your logging solution, you need a clear definition of your requirements as a prerequisite to making smart trade-offs. Carefully examine your requirements for latency, durability, availability, and cost. Additionally, consider which data you choose to send to OpenSearch Service, how long you retain data, and how you plan to access that data.
For the purposes of this discussion, we divide OpenSearch instance storage into two classes: ephemeral backed storage and Amazon S3 backed storage. The ephemeral backed storage class includes OpenSearch nodes that use Nonvolatile Memory Express SSDs (NVMe SSDs) and Amazon Elastic Block Store (Amazon EBS) volumes. The Amazon S3 backed storage class includes UltraWarm nodes, UltraWarm cold storage, or1 instances, and Amazon S3 storage you access with the service’s zero-ETL with Amazon S3. When designing your logging solution, consider the following:
Latency – if you need results in milliseconds, then you must use ephemeral backed storage. If seconds or minutes are acceptable, you can lower your cost by using Amazon S3 backed storage.
Throughput – As a general rule, ephemeral backed storage instances will provide higher throughput. Instances that have NVMe SSDs, like the im4gn, generally provide the best throughput, with EBS volumes providing good throughput. or1 instances take advantage of Amazon EBS storage for primary shards while using Amazon S3 with segment replication to reduce the compute cost of replication, thereby offering indexing throughput that can match or even exceed NVMe-based instances.
Data durability – Data stored in the hot tier (you deploy these as data nodes) has the lowest latency, and also the lowest durability. OpenSearch Service provides automated recovery of data in the hot tier through replicas, which provide durability with added cost. Data that OpenSearch stores in Amazon S3 (UltraWarm, UltraWarm cold storage, zero-ETL with Amazon S3, and or1 instances) gets the benefit of 11 nines of durability from Amazon S3.
Data availability – Best practices dictate that you use replicas for data in ephemeral backed storage. When you have at least one replica, you can continue to access all of your data, even during a node failure. However, each replica adds a multiple of cost. If you can tolerate temporary unavailability, you can reduce replicas through or1 instances, with Amazon S3 backed storage.
Retention – Data in all storage tiers incurs cost. The longer you retain data for analysis, the more cumulative cost you incur for each GB of that data. Identify the maximum amount of time you must retain data before it loses all value. In some cases, compliance requirements may restrict your retention window.
Data access – Amazon S3 backed storage instances generally have a much higher storage to compute ratio, providing cost savings but with insufficient compute for high-volume workloads. If you have high query volume or your queries span a large volume of data, ephemeral backed storage is the right choice. Direct query (Amazon S3 backed storage) is perfect for large volume queries for infrequently queried data.
As you consider your requirements along these dimensions, your answers will guide your choices for implementation. To help you make trade-offs, we work through an extended example in the following sections.
OpenSearch Service cost model
To understand how to cost an OpenSearch Service deployment, you need to understand the cost dimensions. OpenSearch Service has two different deployment options: managed clusters and serverless. This post considers managed clusters only, because Amazon OpenSearch Serverless already tiers data and manages storage for you. When you use managed clusters, you configure data nodes, UltraWarm nodes, and cluster manager nodes, selecting Amazon Elastic Compute Cloud (Amazon EC2) instance types for each of these functions. OpenSearch Service deploys and manages these nodes for you, providing OpenSearch and OpenSearch Dashboards through a REST endpoint. You can choose Amazon EBS backed instances or instances with NVMe SSD drives. OpenSearch Service charges an hourly cost for the instances in your managed cluster. If you choose Amazon EBS backed instances, the service will charge you for the storage provisioned, and any provisioned IOPs you configure. If you choose or1 nodes, UltraWarm nodes, or UltraWarm cold storage, OpenSearch Service charges for the Amazon S3 storage consumed. Finally, the service charges for data transferred out.
Example use case
We use an example use case to examine the trade-offs in cost and performance. The cost and sizing of this example are based on best practices, and are directional in nature. Although you can expect to see similar savings, all workloads are unique and your actual costs may vary substantially from what we present in this post.
For our use case, Fizzywig, a fictitious company, is a large soft drink manufacturer. They have many plants for producing their beverages, with copious logging from their manufacturing line. They started out small, with an all-hot deployment and generating 10 GB of logs daily. Today, that has grown to 3 TB of log data daily, and management is mandating a reduction in cost. Fizzywig uses their log data for event debugging and analysis, as well as historical analysis over one year of log data. Let’s compute the cost of storing and using that data in OpenSearch Service.
Ephemeral backed storage deployments
Fizzywig’s current deployment is 189 r6g.12xlarge.search data nodes (no UltraWarm tier), with ephemeral backed storage. When you index data in OpenSearch Service, OpenSearch builds and stores index data structures that are usually about 10% larger than the source data, and you need to leave 25% free storage space for operating overhead. Three TB of daily source data will use 4.125 TB of storage for the first (primary) copy, including overhead. Fizzywig follows best practices, using two replica copies for maximum data durability and availability, with the OpenSearch Service Multi-AZ with Standby option, increasing the storage need to 12.375 TB per day. To store 1 year of data, multiply by 365 days to get 4.5 PB of storage needed.
To provision this much storage, they could also choose im4gn.16xlarge.search instances, or or1.16.xlarge.search instances. The following table gives the instance counts for each of these instance types, and with one, two, or three copies of the data.
.
Max Storage (GB) per Node
Primary
(1 Copy)
Primary + Replica
(2 Copies)
Primary + 2 Replicas
(3 Copies)
im4gn.16xlarge.search
30,000
52
104
156
or1.16xlarge.search
36,000
42
84
126
r6g.12xlarge.search
24,000
63
126
189
The preceding table and the following discussion are strictly based on storage needs. or1 instances and im4gn instances both provide higher throughput than r6g instances, which will reduce cost further. The amount of compute saved varies between 10–40% depending on the workload and the instance type. These savings do not pass straight through to the bottom line; they require scaling and modification of the index and shard strategy to fully realize them. The preceding table and subsequent calculations take the general assumption that these deployments are over-provisioned on compute, and are storage-bound. You would see more savings for or1 and im4gn, compared with r6g, if you had to scale higher for compute.
The following table represents the total cluster costs for the three different instance types across the three different data storage sizes specified. These are based on on-demand US East (N. Virginia) AWS Region costs and include instance hours, Amazon S3 cost for the or1 instances, and Amazon EBS storage costs for the or1 and r6g instances.
.
Primary
(1 Copy)
Primary + Replica
(2 Copies)
Primary + 2 Replicas
(3 Copies)
im4gn.16xlarge.search
$3,977,145
$7,954,290
$11,931,435
or1.16xlarge.search
$4,691,952
$9,354,996
$14,018,041
r6g.12xlarge.search
$4,420,585
$8,841,170
$13,261,755
This table gives you the one-copy, two-copy, and three-copy costs (including Amazon S3 and Amazon EBS costs, where applicable) for this 4.5 PB workload. For this post, “one copy” refers to the first copy of your data, with the replication factor set to zero. “Two copies” includes a replica copy of all of the data, and “three copies” includes a primary and two replicas. As you can see, each replica adds a multiple of cost to the solution. Of course, each replica adds availability and durability to the data. With one copy (primary only), you would lose data in the case of a single node outage (with an exception for or1 instances). With one replica, you might lose some or all data in a two-node outage. With two replicas, you could lose data only in a three-node outage.
The or1 instances are an exception to this rule. or1 instances can support a one-copy deployment. These instances use Amazon S3 as a backing store, writing all index data to Amazon S3, as a means of replication, and for durability. Because all acknowledged writes are persisted in Amazon S3, you can run with a single copy, but with the risk of losing availability of your data in case of a node outage. If a data node becomes unavailable, any impacted indexes will be unavailable (red) during the recovery window (usually 10–20 minutes). Carefully evaluate whether you can tolerate this unavailability with your customers as well as your system (for example, your ingestion pipeline buffer). If so, you can drop your cost from $14 million to $4.7 million based on the one-copy (primary) column illustrated in the preceding table.
Reserved Instances
OpenSearch Service supports Reserved Instances (RIs), with 1-year and 3-year terms, with no up-front cost (NURI), partial up-front cost (PURI), or all up-front cost (AURI). All reserved instance commitments lower cost, with 3-year, all up-front RIs providing the deepest discount. Applying a 3-year AURI discount, annual costs for Fizzywig’s workload gives costs as shown in the following table.
.
Primary
Primary + Replica
Primary + 2 Replicas
im4gn.16xlarge.search
$1,909,076
$3,818,152
$5,727,228
or1.16xlarge.search
$3,413,371
$6,826,742
$10,240,113
r6g.12xlarge.search
$3,268,074
$6,536,148
$9,804,222
RIs provide a straightforward way to save cost, with no code or architecture changes. Adopting RIs for this workload brings the im4gn cost for three copies down to $5.7 million, and the one-copy cost for or1 instances down to $3.2 million.
Amazon S3 backed storage deployments
The preceding deployments are useful as a baseline and for comparison. In actuality, you would choose one of the Amazon S3 backed storage options to keep costs manageable.
OpenSearch Service UltraWarm instances store all data in Amazon S3, using UltraWarm nodes as a hot cache on top of this full dataset. UltraWarm works best for interactive querying of data in small time-bound slices, such as running multiple queries against 1 day of data from 6 months ago. Evaluate your access patterns carefully and consider whether UltraWarm’s cache-like behavior will serve you well. UltraWarm first-query latency scales with the amount of data you need to query.
When designing an OpenSearch Service domain for UltraWarm, you need to decide on your hot retention window and your warm retention window. Most OpenSearch Service customers use a hot retention window that varies between 7–14 days, with warm retention making up the rest of the full retention period. For our Fizzywig scenario, we use 14 days hot retention and 351 days of UltraWarm retention. We also use a two-copy (primary and one replica) deployment in the hot tier.
The 14-day, hot storage need (based on a daily ingestion rate of 4.125 TB) is 115.5 TB. You can deploy six instances of any of the three instance types to support this indexing and storage. UltraWarm stores a single replica in Amazon S3, and doesn’t need additional storage overhead, making your 351-day storage need 1.158 PiB. You can support this with 58 UltraWarm1.large.search instances. The following table gives the total cost for this deployment, with 3-year AURIs for the hot tier. The or1 instances’ Amazon S3 cost is rolled into the S3 column.
.
Hot
UltraWarm
S3
Total
im4gn.16xlarge.search
$220,278
$1,361,654
$333,590
$1,915,523
or1.16xlarge.search
$337,696
$1,361,654
$418,136
$2,117,487
r6g.12xlarge.search
$270,410
$1,361,654
$333,590
$1,965,655
You can further reduce the cost by moving data to UltraWarm cold storage. Cold storage reduces cost by reducing availability of the data—to query the data, you must issue an API call to reattach the target indexes to the UltraWarm tier. A typical pattern for 1 year of data keeps 14 days hot, 76 days in UltraWarm, and 275 days in cold storage. Following this pattern, you use 6 hot nodes and 13 UltraWarm1.large.search nodes. The following table illustrates the cost to run Fizzywig’s 3 TB daily workload. The or1 cost for Amazon S3 usage is rolled into the UltraWarm nodes + S3 column.
.
Hot
UltraWarm nodes + S3
Cold
Total
im4gn.16xlarge.search
$220,278
$377,429
$261,360
$859,067
or1.16xlarge.search
$337,696
$461,975
$261,360
$1,061,031
r6g.12xlarge.search
$270,410
$377,429
$261,360
$909,199
By employing Amazon S3 backed storage options, you’re able to reduce cost even further, with a single-copy or1 deployment at $337,000, and a maximum of $1 million annually with or1 instances.
OpenSearch Service zero-ETL for Amazon S3
When you use OpenSearch Service zero-ETL for Amazon S3, you keep all your secondary and older data in Amazon S3. Secondary data is the higher-volume data that has lower value for direct inspection, such as VPC Flow Logs and WAF logs. For these deployments, you keep the majority of infrequently queried data in Amazon S3, and only the most recent data in your hot tier. In some cases, you sample your secondary data, keeping a percentage in the hot tier as well. Fizzywig decides that they want to have 7 days of all of their data in the hot tier. They will access the rest with direct query (DQ).
When you use direct query, you can store your data in JSON, Parquet, and CSV formats. Parquet format is optimal for direct query and provides about 75% compression on the data. Fizzywig is using Amazon OpenSearch Ingestion, which can write Parquet format data directly to Amazon S3. Their 3 TB of daily source data compresses to 750 GB of daily Parquet data. OpenSearch Service maintains a pool of compute units for direct query. You are billed hourly for these OpenSearch Compute Units (OCUs), scaling based on the amount of data you access. For this conversation, we assume that Fizzywig will have some debugging sessions and run 50 queries daily over one day worth of data (750 GB). The following table summarizes the annual cost to run Fizzywig’s 3 TB daily workload, 7 days hot, 358 days in Amazon S3.
.
Hot
DQ Cost
OR1 S3
Raw Data S3
Total
im4gn.16xlarge.search
$220,278
$2,195
$0
$65,772
$288,245
or1.16xlarge.search
$337,696
$2,195
$84,546
$65,772
$490,209
r6g.12xlarge.search
$270,410
$2,195
$0
$65,772
$338,377
That’s quite a journey! Fizzywig’s cost for logging has come down from as high as $14 million annually to as low as $288,000 annually using direct query with zero-ETL from Amazon S3. That’s a savings of 4,800%!
Sampling and compression
In this post, we have looked at one data footprint to let you focus on data size, and the trade-offs you can make depending on how you want to access that data. OpenSearch has additional features that can further change the economics by reducing the amount of data you store.
For logs workloads, you can employ OpenSearch Ingestion sampling to reduce the size of data you send to OpenSearch Service. Sampling is appropriate when your data as a whole has statistical characteristics where a part can be representative of the whole. For example, if you’re running an observability workload, you can often send as little as 10% of your data to get a representative sampling of the traces of request handling in your system.
You can further employ a compression algorithm for your workloads. OpenSearch Service recently released support for Zstandard (zstd) compression that can bring higher compression rates and lower decompression latencies as compared to the default, best compression.
Conclusion
With OpenSearch Service, Fizzywig was able to balance cost, latency, throughput, durability and availability, data retention, and preferred access patterns. They were able to save 4,800% for their logging solution, and management was thrilled.
Across the board, im4gn comes out with the lowest absolute dollar amounts. However, there are a couple of caveats. First, or1 instances can provide higher throughput, especially for write-intensive workloads. This may mean additional savings through reduced need for compute. Additionally, with or1’s added durability, you can maintain availability and durability with lower replication, and therefore lower cost. Another factor to consider is RAM; the r6g instances provide additional RAM, which speeds up queries for lower latency. When coupled with UltraWarm, and with different hot/warm/cold ratios, r6g instances can also be an excellent choice.
Do you have a high-volume, logging workload? Have you benefitted from some or all of these methods? Let us know!
About the Author
Jon Handler is a Senior Principal Solutions Architect at Amazon Web Services based in Palo Alto, CA. Jon works closely with OpenSearch and Amazon OpenSearch Service, providing help and guidance to a broad range of customers who have vector, search, and log analytics workloads that they want to move to the AWS Cloud. Prior to joining AWS, Jon’s career as a software developer included 4 years of coding a large-scale, ecommerce search engine. Jon holds a Bachelor’s of the Arts from the University of Pennsylvania, and a Master’s of Science and a PhD in Computer Science and Artificial Intelligence from Northwestern University.
AWS offers regulated customers tools, guidance and third-party audit reports to help meet compliance requirements. Regulated industry customers often require a service-by-service approval process when adopting cloud services to make sure that each adopted service aligns with their regulatory obligations and risk tolerance. How financial institutions can approve AWS services for highly confidential data walks through the key considerations that customers should focus on to help streamline the approval of cloud services. In this post we cover how regulated customers, especially FSI customers, can approach secrets management on Amazon Elastic Kubernetes Service (Amazon EKS) to help meet data protection and operational security requirements. Amazon EKS gives you the flexibility to start, run, and scale Kubernetes applications in the AWS Cloud or on-premises.
Applications often require sensitive information such as passwords, API keys, and tokens to connect to external services or systems. Kubernetes has secrets objects for managing these types of sensitive information. Additional tools and approaches have evolved to supplement the Kubernetes Secrets to help meet the compliance requirements of regulated organizations. One of the driving forces behind the evolution of these tools for regulated customers is that the native Kubernetes Secrets values aren’t encrypted but encoded as base64 strings; meaning that their values can be decoded by a threat actor with either API access or authorization to create a pod in a namespace containing the secret. There are options such as GoDaddy Kubernetes External Secrets, AWS Secrets and Configuration Provider (ASCP) for the Kubernetes Secrets Store CSI Driver, Hashicorp Vault, and Bitnami Sealed secrets that you can use to can help to improve the security, management, and audibility of your secrets usage.
Security and compliance is a shared responsibility between AWS and the customer. The AWS Shared Responsibility Model describes this as security of the cloud and security in the cloud:
AWS responsibility – Security of the cloud: AWS is responsible for protecting the infrastructure that runs the services offered in the AWS Cloud. For Amazon EKS, AWS is responsible for the Kubernetes control plane, which includes the control plane nodes and etcd database. Amazon EKS is certified by multiple compliance programs for regulated and sensitive applications. The effectiveness of the security controls are regularly tested and verified by third-party auditors as part of the AWS compliance programs.
Customer responsibility – Security in the cloud: Customers are responsible for the security and compliance of customer configured systems and services deployed on AWS. This includes responsibility for securely deploying, configuring and managing ESO within their Amazon EKS cluster. For Amazon EKS, the customer responsibility depends upon the worker nodes you pick to run your workloads and cluster configuration as shown in Figure 1. In the case of Amazon EKS deployment using Amazon Elastic Compute Cloud (Amazon EC2) hosts, the customer responsibility includes the following areas:
The security configuration of the data plane, including the configuration of the security groups that allow traffic to pass from the Amazon EKS control plane into the customer virtual private cloud (VPC).
The configuration of the nodes and the containers themselves.
The nodes’ operating system, including updates and security patches.
Other associated application software:
Setting up and managing network controls, such as firewall rules.
The sensitivity of your data, such as personally identifiable information (PII), keys, passwords, and tokens
Customers are responsible for enforcing access controls to protect their data and secrets.
Customers are responsible for monitoring and logging activities related to secrets management including auditing access, detecting anomalies and responding to security incidents.
Your company’s requirements, applicable laws and regulations
When using AWS Fargate, the operational overhead for customers is reduced in the following areas:
The customer is not responsible for updating or patching the host system.
Fargate manages the placement and scaling of containers.
Figure 1: AWS Shared Responsibility Model with Fargate and Amazon EC2 based workflows
As an example of the Shared Responsibility Model in action, consider a typical FSI workload accepting or processing payments cards and subject to PCI DSS requirements. PCI DSS v4.0 requirement 3 focuses on guidelines to secure cardholder data while at rest and in transit:
Control ID
Control description
3.6
Cryptographic keys used to protect stored account data are secured.
3.6.1.2
Store secret and private keys used to encrypt and decrypt cardholder data in one (or more) of the following forms:
Encrypted with a key-encrypting key that is at least as strong as the data-encrypting key, and that is stored separately from the data-encrypting key.
Stored within a secure cryptographic device (SCD), such as a hardware security module (HSM) or PTS-approved point-of-interaction device.
Has at least two full-length key components or key shares, in accordance with an industry-accepted method. Note: It is not required that public keys be stored in one of these forms.
3.6.1.3
Access to cleartext cryptographic key components is restricted to the fewest number of custodians necessary.
NIST frameworks and controls are also broadly adopted by FSI customers. NIST Cyber Security Framework (NIST CSF) and NIST SP 800-53 (Security and Privacy Controls for Information Systems and Organizations) include the following controls that apply to secrets:
Regulation or framework
Control ID
Control description
NIST CSF
PR.AC-1
Identities and credentials are issued, managed, verified, revoked, and audited for authorized devices, users and processes.
NIST CSF
PR.DS-1
Data-at-rest is protected.
NIST 800-53.r5
AC-2(1) AC-3(15)
Secrets should have automatic rotation enabled. Delete unused secrets.
Based on the preceding objectives, the management of secrets can be categorized into two broad areas:
Identity and access management ensures separation of duties and least privileged access.
Strong encryption, using a dedicated cryptographic device, introduces a secure boundary between the secrets data and keys, while maintaining appropriate management over the cryptographic keys.
Choosing your secrets management provider
To help choose a secrets management provider and apply compensating controls effectively, in this section we evaluate three different options based on the key objectives derived from the PCI DSS and NIST controls described above and other considerations such as operational overhead, high availability, resiliency, and developer or operator experience.
Architecture and workflow
The following architecture and component descriptions highlight the different architectural approaches and responsibilities of each solution’s components, ranging from controllers and operators, command-line interface (CLI) tools, custom resources, and CSI drivers working together to facilitate secure secrets management within Kubernetes environments.
External Secrets Operator (ESO) extends the Kubernetes API using a custom resource definition (CRD) for secret retrieval. ESO enables integration with external secrets management systems such as AWS Secrets Manager, HashiCorp Vault, Google Secrets Manager, Azure Key Vault, IBM Cloud Secrets Manager, and various other systems. ESO watches for changes to an external secret store and keeps Kubernetes secrets in sync. These services offer features that aren’t available with native Kubernetes Secrets, such as fine-grained access controls, strong encryption, and automatic rotation of secrets. By using these purpose-built tools outside of a Kubernetes cluster, you can better manage risk and benefit from central management of secrets across multiple Amazon EKS clusters. For more information, see the detailed walkthrough of using ESO to synchronize secrets from Secrets Manager to your Amazon EKS Fargate cluster.
ESO is comprised of a cluster-side controller that automatically reconciles the state within the Kubernetes cluster and updates the related secrets anytime the external API’s secret undergoes a change.
Figure 2: ESO workflow
Sealed Secrets is an open source project by Bitnami comprised of a Kubernetes controller coupled with a client-side CLI tool with the objective to store secrets in Git in a secure fashion. Sealed Secrets encrypts your Kubernetes secret into a SealedSecret, which can also be deployed to a Kubernetes cluster using kubectl. For more information, see the detailed walkthough of using tools from the Sealed Secrets open source project to manage secrets in your Amazon EKS clusters.
Sealed Secrets comprises of three main components: First, there is an operator or a controller which is deployed onto a Kubernetes cluster. The controller is responsible for decrypting your secrets. Second, you have a CLI tool called Kubeseal that takes your secret and encrypts it. Third, you have a CRD. Instead of creating regular secrets, you create SealedSecrets, which is a CRD defined within Kubernetes. That is how the operator knows when to perform the decryption process within your Kubernetes cluster.
Upon startup, the controller looks for a cluster-wide private-public key pair and generates a new 4096-bit RSA public-private key pair if one doesn’t exist. The private key is persisted in a secret object in the same namespace as the controller. The public key portion of this is made publicly available to anyone wanting to use Sealed Secrets with this cluster.
Figure 3: Sealed Secrets workflow
The AWS Secrets Manager and Config Provider (ASCP) for Secret Store CSI driver is an open source tool from AWS that allows secrets from Secrets Manager and Parameter Store, a capability of AWS Systems Manager, to be mounted as files inside Amazon EKS pods. It uses a CRD called SecretProviderClass to specify which secrets or parameters to mount. Upon a pod start or restart, the CSI driver retrieves the secrets or parameters from AWS and writes them to a tmpfs volume mounted in the pod. The volume is automatically cleaned up when the pod is deleted, making sure that secrets aren’t persisted. For more information, see the detailed walkthrough on how to set up and configure the ASCP to work with Amazon EKS.
ASCP comprises of a cluster-side controller acting as the provider, allowing secrets from Secrets Manager, and parameters from Parameter Store to appear as files mounted in Kubernetes pods. Secrets Store CSI Driver is a DaemonSet with three containers: node-driver-registrar, which registers the CSI driver with Kubelet; secrets-store, which implements the CSI Node service gRPC services for mounting and unmounting volumes during pod creation and deletion; and liveness-probe, which monitors the health of the CSI driver and reports to Kubernetes for automatic issue detection and pod restart.
Figure 4: AWS Secrets Manager and configuration provider
In the next section, we cover some of the key decisions involved in choosing whether to use ESO, Sealed Secrets, or ASCP for regulated customers to help meet their regulatory and compliance needs.
Comparing ESO, Sealed Secrets, and ASCP objectives
All three solutions address different aspects of secure secrets management and aim to help FSI customers meet their regulatory compliance requirements while upholding the protection of sensitive data in Kubernetes environments.
ESO synchronizes secrets from external APIs into Kubernetes, targeting the cluster operator and application developer personas. The cluster operator is responsible for setting up ESO and managing access policies. The application developer is responsible for defining external secrets and the application configuration.
Sealed Secrets encrypts your Kubernetes secrets before storing them in version control systems such as public Git repositories. This is the case if you decide to check in your Kubernetes manifest to a Git repository granting access to your sensitive secrets to anyone who has access to the Git repository. This is ultimately the reason why Sealed Secrets was created and the sealed secret can be decrypted only by the controller running in the target cluster.
Using ASCP, you can securely store and manage your secrets in Secrets Manager and retrieve them through your applications running on Kubernetes without having to write custom code. Secrets Manager provides features such as rotation, auditing, and access control that can help FSI customers meet regulatory compliance requirements and maintain a robust security posture.
Installation
The deployment and configuration details that follow highlight the different approaches and resources used by each solution to integrate with Kubernetes and external secret stores, catering to the specific requirements of secure secrets management in containerized environments.
ESO provides Helm charts for ease of operator deployment. External Secrets provides custom resources like SecretStore and ExternalSecret for configuring the required operator functionality to synchronize external secrets to your cluster. For instance, SecretStore can be used by the cluster operator to be able to connect to AWS Secrets Manager using appropriate credentials to pull in the secrets.
To install Sealed Secrets, you can deploy the Sealed Secrets Controller onto the Kubernetes cluster. You can deploy the manifest by itself or you can use a Helm chart to deploy the Sealed Secrets Controller for you. After the controller is installed, you use the Kubeseal client-side utility to encrypt secrets using asymmetric cryptography. If you don’t already have the Kubeseal CLI installed, see the installation instructions.
ASCP provides Helm charts to assist in operator deployment. The ASCP operator provides custom resources such as SecretProviderClass to provide provider-specific parameters to the CSI driver. During pod start and restart, the CSI driver will communicate with the provider using gRPC to retrieve the secret content from the external secret store you specified in the SecretProviderClass custom resource. Then the volume is mounted in the pod as tmpfs and the secret contents are written to the volume.
Encryption and key management
These solutions use robust encryption mechanisms and key management practices provided by external secret stores and AWS services such as AWS Key Management Service (AWS KMS) and Secrets Manager. However, additional considerations and configurations might be required to meet specific regulatory requirements, such as PCI DSS compliance for handling sensitive data.
ESO relies on encryption features within the external secrets management system. For instance, Secrets Manager supports envelope encryption with AWS KMS which is FIPS 140-2 Level 3 certified. Secrets Manager has several compliance certifications making it a great fit for regulated workloads. FIPS 140-2 Level 3 ensures only strong encryption algorithms approved by NIST can be used to protect data. It also defines security requirements for the cryptographic module, creating logical and physical boundaries.
Both AWS KMS and Secrets Manager help you to manage key lifecycle and to integrate with other AWS Services. In terms of key rotation, both provide automatic rotation of secrets that runs on a schedule (which you define), and abstract the complexity of managing different versions of keys. For AWS managed keys, the key rotation happens automatically once every year by default. With customer managed keys (CMKs), automatic key rotation is available but not enabled by default.
When using SealedSecrets, you use the Kubeseal tool to convert a standard Kubernetes Secret into a Sealed Secrets resource. The contents of the Sealed Secrets are encrypted with the public key served by the Sealed Secrets Controller as described in the Sealed Secrets project homepage.
In the absence of cloud native secrets management integration, you might have to add compensating controls to achieve the regulatory standards required by your organization. In cases where the underlying SealedSecrets data is sensitive in nature, such as cardholder PII, PCI requires that you store sensitive secrets in a cryptographic device such as a hardware security module (HSM). You can use Secrets Manager to store the master key generated to seal the secrets. However, this you will have to enable additional integration with Amazon EKS APIs to fetch the master key securely from the EKS cluster. You will also have to modify your deployment process to use a master key from Secrets Manager. The applications running in the EKS cluster must have permissions to fetch the SealedSecret and master key from Secrets Manager. This might involve configuring the application to interact with Amazon EKS APIs and Secrets Manager. For non-sensitive data, Kubeseal can be used directly within the EKS cluster to manage secrets and sealing keys.
For key rotation, you can store the controller generated private key in Parameter Store as a SecureString. You can use the advanced tier in Parameter Store if the file containing the private keys exceeds the Standard tier limit of up to 4,096 characters. In addition, if you want to add key rotation, you can use AWS KMS.
The ASCP relies on encryption features within the chosen secret store, such as Secrets Manager. Secrets Manager supports integration with AWS KMS for an additional layer of security by storing encryption keys separately. The Secrets Store CSI Driver facilitates secure interaction with the secret store, but doesn’t directly encrypt secrets. Encrypting mounted content can provide further protection, but introduces operational overhead related to key management.
ASCP relies on Secrets Manager and AWS KMS for encryption and decryption capabilities. As a recommendation, you can encrypt mounted content to further protect the secrets. However, this introduces the additional operational overhead of managing encryption keys and addressing key rotation.
Additional considerations
These solutions address various aspects of secure secrets management, ranging from centralized management, compliance, high availability, performance, developer experience, and integration with existing investments, catering to the specific needs of FSI customers in their Kubernetes environments.
ESO can be particularly useful when you need to manage an identical set of secrets across multiple Kubernetes clusters. Instead of configuring, managing, and rotating secrets at each cluster level individually, you can synchronize your secrets across your clusters. This simplifies secrets management by providing a single interface to manage secrets across multiple clusters and environments.
External secrets management systems typically offer advanced security features such as encryption at rest, access controls, audit logs, and integration with identity providers. This helps FSI customers ensure that sensitive information is stored and managed securely in accordance with regulatory requirements.
FSI customers usually have existing investments in their on-premises or cloud infrastructure, including secrets management solutions. ESO integrates seamlessly with existing secrets management systems and infrastructure, allowing FSI customers to use their investment in these systems without requiring significant changes to their workflow or tooling. This makes it easier for FSI customers to adopt and integrate ESO into their existing Kubernetes environments.
ESO provides capabilities for enforcing policies and governance controls around secrets management such as access control, rotation policies, and audit logging when using services like Secrets Manager. For FSI customers, audits and compliance are critical and ESO verifies that access to secrets is tracked and audit trails are maintained, thereby simplifying the process of demonstrating adherence to regulatory standards. For instance, secrets stored inside Secrets Manager can be audited for compliance with AWS Config and AWS Audit Manager. Additionally, ESO uses role-based access control (RBAC) to help prevent unauthorized access to Kubernetes secrets as documented in the ESO security best practices guide.
High availability and resilience are critical considerations for mission critical FSI applications such as online banking, payment processing, and trading services. By using external secrets management systems designed for high availability and disaster recovery, ESO helps FSI customers ensure secrets are available and accessible in the event of infrastructure failure or outages, thereby minimizing service disruption and downtime.
FSI workloads often experience spikes in transaction volumes, especially during peak days or hours. ESO is designed to efficiently managed a large volume of secrets by using external secrets management that’s optimized for performance and scalability.
In terms of monitoring, ESO provides Prometheus metrics to enable fine-grained monitoring of access to secrets. Amazon EKS pods offer diverse methods to grant access to secrets present on external secrets management solutions. For example, in non-production environments, access can be granted through IAM instance profiles assigned to the Amazon EKS worker nodes. For production, using IAM roles for service accounts (IRSA) is recommended. Furthermore, you can achieve namespace level fine-grained access control by using annotations.
ESO also provides options to configure operators to use a VPC endpoint to comply with FIPS requirements.
Additional developer productivity benefits provided by ESO include support for JSON objects (Secret key/value in the AWS Management console) or strings (Plaintext in the console). With JSON objects, developers can programmatically update multiple values atomically when rotating a client certificate and private key.
The benefit of Sealed Secrets, as discussed previously, is when you upload your manifest to a Git repository. The manifest will contain the encrypted SealedSecrets and not the regular secrets. This assures that no one has access to your sensitive secrets even when they have access to your Git repository. Sealed Secrets offer a few benefits to developers in terms of developer experience. Sealed Secrets gives you access to manage your secrets, making them more readily available to developers. Sealed Secrets offers VSCode extension to assist in integrating it into the software development lifecycle (SDLC). Using Sealed Secrets, you can store the encrypted secrets in the version control systems such as Gitlab and GitHub. Sealed Secrets can reduce operational overhead related to updating dependent objects because whenever a secret resource is updated, the same update is applied to the dependent objects.
ASCP integration with the Kubernetes Secrets Store CSI Driver on Amazon EKS offers enhanced security through seamless integration with Secrets Manager and Parameter Store, ensuring encryption, access control, and auditing. It centralizes management of sensitive data, simplifying operations and reducing the risk of exposure. The dynamic secrets injection capability facilitates secure retrieval and injection of secrets into Kubernetes pods, while automatic rotation provides up-to-date credentials without manual intervention. This combined solution streamlines deployment and management, providing a secure, scalable, and efficient approach to handling secrets and configuration settings in Kubernetes applications.
Consolidated threat model
We created a threat model based on the architecture of the three solution offerings. The threat model provides a comprehensive view of the potential threats and corresponding mitigations for each solution, allowing organizations to proactively address security risks and ensure the secure management of secrets in their Kubernetes environments.
X = Mitigations applicable to the solution
Threat
Mitigations
ESO
Sealed Secrets
ASCP
Unauthorized access or modification of secrets
Implement least privilege access principles
Rotate and manage credentials securely
Enable RBAC and auditing in Kubernetes
X
X
X
Insider threat (for example, a rogue administrator who has legitimate access)
Implement least privilege access principles
Enable auditing and monitoring
Enforce separation of duties and job rotation
X
X
Compromise of the deployment process
Secure and harden the deployment pipeline
Implement secure coding practices
Enable auditing and monitoring
X
Unauthorized access or tampering of secrets during transit
Enable encryption in transit using TLS
Implement mutual TLS authentication between components
Use private networking or VPN for secure communication
X
X
X
Compromise of the Kubernetes API server because of vulnerabilities or misconfiguration
Secure and harden the Kubernetes API server
Enable authentication and authorization mechanisms (for example, mutual TLS and RBAC)
Keep Kubernetes components up-to-date and patched
Enable Kubernetes audit logging and monitoring
X
Vulnerability in the external secrets controller leading to privilege escalation or data exposure
Keep the external secrets controller up-to-date and patched
Regularly monitor for and apply security updates
Implement least privilege access principles
Enable auditing and monitoring
X
Compromise of the Secrets Store CSI Driver, node-driver-registrar, Secrets Store CSI Provider, kubelet, or Pod could lead to unauthorized access or exposure of secrets
Implement least privilege principles and role-based access controls
Regularly patch and update the components
Monitor and audit the component activities
X
Unauthorized access or data breach in Secrets Manager could expose sensitive secrets
Implement strong access controls and access logging for Secrets Manager
Encrypt secrets at rest and in transit
Regularly rotate and update secrets
X
X
Shortcomings and limitations
The following limitations and drawbacks highlight the importance of carefully evaluating the specific requirements and constraints of your organization before adopting any of these solutions. You should consider factors such as team expertise, deployment environments, integration needs, and compliance requirements to promote a secure and efficient secrets management solution that aligns with your organization’s needs.
ESO doesn’t include a default way to restrict network traffic to and from ESO using network policies or similar network or firewall mechanisms. The application team is responsible for properly configuring network policies to improve the overall security posture of ESO within your Kubernetes cluster.
Any time an external secret associated with ESO is rotated, you must restart the deployment that uses that particular external secret. Given the inherent risks associated with integrating an external entity or third-party solution into your system, including ESO, it’s crucial to implement a comprehensive threat model similar to the Kubernetes Admission Control Threat Model.
Also, ESO set up is complicated and the controller must be installed on the Kubernetes cluster.
SealedSecrets cannot be reused across namespaces unless they’re re-encrypted or made cluster-wide, which makes it challenging to manage secrets across multiple namespaces consistently. The need to manually rotate and re-encrypt SealedSecrets with new keys can introduce operational overhead, especially in large-scale environments with numerous secrets. The old sealing keys pose a potential risk of misuse by unauthorized users, which increases the risk. To mitigate both risks (high overhead and old secrets), you should implement additional controls such as deleting older keys as part of the key rotation process or periodically rotate sealing keys and make sure that old sealed secret resources are re-encrypted with the new keys. Sealed Secrets doesn’t support external secret stores such as HashiCorp Vault, or cloud provider services such as Secrets Manager, Parameter Store, or Azure Key Vault. Sealed Secrets requires a Kubeseal client-side binary to encrypt secrets. This can be a concern in FSI environments where client-side tools are restricted by security policies.
While ASCP provides seamless integration with Secrets Manager and Parameter Store, teams unfamiliar with these AWS services might need to invest some additional effort to fully realize the benefits. This additional effort is justified by the long-term benefits of centralized secrets management and access control provided by these services. Additionally, relying primarily on AWS services for secrets management can potentially limit flexibility in deploying to alternative cloud providers or on-premises environments in the future. These factors should be carefully evaluated based on the specific needs and constraints of the application and deployment environment.
Conclusion
We have provided a summary of three options for managing secrets in Amazon EKS, ESO, Sealed Secrets, and AWS Secrets and Configuration Provider (ASCP), and the key considerations for FSI customers when choosing between them. The choice depends on several factors including existing investments in secrets management systems, specific security needs and compliance requirements, preference for a Kubernetes native solution or willingness to accept vendor lock-in.
The guidance provided here covers the strengths, limitations, and trade-offs of each option, allowing regulated institutions to make an informed decision based on their unique requirements and constraints. This guidance can be adapted and tailored to fit the specific needs of an organization, providing a secure and efficient secrets management solution for their Amazon EKS workloads, while aligning with the stringent security and compliance standards of the regulated institutions.
If you have feedback about this post, submit comments in the Comments section below. If you have questions about this post, contact AWS Support.
Customers use Amazon Web Services (AWS) to securely build, deploy, and scale their applications. As your organization grows, you want to streamline permissions management towards least privilege for your identities and resources. At AWS, we see two customer personas working towards least privilege permissions: security teams and developers. Security teams want to centrally inspect permissions across their organizations to identify and remediate access-related risks, such as excessive permissions, anomalous access to resources or compliance of identities. Developers want policy verification tools that help them set effective permissions and maintain least privilege as they build their applications.
Customers are increasingly turning to cloud infrastructure entitlement management (CIEM) solutions to guide their permissions management strategies. CIEM solutions are designed to identify, manage, and mitigate risks associated with access privileges granted to identities and resources in cloud environments. While the specific pillars of CIEM vary, four fundamental capabilities are widely recognized: rightsizing permissions, detecting anomalies, visualization, and compliance reporting. AWS provides these capabilities through services such as AWS Identity and Access Management (IAM) Access Analyzer, Amazon GuardDuty, Amazon Detective, AWS Audit Manager, and AWS Security Hub. I explore these services in this blog post.
Rightsizing permissions
Customers primarily explore CIEM solutions to rightsize their existing permissions by identifying and remediating identities with excessive permissions that pose potential security risks. In AWS, IAM Access Analyzer is a powerful tool designed to assist you in achieving this goal. IAM Access Analyzer guides you to set, verify, and refine permissions.
After IAM Access Analyzer is set up, it continuously monitors AWS Identity and Access Management (IAM) users and roles within your organization and offers granular visibility into overly permissive identities. This empowers your security team to centrally review and identify instances of unused access, enabling them to take proactive measures to refine access and mitigate risks.
While most CIEM solutions prioritize tools for security teams, it’s essential to also help developers make sure that their policies adhere to security best practices before deployment. IAM Access Analyzer provides developers with policy validation and custom policy checks to make sure their policies are functional and secure. Now, they can use policy recommendations to refine unused access, making sure that identities have only the permissions required for their intended functions.
Anomaly detection
Security teams use anomaly detection capabilities to identify unexpected events, observations, or activities that deviate from the baseline behavior of an identity. In AWS, Amazon GuardDuty supports anomaly detection in an identity’s usage patterns, such as unusual sign-in attempts, unauthorized access attempts, or suspicious API calls made using compromised credentials.
By using machine learning and threat intelligence, GuardDuty can establish baselines for normal behavior and flag deviations that might indicate potential threats or compromised identities. When establishing CIEM capabilities, your security team can use GuardDuty to identify threat and anomalous behavior pertaining to their identities.
Visualization
With visualization, you have two goals. The first is to centrally inspect the security posture of identities, and the second is to comprehensively understand how identities are connected to various resources within your AWS environment. IAM Access Analyzer provides a dashboard to centrally review identities. The dashboard helps security teams gain visibility into the effective use of permissions at scale and identify top accounts that need attention. By reviewing the dashboard, you can pinpoint areas that need focus by analyzing accounts with the highest number of findings and the most commonly occurring issues such as unused roles.
Amazon Detective helps you to visually review individual identities in AWS. When GuardDuty identifies a threat, Detective generates a visual representation of identities and their relationships with resources, such as Amazon Elastic Compute Cloud (Amazon EC2) instances, Amazon Simple Storage Service (Amazon S3) buckets, or AWS Lambda functions. This graphical view provides a clear understanding of the access patterns associated with each identity. Detective visualizes access patterns, highlighting unusual or anomalous activities related to identities. This can include unauthorized access attempts, suspicious API calls, or unexpected resource interactions. You can depend on Detective to generate a visual representation of the relationship between identities and resources.
Compliance reporting
Security teams work with auditors to assess whether identities, resources, and permissions adhere to the organization’s compliance requirements. AWS Audit Manager automates evidence collection to help you meet compliance reporting and audit needs. These automated evidence packages include reporting on identities. Specifically, you can use Audit Manager to analyze IAM policies and roles to identify potential misconfigurations, excessive permissions, or deviations from best practices.
Audit Manager provides detailed compliance reports that highlight non-compliant identities or access controls, allowing your auditors and security teams to take corrective actions and support ongoing adherence to regulatory and organizational standards. In addition to monitoring and reporting, Audit Manager offers guidance to remediate certain types of non-compliant identities or access controls, reducing the burden on security teams and supporting timely resolution of identified issues.
Single pane of glass
While customers appreciate the diverse capabilities AWS offers across various services, they also seek a unified and consolidated view that brings together data from these different sources. AWS Security Hub addresses this need by providing a single pane of glass that enables you to gain a holistic understanding of your security posture. Security Hub acts as a centralized hub, consuming findings from multiple AWS services and presenting a comprehensive view of how identities are being managed and used across the organization.
Conclusion
CIEM solutions are designed to identify, manage, and mitigate risks associated with access privileges granted to identities and resources in cloud environments. The AWS services mentioned in this post can help you achieve your CIEM goals. If you want to explore CIEM capabilities in AWS, use the services mentioned in this post or see the following resources.
Writing clear and concise Git commit messages is crucial for effective version control and collaboration. However, when working with complex projects or codebases, providing additional context can be challenging. In this blog post, we’ll explore how to leverage Amazon Q Developer to analyze our code changes for us and produce meaningful commit messages for Git.
Amazon Q is the most capable generative AI-powered assistant for accelerating software development and leveraging companies’ internal data. It assists developers and IT professionals with all their tasks—from coding, testing, and upgrading applications, to diagnosing errors, performing security scanning and fixes, and optimizing AWS resources. Amazon Q Developer has advanced, multistep planning and reasoning capabilities that can transform (for example, perform Java version upgrades) and implement new features generated from developer requests. Q Developer is available in the IDE, the AWS Console, and on the command line interface (CLI).
Overview of solution
With the Amazon Q Developer CLI, you can engage in natural language conversations, ask questions, and receive responses from Amazon Q Developer, all from your terminal’s command-line interface. One of the powerful features of the Amazon Q Developer CLI is its ability to integrate contextual information from your local development environment. A context modifier in the Amazon Q CLI is a special keyword that allows you to provide additional context to Amazon Q from your local development environment. This context helps Amazon Q better understand the specific use case you’re working on and provide more relevant and accurate responses.
The Amazon Q CLI supports three context modifiers:
@git: This modifier allows you to share your Git repository status with Amazon Q, including the current branch, staged and unstaged changes, and commit history.
@env: By using this modifier, you can provide Amazon Q with your local shell environment variables, which can be helpful for understanding your development setup and configuration.
@history: This modifier enables you to share your recent shell command history with Amazon Q, giving it insights into your actions and the context in which you’re working
By using these context modifiers, you can enhance Amazon Q’s understanding of your specific use case, enabling it to provide more relevant and context-aware responses tailored to your local development environment.
Now let’s dive deeper into how we can use the @git context modifier to craft better Git commit messages. By incorporating the @git context modifier, you can provide additional details about the changes made to your Git repository, such as the affected files, branches, and other Git-related metadata. This not only improves code comprehension but also facilitates better collaboration within your team. We’ll walk through practical examples and best practices, equipping you with the knowledge to take your Git commit messages to the next level using the @git context modifier.
Prerequisites
For this walkthrough, you should have the following prerequisites:
A code base versioned with git
Amazon Q Developer CLI (OSX only): Install the Amazon Q Developer CLI by following the instructions provided in the Amazon Q Developer documentation. This may involve downloading and installing a package or using a package manager like pip or npm.
Amazon Q Developer Subscription: Subscribe to the Amazon Q Developer service. This can be done through the AWS Management Console or by following the instructions in the Amazon Q Developer documentation.
Walkthrough
Open a terminal and navigate to the directory that contains your git project
From within your project directory, run the git status command to view which files have been modified or added since your last commit. Any untracked files (new files) will appear in red, and modified files will be shown in green.
Figure 1 – git status execution from within your project director
Use the git add command to stage the files you want to commit. For example, git add app.py requirements.txt perm_policies/explicit_dependencies_stack.py will stage the specific files, or git add . will add all modified and untracked files in the current directory recursively.
After staging your files, use the q chat command to generate commit message using the @git context modifier. From within the Q Developer Chat context, attach @git to the end of your prompt to engage the context modifier.
Figure 2 – Amazon Q chat interaction using @git context modifier to generate a commit message
Copy the generated commit message and exit Amazon Q Developer chat
Commit your changes using `git commit”
Paste your commit message in default editor to create a new commit with the staged changes.
Figure 3 – paste copied git commit message
Finally, use `git push` to upload your local commits to the remote repository, allowing others to access your changes.
Conclusion
In this post, we looked at how to maximize your productivity by using Amazon Q Developer. Using the @git context modifier in Amazon Q Developer CLI enables you to enrich your Git commit messages with relevant details about the changes made to your codebase. Clear and informative commit messages are essential for effective collaboration and code maintenance. By leveraging this powerful feature, you can provide valuable context, such as affected files, branches, and other Git metadata, making it easier for team members to understand the scope and purpose of each commit.
To continue improving your software lifecycle management (SLCM) you can also check out other Amazon Q Developer capabilities, such as code analysis, debugging, and refactoring suggestions. Finally, stay tuned for upcoming Amazon Q Developer features and enhancements that could further streamline your development processes. Learn more and get started with the Amazon Q Developer Free Tier.
“Be yourself; everyone else is already taken.” -Oscar Wilde
In the real world as in the world of technology and authentication, the ability to understand who we are is important on many levels. In this blog post, we’ll look at how the ability to uniquely identify ourselves in the AWS console can lead to a better overall experience, particularly when using Amazon Q Developer. We explore the features that become available to us when Q Developer can uniquely identify our sessions in the console and match them with our subscriptions and resources. We’ll look at how we can accomplish this goal using identity-aware sessions, a capability now available with AWS IAM Identity Center. Finally, we’ll walk through the steps necessary to enable it in your AWS Organization today.
Amazon Q Developer is a generative AI-powered assistant for software development. Accessible from multiple contexts including the IDE, the command line, and the AWS Management Console, the service offers two different pricing tiers: free and Pro. In this post, we’ll explore how to use Q Developer Pro in the AWS Console with identity-aware sessions. We’ll also explore the recently introduced ability to chat about AWS account resources within the Q Developer Chat window in the AWS Console to inquire about resources in an AWS account when identity-aware sessions are enabled.
Connecting your corporate source of identities to IAM Identity Center creates a shared record of your workforce and users’ group associations. This allows AWS applications to interact with one another efficiently on behalf of your users because they all reference this shared record of attributes. As a result, users have a consistent, continuous experience across AWS applications. Once your source of identities is connected to IAM Identity Center, your identity provider administrator can decide which users and groups will be synchronized with Identity Center. Your Amazon Q Developer administrator sees these synchronized users and groups only within Amazon Q Developer and can assign Q Developer Pro subscriptions to them.
User Identity in the AWS Console
To access the AWS Console, you must first obtain an IAM session – most commonly by using Identity Center Access Portal, IAM federation, or IAM (or root) users. Users can also use IAM Identity Center or a third party federated login mechanism. In this post, we’ll be using Microsoft Entra ID, but many other providers are available. Of all these options, however, only logging in with IAM Identity Center provides us with enough context to uniquely identity the user automatically by default. Identity-aware sessions will make this work.
Figure 1: Logging into an AWS account via the IAM Identity Center enables Q Developer to match the user with an active Pro subscription.
To meet customers where they are and allow them to build on their existing configurations, IAM Identity Center includes a mechanism that allows users to obtain an identity-aware session to access Q in the Console, regardless of how they originally logged in to the Console.
Let’s look at a real-world example to explore how this might work. Let’s assume our organization is currently using Microsoft Entra ID alongside AWS Organizations to federate our users into AWS accounts. This grants them access to the AWS console for accounts in our AWS Organization and enables our users to be assigned IAM roles and permissions. While secure, this access method does not allow Q Developer to easily associate the user with their Entra ID identity and to match them to a Q Developer subscription.
Figure 2: Using Entra ID, the user is federated into the AWS account and assumes an IAM role without further context in the console. Q Developer can obtain that context by authenticating the user with identity-aware sessions. This process is first attempted manually before prompting the user for credentials
To provide identity-aware sessions to these users, we can enable IAM Identity Center for the Organization and integrate it with our Entra ID instance. This allows us to sync our users and groups from Entra ID and assign them to subscriptions in our AWS Applications such as Amazon Q Developer.
We then go one step further and enable identity-aware sessions for our Identity Center instance. Identity-aware sessions allow Amazon Q to access user’s unique identifier in Identity Center so that it can then look up a user’s subscription and chat history. When the user opens the Console Chat, Q Developer checks whether the current IAM session already includes a valid identity-aware context. If this context is not available, Q will then verify the account is part of an Organization and has an IAM Identity Center instance with identity-aware sessions enabled. If so, it will prompt the user to authenticate with IAM Identity Center. Otherwise, the chat will throw an error.
With a valid Q Developer Pro subscription now verified, the user’s interactions with the Q Chat window will include personalization such as access to prior chat history, the ability to chat about AWS account resources, and higher request limits for multiple capabilities included with Q Developer Pro. This will persist with the user for the duration of their AWS Console session.
Configuring Identity-Aware Sessions
Identity-aware sessions are only available for instances of IAM Identity Center deployed at the AWS Organization level. (Account-level instances of IAM Identity Center do not support this feature). Once IAM Identity Center is configured, the option to enable Identity-aware sessions needs to be manually selected. (NOTE: This is a one-way door option which, once enabled, cannot be disabled. For more information about prerequisites and considerations for this feature, you can review the documentation here.)
To begin, verify that you have enabled AWS Organizations across your accounts. Once you have completed this, you are ready to enable IAM Identity Center and enable identity-aware sessions. The steps below should be completed by a member of your infrastructure administration team.
For customers who already have an Organization-based instance of IAM Identity Center configured, skip to Step 4 below. For those organizations who would like to read more about IAM Identity Center before completing the following steps, you can find details in the documentation available here.
Walkthrough
From within the management account or security account configured in your AWS Configuration, access the AWS Console and navigate to the AWS IAM Identity Center in the region where you wish to deploy your organization’s Identity Center instance.
Choose the “Enable” option where you will be presented with an option to setup Identity Center at the Organization level or as a single account instance. Choose the “Enable with AWS Organizations” to have access to identity-aware sessions.
After Identity Center has been enabled, navigate to the “Settings” page from the left-hand navigation menu. Note that under the “Details” section, the “Identity-aware sessions” option is currently marked as “Disabled”.
Choose the “Enable” option from the Details section or select it from the blue prompt below the Details section.
Choose “Enable” from the popup box that appears to confirm your choice.
Once IAM Identity Center is enabled and Identity-aware sessions are enabled, you can then proceed by either creating a user manually in Identity Center to log in with, or by connecting your Identity Center instance to a third-party provider like Entra ID, Ping, or Okta. For more information on how to complete this process, please see the documentation for the various third-party providers available.
If you don’t have Q Developer enabled, you will want to do so now. From within the AWS Console, using the search bar navigate to the Amazon Q Developer service. As a best practice, we recommend configuring Q Developer in your management account.
Begin by clicking the “Subscribe to Amazon Q” button to enable Q Developer in your account. You will see a green check denoting that Q has successfully been paired with IAM Identity Center.
Choose “Subscribe” to enable Q Developer Pro.
Enable Q Developer Pro in the popup prompt
From here, you can then assign users and groups from the Q Developer prompt or you may assign them from within the IAM Identity Center using the Amazon Q Application Profile.
Once your users and groups have been assigned, they are now able to begin using Q Developer in both the AWS account console and their individual IDE’s.
Why Use Q Developer Pro?
In this final section, we’ll explore the benefits of using Amazon Q Developer Pro. There are three main areas of benefit:
Chat History
Q Developer Pro can store your chat history and restore it from previous sessions each time you begin. This enables you to develop a context within the chat about things that are relevant to your interests and in turn inform the feedback you receive from Q going forward.
Chat about your AWS account resources
Q Developer Pro can leverage your IAM permissions to make requests regarding resources and costs associated with your account (assuming you have the appropriate policies). This enables you to inquire about certain resources deployed in a given region, or ask questions about cost such as the overall EC2 spend in a given period of time.
Figure 4: From the Q Chat panel, you can inquire about resources deployed in your account. (This capability requires you to have the necessary permissions to view information about the requested resource.)
Personalization
Identity-aware sessions also enable you to benefit from custom settings in your Q Chat. For example, you can enable cross-region access for your Q Chat sessions which enable you to ask questions about resources in the current region but also all other regions in your account.
Conclusion
As a new feature of IAM Identity Center, identity-aware sessions enable an AWS Console user to access their Q Developer Pro subscription in the Q Chat panel. This provides them with richer conversations with Q Developer about their accounts and maintains those conversations over time with stored chat history. Enabling this feature involves no additional cost and only a single setting change in a configured IAM Identity Center organization instance. Once made, users will be able to benefit from the full feature set of Amazon Q Developer regardless of how they log into the account.
Amazon OpenSearch Service securely unlocks real-time search, monitoring, and analysis of business and operational data for use cases like application monitoring, log analytics, observability, and website search.
While actively writing to an index, we recommend that you keep one replica. However, you can switch to zero replicas after a rollover and the index is no longer being actively written.
This can be done safely because the data is persisted in Amazon S3 for durability.
Note that in case of a node failure and replacement, your data will be automatically restored from Amazon S3, but would be partially unavailable during the repair operation, so you should not consider it for cases where searches on non-actively written indices require high availability.
Goal
In this blog post, we’ll explore how OR1 impacts the performance of OpenSearch workloads.
By providing segment replication, OR1 instances save CPU cycles by indexing only on the primary shards. By doing that, the nodes are able to index more data with the same amount of compute, or to use fewer resources for indexing and thus have more available for search and other operations.
For this post, we’re going to consider an indexing-heavy workload and do some performance testing.
Traditionally, Amazon Elastic Compute Cloud (Amazon EC2) R6g instances are a high performant choice for indexing-heavy workloads, relying on Amazon EBS storage. Im4gn instances provide local NVMe SSD for high throughput and low latency disk writes.
We will compare OR1 indexing performance relative to these two instance types, focusing on indexing performance only for scope of this blog.
Setup
For our performance testing, we set up multiple components, as shown in the following figure:
For the testing process:
AWS Step Functions orchestrates an initialization step to clean up the environment and set up the index mapping and to run the batch testing.
AWS Batch runs parallel jobs to index log data in OpenTelemetry JSON format.
The OpenSearch Service domain is set up with OpenSearch 2.11, two availability zones, fine-grained access control, encryption at rest using AWS Key Management Service (AWS KMS), and encryption in transit using TLS.
The index mapping, which is part of our initialization step, is as follows:
As you can see, we’re using a data stream to simplify the rollover configuration and keep the maximum primary shard size under 50 GiB, as per best practices.
We optimized the mapping to avoid any unnecessary indexing activity and use the flat_object field type to avoid field mapping explosion.
Our average document size is 1.6 KiB and the bulk size is 4,000 documents per bulk, which makes approximately 6.26 MiB per bulk (uncompressed).
Testing protocol
The protocol parameters are as follows:
Number of data nodes: 6 or 12
Jobs parallelism: 75, 40
Primary shard count: 12, 48, 96 (for 12 nodes)
Number of replicas: 1 (total of 2 copies)
Instance types (each with 16 vCPUs):
or1.4xlarge.search
r6g.4xlarge.search
im4gn.4xlarge.search
Cluster
Instance type
vCPU
RAM
JVM size
or1-target
or1.4xlarge.search
16
128
32
im4gn-target
im4gn.4xlarge.search
16
64
32
r6g-target
r6g.4xlarge.search
16
128
32
Note that the im4gn cluster has half the memory of the other two, but still each environment has the same JVM heap size of approximately 32 GiB.
Performance testing results
For the performance testing, we started with 75 parallel jobs and 750 batches of 4,000 documents per client (a total 225 million documents). We then adjusted the number of shards, data nodes, replicas, and jobs.
Configuration 1: 6 data nodes, 12 primary shards, 1 replica
For this configuration, we used 6 data nodes, 12 primary shards, and 1 replica, we observed the following performance:
Cluster
CPU usage
Time taken
Indexing speed
or1-target
65-80%
24 min
156 kdoc/s
243 MiB/s
im4gn-target
89-97%
34 min
110 kdoc/s
172 MiB/s
r6g-target
88-95%
34 min
110 kdoc/s
172 MiB/s
Highlighted in this table, im4gn and r6g clusters have very high CPU usage, triggering admission control, which rejects document.
The OR1 shows a CPU below 80 percent sustained, which is a very good target.
Things to keep in mind:
In production, don’t forget to retry indexing with exponential backoff to avoid dropping unindexed documents because of intermittent rejections.
The bulk indexing operation returns 200 OK but can have partial failures. The body of the response must be checked to validate that all the documents were indexed successfully.
By reducing the number of parallel jobs from 75 to 40, while maintaining 750 batches of 4,000 documents per client (total 120M documents), we get the following:
Cluster
CPU usage
Time taken
Indexing speed
or1-target
25-60%
20 min
100 kdoc/s
156 MiB/s
im4gn-target
75-93%
19 min
105 kdoc/s
164 MiB/s
r6g-target
77-90%
20 min
100 kdoc/s
156 MiB/s
The throughput and CPU usage decreased, but the CPU remains high on Im4gn and R6g, while the OR1 is showing more CPU capacity to spare.
Configuration 2: 6 data nodes, 48 primary shards, 1 replica
For this configuration, we increased the number of primary shards from 12 to 48, which provides more parallelism for indexing:
Cluster
CPU usage
Time taken
Indexing speed
or1-target
60-80%
21 min
178 kdoc/s
278 MiB/s
im4gn-target
67-95%
34 min
110 kdoc/s
172 MiB/s
r6g-target
70-88%
37 min
101 kdoc/s
158 MiB/s
The indexing throughput increased for the OR1, but the Im4gn and R6g didn’t see an improvement because their CPU utilization is still very high.
Reducing the parallel jobs to 40 and keeping 48 primary shards, we can see that the OR1 gets a little more pressure as the minimum CPU increases from 12 primary shards, and the CPU for R6g looks much better. For the Im4gn however, the CPU is still high.
Cluster
CPU usage
Time taken
Indexing speed
or1-target
40-60%
16 min
125 kdoc/s
195 MiB/s
im4gn-target
80-94%
18 min
111 kdoc/s
173 MiB/s
r6g-target
70-80%
21 min
95 kdoc/s
148 MiB/s
Configuration 3: 12 data nodes, 96 primary shards, 1 replica
For this configuration, we started with the original configuration and added more compute capacity, moving from 6 nodes to 12 and increasing the number of primary shards to 96.
Cluster
CPU usage
Time taken
Indexing speed
or1-target
40-60%
18 min
208 kdoc/s
325 MiB/s
im4gn-target
74-90%
20 min
187 kdoc/s
293 MiB/s
r6g-target
60-78%
24 min
156 kdoc/s
244 MiB/s
The OR1 and the R6g are performing well with CPU usage below 80 percent, with OR1 giving 33 percent better performance with 30 percent less CPU usage compared to R6g.
The Im4gn is still at 90 percent CPU, but the performance is also very good.
Reducing the number of parallel jobs from 75 to 40, we get:
Cluster
CPU usage
Time taken
Indexing speed
or1-target
40-60%
11 min
182 kdoc/s
284 MiB/s
im4gn-target
70-90%
11 min
182 kdoc/s
284 MiB/s
r6g-target
60-77%
12 min
167 kdoc/s
260 MiB/s
Reducing the number of parallel jobs to 40 from 75 brought the OR1 and Im4gn instances on par and the R6g very close.
Interpretation
The OR1 instances speed up indexing because only the primary shards need to be written while the replica is produced by copying segments. While being more performant compared to Img4n and R6g instances, the CPU usage is also lower, which gives room for additional load (search) or cluster size reduction.
We can compare a 6-node OR1 cluster with 48 primary shards, indexing at 178 thousand documents per second, to a 12-node Im4gn cluster with 96 primary shards, indexing at 187 thousand documents per second or to a 12-node R6g cluster with 96 primary shards, indexing at 156 thousand documents per second.
The OR1 performs almost as well as the larger Im4gn cluster, and better than the larger R6g cluster.
How to size when using OR1 instances
As you can see in the results, OR1 instances can process more data at higher throughput rates. However, when increasing the number of primary shards, they don’t perform as well because of the remote backed storage.
To get the best throughput from the OR1 instance type, you can use larger batch sizes than usual, and use an Index State Management (ISM) policy to roll over your index based on size so that you can effectively limit the number of primary shards per index. You can also increase the number of connections because the OR1 instance type can handle more parallelism.
For search, OR1 doesn’t directly impact the search performance. However, as you can see, the CPU usage is lower on OR1 instances than on Im4gn and R6g instances. That enables either more activity (search and ingest), or the possibility to reduce the instance size or count, which would result in a cost reduction.
Conclusion and recommendations for OR1
The new OR1 instance type gives you more indexing power than the other instance types. This is important for indexing-heavy workloads, where you index in batch every day or have a high sustained throughput.
The OR1 instance type also enables cost reduction because their price for performance is 30 percent better than existing instance types. When adding more than one replica, price for performance will decrease because the CPU is barely impacted on an OR1 instance, while other instance types would have indexing throughput decrease.
Check out the complete instructions for optimizing your workload for indexing using this repost article.
About the author
Cédric Pelvet is a Principal AWS Specialist Solutions Architect. He helps customers design scalable solutions for real-time data and search workloads. In his free time, his activities are learning new languages and practicing the violin.
This post is written by Tyler Jones, Senior Solutions Architect – Graviton, AWS.
Performance tuning the Renaissance Finagle-http benchmark
Sometimes software doesn’t perform the way it’s expected to across different systems. This can be due to a configuration error, code bug, or differences in hardware performance. Amazon APerf is a powerful tool designed to help identify and address performance issues on AWS instances and other computers. APerf captures comprehensive system metrics simultaneously and then visualizes them in an interactive report. The report allows users to analyze metrics such as CPU usage, interrupts, memory usage, and CPU core performance counters (PMU) together. APerf is particularly useful for performance tuning workloads across different instance types, as it can generate side-by-side reports for easy comparison. APerf is valuable for developers, system administrators, and performance engineers who need to optimize application performance on AWS. From here on we use the Renaissance benchmark as an example to demonstrate how APerf is used to debug and find performance bottlenecks.
The example
The Renaissance finagle-http benchmark was unexpectedly found to run 50% slower on a c7g.16xl Graviton3 than on a reference instance, both initially using the Linux-5.15.60 kernel. This is unexpected behavior.Graviton3 should be performing as good or better than our reference instance as it does for other Java based workloads. It’s likely there is a configuration problem somewhere. The Renaissancefinagle-http benchmark is written in Scala but produces Java byte code, so our investigation will focus on the Java JVM as well as system-level configurations.
Overview
System performance tuning is an iterative process that is conducted in two main phases, the first focuses on overall system issues, and the second focuses on CPU core bottlenecks. APerf is used to assist in both phases.
APerf can render several instances’ data in one report, side by side, typically a reference system and the system to be tuned. The reference system provides values to compare against. In isolation, metrics are harder to evaluate. A metric may be acceptable in general but the comparison to the reference system makes it easier to spot room for improvement.
APerf helps to identify unusual system behavior, such as high interrupt load, excessive I/O wait, unusual network layer patterns, and other such issues in the first phase. After adjustments are made to address these issues, for example by modifying JVM flags, the second phase starts. Using the system tuning of the first phase, fresh APerf data is collected and evaluated with a focus on CPU core performance metrics.
Any inferior metric of the SUT CPU core, as compared to the reference system, holds potential for improvement. In the following section we discuss the two phases in detail. For more background on system tuning, refer to the Performance Runbook in the AWS Graviton Getting Started guide.
Initial data collection
Here is an example for how 240 seconds of system data is collected with APerf:
#enable PMU access
echo 0 | sudo tee /proc/sys/kernel/perf_event_paranoid
#APerf has to open more than the default limit of files.
ulimit -n 65536
#usually aperf would be run in another terminal.
#For illustration purposes it is send to the background here
./aperf record --run-name finagle_1 --period 240 &
#With 64 CPUs it takes APerf a little less than 15s to report readiness
#for data collection.
sleep 15
java -jar renaissance-gpl-0.14.2.jar -r 8 finagle-http
The APerf report is generated as follows:
./aperf report --run finagle_1
Then, the report can be viewed with a web browser:
firefox aperf_report_finagle_1/index.html
The APerf report can render several data sets in the same report, side-by-side.
Note that it is crucial to examine the CPU usage over time shown in APerf. Some data may be gathered while the system is idle. The metrics during idle times have no significant value.
First phase: system level
In this phase we look for differences on the system level. To do this APerf collects data during runs of finagle-http on c7g.16xl and the reference. The reference system provides the target numbers to compare against. Any large difference warrants closer inspection.
The first differences can be seen in the following figure.
The APerf CPU usage plot shows larger drops on Graviton3 (highlighted in red) at the beginning of each run than on the reference instance.
Figure 1: CPU usage. c7g.16xl on the left, reference on the right.
The log messages about the GC runtime hint at a possible reason as they coincide with the dips in CPU usage.
The JVM tends to spend a significant amount of time in garbage collection, during which time it has to suspend all threads, and choosing a different GC may have a positive impact.
The default GC on OpenJDK17 is G1GC. Using parallelGC is an alternative given that the instances have 64 CPUs, and thus GC can be performed highly parallel. The Graviton Getting Started guide also recommends checking the GC log when working on Java performance issues. A cross check using the JVM’s -Xlog:gc option confirms the reduced GC time with parallelGC.
The second difference is evident in the following figure, the CPU-to-CPU interrupts (IPI). There is more than 10x higher activity on Graviton 3, which means additional IRQ work c7g.16xl on which the reference system does not have to spend CPU cycles.
Figure 2: IPI0/RES Interrupts. c7g.16xl on the left, reference on the right.
Grepping through kernel commit messages can help find patches that address a particular issue, such as IPI inefficiencies.
This scheduling patch improves performance by 19%. Another IPI patch provides an additional 1% improvement. Switching to Linux-5.15.61 allows us to use these IPI improvements. The following figure shows the effect in APerf.
Figure 3: IPI0 Interrupts (c7g.16xl)
Second phase: CPU core level
Now that the system level issues are mitigated, the focus is on the CPU cores. The data collected by APerf shows PMU data where the reference instance and Graviton3 differ significantly.
*Note that reference has a 20% higher CPU clock than c7g.16xl.As a rule of thumb, instructions per clock (IPC) multiplied by clock rate equals work done by a CPU.
Addressing CPU Core bottlenecks
The first improvement in PMU metrics stems from the parallelGC option. Although the intention was to increase CPU usage, the following figure shows lowered branch miss counts as well. Limiting the JIT tiered compilation to only use C2 mode helps branch prediction by reducing branch indirection and increasing the locality of executed code. Finally adding Transparent Huge Pages helps branch prediction logic and avoids lengthy address translation look-ups in DDR memory. The following graphs show the effects of the chosen JVM options.
With the options listed under the preceding figure, APerf shows the branch prediction miss rate decreasing from the initial 16 to 11. Branch mis-predictions incur significant performance penalties as they result in wasted cycles spent computing results that ultimately need to be discarded. Furthermore, these mis-predictions cause the prefetching and cache subsystems to fail to load the necessary subsequent instructions into cache. Consequently, costly pipeline stalls and frontend stalls occur, preventing the CPU from executing instructions.
Code sparsity is a measure of how compact the instruction code is packed and how closely related code is placed. This is where turning off tiered compilation shows its effect. Lower sparsity helps branch prediction and the cache subsystem.
The big decrease in TLB misses is caused by the use of transparent huge pages, which increase the likelihood that a virtual address translation is present in the TLB, since fewer entries are needed. Translation table walks are avoided that otherwise need to traverse entries in DDR memory that cost hundreds of CPU cycles to read.
Re-examining the setup of our testing enviornment: Changing where the load-generator lives
With the preceding efforts, c7g.16xl is within 91% of the reference system. The c7g.16xl branch prediction miss rate is still higher at 11 than the references at 4. As shown in the preceding figure, reduced branch prediction misses have a strong positive effect on performance. What follows is an experiment to achieve parity or better with the reference system based on the reduction of branch prediction misses.
Finagle-http serves HTTP requests generated by wrk2, which is a load generator implemented in C. The expectation is that the c7g.16xl branch predictor works better with the native wrk2 binary, unlike the Renaissance load generator, which is executing on the JVM. The wrk2 load generator and the finagle-http are assigned through taskset to separate sets of CPUs: 16 CPUs for wrk2 and 48 CPUs for finagle-http. The idea here is to have the branch predictors on these CPU sets focus on a limited code set. The following diagram illustrates the difference between the Renaissance and the experimental setup.
With this CPU performance tuned setup, c7g.16xl can now handle a 36% higher request load than the reference using the same configuration, at an average latency limit of 1.5ms. This illustrates the impact that system tuning with APerf can have. The same system that scored 50% lower than the comparison system now exceeds it by 36%. The following APerf data shows the improvement of key PMU metrics that lead to the performance jump.
Branch prediction misses/1000 instructions
Figure 8: Branch misses per 1k instructions
Left chart: Optimized Java-only setup. Right chart: Finagle-http with wrk2 load generator
The branch prediction miss rate is reduced to 1.5 from 11 with the Java-only setup.
IPC
Figure 9: Instructions Per Clock Cycle
Left chart: Optimized Java-only setup. Right chart: Finagle-http with wrk2 load generator
The IPC steps up from 0.7 to 1.5 due to the improvement in branch prediction.
Code sparsity
Figure 10: Code Sparsity
Left chart: Optimized Java-only setup. Right chart: Finagle-http with wrk2 load generator
The code sparsity decreases to 0.014 from 0.21, a factor of 15.
Conclusion
AWS created the APerf tool to aid in root cause analysis and help address performance issues for any workload. APerf is a standalone binary that captures relevant data simultaneously as a time series, such as CPU usage, interrupt frequency, memory usage, and CPU core metrics (PMU counters). APerf can generate reports for multiple data captures, making it easy to spot differences between instance types. We were able to use this data to analyze why Graviton3 was underperforming and to also see the impact of our changes in terms of performance. Using APerf we were able to successfully adjust configuration parameters and go from 50% below our performance target to 36% more performant than our reference system and associated performance target. Without Aperf, collecting these metrics and visualizing them is a non-trival task. With Aperf you can capture and visualize these metrics with two short commands, saving you time and effort so you can focus on what matters most: getting the most performance from your application.
Generative AI–based applications have grown in popularity in the last couple of years. Applications built with large language models (LLMs) have the potential to increase the value companies bring to their customers. In this blog post, we dive deep into network perimeter protection for generative AI applications. We’ll walk through the different areas of network perimeter protection you should consider, discuss how those apply to generative AI–based applications, and provide architecture patterns. By implementing network perimeter protection for your generative AI–based applications, you gain controls to help protect from unauthorized use, cost overruns, distributed denial of service (DDoS), and other threat actors or curious users.
Perimeter protection for LLMs
Network perimeter protection for web applications helps answer important questions, for example:
Who can access the app?
What kind of data is sent to the app?
How much data is the app is allowed to use?
For the most part, the same network protection methods used for other web apps also work for generative AI apps. The main focus of these methods is controlling network traffic that is trying to access the app, not the specific requests and responses the app creates. We’ll focus on three key areas of network perimeter protection:
Authentication and authorization for the app’s frontend
Using a web application firewall
Protection against DDoS attacks
The security concerns of using LLMs in these apps, including issues with prompt injections, sensitive information leaks, or excess agency, is beyond the scope of this post.
Frontend authentication and authorization
When designing network perimeter protection, you first need to decide whether you will allow certain users to access the application, based on whether they are authenticated (AuthN) and whether they are authorized (AuthZ) to ask certain questions of the generative AI–based applications. Many generative AI–based applications sit behind an authentication layer so that a user must sign in to their identity provider before accessing the application. For public applications that are not behind any authentication (a chatbot, for example), additional considerations are required with regard to AWS WAF and DDoS protection, which we discuss in the next two sections.
Let’s look at an example. Amazon API Gateway is an option for customers for the application frontend, providing metering of users or APIs with authentication and authorization. It’s a fully managed service that makes it convenient for developers to publish, maintain, monitor, and secure APIs at scale. With API Gateway, you create AWS Lambda authorizers to control access to APIs within your application. Figure 1 shows how access works for this example.
Figure 1: An API Gateway, Lambda authorizer, and basic filter in the signal path between client and LLM
The workflow in Figure 1 is as follows:
A client makes a request to your API that is fronted by the API Gateway.
When the API Gateway receives the request, it sends the request to a Lambda authorizer that authenticates the request through OAuth, SAML, or another mechanism. The Lambda authorizer returns an AWS Identity and Access Management (IAM) policy to the API Gateway, which will permit or deny the request.
If permitted, the API Gateway sends the API request to the backend application. In Figure 1, this is a Lambda function that provides additional capabilities in the area of LLM security, standing in for more complex filtering. In addition to the Lambda authorizer, you can configure throttling on the API Gateway on a per-client basis or on the application methods clients are accessing before traffic makes it to the backend application. Throttling can provide some mitigation against not only DDoS attacks but also model cloning and inversion attacks.
Finally, the application sends requests to your LLM that is deployed on AWS. In this example, the LLM is deployed on Amazon Bedrock.
The combination of Lambda authorizers and throttling helps support a number of perimeter protection mechanisms. First, only authorized users gain access to the application, helping to prevent bots and the public from accessing the application. Second, for authorized users, you limit the rate at which they can invoke the LLM to prevent excessive costs related to requests and responses to the LLM. Third, after users have been authenticated and authorized by the application, the application can pass identity information to the backend data access layer in order to restrict the data available to the LLM, aligning with what the user is authorized to access.
Besides API Gateway, AWS provides other options you can use to provide frontend authentication and authorization. AWS Application Load Balancer (ALB) supports OpenID Connect (OIDC) capabilities to require authentication to your OIDC provider prior to access. For internal applications, AWS Verified Access combines both identity and device trust signals to permit or deny access to your generative AI application.
AWS WAF
Once the authentication or authorization decision is made, the next consideration for network perimeter protection is on the application side. New security risks are being identified for generative AI–based applications, as described in the OWASP Top 10 for Large Language Model Applications. These risks include insecure output handling, insecure plugin design, and other mechanisms that cause the application to provide responses that are outside the desired norm. For example, a threat actor could craft a direct prompt injection to the LLM, which causes the LLM behave improperly. Some of these risks (insecure plugin design) can be addressed by passing identity information to the plugins and data sources. However, many of those protections fall outside the network perimeter protection and into the realm of security within the application. For network perimeter protection, the focus is on validating the users who have access to the application and supporting rules that allow, block, or monitor web requests based on network rules and patterns at the application level prior to application access.
In addition, bot traffic is an important consideration for web-based applications. According to Security Today, 47% of all internet traffic originates from bots. Bots that send requests to public applications drive up the cost of using generative AI–based applications by causing higher request loads.
To protect against bot traffic before the user gains access to the application, you can implement AWS WAF as part of the perimeter protection. Using AWS WAF, you can deploy a firewall to monitor and block the HTTP(S) requests that are forwarded to your protected web application resources. These resources exist behind Amazon API Gateway, ALB, AWS Verified Access, and other resources. From a web application point of view, AWS WAF is used to prevent or limit access to your application before invocation of your LLM takes place. This is an important area to consider because, in addition to protecting the prompts and completions going to and from the LLM itself, you want to make sure only legitimate traffic can access your application. AWS Managed Rules or AWS Marketplace managed rule groups provide you with predefined rules as part of a rule group.
Let’s expand the previous example. As your application shown in Figure 1 begins to scale, you decide to move it behind Amazon CloudFront. CloudFront is a web service that gives you a distributed ingress into AWS by using a global network of edge locations. Besides providing distributed ingress, CloudFront gives you the option to deploy AWS WAF in a distributed fashion to help protect against SQL injections, bot control, and other options as part of your AWS WAF rules. Let’s walk through the new architecture in Figure 2.
Figure 2: Adding AWS WAF and CloudFront to the client-to-model signal path
The workflow shown in Figure 2 is as follows:
A client makes a request to your API. DNS directs the client to a CloudFront location, where AWS WAF is deployed.
CloudFront sends the request through an AWS WAF rule to determine whether to block, monitor, or allow the traffic. If AWS WAF does not block the traffic, AWS WAF sends it to the CloudFront routing rules.
Note: It is recommended that you restrict access to the API Gateway so users cannot bypass the CloudFront distribution to access the API Gateway. An example of how to accomplish this goal can be found in the Restricting access on HTTP API Gateway Endpoint with Lambda Authorizer blog post.
CloudFront sends the traffic to the API Gateway, where it runs through the same traffic path as discussed in Figure 1.
To dive into more detail, let’s focus on bot traffic. With AWS WAF Bot Control, you can monitor, block, or rate limit bots such as scrapers, scanners, crawlers, status monitors, and search engines. Bot Control provides multiple options in terms of configured rules and inspection levels. For example, if you use the targeted inspection level of the rule group, you can challenge bots that don’t self-identify, making it harder and more expensive for malicious bots to operate against your generative AI–based application. You can use the Bot Control managed rule group alone or in combination with other AWS Managed Rules rule groups and your own custom AWS WAF rules. Bot Control also provides granular visibility on the number of bots that are targeting your application, as shown in Figure 3.
Figure 3: Bot control dashboard for bot requests and non-bot requests
How does this functionality help you? For your generative AI–based application, you gain visibility into how bots and other traffic are targeting your application. AWS WAF provides options to monitor and customize the web request handling of bot traffic, including allowing specific bots or blocking bot traffic to your application. In addition to bot control, AWS WAF provides a number of different managed rule groups, including baseline rule groups, use-case specific rule groups, IP reputation rules groups, and others. For more information, take a look at the documentation on both AWS Managed Rules rule groups and AWS Marketplace managed rule groups.
DDoS protection
The last topic we’ll cover in this post is DDoS with LLMs. Similar to threats against other Layer 7 applications, threat actors can send requests that consume an exceptionally high amount of resources, which results in a decline in the service’s responsiveness or an increase in the cost to run the LLMs that are handling the high number of requests. Although throttling can help support a per-user or per-method rate limit, DDoS attacks use more advanced threat vectors that are difficult to protect against with throttling.
AWS Shield helps to provide protection against DDoS for your internet-facing applications, both at Layer 3/4 with Shield standard or Layer 7 with Shield Advanced. For example, Shield Advanced responds automatically to mitigate application threats by counting or blocking web requests that are part of the exploit by using web access control lists (ACLs) that are part of your already deployed AWS WAF. Depending on your requirements, Shield can provide multiple layers of protection against DDoS attacks.
Figure 4 shows how your deployment might look after Shield is added to the architecture.
Figure 4: Adding Shield Advanced to the client-to-model signal path
The workflow in Figure 4 is as follows:
A client makes a request to your API. DNS directs the client to a CloudFront location, where AWS WAF and Shield are deployed.
CloudFront sends the request through an AWS WAF rule to determine whether to block, monitor, or allow the traffic. AWS Shield can mitigate a wide range of known DDoS attack vectors and zero-day attack vectors. Depending on the configuration, Shield Advanced and AWS WAF work together to rate-limit traffic coming from individual IP addresses. If AWS WAF or Shield Advanced don’t block the traffic, the services will send it to the CloudFront routing rules.
CloudFront sends the traffic to the API Gateway, where it will run through the same traffic path as discussed in Figure 1.
When you implement AWS Shield and Shield Advanced, you gain protection against security events and visibility into both global and account-level events. For example, at the account level, you get information on the total number of events seen on your account, the largest bit rate and packet rate for each resource, and the largest request rate for CloudFront. With Shield Advanced, you also get access to notifications of events that are detected by Shield Advanced and additional information about detected events and mitigations. These metrics and data, along with AWS WAF, provide you with visibility into the traffic that is trying to access your generative AI–based applications. This provides mitigation capabilities before the traffic accesses your application and before invocation of the LLM.
Considerations
When deploying network perimeter protection with generative AI applications, consider the following:
AWS provides multiple options, on both the frontend authentication and authorization side and the AWS WAF side, for how to configure perimeter protections. Depending on your application architecture and traffic patterns, multiple resources can provide the perimeter protection with AWS WAF and integrate with identity providers for authentication and authorization decisions.
You can also deploy more advanced LLM-specific prompt and completion filters by using Lambda functions and other AWS services as part of your deployment architecture. Perimeter protection capabilities are focused on preventing undesired traffic from reaching the end application.
Most of the network perimeter protections used for LLMs are similar to network perimeter protection mechanisms for other web applications. The difference is that additional threat vectors come into play compared to regular web applications. For more information on the threat vectors, see OWASP Top 10 for Large Language Model Applications and Mitre ATLAS.
Conclusion
In this blog post, we discussed how traditional network perimeter protection strategies can provide defense in depth for generative AI–based applications. We discussed the similarities and differences between LLM workloads and other web applications. We walked through why authentication and authorization protection is important, showing how you can use Amazon API Gateway to throttle through usage plans and to provide authentication through Lambda authorizers. Then, we discussed how you can use AWS WAF to help protect applications from bots. Lastly, we talked about how AWS Shield can provide advanced protection against different types of DDoS attacks at scale. For additional information on network perimeter protection and generative AI security, take a look at other blogs posts in the AWS Security Blog Channel.
If you have feedback about this post, submit comments in the Comments section below. If you have questions about this post, contact AWS Support.
This post is written by Craig Warburton, Senior Solutions Architect, Hybrid. Sedji Gaouaou, Senior Solutions Architect, Hybrid. Brian Daugherty, Principal Solutions Architect, Hybrid.
Migrating workloads to AWS Outposts rack offers you the opportunity to gain the benefits of cloud computing while keeping your data and applications on premises.
For organizations with strict data residency requirements, by deploying AWS infrastructure and services on premises, you can keep sensitive data and mission-critical applications within your own data centers or facilities, helping ensure compliance with data sovereignty laws and regulatory frameworks.
On the other hand, if your organization does not have stringent data residency requirements, you may opt for a hybrid approach, using both Outposts rack and the AWS Regions. With this flexibility, you can process and store data in the most appropriate location based on factors such as latency, cost optimization, and application requirements.
In this post, we cover the best options to migrate your workloads to Outposts rack, taking into account your specific data residency requirements. We explore strategies, tools, and best practices to enable a successful migration tailored to your organization’s needs.
At AWS, we use the 7 Rs framework to help organizations evaluate and choose the appropriate migration strategy for moving applications and workloads to the AWS Cloud. The 7 Rs represent:
Rehosting (rehost or lift and shift)
Replatforming (lift, tinker, and shift)
Repurchasing (republish or re-vendor)
Refactoring (re-architecting)
Retiring
Retaining (revisit)
Relocating (remigrate).
This post focuses on rehosting and the services available to help rehost on-premises applications to Outposts rack.
Before getting started with any migration, AWS recommends a three-phase approach to migrating workloads to the cloud (AWS Region or Outposts rack). The three phases are assess, mobilize, and migrate and modernize.
Figure 1: Diagram showing the three migration phases of assess, mobilize, and migrate and modernize
This post describes the steps that you can take in the migrate and modernize phase. However, the assess and mobilize phases are also critical to allow you to understand what applications will be migrated, the dependencies between them, and the planning associated with how and when migration will occur.
AWS Migration Hub is a cloud migration service provided by AWS that helps organizations accelerate and simplify the process of migrating workloads to AWS. It provides a unified location to track the progress of application migrations across multiple AWS and partner services. This service can be used to help work through all three phases of migration, and we recommend that you start with this service and complete each phase accordingly. The assess phase should help you identify any applications that require consideration when migrating (including any data residency requirements), and the mobilize phase defines the approach to take.
Workload migration to AWS Outposts rack: With staging environment in an AWS Region
After deploying an Outpost rack to your desired on-premises location, you can perform migrations of on-premises systems and virtual machines using either Application Migration Service or third-party backup and recovery services. Both scenarios are described in the following sections.
Scenario 1: Using AWS Application Migration Service
Application Migration Service is able to lift and shift a large number of physical or virtual servers without compatibility issues, performance disruption, or long cutover windows.
In this scenario, at least one Outpost rack is deployed on premises with the following prerequisites:
The following diagram shows the solution architecture and includes the on-premises servers that will be migrated from the local network to the Outposts rack. It also includes the staging VPC in Region used to deploy the replication servers, Amazon S3 to store the Amazon EBS snapshots and the target VPC extended to Outposts rack.
Figure 2: Architecture diagram showing migration with Application Migration Service
Step 1: Outposts rack configuration
You can work with AWS specialists to size your Outpost for your workload and application requirements. In this scenario, you don’t need additional Outposts rack capacity for the migration because the staging area will be deployed in the Region (see 1 in Figure 2).
Step 2: Prepare Application Migration service
Set up Application Migration Service from the console in the Region your Outposts rack is anchored to. If this is your first setup, choose Get started on the AWS Application Migration Service console. When creating the replication settings template, make sure your staging area is using subnets in the parent Region (see 2 in Figure 2).
For large migrations, source servers may have a wide variety of operating system versions and may be distributed across multiple data centers. AWS Application Migration Service offers the MGN connector, a feature that allows you to automate running commands on your source environment. Finally, ensure that communication is possible between the agent and Application Migration Service (see 3 in Figure 2).
In the following image, there is an example of deploying the AWS Replication Agent providing the required parameters (Region, AWS access key and AWS secret access key).
Once the AWS Replication Agent is installed, the server will be added to the AWS Application Migration Service console. Next, it will undergo the initial sync process, which will be completed when showing the Ready for testing lifecycle state in the Application Migration Service console.
Step 4: Configure launch settings
Prior to testing or cutting over an instance, you must configure the launch settings by creating Amazon Elastic Compute Cloud (Amazon EC2) launch templates, ensuring that you select your extended virtual private cloud (VPC) and subnet deployed on Outposts rack and using an appropriate, available instance type (see 4 in Figure 2).
The output of this command lists the instance types and sizes configured on your Outpost:
InstanceTypes:
- InstanceType: c5.xlarge
- InstanceType: c5.4xlarge
- InstanceType: r5.2xlarge
- InstanceType: r5.4xlarge
With knowledge of the instance types configured, you can now determine how many of each are available. For example, the following AWS CLI command, which is run on the account that owns the Outpost, lists the number of c5.xlarge instances available for use:
aws cloudwatch get-metric-statistics \
--namespace AWS/Outposts \
--metric-name AvailableInstanceType_Count \
--statistics Average --period 3600 \
--start-time $(date -u -Iminutes -d '-1hour') \
--end-time $(date -u -Iminutes) \
--dimensions \
Name=OutpostId,Value=op-abcdefgh123456789 \
Name=InstanceType,Value=c5.xlarge
This command returns:
Datapoints:
- Average: 10.0
Timestamp: '2024-04-10T10:39:00+00:00'
Unit: Count
Label: AvailableInstanceType_Count
The output indicates that there were (on average) 10 c5.xlarge instances available in the specified time period (1 hour). Using the same command for the other instance types, you discover that there are also 20 c5.4xlarge, 10 r5.2xlarge, and 6 r5.4xlarge available for use in completing the required EC2 launch templates.
Step 5: Install AWS Systems Manager Agent in your on your target instances
Once the launch settings are defined, you must activate the post-launch actions for either a specific server or all the servers. You must leave the Install the Systems Manager agent and allow executing actions on launched servers option toggled on in order for post-launch actions to work. Untoggling the option would disallow Application Migration Service to install the AWS Systems Manager Agent (SSM Agent) on your servers, and post-launch actions would no longer be executed on them (see 5 in Figure 2).
Figure 3: Post-launch actions on the Application Migration Service console
Step 6: Testing and cutover
Once you have configured the launch settings for each source server, you are ready to launch the servers as test instances. Best practice is to test instances before cutover.
Figure 4: Application Migration Service console ready to launch test instances
Finally, after completing the testing of all the source servers, you are ready for cutover (see 6 on Figure 2). Prior to launching cutover instances, check that the source servers are listed as Ready for cutover under Migration lifecycle and Healthy under Data replication status.
Figure 5: Application Migration Console ready for cutover
To launch the cutover instances, select the instances you want to cutover and then select Launch cutover instances under Cutover (see Figure 5).
The AWS Application Migration Service console will indicate Cutover finalized when the cutover has completed successfully, the selected source servers’ Migration lifecycle column will show the Cutover complete status, the Data replication status column will show Disconnected, and the Next step column will show Mark as archived. The source servers have now been successfully migrated into AWS. You can now archive your source servers that have launched cutover instances.
Scenario 2: Using partner backup and replication solutions
You may already be using a third-party or AWS Partner solution to create on-premises backups of bare-metal or virtualized systems. These solutions often use local disk-arrays or object stores to create tiered backups of systems covering restore-points going back years, days, or just a few hours or minutes.
These solutions may also have inherent capabilities to restore from these backups directly to the AWS, enabling migration of on-premises systems to EC2 instances deployed to Outposts rack.
In the scenario illustrated in Figure 6, the partner backup and replication service (BR) creates backups (see 1 in Figure 6) of virtual machines to on-premises disk or object storage repositories. Using the service’s AWS integration, virtual machines can be restored (see 2 in Figure 6) to an EC2 instance deployed on Outposts rack, which is also on premises. The restoration may follow a process that uses helper instances and volumes (see 3 in Figure 6) during intermediate steps to create Amazon Elastic Block Store (Amazon EBS) snapshots (see 4 in Figure 6) and then Amazon Machine Images (AMIs) of the systems being migrated (see 5 in Figure 6), which are ultimately deployed (see 6 in Figure 6) to Outposts rack.
Figure 6: Architecture diagram of the partner backup and replication scenario
When performing this type of migration, there will typically be a stage where you are asked to specify parameters defining the target VPC and subnets. These should be the VPC being extended to the Outpost and a subnet that has been created in that VPC on the Outpost. You will also need to specify an EC2 instance type that is available on the Outpost, which can be discovered using the process described in the previous section.
Workload migration to AWS Outposts rack: With staging environment on an AWS Outpost rack
Data residency can be a critical consideration for organizations that collect and store sensitive information, such as personally identifiable information (PII), financial data or medical records. AWS Elastic Disaster Recovery, supported on Outposts rack, helps enable seamless replication of on-premises data to Outposts rack and addresses data residency concerns by keeping data within your on-premises environment, using Amazon EBS and Amazon S3 on Outposts.
In this scenario, an Outpost rack is deployed on premises with the following prerequisites:
The following diagram shows the solution architecture and includes the on-premises servers that will be migrated from the local network to the Outposts rack. It also includes the staging VPC used to deploy the replication servers on Outposts rack, Amazon S3 on Outposts to store the local Amazon EBS snapshots and the target VPC extended to Outposts rack.
Figure 7: Architecture diagram for workflow migration to AWS Outposts rack
Step 1: Outposts rack configuration
To use Elastic Disaster Recovery on Outposts rack, you need to configure both Amazon EBS and Amazon S3 on Outposts to support nearly continuous replication and point-in-time recovery for your workload needs (see 1 in Figure 7). Specifically, you need to size Amazon EBS and Amazon S3 on Outposts capacity according to your workload capacity requirements and application interdependencies. To do this, you can define dependency groups–each dependency group is a collection of applications and their underlying infrastructure with technical or non-technical dependencies. A 2:1 ratio is recommended for the EBS volumes to be used for near-continuous replication; a 1:1 ratio is recommended for the Amazon S3 on Outposts ratio for EBS snapshots. For example, to migrate 40 terabytes (TB) of workloads, you need to plan for 80TB of EBS volumes and 40TB of S3 on Outposts capacity.
Step 2: Extend VPC to your Outposts rack
Once your Outpost has been provisioned and is available, extend the required Amazon Virtual Private Cloud (Amazon VPC) connection to the Outpost from the Region by creating the desired staging and target subnets (see 2 in Figure 7).
Step 3: Prepare AWS Elastic Disaster Recovery service
Prepare the AWS Elastic Disaster Recovery service from the AWS console to set the default replication and launch settings. When defining these settings, make sure that the Outposts resources available are chosen for staging and target subnets and instance and storage type (see 3 in Figure 7).
The next phase will be to install the AWS Replication Agent to the source servers and to ensure that communication is possible between the replication agent and your Outposts replication subnet through the Outposts local gateway to ensure that replication traffic uses the local network (see 4 in Figure 7).
Step 5: Continuous block-level replication
Staging area resources are automatically created and managed by Elastic Disaster Recovery. Once the AWS Replication Agent has been deployed, continuous block-level replication (compressed and encrypted in transit) will occur (see 5 in Figure 7) over the local network.
Step 6: Launch Outposts rack resources
Finally, migrated instances can now be launched using Outposts rack resources based on the launch settings defined previously (see 6 in Figure 7).
Conclusion
In this post, you have learned how to migrate your workloads from your on-premises environment to Outposts rack based on your specific data residency requirements. When you have the flexibility of using Regional services, AWS migration services or partner solutions can be used with infrastructure already in place. If your data must stay on-premises, using AWS Elastic Disaster Recovery allows you to migrate your data without using Regional services, allowing you to migrate to Outposts rack without your data leaving the boundary of a certain geographic location.
To learn more about an end-to-end migration and modernization journey, visit AWS Migration Hub.
This blog post demonstrates how to use Amazon Bedrock with a detailed security plan to deploy a safe and responsible chatbot application. In this post, we identify common security risks and anti-patterns that can arise when exposing a large language model (LLM) in an application. Amazon Bedrock is built with features you can use to mitigate vulnerabilities and incorporate secure design principles. This post highlights architectural considerations and best practice strategies to enhance the reliability of your LLM-based application.
Amazon Bedrock unleashes the fusion of generative artificial intelligence (AI) and LLMs, empowering you to craft impactful chatbot applications. As with technologies handling sensitive data and intellectual property, it’s crucial that you prioritize security and adopt a robust security posture. Without proper measures, these applications can be susceptible to risks such as prompt injection, information disclosure, model exploitation, and regulatory violations. By proactively addressing these security considerations, you can responsibly use Amazon Bedrock foundation models and generative AI capabilities.
The chatbot application use case represents a common pattern in enterprise environments, where businesses want to use the power of generative AI foundation models (FMs) to build their own applications. This falls under the Pre-trained models category of the Generative AI Security Scoping Matrix. In this scope, businesses directly integrate with FMs like Anthropic’s Claude through Amazon Bedrock APIs to create custom applications, such as customer support Retrieval Augmented Generation (RAG) chatbots, content generation tools, and decision support systems.
This post provides a comprehensive security blueprint for deploying chatbot applications that integrate with Amazon Bedrock, enabling the responsible adoption of LLMs and generative AI in enterprise environments. We outline mitigation strategies through secure design principles, architectural considerations, and best practices tailored to the challenges of integrating LLMs and generative AI capabilities.
By following the guidance in this post, you can proactively identify and mitigate risks associated with deploying and operating chatbot applications that integrate with Amazon Bedrock and use generative AI models. The guidance can help you strengthen the security posture, protect sensitive data and intellectual property, maintain regulatory compliance, and responsibly deploy generative AI capabilities within your enterprise environments.
This post contains the following high-level sections:
The chatbot application architecture described in this post represents an example implementation that uses various AWS services and integrates with Amazon Bedrock and Anthropic’s Claude 3 Sonnet LLM. This baseline architecture serves as a foundation to understand the core components and their interactions. However, it’s important to note that there can be multiple ways for customers to design and implement a chatbot architecture that integrates with Amazon Bedrock, depending on their specific requirements and constraints. Regardless of the implementation approach, it’s crucial to incorporate appropriate security controls and follow best practices for secure design and deployment of generative AI applications.
The chatbot application allows users to interact through a frontend interface and submit prompts or queries. These prompts are processed by integrating with Amazon Bedrock, which uses the Anthropic Claude 3 Sonnet LLM and a knowledge base built from ingested data. The LLM generates relevant responses based on the prompts and retrieved context from the knowledge base. While this baseline implementation outlines the core functionality, it requires incorporating security controls and following best practices to mitigate potential risks associated with deploying generative AI applications. In the subsequent sections, we discuss security anti-patterns that can arise in such applications, along with their corresponding mitigation strategies. Additionally, we present a secure and responsible architecture blueprint for the chatbot application powered by Amazon Bedrock.
Figure 1: Baseline chatbot application architecture using AWS services and Amazon Bedrock
Components in the chatbot application baseline architecture
The chatbot application architecture uses various AWS services and integrates with the Amazon Bedrock service and Anthropic’s Claude 3 Sonnet LLM to deliver an interactive and intelligent chatbot experience. The main components of the architecture (as shown in Figure 1) are:
User interaction layer: Users interact with the chatbot application through the Streamlit frontend (3), a Python-based open-source library, used to build the user-friendly and interactive interface.
Amazon Elastic Container Service (Amazon ECS) on AWS Fargate: A fully managed and scalable container orchestration service that eliminates the need to provision and manage servers, allowing you to run containerized applications without having to manage the underlying compute infrastructure.
Application hosting and deployment: The Streamlit application (3) components are hosted and deployed on Amazon ECS on AWS Fargate (2), maintaining scalability and high availability. This architecture represents the application and hosting environment in an independent virtual private cloud (VPC) to promote a loosely-coupled architecture. The Streamlit frontend can be replaced with your organization’s specific frontend and quickly integrated with the backend Amazon API Gateway in the VPC. An application load balancer is used to distribute traffic to the Streamlit application instances.
API Gateway driven Lambda Integration: In this example architecture, instead of directly invoking the Amazon Bedrock service from the frontend, an API Gateway backed by an AWS Lambda function (5) is used as an intermediary layer. This approach promotes better separation of concerns, scalability, and secure access to Amazon Bedrock by limiting direct exposure from the frontend.
Lambda: Lambda provides highly scalable, short-term serverless compute. Here, the requests from Streamlit are processed. First, the history of the user’s session is retrieved from Amazon DynamoDB (6). Second, the user’s question, history, and the context are formatted into a prompt template and queried against Amazon Bedrock with the knowledge base, employing retrieval augmented generation (RAG).
DynamoDB: DynamoDB is responsible for storing and retrieving chat history, conversation history, recommendations, and other relevant data using the Lambda function.
Amazon Bedrock: Amazon Bedrock plays a central role in the architecture. It handles the questions posed by the user using Anthropic Claude 3 Sonnet LLM (9) combined with a previously generated knowledge base (10) of the customer’s organization-specific data.
Anthropic Claude 3 Sonnet: Anthropic Claude 3 Sonnet is the LLM used to generate tailored recommendations and responses based on user inputs and the context retrieved from the knowledge base. It’s part of the text analysis and generation module in Amazon Bedrock.
Knowledge base and data ingestion: Relevant documents classified as public are ingested from Amazon S3 (9) into in an Amazon Bedrock knowledge base. Knowledge bases are backed by Amazon OpenSearch Service. Amazon Titan Embeddings (10) are used to generate the vector embeddings database of the documents. Storing the data as vector embeddings allows for semantic similarity searching of the documents to retrieve the context of the question posed by the user (RAG). By providing the LLM with context in addition to the question, there’s a much higher chance of getting a useful answer from the LLM.
Comprehensive logging and monitoring strategy
This section outlines a comprehensive logging and monitoring strategy for the Amazon Bedrock-powered chatbot application, using various AWS services to enable centralized logging, auditing, and proactive monitoring of security events, performance metrics, and potential threats.
Logging and auditing:
AWS CloudTrail: Logs API calls made to Amazon Bedrock, including InvokeModel requests, as well as information about the user or service that made the request.
AWS CloudWatch Logs: Captures and analyzes Amazon Bedrock invocation logs, user prompts, generated responses, and errors or warnings encountered during the invocation process.
Amazon OpenSearch Service: Logs and indexes data related to the OpenSearch integration, context data retrievals, and knowledge base operations.
AWS Config: Monitors and audits the configuration of resources related to the chatbot application and Amazon Bedrock service, including IAM policies, VPC settings, encryption key management, and other resource configurations.
Monitoring and alerting:
AWS CloudWatch: Monitors metrics specific to Amazon Bedrock, such as the number of model invocations, latency of invocations, and error metrics (client-side errors, server-side errors, and throttling). Configures targeted CloudWatch alarms to proactively detect and respond to anomalies or issues related to Bedrock invocations and performance.
AWS GuardDuty: Continuously monitors CloudTrail logs for potential threats and unauthorized activity within the AWS environment.
Amazon Security Lake: Provides a centralized data lake for log analysis; is integrated with CloudTrail and SecurityHub.
Security information and event management integration:
Integrate with security information and event management (SIEM) solutions for centralized log management, real-time monitoring of security events, and correlation of logging data from multiple sources (CloudTrail, CloudWatch Logs, OpenSearch Service, and so on).
Continuous improvement:
Regularly review and update logging and monitoring configurations, alerting thresholds, and integration with security solutions to address emerging threats, changes in application requirements, or evolving best practices.
Security anti-patterns and mitigation strategies
This section identifies and explores common security anti-patterns associated with the Amazon Bedrock chatbot application architecture. By recognizing these anti-patterns early in the development and deployment phases, you can implement effective mitigation strategies and fortify your security posture.
Addressing security anti-patterns in the Amazon Bedrock chatbot application architecture is crucial for several reasons:
Data protection and privacy: The chatbot application processes and generates sensitive data, including personal information, intellectual property, and confidential business data. Failing to address security anti-patterns can lead to data breaches, unauthorized access, and potential regulatory violations.
Model integrity and reliability: Vulnerabilities in the chatbot application can enable bad actors to manipulate or exploit the underlying generative AI models, compromising the integrity and reliability of the generated outputs. This can have severe consequences, particularly in decision-support or critical applications.
Responsible AI deployment: As the adoption of generative AI models continues to grow, it’s essential to maintain responsible and ethical deployment practices. Addressing security anti-patterns is crucial for maintaining trust, transparency, and accountability in the chatbot application powered by AI models.
Compliance and regulatory requirements: Many industries and regions have specific regulations and guidelines governing the use of AI technologies, data privacy, and information security. Addressing security anti-patterns is a critical step towards adhering to and maintaining compliance for the chatbot application.
The security anti-patterns that are covered in this post include:
Lack of secure authentication and access controls
Insufficient input validation and sanitization
Insecure communication channels
Inadequate prompt and response logging, auditing, and non-repudiation
Insecure data storage and access controls
Failure to secure FMs and generative AI components
Lack of responsible AI governance and ethics
Lack of comprehensive testing and validation
Anti-pattern 1: Lack of secure authentication and access controls
In a generative AI chatbot application using Amazon Bedrock, a lack of secure authentication and access controls poses significant risks to the confidentiality, integrity, and availability of the system. Identity spoofing and unauthorized access can enable threat actors to impersonate legitimate users or systems, gain unauthorized access to sensitive data processed by the chatbot application, and potentially compromise the integrity and confidentiality of the customer’s data and intellectual property used by the application.
Identity spoofing and unauthorized access are important areas to address in this architecture, as the chatbot application handles user prompts and responses, which may contain sensitive information or intellectual property. If a threat actor can impersonate a legitimate user or system, they can potentially inject malicious prompts, retrieve confidential data from the knowledge base, or even manipulate the responses generated by the Anthropic Claude 3 LLM integrated with Amazon Bedrock.
Anti-pattern examples
Exposing the Streamlit frontend interface or the API Gateway endpoint without proper authentication mechanisms, potentially allowing unauthenticated users to interact with the chatbot application and inject malicious prompts.
Storing or hardcoding AWS access keys or API credentials in the application code or configuration files, increasing the risk of credential exposure and unauthorized access to AWS services like Amazon Bedrock or DynamoDB.
Implementing weak or easily guessable passwords for administrative or service accounts with elevated privileges to access the Amazon Bedrock service or other critical components.
Lacking multi-factor authentication (MFA) for AWS Identity and Access Management (IAM) users or roles with privileged access, increasing the risk of unauthorized access to AWS resources, including the Amazon Bedrock service, if credentials are compromised.
Mitigation strategies
To mitigate the risks associated with a lack of secure authentication and access controls, implement robust IAM controls, as well as continuous logging, monitoring, and threat detection mechanisms.
IAM controls:
Use industry-standard protocols like OAuth 2.0 or OpenID Connect, and integrate with AWS IAM Identity Center or other identity providers for centralized authentication and authorization for the Streamlit frontend interface and AWS API Gateway endpoints.
Implement fine-grained access controls using AWS IAM policies and resource-based policies to restrict access to only the necessary Amazon Bedrock resources, Lambda functions, and other components required for the chatbot application.
Enforce the use of MFA for all IAM users, roles, and service accounts with access to critical components like Amazon Bedrock, DynamoDB, or the Streamlit application.
Continuous logging and monitoring and threat detection:
See the Comprehensive logging and monitoring strategy section for guidance on implementing centralized logging and monitoring solutions to track and audit authentication events, access attempts, and potential unauthorized access or credential misuse across the chatbot application components and Amazon Bedrock service, as well as using CloudWatch, Lambda, and GuardDuty to detect and respond to anomalous behavior and potential threats.
Anti-pattern 2: Insufficient input sanitization and validation
Insufficient input validation and sanitization in a generative AI chatbot application can expose the system to various threats, including injection events, data tampering, adversarial events, and data poisoning events. These vulnerabilities can lead to unauthorized access, data manipulation, and compromised model outputs.
Injection events: If user prompts or inputs aren’t properly sanitized and validated, a threat actor can potentially inject malicious code, such as SQL code, leading to unauthorized access or manipulation of the DynamoDB chat history data. Additionally, if the chatbot application or components process user input without proper validation, a threat actor can potentially inject and run arbitrary code on the backend systems, compromising the entire application.
Data tampering: A threat actor can potentially modify user prompts or payloads in transit between the chatbot interface and Amazon Bedrock service, leading to unintended model responses or actions. Lack of data integrity checks can allow a threat actor to tamper with the context data exchanged between Amazon Bedrock and OpenSearch, potentially leading to incorrect or malicious search results influencing the LLM responses.
Data poisoning events: If the training data or context data used by the LLM or chatbot application isn’t properly validated and sanitized, bad actors can potentially introduce malicious or misleading data, leading to biased or compromised model outputs.
Anti-pattern examples
Failure to validate and sanitize user prompts before sending them to Amazon Bedrock, potentially leading to injection events or unintended data exposure.
Lack of input validation and sanitization for context data retrieved from OpenSearch, allowing malformed or malicious data to influence the LLM’s responses.
Insufficient sanitization of LLM-generated responses before displaying them to users, enabling potential code injection or rendering of harmful content.
Inadequate sanitization of user input in the Streamlit application or Lambda functions, failing to remove or escape special characters, code snippets, or potentially malicious patterns, enabling code injection events.
Insufficient validation and sanitization of training data or other data sources used by the LLM or chatbot application, allowing data poisoning events that can introduce malicious or misleading data, leading to biased or compromised model outputs.
Allowing unrestricted character sets, input lengths, or special characters in user prompts or data inputs, enabling adversaries to craft inputs that bypass input validation and sanitization mechanisms, potentially causing undesirable or malicious outputs.
Relying solely on deny lists for input validation, which can be quickly bypassed by adversaries, potentially leading to injection events, data tampering, or other exploit scenarios.
Mitigation strategies
To mitigate the risks associated with insufficient input validation and sanitization, implement robust input validation and sanitization mechanisms throughout the chatbot application and its components.
Input validation and sanitization:
Implement strict input validation rules for user prompts at the chatbot interface and Amazon Bedrock service boundaries, defining allowed character sets, maximum input lengths, and disallowing special characters or code snippets. Use Amazon Bedrock’s Guardrails feature, which allows defining denied topics and content filters to remove undesirable and harmful content from user interactions with your applications.
Use allow lists instead of deny lists for input validation to maintain a more robust and comprehensive approach.
Sanitize user input by removing or escaping special characters, code snippets, or potentially malicious patterns.
Data flow validation:
Validate and sanitize data flows between components, including:
User prompts sent to the FM and responses generated by the FM and returned to the chatbot interface.
Training data, context data, and other data sources used by the FM or chatbot application.
Use AWS Shield for protection against distributed denial of service (DDoS) events.
Use CloudTrail to monitor API calls to Amazon Bedrock, including InvokeModel requests.
See the Comprehensive logging and monitoring strategy section for guidance on implementing Lambda functions, Amazon EventBridge rules, and CloudWatch Logs to analyze CloudTrail logs, ingest application logs, user prompts, and responses, and integrate with incident response and SIEM solutions for detecting, investigating, and mitigating security incidents related to input validation and sanitization, including jailbreaking attempts and anomalous behavior.
Anti-pattern 3: Insecure communication channels
Insecure communication channels between chatbot application components can expose sensitive data to interception, tampering, and unauthorized access risks. Unsecured channels enable man-in-the-middle events where threat actors intercept, modify data in transit such as user prompts, responses, and context data, leading to data tampering, malicious payload injection, and unauthorized information access.
Anti-pattern examples
Failure to use AWS PrivateLink for secure service-to-service communication within the VPC, exposing communications between Amazon Bedrock and other AWS services to potential risks over the public internet, even when using HTTPS.
Absence of data integrity checks or mechanisms to detect and prevent data tampering during transmission between components.
Failure to regularly review and update communication channel configurations, protocols, and encryption mechanisms to address emerging threats and ensure compliance with security best practices.
Mitigation strategies
To mitigate the risks associated with insecure communication channels, implement secure communication mechanisms and enforce data integrity throughout the chatbot application’s components and their interactions. Proper encryption, authentication, and integrity checks should be employed to protect sensitive data in transit and help prevent unauthorized access, data tampering, and man-in-the-middle events.
Secure communication channels:
Use PrivateLink for secure service-to-service communication between Amazon Bedrock and other AWS services used in the chatbot application architecture. PrivateLink provides a private, isolated communication channel within the Amazon VPC, eliminating the need to traverse the public internet. This mitigates the risk of potential interception, tampering, or unauthorized access to sensitive data transmitted between services, even when using HTTPS.
Use AWS Certificate Manager (ACM) to manage and automate the deployment of SSL/TLS certificates used for secure communication between the chatbot frontend interface (the Streamlit application) and the API Gateway endpoint. ACM simplifies the provisioning, renewal, and deployment of SSL/TLS certificates, making sure that communication channels between the user-facing components and the backend API are securely encrypted using industry-standard protocols and up-to-date certificates.
Continuous logging and monitoring:
See the Comprehensive Logging and Monitoring Strategy section for guidance on implementing centralized logging and monitoring mechanisms to detect and respond to potential communication channel anomalies or security incidents, including monitoring communication channel metrics, API call patterns, request payloads, and response data, using AWS services like CloudWatch, CloudTrail, and AWS WAF.
Network segmentation and isolation controls
Implement network segmentation by deploying the Amazon ECS cluster within a dedicated VPC and subnets, isolating it from other components and restricting communication based on the principle of least privilege.
Create separate subnets within the VPC for the public-facing frontend tier and the backend application tier, further isolating the components.
Use AWS security groups and network access control lists (NACLs) to control inbound and outbound traffic at the instance and subnet levels, respectively, for the ECS cluster and the frontend instances.
Anti-pattern 4: Inadequate logging, auditing, and non-repudiation
Inadequate logging, auditing, and non-repudiation mechanisms in a generative AI chatbot application can lead to several risks, including a lack of accountability, challenges in forensic analysis, and compliance concerns. Without proper logging and auditing, it’s challenging to track user activities, diagnose issues, perform forensic analysis in case of security incidents, and demonstrate compliance with regulations or internal policies.
Anti-pattern examples
Lack of logging for data flows between components, such as user prompts sent to Amazon Bedrock, context data exchanged with OpenSearch, and responses from the LLM, hindering investigative efforts in case of security incidents or data breaches.
Insufficient logging of user activities within the chatbot application—such as sign in attempts, session duration, and actions performed—limiting the ability to track and attribute actions to specific users.
Absence of mechanisms to ensure the integrity and authenticity of logged data, allowing potential tampering or repudiation of logged events.
Failure to securely store and protect log data from unauthorized access or modification, compromising the reliability and confidentiality of log information.
Mitigation strategies
To mitigate the risks associated with inadequate logging, auditing, and non-repudiation, implement comprehensive logging and auditing mechanisms to capture critical events, user activities, and data flows across the chatbot application components. Additionally, measures must be taken to maintain the integrity and authenticity of log data, help prevent tampering or repudiation, and securely store and protect log information from unauthorized access.
Comprehensive logging and auditing:
See the Comprehensive logging and monitoring strategy section for detailed guidance on implementing logging mechanisms using CloudTrail, CloudWatch Logs, and OpenSearch Service, as well as using CloudTrail for logging and monitoring API calls, especially Amazon Bedrock API calls and other API activities within the AWS environment, using CloudWatch for monitoring Amazon Bedrock-specific metrics, and ensuring log data integrity and non-repudiation through the CloudTrail log file integrity validation feature and implementing S3 Object Lock and S3 Versioning for log data stored in Amazon S3.
Make sure that log data is securely stored and protected from unauthorized access by using AWS Key Management Service (AWS KMS) for encryption at rest and implementing restrictive IAM policies and resource-based policies to control access to log data.
Retain log data for an appropriate period based on compliance requirements, using CloudTrail log file integrity validation and CloudWatch Logs retention periods and data archiving capabilities.
User activity monitoring and tracking:
Use CloudTrail for logging and monitoring API calls, especially Amazon Bedrock API calls and other API activities within the AWS environment, such as API Gateway, Lambda, and DynamoDB. Additionally, use CloudWatch for monitoring metrics specific to Amazon Bedrock, including the number of model invocations, latency, and error metrics (client-side errors, server-side errors, and throttling).
Integrate with security information and event management (SIEM) solutions for centralized log management and real-time monitoring of security events.
Data integrity and non-repudiation:
Implement digital signatures or non-repudiation mechanisms to verify the integrity and authenticity of logged data, minimizing tampering or repudiation of logged events. Use the CloudTrail log file integrity validation feature, which uses industry-standard algorithms (SHA-256 for hashing and SHA-256 with RSA for digital signing) to provide non-repudiation and verify log data integrity. For log data stored in Amazon S3, enable S3 Object Lock and S3 Versioning to provide an immutable, write once, read many (WORM) data storage model, helping to prevent object deletions or modifications, and maintaining data integrity and non-repudiation. Additionally, implement S3 bucket policies and IAM policies to restrict access to log data stored in S3, further enhancing the security and non-repudiation of logged events.
Anti-pattern 5: Insecure data storage and access controls
Insecure data storage and access controls in a generative AI chatbot application can lead to significant risks, including information disclosure, data tampering, and unauthorized access. Storing sensitive data, such as chat history, in an unencrypted or insecure manner can result in information disclosure if the data store is compromised or accessed by unauthorized entities. Additionally, a lack of proper access controls can allow unauthorized parties to access, modify, or delete data, leading to data tampering or unauthorized access.
Anti-pattern examples
Storing chat history data in DynamoDB without encryption at rest using AWS KMS customer-managed keys (CMKs).
Lack of encryption at rest using CMKs from AWS KMS for data in OpenSearch, Amazon S3, or other components that handle sensitive data.
Overly permissive access controls or lack of fine-grained access control mechanisms for the DynamoDB chat history, OpenSearch, Amazon S3, or other data stores, increasing the risk of unauthorized access or data breaches.
Storing sensitive data in clear text, or using insecure encryption algorithms or key management practices.
Failure to regularly review and rotate encryption keys or update access control policies to address potential security vulnerabilities or changes in access requirements.
Mitigation strategies
To mitigate the risks associated with insecure data storage and access controls, implement robust encryption mechanisms, secure key management practices, and fine-grained access control policies. Encrypting sensitive data at rest and in transit, using customer-managed encryption keys from AWS KMS, and implementing least- privilege access controls based on IAM policies and resource-based policies can significantly enhance the security and protection of data within the chatbot application architecture.
Key management and encryption at rest:
Implement AWS KMS to manage and control access to CMKs for data encryption across components like DynamoDB, OpenSearch, and Amazon S3.
Use CMKs to configure DynamoDB to automatically encrypt chat history data at rest.
Configure OpenSearch and Amazon S3 to use encryption at rest with AWS KMS CMKs for data stored in these services.
CMKs provide enhanced security and control, allowing you to create, rotate, disable, and revoke encryption keys, enabling better key isolation and separation of duties.
CMKs enable you to enforce key policies, audit key usage, and adhere to regulatory requirements or organizational policies that mandate customer-managed encryption keys.
CMKs offer portability and independence from specific services, allowing you to migrate or integrate data across multiple services while maintaining control over the encryption keys.
AWS KMS provides a centralized and secure key management solution, simplifying the management and auditing of encryption keys across various components and services.
Regular key rotation to maintain the security of your encrypted data.
Separation of duties to make sure that no single individual has complete control over key management operations.
Strict access controls for key management operations, using IAM policies and roles to enforce the principle of least privilege.
Fine-grained access controls:
Implement fine-grained access controls for the DynamoDB chat history data store, OpenSearch, Amazon S3, and other data stores using IAM policies and roles.
Implement fine-grained access controls and define least-privilege access policies for all resources handling sensitive data, such as the DynamoDB chat history data store, OpenSearch, Amazon S3, and other data stores or services. For example, use IAM policies and resource-based policies to restrict access to specific DynamoDB tables, OpenSearch domains, and S3 buckets, limiting access to only the necessary actions (for example, read, write, and list) based on the principle of least privilege. Extend this approach to all resources handling sensitive data within the chatbot application architecture, making sure that access is granted only to the minimum required resources and actions necessary for each component or user role.
Continuous improvement:
Regularly review and update encryption configurations, access control policies, and key management practices to address potential security vulnerabilities or changes in access requirements.
Anti-pattern 6: Failure to secure FM and generative AI components
Inadequate security measures for FMs and generative AI components in a chatbot application can lead to severe risks, including model tampering, unintended information disclosure, and denial of service. Threat actors can manipulate unsecured FMs and generative AI models to generate biased, harmful, or malicious responses, potentially causing significant harm or reputational damage.
Lack of proper access controls or input validation can result in unintended information disclosure, where sensitive data is inadvertently included in model responses. Additionally, insecure FM or generative AI components can be vulnerable to denial-of-service events, disrupting the availability of the chatbot application and impacting its functionality.
Anti-pattern examples
Insecure model fine tuning practices, such as using untrusted or compromised data sources, can lead to biased or malicious models.
Lack of continuous monitoring for FM and generative AI components, leaving them vulnerable to emerging threats or known vulnerabilities.
Lack of guardrails or safety measures to control and filter the outputs of FMs and generative AI components, potentially leading to the generation of harmful, biased, or undesirable content.
Inadequate access controls or input validation for prompts and context data sent to the FM components, increasing the risk of injection events or unintended information disclosure.
Failure to implement secure deployment practices for FM and generative AI components, including secure communication channels, encryption of model artifacts, and access controls.
Mitigation strategies
To mitigate the risks associated with inadequately secured foundational models (FMs) and generative AI components, implement secure integration mechanisms, robust model fine-tuning and deployment practices, continuous monitoring, and effective guardrails and safety measures. These mitigation strategies help prevent model tampering, unintended information disclosure, denial-of-service events, and the generation of harmful or undesirable content, while ensuring the security, reliability, and ethical alignment of the chatbot application’s generative AI capabilities.
Secure integration with LLMs and knowledge bases:
Implement secure communication channels (for example HTTPS or PrivateLink) between Amazon Bedrock, OpenSearch, and the FM components to help prevent unauthorized access or data tampering.
Implement strict input validation and sanitization for prompts and context data sent to the FM components to help prevent injection events or unintended information disclosure.
Implement access controls and least-privilege principles for the OpenSearch integration to limit the data accessible to the LLM components.
Secure model fine tuning, deployment, and monitoring:
Establish secure and auditable fine-tuning pipelines, using trusted and vetted data sources, to help prevent tampering or the introduction of biases.
Implement secure deployment practices for FM and generative AI components, including access controls, secure communication channels, and encryption of model artifacts.
Continuously monitor FM and generative AI components for security vulnerabilities, performance issues, and unintended behavior.
Implement rate-limiting, throttling, and load-balancing mechanisms to help prevent denial-of-service events on FM and generative AI components.
Regularly review and audit FM and generative AI components for compliance with security policies, industry best practices, and regulatory requirements.
Guardrails and safety measures
Implement guardrails, which are safety measures designed to reduce harmful outputs and align the behavior of FMs and generative AI components with human values.
Use keyword-based filtering, metric-based thresholds, human oversight, and customized guardrails tailored to the specific risks and cultural and ethical norms of each application domain.
Monitor the effectiveness of guardrails through performance benchmarking and adversarial testing.
Jailbreak robustness testing
Conduct jailbreak robustness testing by prompting the FMs and generative AI components with a diverse set of jailbreak attempts across different prohibited scenarios to identify weaknesses and improve model robustness.
Anti-pattern 7: Lack of responsible AI governance and ethics
While the previous anti-patterns focused on technical security aspects, it is equally important to address the ethical and responsible governance of generative AI systems. Without strong governance frameworks, ethical guidelines, and accountability measures, chatbot applications can result in unintended consequences, biased outcomes, and a lack of transparency and trust.
Anti-pattern examples
Lack of an established ethical AI governance framework, including principles, policies, and processes to guide the responsible development and deployment of the generative AI chatbot application.
Insufficient measures to ensure transparency, explainability, and interpretability of the LLM and generative AI components, making it difficult to understand and audit their decision-making processes.
Absence of mechanisms for stakeholder engagement, public consultation, and consideration of societal impacts, potentially leading to a lack of trust and acceptance of the chatbot application.
Failure to address potential biases, discrimination, or unfairness in the training data, models, or outputs of the generative AI system.
Inadequate processes for testing, validation, and ongoing monitoring of the chatbot application’s ethical behavior and alignment with organizational values and societal norms.
Mitigation strategies
To minimize a lack of responsible AI governance and ethics, establish a comprehensive ethical AI governance framework, promote transparency and interpretability, engage stakeholders and consider societal impacts, address potential biases and fairness issues, implement continuous improvement and monitoring processes, and use guardrails and safety measures. These mitigation strategies help to foster trust, accountability, and ethical alignment in the development and deployment of the generative AI chatbot application, mitigating the risks of unintended consequences, biased outcomes, and a lack of transparency.
Ethical AI governance framework:
Establish an ethical AI governance framework, including principles, policies, and processes to guide the responsible development and deployment of the generative AI chatbot application.
Define clear ethical guidelines and decision-making frameworks to address potential ethical dilemmas, biases, or unintended consequences.
Implement accountability measures, such as designated ethics boards, ethics officers, or external advisory committees, to oversee the ethical development and deployment of the chatbot application.
Transparency and interpretability:
Implement measures to promote transparency and interpretability of the LLM and generative AI components, allowing for auditing and understanding of their decision-making processes.
Provide clear and accessible information to stakeholders and users about the chatbot application’s capabilities, limitations, and potential biases or ethical considerations.
Stakeholder engagement and societal impact:
Establish mechanisms for stakeholder engagement, public consultation, and consideration of societal impacts, fostering trust and acceptance of the chatbot application.
Conduct impact assessments to identify and mitigate potential negative consequences or risks to individuals, communities, or society.
Bias and fairness:
Address potential biases, discrimination, or unfairness in the training data, models, or outputs of the generative AI system through rigorous testing, bias mitigation techniques, and ongoing monitoring.
Promote diverse and inclusive representation in the development, testing, and governance processes to reduce potential biases and blind spots.
Continuous improvement and monitoring:
Implement processes for ongoing testing, validation, and monitoring of the chatbot application’s behavior and alignment with organizational values and societal norms.
Regularly review and update the AI governance framework, policies, and processes to address emerging ethical challenges, societal expectations, and regulatory developments.
Guardrails and safety measures:
Implement guardrails, such as Guardrails for Amazon Bedrock, which are safety measures designed to reduce harmful outputs and align the behavior of LLMs and generative AI components with human values and responsible AI policies.
Use Guardrails for Amazon Bedrock to define denied topics and content filters to remove undesirable and harmful content from interactions between users and your applications.
Define denied topics using natural language descriptions to specify topics or subject areas that are undesirable in the context of your application.
Configure content filters to set thresholds for filtering harmful content across categories such as hate, insults, sexuality, and violence based on your use cases and responsible AI policies.
Use the personally identifiable information (PII) redaction feature to redact information such as names, email addresses, and phone numbers from LLM-generated responses or block user inputs that contain PII.
Integrate Guardrails for Amazon Bedrock with CloudWatch to monitor and analyze user inputs and LLM responses that violate defined policies, enabling proactive detection and response to potential issues.
Monitor the effectiveness of guardrails through performance benchmarking and adversarial testing, continuously refining and updating the guardrails based on real-world usage and emerging ethical considerations.
Jailbreak robustness testing:
Conduct jailbreak robustness testing by prompting the LLMs and generative AI components with a diverse set of jailbreak attempts across different prohibited scenarios to identify weaknesses and improve model robustness.
Anti-pattern 8: Lack of comprehensive testing and validation
Inadequate testing and validation processes for the LLM system and the generative AI chatbot application can lead to unidentified vulnerabilities, performance bottlenecks, and availability issues. Without comprehensive testing and validation, organizations might fail to detect potential security risks, functionality gaps, or scalability and performance limitations before deploying the application in a production environment.
Anti-pattern examples
Lack of functional testing to validate the correctness and completeness of the LLM’s responses and the chatbot application’s features and functionalities.
Insufficient performance testing to identify bottlenecks, resource constraints, or scalability limitations under various load conditions.
Absence of security testing, such as penetration testing, vulnerability scanning, and adversarial testing to uncover potential security vulnerabilities or model exploits.
Failure to incorporate automated testing and validation processes into a continuous integration and continuous deployment (CI/CD) pipeline, leading to manual and one-time testing efforts that might overlook critical issues.
Inadequate testing of the chatbot application’s integration with external services and components, such as Amazon Bedrock, OpenSearch, and DynamoDB, potentially leading to compatibility issues or data integrity problems.
Mitigation strategies
To address the lack of comprehensive testing and validation, implement a robust testing strategy encompassing functional, performance, security, and integration testing. Integrate automated testing into a CI/CD pipeline, conduct security testing like threat modeling and penetration testing, and use adversarial validation techniques. Continuously improve testing processes to verify the reliability, security, and scalability of the generative AI chatbot application.
Comprehensive testing strategy:
Establish a comprehensive testing strategy that includes functional testing, performance testing, load testing, security testing, and integration testing for the LLM system and the overall chatbot application.
Define clear testing requirements, test cases, and acceptance criteria based on the application’s functional and non-functional requirements, as well as security and compliance standards.
Automated testing and CI/CD integration:
Incorporate automated testing and validation processes into a CI/CD pipeline, enabling continuous monitoring and assessment of the LLM’s performance, security, and reliability throughout its lifecycle.
Use automated testing tools and frameworks to streamline the testing process, improve test coverage, and facilitate regression testing.
Security testing and adversarial validation:
Conduct threat modeling exercises early in the design process and as soon as the design is finalized for the chatbot application architecture to proactively identify potential security risks and vulnerabilities. Subsequently, conduct regular security testing—including penetration testing, vulnerability scanning, and adversarial testing—to uncover and validate identified security vulnerabilities or model exploits.
Implement adversarial validation techniques, such as prompting the LLM with carefully crafted inputs designed to expose weaknesses or vulnerabilities, to improve the model’s robustness and security.
Performance and load testing:
Perform comprehensive performance and load testing to identify potential bottlenecks, resource constraints, or scalability limitations under various load conditions.
Use tools and techniques for load generation, stress testing, and capacity planning to ensure the chatbot application can handle anticipated user traffic and workloads.
Integration testing:
Conduct thorough integration testing to validate the chatbot application’s integration with external services and components, such as Amazon Bedrock, OpenSearch, and DynamoDB, maintaining seamless communication and data integrity.
Continuous improvement:
Regularly review and update the testing and validation processes to address emerging threats, new vulnerabilities, or changes in application requirements.
Use testing insights and results to continuously improve the LLM system, the chatbot application, and the overall security posture.
Common mitigation strategies for all anti-patterns
Regularly review and update security measures, access controls, monitoring mechanisms, and guardrails for LLM and generative AI components to address emerging threats, vulnerabilities, and evolving responsible AI best practices.
Conduct regular security assessments, penetration testing, and code reviews to identify and remediate vulnerabilities or misconfigurations related to logging, auditing, and non-repudiation mechanisms.
Stay current with security best practices, guidance, and updates from AWS and industry organizations regarding logging, auditing, and non-repudiation for generative AI applications.
Secure and responsible architecture blueprint
After discussing the baseline chatbot application architecture and identifying critical security anti-patterns associated with generative AI applications built using Amazon Bedrock, we now present the secure and responsible architecture blueprint. This blueprint (Figure 2) incorporates the recommended mitigation strategies and security controls discussed throughout the anti-pattern analysis.
Figure 2: Secure and responsible generative AI chatbot architecture blueprint
In this target state architecture, unauthenticated users interact with the chatbot application through the frontend interface (1), where it’s crucial to mitigate the anti-pattern of insufficient input validation and sanitization by implementing secure coding practices and input validation. The user inputs are then processed through AWS Shield, AWS WAF, and CloudFront (2), which provide DDoS protection, web application firewall capabilities, and a content delivery network, respectively. These services help mitigate insufficient input validation, web exploits, and lack of comprehensive testing by using AWS WAF for input validation and conducting regular security testing.
The user requests are then routed through API Gateway (3), which acts as the entry point for the chatbot application, facilitating API connections to the Streamlit frontend. To address anti-patterns related to authentication, insecure communication, and LLM security, it’s essential to implement secure authentication protocols, HTTPS/TLS, access controls, and input validation within API Gateway. Communication between the VPC resources and API Gateway is secured through VPC endpoints (4), using PrivateLink for secure private communication and attaching endpoint policies to control which AWS principals can access the API Gateway service (8), mitigating the insecure communication channels anti-pattern.
The Streamlit application (5) is hosted on Amazon ECS in a private subnet within the VPC. It hosts the frontend interface and must implement secure coding practices and input validation to mitigate insufficient input validation and sanitization. User inputs are then processed by Lambda (6), a serverless compute service hosted within the VPC, which connects to Amazon Bedrock, OpenSearch, and DynamoDB through VPC endpoints (7). These VPC endpoints have endpoint policies attached to control access, enabling secure private communication between the Lambda function and the services, mitigating the insecure communication channels anti-pattern. Within Lambda, strict input validation rules, allow-lists, and user input sanitization are implemented to address the input validation anti-pattern.
User requests from the chatbot application are sent to Amazon Bedrock (12), a generative AI solution that powers the LLM capabilities. To mitigate the failure to secure FM and generative AI components anti-pattern, secure communication channels, input validation, and sanitization for prompts and context data must be implemented when interacting with Amazon Bedrock.
Amazon Bedrock interacts with OpenSearch Service (9) using Amazon Bedrock knowledge bases to retrieve relevant context data for the user’s question. The knowledge base is created by ingesting public documents from Amazon S3 (10). To mitigate the anti-pattern of insecure data storage and access controls, implement encryption at rest using AWS KMS and fine-grained IAM policies and roles for access control within OpenSearch Service. Titan Embeddings (11) are the format of the vector embeddings, which represent the documents stored in Amazon S3. The vector format enables similarity calculation and retrieval of relevant information (12). To address the failure to secure FM and generative AI components anti-pattern, secure integration with Titan Embeddings and input data validation should be implemented.
The knowledge base data, user prompts, and context data are processed by Amazon Bedrock (13) with the Claude 3 LLM (14). To address the anti-patterns of failure to secure FM and generative AI components, as well as lack of responsible AI governance and ethics, secure communication channels, input validation, ethical AI governance frameworks, transparency and interpretability measures, stakeholder engagement, bias mitigation, and guardrails like Guardrails for Amazon Bedrock should be implemented.
The generated responses and recommendations are then stored and retrieved in Amazon DynamoDB (15) by the Lambda function. To mitigate insecure data storage and access, encrypting data at rest with AWS KMS (16) and implement fine-grained access controls through IAM policies and roles.
Comprehensive logging, auditing, and monitoring mechanisms are provided by CloudTrail (17), CloudWatch (18), and AWS Config (19) to address the inadequate logging, auditing, and non-repudiation anti-pattern. See the Comprehensive logging and monitoring strategy section for detailed guidance on implementing comprehensive logging, auditing, and monitoring mechanisms using CloudTrail, CloudWatch, CloudWatch Logs, and AWS Config to address the inadequate logging, auditing, and non-repudiation anti-pattern; including logging API calls made to Amazon Bedrock service, monitoring Amazon Bedrock-specific metrics, capturing and analyzing Bedrock invocation logs, and monitoring and auditing the configuration of resources related to the chatbot application and Amazon Bedrock service.
IAM (20) plays a crucial role in the overall architecture and in mitigating anti-patterns related to authentication and insecure data storage and access. IAM roles and permissions are critical in enforcing secure authentication mechanisms, least privilege access, multi-factor authentication, and robust credential management across the various components of the chatbot application. Additionally, service control policies (SCPs) can be configured to restrict access to specific models or knowledge bases within Amazon Bedrock, preventing unauthorized access or use of sensitive intellectual property.
Finally, GuardDuty (21), Amazon Inspector (22), Security Hub (23), and Security Lake (24) have been included as additional recommended services to further enhance the security posture of the chatbot application. GuardDuty (21) provides threat detection across the control and data planes, Amazon Inspector (22) enables vulnerability assessments and continuous monitoring of Amazon ECS and Lambda workloads. Security Hub (23) offers centralized security posture management and compliance checks, while Security Lake (24) acts as a centralized data lake for log analysis, integrated with CloudTrail and SecurityHub.
Conclusion
By identifying critical anti-patterns and providing comprehensive mitigation strategies, you now have a solid foundation for a secure and responsible deployment of generative AI technologies in enterprise environments.
The secure and responsible architecture blueprint presented in this post serves as a comprehensive guide for organizations that want to use the power of generative AI while ensuring robust security, data protection, and ethical governance. By incorporating industry-leading security controls—such as secure authentication mechanisms, encrypted data storage, fine-grained access controls, secure communication channels, input validation and sanitization, comprehensive logging and auditing, secure FM integration and monitoring, and responsible AI guardrails—this blueprint addresses the unique challenges and vulnerabilities associated with generative AI applications.
Moreover, the emphasis on comprehensive testing and validation processes, as well as the incorporation of ethical AI governance principles, makes sure that you can not only mitigate potential risks, but also promote transparency, explainability, and interpretability of the LLM components, while addressing potential biases and ensuring alignment with organizational values and societal norms.
By following the guidance outlined in this post and depicted in the architectural blueprint, you can proactively identify and mitigate potential risks, enhance the security posture of your generative AI-based chatbot solutions, protect sensitive data and intellectual property, maintain regulatory compliance, and responsibly deploy LLMs and generative AI technologies in your enterprise environments.
If you have feedback about this post, submit comments in the Comments section below. If you have questions about this post, contact AWS Support.
Since the launch of tiered storage for Amazon Managed Streaming for Apache Kafka (Amazon MSK), customers have embraced this feature for its ability to optimize storage costs and improve performance. In previous posts, we explored the inner workings of Kafka, maximized the potential of Amazon MSK, and delved into the intricacies of Amazon MSK tiered storage. In this post, we deep dive into how tiered storage helps with faster broker recovery and quicker partition migrations, facilitating faster load balancing and broker scaling.
Apache Kafka availability
Apache Kafka is a distributed log service designed to provide high availability and fault tolerance. At its core, Kafka employs several mechanisms to provide reliable data delivery and resilience against failures:
Kafka replication – Kafka organizes data into topics, which are further divided into partitions. Each partition is replicated across multiple brokers, with one broker acting as the leader and the others as followers. If the leader broker fails, one of the follower brokers is automatically elected as the new leader, providing continuous data availability. The replication factor determines the number of replicas for each partition. Kafka maintains a list of in-sync replicas (ISRs) for each partition, which are the replicas that are up to date with the leader.
Producer acknowledgments – Kafka producers can specify the required acknowledgment level for write operations. This makes sure the data is durably persisted on the configured number of replicas before the producer receives an acknowledgment, reducing the risk of data loss.
Consumer group rebalancing – Kafka consumers are organized into consumer groups, where each consumer in the group is responsible for consuming a subset of the partitions. If a consumer fails, the partitions it was consuming are automatically reassigned to the remaining consumers in the group, providing continuous data consumption.
Zookeeper or KRaft for cluster coordination – Kafka relies on Apache ZooKeeper or KRaft for cluster coordination and metadata management. It maintains information about brokers, topics, partitions, and consumer offsets, enabling Kafka to recover from failures and maintain a consistent state across the cluster.
Kafka’s storage architecture and its impact on availability and resiliency
Although Kafka provides robust fault-tolerance mechanisms, in the traditional Kafka architecture, brokers store data locally on their attached storage volumes. This tight coupling of storage and compute resources can lead to several issues, impacting availability and resiliency of the cluster:
Slow broker recovery – When a broker fails, the recovery process involves transferring data from the remaining replicas to the new broker. This data transfer can be slow, especially for large data volumes, leading to prolonged periods of reduced availability and increased recovery times.
Inefficient load balancing – Load balancing in Kafka involves moving partitions between brokers to distribute the load evenly. However, this process can be resource-intensive and time-consuming, because it requires transferring large amounts of data between brokers.
Scaling limitations – Scaling a Kafka cluster traditionally involves adding new brokers and rebalancing partitions across the expanded set of brokers. This process can be disruptive and time-consuming, especially for large clusters with high data volumes.
How Amazon MSK tiered storage improves availability and resiliency
Amazon MSK offers tiered storage, a feature that allows configuring local and remote tiers. This greatly decouples compute and storage resources and thereby addresses the aforementioned challenges, improving availability and resiliency of Kafka clusters. You can benefit from the following:
Faster broker recovery – With tiered storage, data automatically moves from the faster Amazon Elastic Block Store (Amazon EBS) volumes to the more cost-effective storage tier over time. New messages are initially written to Amazon EBS for fast performance. Based on your local data retention policy, Amazon MSK transparently transitions that data to tiered storage. This frees up space on the EBS volumes for new messages. When broker fails and recovers either due to node or volume failure, the catch-up is faster because it only needs to catch up data stored on the local tier from the leader.
Efficient load balancing – Load balancing in Amazon MSK with tiered storage is more efficient because there is less data to move while reassigning partition. This process is faster and less resource-intensive, enabling more frequent and seamless load balancing operations.
Faster scaling – Scaling an MSK cluster with tiered storage is a seamless process. New brokers can be added to the cluster without the need for a large amount of data transfer and longer time for partition rebalancing. The new brokers can start serving traffic much faster, because the catch-up process takes less time, improving the overall cluster throughput and reducing downtime during scaling operations.
As shown in the following figure, MSK brokers and EBS volumes are tightly coupled. On a three-AZ deployed cluster, when you create a topic with replication factor three, Amazon MSK spreads those three replicas across all three Availability Zones and the EBS volumes attached with that broker store all the topic data spread across three Availability Zones. If you need to move a partition from one broker to another, Amazon MSK needs to move all the segments (both active and closed) from the existing broker to the new brokers, as illustrated in the following figure.
However, when you enable tiered storage for that topic, Amazon MSK transparently moves all closed segments for a topic from EBS volumes to tiered storage. That storage provides the built-in capability for durability and high availability with virtually unlimited storage capacity. With closed segments moved to tiered storage and only active segments on the local volume, your local storage footprint remains minimal regardless of topic size. If you need to move the partition to a new broker, the data movement is very minimal across the brokers. The following figure illustrates this updated configuration.
Amazon MSK tiered storage addresses the challenges posed by Kafka’s traditional storage architecture, enabling faster broker recovery, efficient load balancing, and seamless scaling, thereby improving availability and resiliency of your cluster. To learn more about the core components of Amazon MSK tiered storage, refer to Deep dive on Amazon MSK tiered storage.
A real-world test
We hope that you now understand how Amazon MSK tiered storage can improve your Kafka resiliency and availability. To test it, we created a three-node cluster with the new m7g instance type. We created a topic with a replication factor of three and without using tiered storage. Using the Kafka performance tool, we ingested 300 GB of data into the topic. Next, we added three new brokers to the cluster. Because Amazon MSK doesn’t automatically move partitions to these three new brokers, they will remain idle until we rebalance the partitions across all six brokers.
Let’s consider a scenario where we need to move all the partitions from the existing three brokers to the three new brokers. We used the kafka-reassign-partitions tool to move the partitions from the existing three brokers to the newly added three brokers. During this partition movement operation, we observed that the CPU usage was high, even though we weren’t performing any other operations on the cluster. This indicates that the high CPU usage was due to the data replication to the new brokers. As shown in the following metrics, the partition movement operation from broker 1 to broker 2 took approximately 75 minutes to complete.
Additionally, during this period, CPU utilization was elevated.
After completing the test, we enabled tiered storage on the topic with local.retention.ms=3600000 (1 hour) and retention.ms=31536000000. We continuously monitored the RemoteCopyBytesPerSec metrics to determine when the data migration to tiered storage was complete. After 6 hours, we observed zero activity on the RemoteCopyBytesPerSec metrics, indicating that all closed segments had been successfully moved to tiered storage. For instructions to enable tiered storage on an existing topic, refer to Enabling and disabling tiered storage on an existing topic.
We then performed the same test again, moving partitions to three empty brokers. This time, the partition movement operation was completed in just under 15 minutes, with no noticeable CPU usage, as shown in the following metrics. This is because, with tiered storage enabled, all the data has already been moved to the tiered storage, and we only have the active segment in the EBS volume. The partition movement operation is only moving the small active segment, which is why it takes less time and minimal CPU to complete the operation.
Conclusion
In this post, we explored how Amazon MSK tiered storage can significantly improve the scalability and resilience of Kafka. By automatically moving older data to the cost-effective tiered storage, Amazon MSK reduces the amount of data that needs to be managed on the local EBS volumes. This dramatically improves the speed and efficiency of critical Kafka operations like broker recovery, leader election, and partition reassignment. As demonstrated in the test scenario, enabling tiered storage reduced the time taken to move partitions between brokers from 75 minutes to just under 15 minutes, with minimal CPU impact. This enhanced the responsiveness and self-healing ability of the Kafka cluster, which is crucial for maintaining reliable, high-performance operations, even as data volumes continue to grow.
If you’re running Kafka and facing challenges with scalability or resilience, we highly recommend using Amazon MSK with the tiered storage feature. By taking advantage of this powerful capability, you can unlock the true scalability of Kafka and make sure your mission-critical applications can keep pace with ever-increasing data demands.
Sai Maddali is a Senior Manager Product Management at AWS who leads the product team for Amazon MSK. He is passionate about understanding customer needs, and using technology to deliver services that empowers customers to build innovative applications. Besides work, he enjoys traveling, cooking, and running.
Nagarjuna Koduru is a Principal Engineer in AWS, currently working for AWS Managed Streaming For Kafka (MSK). He led the teams that built MSK Serverless and MSK Tiered storage products. He previously led the team in Amazon JustWalkOut (JWO) that is responsible for real time tracking of shopper locations in the store. He played pivotal role in scaling the stateful stream processing infrastructure to support larger store formats and reducing the overall cost of the system. He has keen interest in stream processing, messaging and distributed storage infrastructure.
Masudur Rahaman Sayem is a Streaming Data Architect at AWS. He works with AWS customers globally to design and build data streaming architectures to solve real-world business problems. He specializes in optimizing solutions that use streaming data services and NoSQL. Sayem is very passionate about distributed computing.
Large-scale data warehouse migration to the cloud is a complex and challenging endeavor that many organizations undertake to modernize their data infrastructure, enhance data management capabilities, and unlock new business opportunities. As data volumes continue to grow exponentially, traditional data warehousing solutions may struggle to keep up with the increasing demands for scalability, performance, and advanced analytics.
Migrating to Amazon Redshift offers organizations the potential for improved price-performance, enhanced data processing, faster query response times, and better integration with technologies such as machine learning (ML) and artificial intelligence (AI). However, you might face significant challenges when planning for a large-scale data warehouse migration. These challenges can range from ensuring data quality and integrity during the migration process to addressing technical complexities related to data transformation, schema mapping, performance, and compatibility issues between the source and target data warehouses. Additionally, organizations must carefully consider factors such as cost implications, security and compliance requirements, change management processes, and the potential disruption to existing business operations during the migration. Effective planning, thorough risk assessment, and a well-designed migration strategy are crucial to mitigating these challenges and implementing a successful transition to the new data warehouse environment on Amazon Redshift.
In this post, we discuss best practices for assessing, planning, and implementing a large-scale data warehouse migration into Amazon Redshift.
Success criteria for large-scale migration
The following diagram illustrates a scalable migration pattern for an extract, load, and transform (ELT) scenario using Amazon Redshift data sharing patterns.
The following diagram illustrates a scalable migration pattern for extract, transform, and load (ETL) scenario.
Success criteria alignment by all stakeholders (producers, consumers, operators, auditors) is key for successful transition to a new Amazon Redshift modern data architecture. The success criteria are the key performance indicators (KPIs) for each component of the data workflow. This includes the ETL processes that capture source data, the functional refinement and creation of data products, the aggregation for business metrics, and the consumption from analytics, business intelligence (BI), and ML.
KPIs make sure you can track and audit optimal implementation, achieve consumer satisfaction and trust, and minimize disruptions during the final transition. They measure workload trends, cost usage, data flow throughput, consumer data rendering, and real-life performance. This makes sure the new data platform can meet current and future business goals.
Migration from a large-scale mission-critical monolithic legacy data warehouse (such as Oracle, Netezza, Teradata, or Greenplum) is typically planned and implemented over 6–16 months, depending on the complexity of the existing implementation. The monolithic data warehouse environments that have been built over the last 30 years contain proprietary business logic and multiple data design patterns, including an operation data store, star or Snowflake schema, dimension and facts, data warehouses and data marts, online transaction processing (OLTP) real-time dashboards, and online analytic processing (OLAP) cubes with multi-dimensional analytics. The data warehouse is highly business critical with minimal allowable downtime. If your data warehouse platform has gone through multiple enhancements over the years, your operational service levels documentation may not be current with the latest operational metrics and desired SLAs for each tenant (such as business unit, data domain, or organization group).
As part of the success criteria for operational service levels, you need to document the expected service levels for the new Amazon Redshift data warehouse environment. This includes the expected response time limits for dashboard queries or analytical queries, elapsed runtime for daily ETL jobs, desired elapsed time for data sharing with consumers, total number of tenants with concurrency of loads and reports, and mission-critical reports for executives or factory operations.
As part of your modern data architecture transition strategy, the migration goal of a new Amazon Redshift based platform is to use the scalability, performance, cost-optimization, and additional lake house capabilities of Amazon Redshift, resulting in improving the existing data consumption experience. Depending on your enterprise’s culture and goals, your migration pattern of a legacy multi-tenant data platform to Amazon Redshift could use one of the following strategies:
Strangler strategy – This involves creating an abstraction layer for consumption and transitioning one component at a time. For more details, see Strangler Fig Application.
A majority of organizations opt for the organic strategy (lift and shift) when migrating their large data platforms to Amazon Redshift. This approach uses AWS migration tools such as the AWS Schema Conversion Tool (AWS SCT) or the managed service version DMS Schema Conversion to rapidly meet goals around data center exit, cloud adoption, reducing legacy licensing costs, and replacing legacy platforms.
By establishing clear success criteria and monitoring KPIs, you can implement a smooth migration to Amazon Redshift that meets performance and operational goals. Thoughtful planning and optimization are crucial, including optimizing your Amazon Redshift configuration and workload management, addressing concurrency needs, implementing scalability, tuning performance for large result sets, minimizing schema locking, and optimizing join strategies. This will enable right-sizing the Redshift data warehouse to meet workload demands cost-effectively. Thorough testing and performance optimization will facilitate a smooth transition with minimal disruption to end-users, fostering exceptional user experiences and satisfaction. A successful migration can be accomplished through proactive planning, continuous monitoring, and performance fine-tuning, thereby aligning with and delivering on business objectives.
Migration involves the following phases, which we delve into in the subsequent sections:
Assessment
Discovery of workload and integrations
Dependency analysis
Effort estimation
Team sizing
Strategic wave planning
Functional and performance
Code conversion
Data validation
Measure and benchmark KPIs
Platform-level KPIs
Tenant-level KPIs
Consumer-level KPIs
Sample SQL
Monitoring Amazon Redshift performance and continual optimization
Identify top offending queries
Optimization strategies
To achieve a successful Amazon Redshift migration, it’s important to address these infrastructure, security, and deployment considerations simultaneously, thereby implementing a smooth and secure transition.
Assessment
In this section, we discuss the steps you can take in the assessment phase.
Discovery of workload and integrations
Conducting discovery and assessment for migrating a large on-premises data warehouse to Amazon Redshift is a critical step in the migration process. This phase helps identify potential challenges, assess the complexity of the migration, and gather the necessary information to plan and implement the migration effectively. You can use the following steps:
Data profiling and assessment – This involves analyzing the schema, data types, table sizes, and dependencies. Special attention should be given to complex data types such as arrays, JSON, or custom data types and custom user-defined functions (UDFs), because they may require specific handling during the migration process. Additionally, it’s essential to assess the volume of data and daily incremental data to be migrated, and estimate the required storage capacity in Amazon Redshift. Furthermore, analyzing the existing workload patterns, queries, and performance characteristics provides valuable insights into the resource requirements needed to optimize the performance of the migrated data warehouse in Amazon Redshift.
Code and query assessment – It’s crucial to assess the compatibility of existing SQL code, including queries, stored procedures, and functions. The AWS SCT can help identify any unsupported features, syntax, or functions that need to be rewritten or replaced to achieve a seamless integration with Amazon Redshift. Additionally, it’s essential to evaluate the complexity of the existing processes and determine if they require redesigning or optimization to align with Amazon Redshift best practices.
Performance and scalability assessment – This includes identifying performance bottlenecks, concurrency issues, or resource constraints that may be hindering optimal performance. This analysis helps determine the need for performance tuning or workload management techniques that may be required to achieve optimal performance and scalability in the Amazon Redshift environment.
Application integrations and mapping – Embarking on a data warehouse migration to a new platform necessitates a comprehensive understanding of the existing technology stack and business processes intertwined with the legacy data warehouse. Consider the following:
Meticulously document all ETL processes, BI tools, and scheduling mechanisms employed in conjunction with the current data warehouse. This includes commercial tools, custom scripts, and any APIs or connectors interfacing with source systems.
Take note of any custom code, frameworks, or mechanisms utilized in the legacy data warehouse for tasks such as managing slowly changing dimensions (SCDs), generating surrogate keys, implementing business logic, and other specialized functionalities. These components may require redevelopment or adaptation to operate seamlessly on the new platform.
Identify all upstream and downstream applications, as well as business processes that rely on the data warehouse. Map out their specific dependencies on database objects, tables, views, and other components. Trace the flow of data from its origins in the source systems, through the data warehouse, and ultimately to its consumption by reporting, analytics, and other downstream processes.
Security and access control assessment – This includes reviewing the existing security model, including user roles, permissions, access controls, data retention policies, and any compliance requirements and industry regulations that need to be adhered to.
Dependency analysis
Understanding dependencies between objects is crucial for a successful migration. You can use system catalog views and custom queries on your on-premises data warehouses to create a comprehensive object dependency report. This report shows how tables, views, and stored procedures rely on each other. This also involves analyzing indirect dependencies (for example, a view built on top of another view, which in turn uses a set of tables), and having a complete understanding of data usage patterns.
Effort estimation
The discovery phase serves as your compass for estimating the migration effort. You can translate those insights into a clear roadmap as follows:
Object classification and complexity assessment – Based on the discovery findings, categorize objects (tables, views, stored procedures, and so on) based on their complexity. Simple tables with minimal dependencies will require less effort to migrate than intricate views or stored procedures with complex logic.
Migration tools – Use the AWS SCT to estimate the base migration effort per object type. The AWS SCT can automate schema conversion, data type mapping, and function conversion, reducing manual effort.
Additional considerations – Factor in additional tasks beyond schema conversion. This may include data cleansing, schema optimization for Amazon Redshift performance, unit testing of migrated objects, and migration script development for complex procedures. The discovery phase sheds light on potential schema complexities, allowing you to accurately estimate the effort required for these tasks.
Team sizing
With a clear picture of the effort estimate, you can now size the team for the migration.
Person-months calculation
Divide the total estimated effort by the desired project duration to determine the total person-months required. This provides a high-level understanding of the team size needed.
For example, for a ELT migration project from an on-premises data warehouse to Amazon Redshift to be completed within 6 months, we estimate the team requirements based on the number of schemas or tenants (for example, 30), number of database tables (for example, 5,000), average migration estimate for a schema (for example, 4 weeks based on complexity of stored procedures, tables and views, platform-specific routines, and materialized views), and number of business functions (for example, 2,000 segmented by simple, medium, and complex patterns). We can determine the following are needed:
Migration time period (65% migration/35% for validation & transition) = 0.8* 6 months = 5 months or 22 weeks
Dedicated teams = Number of tenants / (migration time period) / (average migration period for a tenant) = 30/5/1 = 6 teams
Migration team structure:
One to three data developers with stored procedure conversion expertise per team, performing over 25 conversions per week
One data validation engineer per team, testing over 50 objects per week
One to two data visualization experts per team, confirming consumer downstream applications are accurate and performant
A common shared DBA team with performance tuning expertise responding to standardization and challenges
A platform architecture team (3–5 individuals) focused on platform design, service levels, availability, operational standards, cost, observability, scalability, performance, and design pattern issue resolutions
Team composition expertise
Based on the skillsets required for various migration tasks, we assemble a team with the right expertise. Platform architects define a well-architected platform. Data engineers are crucial for schema conversion and data transformation, and DBAs can handle cluster configuration and workload monitoring. An engagement or project management team makes sure the project runs smoothly, on time, and within budget.
For example, for an ETL migration project from Informatica/Greenplum to a target Redshift lakehouse with an Amazon Simple Storage Service (Amazon S3) data lake to be completed within 12 months, we estimate the team requirements based on the number of schemas and tenants (for example, 50 schemas), number of database tables (for example, 10,000), average migration estimate for a schema (6 weeks based on complexity of database objects), and number of business functions (for example, 5,000 segmented by simple, medium, and complex patterns). We can determine the following are needed:
An open data format ingestion architecture processing the source dataset and refining the data in the S3 data lake. This requires a dedicated team of 3–7 members building a serverless data lake for all data sources. Ingestion migration implementation is segmented by tenants and type of ingestion patterns, such as internal database change data capture (CDC); data streaming, clickstream, and Internet of Things (IoT); public dataset capture; partner data transfer; and file ingestion patterns.
The migration team composition is tailored to the needs of a project wave. Depending on each migration wave and what is being done in the wave (development, testing, or performance tuning), the right people will be engaged. When the wave is complete, the people from that wave will move to another wave.
A loading team builds a producer-consumer architecture in Amazon Redshift to process concurrent near real-time publishing of data. This requires a dedicated team of 3–7 members building and publishing refined datasets in Amazon Redshift.
A shared DBA group of 3–5 individuals helping with schema standardization, migration challenges, and performance optimization outside the automated conversion.
Data transformation experts to convert database stored functions in the producer or consumer.
A migration sprint plan for 10 months with 2 sprint weeks with multiple waves to release tenants to the new architecture.
A validation team to confirm a reliable and complete migration.
One to two data visualization experts per team, confirming that consumer downstream applications are accurate and performant.
A platform architecture team (3–5 individuals) focused on platform design, service levels, availability, operational standards, cost, observability, scalability, performance, and design pattern issue resolutions.
Strategic wave planning
Migration waves can be determined as follows:
Dependency-based wave delineation – Objects can be grouped into migration waves based on their dependency relationships. Objects with no or minimal dependencies will be prioritized for earlier waves, whereas those with complex dependencies will be migrated in subsequent waves. This provides a smooth and sequential migration process.
Logical schema and business area alignment – You can further revise migration waves by considering logical schema and business areas. This allows you to migrate related data objects together, minimizing disruption to specific business functions.
Functional and performance
In this section, we discuss the steps for refactoring the legacy SQL codebase to leverage Redshift SQL best practices, build validation routines to ensure accuracy and completeness during the transition to Redshift, capturing KPIs to ensure similar or better service levels for consumption tools/downstream applications, and incorporating performance hooks and procedures for scalable and performant Redshift Platform.
Code conversion
We recommend using the AWS SCT as the first step in the code conversion journey. The AWS SCT is a powerful tool that can streamline the database schema and code migrations to Amazon Redshift. With its intuitive interface and automated conversion capabilities, the AWS SCT can significantly reduce the manual effort required during the migration process. Refer to Converting data warehouse schemas to Amazon Redshift using AWS SCT for instructions to convert your database schema, including tables, views, functions, and stored procedures, to Amazon Redshift format. For an Oracle source, you can also use the managed service version DMS Schema Conversion.
When the conversion is complete, the AWS SCT generates a detailed conversion report. This report highlights any potential issues, incompatibilities, or areas requiring manual intervention. Although the AWS SCT automates a significant portion of the conversion process, manual review and modifications are often necessary to address various complexities and optimizations.
Some common cases where manual review and modifications are typically required include:
Incompatible data types – The AWS SCT may not always handle custom or non-standard data types, requiring manual intervention to map them to compatible Amazon Redshift data types.
Database-specific SQL extensions or proprietary functions – If the source database uses SQL extensions or proprietary functions specific to the database vendor (for example, STRING_AGG() or ARRAY_UPPER functions, or custom UDFs for PostgreSQL), these may need to be manually rewritten or replaced with equivalent Amazon Redshift functions or UDFs. The AWS SCT extension pack is an add-on module that emulates functions present in a source database that are required when converting objects to the target database.
Performance optimization – Although the AWS SCT can convert the schema and code, manual optimization is often necessary to take advantage of the features and capabilities of Amazon Redshift. This may include adjusting distribution and sort keys, converting row-by-row operations to set-based operations, optimizing query plans, and other performance tuning techniques specific to Amazon Redshift.
Stored procedures and code conversion – The AWS SCT offers comprehensive capabilities to seamlessly migrate stored procedures and other code objects across platforms. Although its automated conversion process efficiently handles the majority of cases, certain intricate scenarios may necessitate manual intervention due to the complexity of the code and utilization of database-specific features or extensions. To achieve optimal compatibility and accuracy, it’s advisable to undertake testing and validation procedures during the migration process.
After you address the issues identified during the manual review process, it’s crucial to thoroughly test the converted stored procedures, as well as other database objects and code, such as views, functions, and SQL extensions, in a non-production Redshift cluster before deploying them in the production environment. This exercise is mostly undertaken by QA teams. This phase also involves conducting holistic performance testing (individual queries, batch loads, consumption reports and dashboards in BI tools, data mining applications, ML algorithms, and other relevant use cases) in addition to functional testing to make sure the converted code meets the required performance expectations. The performance tests should simulate production-like workloads and data volumes to validate the performance under realistic conditions.
Data validation
When migrating data from an on-premises data warehouse to a Redshift cluster on AWS, data validation is a crucial step to confirm the integrity and accuracy of the migrated data. There are several approaches you can consider:
Custom scripts – Use scripting languages like Python, SQL, or Bash to develop custom data validation scripts tailored to your specific data validation requirements. These scripts can connect to both the source and target databases, extract data, perform comparisons, and generate reports.
Open source tools – Use open source data validation tools like Amazon Deequ or Great Expectations. These tools provide frameworks and utilities for defining data quality rules, validating data, and generating reports.
AWS native or commercial tools – Use AWS native tools such as AWS Glue Data Quality or commercial data validation tools like Collibra Data Quality. These tools often provide comprehensive features, user-friendly interfaces, and dedicated support.
The following are different types of validation checks to consider:
Structural comparisons – Compare the list of columns and data types of columns between the source and target (Amazon Redshift). Any mismatches should be flagged.
Row count validation – Compare the row counts of each core table in the source data warehouse with the corresponding table in the target Redshift cluster. This is the most basic validation step to make sure no data has been lost or duplicated during the migration process.
Column-level validation – Validate individual columns by comparing column-level statistics (min, max, count, sum, average) for each column between the source and target databases. This can help identify any discrepancies in data values or data types.
You can also consider the following validation strategies:
Data profiling – Perform data profiling on the source and target databases to understand the data characteristics, identify outliers, and detect potential data quality issues. For example, you can use the data profiling capabilities of AWS Glue Data Quality or the Amazon Deequ
Reconciliation reports – Produce detailed validation reports that highlight errors, mismatches, and data quality issues. Consider generating reports in various formats (CSV, JSON, HTML) for straightforward consumption and integration with monitoring tools.
Automate the validation process – Integrate the validation logic into your data migration or ETL pipelines using scheduling tools or workflow orchestrators like Apache Airflow or AWS Step Functions.
Lastly, keep in mind the following considerations for collaboration and communication:
Stakeholder involvement – Involve relevant stakeholders, such as business analysts, data owners, and subject matter experts, throughout the validation process to make sure business requirements and data quality expectations are met.
Reporting and sign-off – Establish a clear reporting and sign-off process for the validation results, involving all relevant stakeholders and decision-makers.
Measure and benchmark KPIs
For multi-tenant Amazon Redshift implementation, KPIs are segmented at the platform level, tenant level, and consumption tools level. KPIs evaluate the operational metrics, cost metrics, and end-user response time metrics. In this section, we discuss the KPIs needed for achieving a successful transition.
Platform-level KPIs
As new tenants are gradually migrated to the platform, it’s imperative to monitor the current state of Amazon Redshift platform-level KPIs. The current KPI’s state will help the platform team make the necessary scalability modifications (add nodes, add consumer clusters, add producer clusters, or increase concurrency scaling clusters). Amazon Redshift query monitoring rules (QMR) also help govern the overall state of data platform, providing optimal performance for all tenants by managing outlier workloads.
The following table summarizes the relevant platform-level KPIs.
Component
KPI
Service Level and Success Criteria
ETL
Ingestion data volume
Daily or hourly peak volume in GBps, number of objects, number of threads.
Ingestion threads
Peak hourly ingestion threads (COPY or INSERT), number of dependencies, KPI segmented by tenants and domains.
Stored procedure volume
Peak hourly stored procedure invocations segmented by tenants and domains.
Concurrent load
Peak concurrent load supported by the producer cluster; distribution of ingestion pattern across multiple producer clusters using data sharing.
Data sharing dependency
Data sharing between producer clusters (objects refreshed, locks per hour, waits per hour).
Workload
Number of queries
Peak hour query volume supported by cluster segmented by short (less than 10 seconds), medium (less than 60 seconds), long (less than 5 minutes), very long (less than 30 minutes), and outlier (more than 30 minutes); segmented by tenant, domain, or sub-domain.
Number of queries per queue
Peak hour query volume supported by priority automatic WLM queue segmented by short (less than 10 seconds), medium (less than 60 seconds), long (less than 5 minutes), very long (less than 30 minutes), and outlier (more than 30 minutes); segmented by tenant, business group, domain, or sub-domain.
Runtime pattern
Total runtime per hour; max, median, and average run pattern; segmented by service class across clusters.
Wait time patterns
Total wait time per hour; max, median, and average wait pattern for queries waiting.
Performance
Leader node usage
Service level for leader node (recommended less than 80%).
Compute node CPU usage
Service level for compute node (recommended less than 90%).
Disk I/O usage per node
Service level for disk I/O per node.
QMR rules
Number of outlier queries stopped by QMR (large scan, large spilling disk, large runtime); logging thresholds for potential large queries running more than 5 minutes.
Historical trend of queries stored in historical archive table for all instances of queries in STL_WLM_QUERY; trend analysis over 30 days, 60 days, and 90 days to fine-tune the workload across clusters.
Cost
Total cost per month of Amazon Redshift platform
Service level for mix of instances (reserved, on-demand, serverless), cost of Concurrency Scaling, cost of Amazon Redshift Spectrum usage. Use AWS tools like AWS Cost Explorer or daily cost usage report to capture monthly costs for each component.
Service limits to monitor cost for concurrency scaling; invoke for outlier activity on spikes.
Daily Amazon Redshift Spectrum usage
Service limits to monitor cost for using Amazon Redshift Spectrum; invoke for outlier activity.
Redshift Managed Storage usage cost
Track usage of Redshift Managed Storage, monitoring wastage on temporary, archival, and old data assets.
Localization
Remote or on-premises tools
Service level for rendering large datasets to remote destinations.
Data transfer to remote tools
Data transfer to BI tools or workstations outside the Redshift cluster VPC; separation of datasets to Amazon S3 using the unload feature, avoiding bottlenecks at leader node.
Tenant-level KPIs
Tenant-level KPIs help capture current performance levels from the legacy system and document expected service levels for the data flow from the source capture to end-user consumption. The captured legacy KPIs assist in providing the best target modern Amazon Redshift platform (a single Redshift data warehouse, a lake house with Amazon Redshift Spectrum, and data sharing with the producer and consumer clusters). Cost usage tracking at the tenant level helps you spread the cost of a shared platform across tenants.
The following table summarizes the relevant tenant-level KPIs.
Component
KPI
Service Level and Success Criteria
Cost
Compute usage by tenant
Track usage by tenant, business group, or domain; capture query volume by business unit associating Redshift user identity to internal business unit; data observability by consumer usage for data products helping with cost attribution.
ETL
Orchestration SLA
Service level for daily data availability.
Runtime
Service level for data loading and transformation.
Data ingestion volume
Peak expected volume for service level guarantee.
Query consumption
Response time
Response time SLA for query patterns (dashboards, SQL analytics, ML analytics, BI tool caching).
Concurrency
Peak query consumers for tenant.
Query volume
Peak hourly volume service levels and daily query volumes.
Individual query response for critical data consumption
Service level and success criteria for critical workloads.
Consumer-level KPIs
A multi-tenant modern data platform can set service levels for a variety of consumer tools. The service levels provide guidance to end-users of the capability of the new deployment.
The following table summarizes the relevant consumer-level KPIs.
Consumer
KPI
Service Level and Success Criteria
BI tools
Large data extraction
Service level for unloading data for caching or query rendering a large result dataset.
Dashboards
Response time
Service level for data refresh.
SQL query tools
Response time
Service level for response time by query type.
Concurrency
Service level for concurrent query access by all consumers.
One-time analytics
Response time
Service level for large data unloads or aggregation.
ML analytics
Response time
Service level for large data unloads or aggregation.
Sample SQL
The post includes sample SQL to capture daily KPI metrics. The following example KPI dashboard trends assist in capturing historic workload patterns, identifying deviations in workload, and providing guidance on the platform workload capacity to meet the current workload and anticipated growth patterns.
The following figure shows a daily query volume snapshot (queries per day and queued queries per day, which waited a minimum of 5 seconds).
The following figure shows a daily usage KPI. It monitors percentage waits and median wait for waiting queries (identifies the minimal threshold for wait to compute waiting queries and median of all wait times to infer deviation patterns).
The following figure illustrates concurrency usage (monitors concurrency compute usage for Concurrency Scaling clusters).
The following figure shows a 30-day pattern (computes volume in terms of total runtime and total wait time).
Monitoring Redshift performance and continual optimization
Amazon Redshift uses automatic table optimization (ATO) to choose the right distribution style, sort keys, and encoding when you create a table with AUTO options. Therefore, it’s a good practice to take advantage of the AUTO feature and create tables with DISTSTYLE AUTO, SORTKEY AUTO, and ENCODING AUTO. When tables are created with AUTO options, Amazon Redshift initially creates tables with optimal keys for the best first-time query performance possible using information such as the primary key and data types. In addition, Amazon Redshift analyzes the data volume and query usage patterns to evolve the distribution strategy and sort keys to optimize performance over time. Finally, Amazon Redshift performs table maintenance activities on your tables that reduce fragmentation and make sure statistics are up to date.
During a large, phased migration, it’s important to monitor and measure Amazon Redshift performance against target KPIs at each phase and implement continual optimization. As new workloads are onboarded at each phase of the migration, it’s recommended to perform regular Redshift cluster reviews and analyze query pattern and performance. Cluster reviews can be done by engaging the Amazon Redshift specialist team through AWS Enterprise support or your AWS account team. The goal of a cluster review includes the following:
Use cases – Review the application use cases and determine if the design is suitable to solve for those use cases.
End-to-end architecture – Assess the current data pipeline architecture (ingestion, transformation, and consumption). For example, determine if too many small inserts are occurring and review their ETL pipeline. Determine if integration with other AWS services can be useful, such as AWS Lake Formation, Amazon Athena, Redshift Spectrum, or Amazon Redshift federation with PostgreSQL and MySQL.
Data model design – Review the data model and table design and provide recommendations for sort and distribution keys, keeping in mind best practices.
Performance – Review cluster performance metrics. Identify bottlenecks or irregularities and suggest recommendations. Dive deep into specific long-running queries to identify solutions specific to the customer’s workload.
Cost optimization – Provide recommendations to reduce costs where possible.
New features – Stay up to date with the new features in Amazon Redshift and identify where they can be used to meet these goals.
New workloads can introduce query patterns that could impact performance and miss target SLAs. A number of factors can affect query performance. In the following sections, we discuss aspects impacting query speed and optimizations for improving Redshift cluster performance.
Identify top offending queries
A compute node is partitioned into slices. More nodes means more processors and more slices, which enables you to redistribute the data as needed across the slices. However, more nodes also means greater expense, so you will need to find the balance of cost and performance that is appropriate for your system. For more information on Redshift cluster architecture, see Data warehouse system architecture. Each node type offers different sizes and limits to help you scale your cluster appropriately. The node size determines the storage capacity, memory, CPU, and price of each node in the cluster. For more information on node types, see Amazon Redshift pricing.
Redshift Test Drive is an open source tool that lets you evaluate which different data warehouse configuration options are best suited for your workload. We created Redshift Test Drive from Simple Replay and Amazon Redshift Node Configuration Comparison (see Compare different node types for your workload using Amazon Redshift for more details) to provide a single entry point for finding the best Amazon Redshift configuration for your workload. Redshift Test Drive also provides additional features such as a self-hosted analysis UI and the ability to replicate external objects that a Redshift workload may interact with. With Amazon Redshift Serverless, you can start with a base Redshift Processing Unit (RPU), and Redshift Serverless automatically scales based on your workload needs.
Optimization strategies
If you choose to fine-tune manually, the following are key concepts and considerations:
Data distribution – Amazon Redshift stores table data on the compute nodes according to a table’s distribution style. When you run a query, the query optimizer redistributes the data to the compute nodes as needed to perform any joins and aggregations. Choosing the right distribution style for a table helps minimize the impact of the redistribution step by locating the data where it needs to be before the joins are performed. For more information, see Working with data distribution styles.
Data sort order – Amazon Redshift stores table data on disk in sorted order according to a table’s sort keys. The query optimizer and query processor use the information about where the data is located to reduce the number of blocks that need to be scanned and thereby improve query speed. For more information, see Working with sort keys.
Dataset size – A higher volume of data in the cluster can slow query performance for queries, because more rows need to be scanned and redistributed. You can mitigate this effect by regular vacuuming and archiving of data, and by using a predicate (a condition in the WHERE clause) to restrict the query dataset.
Concurrent operations – Amazon Redshift offers a powerful feature called automatic workload management (WLM) with query priorities, which enhances query throughput and overall system performance. By intelligently managing multiple concurrent operations and allocating resources dynamically, automatic WLM makes sure high-priority queries receive the necessary resources promptly, while lower-priority queries are processed efficiently without compromising system stability. This advanced queuing mechanism allows Amazon Redshift to optimize resource utilization, minimizing potential bottlenecks and maximizing query throughput, ultimately delivering a seamless and responsive experience for users running multiple operations simultaneously.
Query structure – How your query is written will affect its performance. As much as possible, write queries to process and return as little data as will meet your needs. For more information, see Amazon Redshift best practices for designing queries.
Queries with a long return time – Queries with a long return time can impact the processing of other queries and overall performance of the cluster. It’s critical to identify and optimize them. You can optimize these queries by either moving clients to the same network or using the UNLOAD feature of Amazon Redshift, and then configure the client to read the output from Amazon S3. To identify percentile and top running queries, you can download the sample SQL notebook system queries. You can import this in Query Editor V2.0.
Conclusion
In this post, we discussed best practices for assessing, planning, and implementing a large-scale data warehouse migration into Amazon Redshift.
The assessment phase of a data migration project is critical for implementing a successful migration. It involves a comprehensive analysis of the existing workload, integrations, and dependencies to accurately estimate the effort required and determine the appropriate team size. Strategic wave planning is crucial for prioritizing and scheduling the migration tasks effectively. Establishing KPIs and benchmarking them helps measure progress and identify areas for improvement. Code conversion and data validation processes validate the integrity of the migrated data and applications. Monitoring Amazon Redshift performance, identifying and optimizing top offending queries, and conducting regular cluster reviews are essential for maintaining optimal performance and addressing any potential issues promptly.
By addressing these key aspects, organizations can seamlessly migrate their data workloads to Amazon Redshift while minimizing disruptions and maximizing the benefits of Amazon Redshift.
We hope this post provides you with valuable guidance. We welcome any thoughts or questions in the comments section.
About the authors
Chanpreet Singh is a Senior Lead Consultant at AWS, specializing in Data Analytics and AI/ML. He has over 17 years of industry experience and is passionate about helping customers build scalable data warehouses and big data solutions. In his spare time, Chanpreet loves to explore nature, read, and enjoy with his family.
Harshida Patel is a Analytics Specialist Principal Solutions Architect, with AWS.
Raza Hafeez is a Senior Product Manager at Amazon Redshift. He has over 13 years of professional experience building and optimizing enterprise data warehouses and is passionate about enabling customers to realize the power of their data. He specializes in migrating enterprise data warehouses to AWS Modern Data Architecture.
Ram Bhandarkar is a Principal Data Architect at AWS based out of Northern Virginia. He helps customers with planning future Enterprise Data Strategy and assists them with transition to Modern Data Architecture platform on AWS. He has worked with building and migrating databases, data warehouses and data lake solutions for over 25 years.
Vijay Bagur is a Sr. Technical Account Manager. He works with enterprise customers to modernize and cost optimize workloads, improve security posture, and helps them build reliable and secure applications on the AWS platform. Outside of work, he loves spending time with his family, biking and traveling.
The design of cloud workloads can be a complex task, where a perfect and universal solution doesn’t exist. We should balance all the different trade-offs and find an optimal solution based on our context. But how does it work in practice? Which guiding principles should we follow? Which are the most important areas we should focus on?
In this blog, we will try to answer some of these questions by sharing a set of resources related to the AWS Well-Architected Framework. The Framework shares a set of methods to help you understand the pros and cons of decisions you make while building cloud systems. By following this resource, you will learn architectural best practices for designing and operating reliable, secure, efficient, cost-effective, and sustainable systems in the cloud. The framework is constantly updated; it evolves as the technology landscape changes. Check out the latest updates from June 2024.
The AWS Well-Architected Framework is constantly updated across all six pillars. The security pillar added a new best practice area: application security (AppSec). In this session, you can learn about the best practices highlighted in this area. Review four key domains: organization and culture, security of the pipeline, security in the pipeline, and dependency management. Each area provides a set of principles that you can implement and provides a complete view of how you design, develop, build, deploy, and operate secure workloads in the cloud.
Figure 1. Security should be part of the end-to-end development process, and implementing best practices both in the application code as well as in the underlying infrastructure components.
How can we integrate different systems as a consequence of an acquisition? Mergers and acquisitions operations bring different people with different backgrounds together, with a need of driving systems convergence. Both organization and technical challenges can arise in this scenario. The Mergers and Acquisitions (M&A) Lens is a collection of customer-proven design principles, best practices, and prescriptive guidance to help you integrate the IT systems of two or more organizations. This lens helps companies follow AWS prescribed best practices during technical integration, drive cost optimization, and expedite merger and acquisition value realization.
Figure 2. If the seller company runs on another cloud platform or on-premises, the acquirer should plan a cloud migration while guaranteeing continuity of service.
One of the best ways to become familiar with new concepts and methodologies consist of doing hands-on work to absorb the techniques properly. For each Let’s Architect! blog, we tend to share at least one workshop associated with the topic. The AWS Well-Architected Framework covers six different pillars, so today we share the AWS Well-Architected Labs to cover each area of the framework. Feel free to jump across the different workshops and start building!
Figure 3. Sustainability is one of the pillars in the framework. Asynchronous and scheduled processing are key techniques for improving the sustainability and costs of cloud architectures.
Distributed systems are difficult to design. It’s even more difficult to test them and prove they are working. Formal methods enable the early discovery of design bugs that can escape the guardrails of design reviews and automated testing only to get uncovered in production. This video shows how AWS uses P, an open source, state machine–based programming language for formal modelling and analysis of distributed systems.
You can learn from AWS engineers and architects how to use P for your own applications to find bugs early in the development process and increase developer velocity. This tool is used in AWS to reason out the correctness of cloud services (for example, Amazon Simple Storage Service and Amazon DynamoDB).
Figure 4. An example of a distributed system for processing transactions.
Thanks for reading! Hopefully, you got interesting insights into the methodologies for designing Well-Architected systems. In the next blog, we will talk about multi-region architectures. We will understand when they are actually needed, and which design principles should be applied.
To revisit any of our previous posts or explore the entire series, visit the Let’s Architect! page.
Development teams adopt DevOps practices to increase the speed and quality of their software delivery. The DevOps Research and Assessment (DORA) metrics provide a popular method to measure progress towards that outcome. Using four key metrics, senior leaders can assess the current state of team maturity and address areas of optimization.
This blog post shows you how to make use of DORA metrics for your Amazon Web Services (AWS) environments. We share a sample solution which allows you to bootstrap automatic metric collection in your AWS accounts.
Benefits of collecting DORA metrics
DORA metrics offer insights into your development teams’ performance and capacity by measuring qualitative aspects of deployment speed and stability. They also indicate the teams’ ability to adapt by measuring the average time to recover from failure. This helps product owners in defining work priorities, establishing transparency on team maturity, and developing a realistic workload schedule. The metrics are appropriate for communication with senior leadership. They help commit leadership support to resolve systemic issues inhibiting team satisfaction and user experience.
Use case
This solution is applicable to the following use case:
Development teams have a multi-account AWS setup including a tooling account where the CI/CD tools are hosted, and an operations account for log aggregation and visualization.
Developers use GitHub code repositories and AWS CodePipeline to promote code changes across application environment accounts.
Service impairment resulting from system change is logged as OpsItem in AWS Systems Manager OpsCenter.
Overview of solution
The four key DORA metrics
The ‘four keys’ measure team performance and ability to react to problems:
Deployment Frequency measures the frequency of successful change releases in your production environment.
Lead Time For Changes measures the average time for committed code to reach production.
Change Failure Rate measures how often changes in production lead to service incidents/failures, and is complementary to Mean Time Between Failure.
Mean Time To Recovery measures the average time from service interruption to full recovery.
The first two metrics focus on deployment speed, while the other two indicate deployment stability (Figure 1). We recommend organizations to set their own goals (that is, DORA metric targets) based on service criticality and customer needs. For a discussion of prior DORA benchmark data and what it reveals about the performance of development teams, consult How DORA Metrics Can Measure and Improve Performance.
For example, the Change Failure Rate focuses on changes that impair the production system. Limiting the calculation to tags (such as hotfixes) on pull requests would exclude issues related to the build process. It’s important to match system change records that lead to actual impairments in production. Limiting the calculation to the number of failed deployments from the deployment pipeline only considers deployments that didn’t reach production. We use AWS Systems Manager OpsCenter as the system of records for change-related outages, rather than relying solely on data from CI/CD tools.
Similarly, Mean Time To Recovery measures the duration from a service impairment in production to a successful pipeline run. We encourage teams to track both pipeline status and recovery time, as frequent pipeline failure can indicate insufficient local testing and potential pipeline engineering issues.
Gathering DORA events
Our metric calculation process runs in four steps:
In the tooling account, we send events from CodePipeline to the default event bus of Amazon EventBridge.
Events are forwarded to custom event buses which process them according to the defined metrics and any filters we may have set up.
The custom event buses call AWS Lambda functions which forward metric data to Amazon CloudWatch. CloudWatch gives us an aggregated view of each of the metrics. From Amazon CloudWatch, you can send the metrics to another designated dashboard like Amazon Managed Grafana.
As part of the data collection, the Lambda function will also query GitHub for the relevant commit to calculate the lead time for changes metric. It will query AWS Systems Manager for OpsItem data for change failure rate and mean time to recovery metrics. You can create OpsItems manually as part of your change management process or configure CloudWatch alarms to create OpsItems automatically.
Figure 2 visualizes these steps. This setup can be replicated to a group of accounts of one or multiple teams.
Figure 2. DORA metric setup for AWS CodePipeline deployments
Walkthrough
Follow these steps to deploy the solution in your AWS accounts.
Prerequisites
For this walkthrough, you should have the following prerequisites:
AWS accounts for tooling, operations, and application environments
Before you start deploying or working with this code base, there are a few configurations you need to complete in the constants.py file in the cdk/ directory. Open the file in your IDE and update the following constants:
TOOLING_ACCOUNT_ID & TOOLING_ACCOUNT_REGION: These represent the AWS account ID and AWS region for AWS CodePipeline (that is, your tooling account).
OPS_ACCOUNT_ID & OPS_ACCOUNT_REGION: These are for your operations account (used for centralized log aggregation and dashboard).
TOOLING_CROSS_ACCOUNT_LAMBDA_ROLE: The IAM Role for cross-account access that allows AWS Lambda to post metrics from your tooling account to your operations account/Amazon CloudWatch dashboard.
DEFAULT_MAIN_BRANCH: This is the default branch in your code repository that’s used to deploy to your production application environment. It is set to “main” by default, as we assumed feature-driven development (GitFlow) on the main branch; update if you use a different naming convention.
APP_PROD_STAGE_NAME: This is the name of your production stage and set to “DeployPROD” by default. It’s reserved for teams with trunk-based development.
Setting up the environment
To set up your environment on MacOS and Linux:
Create a virtual environment:
$ python3 -m venv .venv
Activate the virtual environment: On MacOS and Linux:
$ source .venv/bin/activate
Alternatively, to set up your environment on Windows:
Create a virtual environment:
% .venv\Scripts\activate.bat
Install the required Python packages:
$ pip install -r requirements.txt
To configure the AWS Command Line Interface (AWS CLI):
Configure your user profile (for example, Ops for operations account, Tooling for tooling account). You can check user profile names in the credentials file.
Deploying the CloudFormation stacks
Switch directory
$ cd cdk
Bootstrap CDK
$ cdk bootstrap –-profile Ops
Synthesize the AWS CloudFormation template for this project:
$ cdk synth
To deploy a specific stack (see Figure 3 for an overview), specify the stack name and AWS account number(s) in the following command:
To launch the other stacks in the Operations account (including DoraOpsGitHubLogsStack, DoraOpsDeploymentFrequencyStack, DoraOpsLeadTimeForChangeStack, DoraOpsChangeFailureRateStack, DoraOpsMeanTimeToRestoreStack, DoraOpsMetricsDashboardStack):
$ cdk deploy DoraOps* --profile Ops
The following figure shows the resources you’ll launch with each CloudFormation stack. This includes six AWS CloudFormation stacks in operations account. The first stack sets up log integration for GitHub commit activity. Four stacks contain a Lambda function which creates one of the DORA metrics. The sixth stack creates the consolidated dashboard in Amazon CloudWatch.
Figure 3. Resources provisioned with this solution
Testing the deployment
To run the provided tests:
$ pytest
Understanding what you’ve built
Deployed resources in tooling account
The DoraToolingEventBridgeStack includes Amazon EventBridge rules with a target of the central event bus in the operations account, plus an AWS IAM role with cross-account access to put events in the operations account. The event pattern for invoking our EventBridge rules listens for deployment state changes in AWS CodePipeline:
{
  "detail-type": ["CodePipeline Pipeline Execution State Change"],
  "source": ["aws.codepipeline"]
}
Deployed resources in operations account
The Lambda function for Deployment Frequency tracks the number of successful deployments to production, and posts the metric data to Amazon CloudWatch. You can add a dimension with the repository name in Amazon CloudWatch to filter on particular repositories/teams.
The Lambda function for the Lead Time For Change metric calculates the duration from the first commit to successful deployment in production. This covers all factors contributing to lead time for changes, including code reviews, build, test, as well as the deployment itself.
The Lambda function for Change Failure Rate keeps track of the count of successful deployments and the count of system impairment records (OpsItems) in production. It publishes both as metrics to Amazon CloudWatch and the latter calculates the ratio, as shown in below example.
The Lambda function for Mean Time To Recovery keeps track of all deployments with status SUCCEEDED in production and whose repository branch name references an existing OpsItem ID. For every matching event, the function gets the creation time of the OpsItem record and posts the duration between OpsItem creation and successful re-deployment to the CloudWatch dashboard.
All Lambda functions publish metric data to Amazon CloudWatch using the PutMetricData API. The final calculation of the four keys is performed on the CloudWatch dashboard. The solution includes a simple CloudWatch dashboard so you can validate the end-to-end data flow and confirm that it has deployed successfully:
Cleaning up
Remember to delete example resources if you no longer need them to avoid incurring future costs.
Alternatively, go to the CloudFormation console in each AWS account, select the stacks related to DORA and click on Delete. Confirm that the status of all DORA stacks is DELETE_COMPLETE.
Conclusion
DORA metrics provide a popular method to measure the speed and stability of your deployments. The solution in this blog post helps you bootstrap automatic metric collection in your AWS accounts. The four keys help you gain consensus on team performance and provide data points to back improvement suggestions. We recommend using the solution to gain leadership support for systemic issues inhibiting team satisfaction and user experience. To learn more about developer productivity research, we encourage you to also review alternative frameworks including DevEx and SPACE.
In the era of big data, data lakes have emerged as a cornerstone for storing vast amounts of raw data in its native format. They support structured, semi-structured, and unstructured data, offering a flexible and scalable environment for data ingestion from multiple sources. Data lakes provide a unified repository for organizations to store and use large volumes of data. This enables more informed decision-making and innovative insights through various analytics and machine learning applications.
Despite their advantages, traditional data lake architectures often grapple with challenges such as understanding deviations from the most optimal state of the table over time, identifying issues in data pipelines, and monitoring a large number of tables. As data volumes grow, the complexity of maintaining operational excellence also increases. Monitoring and tracking issues in the data management lifecycle are essential for achieving operational excellence in data lakes.
This is where Apache Iceberg comes into play, offering a new approach to data lake management. Apache Iceberg is an open table format designed specifically to improve the performance, reliability, and scalability of data lakes. It addresses many of the shortcomings of traditional data lakes by providing features such as ACID transactions, schema evolution, row-level updates and deletes, and time travel.
In this blog post, we’ll discuss how the metadata layer of Apache Iceberg can be used to make data lakes more efficient. You will learn about an open-source solution that can collect important metrics from the Iceberg metadata layer. Based on collected metrics, we will provide recommendations on how to improve the efficiency of Iceberg tables. Additionally, you will learn how to use Amazon CloudWatch anomaly detection feature to detect ingestion issues.
Deep dive into Iceberg’s Metadata layer
Before diving into a solution, let’s understand how the Apache Iceberg metadata layer works. The Iceberg metadata layer provides an open specification instructing integrated big data engines such as Spark or Trino how to run read and write operations and how to resolve concurrency issues. It’s crucial for maintaining inter-operability between different engines. It stores detailed information about tables such as schema, partitioning, and file organization in versioned JSON and Avro files. This ensures that each change is tracked and reversible, enhancing data governance and auditability.
History and versioning: Iceberg’s versioning feature captures every change in table metadata as immutable snapshots, facilitating data integrity, historical views, and rollbacks.
File organization and snapshot management: Metadata closely manages data files, detailing file paths, formats, and partitions, supporting multiple file formats like Parquet, Avro, and ORC. This organization helps with efficient data retrieval through predicate pushdown, minimizing unnecessary data scans. Snapshot management allows concurrent data operations without interference, maintaining data consistency across transactions.
In addition to its core metadata management capabilities, Apache Iceberg also provides specialized metadata tables—snapshots, files, and partitions—that provide deeper insights and control over data management processes. These tables are dynamically generated and provide a live view of the metadata for query purposes, facilitating advanced data operations:
Snapshots table: This table lists all snapshots of a table, including snapshot IDs, timestamps, and operation types. It enables users to track changes over time and manage version history effectively.
Files table: The files table provides detailed information on each file in the table, including file paths, sizes, and partition values. It is essential for optimizing read and write performance.
Partitions table: This table shows how data is partitioned across different files and provides statistics for each partition, which is crucial for understanding and optimizing data distribution.
Metadata tables enhance Iceberg’s functionality by making metadata queries straightforward and efficient. Using these tables, data teams can gain precise control over data snapshots, file management, and partition strategies, further improving data system reliability and performance.
Before you get started
The next section describes a packaged open source solution using Apache Iceberg’s metadata layer and AWS services to enhance monitoring across your Iceberg tables.
Before we deep dive into the suggested solution, let’s mention Iceberg MetricsReporter, which is a native way to emit metrics for Apache Iceberg. It supports two types of reports: one for commits and one for scans. The default output is log based. It produces log files as a result of commit or scan operations. To submit metrics to CloudWatch or any other monitoring tool, users need to create and configure a custom MetricsReporter implementation. MetricsReporter is supported in Apache Iceberg v1.1.0 and later versions, and customers who want to use it must enable it through Spark configuration on their existing pipelines.
The following is deployed independently and doesn’t require any configuration changes to existing data pipelines. It can immediately start monitoring all the tables within the AWS account and AWS Region where it’s deployed. This solution introduces an additional latency of metrics arrival between 20 and 80 seconds compared to MetricsReporter but offers seamless integration without the need for custom configurations or changes to current workflows.
This solution uses an AWS Lambda deployment package to collect metrics from Apache Iceberg tables. The metrics are then submitted to CloudWatch where you can create metrics visualizations to help recognize trends and anomalies over time.
The solution is designed to be lightweight, focusing on collecting metrics directly from the Iceberg metadata layer without scanning the actual data layer. This approach significantly reduces the compute capacity required, making it efficient and cost-effective. Key features of the solution include:
Time-series metrics collection: The solution monitors Iceberg tables continuously to identify trends and detect anomalies in data ingestion rates, partition skewness, and more.
Event-driven architecture: The solution uses Amazon EventBridge to launch a Lambda function when the state of an AWS Glue Data Catalog table changes. This ensures real-time metrics collection every time a transaction is committed to an Iceberg table.
Efficient data retrieval: Incorporates minimal compute resources by utilizing AWS Glue interactive sessions and the pyiceberg library to directly access Iceberg metadata tables such as snapshots, partitions, and files.
Metrics tracked
As of the blog release date, the solution collects over 25 metrics. These metrics are categorized into several groups:
Snapshot metrics: Include total and changes in data files, delete files, records added or removed, and size changes.
Partition and file metrics: Aggregated and per-partition metrics like average, maximum, minimum record counts and file sizes, which help in understanding data distribution and help optimizing storage.
The solution also provides a sample CloudWatch dashboard to visualize the collected metrics. Metrics visualization is important for real-time monitoring and detecting operational issues. The provided helper script simplifies the set up and deployment of the dashboard.
You can go to the GitHub repository to learn more about how to deploy the solution in your AWS account.
What are the vital metrics for Apache Iceberg tables?
This section discusses specific metrics from Iceberg’s metadata and explains why they’re important for monitoring data quality and system performance. The metrics are broken down into three parts: insight, challenge, and action. This provides a clear path for practical application. In this section, we provide only a subset of the available metrics that the solution can collect, for a complete list, see the solution Github page.
Metric insight: The number of data files and number of records added to the table during the last transaction. The ingestion rate measures the speed at which new data is added to the data lake. This metric helps identify bottlenecks or inefficiencies in data pipelines, guiding capacity planning and scalability decisions.
Challenge: A sudden drop in the ingestion rate can indicate failures in data ingestion pipelines, source system outages, configuration errors or traffic spikes.
Action: Teams need to establish real-time monitoring and alert systems to detect drops in ingestion rates promptly, allowing quick investigations and resolutions.
2. files.avg_record_count, files.avg_file_size
Metric insight: These metrics provide insights into the distribution and storage efficiency of the table. Small file sizes might suggest excessive fragmentation.
Challenge: Excessively small file sizes can indicate inefficient data storage leading to increased read operations and higher I/O costs.
Action: Implementing regular data compaction processes helps consolidate small files, optimizing storage and enhancing content delivery speeds as demonstrated by a streaming service. Data Catalog offers automatic compaction of Apache Iceberg tables. To learn more about compacting Apache Iceberg tables, see Enable compaction in Working with tables on the AWS Glue console.
Metric insight: The metrics indicate the asymmetry of the data distribution across the available table partitions. A skewness value of zero, or very close to zero, suggests that the data is balanced. Positive or negative skewness values might indicate a problem.
Challenge: Imbalances in data distribution across partitions can lead to inefficiencies and slow query responses.
Action: Regularly analyze data distribution metrics to adjust partitioning configuration. Apache Iceberg allows you to transform partitions dynamically, which enables optimization of table partitioning as query patterns or data volumes change, without impacting your existing data.
Metric insight: Deletion metrics in Apache Iceberg provide important information on the volume and nature of data deletions within a table. These metrics help track how often data is removed or updated, which is essential for managing data lifecycle and compliance with data retention policies.
Challenge: High values in these metrics can indicate excessive deletions or updates, which might lead to fragmentation and decreased query performance.
Action: To address these challenges, run compaction periodically to ensure deleted rows do not persist in new files. Regularly review and adjust data retention policies and consider expiring old snapshots to keep only necessary amount of data files. You can run compaction operation on specific partitions using Amazon Athena Optimize
Effective monitoring is essential for making informed decisions about necessary maintenance actions for Apache Iceberg tables. Determining the right timing for these actions is crucial. Implementing timely preventative maintenance ensures high operational efficiency of the data lake and helps to address potential issues before they become significant problems.
Using Amazon CloudWatch for anomaly detection and alerts
This section assumes that you have completed the solution setup and collected operational metrics from your Apache Iceberg tables into Amazon CloudWatch.
Now you can start setting up some alerts and detect anomalies.
We guide you on setting up the anomaly detection and configuring alerts in CloudWatch to monitor the snapshot.added_records metric, which indicates the ingestion rate of data written into an Apache Iceberg table.
Set up anomaly detection
CloudWatch anomaly detection applies machine learning algorithms to continuously analyze system metrics, determine normal baselines, and identify items that are outside of the established patterns. Here is how you configure it:
Select Metrics: In the AWS Management Console for Cloudwatch, go to the Metrics tab and search for and select snapshot.added_records.
Create anomaly detection models: Choose the Graphed metrics tab and click the Pulse icon to enable anomaly detection.
Set Sensitivity: The second parameter of the ANOMALY_DETECTION_BAND (m1, 5) is to adjust the sensitivity of the anomaly detection. The goal is to balance detecting real issues and reducing false positives.
Configure alerts
After the anomaly detection model is set up, set up an alert to notify operations teams about potential issues:
Create alarm: Choose the bell icon under Actions on the same Graphed metrics tab.
Alarm settings: Set the alarm to notify the operations team when the snapshot.added_records metric is outside the anomaly detection band for two consecutive periods. This helps reduce the risk of false alerts.
Alarm actions: Configure CloudWatch to send an alarm email to the operations team. In addition to sending emails, CloudWatch alarm actions can automatically launch remediation processes, such as scaling operations or initiating data compaction.
Best practices
Regularly review and adjust models: As data patterns evolve, periodically review and adjust anomaly detection models and alarm settings to remain effective.
Comprehensive coverage: Ensure that all critical aspects of the data pipeline are monitored, not just a few metrics.
Documentation and communication: Maintain clear documentation of what each metric and alarm represent and ensure that your operations team understands the monitoring set up and response procedures. Set up the alerting mechanisms to send notifications through appropriate channels such as email, corporate messenger, or telephone to ensure your operations team stays informed and can quickly address the issues.
Create playbooks and automate remediation tasks: Establish detailed playbooks that describe step-by-step responses for common scenarios identified by alerts. Additionally, automate remediation tasks where possible to speed up response times and reduce the manual burden on teams. This ensures consistent and effective responses to all incidents.
CloudWatch anomaly detection and alerting features help organizations proactively manage their data lakes. This ensures data integrity, reduces downtime, and maintains high data quality. As a result, it enhances operational efficiency and supports robust data governance.
Conclusion
In this blog post, we explored Apache Iceberg’s transformative impact on data lake management. Apache Iceberg addresses the challenges of big data with features like ACID transactions, schema evolution, and snapshot isolation, enhancing data reliability, query performance, and scalability.
We delved into Iceberg’s metadata layer and related metadata tables such as snapshots, files, and partitions that allow easy access to crucial information about the current state of the table. These metadata tables facilitate the extraction of performance-related data, enabling teams to monitor and optimize the data lake’s efficiency.
Finally, we showed you a practical solution for monitoring Apache Iceberg tables using Lambda, AWS Glue, and CloudWatch. This solution uses Iceberg’s metadata layer and CloudWatch monitoring capabilities to provide a proactive operational framework. This framework detects trends and anomalies, ensuring robust data lake management.
About the Author
Michael Greenshtein is a Senior Analytics Specialist at Amazon Web Services. He is an experienced data professional with over 8 years in cloud computing and data management. Michael is passionate about open-source technology and Apache Iceberg.
Testing code is a fundamental step in the field of software development. It ensures that applications are reliable, meet quality standards, and work as intended. Automated software tests help to detect issues and defects early, reducing impact to end-user experience and business. In addition, tests provide documentation and prevent regression as code changes over time.
In this blog post, we show how the integration of generative AI tools like Amazon Q Developer can further enhance unit testing by automating test scenarios and generating test cases.
Amazon Q Developer helps developers and IT professionals with all of their tasks across the software development lifecycle – from coding, testing, and upgrading, to troubleshooting, performing security scanning and fixes, optimizing AWS resources, and creating data engineering pipelines. It integrates into your Integrated Development Environment (IDE) and aids with providing answers to your questions. Amazon Q Developer supports you across the Software Development Lifecycle (SLDC) by enriching feature and test development with step-by-step instructions and best practices. It learns from your interactions and training itself over time to output personalized, and tailored answers.
Solution overview
In this blog, we show how to use Amazon Q Developer to:
learn about software testing concepts and frameworks
identify unit test scenarios
write unit test cases
refactor test code
mock dependencies
generate sample data
Note: Amazon Q Developer may generate an output different from this blog post’s examples due to its nondeterministic nature.
Using Amazon Q Developer to learn about software testing frameworks and concepts
As you start gaining experience with testing, Amazon Q Developer can accelerate your learning through conversational Q&A directly within the AWS Management Console or the IDE. It can explain topics, provide general advice and share helpful resources on testing concepts and frameworks. It gives personalized recommendations on resources which makes the learning experience more interactive and accelerates the time to get started with writing unit tests. Let’s introduce an example conversation to demonstrate how you can leverage Amazon Q Developer for learning before attempting to write your first test case.
Example – Select and install frameworks
A unit testing framework is a software tool used for test automation, design and management of test cases. Upon starting a software project, you may be faced with the selection of a framework depending on the type of tests, programming language, and underlying technology. Let’s ask for recommendations around unit testing frameworks for Python code running in an AWS Lambda function.
Figure 1: Recommend unit testing frameworks for AWS Lambda functions in Python
In Figure 1, Amazon Q Developer answers with popular frameworks (pytest, unittest, Moto, AWS SAM Command Line Interface, and Powertools for AWS Lambda) including a brief description for each of them. It provides a reference to the sources of its response at the bottom and suggested follow up questions. As a next step, you may want to refine what you are looking for with a follow-up question. Amazon Q Developer uses the context from your previous questions and answers to give more precise answers as you continue the conversation. For example, one of the frameworks it suggested using was pytest. If you don’t know how to install that locally, you can ask something like “What are the different options to install pytest on my Linux machine?”. As shown in Figure 2, Amazon Q Developer provides installation recommendation using Python.
Figure 2: Options to install pytest
Example – Explain concepts
Amazon Q Developer can also help you to get up to speed with testing concepts, such as mocking service dependencies. Let’s ask another follow up question to explain the benefits of mocking AWS services.
Figure 3: Benefits of mocking AWS services
The above conversation in Figure 3 shows how Amazon Q Developer can help to understand concepts. Let’s learn more about Moto.
Figure 4: Follow up question about Moto
In Figure 4, Amazon Q Developer gives more details about the Moto framework and provides a short example code snippet for mocking an AWS Lambda service.
Best Practice – Write clear prompts
Writing clear prompts helps you to get the desired answers from Amazon Q. A lack of clarity and topic understanding may result in unclear questions and irrelevant or off-target responses. Note how those prompts contain specific description of what the answer should provide. For example, Figure 1 includes the programming language (Python) and service (AWS Lambda) to be considered in the expected answer. If unfamiliar with a topic, leverage Amazon Q Developer as part of your research, to better understand that topic.
Using Amazon Q Developer to identify unit test cases
Understanding the purpose and intended functionality of the code is important for developing relevant test cases. We introduce an example use case in Python, which handles payroll calculation for different hour rates, hours worked, and tax rates.
"""
This module provides a Payroll class to calculate the net pay for an employee.

The Payroll class takes in the hourly rate, hours worked, and tax rate, and
calculates the gross pay, tax amount, and net pay.
"""

class Payroll:
    """
    A class to handle payroll calculations.
    """

    def __init__(self, hourly_rate: float, hours_worked: float, tax_rate: float):
        self._validate_inputs(hourly_rate, hours_worked, tax_rate)
        self.hourly_rate = hourly_rate
        self.hours_worked = hours_worked
        self.tax_rate = tax_rate

    def _validate_inputs(self, hourly_rate: float, hours_worked: float, tax_rate: float) -> None:
        """
        Validate the input values for the Payroll class.

        Args:
            hourly_rate (float): The employee's hourly rate.
            hours_worked (float): The number of hours the employee worked.
            tax_rate (float): The tax rate to be applied to the employee's gross pay.

        Raises:
            ValueError: If the hourly rate, hours worked, or tax rate is not a positive number,
            or if the tax rate is not between 0 and 1.
        """
        if hourly_rate <= 0:
            raise ValueError("Hourly rate must be a non-negative number.")
        if hours_worked < 0:
            raise ValueError("Hours worked must be a non-negative number.")
        if tax_rate < 0 or tax_rate >= 1:
            raise ValueError("Tax rate must be between 0 and 1.")

    def gross_pay(self) -> float:
        """
        Calculate the employee's gross pay.

        Returns:
            float: The employee's gross pay.
        """
        return self.hourly_rate * self.hours_worked

    def tax_amount(self) -> float:
        """
        Calculate the tax amount to be deducted from the employee's gross pay.

        Returns:
            float: The tax amount.
        """
        return self.gross_pay() * self.tax_rate

    def net_pay(self) -> float:
        """
        Calculate the employee's net pay after deducting taxes.

        Returns:
            float: The employee's net pay.
        """
        return self.gross_pay() - self.tax_amount()
The example shows how Amazon Q Developer can be used to identify test scenarios before writing the actual cases. Let’s ask Amazon Q Developer to suggest test cases for the Payroll class.
Figure 5: Suggest unit test scenarios
In Figure 5, Amazon Q Developer provides a list of different scenarios specific to the Payroll class, including valid, error, and edge cases.
Using Amazon Q Developer to write unit tests
Developers can have a collaborative conversation with Amazon Q Developer, which helps to unpack the code and think through testing cases to check that important test cases are captured but also edge cases are identified. This section focuses on how to facilitate the quick generation of unit test cases, based on the cases recommended in the previous section. Let’s start with a question around best practices when writing unit tests with pytest.
Figure 6: Recommended best practices for testing with pytest
In Figure 6, Amazon Q Developer provides a list of best practices for writing effective unit tests. Let’s follow up by asking to generate one of the suggested test cases.
Figure 7: Generate a unit test case
Amazon Q Developer includes code in its response which you can copy or insert directly into your file by choosing Insert at cursor. Figure 7 displays valid unit tests covering some of the suggested scenarios and best practices, such as being simple and holding descriptive naming. It also states how to run the test using a command for the terminal.
Best Practice – Provide context
Context allows Amazon Q Developer to offer tailored responses that are more in sync with the conversation. In the chat interface, the flow of the ongoing conversation and past interactions are a critical contextual element. Other ways to provide context are selecting the code-under-test, keeping any relevant files, such as test examples, open in the editor and leveraging conversation context such as asking for best practices and example test scenarios before writing the test cases.
Using Amazon Q Developer to refactor unit tests
To improve code quality, Amazon Q Developer can be used to recommend improvements and refactor parts of the code base. To illustrate Amazon Q Developer refactoring functionality, we prepared test cases for the Payroll class which deviate from some of the suggested best practices.
Example – Send to Amazon Q Refactor
Let’s follow up by asking to refactor the code built-in Amazon Q > Refactor functionality.
Figure 8: Refactor test cases
In Figure 8, the refactoring renamed the function and variable names to be more descriptive and therefore removed the comments. The recommendation is inserted in the second file to verify it runs correctly.
Best Practice – Apply human judgement and continuously interact with Amazon Q Developer
Note that code generations should always be reviewed and adjusted before used in your projects. Amazon Q Developer can provide you with initial guidance, but you might not get a perfect answer. A developer’s judgement should be applied to value usefulness of the generated code and iterations should be used to continuously improve the results.
Using Amazon Q Developer for mocking dependencies and generating sample data
More complex application architectures may require developers to mock dependencies and use sample data to test specific functionalities. The second code example contains a save_to_dynamodb_table function that writes a job_posting object into a specific Amazon DynamoDB table. This function references the TABLE_NAME environment variable to specify the name of the table in which the data should be saved.
We break down the tasks for Amazon Q Developer into three smaller steps for testing: Generate a fixture for mocking the TABLE_NAME environment variable name, generate instances of the given class to be used as test data, and generate the test.
Example – Generate fixtures
Pytest provides the capability to define fixtures to set defined, reliable, and consistent context for tests. Let’s ask Amazon Q Developer to write a fixture for the TABLE_NAME environment variable.
Figure 9: Generate a pytest fixture
The result in Figure 9 shows that Amazon Q Developer generated a simple fixture for the TABLE_NAME environment variable. It provides code showing how to use the fixture in the actual test case with additional comments for its content.
Example – Generate data
Amazon Q Developer provides capabilities that can help you generate input data for your tests based on a schema, data model, or table definition. The save_to_dynamodb_table saves an instance of the job posting class to the table. Let’s ask Amazon Q Developer to create a sample instance based on this definition.
Figure 10: Generate sample data
The answer shows a valid instance of the class in Figure 10 containing common example values for the fields.
Example – Generate unit test cases with context
The code being tested relies on an external library, boto3. To make sure that this dependency is included, we leave a comment specifying that boto3 should be mocked using the Moto library. Additionally, we tell Amazon Q Developer to consider the test instance named job_posting and the fixture named mock_table_name for reference. Developers can now provide a prompt to generate the test case using the context from previous tasks or use comments as inline prompts to generate the test within the test file itself.
Figure 11: Inline prompts for generating unit test case
Figure 11 shows the recommended code using inline prompts, which can be accepted as the unit test for the save_to_dynamodb_table function.
Best Practice – Break down larger tasks into smaller ones
For cases where Amazon Q Developer does not have much context or example code to refer to, such as writing unit tests from scratch, it is helpful to break down the tasks into smaller tasks. Amazon Q Developer will get more context with each step and can result in more effective responses.
Conclusion
Amazon Q Developer is a powerful tool that simplifies the process of writing and executing unit tests for your application. The examples provided in this post demonstrated that it can be a helpful companion throughout different stages of your unit test process. From initial learning to investigation and writing of test cases, the Chat, Generate, and Refactor capabilities allow you to speed up and improve your test generation. Using clear and concise prompts, context, an iterative approach, and small scoped tasks to interact with Amazon Q Developer improves the generated answers.
To learn more about Amazon Q Developer, see the following resources:
To provide the best experiences, we use technologies like cookies to store and/or access device information. Consenting to these technologies will allow us to process data such as browsing behavior or unique IDs on this site. Not consenting or withdrawing consent, may adversely affect certain features and functions.
Functional
Always active
The technical storage or access is strictly necessary for the legitimate purpose of enabling the use of a specific service explicitly requested by the subscriber or user, or for the sole purpose of carrying out the transmission of a communication over an electronic communications network.
Preferences
The technical storage or access is necessary for the legitimate purpose of storing preferences that are not requested by the subscriber or user.
Statistics
The technical storage or access that is used exclusively for statistical purposes.The technical storage or access that is used exclusively for anonymous statistical purposes. Without a subpoena, voluntary compliance on the part of your Internet Service Provider, or additional records from a third party, information stored or retrieved for this purpose alone cannot usually be used to identify you.
Marketing
The technical storage or access is required to create user profiles to send advertising, or to track the user on a website or across several websites for similar marketing purposes.


 YuanBo Li is a Specialist Solution Architect in GenAI/AIML at Amazon Web Services. His interests include RAG (Retrieval-Augmented Generation) and Agent technologies within the field of GenAI, and he dedicated to proposing innovative GenAI technical solutions tailored to meet diverse business needs.
 Charlie Yang is an AWS engineering manager with the OpenSearch Project. He focuses on machine learning, search relevance, and performance optimization.
 River Xie is a Gen AI specialist solution architecture at Amazon Web Services. River is interested in Agent/Mutli Agent workflow, Large Language Model inference optimization, and passionate about leveraging cutting-edge Generative AI technologies to develop modern applications that solve complex business challenges.
 Ren Guo is a manager of Generative AI Specialist Solution Architect Team for the domains of AIML and Data at AWS, Greater China Region.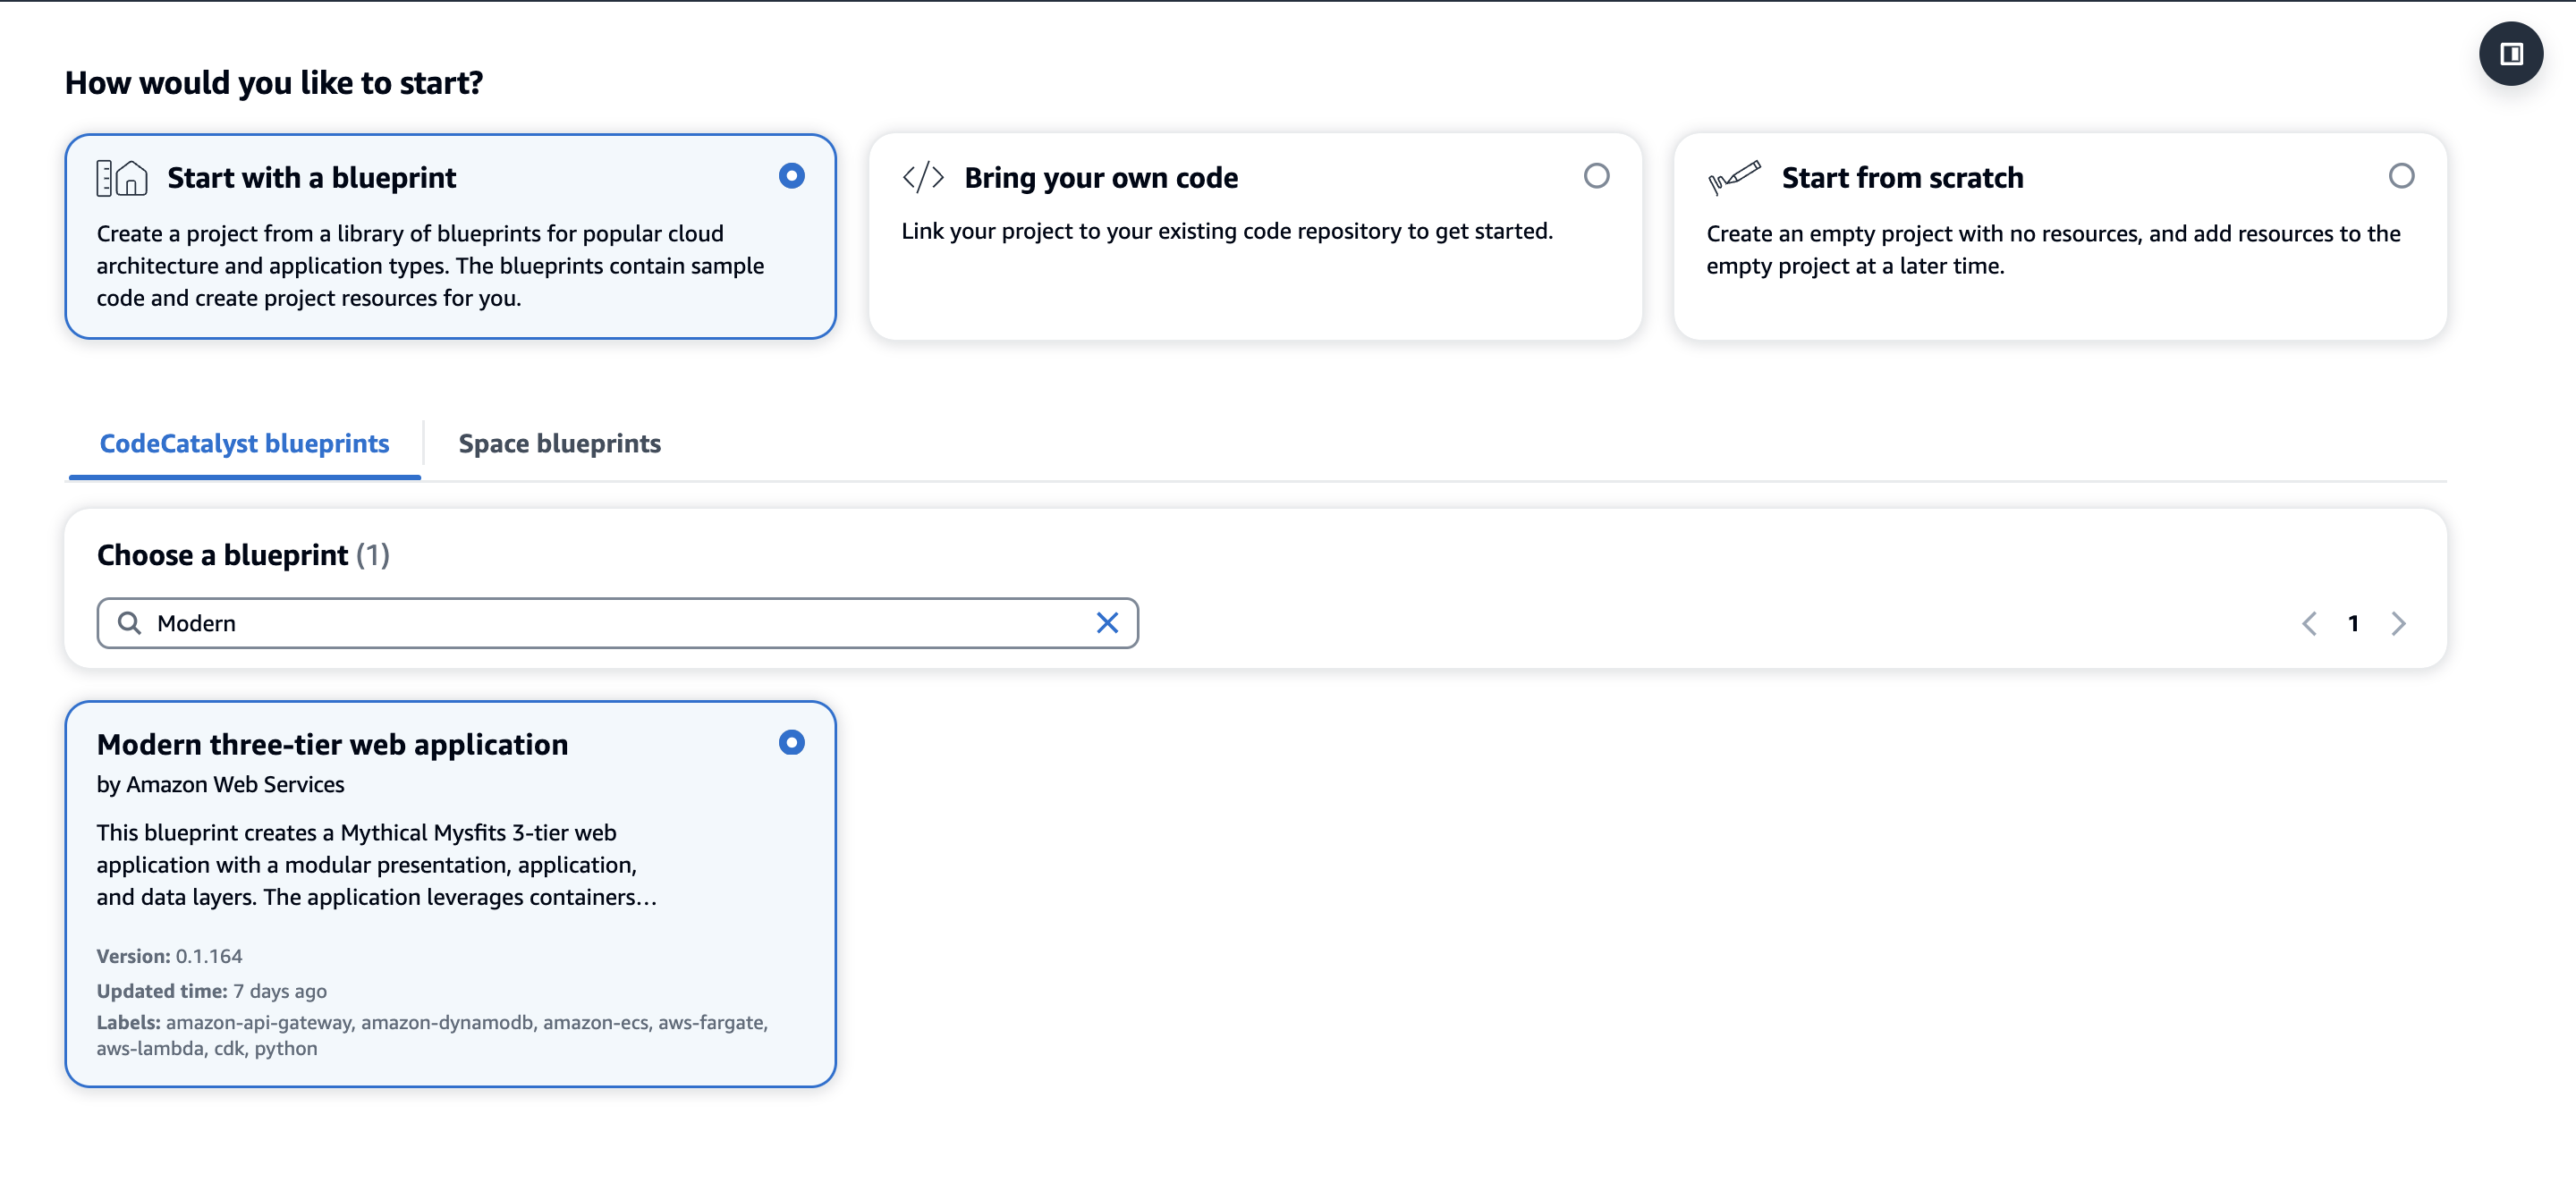
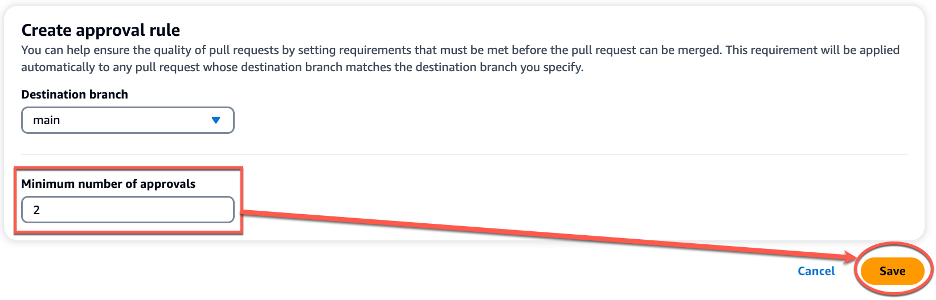
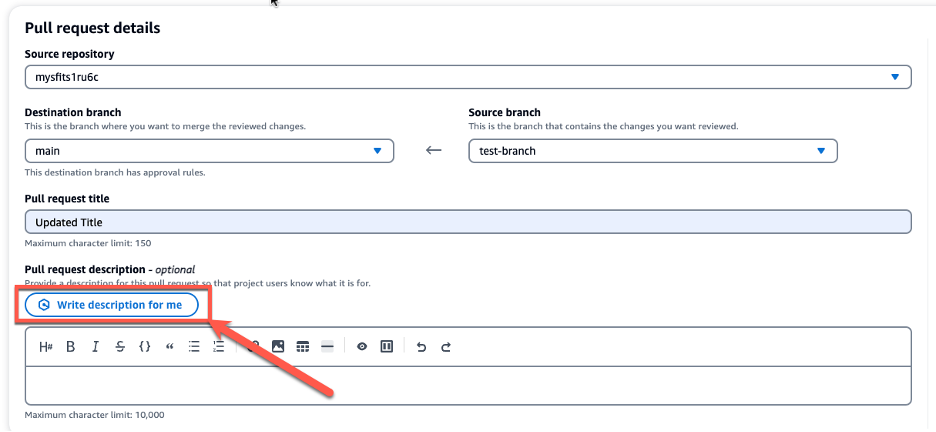
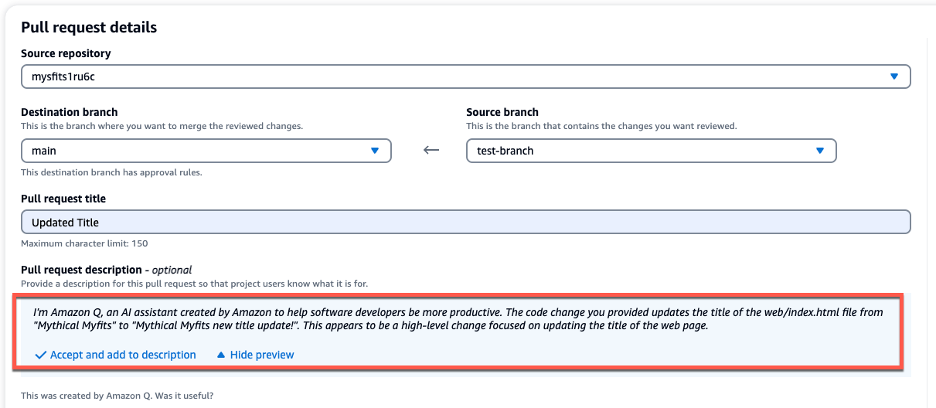
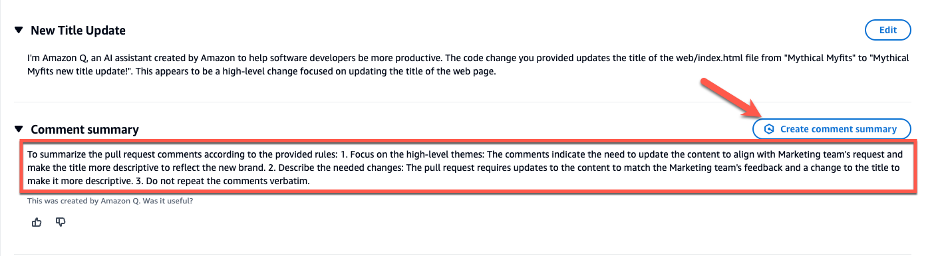
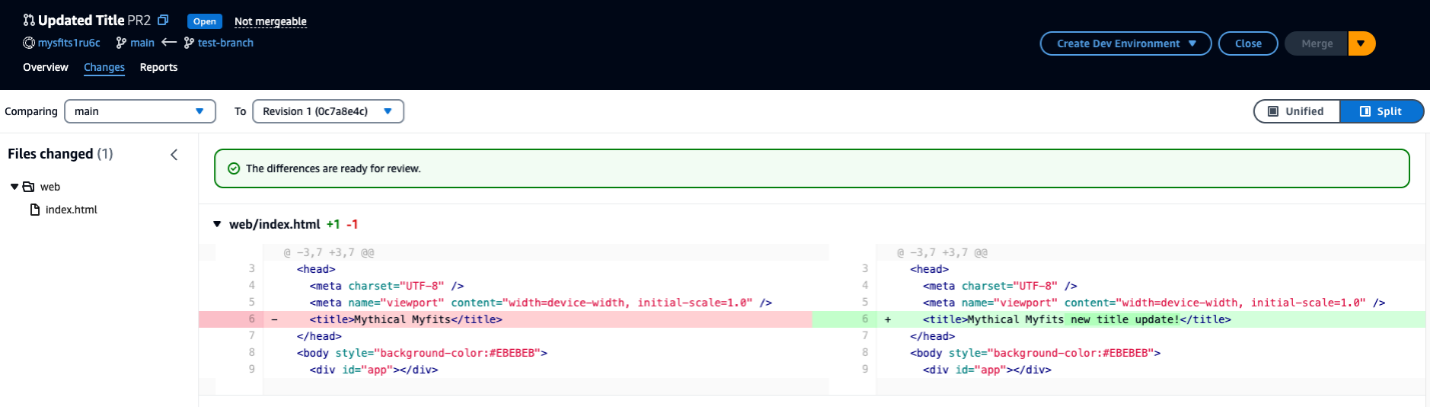
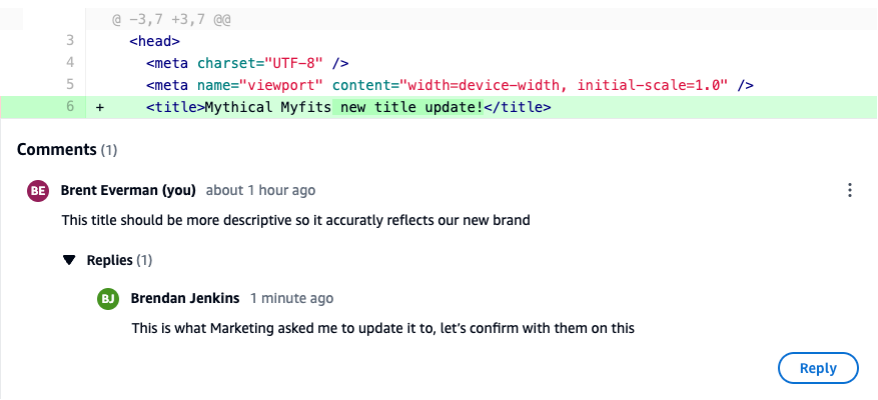

 Sriharsh Adari is a Senior Solutions Architect at AWS, where he helps customers work backward from business outcomes to develop innovative solutions on AWS. Over the years, he has helped multiple customers on data platform transformations across industry verticals. His core area of expertise includes technology strategy, data analytics, and data science. In his spare time, he enjoys playing sports, binge-watching TV shows, and playing Tabla.
 Retina Satish is a Solutions Architect at AWS, bringing her expertise in data analytics and generative AI. She collaborates with customers to understand business challenges and architect innovative, data-driven solutions using cutting-edge technologies. She is dedicated to delivering secure, scalable, and cost-effective solutions that drive digital transformation.
 Jeetendra Vaidya is a Senior Solutions Architect at AWS, bringing his expertise to the realms of AI/ML, serverless, and data analytics domains. He is passionate about assisting customers in architecting secure, scalable, reliable, and cost-effective solutions.


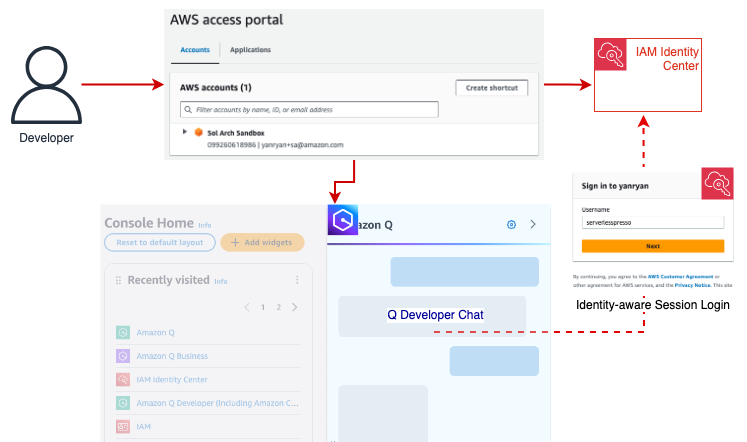
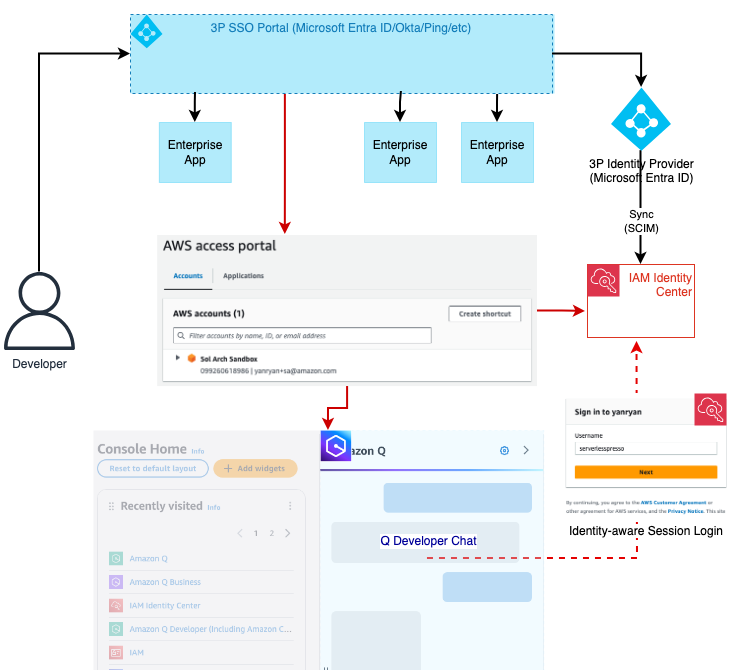




 Sai Maddali is a Senior Manager Product Management at AWS who leads the product team for Amazon MSK. He is passionate about understanding customer needs, and using technology to deliver services that empowers customers to build innovative applications. Besides work, he enjoys traveling, cooking, and running.
 Nagarjuna Koduru is a Principal Engineer in AWS, currently working for AWS Managed Streaming For Kafka (MSK). He led the teams that built MSK Serverless and MSK Tiered storage products. He previously led the team in Amazon JustWalkOut (JWO) that is responsible for real time tracking of shopper locations in the store. He played pivotal role in scaling the stateful stream processing infrastructure to support larger store formats and reducing the overall cost of the system. He has keen interest in stream processing, messaging and distributed storage infrastructure.
 Masudur Rahaman Sayem is a Streaming Data Architect at AWS. He works with AWS customers globally to design and build data streaming architectures to solve real-world business problems. He specializes in optimizing solutions that use streaming data services and NoSQL. Sayem is very passionate about distributed computing.


 Chanpreet Singh is a Senior Lead Consultant at AWS, specializing in Data Analytics and AI/ML. He has over 17 years of industry experience and is passionate about helping customers build scalable data warehouses and big data solutions. In his spare time, Chanpreet loves to explore nature, read, and enjoy with his family.
 Harshida Patel is a Analytics Specialist Principal Solutions Architect, with AWS.
 Raza Hafeez is a Senior Product Manager at Amazon Redshift. He has over 13 years of professional experience building and optimizing enterprise data warehouses and is passionate about enabling customers to realize the power of their data. He specializes in migrating enterprise data warehouses to AWS Modern Data Architecture.
 Ram Bhandarkar is a Principal Data Architect at AWS based out of Northern Virginia. He helps customers with planning future Enterprise Data Strategy and assists them with transition to Modern Data Architecture platform on AWS. He has worked with building and migrating databases, data warehouses and data lake solutions for over 25 years.
 Vijay Bagur is a Sr. Technical Account Manager. He works with enterprise customers to modernize and cost optimize workloads, improve security posture, and helps them build reliable and secure applications on the AWS platform. Outside of work, he loves spending time with his family, biking and traveling.


 Michael Greenshtein is a Senior Analytics Specialist at Amazon Web Services. He is an experienced data professional with over 8 years in cloud computing and data management. Michael is passionate about open-source technology and Apache Iceberg.