Tag Archives: Developer Tools

New Customization Capability in Amazon CodeWhisperer Generates Even Better Suggestions (Preview)

Post Syndicated from Donnie Prakoso original https://aws.amazon.com/blogs/aws/new-customization-capability-in-amazon-codewhisperer-generates-even-better-suggestions-preview/

An AI coding companion, such as Amazon CodeWhisperer, aims to improve developers’ productivity by helping them write code quickly and securely. However, in particular cases, developers need to have code recommendations based on their internal libraries and APIs they extensively use every day.

As most of the existing AI coding companion tools are trained only on open-source codes, they lack the capability to customize the code recommendations using private code repositories. This limitation presents a variety of challenges for developers. Developers have a difficulty learning how to use internal libraries correctly and avoid security problems. For large codebases, it requires hours of reading documentation to understand what code needs to be written to complete the task.

Now in Preview —  Amazon CodeWhisperer Customization Capability
Today, I’m excited to announce Amazon CodeWhisperer customization capability (in preview) that enables organizations to customize CodeWhisperer to generate specific code recommendations from private code repositories. With this feature, developers who are part of Amazon CodeWhisperer Professional tier can now receive real-time code recommendations that include their internal libraries, APIs, packages, classes, and methods.

Let’s say that you’re a developer working for a hypothetical food delivery company called AnyCompany. You’re given a task to process a list of unassigned food deliveries around the driver’s current location. Previously, with CodeWhisperer, it would not know the correct internal APIs to process unassigned food deliveries or getting driver’s current location as this isn’t publicly available information. 

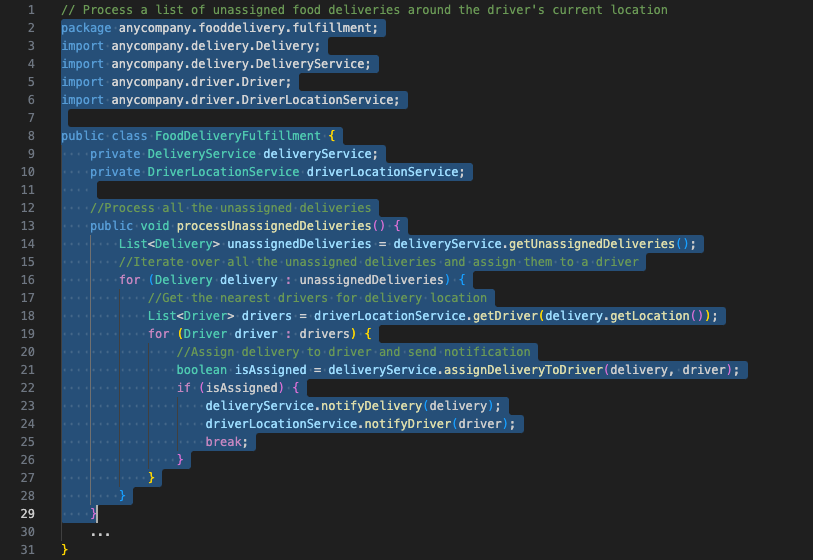
Now, with customization capability, you can ask CodeWhisperer to provide recommendations that include specific code related to the company’s internal services. The following screenshot shows how CodeWhisperer generates codes based on the internal codebase just by writing a set of comments.

With the customization capability of utilizing your internal codebase, CodeWhisperer now understands the intent, determines which internal and public APIs are best suited to the task, and generates code recommendations.

How It Works
The explanation above described how you can use CodeWhisperer customization capability as a developer. Now, let me share how it works and how you can get started. 

To create a customization, you need to complete the following steps as a CodeWhisperer administrator. 

  1. Administer your end users as CodeWhisperer administrator.
  2. Connect to existing repositories. You can connect one or more code repositories in your GitHub, GitLab, or BitBucket account using AWS CodeStar Connections or manually upload all of your codes into an Amazon Simple Storage Service (Amazon S3) bucket.
  3. Create a customization. CodeWhisperer will customize its model based on your codebase.
  4. Activate the customization for your team members. Once the customization is created, you can review and manually activate the customization to make it available automatically in your team members’ IDEs.

This capability provides two main advantages: providing real-time customized code recommendations that are specific to organizations and ensuring the protection of valuable intellectual property. Organizations can now promote the use of code that meets their quality and security standards based on their codes in existing repositories.

Furthermore, CodeWhisperer helps to ensure the security of your codes by providing the option to encrypt your customization data using customer managed keys in AWS Key Management Service (AWS KMS). This customization data will be deleted once the customization job finishes. 

Let’s Get Started
Let me show you how you can use the Amazon CodeWhisperer customization capability.

To get started, I need to create a customization. I need to have administrator access to navigate to the Create customization page on the Amazon CodeWhisperer dashboard.

On the Create customization page, I can connect the desired private code repositories I want CodeWhisperer to train. Currently, CodeWhisperer customization capability supports connection to GitHub, GitLab, and Bitbucket via AWS CodeStar Connections. If I have codes that are not in any code repositories, I can also manually upload my codes into an S3 bucket and define the Amazon S3 URI.

The following screenshot shows that I have existing connections with my code repositories using AWS CodeStar Connections. I can also create a new connection by selecting Create new connection.

Then, I can select Create Customization so CodeWhisperer can start training the model based on the codes available in the connection. The duration to complete this process depends on the size of the code repositories.

When the customization is ready, CodeWhisperer will not activate it automatically. This gives me the flexibility to activate the customizations just when I need them. But before I demonstrate that, I’d like to explain the evaluation score.

In short, the evaluation score helps me to measure the customization’s accuracy in predicting and providing code recommendations based on the codes in my code repositories. It provides a score in one of three categories: 1) Very Good, with a score ranging from 7–10; 2) Fair, with a score ranging from 4–7; and 3) Poor, with a score ranging from 0–4. It’s recommended to activate the customization if the evaluation score is 6 or higher. If the evaluation score is less than desired, I need to make sure that I’m providing enough codes for customization and provide a new code dataset that extensively contains references to internal APIs.

Here, I can see the Evaluation score for my customization is 8, and I’m happy with this result. Then, I can select Activate to start using this customization.

Once I have activated the customizations, I can define the access to selected customizations by selecting Add users. Now, I can give access to the customizations for selected team members who have been added as users for Amazon CodeWhisperer Professional tier. To do that, I can follow the guide from the Administering end users page. 

Then, once my team members sign in via AWS Toolkit in their IDEs, they will see the available customizations and can start using them. 

With Amazon CodeWhisperer, I can create multiple customizations by providing different code repositories. This feature is useful if I want to build customizations for code recommendations for certain teams. 

As administrator, I can also monitor the performance of each of the customizations by navigating to the CodeWhisperer dashboard page. This page summarizes useful data such as user activity, how many lines of code were suggested by CodeWhisperer and accepted by my team members, and how many security scans have successfully been run from IDEs. 

Amazon CodeWhisperer customization capability also follows the supported IDEs as part of AWS Toolkit by Amazon CodeWhisperer, such as Visual Studio Code, IntelliJ JetBrains, Visual Studio, and AWS Cloud9. This feature also provides support for most popular programming languages, including Python, Java, JavaScript, TypeScript, and C#.

Join the Public Preview
By securely leveraging customer’s internal codebase, Amazon CodeWhisperer unlocks the full potential of generative AI-powered coding that is customized to your unique requirements.

Join the public preview now and learn more on how to get started on the Amazon CodeWhisperer Customization page.

Happy coding!
— Donnie

Announcing the AWS Well-Architected Framework DevOps Guidance

Post Syndicated from Michael Rhyndress original https://aws.amazon.com/blogs/devops/announcing-the-aws-well-architected-framework-devops-guidance/

Today, Amazon Web Services (AWS) announced the launch of the AWS Well-Architected Framework DevOps Guidance. The AWS DevOps Guidance introduces the AWS DevOps Sagas—a collection of modern capabilities that together form a comprehensive approach to designing, developing, securing, and efficiently operating software at cloud scale. Taking the learnings from Amazon’s own transformation journey and our experience managing global cloud services, the AWS DevOps Guidance was built to equip organizations of all sizes with best practice culture, processes, and technical capabilities that help to deliver business value and applications more securely and at a higher velocity.

A Glimpse into Amazon’s DevOps Transformation

In the early 2000s, Amazon went through its own DevOps transformation which led to an online bookstore forming the AWS cloud computing division. Today, AWS provides a wide range of products and services for global customers that are powered by that same innovative DevOps approach. Due to the positive effects of this transformation, AWS recognizes the significance of DevOps and has been at the forefront of its adoption and implementation.

Amazon’s own journey, along with the collective experience gained from assisting customers as they modernize and migrate to the cloud, provided insight into the capabilities which we believe make DevOps adoption successful. With these learnings, we created the DevOps Sagas to help our customers sustainably adopt and practice DevOps through the implementation of an interconnected set of capabilities. Each DevOps Saga includes prescriptive guidance for capabilities that provide indicators of success, metrics to measure, and common anti-patterns to avoid.

Introducing The DevOps Sagas

The DevOps Sagas are core domains within the software delivery process that collectively form AWS DevOps best practices. Together, they encompass a collection of modern capabilities representing a comprehensive approach to designing, developing, securing, and efficiently operating software at cloud scale. You can use the DevOps Sagas as a common definition of what DevOps means to your organization by aligning on a shared understanding within your organization and to consistently measure DevOps adoption over time. The 5 DevOps Sagas are:

  • Organizational Adoption Saga: Inspires the formation of a customer-centric, adaptive culture focused on optimizing people-driven processes, personal and professional development, and improving developer experience to set the foundation for successful DevOps adoption.
  • Development Lifecycle Saga: Aims to enhance the organization’s capacity to develop, review, and deploy workloads swiftly and securely. It leverages feedback loops, consistent deployment methods, and an ‘everything-as-code’ approach to attain efficiency in deployment.
  • Quality Assurance Saga: Advocates for a proactive, test-first methodology integrated into the development process to ensure that applications are well-architected by design, secure, cost-efficient, sustainable, and delivered with increased agility through automation.
  • Automated Governance Saga: Facilitates directive, detective, preventive, and responsive measures at all stages of the development process. It emphasizes risk management, business process adherence, and application and infrastructure compliance at scale through automated processes, policies, and guardrails.
  • Observability Saga: Presents an approach to incorporating observability within environment and workloads, allowing teams to detect and address issues, improve performance, reduce costs, and ensure alignment with business objectives and customer needs.

DevOps Sagas display image defining the definition of Sagas, Capabilities, Indicators, Metrics, and Anti-Patterns. AWS DevOps Sagas provides foundational DevOps capabilities, indicators, and metrics aligned to AWS best practices. Sagas are core domains that collectively form AWS DevOps best practices. Capabilities are individual practices with differentiated outcomes that form a Saga. Indicators objectively measure qualities of each capability. Metrics quantify and measure proficiency of each capability. Anti-patterns avoid behaviors that may seem beneficial but lead to inefficient outcomes.

Who should use the AWS DevOps Guidance?

We recognize that every organization is unique and that there is no one-size-fits-all approach to practicing DevOps. The recommendations and examples provided can be tailored to suit your organization’s environment, quality, and security needs. The AWS DevOps Guidance is designed for a wide range of professionals and organizations, including startups exploring DevOps for the first time, established enterprises refining their processes, public sector companies, cloud-native businesses, and customers migrating to the AWS Cloud. Whether you are steering strategic direction as a Chief Technology Officer (CTO) or Chief Information Security Officer (CISO), a developer or architect actively engaged in designing and deploying workloads, or in a compliance role overseeing quality assurance, auditing, or governance, this guidance is tailored to help you.

Next Steps

With the release of the AWS DevOps Guidance, we encourage you, our customers, to download and read the document, as well as implement and test your workloads in accordance with the recommendations within. Use the AWS DevOps Guidance in tandem with the AWS Well-Architected Framework to conduct an assessment of your organization and individual workload’s adherence to DevOps best practices to pinpoint areas of strength and opportunities for improvement. Collaborate with your teams – from developers to operations and decision-makers – to share insights from your assessment. Use the insights gained from the AWS DevOps Guidance to prioritize areas of improvement and iteratively improve your DevOps capabilities.

Find the AWS DevOps Guidance on the AWS Well-Architected website or contact your AWS account team for more information. As with the AWS Well-Architected Framework and other industry and technology guidance, we recommend leveraging the AWS DevOps Guidance early and often – as you approach architectural and service design decisions, and whenever you carry out Well-Architected reviews. As you use the AWS DevOps Guidance, we would appreciate your comments and feedback to help us improve as best practices and technology evolve. We will continually refresh the content as we identify new best practices, metrics, and common scenarios.

Enhancing Resource Isolation in AWS CDK with the App Staging Synthesizer

Post Syndicated from Jehu Gray original https://aws.amazon.com/blogs/devops/enhancing-resource-isolation-in-aws-cdk-with-the-app-staging-synthesizer/

AWS Cloud Development Kit (CDK) has become a powerful tool for defining and provisioning AWS cloud resources. While CDK simplifies the process of infrastructure as code, managing resources across different projects and environments can still present challenges. In this blog post, we’ll explore a new experimental library, the App Staging Synthesizer, that enhances resource isolation and provides finer control over staging resources in CDK applications.

Background: The CDK Bootstrapping Model

Let’s consider a scenario where a company has two projects in the same account, Project A and Project B. Both projects are developed using the AWS CDK and deploy various AWS resources. However, the company wants to ensure that resources used in Project A are not discoverable or accessible to Project B. Prior to the introduction of the App Staging Synthesizer library in CDK, the default bootstrapping process created shared staging resources, such as a single Amazon S3 bucket and Amazon ECR repository, which are used by all CDK applications deployed in the CDK environment. In AWS CDK, a combination of region and an account is considered to be an environment. The traditional CDK bootstrapping method offers simplicity and consistency by providing a standardized set of shared staging resources for all CDK applications in an environment, which can be cost-effective for multiple applications. This shared model makes it challenging to control access and visibility between the projects in the same account, particularly in scenarios where resource isolation is crucial between different projects. In such scenarios, AWS recommends a best practice of separating projects that need critical isolation into different AWS accounts. However, it is recognized that there might be organizational or practical reasons preventing the immediate adoption of this recommendation. In such cases, mechanisms like the App Staging Synthesizer can provide a valuable workaround.

Introducing the App Staging Synthesizer:

Today, a growing trend among customers is the consolidation of their cloud accounts driven by the desire to optimize costs, bolster security and enhance compliance control. However, while consolidation offers several advantages, it can sometimes limit the flexibility to align ownership and decision making with individual accounts. This can lead to dependencies and conflicts in how workloads across accounts are secured and managed. The App Staging Synthesizer which is an experimental library designed to provide a more flexible approach to resource management and staging in CDK applications was designed to address these challenges. The AppStagingSynthesizer enhances resource isolation and cleanup control by creating separate staging resources for each application, reducing the risk of conflicts between resources and providing more granular management. It also enables better asset lifecycle management and customization of roles and resource handling, offering CDK developers a flexible and organized approach to resource deployment. Let’s delve into some of the advantages and key features of this library.

Advantages and Outcomes:

  1. Isolation and Access Control: The resources created for Project A are now completely isolated from Project B. Project B doesn’t have visibility or access to the staging resources of Project A, and vice versa. This ensures a higher level of data and resource security.
  2. Easier Resource Cleanup: When cleaning up or deleting resources, the Staging Stack specific to each project can be removed independently. This allows for a more streamlined and controlled cleanup process, mitigating the risk of inadvertently affecting other projects.
  3. Lifecycle Management: With separate ECR repositories for each CDK application, the company can apply lifecycle rules independently for retention and cost management. For example, they can configure each ECR repository to retain only the most recent 5 images, effectively cutting down on storage costs.
  4. Reduced Bootstrapping Complexity: As the only shared resources required are global Roles, the company now only needs to bootstrap every account in one Region instead of bootstrapping every Region. This simplifies the bootstrapping process, making it easier to manage with CloudFormation StackSets.

Key Features of the App Staging Synthesizer:

  • IStagingResources Interface: The App Staging Synthesizer introduces the IStagingResources interface, offering a framework to manage app-level bootstrap stacks. These stacks handle file assets and Docker assets for CDK applications.
  • DefaultStagingStack: Included in the library, the DefaultStagingStack is a pre-built implementation of the IStagingResources It comes with default configurations for staging resources, making it easier to get started.
  • AppStagingSynthesizer: This is a new CDK synthesizer that orchestrates the creation of staging resources for each CDK application. It seamlessly integrates with the application deployment process.
  • Deployment Roles: In addition to creating staging resources, the CDK App Staging Synthesizer also manages deployment roles. These roles are crucial for secure and controlled resource deployment, ensuring that only authorized processes can modify or access the resources.

 Implementation:

Let’s explore practical examples of using the App Staging Synthesizer within a CDK application.

Prerequisite:

For this walkthrough, you should have the following prerequisites:

  • An AWS account
  • Install AWS CDK version 2.73.0 or later
  • A basic understanding of CDK. Please go through cdkworkshop.com to get hands-on learning about CDK and related concepts.
  • NOTE: To utilize the AppStagingSynthesizer, you should have an existing CDK application or should be working on a CDK application.

Using Default Staging Resources:

When configuring your CDK application to use deployment identities with the old bootstrap stack, it’s important to note that the existing staging resources, including the global S3 bucket and ECR repository, will still be created as part of the bootstrapping process. However, they will remain unused by this specific application, thanks to the App Staging Synthesizer.
While we won’t delve into the removal of these unused resources in this blogpost, it’s worth mentioning that for a more streamlined resource setup, you have the option to customize the bootstrap template to remove these resources if desired. This can help reduce clutter and ensure that only the necessary resources are retained within your CDK environment.

To get started, update your CDK App with the following code snippet:

const app = new App({
defaultStackSynthesizer: AppStagingSynthesizer.defaultResources({
appId: 'my-app-id',
// The following line is optional. By default, it is assumed you have bootstrapped in the same region(s) as the stack(s) you are deploying.
deploymentIdentities: DeploymentIdentities.defaultBootstrapRoles({ bootstrapRegion: 'us-east-1' }),
}),
});

This code snippet creates a DefaultStagingStack for a CDK App, allowing you to manage staging resources more effectively.

Customizing Roles:

You can customize roles for the synthesizer, which can be useful for several reasons such as:

  • Reuse of existing roles: In many AWS environments, organizations have existing IAM roles with specific permissions and policies that are aligned with their security and compliance requirements. Rather than creating new roles from scratch, you might want to leverage these existing roles to maintain consistency and adhere to established security practices.
  • Compatibility: In scenarios where you have pre-existing IAM roles that are being used across various AWS services or applications, customizing roles within the CDK App Staging Synthesizer allows you to seamlessly integrate CDK deployments into your existing IAM role management strategy.

Overall, customizing roles provides flexibility and control over resources used during CDK application deployments, enabling you to align CDK-based infrastructure with the organization’s policies. An example is:

const app = new App({
defaultStackSynthesizer: AppStagingSynthesizer.defaultResources({
appId: 'my-app-id',
deploymentIdentities: DeploymentIdentities.specifyRoles({
cloudFormationExecutionRole: BootstrapRole.fromRoleArn('arn:aws:iam::123456789012:role/Execute'),
deploymentRole: BootstrapRole.fromRoleArn('arn:aws:iam::123456789012:role/Deploy'),
}),
}),
});

This code snippet illustrates how you can specify custom roles for different stages of the deployment process.

Deploy Time S3 Assets:

Deploy-time S3 assets can be classified into two categories, each serving a distinct purpose:

  • Assets Used Only During Deployment: These assets are instrumental in handing off substantial data to other services for private copying during deployment. They play a vital role during initial deployment, and afterwards are retained solely for potential future rollbacks
  • Assets Accessed Throughout Application Lifespan: In contrast, some assets are accessed continuously throughout the runtime of your application. These could include script files utilized in CodeBuild projects, startup scripts for EC2 instances, or, in the case of CDK applications, ECR images that persist throughout the application’s life.

Marking Lambda Assets as Deploy-Time:

By default, Lambda assets are marked as deploy-time assets in the CDK App Staging Synthesizer. This means they fall into the first category mentioned above, serving as essential components during deployment. For instance, consider the following code snippet:

declare const stack: Stack;
new lambda.Function(stack, 'lambda', {
code: lambda.AssetCode.fromAsset(path.join(__dirname, 'assets')), // Lambda code bundle marked as deploy-time
handler: 'index.handler',
runtime: lambda.Runtime.PYTHON_3_9,
});

In this example, the Lambda code bundle is automatically identified as a deploy-time asset. This distinction ensures that it’s cleaned up after the configurable rollback window.

Creating Custom Deploy-Time Assets:

CDK offers the flexibility needed to create custom deploy-time assets. This can be achieved by utilizing the Asset construct from the AWS CDK library:

import { Asset } from 'aws-cdk-lib/aws-s3-assets';
declare const stack: Stack;
const asset = new Asset(stack, 'deploy-time-asset', {
deployTime: true, // Marking the asset as deploy-time
path: path.join(__dirname, './deploy-time-asset'),
});

By setting deployTime to true, the asset is explicitly marked as deploy-time. This allows you to maintain control over the lifecycle of these assets, ensuring they are retained for as long as needed. However, it is important to note that deploy-time assets eventually become eligible for cleanup.

Configuring Asset Lifecycles:
By default, the CDK retains deploy-time assets for a period of 30 days. However, there is flexibility to adjust this duration according to custom requirements. This can be achieved by specifying deployTimeFileAssetLifetime. The value set here determines how long you can roll back to a previous application version without the need for rebuilding and republishing assets:

const app = new App({
defaultStackSynthesizer: AppStagingSynthesizer.defaultResources({
appId: 'my-app-id',
deployTimeFileAssetLifetime: Duration.days(100), // Adjusting the asset retention period to 100 days
}),
});

By fine-tuning the lifecycle of deploy-time S3 assets, you gain more control over CDK deployments and ensure that CDK applications are equipped to handle rollbacks and updates with ease.

Optimizing ECR Repository Management with Lifecycle Rules:

The AWS CDK App Staging Synthesizer provides you with the capability to control the lifecycle of container images by leveraging lifecycle rules within ECR repositories. Let’s explore how this feature can help streamline your CDK workflows.

ECR repositories can accumulate numerous versions of Docker images over time. While retaining some historical versions is essential for rollback scenarios and reference, an unregulated growth of image versions can lead to increased storage costs and management complexity.

The AWS CDK App Staging Synthesizer offers a default configuration that stores a maximum of 3 revisions for a given Docker image asset. This ensures that you maintain access to previous image versions, facilitating seamless rollback operations. When more than 3 revisions of an asset exist in the ECR repository, the oldest one is purged.

Although by default, it’s set to 3, you can also adjust this value using the imageAssetVersionCount property:

const app = new App({
defaultStackSynthesizer: AppStagingSynthesizer.defaultResources({
appId: 'my-app-id',
imageAssetVersionCount: 10, // Customizing the image version count to retain up to 10 revisions
}),
});

By increasing or decreasing the imageAssetVersionCount, you can strike a balance between storage efficiency and the need to access historical image versions. This ensures that ECR repositories are optimized to the CDK application’s requirements.

Streamlining Cleanup: Auto Delete Staging Assets on Stack Deletion

Efficiently managing resources throughout the lifecycle of your CDK applications is essential, and this includes handling the cleanup of staging assets when stacks are deleted. The AWS CDK App Staging Synthesizer simplifies this process by providing an auto-delete feature for staging resources. In this section, we’ll explore how this feature works and how you can customize it according to your needs.

The Default Cleanup Behavior:
By default, the AWS CDK App Staging Synthesizer is designed to facilitate the cleanup of staging resources automatically when a stack is deleted. This means that associated resources, such as S3 buckets and ECR repositories, are configured with a RemovalPolicy.DESTROY and have autoDeleteObjects (for S3 buckets) or autoDeleteImages (for ECR repositories) turned on. Under the hood, custom resources are created to ensure a seamless cleanup process.

Customizing Cleanup Behavior:
While automatic cleanup is convenient for many scenarios, there may be situations where you want to retain staging resources even after stack deletion. This can be useful when you intend to reuse these resources or when you have specific cleanup processes outside of the default behavior. To retain staging assets and disable the auto-delete feature, you can specify autoDeleteStagingAssets: as false when configuring the AWS CDK App Staging Synthesizer:

const app = new App({
defaultStackSynthesizer: AppStagingSynthesizer.defaultResources({
appId: 'my-app-id',
autoDeleteStagingAssets: false, // Disabling auto-delete of staging assets
}),
});

By setting autoDeleteStagingAssets to false, you have full control over the cleanup of staging resources. This allows you to retain and manage these resources independently, giving you the flexibility to align CDK workflows with the organization’s specific practices.

Using an Existing Staging Stack:

While the AWS CDK App Staging Synthesizer offers powerful tools for managing staging resources, there may be scenarios where you already have a meticulously crafted staging stack in place. In such cases, you can seamlessly integrate the existing stack with the AppStagingSynthesizer using the customResources() method. Let’s explore how you can make the most of your pre-existing staging infrastructure.

The process is straightforward—supply your existing staging stack as a resource to the AppStagingSynthesizer using the customResources() method. It’s crucial to ensure that the custom stack adheres to the requirements of the IStagingResources interface for smooth integration.

Here’s an example:

// Create a new CDK App
const resourceApp = new App();

//Instantiate your custom staging stack (make sure it implements IstagingResources)
const resources = new CustomStagingStack(resourceApp, 'CustomStagingStack', {});

//Configure your CDK App to use the App Staging Synthesizer with your custom staging stack
const app = new App({
defaultStackSynthesizer: AppStagingSynthesizer.customResources({
resources,
}),
});

In this example, CustomStagingStack represents the pre-existing staging infrastructure. By providing it as a resource to the App Staging Synthesizer, you seamlessly integrate it into the CDK application’s deployment workflow.

Crafting Custom Staging Stacks for Environment Control:

For those seeking precise control over resource management in different environments, the AWS CDK App Staging Synthesizer offers a robust solution – custom staging stacks. This feature allows you to tailor resource configurations, permissions, and behaviors to meet the unique demands of each environment within the CDK application.

Subclassing DefaultStagingStack for a Quick Start:

If your customization requirements align with the available properties, you can start by subclassing DefaultStagingStack. This streamlined approach lets you inherit existing functionalities while tweaking specific behaviors as needed. Here’s how you can dive right in:

//Define custom staging stack
interface CustomStagingStackOptions extends DefaultStagingStackOptions {}

//Subclass DefaultStagingStack to create the custom stgaing stack
class CustomStagingStack extends DefaultStagingStack {
// Implement customizations here
}

Building Staging Resources from Scratch:

For more granular control, consider building the staging resources entirely from scratch. This approach allows you to define every aspect of the staging stack, from the ground up, by implementing the “IStagingResources” interface. Here’s an example:

// Define custom staging stack properties(if needed)
interface CustomStagingStackProps extends StackProps {}

//Create your custom staging stack that implements IStagingResources
class CustomStagingStack extends Stack implements IStagingResources {
constructor(scope: Construct, id: string, props: CustomStagingStackProps) {
super(scope, id, props);
}

// Implement methods to define your custom staging resources
public addFile(asset: FileAssetSource): FileStagingLocation {
return {
bucketName: 'myBucket',
assumeRoleArn: 'myArn',
dependencyStack: this,
};
}
public addDockerImage(asset: DockerImageAssetSource): ImageStagingLocation {
return {
repoName: 'myRepo',
assumeRoleArn: 'myArn',
dependencyStack: this,
};
}
}

Creating Custom Staging Resources:

Implementing custom staging resources also involves crafting a CustomFactory class to facilitate the creation of these resources in every environment where your CDK App is deployed. This approach offers a high level of customization while ensuring consistency across deployments. Here’s how it works:

// Define a custom factory for your staging resources
class CustomFactory implements IStagingResourcesFactory {
public obtainStagingResources(stack: Stack, context: ObtainStagingResourcesContext) {
const myApp = App.of(stack);

// Create a custom staging stack instance for the current environment
return new CustomStagingStack(myApp!, `CustomStagingStack-${context.environmentString}`, {});
}
}

//Incorporate your custom staging resources into the Application using the customer factory
const app = new App({
defaultStackSynthesizer: AppStagingSynthesizer.customFactory({
factory: new CustomFactory(),
oncePerEnv: true, // by default
}),
});

With this setup, you can create custom staging stacks for each environment, ensuring resource management tailored to your specific needs. Whether you choose to subclass DefaultStagingStack for a quick start or build resources from scratch, custom staging stacks empower you to achieve fine-grained control and consistency across CDK deployments.

Conclusion:

The App Staging Synthesizer introduces a powerful approach to managing staging resources in AWS CDK applications. With enhanced resource isolation and lifecycle control, it addresses the limitations of the default bootstrapping model. By integrating the App Staging Synthesizer into CDK applications, you can achieve better resource management, cleaner cleanup processes, and more control over cloud infrastructure.
Explore this experimental library and unleash the potential of fine-tuned resource management in CDK projects.

For more information and code examples, refer to the official documentation provided by AWS.

About the Authors:
Jehu Gray

Jehu Gray is an Enterprise Solutions Architect at Amazon Web Services where he helps customers design solutions that fits their needs. He enjoys exploring what’s possible with IaC.

Abiola Olanrewaju

Abiola Olanrewaju is an Enterprise Solutions Architect at Amazon Web Services where he helps customers design and implement scalable solutions that drive business outcomes. He has a keen interest in Data Analytics, Security and Automation.

Using Amazon CodeCatalyst Blueprints to Build and Deploy a Video-On-Demand Application to AWS

Post Syndicated from Aaron Grode original https://aws.amazon.com/blogs/devops/using-amazon-codecatalyst-blueprints-to-build-and-deploy-a-video-on-demand-application-to-aws/

In this blog post, we will walk you through how to create and launch new projects in minutes using Amazon CodeCatalyst Blueprints. Blueprints automatically generate source code and a continuous integration and delivery (CI/CD) pipeline to deploy common patterns to your AWS account without requiring extensive programming knowledge. This functionality boosts productivity and lowers time to market for features. To illustrate how to use blueprints, we will walk through how to deploy a video-on-demand web service to your AWS account.

What is Amazon CodeCatalyst? It is an integrated DevOps service for software development teams adopting continuous integration and deployment practices into their software development process. CodeCatalyst provides one place where you can plan work, collaborate on code, and build, test, and deploy applications with continuous integration and continuous delivery (CI/CD) tools. You can easily integrate AWS resources with your projects by connecting your AWS accounts to your CodeCatalyst space. With all of these stages and aspects of an application’s lifecycle in one tool, you can deliver software quickly and confidently.

Prerequisites

To get started with Amazon CodeCatalyst, you need the following prerequisites. Please review them and ensure you have completed all steps before proceeding:

  1. Create an AWS Builder ID. An AWS Builder ID is a new personal profile for everyone who builds on AWS. It is used to access tools and services within AWS, such as Amazon CodeCatalyst.
  2. Join an Amazon CodeCatalyst space. To join a space, you will need to either:
    1. Create an Amazon CodeCatalyst space. If you are creating the space, you will need to specify an AWS account ID for billing and provisioning of resources. If you have not created an AWS account, follow the AWS documentation to create one.
    2. Accept an invitation to an existing space.
  3. Create an AWS Identity and Access Management (IAM) role. Amazon CodeCatalyst will need an IAM role to have permissions to deploy the infrastructure to your AWS account. Follow the documentation for steps how to create an IAM role via the Amazon CodeCatalyst console.

Create the Amazon CodeCatalyst Project

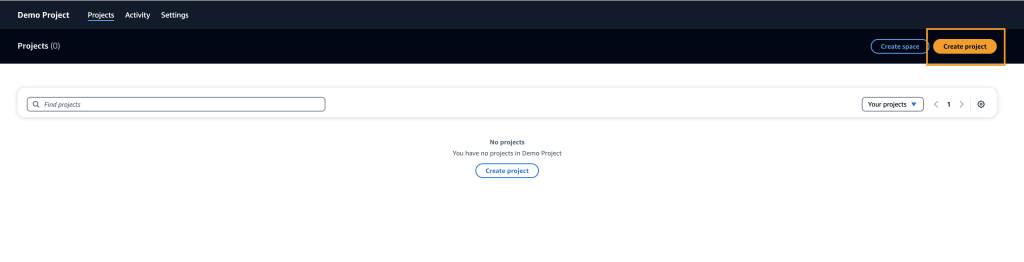
Once all of the prerequisites have been met, you can log in to your Amazon CodeCatalyst space and create a project. Once you are logged in, navigate to your projects and select “Create project” (Figure 1).

Project screen with create project button selected

Figure 1: Project screen with create project button selected

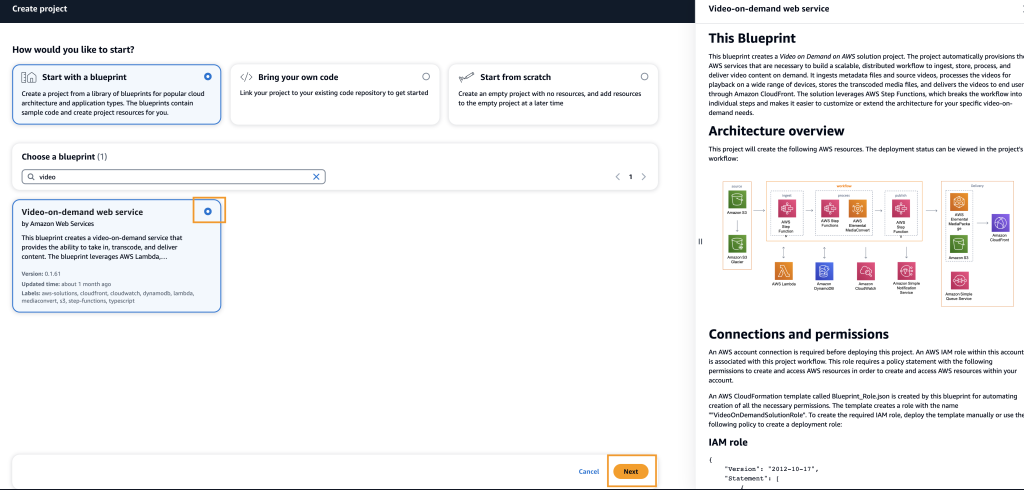
Select Start with a blueprint option and enter into the Choose a blueprint input box, “Video”. Select the Video-on-demand web service blueprint. Choosing this blueprint will open a side panel describing what the blueprint provides and an architecture diagram (Figure 2).

Create project screen with video-on-demand project selected

Figure 2: Create project screen with video-on-demand project selected

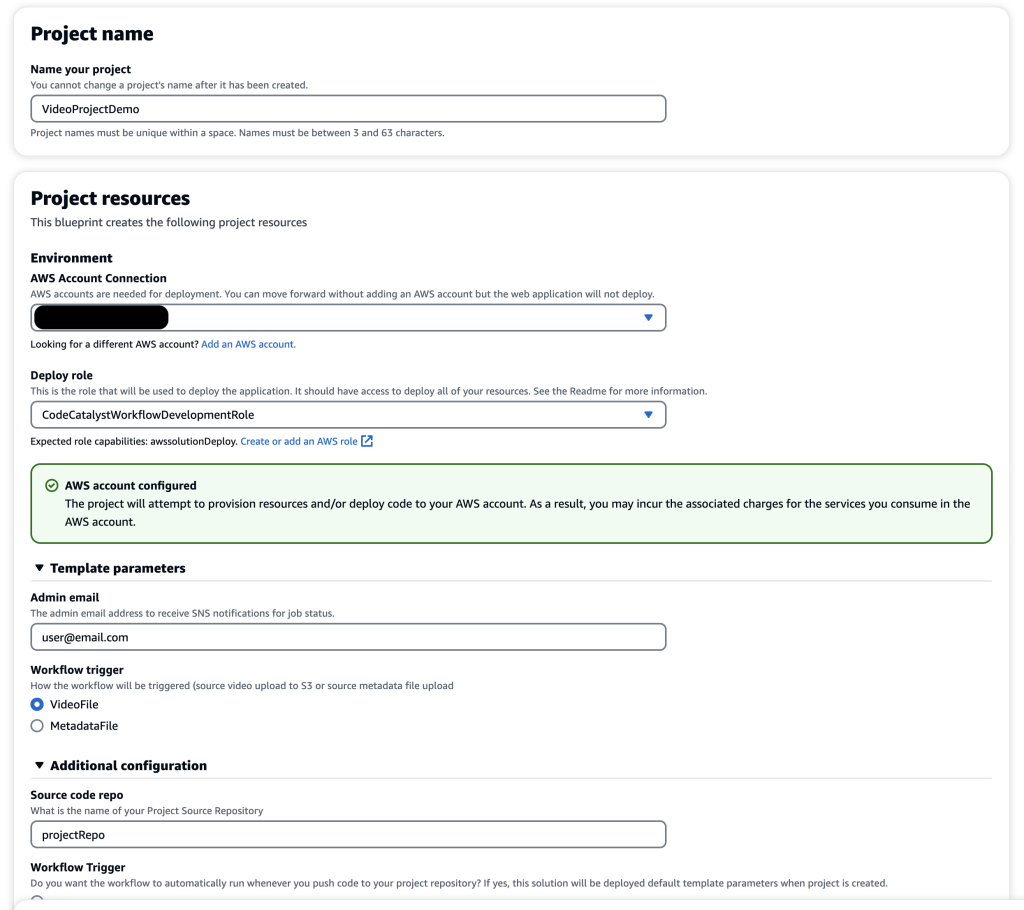
After selecting Next, you will be prompted for a project name, an AWS account ID and an IAM role to be associated with the project. Project names must be unique within your space and must be within 3-63 characters. See the official documentation for project naming requirements for more information.

Your AWS account ID and IAM role that you created as part of prerequisites should be automatically populated for you (Figure 3). If they are not present, you need to ensure you have properly linked the account and created the IAM role.

Project configurations listed. Linked AWS account ID and IAM role present

Figure 3: Project configurations listed. Linked AWS account ID and IAM role present

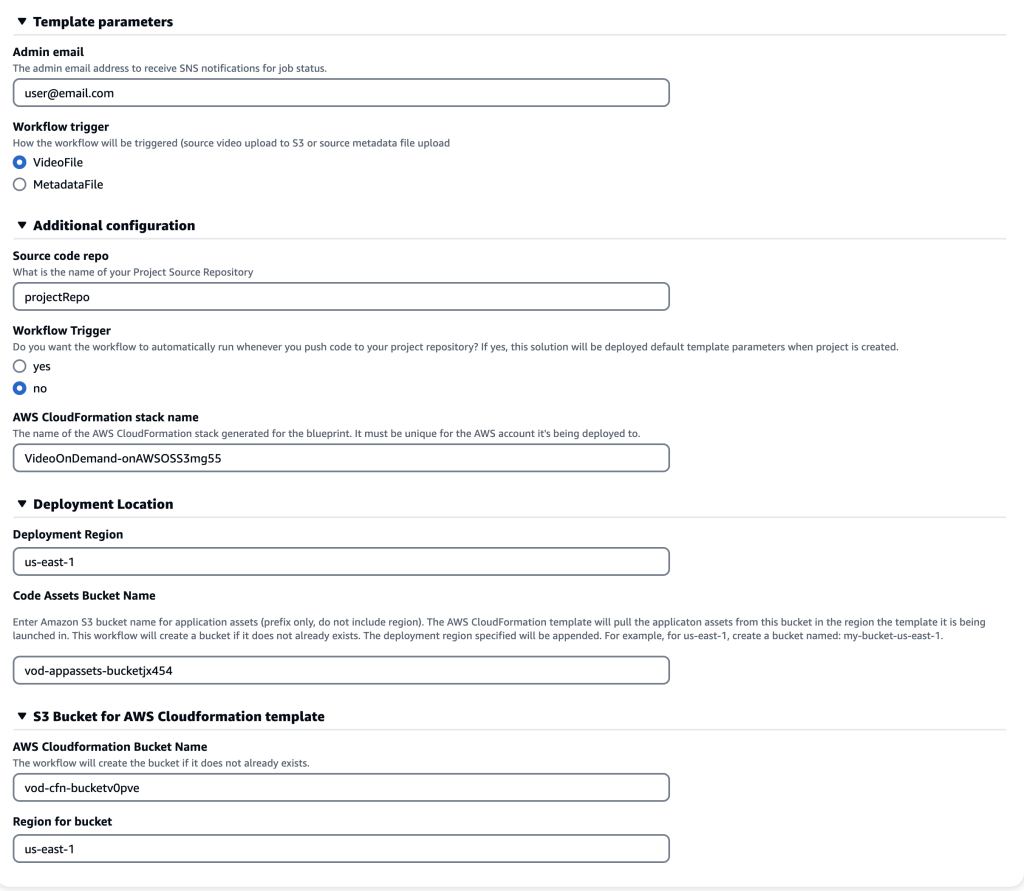
For this specific blueprint, there are more configuration options listed below such as: code repository name, automatic triggers of pipeline, CloudFormation stack name, deployment region and more (Figure 4). Leave all fields under Template parameters, Additional configuration, Deployment Location, and S3 Bucket for AWS CloudFormation Template as their default values.

Additional project configurations listed

Figure 4: Additional project configurations. Leaving default is fine

Once you have finished editing the configuration, choose Create project in the lower right corner. Amazon CodeCatalyst generates your project space and repository.

Walkthrough of the Project Space

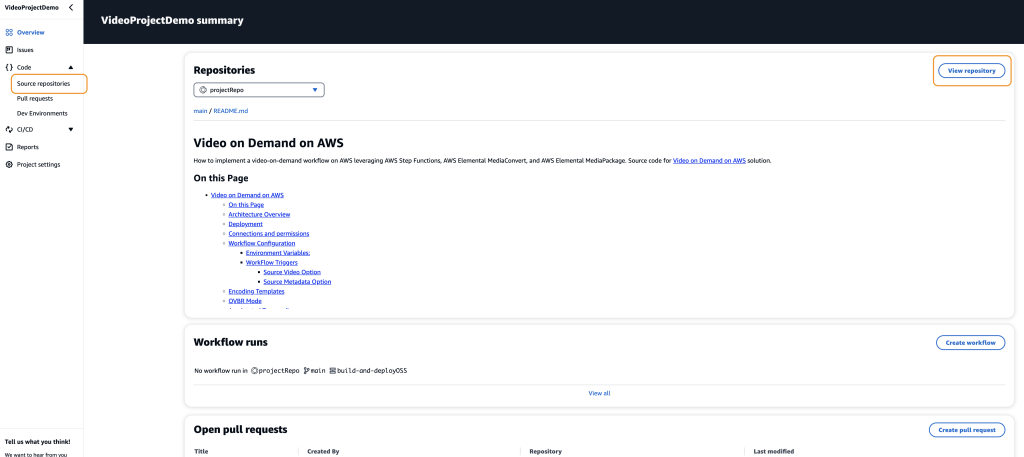
Your new code repository is the first item on the overview dashboard. Select View Repository or Source Repositories (Figure 5) to navigate to the code repository for this project. If the repository details are not present on the overview page, wait for approximately 10-15 seconds and refresh the page.

Project overview screen with view repository and source repositories selected

Figure 5: Project overview screen with view repository and source repositories selected

This blueprint provides you with a functioning video-on-demand solution; however, you can modify the code for your specific use case. Blueprints are a template and give users the freedom to add custom business logic.

Adding IAM Permissions

You should have created an IAM role for Amazon CodeCatalyst workflow to use during the prerequisites section. If you have not, please refer to the prerequisites section.

This specific solution provides an IAM Policy that you can attach to your IAM role such that sufficient IAM permissions are present to deploy the solution to your AWS account. The IAM Policy is within the README.md file. Within README.md, under the connections and permissions section, copy the IAM policy and create a new policy via the AWS console. Make sure to attach this IAM policy to your existing IAM role.

CI/CD Workflows

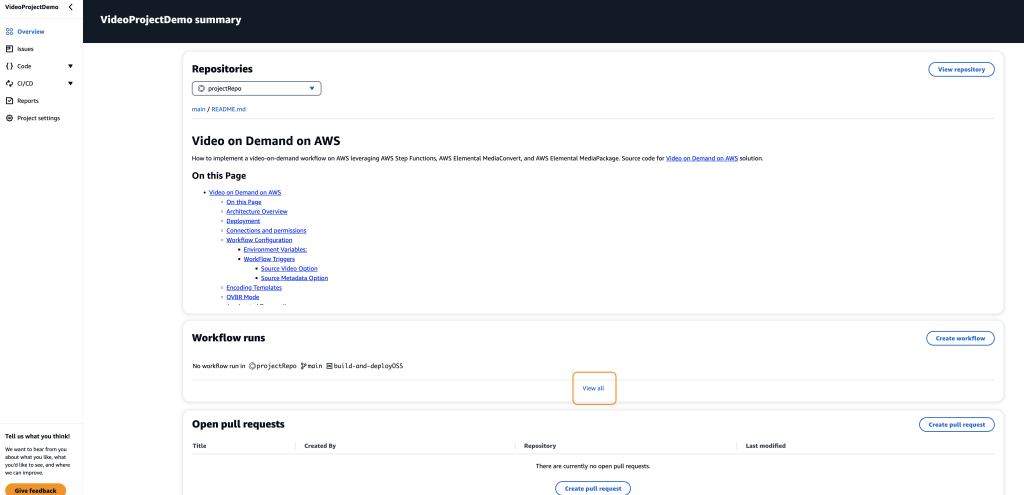
Start the CI/CD process to deploy the video-on-demand solution to your AWS account. Choose View all from the Overview page. This can also be found by selecting CI/CD from the side menu (Figure 6).

Overview page with View All button selected

Figure 6: Overview page with View All button selected

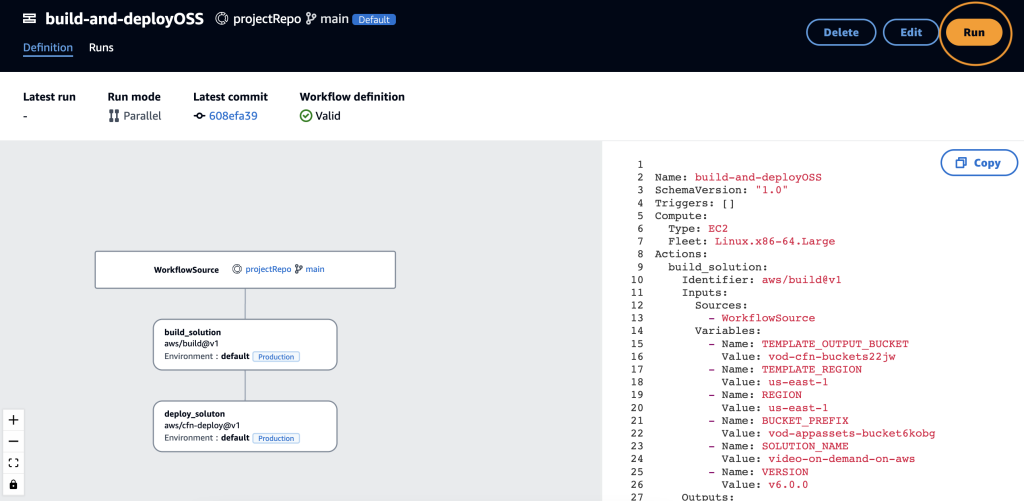
This blueprint comes with one, default workflow called build-and-deployOSS. To build and deploy this application to your AWS account, choose Run on the workflow page (Figure 7).

build-and-deployOSS workflow with Run button selected

Figure 7: build-and-deployOSS workflow with Run button selected

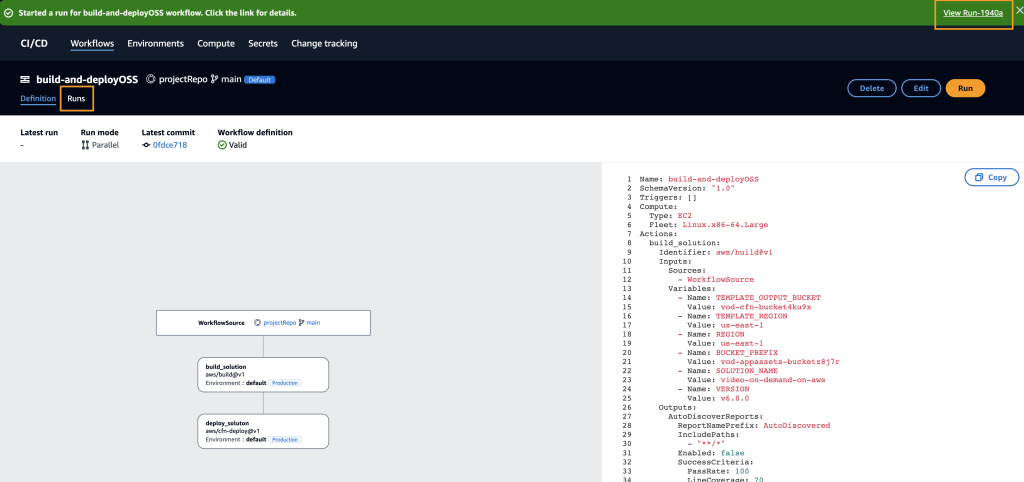
Select the Runs tab or the RunID from the dialog box to view the status of the deployment (Figure 8). This pipeline is building and deploying the full application and will need approximately 10 minutes to run.

build-and-deployOSS workflow with the RunID and Runs tab selected

Figure 8: build-and-deployOSS workflow with the RunID and Runs tab selected

Configure a custom workflow

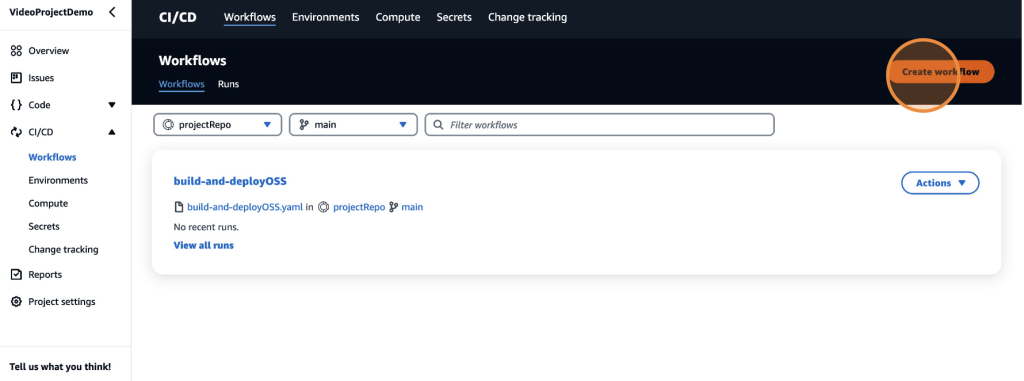
You can configure custom pipelines within CodeCatalyst. To do this, navigate to the Workflows page within Amazon CodeCatalyst and select Create Workflow (Figure 9).

Workflow page with create workflow button selected

Figure 9: Create a custom workflow

Amazon CodeCatalyst offers a variety of drag and drop solutions to building pipelines using YAML and CloudFormation. For more information on configuring custom workflows within Amazon CodeCatalyst, view the getting started with custom workflows documentation.

Check in on your Workflow

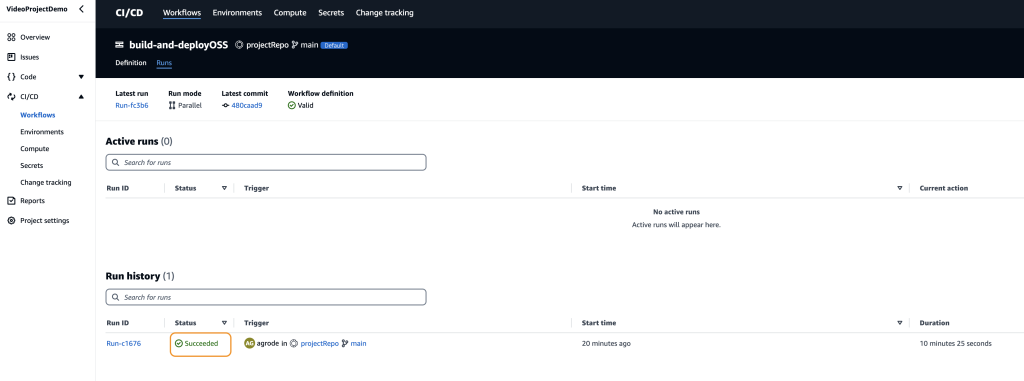
After approximately 10 minutes, the build-and-deployOSS should be complete! The status of the run is listed under Run History (Figure 10).

Run history with the job status highlighted

Figure 10: Run history with the job status highlighted

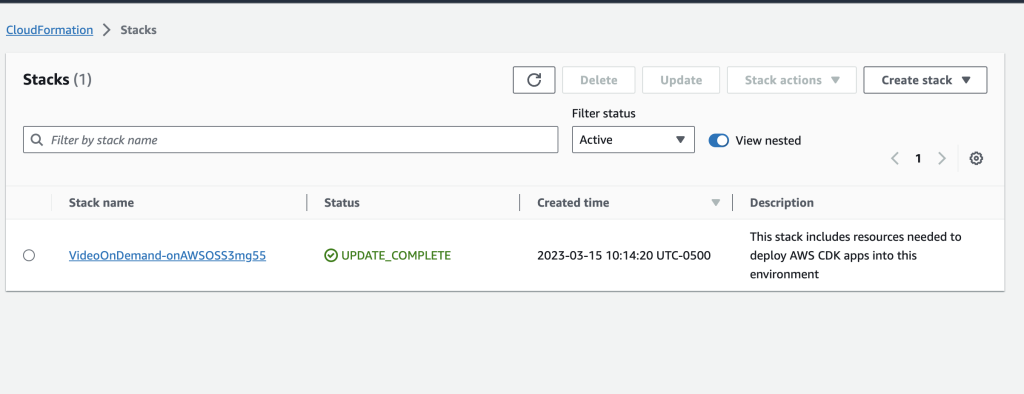
To validate a successful deployment of the blueprint, login to the AWS Console and navigate to the CloudFormation service. If the status is listed as UPDATE_COMPLETE, then the blueprint has been deployed successfully!

AWS Console showing CloudFormation template successful run

Figure 11: AWS Console showing CloudFormation template successful run

Clean up Your Environment

To avoid incurring future charges, delete the infrastructure provisioned by the Amazon CodeCatalyst workflow. This can be done by deleting the CloudFormation stack. To do this, login to your AWS account and select the CloudFormation service. Select the stack with VideoOnDemand in the title and select the delete button. This will delete the entire stack.

Conclusion

While reading this blog, you learned how to use Amazon CodeCatalyst blueprints by deploying a video-on-demand web service to your AWS account. You used the automatically generated source code and a CI/CD pipeline to deploy the solution in minutes. Now, that you are more familiar with Amazon CodeCatalyst blueprints, you can use it to deliver software quickly and confidently.

To share any feedback on your experience with Amazon CodeCatalyst, please visit the Amazon CodeCatalyst feedback page.

Aliya Shaikh

Aliya Shaikh is an Associate Cloud Application Developer at Amazon Web Services (AWS), Professional Services. She has been with AWS for 10 months and has been focused on Serverless and cloud-native solutions. In her role, Aliya collaborates closely with AWS customers to support and accelerate their journeys to the cloud and within the cloud ecosystem by building performant, resilient, scalable, secure and cost efficient solutions.

Aaron Grode

Aaron Grode is an Associate Cloud Application Developer at Amazon Web Services. He specializes in microservices and serverless architectures. Aaron enjoys assisting customers with cloud migrations, ensuring their transition to the cloud is seamless and successful, while continually delivering innovative solutions.

New – Add Your Swift Packages to AWS CodeArtifact

Post Syndicated from Sébastien Stormacq original https://aws.amazon.com/blogs/aws/new-add-your-swift-packages-to-aws-codeartifact/

Starting today, Swift developers who write code for Apple platforms (iOS, iPadOS, macOS, tvOS, watchOS, or visionOS) or for Swift applications running on the server side can use AWS CodeArtifact to securely store and retrieve their package dependencies. CodeArtifact integrates with standard developer tools such as Xcode, xcodebuild, and the Swift Package Manager (the swift package command).

Simple applications routinely include dozens of packages. Large enterprise applications might have hundreds of dependencies. These packages help developers speed up the development and testing process by providing code that solves common programming challenges such as network access, cryptographic functions, or data format manipulation. Developers also embed SDKs–such as the AWS SDKs–to access remote services. These packages might be produced by other teams in your organization or maintained by third-parties, such as open-source projects. Managing packages and their dependencies is an integral part of the software development process. Modern programming languages include tools to download and resolve dependencies: Maven in Java, NuGet in C#, npm or yarn in JavaScript, and pip in Python just to mention a few. Developers for Apple platforms use CocoaPods or the Swift Package Manager (SwiftPM).

Downloading and integrating packages is a routine operation for application developers. However, it presents at least two significant challenges for organizations.

The first challenge is legal. Organizations must ensure that licenses for third-party packages are compatible with the expected use of licenses for your specific project and that the package doesn’t violate someone else’s intellectual property (IP). The second challenge is security. Organizations must ensure that the included code is safe to use and doesn’t include back doors or intentional vulnerabilities designed to introduce security flaws in your app. Injecting vulnerabilities in popular open-source projects is known as a supply chain attack and has become increasingly popular in recent years.

To address these challenges, organizations typically install private package servers on premises or in the cloud. Developers can only use packages vetted by their organization’s security and legal teams and made available through private repositories.

AWS CodeArtifact is a managed service that allows you to safely distribute packages to your internal teams of developers. There is no need to install, manage, or scale the underlying infrastructure. We take care of that for you, giving you more time to work on your apps instead of the software development infrastructure.

I’m excited to announce that CodeArtifact now supports native Swift packages, in addition to npm, PyPI, Maven, NuGet, and generic package formats. Swift packages are a popular way to package and distribute reusable Swift code elements. To learn how to create your own Swift package, you can follow this tutorial. The community has also created more than 6,000 Swift packages that you can use in your Swift applications.

You can now publish and download your Swift package dependencies from your CodeArtifact repository in the AWS Cloud. CodeArtifact SwiftPM works with existing developer tools such as Xcode, VSCode, and the Swift Package Manager command line tool. After your packages are stored in CodeArtifact, you can reference them in your project’s Package.swift file or in your Xcode project, in a similar way you use Git endpoints to access public Swift packages.

After the configuration is complete, your network-jailed build system will download the packages from the CodeArtifact repository, ensuring that only approved and controlled packages are used during your application’s build process.

How To Get Started
As usual on this blog, I’ll show you how it works. Imagine I’m working on an iOS application that uses Amazon DynamoDB as a database. My application embeds the AWS SDK for Swift as a dependency. To comply with my organization policies, the application must use a specific version of the AWS SDK for Swift, compiled in-house and approved by my organization’s legal and security teams. In this demo, I show you how I prepare my environment, upload the package to the repository, and use this specific package build as a dependency for my project.

For this demo, I focus on the steps specific to Swift packages. You can read the tutorial written by my colleague Steven to get started with CodeArtifact.

I use an AWS account that has a package repository (MySwiftRepo) and domain (stormacq-test) already configured.

CodeArtifact repository

To let SwiftPM acess my CodeArtifact repository, I start by collecting an authentication token from CodeArtifact.

export CODEARTIFACT_AUTH_TOKEN=`aws codeartifact get-authorization-token \
                                     --domain stormacq-test              \
                                     --domain-owner 012345678912         \
                                     --query authorizationToken          \
                                     --output text`

Note that the authentication token expires after 12 hours. I must repeat this command after 12 hours to obtain a fresh token.

Then, I request the repository endpoint. I pass the domain name and domain owner (the AWS account ID). Notice the --format swift option.

export CODEARTIFACT_REPO=`aws codeartifact get-repository-endpoint  \
                               --domain stormacq-test               \
                               --domain-owner 012345678912          \
                               --format swift                       \
                               --repository MySwiftRepo             \
                               --query repositoryEndpoint           \
                               --output text`

Now that I have the repository endpoint and an authentication token, I use the AWS Command Line Interface (AWS CLI) to configure SwiftPM on my machine.

SwiftPM can store the repository configurations at user level (in the file ~/.swiftpm/configurations) or at project level (in the file <your project>/.swiftpm/configurations). By default, the CodeArtifact login command creates a project-level configuration to allow you to use different CodeArtifact repositories for different projects.

I use the AWS CLI to configure SwiftPM on my build machine.

aws codeartifact login          \
    --tool swift                \
    --domain stormacq-test      \
    --repository MySwiftRepo    \
    --namespace aws             \
    --domain-owner 012345678912

The command invokes swift package-registry login with the correct options, which in turn, creates the required SwiftPM configuration files with the given repository name (MySwiftRepo) and scope name (aws).

Now that my build machine is ready, I prepare my organization’s approved version of the AWS SDK for Swift package and then I upload it to the repository.

git clone https://github.com/awslabs/aws-sdk-swift.git
pushd aws-sdk-swift
swift package archive-source
mv aws-sdk-swift.zip ../aws-sdk-swift-0.24.0.zip
popd

Finally, I upload this package version to the repository.

When using Swift 5.9 or more recent, I can upload my package to my private repository using the SwiftPM command:

swift package-registry publish           \
                       aws.aws-sdk-swift \
                       0.24.0            \
                       --verbose

The versions of Swift before 5.9 don’t provide a swift package-registry publish command. So, I use the curl command instead.

curl  -X PUT 
      --user "aws:$CODEARTIFACT_AUTH_TOKEN"               \
      -H "Accept: application/vnd.swift.registry.v1+json" \
      -F source-archive="@aws-sdk-swift-0.24.0.zip"       \
      "${CODEARTIFACT_REPO}aws/aws-sdk-swift/0.24.0"

Notice the format of the package name after the URI of the repository: <scope>/<package name>/<package version>. The package version must follow the semantic versioning scheme.

I can use the CLI or the console to verify that the package is available in the repository.

CodeArtifact List Packages

aws codeartifact list-package-versions      \
                  --domain stormacq-test    \
                  --repository MySwiftRepo  \
                  --format swift            \
                  --namespace aws           \
                  --package aws-sdk-swift
{
    "versions": [
        {
            "version": "0.24.0",
            "revision": "6XB5O65J8J3jkTDZd8RMLyqz7XbxIg9IXpTudP7THbU=",
            "status": "Published",
            "origin": {
                "domainEntryPoint": {
                    "repositoryName": "MySwiftRepo"
                },
                "originType": "INTERNAL"
            }
        }
    ],
    "defaultDisplayVersion": "0.24.0",
    "format": "swift",
    "package": "aws-sdk-swift",
    "namespace": "aws"
}

Now that the package is available, I can use it in my projects as usual.

Xcode uses SwiftPM tools and configuration files I just created. To add a package to my Xcode project, I select the project name on the left pane, and then I select the Package Dependencies tab. I can see the packages that are already part of my project. To add a private package, I choose the + sign under Packages.

Xcode add a package as dependency to a project

On the top right search field, I enter aws.aws-sdk-swift (this is <scope name>.<package name>). After a second or two, the package name appears on the list. On the top right side, you can verify the source repository (next to the Registry label). Before selecting the Add Package button, select the version of the package, just like you do for publicly available packages.

Add a private package from Codeartifact on Xcode

Alternatively, for my server-side or command-line applications, I add the dependency in the Package.swift file. I also use the format (<scope>.<package name>) as the first parameter of .package(id:from:)function.

    dependencies: [
        .package(id: "aws.aws-sdk-swift", from: "0.24.0")
    ],

When I type swift package update, SwiftPM downloads the package from the CodeArtifact repository.

Things to Know
There are some things to keep in mind before uploading your first Swift packages.

  • Be sure to update to the latest version of the CLI before trying any command shown in the preceding instructions.
  • You have to use Swift version 5.8 or newer to use CodeArtifact with the swift package command. On macOS, the Swift toolchain comes with Xcode. Swift 5.8 is available on macOS 13 (Ventura) and Xcode 14. On Linux and Windows, you can download the Swift toolchain from swift.org.
  • You have to use Xcode 15 for your iOS, iPadOS, tvOS, or watchOS applications. I tested this with Xcode 15 beta8.
  • The swift package-registry publish command is available with Swift 5.9 or newer. When you use Swift 5.8, you can use curlto upload your package, as I showed in the demo (or use any HTTP client of your choice).
  • Swift packages have the concept of scope. A scope provides a namespace for related packages within a package repository. Scopes are mapped to CodeArtifact namespaces.
  • The authentication token expires after 12 hours. We suggest writing a script to automate its renewal or using a scheduled AWS Lambda function and securely storing the token in AWS Secrets Manager (for example).

Troubleshooting
If Xcode can not find your private package, double-check the registry configuration in ~/.swiftpm/configurations/registries.json. In particular, check if the scope name is present. Also verify that the authentication token is present in the keychain. The name of the entry is the URL of your repository. You can verify the entries in the keychain with the /Application/Utilities/Keychain Access.app application or using the security command line tool.

security find-internet-password                                                  \
          -s "stormacq-test-012345678912.d.codeartifact.us-west-2.amazonaws.com" \
          -g

Here is the SwiftPM configuration on my machine.

cat ~/.swiftpm/configuration/registries.json

{
  "authentication" : {
    "stormacq-test-012345678912.d.codeartifact.us-west-2.amazonaws.com" : {
      "loginAPIPath" : "/swift/MySwiftRepo/login",
      "type" : "token"
    }
  },
  "registries" : {
    "aws" : { // <-- this is the scope name!
      "url" : "https://stormacq-test-012345678912.d.codeartifact.us-west-2.amazonaws.com/swift/MySwiftRepo/"
    }
  },
  "version" : 1
}

Keychain item for codeartifact authentication token

Pricing and Availability
CodeArtifact costs for Swift packages are the same as for the other package formats already supported. CodeArtifact billing depends on three metrics: the storage (measured in GB per month), the number of requests, and the data transfer out to the internet or to other AWS Regions. Data transfer to AWS services in the same Region is not charged, meaning you can run your CICD jobs on Amazon EC2 Mac instances, for example, without incurring a charge for the CodeArtifact data transfer. As usual, the pricing page has the details.

CodeArtifact for Swift packages is available in all 13 Regions where CodeArtifact is available.

Now go build your Swift applications and upload your private packages to CodeArtifact!

— seb

PS : Do you know you can write Lambda functions in the Swift programming language? Check the quick start guide or follow this 35-minute tutorial.

Implementing idempotent AWS Lambda functions with Powertools for AWS Lambda (TypeScript)

Post Syndicated from Pascal Vogel original https://aws.amazon.com/blogs/compute/implementing-idempotent-aws-lambda-functions-with-powertools-for-aws-lambda-typescript/

This post is written by Alexander Schüren, Sr Specialist SA, Powertools.

One of the design principles of AWS Lambda is to “develop for retries and failures”. If your function fails, the Lambda service will retry and invoke your function again with the same event payload. Therefore, when your function performs tasks such as processing orders or making reservations, it is necessary for your Lambda function to handle requests idempotently to avoid duplicate payment or order processing, which can result in a poor customer experience.

This article explains what idempotency is and how to make your Lambda functions idempotent using the idempotency utility for Powertools for AWS Lambda (TypeScript). The Powertools idempotency utility for TypeScript was co-developed with Vanguard and is now generally available.

Understanding idempotency

Idempotency is the property of an operation that can be applied multiple times without changing the result beyond the initial execution. You can safely run an idempotent operation multiple times without side effects, such as duplicate records or data inconsistencies. This is especially relevant for payment and order processing or third-party API integrations.

There are key concepts to consider when implementing idempotency in AWS Lambda. For each invocation, you specify which subset of the event payload you want to use to identify an idempotent request. This is called the idempotency key. This key can be a single field such as transactionId, a combination of multiple fields such as customerId and requestId, or the entire event payload.

Because timestamps, dates, and other generated values within the payload affect the idempotency key, we recommend that you define specific fields rather than using the entire event payload.

By evaluating the idempotency key, you can then decide if the function needs to run again or send an existing response to the client. To do this, you need to store the following information for each request in a persistence layer (i.e., Amazon DynamoDB):

  • Status: IN_PROGRESS, EXPIRED, COMPLETE
  • Response data: the response to send back to the client instead of executing the function again
  • Expiration timestamp: when the idempotency record becomes invalid for reuse

The following diagram shows a successful request flow for this idempotency scenario:

Request flow for idempotent Lambda function

When you invoke a Lambda function with a particular event for the first time, it stores a record with a unique idempotency key tied to an event payload in the persistence layer.

The function then executes its code and updates the record in the persistence layer with the function response. For subsequent invocations with the same payload, you must check if the idempotency key exists in the persistence layer. If it exists, the function returns the same response to the client. This prevents multiple invocations of the function, making it idempotent.

There are more edge cases to be mindful of, such as when the idempotency record has expired, or handling of failures between the client, the Lambda function, and the persistence layer. The Powertools for AWS Lambda (TypeScript) documentation covers all request flows in detail.

Idempotency with Powertools for AWS Lambda (TypeScript)

Powertools for AWS Lambda, available in Python, Java, .NET, and TypeScript, provides utilities for Lambda functions to ease the adoption of best practices and to reduce the amount of code needed to perform recurring tasks. In particular, it provides a module to handle idempotency.

This post shows examples using the TypeScript version of Powertools. To get started with the Powertools idempotency module, you must install the library and configure it within your build process. For more details, follow the Powertools for AWS Lambda documentation.

Getting started

Powertools for AWS Lambda (TypeScript) is modular, meaning you can install the idempotency utility independently from the Logger, Tracing, Metrics, or other packages. Install the idempotency utility library and the AWS SDK v3 client for DynamoDB in your project using npm:

npm i @aws-lambda-powertools/idempotency @aws-sdk/client-dynamodb @aws-sdk/lib-dynamodb

Before getting started, you need to create a persistent storage layer where the idempotency utility can store its state. Your Lambda function AWS Identity and Access Management (IAM) role must have dynamodb:GetItem, dynamodb:PutItem, dynamodb:UpdateItem and dynamodb:DeleteItem permissions.

Currently, DynamoDB is the only supported persistent storage layer, so you’ll need to create a table first. Use the AWS Cloud Development Kit (CDK), AWS CloudFormation, AWS Serverless Application Model (SAM) or any Infrastructure as Code tool of your choice that supports DynamoDB resources.

The following sections illustrate how to instrument your Lambda function code to make it idempotent using a wrapper function or using middy middleware.

Using the function wrapper

Assuming you have created a DynamoDB table with the name IdempotencyTable, create a persistence layer in your Lambda function code:

import { makeIdempotent } from "@aws-lambda-powertools/idempotency";
import { DynamoDBPersistenceLayer } from "@aws-lambda-powertools/idempotency/dynamodb";

const persistenceStore = new DynamoDBPersistenceLayer({
  tableName: "IdempotencyTable",
});

Now, apply the makeIdempotent function wrapper to your Lambda function handler to make it idempotent and use the previously configured persistence store.

import { makeIdempotent } from '@aws-lambda-powertools/idempotency';
import { DynamoDBPersistenceLayer } from '@aws-lambda-powertools/idempotency/dynamodb';
import type { Context } from 'aws-lambda';
import type { Request, Response, SubscriptionResult } from './types';

export const handler = makeIdempotent(
  async (event: Request, _context: Context): Promise<Response> => {
    try {
      const payment = … // create payment
	  
      return {
        paymentId: payment.id,
        message: 'success',
        statusCode: 200,
      };

    } catch (error) {
      throw new Error('Error creating payment');
    }
  },
  {
    persistenceStore,
  }
);

The function processes the incoming event to create a payment and return the paymentId, message, and status back to the client. Making the Lambda function handler idempotent ensures that payments are only processed once, despite multiple Lambda invocations with the same event payload. You can also apply the makeIdempotent function wrapper to any other function outside of your handler.

Use the following type definitions for this example by adding a types.ts file to your source folder:

type Request = {
  user: string;
  productId: string;
};

type Response = {
  [key: string]: unknown;
};

type SubscriptionResult = {
  id: string;
  productId: string;
};

Using middy middleware

If you are using middy middleware, Powertools provides makeHandlerIdempotent middleware to make your Lambda function handler idempotent:

import { makeHandlerIdempotent } from '@aws-lambda-powertools/idempotency/middleware';
import { DynamoDBPersistenceLayer } from '@aws-lambda-powertools/idempotency/dynamodb';
import middy from '@middy/core';
import type { Context } from 'aws-lambda';
import type { Request, Response, SubscriptionResult } from './types';

const persistenceStore = new DynamoDBPersistenceLayer({
  tableName: 'IdempotencyTable',
});

export const handler = middy(
  async (event: Request, _context: Context): Promise<Response> => {
    try {
      const payment = … // create payment object
	  
      return {
        paymentId: payment.id,
        message: 'success',
        statusCode: 200,
      };
    } catch (error) {
      throw new Error('Error creating payment');
    }
  }
).use(
    makeHandlerIdempotent({
      persistenceStore,
  })
);

Configuration options

The Powertools idempotency utility comes with several configuration options to change the idempotency behavior that will fit your use case scenario. This section highlights the most common configurations. You can find all available customization options in the AWS Powertools for Lambda (TypeScript) documentation.

Persistence layer options

When you create a DynamoDBPersistenceLayer object, only the tableName attribute is required. Powertools will expect the table with a partition key id and will create other attributes with default values.

You can change these default values if needed by passing the options parameter:

import { DynamoDBPersistenceLayer } from '@aws-lambda-powertools/idempotency/dynamodb';

const persistenceStore = new DynamoDBPersistenceLayer({
  tableName: 'idempotencyTableName',
  keyAttr: 'idempotencyKey', // default: id
  expiryAttr: 'expiresAt', // default: expiration
  inProgressExpiryAttr: 'inProgressExpiresAt', // default: in_progress_expiration
  statusAttr: 'currentStatus', // default: status
  dataAttr: 'resultData', // default: data
  validationKeyAttr: 'validationKey', .// default validation
});

Using a subset of the event payload

When you configure idempotency for your Lambda function handler, Powertools will use the entire event payload for idempotency handling by hashing the object.

However, events from AWS services such as Amazon API Gateway or Amazon Simple Queue Service (Amazon SQS) often have generated fields, such as timestamp or requestId. This results in Powertools treating each event payload as unique.

To prevent that, create an IdempotencyConfig and configure which part of the payload should be hashed for the idempotency logic.

Create the IdempotencyConfig and set eventKeyJmespath to a key within your event payload:

import { IdempotencyConfig } from '@aws-lambda-powertools/idempotency';

// Extract the idempotency key from the request headers
const config = new IdempotencyConfig({
  eventKeyJmesPath: 'headers."X-Idempotency-Key"',
});

Use the X-Idempotency-Key header for your idempotency key. Subsequent invocations with the same header value will be idempotent.

You can then add the configuration to the makeIdempotent function wrapper from the previous example:

export const handler = makeIdempotent(
  async (event: Request, _context: Context): Promise<Response> => {
    try {
      const payment = … // create payment
      
	  return {
        paymentId: payment.id,
        message: 'success',
        statusCode: 200,
      };
    } catch (error) {
      throw new Error('Error creating payment');
    }
  },
  {
    persistenceStore,
    config
  }
);

The event payload should contain X-Idempotency-Key in the headers, so Powertools can use this field to handle idempotency:

{
  "version": "2.0",
  "routeKey": "ANY /createpayment",
  "rawPath": "/createpayment",
  "rawQueryString": "",
  "headers": {
    "Header1": "value1",
    "X-Idempotency-Key": "abcdefg"
  },
  "requestContext": {
    "accountId": "123456789012",
    "apiId": "api-id",
    "domainName": "id.execute-api.us-east-1.amazonaws.com",
    "domainPrefix": "id",
    "http": {
      "method": "POST",
      "path": "/createpayment",
      "protocol": "HTTP/1.1",
      "sourceIp": "ip",
      "userAgent": "agent"
    },
    "requestId": "id",
    "routeKey": "ANY /createpayment",
    "stage": "$default",
    "time": "10/Feb/2021:13:40:43 +0000",
    "timeEpoch": 1612964443723
  },
  "body": "{\"user\":\"xyz\",\"productId\":\"123456789\"}",
  "isBase64Encoded": false
}

There are other configuration options you can apply, such as payload validation, expiration duration, local caching, and others. See the Powertools for AWS Lambda (TypeScript) documentation for more information.

Customizing the AWS SDK configuration

The DynamoDBPersistenceLayer is built-in and allows you to store the idempotency data for all your requests. Under the hood, Powertools uses the AWS SDK for JavaScript v3. Change the SDK configuration by passing a clientConfig object.

The following sample sets the region to eu-west-1:

import { DynamoDBPersistenceLayer } from '@aws-lambda-powertools/idempotency/dynamodb';

const persistenceStore = new DynamoDBPersistenceLayer({
  tableName: 'IdempotencyTable',
  clientConfig: {
    region: 'eu-west-1',
  },
});

If you are using your own client, you can pass it the persistence layer:

import { DynamoDBPersistenceLayer } from '@aws-lambda-powertools/idempotency/dynamodb';
import { DynamoDBClient } from '@aws-sdk/client-dynamodb';

const ddbClient = new DynamoDBClient({ region: 'eu-west-1' });

const dynamoDBPersistenceLayer = new DynamoDBPersistenceLayer({
  tableName: 'IdempotencyTable',
  awsSdkV3Client: ddbClient,
});

Conclusion

Making your Lambda functions idempotent can be a challenge and, if not done correctly, can lead to duplicate data, inconsistencies, and a bad customer experience. This post shows how to use Powertools for AWS Lambda (TypeScript) to process your critical transactions only once when using AWS Lambda.

For more details on the Powertools idempotency feature and its configuration options, see the full documentation.

For more serverless learning resources, visit Serverless Land.

Using AWS CloudFormation and AWS Cloud Development Kit to provision multicloud resources

Post Syndicated from Aaron Sempf original https://aws.amazon.com/blogs/devops/using-aws-cloudformation-and-aws-cloud-development-kit-to-provision-multicloud-resources/

Customers often need to architect solutions to support components across multiple cloud service providers, a need which may arise if they have acquired a company running on another cloud, or for functional purposes where specific services provide a differentiated capability. In this post, we will show you how to use the AWS Cloud Development Kit (AWS CDK) to create a single pane of glass for managing your multicloud resources.

AWS CDK is an open source framework that builds on the underlying functionality provided by AWS CloudFormation. It allows developers to define cloud resources using common programming languages and an abstraction model based on reusable components called constructs. There is a misconception that CloudFormation and CDK can only be used to provision resources on AWS, but this is not the case. The CloudFormation registry, with support for third party resource types, along with custom resource providers, allow for any resource that can be configured via an API to be created and managed, regardless of where it is located.

Multicloud solution design paradigm

Multicloud solutions are often designed with services grouped and separated by cloud, creating a segregation of resource and functions within the design. This approach leads to a duplication of layers of the solution, most commonly a duplication of resources and the deployment processes for each environment. This duplication increases cost, and leads to a complexity of management increasing the potential break points within the solution or practice. 

Along with simplifying resource deployments, and the ever-increasing complexity of customer needs, so too has the need increased for the capability of IaC solutions to deploy resources across hybrid or multicloud environments. Through meeting this need, a proliferation of supported tools, frameworks, languages, and practices has created “choice overload”. At worst, this scares the non-cloud-savvy away from adopting an IaC solution benefiting their cloud journey, and at best confuses the very reason for adopting an IaC practice.

A single pane of glass

Systems Thinking is a holistic approach that focuses on the way a system’s constituent parts interrelate and how systems work as a whole especially over time and within the context of larger systems. Systems thinking is commonly accepted as the backbone of a successful systems engineering approach. Designing solutions taking a full systems view, based on the component’s function and interrelation within the system across environments, more closely aligns with the ability to handle the deployment of each cloud-specific resource, from a single control plane.

While AWS provides a list of services that can be used to help design, manage and operate hybrid and multicloud solutions, with AWS as the primary cloud you can go beyond just using services to support multicloud. CloudFormation registry resource types model and provision resources using custom logic, as a component of stacks in CloudFormation. Public extensions are not only provided by AWS, but third-party extensions are made available for general use by publishers other than AWS, meaning customers can create their own extensions and publish them for anyone to use.

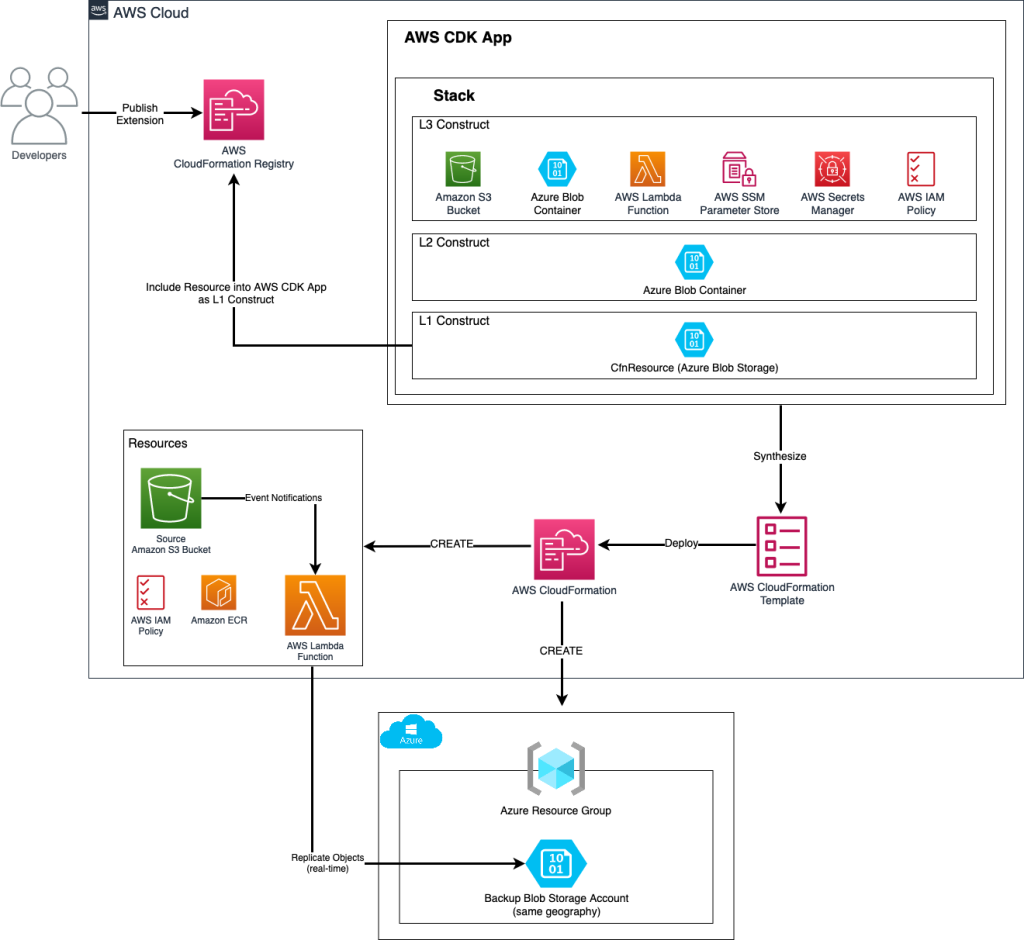
The AWS CDK, which has a 1:1 mapping of all AWS CloudFormation resources, as well as a library of abstracted constructs, supports the ability to import custom AWS CloudFormation extensions, enabling customers and partners to create custom AWS CDK constructs for their extensions. The chosen programming language can be used to inherit and abstract the custom resource into reusable AWS CDK constructs, allowing developers to create solutions that contain native AWS extensions along with secondary hybrid or alternate cloud resources.

Providing the ability to integrate mixed resources in the same stack more closely aligns with the functional design and often diagrammatic depiction of the solution. In essence, we are creating a single IaC pane of glass over the entire solution, deployed through a single control plane. This lowers the complexity and the cost of maintaining separate modules and deployment pipelines across multiple cloud providers.

A common use case for a multicloud: disaster recovery

One of the most common use cases of the requirement for using components across different cloud providers is the need to maintain data sovereignty while designing disaster recovery (DR) into a solution.

Data sovereignty is the idea that data is subject to the laws of where it is physically located, and in some countries extends to regulations that if data is collected from citizens of a geographical area, then the data must reside in servers located in jurisdictions of that geographical area or in countries with a similar scope and rigor in their protection laws. 

This requires organizations to remain in compliance with their host country, and in cases such as state government agencies, a stricter scope of within state boundaries, data sovereignty regulations. Unfortunately, not all countries, and especially not all states, have multiple AWS regions to select from when designing where their primary and recovery data backups will reside. Therefore, the DR solution needs to take advantage of multiple cloud providers in the same geography, and as such a solution must be designed to backup or replicate data across providers.

The multicloud solution

A multicloud solution to the proposed use case would be the backup of data from an AWS resource such as an Amazon S3 bucket to another cloud provider within the same geography, such as an Azure Blob Storage container, using AWS event driven behaviour to trigger the copying of data from the primary AWS resource to the secondary Azure backup resource.

Following the IaC single pane of glass approach, the Azure Blob Storage container is created as a resource type in the CloudFormation Registry, and imported into the AWS CDK to be used as a construct in the solution. However, before the extension resource type can be used effectively in the CDK as a reusable construct and added to your private library, you will first need to go through the import into CDK process for creating Constructs.

There are three different levels of constructs, beginning with low-level constructs, which are called CFN Resources (or L1, short for “layer 1”). These constructs directly represent all resources available in AWS CloudFormation. They are named CfnXyz, where Xyz is name of the resource.

Layer 1 Construct

In this example, an L1 construct named CfnAzureBlobStorage represents an Azure::BlobStorage AWS CloudFormation extension. Here you also explicitly configure the ref property, in order for higher level constructs to access the Output value which will be the Azure blob container url being provisioned.

import { CfnResource } from "aws-cdk-lib";
import { Secret, ISecret } from "aws-cdk-lib/aws-secretsmanager";
import { Construct } from "constructs";

export interface CfnAzureBlobStorageProps {
  subscriptionId: string;
  clientId: string;
  tenantId: string;
  clientSecretName: string;
}

// L1 Construct
export class CfnAzureBlobStorage extends Construct {
  // Allows accessing the ref property
  public readonly ref: string;

  constructor(scope: Construct, id: string, props: CfnAzureBlobStorageProps) {
    super(scope, id);

    const secret = this.getSecret("AzureClientSecret", props.clientSecretName);
    
    const azureBlobStorage = new CfnResource(
      this,
      "ExtensionAzureBlobStorage",
      {
        type: "Azure::BlobStorage",
        properties: {
          AzureSubscriptionId: props.subscriptionId,
          AzureClientId: props.clientId,
          AzureTenantId: props.tenantId,
          AzureClientSecret: secret.secretValue.unsafeUnwrap()
        },
      }
    );

    this.ref = azureBlobStorage.ref;
  }

  private getSecret(id: string, secretName: string) : ISecret {  
    return Secret.fromSecretNameV2(this, secretName.concat("Value"), secretName);
  }
}

As with every CDK Construct, the constructor arguments are scope, id and props. scope and id are propagated to the cdk.Construct base class. The props argument is of type CfnAzureBlobStorageProps which includes four properties all of type string. This is how the Azure credentials are propagated down from upstream constructs.

Layer 2 Construct

The next level of constructs, L2, also represent AWS resources, but with a higher-level, intent-based API. They provide similar functionality, but incorporate the defaults, boilerplate, and glue logic you’d be writing yourself with a CFN Resource construct. They also provide convenience methods that make it simpler to work with the resource.

In this example, an L2 construct is created to abstract the CfnAzureBlobStorage L1 construct and provides additional properties and methods.

import { Construct } from "constructs";
import { CfnAzureBlobStorage } from "./cfn-azure-blob-storage";

// L2 Construct
export class AzureBlobStorage extends Construct {
  public readonly blobContainerUrl: string;

  constructor(
    scope: Construct,
    id: string,
    subscriptionId: string,
    clientId: string,
    tenantId: string,
    clientSecretName: string
  ) {
    super(scope, id);

    const azureBlobStorage = new CfnAzureBlobStorage(
      this,
      "CfnAzureBlobStorage",
      {
        subscriptionId: subscriptionId,
        clientId: clientId,
        tenantId: tenantId,
        clientSecretName: clientSecretName,
      }
    );

    this.blobContainerUrl = azureBlobStorage.ref;
  }
}

The custom L2 construct class is declared as AzureBlobStorage, this time without the Cfn prefix to represent an L2 construct. This time the constructor arguments include the Azure credentials and client secret, and the ref from the L1 construct us output to the public variable AzureBlobContainerUrl.

As an L2 construct, the AzureBlobStorage construct could be used in CDK Apps along with AWS Resource Constructs in the same Stack, to be provisioned through AWS CloudFormation creating the IaC single pane of glass for a multicloud solution.

Layer 3 Construct

The true value of the CDK construct programming model is in the ability to extend L2 constructs, which represent a single resource, into a composition of multiple constructs that provide a solution for a common task. These are Layer 3, L3, Constructs also known as patterns.

In this example, the L3 construct represents the solution architecture to backup objects uploaded to an Amazon S3 bucket into an Azure Blob Storage container in real-time, using AWS Lambda to process event notifications from Amazon S3.

import { RemovalPolicy, Duration, CfnOutput } from "aws-cdk-lib";
import { Bucket, BlockPublicAccess, EventType } from "aws-cdk-lib/aws-s3";
import { DockerImageFunction, DockerImageCode } from "aws-cdk-lib/aws-lambda";
import { PolicyStatement, Effect } from "aws-cdk-lib/aws-iam";
import { LambdaDestination } from "aws-cdk-lib/aws-s3-notifications";
import { IStringParameter, StringParameter } from "aws-cdk-lib/aws-ssm";
import { Secret, ISecret } from "aws-cdk-lib/aws-secretsmanager";
import { Construct } from "constructs";
import { AzureBlobStorage } from "./azure-blob-storage";

// L3 Construct
export class S3ToAzureBackupService extends Construct {
  constructor(
    scope: Construct,
    id: string,
    azureSubscriptionIdParamName: string,
    azureClientIdParamName: string,
    azureTenantIdParamName: string,
    azureClientSecretName: string
  ) {
    super(scope, id);

    // Retrieve existing SSM Parameters
    const azureSubscriptionIdParameter = this.getSSMParameter("AzureSubscriptionIdParam", azureSubscriptionIdParamName);
    const azureClientIdParameter = this.getSSMParameter("AzureClientIdParam", azureClientIdParamName);
    const azureTenantIdParameter = this.getSSMParameter("AzureTenantIdParam", azureTenantIdParamName);    
    
    // Retrieve existing Azure Client Secret
    const azureClientSecret = this.getSecret("AzureClientSecret", azureClientSecretName);

    // Create an S3 bucket
    const sourceBucket = new Bucket(this, "SourceBucketForAzureBlob", {
      removalPolicy: RemovalPolicy.RETAIN,
      blockPublicAccess: BlockPublicAccess.BLOCK_ALL,
    });

    // Create a corresponding Azure Blob Storage account and a Blob Container
    const azurebBlobStorage = new AzureBlobStorage(
      this,
      "MyCustomAzureBlobStorage",
      azureSubscriptionIdParameter.stringValue,
      azureClientIdParameter.stringValue,
      azureTenantIdParameter.stringValue,
      azureClientSecretName
    );

    // Create a lambda function that will receive notifications from S3 bucket
    // and copy the new uploaded object to Azure Blob Storage
    const copyObjectToAzureLambda = new DockerImageFunction(
      this,
      "CopyObjectsToAzureLambda",
      {
        timeout: Duration.seconds(60),
        code: DockerImageCode.fromImageAsset("copy_s3_fn_code", {
          buildArgs: {
            "--platform": "linux/amd64"
          }
        }),
      },
    );

    // Add an IAM policy statement to allow the Lambda function to access the
    // S3 bucket
    sourceBucket.grantRead(copyObjectToAzureLambda);

    // Add an IAM policy statement to allow the Lambda function to get the contents
    // of an S3 object
    copyObjectToAzureLambda.addToRolePolicy(
      new PolicyStatement({
        effect: Effect.ALLOW,
        actions: ["s3:GetObject"],
        resources: [`arn:aws:s3:::${sourceBucket.bucketName}/*`],
      })
    );

    // Set up an S3 bucket notification to trigger the Lambda function
    // when an object is uploaded
    sourceBucket.addEventNotification(
      EventType.OBJECT_CREATED,
      new LambdaDestination(copyObjectToAzureLambda)
    );

    // Grant the Lambda function read access to existing SSM Parameters
    azureSubscriptionIdParameter.grantRead(copyObjectToAzureLambda);
    azureClientIdParameter.grantRead(copyObjectToAzureLambda);
    azureTenantIdParameter.grantRead(copyObjectToAzureLambda);

    // Put the Azure Blob Container Url into SSM Parameter Store
    this.createStringSSMParameter(
      "AzureBlobContainerUrl",
      "Azure blob container URL",
      "/s3toazurebackupservice/azureblobcontainerurl",
      azurebBlobStorage.blobContainerUrl,
      copyObjectToAzureLambda
    );      

    // Grant the Lambda function read access to the secret
    azureClientSecret.grantRead(copyObjectToAzureLambda);

    // Output S3 bucket arn
    new CfnOutput(this, "sourceBucketArn", {
      value: sourceBucket.bucketArn,
      exportName: "sourceBucketArn",
    });

    // Output the Blob Conatiner Url
    new CfnOutput(this, "azureBlobContainerUrl", {
      value: azurebBlobStorage.blobContainerUrl,
      exportName: "azureBlobContainerUrl",
    });
  }

}

The custom L3 construct can be used in larger IaC solutions by calling the class called S3ToAzureBackupService and providing the Azure credentials and client secret as properties to the constructor.

import * as cdk from "aws-cdk-lib";
import { Construct } from "constructs";
import { S3ToAzureBackupService } from "./s3-to-azure-backup-service";

export class MultiCloudBackupCdkStack extends cdk.Stack {
  constructor(scope: Construct, id: string, props?: cdk.StackProps) {
    super(scope, id, props);

    const s3ToAzureBackupService = new S3ToAzureBackupService(
      this,
      "MyMultiCloudBackupService",
      "/s3toazurebackupservice/azuresubscriptionid",
      "/s3toazurebackupservice/azureclientid",
      "/s3toazurebackupservice/azuretenantid",
      "s3toazurebackupservice/azureclientsecret"
    );
  }
}

Solution Diagram

Diagram 1: IaC Single Control Plane, demonstrates the concept of the Azure Blob Storage extension being imported from the AWS CloudFormation Registry into AWS CDK as an L1 CfnResource, wrapped into an L2 Construct and used in an L3 pattern alongside AWS resources to perform the specific task of backing up from and Amazon s3 Bucket into an Azure Blob Storage Container.

Multicloud IaC with CDK

Diagram 1: IaC Single Control Plan

The CDK application is then synthesized into one or more AWS CloudFormation Templates, which result in the CloudFormation service deploying AWS resource configurations to AWS and Azure resource configurations to Azure.

This solution demonstrates not only how to consolidate the management of secondary cloud resources into a unified infrastructure stack in AWS, but also the improved productivity by eliminating the complexity and cost of operating multiple deployment mechanisms into multiple public cloud environments.

The following video demonstrates an example in real-time of the end-state solution:

Next Steps

While this was just a straightforward example, with the same approach you can use your imagination to come up with even more and complex scenarios where AWS CDK can be used as a single pane of glass for IaC to manage multicloud and hybrid solutions.

To get started with the solution discussed in this post, this workshop will provide you with the instructions you need to understand the steps required to create the S3ToAzureBackupService.

Once you have learned how to create AWS CloudFormation extensions and develop them into AWS CDK Constructs, you will learn how, with just a few lines of code, you can develop reusable multicloud unified IaC solutions that deploy through a single AWS control plane.

Conclusion

By adopting AWS CloudFormation extensions and AWS CDK, deployed through a single AWS control plane, the cost and complexity of maintaining deployment pipelines across multiple cloud providers is reduced to a single holistic solution-focused pipeline. The techniques demonstrated in this post and the related workshop provide a capability to simplify the design of complex systems, improve the management of integration, and more closely align the IaC and deployment management practices with the design.

About the authors:

Aaron Sempf

Aaron Sempf is a Global Principal Partner Solutions Architect, in the Global Systems Integrators team. With over twenty years in software engineering and distributed system, he focuses on solving for large scale integration and event driven systems. When not working with AWS GSI partners, he can be found coding prototypes for autonomous robots, IoT devices, and distributed solutions.

 
Puneet Talwar

Puneet Talwar

Puneet Talwar is a Senior Solutions Architect at Amazon Web Services (AWS) on the Australian Public Sector team. With a background of over twenty years in software engineering, he particularly enjoys helping customers build modern, API Driven software architectures at scale. In his spare time, he can be found building prototypes for micro front ends and event driven architectures.

Reimagine Software Development With CodeWhisperer as Your AI Coding Companion

Post Syndicated from Danilo Poccia original https://aws.amazon.com/blogs/aws/reimagine-software-development-with-codewhisperer-as-your-ai-coding-companion/

In the few months since Amazon CodeWhisperer became generally available, many customers have used it to simplify and streamline the way they develop software. CodeWhisperer uses generative AI powered by a foundational model to understand the semantics and context of your code and provide relevant and useful suggestions. It can help build applications faster and more securely, and it can help at different levels, from small suggestions to writing full functions and unit tests that help decompose a complex problem into simpler tasks.

Imagine you want to improve your code test coverage or implement a fine-grained authorization model for your application. As you begin writing your code, CodeWhisperer is there, working alongside you. It understands your comments and existing code, providing real-time suggestions that can range from snippets to entire functions or classes. This immediate assistance adapts to your flow, reducing the need for context-switching to search for solutions or syntax tips. Using a code companion can enhance focus and productivity during the development process.

When you encounter an unfamiliar API, CodeWhisperer accelerates your work by offering relevant code suggestions. In addition, CodeWhisperer offers a comprehensive code scanning feature that can detect elusive vulnerabilities and provide suggestions to rectify them. This aligns with best practices such as those outlined by the Open Worldwide Application Security Project (OWASP). This makes coding not just more efficient, but also more secure and with an increased assurance in the quality of your work.

CodeWhisperer can also flag code suggestions that resemble open-source training data, and flag and remove problematic code that might be considered biased or unfair. It provides you with the associated open-source project’s repository URL and license, making it easier for you to review them and add attribution where necessary.

Here are a few examples of CodeWhisperer in action that span different areas of software development, from prototyping and onboarding to data analytics and permissions management.

CodeWhisperer Speeds Up Prototyping and Onboarding
One customer using CodeWhisperer in an interesting way is BUILDSTR, a consultancy that provides cloud engineering services focused on platform development and modernization. They use Node.js and Python in the backend and mainly React in the frontend.

I talked with Kyle Hines, co-founder of BUILDSTR, who said, “leveraging CodeWhisperer across different types of development projects for different customers, we’ve seen a huge impact in prototyping. For example, we are impressed by how quickly we are able to create templates for AWS Lambda functions interacting with other AWS services such as Amazon DynamoDB.” Kyle said their prototyping now takes 40% less time, and they noticed a reduction of more than 50% in the number of vulnerabilities present in customer environments.

Screenshot of a code editor using CodeWhisperer to generate the handler of an AWS Lambda function.

Kyle added, “Because hiring and developing new talent is a perpetual process for consultancies, we leveraged CodeWhisperer for onboarding new developers and it helps BUILDSTR Academy reduce the time and complexity for onboarding by more than 20%.”

CodeWhisperer for Exploratory Data Analysis
Wendy Wong is a business performance analyst building data pipelines at Service NSW and agile projects in AI. For her contributions to the community, she’s also an AWS Data Hero. She says Amazon CodeWhisperer has significantly accelerated her exploratory data analysis process, when she is analyzing a dataset to get a summary of its main characteristics using statistics and visualization tools.

She finds CodeWhisperer to be a swift, user-friendly, and dependable coding companion that accurately infers her intent with each line of code she crafts, and ultimately aids in the enhancement of her code quality through its best practice suggestions.

“Using CodeWhisperer, building code feels so much easier when I don’t have to remember every detail as it will accurately autocomplete my code and comments,” she shared. “Earlier, it would take me 15 minutes to set up data preparation pre-processing tasks, but now I’m ready to go in 5 minutes.”

Screenshot of exploratory data analysis using Amazon CodeWhisperer in a Jupyter notebook.

Wendy says she has gained efficiency by delegating these repetitive tasks to CodeWhisperer, and she wrote a series of articles to explain how to use it to simplify exploratory data analysis.

Another tool used to explore data sets is SQL. Wendy is looking into how CodeWhisperer can help data engineers who are not SQL experts. For instance, she noticed they can just ask to “write multiple joins” or “write a subquery” to quickly get the correct syntax to use.

Asking Amazon CodeWhisperer to generate SQL syntax and code.

CodeWhisperer Accelerates Testing and Other Daily Tasks
I had the opportunity to spend some time with software engineers in the AWS Developer Relations Platform team. That’s the team that, among other things, builds and operates the community.aws website.

Screenshot of the community.aws website, built and operated by the AWS Developer Relations Platform team with some help from Amazon CodeWhisperer.

Nikitha Tejpal’s work primarily revolves around TypeScript, and CodeWhisperer aids her coding process by offering effective autocomplete suggestions that come up as she types. She said she specifically likes the way CodeWhisperer helps with unit tests.

“I can now focus on writing the positive tests, and then use a comment to have CodeWhisperer suggest negative tests for the same code,” she says. “In this way, I can write unit tests in 40% less time.”

Her colleague, Carlos Aller Estévez, relies on CodeWhisperer’s autocomplete feature to provide him with suggestions for a line or two to supplement his existing code, which he accepts or ignores based on his own discretion. Other times, he proactively leverages the predictive abilities of CodeWhisperer to write code for him. “If I want explicitly to get CodeWhisperer to code for me, I write a method signature with a comment describing what I want, and I wait for the autocomplete,” he explained.

For instance, when Carlos’s objective was to check if a user had permissions on a given path or any of its parent paths, CodeWhisperer provided a neat solution for part of the problem based on Carlos’s method signature and comment. The generated code checks the parent directories of a given resource, then creates a list of all possible parent paths. Carlos then implemented a simple permission check over each path to complete the implementation.

“CodeWhisperer helps with algorithms and implementation details so that I have more time to think about the big picture, such as business requirements, and create better solutions,” he added.

Code generated by CodeWhisperer based on method signature and comment.

CodeWhisperer is a Multilingual Team Player
CodeWhisperer is polyglot, supporting code generation for 15 programming languages: Python, Java, JavaScript, TypeScript, C#, Go, Rust, PHP, Ruby, Kotlin, C, C++, Shell scripting, SQL, and Scala.

CodeWhisperer is also a team player. In addition to Visual Studio (VS) Code and the JetBrains family of IDEs (including IntelliJ, PyCharm, GoLand, CLion, PhpStorm, RubyMine, Rider, WebStorm, and DataGrip), CodeWhisperer is also available for JupyterLab, in AWS Cloud9, in the AWS Lambda console, and in Amazon SageMaker Studio.

At AWS, we are committed to helping our customers transform responsible AI from theory into practice by investing to build new services to meet the needs of our customers and make it easier for them to identify and mitigate bias, improve explainability, and help keep data private and secure.

You can use Amazon CodeWhisperer for free in the Individual Tier. See CodeWhisperer pricing for more information. To get started, follow these steps.

— Danilo

Running GitHub Actions in a private Subnet with AWS CodeBuild

Post Syndicated from original https://aws.amazon.com/blogs/devops/running-github-actions-in-a-private-subnet-with-aws-codebuild/

Last week the Developer Tools team announced that AWS CodeBuild now supports GitHub Actions. AWS CodeBuild is a fully managed continuous integration service that allows you to build and test code. CodeBuild builds are defined as a collection of build commands and related settings, in YAML format, called a BuildSpec. You can now define GitHub Actions steps directly in the BuildSpec and run them alongside CodeBuild commands. In this post, I will use the Liquibase GitHub Action to deploy changes to an Amazon Aurora database in a private subnet.

Background

The GitHub Marketplace includes a large catalog of actions developed by third-parties and the open-source community. At the time of writing, there are nearly 20,000 actions available in the marketplace. Using an action from the marketplace can save you time and effort that would be spent scripting the installation and configuration of various tools required in the build process.

While I love GitHub actions, I often what to run my build in AWS. For example, I might want to access a resource in a private VPC or simply reduce the latency between the build service and my resources. I could accomplish this by hosting a GitHub Action Runner on Amazon Elastic Compute Cloud (Amazon EC2). However, hosting a GitHub Action runner requires additional effort to configure and maintain the environment that hosts the runner.

AWS CodeBuild is a fully managed continuous integration service. CodeBuild does not require ongoing maintenance and it can access resources in a private subnet. You can now use GitHub Actions in AWS CodeBuild. This feature provides the simplified configuration and management of CodeBuild with the rich marketplace of GitHub Actions. In the following section, I will explain how to configure CodeBuild to run a GitHub Action.

Walkthrough

In this walkthrough, I will configure AWS CodeBuild to use the Liquibase GitHub Action to deploy changelogs to a PostgreSQL database hosted on Amazon Aurora in a private subnet. As shown in the following image, AWS CodeBuild will be configured to run in a private subnet along with my Aurora instance. First, CodeBuild will download the GitHub action using a NAT Gateway to access the internet. Second, CodeBuild will apply the changelog to the Aurora instance in the private subnet.

Architecture diagram showing CodeBuild and Aurora in a private subnet with internet access provided by a NAT gateway

I already have a GitHub repository with the Liquibase configuration properties and changelogs shown in the following image. Liquibase configuration is not the focus of this blog post, but you can read more in Getting Started with Liquibase. My source also includes the buildspec.yaml file which I will explain later in this post.

GitHub repository with Liquibase change set

To create my build project, I open CodeBuild in the AWS Console and select Create build project. Then I provide a name and optional description for the build. My project is named liquibase-blog-post.

If you are note already connected to GitHub, you can connect using a personal access token as shown in the following image.

GitHub configuration in CodeBuild showing the GitHub personal access token

Once I have successfully connected to GitHub, I can paste the URL to my repository as shown in the following image.

CodeBuild configuration showing the GitHub repository URL

I configure my build environment to use the standard build environment on Amazon Linux 2. GitHub actions are built using either JavaScript or a Docker container. If the action uses a Docker container, you must enable the Privileged flag. The Liquibase image is using a Docker container, therefore, I check the box to enabled privileged mode.

Environment configuration showing the standard image on Linux and the privileged flag enabled.

For the VPC configuration, I select the VPC and private subnet where my Aurora instance is hosted and then click Validate VPC Settings to ensure my configuration is correct.

VPC configuration with private subnet selected

My Buildspec file is included I the source. Therefore, I select Use a buildspec file and enter the path to the buildspec file in the repository.

Buildspec configuration with Use a build spec file selected

My buildspec.yaml file includes the following content. Notice that the pre_build phase incudes a series of commands. Commands have always been supported in CodeBuild and include a series of command line commands to run. In this case, I am simply logging a few environment variables for later debugging.

version: 0.2
phases:
  pre_build:
    commands:
      - echo $AWS_DEFAULT_REGION
      - echo $URL
  build: 
    steps:
      - uses: liquibase-github-actions/[email protected]
        with:
          changelogFile: changelog-root.xml
          url: ${{ env.URL }}
          username: postgres
          password: ${{ $env.PASSWORD }}
          headless: true

Also notice that the build phase incudes a series of steps. Steps are new, and are used to run GitHub Actions. Each build phase supports either a list of commands, or a list of steps, but not both. In this example, I am specifying the Liquibase Update Action (liquibase-github-actions/update) with a few configuration parameters. You can see a full list of parameters in the Liquibase Update Action repository on GitHub.

I want to call you attention to the environment variables used in my buildspec.yml. Note that I pass the URL and PASSWORD for my database as environment variables. This allows me easily change these values from one environment to another. I have configured these environment variables in the CodeBuild project definition as shown in the following image. The URL is configured as Plaintext and the PASSWORD is configured as Secrets Manager. Running the GitHub Action in CodeBuild has the added advantage that I easily access secrets stored in AWS Secrets Manager and configuration data stored in AWS Systems Manager Parameter Store.

Environment Variables used to configure the URL and PASSWORD.

It is also important to note that the syntax use to access environment variables in the buildspec.yaml is different when using a GitHub Action. GitHub Actions access environment variables using the environment context. Therefore, in the pre_build phase, I am using CodeBuild syntax, in the format $NAME. However, the in the build phase, I am using GitHub syntax, in the format ${{ env:NAME}}.

With the configuration complete, I select Create build project and then manually start a build to test the configuration. In the following example you can see the logs from the Liquibase update. Notice that two changesets have been successfully applied to the database.


####################################################
##   _     _             _ _                      ##
##  | |   (_)           (_) |                     ##
##  | |    _  __ _ _   _ _| |__   __ _ ___  ___   ##
##  | |   | |/ _` | | | | | '_ \ / _` / __|/ _ \  ##
##  | |___| | (_| | |_| | | |_) | (_| \__ \  __/  ##
##  \_____/_|\__, |\__,_|_|_.__/ \__,_|___/\___|  ##
##              | |                               ##
##              |_|                               ##
##                                                ##
##  Get documentation at docs.liquibase.com       ##
##  Get certified courses at learn.liquibase.com  ##
##  Free schema change activity reports at        ##
##      https://hub.liquibase.com                 ##
##                                                ##
####################################################
Starting Liquibase at 18:33:23 (version 4.21.1 #9070)
Liquibase Version: 4.21.1
Liquibase Open Source 4.21.1 by Liquibase
Running Changeset: changelogs/changelog-1.0.0.xml::1::BobR
Running Changeset: changelogs/changelog-1.0.1.xml::2::BobR
  
UPDATE SUMMARY
Run: 2
Previously run: 0
Filtered out: 0
-------------------------------
Total change sets: 2
  
Liquibase: Update has been successful.
Liquibase command 'update' was executed successfully.
  
Phase complete: BUILD State: SUCCEEDED
Phase context status code: Message:
Entering phase POST_BUILD

If I connect to the Aurora database and describe the tables you can see that Liquibase has created the actor table (as defined in the Liquibase Quick Start) along with the Liquibase audit tables databasechangelog and databasechangeloglock. Everything is working just as I expected, and I did not have to install and configure Liquibase!


mydatabase=> \dt
List of relations
Schema  |         Name          | Type  |  Owner
--------+-----------------------+-------+----------
public  | actor                 | table | postgres
public  | databasechangelog     | table | postgres
public  | databasechangeloglock | table | postgres
(3 rows)

In this example, I showed you how to update an Aurora database in a private subnet using a the Liquibase GitHub Action running in CodeBuild. GitHub Actions provide a rich catalog of preconfigured actions simplifying the configuration. CodeBuild provides a managed service that simplifies the configuration and maintenance of my build environment. Used together I can get the best features of both CodeBuild and GitHub Actions.

Cleanup

In this walkthrough I showed you how to create a CodeBuild project. If you no longer need the project, you can simply delete it in the console. If you created other resources, for example an Aurora database, that were not explained in this post, you should delete those as well.

Conclusion

The GitHub Marketplace includes a catalog of nearly 20,000 actions developed by third-parties and the open-source community. AWS CodeBuild is a fully managed continuous integration service that integrates tightly with other AWS services. In this post I used the GitHub Action for Liquibase to deploy an update to a database in a private subnet. I am excited to see what you will do with support for GitHub Actions in CodeBuild. You can read more about this exciting new feature in GitHub Action runner in AWS CodeBuild.

Automated Code Review on Pull Requests using AWS CodeCommit and AWS CodeBuild

Post Syndicated from Verinder Singh original https://aws.amazon.com/blogs/devops/automated-code-review-on-pull-requests-using-aws-codecommit-and-aws-codebuild/

Pull Requests play a critical part in the software development process. They ensure that a developer’s proposed code changes are reviewed by relevant parties before code is merged into the main codebase. This is a standard procedure that is followed across the globe in different organisations today. However, pull requests often require code reviewers to read through a great deal of code and manually check it against quality and security standards. These manual reviews can lead to problematic code being merged into the main codebase if the reviewer overlooks any problems.

To help solve this problem, we recommend using Amazon CodeGuru Reviewer to assist in the review process. CodeGuru Reviewer identifies critical defects and deviation from best practices in your code. It provides recommendations to remediate its findings as comments in your pull requests, helping reviewers miss fewer problems that may have otherwise made into production. You can easily integrate your repositories in AWS CodeCommit with Amazon CodeGuru Reviewer following these steps.

The purpose of this post isn’t, however, to show you CodeGuru Reviewer. Instead, our aim is to help you achieve automated code reviews with your pull requests if you already have a code scanning tool and need to continue using it. In this post, we will show you step-by-step how to add automation to the pull request review process using your code scanning tool with AWS CodeCommit (as source code repository) and AWS CodeBuild (to automatically review code using your code reviewer). After following this guide, you should be able to give developers automatic feedback on their code changes and augment manual code reviews so fewer problems make it into your main codebase.

Solution Overview

The solution comprises of the following components:

  1. AWS CodeCommit: AWS service to host private Git repositories.
  2. Amazon EventBridge: AWS service to receive pullRequestCreated and pullRequestSourceBranchUpdated events and trigger Amazon EventBridge rule.
  3. AWS CodeBuild: AWS service to perform code review and send the result to AWS CodeCommit repository as pull request comment.

The following diagram illustrates the architecture:

Figure 1: This architecture diagram illustrates the workflow where developer raises a Pull Request and receives automated feedback on the code changes using AWS CodeCommit, AWS CodeBuild and Amazon EventBridge rule

Figure 1. Architecture Diagram of the proposed solution in the blog

  1. Developer raises a pull request against the main branch of the source code repository in AWS CodeCommit.
  2. The pullRequestCreated event is received by the default event bus.
  3. The default event bus triggers the Amazon EventBridge rule which is configured to be triggered on pullRequestCreated and pullRequestSourceBranchUpdated events.
  4. The EventBridge rule triggers AWS CodeBuild project.
  5. The AWS CodeBuild project runs the code quality check using customer’s choice of tool and sends the results back to the pull request as comments. Based on the result, the AWS CodeBuild project approves or rejects the pull request automatically.

Walkthrough

The following steps provide a high-level overview of the walkthrough:

  1. Create a source code repository in AWS CodeCommit.
  2. Create and associate an approval rule template.
  3. Create AWS CodeBuild project to run the code quality check and post the result as pull request comment.
  4. Create an Amazon EventBridge rule that reacts to AWS CodeCommit pullRequestCreated and pullRequestSourceBranchUpdated events for the repository created in step 1 and set its target to AWS CodeBuild project created in step 3.
  5. Create a feature branch, add a new file and raise a pull request.
  6. Verify the pull request with the code review feedback in comment section.

1. Create a source code repository in AWS CodeCommit

Create an empty test repository in AWS CodeCommit by following these steps. Once the repository is created you can add files to your repository following these steps. If you create or upload the first file for your repository in the console, a branch is created for you named main. This branch is the default branch for your repository. If you are using a Git client instead, consider configuring your Git client to use main as the name for the initial branch. This blog post assumes the default branch is named as main.

2. Create and associate an approval rule template

Create an AWS CodeCommit approval rule template and associate it with the code repository created in step 1 following these steps.

3. Create AWS CodeBuild project to run the code quality check and post the result as pull request comment

This blog post is based on the assumption that the source code repository has JavaScript code in it, so it uses jshint as a code analysis tool to review the code quality of those files. However, users can choose a different tool as per their use case and choice of programming language.

Create an AWS CodeBuild project from AWS Management Console following these steps and using below configuration:

  • Source: Choose the AWS CodeCommit repository created in step 1 as the source provider.
  • Environment: Select the latest version of AWS managed image with operating system of your choice. Choose New service role option to create the service IAM role with default permissions.
  • Buildspec: Use below build specification. Replace <NODEJS_VERSION> with the latest supported nodejs runtime version for the image selected in previous step. Replace <REPOSITORY_NAME> with the repository name created in step 1. The below spec installs the jshint package, creates a jshint config file with a few sample rules, runs it against the source code in the pull request commit, posts the result as comment to the pull request page and based on the results, approves or rejects the pull request automatically.
version: 0.2
phases:
  install:
    runtime-versions:
      nodejs: <NODEJS_VERSION>
    commands:
      - npm install jshint --global
  build:
    commands:
      - echo \{\"esversion\":6,\"eqeqeq\":true,\"quotmark\":\"single\"\} > .jshintrc
      - CODE_QUALITY_RESULT="$(echo \`\`\`) $(jshint .)"; EXITCODE=$?
      - aws codecommit post-comment-for-pull-request --pull-request-id $PULL_REQUEST_ID --repository-name <REPOSITORY_NAME> --content "$CODE_QUALITY_RESULT" --before-commit-id $DESTINATION_COMMIT_ID --after-commit-id $SOURCE_COMMIT_ID --region $AWS_REGION	
      - |
        if [ $EXITCODE -ne 0 ]
        then
          PR_STATUS='REVOKE'
        else
          PR_STATUS='APPROVE'
        fi
      - REVISION_ID=$(aws codecommit get-pull-request --pull-request-id $PULL_REQUEST_ID | jq -r '.pullRequest.revisionId')
      - aws codecommit update-pull-request-approval-state --pull-request-id $PULL_REQUEST_ID --revision-id $REVISION_ID --approval-state $PR_STATUS --region $AWS_REGION

Once the AWS CodeBuild project has been created successfully, modify its IAM service role by following the below steps:

  • Choose the CodeBuild project’s Build details tab.
  • Choose the Service role link under the Environment section which should navigate you to the CodeBuild’s IAM service role in IAM console.
  • Expand the default customer managed policy and choose Edit.
  • Add the following actions to the existing codecommit actions:
"codecommit:CreatePullRequestApprovalRule",
"codecommit:GetPullRequest",
"codecommit:PostCommentForPullRequest",
"codecommit:UpdatePullRequestApprovalState"

  • Choose Next.
  • On the Review screen, choose Save changes.

4. Create an Amazon EventBridge rule that reacts to AWS CodeCommit pullRequestCreated and pullRequestSourceBranchUpdated events for the repository created in step 1 and set its target to AWS CodeBuild project created in step 3

Follow these steps to create an Amazon EventBridge rule that gets triggered whenever a pull request is created or updated using the following event pattern. Replace the <REGION>, <ACCOUNT_ID> and <REPOSITORY_NAME> placeholders with the actual values. Select target of the event rule as AWS CodeBuild project created in step 3.

Event Pattern

{
    "detail-type": ["CodeCommit Pull Request State Change"],
    "resources": ["arn:aws:codecommit:<REGION>:<ACCOUNT_ID>:<REPOSITORY_NAME>"],
    "source": ["aws.codecommit"],
    "detail": {
      "isMerged": ["False"],
      "pullRequestStatus": ["Open"],
      "repositoryNames": ["<REPOSITORY_NAME>"],
      "destinationReference": ["refs/heads/main"],
      "event": ["pullRequestCreated", "pullRequestSourceBranchUpdated"]
    },
    "account": ["<ACCOUNT_ID>"]
  }

Follow these steps to configure the target input using the below input path and input template.

Input transformer – Input path

{
    "detail-destinationCommit": "$.detail.destinationCommit",
    "detail-pullRequestId": "$.detail.pullRequestId",
    "detail-sourceCommit": "$.detail.sourceCommit"
}

Input transformer – Input template

{
    "sourceVersion": <detail-sourceCommit>,
    "environmentVariablesOverride": [
        {
            "name": "DESTINATION_COMMIT_ID",
            "type": "PLAINTEXT",
            "value": <detail-destinationCommit>
        },
        {
            "name": "SOURCE_COMMIT_ID",
            "type": "PLAINTEXT",
            "value": <detail-sourceCommit>
        },
        {
            "name": "PULL_REQUEST_ID",
            "type": "PLAINTEXT",
            "value": <detail-pullRequestId>
        }
    ]
}

5. Create a feature branch, add a new file and raise a pull request

Create a feature branch following these steps. Push a new file called “index.js” to the root of the repository with the below content.

function greet(dayofweek) {
  if (dayofweek == "Saturday" || dayofweek == "Sunday") {
    console.log("Have a great weekend");
  } else {
    console.log("Have a great day at work");
  }
}

Now raise a pull request using the feature branch as source and main branch as destination following these steps.

6. Verify the pull request with the code review feedback in comment section

As soon as the pull request is created, the AWS CodeBuild project created in step 3 above will be triggered which will run the code quality check and post the results as a pull request comment. Navigate to the AWS CodeCommit repository pull request page in AWS Management Console and check under the Activity tab to confirm the automated code review result being displayed as the latest comment.

The pull request comment submitted by AWS CodeBuild highlights 6 errors in the JavaScript code. The errors on lines first and third are based on the jshint rule “eqeqeq”. It recommends to use strict equality operator (“===”) instead of the loose equality operator (“==”) to avoid type coercion. The errors on lines second, fourth and fifth are based on jshint rule “quotmark” which recommends to use single quotes with strings instead of double quotes for better readability. These jshint rules are defined in AWS CodeBuild project’s buildspec in step 3 above.

Figure 2: The image shows the AWS CodeCommit pull request's Activity tab with code review results automatically posted by the automated code reviewer

Figure 2. Pull Request comments updated with automated code review results.

Conclusion

In this blog post we’ve shown how using AWS CodeCommit and AWS CodeBuild services customers can automate their pull request review process by utilising Amazon EventBridge events and using their own choice of code quality tool. This simple solution also makes it easier for the human reviewers by providing them with automated code quality results as input and enabling them to focus their code review more on business logic code changes rather than static code quality issues.

About the authors

Blog post's primary author's image

Verinder Singh

Verinder Singh is an experienced Solution’s Architect based out of Sydney, Australia with 16+ years of experience in software development and architecture. He works primarily on building large scale open-source AWS solutions for common customer use cases and business problems. In his spare time, he enjoys vacationing and watching movies with his family.

Blog post's secondary author's image

Deenadayaalan Thirugnanasambandam

Deenadayaalan Thirugnanasambandam is a Principal Cloud Architect at AWS. He provides prescriptive architectural guidance and consulting that enable and accelerate customers’ adoption of AWS.

A New Set of APIs for Amazon SQS Dead-Letter Queue Redrive

Post Syndicated from Sébastien Stormacq original https://aws.amazon.com/blogs/aws/a-new-set-of-apis-for-amazon-sqs-dead-letter-queue-redrive/

Today, we launch a new set of APIs for Amazon Simple Queue Service (Amazon SQS). These new APIs allow you to manage dead-letter queue (DLQ) redrive programmatically. You can now use the AWS SDKs or the AWS Command Line Interface (AWS CLI) to programmatically move messages from the DLQ to their original queue, or to a custom queue destination, to attempt to process them again. A DLQ is a queue where Amazon SQS automatically moves messages that are not correctly processed by your consumer application.

To fully appreciate how this new API might help you, let’s have a quick look back at history.

Message queues are an integral part of modern application architectures. They allow developers to decouple services by allowing asynchronous and message-based communications between message producers and consumers. In most systems, messages are persisted in shared storage (the queue) until the consumer processes them. Message queues allow developers to build applications that are resilient to temporary service failure. They help prioritize message processing and scale their fleet of worker nodes that process the messages. Message queues are also popular in event-driven architectures.

Asynchronous message exchange is not new in application architectures. The concept of exchanging messages asynchronously between applications appeared in the 1960s and was first made popular when IBM launched TCAM for OS/360 in 1972. The general adoption came 20 years later with IBM MQ Series in 1993 (now IBM MQ) and when Sun Microsystems released Java Messaging Service (JMS) in 1998, a standard API for Java applications to interact with message queues.

AWS launched Amazon SQS on July 12, 2006. Amazon SQS is a highly scalable, reliable, and elastic queuing service that “just works.” As Werner wrote at the time: “We have chosen a concurrency model where the process working on a message automatically acquires a leased lock on that message; if the message is not deleted before the lease expires, it becomes available for processing again. Makes failure handling very simple.”

On January 29, 2014, we introduced dead-letter queues (DLQ). DLQs help you avoid a message that failed to be processed from staying forever on top of the queue, possibly preventing other messages in the queue from processing. With DLQs, each queue has an associated property telling Amazon SQS how many times a message may be presented for processing (maxReceiveCount). Each message also has an associated receive counter (ReceiveCount). Each time a consumer application picks up a message for processing, the message receive count is incremented by 1. When ReceiveCount > maxReceiveCount, Amazon SQS moves the message to your designated DLQ for human analysis and debugging. You generally associate alarms with the DLQ to send notifications when such events happen. Typical reasons to move a message to the DLQ are because they are incorrectly formatted, there are bugs in the consumer application, or it takes too long to process the message.

At AWS re:Invent 2021, AWS announced dead-letter queue redrive on the Amazon SQS console. The redrive addresses the second part of the failed message lifecycle. It allows you to reinject the message in its original queue to attempt processing it again. After the consumer application is fixed and ready to consume the failed messages, you can redrive the messages from the DLQ back in the source queue or a customized queue destination. It just requires a couple of clicks on the console.

Today, we are adding APIs allowing you to write applications and scripts that handle the redrive programmatically. There is no longer a need to have a human clicking on the console. Using the API increases the scalability of your processes and reduces the risk of human error.

Let’s See It in Action
To try out this new API, I open a terminal for a command-line only demo. Before I get started, I make sure I have the latest version of the AWS CLI. On macOS I enter brew upgrade awscli.

I first create two queues. One is the dead-letter queue, and the other is my application queue:

# First, I create the dead-letter queue (notice the -dlq I choose to add at the end of the queue name)
➜ ~ aws sqs create-queue \
            --queue-name awsnewsblog-dlq                                            
{
    "QueueUrl": "https://sqs.us-east-2.amazonaws.com/012345678900/awsnewsblog-dlq"
}

# second, I retrieve the Arn of the queue I just created
➜  ~ aws sqs get-queue-attributes \
             --queue-url https://sqs.us-east-2.amazonaws.com/012345678900/awsnewsblog-dlq \
             --attribute-names QueueArn
{
    "Attributes": {
        "QueueArn": "arn:aws:sqs:us-east-2:012345678900:awsnewsblog-dlq"
    }
}

# Third, I create the application queue. I enter a redrive policy: post messages in the DLQ after three delivery attempts
➜  ~ aws sqs create-queue \
             --queue-name awsnewsblog \
             --attributes '{"RedrivePolicy": "{\"deadLetterTargetArn\":\"arn:aws:sqs:us-east-2:012345678900:awsnewsblog-dlq\",\"maxReceiveCount\":\"3\"}"}' 
{
    "QueueUrl": "https://sqs.us-east-2.amazonaws.com/012345678900/awsnewsblog"
}

Now that the two queues are ready, I post a message to the application queue:

➜ ~ aws sqs send-message \
            --queue-url https://sqs.us-east-2.amazonaws.com/012345678900/awsnewsblog \
            --message-body "Hello World"
{
"MD5OfMessageBody": "b10a8db164e0754105b7a99be72e3fe5",
"MessageId": "fdc26778-ce9a-4782-9e33-ae73877cfcb2"
}

Next, I consume the message, but I don’t delete it from the queue. This simulates a crash in the message consumer application. Message consumers are supposed to delete the message after successful processing. I set the maxReceivedCount property to 3 when I entered the redrivePolicy. I therefore repeat this operation three times to force Amazon SQS to move the message to the dead-letter queue after three delivery attempts. The default visibility timeout is 30 seconds, so I have to wait 30 seconds or more between the retries.

➜ ~ aws sqs receive-message \
            --queue-url https://sqs.us-east-2.amazonaws.com/012345678900/awsnewsblog
{
"Messages": [
{
"MessageId": "fdc26778-ce9a-4782-9e33-ae73877cfcb2",
"ReceiptHandle": "AQEBP8yOfgBlnjlkGXjyeLROiY7xg7cZ6Znq8Aoa0d3Ar4uvTLPrHZptNotNfKRK25xm+IU8ebD3kDwZ9lja6JYs/t1kBlwiNO6TBACN5srAb/WggQiAAkYl045Tx3CvsOypbJA3y8U+MyEOQRwIz6G85i7MnR8RgKTlhOzOZOVACXC4W8J9GADaQquFaS1wVeM9VDsOxds1hDZLL0j33PIAkIrG016LOQ4sAntH0DOlEKIWZjvZIQGdlRJS65PJu+I/Ka1UPHGiFt9f8m3SR+Y34/ttRWpQANlXQi5ByA47N8UfcpFXXB5L30cUmoDtKucPewsJNG2zRCteR0bQczMMAmOPujsKq70UGOT8X2gEv2LfhlY7+5n8z3yew8sdBjWhVSegrgj6Yzwoc4kXiMddMg==",
"MD5OfBody": "b10a8db164e0754105b7a99be72e3fe5",
"Body": "Hello World"
}
]
}

# wait 30 seconds,
# then repeat two times (for a total of three receive-message API calls)

After three processing attempts, the message is not in the queue anymore:

➜  ~ aws sqs receive-message \
             --queue-url  https://sqs.us-east-2.amazonaws.com/012345678900/awsnewsblog
{
    "Messages": []
}

The message has been moved to the dead-letter queue. I check the DLQ to confirm (notice the queue URL ending with -dlq):

➜  ~ aws sqs receive-message \
             --queue-url  https://sqs.us-east-2.amazonaws.com/012345678900/awsnewsblog-dlq
{
    "Messages": [
        {
            "MessageId": "fdc26778-ce9a-4782-9e33-ae73877cfcb2",
            "ReceiptHandle": "AQEBCLtBMoZYVMMq7fUGNHeCliqE3mFXnkuJ+nOXLK1++uoXWBG31nDejCpxElmiBZWfbcfGJrEdKj4P9HJdrQMYDbeSqB+u1ZlB7CYzQBiQps4SEG0biEoubwqjQbmDZlPrmkFsnYgLD98D1XYWk/Ik6Z2n/wxDo9ko9rbZ15izK5RFnbwveNy8dfc6ireqVB1EGbeGkHcweHGuoeKWXEab1ynZWhNqZsQgCR6pWRkgtn59lJcLv4cJ4UMewNzvt7tMHH69GvVjXdYDYvJJI2vj+6RHvcvSHWWhTNT+CuPEXguVNuNrSya8gho1fCnKpVwQre6HhMlLPjY4wvn/tXY7+5rmte9eXagCqLQXaENB2R7qWNVPiWRIJy8/cTf37NLYVzBom030DNJlH9EeceRhCQ==",
            "MD5OfBody": "b10a8db164e0754105b7a99be72e3fe5",
            "Body": "Hello World"
        }
    ]
}

Now that the setup is ready, let’s programmatically redrive the message to its original queue. Let’s assume I understand why the consumer didn’t correctly process the message and that I fixed the consumer application code. I use start-message-move-task on the DLQ to start the asynchronous redrive. There is an optional attribute (MaxNumberOfMessagesPerSecond) to control the velocity of the redrive:

➜ ~ aws sqs start-message-move-task \
            --source-arn arn:aws:sqs:us-east-2:012345678900:awsnewsblog-dlq
{
    "TaskHandle": "eyJ0YXNrSWQiOiI4ZGJmNjBiMy00MmUwLTQzYTYtYjg4Zi1iMTZjYWRjY2FkNmEiLCJzb3VyY2VBcm4iOiJhcm46YXdzOnNxczp1cy1lYXN0LTI6NDg2NjUyMDY2NjkzOmF3c25ld3NibG9nLWRscSJ9"
}

I can list and check status the of the move tasks I initiated with list-message-move-tasks or cancel a running task by calling the cancel-message-move-task API:

➜ ~ aws sqs list-message-move-tasks \
            --source-arn arn:aws:sqs:us-east-2:012345678900:awsnewsblog-dlq
{
    "Results": [
        {
            "Status": "COMPLETED",
            "SourceArn": "arn:aws:sqs:us-east-2:012345678900:awsnewsblog-dlq",
            "ApproximateNumberOfMessagesMoved": 1,
            "ApproximateNumberOfMessagesToMove": 1,
            "StartedTimestamp": 1684135792239
        }
    ]
}

Now my application can consume the message again from the application queue:

➜  ~ aws sqs receive-message \
             --queue-url  https://sqs.us-east-2.amazonaws.com/012345678900/awsnewsblog                                   
{
    "Messages": [
        {
            "MessageId": "a7ae83ca-cde4-48bf-b822-3d4bc1f4dcae",
            "ReceiptHandle": "AQEB9a+Dm2nvb3VUn9+46j9UsDidU/W6qFwJtXtNWTyfoSDOKT7h73e6ctT9RVZysEw3qqzJOx1cxblTTOSrYwwwoBA2qoJMGsqsrsRGGYojBvf9X8hqi8B8MHn9rTm8diJ2wT2b7WC+TDrx3zIvUeiSEkP+EhqyYOvOs7Q9aETR+Uz02kQxZ/cUJWsN4MMSXBejwW+c5ivv5uQtpfUrfZuCWa9B9O67Kj/q52clriPHpcqCCfJwFBSZkGTXYwTpnjxD4QM7DPS+xVeVfTyM7DsKCAOtpvFBmX5m4UNKT6TROgCnGxTRglUSMWQp8ufVxXiaUyM1dwqxYekM9uX/RCb01gEyCZHas4jeNRV5nUJlhBkkqPlw3i6w9Uuc2y9nH0Df8nH3g7KTXo4lv5Bl3ayh9w==",
            "MD5OfBody": "b10a8db164e0754105b7a99be72e3fe5",
            "Body": "Hello World"
        }
    ]
}

Availability
DLQ redrive APIs are available today in all commercial Regions where Amazon SQS is available.

Redriving the messages from the dead-letter queue to the source queue or a custom destination queue generates additional API calls billed based on existing pricing (starting at $0.40 per million API calls, after the first million, which is free every month). Amazon SQS batches the messages while redriving them from one queue to another. This makes moving messages from one queue to another a simple and low-cost option.

To learn more about DLQ and DLQ redrive, check our documentation.

Remember that we live in an asynchronous world—so should your applications. Get started today and write your first redrive application.

— seb

Optimize software development with Amazon CodeWhisperer

Post Syndicated from Dhaval Shah original https://aws.amazon.com/blogs/devops/optimize-software-development-with-amazon-codewhisperer/

Businesses differentiate themselves by delivering new capabilities to their customers faster. They must leverage automation to accelerate their software development by optimizing code quality, improving performance, and ensuring their software meets security/compliance requirements. Trained on billions of lines of Amazon and open-source code, Amazon CodeWhisperer is an AI coding companion that helps developers write code by generating real-time whole-line and full-function code suggestions in their IDEs. Amazon CodeWhisperer has two tiers: the individual tier is free for individual use, and the professional tier provides administrative capabilities for organizations seeking to grant their developers access to CW. This blog provides a high-level overview of how developers can use CodeWhisperer.

Getting Started

Getting started with CodeWhisperer is straightforward and documented here. After setup, CodeWhisperer integrates with the IDE and provides code suggestions based on comments written in the IDE. Use TAB to accept a suggestion, ESC to reject the suggestion ALT+C (Windows)/Option + C(MAC) to force a suggestion, and left and right arrow keys to switch between suggestions.

CodeWhisperer supports code generation for 15 programming languages. CodeWhisperer can be used in various IDEs like Amazon Sagemaker Studio, Visual Studio Code, AWS Cloud9, AWS Lambda and many JetBrains IDEs. Refer to the Amazon CodeWhisperer documentation for the latest updates on supported languages and IDEs.

Contextual Code Suggestions

CodeWhisperer continuously examines code and comments for contextual code suggestions. It will generate code snippets using this contextual information and the location of your cursor. Illustrated below is an example of a code suggestion from inline comments in Visual Studio Code that demonstrates how CodeWhisperer can provide context-specific code suggestions without requiring the user to manually replace variables or parameters. In the comment, the file and Amazon Simple Storage Service (Amazon S3) bucket are specified, and CodeWhisperer uses this context to suggest relevant code.

Image depicts a person typing on a computer keyboard, with a code editor window on the screen. The code shows a function for uploading a file from a local directory to an Amazon S3 bucket

CodeWhisperer also supports and recommends writing declarative code and procedural code, such as shell scripting and query languages. The following example shows how CodeWhisperer recommend the blocks of code in a shell script to loop through servers to execute the hostname command and save their response to an output file.

Image is a gif of a person typing on a computer keyboard, with a terminal window on the screen displaying a shell script named 'shell_script.sh.' The code defines a list of servers and outputs the file path. As the person types, the code updates with the output path displayed below.

In the following example, based on the comment, CodeWhisperer suggests Structured Query Language (SQL) code for using common table expression.

"Image is a gif of a person typing on a computer keyboard, with a code editor window on the screen displaying a SQL query. The query uses common table expressions to find the age of a product from an inventory table. As the person types, the query updates with the output displayed below in the form of SQL code. The background is a blurred office environment

CodeWhisperer works with popular Integrated Development Environments (IDEs), for more information on IDE’s supported please refer to CodeWhisperer’s documentation. Illustrated below is CodeWhisperer integrated with AWS Lambda console.

"Image is a gif of a person typing on a computer keyboard, with an AWS Lambda console on the screen. The person is entering a prompt to list all the Amazon S3 buckets. As the person types, the console updates with the output code displayed below, which can be executed to show all the S3 buckets."

Amazon CodeWhisperer is a versatile AI coding assistant that can aid in a variety of tasks, including AWS-related tasks and API integrations, as well as external (non AWS) API integrations. For example, illustrated below is CodeWhisperer suggesting code for Twilio’s APIs.

"Image is a gif of a person typing on a computer keyboard, with an integrated development environment (IDE) on the screen. The person is entering a prompt to write a code that uses the Twilio API to make a voice call. As the person types, the IDE updates with the output function displayed below, which can be executed to make the voice call."

Now that we have seen how CodeWhisperer can help with writing code faster, the next section explores how to use AI responsibly.

Use AI responsibly

Developers often leverage open-source code, however run into challenges of license attribution such as attributing the original authors or maintaining the license text. The challenge lies in properly identifying and attributing the relevant open-source components used within a project. With the abundance of open-source libraries and frameworks available, it can be time-consuming and complex to track and attribute each piece of code accurately. Failure to meet the license attribution requirements can result in legal issues, violation of intellectual property rights, and damage to a developer’s reputation. Code Whisperer’s reference tracking continuously monitors suggested code for similarities with known open-source code, allowing developers to make informed decisions about incorporating it into their project and ensuring proper attribution.

"Image is a gif of a code editor window displaying a counting sort function, with a section of the code highlighted. The highlighted section is the implementation of counting sort by digit, suggested by CodeWhisperer. The gif includes a caption mentioning that the implementation is being referenced from MIT. This showcases the capability of CodeWhisperer's reference tracking."

Shift left application security

CodeWhisperer can scan code for hard-to-find vulnerabilities such as those in the top ten Open Web Application Security Project (OWASP), or those that don’t meet crypto library best practices, AWS internal security best practices, and others. As of this writing, CodeWhisperer supports security scanning in Python, Java, and JavaScript languages. Below is an illustration of identifying the most known CWEs (Common Weakness Enumeration) along with the ability to dive deep into the problematic line of code with a click of a button.

"Image is a gif of a code editor window displaying a code to download a file, with a section of the code highlighted. Below the code, there is an illustration of the identification of the most common Common Weakness Enumerations (CWEs) found in the code. However, it is mentioned that not all CWEs have been identified. Additionally, the illustration showcases the feature of being able to dive deep into the problematic line of code by clicking a button."

In the following example, CodeWhisperer provides file-by-file analysis of CWE’s and highlights the top 10 OWASP CWEs such as Unsensitized input is run as code, Cross-site scripting, Resource leak, Hardcoded credentials, SQL injection, OS command injection and Insecure hashing.

Image displays a screen with a proceeding from CodeWhisperer. The text highlights the file-by-file analysis of Common Weakness Enumerations (CWEs) and emphasizes the top 10 OWASP CWEs. These include CWE-94, CWE-95, and CWE-96, which pertain to the unsanitized input being executed as code. Additionally, CWE-20, CWE-79, and CWE-80 are related to cross-site scripting. Furthermore, CWE-400 and CWE-664 are associated with resource leaks, while CWE-798 relates to hardcoded credentials. CWE-89 refers to SQL injection, and CWE-77, CWE-78, and CWE-88 are connected to OS command injection. Lastly, CWE-327 and CWE-328 relate to insecure hashing.

Generating Test Cases

A good developer always writes tests. CodeWhisperer can help suggest test cases and verify the code’s functionality. CodeWhisperer considers boundary values, edge cases, and other potential issues that may need to be tested. In the example below, a comment referring to using fact_demo() function leads CodeWhisperer to suggest a unit test for fact_demo() while leveraging contextual details.

"Image is a gif displaying a code editor window, with a section of code highlighted. A comment within the code refers to the use of the fact_demo() function. CodeWhisperer is seen suggesting code for unit testing, leveraging contextual details related to the fact_demo() function. The background is a blurred office environment."

Also, CodeWhisperer can simplify creating repetitive code for unit testing. For example, if you need to create sample data using INSERT statements, CodeWhisperer can generate the necessary inserts based on a pattern.

"Image is a gif of a person typing on a computer keyboard, with an integrated development environment (IDE) on the screen. The person is entering a prompt to insert sample users into a table, with details such as username, password, and status. As the person types, CodeWhisperer builds out the insert query for the user. The IDE updates with the output query displayed below, which can be executed to insert the sample users into the table."

CodeWhisperer with Amazon SageMaker Studio and Jupyter Lab

CodeWhisperer works with SageMaker Studio and Jupyter Lab, providing code completion support for Python in code cells. To utilize CodeWhisperer, follow the setup instructions to activate it in Amazon SageMaker Studio and Jupyter Lab. To begin coding, see User actions.
The following illustration showcases CodeWhisperer’s code recommendations in SageMaker Studio. It demonstrates the suggested code based on comments for loading and analyzing a dataset.

"Image is a gif of an illustration showcasing CodeWhisperer's code recommendations in SageMaker Studio. The illustration shows a code editor window with a section of code highlighted. The code pertains to loading and analyzing a dataset. CodeWhisperer is seen providing code recommendations based on comments within the code. The recommendations appear in the form of a pop-up, with suggested changes displayed."

Conclusion

In conclusion, this blog has highlighted the numerous ways in which developers can leverage CodeWhisperer to increase productivity, streamline workflows, and ensure the development of secure code. By adopting Code Whisperer’s AI-powered features, developers can experience enhanced productivity, accelerated learning, and significant time savings.

To take advantage of CodeWhisperer and optimize your coding process, here are the next steps:

1. Visit feature page to learn more about the benefits of CodeWhisperer.

2. Sign up and start using CodeWhisperer.

3. Read about CodeWhisperer success stories

About the Authors

Headshot of a person in a black background with natural experssion

Vamsi Cherukuri

Vamsi Cherukuri is a Senior Technical Account Manager at Amazon Web Services (AWS), leveraging over 15 years of developer experience in Analytics, application modernization, and data platforms. With a passion for technology, Vamsi takes joy in helping customers achieve accelerated business outcomes through their cloud transformation journey. In his free time, he finds peace in the pursuits of running and biking, frequently immersing himself in the thrilling realm of marathons.

Headshot of a person in a black background with a smile wearing a navy blue tshirt with stripes

Dhaval Shah

Dhaval Shah is a Senior Solutions Architect at AWS, specializing in Machine Learning. With a strong focus on digital native businesses, he empowers customers to leverage AWS and drive their business growth. As an ML enthusiast, Dhaval is driven by his passion for creating impactful solutions that bring positive change. In his leisure time, he indulges in his love for travel and cherishes quality moments with his family.

Headshot of a person in a black background with a grey shirt and spectables with natural experssion

Nikhil Sharma

Nikhil Sharma is a Solutions Architecture Leader at Amazon Web Services (AWS) where he and his team of Solutions Architects help AWS customers solve critical business challenges using AWS cloud technologies and services.

DevSecOps with Amazon CodeGuru Reviewer CLI and Bitbucket Pipelines

Post Syndicated from Bineesh Ravindran original https://aws.amazon.com/blogs/devops/devsecops-with-amazon-codeguru-reviewer-cli-and-bitbucket-pipelines/

DevSecOps refers to a set of best practices that integrate security controls into the continuous integration and delivery (CI/CD) workflow. One of the first controls is Static Application Security Testing (SAST). SAST tools run on every code change and search for potential security vulnerabilities before the code is executed for the first time. Catching security issues early in the development process significantly reduces the cost of fixing them and the risk of exposure.

This blog post, shows how we can set up a CI/CD using Bitbucket Pipelines and Amazon CodeGuru Reviewer . Bitbucket Pipelines is a cloud-based continuous delivery system that allows developers to automate builds, tests, and security checks with just a few lines of code. CodeGuru Reviewer is a cloud-based static analysis tool that uses machine learning and automated reasoning to generate code quality and security recommendations for Java and Python code.

We demonstrate step-by-step how to set up a pipeline with Bitbucket Pipelines, and how to call CodeGuru Reviewer from there. We then show how to view the recommendations produced by CodeGuru Reviewer in Bitbucket Code Insights, and how to triage and manage recommendations during the development process.

Bitbucket Overview

Bitbucket is a Git-based code hosting and collaboration tool built for teams. Bitbucket’s best-in-class Jira and Trello integrations are designed to bring the entire software team together to execute a project. Bitbucket provides one place for a team to collaborate on code from concept to cloud, build quality code through automated testing, and deploy code with confidence. Bitbucket makes it easy for teams to collaborate and reduce issues found during integration by providing a way to combine easily and test code frequently. Bitbucket gives teams easy access to tools needed in other parts of the feedback loop, from creating an issue to deploying on your hardware of choice. It also provides more advanced features for those customers that need them, like SAML authentication and secrets storage.

Solution Overview

Bitbucket Pipelines uses a Docker container to perform the build steps. You can specify any Docker image accessible by Bitbucket, including private images, if you specify credentials to access them. The container starts and then runs the build steps in the order specified in your configuration file. The build steps specified in the configuration file are nothing more than shell commands executed on the Docker image. Therefore, you can run scripts, in any language supported by the Docker image you choose, as part of the build steps. These scripts can be stored either directly in your repository or an Internet-accessible location. This solution demonstrates an easy way to integrate Bitbucket pipelines with AWS CodeReviewer using bitbucket-pipelines.yml file.

You can interact with your Amazon Web Services (AWS)  account from your Bitbucket Pipeline using the  OpenID Connect (OIDC)  feature. OpenID Connect is an identity layer above the OAuth 2.0 protocol.

Now that you understand how Bitbucket and your AWS Account securely communicate with each other, let’s look into the overall summary of steps to configure this solution.

  1. Fork the repository
  2. Configure Bitbucket Pipelines as an IdP on AWS.
  3. Create an IAM role.
  4. Add repository variables needed for pipeline
  5. Adding the CodeGuru Reviewer CLI to your pipeline
  6. Review CodeGuru recommendations

Now let’s look into each step in detail. To configure the solution, follow  steps mentioned below.

Step 1: Fork this repo

Log in to Bitbucket and choose **Fork** to fork this example app to your Bitbucket account.

https://bitbucket.org/aws-samples/amazon-codeguru-samples

Fork amazon-codeguru-samples bitbucket repository.

Figure 1 : Fork amazon-codeguru-samples bitbucket repository.

Step 2: Configure Bitbucket Pipelines as an Identity Provider on AWS

Configuring Bitbucket Pipelines as an IdP in IAM enables Bitbucket Pipelines to issue authentication tokens to users to connect to AWS.
In your Bitbucket repo, go to Repository Settings > OpenID Connect. Note the provider URL and the Audience variable on that screen.

The Identity Provider URL will look like this:

https://api.bitbucket.org/2.0/workspaces/YOUR_WORKSPACE/pipelines-config/identity/oidc  – This is the issuer URL for authentication requests. This URL issues a  token to a requester automatically as part of the workflow. See more detail about issuer URL in RFC . Here “YOUR_WORKSPACE” need to be replaced with name of your bitbucket workspace.

And the Audience will look like:

ari:cloud:bitbucket::workspace/ari:cloud:bitbucket::workspace/84c08677-e352-4a1c-a107-6df387cfeef7  – This is the recipient the token is intended for. See more detail about audience in Request For Comments (RFC) which is memorandum published by the Internet Engineering Task Force(IETF) describing methods and behavior for  securely transmitting information between two parties usinf JSON Web Token ( JWT).

Configure Bitbucket Pipelines as an Identity Provider on AWS

Figure 2 : Configure Bitbucket Pipelines as an Identity Provider on AWS

Next, navigate to the IAM dashboard > Identity Providers > Add provider, and paste in the above info. This tells AWS that Bitbucket Pipelines is a token issuer.

Step 3: Create a custom policy

You can always use the CLI with Admin credentials but if you want to have a specific role to use the CLI, your credentials must have at least the following permissions:

{
    "Version": "2012-10-17",
    "Statement": [
        {
            "Action": [
                "codeguru-reviewer:ListRepositoryAssociations",
                "codeguru-reviewer:AssociateRepository",
                "codeguru-reviewer:DescribeRepositoryAssociation",
                "codeguru-reviewer:CreateCodeReview",
                "codeguru-reviewer:DescribeCodeReview",
                "codeguru-reviewer:ListRecommendations",
                "iam:CreateServiceLinkedRole"
            ],
            "Resource": "*",
            "Effect": "Allow"
        },
        {
            "Action": [
                "s3:CreateBucket",
                "s3:GetBucket*",
                "s3:List*",
                "s3:GetObject",
                "s3:PutObject",
                "s3:DeleteObject"
            ],
            "Resource": [
                "arn:aws:s3:::codeguru-reviewer-cli-<AWS ACCOUNT ID>*",
                "arn:aws:s3:::codeguru-reviewer-cli-<AWS ACCOUNT ID>*/*"
            ],
            "Effect": "Allow"
        }
    ]
}

To create an IAM policy, navigate to the IAM dashboard > Policies > Create Policy

Now then paste the above mentioned json document into the json tab as shown in screenshot below and replace <AWS ACCOUNT ID>   with your own AWS Account ID

Create a Policy.

Figure 3 : Create a Policy.

Name your policy; in our example, we name it CodeGuruReviewerOIDC.

Review and Create a IAM policy.

Figure 4 : Review and Create a IAM policy.

Step 4: Create an IAM Role

Once you’ve enabled Bitbucket Pipelines as a token issuer, you need to configure permissions for those tokens so they can execute actions on AWS.
To create an IAM web identity role, navigate to the IAM dashboard > Roles > Create Role, and choose the IdP and audience you just created.

Create an IAM role

Figure 5 : Create an IAM role

Next, select the “CodeGuruReviewerOIDC “ policy to attach to the role.

Assign policy to role

Figure 6 : Assign policy to role

 Review and Create role

Figure 7 : Review and Create role

Name your role; in our example, we name it CodeGuruReviewerOIDCRole.

After adding a role, copy the Amazon Resource Name (ARN) of the role created:

The Amazon Resource Name (ARN) will look like this:

arn:aws:iam::000000000000:role/CodeGuruReviewerOIDCRole

we will need this in a later step when we create AWS_OIDC_ROLE_ARN as a repository variable.

Step 5: Add repository variables needed for pipeline

Variables are configured as environment variables in the build container. You can access the variables from the bitbucket-pipelines.yml file or any script that you invoke by referring to them. Pipelines provides a set of default variables that are available for builds, and can be used in scripts .Along with default variables we need to configure few additional variables called Repository Variables which are used to pass special parameter to the pipeline.

Create repository variables

Figure 8 : Create repository variables

Figure 8 Create repository variables

Below mentioned are the few repository variables that need to be configured for this solution.

1.AWS_DEFAULT_REGION       Create a repository variableAWS_DEFAULT_REGION with value “us-east-1”

2.BB_API_TOKEN          Create a new repository variable BB_API_TOKEN and paste the below created App password as the value

App passwords are user-based access tokens for scripting tasks and integrating tools (such as CI/CD tools) with Bitbucket Cloud.These access tokens have reduced user access (specified at the time of creation) and can be useful for scripting, CI/CD tools, and testing Bitbucket connected applications while they are in development.
To create an App password:

    • Select your avatar (Your profile and settings) from the navigation bar at the top of the screen.
    • Under Settings, select Personal settings.
    • On the sidebar, select App passwords.
    • Select Create app password.
    • Give the App password a name, usually related to the application that will use the password.
    • Select the permissions the App password needs. For detailed descriptions of each permission, see: App password permissions.
    • Select the Create button. The page will display the New app password dialog.
    • Copy the generated password and either record or paste it into the application you want to give access. The password is only displayed once and can’t be retrieved later.

3.BB_USERNAME  Create a repository variable BB_USERNAME and add your bitbucket username as the value of this variable

4.AWS_OIDC_ROLE_ARN

After adding a role in Step 4, copy the Amazon Resource Name (ARN) of the role created:

The Amazon Resource Name (ARN) will look something like this:

    arn:aws:iam::000000000000:role/CodeGuruReviewerOIDCRole

and create AWS_OIDC_ROLE_ARN as a repository variable in the target Bitbucket repository.

Step 6: Adding the CodeGuru Reviewer CLI to your pipeline

In order to add CodeGuruRevewer CLi to your pipeline update the bitbucket-pipelines.yml file as shown below

#  Template maven-build

 #  This template allows you to test and build your Java project with Maven.
 #  The workflow allows running tests, code checkstyle and security scans on the default branch.

 # Prerequisites: pom.xml and appropriate project structure should exist in the repository.

 image: docker-public.packages.atlassian.com/atlassian/bitbucket-pipelines-mvn-python3-awscli

 pipelines:
  default:
    - step:
        name: Build Source Code
        caches:
          - maven
        script:
          - cd $BITBUCKET_CLONE_DIR
          - chmod 777 ./gradlew
          - ./gradlew build
        artifacts:
          - build/**
    - step: 
        name: Download and Install CodeReviewer CLI   
        script:
          - curl -OL https://github.com/aws/aws-codeguru-cli/releases/download/0.2.3/aws-codeguru-cli.zip
          - unzip aws-codeguru-cli.zip
        artifacts:
          - aws-codeguru-cli/**
    - step:
        name: Run CodeGuruReviewer 
        oidc: true
        script:
          - export AWS_DEFAULT_REGION=$AWS_DEFAULT_REGION
          - export AWS_ROLE_ARN=$AWS_OIDC_ROLE_ARN
          - export S3_BUCKET=$S3_BUCKET

          # Setup aws cli
          - export AWS_WEB_IDENTITY_TOKEN_FILE=$(pwd)/web-identity-token
          - echo $BITBUCKET_STEP_OIDC_TOKEN > $(pwd)/web-identity-token
          - aws configure set web_identity_token_file "${AWS_WEB_IDENTITY_TOKEN_FILE}"
          - aws configure set role_arn "${AWS_ROLE_ARN}"
          - aws sts get-caller-identity

          # setup codegurureviewercli
          - export PATH=$PATH:./aws-codeguru-cli/bin
          - chmod 777 ./aws-codeguru-cli/bin/aws-codeguru-cli

          - export SRC=$BITBUCKET_CLONE_DIR/src
          - export OUTPUT=$BITBUCKET_CLONE_DIR/test-reports
          - export CODE_INSIGHTS=$BITBUCKET_CLONE_DIR/bb-report

          # Calling Code Reviewer CLI
          - ./aws-codeguru-cli/bin/aws-codeguru-cli --region $AWS_DEFAULT_REGION  --root-dir $BITBUCKET_CLONE_DIR --build $BITBUCKET_CLONE_DIR/build/classes/java --src $SRC --output $OUTPUT --no-prompt --bitbucket-code-insights $CODE_INSIGHTS        
        artifacts:
          - test-reports/*.* 
          - target/**
          - bb-report/**
    - step: 
        name: Upload Code Insights Artifacts to Bitbucket Reports 
        script:
          - chmod 777 upload.sh
          - ./upload.sh bb-report/report.json bb-report/annotations.json
    - step:
        name: Upload Artifacts to Bitbucket Downloads       # Optional Step
        script:
          - pipe: atlassian/bitbucket-upload-file:0.3.3
            variables:
              BITBUCKET_USERNAME: $BB_USERNAME
              BITBUCKET_APP_PASSWORD: $BB_API_TOKEN
              FILENAME: '**/*.json'
    - step:
          name: Validate Findings     #Optional Step
          script:
            # Looking into CodeReviewer results and failing if there are Critical recommendations
            - grep -o "Critical" test-reports/recommendations.json | wc -l
            - count="$(grep -o "Critical" test-reports/recommendations.json | wc -l)"
            - echo $count
            - if (( $count > 0 )); then
            - echo "Critical findings discovered. Failing."
            - exit 1
            - fi
          artifacts:
            - '**/*.json'

Let’s look into the pipeline file to understand various steps defined in this pipeline

Bitbucket pipeline execution steps

Figure 9 : Bitbucket pipeline execution steps

Step 1) Build Source Code

In this step source code is downloaded into a working directory and build using Gradle.All the build artifacts are then passed on to next step

Step 2) Download and Install Amazon CodeGuru Reviewer CLI
In this step Amazon CodeGuru Reviewer is CLI is downloaded from a public github repo and extracted into working directory. All artifacts downloaded and extracted are then passed on to next step

Step 3) Run CodeGuruReviewer

This step uses flag oidc: true which declares you are using  the OIDC authentication method, while AWS_OIDC_ROLE_ARN declares the role created in the previous step that contains all of the necessary permissions to deal with AWS resources.
Further repository variables are exported, which is then used to set AWS CLI .Amazon CodeGuruReviewer CLI which was downloaded and extracted in previous step is then used to invoke CodeGuruReviewer along with some parameters .

Following are the parameters that are passed on to the CodeGuruReviewer CLI
--region $AWS_DEFAULT_REGION   The AWS region in which CodeGuru Reviewer will run (in this blog we used us-east-1).

--root-dir $BITBUCKET_CLONE_DIR The root directory of the repository that CodeGuru Reviewer should analyze.

--build $BITBUCKET_CLONE_DIR/build/classes/java Points to the build artifacts. Passing the Java build artifacts allows CodeGuru Reviewer to perform more in-depth bytecode analysis, but passing the build artifacts is not required.

--src $SRC Points the source code that should be analyzed. This can be used to focus the analysis on certain source files, e.g., to exclude test files. This parameter is optional, but focusing on relevant code can shorten analysis time and cost.

--output $OUTPUT The directory where CodeGuru Reviewer will store its recommendations.

--no-prompt This ensures that CodeGuru Reviewer does run in interactive mode where it pauses for user input.

–-bitbucket-code-insights $CODE_INSIGHTS The location where recommendations in Bitbucket CodeInsights format should be written to.

Once Amazon CodeGuruReviewer scans the code based on the above parameters, it generates two json files (reports.json and annotations.json) Code Insight Reports which is then passed on as artifacts to the next step.

Step 4) Upload Code Insights Artifacts to Bitbucket Reports
In this step code Insight Report generated by Amazon CodeGuru Reviewer is then uploaded to Bitbucket Reports. This makes the report available in the reports section in the pipeline as displayed in the screenshot

CodeGuru Reviewer Report

Figure 10 : CodeGuru Reviewer Report

Step 5) [Optional] Upload the copy of these reports to Bitbucket Downloads
This is an Optional step where you can upload the artifacts to Bitbucket Downloads. This is especially useful because the artifacts inside a build pipeline gets deleted after 14 days of the pipeline run. Using Bitbucket Downloads, you can store these artifacts for a much longer duration.

Bitbucket downloads

Figure 11 : Bitbucket downloads

Step 6) [Optional] Validate Findings by looking into results and failing is there are any Critical Recommendations
This is an optional step showcasing how the results for CodeGururReviewer can be used to trigger the success and failure of a Bitbucket pipeline. In this step the pipeline fails, if a critical recommendation exists in report.

Step 7: Review CodeGuru recommendations

CodeGuru Reviewer supports different recommendation formats, including CodeGuru recommendation summaries, SARIF, and Bitbucket CodeInsights.

Keeping your Pipeline Green

Now that CodeGuru Reviewer is running in our pipeline, we need to learn how to unblock ourselves if there are recommendations. The easiest way to unblock a pipeline after is to address the CodeGuru recommendation. If we want to validate on our local machine that a change addresses a recommendation using the same CLI that we use as part of our pipeline.
Sometimes, it is not convenient to address a recommendation. E.g., because there are mitigations outside of the code that make the recommendation less relevant, or simply because the team agrees that they don’t want to block deployments on recommendations unless they are critical. For these cases, developers can add a .codeguru-ignore.yml file to their repository where they can use a variety of criteria under which a recommendation should not be reported. Below we explain all available criteria to filter recommendations. Developers can use any subset of those criteria in their .codeguru-ignore.yml file. We will give a specific example in the following sections.

version: 1.0 # The version number is mandatory. All other entries are optional.

# The CodeGuru Reviewer CLI produces a recommendations.json file which contains deterministic IDs for each
# recommendation. This ID can be excluded so that this recommendation will not be reported in future runs of the
# CLI.
 ExcludeById:
 - '4d2c43618a2dac129818bef77093730e84a4e139eef3f0166334657503ecd88d'
# We can tell the CLI to exclude all recommendations below a certain severity. This can be useful in CI/CD integration.
 ExcludeBelowSeverity: 'HIGH'
# We can exclude all recommendations that have a certain tag. Available Tags can be found here:
# https://docs.aws.amazon.com/codeguru/detector-library/java/tags/
# https://docs.aws.amazon.com/codeguru/detector-library/python/tags/
 ExcludeTags:
  - 'maintainability'
# We can also exclude recommendations by Detector ID. Detector IDs can be found here:
# https://docs.aws.amazon.com/codeguru/detector-library
 ExcludeRecommendations:
# Ignore all recommendations for a given Detector ID 
  - detectorId: 'java/[email protected]'
# Ignore all recommendations for a given Detector ID in a provided set of locations.
# Locations can be written as Unix GLOB expressions using wildcard symbols.
  - detectorId: 'java/[email protected]'
    Locations:
      - 'src/main/java/com/folder01/*.java'
# Excludes all recommendations in the provided files. Files can be provided as Unix GLOB expressions.
 ExcludeFiles:
  - tst/**

The recommendations will still be reported in the CodeGuru Reviewer console, but not by the CodeGuru Reviewer CLI and thus they will not block the pipeline anymore.

Conclusion

In this post, we outlined how you can set up a CI/CD pipeline using Bitbucket Pipelines, and Amazon CodeGuru Reviewer and  we outlined how you can integrate Amazon CodeGuru Reviewer CLI with the Bitbucket cloud-based continuous delivery system that allows developers to automate builds, tests, and security checks with just a few lines of code. We showed you how to create a Bitbucket pipeline job and integrate the CodeGuru Reviewer CLI to detect issues in your Java and Python code, and access the recommendations for remediating these issues.

We presented an example where you can stop the build upon finding critical violations. Furthermore, we discussed how you could upload these artifacts to BitBucket downloads and store these artifacts for a much longer duration. The CodeGuru Reviewer CLI offers you a one-line command to scan any code on your machine and retrieve recommendations .You can use the CLI to integrate CodeGuru Reviewer into your favorite CI tool, as a pre-commit hook,   in your workflow. In turn, you can combine CodeGuru Reviewer with Dynamic Application Security Testing (DAST) and Software Composition Analysis (SCA) tools to achieve a hybrid application security testing method that helps you combine the inside-out and outside-in testing approaches, cross-reference results, and detect vulnerabilities that both exist and are exploitable.

If you need hands-on keyboard support, then AWS Professional Services can help implement this solution in your enterprise, and introduce you to our AWS DevOps services and offerings.

About the authors:

Bineesh Ravindran

Bineesh Ravindran

Bineesh is Solutions Architect at Amazon Webservices (AWS) who is passionate about technology and love to help customers solve problems. Bineesh has over 20 years of experience in designing and implementing enterprise applications. He works with AWS partners and customers to provide them with architectural guidance for building scalable architecture and execute strategies to drive adoption of AWS services. When he’s not working, he enjoys biking, aquascaping and playing badminton..

Martin Schaef

Martin Schaef

Martin Schaef is an Applied Scientist in the AWS CodeGuru team since 2017. Prior to that, he worked at SRI International in Menlo Park, CA, and at the United Nations University in Macau. He received his PhD from University of Freiburg in 2011.

Amazon CodeWhisperer, Free for Individual Use, is Now Generally Available

Post Syndicated from Steve Roberts original https://aws.amazon.com/blogs/aws/amazon-codewhisperer-free-for-individual-use-is-now-generally-available/

Today, Amazon CodeWhisperer, a real-time AI coding companion, is generally available and also includes a CodeWhisperer Individual tier that’s free to use for all developers. Originally launched in preview last year, CodeWhisperer keeps developers in the zone and productive, helping them write code quickly and securely and without needing to break their flow by leaving their IDE to research something. Faced with creating code for complex and ever-changing environments, developers can improve their productivity and simplify their work by making use of CodeWhisperer inside their favorite IDEs, including Visual Studio Code, IntelliJ IDEA, and others. CodeWhisperer helps with creating code for routine or time-consuming, undifferentiated tasks, working with unfamiliar APIs or SDKs, making correct and effective use of AWS APIs, and other common coding scenarios such as reading and writing files, image processing, writing unit tests, and lots more.

Using just an email account, you can sign up and, in just a few minutes, become more productive writing code—and you don’t even need to be an AWS customer. For business users, CodeWhisperer offers a Professional tier that adds administrative features, like SSO and IAM Identity Center integration, policy control for referenced code suggestions, and higher limits on security scanning. And in addition to generating code suggestions for Python, Java, JavaScript, TypeScript, and C#, the generally available release also now supports Go, Rust, PHP, Ruby, Kotlin, C, C++, Shell scripting, SQL, and Scala. CodeWhisperer is available to developers working in Visual Studio Code, IntelliJ IDEA, CLion, GoLand, WebStorm, Rider, PhpStorm, PyCharm, RubyMine, and DataGrip IDEs (when the appropriate AWS extensions for those IDEs are installed), or natively in AWS Cloud9 or AWS Lambda console.

Helping to keep developers in their flow is increasingly important as, facing increasing time pressure to get their work done, developers are often forced to break that flow to turn to an internet search, sites such as StackOverflow, or their colleagues for help in completing tasks. While this can help them obtain the starter code they need, it’s disruptive as they’ve had to leave their IDE environment to search or ask questions in a forum or find and ask a colleague—further adding to the disruption. Instead, CodeWhisperer meets developers where they are most productive, providing recommendations in real time as they write code or comments in their IDE. During the preview we ran a productivity challenge, and participants who used CodeWhisperer were 27% more likely to complete tasks successfully and did so an average of 57% faster than those who didn’t use CodeWhisperer.

Code generation from a comment in CodeWhisperer
Code generation from a comment

The code developers eventually locate may, however, contain issues such as hidden security vulnerabilities, be biased or unfair, or fail to handle open source responsibly. These issues won’t improve the developer’s productivity when they later have to resolve them. CodeWhisperer is the best coding companion when it comes to coding securely and using AI responsibly. To help you code responsibly, CodeWhisperer filters out code suggestions that might be considered biased or unfair, and it’s the only coding companion that can filter or flag code suggestions that may resemble particular open-source training data. It provides additional data for suggestions—for example, the repository URL and license—when code similar to training data is generated, helping lower the risk of using the code and enabling developers to reuse it with confidence.

Reference tracking in CodeWhisperer
Open-source reference tracking

CodeWhisperer is also the only AI coding companion to have security scanning for finding and suggesting remediations for hard-to-detect vulnerabilities, scanning both generated and developer-written code looking for vulnerabilities such as those in the top ten listed in the Open Web Application Security Project (OWASP). If it finds a vulnerability, CodeWhisperer provides suggestions to help remediate the issue.

Scanning for vulnerabilities in CodeWhisperer
Scanning for vulnerabilities

Code suggestions provided by CodeWhisperer are not specific to working with AWS. However, CodeWhisperer is optimized for the most-used AWS APIs, for example AWS Lambda, or Amazon Simple Storage Service (Amazon S3), making it the best coding companion for those building applications on AWS. While CodeWhisperer provides suggestions for general-purpose use cases across a variety of languages, the tuning performed using additional data on AWS APIs means you can be confident it is the highest quality, most accurate code generation you can get for working with AWS.

Meet Your new AI Code Companion Today
Amazon CodeWhisperer is generally available today to all developers—not just those with an AWS account or working with AWS—writing code in Python, Java, JavaScript, TypeScript, C#, Go, Rust, PHP, Ruby, Kotlin, C, C++, Shell scripting, SQL, and Scala. You can sign up with just an email address, and, as I mentioned at the top of this post, CodeWhisperer offers an Individual tier that’s freely available to all developers. More information on the Individual tier, and pricing for the Professional tier, can be found at https://aws.amazon.com/codewhisperer/pricing. 

Using Porting Advisor for Graviton

Post Syndicated from Sheila Busser original https://aws.amazon.com/blogs/compute/using-porting-advisor-for-graviton/

This blog post is written by Ryan Doty Solutions Architect , AWS and Vishal Manan Sr. SSA, EC2 Graviton , AWS.

Introduction

AWS customers recognize that Graviton-based EC2 instances deliver price-performance benefits but many are concerned about the effort to port existing applications. Porting code from one architecture to another can result in a substantial investment in time and effort. AWS has worked continuously to improve the migration process for customers. We recently introduced the Porting Advisor for Graviton as a tool to further simplify the migration process. In this blog, we’ll walk you through how to use Porting Advisor for Graviton so that you can learn how to use it.

Porting Advisor for Graviton is an open-source, command-line tool that analyzes source code and generates a report highlighting missing or outdated libraries and code constructs that may require modification and provides a user with alternative recommendations. It helps customers and developers accelerate their transition to Graviton-based Amazon EC2 instances by reducing the iterative process of identifying and resolving source code and library dependencies. This blog post will provide you with a step-by-step implementation on how to use Porting Advisor for Graviton. At the end of the blog, you will be able to run Porting Advisor for Graviton on your source code tree, generating findings that will help simplify the effort required to port your application.

Porting Advisor for Graviton scans for potentially unsupported or non-portable arm64 code in source code trees. The tool only scans source code files for the programming languages C/C++, Fortran, Go 1.11+, Java 8+, Python 3+, and dependency files such as project/requirements.txt file(s). Most importantly the Porting Advisor doesn’t make any code modifications, API-level recommendations, or send data back to AWS.

You can utilize Porting Advisor for Graviton either as a Python script or compiled into a binary and run on x86-64 or arm64 systems. Therefore, it can be easily implemented as part of your build processes.

Expected Results

Porting Advisor for Graviton reports the following issues:

  1. Inline assembly with no corresponding arm64 inline assembly.
  2. Assembly source files with no corresponding arm64 assembly source files.
  3. Missing arm64 architecture detection in autoconf config.guess scripts.
  4. Linking against libraries that aren’t available on the arm64 architecture.
  5. Use  architecture specific intrinsics.
  6. Preprocessor errors that trigger when compiling on arm64.
  7. Usages of old Visual C++ runtime (Windows specific).

Compiler specific code guarded by compiler specific pre-defined macros is detected, but not reported by default. The following cross-compile specific issues are detected, but not reported by default:

  • Architecture detection that depends on the host rather than the target.
  • Use of build artifacts in the build process.

Skillsets needed for using the tool

Porting Advisor for Graviton is designed to be easy to use. Users though should be versed in the following skills in order to take advantage of the recommendations the tool provides:

  • An understanding of the build system – project requirements and dependencies, versioning, etc.
  • Basic scripting language skills around Python, PowerShell/Bash.
  • Understanding hardware (inline assembly for C/C++) or compiler specific (intrinsic for C/C++) constructs when applicable.
  • The ability to follow best practices in the AWS Graviton Technical Guide for code optimization.

How to use Porting Advisor for Graviton

Prerequisites

The tool requires a minimum version of Python 3.10 and Java (8+ to be installed). The installation of Java is also optional and only required if you want to scan JAR files for native method calls. You can run the tool on a Windows/Linux/MacOS machine, or in an EC2 instance. I will show case usage on Windows and Amazon Linux 2(AL2) running on an EC2 instance. It supports both arm64 and x86-64 processors.

You don’t need to be on an arm64-based processor to run the tool.

The tool doesn't need a lot of CPU Horsepower and even a system with few processors will do

You can run the tool as a Python script or an executable. The executable requires extra steps to build. However, it can be used on another machine without the need to install Python packages.

You must copy the complete “dist” folder for it to work, as there are libraries that are present in that folder along with the executable.

Porting Advisor for Graviton can be run as a binary or as a script. You must run the script to generate the binaries

./porting-advisor-linux-x86_64 ~/my/path/to/my/repo --output report.html 
./porting-advisor-linux-x86_64.exe ../test/CppCode/inline_assembly --output report.html

Running Porting Advisor for Graviton as an executable

The first step is to build the executable.

Building the executable

The first step is to set up the Python Environment. If you run into any errors building the binary, see the Troubleshooting section for more details.

Building the binary on Windows

Building Porting Advisor using Powershell

Building Porting Advisor binary

Building the binary on Linux/Mac

Using shell script to build on Linux or macOS

Porting Advisor binary saved in dist folder

Running the binary

Here you can see how you can run the tool on Linux as a binary for a C++ project.

Porting advisor binary run on a C++ codebase with 350 files

The “dist” folder will have the executable.

Running Porting Advisor for Graviton as a script

Enable the Python environment for the following:

Linux/Mac:

$. python3 -m venv .venv
$. source .venv/bin/activate

PowerShell:

PS> python -m venv .venv
PS> .\.venv\Scripts\Activate.ps1

The following shows how the tool would work on Windows when run as a script:

Running Porting Advisor on Windows as a powershell script

Running the Porting Advisor for Graviton on Linux as a Script

Setting up Python environment to run the Porting Advisor as a script

Running Porting Advisor on Linux as a script

Output of the Porting Advisor for Graviton

The Porting Advisor for Graviton requires the directory parameter to point to the folder where your source code lives. If there are multiple locations, then you can run the tool as part of the script.

If no output file is supplied only standard output will be produced. The following is the output of the tool in HTML format. The first line shows the total files scanned.

  1. If no issues are found, then you’ll see an output like the following:

Results of Porting Advisor run on C++ code with 2836 files with no issues found

  1. With x86-64 specific intrinsics, such as _bswap64, you’ll see it flagged. arm64 specific intrinsics won’t be flagged. Therefore, if your code has arm64 specific intrinsics, then the porting advisor will only flag x86-64 to arm64 and not vice versa. The primary goal of the tool is determining the arm64 readiness of your code.

Porting Advisor reporting inline assembly files in C++ code

  1. The scanner typically looks for source code files only, but it can also look for assembly files with *.s extensions. An example of a file with the C++ code with inline assembly code is as follows:

Porting Advisor reporting use of intrinsics in C++ code

  1. The tool has pointed out errors such as a preprocessor error and architecture-specific intrinsic usage errors.

Porting Advisor results run on C++ code pointing out missing preprocessor macros for arm64 and x86-64 specific intrinsics

Next steps

If you don’t see any issues reported by the tool, then you are in good shape for doing the port. If no issues are reported it does not guarantee that it will work as port. Porting Advisor for Graviton is a tool used best as a helper. Regardless of the issues reported by the tool, we still highly suggest testing the application thoroughly.

As a good practice, we recommend that you use the latest version of your libraries.

Based on the issue, you can consider further actions. For Compiler intrinsic errors, we recommend studying Intel and arm64 intrinsics.

Once you’ve migrated your code and are using Gravition, you can start to look at taking steps to optimize your performance. If you’re interested in doing that please look at our Getting Started Guide.

If you run into any issues, then see our CONTRIBUTING file.

FAQs

  1. How fast is the tool? The tool is able to scan 4048 files in 1.18 seconds.

On an arm64 Based Instance:

Porting Advisor scans 4048 files in 1.18 seconds

  1. False Positives?

This tool scans all files in a source tree, regardless of whether they are included by the build system or not. Therefore, it may misreport issues in files that appear in the source tree but are excluded by the build system. Currently, the tool supports the following languages/dependencies: C/C++, Fortran, Go 1.11+, Java 8+, and Python 3+.

For example: You may have legacy code using Python version 2.7 that is in the source tree but isn’t being used. The tool will scan the code base and point out issues in that particular codebase even though you may not be using that piece of code.  To mitigate, either  remove that folder from the source code or ignore the error pointed by the tool.

  1. I see mention of Ruby and .Net in the Open source tool, but they don’t work on my tool.

Ruby and .Net haven’t been implemented yet, but please consider contributing to it and open an issue requesting support. If you need support then see our CONTRIBUTING file.

Troubleshooting

Errors that you may encounter while building the tool binary:

PyInstaller needs a shared version of libraries.

  1. Python 3.10+ not having shared libraries for use by the PyInstaller tool.

Building Porting Advisor binaries

Pyinstaller failed at building binary and suggesting building Python configure script with --enable-shared on Linux or --enable-framework on macOS

The fix for this is to build your version of Python(3.10+) with the right flags:

./configure --enable-optimizations --enable-shared

If the two flags don’t work together, try doing the build with each flag enabled sequentially.

pyinstaller tool needs python configure script with --enable-shared and enable-optimizations flag

  1. Incorrect Python version (version less than 3.10).If you aren’t on the correct version of Python:

You will get errors similar to the ones here:

Python version on host is 3.7.15 which is less than the recommended version

If you want to run the tool in an EC2 instance on Amazon Linux 2(AL2), then you could try upgrading/installing Python 3.10 as pointed out here.

If you run into any issues, then see our CONTRIBUTING file.

Trying to run Porting Advisor as script will result in Syntax errors on Python version less than 3.10

Conclusion

Porting Advisor for Graviton helps customers quantify the amount of work that is required to port an application. It accelerates your ability to transition to Graviton-based Amazon EC2 instances by reducing the iterative process of identifying and resolving source code and library dependencies.

Resources

To learn how to migrate your workloads to Graviton-based instances, see the AWS Graviton Technical Guide GitHub Repository and AWS Graviton Transition Guide. To get started with Graviton-based Amazon EC2 instances, see the AWS Management Console, AWS Command Line Interface (AWS CLI), and AWS SDKs.

Some other resources include:

Announcing Amazon CodeCatalyst (preview), a Unified Software Development Service

Post Syndicated from Steve Roberts original https://aws.amazon.com/blogs/aws/announcing-amazon-codecatalyst-preview-a-unified-software-development-service/

Today, we announced the preview release of Amazon CodeCatalyst. A unified software development and delivery service, Amazon CodeCatalyst enables software development teams to quickly and easily plan, develop, collaborate on, build, and deliver applications on AWS, reducing friction throughout the development lifecycle.

In my time as a developer the biggest excitement—besides shipping software to users—was the start of a new project, or being invited to join a project. Both came with the anticipation of building something cool, cutting new code—seeing an idea come to life. However, starting out was sometimes a slow process. My team or I would need to update our local development environments—or entirely new machines—with tools, libraries, and programming frameworks. We had to create source code repositories and set up other shared tools such as Jira, Confluence, or Jenkins, configure build pipelines and other automation workflows, create test environments, and so on. Day-to-day maintenance of development and build environments consumed valuable team cycles and energy. Collaboration between the team took effort, too, because tools to share information and have a single source of truth were not available. Context switching between projects and dealing with conflicting dependencies in those projects, e.g., Python 3.6 for project X and Python 2.7 for project Y—especially when we had only a single machine to work on—further increased the burden.

It doesn’t seem to have gotten any better! These days, when talking to developers about their experiences, I often hear them express that they feel modern development has become even more complicated. This is due to having to select and configure a wider collection of modern frameworks and libraries, tools, cloud services, continuous integration and delivery pipelines, and many other choices that all need to work together to deliver the application experience. What was once manageable by one developer on one machine is now a sprawling, dynamic, complex net of decisions and tradeoffs, made even more challenging by the need to coordinate all this across dispersed teams.

Enter Amazon CodeCatalyst
I’ve spent some time talking with the team behind Amazon CodeCatalyst about their sources of inspiration and goals. Taking feedback from both new and experienced developers and service teams here at AWS, they examined the challenges typically experienced by teams and individual developers when building software for the cloud. Having gathered and reviewed this feedback, they set about creating a unified tool that smooths out the rough edges that needlessly slow down software delivery, and they added features to make it easier for teams to work together and collaborate. Features in Amazon CodeCatalyst to address these challenges include:

  • Blueprints that set up the project’s resources—not just scaffolding for new projects, but also the resources needed to support software delivery and deployment.
  • On-demand cloud-based Dev Environments, to make it easy to replicate consistent development environments for you or your teams.
  • Issue management, enabling tracing of changes across commits, pull requests, and deployments.
  • Automated build and release (CI/CD) pipelines using flexible, managed build infrastructure.
  • Dashboards to surface a feed of project activities such as commits, pull requests, and test reporting.
  • The ability to invite others to collaborate on a project with just an email.
  • Unified search, making it easy to find what you’re looking for across users, issues, code and other project resources.

There’s a lot in Amazon CodeCatalyst that I don’t have space to cover in this post, so I’m going to briefly cover some specific features, like blueprints, Dev Environments, and project collaboration. Other upcoming posts will cover additional features.

Project Blueprints
When I first heard about blueprints, they sounded like a feature to scaffold some initial code for a project. However, they’re much more! Parameterized application blueprints enable you to set up shared project resources to support the application development lifecycle and team collaboration in minutes—not just initial starter code for an application. The resources that a blueprint creates for a project include a source code repository, complete with initial sample code and AWS service configuration for popular application patterns, which follow AWS best practices by default. If you prefer, an external Git repository such as GitHub may be used instead. The blueprint can also add an issue tracker, but external trackers such as Jira can also be used. Then, the blueprint adds a build and release pipeline for CI/CD, which I’ll come to shortly, as well as other integrated tooling.

The project resources and integrated tools set up using blueprints, including the CI/CD pipeline and the AWS resources to host your application, make it so that you can press “deploy” and get sample code running in a few minutes, enabling you to jump right in and start working on your specific business logic.

Project blueprints when starting a new project

At launch, customers can choose from blueprints with Typescript, Python, Java, .NET, Javascript for languages and React, Angular, and Vue frameworks, with more to come. And you don’t need to start with a blueprint. You can build projects with workflows that run on anything that works with Linux and Windows operating systems.

Cloud-Based Dev Environments
Development teams can often run into a problem of “environment drift” where one team member has a slightly different version of a toolchain or library compared to everyone else or the test environments. This can introduce subtle bugs that might go unnoticed for some time. Dev Environment specifications, and the other shared resources, that blueprints create help ensure there’s no unnecessary variance, and everyone on the team gets the same setup to provide a consistent, repeatable experience between developers.

Amazon CodeCatalyst uses a devfile to define the configuration of an on-demand, cloud-based Dev Environment, which currently supports four resizable instance size options with 2, 4, 8, or 16 vCPUs. The devfile defines and configures all of the resources needed to code, test, and debug for a given project, minimizing the time the development team members need to spend on creating and maintaining their local development environments. Devfiles, which are added to the source code repository by the selected blueprint can also be modified if required. With Dev Environments, context switching between projects incurs less overhead—with one click, you can simply switch to a different environment, and you’re ready to start working. This means you’re easily able to work concurrently on multiple codebases without reconfiguring. Being on-demand, Dev Environments can also be paused, restarted, or deleted as needed.

Below is an example of a devfile that bootstraps a Dev Environment.

schemaVersion: 2.0.0
metadata:
  name: aws-universal
  version: 1.0.1
  displayName: AWS Universal
  description: Stack with AWS Universal Tooling
  tags:
    - aws
    - a12
  projectType: aws
commands:
  - id: npm_install
    exec:
      component: aws-runtime
      commandLine: "npm install"
      workingDir: /projects/spa-app
events:
  postStart:
    - npm_install
components:
  - name: aws-runtime
    container:
      image: public.ecr.aws/aws-mde/universal-image:latest
      mountSources: true
      volumeMounts:
        - name: docker-store
          path: /var/lib/docker
  - name: docker-store
    volume:
      size: 16Gi

Developers working in cloud-based Dev Environments provisioned by Amazon CodeCatalyst can use AWS Cloud9 as their IDE. However, they can just as easily work with Amazon CodeCatalyst from other IDEs on their local machines, such as JetBrains IntelliJ IDEA Ultimate, PyCharm Pro, GoLand, and Visual Studio Code. Developers can also create Dev Environments from within their IDE, such as Visual Studio Code or for JetBrains using the JetBrains Gateway app. Below, JetBrains IntelliJ is being used.

Editing an application source file in JetBrains IntelliJ

Build and Release Pipelines
The build and release pipeline created by the blueprint run on flexible, managed infrastructure. The pipelines can use on-demand compute or preprovisioned builds, including a choice of machine sizes, and you can bring your own container environments. You can incorporate build actions that are built in or provided by partners (e.g., Mend, which provides a software composition analysis build action), and you can also incorporate GitHub Actions to compose fully automated pipelines. Pipelines are configurable using either a visual editor or YAML files.

Build and release pipelines enable deployment to popular AWS services, including Amazon Elastic Container Service (Amazon ECS), AWS Lambda, and Amazon Elastic Compute Cloud (Amazon EC2). Amazon CodeCatalyst makes it trivial to set up test and production environments and deploy using pipelines to one or many Regions or even multiple accounts for security.

Running automated workflow

Project Collaboration
As a unified software development service, Amazon CodeCatalyst not only makes it easier to get started building and delivering applications on AWS, it helps developers of all levels collaborate on projects through a single shared project space and source of truth. Developers can be invited to collaborate using just an email. On accepting the invitation, the developer sees the full project context and can begin work at once using the project’s Dev Environments—no need to spend time updating or reconfiguring their local machine with required tools, libraries, or other pre-requisites.

Existing members of an Amazon CodeCatalyst space, or new members using their email, can be invited to collaborate on a project:

Inviting new members to collaborate on a project

Each will receive an invitation email containing a link titled Accept Invitation, which when clicked, opens a browser tab to sign in. Once signed in, they can view all the projects in the Amazon CodeCatalyst space they’ve been invited to and can also quickly switch to other spaces in which they are the owner or to which they’ve been invited.

Projects I'm invited to collaborate on

From there, they can select a project and get an immediate overview of where things stand, for example, the status of recent workflows, any open pull requests, and available Dev Environments.

CodeCatalyst project summary

On the Issues board, team members can see which issues need to be worked on, select one, and get started.

Viewing issues

Being able to immediately see the context for the project, and have access to on-demand cloud-based Dev Environments, all help with being able to start contributing more quickly, eliminating setup delays.

Get Started with Amazon CodeCatalyst in the Free Tier Today!
Blueprints to scaffold not just application code but also shared project resources supporting the development and deployment of applications, issue tracking, invite-by-email collaboration, automated workflows, and more are all available today in the newly released preview of Amazon CodeCatalyst to help accelerate your cloud development and delivery efforts. Learn more in the Amazon CodeCatalyst User Guide. And, as I mentioned earlier, additional blogs posts and other supporting content are planned by the team to dive into the range of features in more detail, so be sure to look out for them!

Introducing AWS Resource Explorer – Quickly Find Resources in Your AWS Account

Post Syndicated from Danilo Poccia original https://aws.amazon.com/blogs/aws/introducing-aws-resource-explorer-quickly-find-resources-in-your-aws-account/

Looking for a specific Amazon Elastic Compute Cloud (Amazon EC2) instance, Amazon Elastic Container Service (Amazon ECS) task, or Amazon CloudWatch log group can take some time, especially if you have many resources and use multiple AWS Regions.

Today, we’re making that easier. Using the new AWS Resource Explorer, you can search through the AWS resources in your account across Regions using metadata such as names, tags, and IDs. When you find a resource in the AWS Management Console, you can quickly go from the search results to the corresponding service console and Region to start working on that resource. In a similar way, you can use the AWS Command Line Interface (CLI) or any of the AWS SDKs to find resources in your automation tools.

Let’s see how this works in practice.

Using AWS Resource Explorer
To start using Resource Explorer, I need to turn it on so that it creates and maintains the indexes that will provide fast responses to my search queries. Usually, the administrator of the account is the one taking these steps so that authorized users in that account can start searching.

To run a query, I need a view that gives access to an index. If the view is using an aggregator index, then the query can search across all indexed Regions.

Aggregator index diagram.

If the view is using a local index, then the query has access only to the resources in that Region.

Local index diagram.

I can control the visibility of resources in my account by creating views that define what resource information is available for search and discovery. These controls are not based only on resources but also on the information that resources bring. For example, I can give access to the Amazon Resource Names (ARNs) of all resources but not to their tags which might contain information that I want to keep confidential.

In the Resource Explorer console, I choose Enable Resource Explorer. Then, I select the Quick setup option to have visibility for all supported resources within my account. This option creates local indexes in all Regions and an aggregator index in the selected Region. A default view with a filter that includes all supported resources in the account is also created in the same Region as the aggregator index.

Console screenshot.

With the Advanced setup option, I have access to more granular controls that are useful when there are specific governance requirements. For example, I can select in which Regions to create indexes. I can choose not to replicate resource information to any other Region so that resources from each AWS Region are searchable only from within the same Region. I can also control what information is available in the default view or avoid the creation of the default view.

With the Quick setup option selected, I choose Go to Resource Explorer. A quick overview shows the progress of enabling Resource Explorer across Regions. After the indexes have been created, it can take up to 36 hours to index all supported resources, and search results might be incomplete until then. When resources are created or deleted, your indexes are automatically updated. These updates are asynchronous, so it can take some time (usually a few minutes) to see the changes.

Searching With AWS Resource Explorer
After resources have been indexed, I choose Proceed to resource search. In the Search criteria, I choose which View to use. Currently, I have the default view selected. Then, I start typing in the Query field to search through the resources in my AWS account across all Regions. For example, I have an application where I used the convention to start resource names with my-app. For the resources I created manually, I also added the Project tag with value MyApp.

To find the resource of this application, I start by searching for my-app.

Console screenshot.

The results include resources from multiple services and Regions and global resources from AWS Identity and Access Management (IAM). I have a service, tasks, and a task definition from Amazon ECS, roles and policies from AWS IAM, log groups from CloudWatch. Optionally, I can filter results by Region or resource type. If I choose any of the listed resources, the link will bring me to the corresponding service console and Region with the resource selected.

Console screenshot.

To look for something in a specific Region, such as Europe (Ireland), I can restrict the results by adding region:eu-west-1 to the query.

Console screenshot.

I can further restrict results to Amazon ECS resources by adding service:ecs to the query. Now I only see the ECS cluster, service, tasks, and task definition in Europe (Ireland). That’s the task definition I was looking for!

Console screenshot.

I can also search using tags. For example, I can see the resources where I added the MyApp tag by including tag.value:MyApp in a query. To specify the actual key-value pair of the tag, I can use tag:Project=MyApp.

Console screenshot.

Creating a Custom View
Sometimes you need to control the visibility of the resources in your account. For example, all the EC2 instances used for development in my account are in US West (Oregon). I create a view for the development team by choosing a specific Region (us-west-2) and filtering the results with service:ec2 in the query. Optionally, I could further filter results based on resource names or tags. For example, I could add tag:Environment=Dev to only see resources that have been tagged to be in a development environment.

Console screenshot.

Now I allow access to this view to users and roles used by the development team. To do so, I can attach an identity-based policy to the users and roles of the development team. In this way, they can only explore and search resources using this view.

Console screenshot.

Unified Search in the AWS Management Console
After I turn Resource Explorer on, I can also search through my AWS resources in the search bar at the top of the Management Console. We call this capability unified search as it gives results that include AWS services, features, blogs, documentation, tutorial, events, and more.

To focus my search on AWS resources, I add /Resources at the beginning of my search.

Console screenshot.

Note that unified search automatically inserts a wildcard character (*) at the end of the first keyword in the string. This means that unified search results include resources that match any string that starts with the specified keyword.

Console screenshot.

The search performed by the Query text box on the Resource search page in the Resource Explorer console does not automatically append a wildcard character but I can do it manually after any term in the search string to have similar results.

Unified search works when I have the default view in the same Region that contains the aggregator index. To check if unified search works for me, I look at the top of the Settings page.

Console screenshot.

Availability and Pricing
You can start using AWS Resource Explorer today with a global console and via the AWS Command Line Interface (CLI) and the AWS SDKs. AWS Resource Explorer is available at no additional charge. Using Resource Explorer makes it much faster to find the resources you need and use them in your automation processes and in their service console.

Discover and access your AWS resources across all the Regions you use with AWS Resource Explorer.

— Danilo

Using CloudFormation events to build custom workflows for post provisioning management

Post Syndicated from Vivek Kumar original https://aws.amazon.com/blogs/devops/using-cloudformation-events-to-build-custom-workflows-for-post-provisioning-management/

Over one million active customers manage application resources with AWS CloudFormation every week. CloudFormation is a service that helps you model, provision, and manage your cloud resources by treating Infrastructure as Code (IaC). It can simplify infrastructure management, quickly replicate your environment to multiple AWS regions with a single turn-key solution, and let you easily control and track changes in your infrastructure.

You can create various AWS resources using CloudFormation to setup an environment for your workloads. You continue to interact with and manage those resources throughout the workload lifecycle to make sure the resource configuration is aligned with business objectives such as adhering to security compliance standards, meeting required reliability targets, and aligning with budget requirements. The inability to perform a hand-off between resource provisioning actions in CloudFormation and resource management actions in other relevant AWS and non-AWS services poses a challenge. For example, after provisioning of resources, customers might need to perform additional tasks to manage these resources such as adding cost allocation tags, populating resource inventory database or trigger downstream processes.

While they are able to obtain the logical resource grouping that is tied to a workload or a workload component with a CloudFormation stack, that context does not extend beyond CloudFormation for the most part when they use various AWS and non-AWS services to conduct post-provisioning resource management. These AWS and non-AWS services typically offer a resource level view, or in some cases offer basic aggregated views such as supporting a tag group, or an account level abstraction to see all resources in a given account. For a CloudFormation customer, the inability to not have the context of a stack beyond resource provisioning provides a disjointed experience given there is no hand-off between resource provisioning actions in CloudFormation and resource management actions in other relevant AWS and non-AWS services. The various management actions customers take with their workload resources through out their lifecycle are

CloudFormation events provide a robust way to track the status of individual resources during the lifecycle of a stack. You can send CloudFormation events to Amazon EventBridge whenever a create, update,  or drift detection action is performed on your stack. Then you can set up additional workflows based on those events from EventBridge. For example, by tagging the resources automatically, you can reference that tag group when using AWS Trusted Advisor, and continue your resource management experience post-provisioning. CloudFormation sends these events to EventBridge automatically so that you don’t need to do anything. One real-world use case is to use these events to create actionable tasks for your teams to troubleshoot issues. CloudFormation events published to EventBridge can be used to create OpsItems within AWS Systems Manager OpsCenter. OpsItems are the work items created in OpsCenter for engineers to view, investigate and remediate tasks/issues. This enables teams to respond and resolve any issues more efficiently.

Walkthrough

To set up the EventBridge rule, go to the AWS console and navigate to EventBridge. Select on Create Rule to get started. Enter Name, description and select Next:

Create Rule

On the next screen, select AWS events in the Event source section.

This sample event is for the CREATE_COMPLETE event. It contains the source, AWS account number, AWS region, event type, resources and details about the event.

On the same page in the Event pattern section:

Select Custom patterns (JSON editor) and enter the following event pattern. This will match any events when a resource fails to create, update, or delete. Learn more about EventBridge event patterns.

{
    "source": [
        "aws.cloudformation"
    ],
    "detail-type": [
        "CloudFormation Resource Status Change"
    ],
    "detail": {
        "status-details": {
            "status": [
                "CREATE_FAILED",
                "UPDATE_FAILED",
                "DELETE_FAILED"
            ]
        }
    }
}

Custom patterns - JSON editor

Select Next. On the Target screen, select AWS service, then select System Manager OpsItem as the target for this rule.

Target 1

Add a second target – an Amazon Simple Notification Service (SNS) Topic – to notify the Ops team whenever a failure occurs and an OpsItem has been created.

Target 2

Select Next and optionally add tags.

Select next to review the selections, and select Create rule.

Now your rule is created and whenever a stack failure occurs, an OpsItem gets created and a notification is sent out for the operators to troubleshoot and fix the issue. The OpsItem contains operational data, such as the resource that failed, the reason for failure, as well as the stack to which it belongs, which is useful for troubleshooting the issue. Operators can take manual actions or use runbooks codified as Systems Manager Documents to take corrective actions. From the AWS Console you can go to OpsCenter to see the events:

operational data

Once the issues have been addressed, operators can mark the OpsItem as resolved, and retry the stack operation that failed, resulting in a swift resolution of the issue, and preventing duplication of efforts.

This walkthrough is for the Console but you can use AWS Command Line Interface (AWS CLI), AWS SDK or even CloudFormation to accomplish all of this. Refer to AWS CLI documentation for more information on creating EventBridge rules through CLI. Furthermore, refer to AWS SDK documentation for creating EventBridge rules through AWS SDK. You can use following CloudFormation template to deploy the EventBridge rules example used as part of the walkthrough in this blog post:

{
	"Parameters": {
		"SNSTopicARN": {
			"Type": "String",
			"Description": "Enter the ARN of the SNS Topic where you want stack failure notifications to be sent."
		}
	},
	"Resources": {
		"CFNEventsRule": {
			"Type": "AWS::Events::Rule",
			"Properties": {
				"Description": "Event rule to capture CloudFormation failure events",
				"EventPattern": {
					"source": [
						"aws.cloudformation"
					],
					"detail-type": [
						"CloudFormation Resource Status Change"
					],
					"detail": {
						"status-details": {
							"status": [
								"CREATE_FAILED",
								"UPDATE_FAILED",
								"DELETE_FAILED"
							]
						}
					}
				},
				"Name": "cfn-stack-failure-test",
				"State": "ENABLED",
				"Targets": [
					{
						"Arn": {
							"Fn::Sub": "arn:aws:ssm:${AWS::Region}:${AWS::AccountId}:opsitem"
						},
						"Id": "opsitems",
						"RoleArn": {
							"Fn::GetAtt": [
								"TargetInvocationRole",
								"Arn"
							]
						}
					},
					{
						"Arn": {
							"Ref": "SNSTopicARN"
						},
						"Id": "sns"
					}
				]
			}
		},
		"TargetInvocationRole": {
			"Type": "AWS::IAM::Role",
			"Properties": {
				"AssumeRolePolicyDocument": {
					"Version": "2012-10-17",
					"Statement": [
						{
							"Effect": "Allow",
							"Principal": {
								"Service": [
									"events.amazonaws.com"
								]
							},
							"Action": [
								"sts:AssumeRole"
							]
						}
					]
				},
				"Path": "/",
				"Policies": [
					{
						"PolicyName": "createopsitem",
						"PolicyDocument": {
							"Version": "2012-10-17",
							"Statement": [
								{
									"Effect": "Allow",
									"Action": [
										"ssm:CreateOpsItem"
									],
									"Resource": "*"
								}
							]
						}
					}
				]
			}
		},
		"AllowSNSPublish": {
			"Type": "AWS::SNS::TopicPolicy",
			"Properties": {
				"PolicyDocument": {
					"Statement": [
						{
							"Sid": "grant-eventbridge-publish",
							"Effect": "Allow",
							"Principal": {
								"Service": "events.amazonaws.com"
							},
							"Action": [
								"sns:Publish"
							],
							"Resource": {
								"Ref": "SNSTopicARN"
							}
						}
					]
				},
				"Topics": [
					{
						"Ref": "SNSTopicARN"
					}
				]
			}
		}
	}
}

Summary

Responding to CloudFormation stack events becomes easy with the integration between CloudFormation and EventBridge. CloudFormation events can be used to perform post-provisioning actions on workload resources. With the variety of targets available to EventBridge rules, various actions such as adding tags and, troubleshooting issues can be performed. This example above uses Systems Manager and Amazon SNS but you can have numerous targets including, Amazon API gateway, AWS Lambda, Amazon Elastic Container Service (Amazon ECS) task, Amazon Kinesis services, Amazon Redshift, Amazon SageMaker pipeline, and many more. These events are available for free in EventBridge.

Learn more about Managing events with CloudFormation and EventBridge.

About the Author

Vivek is a Solutions Architect at AWS based out of New York. He works with customers providing technical assistance and architectural guidance on various AWS services. He brings more than 25 years of experience in software engineering and architecture roles for various large-scale enterprises.


Mahanth is a Solutions Architect at Amazon Web Services (AWS). As part of the AWS Well-Architected team, he works with customers and AWS Partner Network partners of all sizes to help them build secure, high-performing, resilient, and efficient infrastructure for their applications. He spends his free time playing with his pup Cosmo, learning more about astronomy, and is an avid gamer.


Sukhchander is a Solutions Architect at Amazon Web Services. He is passionate about helping startups and enterprises adopt the cloud in the most scalable, secure, and cost-effective way by providing technical guidance, best practices, and well architected solutions.

Hazard analysis and Chaos engineering at Vanguard Group

Post Syndicated from Jason Barto original https://aws.amazon.com/blogs/devops/hazard-analysis-and-chaos-engineering-at-vanguard-group/

Anticipating events that can cause a disruption to your system’s service is critical to building highly available, reliable systems.  Hazard analysis gives you a method to identify such events.  Chaos engineering gives you a method to confirm that a system behaves as expected in adverse conditions.  By combining these methods, Vanguard is building reliability into their systems.

Vanguard engineering teams perform hazard analysis on their systems and capture the identified events as failure scenarios.  They use the identified failure scenarios to create hypotheses to support chaos engineering experiments.  These hypotheses predict how the system will respond to failures and each hypothesis is then confirmed through experimentation to increase the team’s confidence in the system’s reliability.

In this article we will walk you through how Vanguard uses hazard analysis and chaos engineering.  We will also provide guidance on how you can employ these techniques on your applications.

Failure Mode & Effects Analysis

A hazard analysis can be performed using different methods.  At Vanguard, they have adapted the failure mode & effects analysis (FMEA) method to support their important services.

FMEA is a bottom-up approach to analyse an architecture and focus on the impact to system functions when one or more components of the system are disrupted. Members of the engineering team and architects responsible for designing and building a system brainstorm possible failure scenarios or failure modes, and document the impact of these failures on the system. Combined with a quantitative method for ranking the failure modes, the analysis process produces a prioritised list of failure modes which describes how the system would respond to individual or combined failures in its component parts or dependencies.

For each failure mode the team conducting the analysis will highlight what protections exist within the system to guard against the failure mode.  Sometimes, fault isolation boundaries have been put in place to prevent client impact in failure scenarios. In other scenarios, for one reason or another, there are hard dependencies in place for which the engineering team has decided not to build in fault tolerance. For example, a team responsible for a less-critical function may have architected its system to operate across multiple availability zones, but could decide not to implement other mitigations to prioritize cost over increased resilience.

The FMEA method has been in use by engineers in the automotive, aeronautical, healthcare, and military industries for more than 60 years.  Over that time, FMEA has been modified to best suit the organization and the field in which it was applied.  In many variations the FMEA measures each failure mode with a risk priority number (RPN), which is intended to quantitatively rank the failure mode based upon:

  1. The failure mode’s impact to the system as a whole
  2. The probability of the failure mode’s occurrence
  3. How easily the failure mode can be detected

Vanguard have adapted the FMEA process to serve their own specific requirements and processes.  Vanguard have decided not to adopt the RPN element of the FMEA process, as teams found they spent a lot of time debating the impact, probability, and detectability of individual failure modes.  To perform an FMEA more quickly, teams instead focus on the failure modes and system impact only, documenting a mental model of system performance which can be experimented through chaos engineering.

An excerpt of a Vanguard FMEA output is provided as an example in the following table:

The “Process Step” in the table above refers to a business function of the system being analyzed, for example “Request to retrieve stored data”. As part of the analysis, the team identifies the system components needed to perform the Process Step and considers the interactions of those components Focusing on a Process Step makes it easier to anticipate the failure scenarios that would affect the system in performing this particular business function. Also, the Process Step will imply an importance or criticality which can be a factor when prioritizing mitigations.

After selecting a Process Step, you walk through the system components involved and identify how component failures or disruptions will affect the wider system. Such component failures may involve individual components or a combination of components and are captured as “Failure Mode”. This identifies the component or components that are disrupted and their behaviour; for example, “Microservice is unavailable or returns an error”.

“Expected Behaviour” describes the effect of the failure mode on the wider system, in the context of the Process Step. This captures what other system components are affected by the Failure Mode and why, and how this impacts the Process Step as a whole.

Lastly, the “Hypothesis” column forms the basis for the chaos experiments that will follow from the FMEA to confirm that the system performs as expected.

At Vanguard, all mission-critical product teams are conducting FMEAs for their production applications. The outputs of these sessions are maintained over time and serve multiple purposes:

  1. When onboarding new team members, it is helpful to provide the FMEA document alongside an architecture diagram and narrative. It will paint a more robust picture of how the system is intended to operate in both “happy path” and “unhappy path” scenarios.
  2. When troubleshooting incidents, an FMEA document can help on-call engineers – especially those less experienced with debugging – to match up the documented expectations to the observed system behavior.
  3. Site Reliability Engineers (SREs) looking for opportunities to improve the resilience of a system might look to FMEA documentation to understand the existing fault isolation boundaries and introduce additional resilience mechanisms through automation and system changes.
  4. Finally, when selecting scenarios for experimentation with Chaos Engineering, the FMEA document provides a list of conjectures that have been mapped to hypotheses, ready to be validated through experimentation. This input into the Chaos Engineering workflow is the primary use of FMEA documents for Vanguard product teams.

There are many resources available online to learn more about how FMEA is used and applied in other organisations. In Failure Modes and Continuous Resilience, Adrian Cockcroft introduces FMEA as a method for anticipating failure scenarios. The NASA Software Engineering Handbook details how FMEAs are conducted as part of their engineering process. The Automotive Industry Group has also formally documented the use of FMEA in the Automotive Industry Action Group FMEA Handbook.

Chaos Engineering

After failure modes have been identified and mitigated through system design, it’s time to understand how resilient the system’s implementation is to those failure modes. Chaos engineering can be used to explore a system and validate that a system’s implementation meets business resiliency objectives.

Chaos engineering helps to improve a team’s mental model about the system under experimentation and provides insights into how a complex system behaves under adverse conditions. It also enables an engineer to find the unknown unknowns and the known unknowns through experiments that are built on top of the hypothesis. These experiments should simulate real world events, such as network degradation and increased client requests, and the outcome of the experiment should not be known. In other words, an experiment is not an experiment if it’s known that the conditions will cause the system to fail.

Prerequisites to Chaos Experiments at Vanguard

At Vanguard, there are some necessary prerequisites to running a chaos experiment. Firstly, the system under experiment must be set up with some basic observability tooling that will allow teams to monitor the state of the application during the failure injection. This could be as simple as an Amazon CloudWatch dashboard and some associated alarms, or as elaborate as a dedicated dashboard set up in a vendor tool.

Secondly, teams must be able to drive load to the application during the experiment; depending on the experiment type, the level and type of load may vary. The load generator can be as simple as a script on someone’s machine, or a fully automated load test depending on the requirements of the hypothesis.

Finally, teams need to have a good understanding of what the application’s “steady state” looks like. I Ideally, this takes the form of some metrics such as expected error rate, expected latency, and/or a service level objective (SLO) that can be monitored throughout the duration of the experiment. For example, a service level objective for a RESTful API might be that 90% of requests should receive a response within 100 milliseconds.

With the prerequisites met and a completed FMEA, teams can then experiment with their hypothesis using various experiment templates defined by Vanguard’s Climate of Chaos tooling.

Vanguard’s Climate of Chaos

At Vanguard, ensuring its software systems are resilient to adverse events is a critical part of its ongoing mission to provide world-class service to their clients. Vanguard believes that in order to develop high quality software, one must plan for the inevitable “stormy weather” events that occur in a distributed system.

Over the past 2 years, as a response to this need, Vanguard has developed in-house tooling called “The Climate of Chaos” to give teams easy access to common experiment templates, along with a friendly UI interface. The Climate of Chaos helps developers experiment on their systems and validate the hypotheses generated from FMEAs. It also provides the tooling for them to simulate the most common failure scenarios on Vanguard’s most commonly utilized AWS infrastructure, including Amazon Elastic Container Service (Amazon ECS), AWS Fargate, Amazon DynamoDB, Amazon Relational Database Service (Amazon RDS), AWS Lambda, and others.

The Climate of Chaos was created prior to Amazon’s release of the AWS Fault Injection Simulator (FIS), and today there is a lot of overlap with the experiment capabilities available in FIS. The Climate of Chaos has also been enhanced with company-specific features and integrations that make it easier for Vanguard developers to run chaos experiments in a controlled and predictable manner.

The Climate of Chaos includes important safety features such as an “emergency stop” function. This feature enables teams to terminate the experiment immediately if unintended side effects are encountered, rolling back the events simulated to resume steady state operation. The Climate of Chaos has been coupled with other systems like an in-house load testing tooling and added features like the ability to monitor CloudWatch alarms. Vanguard also offers teams the ability to schedule experiments to run at their convenience. Soon, Vanguard hopes to make running chaos experiments even smarter, introducing tools that will help teams run bulk experiments that systematically inject failures on a group of related applications to help pinpoint more complex failure modes.

Next Steps

Failure modes and effects analysis is a hazard analysis method which can help you identify single and combined points of failure in your system so you can prioritize the failure modes. To learn more about the FMEA process, you can read the NASA Software Engineering Handbook which outlines how they perform FMEA on their software-based systems. The AWS Whitepaper Building Mission-Critical Financial Services Applications on AWS provides example forms and suggestions for severity, probability, and detectability rankings. Appendix F in the whitepaper suggests a 1 to 10 ranking for each Risk Priority Number input, and the example spreadsheets recommend performing FMEAs for the application, platform, infrastructure, and operation layers of the system. Using these examples, you can perform an analysis of your own systems and generate hypotheses.

To experiment on your systems and validate your own hypotheses, you can use the AWS Fault Injection Simulator (FIS) mentioned earlier in this article. FIS provides you with a framework for performing controlled chaos experiments on your AWS workloads. It helps you to safely manage your experiments by providing tooling to monitor, rollback, and orchestrate chaos experiments. FIS provides the fault injection mechanisms that you will need to experiment upon your system’s implementation and resilience to identified failure modes. You can start by running experiments in pre-production environments, and then step up to running them as part of your CI/CD workflow and ultimately in your production environment. To learn more about FIS, you can read the FIS User Guide and FIS tutorials.

By using FMEA to anticipate the failures and experimenting on your systems with chaos engineering, you will gain confidence in the reliability of your system.

The content and opinions in this post are those of The Vanguard Group and AWS is not responsible for the content or accuracy of this post.

About the authors:

Tory Benya

Tory works as a Chaos Engineering Tech Lead at Vanguard.  She is passionate about automation, data, and making software work for people.  She likes to automate, integrate, and improve processes and technology.  Tory makes data-driven decisions to make a difference as part of her team at Vanguard.

Christina Yakomin

Christina works as a Senior Site Reliability Engineering Specialist in Vanguard’s Chief Technology Office. Throughout her career, she has developed an expansive skill set in front- and back-end web development, as well as cloud infrastructure and automation, with a specialization in Site Reliability Engineering. She has earned several Amazon Web Services certifications, including the Solutions Architect – Professional. Christina has also worked closely with the Women’s Initiative for Leadership Success at Vanguard, both internally at the company and externally in the local community, to further the career advancement of women and girls – in particular within the tech industry.

Jason Barto

Jason works as a Principal Solutions Architect at AWS where he works with customers to design resilient system architectures and develop chaos engineering practices. Prior to joining AWS Jason was designing and building distributed systems for complex event processing and real-time telemetry analytics.

John Formento

John is a Solutions Architect at AWS. He helps large enterprises achieve their goals by architecting secure and scalable solutions on the AWS Cloud. John holds 7 AWS certifications including AWS Certified Solutions Architect – Professional and DevOps Engineer – Professional.

Jenkins high availability and disaster recovery on AWS

Post Syndicated from James Bland original https://aws.amazon.com/blogs/devops/jenkins-high-availability-and-disaster-recovery-on-aws/

We often hear from customers about their challenges architecting Jenkins for scale and high availability (HA). Jenkins was originally built as a continuous integration (CI) system to test software before it was committed to a repository. Since its beginning, Jenkins has grown out of necessity versus grand master plan. Developers who extended Jenkins favored speed of creating functionality over performance or scalability of the entire system. This is not to say that it’s impossible to scale Jenkins, it’s only mentioned here to highlight the challenges and technical debt that has accumulated because of the prioritization of features versus developing towards a specific architecture. In this post, we discuss these challenges and our proposed solution.

Challenges with Jenkins at scale and HA

Business and customer demand are forcing organizations to increase the speed and agility at which they release features and functionality. As organizations make this transition, the usage of continuous integration and continuous delivery (CI/CD) increases, which drives the need to scale Jenkins. Overlay this with an organization that commits hundreds of changes per day and works around the clock, with developers dispersed globally, and you end up with an operational situation where there is no room for downtime. To mitigate the risk of impacting an organization’s ability to release when they need it, developers require a system that not only scales but is also highly available.

The ability to scale Jenkins and provide HA comes down to two problems. One is the ability to scale compute to handle additional jobs, and the second is storage. To scale compute, we typically do it in one of two ways, horizontally or vertically. Horizontally means we scale Jenkins to add additional compute nodes. Scaling vertically means we scale Jenkins by adding more resources to the compute node.

Let’s start with the storage problem. Jenkins is designed around the local file system. Anyone who has spent time around Jenkins is aware that logs, cloned repos, plugins, and build artifacts are stored into JENKINS_HOME. Local file systems, while good for single-server designs, tend to be a challenge when HA comes into the picture. In on-premises designs, administrators have often used Network File System (NFS) and Storage Area Networks (SAN) to achieve some scale and resiliency. This type of design comes with a trade-off of performance and doesn’t provide the true HA and inherent disaster recovery (DR) required to meet the demands of the business.

Because of the local file system constraint, there are two native families of storage available in AWS: Amazon Elastic Block Store (Amazon EBS) and Amazon Elastic File System (Amazon EFS). Amazon EBS is great for a single-server design in a single Availability Zone. The challenge is trying to scale a single-server design to support HA. Because of the requirement to assign an EBS volume to a specific Availability Zone, you can’t automatically transition the EBS volume to another Availability Zone and attach it to a Jenkins instance. If you don’t mind having an impact on Recovery Time Objective (RTO) and Recovery Point Objective (RPO), a solution using Amazon EBS snapshots copied to additional Availability Zones might work. Although EBS snapshot copy is possible, it’s not a recommended solution because it doesn’t scale and has complexities in building and maintaining this type of solution.

Amazon EFS as an alternative has worked well for customers that don’t have high usage patterns of Jenkins. All Jenkins instances within the Region can access the Amazon EFS file system and data durably stored in multiple Availability Zones. If a single Availability Zone experiences an outage, the Jenkins file system is still accessible from other Availability Zones providing HA for the storage layer. This solution is not recommended for high-usage systems due to the way that Jenkins reads and writes data. Jenkins’s access pattern is skewed towards writing data such as logs, cloned repos, and building artifacts versus reading data. Amazon EFS, on the other hand, is designed for workloads that read more than they write. On high-usage workloads, customers have experienced Jenkins build slowness and Jenkins page load latency. This is why Amazon EFS isn’t recommended for high-usage Jenkins systems.

Solution for Jenkins at scale and HA

Solving the compute problem is relatively straightforward by using Amazon Elastic Kubernetes Service (Amazon EKS). In the context of Jenkins, an organization would run Jenkins in an Amazon EKS cluster that spans multiple Availability Zones, as shown in the following diagram.

Diagram showing Jenkins deployment in Amazon EKS with three availability zones inside a VPC

Figure 1 –Jenkins deployment in Amazon EKS with multiple availability zones.

Jenkins Controller and Agent would run in an Availability Zone as a Kubernetes pod. Amazon EKS is designed around Desired State Configuration (DSC), which means that it continuously make sure that the running environment matches the configuration that has been applied to Amazon EKS. In practice, when Amazon EKS is told that you want a single pod of Jenkins running, it monitors and makes sure that pod is always running. If an Availability Zone is unavailable, Amazon EKS launches a new node in another Availability Zone and deploys all pods to meet any necessary constraints defined in Amazon EKS. With this option, we still need to have the data in other Availability Zones, which we cover later in this post.

The only option of scaling Jenkins controllers is vertical. Scaling Jenkins horizontally could lead to an undesirable state because the system wasn’t designed to have multiple instances of Jenkins attached to the same storage layer. There is no exclusive file locking mechanism to ensure data consistency. For organizations that have exhausted the limits with vertical scaling, the recommendation is to run multiple independent Jenkins controllers and separate them per team or group. Vertical scaling of Jenkins is simpler in Amazon EKS. Node sizes and container memory are controlled by configuration. Increasing memory size is as simple as changing a container’s memory setting. Due to the ease of changing configuration, it’s best to start with a lower memory setting, monitor performance, and increase as necessary. You want to find a good balance between price and performance.

For Jenkins agents, there are many options to scale the compute. In the context of scale and HA, the best options are to use AWS CodeBuild, AWS Fargate for Amazon EKS, or Amazon EKS managed node groups. With CodeBuild, you don’t need to provision, manage, or scale your build servers. CodeBuild scales continuously and processes multiple builds concurrently. You can use the Jenkins plugin for CodeBuild to integrate CodeBuild with Jenkins. Fargate is a good option but has some challenges if you’re trying to build container images within a container due to permissions necessary that aren’t exposed in Fargate. For additional information on how to overcome this challenge with Jenkins, refer to How to build container images with Amazon EKS on Fargate.

Now let’s look at the storage layer and see how LINBIT is helping organizations solve this problem with LINSTOR. LINBIT’s LINSTOR is an open-source management tool designed to manage block storage devices. Its primary use case is to provide Linux block storage for Kubernetes and other public and private cloud platforms. LINBIT also provides enterprise subscription for LINSTOR, which include technical support with SLA.

The following diagram illustrates a LINSTOR storage solution running on Amazon EKS using multiple Availability Zones and Amazon Simple Storage Service (Amazon S3) for snapshots.

Diagram showing LINSTOR storage solution running on Amazon EKS across three availability zone with snapshot stored in Amazon S3.

Figure 2. LINSTOR storage solution running on Amazon EKS using multiple availability zones and S3 for snapshot.

LINSTOR is composed of a control plane and a data plane. The control plane consists of a set of containers deployed into Amazon EKS and is responsible for managing the data plane. The data plane consists of a collection of open-source block storage software, most importantly LINBIT’s Distributed Replicated Storage System (DRBD) software. DRBD is responsible for provisioning and synchronously replicating storage between Amazon EKS worker instances in different Availability Zones.

LINSTOR is deployed via Helm into Amazon EKS, and the LINSTOR cluster is initialized by the LINSTOR Operator. Once deployed, LINSTOR volumes and volume snapshots are managed via Kubernetes Storage Classes and Snapshot Classes in a Kubernetes native fashion. LINSTOR volumes are backed by LINSTOR objects known as storage pools, which are composed of one or more EBS volumes attached to each Amazon EKS worker instance.

LINSTOR volumes layer DRBD on top of the worker’s attached EBS volume to enable synchronous replication between peers in the Amazon EKS cluster. This ensures that you have an identical copy of your persistent volume on the EBS volumes in each Availability Zone. In the event of an Availability Zone outage or planned migration, Amazon EKS moves the Jenkins deployment to another Availability Zone where the persistent volume copy is available. In terms of scaling, LINBIT DRDB supports up to 32 replicas per volume, with a maximum size of 1 PiB per volume. LINSTOR node itself can scale beyond hundreds of nodes, as shown in this case study.

LINSTOR also provides an HA Controller component in its control plane to speed up failover times during outages. LINSTOR’s HA Controller looks for pods with a specific label, and if LINSTOR’s persistent volumes replication network becomes interrupted (like during an Availability Zone outage), LINSTOR reschedules the pod sooner than the default Kubernetes pod-eviction-timeout.

LINBIT provides a detailed full installation for Jenkins HA in AWS. A sample of LINSTOR’s helm values supporting these features is as follows:

operator:
  satelliteSet:
    storagePools:
      lvmThinPools:
      - name: lvm-thin
        thinVolume: thinpool
        volumeGroup: ""
        devicePaths:
        - /dev/nvme1n1
    kernelModuleInjectionMode: Compile
stork:
  enabled: false
csi:
  enableTopology: true
etcd:
  replicas: 3
haController:
  replicas: 3

After LINSTOR is deployed, you create a Kubernetes StorageClass supporting persistent volumes with three replicas using the following example:

apiVersion: storage.k8s.io/v1
kind: StorageClass
metadata:
  name: "linstor-csi-lvm-thin-r3"
provisioner: linstor.csi.linbit.com
parameters:
  allowRemoteVolumeAccess: "false"
  autoPlace: "3"
  storagePool: "lvm-thin"
  DrbdOptions/Disk/disk-flushes: "no"
  DrbdOptions/Disk/md-flushes: "no"
  DrbdOptions/Net/max-buffers: "10000"
reclaimPolicy: Retain
allowVolumeExpansion: true
volumeBindingMode: WaitForFirstConsumer

Finally, Jenkins helm charts are deployed into Amazon EKS with the following Helm values to request a PV from the LINSTOR StorageClass:

persistence:
  storageClass: linstor-csi-lvm-thin-r3
  size: "200Gi"
controller:
  serviceType: LoadBalancer
  podLabels:
    linstor.csi.linbit.com/on-storage-lost: remove

To protect against entire AWS Region outages and provide disaster recovery, LINSTOR takes volume snapshots and replicates it cross-Region using Amazon S3. LINSTOR requires read and write access to the target S3 bucket using AWS credentials provided as Kubernetes secrets:

kind: Secret
apiVersion: v1
metadata:
  name: linstor-csi-s3-access
  namespace: default
type: linstor.csi.linbit.com/s3-credentials.v1
immutable: true
stringData:
  access-key: REDACTED
  secret-key: REDACTED

The target S3 bucket is referenced as a snapshot shipping target using a LINSTOR S3 VolumeSnapshotClass. The following example shows a VolumeSnapshotClass referencing the S3 bucket’s secret and additional configuration for the target S3 bucket:

kind: VolumeSnapshotClass
apiVersion: snapshot.storage.k8s.io/v1
metadata:
  name: linstor-csi-snapshot-class-s3
driver: linstor.csi.linbit.com
deletionPolicy: Delete
parameters:
  snap.linstor.csi.linbit.com/type: S3
  snap.linstor.csi.linbit.com/remote-name: s3-us-west-2
  snap.linstor.csi.linbit.com/allow-incremental: "false"
  snap.linstor.csi.linbit.com/s3-bucket: name-of-bucket-123
  snap.linstor.csi.linbit.com/s3-endpoint: http://s3.us-west-2.amazonaws.com
  snap.linstor.csi.linbit.com/s3-signing-region: us-west-2
  snap.linstor.csi.linbit.com/s3-use-path-style: "false"
  # Secret to store access credentials
  csi.storage.k8s.io/snapshotter-secret-name: linstor-csi-s3-access
  csi.storage.k8s.io/snapshotter-secret-namespace: default

Jenkins deployment persistent volume claim (PVC) is stored as a snapshot in Amazon S3 by using a standard Kubernetes volumeSnapshot definition with LINSTOR’s snapshot class for Amazon S3:

apiVersion: snapshot.storage.k8s.io/v1
kind: VolumeSnapshot
metadata:
  name: jenkins-dr-snapshot-0
spec:
  volumeSnapshotClassName: linstor-csi-snapshot-class-s3
  source:
    persistentVolumeClaimName: <jenkins-pvc-name>

Conclusion

In this post, we explained  the challenges to scale Jenkins for HA and DR. We also reviewed Jenkins storage architecture with Amazon EBS and Amazon EFS and where to apply these. We demonstrated how you can use Amazon EKS to scale Jenkins compute for HA and how AWS partner solutions such as LINBIT LINSTOR can help scale Jenkins storage for HA and DR. Combining both solutions can help organizations maintain their ability to deploy software with speed and agility. We hope you found this post useful as you think through building your CI/CD infrastructure in AWS. To learn more about running Jenkins in Amazon EKS, check out Orchestrate Jenkins Workloads using Dynamic Pod Autoscaling with Amazon EKS. To find out more information about LINBIT’s LINSTOR, check the Jenkins technical guide.

Authors:

James Bland

James is a 25+ year veteran in the IT industry helping organizations from startups to ultra large enterprises achieve their business objectives. He has held various leadership roles in software development, worldwide infrastructure automation, and enterprise architecture. James has been
practicing DevOps long before the term became popularized. He holds a doctorate in computer science with a focus on leveraging machine learning algorithms for scaling systems. In his current role at AWS as the APN Global Tech Lead for DevOps, he works with partners to help shape the future of technology.

Welly Siauw

Welly Siauw is a Sr. Partner Solution Architect at Amazon Web Services (AWS). He spends his day working with customers and partners, solving architectural challenges. He is passionate about service integration and orchestration, serverless and artificial intelligence (AI) and machine learning (ML). He authored several AWS blogs and actively leading AWS Immersion Days and Activation Days. Welly spends his free time tinkering with espresso machine and outdoor hiking.

Matt Kereczman

Matt Kereczman is a Solutions Architect at LINBIT with a long history of Linux System Administration and Linux System Engineering. Matt is a cornerstone in LINBIT’s technical team, and plays an important role in making LINBIT and LINBIT’s customer’s solutions great. Matt was President of the GNU/Linux Club at Northampton Area Community College prior to graduating with Honors from Pennsylvania College of Technology with a BS in Information Security. Open Source Software and Hardware are at the core of most of Matt’s hobbies.