Website defacement occurs when threat actors gain unauthorized access to a website, most commonly a public website, and replace content on the site with their own messages. In this blog post, we show you how to detect website defacement, and then automate both defacement verification and your defacement response by using Amazon CloudWatch Synthetics visual monitoring canaries. Canaries are configurable scripts that run on a schedule and compare screenshots taken during a canary run with screenshots taken during a baseline canary run. If the discrepancy between the two screenshots exceeds a threshold percentage, the canary fails. We will show you how to quickly deploy a maintenance page through AWS WAF after you verify the defacement.
Common causes of defacement include unauthorized access, SQL injection, cross-site scripting (XSS), or malware. You can use AWS services such as AWS WAF, Amazon Route 53, and Amazon GuardDuty to put additional mechanisms in place to help improve your security posture.
Solution overview
The architectural diagram in Figure 1 shows a typical web application where users access the application by using Amazon CloudFront protected by AWS WAF.
Figure 1: Defacement detection and response with CloudWatch Synthetics
As shown in the diagram, the solution consists of two parts: 1) visual monitoring for defacement detection, and 2) automation of the verification and defacement response.
Part 1: Visual monitoring for defacement detection
Defacement detection uses CloudWatch Synthetics visual monitoring canaries to perform visual monitoring. You can create canaries in CloudWatch Synthetics that periodically take a screenshot of the monitored URLs. Because the canaries only need network access to the monitored URLs, you can implement this solution without affecting the application or modifying its code. For more details on how to create CloudWatch Synthetics visual monitoring canaries, see Visual monitoring of applications with Amazon CloudWatch Synthetics.
You can use the CloudWatch Synthetics visual monitoring blueprint to compare screenshots taken during a canary run with screenshots taken during a baseline canary run. This solution is suitable for static a target=”_blank” hrefs where a discrepancy between the two screenshots that exceeds a threshold percentage could indicate a possible defacement attempt, causing the canary to trigger a failure event.
The threshold percentage is defined by the visual variance that occurs when the current screenshot differs from the baseline screenshot that was captured during the first run of the canary. To reduce false positives, you can adjust the threshold for detecting visual variance.
# Setting Threshold to 5%
syntheticsConfiguration.withVisualVarianceThresholdPercentage(5);
Figure 2 shows the first baseline screenshot of a webpage with visual variance set to 5%.
Figure 2: Image taken during a baseline canary run
Figure 3 shows the visual variance of a defaced webpage. In this case, the visual variance was set to 5% in the script, and the visual variance detected was 30.92%.
Figure 3: Failed canary run due to differences from the baseline screenshot
Figure 4 shows a webpage with dynamic content that triggered a false positive because the visual monitoring canary was unable to differentiate between real dynamic content and variation from the baseline. In this case, the visual variance was set to 5% in the script, and the visual variance detected was 5.25%.
Figure 4: Dynamic content in Feedback form that triggered canary failure
You can select the dynamic content to exclude it from the visual comparison for subsequent canary runs. To exclude the dynamic content, edit the baseline screenshot in CloudWatch Synthetics. Using a simple click-drag, you can select the area to exclude from visual comparison for subsequent canary runs, as shown in Figure 5.
Figure 5: Exclusion of dynamic content
If your applications have additional areas with dynamic content, you can select more than one area to exclude from comparison.
Figure 6 shows a successful canary run after exclusion of the area that contains the dynamic content.
Figure 6: Canary succeeded after the exclusion of dynamic content
The following shows the event pattern script in EventBridge. Make sure to update the canary name with the name of the CloudWatch Synthetics visual monitoring canary that you created earlier to serve as the event source.
 // Event patterns in EventBridge to get event source from canary

{
  "source": ["aws.synthetics"],
  "detail-type": ["Synthetics Canary TestRun Failure"],
  "detail": {
    "canary-name": ["<replace-with-canary-name>"]
  }
}
When the event pattern matches the rules that you configured in EventBridge, the Amazon SNS topic triggers the approval flow, as shown in Figure 7. This begins automation of the verification and defacement response, which we describe in the next section.
Figure 7: Amazon SNS topic triggered when the event pattern matches
Part 2: Automation of the verification and defacement response
Figure 8 outlines how to automate the verification and defacement response. When alerts are received upon detection of defacement, the notified team can choose to verify the defacement. This defacement monitor uses CloudWatch Synthetics while maintaining the flexibility to configure and verify threshold settings through manual verification. If you are confident in your thresholds, you can bypass the approval flow and directly block site traffic by using an AWS WAF rule during a defacement attempt.
Figure 8: Defacement detection and response with CloudWatch Synthetics
As shown in the diagram, this is what the traffic flow looks like during a defacement:
The canary from the CloudWatch Synthetics visual monitor identifies defacement through visual variance against the baseline screenshot taken during the first canary run and emits an event.
If the emitted event matches the rules configured in EventBridge, Amazon SNS is triggered. This triggers the subscribed AWS Lambda function that sends a Slack notification with the event details asking for approval.
The notified team receives a Slack message about the defacement and makes an approval decision.
If approval is granted, an AWS WAF rule is added to block traffic and a maintenance page is served to users.
The user that accessed the origin is shown a maintenance page served by AWS WAF.
Although this example shows the use of Slack as an approval mechanism, you can use the communication mechanism of your choice.
Conclusion
In this post, you learned how to use CloudWatch Synthetics to monitor for defacement and display a maintenance page through AWS WAF and CloudFront while you work on recovering the service. You also learned how to use manual approval to identify the optimal threshold and exclude the area that contains dynamic content to reduce false positives.
Although most web applications already use CloudFront and AWS WAF, you can integrate this solution to your existing environment without affecting the application or modifying its code. This solution helps detect potential defacement, providing you with an additional layer of protection for your environment.
We recommend that you explore the capabilities of CloudWatch Synthetics monitoring to detect and use the capabilities of the cloud through services such as EventBridge, Amazon SNS, and Lambda to enable automation. This can help you proactively protect your application against defacement attempts.
If you have feedback about this post, submit comments in the Comments section below. If you have questions about this post, contact AWS Support.
Generative artificial intelligence (AI) is now a household topic and popular across various public applications. Users enter prompts to get answers to questions, write code, create images, improve their writing, and synthesize information. As people become familiar with generative AI, businesses are looking for ways to apply these concepts to their enterprise use cases in a simple, scalable, and cost-effective way. These same needs are shared by a variety of security stakeholders. For example, if security directors want to summarize their security posture in natural language, a security architect will need to triage alerts or findings and investigate AWS CloudTrail logs to identify high priority remediation actions or detect potential threat actors by identifying potentially malicious activity. There are many ways to deploy solutions for these use cases.
In this blog post, we review a fully serverless solution for querying data stored in Amazon Security Lake using natural language (human language) with Amazon Q in QuickSight. This solution has multiple use cases, such as generating visualizations and querying vulnerability information for vulnerability management using tools such as Amazon Inspector that feed into AWS Security Hub. The solution helps reduce the time from detection to investigation by using natural language to query CloudTrail logs and Amazon Virtual Private Cloud (VPC) Flow Logs, resulting in quicker response to threats in your environment.
Amazon Security Lake is a fully managed security data lake service that automatically centralizes security data from AWS environments, software as a service (SaaS) providers, and on-premises and cloud sources into a purpose-built data lake that’s stored in your AWS account. The data lake is backed by Amazon Simple Storage Service (Amazon S3) buckets, and you retain ownership over your data. Security Lake converts ingested data into Apache Parquet format and a standard open source schema called the Open Cybersecurity Schema Framework (OCSF). With OCSF support, Security Lake normalizes and combines security data from AWS and a broad range of enterprise security data sources.
Amazon QuickSight is a cloud-scale business intelligence (BI) service that delivers insights to stakeholders, wherever they are. QuickSight connects to your data in the cloud and combines data from a variety of different sources. With QuickSight, users can meet varying analytic needs from the same source of truth through interactive dashboards, reports, natural language queries, and embedded analytics. With Amazon Q in QuickSight, business analysts and users can use natural language to build, discover, and share meaningful insights.
The recent announcements for Amazon Q in QuickSight, Security Lake, and the OCSF present a unique opportunity to apply generative AI to fully managed hybrid multi-cloud security related logs and findings from over 100 independent software vendors and partners.
Solution overview
The solution uses Security Lake as the data lake which has native ingestion for CloudTrail, VPC Flow Logs, and Security Hub findings as shown in Figure 1. Logs from these sources are sent to S3 buckets in your AWS account and are maintained by Security Lake. We then create Amazon Athena views from tables created by Security Lake for Security Hub findings, CloudTrail logs, and VPC Flow Logs to define the interesting fields from each of the log sources. Each of these views are ingested into a QuickSight dataset. From these datasets, we generate analyses and dashboards. We use Amazon Q topics to label columns in the dataset that are human-readable and create a named entity to present contextual and multi-visual answers in response to questions. After the topics are created, users can perform their analysis using Q topics, QuickSight analyses, or QuickSight dashboards.
Figure 1: Solution architecture
You can use the rollup AWS Region feature in Security Lake to aggregate logs from multiple Regions into a single Region. Specifying a rollup Region can help you adhere to regional compliance requirements. If you use rollup Regions, you must set up the solution described in this post for datasets only in rollup Regions. If you don’t use a rollup Region, you must deploy this solution for each Region you that want to collect data from.
Prerequisites
To implement the solution described in this post, you must meet the following requirements:
Basic understanding of Security Lake, Athena, and QuickSight.
Security Lake is already deployed and accepting CloudTrail management events, VPC Flow Logs, and Security Hub findings as sources. If you haven’t deployed Security Lake yet, we recommend following the best practices established in the security reference architecture.
This solution uses Security Lake data source version 2 to create the dashboards and visualizations. If you aren’t already using data source version 2, you will see a banner in your Security Lake console with instructions to update.
An existing QuickSight deployment that will be used to visualize Security Lake data or an account that is able to sign up for QuickSight to create visualizations.
QuickSight Author Pro and Reader Pro licenses are needed for using Amazon Q features in QuickSight. Non-pro Authors and Readers can still access Q topics if an Author Pro or Admin Pro user shares the topic with them. Non-pro Authors and Readers can also access data stories if a Reader Pro, Author Pro, or Admin Pro shares one with them. Review Generative AI features supported by each QuickSight licensing tiers.
In the following section, we walk through the steps to ingest Security Lake data into QuickSight using Athena views and then using Amazon Q in QuickSight to create visualizations and query data using natural language.
Provide cross-account query access
In alignment with our security reference architecture, it’s a best practice to isolate the Security Lake account from the accounts that are running the visualization and querying workloads. It’s recommended that QuickSight for security use cases be deployed in the security tooling account. See How to visualize Amazon Security Lake findings with Amazon QuickSight for information on how to set up cross-account query access. Follow the steps in the Configure a Security Lake subscriber section and configure Athena to visualize your data section.
When you get to the create resource link steps, create a resource link for data source version 2 for Security Hub, CloudTrail, and VPC flow log tables for a total of three resource links. The way to identify data source version 2 tables is by their name; it ends in _2_0. For example:
For the remainder of this post, we will be referencing the database name security_lake_visualization and the resource link names for Security Hub findings, CloudTrail logs, and VPC Flow Logs respectively, as shown in Figure 2:
We will call the QuickSight account the visualization account. If you plan to use same account as the Security Lake delegated administrator and QuickSight, then skip this step and go to the next section where you will create views in Athena.
Create views in Athena
A view in Athena is a logical table that helps simplify your queries by working with only a subset of the relevant data. Follow these steps to create three views in Athena, one each for Security Hub findings, CloudTrail logs, and the VPC Flow Logs in the visualization account.
These queries default to the previous week’s data starting from the previous day, but you can change the time frame by modifying the last line in the query from 8 to the number of days you prefer. Keep in mind that there is a limitation on the size of each SPICE table of 1 TB. If you want to limit the volume of data, you can delete the rows that you find unnecessary. We included the fields customers have identified as relevant to reduce the burden of writing the parsing details yourself.
To create views:
Sign in to the AWS Management Console in the visualization account and navigate to the Athena console.
If a Security Lake rollup Region is used, select the rollup Region.
Choose Launch Query Editor.
If this is the first time you’re using Athena, you will need to choose a bucket to store your query results.
Choose Edit Settings.
Choose Browse S3.
Search for your bucket name.
Select the radio button next to the name of your bucket.
Select Choose.
For Data Source, select AWSDataCatalog.
Select Database as security_lake_visualization. If you used a different name for the database for cross account query access, then select that database.
Figure 3: Athena database selection
Copy the query for the security_hub_view from the GitHub repo for this post. If you’re using a different name for the database and table resource link than the one specified in this post, edit the FROM statement at the bottom of the query to reflect the correct names.
Paste the query in the query editor and then choose Run. The name of the view is set in the first line of the query which is security_insights_security_hub_vw2.
To confirm this view was created correctly, choose the three dots next to the view that was created and select Preview View.
Figure 4: Previewing the view
Repeat steps 5–9 to create the CloudTrail and VPC Flow Logs views. The queries for each can be found in the GitHub repo.
Figure 5: Athena views
Create QuickSight dataset
Now that you’ve created the views, use Athena as the data source to create a dataset in QuickSight. Repeat these steps for the Security Hub findings, CloudTrail logs, and VPC Flow Logs. Start by creating a dataset for the Security Hub findings.
To configure permissions on tables:
Sign in to the QuickSight console in the visualization account. If a Security Lake rollup Region is used, select the rollup Region.
Although there are multiple ways to sign in to QuickSight, we used IAM based access to build the dashboards. To use QuickSight with Athena and Lake Formation, you first need to authorize connections through Lake Formation.
When using a cross-account configuration with AWS Glue Data Catalog, you need to configure permissions on tables that are shared through Lake Formation. For the use case in this post, use the following steps to grant access on the cross-account tables in the Glue Catalog. You must perform these steps for each of the Security Hub, CloudTrail, and VPC Flow Logs tables that you created in the preceding cross-account query access section. Because granting permissions on a resource link doesn’t grant permissions on the target (linked) database or table, you will grant permission twice, once to the target (linked table) and then to the resource link.
In the Lake Formation console, navigate to the Tables section and select the resource link for the Security Hub table. For example:
Select Actions. Under Permissions, select Grant on target.
For the next step, you need the Amazon Resource Name (ARN) of the QuickSight users or groups that need access to the table. To obtain the ARN through the AWS Command Line Interface (AWS CLI), run following commands (replacing account ID and Region with that of the visualization account.) You can use AWS CloudShell for this purpose.
After you have the ARN of the user or group, copy it and go back to the LakeFormation console Grant on Target page. For Principals, select SAML users and groups, and then add the QuickSight user’s ARN.
Figure 6: Selecting principals
For LF-Tags or catalog resources, keep the default settings.
Figure 7: Table grant on target permissions
For Table permissions, select Select for both Table Permissions and Grantable Permissions, and then choose Grant.
Figure 8: Selecting table permissions
Navigate back to the Tables section and select the resource link for the Security Hub table. For example:
Select Actions. This time under Permissions, and then choose Grant.
For Principals, select SAML users and groups, and then add the QuickSight user’s ARN captured earlier.
For the LF-Tags or catalog resources section, use the default settings.
For Resource link permissions choose Describe for both Table Permissions and Grantable Permissions.
Repeat steps a–k for the CloudTrail and VPC Flow Logs resource links.
To create datasets from views:
After permissions are in place, you create three datasets from the views created earlier. Because both Quicksight and Lake Formation are Regional services, verify that you’re using QuickSight in the same Region where Lake Formation is sharing the data. The simplest way to determine your Region is to check the QuickSight URL in your web browser. The Region will be at the beginning of the URL, such as us-east-1. To change the Region, select the settings icon in the top right of the QuickSight screen and select the correct Region from the list of available Regions in the drop-down menu.
Navigate back to the QuickSight console.
Select Datasets, and then choose New dataset.
Select Athena from the list of available data sources.
Enter a Data source name, for example security_lake_securityhub_dataset and leave the Athena workgroup as [primary]. Choose Create data source.
At the Choose your table prompt, for Catalog, select AwsDataCatalog. For Database, select security_lake_visualization. If you used a different name for the database for cross-account query access, then select that database. For Tables, select the view name security_insights_security_hub_vw2 to build your dashboards for Security Hub findings. Then choose Select.
Figure 9: Choose a table during QuickSight dataset creation
At the Finish dataset creation prompt, select Import to SPICE for quicker analytics. Choose Visualize. This will create a new dataset in QuickSight using the name of the Athena view, which is security_insights_security_hub_vw2. You will be taken to the Analysis page, exit out of it.
Go back to the QuickSight console and repeat steps 3–8 for the CloudTrail and VPC Flow Log datasets.
Create a topic
Now that you have created a dataset, you can create a topic. Q topics are collections of one or more datasets that represent a subject area for your business users to ask questions. Topics allow users to ask questions in natural language and to build visualizations using natural language.
To create a Q topic:
Navigate to the QuickSight console.
Choose Topics in the left navigation pane.
Figure 10: QuickSight navigation pane
Choose New topic. Create one topic each for the Security Hub findings, CloudTrail logs, and VPC Flow Logs
Figure 11: QuickSight topic creation
On the New topic page, do the following:
For Topic name, enter a descriptive name for the topic. Name the first one SecurityHubTopic. Your business users will identify the topic by this name and use it to ask questions.
For Description, enter a description for the topic. Your users can use this description to get more details about the topic.
Choose Continue.
On the Add data to topic page, choose the dataset you created in the Create a QuickSight dataset section. Start with the Security Hub dataset security_insights_security_hub_vw2.
Choose Continue. It will take a few minutes to create the topic.
Now that your topic has been created, navigate to the Data tab of the topic.
Your Data Fields sub-tab should be selected already. If not, choose Data Fields.
Figure 12: Topics data fields
For each of the fields in the list, turn on Include to make sure that all fields are included. For this example, we selected all fields, but you can adjust the included columns as needed for your use case. Note, you might see a banner at the top of the page indicating that the indexing is in progress. Depending on the size of your data, it might take some time for Q to make those fields available for querying. Most of the time, indexing is complete in less than 15 minutes.
Review the Synonyms column. These alternate representations of your column name are automatically generated by Amazon Q. You can add and remove synonyms as needed for your use case.
At this point, you’re ready to ask questions about your data using Amazon Q in QuickSight. Choose Ask a question about SecurityHubTopic at the top of the page.
Figure 13: Ask questions using Q
You can now ask questions about Security Hub findings in the prompt. Enter Show me findings with compliance status failed along with control id.
Figure 14: Q answers
Under the question, you will see how it was interpreted by QuickSight.
Repeat steps 1–13 to create CloudTrail and VPC Flow Log QuickSight topics.
Create named entities for your topics
Now that you’ve created your topics, you will now add named entities. Named entities are optional, but we’re using them in the solution to help make queries more effective. The information contained in named entities, the ordering of fields, and their ranking make it possible to present contextual, multi-visual answers in response to even vague questions.
To create a named entity:
In the QuickSight console, navigate to Topics.
Select the Security Hub topic that you created in the previous section.
Under the Data tab, select the Named Entity subtab, and choose Add Named Entity.
Figure 15: Named entity subtab
Enter Security Findings as the entity name.
Select the following datafields: Status, Metadata Product Name, Finding Info Title, Region, Severity, Cloud Account Uid, Time Dt, Compliance Status, and AccountId. The order of the fields helps Q to prioritize the data, so rearrange your data fields as needed.
Choose Save in the top right corner to save your results.
Repeat steps 1–6 with the CloudTrail dataset using the following datafields: API operation, Time Dt, Region, Status, AccountId, API Response Error, Actor User Credential Uid, Actor User Name, Actor User Type, Api Service Name, Actor Idp Name, Cloud Provider, Session Issuer, and Unmapped.
Figure 17: CloudTrail named entity creation
Repeat steps 1–6 with the VPC Flow Log dataset using the following datafields: Src Endpoint IP, Src Endpoint Port, Dst Endpoint IP, Dst Endpoint Port, Connection Info Direction, Traffic Bytes, Action, Accountid, Time Dt, and Region.
Figure 18: VPC Flow log named entity creation
Create visualizations using natural language
After your topic is done indexing, you can start creating visualizations using natural language. In QuickSight, an analysis is the same thing as a dashboard, but is only accessible by the authors. You can keep it private and make it as robust and detailed as you want. When you decide to publish it, the shared version is called a dashboard.
To create visualizations:
Open the QuickSight console and navigate to the Analysis tab.
In the top right, select New analysis.
Select the dataset you created previously, it will have the same naming convention as the Athena view. For reference, the Athena view query created a Security Hub dataset called security_insights_security_hub_vw2.
Validate the information about the data set you’re going to use in the analysis and choose USE IN ANALYSIS.
On the pop up, select the interactive sheet option and choose Create.
For datasets that have a corresponding Q topic, which you created in a previous step, choose Build visual at the top of the screen.
Figure 19: Build visual using natural language
Enter your prompt and choose BUILD. For example, enter findings with product security hub group by control id include count. Q automatically generates a visualization.
Figure 20: Q response
To add to your dashboard, choose ADD TO ANALYSIS to see your new visualization module in your current analysis.
The supplied questions are targeted towards a Security Hub findings topic, where you can ask questions about your security hub findings data. For example, show all Security Hub findings for critical severity for a specific resource or ARN.
If you use Amazon Inspector for software vulnerability management and you want to monitor top common vulnerabilities and exposures (CVEs) affecting your organization, choose Build visual and enter show all ACTIVE findings with product inspector group by Title add count in the prompt. We used the keyword ACTIVE because ACTIVE is a finding state in Security Hub that indicates the finding is still active as per the finding source and Amazon Inspector has not closed the finding yet. If Amazon Inspector has closed the finding, the finding will have a state of ARCHIVED.
Figure 21: Q Response for an Amazon Inspector findings question
To add the remaining datasets, which allows you to visualize data from multiple datasets in a single view, select the dropdown in the left navigation under Dataset.
Select Add a new dataset.
Search the name of the remaining datasets you created previously.
Select anywhere on the name of the dataset to make the radial button blue for the single dataset you want to add. Choose Select.
Repeat steps 7–12 in this section to add all the corresponding datasets you created previously.
Note: When you add additional datasets to the same Analysis and use Build visual to generate visualizations using natural language, the corresponding datasets with Q Topics are populated in the drop down under the prompt. Be sure to choose the correct dataset when asking questions.
Figure 22: Choosing a QuickSight dataset
To create dashboards:
After you’ve created the visual and are ready to publish the analysis as a dashboard, select PUBLISH in the top right corner.
Enter a name for your dashboard.
Choose Publish Dashboard.
After your dashboard is published, your users can ask questions about the data through the dashboard as well. This dashboard can be shared with other users. Users with QuickSight Reader Pro licenses can ask questions using Amazon Q.
To ask questions using the dashboard:
Navigate to the Dashboards section on the left navigation.
Select the dashboard you previously published.
Select Ask a question about [Topic Name] at the top of the screen. A module will open from the side of your screen. Questions can only be addressed to a single topic. To change the topic, select the name of the topic and a drop-down will appear. Select the name of the current topic to see other options and select the topic you want to ask a question about. For this example, select CloudTrailTopic.
Figure 23: Selecting a topic
Enter a question in the prompt. For this example, enter show top API operations in the last 24 hours with accessdenied.
Figure 24: CloudTrail question 1
Enter show all activity by user johndoe in the last 3 days.
Figure 25: CloudTrail question 2
Q will automatically build a small dashboard based on the questions provided.
Now change the topic to VPCFlowTopic as described in step 3.
Enter show me the top 5 dst ip by bytes for outbound traffic with dst port 443.
Figure 26: VPC Flow Log question
You can build executive summaries using QuickSight data stories, which also use generative AI. Data stories use Amazon Q prompts and visuals to produce a draft that incorporates the details that you provide. For example, you can create a data story about how a specific CVE affects your organization by asking Q questions, then add visuals from analyses you already created.
Conclusion
In this blog post, you learned how to use generative AI for your security use cases. We showed you how to use cross-account query access to allow a QuickSight visualization account to subscribe to Security Lake data for Security Hub findings, CloudTrail logs, and VPC Flow Logs. We then provided instructions for creating, Athena views, QuickSight datasets, Q topics, named entities, and for using natural language to build dashboards and query your data. You can customize the Athena views to create, update, or delete columns and column names as needed for your use case. You can also customize the Q topics and named entities to use naming conventions and structure responses based on your organization’s needs.
If you have feedback about this post, submit comments in the Comments section below. If you have questions about this post, contact AWS Support.
Developing secure products and services is imperative for organizations that are looking to strengthen operational resilience and build customer trust. However, system design often prioritizes performance, functionality, and user experience over security. This approach can lead to vulnerabilities across the supply chain.
As security threats continue to evolve, the concept of Secure by Design (SbD) is gaining importance in the effort to mitigate vulnerabilities early, minimize risks, and recognize security as a core business requirement. We’re excited to share a whitepaper we recently authored with SANS Institute called Building Security from the Ground up with Secure by Design, which addresses SbD strategy and explores the effects of SbD implementations.
The whitepaper contains context and analysis that can help you take a proactive approach to product development that facilitates foundational security. Key considerations include the following:
Integrating SbD into the software development lifecycle (SDLC)
Supporting SbD with automation
Reinforcing defense-in-depth
Applying SbD to artificial intelligence (AI)
Identifying threats in the design phase with threat modeling
Using SbD to simplify compliance with requirements and standards
Planning for the short and long term
Establishing a culture of security
While the journey to a Secure by Design approach is an iterative process that is different for every organization, the whitepaper details five key action items that can help set you on the right path. We encourage you to download the whitepaper and gain insight into how you can build secure products with a multi-layered strategy that meaningfully improves your technical and business outcomes. We look forward to your feedback and to continuing the journey together.
Zabbix plays a crucial role in monitoring all kinds of “things” – IoT devices,domains, cloud infrastructures and more. It can also be integrated with third-party solutions – for example, with Oxidized for configuration backup monitoring. Given the nature of Zabbix, it usually contains a lot of confidential information as well as (more importantly) some kind of elevated access to network elements while being used by operators, engineers, and customers. This requires that Zabbix as a product should be as secure as possible.
Zabbix has upped their security game and is actively working with HackerOne to take full advantage of the reach of their global community by providing a bug bounty program. And though it doesn’t happen too often, from time to time a security issue arises in Zabbix or one of its dependencies, warranting the release of a Security Advisory.
Table of Contents
The issue
Zabbix typically releases a Security Advisory and might even assign a CVE to the issue. Cool, that is what we expect from reputable software developers. They even inform their customers with support contracts before publishing the advisory, in order to allow them to patch installations beforehand.
Unfortunately, if you don’t have a support contract you’re expected to find out about these security advisories on your own, either by monitoring the Security Advisory page or by monitoring the published CVEs for Zabbix. NIST has a public API that can be used and that works well, but the issue with CVE’s is that they are often incomplete and thus useless. For example, CVE-2024-22119 contains far less information than the advisory.
Currently, Zabbix does not publish an API for their Security Advisories. There is the public tracker which contains all entries and can be queried via API, but because it is unstructured text, it is really hard to parse.
The solution
We want to automatically be notified of new security advisories, and the only data source that contains all data in a structured way is the Zabbix Security Advisory page. However, structured doesn’t mean easily parseable – in fact, it is just raw HTML. We could try to solve this issue in Zabbix, but the easier solution in this case is to scrape the page and generate a JSON file which then can be parsed by Zabbix to achieve our goal, which is automated notifications of new advisories.
Webscraping
We’ve chosen to scrape the Zabbix site using Rust, utilizing the Scraper crate to parse the HTML and flesh out the relevant parts we want. Without going into too much detail, the interesting information is stored in 2 tables, one with the table-simple class applied and one with the table-vertical class applied. Using CSS selectors (which is what the Scraper crate requires), we can retrieve the information we want.
This information is then stored in a struct, which gets added to a hashmap. The result is stored in a vector, which is added to a struct, which eventually is used to generate the JSON we require. Phew.
The ‘reports’ array contains one entry per advisory, and each entry has the following layout. Unsurprisingly, this closely matches the information that is available on the Zabbix Security Advisory page:
Now, we could provide you with the code of the scraping tool and wish you good luck with making sure the tool runs every X hours and somehow, somewhere stores the resulting JSON for Zabbix to parse. That would be the easy way out, right?
Instead, we’ve chosen to host the Rust program as an AWS Lambda function, triggered every 2 hours by the AWS EventBridge Scheduler and with some code added to the Rust program (function?) to upload the resulting JSON to an AWS S3 bucket. This chain of AWS products not only makes sure that our cloud bill increases, but also guarantees we don’t have to host (and maintain!) anything ourselves.
Now that the data is available in JSON, it’s fairly easy to parse it using Zabbix. Using the HTTP Agent data collection, we download the JSON from AWS. The URI is stored in the {$ZBX_ADVISORY_URI} macro, which allows for easy modification. By default, it points to the JSON file hosted on AWS S3. This retrieval is done by the Retrieve the Zabbix Security Advisories item, which acts as the source for every other operation. It retrieves the JSON every hour, and with the JSON being generated every 2 hours, the maximum delay between Zabbix publishing a new advisory and you getting it into Zabbix is 3 hours.
The retrieve the Zabbix Security Advisories item acts as a master item for the Last Updated item. This item uses a JSONPath preprocessing step to flesh out the information we want: $.last_updated.secs. The resulting data is stored as unixtime so that we mere mortals can easily read when the last update of the JSON file was performed.
A trigger is configured for this item to ensure that the JSON file isn’t too old. The trigger JSON Feed is out of date has the following expression: last(/Zabbix Security Advisories/zbx_sec.last_updated)>{$ZBX_ADVISORY_UPDATE_INTERVAL}*{$ZBX_ADVISORY_UPDATE_THRESHOLD}
By default, {$ZBX_ADVISORY_UPDATE_INTERVAL} is set to 2 hours (which is the interval the file gets updated by our tool) and {$ZBX_ADVISORY_UPDATE_THRESHOLD} is set to 3. So, when the JSON file hasn’t been updated within the last 6 hours, this trigger will trigger.
The item Number of advisories uses the same principle, where a JSONPath preprocessing step is used to flesh out the information we want: $.reports. However, as $.reports is an array, we can use functions on it. In this case .length(), which returns an integer. This number is used in the associated trigger A new Zabbix Security Advisory has been published, which simply triggers when the value changes.
This is all very cool, but the JSON has a lot more information, including details about each report. In order to get these details into Zabbix, we use a discovery rule to ‘loop’ through the JSON and create items based on what we’ve discovered: Discover Advisories. This rule uses (again) a JSONPath preprocessing step to get the details we want: $.reports[*][*]. Based on the resulting data (which is a single report in this case), 2 LLD Macros are assigned: {#ZBXREF} – based on the JSONpath $.zbxref and {{#CVEREF} – based on the JSONpath $.cveref.
For each discovered report, 8 items are created. They all work using the same principle, so I will only describe one: Advisory {#ZBXREF} / {#CVEREF} – Acknowledgement. This item uses the master item Zabbix Security Advisories, just like all other items described so far. JSONPath is once again used to get the information we want. The expression $.reports[*][“{#ZBXREF}”].acknowledgement.first() provides exactly what we need, where we combine a LLD macro ({#ZBXREF}) and a JSONpath function (.first()) to first ‘select’ the correct advisory in the JSON and then retrieve the value.
All other 7 items work like this, and there is only one exception: Advisory {#ZBXREF} / {#CVEREF} – Components. The ‘components’ value in the JSON file is actually an array with 1 or more items, describing which components might be affected. But we cannot store arrays in Zabbix, so we use another preprocessing step to convert the array into a string. A few lines of Javascript is all we need:
First, we parse the JSON input (‘value’) into an array, only to apply the javascript .toString() function on it. The toString method of arrays calls join() internally, which joins the array and returns one string containing each array element separated by commas, which is exactly what we want: a string, separated by commas.
To make working with these advisories easier, each item has the componenttag applied, with the value zabbix_security. If the item belongs to an advisory, the advisory tag is added with the value of {#ZBXREF} (which is the advisory number/name). That way, we can easily filter on all Zabbix Security items, filter on all items for a single advisory, and (to make things even better) the type tag is also applied, with the actual type being ‘workaround’ or ‘description.’ This allows for filtering on all Zabbix Security items, of the type ‘score’ (et cetera) to easily gain insight into the different advisories and their score, synopsis, description, components, et cetera.
Dashboard
The tags on the items allow for filtering, but with Zabbix 7.0 we can use all great new nifty features, such as the Item Navigator widget combined with the Item Value widget. Let’s take a look at what configuring such a dashboard might look like if you set up the Item Navigator widget as follows:
And then ‘link’ the Item Value widget to it:
You should get a somewhat decent dashboard. It isn’t perfect (given that the Item Value widget only seems to be able to display a single line of text) but it’s something.
Disclaimer
Though we use this functionality ourselves, this all comes without any guarantee. The technology used to retrieve data (screen scraping) is mediocre at best and could break at any moment if and when Zabbix changes the layout of their page.
The Agence du Numérique en Santé (ANS), the French governmental agency for health, introduced the HDS certification to strengthen the security and protection of personal health data. By achieving this certification, AWS demonstrates our continuous commitment to adhere to the heightened expectations for cloud service providers.
The following 24 Regions are in scope for this certification:
US East (N. Virginia)
US East (Ohio)
US West (N. California)
US West (Oregon)
Asia Pacific (Hong Kong)
Asia Pacific (Hyderabad)
Asia Pacific (Jakarta)
Asia Pacific (Mumbai)
Asia Pacific (Osaka)
Asia Pacific (Seoul)
Asia Pacific (Singapore)
Asia Pacific (Sydney)
Asia Pacific (Tokyo)
Canada (Central)
Europe (Frankfurt)
Europe (Ireland)
Europe (London)
Europe (Milan)
Europe (Paris)
Europe (Stockholm)
Europe (Zurich)
Middle East (UAE)
Israel (Tel Aviv)
South America (São Paulo)
The HDS certification demonstrates that AWS provides a framework for technical and governance measures to secure and protect personal health data according to HDS requirements. Our customers who handle personal health data can continue to manage their workloads in HDS-certified Regions with confidence.
For up-to-date information, including when additional Regions are added, visit the AWS Compliance Programs page and choose HDS.
AWS strives to continuously meet your architectural and regulatory needs. If you have questions or feedback about HDS compliance, reach out to your AWS account team.
To learn more about our compliance and security programs, see AWS Compliance Programs. As always, we value your feedback and questions; reach out to the AWS Compliance team through the Contact Us page.
If you have feedback about this post, submit comments in the Comments section below.
As the Vice President of Compliance and Policy at fTLD Registry Services, Heather Diaz is a security expert with over a decade of experience in ensuring the legal, compliance, and strategic alignment of the top-level domains .Bank and .Insurance. She is a compliance and ethics professional and leads the policy and security compliance functions at fTLD.
We sat down with her to learn more about how Zabbix makes her job easier, why she appreciates the inherent flexibility of our solutions, and how she works with our team to help make sure fTLD’s domains are as secure as they can possibly be.
Can you give us a bit of background on fTLD and what it does? What makes your business proposition stand out?
fTLD Registry is the domain authority for .Bank and .Insurance – the most trusted and exclusive domain extensions for banks, insurers, and producers. Our mission is to offer these industry-created and governed domains a shield against cyberattacks and fraud, delivering peace of mind with website and email security.
Since 2011, fTLD Registry has collaborated with experts in cybersecurity, domain security, and the banking and insurance sectors to develop Security Requirements that mitigate cyber threats such as phishing, spoofing, cybersquatting, and man-in-the-middle attacks.
Why is monitoring especially important for fTLD?
Security monitoring is a key value for .Bankers (banks who have switched to .Bank) and our .Insurance customers as well. They receive reporting from our customized Zabbix monitoring system whenever security vulnerabilities are detected. This ensures we provide proactive compliance security monitoring, which allows them to address any findings and keep their .Bank and .Insurance websites and email channels secure.
Are there any specific points you were looking to address with a new monitoring approach?
fTLD has continued to enhance our security requirements for .Bank and .Insurance to address new and evolving cybersecurity threats and provide more secure and trusted online interactions for the financial services sector and their customers. We do this by partnering with Zabbix’s security experts and engineers to make sure our security requirements and monitoring continue to provide best-in-class domain security for .Bank and .Insurance.
Can you please share any business or operational areas that have seen improvements since implementing Zabbix?
Our compliance area has enjoyed having time to engage with .Bank and .Insurance customers to educate them about how to address any security vulnerabilities, as the Zabbix system takes care of sending notifications and warnings to our customers. Not only that, the Zabbix system gives us a dashboard with easy-to-interpret metrics, the ability to generate ad-hoc reporting, and with a number of important data elements integrated, such as customer contact information and their domain status (e.g., live), so our team can always have secure employee access to security monitoring data no matter where in the world we are working. Here are just some of the external interfaces, Agent2 plugins, and custom notifications we developed together with the Zabbix team.
External interfaces:
ICANN CZDS (to get a list of zones)
Whois (to get zone and registrar details)
CRM (to get a list of verification contacts)
Marketing system (to get a list of additional zone details)
Certificate plugin (to validate TLS ciphers and certificates)
Port check plugin (to check what ports are open and verify the security of opened ports)
DMARC/SPF plugin (to check presence and validity of DMARC and SPF records)
Web redirect plugin (to check validity of HTTP headers and redirects)
Notifications
Media types to send compliance reports
Is there anything else you’d like to share about Zabbix and our capabilities?
Zabbix is a great partner for security monitoring, as they’re willing to develop new features to provide a service that meets our exacting business requirements and their support is highly responsive. Most solutions come as they are. With Zabbix, we were able to customize and adapt their solution when new needs came up. My favorite feature is how we provide automated reporting to our customers and key stakeholders – it’s all automated and handled by the Zabbix platform.
Amazon Simple Storage Service (Amazon S3) is a widely used object storage service known for its scalability, availability, durability, security, and performance. When sharing data between organizations, customers need to treat incoming data as untrusted and assess it for malicious files before ingesting it into their downstream processes. This traditionally requires setting up secure staging buckets, deploying third-party anti-virus and anti-malware scanning software, and managing a complex data pipeline and processing architecture.
To address the need for malware protection in Amazon S3, Amazon Web Services (AWS) has launched Amazon GuardDuty Malware Protection for Amazon S3. This new feature provides malicious object scanning for objects uploaded to S3 buckets, using multiple AWS-developed and industry-leading third-party malware scanning engines. It eliminates the need for customers to manage their own isolated data pipelines, compute infrastructure, and anti-virus software across accounts and AWS Regions, providing malware detection without compromising the scale, latency, and resiliency of S3 usage.
In this blog post, we share a solution that uses Amazon EventBridge, AWS Lambda, and Amazon S3 to copy scanned S3 objects to a destination S3 bucket. EventBridge is a serverless event bus that you can use to build event-driven architectures and automate your business workflows. In this solution, we allow events to be invoked from an object that is being placed in an S3 bucket. The events can be processed by a serverless function in Lambda to invoke a malware scan. We then show you how to extend this solution for other use cases specific to your organization.
Feature overview
GuardDuty Malware Protection for Amazon S3 provides a malware and anti-virus detection service for new objects uploaded to an S3 bucket. Malware Protection for S3 is enabled from within the AWS Management Console for GuardDuty and GuardDuty threat detection is not required to be enabled to use this feature. If GuardDuty threat detection is enabled, security findings for detected malware are also sent to GuardDuty. This allows customer development or application teams and security teams to work together and oversee malware protection for S3 buckets throughout the organization.
When your AWS account has GuardDuty enabled in an AWS Region, your account is associated to a unique regional entity called a detector ID. All findings that GuardDuty generates and API operations that are performed are associated with this detector ID. If you don’t want to use GuardDuty with your AWS account, Malware Protection for S3 is available as an independent feature. Used independently, Malware Protection for S3 will not create an associated detector ID.
When a malware scan identifies a potentially malicious object and you don’t have a detector ID, no GuardDuty finding will be generated in your AWS account. GuardDuty will publish the malware scan results to your default EventBridge event bus and metrics to an Amazon CloudWatch namespace for you to use for automating additional tasks.
GuardDuty manages error handling and reprocessing of event creation and publication as needed to make sure that each object is properly evaluated before being accessed by downstream resources. GuardDuty supports configuring Amazon S3 object tagging actions to be performed throughout the process.
Figure 1 shows the high-level overview of the S3 object scanning process.
Figure 1: S3 object scanning process
The object scanning process is the following:
An object is uploaded to an S3 bucket that has been configured for malware detection. If the object is uploaded as a multi-part upload, then a new object notification will be generated on completion of the upload.
The malware scan service receives a notification that a new object has been detected in the bucket.
The malware scan service downloads the object by using AWS PrivateLink. This will be automatically created when malware detection is enabled on an S3 bucket. No additional configuration is required.
The malware detection service then reads, decrypts, and scans this object in an isolated VPC with no internet access within the GuardDuty service account. Encryption at rest is used for customer data that is scanned during this process. After the malware detection scan is complete, the object is deleted from the malware scanning environment.
The malware scan result event is sent to the EventBridge default event bus in your AWS account and Region where malware detection has been enabled. When malware is detected, an EventBridge notification is generated that includes details of which S3 object was flagged as malicious and supporting information such as the malware variant and known use cases for the malicious software.
Scan metrics such as number of objects scanned and bytes scanned are sent to Amazon CloudWatch.
If malware is detected, the service sends a finding to the GuardDuty detector ID in the current Region.
If you have configured object tagging, GuardDuty adds a predefined tag with key GuardDutyMalwareScanStatus and a potential scan result value of your scanned S3 object.
IAM permissions
Enabling and using GuardDuty Malware Protection for S3 requires you to add AWS Identity and Access Manager (IAM) role permissions and a specific trust policy for GuardDuty to perform the malware scan on your behalf. GuardDuty provides you flexibility to enable this feature for your entire bucket, or limit the scope of the malware scan to specific object prefixes where GuardDuty scans each uploaded object that starts with up to five selected prefixes.
To allow GuardDuty Malware Protection for S3 to scan and add tags to your S3 objects, you need an IAM role that includes permissions to perform the following tasks:
A trust policy to allow Malware Protection to assume the IAM role.
Allow EventBridge actions to create and manage the EventBridge managed rule to allow Malware Protection for S3 to listen to your S3 object notifications.
Allow Amazon S3 and EventBridge actions to send notification to EventBridge for events in the S3 bucket.
Allow Amazon S3 actions to access the uploaded S3 object and add a predefined tag GuardDutyMalwareScanStatus to the scanned S3 object.
If you’re encrypting S3 buckets with AWS Key Management System (AWS KMS) keys, you must allow AWS KMS key actions to access the object before scanning and putting a test object in S3 buckets with the supported encryption.
This IAM policy is required each time you enable Malware Protection for S3 for a new bucket in your account. Alternatively, update an existing IAM PassRole policy to include the details of another S3 bucket resource each time you enable Malware Protection. See the AWS documentation for example policies and permissions required.
The example S3 bucket policy in the AWS GuardDuty user guide stops anyone other than the GuardDuty Malware scan service principal from reading objects from the specific S3 bucket that aren’t tagged GuardDutyMalwareScanStatus with a value NO_THREATS_FOUND. The policy also helps prevent other roles or users other than GuardDuty from adding the GuardDutyMalwareScanStatus tag.
Configure optional access for other IAM roles that are allowed to override the GuardDutyMalwareScanStatus tag after an object is tagged. Achieve this by replacing <IAM-role-name> in the following example S3 bucket policy.
Change the policy if you are required to allow certain principals or roles to read failed or skipped objects. You can permit a special role to read the malicious object if needed as part of your existing incident response process. Do this by adding an additional statement into the S3 bucket policy and replacing the <IAM-role-name>value in the following example.
This solution is designed to streamline the deployment of GuardDuty Malware Protection for S3, helping you to maintain a secure and reliable S3 storage environment while minimizing the risk of malware infections and their potential consequences. The solution provides several configuration options, allowing you to create a new S3 bucket or use an existing one, enable encryption with a new or existing AWS KMS key, and optionally set up a function to copy objects with a defined tag to a destination S3 bucket. The copy function feature offers an additional layer of protection by separating potentially malicious files from clean ones, allowing you to maintain a separate repository of safe data for continued business operations or further analysis.
The high-level workflow of the solution is as follows:
An object is uploaded to an S3 bucket that has been configured for malware detection.
The malware scan service receives a notification that a new object has been detected in the bucket and then GuardDuty reads, decrypts, and scans the object in an isolated environment.
An EventBridge rule is configured to listen for events that match the pattern of completed scans for the monitored bucket that have a scan result of NO_THREATS_FOUND.
When the matched event pattern occurs, the copy object Lambda function is invoked.
The Lambda copy object function copies the object from the monitored S3 bucket to the target bucket.
In this solution, you will use the follow AWS services and features:
Event tracking: This solution uses an EventBridge rule to listen for completed malware scan result events for a specific S3 bucket, which has been enabled for malware scanning. When the EventBridge rule finds a matched event, the rule passes the required parameters and invokes the Lambda function required to copy the S3 object from the source malware protected bucket to a destination clean bucket. The event pattern used in this solution uses the following format:
Note: Replace the value of the bucketName attribute with the bucket in your account.
Task orchestration: A Lambda function handles the logic for copying the S3 object from the source bucket to the destination bucket which has just been scanned by GuardDuty. If the object was created within a new S3 prefix, the prefix and the object will be copied. If the object was tagged by GuardDuty, then the object tag will be copied.
Deploy the solution
The solution CloudFormation template provides you with multiple deployment scenarios so you can choose which best applies to your use case.
Deploy the CloudFormation template
For this next step, make sure that you deploy the CloudFormation template provided in the AWS account and Region where you want to test this solution.
To deploy the CloudFormation template
Choose the Launch Stack button to launch a CloudFormation stack in your account. Note that the stack will launch in the N. Virginia (us-east-1) Region. To deploy this solution in other Regions, download the solution’s CloudFormation template, modify it, and deploy it to the selected Regions.
Choose the appropriate scenario and complete the parameters information questions as shown in Figure 3.
Figure 3: CloudFormation template parameters
Each of the following scenarios and their parameter information (from Figure 3) can be evaluated to make sure that the CloudFormation template deploys successfully:
Deployment scenario
Create a new bucket or use an existing bucket?
If ”new”, should a KMS key be created for the new bucket?
Would you like to create the copy function to a destination bucket? Create the Lambda copy function from the protected bucket to the clean bucket.
Post scan file copy function
This will be used as the basis for the copy function and EventBridge rule to invoke the function: Copy files to the clean bucket with either the THREATS or NO_THREATS_FOUND tagged value.
Existing S3 bucket configuration – not used for new S3 buckets
Enter the bucket name that you would like to be your scanned bucket: Enter the existing S3 bucket name that will be enabled for GuardDuty Malware Protection for S3.
Enter the bucket name that you would like to be your scanned bucket: Enter the S3 bucket name to be used as the copy destination for S3 objects.
Is the existing bucket using a KMS key? Is the existing S3 bucket encrypted with an existing KMS key?
ARN of the existing KMS key to be used: Provide the existing KMS key Amazon Resource Name (ARN) to be used for KMS encryption. IAM policies will be configured for this KMS key name.
Lambda Copy Function clean bucket: Create a new S3 bucket with the Lambda copy function from the protected bucket to the clean bucket.
Review the stack name and the parameters for the template.
On the Quick create stack screen, scroll to the bottom and select I acknowledge that AWS CloudFormation will create IAM resources.
Choose Create stack. The deployment of the CloudFormation stack will take 3–4 minutes.
After the CloudFormation stack has deployed successfully, the solution will be available for use in the same Region where you deployed the CloudFormation stack. The solution deploys a specific Lambda function and EventBridge rule to match the name of the source S3 bucket.
Follow the readme contained within the repository to deploy the solution or individual components depending your requirements.
Extend the solution
In this section, you’ll find options for extending the solution.
Copy alternative status results
The solution can be extended to copy S3 objects with a scan result status that you define. To change the scan result used to invoke the copy function, update the scanresultstatus in the event pattern defined in EventBridge rule created as part of the solution named S3Malware-CopyS3Object-<DOC-EXAMPLE-BUCKET-111122223333>.
"scanResultDetails": {
      "scanResultStatus": ["<scan result status>"]
Delete source S3 objects
To delete the object from the source after the copy was successful, you will need to update the Lambda function code and the IAM role used by the Lambda function.
The IAM role used by the Lambda function requires a new statement added to the existing role. The JSON formatted statement is provided in the following example.
To remove malicious objects from the S3 bucket to help prevent accidental download or access, implement a tag-based lifecycle rule to delete the object after a specific number of days. To achieve this follow the steps in Setting a lifecycle configuration on a bucket to configure a lifecycle rule and make sure the tag key is GuardDutyMalwareScanStatus and value is THREATS_FOUND.
Figure 4: Tag based S3 lifecycle rule
Align the lifecycle policy with your organization’s current S3 object malware investigation procedures. Deleting objects prematurely might hinder security teams’ ability to analyze potentially malicious content. When using bucket versioning instead of permanently deleting the object, Amazon S3 inserts a delete marker that becomes the current version of the object.
AWS Transfer Family integration
If you’re using the AWS Transfer Family service with Secure File Transfer Protocol (SFTP) connector for S3, it’s recommended to scan external uploads for malware before using the received files. This helps ensure the security and integrity of data transferred into your S3 buckets using SFTP.
Figure 5: AWS Transfer Family S3 workflow
To implement malware scanning, configure a file processing workflow configuration to copy the uploaded objects into an S3 bucket that has GuardDuty Malware Protection for S3 enabled.
Figure 6: Transfer Family configuration workflow
Summary
Amazon GuardDuty Malware Protection for S3 is now available to assess untrusted objects for malicious files before being ingested by downstream processes within your organization. Customers can automatically scan their S3 objects for malware and take appropriate actions, such as quarantining or remediating infected files. This proactive approach helps mitigate the risks associated with malware infections, data breaches, and potential financial losses. The solution provided offers an additional layer of protection by separating potentially malicious files from clean ones, allowing customers to maintain a separate repository of safe data for continued business operations or further analysis. Visit the 2024 re:Inforce session or the what’s new blog post to understand additional service details.
If you have feedback about this post, submit comments in the Comments section below. If you have questions about this post, contact AWS Support.
For many years, Cloudflare has used advanced fingerprinting techniques to help block online threats, in products like our DDoS engine, our WAF, and Bot Management. For the purposes of Bot Management, fingerprinting characteristic elements of client software help us quickly identify what kind of software is making an HTTP request. It’s an efficient and accurate way to differentiate a browser from a Python script, while preserving user privacy. These fingerprints are used on their own for simple rules, and they underpin complex machine learning models as well.
Making sure our fingerprints keep pace with the pace of change on the Internet is a constant and critical task. Bots will always adapt to try and look more browser-like. Less frequently, browsers will introduce major changes to their behavior and affect the entire Internet landscape. Last year, Google did exactly that, making older TLS fingerprints almost useless for identifying the latest version of Chrome.
Cloudflare network fingerprinting techniques
These methods are instrumental in accurately scoring and classifying bots, enhancing security measures, and enriching data analytics capabilities. Below are some examples of the fingerprinting techniques we have implemented over the years:
HTTP Signature: The HTTP Signature technique involves analyzing HTTP headers and other request attributes to create a unique signature for each client. This method is particularly useful for identifying and managing bot traffic, as it can detect inconsistencies between the HTTP signature and the claimed user-agent.
ClientHello fingerprint (v1 & v2): The ClientHello fingerprint technique involves analyzing the ClientHello message during the TLS handshake. This message contains various parameters, such as cipher suites, extensions, and supported groups, which can be used to create a unique fingerprint for each client. The first version of ClientHello fingerprint was introduced as part of Cloudflare’s broader TLS fingerprinting efforts, with subsequent improvements leading to version 2. These fingerprints help in identifying the client software and its configuration, providing a static identifier that can be used to detect anomalies and potential threats.
HTTP/2 fingerprint: HTTP/2 fingerprinting focuses on the unique characteristics of the HTTP/2 protocol, such as the settings frame, stream priority information, and the order of pseudo-header fields. Supported by all major browsers, this method was introduced to leverage the protocol’s binary framing layer, which provides a rich set of attributes for creating unique client fingerprints.
HTTP/3 and QUIC fingerprints: As HTTP/3 and the QUIC protocol gain popularity, Cloudflare has developed fingerprinting techniques tailored to these advanced protocols. Running over QUIC, HTTP/3 uses UDP and introduces unique handshake mechanisms, distinct from TCP-based protocols. Cloudflare’s techniques focus on specific attributes like QUIC version and transport parameters to generate precise fingerprints. These are vital for managing and identifying traffic, particularly in environments that heavily use Google products.
JA3 fingerprint: This TLS fingerprinting technique, introduced by Salesforce researchers in 2017 and later adopted by Cloudflare, involves creating a hash of the TLS ClientHello message. This hash includes the ordered list of TLS cipher suites, extensions, and other parameters, providing a unique identifier for each client. While JA3 is broadly utilized for detecting malicious activity and pinpointing specific client software, it shares similarities with Cloudflare’s proprietary ClientHello fingerprints (v1 & v2). However, the latter distinguish themselves by utilizing different components of the ClientHello message and employing alternative encoding schemes.
These fingerprinting techniques power Cloudflare’s Heuristic engine and machine learning models, both of which compute a Bot Score. This score assesses the likelihood — on a scale from 0 to 100 — of whether a request originated from an automated program (low score) or a human (high score). Additionally, these models leverage aggregated traffic statistics from all fingerprint types, and other dimensions, and integrate features throughout the OSI model’s layers (L1 to L7), enabling them to analyze every request for all customers. They provide sophisticated, real-time security analysis with inferences delivered at microsecond latency, providing prompt and precise responses to potential threats.
Limitations of JA3 fingerprint
In early 2023, Google implemented a change in Chromium-based browsers to shuffle the order of TLS extensions – a strategy aimed at disrupting the detection capabilities of JA3 and enhancing the robustness of the TLS ecosystem. This modification was prompted by concerns that fixed fingerprint patterns could lead to rigid server implementations, potentially causing complications each time Chrome updates were rolled out. Over time, JA3 became less useful due to the following reasons:
Randomization of TLS extensions: Browsers began randomizing the order of TLS extensions in their ClientHello messages. This change meant that the JA3 fingerprints, which relied on the sequential order of these extensions, would vary with each connection, making it unreliable for identifying unique clients. (Further information can be found at Stamus Networks.)
Inconsistencies across tools: Different tools and databases that implemented JA3 fingerprinting often produced varying results due to discrepancies in how they handled TLS extensions and other protocol elements. This inconsistency hindered the effectiveness of JA3 fingerprints for reliable cross-organization sharing and threat intelligence. (Further information can be found at Fingerprint.)
Vulnerability to evasion: While the static and simplistic nature of JA3 made it vulnerable to evasion, Cloudflare’s proprietary ClientHello fingerprint v2 (CHFPv2) addressed this challenge by accounting for the randomization of TLS extensions. In our internal implementations, TLS extensions are sorted before being incorporated into the fingerprint, effectively mitigating the impact of randomization for Cloudflare customers.
Limited scope and lack of adaptability: JA3 focused solely on elements within the TLS ClientHello packet, covering only a narrow portion of the OSI model’s layers. This limited scope often missed crucial context about a client’s environment. Additionally, as newer transport layer protocols like QUIC became popular, JA3’s methodology – originally designed for older versions of TLS and excluding modern protocols – proved ineffective.
Enter JA4 fingerprint
In response to these challenges, FoxIO developed JA4, a successor to JA3 that offers a more robust, adaptable, and reliable method for fingerprinting TLS clients across various protocols, including emerging standards like QUIC. Officially launched in September 2023, JA4 is part of the broader JA4+ suite that includes fingerprints for multiple protocols such as TLS, HTTP, and SSH. This suite is designed to be interpretable by both humans and machines, thereby enhancing threat detection and security analysis capabilities.
JA4 fingerprint is resistant to the randomization of TLS extensions and incorporates additional useful dimensions, such as Application Layer Protocol Negotiation (ALPN), which were not part of JA3. The introduction of JA4 has been met with positive reception in the cybersecurity community, with several open-source tools and commercial products beginning to incorporate it into their systems, including Cloudflare. The JA4 fingerprint is available under the BSD 3-Clause license, promoting seamless upgrades from JA3. Other fingerprints within the suite, such as JA4S (TLS Server Response) and JA4H (HTTP Client Fingerprinting), are licensed under the proprietary FoxIO License, which is designed for broader use but requires specific arrangements for commercial monetization.
Let’s take a look at specific JA4 fingerprint example, representing the latest version of Google Chrome on Linux:
Protocol Identifier (t): Indicates the use of TLS over TCP. This identifier is crucial for determining the underlying protocol, distinguishing it from q for QUIC or d for DTLS.
TLS Version (13): Represents TLS version 1.3, confirming that the client is using one of the latest secure protocols. The version number is derived from analyzing the highest version supported in the ClientHello, excluding any GREASE values.
SNI Presence (d): The presence of a domain name in the Server Name Indication. This indicates that the client specifies a domain (d), rather than an IP address (it would indicate the absence of SNI).
Cipher Suites Count (15): Reflects the total number of cipher suites included in the ClientHello, excluding any GREASE values. It provides insight into the cryptographic options the client is willing to use.
Extensions Count (16): Indicates the count of distinct extensions presented by the client in the ClientHello. This measure helps identify the range of functionalities or customizations the client supports.
ALPN Values (h2): Represents the Application-Layer Protocol Negotiation protocol, in this case, HTTP/2, which indicates the protocol preferences of the client for optimized web performance.
Cipher Hash (8daaf6152771): A truncated SHA256 hash of the list of cipher suites, sorted in hexadecimal order. This unique hash serves as a compact identifier for the client’s cipher suite preferences.
Extension Hash (02713d6af862): A truncated SHA256 hash of the sorted list of extensions combined with the list of signature algorithms. This hash provides a unique identifier that helps differentiate clients based on the extensions and signature algorithms they support.
Integrating JA4 support into Cloudflare required rethinking our approach to parsing TLS ClientHello messages, which were previously handled in separate implementations across C, Lua, and Go. Recognizing the need to boost performance and ensure memory safety, we developed a new Rust-based crate, client-hello-parser. This unified parser not only simplifies modifications by centralizing all related logic but also prepares us for future transitions, such as replacing nginx with an upcoming Rust-based service. Additionally, this streamlined parser facilitates the exposure of JA4 fingerprints across our platform, improving the integration with Cloudflare’s firewall rules, Workers, and analytics systems.
Parsing ClientHello
client-hello-parser is an internal Rust crate designed for parsing TLS ClientHello messages. It aims to simplify the process of analyzing TLS traffic by providing a straightforward way to decode and inspect the initial handshake messages sent by clients when establishing TLS connections. This crate efficiently populates a ClientHelloParsed struct with relevant parsed fields, including version 1 and version 2 fingerprints, and JA3 and JA4 hashes, which are essential for network traffic analysis and fingerprinting.
Key benefits of the client-hello-parser library include:
Optimized memory usage: The library achieves amortized zero heap allocations, verified through extensive testing with the dhat crate to track memory allocations. Utilizing the tiny_vec crate, it begins with stack allocations for small vectors backed by fixed-size arrays, resorting to heap allocations only when these vectors exceed their initial size. This method ensures efficient reuse of all vectors, maintaining amortized zero heap allocations.
Memory safety: Reinforced by Rust’s robust borrow checker and complemented by extensive fuzzing, which has helped identify and resolve potential security vulnerabilities previously undetected in C implementations.
Ultra-low latency: The parser benefits from using faster_hex for efficient hex encoding/decoding, which utilizes SIMD instructions to speed up processing. The use of Rust iterators also helps in optimizing performance, often allowing the compiler to generate SIMD-optimized assembly code. This efficiency is further enhanced through the use of BigEndianIterator, which allows for efficient streaming-like processing of TLS ClientHello bytes in a single pass.
The benchmark results demonstrate that the parser efficiently handles different sizes of ClientHello messages, with shorter messages being processed at a rate of approximately 2 million elements per second, and longer messages at around 1 million elements per second, showcasing the effectiveness of SIMD optimizations and Rust’s iterator performance in real-world applications.
Robust testing suite: Includes dozens of real-life TLS ClientHello message examples, with parsed components verified against Wireshark with JA3 and JA4 plugins. Additionally, Cargo fuzzer with memory sanitizer ensures no memory leaks or edge cases leading to core dumps. Backward compatibility tests with the legacy C parser, imported as a dependency and called via FFI, confirm that both parsers yield equivalent results.
Seamless integration with nginx: The crate, compiled as a dynamic library, is linked to the nginx binary, ensuring a smooth transition from the legacy parser to the new Rust-based parser through backwards compatibility tests.
The transition to a new Rust-based parser has enabled the retirement of multiple implementations across different languages (C, Lua, and Go), significantly enhancing performance and parser robustness against edge cases. This shift also facilitates the easier integration of new features and business logic for parsing TLS ClientHello messages, streamlining future expansions and security updates.
With Cloudflare JA4 fingerprints implemented on our network, we were left with another problem to solve. When JA3 was released, we saw some scenarios where customers were surprised by traffic from a new JA3 fingerprint and blocked it, only to find the fingerprint was a new browser release, or an OS update had caused a change in the fingerprint used by their mobile device. By giving customers just a hash, customers still lack context. We wanted to give our customers the necessary context to help them make informed decisions about the safety of a fingerprint, so they can act quickly and confidently on it. As more of our customers embrace AI, we’ve heard more demand from our customers to break out the signals that power our bot detection. These customers want to run complex models on proprietary data that has to stay in their control, but they want to have Cloudflare’s unique perspective on Internet traffic when they do it. To us, both use cases sounded like the same problem.
Enter JA4 Signals
In the ever-evolving landscape of web security, traditional fingerprinting techniques like JA3 and JA4 have proven invaluable for identifying and managing web traffic. However, these methods alone are not sufficient to address the sophisticated tactics employed by malicious agents. Fingerprints can be easily spoofed, they change frequently, and traffic patterns and behaviors are constantly evolving. This is where JA4 Signals come into play, providing a robust and comprehensive approach to traffic analysis.
JA4 Signals are inter-request features computed based on the last hour of all traffic that Cloudflare sees globally. On a daily basis, we analyze over 15 million unique JA4 fingerprints generated from more than 500 million user agents and billions of IP addresses. This breadth of data enables JA4 Signals to provide aggregated statistics that offer deeper insights into global traffic patterns – far beyond what single-request or connection fingerprinting can achieve. These signals are crucial for enhancing security measures, whether through simple firewall rules, Workers scripts, or advanced machine learning models.
Let’s consider a specific example of JA4 Signals from a Firewall events activity log, which involves the latest version of Chrome:
This example highlights that a particular HTTP request received a Bot Score of 95, suggesting it likely originated from a human user operating a browser rather than an automated program or a bot. Please note that ratio and quantile-based signal values fall within the range of [0.0 to 1.0], whereas rank-based signal values are integer values within the range of [1 to N]. Analyzing JA4 Signals in this context provides deeper insight into the behavior of this client (latest Linux Chrome) in comparison to other network clients and their respective JA4 fingerprints:
JA4 Signal
Description
Value example
Interpretation
browser_ratio_1h
The ratio of requests originating from browser-based user agents for the JA4 fingerprint in the last hour. Higher values suggest a higher proportion of browser-based requests.
0.942
Indicates a 94.2% browser-based request rate for this JA4.
cache_ratio_1h
The ratio of cacheable responses for the JA4 fingerprint in the last hour. Higher values suggest a higher proportion of responses that can be cached.
0.534
Shows a 53.4% cacheable response rate for this JA4.
h2h3_ratio_1h
The ratio of HTTP/2 and HTTP/3 requests combined with the total number of requests for the JA4 fingerprint in the last hour. Higher values indicate a higher proportion of HTTP/2 and HTTP/3 requests compared to other protocol versions.
0.987
Reflects a 98.7% rate of HTTP/2 and HTTP/3 requests.
heuristic_ratio_1h
The ratio of requests with a scoreSrc value of “heuristics” for the JA4 fingerprint in the last hour. Higher values suggest a larger proportion of requests being flagged by heuristic-based scoring.
0.007
Suggests a 0.7% rate of heuristic-based scoring for requests.
ips_quantile_1h
The quantile position of the JA4 fingerprint based on the number of unique client IP addresses across all fingerprints in the last hour. Higher values indicate a relatively higher number of distinct client IPs compared to other fingerprints.
1
Indicates a high diversity of client IPs for this JA4.
ips_rank_1h
The rank of the JA4 fingerprint based on the number of unique client IP addresses across all fingerprints in the last hour. Lower values indicate a higher number of distinct client IPs associated with the fingerprint.
2
High volume of IPs compared to other JA4s.
paths_rank_1h
The rank of the JA4 fingerprint based on the number of unique request paths across all fingerprints in the last hour. Lower values indicate a higher diversity of request paths associated with the fingerprint.
2
High diversity of request paths.
reqs_quantile_1h
The quantile position of the JA4 fingerprint based on the number of requests across all fingerprints in the last hour. Higher values indicate a relatively higher number of requests compared to other fingerprints.
1
High volume of requests compared to other JA4s.
reqs_rank_1h
The rank of the JA4 fingerprint based on the number of requests across all fingerprints in the last hour. Lower values indicate a higher number of requests associated with the fingerprint.
2
High request count for this JA4.
uas_rank_1h
The rank of the JA4 fingerprint based on the number of distinct user agents across all fingerprints in the last hour. Lower values indicate a higher diversity of user agents associated with the fingerprint.
1
Highest diversity of user agents for this JA4.
The JA4 fingerprint and JA4 Signals are now available in the Firewall Rules UI, Bot Analytics and Workers. Customers can now use these fields to write custom rules, rate-limiting rules, transform rules, or Workers logic using JA4 fingerprint and JA4 Signals.
Let’s demonstrate how to use JA4 Signals with the following Worker example. This script processes incoming requests by parsing and categorizing JA4 Signals, providing a clear structure for further analysis or rule application within Cloudflare Workers:
/**
 * Event listener for 'fetch' events. This triggers on every request to the worker.
 */
addEventListener('fetch', event => {
  event.respondWith(handleRequest(event.request))
})

/**
 * Main handler for incoming requests.
 * @param {Request} request - The incoming request object from the fetch event.
 * @returns {Response} A response object with JA4 Signals in JSON format.
 */
async function handleRequest(request) {
  // Safely access the ja4Signals object using optional chaining, which prevents errors if properties are undefined.
  const ja4Signals = request.cf?.botManagement?.ja4Signals || {};

  // Construct the response content, including both the original ja4Signals and the parsed signals.
  const responseContent = {
    ja4Signals: ja4Signals,
    jaSignalsParsed: parseJA4Signals(ja4Signals)
  };

  // Return a JSON response with appropriate headers.
  return new Response(JSON.stringify(responseContent), {
    status: 200,
    headers: {
      "content-type": "application/json;charset=UTF-8"
    }
  })
}

/**
 * Parses the JA4 Signals into categorized groups based on their names.
 * @param {Object} ja4Signals - The JA4 Signals object that may contain various metrics.
 * @returns {Object} An object with categorized JA4 Signals: ratios, ranks, and quantiles.
 */
function parseJA4Signals(ja4Signals) {
  // Define the keys for each category of signals.
  const ratios = ['h2h3_ratio_1h', 'heuristic_ratio_1h', 'browser_ratio_1h', 'cache_ratio_1h'];
  const ranks = ['uas_rank_1h', 'paths_rank_1h', 'reqs_rank_1h', 'ips_rank_1h'];
  const quantiles = ['reqs_quantile_1h', 'ips_quantile_1h'];

  // Return an object with each category containing only the signals that are present.
  return {
    ratios: filterKeys(ja4Signals, ratios),
    ranks: filterKeys(ja4Signals, ranks),
    quantiles: filterKeys(ja4Signals, quantiles)
  };
}

/**
 * Filters the keys in the ja4Signals object that match the list of specified keys and are not undefined.
 * @param {Object} ja4Signals - The JA4 Signals object.
 * @param {Array<string>} keys - An array of keys to filter from the ja4Signals object.
 * @returns {Object} A filtered object containing only the specified keys that are present in ja4Signals.
 */
function filterKeys(ja4Signals, keys) {
  const filtered = {};
  // Iterate over the specified keys and add them to the filtered object if they exist in ja4Signals.
  keys.forEach(key => {
    // Check if the key exists and is not undefined to handle optional presence of each signal.
    if (ja4Signals && ja4Signals[key] !== undefined) {
      filtered[key] = ja4Signals[key];
    }
  });
  return filtered;
}
When JA4 Signals are present, the output from the Worker might look like this:
Comprehensive traffic analysis: JA4 Signals aggregate data over an hour to provide a holistic view of traffic patterns. This method enhances the ability to identify emerging threats and abnormal behaviors by analyzing changes over time rather than in isolation.
Precision in anomaly detection: Leveraging detailed inter-request features, JA4 Signals enable the precise detection of anomalies that may be overlooked by single-request fingerprinting. This leads to more accurate identification of sophisticated cyber threats.
Globally scalable insights: By synthesizing data at a global scale, JA4 Signals harness the strength of Cloudflare’s network intelligence. This extensive analysis makes the system less susceptible to manipulation and provides a resilient foundation for security protocols.
Dynamic security enforcement: JA4 Signals can dynamically inform security rules, from simple firewall configurations to complex machine learning algorithms. This adaptability ensures that security measures evolve in tandem with changing traffic patterns and emerging threats.
Reduction in false positives and negatives: With the detailed insights provided by JA4 Signals, security systems can distinguish between legitimate and malicious traffic more effectively, reducing the occurrence of false positives and negatives and improving overall system reliability.
Conclusion
The introduction of JA4 fingerprint and JA4 Signals marks a significant milestone in advancing Cloudflare’s security offerings, including Bot Management and DDoS protection. These tools not only enhance the robustness of our traffic analysis but also showcase the continuous evolution of our network fingerprinting techniques. The efficiency of computing JA4 fingerprints enables real-time detection and response to emerging threats. Similarly, by leveraging aggregated statistics and inter-request features, JA4 Signals provide deep insights into traffic patterns at speeds measured in microseconds, ensuring that no detail is too small to be captured and analyzed.
These security features are underpinned by the scalable techniques and open-sourced libraries outlined in “Every request, every microsecond: scalable machine learning at Cloudflare”. This discussion highlights how Cloudflare’s innovations not only analyze vast amounts of data but also transform this analysis into actionable, reliable, and dynamically adaptable security measures.
Any Enterprise business with a bot problem will benefit from Cloudflare’s unique JA4 implementation and our perspective on bot traffic, but customers who run their own internal threat models will also benefit from access to data insights from a network that processes over 50 million requests per second. Please get in touch with us to learn more about our Bot Management offering.
At Zabbix, we’ve championed the open-source movement, with its emphasis on openness, transparency, and cooperation, from day one. Because of this, prospective customers and partners often have questions about the security of our product – the fear being that open-source software is somehow less secure than proprietary software.
In this post, we’ll provide a bit of background regarding how open-source software works, explain why fears about the security of open-source software are largely unfounded, and provide an overview of how the Zabbix team works to make sure that our product is as secure as it can possibly be.
Table of Contents
A short open-source primer
At its most basic, open-source software is code that is available for anyone to modify and share in either its original or modified forms. It lets developers share their work without the restrictions of a proprietary license. The open-source movement is based on collaborative development and encourages the creation of high-quality software by tapping into the creativity and enthusiasm of a global community of developers.
Zabbix itself is an open-source solution covered by the GNU Affero General Public License version 3 (AGPLv3). The Zabbix source code is readily available and can be redistributed or modified – anyone with a great idea can create their own version of Zabbix. Apart from Zabbix, many well-known and widely used software solutions have emerged from the open-source movement, including Mozilla’s Firefox browser, the WordPress content management system, VLC Media Player, and the Linux operating system.
Open-source software and security
Data security is an issue that unites every company (and therefore every potential partner or client). Developers are constantly on the lookout for solutions that follow up-to-the-minute data and application security best practices in order to reduce risk and give users the most secure experience possible.
A common debate among both users and developers is whether open-source software is secure enough when compared to closed source alternatives. The good news is that there are massive efforts underway to help make sure that the open-source community is as safe as possible.
The Linux Foundation’s Community Health Analytics Open Source Software (CHAOSS) is a project that’s focused on creating a standard set of metrics and software to help define open source community health, and its GrimoireLab tool in particular makes it much easier for open-source projects to analyze and report their community health metrics.
Opinions vary regarding what makes for a truly secure environment, but quite possibly the biggest security advantage of open-source software is its transparency.
If you see something, say something
Open-source code is available for anyone to review, modify, and distribute. “Hold up,” you may be thinking – “If someone can see the whole code, can’t they just take advantage of a vulnerability if they see it?” The answer is that someone could certainly exploit a vulnerability, but because everybody can also see the code, there’s a far higher probability that someone else has also noticed the vulnerability in question and taken steps to correct it.
With open-source code, it’s usually much easier to get in touch with the developers and report issues directly to them than it is with a closed source project. This means a faster resolution of most security issues. Not only that, because the public is often allowed and encouraged to submit code improvements directly to the developers, anyone could submit the code to fix a vulnerability as a part of them reporting an issue. This leads to rigorous security scrutiny, with many eyes on the code, identifying and reporting vulnerabilities.
Think of it as the equivalent of a “neighborhood watch” program, in which organized groups of civilians devote themselves to crime and vandalism prevention within a neighborhood, ultimately making it safer and more secure for everyone.
No “waiting game” for updates
With standard closed source (or proprietary) software, users are completely at the mercy of the companies behind the software when it comes to getting software updates. Updates and fixes for high-profile closed source applications usually involve a great deal of complicated planning, and if there’s no budget or resources available, users might go months or even years before they see a new update, whether there are glaring security flaws or not.
Open-source solutions are also more agile when it comes to iterating and releasing new versions. This is down to any number of reasons, including the fact that open-source software has more eyes on the source code at any given time, plus a community-driven interest in making the product as good as it can be.
The Zabbix advantage
At Zabbix, we’ve long benefited from the inherent security advantages of being open-source. Because we’re enterprise-level open-source software, we’ve been able to adopt a “best of both worlds” approach that combines the flexibility and community policing of open-source with the knowledge that only a dedicated team of in-house security experts and robust security policies can provide.
If a member of our community notices a security vulnerability, the best way to make sure that it gets fixed as quickly as possible if for them to create a new issue in the Zabbix Security Reports (ZBXSEC) section of the public bug tracker, describing the problem (and a proposed solution if possible) in detail. This helps us make sure that only the Zabbix security team and the reporter have access to the case.
At that point, the Zabbix Security team reviews the issue and evaluates its potential impact. The team then works on the issue to provide a solution, creating new packages and making them available for download. Clients with support agreements are informed about security vulnerabilities that have been addressed and fixed, and given a window of opportunity to upgrade before the issue becomes known to the public. After that, a public announcement for the community is made.
Another potential security risk involves complex dependencies on other open-source libraries, where each dependency can introduce vulnerabilities if not properly managed. A perfect example of this is 2023’s repojacking attack on GitHub, in which a critical vulnerability in an open-source repository led to the exposure of over 4,000 other repositories.
To minimize the possibility of these supply chain attacks, we use tools that can generate an SBOM (Software Bill of Materials), which is basically a list of ingredients that make up software components. This makes it easy to keep track of each individual ingredient and take appropriate actions in the event of a red flag. What’s more, the fact that our clients are the sole owners of their data eliminates another potential source of security issues – unlike with other software vendors, there is no risk of an attacker accessing systems running Zabbix.
As an additional line of defense, we work with HackerOne, the world’s leading platform for ethical hackers, to maintain a Zabbix-specific bug bounty program that challenges the world’s most elite ethical hackers to find the weak spots in our code and let us know about them in time to fix them. We’re proud of the way that our community has done their part to help us make Zabbix as secure as possible, and we’re confident that with a few refinements we can pay out even more bug bounties in the future.
To learn more about the Zabbix approach to open-source security, please visit our website or get in touch with us.
Amazon Cognito is a customer identity and access management (CIAM) service that can scale to millions of users. Although the Cognito documentation details which multi-tenancy models are available, determining when to use each model can sometimes be challenging. In this blog post, we’ll provide guidance on when to use each model and review their pros and cons to help inform your decision.
Cognito overview
Amazon Cognito handles user identity management and access control for web and mobile apps. With Cognito user pools, you can add sign-up, sign-in, and access control to your apps. A Cognito user pool is a user directory within a specific AWS Region where users can authenticate and register for applications. In addition, a Cognito user pool is an OpenID Connect (OIDC) identity provider (IdP). App users can either sign in directly through a user pool or federate through a third-party IdP. Cognito issues a user pool token after successful authentication, which can be used to securely access backend APIs and resources.
Cognito issues three types of tokens:
ID token – Contains user identity claims like name, email, and phone number. This token type authenticates users and enables authorization decisions in apps and API gateways.
Access token – Includes user claims, groups, and authorized scopes. This token type grants access to API operations based on the authenticated user and application permissions. It also enables fine-grained, user-based access control within the application or service.
Refresh token – Retrieves new ID and access tokens when these are expired. Access and ID tokens are short-lived, while the refresh token is long-lived. By default, refresh tokens expire 30 days after the user signs in, but this can be configured to a value between 60 minutes and 10 years.
You can find more information on using tokens and their contents in the Cognito documentation.
Multi-tenancy approaches
Software as a service (SaaS) architectures often use silo, pool, or bridge deployment models, which also apply to CIAM services like Cognito. The silo model isolates tenants in dedicated resources. The pool model shares resources between tenants. The bridge model connects siloed and pooled components. This post compares the Cognito silo and pool models for SaaS identity management.
It’s also possible to combine the silo and pool models by having multiple tiers of resources. For example, you could have a siloed tier for sensitive tenant data along with a pooled tier for shared functionality. This is similar to the silo model but with added routing complexity to connect the tiers. When you have multiple pools or silos, this is a similar approach to the pure silo model but with more components to manage.
More detail on these models are included in the AWS SaaS Lens.
We’ve detailed five possible patterns in the following sections and explored the scenarios where each of the patterns can be used, along with the advantages and disadvantages for each. The rest of the post delves deeper into the details of these different patterns, enabling you to make an informed decision that best aligns with your unique requirements and constraints.
Pattern 1: Representing SaaS identity with custom attributes
To implement multi-tenancy in a SaaS application, tenant context needs to be associated with user identity. This allows implementation of the multi-tenant policies and strategies that comprise our SaaS application. Cognito has user pool attributes, which are pieces of information to represent identity. There are standard attributes, such as name and email, that describe the user identity. Cognito also supports custom attributes that can be used to hold information about the user’s relationship to a tenant, such as tenantId.
By using custom attributes for multi-tenancy in Amazon Cognito, the tenant context for each user can be stored in their user profile.
To enable multi-tenancy, you can add a custom attribute like tenantId to the user profile. When a new user signs up, this tenantId attribute can be set to a value indicating which tenant the user belongs to. For example, users with tenantId “1234” belong to Tenant A, while users with tenantId “5678” belong to Tenant B.
The tenantId attribute value gets returned in the ID token after a successful user authentication. (This value can also be added to the access token through customization by using a pre-token generation Lambda trigger.) The application can then inspect this claim to determine which tenant the user belongs to. The tenantId attribute is typically managed at the SaaS platform level and is read-only to users and the application layer. (Note: SaaS providers need to configure the tenantId attribute to be read-only.)
In addition to storing a tenant ID, you can use custom attributes to model additional tenant context. For instance, attributes like tenantName, tenantTier, or tenantRegion could be defined and set appropriately for each user to provide relevant informational context for the application. However, make sure not to use custom attributes as a database—they are meant to represent identity, not store application data. Custom attributes should only contain information that is relevant for authorization decisions and JSON web token (JWT) compactness and should be relatively static because their values are stored in the Cognito directory. Updating frequently changing data requires modifying the directory, which can be cumbersome.
The custom attributes themselves need to be defined at the time of creating the Amazon Cognito user pool, and there is a maximum of 50 custom attributes that you can create. Once the pool is created, these custom attribute fields will be present on every user profile in that user pool. However, they won’t have values populated yet. The actual tenant attribute values get populated only when a new user is created in the user pool. This can be done in two ways:
During user sign-up, a post confirmation AWS Lambda trigger can be used to set the appropriate tenant attribute values based on the user’s input.
An admin user can provision a new user through the AdminCreateUser API operation and specify the tenant attribute values at that time.
After user creation, the custom tenant attribute values can still be updated by an administrator through the AdminUpdateUserAttributes API operation or by a user with the UpdateUserAttributes API operation, if needed. But the key point is that the custom attributes themselves must be predefined at user pool creation, while the values get set later during user creation and provisioning flows. Figure 1 shows how custom attributes are associated with an ID token and used subsequently in downstream applications.
Figure 1: Associating tenant context with custom attributes
As shown in Figure 1:
The custom tenant attribute values from the user profile are included in the Cognito ID token that is generated after a successful user authentication. These values can be used for access control for other AWS services, such as Amazon API Gateway.
You can configure Amazon API Gateway with a Lambda authorizer function that validates the ID token signature (the aws-jwt-verify library can be used for this purpose) and inspects the tenant ID claim in each request.
Based on the tenant ID value extracted from the ID token, the Lambda authorizer can determine which backend resources and services each authenticated user is authorized to access.
You can use this method to provide fine-grained access control, as described in this blog post, by using tenant claims as context in addition to the user claims embedded within the token. This pattern of embedding information about the user’s identity, along with details on their associated tenant, in a single token is what AWS refers to as SaaS identity.
The multi-tenancy approaches of using siloed user pools, shared pools, or custom attributes rely on embedding tenant context within the user identity. This is accomplished by having Cognito include claims with tenant information in the JWTs issued after authentication.
The JWT encodes user identity information like the username, email address, and so on. By adding custom claims that contain tenant identifiers or metadata, the tenant context gets tightly coupled to the user identity. The embedded tenant context in the JWT allows applications to implement access control and authorization based on the associated tenant for each user.
This combination of user identity information and tenant context in the issued JWT represents the SaaS identity—a unified identity spanning both user and tenant dimensions. The application uses this SaaS identity for implementing multi-tenant logic and policies.
Pattern 2: Shared user pool (pool model)
A single, shared Amazon Cognito user pool simplifies identity management for multi-tenant SaaS applications. With one consolidated pool, changes and configurations apply across tenants in one place, which can reduce overhead.
For example, you can define password complexity rules and other settings once at the user pool level, and then these settings are shared across tenants. Adding new tenants is streamlined by using the settings in the existing shared pool, without duplicating setup per tenant. This avoids deploying isolated pools when onboarding new tenants.
Additionally, the tokens issued from the shared pool are signed by the same issuer. There is no tenant-specific issuer in the tokens when using a shared pool. For SaaS apps with common identity needs, a shared multi-tenant pool minimizes friction for rapid onboarding despite that loss of per-tenant customization.
Advantages of the pool model:
This model uses a single shared user pool for tenants. This simplifies onboarding by setting user attributes rather than configuring multiple user pools.
Tenants authenticate using the same application client and user pool, which keeps the SaaS client configuration simple.
Disadvantages of the pool model:
Sharing one pool means that settings like password policies and MFA apply uniformly, without customization per tenant.
Some resource quotas are managed at a user pool level (for example, the number of application clients or customer attributes), so you need to consider quotas carefully when adopting this model.
Pattern 3: Group-based multi-tenancy (pool model)
Amazon Cognito user pools give an administrator the capability to add groups and associate users with groups. Doing so introduces specific attributes (cognito:groups and cognito:roles) that are managed and maintained by Cognito and available within the ID tokens. (Access tokens only have the cognito:groups attribute.) These groups can be used to enable multi-tenancy by creating a separate group for each tenant. Users can be assigned to the appropriate tenant group based on the value of a custom tenantId attribute. The application can then implement authorization logic to limit access to resources and data based on the user’s tenant group membership that is encoded in the tokens. This provides isolation and access control across tenants, making use of the native group constructs in Cognito rather than relying entirely on custom attributes.
The group information contained in the tokens can then be used by downstream services to make authorization decisions. Groups are often combined with custom attributes for more granular access control. For example, in the SaaS Factory Serverless SaaS – Reference Solution developed by the AWS SaaS Factory team, roles are specified by using Cognito groups, but tenant identity relies on a custom tenantId attribute. The tenant ID attribute provides isolation between tenants, while the groups define individual user roles and access privileges that apply within a tenant.
Figure 2 shows how groups are associated with the user and then the Lambda authorizer can determine which backend resources and services each authenticated user is authorized to access.
Figure 2: Group-based multi-tenancy
In this model, groups can provide role-based controls, while custom attributes like tenant ID provide the contextual information needed to enforce tenant isolation. The authorization decisions are then made by evaluating a user’s group memberships and attribute values in order to provide fine-grained access tailored to each tenant and user. So groups directly enable role-based checks, while custom attributes provide broader context for conditional access across tenants. Together they can provide the data that is needed to implement granular authorization in a multi-tenant application.
Advantages of group-based multi-tenancy:
This model uses a single shared user pool for tenants, so that onboarding requires setting user attributes rather than configuring multiple pools.
Tenants authenticate through the same application client and pool, keeping SaaS client configuration straightforward.
Disadvantages of group-based multi-tenancy:
Sharing one pool means that settings like password policies and MFA apply uniformly without per-tenant customization.
There is a limit of 10,000 groups per user pool.
Pattern 4: Dedicated user pool per tenant (silo model)
Another common approach for multi-tenant identity with Cognito is to provision a separate user pool for each tenant. A Cognito user pool is a user directory, so using distinct pools provides maximum isolation. However, this approach requires that you implement tenant routing logic in the application to determine which user pool a user should authenticate against, based on their tenant.
Tenant routing
With separate user pools per tenant (or application clients, as we’ll discuss later), the application needs logic to route each user to the appropriate pool (or client) for authentication. There are a few options that you can use for this approach:
Use a subdomain in the URL that maps to the tenant—for example, tenant1.myapp.com routes to Tenant 1’s user pool. This requires mapping subdomains to tenant pools.
Rely on unique email domains per tenant—for example, @tenant1.com goes to Tenant 1’s pool. This requires mapping email domains to pools.
Have the user select their tenant from a dropdown list. This requires the tenant choices to be configured.
Prompt the user to enter a tenant ID code that maps to pools. This requires mapping codes to pools.
No matter the approach you chose, the key requirements are the following:
A data point to identify the tenant (such as subdomain, email, selection, or code).
A mapping dataset that takes tenant identifying information from the user and looks up the corresponding user pool to route to for authentication.
Routing logic to redirect to the appropriate user pool.
The tenant name retrieves tenant-specific information like the user pool ID, application client ID, and API URLs.
Tenant-specific information is passed to the SaaS app to initialize authentication to the correct user pool and app client, and this is used to initialize an authorization code flow.
The app redirects to the Cognito hosted UI for authentication.
User credentials are validated, and Cognito issues an OAuth code.
The OAuth code is exchanged for a JWT token from Cognito.
The JWT token is used to authenticate the user to access microservices.
Advantages of the one pool per tenant model:
Users exist in a single directory with no cross-tenant visibility. Tokens are issued and signed with keys that are unique to that pool.
Each pool can have customized security policies, like password rules or MFA requirements per tenant.
Pools can be hosted in different AWS Regions to meet data residency needs.
Potential disadvantages of the one pool per tenant model:
There are limits on the number of pools per account. (The default is 1,000 pools, and the maximum is 10,000.)
Additional automation is required to create multiple pools, especially with customized configurations.
Applications must implement tenant routing to direct authentication requests to the correct user pool.
Troubleshooting can be more difficult, because configuration of each pool is managed separately and tenant routing functionality is added.
In summary, separate user pools maximize tenant isolation but require more complex provisioning and routing. You might also need to consider limits on the pool count for large multi-tenant deployments.
Pattern 5: Application client per tenant (bridge model)
You can achieve some extra tenant isolation by using separate application clients per tenant in a single user pool, in addition to using groups and custom attributes. Cognito configurations from the application client, such as OAuth scopes, hosted UI customization, and security policies can be specific to each tenant. The application client also enables external IdP federation per tenant. However, user pool–level settings, such as password policy, remain shared.
Figure 4 shows how a single user pool can be configured with multiple application clients. Each of those application clients is assigned to a tenant. However, this approach requires that you implement tenant routing logic in the application to determine which application client a tenant should be mapped to (similar to the approach we discussed for the shared user pool). Once the user is authenticated, you can configure Amazon API Gateway with a Lambda authorizer function that validates the ID token signature. Subsequently, the Lambda authorizer can determine which backend resources and services each authenticated user is authorized to access.
Figure 4: Application client based multi-tenancy
For tenants that want to use their own IdP through SAML or OpenID Connect federation, you can create a dedicated application client that will redirect users to authenticate with the tenant’s federated IdP. This has some key benefits:
If a single external IdP is enabled on the application client, the hosted UI automatically redirects users without presenting Cognito sign-in screens. This provides a familiar sign-in experience for tenants and is frictionless if users have existing sessions with the tenant IdP.
Management of user activities like joining and leaving, passwords, and other tasks are entirely handled by the tenant in their own IdP. The SaaS provider doesn’t need to get involved in these processes.
Importantly, even with federation, Cognito still issues tokens after successful external authentication. So the SaaS provider gets consistent tokens from Cognito to validate during authorization, regardless of the IdP.
Attribute mapping
When federating with an external IdP, Amazon Cognito can dynamically map attributes to populate the tokens it issues. This allows attributes like groups, email addresses, and roles created in the IdP to be passed to Cognito during authentication and added to the tokens.
The mapping occurs upon every sign-in, overwriting the existing mapped attributes to stay in sync with the latest IdP values. Therefore, changes made in the external IdP related to mapped attributes are reflected in Cognito after signing in. If a mapped attribute is required in the Cognito user pool, like email for sign-in, it must have an equivalent in the IdP to map. The target attributes in Cognito must be configured as mutable, since immutable attributes cannot be overwritten after creation, even through mapping.
Important: For SaaS identity, tenant attributes should be defined in Cognito rather than mapped from an external IdP. This helps to prevent tenants from tampering with values and maintains isolation. However, user attributes like groups and roles can be mapped from the tenant’s IdP to manage permissions. This allows tenants to configure application roles by using their own IdP groups.
Advantages of the bridge model:
This model enables tenant-specific configuration like OAuth scopes, UI, and IdPs.
Tenant users access familiar workflows through external IdPs, and when using external IdPs, tenant user management is handled externally.
No custom claim mappings are needed, but can be used optionally.
Cognito still issues tokens for authorization.
Disadvantages of the bridge model:
Requires routing users to the correct app client per tenant.
There is a limit on the number of app clients per user pool.
Some user pool settings remain shared, such as password policy.
There is no dynamic group claim modification.
Conclusion
In this blog post, we explored various ways Amazon Cognito user pools can enable multi-tenant identity for SaaS solutions. A single shared user pool simplifies management but limits the option to customize user pool–level policies, while separate pools maximize isolation and configurability at the cost of complexity. If you use multiple application clients, you can balance tailored options like external IdPs and OAuth scopes with centralized policies in the user pool. Custom claim mappings provide flexibility but require additional logic.
These two approaches can also be combined. For example, you can have dedicated user pools for select high-tier tenants while others share a multi-tenant pool. The optimal choice depends on the specific tenant needs and on the customization that is required.
In this blog post, we have mainly focused on a static approach. You can also use a pre-token generation Lambda trigger to modify tokens by adding, changing, or removing claims dynamically. The trigger can also override the group membership in both the identity and access tokens. Other claim changes only apply to the ID token. A common use case for this trigger is injecting tenant attributes into the token dynamically.
Evaluate the pros and cons of each approach against the requirements of the SaaS architecture and tenants. Often a hybrid model works best. Cognito constructs like user pools, IdPs, and triggers provide various levers that you can use to fine-tune authentication and authorization across tenants.
If you have feedback about this post, submit comments in the Comments section below. If you have questions about this post, start a new thread on Amazon Cognito re:Post
Threat intelligence that can fend off security threats before they happen requires not just smarts, but the speed and worldwide scale that only AWS can offer.
Organizations around the world trust Amazon Web Services (AWS) with their most sensitive data. One of the ways we help secure data on AWS is with an industry-leading threat intelligence program where we identify and stop many kinds of malicious online activities that could harm or disrupt our customers or our infrastructure. Producing accurate, timely, actionable, and scalable threat intelligence is a responsibility we take very seriously, and is something we invest significant resources in.
Customers increasingly ask us where our threat intelligence comes from, what types of threats we see, how we act on what we observe, and what they need to do to protect themselves. Questions like these indicate that Chief Information Security Officers (CISOs)—whose roles have evolved from being primarily technical to now being a strategic, business-oriented function—understand that effective threat intelligence is critical to their organizations’ success and resilience. This blog post is the first of a series that begins to answer these questions and provides examples of how AWS threat intelligence protects our customers, partners, and other organizations.
High-fidelity threat intelligence that can only be achieved at the global scale of AWS
Every day across AWS infrastructure, we detect and thwart cyberattacks. With the largest public network footprint of any cloud provider, AWS has unparalleled insight into certain activities on the internet, in real time. For threat intelligence to have meaningful impact on security, large amounts of raw data from across the internet must be gathered and quickly analyzed. In addition, false positives must be purged. For example, threat intelligence findings could erroneously indicate an insider threat when an employee is logged accessing sensitive data after working hours, when in reality, that employee may have been tasked with a last-minute project and had to work overnight. Producing threat intelligence is very time consuming and requires substantial human and digital resources. Artificial intelligence (AI) and machine learning can help analysts sift through and analyze vast amounts of data. However, without the ability to collect and analyze relevant information across the entire internet, threat intelligence is not very useful. Even for organizations that are able to gather actionable threat intelligence on their own, without the reach of global-scale cloud infrastructure, it’s difficult or impossible for time-sensitive information to be collectively shared with others at a meaningful scale.
The AWS infrastructure radically transforms threat intelligence because we can significantly boost threat intelligence accuracy—what we refer to as high fidelity—because of the sheer number of intelligence signals (notifications generated by our security tools) we can observe. And we constantly improve our ability to observe and react to threat actors’ evolving tactics, techniques, and procedures (TTPs) as we discover and monitor potentially harmful activities through MadPot, our sophisticated globally-distributed network of honeypot threat sensors with automated response capabilities.
With our global network and internal tools such as MadPot, we receive and analyze thousands of different kinds of event signals in real time. For example, MadPot observes more than 100 million potential threats every day around the world, with approximately 500,000 of those observed activities classified as malicious. This means high-fidelity findings (pieces of relevant information) produce valuable threat intelligence that can be acted on quickly to protect customers around the world from harmful and malicious online activities. Our high-fidelity intelligence also generates real-time findings that are ingested into our intelligent threat detection security service Amazon GuardDuty, which automatically detects threats for millions of AWS accounts.
AWS’s Mithra ranks domain trustworthiness to help protect customers from threats
Let’s dive deeper. Identification of malicious domains (physical IP addresses on the internet) is crucial to effective threat intelligence. GuardDuty generates various kinds of findings (potential security issues such as anomalous behaviors) when AWS customers interact with domains, with each domain being assigned a reputation score derived from a variety of metrics that rank trustworthiness. Why this ranking? Because maintaining a high-quality list of malicious domain names is crucial to monitoring cybercriminal behavior so that we can protect customers. How do we accomplish the huge task of ranking? First, imagine a graph so large (perhaps one of the largest in existence) that it’s impossible for a human to view and comprehend the entirety of its contents, let alone derive usable insights.
Meet Mithra. Named after a mythological rising sun, Mithra is a massive internal neural network graph model, developed by AWS, that uses algorithms for threat intelligence. With its 3.5 billion nodes and 48 billion edges, Mithra’s reputation scoring system is tailored to identify malicious domains that customers come in contact with, so the domains can be ranked accordingly. We observe a significant number of DNS requests per day—up to 200 trillion in a single AWS Region alone—and Mithra detects an average of 182,000 new malicious domains daily. By assigning a reputation score that ranks every domain name queried within AWS on a daily basis, Mithra’s algorithms help AWS rely less on third parties for detecting emerging threats, and instead generate better knowledge, produced more quickly than would be possible if we used a third party.
Mithra is not only able to detect malicious domains with remarkable accuracy and fewer false positives, but this super graph is also capable of predicting malicious domains days, weeks, and sometimes even months before they show up on threat intel feeds from third parties. This world-class capability means that we can see and act on millions of security events and potential threats every day.
By scoring domain names, Mithra can be used in the following ways:
A high-confidence list of previously unknown malicious domain names can be used in security services like GuardDuty to help protect our customers. GuardDuty also allows customers to block malicious domains and get alerts for potential threats.
Services that use third-party threat feeds can use Mithra’s scores to significantly reduce false positives.
AWS security analysts can use scores for additional context as part of security investigations.
Sharing our high-fidelity threat intelligence with customers so they can protect themselves
Not only is our threat intelligence used to seamlessly enrich security services that AWS and our customers rely on, we also proactively reach out to share critical information with customers and other organizations that we believe may be targeted or potentially compromised by malicious actors. Sharing our threat intelligence enables recipients to assess information we provide, take steps to reduce their risk, and help prevent disruptions to their business.
For example, using our threat intelligence, we notify organizations around the world if we identify that their systems are potentially compromised by threat actors or appear to be running misconfigured systems vulnerable to exploits or abuse, such as open databases. Cybercriminals are constantly scanning the internet for exposed databases and other vulnerabilities, and the longer a database remains exposed, the higher the risk that malicious actors will discover and exploit it. In certain circumstances when we receive signals that suggest a third-party (non-customer) organization may be compromised by a threat actor, we also notify them because doing so can help head off further exploitation, which promotes a safer internet at large.
Often, when we alert customers and others to these kinds of issues, it’s the first time they become aware that they are potentially compromised. After we notify organizations, they can investigate and determine the steps they need to take to protect themselves and help prevent incidents that could cause disruptions to their organization or allow further exploitation. Our notifications often also include recommendations for actions organizations can take, such as to review security logs for specific domains and block them, implement mitigations, change configurations, conduct a forensic investigation, install the latest patches, or move infrastructure behind a network firewall. These proactive actions help organizations to get ahead of potential threats, rather than just reacting after an incident occurs.
Sometimes, the customers and other organizations we notify contribute information that in turn helps us assist others. After an investigation, if an affected organization provides us with related indicators of compromise (IOCs), this information can be used to improve our understanding of how a compromise occurred. This understanding can lead to critical insights we may be able to share with others, who can use it to take action to improve their security posture—a virtuous cycle that helps promote collaboration aimed at improving security. For example, information we receive may help us learn how a social engineering attack or particular phishing campaign was used to compromise an organization’s security to install malware on a victim’s system. Or, we may receive information about a zero-day vulnerability that was used to perpetrate an intrusion, or learn how a remote code execution (RCE) attack was used to run malicious code and other malware to steal an organization’s data. We can then use and share this intelligence to protect customers and other third parties. This type of collaboration and coordinated response is more effective when organizations work together and share resources, intelligence, and expertise.
Three examples of AWS high-fidelity threat intelligence in action
Example 1: We became aware of suspicious activity when our MadPot sensors indicated unusual network traffic known as backscatter (potentially unwanted or unintended network traffic that is often associated with a cyberattack) that contained known IOCs associated with a specific threat attempting to move across our infrastructure. The network traffic appeared to be originating from the IP space of a large multinational food service industry organization and flowing to Eastern Europe, suggesting potential malicious data exfiltration. Our threat intelligence team promptly contacted the security team at the affected organization, which wasn’t an AWS customer. They were already aware of the issue but believed they had successfully addressed and removed the threat from their IT environment. However, our sensors indicated that the threat was continuing and not resolved, showing that a persistent threat was ongoing. We requested an immediate escalation, and during a late-night phone call, the AWS CISO shared real-time security logs with the CISO of the impacted organization to show that large amounts of data were still being suspiciously exfiltrated and that urgent action was necessary. The CISO of the affected company agreed and engaged their Incident Response (IR) team, which we worked with to successfully stop the threat.
Example 2: Earlier this year, Volexity published research detailing two zero-day vulnerabilities in the Ivanti Connect Secure VPN, resulting in the publication of CVE-2023-46805 (an authentication-bypass vulnerability) and CVE-2024-21887 (a command-injection vulnerability found in multiple web components). The U.S. Cybersecurity and Infrastructure Security Agency (CISA) issued a cybersecurity advisory on February 29, 2024 on this issue. Earlier this year, Amazon security teams enhanced our MadPot sensors to detect attempts by malicious actors to exploit these vulnerabilities. Using information obtained by the MadPot sensors, Amazon identified multiple active exploitation campaigns targeting vulnerable Ivanti Connect Secure VPNs. We also published related intelligence in the GuardDuty common vulnerabilities and exposures (CVE) feed, enabling our customers who use this service to detect and stop this activity if it is present in their environment. (For more on CVSS metrics, see the National Institute of Standards and Technology (NIST) Vulnerability Metrics.)
Example 3: Around the time Russia began its invasion of Ukraine in 2022, Amazon proactively identified infrastructure that Russian threat groups were creating to use for phishing campaigns against Ukrainian government services. Our intelligence findings were integrated into GuardDuty to automatically protect AWS customers while also providing the information to the Ukrainian government for their own protection. After the invasion, Amazon identified IOCs and TTPs of Russian cyber threat actors that appeared to target certain technology supply chains that could adversely affect Western businesses opposed to Russia’s actions. We worked with the targeted AWS customers to thwart potentially harmful activities and help prevent supply chain disruption from taking place.
AWS operates the most trusted cloud infrastructure on the planet, which gives us a unique view of the security landscape and the threats our customers face every day. We are encouraged by how our efforts to share our threat intelligence have helped customers and other organizations be more secure, and we are committed to finding even more ways to help. Upcoming posts in this series will include other threat intelligence topics such as mean time to defend, our internal tool Sonaris, and more.
If you have feedback about this post, submit comments in the Comments section below. If you have questions about this post, contact AWS Support.
Managing Amazon Athena through identity federation allows you to manage authentication and authorization procedures centrally. Athena is a serverless, interactive analytics service that provides a simplified and flexible way to analyze petabytes of data.
In this blog post, we show you how you can use the Athena JDBC driver (which includes a browser Security Assertion Markup Language (SAML) plugin) to connect to Athena from third-party SQL client tools, which helps you quickly implement identity federation capabilities and multi-factor authentication (MFA). This enables automation and enforcement of data access policies across your organization.
You can use AWS IAM Identity Center to federate access to users to AWS accounts. IAM Identity Center integrates with AWS Organizations to manage access to the AWS accounts under your organization. In this post, you will learn how to configure the Athena driver to use the AWS configuration profile credentials. This will allow you to resolve credentials from IAM Identity Center and use the MFA capability of your federation identity provider (IdP).In this post, you will learn how you can integrate the Athena browser-based SAML plugin to add single sign-on (SSO) and MFA capability with your federation identity provider (IdP).
Prerequisites
To implement this solution, you must have the follow prerequisites:
Create two Athena workgroups (for example, sensitive and non-sensitive).
Note: Lake Formation only supports a single role in the SAML assertion. Multiple roles cannot be used.
Solution overview
Figure 1: Solution architecture
To implement the solution, complete the steps below as shown in Figure 1:
An IAM Identity Center delegated administrator creates two custom permission sets within Identity Center.
An IAM Identity Center delegated administrator assign permission sets to AWS accounts and users and groups. The user has permissions to single sign-on roles that are provisioned in the data lake account. The role created by Identity Center has a name that begins with AWSReservedSSO.
A Lake Formation administrator grants single sign-on roles permissions to the corresponding database and tables.
The solution workflow consists of the following high-level steps as shown in Figure 1:
The user configures IAM Identity Center authentication using the AWS CLI.
The AWS CLI redirects the user to the AWS access portal URL. The user enters workforce identity credentials (username and password). Then chooses Sign in.
The AWS access portal verifies the user’s identity. IAM Identity Center redirects the request to the Identity Center authentication service to validate the user’s credentials.
If MFA is enabled for the user, then they are prompted to authenticate their MFA device.
The user enters or approves the MFA details. The user’s MFA is successfully completed.
The user selects the AWS account to use from the displayed list. Then select the IAM single sign-on role to use from the displayed list.
The user tests the SQL client connection and then uses the client to run a SQL query.
The client makes a call to Athena to retrieve the table and associated metadata from the Data Catalog.
Lake Formation obtains temporary AWS credentials with the permissions of the defined IAM role (sensitive or non-sensitive) associated with the data lake location.
Lake Formation returns temporary credentials to Athena.
Athena uses the temporary credentials to retrieve data objects from Amazon S3.
The Athena engine successfully runs the query and returns the results to the client.
Solution walkthrough
The walkthrough includes five sections that will guide you through the process of creating permission sets, assigning permission sets to AWS Accounts, managing permission sets access using Lake Formation, and setting up third-party SQL clients such as SQL Workbench to connect to your data store and query your data through Athena.
Step 1: Federate onboarding
Federating onboarding is done within the IAM Identity Center account. As part of federated onboarding, you need to create IAM Identity Center users and groups. Groups are a collection of people who have the same security rights and permissions. You can create groups and add users to the groups. Create one IAM Identity Center group for sensitive data and another for non-sensitive data to provide distinct access to different classes of data sets. You can assign access to IAM Identity Center permission sets to a user or group.
To federate onboarding:
Open the AWS Management Console using the IAM Identity Center account and go to IAM Identity Center.
Choose Groups.
Choose Create group.
Enter a Group name and Description .
Choose Create group.
To add a user as a member of a group:
Open the IAM Identity Center console.
Choose Groups.
Select the group name that you want to update.
On the group details page, under Users in this group, choose Add users to group.
On the Add users to group page, under Other users, locate the users you want to add as members and select the check box next to each of them.
Choose Add users to group.
Figure 2: Assigning users to a group
Step 2: Create permission sets
For this step, create two permission sets (sensitive-iam-role and non-sensitive-iam-role). These permission sets can be assigned to users or groups in IAM Identity Center, granting them specific access to AWS account resources.
To create custom permission sets:
In the IAM Identity Center administrator account, under Multi-Account permissions, choose Permission sets.
Choose Create permission set.
On the Select permission set type page, under Permission set type, choose Custom permission set.
Figure 3: Selecting a permission set
Choose Next.
On the Specify policies and permission boundary page, expand Inline policy to add custom JSON-formatted policy text.
Insert the following policy and update the S3 bucket name (<s3-bucket-name>), AWS Region (<region>) account ID (<account-id>), CloudWatch alarm name (<AlarmName>), Athena workgroup name (sensitive or non-sensitive) (<WorkGroupName>), KMS key alias name (<KMS-key-alias-name>), and organization ID (<aws-PrincipalOrgID>).
On the Specify permission set details page, enter a name to identify this permission set in IAM Identity Center. The name that you specify for this permission set appears in the AWS access portal as an available role. Users sign in to the AWS access portal, choose an AWS account, and then choose the role.
Choose Next.
On the Review and create page, review the selections that you made, and then choose Create.
Step 3: Assign permission sets to AWS accounts
You can add and remove permissions sets for an IAM user or group by attaching and detaching permission sets. Permission sets define what actions an identity can perform on which AWS resources.
To assign permission sets to AWS accounts:
In the IAM Identity Center administrator account, under Multi-account permissions, choose AWS accounts.
On the AWS accounts page, select one or more AWS accounts that you want to assign single sign-on access to.
Choose Assign users or groups.
Figure 4: Selecting users and groups
On the Assign users and groups to “<AWS account name>”, for Selected users and groups, choose the users that you want to create the permission set for. Choose Next.
Select permission sets: On the Assign permission sets to “AWS-account-name” page, select one or more permission sets.
On the Review and submit assignments to AWS-account-name page, for Review and submit, choose Submit.
Step 4. Grant permissions to IAM (single sign-on) roles
A data lake administrator has the broad ability to grant a principal (including themselves) permissions on Data Catalog resources. This includes the ability to manage access controls and permissions for the data lake. When you grant Lake Formation permissions on a specific Data Catalog table, you can also include data filtering specifications. This allows you to further restrict access to certain data within the table, limiting what users can see in their query results based on those filtering rules.
To grant permissions to IAM roles:
In the Lake Formation console, under Permissions in the navigation pane, select Data Lake permissions, and then choose Grant.
To grant Database permissions to IAM roles:
Under Principals, select the IAM role name (for example, Sensitive-IAM-Role).
Under Named Data Catalog resources, go to Databases and select a database (for example, demo).
Figure 5: Select an IAM role and database
Under Database permissions, select Describe and then choose Grant.
Figure 6: Grant database permissions to an IAM role
To grant tables permissions to IAM roles:
Repeat steps 1 and 2 of the preceding procedure.
Under Tables – optional, select a table name (for example, demo2).
Figure 7: Select tables within a database to grant access
Select the desired Table Permissions (for example, select and describe), and then choose Grant.
Figure 8: Grant access to tables within the database
Repeat steps 1 through 4 to grant access for the respective database and tables for the non-sensitive IAM role.
Step 5: Client-side setup using JDBC
You can use a JDBC connection to connect Athena and SQL client applications (for example, PyCharm or SQL Workbench) to enable analytics and reporting on the data that Athena returns from Amazon S3 databases. To use the Athena JDBC driver, you must specify the driver class from the JAR file. Additionally, you must pass in some parameters to change the authentication mechanism so the athena-sts-auth libraries are used:
S3 output location – Where in S3 the Athena service can write its output. For example, s3://path/to/query/bucket/.
The IAM Identity Center administrator can configure the session duration for the AWS access portal. The session duration can be set from a minimum of 15 minutes to a maximum of 90 days.
In the left navigation pane, select JDBC 3.x and then Getting started. Select Uber jar to download a .jar file, which contains the driver and its dependencies.
Figure 9: Download Athena JDBC jar
Open PyCharm and create a new project.
Enter a Name for your project
Select the desired project Location
Choose Create
Figure 10: Create a new project in PyCharm
Configure Data Source and drivers. Select Data Source, and then choose the plus sign or New to configure new data sources and drivers.
Figure 11: Add database source properties
Configure the Athena driver by selecting the Drivers tab, and then choose the plus sign to add a new driver.
Figure 12: Add database drivers
Under Driver Files, upload the custom JAR file that you downloaded in the Step 1. Select the Athena class dropdown. Enter the driver’s name (for example Athena JDBC Driver). Then choose Apply.
Figure 13: Add database driver files
Configure a new data source. Choose the plus sign and select your driver’s name from the driver dropdown.
Enter the data source name (for example, Athena Demo). For the authentication method, select User & Password. Then choose Apply.
Figure 14: Create a project data source profile
Select the SSH/SSL tab and select Use SSL. Verify that the Use truststore options for IDE, JAVA, and system are all selected. Then choose Apply.
Figure 15: Enable data source profile SSL
Select the Options tab and then select Single Session Mode. Then choose Apply.
Figure 16: Configure single session mode in PyCharm
Select the General tab and enter the JDBC and single sign-on URL. The following is a sample JDBC URL based on the SAML application:
Choose Test Connection. If the profile has expired, refresh the single sign-on session by running aws sso login --profile <profile-name> with the corresponding profile.
Figure 17: Test the data source connection
After the connection is successful, select the Schemas tab and select All databases and All schemas.
Figure 18: Select data source databases and schemas
Run a sample test query: SELECT <table-names> FROM <database-name> limit 10;
Verify that the credentials and permissions are working as expected.
To set up SQL Workbench
Open SQL Workbench.
Configure an Athena driver by selecting File and then Manage Drivers.
Enter the Athena JDBC Driver as the name and set the library to browse the path for the location where you downloaded the driver. Enter amazonaws.athena.jdbc.AthenaDriver as the Classname.
Enter the following URL, replacing <name-of-the-WorkGroup> with your workgroup name.
Run a test query, replacing <table-names> and <database-name> with your table and database names:
SELECT <table-names> FROM <database-name> limit 10;
Verify that the credentials and permissions are working as expected.
Conclusion
In this post, we covered how to use JDBC drivers to connect to Athena from third-party SQL client tools. You were able to set this up without creating IAM users or any type of long-lived credentials that would need to be stored on your developers’ workstations. You learned how to configure IAM Identity Center users and groups, create permission sets, and assign permission sets to AWS Accounts. You also learned how to grant permissions to single sign-on roles using Lake Formation to create distinct access to different classes of data sets and connect to Athena through an SQL client tool (such as PyCharm). This setup can also work with other supported identity sources such as IAM Identity Center, self-managed or on-premises Active Directory, or an external IdP.
If you have feedback about this post, submit comments in the Comments section below. If you have questions about this post, contact AWS Support.
We’re excited to announce that Amazon Web Services (AWS) has completed its first German Insurance Association (GDV) joint audit with GDV participant members, which provides assurance to customers in the German insurance industry for the security of their workloads on AWS. This is an important addition to the joint audits performed at AWS by our regulated customers within the financial services industry. Joint audits are an efficient method to provide additional assurance to a group of customers on the “security of the cloud” (as described in the AWS Shared Responsibility Model), in addition to Compliance Programs (for example, C5) and resources that are provided to customers on AWS Artifact.
At AWS, security is our top priority. As customers embrace the scalability and flexibility of AWS, we’re helping them evolve security and compliance into key business enablers. We’re obsessed with earning and maintaining customer trust, and we provide our financial services customers, their end users, and regulatory bodies with the assurance that AWS has the necessary controls in place to help protect their most sensitive material and regulated workloads.
With the increasing digitalization of the financial services industry, and the importance of cloud computing as a key enabling technology for digitalization, security and governance is becoming an ever-more-significant priority for financial services companies. Our engagement with GDV members is an example of how AWS supports customers’ risk management and regulatory compliance. For the first time, this joint audit meticulously assessed the AWS controls that enable us to help protect customers’ workloads, while adhering to strict regulatory obligations. For insurers, moving their workloads to AWS helps protect customer data, support continuity of business-critical operations, and meet new standards in regulatory reporting.
GDV is the association of private insurers in Germany, representing around 470 members in the industry, and is a key player within the German and European financial services industries. GDV’s members participating in this joint audit have reached out to AWS to exercise their audit rights. For this cycle, the 35 participating members from the German insurance industry decided to appoint the Deutsche Cyber-Sicherheitsorganisation GmbH (DCSO) as the single external audit service provider, to perform the audit on behalf of each of the participating members. Because many participating members are affiliates of larger insurance groups and the audit report can be used throughout the group, a coverage of over 70% of the German market in terms of revenue is achieved.
Audit preparations
The scope of the audit was defined with reference to the Federal Office for Information Security (BSI) C5 Framework. It included key domains such as identity and access management, as well as AWS services such as Amazon Elastic Compute Cloud (Amazon EC2), and Regions relevant to participant members such as the Europe (Frankfurt) Region (eu-central-1).
Audit fieldwork
This audit fieldwork phase started after a kick-off in Berlin, Germany. It used a remote approach, with work occurring through the use of videoconferencing and through a secure audit portal for the inspection of evidence. Auditors assessed AWS policies, procedures, and controls, following a risk-based approach, and using sampled evidence, deep-dive sessions and follow-up questions to clarify provided evidence. In the DCSO’s own words regarding their experience during the audit, “We experienced a transparent and comprehensive audit process and appreciate the professional approach as well as the commitment shown by AWS in addressing all our inquiries.”
Audit results
The audit was carried out and completed according to the assessment criteria that were mutually agreed upon by AWS and auditors on behalf of participating members. After a joint review by the auditors and AWS, the auditors finalized the audit report. The results of the GDV joint audit are only available to the participating members and their regulators. The results provide participating members with assurance regarding the AWS controls environment, helping members remove compliance blockers, accelerate their adoption of AWS services, obtain confidence, and gain trust in AWS security controls.
If you have feedback about this post, submit comments in the Comments section below. If you have questions about this post, contact AWS Support.
The design of cloud workloads can be a complex task, where a perfect and universal solution doesn’t exist. We should balance all the different trade-offs and find an optimal solution based on our context. But how does it work in practice? Which guiding principles should we follow? Which are the most important areas we should focus on?
In this blog, we will try to answer some of these questions by sharing a set of resources related to the AWS Well-Architected Framework. The Framework shares a set of methods to help you understand the pros and cons of decisions you make while building cloud systems. By following this resource, you will learn architectural best practices for designing and operating reliable, secure, efficient, cost-effective, and sustainable systems in the cloud. The framework is constantly updated; it evolves as the technology landscape changes. Check out the latest updates from June 2024.
The AWS Well-Architected Framework is constantly updated across all six pillars. The security pillar added a new best practice area: application security (AppSec). In this session, you can learn about the best practices highlighted in this area. Review four key domains: organization and culture, security of the pipeline, security in the pipeline, and dependency management. Each area provides a set of principles that you can implement and provides a complete view of how you design, develop, build, deploy, and operate secure workloads in the cloud.
Figure 1. Security should be part of the end-to-end development process, and implementing best practices both in the application code as well as in the underlying infrastructure components.
How can we integrate different systems as a consequence of an acquisition? Mergers and acquisitions operations bring different people with different backgrounds together, with a need of driving systems convergence. Both organization and technical challenges can arise in this scenario. The Mergers and Acquisitions (M&A) Lens is a collection of customer-proven design principles, best practices, and prescriptive guidance to help you integrate the IT systems of two or more organizations. This lens helps companies follow AWS prescribed best practices during technical integration, drive cost optimization, and expedite merger and acquisition value realization.
Figure 2. If the seller company runs on another cloud platform or on-premises, the acquirer should plan a cloud migration while guaranteeing continuity of service.
One of the best ways to become familiar with new concepts and methodologies consist of doing hands-on work to absorb the techniques properly. For each Let’s Architect! blog, we tend to share at least one workshop associated with the topic. The AWS Well-Architected Framework covers six different pillars, so today we share the AWS Well-Architected Labs to cover each area of the framework. Feel free to jump across the different workshops and start building!
Figure 3. Sustainability is one of the pillars in the framework. Asynchronous and scheduled processing are key techniques for improving the sustainability and costs of cloud architectures.
Distributed systems are difficult to design. It’s even more difficult to test them and prove they are working. Formal methods enable the early discovery of design bugs that can escape the guardrails of design reviews and automated testing only to get uncovered in production. This video shows how AWS uses P, an open source, state machine–based programming language for formal modelling and analysis of distributed systems.
You can learn from AWS engineers and architects how to use P for your own applications to find bugs early in the development process and increase developer velocity. This tool is used in AWS to reason out the correctness of cloud services (for example, Amazon Simple Storage Service and Amazon DynamoDB).
Figure 4. An example of a distributed system for processing transactions.
Thanks for reading! Hopefully, you got interesting insights into the methodologies for designing Well-Architected systems. In the next blog, we will talk about multi-region architectures. We will understand when they are actually needed, and which design principles should be applied.
To revisit any of our previous posts or explore the entire series, visit the Let’s Architect! page.
Figure 1: Example architecture configured in the previous blog post
The first phase of the NIST SP 800-61 framework is preparation, which was covered in part 1 of this two-part blog series. The following sections cover phase 2 (detection and analysis) and phase 3 (containment, eradication, and recovery) of the NIST framework, and demonstrate how Security Lake accelerates your incident response workflow by providing a central datastore of security logs and findings in a standardized format.
Consider a scenario where your security team has received an Amazon GuardDuty alert through Amazon EventBridge for anomalous user behavior. As a result, the team becomes aware of potential unintended data access. GuardDuty noted unusual IAM user activity for the AWS Identity and Access Management (IAM) user Service_Backup and generated a finding. The security team had set up a rule in EventBridge that sends an alert email notifying them of GuardDuty findings relating to IAM user activity. At this point, the security team is unsure if any malicious activity has occurred, however, the username is not familiar. The security team should investigate further to determine whether the finding is a false positive by querying data in Security Lake. In line with the NIST incident response framework, the team moves to phase 2 of this investigation.
Phase 2: Acquire, preserve, and document evidence
The security team wants to investigate which API calls the unfamiliar user has been making. First, the team checks AWS CloudTrail management activity for the user, and they can do that by using Security Lake. They want a list of that user’s activity, which will help them in several ways:
Give them a list of API calls that warrant further investigation (especially Create*)
Give an indication whether the activity is unusual or not (in the context of “typical” user activity within the account, team, user group, or individual user)
Give an indication of when potentially malicious activity might have started (user history)
The team can use Amazon Athena to query CloudTrail management events that were captured by Security Lake. In some cases, compromised user accounts might have existed for a long time previously as legitimate users and made tens of thousands of API calls. In such a case, how would a security team identify the calls that might need further investigation? A quick way to get a summary list of API calls the user has made would be to run a query like the following:
SELECT DISTINCT api.operation FROM amazon_security_lake_table_us_west_2_cloud_trail_mgmt_2_0
WHERE lower(actor.user.name) = 'service_backup'
From the results, the team can determine information and queries of interest to focus on for further investigation. To begin with, the security team uses the preceding query to enumerate the number and type of API calls made by the user, as shown in Figure 2.
Figure 2: Example API call summary made by an IAM user
The initial query results in Figure 2 show API calls that could indicate privilege elevation (creating users, attaching user policies, and similar calls are a good indicator). There are other API calls that indicate that additional resources may have been created, such as Amazon Simple Storage Service (Amazon S3) buckets and Amazon Elastic Compute Cloud (Amazon EC2) instances.
Note that in this early phase, the team didn’t time-bound the query. However, if there is a high degree of confidence that the team can focus on a specific time or date range, the query can be further modified. How would the team decide on a time period to focus on? When the team received the alert email from EventBridge, that email included information about the GuardDuty finding, including the time it was observed. The team can use that time as an anchor to search around.
The team now wants to look at the user’s activity in a bit more detail. To do that, they can use a query that returns more detail for each of the API calls the user has made:
SELECT time_dt AS "Time Date", metadata.product.name AS "Log Source", cloud.region, actor.user.type, actor.user.name, actor.user.account.uid AS "User AWS Acc ID", api.operation AS "API Operation", status AS "API Response", api.service.name AS "Service", api.request.data AS "Request Data"
FROM amazon_security_lake_table_us_west_2_cloud_trail_mgmt_2_0
WHERE lower(actor.user.name) = 'service_backup';
Figure 3: Example CloudTrail activity for an IAM user
Figure 3 shows the result of the example query. The team observes that the user created an S3 bucket and performed other management plane actions, including creating IAM users and attaching the administrator access policy to a newly created user. Attempts were made to create other resources such as Amazon EC2 instances, but these were not successful. So the team needs to do further investigation on the newly created IAM users and S3 buckets, but they don’t need to take further action on EC2 instances, at least for this user.
The team starts to focus on investigating the IAM permissions of the Service_Backup user because some resources created by this user could lead to privilege elevation (for example: CreateUser >> AttachPolicy >> CreateAccessKey). The team verifies that the policy attached to that new user was AdminAccess. The activities of this newly created user should be investigated. Now, with a broad idea of that user’s activity and the time the activity occurred, the security team wants to focus on IAM activity, so that they can understand what resources have been created. Those resources will likely also need to be investigated.
The team can use the following query to find more detail about the resources that the user has created, modified, or deleted. In this case, the user has also created additional IAM users and roles. The team uses timestamps to limit query results to a specific time range during which they believe the suspicious activity occurred, and can also focus on IAM activity specifically.
SELECT time_dt AS "Time", cloud.region AS "Region", actor.session.issuer AS "Role Issuer", actor.user.name AS "User Name", api.operation AS "API Call", json_extract(api.request.data, '$.userName') AS "Target Principal", json_extract(api.request.data, '$.policyArn') AS "Target Policy", json_extract(api.request.data, '$.roleName') AS "Target Role", actor.user.uid AS "User ID", user.name AS "Target Principal", status AS "Response Status", accountid AS "AWS Account"
FROM amazon_security_lake_table_us_west_2_cloud_trail_mgmt_2_0
WHERE (lower(api.operation) LIKE 'create%' OR lower(api.operation) LIKE 'attach%' OR lower(api.operation) LIKE 'delete%')
AND lower(api.service.name) = 'iam.amazonaws.com'
AND lower(actor.user.name) = 'service_backup'
AND time_dt BETWEEN TIMESTAMP '2024-03-01 00:00:00.000' AND TIMESTAMP  '2024-05-31 23:59:00.000';
Figure 4: CloudTrail IAM activity for a specific user with additional resource detail
This additional detail helps the security team focus on the resources created by the Service_Backup user. These will need to be investigated further and most likely quarantined. If further analysis is required, resources can be disabled, or (in some instances) copied over to a forensic account to conduct the analysis.
Having identified newly created IAM resources that require further investigation, the team now continues by focusing on the resources created in S3. Has the Service_Backup user put objects into that bucket? Have they interacted with objects in any other buckets? To do that, the team queries the S3 data events by using Athena, as follows:
SELECT time_dt AS "Time Date", cloud.region AS "Region", actor.user.type, actor.user.name AS "User Name", api.operation AS "API Call", status AS "Status", api.request.data AS "Request Data", accountid AS "AWS Account ID"
FROM amazon_security_lake_table_us_west_2_s3_data_2_0
WHERE lower(actor.user.name) = 'service_backup';
The security team discovers that the Service_Backup user created an S3 bucket named breach.notify and uploaded a file named data-locked-xxx.txt in the bucket (the bucket name is also returned in the query results shown in Figure 3). Additionally, they see GetObject API calls for potentially sensitive data, followed by DeleteObject API calls for the same data and additional potentially sensitive data files. These are a group of CSV files, for example cc-data-2.csv, as shown in Figure 5.
Figure 5: Example Amazon S3 API activity for an IAM user
Now the security team has two important goals:
Protect and recover their data and resources
Make sure that any applications that are reliant on those resources or data are available and serving customers
The security team knows that their S3 buckets do contain sensitive data, and they need a quick way to understand which files may be of value to a threat actor. Because the security team was able to quickly investigate their S3 data logs and determine that files have indeed been downloaded and deleted, they already have actionable information. To enrich that with additional context, the team needs a way to verify whether the file contains sensitive data. Amazon Macie can be configured to detect sensitive data in S3 buckets and natively integrate with Security Hub. The team had already configured Macie to scan their buckets and provide alerts if potentially sensitive data is discovered. The team can continue to use Athena to query Security Hub data stored in Security Lake, to see if the Macie results could be related to those files or buckets. The team looks for such findings that were generated around the time that the breach.notify S3 bucket was created, with the unusually named object uploaded, through the following Athena query:
SELECT time_dt AS "Date/Time", metadata.product.name AS "Log Source", cloud.account.uid AS "AWS Account ID", cloud.region AS "AWS Region", resources[1].type AS "Resource Type", resources[1].uid AS "Bucket ARN", resources[2].type AS "Resource Type 2", resources[2].uid AS "Object Name", finding_info.desc AS "Finding summary" FROM amazon_security_lake_table_us_west_2_sh_findings_2_0
WHERE cloud.account.uid = '<YOUR_AWS_ACCOUNT_ID>'
AND lower(metadata.product.name) = 'macie'
AND time_dt BETWEEN TIMESTAMP '2024-03-10 00:00:00.000' AND TIMESTAMP  '2024-03-14 23:59:00.000';
Figure 6: Example Amazon Macie finding summary for data in S3 buckets
As Figure 6 shows, the team used the preceding query to pull just the information they needed to help them understand whether there is likely sensitive information in the bucket, which files contain that information, and what kind of information it is. From these results, it appears that the files listed do contain sensitive information, which appears to be credit card related data.
It’s time to stop and briefly review what the team now knows, and what still needs to be done. The team established that the Service_Backup user created additional IAM users and assigned wide-ranging permissions to those users. They also found that the Service_Backup user downloaded what appears to be confidential data, and then deleted those files from the customer’s buckets. Meanwhile, the Service_Backup user created a new S3 bucket and stored ransom files in it. In addition to this, that user also created IAM roles and attempted to create EC2 instances. In our example scenario, the first part of the investigation is complete.
There are a few things to note about what the team has done so far with Security Lake. First, because they’ve set up Security Lake across their entire organization, the team can query results from accounts in their organization, for various types of resources. That in itself saves a significant amount of time during the investigative process. Additionally, the team has seamlessly queried different sets of data to get an outcome—so far they have queried CloudTrail management events, S3 data events, and Macie findings through Security Hub—with the preceding queries done through Security Lake, directly from the Athena console, with no account or role switching, and no tool switching.
Next, we’ll move on to the containment step.
Phase 3: Containment, eradication, and recovery
Having gathered sufficient evidence in the previous phases to act, it’s now time for the team to contain this incident and focus on the AWS API by using either the AWS Management Console, the AWS CLI, or other tools. For the purposes of this blog post, we’ll use the CLI tools.
The team needs to perform several actions to contain the incident. They want to reduce the risk of further data exposure and the creation, modification, or deletion of resources in these AWS accounts. First, they will disable the Service_Backup user’s access and subsequently investigate and assess whether to disable the access of the IAM principal which created that user. Additionally, because Service_Backup created other IAM users, those users must also be investigated using the same process outlined earlier.
After completing the steps to help prevent further access of the impacted IAM users, and restoring relevant data in impacted S3 buckets, the team now turns their attention to the additional resources created by the now-disabled user. Because these resources include IAM resources, the team needs a list of what has been created and deleted. They could see that information from earlier queries, but now decide to focus just on IAM resources by using the following example query;
SELECT time_dt AS "Time", cloud.region AS "Region", actor.session.issuer AS "Role Issuer", actor.user.name AS "User Name", api.operation AS "API Call", json_extract(api.request.data, '$.userName') AS "Target Principal", json_extract(api.request.data, '$.policyArn') AS "Target Policy", json_extract(api.request.data, '$.roleName') AS "Target Role", actor.user.uid AS "User ID", user.name AS "Target Principal", status AS "Response Status", accountid AS "AWS Account"
FROM amazon_security_lake_table_us_west_2_cloud_trail_mgmt_2_0
WHERE (lower(api.operation) LIKE 'create%' OR lower(api.operation) LIKE 'attach%' OR lower(api.operation) LIKE 'delete%')
AND lower(api.service.name) = 'iam.amazonaws.com'
AND time_dt BETWEEN TIMESTAMP '2024-03-01 00:00:00.000' AND TIMESTAMP  '2024-05-31 23:59:00.000';
This query returns a concise and informative list of activities for several users. There is a separate column for the role name or the user ID, corresponding to IAM roles and users, respectively, as shown in Figure 7.
After completing these tasks, the security team now confirms with the application owners that application recovery is complete or ongoing. They will subsequently review the event and undertake phase 4 of the NIST framework (post-incident activity) to find the root cause, look for opportunities for improvement, and work on remediating any configuration or design flaws that led to the initial breach.
Conclusion
This is the second post in a two-part series about accelerating security incident response with Security Lake. We used anomalous IAM user activity as an incident example to show how you can use Security Lake as a central repository for your security logs and findings, to accelerate the incident response process.
With Security Lake, your security team is empowered to use analytics tools like Amazon Athena to run queries against a central point of security logs and findings from various security data sources, including management logs and S3 data logs from AWS CloudTrail, Amazon Macie findings, Amazon GuardDuty findings, and more.
If you have feedback about this post, submit comments in the Comments section below. If you have questions about this post, contact AWS Support.
In today’s world, technology is quickly evolving and some practices that were once considered the gold standard are quickly becoming outdated. At Cloudflare, we stay close to industry changes to ensure that we can provide the best solutions to our customers. One practice that we’re continuing to see in use that no longer serves its original purpose is certificate pinning. In this post, we’ll dive into certificate pinning, the consequences of using it in today’s Public Key Infrastructure (PKI) world, and alternatives to pinning that offer the same level of security without the management overhead.
PKI exists to help issue and manage TLS certificates, which are vital to keeping the Internet secure – they ensure that users access the correct applications or servers and that data between two parties stays encrypted. The mis-issuance of a certificate can pose great risk. For example, if a malicious party is able to issue a TLS certificate for your bank’s website, then they can potentially impersonate your bank and intercept that traffic to get access to your bank account. To prevent a mis-issued certificate from intercepting traffic, the server can give a certificate to the client and say “only trust connections if you see this certificate and drop any responses that present a different certificate” – this practice is called certificate pinning.
In the early 2000s, it was common for banks and other organizations that handle sensitive data to pin certificates to clients. However, over the last 20 years, TLS certificate issuance has evolved and changed, and new solutions have been developed to help customers achieve the security benefit they receive through certificate pinning, with simpler management, and without the risk of disruption.
Cloudflare’s mission is to help build a better Internet, which is why our teams are always focused on keeping domains secure and online.
Why certificate pinning is causing more outages now than it did before
Certificate pinning is not a new practice, so why are we emphasizing the need to stop using it now? The reason is that the PKI ecosystem is moving towards becoming more agile, flexible, and secure. As a part of this change, certificate authorities (CAs) are starting to rotate certificates and their intermediates, certificates that bridge the root certificate and the domain certificate, more frequently to improve security and encourage automation.
These more frequent certificate rotations are problematic from a pinning perspective because certificate pinning relies on the exact matching of certificates. When a certificate is rotated, the new certificate might not match the pinned certificate on the client side. If the pinned certificate is not updated to reflect the contents of the rotated certificate, the client will reject the new certificate, even if it’s valid and issued by the same CA. This mismatch leads to a failure in establishing a secure connection, causing the domain or application to become inaccessible until the pinned certificate is updated.
Since the start of 2024, we have seen the number of customer reported outages caused by certificate pinning significantly increase. (As of this writing, we are part way through July and Q3 has already seen as many outages as the last three quarters of 2023 combined.)
We can attribute this rise to two major events: Cloudflare migrating away from using DigiCert as a certificate authority and Google and Let’s Encrypt intermediate CA rotations.
Before migrating customer’s certificates away from using DigiCert as the CA, Cloudflare sent multiple notifications to customers to inform them that they should update or remove their certificate pins, so that the migration does not impact their domain’s availability.
However, what we’ve learned is that almost all customers that were impacted by the change were unaware that they had a certificate pin in place. One of the consequences of using certificate pinning is that the “set and forget” mentality doesn’t work, now that certificates are being rotated more frequently. Instead, changes need to be closely monitored to ensure that a regular certificate renewal doesn’t cause an outage. This goes to show that to implement certificate pinning successfully, customers need a robust system in place to track certificate changes and implement them.
We built our Universal SSL pipeline to be resilient and redundant, ensuring that we can always issue and renew a TLS certificate on behalf of our customers, even in the event of a compromise or revocation. CAs are starting to make changes like more frequent certificate rotations to encourage a move towards a more secure ecosystem. Now, it’s up to domain owners to stop implementing legacy practices like certificate pinning, which cause breaking changes, and instead start adopting modern standards that aim to provide the same level of security, but without the management overhead or risk.
Modern standards & practices are making the need for certificate pinning obsolete
Shorter certificate lifetimes
Over the last few years, we have seen certificate lifetimes quickly decrease. Before 2011, a certificate could be valid for up to 96 months (eight years) and now, in 2024, the maximum validity period for a certificate is 1 year. We’re seeing this trend continue to develop, with Google Chrome pushing for shorter CA, intermediate, and certificate lifetimes, advocating for 3 month certificate validity as the new standard.
This push improves security and redundancy of the entire PKI ecosystem in several ways. First, it reduces the scope of a compromise by limiting the amount of time that a malicious party could control a TLS certificate or private key. Second, it reduces reliance on certificate revocation, a process that lacks standardization and enforcement by clients, browsers, and CAs. Lastly, it encourages automation as a replacement for legacy certificate practices that are time-consuming and error-prone.
Cloudflare is moving towards only using CAs that follow the ACME (Automated Certificate Management Environment) protocol, which by default, issues certificates with 90 day validity periods. We have already started to roll this out to Universal SSL certificates and have removed the ability to issue 1-year certificates as a part of our reduced usage of DigiCert.
Regular rotation of intermediate certificates
The CAs that Cloudflare partners with, Let’s Encrypt and Google Trust Services, are starting to rotate their intermediate CAs more frequently. This increased rotation is beneficial from a security perspective because it limits the lifespan of intermediate certificates, reducing the window of opportunity for attackers to exploit a compromised intermediate. Additionally, regular rotations make it easier to revoke an intermediate certificate if it becomes compromised, enhancing the overall security and resiliency of the PKI ecosystem.
Cloudflare customers using Advanced Certificate Manager have the ability to choose their issuing CA. The issue is that even if Cloudflare uses the same CA for a certificate renewal, there is no guarantee that the same certificate chain (root or intermediate) will be used to issue the renewed certificate. As a result, if pinning is used, a successful renewal could cause a full outage for a domain or application.
This happens because certificate pinning relies on the exact matching of certificates. When an intermediate certificate is rotated or changed, the new certificate might not match the pinned certificate on the client side. As a result, the client will reject the renewed certificate, even if it’s a valid certificate issued by the same CA. This mismatch leads to a failure on the client side, causing the domain to become inaccessible until the pinned certificate is updated to reflect the new intermediate certificate. This risk of an unexpected outage is a major downside of continuing to use certificate pinning, especially as CAs increasingly update their intermediates as a security measure.
Increased use of certificate transparency
Certificate transparency (CT) logs provide a standardized framework for monitoring and auditing the issuance of TLS certificates. CT logs help detect misissued or malicious certificates and Cloudflare customers can set up CT monitoring to receive notifications about any certificates issued for their domain. This provides a better mechanism for detecting certificate mis-issuance, reducing the need for pinning.
Why modern standards make certificate pinning obsolete
Together, these practices – shorter certificate lifetimes, regular rotations of intermediate certificates, and increased use of certificate transparency – address the core security concerns that certificate pinning was initially designed to mitigate. Shorter lifetimes and frequent rotations limit the impact of compromised certificates, while certificate transparency allows for real time monitoring and detection of misissued certificates. These advancements are automated, scalable, and robust and eliminate the need for the manual and error-prone process of certificate pinning. By adopting these modern standards, organizations can achieve a higher level of security and resiliency without the management overhead and risk associated with certificate pinning.
Reasons behind continued use of certificate pinning
Originally, certificate pinning was designed to prevent monster-in-the-middle (MITM) attacks by associating a hostname with a specific TLS certificate, ensuring that a client could only access an application if the server presented a certificate issued by the domain owner.
Certificate pinning was traditionally used to secure IoT (Internet of Things) devices, mobile applications, and APIs. IoT devices are usually equipped with more limited processing power and are oftentimes unable to perform software updates. As a result, they’re less likely to perform things like certificate revocation checks to ensure that they’re using a valid certificate. As a result, it’s common for these devices to come pre-installed with a set of trusted certificate pins to ensure that they can maintain a high level of security. However, the increased frequency of certificate changes poses significant risk, as many devices have immutable software, preventing timely updates to certificate pins during renewals.
Similarly, certificate pinning has been employed to secure Android and iOS applications, ensuring that only the correct certificates are served. Despite this, both Apple and Google warn developers against the use of certificate pinning due to the potential for failures if not implemented correctly.
Understanding the trade-offs of different certificate pinning implementations
While certificate pinning can be applied at various levels of the certificate chain, offering different levels of granularity and security, we don’t recommend it due to the challenges and risks associated with its use.
Pinning certificates at the root certificate
Pinning the root certificate instructs a client to only trust certificates issued by that specific Certificate Authority (CA).
Advantages:
Simplified management: Since root certificates have long lifetimes (>10 years) and rarely change, pinning at the root reduces the need to frequently update certificate pins, making this the easiest option in terms of management overhead.
Disadvantages:
Broader trust: Most Certificate Authorities (CAs) issue their certificates from one root, so pinning a root CA certificate enables the client to trust every certificate issued from that CA. However, this broader trust can be problematic. If the root CA is compromised, every certificate issued by that CA is also compromised, which significantly increases the potential scope and impact of a security breach. This broad trust can therefore create a single point of failure, making the entire ecosystem more vulnerable to attacks.
Neglected Maintenance: Root certificates are infrequently rotated, which can lead to a “set and forget” mentality when pinning them. Although it’s rare, CAs do change their roots and when this happens, a correctly renewed certificate will break the pin, causing an outage. Since these pins are rarely updated, resolving such outages can be time-consuming as engineering teams try to identify and locate where the outdated pins have been set.
Pinning certificates at the intermediate certificate
Pinning an intermediate certificate instructs a client to only trust certificates issued by a specific intermediate CA, issued from a trusted root CA. With lifetimes ranging from 3 to 10 years, intermediate certificates offer a better balance between security and flexibility.
Advantages:
Better security: Narrows down the trust to certificates issued by a specific intermediate CA.
Simpler management: With intermediate CA lifetimes spanning a few years, certificate pins require less frequent updates, reducing the maintenance burden.
Disadvantages:
Broad trust: While pinning on an intermediate certificate is more restrictive than pinning on a root certificate, it still allows for a broad range of certificates to be trusted.
Maintenance: Intermediate certificates are rotated more frequently than root certificates, requiring more regular updates to pinned certificates.
Less predictability: With CAs like Let’s Encrypt issuing their certificates from varying intermediates, it’s no longer possible to predict which certificate chain will be used during a renewal, making it more likely for a certificate renewal to break a certificate pin and cause an outage.
Pinning certificates at the leaf certificate
Pinning the leaf certificate instructs a client to only trust that specific certificate. Although this option offers the highest level of security, it also poses the greatest risk of causing an outage during a certificate renewal.
Advantages:
High security: Provides the highest level of security by ensuring that only a specific certificate is trusted, minimizing the risk of a monster-in-the-middle attack.
Disadvantages:
Risky: Requires careful management of certificate renewals to prevent outages.
Management burden: Leaf certificates have shorter lifetimes, with 90 days becoming the standard, requiring constant updates to the certificate pin to avoid a breaking change during a renewal.
Alternatives to certificate pinning
Given the risks and challenges associated with certificate pinning, we recommend the following as more effective and modern alternatives to achieve the same level of security (preventing a mis-issued certificate from intercepting traffic) that certificate pinning aims to provide.
Shorter certificate lifetimes
Using shorter certificate lifetimes ensures that certificates are regularly renewed and replaced, reducing the risk of misuse of a compromised certificate by limiting the window of opportunity for attackers.
By default, Cloudflare issues 90-day certificates for customers. Customers using Advanced Certificate Manager can request TLS certificates with lifetimes as short as 14 days.
CAA records to restrict which CAs can issue certificates for a domain
Certification Authority Authorization (CAA) DNS records allow domain owners to specify which CAs are allowed to issue certificates for their domain. This adds an extra layer of security by restricting issuance to trusted authorities, providing a similar benefit as pinning a root CA certificate. For example, if you’re using Google Trust Services as your CA, you can add the following CAA DNS record to ensure that only that CA issues certificates for your domain:
example.com CAA 0 issue "pki.goog"
By default, Cloudflare sets CAA records on behalf of customers to ensure that certificates can be issued from the CAs that Cloudflare partners with. Customers can choose to further restrict that list of CAs by adding their own CAA records.
Certificate Transparency & monitoring
Certificate Transparency (CT) provides the ability to monitor and audit certificate issuances. By logging certificates in publicly accessible CT logs, organizations are able to monitor, detect, and respond to misissued certificates at the time they are issued.
Cloudflare customers can set up CT Monitoring to receive notifications when certificates are issued in their domain. Today, we notify customers using the product about all certificates issued for their domains. In the future, we will allow customers to filter those notifications, so that they are only notified when an external party that isn’t Cloudflare issues a certificate for the owner’s domain. This product is available to all customers and can be enabled with the click of a button.
Multi-vantage point Domain Control Validation (DCV) checks to prevent mis-issuances
For a CA to issue a certificate, the domain owner needs to prove ownership of the domain by serving Domain Control Validation (DCV) records. While uncommon, one attack vector of DCV validation allows an actor to perform BGP hijacking to spoof the DNS response and trick a CA into mis-issuing a certificate. To prevent this form of attack, CAs have started to perform DCV validation checks from multiple locations to ensure that a certificate is only issued when a full quorum is met.
Cloudflare has developed its own solution that CAs can use to perform multi vantage point DCV checks. In addition, Cloudflare partners with CAs like Let’s Encrypt who continue to develop these checks to support new locations, reducing the risk of a certificate mis-issuance.
Specifying ACME account URI in CAA records
A new enhancement to the ACME protocol allows certificate requesting parties to specify an ACME account URI, the ID of the ACME account that will be requesting the certificates, in CAA records to tighten control over the certificate issuance process. This ensures that only certificates issued through an authorized ACME account are trusted, adding another layer of verification to certificate issuance. Let’s Encrypt supports this extension to CAA records which allows users with a Let’s Encrypt certificate to set a CAA DNS record, such as the following:
With this record, Let’s Encrypt subscribers can ensure that only Let’s Encrypt can issue certificates for their domain and that these certificates were only issued through their ACME account.
Cloudflare will look to support this enhancement automatically for customers in the future.
Conclusion
Years ago, certificate pinning was a valuable tool for enhancing security, but over the last 20 years, it has failed to keep up with new advancements in the certificate ecosystem. As a result, instead of providing the intended security benefit, it has increased the number of outages caused during a successful certificate renewal. With new enhancements in certificate issuance standards and certificate transparency, we’re encouraging our customers and the industry to move towards adopting those new standards and deprecating old ones.
If you’re a Cloudflare customer and are required to pin your certificate, the only way to ensure a zero-downtime renewal is to upload your own custom certificates. We recommend using the staging network to test your certificate renewal to ensure you have updated your certificate pin.
A top-level domain (TLD) is the part of a URL that comes after the last dot in a domain name. While most are familiar with the first TLDs of .com, .net, and .org, there are more than 1,400 TLDs. fTLD Registry (fTLD) is a global coalition of banks, insurance companies, and financial services trade associations who ensure the .Bank and .Insurance TLDs are governed in the best interests of the financial sector and their customers.
The challenge
In 2011, fTLD was formed to secure and manage .Bank and .Insurance. Due to the high risk of fraud in the financial sector, keeping domains (websites and email) secure and out of the hands of malicious actors was paramount – and that can’t be done without close, careful security monitoring. Unfortunately, fTLD was initially dependent on a monitoring solution that required manual compliance work, which made it difficult to get actionable information to its customers and partners. When they began to seek out a replacement solution, fTLD realized that Zabbix promised exactly the features they required, which prompted them to make the switch.
The solution
For every domain in .Bank and .Insurance that meets minimum technical requirements, Zabbix’s system performs multiple security compliance checks. These checks cover a range of domain security features to ensure .Bank and .Insurance websites and email services have implemented a multi-layered domain defense by way of the Security Requirements required by fTLD. Specifically, Zabbix checks and monitors for:
Authoritative name servers, which guarantee that the name servers for .Bank and .Insurance websites have the required security features.
Enhanced DNS security, which involves the proper validation of DNS Security Extensions (DNSSEC) with strong cryptographic algorithms to prevent unauthorized changes to domain data and cyberattacks, including domain spoofing and domain hijacking.
Digital identity and robust encryption, which confirm TLS certificates and TLS version requirements for secure web connections and encrypts all communications for the safe and secure transmission of personal information and financial transactions.
Email security, which increases the deliverability of email and checks for the deployment of DMARC and SPF to protect against phishing and spoofing.
When Zabbix detects an issue, it automatically notifies involved parties, including the registrar and the customer using the domain. As a client, fTLD has access to all the security monitoring data via a custom dashboard. Zabbix puts critical compliance security monitoring information at fTLD’s fingertips, helping them make good on their promise of airtight security for banks, insurers, and producers and their customers through .Bank and .Insurance domains.
The results
Heather Diaz, Vice President, Compliance and Policy, leads the security function for fTLD and attests that:
“With Zabbix as a partner, we have peace of mind knowing that domain security is closely monitored. We can then focus on engaging with customers to help them get the full cyber benefits of using .Bank and .Insurance to protect their brand and their customer data.”
By entrusting Zabbix with security monitoring, fTLD has seen a variety of benefits, including:
Considerable growth in overall security compliance, as Zabbix monitoring has provided better, more accessible, and more reliable security information.
A tangible boost in productivity, thanks to automated customer and partner notifications.
A bird’s-eye view of stats across all domains as well as detailed information for individual domains.
Adaptive compliance security monitoring through daily checks, which help maintain a proactive defense against cyberattacks.
Security expertise from Zabbix to ensure that fTLD’s Security Requirements represent best practices and security measures to ensure the security of .Bank and .Insurance domains and their customers’ well-placed trust.
In conclusion
fTLD is changing the way banks, insurers, and producers around the world interact with their customers by offering trusted, verified, more secure domains. They trust Zabbix to guarantee a multi-layered domain defense strategy by alerting fTLD and its customers to detected anomalies or security issues.
To learn more about what Zabbix can do for customers in banking and finance, visit us here.
This post is written in collaboration with Clarisa Tavolieri, Austin Rappeport and Samantha Gignac from Zurich Insurance Group.
The growth in volume and number of logging sources has been increasing exponentially over the last few years, and will continue to increase in the coming years. As a result, customers across all industries are facing multiple challenges such as:
Balancing storage costs against meeting long-term log retention requirements
Bandwidth issues when moving logs between the cloud and on premises
Resource scaling and performance issues when trying to analyze massive amounts of log data
Keeping pace with the growing storage requirements, while also being able to provide insights from the data
Aligning license costs for Security Information and Event Management (SIEM) vendors with log processing, storage, and performance requirements. SIEM solutions help you implement real-time reporting by monitoring your environment for security threats and alerting on threats once detected.
The Zurich Cyber Fusion Center management team faced similar challenges, such as balancing licensing costs to ingest and long-term retention requirements for both business application log and security log data within the existing SIEM architecture. Zurich wanted to identify a log management solution to work in conjunction with their existing SIEM solution. The new approach would need to offer the flexibility to integrate new technologies such as machine learning (ML), scalability to handle long-term retention at forecasted growth levels, and provide options for cost optimization. In this post, we discuss how Zurich built a hybrid architecture on AWS incorporating AWS services to satisfy their requirements.
Solution overview
Zurich and AWS Professional Services collaborated to build an architecture that addressed decoupling long-term storage of logs, distributing analytics and alerting capabilities, and optimizing storage costs for log data. The solution was based on categorizing and prioritizing log data into priority levels between 1–3, and routing logs to different destinations based on priority. The following diagram illustrates the solution architecture.
The workflow steps are as follows:
All of the logs (P1, P2, and P3) are collected and ingested into an extract, transform, and load (ETL) service, AWS Partner Cribl’s Stream product, in real time. Capturing and streaming of logs is configured per use case based on the capabilities of the source, such as using built-in forwarders, installing agents, using Cribl Streams, and using AWS services like Amazon Data Firehose. This ETL service performs two functions before data reaches the analytics layer:
Data normalization and aggregation – The raw log data is normalized and aggregated in the required format to perform analytics. The process consists of normalizing log field names, standardizing on JSON, removing unused or duplicate fields, and compressing to reduce storage requirements.
Routing mechanism – Upon completing data normalization, the ETL service will apply necessary routing mechanisms to ingest log data to respective downstream systems based on category and priority.
Priority 1 logs, such as network detection & response (NDR), endpoint detection and response (EDR), and cloud threat detection services (for example, Amazon GuardDuty), are ingested directly to the existing on-premises SIEM solution for real-time analytics and alerting.
Priority 2 logs, such as operating system security logs, firewall, identity provider (IdP), email metadata, and AWS CloudTrail, are ingested into Amazon OpenSearch Service to enable the following capabilities. Previously, P2 logs were ingested into the SIEM.
Systematically detect potential threats and react to a system’s state through alerting, and integrating those alerts back into Zurich’s SIEM for larger correlation, reducing by approximately 85% the amount of data ingestion into Zurich’s SIEM. Eventually, Zurich plans to use ML plugins such as anomaly detection to enhance analysis.
Develop log and trace analytics solutions with interactive queries and visualize results with high adaptability and speed.
Reduce the average time to ingest and average time to search that accommodates the increasing scale of log data.
Priority 3 logs, such as logs from enterprise applications and vulnerability scanning tools, are not ingested into the SIEM or OpenSearch Service, but are forwarded to Amazon Simple Storage Service (Amazon S3) for storage. These can be queried as needed using one-time queries.
Copies of all log data (P1, P2, P3) are sent in real time to Amazon S3 for highly durable, long-term storage to satisfy the following:
Long-term data retention – S3 Object Lock is used to enforce data retention per Zurich’s compliance and regulatory requirements.
Cost-optimized storage – Lifecycle policies automatically transition data with less frequent access patterns to lower-cost Amazon S3 storage classes. Zurich also uses lifecycle policies to automatically expire objects after a predefined period. Lifecycle policies provide a mechanism to balance the cost of storing data and meeting retention requirements.
Historic data analysis – Data stored in Amazon S3 can be queried to satisfy one-time audit or analysis tasks. Eventually, this data could be used to train ML models to support better anomaly detection. Zurich has done testing with Amazon SageMaker and has plans to add this capability in the near future.
One-time query analysis – Simple audit use cases require historical data to be queried based on different time intervals, which can be performed using Amazon Athena and AWS Glue analytic services. By using Athena and AWS Glue, both serverless services, Zurich can perform simple queries without the heavy lifting of running and maintaining servers. Athena supports a variety of compression formats for reading and writing data. Therefore, Zurich is able to store compressed logs in Amazon S3 to achieve cost-optimized storage while still being able to perform one-time queries on the data.
As a future capability, supporting on-demand, complex query, analysis, and reporting on large historical datasets could be performed using Amazon OpenSearch Serverless. Also, OpenSearch Service supports zero-ETL integration with Amazon S3, where users can query their data stored in Amazon S3 using OpenSearch Service query capabilities.
The solution outlined in this post provides Zurich an architecture that supports scalability, resilience, cost optimization, and flexibility. We discuss these key benefits in the following sections.
Scalability
Given the volume of data currently being ingested, Zurich needed a solution that could satisfy existing requirements and provide room for growth. In this section, we discuss how Amazon S3 and OpenSearch Service help Zurich achieve scalability.
Amazon S3 is an object storage service that offers industry-leading scalability, data availability, security, and performance. The total volume of data and number of objects you can store in Amazon S3 are virtually unlimited. Based on its unique architecture, Amazon S3 is designed to exceed 99.999999999% (11 nines) of data durability. Additionally, Amazon S3 stores data redundantly across a minimum of three Availability Zones (AZs) by default, providing built-in resilience against widespread disaster. For example, the S3 Standard storage class is designed for 99.99% availability. For more information, check out the Amazon S3 FAQs.
Zurich uses AWS Partner Cribl’s Stream solution to route copies of all log information to Amazon S3 for long-term storage and retention, enabling Zurich to decouple log storage from their SIEM solution, a common challenge facing SIEM solutions today.
OpenSearch Service is a managed service that makes it straightforward to run OpenSearch without having to manage the underlying infrastructure. Zurich’s current on-premises SIEM infrastructure is comprised of more than 100 servers, all of which have to be operated and maintained. Zurich hopes to reduce this infrastructure footprint by 75% by offloading priority 2 and 3 logs from their existing SIEM solution.
To support geographies with restrictions on cross-border data transfer and to meet availability requirements, AWS and Zurich worked together to define an Amazon OpenSearch Service configuration that would support 99.9% availability using multiple AZs in a single region.
OpenSearch Service supports cross-region and cross-cluster queries, which helps with distributing analysis and processing of logs without moving data, and provides the ability to aggregate information across clusters. Since Zurich plans to deploy multiple OpenSearch domains in different regions, they will use cross-cluster search functionality to query data seamlessly across different regional domains without moving data. Zurich also configured a connector for their existing SIEM to query OpenSearch, which further allows distributed processing from on premises, and enables aggregation of data across data sources. As a result, Zurich is able to distribute processing, decouple storage, and publish key information in the form of alerts and queries to their SIEM solution without having to ship log data.
In addition, many of Zurich’s business units have logging requirements that could also be satisfied using the same AWS services (OpenSearch Service, Amazon S3, AWS Glue, and Amazon Athena). As such, the AWS components of the architecture were templatized using Infrastructure as Code (IaC) for consistent, repeatable deployment. These components are already being used across Zurich’s business units.
Cost optimization
In thinking about optimizing costs, Zurich had to consider how they would continue to ingest 5 TB per day of security log information just for their centralized security logs. In addition, lines of businesses needed similar capabilities to meet requirements, which could include processing 500 GB per day.
With this solution, Zurich can control (by offloading P2 and P3 log sources) the portion of logs that are ingested into their primary SIEM solution. As a result, Zurich has a mechanism to manage licensing costs, as well as improve the efficiency of queries by reducing the amount of information the SIEM needs to parse on search.
Because copies of all log data are going to Amazon S3, Zurich is able to take advantage of the different Amazon S3 storage tiers, such as using S3 Intelligent-Tiering to automatically move data among Infrequent Access and Archive Access tiers, to optimize the cost of retaining multiple years’ worth of log data. When data is moved to the Infrequent Access tier, costs are reduced by up to 40%. Similarly, when data is moved to the Archive Instant Access tier, storage costs are reduced by up to 68%.
Refer to Amazon S3 pricing for current pricing, as well as for information by region. Moving data to S3 Infrequent Access and Archive Access tiers provides a significant cost savings opportunity while meeting long-term retention requirements.
The team at Zurich analyzed priority 2 log sources, and based on historical analytics and query patterns, determined that only the most recent 7 days of logs are typically required. Therefore, OpenSearch Service was right-sized for retaining 7 days of logs in a hot tier. Rather than configuring UltraWarm and cold storage tiers for OpenSearch Service, copies of the remaining logs were simultaneously being sent to Amazon S3 for long-term retention and could be queried using Athena.
The combination of cost-optimization options is projected to reduce by 53% the cost of per GB of log data ingested and stored for 13 months when compared to the previous approach.
Flexibility
Another key consideration for the architecture was the flexibility to integrate with existing alerting systems and data pipelines, as well as the ability to incorporate new technology into Zurich’s log management approach. For example, Zurich also configured a connector for their existing SIEM to query OpenSearch, which further allows distributed processing from on premises and enables aggregation of data across data sources.
Within the OpenSearch Service software, there are options to expand log analysis using security analytics with predefined indicators of compromise across common log types. OpenSearch Service also offers the capability to integrate with ML capabilities such as anomaly detection and alert correlation to enhance log analysis.
In this post, we reviewed how Zurich was able to build a log data management architecture that provided the scalability, flexibility, performance, and cost-optimization mechanisms needed to meet their requirements.
Clarisa Tavolieri is a Software Engineering graduate with qualifications in Business, Audit, and Strategy Consulting. With an extensive career in the financial and tech industries, she specializes in data management and has been involved in initiatives ranging from reporting to data architecture. She currently serves as the Global Head of Cyber Data Management at Zurich Group. In her role, she leads the data strategy to support the protection of company assets and implements advanced analytics to enhance and monitor cybersecurity tools.
Austin Rappeport is a Computer Engineer who graduated from the University of Illinois Urbana/Champaign in 2011 with a focus in Computer Security. After graduation, he worked for the Federal Energy Regulatory Commission in the Office of Electric Reliability, working with the North American Electric Reliability Corporation’s Critical Infrastructure Protection Standards on both the audit and enforcement side, as well as standards development. Austin currently works for Zurich Insurance as the Global Head of Detection Engineering and Automation, where he leads the team responsible for using Zurich’s security tools to detect suspicious and malicious activity and improve internal processes through automation.
Samantha Gignac is a Global Security Architect at Zurich Insurance. She graduated from Ferris State University in 2014 with a Bachelor’s degree in Computer Systems & Network Engineering. With experience in the insurance, healthcare, and supply chain industries, she has held roles such as Storage Engineer, Risk Management Engineer, Vulnerability Management Engineer, and SOC Engineer. As a Cybersecurity Architect, she designs and implements secure network systems to protect organizational data and infrastructure from cyber threats.
Claire Sheridan is a Principal Solutions Architect with Amazon Web Services working with global financial services customers. She holds a PhD in Informatics and has more than 15 years of industry experience in tech. She loves traveling and visiting art galleries.
Jake Obi is a Principal Security Consultant with Amazon Web Services based in South Carolina, US, with over 20 years’ experience in information technology. He helps financial services customers improve their security posture in the cloud. Prior to joining Amazon, Jake was an Information Assurance Manager for the US Navy, where he worked on a large satellite communications program as well as hosting government websites using the public cloud.
Srikanth Daggumalli is an Analytics Specialist Solutions Architect in AWS. Out of 18 years of experience, he has over a decade of experience in architecting cost-effective, performant, and secure enterprise applications that improve customer reachability and experience, using big data, AI/ML, cloud, and security technologies. He has built high-performing data platforms for major financial institutions, enabling improved customer reach and exceptional experiences. He is specialized in services like cross-border transactions and architecting robust analytics platforms.
Freddy Kasprzykowski is a Senior Security Consultant with Amazon Web Services based in Florida, US, with over 20 years’ experience in information technology. He helps customers adopt AWS services securely according to industry best practices, standards, and compliance regulations. He is a member of the Customer Incident Response Team (CIRT), helping customers during security events, a seasoned speaker at AWS re:Invent and AWS re:Inforce conferences, and a contributor to open source projects related to AWS security.
Amazon Web Services (AWS) is pleased to announce the successful attestation of our conformance with the National Institute of Standards and Technology (NIST) Secure Software Development Framework (SSDF), Special Publication 800-218. This achievement underscores our ongoing commitment to the security and integrity of our software supply chain.
Executive Order (EO) 14028, Improving the Nation’s Cybersecurity (May 12, 2021) directs U.S. government agencies to take a variety of actions that “enhance the security of the software supply chain.” In accordance with the EO, NIST released the SSDF, and the Office and Management and Budget (OMB) issued Memorandum M-22-18, Enhancing the Security of the Software Supply Chain through Secure Software Development Practices, requiring U.S. government agencies to only use software provided by software producers who can attest to conformance with NIST guidance.
A FedRAMP certified Third Party Assessment Organization (3PAO) assessed AWS against the 42 security tasks in the SSDF. Our attestation form is available in the Cybersecurity and Infrastructure Security Agency (CISA) Repository for Software Attestations and Artifacts for our U.S. government agency customers to access and download. Per CISA guidance, agencies are encouraged to collect the AWS attestation directly from CISA’s repository.
As always, we value your feedback and questions. Reach out to the AWS Compliance team through the Contact Us page. To learn more about our other compliance and security programs, see AWS Compliance Programs.
If you have feedback about this post, submit comments in the Comments section below. If you have questions about this post, contact AWS Support.
Amazon Virtual Private Cloud (Amazon VPC) provides two options for controlling network traffic: network access control lists (ACLs) and security groups. A network ACL defines inbound and outbound rules that allow or deny traffic based on protocol, IP address range, and port range. Security groups determine which inbound and outbound traffic is allowed on a network interface, but they cannot explicitly deny traffic like a network ACL can. Every VPC subnet is associated with a network ACL that ultimately determines which traffic can enter or leave the subnet, even if a security group allows it. Network ACLs provide a layer of network controls that augment your security groups.
There are situations when you might want to deny specific sources or destinations within the range of network traffic allowed by security groups. For example, you want to deny inbound traffic from malicious sources on the internet, or you want to deny outbound traffic to ports or protocols used by exploits or malware. Security group rules can only control what traffic is allowed. If you want to deny specific traffic within the range of allowed traffic from security groups, you need to use network ACL rules. If you want to deny specific types of traffic in many VPCs, you need to update each network ACL associated with subnets in each of those VPCs. We heard from customers that implementing a baseline of common network ACL rules can be challenging to manage across many Amazon Web Services (AWS) accounts, so we expanded AWS Firewall Manager capabilities to make this easier.
AWS Firewall Manager network ACL security policies allow you to centrally manage network ACL rules for VPC subnets across AWS accounts in your organization. The following sections demonstrate how you can use network ACL policies to manage common network ACL rules that deny inbound and outbound traffic.
Deny inbound traffic using a network ACL security policy
If you have not already set up a Firewall Manager administrator account, see Firewall Manager prerequisites. Note that network ACL policies require your AWS Config configuration recorder to include the AWS::EC2::NetworkAcl and AWS::EC2::Subnet resource types.
Let’s review an example of how you can now use Firewall Manager to centrally manage a network ACL rule that denies inbound traffic from a public source IP range.
To deny inbound traffic:
Sign in to your Firewall Manager delegated administrator account, open the AWS Management Console, and go to Firewall Manager.
In the navigation pane, under AWS Firewall Manager, select Security policies.
On the Filter menu, select the AWS Region where your VPC subnets are defined, and choose Create policy. In this example, we select US East (N. Virginia).
Under Policy details, select Network ACL, and then choose Next.
Figure 1: Network ACL policy type and Region
On Policy name, enter a Policy name and Policy description.
Figure 2: Network ACL policy name and description
In the Network ACL policy rules section, select the Inbound rules tab.
In the First rules section, choose Add rules.
Figure 3: Add rules in the First rules section
In the Inbound rules window, choose Add inbound rules.
Figure 4: Add inbound rules
For Inbound rules, choose the following:
For Type, select All traffic.
For Protocol, select All.
For Port range, select All.
For Source, enter an IP address range that you want to deny. In this example, we use 192.0.2.0/24.
For Action, select Deny.
Choose Add Rules.
Figure 5: Configure a network ACL inbound rule
In Network ACL policy rules, under First rules, review the deny rule.
Figure 6: Review the inbound deny rule
Under Policy action, select the following:
Select Auto remediate any noncompliant resources.
Under Force Remediation, select Force remediate first rules. Firewall Manager compares your existing network ACL rules with rules defined in the policy. A conflict exists if a policy rule has the opposite action of an existing rule and overlaps with the existing rule’s protocol, address range, or port range. In these cases, Firewall Manager will not remediate the network ACL unless you enable force remediation.
Figure 7: Configure the policy action
Choose Next.
Policy scope, select the following:
Under AWS accounts this policy applies to, select the scope of accounts that apply. In this example, we include all accounts.
Under Resource type, select Subnet.
Under Resources, select the scope of resources that apply. In this example, we only include subnets that have a particular tag.
Figure 8: Configure the policy scope
Enable resource cleanup if you want Firewall Manager to remove the rules it added to network ACLs associated with subnets that are no longer in scope. To enable cleanup, select Automatically remove protections from resources that leave the policy scope, and choose Next.
Figure 9: Enable resource cleanup
Under Configure policy tags, define the tags you want to associate with your policy, and then choose Next.
Under Review and create policy, choose Next.
Before creating the Firewall Manager policy, the subnet is associated with a default network ACL, as shown in Figure 10.
Figure 10: Default network ACL rules before the subnet is in scope
As shown in Figure 11, the subnet is now associated with a network ACL managed by Firewall Manager. The original Allow rule has been preserved and moved to priority 5,000. The Deny rule has been added with priority 1.
Figure 11: Inbound rules in network ACL managed by Firewall Manager
Deny outbound traffic using a network ACL security policy
You can also use Firewall Manager to implement outbound network ACL rules to deny the use of ports used by malware or software vulnerabilities. In this example, we’re blocking the use of LDAP port 389.
Sign in to your Firewall Manager delegated administrator account and open the Firewall Manager console.
In the navigation pane, under AWS Firewall Manager, select Security policies.
On the Filter menu, select the AWS Region where your VPC subnets are defined, and choose Create policy. In this example, we select US East (N. Virginia).
Under Policy details, select Network ACL, and then choose Next.
Enter a Policy name and Policy description.
In the Network ACL policy rules section, select the Outbound rules tab.
In the First rules section, choose Add rules.
Figure 12: Add rules in the First rules section
Under Outbound rules, choose Add outbound rules.
In Outbound rules, select the following:
For Type, select LDAP (389).
For Destination, enter 0.0.0.0/0.
For Action, select Deny.
Choose Add Rules.
Figure 13: Configure a network ACL outbound rule
On the Network ACL policy rules page, under First rules, review the deny rule.
Figure 14: Review the outbound deny rule
In Policy action, under Policy action, select the following:
Select Auto remediate any noncompliant resources.
Under Force Remediation, select Force remediate first rules, and then choose Next.
Figure 15: Configure the policy action
Under Policy scope, choose the following:
Under AWS accounts this policy applies to, select the scope of accounts that apply. In this example, we include all accounts by selecting Include all accounts under my organization.
Under Resource type, select Subnet.
Under Resources, select the scope of resources that apply. In this example, we select Include only subnets that all the specified resource tags.
Figure 16: Configure the policy scope
On Resource cleanup, enable resource cleanup if you want Firewall Manager to remove rules it added to network ACLs associated with subnets that are no longer in scope. To enable resource cleanup, select Automatically remove protections from resources that leave the policy scope, and then choose Next.
Figure 17: Enable resource cleanup
Under Configure policy tags, define the tags you want to associate with your policy, and then choose Next.
Under Review and create policy, choose Next.
Before creating the Firewall Manager policy, the subnet is associated with a network ACL that already contains rules with priority 100 and 101, as shown in Figure 18.
Figure 18: Rules in original network ACL
As shown in Figure 19, the subnet is now associated with a network ACL managed by Firewall Manager. The original rules have been preserved and moved to priority 5,000 and 5,100. The Deny rule for LDAP has been added with priority 1.
Figure 19: Outbound rules in network ACL managed by Firewall Manager
Working with network ACLs managed by Firewall Manager
Firewall Manager network ACL policies allow you to manage up to 5 inbound and 5 outbound rules. Network ACLs can support a total of 20 inbound rules and 20 outbound rules by default. This limit can be increased up to 40 inbound rules and 40 outbound rules, but network performance might be impacted. Consider AWS Network Firewall if you need support for more rules and a broader set of features.
AWS accounts that are in scope of your Firewall Manager policy might have identities with permission to modify network ACLs created by Firewall Manager. You can use a service control policy (SCP) to deny AWS Identity and Access Management (IAM) actions that modify network ACLs if you want to make sure that they are exclusively managed by Firewall Manager. Firewall Manager uses service-linked roles, which are not restricted by SCPs. The following example SCP denies network ACL updates without restricting Firewall Manager:
Prior to AWS Firewall Manager network ACL security policies, you had to implement your own process to orchestrate updates to network ACLs across VPC subnets in your organization in AWS Organizations. AWS Firewall Manager network ACL security policies allow you to centrally define common network ACL rules that are automatically applied to VPC subnets across your organization, even as you add new accounts and resources. In this post, we demonstrated how you can use network ACL policies in a variety of scenarios, such as blocking ingress from malicious sources and blocking egress to destinations used by malware and exploits. You can also use network ACL policies to implement an allow list. For example, you might only want to allow egress to your on-premises network.
To provide the best experiences, we use technologies like cookies to store and/or access device information. Consenting to these technologies will allow us to process data such as browsing behavior or unique IDs on this site. Not consenting or withdrawing consent, may adversely affect certain features and functions.
Functional
Always active
The technical storage or access is strictly necessary for the legitimate purpose of enabling the use of a specific service explicitly requested by the subscriber or user, or for the sole purpose of carrying out the transmission of a communication over an electronic communications network.
Preferences
The technical storage or access is necessary for the legitimate purpose of storing preferences that are not requested by the subscriber or user.
Statistics
The technical storage or access that is used exclusively for statistical purposes.The technical storage or access that is used exclusively for anonymous statistical purposes. Without a subpoena, voluntary compliance on the part of your Internet Service Provider, or additional records from a third party, information stored or retrieved for this purpose alone cannot usually be used to identify you.
Marketing
The technical storage or access is required to create user profiles to send advertising, or to track the user on a website or across several websites for similar marketing purposes.


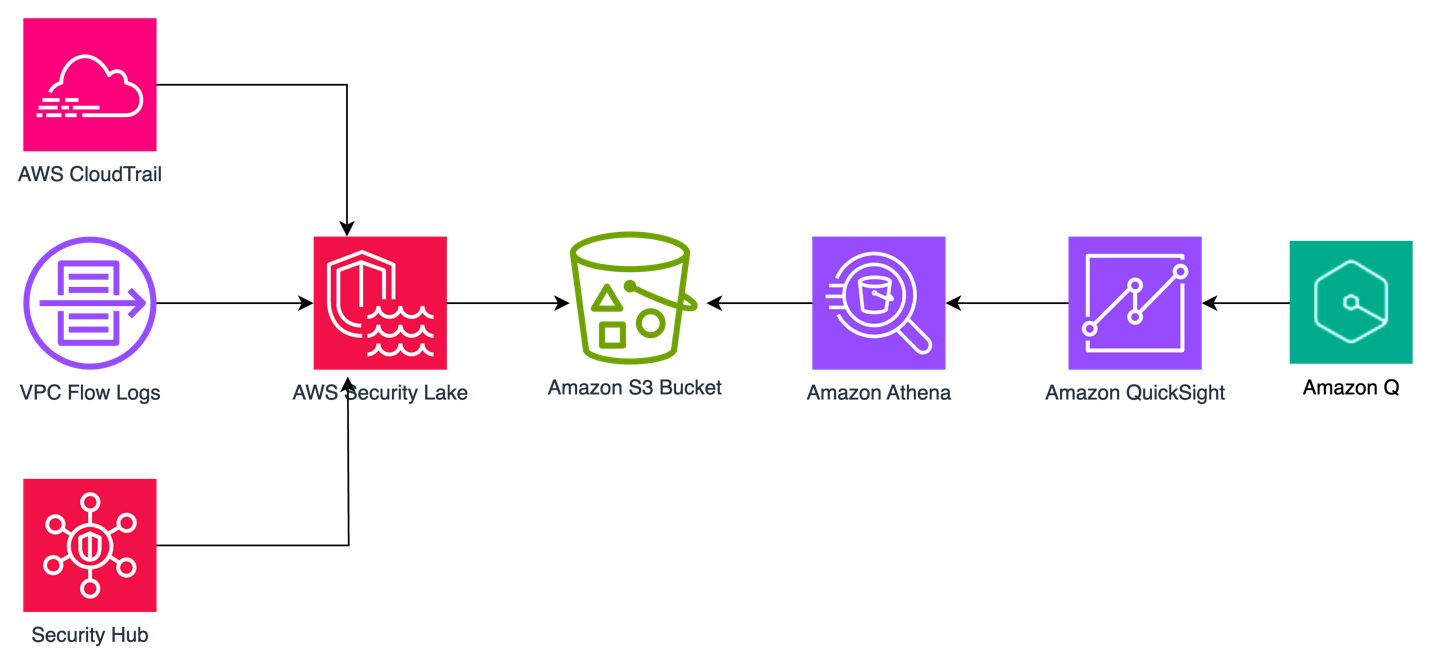
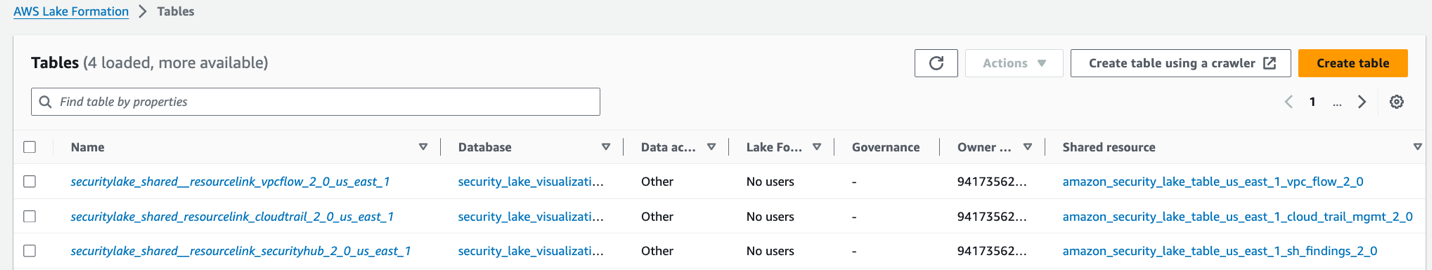


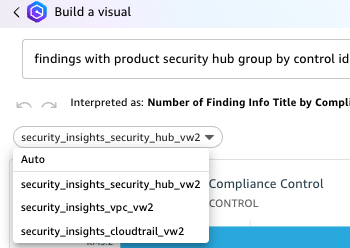


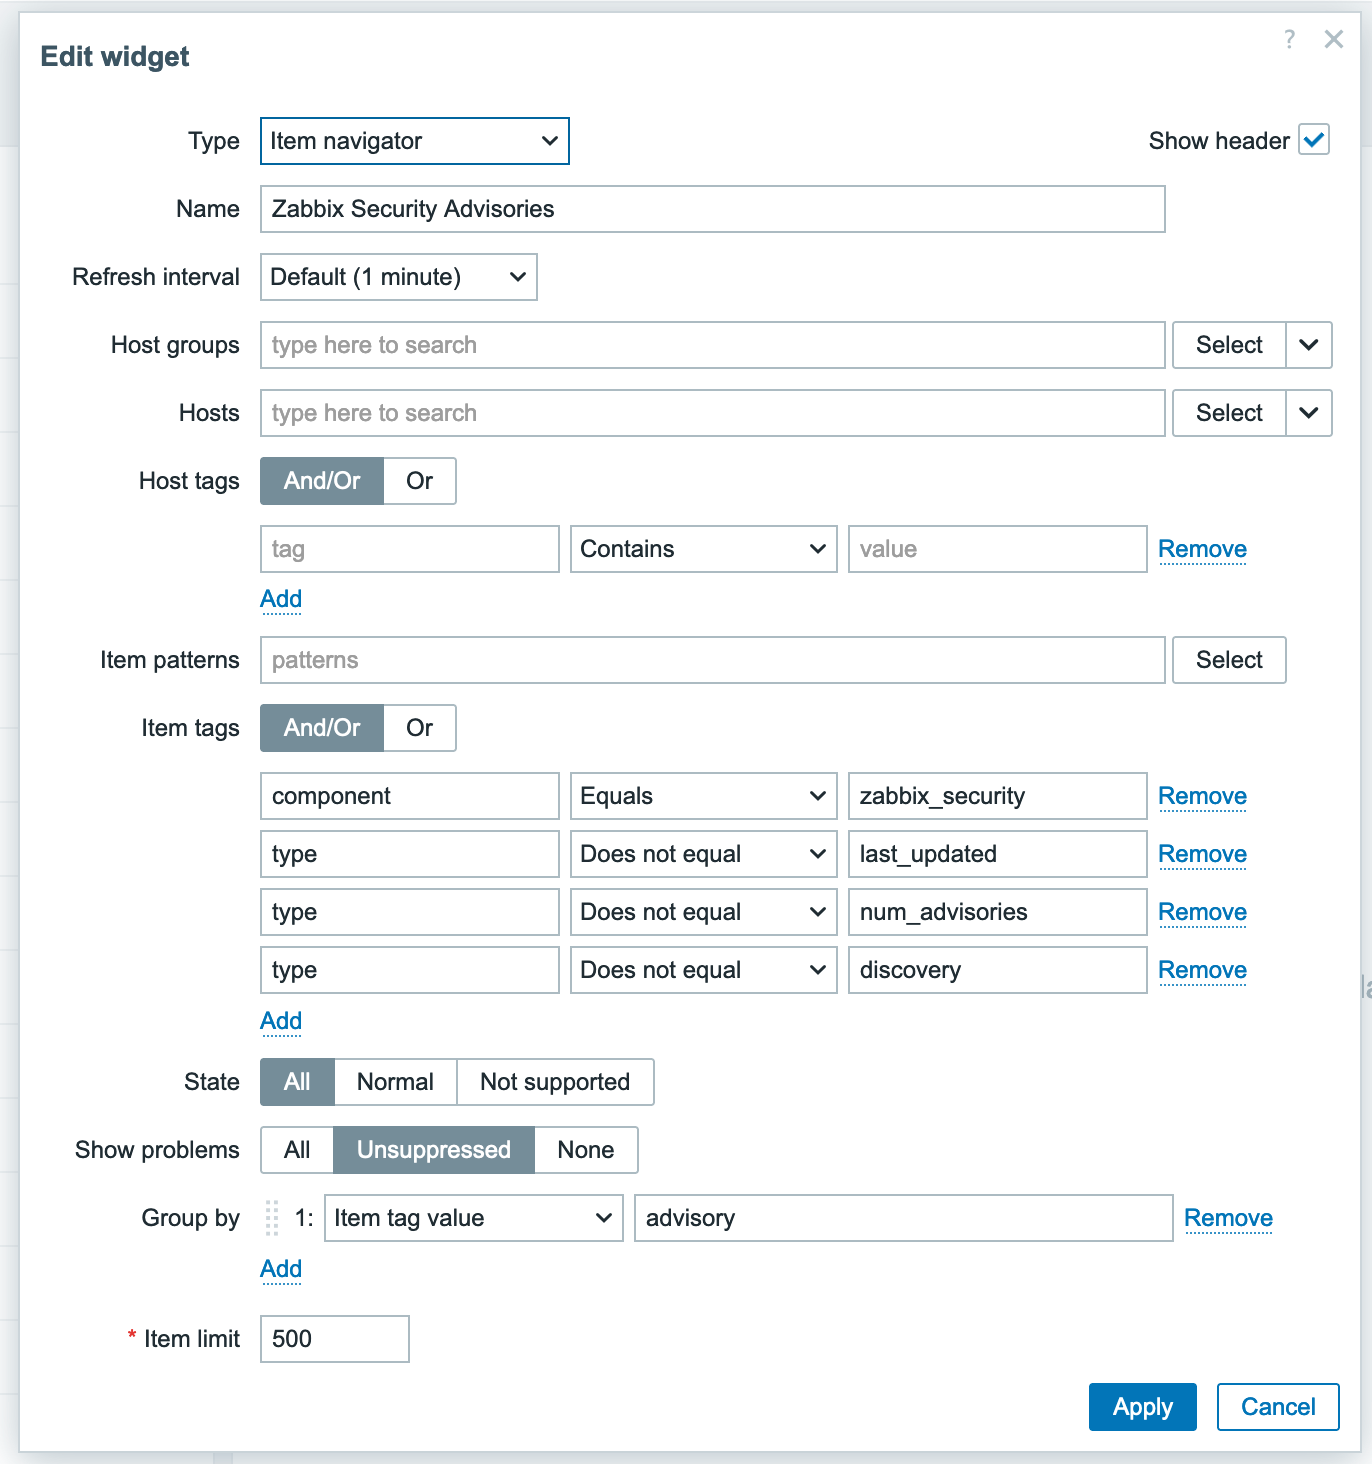
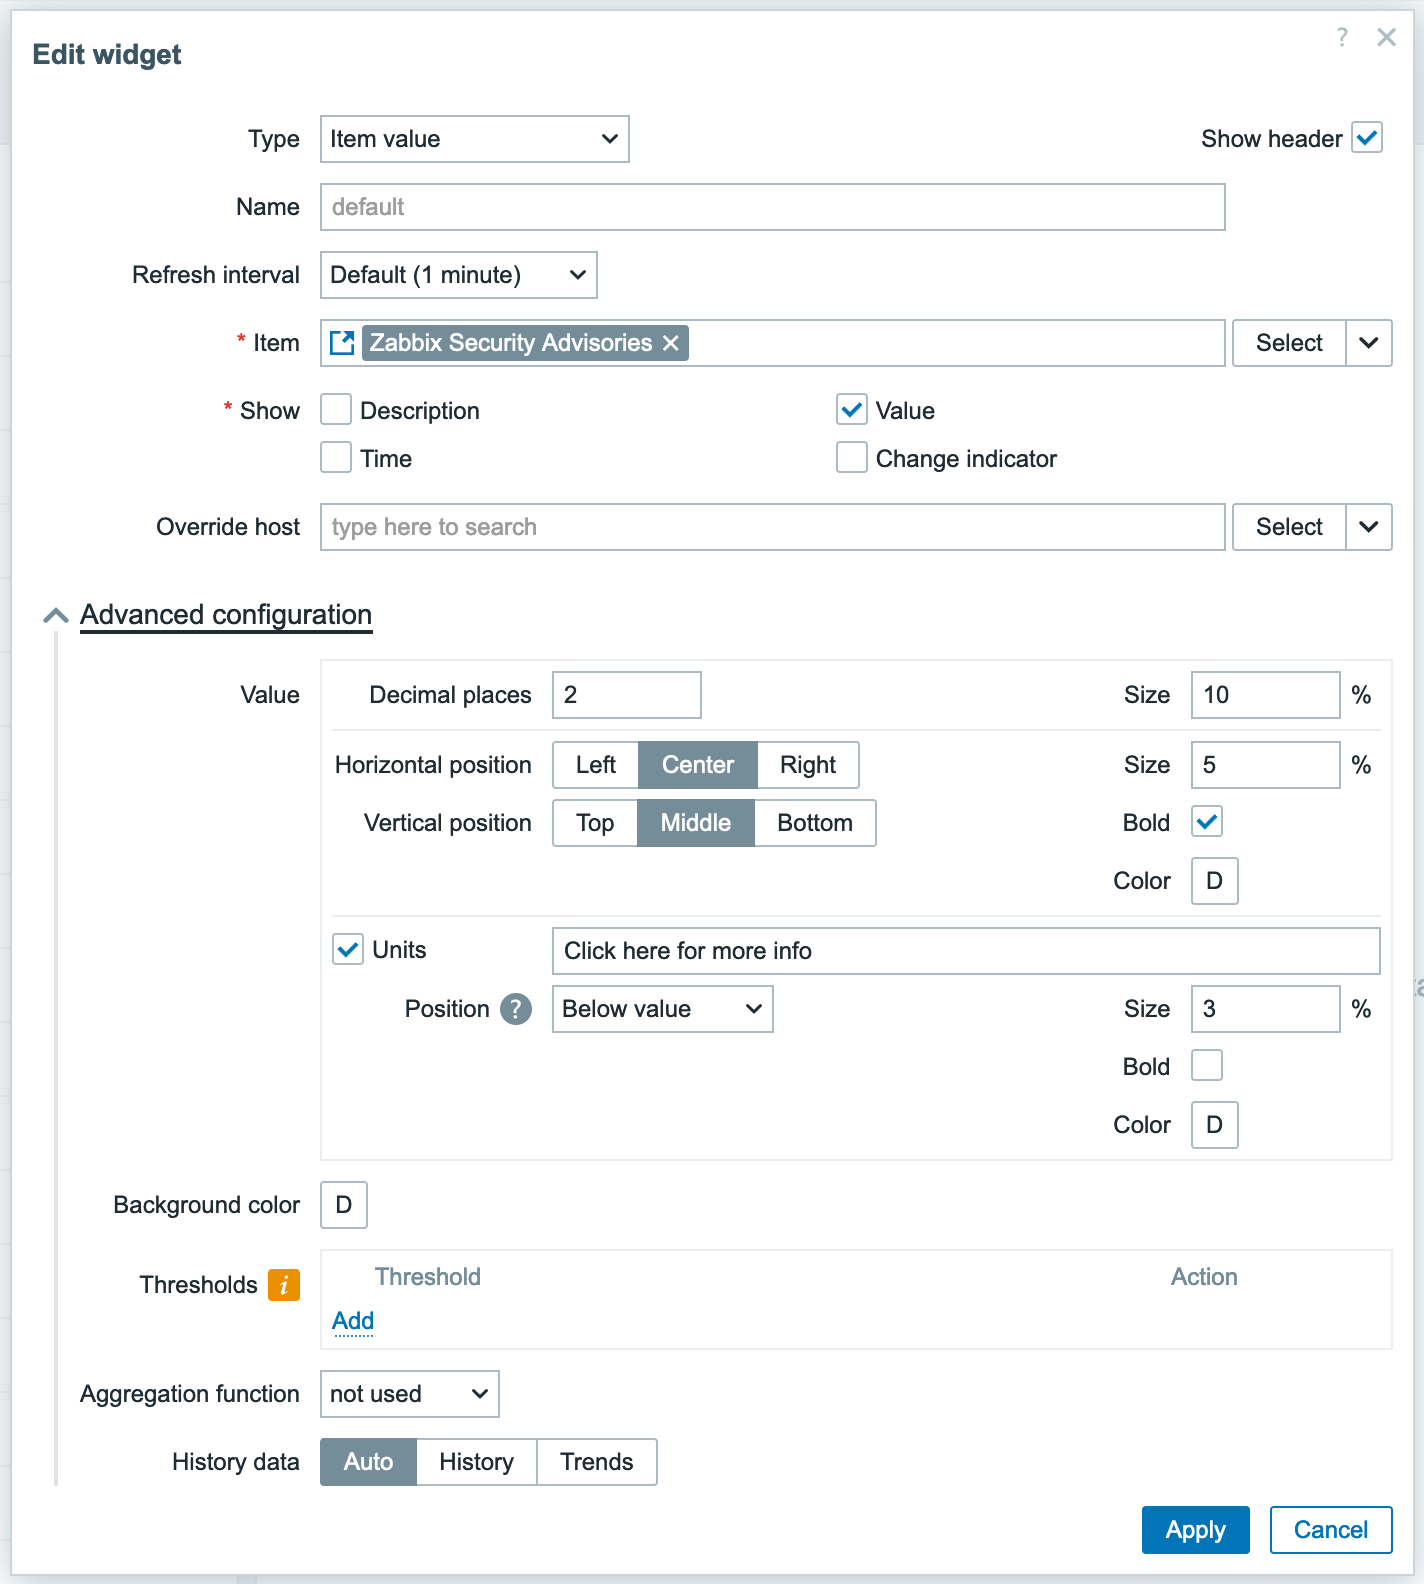
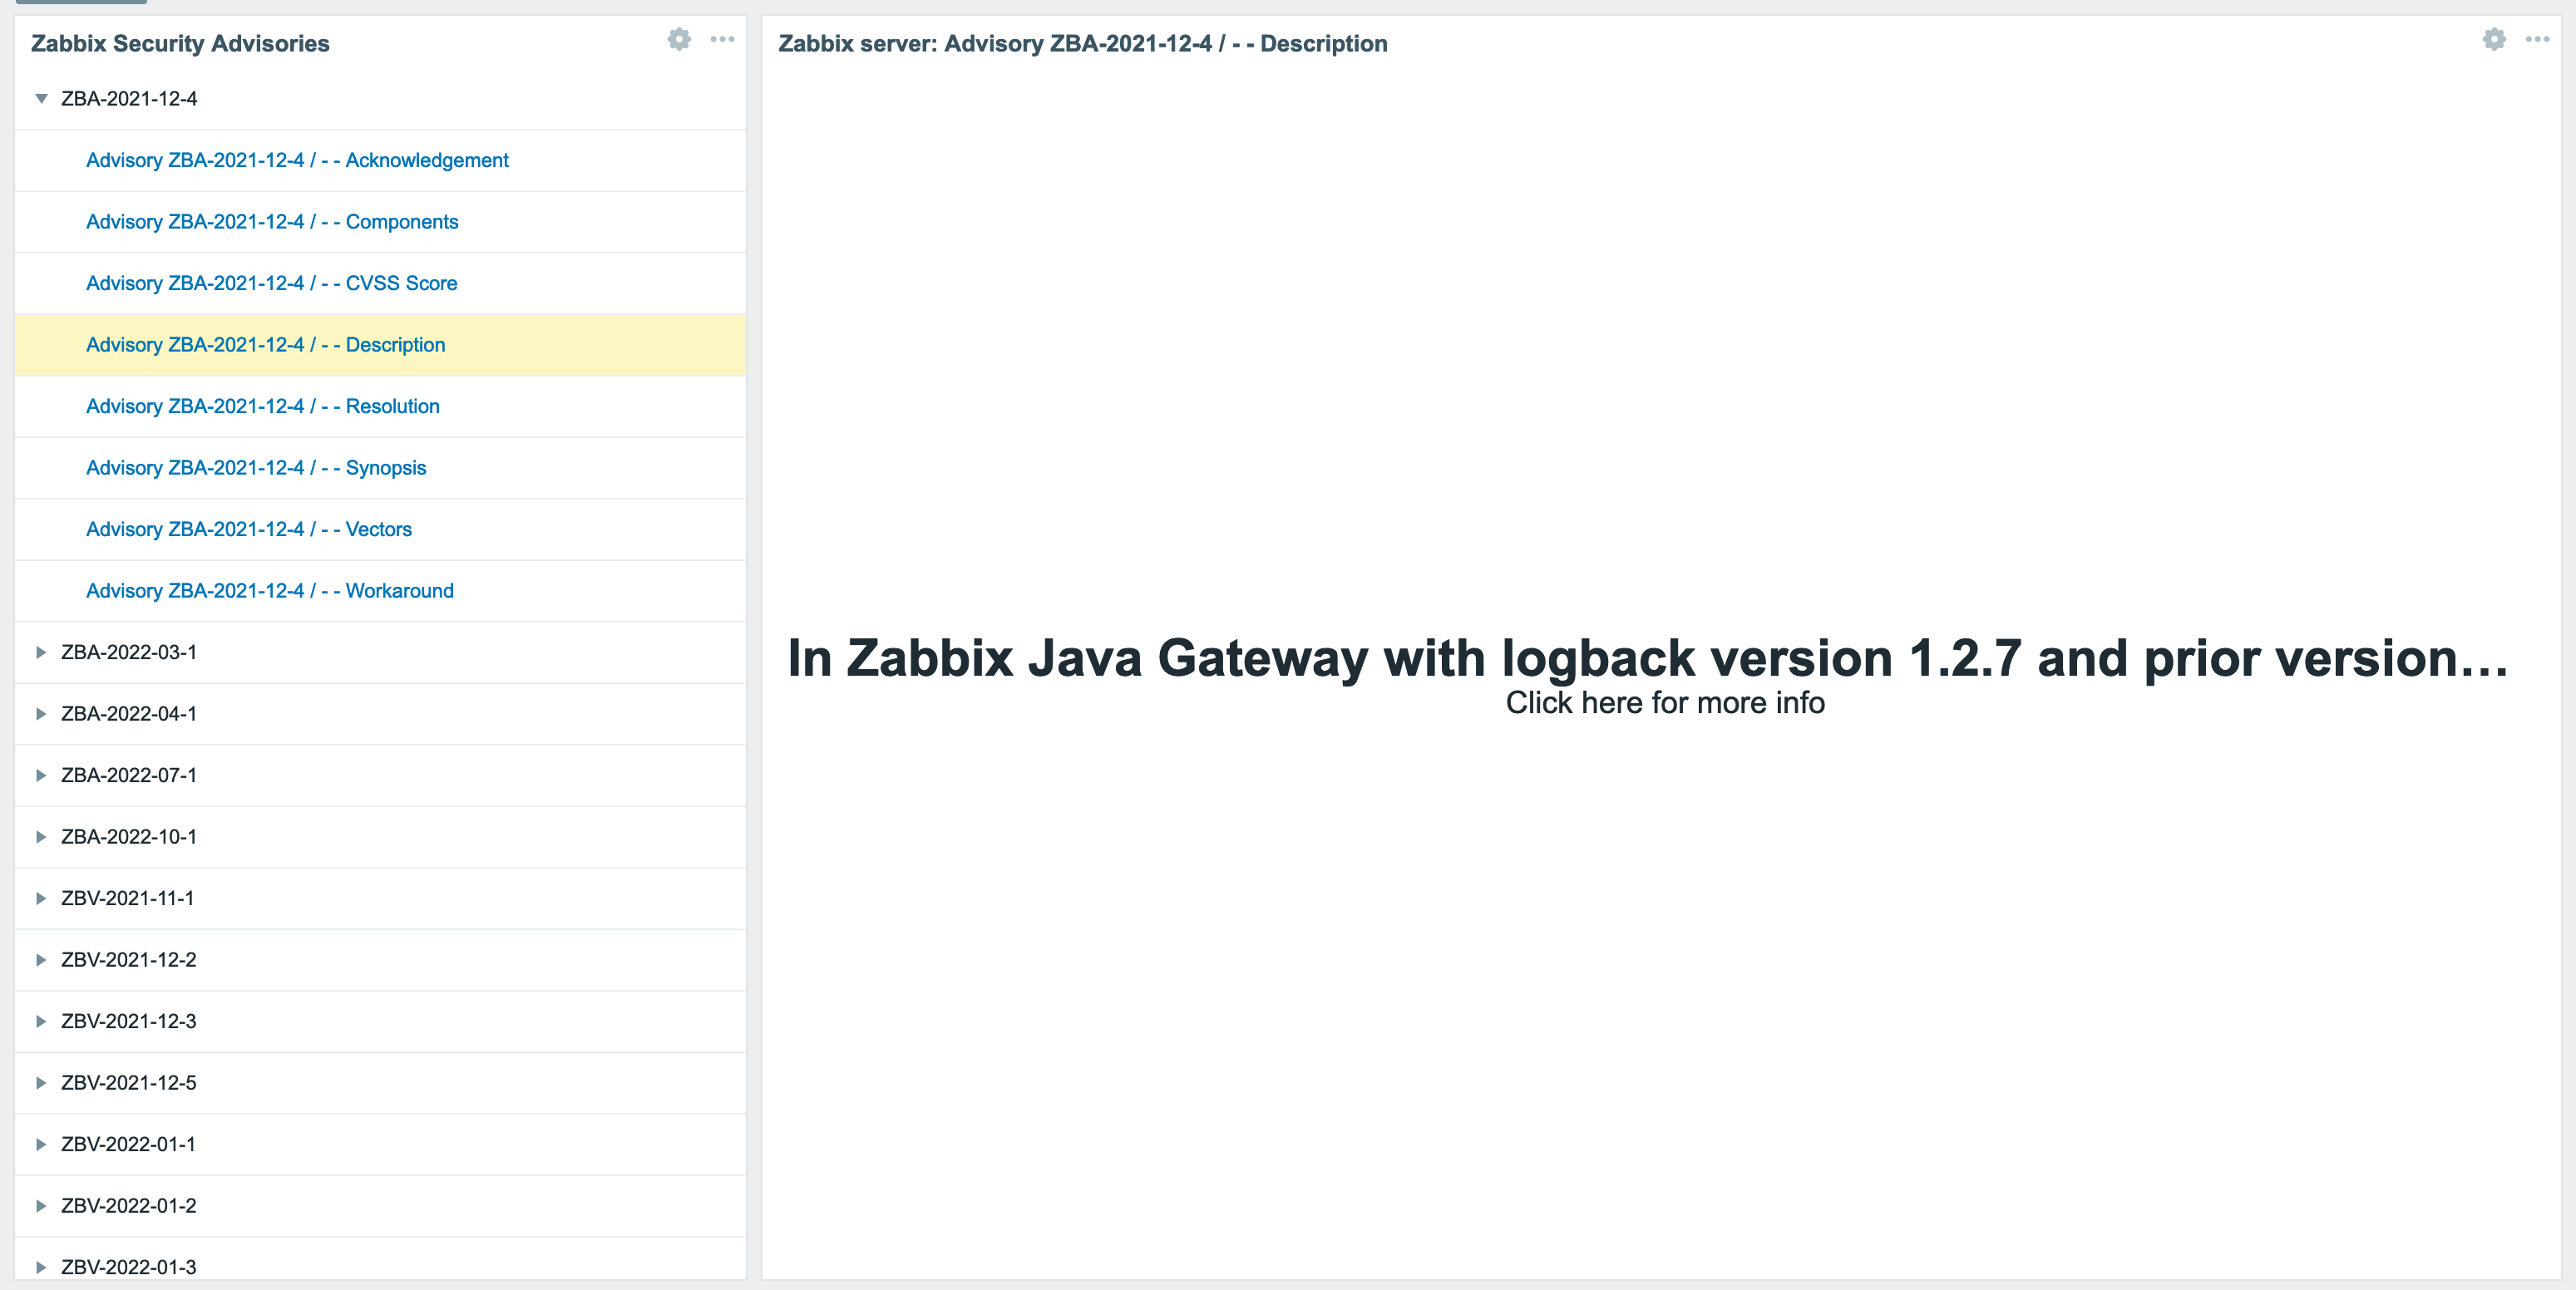


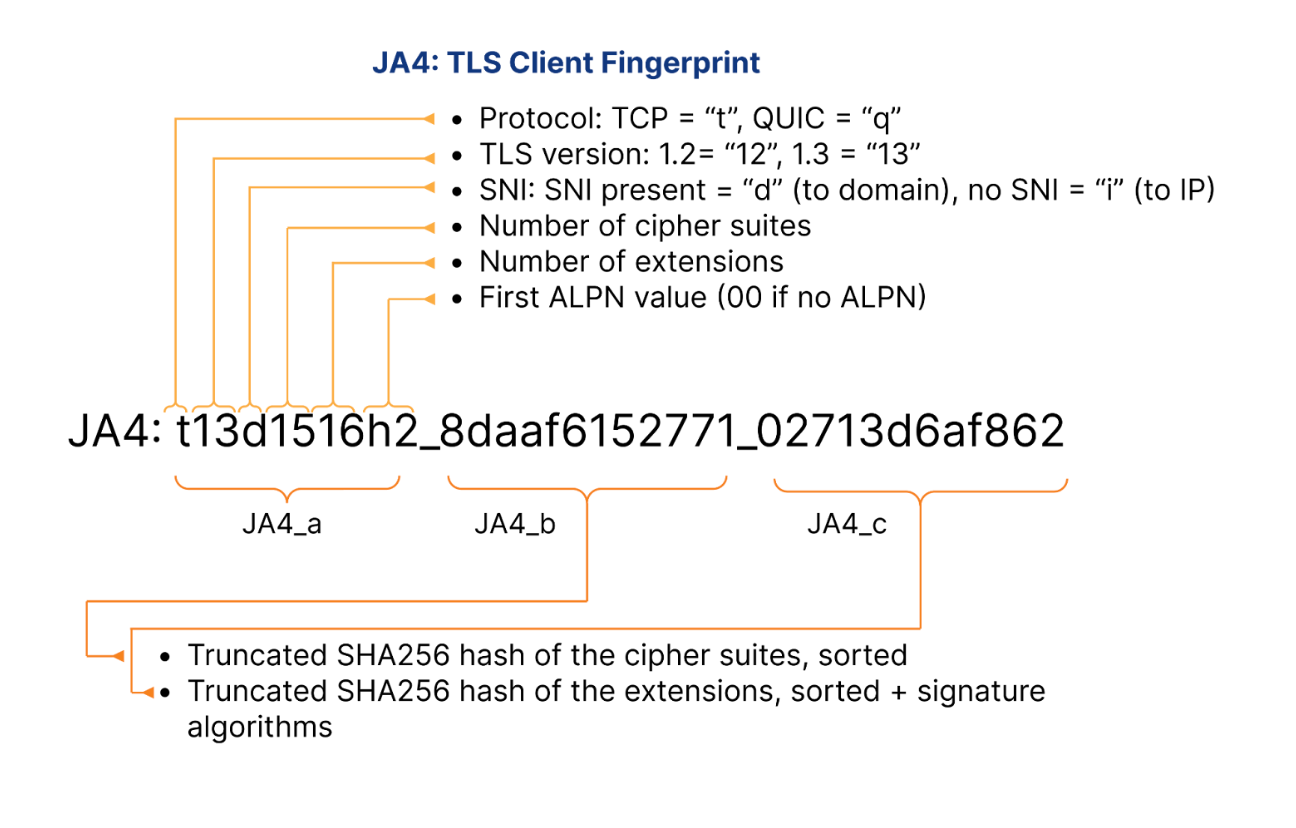
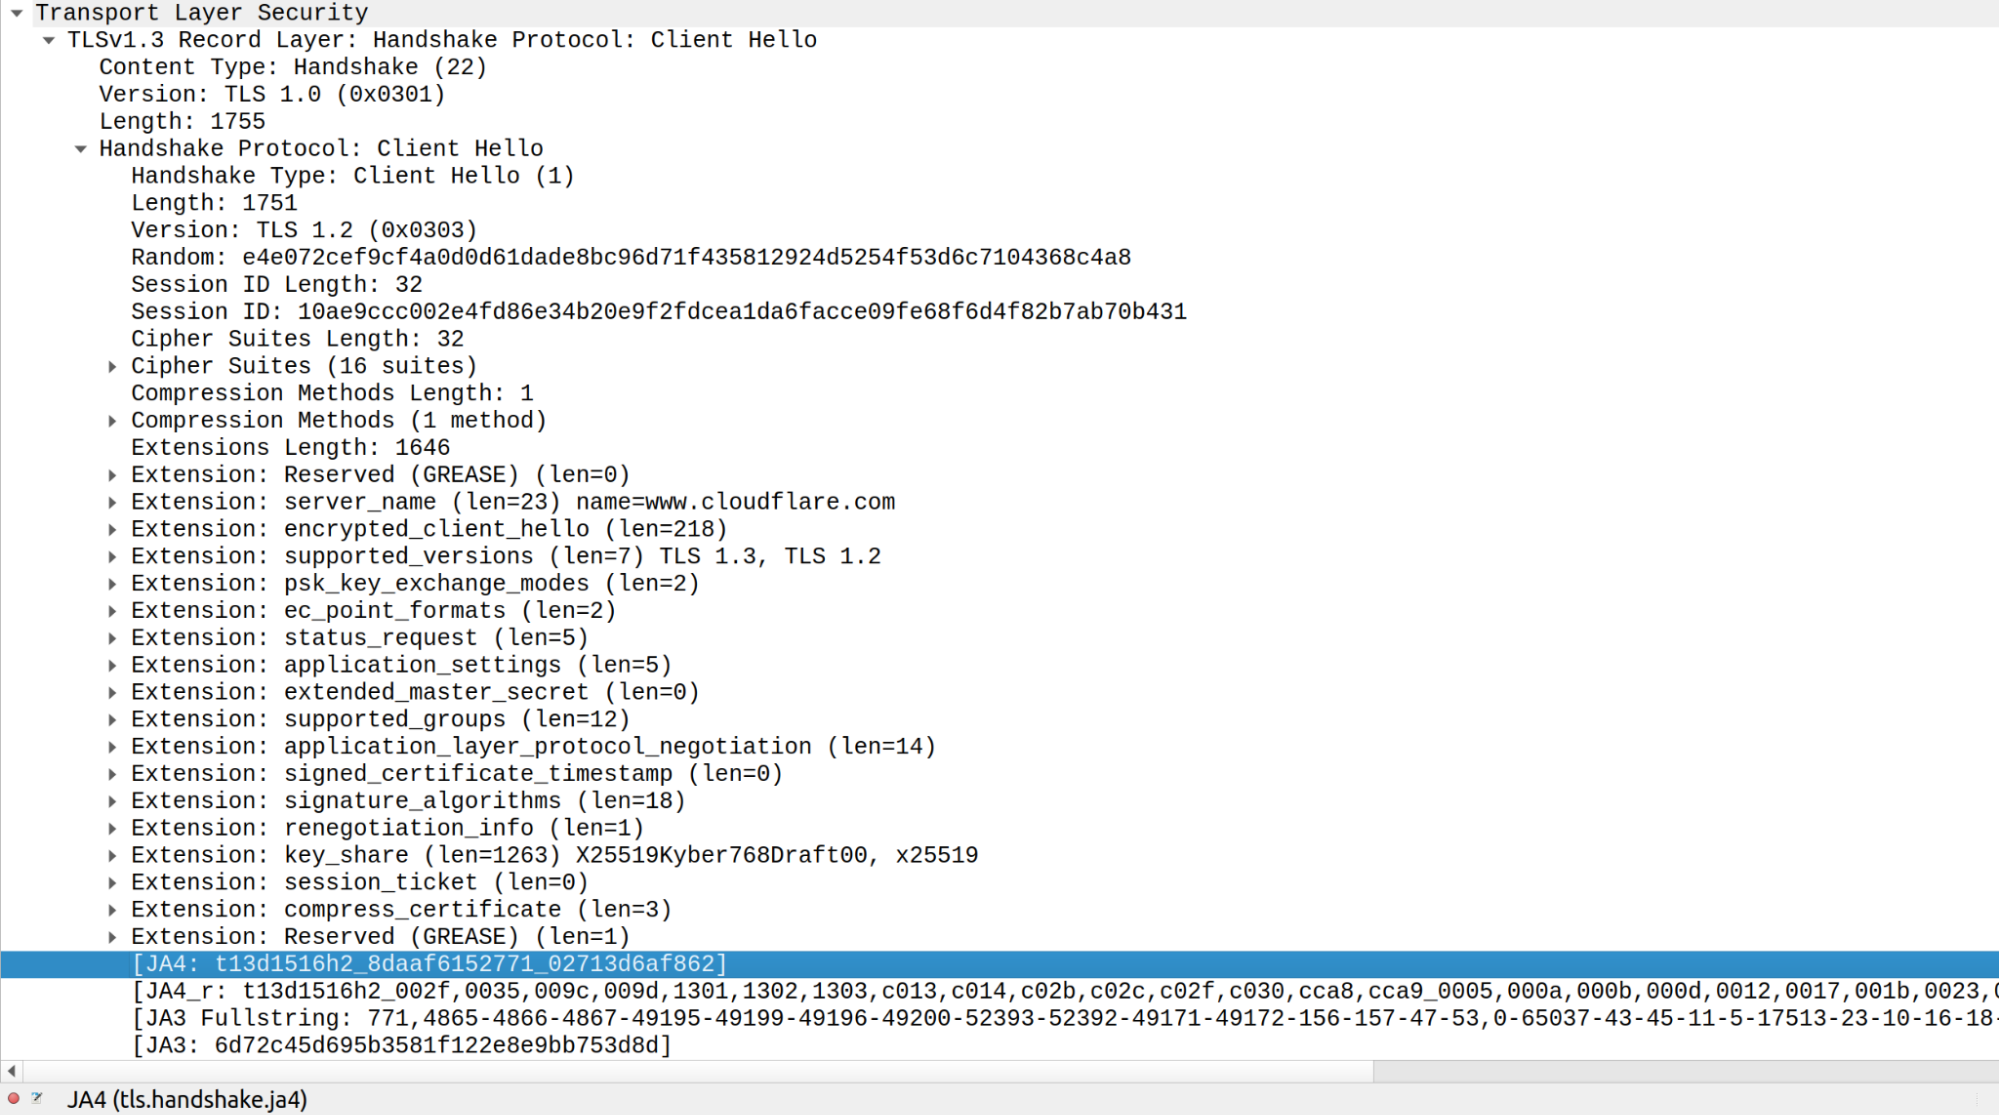
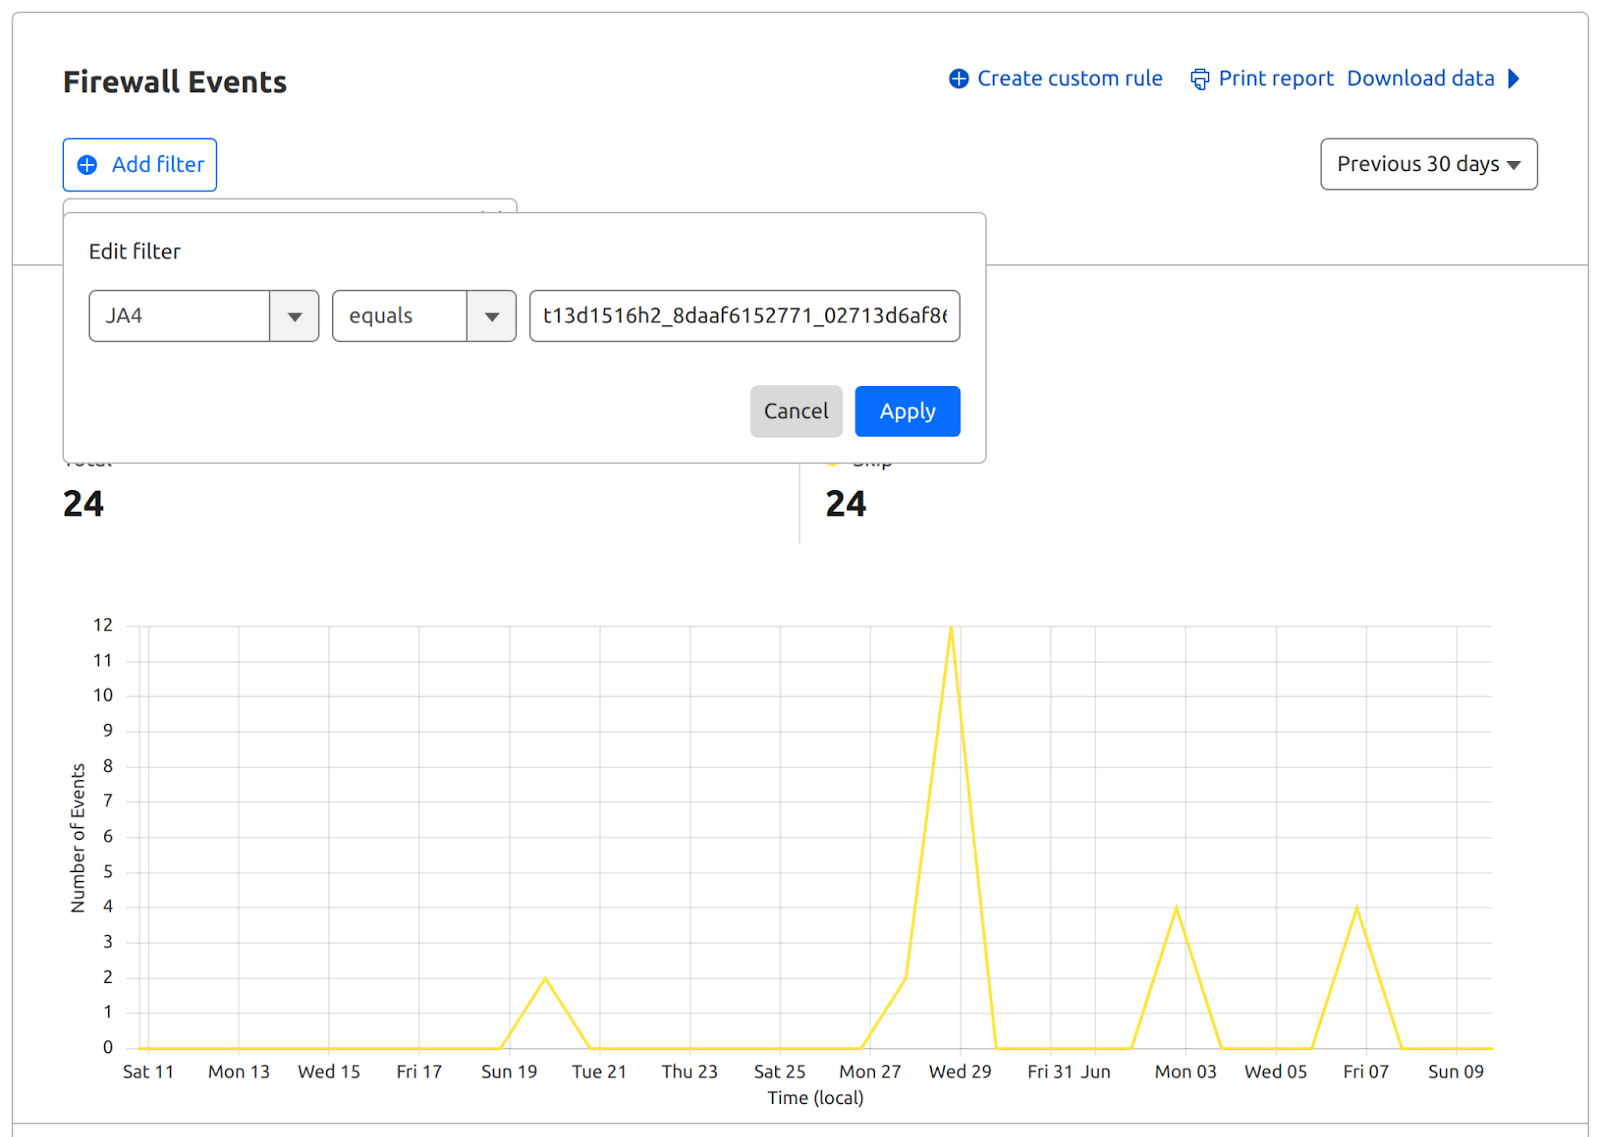
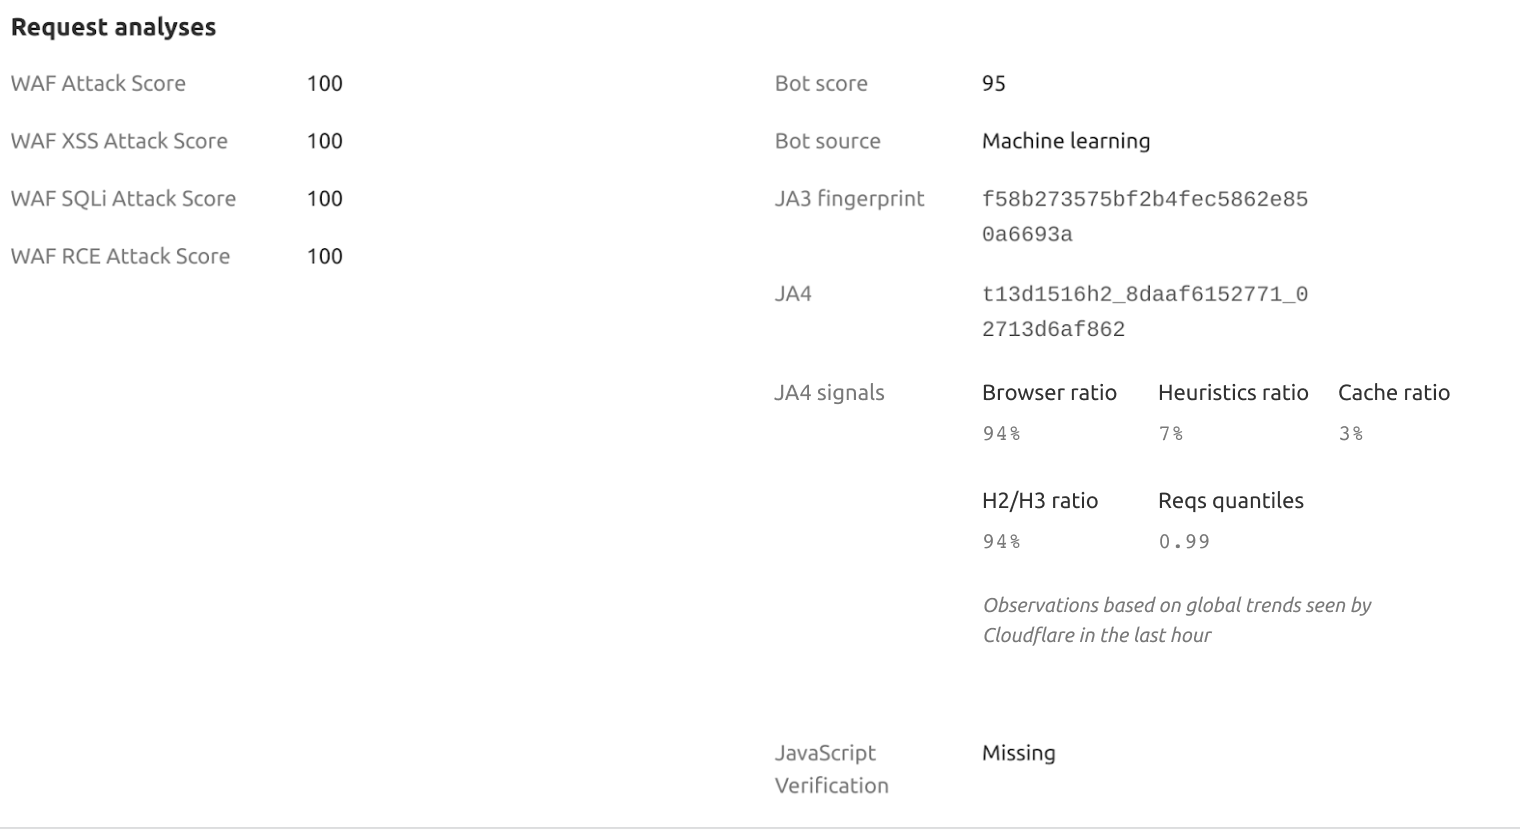


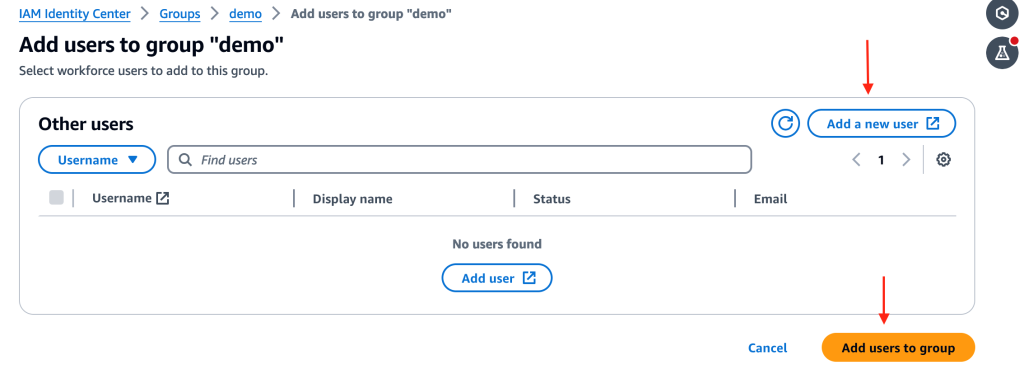
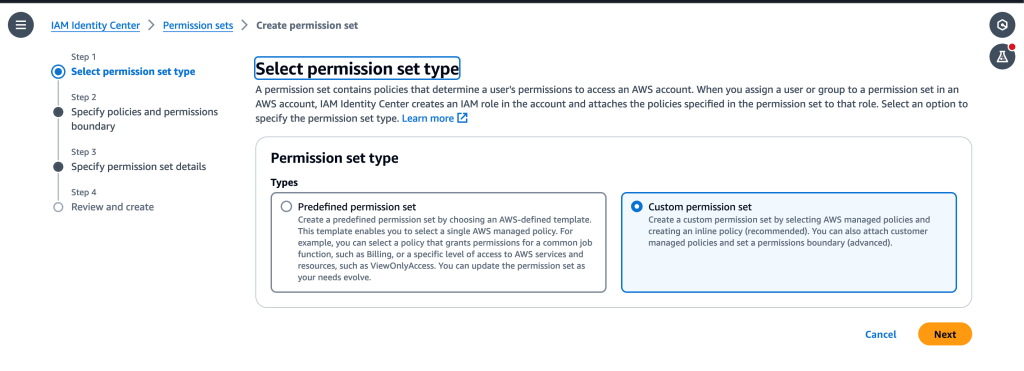
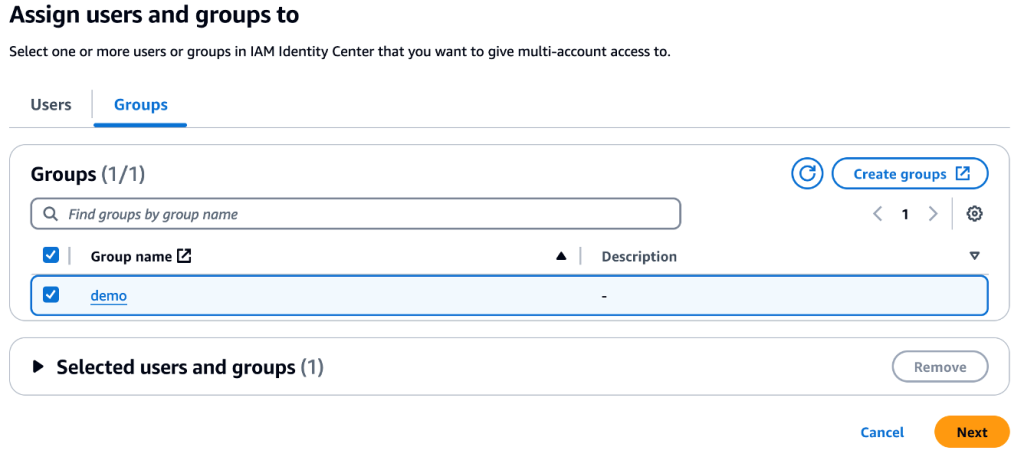
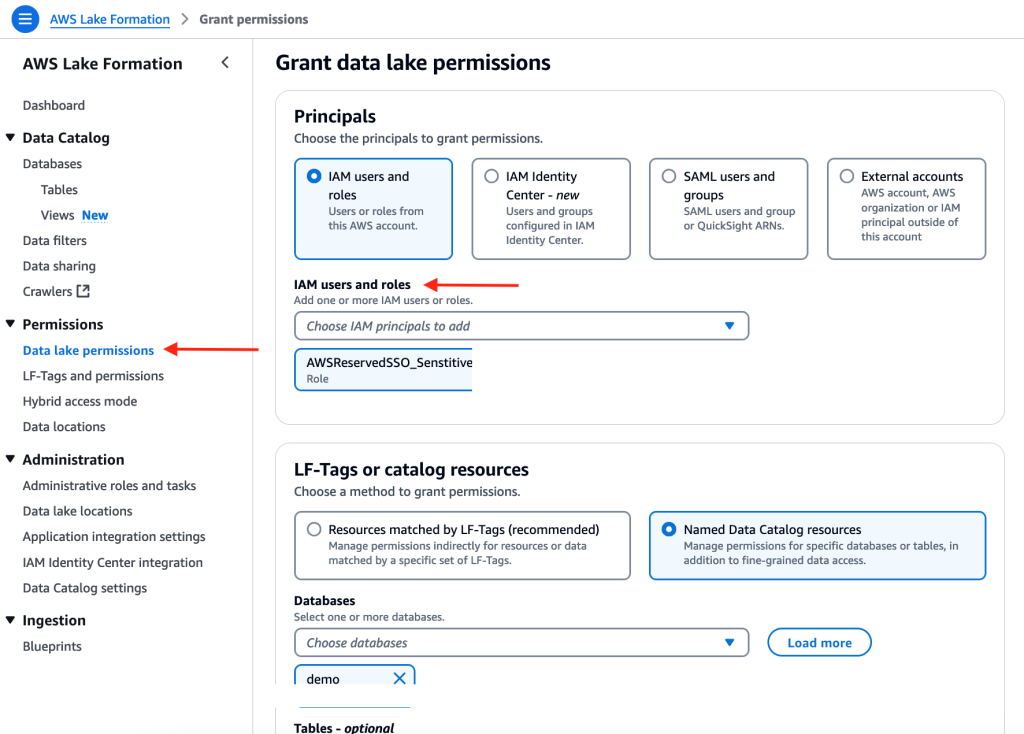
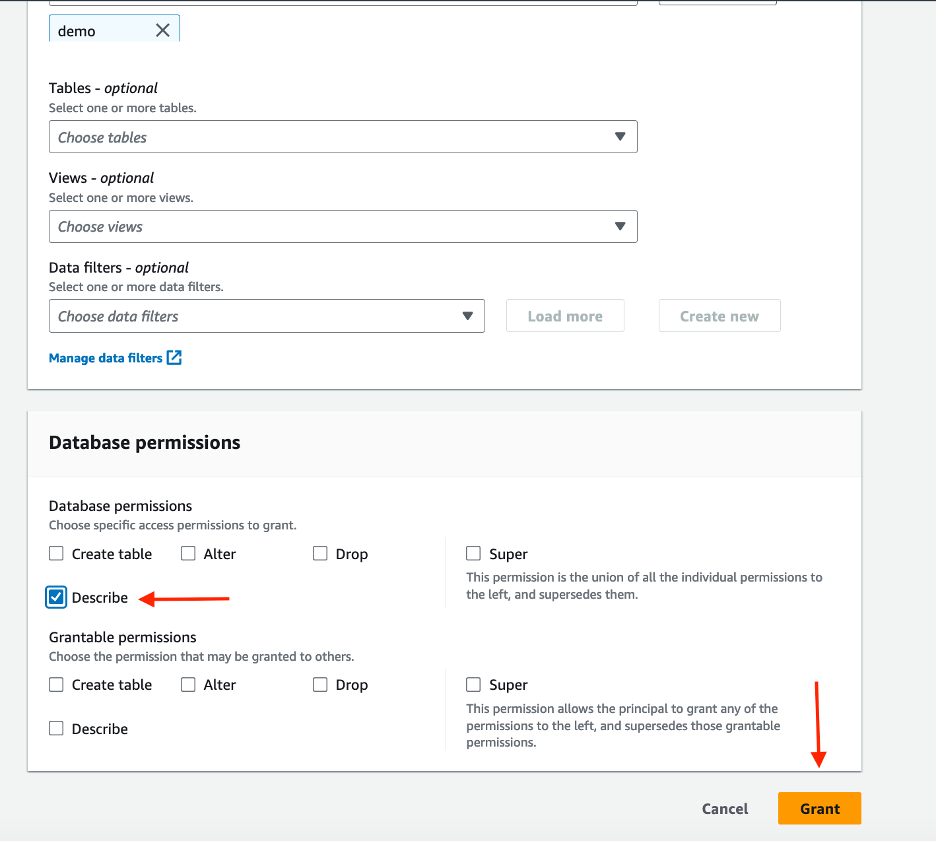
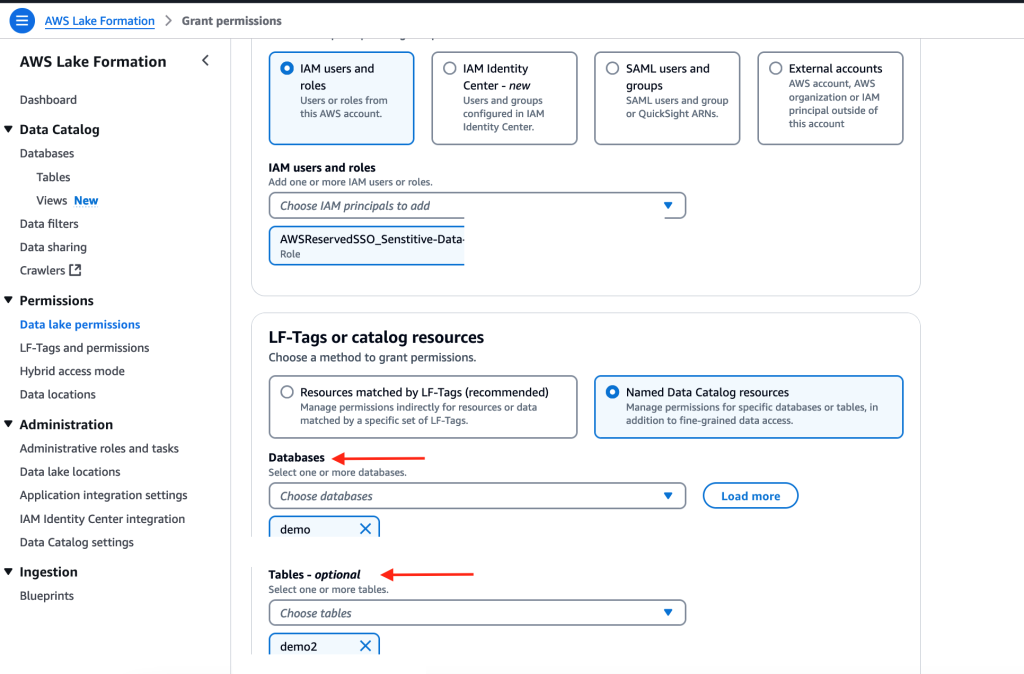
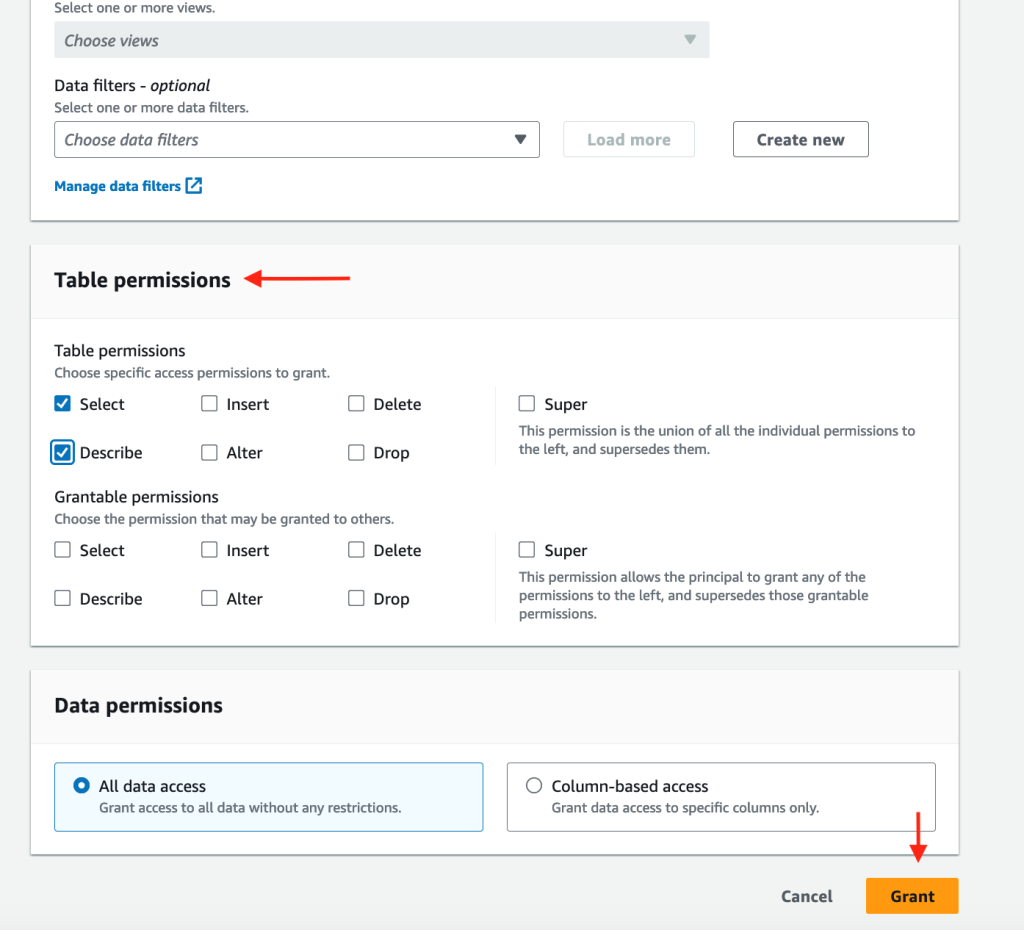
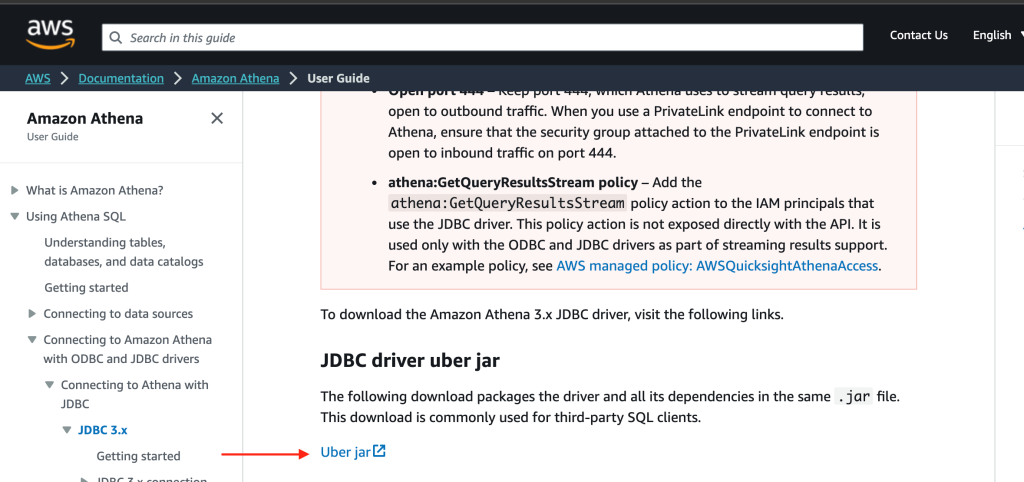
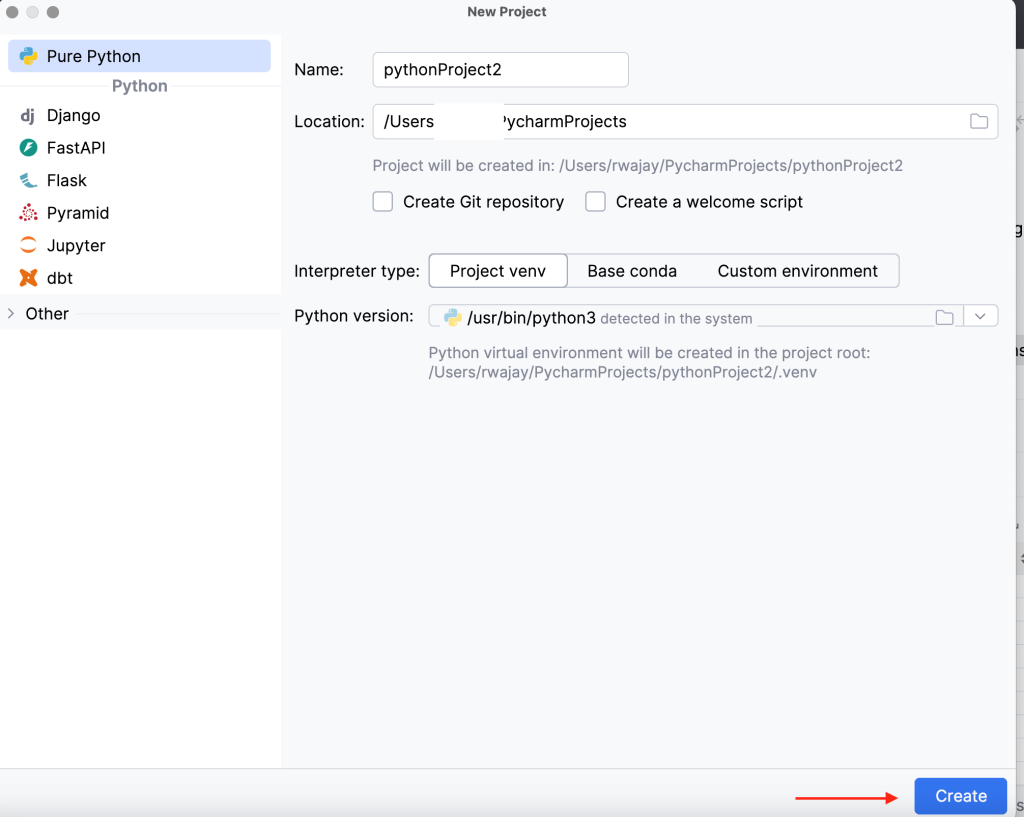
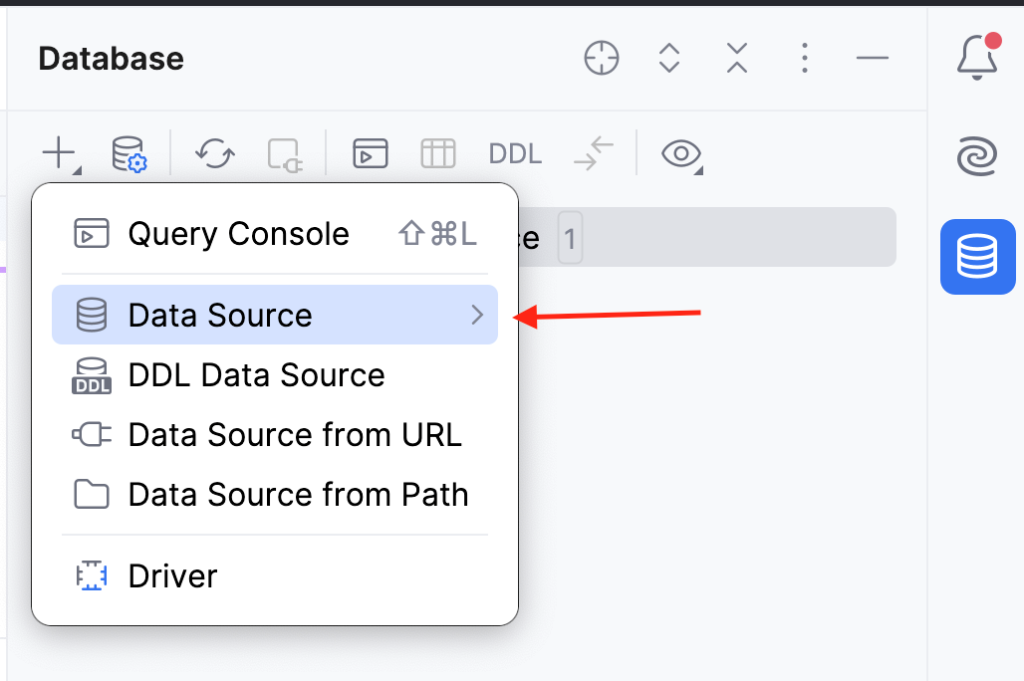
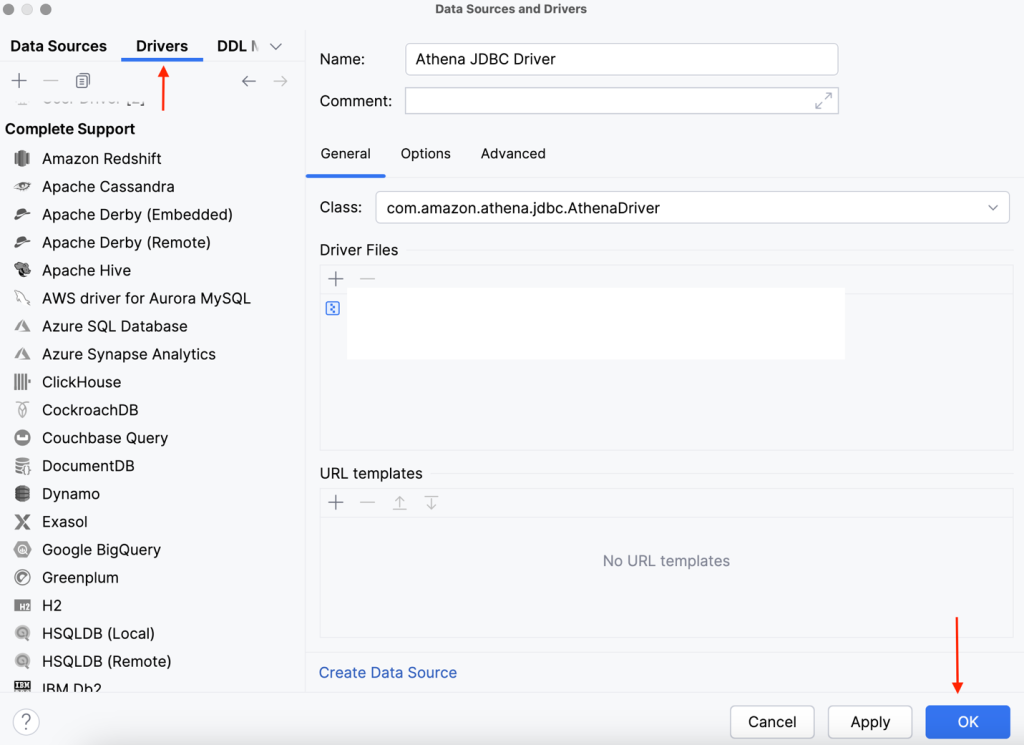
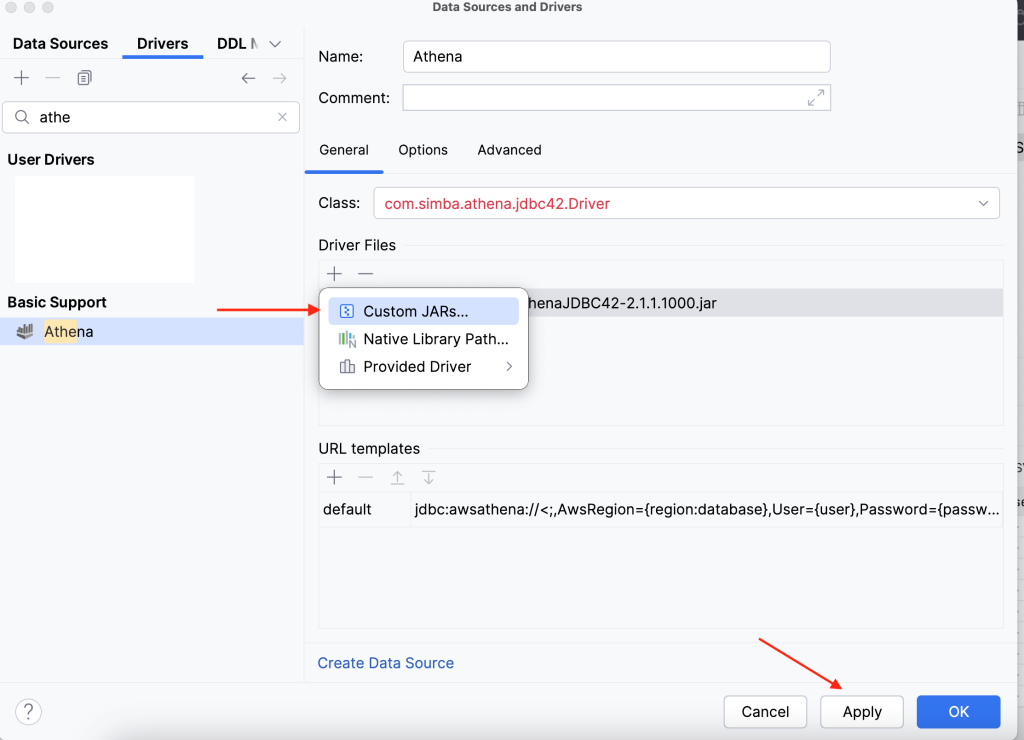
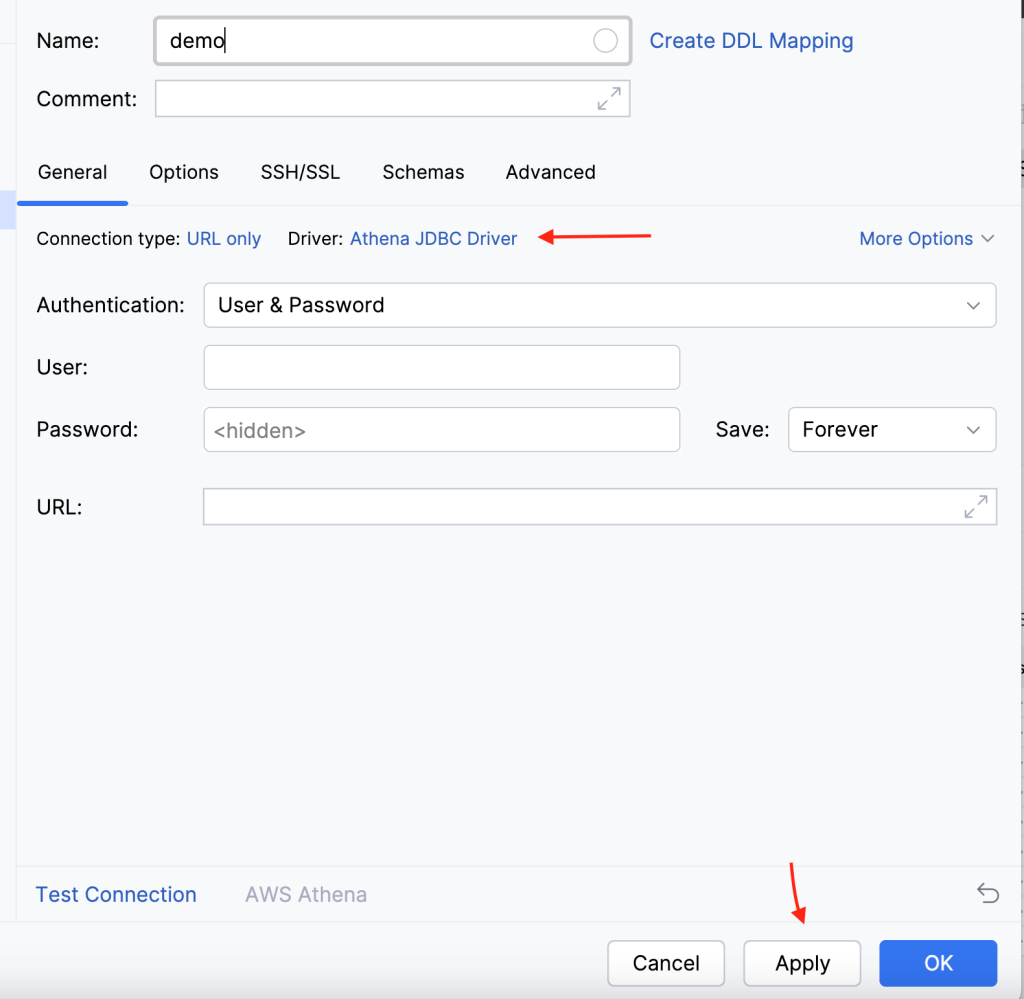
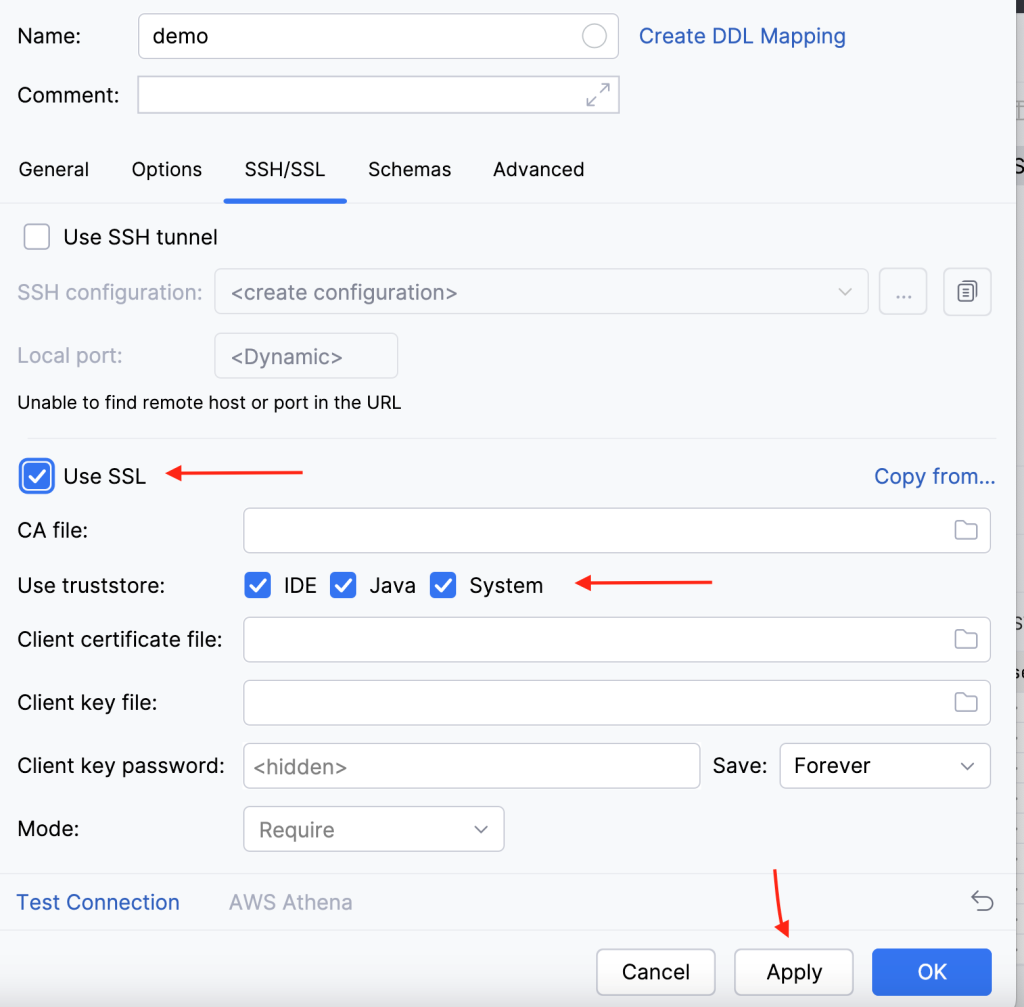
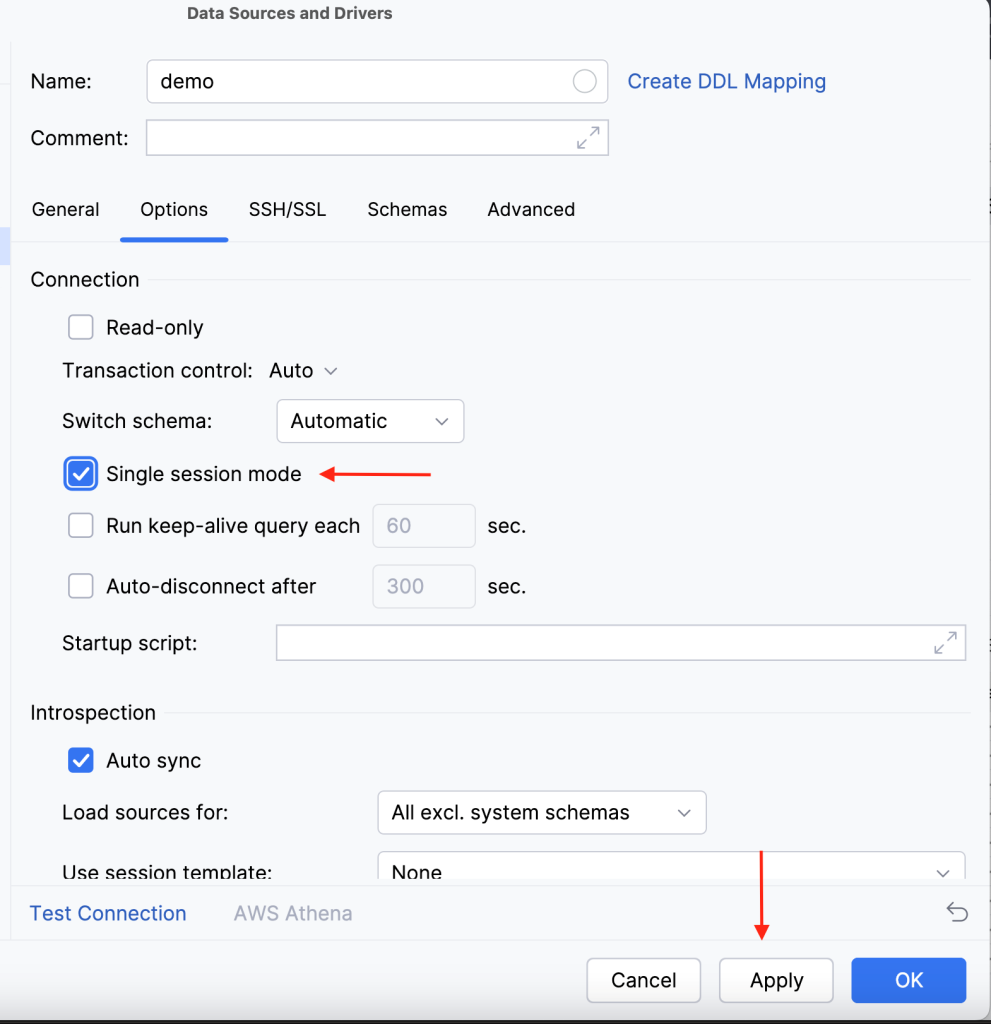
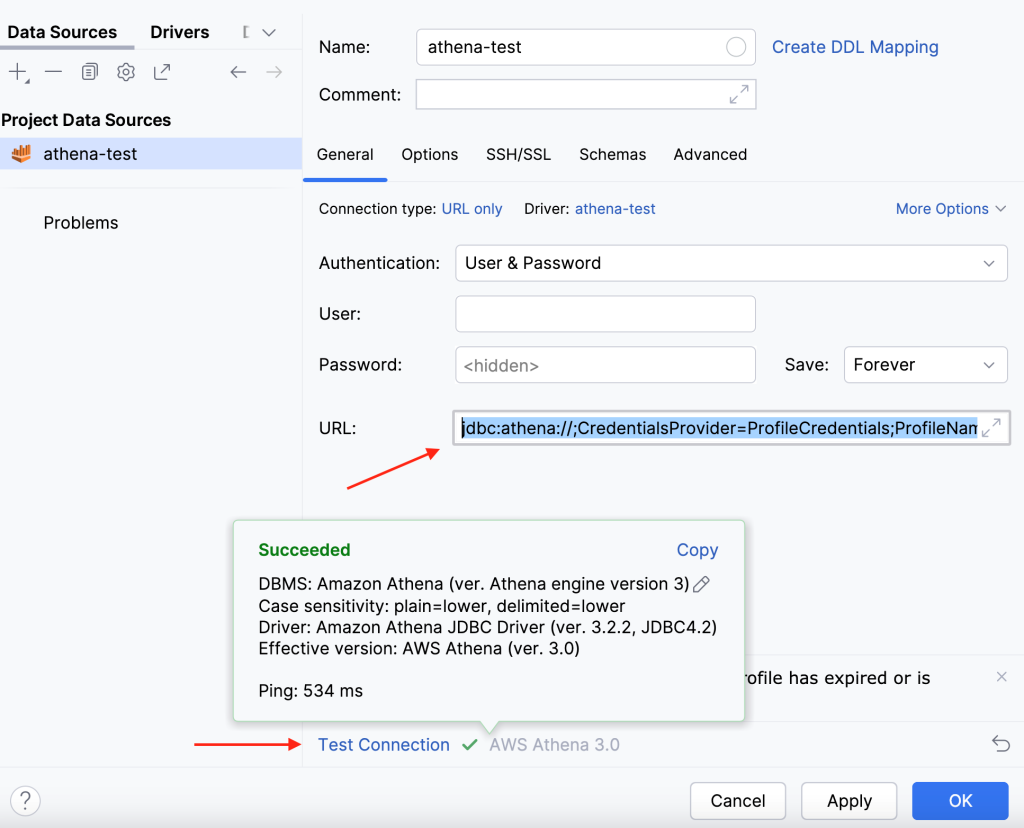
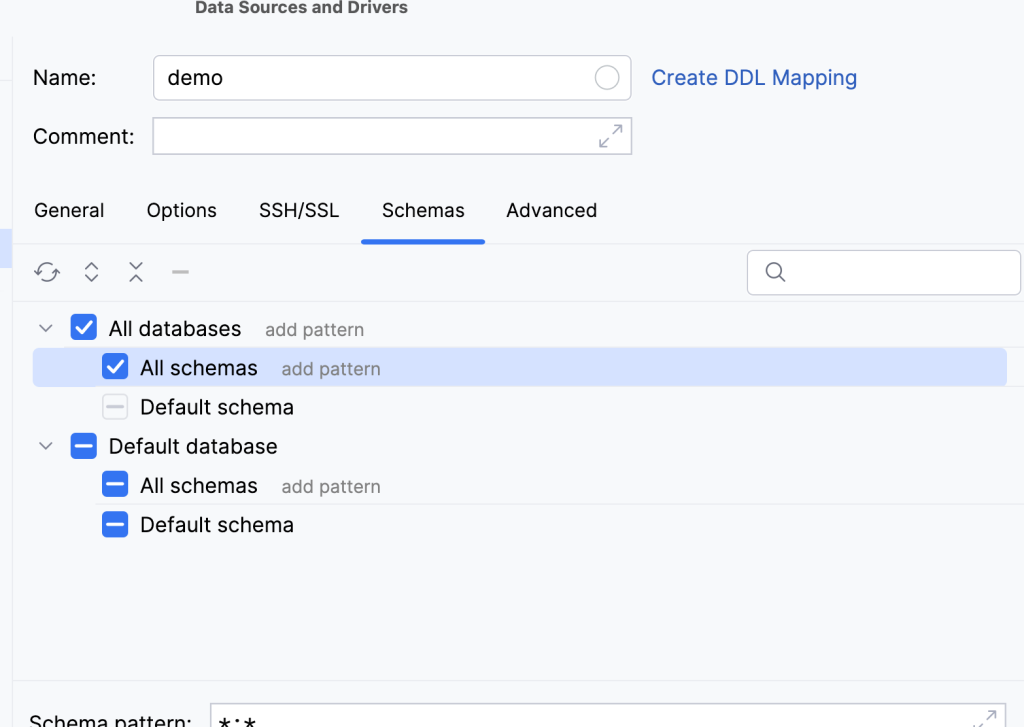


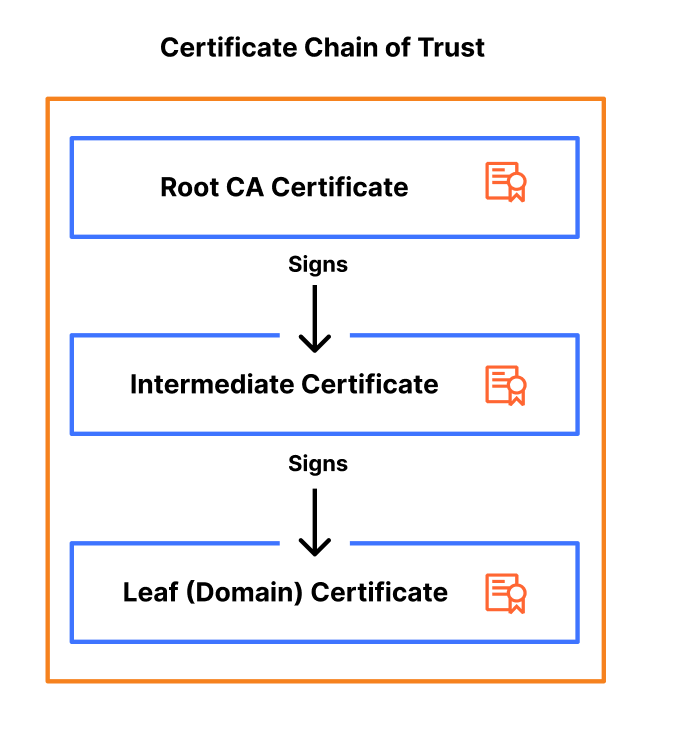
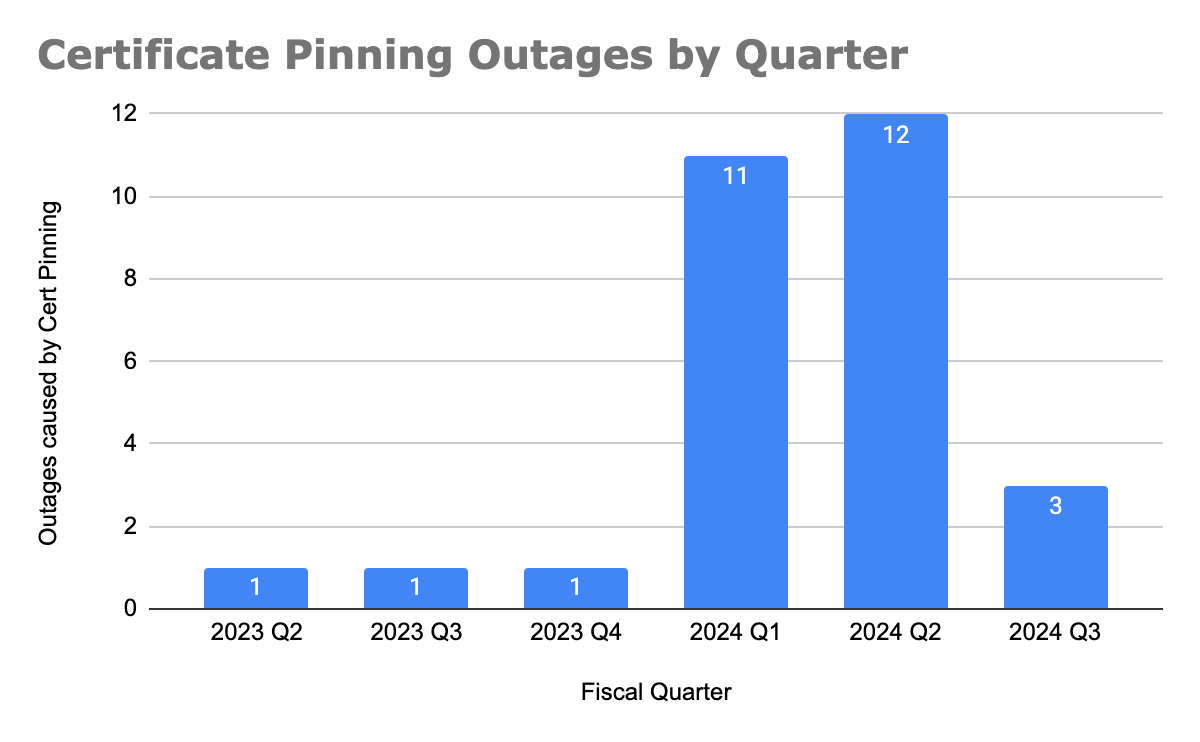


 Clarisa Tavolieri is a Software Engineering graduate with qualifications in Business, Audit, and Strategy Consulting. With an extensive career in the financial and tech industries, she specializes in data management and has been involved in initiatives ranging from reporting to data architecture. She currently serves as the Global Head of Cyber Data Management at Zurich Group. In her role, she leads the data strategy to support the protection of company assets and implements advanced analytics to enhance and monitor cybersecurity tools.
 Austin Rappeport is a Computer Engineer who graduated from the University of Illinois Urbana/Champaign in 2011 with a focus in Computer Security. After graduation, he worked for the Federal Energy Regulatory Commission in the Office of Electric Reliability, working with the North American Electric Reliability Corporation’s Critical Infrastructure Protection Standards on both the audit and enforcement side, as well as standards development. Austin currently works for Zurich Insurance as the Global Head of Detection Engineering and Automation, where he leads the team responsible for using Zurich’s security tools to detect suspicious and malicious activity and improve internal processes through automation.
 Samantha Gignac is a Global Security Architect at Zurich Insurance. She graduated from Ferris State University in 2014 with a Bachelor’s degree in Computer Systems & Network Engineering. With experience in the insurance, healthcare, and supply chain industries, she has held roles such as Storage Engineer, Risk Management Engineer, Vulnerability Management Engineer, and SOC Engineer. As a Cybersecurity Architect, she designs and implements secure network systems to protect organizational data and infrastructure from cyber threats.
 Claire Sheridan is a Principal Solutions Architect with Amazon Web Services working with global financial services customers. She holds a PhD in Informatics and has more than 15 years of industry experience in tech. She loves traveling and visiting art galleries.
 Jake Obi is a Principal Security Consultant with Amazon Web Services based in South Carolina, US, with over 20 years’ experience in information technology. He helps financial services customers improve their security posture in the cloud. Prior to joining Amazon, Jake was an Information Assurance Manager for the US Navy, where he worked on a large satellite communications program as well as hosting government websites using the public cloud.
 Srikanth Daggumalli is an Analytics Specialist Solutions Architect in AWS. Out of 18 years of experience, he has over a decade of experience in architecting cost-effective, performant, and secure enterprise applications that improve customer reachability and experience, using big data, AI/ML, cloud, and security technologies. He has built high-performing data platforms for major financial institutions, enabling improved customer reach and exceptional experiences. He is specialized in services like cross-border transactions and architecting robust analytics platforms.
 Freddy Kasprzykowski is a Senior Security Consultant with Amazon Web Services based in Florida, US, with over 20 years’ experience in information technology. He helps customers adopt AWS services securely according to industry best practices, standards, and compliance regulations. He is a member of the Customer Incident Response Team (CIRT), helping customers during security events, a seasoned speaker at AWS re:Invent and AWS re:Inforce conferences, and a contributor to open source projects related to AWS security.