Tag Archives: Technical How-to

Manage application security and compliance with the AWS Cloud Development Kit and cdk-nag

Post Syndicated from Rodney Bozo original https://aws.amazon.com/blogs/devops/manage-application-security-and-compliance-with-the-aws-cloud-development-kit-and-cdk-nag/

Infrastructure as Code (IaC) is an important part of Cloud Applications. Developers rely on various Static Application Security Testing (SAST) tools to identify security/compliance issues and mitigate these issues early on, before releasing their applications to production. Additionally, SAST tools often provide reporting mechanisms that can help developers verify compliance during security reviews.

cdk-nag integrates directly into AWS Cloud Development Kit (AWS CDK) applications to provide identification and reporting mechanisms similar to SAST tooling.

This post demonstrates how to integrate cdk-nag into an AWS CDK application to provide continual feedback and help align your applications with best practices.

Overview of cdk-nag

cdk-nag (inspired by cfn_nag) validates that the state of constructs within a given scope comply with a given set of rules. Additionally, cdk-nag provides a rule suppression and compliance reporting system. cdk-nag validates constructs by extending AWS CDK Aspects. If you’re interested in learning more about the AWS CDK Aspect system, then you should check out this post.

cdk-nag includes several rule sets (NagPacks) to validate your application against. As of this post, cdk-nag includes the AWS Solutions, HIPAA Security, NIST 800-53 rev 4, NIST 800-53 rev 5, and PCI DSS 3.2.1 NagPacks. You can pick and choose different NagPacks and apply as many as you wish to a given scope.

cdk-nag rules can either be warnings or errors. Both warnings and errors will be displayed in the console and compliance reports. Only unsuppressed errors will prevent applications from deploying with the cdk deploy command.

You can see which rules are implemented in each of the NagPacks in the Rules Documentation in the GitHub repository.

Walkthrough

This walkthrough will setup a minimal AWS CDK v2 application, as well as demonstrate how to apply a NagPack to the application, how to suppress rules, and how to view a report of the findings. Although cdk-nag has support for Python, TypeScript, Java, and .NET AWS CDK applications, we’ll use TypeScript for this walkthrough.

Prerequisites

For this walkthrough, you should have the following prerequisites:

  • A local installation of and experience using the AWS CDK.

Create a baseline AWS CDK application

In this section you will create and synthesize a small AWS CDK v2 application with an Amazon Simple Storage Service (Amazon S3) bucket. If you are unfamiliar with using the AWS CDK, then learn how to install and setup the AWS CDK by looking at their open source GitHub repository.

  1. Run the following commands to create the AWS CDK application:
mkdir CdkTest
cd CdkTest
cdk init app --language typescript
  1. Replace the contents of the lib/cdk_test-stack.ts with the following:
import { Stack, StackProps } from 'aws-cdk-lib';
import { Construct } from 'constructs';
import { Bucket } from 'aws-cdk-lib/aws-s3';

export class CdkTestStack extends Stack {
  constructor(scope: Construct, id: string, props?: StackProps) {
    super(scope, id, props);
    const bucket = new Bucket(this, 'Bucket')
  }
}
  1. Run the following commands to install dependencies and synthesize our sample app:
npm install
npx cdk synth

You should see an AWS CloudFormation template with an S3 bucket both in your terminal and in cdk.out/CdkTestStack.template.json.

Apply a NagPack in your application

In this section, you’ll install cdk-nag, include the AwsSolutions NagPack in your application, and view the results.

  1. Run the following command to install cdk-nag:
npm install cdk-nag
  1. Replace the contents of the bin/cdk_test.ts with the following:
#!/usr/bin/env node
import 'source-map-support/register';
import * as cdk from 'aws-cdk-lib';
import { CdkTestStack } from '../lib/cdk_test-stack';
import { AwsSolutionsChecks } from 'cdk-nag'
import { Aspects } from 'aws-cdk-lib';

const app = new cdk.App();
// Add the cdk-nag AwsSolutions Pack with extra verbose logging enabled.
Aspects.of(app).add(new AwsSolutionsChecks({ verbose: true }))
new CdkTestStack(app, 'CdkTestStack', {});
  1. Run the following command to view the output and generate the compliance report:
npx cdk synth

The output should look similar to the following (Note: SSE stands for Server-side encryption):

[Error at /CdkTestStack/Bucket/Resource] AwsSolutions-S1: The S3 Bucket has server access logs disabled. The bucket should have server access logging enabled to provide detailed records for the requests that are made to the bucket.

[Error at /CdkTestStack/Bucket/Resource] AwsSolutions-S2: The S3 Bucket does not have public access restricted and blocked. The bucket should have public access restricted and blocked to prevent unauthorized access.

[Error at /CdkTestStack/Bucket/Resource] AwsSolutions-S3: The S3 Bucket does not default encryption enabled. The bucket should minimally have SSE enabled to help protect data-at-rest.

[Error at /CdkTestStack/Bucket/Resource] AwsSolutions-S10: The S3 Bucket does not require requests to use SSL. You can use HTTPS (TLS) to help prevent potential attackers from eavesdropping on or manipulating network traffic using person-in-the-middle or similar attacks. You should allow only encrypted connections over HTTPS (TLS) using the aws:SecureTransport condition on Amazon S3 bucket policies.

Found errors

Note that applying the AwsSolutions NagPack to the application rendered several errors in the console (AwsSolutions-S1, AwsSolutions-S2, AwsSolutions-S3, and AwsSolutions-S10). Furthermore, the cdk.out/AwsSolutions-CdkTestStack-NagReport.csv contains the errors as well:

Rule ID,Resource ID,Compliance,Exception Reason,Rule Level,Rule Info
"AwsSolutions-S1","CdkTestStack/Bucket/Resource","Non-Compliant","N/A","Error","The S3 Bucket has server access logs disabled."
"AwsSolutions-S2","CdkTestStack/Bucket/Resource","Non-Compliant","N/A","Error","The S3 Bucket does not have public access restricted and blocked."
"AwsSolutions-S3","CdkTestStack/Bucket/Resource","Non-Compliant","N/A","Error","The S3 Bucket does not default encryption enabled."
"AwsSolutions-S5","CdkTestStack/Bucket/Resource","Compliant","N/A","Error","The S3 static website bucket either has an open world bucket policy or does not use a CloudFront Origin Access Identity (OAI) in the bucket policy for limited getObject and/or putObject permissions."
"AwsSolutions-S10","CdkTestStack/Bucket/Resource","Non-Compliant","N/A","Error","The S3 Bucket does not require requests to use SSL."

Remediating and suppressing errors

In this section, you’ll remediate the AwsSolutions-S10 error, suppress the  AwsSolutions-S1 error on a Stack level, suppress the  AwsSolutions-S2 error on a Resource level errors, and not remediate the  AwsSolutions-S3 error and view the results.

  1. Replace the contents of the lib/cdk_test-stack.ts with the following:
import { Stack, StackProps } from 'aws-cdk-lib';
import { Construct } from 'constructs';
import { Bucket } from 'aws-cdk-lib/aws-s3';
import { NagSuppressions } from 'cdk-nag'

export class CdkTestStack extends Stack {
  constructor(scope: Construct, id: string, props?: StackProps) {
    super(scope, id, props);
    // The local scope 'this' is the Stack. 
    NagSuppressions.addStackSuppressions(this, [
      {
        id: 'AwsSolutions-S1',
        reason: 'Demonstrate a stack level suppression.'
      },
    ])
    // Remediating AwsSolutions-S10 by enforcing SSL on the bucket.
    const bucket = new Bucket(this, 'Bucket', { enforceSSL: true })
    NagSuppressions.addResourceSuppressions(bucket, [
      {
        id: 'AwsSolutions-S2',
        reason: 'Demonstrate a resource level suppression.'
      },
    ])
  }
}
  1. Run the cdk synth command again:
npx cdk synth

The output should look similar to the following:

[Error at /CdkTestStack/Bucket/Resource] AwsSolutions-S3: The S3 Bucket does not default encryption enabled. The bucket should minimally have SSE enabled to help protect data-at-rest.

Found errors

The cdk.out/AwsSolutions-CdkTestStack-NagReport.csv contains more details about rule compliance, non-compliance, and suppressions.

Rule ID,Resource ID,Compliance,Exception Reason,Rule Level,Rule Info
"AwsSolutions-S1","CdkTestStack/Bucket/Resource","Suppressed","Demonstrate a stack level suppression.","Error","The S3 Bucket has server access logs disabled."
"AwsSolutions-S2","CdkTestStack/Bucket/Resource","Suppressed","Demonstrate a resource level suppression.","Error","The S3 Bucket does not have public access restricted and blocked."
"AwsSolutions-S3","CdkTestStack/Bucket/Resource","Non-Compliant","N/A","Error","The S3 Bucket does not default encryption enabled."
"AwsSolutions-S5","CdkTestStack/Bucket/Resource","Compliant","N/A","Error","The S3 static website bucket either has an open world bucket policy or does not use a CloudFront Origin Access Identity (OAI) in the bucket policy for limited getObject and/or putObject permissions."
"AwsSolutions-S10","CdkTestStack/Bucket/Resource","Compliant","N/A","Error","The S3 Bucket does not require requests to use SSL."

Moreover, note that the resultant cdk.out/CdkTestStack.template.json template contains the cdk-nag suppression data. This provides transparency with what rules weren’t applied to an application, as the suppression data is included in the resources.

{
  "Metadata": {
    "cdk_nag": {
      "rules_to_suppress": [
        {
          "id": "AwsSolutions-S1",
          "reason": "Demonstrate a stack level suppression."
        }
      ]
    }
  },
  "Resources": {
    "BucketDEB6E181": {
      "Type": "AWS::S3::Bucket",
      "UpdateReplacePolicy": "Retain",
      "DeletionPolicy": "Retain",
      "Metadata": {
        "aws:cdk:path": "CdkTestStack/Bucket/Resource",
        "cdk_nag": {
          "rules_to_suppress": [
            {
              "id": "AwsSolutions-S2",
              "reason": "Demonstrate a resource level suppression."
            }
          ]
        }
      }
    },
  ...
  },
  ...
}

Reflecting on the Walkthrough

In this section, you learned how to apply a NagPack to your application, remediate/suppress warnings and errors, and review the compliance reports. The reporting and suppression systems provide mechanisms for the development and security teams within organizations to work together to identify and mitigate potential security/compliance issues. Security can choose which NagPacks developers should apply to their applications. Then, developers can use the feedback to quickly remediate issues. Security can use the reports to validate compliances. Furthermore, developers and security can work together to use suppressions to transparently document exceptions to rules that they’ve decided not to follow.

Advanced usage and further reading

This section briefly covers some advanced options for using cdk-nag.

Unit Testing with the AWS CDK Assertions Library

The Annotations submodule of the AWS CDK assertions library lets you check for cdk-nag warnings and errors without AWS credentials by integrating a NagPack into your application unit tests. Read this post for further information about the AWS CDK assertions module. The following is an example of using assertions with a TypeScript AWS CDK application and Jest for unit testing.

import { Annotations, Match } from 'aws-cdk-lib/assertions';
import { App, Aspects, Stack } from 'aws-cdk-lib';
import { AwsSolutionsChecks } from 'cdk-nag';
import { CdkTestStack } from '../lib/cdk_test-stack';

describe('cdk-nag AwsSolutions Pack', () => {
  let stack: Stack;
  let app: App;
  // In this case we can use beforeAll() over beforeEach() since our tests 
  // do not modify the state of the application 
  beforeAll(() => {
    // GIVEN
    app = new App();
    stack = new CdkTestStack(app, 'test');

    // WHEN
    Aspects.of(stack).add(new AwsSolutionsChecks());
  });

  // THEN
  test('No unsuppressed Warnings', () => {
    const warnings = Annotations.fromStack(stack).findWarning(
      '*',
      Match.stringLikeRegexp('AwsSolutions-.*')
    );
    expect(warnings).toHaveLength(0);
  });

  test('No unsuppressed Errors', () => {
    const errors = Annotations.fromStack(stack).findError(
      '*',
      Match.stringLikeRegexp('AwsSolutions-.*')
    );
    expect(errors).toHaveLength(0);
  });
});

Additionally, many testing frameworks include watch functionality. This is a background process that reruns all of the tests when files in your project have changed for fast feedback. For example, when using the AWS CDK in JavaScript/Typescript, you can use the Jest CLI watch commands. When Jest watch detects a file change, it attempts to run unit tests related to the changed file. This can be used to automatically run cdk-nag-related tests when making changes to your AWS CDK application.

CDK Watch

When developing in non-production environments, consider using AWS CDK Watch with a NagPack for fast feedback. AWS CDK Watch attempts to synthesize and then deploy changes whenever you save changes to your files. Aspects are run during synthesis. Therefore, any NagPacks applied to your application will also run on save. As in the walkthrough, all of the unsuppressed errors will prevent deployments, all of the messages will be output to the console, and all of the compliance reports will be generated. Read this post for further information about AWS CDK Watch.

Conclusion

In this post, you learned how to use cdk-nag in your AWS CDK applications. To learn more about using cdk-nag in your applications, check out the README in the GitHub Repository. If you would like to learn how to create your own rules and NagPacks, then check out the developer documentation. The repository is open source and welcomes community contributions and feedback.

Author:

Arun Donti

Arun Donti is a Senior Software Engineer with Twitch. He loves working on building automated processes and tools that enable builders and organizations to focus on and deliver their mission critical needs. You can find him on GitHub.

Use the AWS Toolkit for Azure DevOps to automate your deployments to AWS

Post Syndicated from Mahmoud Abid original https://aws.amazon.com/blogs/devops/use-the-aws-toolkit-for-azure-devops-to-automate-your-deployments-to-aws/

Many developers today seek to improve productivity by finding better ways to collaborate, enhance code quality and automate repetitive tasks. We hear from some of our customers that they would like to leverage services such as AWS CloudFormation, AWS CodeBuild and other AWS Developer Tools to manage their AWS resources while continuing to use their existing CI/CD pipelines which they are familiar with. These services range from popular open-source solutions, such as Jenkins, to paid commercial solutions, such as Azure DevOps Server (formerly Team Foundation Server (TFS)).

In this post, I will walk you through an example to leverage the AWS Toolkit for Azure DevOps to deploy your Infrastructure as Code templates, i.e. AWS CloudFormation stacks, directly from your existing Azure DevOps build pipelines.

The AWS Toolkit for Azure DevOps is a free-to-use extension for hosted and on-premises Microsoft Azure DevOps that makes it easy to manage and deploy applications using AWS. It integrates with many AWS services, including Amazon S3, AWS CodeDeploy, AWS Lambda, AWS CloudFormation, Amazon SQS and others. It can also run commands using the AWS Tools for Windows PowerShell module as well as the AWS CLI.

Solution Overview

The solution described in this post consists of leveraging the AWS Toolkit for Azure DevOps to manage resources on AWS via Infrastructure as Code templates with AWS CloudFormation:

Solution high-level overview

Figure 1. Solution high-level overview

Prerequisites and Assumptions

You will need to go through three main steps in order to set up your environment, which are summarized here and detailed in the toolkit’s user guide:

  • Install the toolkit into your Azure DevOps account or choose Download to install it on an on-premises server (Figure 2).
  • Create an IAM User and download its keys. Keep the principle of least privilege in mind when associating the policy to your user.
  • Create a Service Connection for your project in Azure DevOps. Service connections are how the Azure DevOps tooling manages connecting and providing access to Azure resources. The AWS Toolkit also provides a user interface to configure the AWS credentials used by the service connection (Figure 3).

In addition to the above steps, you will need a sample AWS CloudFormation template to use for testing the deployment such as this sample template creating an EC2 instance. You can find more samples in the Sample Templates page or get started with authoring your own templates.

AWS Toolkit for Azure DevOps in the Visual Studio Marketplace

Figure 2. AWS Toolkit for Azure DevOps in the Visual Studio Marketplace

A new Service Connection of type “AWS” will appear after installing the extension

Figure 3. A new Service Connection of type “AWS” will appear after installing the extension

Model your CI/CD Pipeline to Automate Your Deployments on AWS

One common DevOps model is to have a CI/CD pipeline that deploys an application stack from one environment to another. This model typically includes a Development (or integration) account first, then Staging and finally a Production environment. Let me show you how to make some changes to the service connection configuration to apply this CI/CD model to an Azure DevOps pipeline.

We will create one service connection per AWS account we want to deploy resources to. Figure 4 illustrates the updated solution to showcase multiple AWS Accounts used within the same Azure DevOps pipeline.

Solution overview with multiple target AWS accounts

Figure 4. Solution overview with multiple target AWS accounts

Each service connection will be configured to use a single, target AWS account. This can be done in two ways:

  1. Create an IAM User for every AWS target account and supply the access key ID and secret access key for that user.
  2. Alternatively, create one central IAM User and have it assume an IAM Role for every AWS deployment target. The AWS Toolkit extension enables you to select an IAM Role to assume. This IAM Role can be in the same AWS account as the IAM User or in a different accounts as depicted in Figure 5.
Use a single IAM User to access all other accounts

Figure 5. Use a single IAM User to access all other accounts

Define Your Pipeline Tasks

Once a service connection for your AWS Account is created, you can now add a task to your pipeline that references the service connection created in the previous step. In the example below, I use the CloudFormation Create/Update Stack task to deploy a CloudFormation stack using a template file named my-aws-cloudformation-template.yml:

- task: CloudFormationCreateOrUpdateStack@1
  displayName: 'Create/Update Stack: Development-Deployment'
  inputs:
    awsCredentials: 'development-account'
    regionName:     'eu-central-1'
    stackName:      'my-stack-name'
    useChangeSet:   true
    changeSetName:  'my-stack-name-change-set'
    templateFile:   'my-aws-cloudformation-template.yml'
    templateParametersFile: 'development/parameters.json'
    captureStackOutputs: asVariables
    captureAsSecuredVars: false

I used the service connection that I’ve called development-account and specified the other required information such as the templateFile path for the AWS CloudFormation template. I also specified the optional templateParametersFile path because I used template parameters in my template.

A template parameters file is particularly useful if you need to use custom values in your CloudFormation templates that are different for each stack. This is a common case when deploying the same application stack to different environments (Development, Staging, and Production).

The task below will to deploy the same template to a Staging environment:

- task: CloudFormationCreateOrUpdateStack@1
  displayName: 'Create/Update Stack: Staging-Deployment'
  inputs:
    awsCredentials: 'staging-account'
    regionName:     'eu-central-1'
    stackName:      'my-stack-name'
    useChangeSet:   true
    changeSetName:  'my-stack-name-changeset'
    templateFile:   'my-aws-cloudformation-template.yml'
    templateParametersFile: 'staging/parameters.json'
    captureStackOutputs: asVariables
    captureAsSecuredVars: false

The differences between Development and Staging deployment tasks are the service connection name and template parameters file path used. Remember that each service connection points to a different AWS account and the corresponding parameter values are specific to the target environment.

Use Azure DevOps Parameters to Switch Between Your AWS Accounts

Azure DevOps lets you define reusable contents via pipeline templates and pass different variable values to them when defining the build tasks. You can leverage this functionality so that you easily replicate your deployment steps to your different environments.

In the pipeline template snippet below, I use three template parameters that are passed as input to my task definition:

# File pipeline-templates/my-application.yml

parameters:
  deploymentEnvironment: ''         # development, staging, production, etc
  awsCredentials:        ''         # service connection name
  region:                ''         # the AWS region

steps:

- task: CloudFormationCreateOrUpdateStack@1
  displayName: 'Create/Update Stack: Staging-Deployment'
  inputs:
    awsCredentials: '${{ parameters.awsCredentials }}'
    regionName:     '${{ parameters.region }}'
    stackName:      'my-stack-name'
    useChangeSet:   true
    changeSetName:  'my-stack-name-changeset'
    templateFile:   'my-aws-cloudformation-template.yml'
    templateParametersFile: '${{ parameters.deploymentEnvironment }}/parameters.json'
    captureStackOutputs: asVariables
    captureAsSecuredVars: false

This template can then be used when defining your pipeline with steps to deploy to the Development and Staging environments. The values passed to the parameters will control the target AWS Account the CloudFormation stack will be deployed to :

# File development/pipeline.yml

container: amazon/aws-cli

trigger:
  branches:
    include:
    - master
    
steps:
- template: ../pipeline-templates/my-application.yml  
  parameters:
    deploymentEnvironment: 'development'
    awsCredentials:        'deployment-development'
    region:                'eu-central-1'
    
- template: ../pipeline-templates/my-application.yml  
  parameters:
    deploymentEnvironment: 'staging'
    awsCredentials:        'deployment-staging'
    region:                'eu-central-1'

Putting it All Together

In the snippet examples below, I defined an Azure DevOps pipeline template that builds a Docker image, pushes it to Amazon ECR (using the ECR Push Task) , creates/updates a stack from an AWS CloudFormation template with a template parameter files, and finally runs a AWS CLI command to list all Load Balancers using the AWS CLI Task.

The template below can be reused across different AWS accounts by simply switching the value of the defined parameters as described in the previous section.

Define a template containing your AWS deployment steps:

# File pipeline-templates/my-application.yml

parameters:
  deploymentEnvironment: ''         # development, staging, production, etc
  awsCredentials:        ''         # service connection name
  region:                ''         # the AWS region

steps:

# Build a Docker image
  - task: Docker@1
    displayName: 'Build docker image'
    inputs:
      dockerfile: 'Dockerfile'
      imageName: 'my-application:${{parameters.deploymentEnvironment}}'

# Push Docker Image to Amazon ECR
  - task: ECRPushImage@1
    displayName: 'Push image to ECR'
    inputs:
      awsCredentials: '${{ parameters.awsCredentials }}'
      regionName:     '${{ parameters.region }}'
      sourceImageName: 'my-application'
      repositoryName: 'my-application'
  
# Deploy AWS CloudFormation Stack
- task: CloudFormationCreateOrUpdateStack@1
  displayName: 'Create/Update Stack: My Application Deployment'
  inputs:
    awsCredentials: '${{ parameters.awsCredentials }}'
    regionName:     '${{ parameters.region }}'
    stackName:      'my-application'
    useChangeSet:   true
    changeSetName:  'my-application-changeset'
    templateFile:   'cfn-templates/my-application-template.yml'
    templateParametersFile: '${{ parameters.deploymentEnvironment }}/my-application-parameters.json'
    captureStackOutputs: asVariables
    captureAsSecuredVars: false
         
# Use AWS CLI to perform commands, e.g. list Load Balancers 
 - task: AWSShellScript@1
    displayName: 'AWS CLI: List Elastic Load Balancers'
    inputs:
    awsCredentials: '${{ parameters.awsCredentials }}'
    regionName:     '${{ parameters.region }}'
    scriptType:     'inline'
    inlineScript:   'aws elbv2 describe-load-balancers'

Define a pipeline file for deploying to the Development account:

# File development/azure-pipelines.yml

container: amazon/aws-cli

variables:
- name:  deploymentEnvironment
  value: 'development'
- name:  awsCredentials
  value: 'deployment-development'
- name:  region
  value: 'eu-central-1'  

trigger:
  branches:
    include:
    - master
    - dev
  paths:
    include:
    - "${{ variables.deploymentEnvironment }}/*"  
    
steps:
- template: ../pipeline-templates/my-application.yml  
  parameters:
    deploymentEnvironment: ${{ variables.deploymentEnvironment }}
    awsCredentials:        ${{ variables.awsCredentials }}
    region:                ${{ variables.region }}

(Optionally) Define a pipeline file for deploying to the Staging and Production accounts

<p># File staging/azure-pipelines.yml</p>
container: amazon/aws-cli

variables:
- name:  deploymentEnvironment
  value: 'staging'
- name:  awsCredentials
  value: 'deployment-staging'
- name:  region
  value: 'eu-central-1'  

trigger:
  branches:
    include:
    - master
  paths:
    include:
    - "${{ variables.deploymentEnvironment }}/*"  
    
    
steps:
- template: ../pipeline-templates/my-application.yml  
  parameters:
    deploymentEnvironment: ${{ variables.deploymentEnvironment }}
    awsCredentials:        ${{ variables.awsCredentials }}
    region:                ${{ variables.region }}
	
# File production/azure-pipelines.yml

container: amazon/aws-cli

variables:
- name:  deploymentEnvironment
  value: 'production'
- name:  awsCredentials
  value: 'deployment-production'
- name:  region
  value: 'eu-central-1'  

trigger:
  branches:
    include:
    - master
  paths:
    include:
    - "${{ variables.deploymentEnvironment }}/*"  
    
    
steps:
- template: ../pipeline-templates/my-application.yml  
  parameters:
    deploymentEnvironment: ${{ variables.deploymentEnvironment }}
    awsCredentials:        ${{ variables.awsCredentials }}
    region:                ${{ variables.region }}

Cleanup

After you have tested and verified your pipeline, you should remove any unused resources by deleting the CloudFormation stacks to avoid unintended account charges. You can delete the stack manually from the AWS Console or use your Azure DevOps pipeline by adding a CloudFormationDeleteStack task:

- task: CloudFormationDeleteStack@1
  displayName: 'Delete Stack: My Application Deployment'
  inputs:
    awsCredentials: '${{ parameters.awsCredentials }}'
    regionName:     '${{ parameters.region }}'
    stackName:      'my-application'       

Conclusion

In this post, I showed you how you can easily leverage the AWS Toolkit for AzureDevOps extension to deploy resources to your AWS account from Azure DevOps and Azure DevOps Server. The story does not end here. This extension integrates directly with others services as well, making it easy to build your pipelines around them:

  • AWSCLI – Interact with the AWSCLI (Windows hosts only)
  • AWS Powershell Module – Interact with AWS through powershell (Windows hosts only)
  • Beanstalk – Deploy ElasticBeanstalk applications
  • CodeDeploy – Deploy with CodeDeploy
  • CloudFormation – Create/Delete/Update CloudFormation stacks
  • ECR – Push an image to an ECR repository
  • Lambda – Deploy from S3, .net core applications, or any other language that builds on Azure DevOps
  • S3 – Upload/Download to/from S3 buckets
  • Secrets Manager – Create and retrieve secrets
  • SQS – Send SQS messages
  • SNS – Send SNS messages
  • Systems manager – Get/set parameters and run commands

The toolkit is an open-source project available in GitHub. We’d love to see your issues, feature requests, code reviews, pull requests, or any positive contribution coming up.

Author:

Mahmoud Abid

Mahmoud Abid is a Senior Customer Delivery Architect at Amazon Web Services. He focuses on designing technical solutions that solve complex business challenges for customers across EMEA. A builder at heart, Mahmoud has been designing large scale applications on AWS since 2011 and, in his spare time, enjoys every DIY opportunity to build something at home or outdoors.

Govern CI/CD best practices via AWS Service Catalog

Post Syndicated from César Prieto Ballester original https://aws.amazon.com/blogs/devops/govern-ci-cd-best-practices-via-aws-service-catalog/

Introduction

AWS Service Catalog enables organizations to create and manage Information Technology (IT) services catalogs that are approved for use on AWS. These IT services can include resources such as virtual machine images, servers, software, and databases to complete multi-tier application architectures. AWS Service Catalog lets you centrally manage deployed IT services and your applications, resources, and metadata , which helps you achieve consistent governance and meet your compliance requirements. In addition,  this configuration enables users to quickly deploy only approved IT services.

In large organizations, as more products are created, Service Catalog management can become exponentially complicated when different teams work on various products. The following solution simplifies Service Catalog products provisioning by considering elements such as shared accounts, roles, or users who can run portfolios or tags in the form of best practices via Continuous Integrations and Continuous Deployment (CI/CD) patterns.

This post demonstrates how Service Catalog Products can be delivered by taking advantage of the main benefits of CI/CD principles along with reducing complexity required to sync services. In this scenario, we have built a CI/CD Pipeline exclusively using AWS Services and the AWS Cloud Development Kit (CDK) Framework to provision the necessary Infrastructure.

Customers need the capability to consume services in a self-service manner, with services built on patterns that follow best practices, including focus areas such as compliance and security. The key tenants for these customers are: the use of infrastructure as code (IaC), and CI/CD. For these reasons, we built a scalable and automated deployment solution covered in this post.Furthermore, this post is also inspired from another post from the AWS community, Building a Continuous Delivery Pipeline for AWS Service Catalog.

Solution Overview

The solution is built using a unified AWS CodeCommit repository with CDK v1 code, which manages and deploys the Service Catalog Product estate. The solution supports the following scenarios: 1) making Products available to accounts and 2) provisioning these Products directly into accounts. The configuration provides flexibility regarding which components must be deployed in accounts as opposed to making a collection of these components available to account owners/users who can in turn build upon and provision them via sharing.

Figure shows the pipeline created comprised of stages

The pipeline created is comprised of the following stages:

  1. Retrieving the code from the repository
  2. Synthesize the CDK code to transform it into a CloudFormation template
  3. Ensure the pipeline is defined correctly
  4. Deploy and/or share the defined Portfolios and Products to a hub account or multiple accounts

Deploying and using the solution

Deploy the pipeline

We have created a Python AWS Cloud Development Kit (AWS CDK) v1 application hosted in a Git Repository. Deploying this application will create the required components described in this post. For a list of the deployment prerequisites, see the project README.

Clone the repository to your local machine. Then, bootstrap and deploy the CDK stack following the next steps.

git clone https://github.com/aws-samples/aws-cdk-service-catalog-pipeline
cd aws-cdk-service-catalog
pip install -r requirements.txt
cdk bootstrap aws://account_id/eu-west-1
cdk deploy

The infrastructure creation takes around 3-5 minutes to complete deploying the AWS CodePipelines and repository creation. Once CDK has deployed the components, you will have a new empty repository where we will define the target Service Catalog estate. To do so, clone the new repository and push our sample code into it:

git clone https://git-codecommit.eu-west-1.amazonaws.com/v1/repos/service-catalog-repo
git checkout -b main
cd service-catalog-repo
cp -aR ../cdk-service-catalog-pipeline/* .
git add .
git commit -am "First commit"
git push origin main

Review and update configuration

Our cdk.json file is used to manage context settings such as shared accounts, permissions, region to deploy, etc.

shared_accounts_ecs: AWS account IDs where the ECS portfolio will be shared
shared_accounts_storage: AWS account IDs where the Storage portfolio will be shared
roles: ARN for the roles who will have permissions to access to the Portfolio
users: ARN for the users who will have permissions to access to the Portfolio
groups: ARN for the groups who will have permissions to access to the Portfolio
hub_account: AWS account ID where the Portfolio will be created
pipeline_account: AWS account ID where the main Infrastructure Pipeline will be created
region: the AWS region to be used for the deployment of the account
"shared_accounts_ecs":["012345678901","012345678902"],
    "shared_accounts_storage":["012345678901","012345678902"],
    "roles":[],
    "users":[],
    "groups":[],
    "hub_account":"012345678901",
    "pipeline_account":"012345678901",
    "region":"eu-west-1"

There are two mechanisms that can be used to create Service Catalog Products in this solution: 1) providing a CloudFormation template or 2) declaring a CDK stack (that will be transformed as part of the pipeline). Our sample contains two Products, each demonstrating one of these options: an Amazon Elastic Container Services (ECS) deployment and an Amazon Simple Storage Service (S3) product.

These Products are automatically shared with accounts specified in the shared_accounts_storage variable. Each product is managed by a CDK Python file in the cdk_service_catalog folder.

Figure shows Pipeline stages that AWS CodePipeline runs through

Figure shows Pipeline stages that AWS CodePipeline runs through

Figure shows Pipeline stages that AWS CodePipeline runs through

The Pipeline stages that AWS CodePipeline runs through are as follows:

  1. Download the AWS CodeCommit code
  2. Synthesize the CDK code to transform it into a CloudFormation template
  3. Auto-modify the Pipeline in case you have made manual changes to it
  4. Display the different Portfolios and Products associated in a Hub account in a Region or in multiple accounts

Adding new Portfolios and Products

To add a new Portfolio to the Pipeline, we recommend creating a new class under cdk_service_catalog similar to cdk_service_catalog_ecs_stack.py from our sample. Once the new class is created with the products you wish to associate, we instantiate the new class inside cdk_pipelines.py, and then add it inside the wave in the stage. There are two ways to create portfolio products. The first one is by creating a CloudFormation template, as can be seen in the Amazon Elastic Container Service (ECS) example.  The second way is by creating a CDK stack that will be transformed into a template, as can be seen in the Storage example.

Product and Portfolio definition:

class ECSCluster(servicecatalog.ProductStack):
    def __init__(self, scope, id):
        super().__init__(scope, id)
        # Parameters for the Product Template
        cluster_name = cdk.CfnParameter(self, "clusterName", type="String", description="The name of the ECS cluster")
        container_insights_enable = cdk.CfnParameter(self, "container_insights", type="String",default="False",allowed_values=["False","True"],description="Enable Container Insights")
        vpc = cdk.CfnParameter(self, "vpc", type="AWS::EC2::VPC::Id", description="VPC")
        ecs.Cluster(self,"ECSCluster_template", enable_fargate_capacity_providers=True,cluster_name=cluster_name.value_as_string,container_insights=bool(container_insights_enable.value_as_string),vpc=vpc)
              cdk.Tags.of(self).add("key", "value")

Clean up

The following will help you clean up all necessary parts of this post: After completing your demo, feel free to delete your stack using the CDK CLI:

cdk destroy --all

Conclusion

In this post, we demonstrated how Service Catalog deployments can be accelerated by building a CI/CD pipeline using self-managed services. The Portfolio & Product estate is defined in its entirety by using Infrastructure-as-Code and automatically deployed based on your configuration. To learn more about AWS CDK Pipelines or AWS Service Catalog, visit the appropriate product documentation.

Authors:


César Prieto Ballester

César Prieto Ballester is a Senior DevOps Consultant at AWS. He enjoys automating everything and building infrastructure using code. Apart from work, he plays electric guitar and loves riding his mountain bike.

Daniel Mutale

Daniel Mutale is a Cloud Infrastructure Architect at AWS Professional Services. He enjoys creating cloud based architectures and building out the underlying infrastructure to support the architectures using code. Apart from work, he is an avid animal photographer and has a passion for interior design.

Raphael Sack

Raphael is a technical business development manager for Service Catalog & Control Tower. He enjoys tinkering with automation and code and active member of the management tools community.

Orchestrate big data jobs on on-premises clusters with AWS Step Functions

Post Syndicated from Göksel SARIKAYA original https://aws.amazon.com/blogs/big-data/orchestrate-big-data-jobs-on-on-premises-clusters-with-aws-step-functions/

Customers with specific needs to run big data compute jobs on an on-premises infrastructure often require a scalable orchestration solution. For large-scale distributed compute clusters, the orchestration of jobs must be scalable to maximize their utilization, while at the same time remain resilient to any failures to prevent blocking the ever-growing influx of data and jobs. Moreover, on-premises compute resources can’t be extended on demand, therefore, the jobs may be competing for the same resources with different priorities.

This post showcases serverless building blocks for orchestrating big data jobs using AWS Step Functions, AWS Lambda, and Amazon DynamoDB with a focus on reliability, maintainability, and monitoring. In this solution, Step Functions enables thousands of workflows to run parallel. Additionally, Lambda provides flexibility implementing arbitrary interfaces to the on-premises infrastructure and its compute resources. With additional steps in the orchestration, the solution also allows operations to monitor thousands of parallel jobs in a visual interface for better debugging.

Architecture

The proposed serverless solution consists of the following main components:

  • Job trigger – Requests new compute jobs to run on the on-premises cluster. For simplicity, in this architecture we assume that the trigger is a client calling Step Functions directly. However, you could extend this to include Amazon API Gateway to create a job API to interface with the orchestration solution or a rule engine to trigger jobs when relevant data becomes available.
  • Job manager – This Step Functions workflow runs once per compute job, with multiple workflows running in parallel. It tracks the status of a job from queueing, scheduling, running, retrying, all the way to its completion. Ideally, a job can be scheduled immediately, but workflows can run for days if a job is very low priority and compute resources are sparse. The job manager delegates the decision when or where to run the job to the job queue manager. Communication to the on-premises cluster is abstracted through a Lambda adapter.
  • Job queue manager – Maintains a queue of all jobs. With the given job properties (for example based on priority), the job queue manager decides the running time of jobs, and the cluster on which they run. To illustrate the concept, the architecture considers real-time information on the resource utilization of the compute clusters (memory, CPU) for scheduling. However, you could apply different scheduling algorithms as required given the flexibility of Lambda.
  • On-premises compute cluster – Provides the computing resources, data nodes, and tools to run compute jobs.

The following diagram illustrates the solution architecture.

Solution Architecture

The main process of the solution consists of seven steps:

  1. The job trigger runs a new Step Functions workflow to run a compute job on premises and provides the necessary information (such as priority and required resources).
  2. The job manager creates a new record in DynamoDB to add the job to the queue of the job queue manager, and the workflow waits for the job queue manager to call back.
  3. Amazon EventBridge triggers a scheduled Lambda function in the job queue manager periodically (for example, every 5 minutes), decoupled from the job requests.
  4. The job scheduler Lambda function retrieves real-time information from cluster metrics to see whether jobs can be scheduled at this point in time.
  5. The job scheduler function fetches all queued jobs from DynamoDB and tries to schedule as many of those jobs as possible to available compute resources based on priority, as well as memory and CPU demands.
  6. For each job that can be scheduled to the compute cluster, the job scheduler function communicates back to the job manager to signal the workflow to continue and that the job can be run.
  7. The job manager communicates with the on-premises cluster through the compute cluster adapter Lambda function to run the job, track its status periodically, and retry in case of errors.

On-premises compute cluster

In this post, we assume the on-premises compute cluster offers interfaces to interact with the compute resources. For example, customers could run a Spark compute cluster on premises that allows the following basic interactions through an API:

  • Upload and trigger a compute job on a cluster (for example, upload a Spark JAR file and submit)
  • Get the status of a compute job (such as running, stopped, or error)
  • Get error output in case of failures in the compute job (for example, the job failed due to access denied)

In addition, we assume the cluster can provide metrics on its current utilization. For example, the cluster could provide Prometheus metrics as aggregates over all resources within a compute cluster:

  • Memory utilization (for example, 2 TB with 80% utilization)
  • CPU utilization (for example, 5,000 cores with 50% utilization)

We use the terminology introduced here for the example in this post. Depending on the capabilities of the on-premises cluster, you can adjust these concepts. For example, the compute cluster could use Kubernetes or SLURM instead of Spark.

Job manager

The job manager is responsible for communicating with on-premises clusters to trigger big data jobs and query their status. It’s a Step Functions state machine that consists of three steps, as illustrated in the following figure.

The first step is JobQueueRequest, which makes a request to the job queue manager component and waits for the callback. When the job queue manager sends OK to the waiting step with a callback pattern, the second step StartJobRun runs.

The StartJobRun step communicates with the on-premises environment (for example, via HTTP post to a REST API endpoint) to trigger an on-premises job.

The third step GetJobStatus queries the job status from the on-premises cluster. If the job status is InProgress, the state machine waits for a configured time. When the Wait state is over, it returns to the GetJobStatus step to query the job status again in a loop. When the job returns a successful state from the on-premises cluster, the state machine completes its cycle with a Success state. If the job fails with a timeout or with an error, the state machine completes its cycle with a Fail state.

The following screenshot shows the details of the state machine on the Step Functions console.

Jpob Manager Step Function Inputs

Job queue manager

The job queue manager is responsible for managing job queues based on job priorities and cluster utilization. It consists of DynamoDB, Lambda, and EventBridge.

The JobQueue table keeps data of waiting jobs, including jobId as the primary key, priority as the sort key, needed memory and CPU consumptions, callbackId, and timestamp information. You can add further information to the table dynamically if required by the scheduling algorithm.

The following screenshot shows the attribute details of the JobQueue table.

EventBridge triggers the job scheduler Lambda function on a regular bases in a configured interval. First, the job scheduler function gets waiting jobs data from the JobQueue table in DynamoDB. Then it establishes a connection with the on-premises cluster to fetch cluster metrics such as memory and CPU utilization. Based on this information, the function decides which jobs are ready to be triggered on the on-premises cluster.

The scheduling algorithm proposed here follows a simple concept to maximize resource utilization, while respecting the job priority. Essentially, for an on-premises cluster (we could potentially have multiple in different geographies), the job scheduler Lambda function builds a queue of jobs according to their priority, while allocating the first job in the queue to compute resources on the cluster. If enough resources are available, the scheduler moves to the next job in the queue and repeats.

Due to the flexibility of Lambda functions, you can tailor the scheduling algorithm for a specific use case. Cluster scheduling algorithms are still an open research topic with different optimization goals, such as throughput, data location, fairness, deadlines, and more.

Get started

In this section, we provide a starting point for the solution described in this post. The steps walk you through creating a Step Functions state machine with the appropriate template, and the necessary Lambda and DynamoDB interactions to create the job manager and job queue manager building blocks. Example code for the Lambda functions is excluded from this post, because the communication with the on-premises cluster to trigger jobs can vary depending on your on-premises interface.

  1. On the Step Functions console, choose State machines.
  2. Choose Create state machine.
  3. Select Run a sample project.
  4. Select Job Poller.
    Job Poller State Machine Template
  5. Scroll down to see the sample projects, which are defined using Amazon States Language (ASL).
  6. Review the example definition, then choose Next.Job Manager Step Functions Template
  7. Choose Deploy resources.
    Deployment can take up to 10 minutes.Step Functions Deploy Resources
    The deployment creates the state machine that is responsible for job management. After you deploy the resources, you need to edit the sample ASL code to add the extra JobQueueRequest step in the state machine.
  8. Select the created state machine.
  9. Choose Edit to add ARNs of the three Lambda functions to make a request in the job queue manager (Job Queue Request), to submit a job to the on-premises cluster (Submit Job), and to poll the status of the jobs (Get Job Status).Job Manager Step Functions Definition
    Now you’re ready to create the job queue manager.
  10. On the DynamoDB console, create a table for storing job metadata.
  11. On the EventBridge console, create a scheduled rule that triggers the Lambda function at a configured interval.
  12. On the Lambda console, create the function that communicates with the on-premises cluster to fetch cluster metrics. It also gets jobs from the DynamoDB table to retrieve information including job priorities, required memory, and CPU to run the job on the on-premises cluster.

Limitations

This solution uses Step Functions to track all jobs until completion, and therefore the Step Functions quotas must be considered for potential use cases. Mainly, a workflow can run for a maximum of 1 year (cannot be increased) and by default 1 million parallel runs can run in a single account (can be increased to millions). See Quotas for further details.

Conclusion

This post described how to orchestrate big data jobs running in parallel on on-premises clusters with a Step Functions workflow. To learn more about how to use Step Functions workflows for serverless orchestration, visit Serverless Land.


About the Authors

Göksel Sarikaya is a Senior Cloud Application Architect at AWS Professional Services. He enables customers to design scalable, high-performance, and cost effective applications using the AWS Cloud. He helps them to be more flexible and competitive during their digital transformation journey.

Nicolas Jacob Baer is a Senior Cloud Application Architect with a strong focus on data engineering and machine learning, based in Switzerland. He works closely with enterprise customers to design data platforms and build advanced analytics/ml use-cases.

Shukhrat Khodjaev is a Senior Engagement Manager at AWS ProServe, based out of Berlin. He focuses on delivering engagements in the field of Big Data and AI/ML that enable AWS customers to uncover and to maximize their value through efficient use of data.

Leverage DevOps Guru for RDS to detect anomalies and resolve operational issues

Post Syndicated from Kishore Dhamodaran original https://aws.amazon.com/blogs/devops/leverage-devops-guru-for-rds-to-detect-anomalies-and-resolve-operational-issues/

The Relational Database Management System (RDBMS) is a popular choice among organizations running critical applications that supports online transaction processing (OLTP) use-cases. But managing the RDBMS database comes with its own challenges. AWS has made it easier for organizations to operate these databases in the cloud, thereby addressing the undifferentiated heavy lifting with managed databases (Amazon Aurora, Amazon RDS). Although using managed services has freed up engineering from provisioning hardware, database setup, patching, and backups, they still face the challenges that come with running a highly performant database. As applications scale in size and sophistication, it becomes increasingly challenging for customers to detect and resolve relational database performance bottlenecks and other operational issues quickly.

Amazon RDS Performance Insights is a database performance tuning and monitoring feature, that lets you quickly assess your database load and determine when and where to take action. Performance Insights lets non-experts in database administration diagnose performance problems with an easy-to-understand dashboard that visualizes database load. Furthermore, Performance Insights expands on the existing Amazon RDS monitoring features to illustrate database performance and help analyze any issues that affect it. The Performance Insights dashboard also lets you visualize the database load and filter the load by waits, SQL statements, hosts, or users.

On Dec 1st, 2021, we announced Amazon DevOps Guru for RDS, a new capability for Amazon DevOps Guru. It’s a fully-managed machine learning (ML)-powered service that detects operational and performance related issues for Amazon Aurora engines. It uses the data that it collects from Performance Insights, and then automatically detects and alerts customers of application issues, including database problems. When DevOps Guru detects an issue in an RDS database, it publishes an insight in the DevOps Guru dashboard. The insight contains an anomaly for the resource AWS/RDS. If DevOps Guru for RDS is turned on for your instances, then the anomaly contains a detailed analysis of the problem. DevOps Guru for RDS also recommends that you perform an investigation, or it provides a specific corrective action. For example, the recommendation might be to investigate a specific high-load SQL statement or to scale database resources.

In this post, we’ll deep-dive into some of the common issues that you may encounter while running your workloads against Amazon Aurora MySQL-Compatible Edition databases, with simulated performance issues. We’ll also look at how DevOps Guru for RDS can help identify and resolve these issues. Simulating a performance issue is resource intensive, and it will cost you money to run these tests. If you choose the default options that are provided, and clean up your resources using the following clean-up instructions, then it will cost you approximately $15 to run the first test only. If you wish to run all of the tests, then you can choose “all” in the Tests parameter choice. This will cost you approximately $28 to run all three tests.

Prerequisites

To follow along with this walkthrough, you must have the following prerequisites:

  • An AWS account with a role that has sufficient access to provision the required infrastructure. The account should also not have exceeded its quota for the resources being deployed (VPCs, Amazon Aurora, etc.).
  • Credentials that enable you to interact with your AWS account.
  • If you already have Amazon DevOps Guru turned on, then make sure that it’s tagged properly to detect issues for the resource being deployed.

Solution overview

You will clone the project from GitHub and deploy an AWS CloudFormation template, which will set up the infrastructure required to run the tests. If you choose to use the defaults, then you can run only the first test. If you would like to run all of the tests, then choose the “all” option under Tests parameter.

We simulate some common scenarios that your database might encounter when running enterprise applications. The first test simulates locking issues. The second test simulates the behavior when the AUTOCOMMIT property of the database driver is set to: True. This could result in statement latency. The third test simulates performance issues when an index is missing on a large table.

Solution walk through

Clone the repo and deploy resources

  1. Utilize the following command to clone the GitHub repository that contains the CloudFormation template and the scripts necessary to simulate the database load. Note that by default, we’ve provided the command to run only the first test.
    git clone https://github.com/aws-samples/amazon-devops-guru-rds.git
    cd amazon-devops-guru-rds
    
    aws cloudformation create-stack --stack-name DevOpsGuru-Stack \
        --template-body file://DevOpsGuruMySQL.yaml \
        --capabilities CAPABILITY_IAM \
        --parameters ParameterKey=Tests,ParameterValue=one \
    ParameterKey=EnableDevOpsGuru,ParameterValue=y

    If you wish to run all four of the tests, then flip the ParameterValue of the Tests ParameterKey to “all”.

    If Amazon DevOps Guru is already enabled in your account, then change the ParameterValue of the EnableDevOpsGuru ParameterKey to “n”.

    It may take up to 30 minutes for CloudFormation to provision the necessary resources. Visit the CloudFormation console (make sure to choose the region where you have deployed your resources), and make sure that DevOpsGuru-Stack is in the CREATE_COMPLETE state before proceeding to the next step.

  2. Navigate to AWS Cloud9, then choose Your environments. Next, choose DevOpsGuruMySQLInstance followed by Open IDE. This opens a cloud-based IDE environment where you will be running your tests. Note that in this setup, AWS Cloud9 inherits the credentials that you used to deploy the CloudFormation template.
  3. Open a new terminal window which you will be using to clone the repository where the scripts are located.

  1. Clone the repo into your Cloud9 environment, then navigate to the directory where the scripts are located, and run initial setup.
git clone https://github.com/aws-samples/amazon-devops-guru-rds.git
cd amazon-devops-guru-rds/scripts
sh setup.sh 
# NOTE: If you are running all test cases, use sh setup.sh all command instead. 
source ~/.bashrc
  1. Initialize databases for all of the test cases, and add random data into them. The script to insert random data takes approximately five hours to complete. Your AWS Cloud9 instance is set up to run for up to 24 hours before shutting down. You can exit the browser and return between 5–24 hours to validate that the script ran successfully, then continue to the next step.
source ./connect.sh test 1
USE devopsgurusource;
CREATE TABLE IF NOT EXISTS test1 (id int, filler char(255), timer timestamp);
exit;
python3 ct.py

If you chose to run all test cases, and you ran the sh setup.sh all command in Step 4, open two new terminal windows and run the following commands to insert random data for test cases 2 and 3.

# Test case 2 – Open a new terminal window to run the commands
cd amazon-devops-guru-rds/scripts
source ./connect.sh test 2
USE devopsgurusource;
CREATE TABLE IF NOT EXISTS test1 (id int, filler char(255), timer timestamp);
exit;
python3 ct.py
# Test case 3 - Open a new terminal window to run the commands
cd amazon-devops-guru-rds/scripts
source ./connect.sh test 3
USE devopsgurusource;
CREATE TABLE IF NOT EXISTS test1 (id int, filler char(255), timer timestamp);
exit;
python3 ct.py
  1. Return between 5-24 hours to run the next set of commands.
  1. Add an index to the first database.
source ./connect.sh test 1
CREATE UNIQUE INDEX test1_pk ON test1(id);
INSERT INTO test1 VALUES (-1, 'locker', current_timestamp);
exit;
  1. If you chose to run all test cases, and you ran the sh setup.sh all command in Step 4, add an index to the second database. NOTE: Do no add an index to the third database.
source ./connect.sh test 2
CREATE UNIQUE INDEX test1_pk ON test1(id);
INSERT INTO test1 VALUES (-1, 'locker', current_timestamp);
exit;

DevOps Guru for RDS uses Performance Insights, and it establishes a baseline for the database metrics. Baselining involves analyzing the database performance metrics over a period of time to establish a “normal” behavior. DevOps Guru for RDS then uses ML to detect anomalies against the established baseline. If your workload pattern changes, then DevOps Guru for RDS establishes a new baseline that it uses to detect anomalies against the new “normal”. For new database instances, DevOps Guru for RDS takes up to two days to establish an initial baseline, as it requires an analysis of the database usage patterns and establishing what is considered a normal behavior.

  1. Allow two days before you start running the following tests.

Scenario 1: Locking Issues

In this scenario, multiple sessions compete for the same (“locked”) record, and they must wait for each other.
In real life, this often happens when:

  • A database session gets disconnected due to a (i.e., temporary network) malfunction, while still holding a critical lock.
  • Other sessions become stuck while waiting for the lock to be released.
  • The problem is often exacerbated by the application connection manager that keeps spawning additional sessions (because the existing sessions don’t complete the work on time), thus creating a distinct “inclined slope” pattern that you’ll see in this scenario.

Here’s how you can reproduce it:

  1. Connect to the database.
cd amazon-devops-guru-rds/scripts
source ./connect.sh test 1
  1. In your MySQL, enter the following SQL, and don’t exit the shell.
START TRANSACTION;
UPDATE test1 SET timer=current_timestamp WHERE id=-1;
-- Do NOT exit!
  1. Open a new terminal, and run the command to simulate competing transactions. Give it approximately five minutes before you run the commands in this step.
cd amazon-devops-guru-rds/scripts
source ./connect.sh test 1
exit;
python3 locking_scenario.py 1 1200 2
  1. After the program completes its execution, navigate to the Amazon DevOps Guru console, choose Insights, and then choose RDS DB Load Anomalous. You’ll notice a summary of the insight under Description.

Shows navigation to Amazon DevOps Guru Insights and RDS DB Load Anomalous screen to find the summary description of the anomaly.

  1. Choose the View Recommendations link on the top right, and observe the databases for which it’s showing the recommendations.
  2. Next, choose View detailed analysis for database performance anomaly for the following resources.
  3. Under To view a detailed analysis, choose a resource name, choose the database associated with the first test.

 Shows the detailed analysis of the database performance anomaly. The database experiencing load is chosen, and a graphical representation of how the Average active sessions (AAS) spikes, which Amazon DevOps Guru is able to identify.

  1. Observe the recommendations under Analysis and recommendations. It provides you with analysis, recommendations, and links to troubleshooting documentation.

Shows a different section of the detailed analysis screen that provides Analysis and recommendations and links to the troubleshooting documentation.

In this example, DevOps Guru for RDS has detected a high and unusual spike of database load, and then marked it as “performance anomaly”.

Note that the relative size of the anomaly is significant: 490 times higher than the “typical” database load, which is why it’s deemed: “HIGH severity”.

In the analysis section, note that a single “wait event”, wait/synch/mutex/innodb/aurora_lock_thread_slot_futex, is dominating the entire spike. Moreover, a single SQL is “responsible” (or more precisely: “suffering”) from this wait event at the time of the problem. Select the wait event name and see a simple explanation of what’s happening in the database. For example, it’s “record locking”, where multiple sessions are competing for the same database records. Additionally, you can select the SQL hash and see the exact text of the SQL that’s responsible for the issue.

If you’re interested in why DevOps Guru for RDS detected this problem, and why these particular wait events and an SQL were selected, the Why is this a problem? and Why do we recommend this? links will provide the answer.

Finally, the most relevant part of this analysis is a View troubleshooting doc link. It references a document that contains a detailed explanation of the likely causes for this problem, as well as the actions that you can take to troubleshoot and address it.

Scenario 2: Autocommit: ON

In this scenario, we must run multiple batch updates, and we’re using a fairly popular driver setting: AUTOCOMMIT: ON.

This setting can sometimes lead to performance issues as it causes each UPDATE statement in a batch to be “encased” in its own “transaction”. This leads to data changes being frequently synchronized to disk, thus dramatically increasing batch latency.

Here’s how you can reproduce the scenario:

  1. On your Cloud9 terminal, run the following commands:
cd amazon-devops-guru-rds/scripts
source ./connect.sh test 2
exit;
python3 batch_autocommit.py 50 1200 1000 10000000
  1. Once the program completes its execution, or after an hour, navigate to the Amazon DevOps Guru console, choose Insights, and then choose RDS DB Load Anomalous. Then choose Recommendations and choose View detailed analysis for database performance anomaly for the following resources. Under To view a detailed analysis, choose a resource name, choose the database associated with the second test.

  1. Observe the recommendations under Analysis and recommendations. It provides you with analysis, recommendations, and links to troubleshooting documentation.

Shows a different section of the detailed analysis screen that provides Analysis and recommendations and links to the troubleshooting documentation.

Note that DevOps Guru for RDS detected a significant (and unusual) spike of database load and marked it as a HIGH severity anomaly.

The spike looks similar to the previous example (albeit, “smaller”), but it describes a different database problem (“COMMIT slowdowns”). This is because of a different database wait event that dominates the spike: wait/io/aurora_redo_log_flush.

As in the previous example, you can select the wait event name to see a simple description of what’s going on, and you can select the SQL hash to see the actual statement that is slow. Furthermore, just as before, the View troubleshooting doc link references the document that describes what you can do to troubleshoot the problem further and address it.

Scenario 3: Missing index

Have you ever wondered what would happen if you drop a frequently accessed index on a large table?

In this relatively simple scenario, we’re testing exactly that – an index gets dropped causing queries to switch from fast index lookups to slow full table scans, thus dramatically increasing latency and resource use.

Here’s how you can reproduce this problem and see it for yourself:

  1. On your Cloud9 terminal, run the following commands:
cd amazon-devops-guru-rds/scripts
source ./connect.sh test 3
exit;
python3 no_index.py 50 1200 1000 10000000
  1. Once the program completes its execution, or after an hour, navigate to the Amazon DevOps Guru console, choose Insights, and then choose RDS DB Load Anomalous. Then choose Recommendations and choose View detailed analysis for database performance anomaly for the following resources. Under To view a detailed analysis, choose a resource name, choose the database associated with the third test.

Shows the detailed analysis of the database performance anomaly. The database experiencing load is chosen and a graphical representation of how the Average active sessions (AAS) spikes which Amazon DevOps Guru is able to identify.

  1. Observe the recommendations under Analysis and recommendations. It provides you with analysis, recommendations, and links to troubleshooting documentation.

Shows a different section of the detailed analysis screen that provides Analysis and recommendations and links to the troubleshooting documentation.

As with the previous examples, DevOps Guru for RDS detected a high and unusual spike of database load (in this case, ~ 50 times larger than the “typical” database load). It also identified that a single wait event, wait/io/table/sql/handler, and a single SQL, are responsible for this issue.

The analysis highlights the SQL that you must pay attention to, and it links a detailed troubleshooting document that lists the likely causes and recommended actions for the problems that you see. While it doesn’t tell you that the “missing index” is the real root cause of the issue (this is planned in future versions), it does offer many relevant details that can help you come to that conclusion yourself.

Cleanup

On your terminal where you originally ran the AWS Command Line Interface (AWS CLI) command to create the CloudFormation resources, run the following command:

aws cloudformation delete-stack --stack-name DevOpsGuru-Stack

Conclusion

In this post, you learned how to leverage DevOps Guru for RDS to alert you of any operational issues with recommendations. You simulated some of the commonly encountered, real-world production issues, such as locking contentions, AUTOCOMMIT, and missing indexes. Moreover, you saw how DevOps Guru for RDS helped you detect and resolve these issues. Try this out, and let us know how DevOps Guru for RDS was able to address your use-case.

Authors:

Kishore Dhamodaran

Kishore Dhamodaran is a Senior Solutions Architect at AWS. Kishore helps strategic customers with their cloud enterprise strategy and migration journey, leveraging his years of industry and cloud experience.

Simsek Mert

Simsek Mert is a Cloud Application Architect with AWS Professional Services.
Simsek helps customers with their application architecture, containers, serverless applications, leveraging his over 20 years of experience.

Maxym Kharchenko

Maxym Kharchenko is a Principal Database Engineer at AWS. He builds automated monitoring tools that use machine learning to discover and explain performance problems in relational databases.

Jared Keating

Jared Keating is a Senior Cloud Consultant with Amazon Web Services Professional Services. Jared assists customers with their cloud infrastructure, compliance, and automation requirements drawing from his over 20 years of experience in IT.

How to let builders create IAM resources while improving security and agility for your organization

Post Syndicated from Jeb Benson original https://aws.amazon.com/blogs/security/how-to-let-builders-create-iam-resources-while-improving-security-and-agility-for-your-organization/

Many organizations restrict permissions to create and manage AWS Identity and Access Management (IAM) resources to a group of privileged users or a central team. This post explains how you can safely grant these permissions to builders – the people who are developing, testing, launching, and managing cloud infrastructure – to speed up your development, increase your agility, and improve your application security. In addition, you will use an example application stack to see how IAM permissions boundaries can help establish a secure, yet agile work environment for builders.

An example application stack

Defining and creating IAM resources within the application stack allows your builders to craft policies and roles that grant least privilege to application resources. When builders are entitled to create IAM resources, it is straightforward for them to scope policies by referencing the application resources directly in the IAM policies in the same template.

To illustrate this point you will build a simple “hello world” serverless application. The application includes an AWS Step Functions state machine that, once executed, will invoke an AWS Lambda function. You will use this example application along with some IAM policies and IAM roles to illustrate how you can use permissions boundaries to safely grant IAM privileges to builders.

In this example AWS CloudFormation template, the Resource element in MyStateMachineExecutionRole, which is specified as the role for MyStateMachine, includes a reference to the Amazon Resource Name (ARN) of MyLambdaFunction. This is a great example of the principle of least privilege as MyStateMachine will only have permissions to invoke MyLambdaFunction. Making this association is straightforward because the IAM, Step Functions, and Lambda resources are defined together in the same template.

Example application template

AWSTemplateFormatVersion: 2010-09-09
Description: builder-application

Resources:

MyLambdaFunctionExecutionRole:
	Type: AWS::IAM::Role
    Properties:
		AssumeRolePolicyDocument:
			Version: 2012-10-17
			Statement:
				- Effect: Allow
				Principal:
				Service:
					- lambda.amazonaws.com
				Action: sts:AssumeRole
		Policies:
			- PolicyName: MyLambdaFunctionBasicExecutionPolicy
			PolicyDocument:
				Version: 2012-10-17
				Statement:
					- Effect: Allow
					Action:
						- logs:CreateLogGroup
						- logs:CreateLogStream
						- logs:PutLogEvents
					Resource: !Sub arn:${AWS::Partition}:logs:${AWS::Region}:${AWS::AccountId}:log-group:*


MyLambdaFunction:
  	Type: AWS::Lambda::Function
	Properties:
		Runtime: python3.8
		Role: !GetAtt MyLambdaFunctionExecutionRole.Arn
		Handler: index.handler
		Code:
			ZipFile: |
				def handler(event, context):
					return("Hello Builder!")
		Timeout: 30

MyStateMachineExecutionRole:
	Type: AWS::IAM::Role
	Properties:
		AssumeRolePolicyDocument:
			Version: 2012-10-17
			Statement:
				- Effect: Allow
				Principal:
				Service:
					- states.amazonaws.com
				Action: sts:AssumeRole
		Policies:
			- PolicyName: StateMachineExecutionPolicy
			PolicyDocument:
				Version: 2012-10-17
				Statement:
					- Effect: Allow
					Action:
						- lambda:InvokeFunction
					Resource: !GetAtt MyLambdaFunction.Arn
      
MyStateMachine:
	Type: AWS::StepFunctions::StateMachine
	Properties:
		DefinitionString: !Sub |
          {
            "StartAt": "State1",
            "States": {
              "State1": {
                "Type": "Task",
                "Resource": "${MyLambdaFunction.Arn}",
                "End": true
              }
            }
          }
		RoleArn: !GetAtt MyStateMachineExecutionRole.Arn

MyLambdaFunctionPermission:
	Type: AWS::Lambda::Permission
	Properties:
	  Action: lambda:InvokeFunction
	  FunctionName: !Ref MyLambdaFunction
	  Principal: states.amazonaws.com
	  SourceArn: !Ref MyStateMachine

In an organization that uses a centralized approach to IAM management, a builder would not be able to deploy this example application because the roles the builders are granted prohibit IAM actions related to creating and managing roles and policies. This creates three key challenges for the organization:

  1. Builders often rely on a security or cloud team to create IAM resources. This approach adds an additional burden to that team which slows down development while builders wait for the roles and policies to be created, and encourages the team to grant overly-broad permissions so that they don’t have to be involved in the precise details of changes on a daily basis.
  2. IAM resources must be created before the rest of the stack, which makes it much more difficult to create least-privilege policies and roles.
  3. The code for IAM and application infrastructure is maintained separately, which requires extra coordination when creating and updating workloads.

Removing these challenges can simplify your cloud development, lower the amount of overhead and coordination required across your organization, and improve your security posture. Further, reducing the burden on your security team can free up time for them to focus on enforcing additional data perimeters and implementing best practices from the security pillar of the AWS Well-Architected Framework.

Use permissions boundaries on application roles created by builders

So how can your organization shift to a decentralized approach to IAM management and allow builders to safely create application IAM policies and roles, as well as prevent builders from being able to escalate their own privileges? This is a scenario where permissions boundaries should be used.

Permissions boundaries allow an IAM policy to be attached to an IAM role to enforce limits on the permissions that role can be granted. The permissions boundary itself does not grant any permissions – it’s just a guardrail that defines the maximum entitlements. You can create a builder policy that requires a specified permissions boundary be attached to any application roles that a builder creates, effectively setting the maximum permissions on any role that a builder can generate. The permissions for any application roles created will be the intersection of the application policies and the permissions boundary associated with the application role. Said another way, a permission granted in the application policy must also be granted in the permissions boundary, or else it will be implicitly denied according to the policy evaluation logic.

The set of permissions required for builder roles (assumed by actual people or CI/CD pipelines) to deploy infrastructure and develop applications are different than those required for application roles (assumed by workloads/applications) to execute within applications and workflows. If you think of permissions in terms of control plane actions involved in creating, deleting, and modifying resources, versus data plane actions needed to execute the daily business of those resources, builder and application roles typically operate more on the control plane and data plane, respectively. While permissions policies attached to application roles should be tightly scoped to include only those actions needed to perform a specific task, policies for permissions boundaries should be highly reusable and include a broad set of permissions across a suite of services that a variety of applications might need. In addition, it is a best practice to not share roles between humans and services. To summarize, policies for builder and application roles should be designed with the following criteria in mind:

Policy Role Permissions Scope Reusability User
builder builder control plane broad high human
application application data plane specific low service
application-boundary application data plane broad high application role

Following the steps in this section, you will create:

  1. A builder policy that grants builders permissions for services needed to deploy and manage applications, and to create and manage IAM policies and roles for those applications.
  2. An application-boundary policy that defines the extent of the permissions any application role created by a builder can have.
  3. A builder role with the builder policy attached as the permissions policy, the application-boundary policy attached as a permissions boundary, and a trust policy that allows anyone in the account to assume the builder role.

Create the builder IAM resources

In this first procedure, you will use CloudFormation to create the builder and application-boundary IAM policies, and the builder IAM role.

To launch the builder IAM stack

  1. Open a Linux terminal with the AWS Command Line Interface (CLI) installed and AWS credentials configured for a user or role that has permissions to create IAM resources.
  2. Launch the builder IAM stack by using the following command:
    aws cloudformation create-stack \
    --stack-name builder-iam \
    --template-url https://awsiammedia.s3.amazonaws.com/public/sample/993-grant-IAM-permissions-for-builders+/builder-iam.json \
    --capabilities CAPABILITY_NAMED_IAM

The builder policy you created uses paths to organize IAM policies and roles into isolated “spaces” that can be specified as resource constraints. It also requires roles to have a permissions boundary attached. This approach helps manage role delegation and prevents builders from escalating their privileges or modifying roles that may be used by other teams.

Note that paths can only be added to IAM resources using the AWS CLI or APIs – not via the console. If this is an issue, another option is to specify that policies and roles start with a specific phrase, for example “application-roles-*”. Just be sure to use different phrases for the builder, application, and permissions boundaries resources to maintain isolation and prevent builders from being able to escalate their privileges.

The builder policy also includes some basic control plane permissions, while the application-boundary policy you created includes permissions used across a suite of services that a typical serverless application might need. However, both policies are only meant to demonstrate the concepts in this blog post. In practice, you will need to create policies that more accurately reflect the permissions needed by builder and application roles in your organization. See the example-permissions-boundaries repository on the AWS Samples GitHub site for more ideas.

Use the builder role to launch an application stack

In this section you will assume the builder role and verify that you can launch the application stack, including the application roles, but only if the required permissions boundary and path are specified.

To test launching a stack that creates application roles

  1. Assume the builder role by using the following set of commands (copy and paste into the terminal as a single block). This step uses the jq program, which is available in most operating system package repositories.
    export AWS_DEFAULT_OUTPUT="json"; \
    role=builder; \
    aws_role=$(aws iam get-role --role-name $role); \
    role_arn=$(echo $aws_role|jq '.Role.Arn'|tr -d '"'); \
    aws_credentials=$(aws sts assume-role --role-arn $role_arn --role-session-name builder-test); \
    export AWS_ACCESS_KEY_ID=$(echo $aws_credentials|jq '.Credentials.AccessKeyId'|tr -d '"'); \
    export AWS_SECRET_ACCESS_KEY=$(echo $aws_credentials|jq '.Credentials.SecretAccessKey'|tr -d '"'); \
    export AWS_SESSION_TOKEN=$(echo $aws_credentials|jq '.Credentials.SessionToken'|tr -d '"')

    You will use this role for all of the following procedures up until the “Clean up” section. If, during the course of this exercise, you get an error that “The security token included in the request is expired”, create a new terminal and repeat this step to get a fresh set of credentials.

    The trust policy for the builder role allows any principal in the account to assume it. You can use a combination of the Principal and Condition attributes to further reduce its scope. Normally builder roles are assumed directly via federation or AWS SSO.

  2. Check that the you have now assumed the builder role by using the following command:
    aws sts get-caller-identity

  3. Launch the example application stack by using the following command:
    aws cloudformation create-stack \
    --stack-name builder-application \
    --template-url https://awsiammedia.s3.amazonaws.com/public/sample/993-grant-IAM-permissions-for-builders+/builder-application-1.yml \
    --capabilities CAPABILITY_NAMED_IAM

  4. If things are set up correctly, the stack will fail. To confirm, check the StackStatus by using the following command – it should show ROLLBACK_IN_PROGRESS or ROLLBACK_COMPLETE.
    aws cloudformation describe-stacks \
    --stack-name builder-application | jq '.Stacks[].StackStatus'

  5. The stack failed to create because the builder role you assumed does not have permissions to create the two application roles without specifying the /application_roles/ path and attaching a permissions boundary with /permissions_boundaries/ in the path. To see the details, use the following command:
    aws cloudformation describe-stack-events \
    --stack-name builder-application | jq '.StackEvents[] | select(.ResourceStatus=="CREATE_FAILED") | .ResourceStatusReason'

  6. If the original stack did not create successfully, you will not be able to update it, so you will need to delete it instead by using the following command:
    aws cloudformation delete-stack \
    --stack-name builder-application

  7. Launch a new stack with an updated template that includes the required path and permissions boundary by using the following command:
    aws cloudformation create-stack \
    --stack-name builder-application \
    --template-url https://awsiammedia.s3.amazonaws.com/public/sample/993-grant-IAM-permissions-for-builders+/builder-application-2.yml \
    --capabilities CAPABILITY_NAMED_IAM

  8. After a few minutes, confirm the stack was successfully created by using the following command and verifying StackStatus is CREATE_COMPLETE:
    aws cloudformation describe-stacks \
    --stack-name builder-application | jq '.Stacks[].StackStatus'

To verify the application is working

  1. Start an execution of the state machine and verify the application is working by using the following commands. Run them one at a time to allow the execution to finish.
    state_machine_arn=$(aws cloudformation describe-stack-resources --stack-name builder-application | jq '.StackResources[] | select (.LogicalResourceId=="MyStateMachine") | .PhysicalResourceId' | tr -d '"')
    
    execution_arn=$(aws stepfunctions start-execution --state-machine-arn $state_machine_arn | jq '.executionArn' | tr -d '"')
    
    aws stepfunctions describe-execution --execution-arn $execution_arn | jq '.output'

    If the output is “\”Hello Builder!\””, then the application is working.

Test that a builder can’t escalate their privileges

In this section, you will test scenarios where a builder attempts, intentionally or not, to escalate their privileges by first modifying the policies attached to the builder role and then extending the permissions of an application role beyond the permissions boundary.

To test updating a builder policy attached to the builder role

  1. Create an environment variable for your AWS account number, which will be used in several of the steps below, using the following command:
    export AWS_ACCOUNT=$(aws sts get-caller-identity | jq '.Account' | tr -d '"')

  2. Retrieve the builder policy and save it to a file by using the following command:
    aws iam get-policy-version \
    --policy-arn arn:aws:iam::$AWS_ACCOUNT:policy/builder_policies/builder \
    --version-id v1 | jq '.PolicyVersion.Document' > builder-policy.json

  3. Add the following JSON block to the “Statement” array in the builder-policy.json file and save the changes.
    {
    	"Sid": "SneakyBuilder",
    	"Effect": "Allow",
    	"Action": "*",
    	"Resource": "*"
    }

  4. Try to update the builder policy and set it as the default version by using the following command:
    aws iam create-policy-version \
    --policy-arn arn:aws:iam::$AWS_ACCOUNT:policy/builder_policies/builder \
    --policy-document file://builder-policy.json \
    --set-as-default

    You should get an AccessDenied error because the builder role can only modify policies in the /application_policies/ space.

To test adding an application policy to the builder role

  1. Save a copy of builder-policy.json as a new file called sneaky-policy.json using the following command:
    cp builder-policy.json sneaky-policy.json

  2. Create the new policy using the following command:
    aws iam create-policy \
    --policy-name sneaky-policy \
    --path /application_policies/ \
    --policy-document file://sneaky-policy.json

    You should not get an error in this step because you are creating a new policy that complies with the resource constraint for the statement that includes the iam:CreatePolicy permission in the builder policy. But, it’s just a policy for now – it can’t have any effect unless attached to a role.

  3. Now try to attach this new policy to the builder role by using the following command:
    aws iam attach-role-policy \
    --role-name builder \
    --policy-arn arn:aws:iam::$AWS_ACCOUNT:policy/application_policies/sneaky-policy

    You should get an error because you’re attempting to attach a policy to a role that’s not in the /application-roles/ space, in this case the builder role.

To test modifying an application role with actions outside the permissions boundary

In this procedure, you will attempt to escalate the privileges of the MyLambdaFunctionExecutionRole by adding an action (s3:CreateBucket) that is outside of the permissions boundary attached to the role and then attempting to execute that action when MyLambdaFunction is invoked.

  1. Update the builder-application stack by using the following command:
    aws cloudformation update-stack \
    --stack-name builder-application \
    --template-url https://awsiammedia.s3.amazonaws.com/public/sample/993-grant-IAM-permissions-for-builders+/builder-application-3.yml \
    --capabilities CAPABILITY_NAMED_IAM

  2. After a few minutes, confirm the stack was successfully updated by using the following command and verifying StackStatus is UPDATE_COMPLETE:
    aws cloudformation describe-stacks \
    --stack-name builder-application | jq '.Stacks[].StackStatus'

  3. Start an execution of the state machine and verify the result by using the following commands. Run them one at a time to allow the execution to finish.
    state_machine_arn=$(aws cloudformation describe-stack-resources --stack-name builder-application | jq '.StackResources[] | select (.LogicalResourceId=="MyStateMachine") | .PhysicalResourceId' | tr -d '"')
    
    execution_arn=$(aws stepfunctions start-execution --state-machine-arn $state_machine_arn | jq '.executionArn' | tr -d '"')
    
    aws stepfunctions describe-execution --execution-arn $execution_arn | jq '.status'

    The status should be FAILED. Remember – the effective permissions for any application roles will be the intersection of the attached permissions policies and the permissions boundary. Thus, this execution failed because even though you were able to modify the inline policy of the Lambda function to add s3:CreateBucket, since that action is not allowed in the application-boundary policy attached to the Lambda as a permissions boundary, the request to create an S3 bucket was denied.

  4. Get the name of the latest log stream by using the following commands:
    lambda_function_name=$(aws cloudformation describe-stack-resources --stack-name builder-application | jq '.StackResources[] | select (.LogicalResourceId=="MyLambdaFunction") | .PhysicalResourceId' | tr -d '"')
    
    aws logs describe-log-streams \
    --log-group-name /aws/lambda/$lambda_function_name \
    --order-by LastEventTime \
    --descending | jq -r '.logStreams[0].logStreamName'

  5. To verify the actual error was due to a lack of permissions, get the event message by using the following command, replacing <value> with the value of the log stream copied in the step above. If using a bash terminal, you will need to escape any dollar signs in <value> with a backslash character:
    aws logs get-log-events \
    --log-group-name /aws/lambda/$lambda_function_name \
    --log-stream-name <value> | jq '.events[] | select (.message | contains("[ERROR]"))'

    The error should read [ERROR] ClientError: An error occurred (AccessDenied) when calling the CreateBucket operation: Access Denied, which confirms that the permissions boundary prevented you from escalating your privileges as a builder via an application role.

You have now verified that you can safely allow builders to create IAM policies and roles!

Clean up

After you have finished testing, clean up the resources created in this example. Because the builder role does not have permissions to delete builder policies and roles, you will need to assume a different role that can manage IAM resources to complete step 3 below. If you create a new terminal session, make sure the AWS_ACCOUNT environment variable is set.

To clean up

  1. Delete the builder-application stack by using the following command:
    aws cloudformation delete-stack --stack-name builder-application

  2. Delete the sneaky-policy by using the following command:
    aws iam delete-policy \
    --policy-arn arn:aws:iam::$AWS_ACCOUNT:policy/application_policies/sneaky-policy

  3. Delete the builder-iam stack by using the following command:
    aws cloudformation delete-stack --stack-name builder-iam

Service control policies

Permissions boundaries are applied to individual IAM users or roles within an account. If your organization has multiple accounts, you must create and maintain these boundaries in each account for each individual user or role. But what if you’d like to apply a subset of these rules or others across some or all of your accounts? In this case, you could use service control policies (SCPs), which are a feature of AWS Organizations, to provide central control over the maximum available permissions for multiple accounts in your organization. By organizing accounts into organizational units (OUs), which are groups of accounts that serve an application or service, you can apply service control policies (SCPs) to create targeted governance boundaries for your OUs. To learn more about creating SCPs, see Get more out of service control policies in a multi-account environment in the AWS Security Blog.

Additional tools

Creating and managing tightly scoped policies and roles is an ongoing process that requires a lot of thought and attention to detail. AWS IAM enables fine-grained access control to AWS services, and permissions boundaries are an advanced feature. There is no substitute for actual testing like you performed in the “Test that a builder can’t escalate their privileges” section above, however you can also use the IAM Policy Simulator as a tool to test policies and determine whether or not specific actions are allowed for a given user, group, or role. Additional tools you can use to create, audit, and update IAM policies include:

  • Access Advisor – to review when services and actions were last accessed.
  • Access Analyzer – to help identify resources in your organization and accounts that are shared with an external identity, validate IAM policies against policy grammar and best practices, and generate IAM policies based on access activity in your AWS CloudTrail logs.
  • AWS Cloud Development Kit (CDK) – has built-in convenience methods to help you follow best practices, including the ability to generate least-privilege policies for cloud applications with a single line of code.
  • Open Source tools like cfn-nag and cdk-nag – to inspect CloudFormation templates and CDK applications for patterns that may indicate insecure infrastructure, for example IAM policies that are too permissive.

Conclusion

In this post, you learned how to put policies and guardrails in place that will allow your organization to grant IAM permissions to builders. These changes will enable your builders to develop and deploy cloud infrastructure and applications more rapidly, and will help strengthen your organization’s security culture by extending the responsibility to a broader group. To learn more about creating, testing, and refining IAM policies and permissions boundaries, see Creating IAM policies, Testing IAM policies, and Refining permissions using access information in the IAM User Guide, and IAM policy types: How and when to use them in the AWS Security Blog.

Amazon EC2 DL1 instances Deep Dive

Post Syndicated from Sheila Busser original https://aws.amazon.com/blogs/compute/amazon-ec2-dl1-instances-deep-dive/

This post is written by Amr Ragab, Principal Solutions Architect, Amazon EC2.

AWS is excited to announce that the new Amazon Elastic Compute Cloud (Amazon EC2) DL1 instances are now generally available in US-East (N. Virginia) and US-West (Oregon). DL1 provides up to 40% better price performance for training deep learning models as compared to current generation GPU-based EC2 instances. The dl1.24xlarge instance type features eight Intel-Habana Gaudi accelerators, which are custom-built to train deep learning models. Each Gaudi accelerator has 32 GB of high bandwidth memory (HBM2) and a peer-to-peer bidirectional bandwidth of 100 Gbps RoCE, for a total bidirectional interconnect bandwidth of 700 Gbps per card. Further instance specifications are as follows:

Instance Size vCPU Instance Memory (GiB) Gaudi Accelerators Network Bandwidth (Gbps) Total Accelerator Interconnect (Gbs) Local Instance Storage EBS Bandwidth (Gbps)
d1.24xlarge 96 768 8 4×100 Gbps 700 4x1TB NVMe 19

Instance Architecture

System architecture of the amazon ec2 dl1 instances.

As the preceding instance architecture indicates, pairs of Gaudi accelerators (e.g., Gaudi0 and Gaudi1) are attached directly through a PCIe Gen3x16 link. Additionally, peer-to-peer networking via 100 Gbps RoCEv2 links – with seven active links per card – provides a torus configuration with a total of 700 Gbps of interconnect bandwidth per card. This topology is a separate interconnect outside of the two NUMA domains. Furthermore, the instance supports four EFA ENIs and 4x1TB of local NVMe SSD storage. We will provide a peer-direct driver over EFA, which will let you utilize high throughput, low latency peer-direct networking between accelerators across multiple instances to efficiently scale multi-node distributed training workloads.

Quick Start

Quickly get started with DL1 and SynapseAI SDK through with the following options:

1) Habana Deep Learning AMIs provided by AWS.

2) AWS Marketplace AMIs provided by Habana.

3) Using Packer to build a custom Amazon Machine Images (AMI) provided by this GitHub repo. This repo also provides build scripts to create Amazon Elastic Container Service (Amazon ECS) and Amazon Elastic Kubernetes Service (Amazon EKS) AMIs.

After selecting an AMI, launch a dl1.24xlarge instance in either us-east-1 or us-west-2. To help identify in which availability zone(s) dl1.24xlarge is available, run the following command:

aws ec2 describe-instance-type-offerings \
--location-type availability-zone \
--filters Name=instance-type,Values=dl1.24xlarge \
--region us-west-2 \
--output table

Once launched, you can connect to the instance over SSH (with the correct security group attached).

Habana Collectives Communication Library (HCL/HCCL)

As part of the Habana SynapseAI SDK, Habana Gaudi’s use the HCCL library for handling the collectives between HPUs. Get more information on HCCL here. On DL1 through the HCL-tests, we can confirm close to 700 Gbps (689 Gbps) per card for the collectives tested as follows.

You can confirm these tests by cloning the github repo here.

Habana DL1 HCCL tests.

Amazon EKS Quick Start

Support for DL1 on Amazon EKS is available today with Amazon EKS versions > 1.19. The following is a quick start to get up and running quickly with DL1.

The following dependencies will be needed:

eksctl – You need version 0.70.0+ of eksctl.
kubectl – You use Kubernetes version 1.20 in this post.

Create EKS cluster:

eksctl create cluster --region us-east-1 --without-nodegroup \
--vpc-public-subnets subnet-037d8e430963c2d3e,subnet-0abe898359a7d43e9

Nodegroup configuration – save the following codeblock to a file called dl1-managed-ng.yaml. Replace the AMI ID in the code block with the AMI created earlier.

apiVersion: eksctl.io/v1alpha5
kind: ClusterConfig

metadata:
  name: fabulous-rainbow-1635807811
  region: us-west-2

vpc:
  id: vpc-34f1894c
  subnets:
    public:
      endpoint-one:
        id: subnet-4532e73d
      endpoint-two:
        id: subnet-8f8b7dc5

managedNodeGroups:
  - name: dl1-ng-1d
    instanceType: dl1.24xlarge
    volumeSize: 200
    instancePrefix: dl1-ng-1d-worker
    ami: ami-072c632cbbc2255b3
    iam:
      withAddonPolicies:
        imageBuilder: true
        autoScaler: true
        ebs: true
        fsx: true
        cloudWatch: true
    ssh:
      allow: true
      publicKeyName: amrragab-aws
    subnets:
    - endpoint-one
    minSize: 1
    desiredCapacity: 1
    maxSize: 4
    overrideBootstrapCommand: |
      #!/bin/bash
      /etc/eks/bootstrap.sh fabulous-rainbow-1635807811

Create the managed nodegroup with the following command:

eksctl create nodegroup -f dl1-managed-ng.yaml

Once the nodegroup has been completed, you must apply the habana-k8s-device-plugin

kubectl create -f https://vault.habana.ai/artifactory/docker-k8s-device-plugin/habana-k8s-device-plugin.yaml

Once completed, you should see the Gaudi devices as an allocatable resource in your EKS
cluster, presenting 8 Gaudi accelerators per DL1 node in the cluster.

Allocatable:

attachable-volumes-aws-ebs: 39
cpu:                        95690m
ephemeral-storage:          192188443124
habana.ai/gaudi:            8
hugepages-1Gi:              0
hugepages-2Mi:              30000Mi
memory:                     753055132Ki
pods:                       15

Example Distributed Machine Learning (ML) Workloads

The following tables are examples of Mixed Precision/FP32 training results comparing DL1 to the common GPU instances used for ML training.

Model: ResNet50
Framework: TensorFlow 2
Dataset: Imagenet2012
GitHub: https://github.com/HabanaAI/Model-
References/tree/master/TensorFlow/computer_vision/Resnets/resnet_keras

Instance Type Batch Size
Mixed Precision Training Throughput (images/sec)
8x Gaudi – 32 GB (dl1.24xlarge) 256 13036
8x A100 – 40 GB (p4d.24xlarge) 256 17921
8x V100 – 32 GB (p3dn.24xlarge) 256 9685
8x V100 – 16GB (p3.16xlarge) 256 8945

Model: Bert Large – Pretraining
Framework: Pytorch 1.9
Dataset: Wikipedia/BooksCorpus
GitHub: https://github.com/HabanaAI/Model-References/tree/master/PyTorch/nlp/bert

Instance Type Batch Size
@128 Sequence
Length
Mixed Precision Training Throughput (seq/sec)
8x Gaudi – 32 GB (dl1.24xlarge) 256 1318
8x A100 – 40 GB (p4d.24xlarge) 8192 2979
8x V100 – 32 GB (p3dn.24xlarge) 8192 1458
8x V100 – 16GB (p3.16xlarge) 8192 1013

You can find a more comprehensive list of ML models supported with performance data here. Support for containers with TensorFlow and Pytorch are also available. Furthermore, you can stay up-to-date with the operator support for TensorFlow and Pytorch.

CONCLUSION

We are excited to innovate on behalf of our customers and provide a diverse choice in ML accelerators with DL1 instances. The DL1 instances powered by Gaudi accelerators can provide up to 40% better price performance for training deep learning models as compared to current generation GPU-based EC2 instances. DL1 instances use the Habana SynapseAI SDK with framework support in Pytorch and TensorFlow. Additional future support for EFA with peer direct HPUs across nodes will also be supported. Now it’s time to go power up your ML workloads with Amazon EC2 DL1 instances.

How to unit test and deploy AWS Glue jobs using AWS CodePipeline

Post Syndicated from Praveen Kumar Jeyarajan original https://aws.amazon.com/blogs/devops/how-to-unit-test-and-deploy-aws-glue-jobs-using-aws-codepipeline/

This post is intended to assist users in understanding and replicating a method to unit test Python-based ETL Glue Jobs, using the PyTest Framework in AWS CodePipeline. In the current practice, several options exist for unit testing Python scripts for Glue jobs in a local environment. Although a local development environment may be set up to build and unit test Python-based Glue jobs, by following the documentation, replicating the same procedure in a DevOps pipeline is difficult and time consuming.

Unit test scripts are one of the initial quality gates used by developers to provide a high-quality build. One must reuse these scripts during regression testing to make sure that all of the existing functionality is intact, and that new releases don’t disrupt key application functionality. The majority of the regression test suites are expected to be integrated with the DevOps Pipeline for its execution. Unit testing an application code is a fundamental task that evaluates  whether each (unit) code written by a programmer functions as expected. Unit testing of code provides a mechanism to determine that software quality hasn’t been compromised. One of the difficulties in building Python-based Glue ETL tasks is their ability for unit testing to be incorporated within DevOps Pipeline, especially when there are modernization of mainframe ETL process to modern tech stacks in AWS

AWS Glue is a serverless data integration service that makes it easy to discover, prepare, and combine data for analytics, machine learning (ML), and application development. AWS Glue provides all of the capabilities needed for data integration. This means that you can start analyzing your data and putting it to use in minutes rather than months. AWS Glue provides both visual and code-based interfaces to make data integration easier.

Prerequisites

GitHub Repository

Amazon ECR Image URI for Glue Library

Solution overview

A typical enterprise-scale DevOps pipeline is illustrated in the following diagram. This solution describes how to incorporate the unit testing of Python-based AWS Glue ETL processes into the AWS DevOps Pipeline.

Figure 1 Solution Overview

The GitHub repository aws-glue-jobs-unit-testing has a sample Python-based Glue job in the src folder. Its associated unit test cases built using the Pytest Framework are accessible in the tests folder. An AWS CloudFormation template written in YAML is included in the deploy folder. As a runtime environment, AWS CodeBuild utilizes custom container images. This feature is used to build a project utilizing Glue libraries from Public ECR repository, that can run the code package to demonstrate unit testing integration.

Solution walkthrough

Time to read  7 min
Time to complete  15-20 min
Learning level  300
Services used
AWS CodePipeline, AWS CodeCommit, AWS CodeBuild, Amazon Elastic Container Registry (Amazon ECR) Public Repositories, AWS CloudFormation

The container image at the Public ECR repository for AWS Glue libraries includes all of the binaries required to run PySpark-based AWS Glue ETL tasks locally, as well as unit test them. The public container repository has three image tags, one for each AWS Glue version supported by AWS Glue. To demonstrate the solution, we use the image tag glue_libs_3.0.0_image_01 in this post. To utilize this container image as a runtime image in CodeBuild, copy the Image URI corresponding to the image tag that you intend to use, as shown in the following image.

Figure 2 Select Glue Library from Public ECR

The aws-glue-jobs-unit-testing GitHub repository contains a CloudFormation template, pipeline.yml, which deploys a CodePipeline with CodeBuild projects to create, test, and publish the AWS Glue job. As illustrated in the following, use the copied image URL from Amazon ECR public to create and test a CodeBuild project.

  TestBuild:
    Type: AWS::CodeBuild::Project
    Properties:
      Artifacts:
        Type: CODEPIPELINE
      BadgeEnabled: false
      Environment:
        ComputeType: BUILD_GENERAL1_LARGE
        Image: "public.ecr.aws/glue/aws-glue-libs:glue_libs_3.0.0_image_01"
        ImagePullCredentialsType: CODEBUILD
        PrivilegedMode: false
        Type: LINUX_CONTAINER
      Name: !Sub "${RepositoryName}-${BranchName}-build"
      ServiceRole: !GetAtt CodeBuildRole.Arn  

The pipeline performs the following operations:

  1. It uses the CodeCommit repository as the source and transfers the most recent code from the main branch to the CodeBuild project for further processing.
  2. The following stage is build and test, in which the most recent code from the previous phase is unit tested and the test report is published to CodeBuild report groups.
  3. If all of the test results are good, then the next CodeBuild project is launched to publish the code to an Amazon Simple Storage Service (Amazon S3) bucket.
  4. Following the successful completion of the publish phase, the final step is to deploy the AWS Glue task using the CloudFormation template in the deploy folder.

Deploying the solution

Set up

Now we’ll deploy the solution using a CloudFormation template.

  • Using the GitHub Web, download the code.zip file from the aws-glue-jobs-unit-testing repository. This zip file contains the GitHub repository’s src, tests, and deploy folders. You may also create the zip file yourself using command-line tools, such as git and zip. To create the zip file on Linux or Mac, open the terminal and enter the following commands.
git clone https://github.com/aws-samples/aws-glue-jobs-unit-testing.git
cd aws-glue-jobs-unit-testing
git checkout master
zip -r code.zip src/ tests/ deploy/
  • Sign in to the AWS Management Console and choose the AWS Region of your choice.
  • Create an Amazon S3 bucket. For more information, see How Do I Create an S3 Bucket? in the AWS documentation.
  • Upload the downloaded zip package, code.zip, to the Amazon S3 bucket that you created.

In this example, I created an Amazon S3 bucket named aws-glue-artifacts-us-east-1 in the N. Virginia (us-east-1) Region, and used the console to upload the zip package from the GitHub repository to the Amazon S3 bucket.

Figure 3 Upload code.zip file to S3 bucket

Creating the stack

  1.  In the CloudFormation console, choose Create stack.
  2. On the Specify template page, choose Upload a template file, and then choose the pipeline.yml template, downloaded from the GitHub repository

Figure 4 Upload pipeline.yml template to create a new CloudFormation stack

  1. Specify the following parameters:.
  • Stack name: glue-unit-testing-pipeline (Choose a stack name of your choice)
  • ApplicationStackName: glue-codepipeline-app (This is the name of the CloudFormation stack that will be created by the pipeline)
  • BranchName: master (This is the name of the branch to be created in the CodeCommit repository to check-in the code from the Amazon S3 bucket zip file)
  • BucketName: aws-glue-artifacts-us-east-1 (This is the name of the Amazon S3 bucket that contains the zip file. This bucket will also be used by the pipeline for storing code artifacts)
  • CodeZipFile: lambda.zip (This is the key name of the sample code Amazon S3 object. The object should be a zip file)
  • RepositoryName: aws-glue-unit-testing (This is the name of the CodeCommit repository that will be created by the stack)
  • TestReportGroupName: glue-unittest-report (This is the name of the CodeBuild test report group that will be created to store the unit test reports)

Figure 5 Fill parameters for stack creation

  1. Choose Next, and again Next.
  1. On the Review page, under Capabilities, choose the following options:
  • I acknowledge that CloudFormation might create IAM resources with custom names.

Figure 6 Acknowledge IAM roles creation

  1. Choose Create stack to begin the stack creation process. Once the stack creation is complete, the resources that were created are displayed on the Resources tab. The stack creation takes approximately 5-7 minutes.

Figure 7 Successful completion of stack creation

The stack automatically creates a CodeCommit repository with the initial code checked-in from the zip file uploaded to the Amazon S3 bucket. Furthermore, it creates a CodePipeline view using the CodeCommit repository as the source. In the above example, the CodeCommit repository is aws-glue-unit-test, and the pipeline is aws-glue-unit-test-pipeline.

Testing the solution

To test the deployed pipeline, open the CodePipeline console and select the pipeline created by the CloudFormation stack. Select the Release Change button on the pipeline page.

Figure 8 Choose Release Change on pipeline page

The pipeline begins its execution with the most recent code in the CodeCommit repository.

When the Test_and_Build phase is finished, select the Details link to examine the execution logs.

Figure 9 Successfully completed the Test_and_Build stage

Select the Reports tab, and choose the test report from Report history to view the unit execution results.

Figure 10 Test report from pipeline execution

Finally, after the deployment stage is complete, you can see, run, and monitor the deployed AWS Glue job on the AWS Glue console page. For more information, refer to the Running and monitoring AWS Glue documentation

Figure 11 Successful pipeline execution

Cleanup

To avoid additional infrastructure costs, make sure that you delete the stack after experimenting with the examples provided in the post. On the CloudFormation console, select the stack that you created, and then choose Delete. This will delete all of the resources that it created, including CodeCommit repositories, IAM roles/policies, and CodeBuild projects.

Summary

In this post, we demonstrated how to unit test and deploy Python-based AWS Glue jobs in a pipeline with unit tests written with the PyTest framework. The approach is not limited to CodePipeline, and it can be used to build up a local development environment, as demonstrated in the Big Data blog. The aws-glue-jobs-unit-testing GitHub repository contains the example’s CloudFormation template, as well as sample AWS Glue Python code and Pytest code used in this post. If you have any questions or comments regarding this example, please open an issue or submit a pull request.

Authors:

Praveen Kumar Jeyarajan

Praveen Kumar Jeyarajan is a PraveenKumar is a Senior DevOps Consultant in AWS supporting Enterprise customers and their journey to the cloud. He has 11+ years of DevOps experience and is skilled in solving myriad technical challenges using the latest technologies. He holds a Masters degree in Software Engineering. Outside of work, he enjoys watching movies and playing tennis.

Vaidyanathan Ganesa Sankaran

Vaidyanathan Ganesa Sankaran is a Sr Modernization Architect at AWS supporting Global Enterprise customers on their journey towards modernization. He is specialized in Artificial intelligence, legacy Modernization and Cloud Computing. He holds a Masters degree in Software Engineering and has 12+ years of Modernization experience. Outside work, he loves conducting training sessions for college grads and professional starter who wants to learn cloud and AI. His hobbies are playing tennis, philately and traveling.

Access Apache Livy using a Network Load Balancer on a Kerberos-enabled Amazon EMR cluster

Post Syndicated from Bharat Gamini original https://aws.amazon.com/blogs/big-data/access-apache-livy-using-a-network-load-balancer-on-a-kerberos-enabled-amazon-emr-cluster/

Amazon EMR is a cloud big data platform for running large-scale distributed data processing jobs, interactive SQL queries, and machine learning (ML) applications using open-source analytics frameworks such as Apache Spark, Apache Hive, and Presto. Amazon EMR supports Kerberos for authentication; you can enable Kerberos on Amazon EMR and put the cluster in a private subnet to maximize security.

To access the cluster, the best practice is to use a Network Load Balancer (NLB) to expose only specific ports, which are access-controlled via security groups. By default, the NLB prevents Kerberos ticket authentication to any Amazon EMR service.

Apache Livy is a service that enables easy interaction with a Spark cluster over a REST interface. It enables easy submission of Spark jobs or snippets of Spark code, synchronous or asynchronous result retrieval, as well as SparkContext management, all via a simple REST interface or an RPC client library.

In this post, we discuss how to provide Kerberos ticket access to Livy for external systems like Airflow and Notebooks using an NLB. You can apply this process to other Amazon EMR services beyond Livy, such as Trino and Hive.

Solution overview

The following are the high-level steps required:

  1. Create an EMR cluster with Kerberos security configuration.
  2. Create an NLB with required listeners and target groups.
  3. Update the Kerberos Key Distribution Center (KDC) to create a new service principal and keytab changes.
  4. Update the Livy configuration file.
  5. Verify Livy is accessible via the NLB.
  6. Run the Python Livy test case.

Prerequisites

The advanced configuration presented in this post assumes familiarity with Amazon EMR, Kerberos, Livy, Python and bash.

Create an EMR cluster

Create the Kerberos security configuration using the AWS Command Line Interface (AWS CLI) as follows (this creates the KDC on the EMR primary node):

aws emr create-security-configuration --name kdc-security-config --security-configuration '{
   "EncryptionConfiguration":{
      "InTransitEncryptionConfiguration":{
         "TLSCertificateConfiguration":{
            "CertificateProviderType":"PEM",
            "S3Object":"s3://${conf_bucket}/${certs.zip}"
         }
      },
      "AtRestEncryptionConfiguration":{
         "S3EncryptionConfiguration":{
            "EncryptionMode":"SSE-S3"
         }
      },
      "EnableInTransitEncryption":true,
      "EnableAtRestEncryption":true
   },
   "AuthenticationConfiguration":{
      "KerberosConfiguration":{
         "Provider":"ClusterDedicatedKdc",
         "ClusterDedicatedKdcConfiguration":{
            "TicketLifetimeInHours":24
         }
      }
   }
}'

It’s a security best practice to keep passwords in AWS Secrets Manager. You can use a bash function like the following as the argument to the --kerberos-attributes option so no passwords are stored in the launch script or command line. The function outputs the required JSON for the --kerberos-attributes option after retrieving the password from Secrets Manager.

krbattrs() { # Pull the KDC password from Secrets Manager without saving to disk or var
cat << EOF
  {
    "Realm": "EC2.INTERNAL",
    "KdcAdminPassword": "$(aws secretsmanager get-secret-value \
        --secret-id KDCpasswd  |jq -r .SecretString)"
  }
EOF
}

Create the cluster using the AWS CLI as follows:

aws emr create-cluster \
  --name "<your-cluster-name>" \
  --release-label emr-6.4.0 \
  --log-uri "s3://<your-log-bucket>" \
  --applications Name=Hive Name=Spark \
  --ec2-attributes "KeyName=<your-key-name>,SubnetId=<your-private-subnet>" \
  --instance-groups InstanceGroupType=MASTER,InstanceCount=1,InstanceType=m3.xlarge InstanceGroupType=CORE,InstanceCount=1,InstanceType=m3.xlarge \
  --security-configuration <kdc-security-config> \
  --kerberos-attributes $(krbattrs) \
  --use-default-roles

Create an NLB

Create an internet-facing NLB with TCP listeners in your VPC and subnet. An Internet-facing load balancer routes requests from clients to targets over the internet.  Conversely, an Internal NLB routes requests to targets using private IP addresses. For instructions, refer to Create a Network Load Balancer.

The following screenshot shows the listener details.

Create target groups and register the EMR primary instance (Livy3) and KDC instance (KDC3). For this post, these instances are the same; use the respective instances if KDC is running on a different instance.

The KDC and EMR security groups must allow the NLB’s private IP address to access ports 88 and 8998, respectively. You can find the NLB’s private IP address by searching the elastic network interfaces for the NLB’s name. For access control instructions, refer to this article on the knowledge center. Now that the security groups allow access, the NLB health check should pass, but Livy isn’t usable via the NLB until you make further changes (detailed in the following sections). The NLB is actually being used as a proxy to access Livy rather than doing any load balancing.

Update the Kerberos KDC

The KDC used by the Livy service must contain a new HTTP Service Principal Name (SPN) using the public NLB host name.

  • You can create the new principle from the EMR primary host using the full NLB public host name:
sudo kadmin.local addprinc HTTP/[email protected]

Replace the fully qualified domain name (FQDN) and Kerberos realm as needed. Ensure the NLB hostname is all lowercase.

After the new SPN exists, you create two keytabs containing that SPN. The first keytab is for the Livy service. The second keytab, which must use the same KVNO number as the first keytab, is for the Livy client.

  • Create Livy service keytab as follows:
sudo kadmin.local ktadd -norandkey -k /etc/livy2.keytab livy/[email protected]
sudo kadmin.local ktadd -norandkey -k /etc/livy2.keytab HTTP/[email protected]
sudo chown livy:livy /etc/livy2.keytab
sudo chmod 600 /etc/livy2.keytab
sudo -u livy klist -e -kt /etc/livy2.keytab

Note the key version number (KVNO) for the HTTP principal in the output of the preceding klist command. The KVNO numbers for the HTTP principal must match the KVNO numbers in the user keytab. Copy the livy2.keytab file to the EMR cluster Livy host if it’s not already there.

  • Create a user or client keytab as follows:
sudo kadmin.local ktadd -norandkey -k /var/tmp/user1.keytab [email protected]
sudo kadmin.local ktadd -norandkey -k /var/tmp/user1.keytab HTTP/[email protected]

Note the -norandkey option used when adding the SPN. That preserves the KVNO created in the preceding livy2.keytab.

  • Copy the user1.keytab to the client machine running the Python test case as user1.

Replace the FQDN, realm, and keytab path as needed.

Update the Livy configuration file

The primary change on the EMR cluster primary node running the Livy service is to the /etc/livy/conf/livy.conf file. You change the authentication principal that Livy uses, as well as the associated Kerberos keytab created earlier.

  • Make the following changes to the livy.conf file with sudo:
livy.server.auth.kerberos.principal = HTTP/[email protected]
livy.server.auth.kerberos.keytab = /etc/livy2.keytab

Don’t change the livy.server.launch.kerberos.* values.

  • Restart and verify the Livy service:
sudo systemctl restart livy-server
sudo systemctl status livy-server
  • Verify the Livy port is listening:
sudo lsof -Pi :8998

COMMAND PID USER FD TYPE DEVICE SIZE/OFF NODE NAME
java 30106 livy 196u IPv6 224853844 0t0 TCP *:8998 (LISTEN)

You can automate these steps (modifying the KDC and Livy config file) by adding a step to the EMR cluster. For more information, refer to Tutorial: Configure a cluster-dedicated KDC.

Verify Livy is accessible via the NLB

You can now use user1.keytab to authenticate against the Livy REST endpoint. Copy the user1.keytab you created earlier to the host and user login, which run the Livy test case. The host running the test case must be configured to connect to the modified KDC.

  • Create a Linux user (user1) on client host and EMR cluster.

If the client host has a terminal available that the user can run commands in, you can use the following commands to verify network connectivity to Livy before running the actual Livy Python test case.

  • Verify the NLB host and port are reachable (no data will be returned by the nc command):
$ nc -vz mynlb-a0ac4b07f9f7f0a1.elb.us-west-2.amazonaws.com 8998
Ncat: Version 7.50 ( https://nmap.org/ncat )
Ncat: Connected to 44.242.1.1:8998.
Ncat: 0 bytes sent, 0 bytes received in 0.02 seconds.
  • Create a TLS connection, which returns the server’s TLS certificate and TCP packets:
openssl s_client -connect mynlb-a0ac4b07f9f7f0a1.elb.us-west-2.amazonaws.com:8998

If the openssl command doesn’t return a TLS server certificate, the rest of the verification doesn’t succeed. You may have a proxy or firewall interfering with the connection. Investigate your network environment, resolve the issue, and repeat the openssl command to ensure connectivity.

  • Verify the Livy REST endpoint using curl. This verifies Livy REST but not Spark.
kinit -kt user1.keytab [email protected]
curl -k -u : --negotiate https://mynlb-a0ac4b07f9f7f0a1.elb.us-west-2.amazonaws.com:8998/sessions
{"from":0,"total":0,"sessions":[]}

curl arguments:
  "-k"   - Ignore secure connection check
  "-u :" - Use user name and passwords from environment
  "--negotiate" – Enables negotiate(SPNEGO) authentication

Run the Python Livy test case

The Livy test case is a simple Python3 script named livy-verify.py. You can run this script from a client machine to run Spark commands via Livy using the NLB. The script is as follows:

#!/usr/bin/env python3
# pylint: disable=invalid-name,no-member

"""
Verify Livy (REST) service using pylivy module, install req modules or use PEX:
  sudo yum install python3-devel
  sudo python3 -m pip install livy==0.8.0 requests==2.27.1 requests_gssapi==1.2.3
  https://pypi.org/project/requests-gssapi/

Kerberos authN implicitly uses TGT from kinit in users login env
"""

import shutil
import requests
from requests_gssapi import HTTPSPNEGOAuth
from livy import LivySession

# Disable ssl-warnings for self-signed certs when testing
requests.packages.urllib3.disable_warnings()

# Set the base URI(use FQDN and TLS) to target a Livy service
# Redefine remote_host to specify the remote Livy hostname to connect to
remote_host="mynlb-a0ac4b07f9f7f0a1.elb.us-west-2.amazonaws.com"
livy_uri = "https://" + remote_host + ":8998"

def livy_session():
    ''' Connect to Livy (REST) and run trivial pyspark command '''
    sconf = {"spark.master": "yarn", "spark.submit.deployMode": "cluster"}

    if shutil.which('kinit'):
        kauth = HTTPSPNEGOAuth()
        # Over-ride with an explicit user principal
        #kauth = HTTPSPNEGOAuth(principal="[email protected]")
        print("kinit found, kauth using Krb cache")
    else:
        kauth = None
        print("kinit NOT found, kauth set to None")

    with LivySession.create(livy_uri, verify=False, auth=kauth, spark_conf=sconf) as ls:
        ls.run("rdd = sc.parallelize(range(100), 2)")
        ls.run("rdd.take(3)")

    return 'LivySession complete'

def main():
    """ Starting point """
    livy_session()

if __name__ == '__main__':
    main()

The test case requires the new SPN to be in the user’s Kerberos ticket cache. To get the service principal into the Kerberos cache, use the kinit command with the -S option:

kinit -kt user1.keytab -S HTTP/[email protected] [email protected]

Note the SPN and the User Principal Name (UPN) are both used in the kinit command.

The Kerberos cache should look like the following code, as revealed by the klist command:

klist
Ticket cache: FILE:/tmp/krb5cc_1001
Default principal: [email protected]

Valid starting Expires Service principal
01/20/2022 01:38:06 01/20/2022 11:38:06 HTTP/[email protected]
renew until 01/21/2022 01:38:06

Note the HTTP service principal in the klist ticket cache output.

After the SPN is in the cache as verified by klist, you can run the following command to verify that Livy accepts the Kerberos ticket and runs the simple PySpark script. It generates a simple array, [0,1,2], as the output. The preceding Python script has been copied to the /var/tmp/user1/ folder in this example.

/var/tmp/user1/livy-verify.py
kinit found, kauth using TGT
[0, 1, 2]

It can take a minute or so to generate the result. Any authentication errors will happen in seconds. If the test in the new environment generates the preceding array, the Livy Kerberos configuration has been verified.

Any other client program that needs to have Livy access must be a Kerberos client of the KDC that generated the keytabs. It must also have a client keytab (such as user1.keytab or equivalent) and the service principal key in its Kerberos ticket cache.

In some environments, a simple kinit as follows may be sufficient:

kdestroy
kinit -kt user1.keytab [email protected]

Summary

If you have an existing EMR cluster running Livy and using Kerberos (even in a private subnet), you can add an NLB to connect to the Livy service and still authenticate with Kerberos. For simplicity, we used a cluster-dedicated KDC in this post, but you can use any KDC architecture option supported by Amazon EMR. This post documented all the KDC and Livy changes to make it work; the script and procedure have been run successfully in multiple environments. You can modify the Python script as needed and try running the verification script in your environment.

For more details about the systems and processes described in this post, refer to the following:


About the Authors

John Benninghoff is a AWS Professional Services Sr. Data Architect, focused on Data Lake architecture and implementation.

Bharat Gamini is a Data Architect focused on Big Data & Analytics at Amazon Web Services. He helps customers architect and build highly scalable, robust and secure cloud-based analytical solutions on AWS. Besides family time, he likes watching movies and sports.

Smithy Server and Client Generator for TypeScript (Developer Preview)

Post Syndicated from Adam Thomas original https://aws.amazon.com/blogs/devops/smithy-server-and-client-generator-for-typescript/

We’re excited to announce the Developer Preview of Smithy’s server and client generators for TypeScript. This enables developers to write concise, type-safe code in the same model-first manner that AWS has used to develop its services. Smithy is AWS’s open-source Interface Definition Language (IDL) for web services. AWS uses Smithy and its internal predecessor to model services, generate server scaffolding, and generate rich clients in multiple languages, such as the AWS SDKs.

If you’re unfamiliar with Smithy, check out the Smithy website and watch an introductory talk from Michael Dowling, Smithy’s Principal Engineer.

This post will demonstrate how you can write a simple Smithy model, write a service that implements the model, deploy it to AWS Lambda, and call it using a generated client.

What can the server generator do for me?

Using Smithy and its server generator unlocks model-first development. Model-first development puts your customers first. This forces you to define your interface first rather than let your API to become implicitly defined by your implementation choices.

Smithy’s server generator for TypeScript enables development at a higher level of abstraction. By making serialization, deserialization, and routing an implementation detail in generated code, service developers can focus on writing code against modeled types, rather than against raw HTTP requests. Your business logic and unit tests will be cleaner and more readable, and the way that your messages are represented on the wire is defined explicitly by a protocol, not implicitly by your JSON parser.

The server generator also lets you leverage TypeScript’s type safety. Not only is the business logic of your service written against strongly typed interfaces, but also you can reference your service’s types in your AWS Cloud Development Kit (AWS CDK) definition. This makes sure that your stack will fail at build time rather than deployment time if it’s out of sync with your model.

Finally, using Smithy for service generation lets you ship clients in Smithy’s growing portfolio of generated clients. We’re unveiling a developer preview of the client generator for TypeScript today as well, and we’ll continue to unveil more implementations in the future.

The architecture of a Smithy service

A Smithy service looks much like any other web service running on Lambda behind Amazon API Gateway. The difference lies in the code itself. Where a standard service might use a generic deserializer to parse an incoming request and bind it to an object, a Smithy service relies on code generation for deserialization, serialization, validation, and the object model itself. These functions are generated into a standalone library known as a Smithy server SDK. Using a server SDK with one of AWS’s prepackaged request converters, service developers can focus on their business logic, rather than the undifferentiated heavy lifting of parsing and generating HTTP requests and responses.

A data flow diagram for a Smithy service

Walkthrough

This post will walk you through the process of building and using a Smithy service, from modeling to deployment.

By the end, you should be able to:

  • Model a simple REST service in Smithy
  • Generate a Smithy server SDK for TypeScript
  • Implement a service in Lambda using the generated server SDK
  • Deploy the service to AWS using the AWS CDK
  • Generate a client SDK, and use it to call the deployed service

The complete example described in this post can be found here.

Prerequisites

For this walkthrough, you should have the following prerequisites:

Checking out the sample repository

Create a new repository from the template repository here.

To clone the application in your browser

  1. Open https://github.com/aws-samples/smithy-server-generator-typescript-sample in your browser
  2. Select “Use this template” in the top right-hand corner
  3. Fill out the form, and select “Create repository from template”
  4. Clone your new repository from GitHub by following the instructions in the “Code” dropdown

Exploring and setting up the sample application

The sample application is split into three separate submodules:

  • model – contains the Smithy model that defines the service
  • Server – contains the code generation setup, application logic, and CDK stack for the service
  • typescript-client – contains the code generation setup for a rich client generated in TypeScript

To bootstrap the sample application and run the initial build

  1. Open a terminal and navigate to the root of the sample application
  2. Run the following command:
    ./gradlew build && yarn install
  3. Wait until the build finishes successfully

Modeling a service using Smithy

In an IDE of your choice, open the file at model/src/main/smithy/main.smithy. This file defines the interface for the sample web service, a service that can echo strings back to the caller, as well as provide the string length.

The service definition forms the root of a Smithy model. It defines the operations that are available to clients, as well as common errors that are thrown by all of the operations in a service.


@sigv4(name: "execute-api")
@restJson1
service StringWizard {
    version: "2018-05-10",
    operations: [Echo, Length],
    errors: [ValidationException],
}

This service uses the @sigv4 trait to indicate that calls must be signed with AWS Signature V4. In the sample application, API Gateway’s Identity and Access Management (IAM) Authentication support provides this functionality.

@restJson1 indicates the protocol supported by this service. RestJson1 is Smithy’s built-in protocol for RESTful web services that use JSON for requests and responses.

This service advertises two operations: Echo and Length. Furthermore, it indicates that every operation on the service must be expected to throw ValidationException, if an invalid input is supplied.

Next, let’s look at the definition of the Length operation and its input type.

/// An operation that computes the length of a string
/// provided on the URI path
@readonly
@http(code: 200, method: "GET", uri: "/length/{string}",)
operation Length {
     input: LengthInput,
     output: LengthOutput,
     errors: [PalindromeException],
}

@input
structure LengthInput {
     @required
     @httpLabel
     string: String,
}

This operation uses the @http trait to model how requests are processed with restJson1, including the method (GET) and how the URI is formed (using a label to bind the string field from LengthInput to a path segment). HTTP binding with Smithy can be explored in depth at Smithy’s documentation page.

Note that this operation can also throw a PalindromeException, which we’ll explore in more detail when we check out the business logic.

Updating the Smithy model to add additional constraints to the input

Smithy constraint traits are used to enable additional validation for input types. Server SDKs automatically perform validation based on the Smithy constraints in the model. Let’s add a new constraint to the input for the Length operation. Moreover, let’s make sure that only alphanumeric characters can be passed in by the caller.

  1. Open model/src/main/smithy/main.smithy in an editor
  2. Add a @pattern constraint to the string member of Length input. It should look like this:
    structure LengthInput {
        @required
        @httpLabel
        @pattern(“^[a-zA-Z0-9]$”)
        string: String,
    }
  3. Open a terminal, and navigate to the root of the sample application
  4. Run the following command:
    yarn build
  5. Wait for the build to finish successfully

Using the Smithy Server Generator for TypeScript

The key component of a Smithy web service is its code generator, which translates the Smithy model into actual code. You’ve already run the code generator – it runs every time that you build the sample application.

The codegen directory inside of the server submodule is where the Smithy Server Generator for TypeScript is configured and run. The server generator uses Smithy Build to build, and it’s configured by smithy-build.json.

{
  "version" : "1.0",
  "outputDirectory" : "build/output",
  "projections" : {
      "ts-server" : {
         "plugins": {
           "typescript-ssdk-codegen" : {
              "package" : "@smithy-demo/string-wizard-service-ssdk",
              "packageVersion": "0.0.1"
           }
        }
      },
      "apigateway" : {
        "plugins" : {
          "openapi": {
             "service": "software.amazon.smithy.demo#StringWizard",
             "protocol": "aws.protocols#restJson1",
             "apiGatewayType" : "REST"
           }
         }
      }
   }
}

This smithy-build configures two projections. The ts-server projection generates the server SDK by invoking the typescript-ssdk-codegen plugin. The package and packageVersion arguments are used to generate an npm package that you can add as a dependency in your server code.

The OpenAPI projection configures Smithy’s OpenAPI converter to generate a file that can be imported into API Gateway to host this service. It uses Smithy’s ability to extend models via the imports keyword to extend the base model with an additional API Gateway configuration. The generated OpenAPI specification is used by the CDK stack, which we’ll explore later.

If you open package.json in the server submodule, then you’ll notice this line in the dependencies section:

"@smithy-demo/string-wizard-service-ssdk": "workspace:server/codegen/build/smithyprojections/server-codegen/ts-server/typescript-ssdk-codegen"

The key, @smithy-demo/string-wizard-service-ssdk, matches the package key in the smithy-build.json file. The value uses Yarn’s workspaces feature to set up a local dependency on the generated server SDK. This lets you use the server SDK as a standalone npm dependency without publishing it to a repository. Since we bundle the server application into a zip file before uploading it to Lambda, you can treat the server SDK as an implementation detail that isn’t published externally.

We won’t get into the details here, but you can see the specifics of how the code generator is invoked by looking at the regenerate:ssdk script in the server’s package.json, as well as the build.gradle file in the server’s codegen directory.

Implementing an operation using a server SDK

The server generator takes care of the undifferentiated heavy lifting of writing a Smithy service. However, there are still two tasks left for the service developer: writing the Lambda entrypoint, and implementing the operation’s business logic.

First, let’s look at the entrypoint for the Length operation. Open server/src/length_handler.ts in an editor. You should see the following content:

import { getLengthHandler } from "@smithy-demo/string-wizard-service-ssdk";
import { APIGatewayProxyHandler } from "aws-lambda";
import { LengthOperation } from "./length";
import { getApiGatewayHandler } from "./apigateway";
// This is the entry point for the Lambda Function that services the LengthOperation
export const lambdaHandler: APIGatewayProxyHandler = getApiGatewayHandler(getLengthHandler(LengthOperation));

If you’ve written a Lambda entry-point before, then exporting a function of type APIGatewayProxyHandler will be familiar to you. However, there are a few new pieces here. First, we have a function from the server SDK, called getLengthHandler, that takes a Smithy Operation type and returns a ServiceHandler. Operation is the interface that the server SDK uses to encapsulate business logic. The core task of implementing a Smithy service is to implement Operations. ServiceHandler is the interface that encapsulates the generated logic of a server SDK. It’s the black box that handles serialization, deserialization, error handling, validation, and routing.

The getApiGatewayHandler function simply invokes the request and response conversion logic, and then builds a custom context for the operation. We won’t go into their details here.

Next, let’s explore the operation implementation. Open server/src/length.ts in an editor. You should see the following content:

import { Operation } from "@aws-smithy/server-common";
import {
  LengthServerInput,
  LengthServerOutput,
  PalindromeException,
} from "@smithy-demo/string-wizard-service-ssdk";
import { HandlerContext } from "./apigateway";
import { reverse } from "./util";

// This is the implementation of business logic of the LengthOperation
export const LengthOperation: Operation<LengthServerInput, LengthServerOutput, HandlerContext> = async (
  input,
  context
) => {
  console.log(`Received Length operation from: ${context.user}`);

  if (input.string != undefined && input.string === reverse(input.string)) {
     throw new PalindromeException({ message: "Cannot handle palindrome" });
  }

  return {
     length: input.string?.length,
  };
};

Let’s look at this implementation piece-by-piece. First, the function type Operation<LengthServerInput, LengthServerOutput, HandlerContext> provides the type-safe interface for our business logic. LengthServerInput and LengthServerOutput are the code generated types that correspond to the input and output types for the Length operation in our Smithy model. If we use the wrong type arguments for the Operation, then it will fail type checks against the getLengthHandler function in the entry-point. If we try to access the incorrect properties on the input, then we’ll also see type checker failures. This is one of the core tenets of the Smithy Server Generator for TypeScript: writing a web service should be as strongly typed as writing anything else.

Next, let’s look at the section that validates that the input isn’t a palindrome:

if (input.string != undefined && input.string === reverse(input.string)) {
    throw new PalindromeException({ message: "Cannot handle palindrome" });
}

Although the server SDK can validate the input against Smithy’s constraint traits, there is no constraint trait for rejecting palindromes. Therefore, we must include this validation in our business logic. Our Smithy model includes a PalindromeException definition that includes a message member. This is generated as a standard subclass of Error with a constructor that takes in a message that your operation implementation can throw like any other error. This will be caught and properly rendered as a response by the server SDK.

Finally, there’s the return statement. Since the Smithy model defines LengthOutput as a structure containing an integer member called length, we return an object that has the same structural type here.

Note that this business logic doesn’t have to consider serialization, or the wire format of the request or response, let alone anything else related to HTTP or API Gateway. The unit tests in src/length/length.spec.ts reflect this. They’re the same standard unit tests as you would write against any other TypeScript class. The server SDK lets you write your business logic at a higher level of abstraction, thus simplifying your unit testing and letting your developers focus on their business logic rather than the messy details.

Deploying the sample application

The sample application utilizes the AWS CDK to deploy itself to your AWS account. Explore the CDK definition in server/lib/cdk-stack.ts. An in-depth exploration of the stack is out of the scope for this post, but it looks largely like any other AWS application that deploys TypeScript code to Lambda behind API Gateway.

The key difference is that the cdk stack can rely on a generated OpenAPI definition for the API Gateway resource. This makes sure that your deployed application always matches your Smithy model. Furthermore, it can use the server SDK’s generated types to make sure that every modeled operation has an implementation deployed to Lambda. This means that forgetting to wire up the implementation for a new operation becomes a compile-time failure, rather than a runtime one.

To deploy the sample application from the command line

    1. Open a terminal and navigate to the server directory of your sample application.
    2. Run the following command:
      yarn cdk deploy
    3. The cdk will display a list of security-sensitive resources that will be deployed to your account. These consist mostly of AWS Identity and Access Management (IAM) roles used by your Lambda functions for execution. Enter y to continue deploying the application to your account.
    4. When it has completed, the CDK will print your new application’s endpoint and the CloudFormation stack containing your application to the console. It will look something like the following:
      Outputs:
          StringWizardService.StringWizardApiEndpoint59072E9B
          = https://RANDOMSTRING.execute-api.us-west-2.amazonaws.com/prod/
      	
      Stack ARN:
          arn:aws:cloudformation:us-west-2:YOURACCOUNTID:stack/StringWizardService/SOME-UUID
    5. Log on to your AWS account in the AWS Management Console.
    6. Navigate to the Lambda console. You should see two new functions: one that starts with StringWizardService-EchoFunction, and one that starts with StringWizardService-EchoFunction. These are the implementations of your Smithy service’s operations.
    7. Navigate to the Amazon API Gateway console. You should see a new REST API named StringWizardAPI, with Resources POST /echo and GET /length/{string}, corresponding to your Smithy model.

    Calling the sample application with a generated client

    The last piece of the Smithy puzzle is the strongly-typed generated client generated by the Smithy Client Generator for TypeScript. It’s located in the typescript-client folder, which has a codegen folder that uses SmithyBuild to generate a client in much the same manner as the server.

    The sample application ships with a simple wrapper script for the length operation that uses the generated client to build a rudimentary CLI. Open the typescript-client/bin/length.ts file in your editor. The contents will look like the following:

    #!/usr/bin/env node
    
    import {LengthCommand, StringWizardClient} from "@smithy-demo/string-client";
    
    const client = new StringWizardClient({endpoint: process.argv[2]});
    
    client.send(new LengthCommand({
         string: process.argv[3]
    })).catch((err) => {
         console.log("Failed with error: " + err);
    process.exit(1);
    }).then((res) => {
         process.stderr.write(res.length?.toString() ?? "0");
    });

    If you’ve used the AWS SDK for JavaScript v3, this will look familiar. This is because it’s generated using the Smithy Client Generator for TypeScript!

    From the code, you can see that the CLI takes two positional arguments: the endpoint for the deployed application, and an input string. Let’s give it a spin.

    To call the deployed application using the generated client

    1. Open a terminal and navigate to the typescript-client directory.
    2. Run the following command to build the client:
      yarn build
    3. Using the endpoint output by the CDK in the Deploying the sample application section above, run the following command:
      yarn run str-length https://RANDOMSTRING.execute-api.us-west-2.amazonaws.com/prod/ foo 
    4. You should see an output of 3, the length of foo.
    5. Next, trigger anerror by calling your endpoint with a palindrome by running the following command:
      yarn run str-length https://RANDOMSTRING.execute-api.us-west-2.amazonaws.com/prod/ kayak
    6. You should see the following output:
      Failed with error: PalindromeException: Cannot handle palindrome

    Cleaning up

    To avoid incurring future charges, delete the resources.

    To delete the sample application using the CDK

    1. Open a terminal and navigate to the server directory.
    2. Run the following command:
      yarn cdk destroy StringWizardService
    3. Answer y to the prompt Are you sure you want to delete: StringWizardService (y/n)?
    4. Wait for the CDK to complete the deletion of your CloudFormation stack. You should see the following when it has completed:
      ✅ StringWizardService: destroyed

    Conclusion

    You have now used a Smithy model to define a service, explored how a generated server SDK can simplify your web service development, deployed the service to the AWS Cloud using the AWS CDK, and called the service using a strongly-typed generated client.

    If you aren’t familiar with Smithy, but you want to learn more, then don’t forget to check out the documentation or the introductory video.

    To learn more about the Smithy Server Generator for TypeScript, check out its documentation.

    If you have feature requests, bug reports, feedback of any kind, or would like to contribute, head over to the GitHub repository.

    Adam Thomas

    Adam Thomas is a Senior Software Development engineer on the Smithy team. He has been a web service developer at Amazon for over ten years. Outside of work, Adam is a passionate advocate for staying inside, playing video games, and reading fiction.

Chaos experiments on Amazon RDS using AWS Fault Injection Simulator

Post Syndicated from Anup Sivadas original https://aws.amazon.com/blogs/devops/chaos-experiments-on-amazon-rds-using-aws-fault-injection-simulator/

Performing controlled chaos experiments on your Amazon Relational Database Service (RDS) database instances and validating the application behavior is essential to making sure that your application stack is resilient. How does the application behave when there is a database failover? Will the connection pooling solution or tools being used gracefully connect after a database failover is successful? Will there be a cascading failure if the database node gets rebooted for a few seconds? These are some of the fundamental questions that you should consider when evaluating the resiliency of your database stack. Chaos engineering is a way to effectively answer these questions.

Traditionally, database failure conditions, such as a failover or a node reboot, are often triggered using a script or 3rd party tools. However, at scale, these external dependencies often become a bottleneck and are hard to maintain and manage. Scripts and 3rd party tools can fail when called, whereas a web service is highly available. The scripts and 3rd party tools also tend to require elevated permissions to work, which is a management overhead and insecure from a least privilege access model perspective. This is where AWS Fault Injection Simulator (FIS) comes to the rescue.

AWS Fault Injection Simulator (AWS FIS) is a fully managed service for running fault injection experiments on AWS that makes it easier to improve an application’s performance, observability, and resiliency. Fault injection experiments are used in chaos engineering, which is the practice of stressing an application in testing or production environments by creating disruptive events, such as a sudden increase in CPU or memory consumption, database failover and observing how the system responds, and implementing improvements.

We can define the key phases of chaos engineering as identifying the steady state of the workload, defining a hypothesis, running the experiment, verifying the experiment results and making necessary improvements based on the experiment results. These phases will confirm that you are injecting failures in a controlled environment through well-planned experiments in order to build confidence in the workloads and tools we are using to withstand turbulent conditions.

This diagram explains the phases of chaos engineering. We start with identifying the steady state, defining a hypothesis, run the experiment, verify the experiment results and improve. This is a cycle.

Example—

  • Baseline: we have a managed database with a replica and automatic failover enabled.
  • Hypothesis: failure of a single database instance / replica may slow down a few requests but will not adversely affect our application.
  • Run experiment: trigger a DB failover.
  • Verify: confirm/dis-confirm the hypothesis by looking at KPIs for the application (e.g., via CloudWatch metric/alarm).

Methodology and Walkthrough

Let’s look at how you can configure AWS FIS to perform failure conditions for your RDS database instances. For this walkthrough, we’ll look at injecting a cluster failover for Amazon Aurora PostgreSQL. You can leverage an existing Aurora PostgreSQL cluster or you can launch a new cluster by following the steps in the Create an Aurora PostgreSQL DB Cluster documentation.

Step 1: Select the Aurora Cluster.

The Aurora PostgreSQL instance that we’ll use for this walkthrough is provisioned in us-east-1 (N. Virginia), and it’s a cluster with two instances. There is one writer instance and another reader instance (Aurora replica). The cluster is named chaostest, the writer instance is named chaostest-instance-1, and the reader is named chaostest-intance-1-us-east-1a.

Under RDS Databases Section, the cluster named chaostest is selected. Under the cluster there are two instances which is available. Chaostest-instance-1 is the writer instance and chaostest-instance-1-us-east-1a is the reader instance.

The goal is to simulate a failover for this Aurora PostgreSQL cluster so that the existing chaostest-intance-1-us-east-1a reader instance will switch roles and then be promoted as the writer, and the existing chaostest-instance-1 will become the reader.

Step 2: Navigate to the AWS FIS console.

We will now navigate to the AWS FIS console to create an experiment template. Select Create experiment template.

Under FIS console, Create experiment template needs to be selected.

Step 3: Complete the AWS FIS template pre-requisites.

Enter a Description, Name, and select the AWS IAM Role for the experiment template.

Under create experiment template section, Simulate Database Failover is entered for the Description field. DBFailover is entered for the Name field(Optional). FISWorkshopServiceRole is selected for the IAM role drop down field.

The IAM role selected above was pre-created. To use AWS FIS, you must create an IAM role that grants AWS FIS the permissions required so that the service can run experiments on your behalf. The role follows the least privileged model and includes permissions to act on your database clusters like trigger a failover. AWS FIS only uses the permissions that have been delegated explicitly for the role. To learn more about how to create an IAM role with the required permissions for AWS FIS, refer to the FIS documentation.

Step 4: Navigate to the Actions, Target, Stop Condition section of the template.

The next key section of AWS FIS is Action, Target, and Stop Condition.

Action, Target and Stop Conditions section is highlighted in the image.

Action—An action is an activity that AWS FIS performs on an AWS resource during an experiment. AWS FIS provides a set of pre-configured actions based on the AWS resource type. Each Action runs for a specified duration during an experiment, or until you stop the experiment. An action can run sequentially or in parallel.

For our experiment, the Action will be aws:rds:failover-db-cluster.

Target—A target is one or more AWS resources on which AWS FIS performs an action during an experiment. You can choose specific resources or select a group of resources based on specific criteria, such as tags or state.

For our experiment, the target will be the chaostest Aurora PostgreSQL cluster.

Stop Condition—AWS FIS provides the controls and guardrails that you need to run experiments safely on your AWS workloads. A stop condition is a mechanism to stop an experiment if it reaches a threshold that you define as an Amazon CloudWatch alarm. If a stop condition is triggered while the experiment is running, then AWS FIS stops the experiment.

For our experiment, we won’t be defining a stop condition. This is because this simple experiment contains only one action. Stop conditions are especially useful for experiments with a series of actions, to prevent them from continuing if something goes wrong.

Step 5: Configure Action.

Now, let’s configure the Action and Target for our experiment template. Under the Actions section, we will select Add action to get the New action window.

The action section displays Name,Description, Action Type and Start After fields. There is a Add action button that needs to be selected.

Enter a Name, a Description, and select Action type aws:rds:failover-db-cluster. Start after is an optional setting. This setting allows you to specify an action that should precede the one we are currently configuring.

Under Actions section, DBFailover is entered for the Name field. DB Failover Action is entered for the Description field. aws:rds:failover-db-cluster is entered for the Action Type field. Start after field is left blank and Clusters-Target-1 is selected for the Target field. The save button will save the info entered for the respective fields.

Step 6: Configure Target.

Note that a Target has been automatically created with the name Clusters-Target-1. Select Save to save the action.

Next, you will edit the Clusters-Target-1 target to select the target, i.e., the Aurora PostgreSQL cluster.

Under Targets section, the edit button for Clusters-Target-1 is highlighted.

Select Target method as Resource IDs, and select the chaostest cluster.  If you are interested to select a group of resources, then select Resource tags, filters and parameters option.

Under Edit Target section, Clusters-Target-1 is selected for the Name field. aws:rds:cluster is selected for the Resource type field. Action is set as DBFailover. Resource IDs is selected for the Target Method field. Chaostest cluster is selected for the Resource IDs drop down box. Save button is also available in this section to save the configuration.

Step 7: Create the experiment template to complete this stage.

We will wrap up the process by selecting the create experiment template.

Create experiment template option is highlighted. The user will click this button to proceed creating a template.

We will get a warning stating that a stop condition isn’t defined. We’ll enter create in the provided field to create the template.

After selecting the create experiment template option in the previous screen, the user is prompted to enter "create" in the field to proceed.

We will get a success message if the entries are correct and the template will be successfully created.

"You successfully created experiment template" success message is displayed in the screen and its highlighted in green color.

Step 8: Verify the Aurora Cluster.

Before we run the experiment, let’s double-check the chaostest Aurora Cluster to confirm which instance is the writer and which is the reader.

Under the RDS section, chaos cluster is listed. The user is confirming that chaostest-instance-1 is the writer and chaostest-instance-1-us-east-1a is the reader.

We confirmed that chaostest-instance-1 is the writer and chaostest-instance-1-us-east-1a is the reader.

Step 9: Run the AWS FIS experiment.

Now we’ll run the FIS experiment. Select Actions, and then select Start for the experiment template.

Under the experiment template section, the Simulate Database Failover template is selection. Under the actions section, option Start is selected to start the experiment. The other options under Actions section includes Update, Manage tags and Delete.

Select Start experiment and you’ll get another warning to confirm if you really want to start this experiment. Confirm by entering start say Start experiment.

Under the Start Experiement section, user is promoted to enter "start" in the field to start the experiement.

Step 10: Observe the various stages of the experiment.

The experiment will be in initiating, running and will eventually be in completed states.

The experiment is in initiating state.

The experiment is in Complete state.

Step 11: Verify the Aurora Cluster to confirm failover.

Now let’s look at the chaostest Aurora PostgreSQL cluster to check the state. Note that a failover was indeed triggered by FIS and chaostest-instance-1-us-east-1a is the newly promoted writer and chaostest-instance-1 is the reader now.

Under RDS Section, Chaostest cluster is shown. This time, the writer is chaostest-instance-1-us-east-1a.

Step 12: Verify the Aurora Cluster logs.

We can also confirm the failover action by looking at the Logs and events section of the Aurora Cluster.

Under the Recent Events section of the chaos-test cluster, the failover messages is displayed. One of the messages lists "Started cross AZ failover to DB instance:chaostest-instance-1-us-east-1a. This confirms that the experiment was successful.

Clean up

If you created a new Aurora PostgreSQL cluster for this walkthrough, then you can terminate the cluster to optimize the costs by following the steps in the Deleting an Aurora DB cluster documentation.

You can also delete the AWS FIS experiment template by following the steps in the Delete an experiment template documentation.

You can refer to the AWS FIS documentation to learn more about the service. If you want to know more about chaos engineering, check out the AWS re:Invent session Testing resiliency using chaos engineering and The Chaos Engineering Collection. Finally, check out the following GitHub repo for additional example experiments, and how you can work with AWS FIS using the AWS Cloud Development Kit (AWS CDK).

Conclusion

In this walkthrough, you learned how you can leverage AWS FIS to inject failures into your RDS Instances. To get started with AWS Fault Injection Service for Amazon RDS, refer to the service documentation.

Author:

Anup Sivadas

Anup Sivadas is a Principal Solutions Architect at Amazon Web Services and is based out of Arlington, Virginia. With 18 + years in technology, Anup enjoys working with AWS customers and helps them craft highly scalable, performing, resilient, secure, sustainable and cost-effective cloud architectures. Outside work, Anup’s passion is to travel and explore the nature with his family.

Extend your pre-commit hooks with AWS CloudFormation Guard

Post Syndicated from Joaquin Manuel Rinaudo original https://aws.amazon.com/blogs/security/extend-your-pre-commit-hooks-with-aws-cloudformation-guard/

Git hooks are scripts that extend Git functionality when certain events and actions occur during code development. Developer teams often use Git hooks to perform quality checks before they commit their code changes. For example, see the blog post Use Git pre-commit hooks to avoid AWS CloudFormation errors for a description of how the AWS Integration and Automation team uses various pre-commit hooks to help reduce effort and errors when they build AWS Quick Starts.

This blog post shows you how to extend your Git hooks to validate your AWS CloudFormation templates against policy-as-code rules by using AWS CloudFormation Guard. This can help you verify that your code follows organizational best practices for security, compliance, and more by preventing you from commit changes that fail validation rules.

We will also provide patterns you can use to centrally maintain a list of rules that security teams can use to roll out new security best practices across an organization. You will learn how to configure a pre-commit framework by using an example repository while you store Guard rules in both a central Amazon Simple Storage Service (Amazon S3) bucket or in versioned code repositories (such as AWS CodeCommit, GitHub, Bitbucket, or GitLab).

Prerequisites

To complete the steps in this blog post, first perform the following installations.

  1. Install AWS Command Line Interface (AWS CLI).
  2. Install the Git CLI.
  3. Install the pre-commit framework by running the following command.
    pip install pre-commit
  4. Install the Rust programming language by following these instructions.
  5. (Windows only) Install the version of Microsoft Visual C++ Build Tools 2019 that provides just the Visual C++ build tools. 

Solution walkthrough

In this section, we walk you through an exercise to extend a Java service on an Amazon EKS example repository with Git hooks by using AWS CloudFormation Guard. You can choose to upload your Guard rules in either a separate GitHub repository or your own S3 bucket.

First, download the sample repository that you will add the pre-commit framework to.

To clone the test repository

  • Clone the repo to a local directory by running the following command in your local terminal.

    git clone https://github.com/aws-samples/amazon-eks-example-for-stateful-java-service.git

Next, create Guard rules that reflect the organization’s policy-as-code best practices and store them in an S3 bucket.

To set up an S3 bucket with your Guard rules

  1. Create an S3 bucket by running the following command in the AWS CLI.

    aws s3 mb s3://<account-id>-cfn-guard-rules --region <aws-region>

    where <account-id> is the ID of the AWS account you’re using and <aws-region> is the AWS Region you want to use.

  2. (Optional) Alternatively, you can follow the Getting started with Amazon S3 tutorial to create the bucket and upload the object (as described in step 4 that follows) by using the AWS Management Console.

    When you store your Guard rules in an S3 bucket, you can make the rules accessible to other member accounts in your organization by using the aws:PrincipalOrgID condition and setting the value to your organization ID in the bucket policy.

  3. Create a file that contains a Guard rule named rules.guard, with the following content.
    let eks_cluster = Resources.* [ Type == 'AWS::EKS::Cluster' ]
    rule eks_public_disallowed when %eks_cluster !empty {
          %eks_cluster.Properties.ResourcesVpcConfig.EndpointPublicAccess == false
    }

    This rule will verify that public endpoints are disabled by checking that resources that are created by using the AWS::EKS::Cluster resource type have the EndpointPublicAccess property set to false. For more information about authoring your own rules using Guard domain-specific language (DSL), see Introducing AWS CloudFormation Guard 2.0.

  4. Upload the rule set to your S3 bucket by running the following command in the AWS CLI.

    aws s3 cp rules.guard s3://<account-id>-cfn-guard-rules/rules/rules.guard

In the next step, you will set up the pre-commit framework in the repository to run CloudFormation Guard against code changes.

To configure your pre-commit hook to use Guard

  1. Run the following command to create a new branch where you will test your changes.
    git checkout -b feature/guard-hook
  2. Navigate to the root directory of the project that you cloned earlier and create a .pre-commit-config.yaml file with the following configuration.
    repos:
      - repo: local
        hooks:
          -   id: cfn-guard-rules
              name: Rules for AWS
              description: Download Organization rules
              entry: aws s3 cp --recursive s3://<account-id>-cfn-guard-rules/rules  guard-rules/org-rules/
              language: system
              pass_filenames: false
          -   id: cfn-guard
              name: AWS CloudFormation Guard
              description: Validate code against your Guard rules
              entry: bash -c 'for template in "$@"; do cfn-guard validate -r guard-rules -d "$template" || SCAN_RESULT="FAILED"; done; if [[ "$SCAN_RESULT" = "FAILED" ]]; then exit 1; fi'
              language: rust
              files: \.(json|yaml|yml|template\.json|template)$
              additional_dependencies:
                - cli:cfn-guard

    You will need to replace the <account-id> placeholder value with the AWS account ID you entered in the To set up an S3 bucket with your Guard rules procedure.

    This hook configuration uses local pre-commit hooks to download the latest version of Guard rules from the bucket you created previously. This allows you to set up a centralized set of Guard rules across your organization.

    Alternatively, you can create and use a code repository such as GitHub, AWS CodeCommit, or Bitbucket to keep your rules in version control. To do so, replace the command in the Download Organization rules step of the .pre-commit-config.yaml file with:

    bash -c ‘if [ -d guard-rules/org-rules ]; then cd guard-rules/org-rules && git pull; else git clone <guard-rules-repository-target> guard-rules/org-rules; fi’

    Where <guard-rules-repository-target> is the HTTPS or SSH URL of your repository. This command will clone or pull the latest rules from your Git repo by using your Git credentials.

    The hook will also install Guard as an additional dependency by using a Rust hook. Using Guard, it will run the code changes in the repository directory against the downloaded rule set. When misconfigurations are detected, the hook stops the commit.

    You can further extend your organization rules with your own Guard rules by adding them to the cfn-guard-rules folder. You should commit these rules in your repository and add cfn-guard-rules/org-rules/* to your .gitignore file.

  3. Run a pre-commit install command to install the hooks you just created.

Finally, test that the pre-commit’s Guard hook fails commits of code changes that do not follow organizational best practices.

To test pre-commit hooks

  1. Add EndpointPublicAccess: true in cloudformation/eks.template.yaml, as shown following. This describes the test-only intent (meaning that you want to detect and flag errors in your rule) of adding public access to the Amazon Elastic Kubernetes Service (Amazon EKS) cluster.
      EKSCluster:
        Type: AWS::EKS::Cluster
        Properties:
          Name: java-app-demo-cluster
          ResourcesVpcConfig:
            EndpointPublicAccess: true
            SecurityGroupIds:
              - !Ref EKSControlPlaneSecurityGroup

  2. Add your changes with the git add command.

    git add .pre-commit-config.yaml

    git add cloudformation/eks.template.yaml

  3. Commit changes with the following command.

    git commit -m “bad config”

    You should see the following error that disallows the commit to the local repository and shows which one of your Guard rules failed.

    amazon-eks-controlplane.template.yaml Status = FAIL
    		
    FAILED rules
    		
    rules.guard/eks_public_disallowed    FAIL
    		
    ---
    		
    Evaluation of rules rules.guard against data amazon-eks-controlplane.template.yaml
    		
    ---
    		
    Property
    [/Resources/EKS/Properties/ResourcesVpcConfig/EndpointPublicAccess] in data
    [eks.template.yaml] is not compliant with [rules.guard/eks_public_disallowed] 
    because provided value [true] did not match expected value [false]. 
    Error Message []

  4. (Optional) You can also test hooks before committing by using the pre-commit run command to see similar output.

Cleanup

To avoid incurring ongoing charges, follow these cleanup steps to delete the resources and files you created as you followed along with this blog post.

To clean up resources and files

  1. Remove your local repository.
    rm -rf /path/to/repository
  2. Delete the S3 bucket you created by running the following command.
    aws s3 rb s3://<account-id>-cfn-guard-rules --force
  3. (Optional) Remove the pre-commit hooks framework by running this command.
    pip uninstall pre-commit

Conclusion

In this post, you learned how to use AWS CloudFormation Guard with the pre-commit framework locally to validate your infrastructure-as-code solutions before you push remote changes to your repositories.

You also learned how to extend the solution to use a centralized list of security rules that is stored in versioned code repositories (GitHub, Bitbucket, or GitLab) or an S3 bucket. And you learned how to further extend the solution with your own rules. You can find examples of rules to use in Guard’s Github repository or refer to write preventative compliance rules for AWS CloudFormation templates the cfn-guard way. You can then further configure other repositories to prevent misconfigurations by using the same Guard rules.

 
If you have feedback about this post, submit comments in the Comments section below. If you have questions about this post, start a new thread on the KMS re:Post or contact AWS Support.

Want more AWS Security news? Follow us on Twitter.
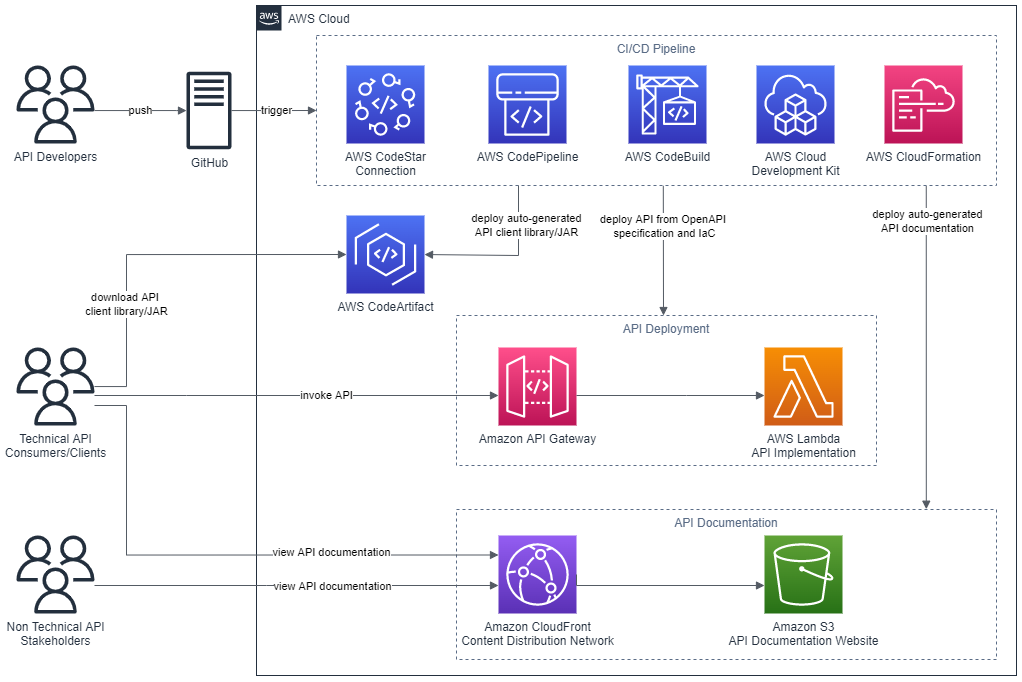
Author

Joaquin Manuel Rinaudo

Joaquin is a Senior Security Architect with AWS Professional Services. He is passionate about building solutions that help developers improve their software quality. Prior to AWS, he worked across multiple domains in the security industry, from mobile security to cloud and compliance related topics. In his free time, Joaquin enjoys spending time with family and reading science-fiction novels.

Deploy .NET Blazor WebAssembly Application to AWS Amplify

Post Syndicated from Adilson Perinei original https://aws.amazon.com/blogs/devops/deploy-net-blazor-webassembly-application-to-aws-amplify/

Blazor can run your client-side C# code directly in the browser, using WebAssembly. It is a .NET running on WebAssembly, and you can reuse code and libraries from the server-side parts of your application.

Overview of solution

In this post, you will deploy a Blazor WebAssembly Application from git repository to AWS Amplify. We will use .NET 6. to create a Blazor WebAssembly on local machine using AWS Command Line Interface (AWS CLI), use GitHub as a git repository, and deploy the application to Amplify.

Follow this post on: Windows 10, Windows 11/Ubuntu 20.04 LTS/macOS 10.15 “Catalina”, macOS 11.0 “Big Sur”, or macOS 12.0 “Monterey”.

User pushes Blazor WebAssembly code and amplify.yml to Github. This action will trigger the amplify pipeline that will use amplify.yml to build and deploy the application.

Walkthrough

We will walk through the following steps:

  • Create Blazor WebAssembly application on our local machine using AWS CLI
  • Test /run the application locally
  • Create a new repository on Github
  • Create a local repository
  • Setup Amplify
  • Test /run the application on AWS

Prerequisites

For this walkthrough, you should have the following prerequisites:

Let’s start creating a Blazor WebAssembly application on our local machine using CLI:

    1. Open the command line interface
    2. Create a directory for your application running the following command:

mkdir BlazorWebApp

    1. Change to the application directory running the following command:

cd BlazorWebApp

    1.  Create the Blazor WebAssembly Application running the following command:

dotnet new blazorwasm

    1. Run the application:

dotnet run

    1. Copy the URL after “Now listening on:”, and paste it on your browser.
      Example: http://localhost:5152 (port might be different in your CLI)

Sample app

    1. After testing your application, go back to the terminal and press <ctrl> + c to stop the application.
    2. Create a gitignore for your project running the following command:

dotnet new gitignore

    1. Create a file called “amplify.yml” in the root directory of your application. The name must be exactly “amplify.yml”. This file contains the commands to build your application used by AWS CodeBuild.
    2. Copy and paste the following code to the file amplify.yml.

version: 1
frontend:
phases:
preBuild:
commands:
- curl -sSL https://dot.net/v1/dotnet-install.sh > dotnet-install.sh
- chmod +x *.sh
- ./dotnet-install.sh -c 6.0 -InstallDir ./dotnet6
- ./dotnet6/dotnet --version
build:
commands:
- ./dotnet6/dotnet publish -c Release -o release
artifacts:
baseDirectory: /release/wwwroot
files:
- '**/*'
cache:
paths: []

Create a new repository on Github:

      1. Log in to the Github website and create a new repository:

Create Github repo

      1. Type a name for your repository, choose private, and add a read.me file as shown in the following screenshot:

Create repo

Create a local repository for your application:

      1. On the root folder of your application enter the following commands. Make sure that you have configured git CLI with email and user

git add --all
git commit -m “first commit”
git branch -M main
git remote add origin https://github.com/perinei/blazorToAmplify.git
(replace red text with your repo)
for ssh authentication use:
git remote add origin [email protected]: perinei/blazorToAmplify.git
git push -u origin main

Setup Amplify:

      1. Log in to the AWS account
      2. Go to AWS Amplify Service
      3. On the left panel, choose All apps
      4. Select New app as per the following screen
      5. Select Host Web App from the dropdown list

      1. Choose Github

      1. Select Continue. If you are still logged in on your Github account, then the page will automatically authenticate you, otherwise select the Authenticate Button
      2. Choose your repository: in my case, perinei/bazortoamplify
      3. Branch: main
      4. Select next

      1. Give your app a name
      2. amplify.yml will be automatically detected and will be used to build the application on AWS

      1. Select Next to review the configuration
      2. Select Save and Deploy
      3. Amplify will provision, build, deploy, and verify the application

      1. When the process is complete, select the URL of your application and test the application.

      1. Congratulations! Your Blazor WebAssembly is running on Amplify.

Cleaning up

To avoid incurring future charges, delete the resources. On Amplify, choose your app name on the left panel, select action, and then delete app.

Conclusion

Congratulations, you deployed your first Blazor Webassembly Application to AWS Amplify.

In this blog post you learned how to easily build a full CI/CD pipeline for a Blazor WebAssembly using the AWS amplify. It was only necessary to specify the repository and the commands build the application on the file amplify.yml that should be include on the root folder of repository. You can also easily add a custom domain to your application. Visit Set up custom domains on AWS Amplify Hosting

AWS can help you to migrate .NET applications to the Cloud. Visit .NET on AWS.

The .NET on AWS YouTube playlist is the place to get the latest .NET on AWS videos, including AWS re:Invent sessions.

To learn more about how to amplify.yml to build your application, visit Configuring build settings – AWS Amplify.

Adilson Perinei

Adilson Perinei is an AWS Consultant with six AWS certifications and loves to develop serverless applications using AWS infrastructure..

How to protect HMACs inside AWS KMS

Post Syndicated from Jeremy Stieglitz original https://aws.amazon.com/blogs/security/how-to-protect-hmacs-inside-aws-kms/

Today AWS Key Management Service (AWS KMS) is introducing new APIs to generate and verify hash-based message authentication codes (HMACs) using the Federal Information Processing Standard (FIPS) 140-2 validated hardware security modules (HSMs) in AWS KMS. HMACs are a powerful cryptographic building block that incorporate secret key material in a hash function to create a unique, keyed message authentication code.

In this post, you will learn the basics of the HMAC algorithm as a cryptographic building block, including how HMACs are used. In the second part of this post, you will see a few real-world use cases that show an application builder’s perspective on using the AWS KMS HMAC APIs.

HMACs provide a fast way to tokenize or sign data such as web API requests, credit cards, bank routing information, or personally identifiable information (PII).They are commonly used in several internet standards and communication protocols such as JSON Web Tokens (JWT), and are even an important security component for how you sign AWS API requests.

HMAC as a cryptographic building block

You can consider an HMAC, sometimes referred to as a keyed hash, to be a combination function that fuses the following elements:

  • A standard hash function such as SHA-256 to produce a message authentication code (MAC).
  • A secret key that binds this MAC to that key’s unique value.

Combining these two elements creates a unique, authenticated version of the digest of a message. Because the HMAC construction allows interchangeable hash functions as well as different secret key sizes, one of the benefits of HMACs is the easy replaceability of the underlying hash function (in case faster or more secure hash functions are required), as well as the ability to add more security by lengthening the size of the secret key used in the HMAC over time. The AWS KMS HMAC API is launching with support for SHA-224, SHA-256, SHA-384, and SHA-512 algorithms to provide a good balance of key sizes and performance trade-offs in the implementation. For more information about HMAC algorithms supported by AWS KMS, see HMAC keys in AWS KMS in the AWS KMS Developer Guide.

HMACs offer two distinct benefits:

  1. Message integrity: As with all hash functions, the output of an HMAC will result in precisely one unique digest of the message’s content. If there is any change to the data object (for example you modify the purchase price in a contract by just one digit: from “$350,000” to “$950,000”), then the verification of the original digest will fail.
  2. Message authenticity: What distinguishes HMAC from other hash methods is the use of a secret key to provide message authenticity. Only message hashes that were created with the specific secret key material will produce the same HMAC output. This dependence on secret key material ensures that no third party can substitute their own message content and create a valid HMAC without the intended verifier detecting the change.

HMAC in the real world

HMACs have widespread applications and industry adoption because they are fast, high performance, and simple to use. HMACs are particularly popular in the JSON Web Token (JWT) open standard as a means of securing web applications, and have replaced older technologies such as cookies and sessions. In fact, Amazon implements a custom authentication scheme, Signature Version 4 (SigV4), to sign AWS API requests based on a keyed-HMAC. To authenticate a request, you first concatenate selected elements of the request to form a string. You then use your AWS secret key material to calculate the HMAC of that string. Informally, this process is called signing the request, and the output of the HMAC algorithm is informally known as the signature, because it simulates the security properties of a real signature in that it represents your identity and your intent.

Advantages of using HMACs in AWS KMS

AWS KMS HMAC APIs provide several advantages over implementing HMACs in application software because the key material for the HMACs is generated in AWS KMS hardware security modules (HSMs) that are certified under the FIPS 140-2 program and never leave AWS KMS unencrypted. In addition, the HMAC keys in AWS KMS can be managed with the same access control mechanisms and auditing features that AWS KMS provides on all AWS KMS keys. These security controls ensure that any HMAC created in AWS KMS can only ever be verified in AWS KMS using the same KMS key. Lastly, the HMAC keys and the HMAC algorithms that AWS KMS uses conform to industry standards defined in RFC 2104 HMAC: Keyed-Hashing for Message Authentication.

Use HMAC keys in AWS KMS to create JSON Web Tokens

The JSON Web Token (JWT) open standard is a common use of HMAC. The standard defines a portable and secure means to communicate a set of statements, known as claims, between parties. HMAC is useful for applications that need an authorization mechanism, in which claims are validated to determine whether an identity has permission to perform some action. Such an application can only work if a validator can trust the integrity of claims in a JWT. Signing JWTs with an HMAC is one way to assert their integrity. Verifiers with access to an HMAC key can cryptographically assert that the claims and signature of a JWT were produced by an issuer using the same key.

This section will walk you through an example of how you can use HMAC keys from AWS KMS to sign JWTs. The example uses the AWS SDK for Python (Boto3) and implements simple JWT encoding and decoding operations. This example shows the ease with which you can integrate HMAC keys in AWS KMS into your JWT application, even if your application is in another language or uses a more formal JWT library.

Create an HMAC key in AWS KMS

Begin by creating an HMAC key in AWS KMS. You can use the AWS KMS console or call the CreateKey API action. The following example shows creation of a 256-bit HMAC key:

import boto3

kms = boto3.client('kms')

# Use CreateKey API to create a 256-bit key for HMAC
key_id = kms.create_key(
	KeySpec='HMAC_256',
	KeyUsage='GENERATE_VERIFY_MAC'
)['KeyMetadata']['KeyId']

Use the HMAC key to encode a signed JWT

Next, you use the HMAC key to encode a signed JWT. There are three components to a JWT token: the set of claims, header, and signature. The claims are the very application-specific statements to be authenticated. The header describes how the JWT is signed. Lastly, the MAC (signature) is the output of applying the header’s described operation to the message (the combination of the claims and header). All these are packed into a URL-safe string according to the JWT standard.

The following example uses the previously created HMAC key in AWS KMS within the construction of a JWT. The example’s claims simply consist of a small claim and an issuance timestamp. The header contains key ID of the HMAC key and the name of the HMAC algorithm used. Note that HS256 is the JWT convention used to represent HMAC with SHA-256 digest. You can generate the MAC using the new GenerateMac API action in AWS KMS.

import base64
import json
import time

def base64_url_encode(data):
	return base64.b64encode(data, b'-_').rstrip(b'=')

# Payload contains simple claim and an issuance timestamp
payload = json.dumps({
	"does_kms_support_hmac": "yes",
	"iat": int(time.time())
}).encode("utf8")

# Header describes the algorithm and AWS KMS key ID to be used for signing
header = json.dumps({
	"typ": "JWT",
	"alg": "HS256",
	"kid": key_id #This key_id is from the “Create an HMAC key in AWS KMS” #example. The “Verify the signed JWT” example will later #assert that the input header has the same value of the #key_id 
}).encode("utf8")

# Message to sign is of form <header_b64>.<payload_b64>
message = base64_url_encode(header) + b'.' + base64_url_encode(payload)

# Generate MAC using GenerateMac API of AWS KMS
MAC = kms.generate_mac(
	KeyId=key_id, #This key_id is from the “Create an HMAC key in AWS KMS” 
				 #example
	MacAlgorithm='HMAC_SHA_256',
	Message=message
)['Mac']

# Form JWT token of form <header_b64>.<payload_b64>.<mac_b64>
jwt_token = message + b'.' + base64_url_encode(mac)

Verify the signed JWT

Now that you have a signed JWT, you can verify it using the same KMS HMAC key. The example below uses the new VerifyMac API action to validate the MAC (signature) of the JWT. If the MAC is invalid, AWS KMS returns an error response and the AWS SDK throws an exception. If the MAC is valid, the request succeeds and the application can continue to do further processing on the token and its claims.

def base64_url_decode(data):
	return base64.b64decode(data + b'=' * (4 - len(data) % 4), b'-_')

# Parse out encoded header, payload, and MAC from the token
message, mac_b64 = jwt_token.rsplit(b'.', 1)
header_b64, payload_b64 = message.rsplit(b'.', 1)

# Decode header and verify its contents match expectations
header_map = json.loads(base64_url_decode(header_b64).decode("utf8"))
assert header_map == {
	"typ": "JWT",
	"alg": "HS256",
	"kid": key_id #This key_id is from the “Create an HMAC key in AWS KMS” 
				 #example
}

# Verify the MAC using VerifyMac API of AWS KMS. # If the verification fails, this will throw an error.
kms.verify_mac(
	KeyId=key_id, #This key_id is from the “Create an HMAC key in AWS KMS” 
				 #example
	MacAlgorithm='HMAC_SHA_256',
	Message=message,
	Mac=base64_url_decode(mac_b64)
)

# Decode payload for use application-specific validation/processing
payload_map = json.loads(base64_url_decode(payload_b64).decode("utf8"))

Create separate roles to control who has access to generate HMACs and who has access to validate HMACs

It’s often helpful to have separate JWT creators and validators so that you can distinguish between the roles that are allowed to create tokens and the roles that are allowed to verify tokens. HMAC signatures performed outside of AWS-KMS don’t work well for this because you can’t isolate creators and verifiers if they both must have a copy of the same key. However, this is not an issue for HMAC keys in AWS KMS. You can use key policies to separate out who has permission to ask AWS KMS to generate HMACs and who has permission to ask AWS KMS to validate. Each party uses their own unique access keys to access the HMAC key in AWS KMS. Only HSMs in AWS KMS will ever have access to the actual key material. See the following example key policy statements that separate out GenerateMac and VerifyMac permissions:

{
	"Id": "example-jwt-policy",
	"Version": "2012-10-17",
	"Statement": [
		{
			"Sid": "Allow use of the key for creating JWTs",
			"Effect": "Allow",
			"Principal": {
				"AWS": "arn:aws:iam::111122223333:role/JwtProducer"
			},
			"Action": [
				"kms:GenerateMac"
			],
			"Resource": "*"
		},
		{
			"Sid": "Allow use of the key for validating JWTs",
			"Effect": "Allow",
			"Principal": {
				"AWS": "arn:aws:iam::111122223333:role/JwtConsumer"
			},
			"Action": [
				"kms:VerifyMac"
			],
			"Resource": "*"
		}
	]
}

Conclusion

In this post, you learned about the new HMAC APIs in AWS KMS (GenerateMac and VerifyMac). These APIs complement existing AWS KMS cryptographic operations: symmetric key encryption, asymmetric key encryption and signing, and data key creation and key enveloping. You can use HMACs for JWTs, tokenization, URL and API signing, as a key derivation function (KDF), as well as in new designs that we haven’t even thought of yet. To learn more about HMAC functionality and design, see HMAC keys in AWS KMS in the AWS KMS Developer Guide.

If you have feedback about this post, submit comments in the Comments section below. If you have questions about this post, start a new thread on the KMS re:Post or contact AWS Support.
Want more AWS Security news? Follow us on Twitter.
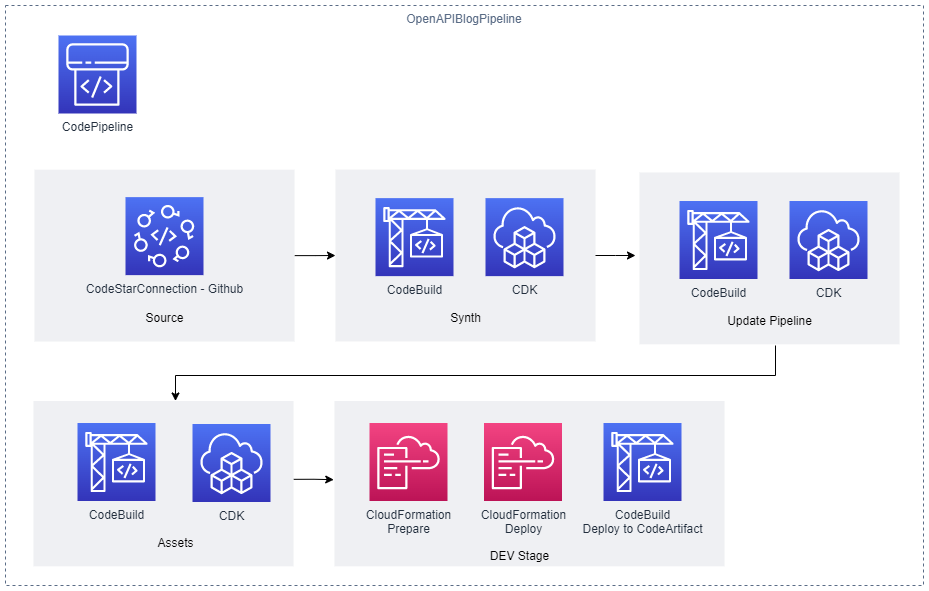
Author

Jeremy Stieglitz

Jeremy is the Principal Product Manager for AWS Key Management Service (KMS) where he drives global product strategy and roadmap for AWS KMS. Jeremy has more than 20 years of experience defining new products and platforms, launching and scaling cryptography solutions, and driving end-to-end product strategies. Jeremy is the author or co-author of 23 patents in network security, user authentication and network automation and control.

Author

Peter Zieske

Peter is a Senior Software Developer on the AWS Key Management Service team, where he works on developing features on the service-side front-end. Outside of work, he enjoys building with LEGO, gaming, and spending time with family.

Build a data pipeline to automatically discover and mask PII data with AWS Glue DataBrew

Post Syndicated from Samson Lee original https://aws.amazon.com/blogs/big-data/build-a-data-pipeline-to-automatically-discover-and-mask-pii-data-with-aws-glue-databrew/

Personally identifiable information (PII) data handling is a common requirement when operating a data lake at scale. Businesses often need to mitigate the risk of exposing PII data to the data science team while not hindering the productivity of the team to get to the data they need in order to generate valuable data insights. However, there are challenges in striking the right balance between data governance and agility:

  • Proactively identifying the dataset that contains PII data, if it’s not labeled by the data providers
  • Determining to what extent the data scientists can access the dataset
  • Minimizing chances that the data lake operator is visually exposed to PII data when they process the data

To help overcome these challenges, we can build a data pipeline that automatically scans data upon its arrival to the data lake, then further masks the portion of data that is labeled as PII data. Automating the PII data scanning and masking tasks helps prevent human actors processing the data while the PII data is still presented in plain text, yet still provides data consumers timely access to the newly arrived dataset.

To build a data pipeline that can automatically handle PII data, you can use AWS Glue DataBrew. DataBrew is a no-code data preparation tool with pre-built transformations to automate data preparation tasks. It natively supports PII data identification, entity detection, and PII data handling features. In addition to its visual interface for no-code data preparation, it offers APIs to let you orchestrate the creation and running of DataBrew profile jobs and recipe jobs.

In this post, we illustrate how you can orchestrate DataBrew jobs with AWS Step Functions to build a data pipeline to handle PII data. The pipeline is triggered by Amazon Simple Storage Service (Amazon S3) event notifications sent to Amazon EventBridge whenever there is a new data object lands in a S3 bucket. We also include an AWS CloudFormation template for you to deploy as a reference.

Solution overview

The following diagram describes the solution architecture.

Architecture Diagram

The solution includes a S3 bucket as the data input bucket and another S3 bucket as the data output bucket. Data uploaded to the data input bucket sends an event to EventBridge to trigger the data pipeline. The pipeline is composed of a Step Functions state machine, DataBrew jobs, and an AWS Lambda function used for reading the results of the DataBrew profile job.

The solution workflow includes the following steps:

  1. A new data file is uploaded to the data input bucket.
  2. EventBridge receives an object created event from the S3 bucket, and triggers the Step Functions state machine.
  3. The state machine uses DataBrew to register the S3 object as a new DataBrew dataset, and creates a profile job. The profile job results, including the PII statistics, are written to the data output bucket.
  4. A Lambda function reads the profile job results and returns whether the data file contains PII data.
  5. If no PII data is found, the workflow is complete; otherwise, a DataBrew recipe job is created to target the columns that contain PII data.
  6. When running the DataBrew recipe job, DataBrew uses the secret (a base64 encoded string, such as TXlTZWNyZXQ=) stored in AWS Secrets Manager to hash the PII columns.
  7. When the job is complete, the new data file with PII data hashed is written to the data output bucket.

Prerequisites

To deploy the solution, you should have the following prerequisites:

Deploy the solution using AWS CloudFormation

To deploy the solution using the CloudFormation template, complete the following steps.

  1. Sign in to your AWS account.
  2. Choose Launch Stack:
  3. Navigate to one of the AWS Regions where DataBrew is available (such as us-east-1).
  4. For Stack name, enter a name for the stack or leave as default (automate-pii-handling-data-pipeline).
  5. For HashingSecretValue, enter a secret (which is base64 encoded during the CloudFormation stack creation) to use for data hashing.
  6. For PIIMatchingThresholdValue, enter a threshold value (1–100 in terms of percentage, default is 80) to indicate the desired percentage of records the DataBrew profile job must identify as PII data in a given column, so that the data in the column is further hashed by the subsequent DataBrew PII recipe job.
  7. Select I acknowledge that AWS CloudFormation might create IAM resources.
  8. Choose Create stack.

CloudFormation Quick Launch Page

The CloudFormation stack creation process takes around 3-4 minutes to complete.

Test the data pipeline

To test the data pipeline, you can download the sample synthetic data generated by Mockaroo. The dataset contains synthetic PII fields such as email, contact number, and credit card number.

Data Preview

The sample data contains columns of PII data as an illustration; you can use DataBrew to detect PII values down to the cell level.

  1. On the AWS CloudFormation console, navigate to the Outputs tab for the stack you created.
  2. Choose the URL value for AmazonS3BucketForGlueDataBrewDataInput to navigate to the S3 bucket created for DataBrew data input.
    CloudFormation Stack Output 1
  3. Choose Upload.
    S3 Object Upload Page
  4. Choose Add files to upload the data file you downloaded.
  5. Choose Upload again.
  6. Return to the Outputs tab for the CloudFormation stack.
  7. Choose the URL value for AWSStepFunctionsStateMachine.
    CloudFormation Stack Output 2
    You’re redirected to the Step Functions console, where you can review the state machine you created. The state machine should be in a Running state.
  1. In the Executions list, choose the current run of the state machine.
    Step Functions State Machine
    A graph inspector visualizes which step of the pipeline is being run. You can also inspect the step input and output of each step completed.Step Functions Graph Inspector
    For the provided sample dataset, with 8 columns containing 1,000 rows of records, the whole run takes approximately 7–8 minutes.

Data pipeline details

While we’re waiting for the steps to complete, let’s explain more of how this data pipeline is built. The following figure is the detailed workflow of the Step Functions state machine.

Step Functions Workflow

The key step in the state machine is the Lambda function used to parse the DataBrew profile job result. The following code is a snippet of the profile job result in JSON format:

{
    "defaultProfileConfiguration": {...
    },
    "entityDetectorConfigurationOverride": {
        "AllowedStatistics": [...
        ],
        "EntityTypes": [
            "USA_ALL",
            "PERSON_NAME"
        ]
    },
    "datasetConfigurationOverride": {},
    "sampleSize": 1000,
    "duplicateRowsCount": 0,
    "columns": [
        {...
        },
        {
            "name": "email_address",
            "type": "string",
            "entity": {
                "rowsCount": 1000,
                "entityTypes": [
                    {
                        "entityType": "EMAIL",
                        "rowsCount": 1000
                    }
                ]
            }...
        }...
    ]...
}

Inside columns, each column object has the property entity if it’s detected to be a column containing PII data. rowsCount inside entity tells us how many rows out of the total sample are identified as PII, followed by entityTypes to indicate the type of PII identified.

The following is the Python code used in the Lambda function:

import json
import boto3
import os

def lambda_handler(event, context):

  s3Bucket = event["Outputs"][0]["Location"]["Bucket"]
  s3ObjKey = event["Outputs"][0]["Location"]["Key"]

  s3 =boto3.client('s3')
  glueDataBrewProfileResultFile = s3.get_object(Bucket=s3Bucket, Key=s3ObjKey)
  glueDataBrewProfileResult = json.loads(glueDataBrewProfileResultFile['Body'].read().decode('utf-8'))
  columnsProfiled = glueDataBrewProfileResult["columns"]
  PIIColumnsList = []

  for item in columnsProfiled:
    if "entityTypes" in item["entity"]:
      if (item["entity"]["rowsCount"]/glueDataBrewProfileResult["sampleSize"]) >= int(os.environ.get("threshold"))/100:
        PIIColumnsList.append(item["name"])

  if PIIColumnsList == []:
    return 'No PII columns found.'
  else:
    return PIIColumnsList

To summarize what the logic of the Lambda function is, a for-loop is implemented to aggregate a list of column names, in which the ratio of PII rows over the total sample size of that column is larger than or equal to the threshold value set earlier in the CloudFormation stack creation step. The Lambda function returns the list of column names to the Step Functions state machine to author a DataBrew recipe that masks only the columns in the returned list, instead of all the columns of the dataset. This way, we retain the content of non-PII columns for the data consumer while not exposing the PII data in plain text.

Step Functions Workflow Studio

We use CRYPTOGRAPHIC_HASH in this solution for the Operation parameter of the DataBrew CreateRecipe step. Because the profile job result and threshold value have already been used to determine which columns contain PII data to mask, the recipe step doesn’t include the parameter entityTypeFilter to enforce all rows of the columns getting hashed. Otherwise, some rows in the column might not be hashed by the operation if the particular rows of data are not identified by DataBrew as PII.

If your dataset potentially contains free-text columns such as doctor notes and email body, it would be beneficial to include the parameter entityTypeFilter in an additional recipe step to handle the free-text columns. For more information, refer to the values supported for this parameter.

To customize the solution further, you can also choose other PII recipe steps available from DataBrew to mask, replace, or transform the data in approaches best suited for your use cases.

Data pipeline results

After a deeper dive into the solution components, let’s check if all the steps in the Step Functions state machine are complete and review the results.

  1. Navigate to the Datasets page on the DataBrew console to view the data profile result of the dataset you just uploaded.
    Glue DataBrew Datasets
    Five columns of the dataset have been identified as columns containing PII data. Depending on the threshold value you set when creating the CloudFormation stack (the default is 80), the column spoken_language wouldn’t be included in the PII data masking step because only 14% of the rows were identified as a name of a person.
  1. Navigate to the Jobs page to inspect the output of the data masking step.
  2. Choose 1 output to see the S3 bucket containing the data output.
    Glue DataBrew Job Ouput
  3. Choose the value for Destination to navigate to the S3 bucket.
    Glue DataBrew Job Output Destination
    The data output S3 bucket contains a .json file, which is the data profile result you just reviewed in JSON format. There is also a folder path that contains the data output of the PII data masking task.
  1. Choose the folder path.
    Glue DataBrew Output in S3
  2. Select the CSV file, which is the output of the DataBrew recipe job.
  3. On the Actions menu, choose Query with S3 Select.
    S3 Select
  4. In the SQL query section, choose Run SQL query.
    Query Result
    The query results sampled five rows from the data output of the DataBrew recipe job; the columns identified as PII (full_name, email_address, and contact_phone_number) have been masked. Congratulations! You have successfully produced a dataset from a data pipeline that detects and masks PII data automatically.

Clean up

To avoid incurring future charges, delete the resources you created as part of this post.

On the AWS CloudFormation console, delete the stack you created (default name is automate-pii-handling-data-pipeline).

Conclusion

In this post, you learned how to build a data pipeline that automatically detects PII data and masks the data accordingly when a new data file arrives in an S3 bucket. With DataBrew profile jobs, you can develop logics with low code to run automatically on the profile results. For this post, our job determined which columns to mask. You can also author the DataBrew recipe job in an automated approach, which helps limit occasions when human actors can access the PII data while it’s still in plain text.

You can learn more about this solution and the source code by visiting the GitHub repository. To learn more about what DataBrew can do in handling PII data, refer to Introducing PII data identification and handling using AWS Glue DataBrew and Personally identifiable information (PII) recipe steps.


About the Author

Author

Samson Lee is a Solutions Architect with a focus on the data analytics domain. He works with customers to build enterprise data platforms, discovering and designing solutions on AI/ML use cases. Samson also enjoys coffee and wine tasting outside of work.

Orchestrating high performance computing with AWS Step Functions and AWS Batch

Post Syndicated from James Beswick original https://aws.amazon.com/blogs/compute/orchestrating-high-performance-computing-with-aws-step-functions-and-aws-batch/

This post is written by Dan Fox, Principal Specialist Solutions Architect; Sabha Parameswaran, Senior Solutions Architect.

High performance computing (HPC) workloads address challenges in a wide variety of industries, including genomics, financial services, oil and gas, weather modeling, and semiconductor design. These workloads frequently have complex orchestration requirements that may include large datasets and hundreds or thousands of compute tasks.

AWS Step Functions is a workflow automation service that can simplify orchestrating other AWS services. AWS Batch is a fully managed batch processing service that can dynamically scale to address computationally intensive workloads. Together, these services can orchestrate and run demanding HPC workloads.

This blog post identifies three common challenges when creating HPC workloads. It describes some features with Step Functions and AWS Batch that can help to solve these challenges. It then shows a sample project that performs complex task orchestration using Step Functions and AWS Batch.

Reaching service quotas with polling iterations

It’s common for HPC workflows to require that a step comprising multiple jobs completes before advancing to the next step. In these cases, it’s typical for developers to implement iterative polling patterns to track job completions.

To handle task orchestration for a workload like this, you may choose to use Step Functions. Step Functions has a hard limit of 25,000 history events. A single state transition may contain multiple history events. For example, an entry to the state and an exit from the state count as two steps. A workflow that iteratively polls many long-running processes may run into limits with this service quota.

Step Functions addresses this by providing synchronization capabilities with several integrated services, including AWS Batch. For integrated services, Step Functions can wait for a task to complete before progressing to the next state. This feature, called “Run a Job (.sync)” in the documentation, returns a Success or Failure message only when the compute service task is complete, reducing the number of entries in the event history log. View the Step Functions documentation for a complete list of supported service integrations.

“Run a Job (.sync)” task pattern

Supporting parallel and dynamic tasks

HPC workloads may require a changing number of compute tasks from execution to execution. For example, the number of compute tasks required in a workflow may depend on the complexity or length of an input dataset. For performance reasons, you may desire for these tasks to run in parallel.

Step Functions supports faster data processing with a fixed number of parallel executions through the parallel state type. If a workload has an unknown number of branches, the map state type can run a set of parallel steps for each element of an input array. We refer to this pattern as dynamic parallelism.

Dynamic parallelism using the map state

Limits and flow control with dynamic tasks

The map state may limit concurrent iterations. When this occurs, some iterations do not begin until previous iterations have completed. The likelihood of this occurring increases when an input array has over 40 items. If your HPC workload benefits from increased concurrency, you may use nested workflows. Step Functions allows you to orchestrate more complex processes by composing modular, reusable workflows.

For example, a map state may invoke secondary, nested workflows, which also contain map states. By nesting Step Functions workflows, you can build larger, more complex workflows out of smaller, simpler workflows.

As your workflow grows in complexity, you may use the callback task, which is an additional flow control feature. Callback tasks provide a way to pause a workflow pending the return of a unique task token. A callback task passes this token to an integrated service and then stops. Once the integrated service has completed, it may return the task token to the Step Functions workflow with a SendTaskSuccess or SendTaskFailure call. Once the callback task receives the task token, the workflow proceeds to the next state.

View the documentation for a list of integrated services that support this pattern.

Nested workflows using callback with task token

A sample project with several orchestration patterns

This sample project demonstrates orchestration of HPC workloads using Step Functions, AWS Batch, and Lambda. The nesting in this project is three layers deep. The primary state machine runs the second layer nested state machines, which in turn run the third layer nested state machines.

The primary state machine demonstrates dynamic parallelism. It receives an input payload that contains an array of items used as input for its map step. Each dynamic map branch runs a nested secondary state machine.

The secondary state machine demonstrates several workflow patterns including a Lambda function with callback, a third layer nested state machine in sync mode, an AWS Batch job in sync mode, and a Lambda function calling AWS Batch with a callback. The tertiary state machine only notifies its parent with Success when called in sync mode.

Explore the ASL in this project to review the code for these patterns.

Sample project architecture

Deploy the sample application

The README of the Github project contains more detailed instructions, but you may also follow these steps.

Prerequisites

  1. AWS Account: If you don’t have an AWS account, navigate to https://aws.amazon.com/ and choose Create an AWS Account.
  2. VPC: A valid existing VPC with subnets (for execution of AWS Batch jobs). Refer to https://docs.aws.amazon.com/vpc/latest/userguide/vpc-getting-started.html for creating a VPC.
  3. AWS CLI: This project requires a local install of AWS CLI. Refer to https://docs.aws.amazon.com/cli/latest/userguide/getting-started-install.html for installing AWS CLI.
  4. Git CLI: This project requires a local install of Git CLI. Refer to https://git-scm.com/book/en/v2/Getting-Started-Installing-Git
  5. AWS SAM CLI: This project requires a local install of AWS SAM CLI to build and deploy the sample application. Refer to https://docs.aws.amazon.com/serverless-application-model/latest/developerguide/serverless-sam-cli-install.html for instructions to install and use AWS SAM CLI.
  6. Python 3.8 and Docker: Required only if you plan for local development and testing with AWS SAM CLI.

Build and deploy in your account

Follow these steps to build this application locally and deploy it in your AWS account:

  1. Git clone the repository into a local folder.
    git clone https://github.com/aws-samples/aws-stepfunction-complex-orchestrator-app
    cd aws-stepfunction-complex-orchestrator-app
    
  2. Build the application using AWS SAM CLI.
    sam build
  3. Use AWS SAM deploy with the --guided flag.
    sam deploy --guided
    1. Parameter BatchScriptName (accept default: batch-notify-step-function.sh)
    2. Parameter VPCID (enter the id of your VPC)
    3. Parameter FargateSubnetAccessibility (choose Private or Public depending on subnet configuration)
    4. Parameter Subnets (enter ID for a single subnet)
    5. Parameter batchSleepDuration (accept default: 15)
    6. Accept all other defaults
  4. Note the name of the BucketName parameter in the Outputs of the deploy process. Save this S3 bucket name for the next step.
  5. Copy the batch script into the S3 bucket created in the prior step.
    aws s3 cp ./batch-script/batch-notify-step-function.sh s3://<S3-bucket-name>

Testing the sample application

Once the SAM CLI deploy is complete, navigate to Step Functions in the AWS Console.

  1. Note the three new state machines deployed to your account. Each state machine has a random suffix generated as part of the AWS SAM deploy process:
    1. ComplexOrchestratorStateMachine1-…
    2. SyncNestedStateMachine2-…
    3. CallbackNotifyStateMachine3-…
  2. Follow the link for the primary state machine: ComplexOrchestratorStateMachine1-…
  3. Choose Start execution.
  4. The sample payload for this state machine is located here: orchestrator-step-function-payload.json. This JSON document has 2 input elements within the entries array. Select and copy this JSON and paste it into the Input field in the console, overwriting the default value. This causes the map state to create and execute two nested state machines in parallel. You may modify this JSON to contain more elements to increase the number of parallel executions.
  5. View the “Execution event history” in the console for this execution. Under the Resource column, locate the links to the nested state machines. Select these links to follow their individual executions. You may also explore the links to Lambda, CloudWatch, and AWS Batch job.
  6. Navigate to AWS Batch in the console. Step Functions workflows are available to AWS Batch users within the AWS Batch console. Find the integration from the AWS Batch side navigation under “Related AWS services”. You can also read this blog post to learn more.
  7. Common troubleshooting. If the batch job fails or if the Step Functions workflow times out, make sure that you have correctly copied over the batch script into the S3 bucket as described in step 5 of the Build and Deploy in your account section of this post. Also make sure that the FargateSubnetAccessibility Parameter matches the configuration of your subnet (Public or Private).
  8. The state machine may take several minutes to complete. When successful, the Graph Inspector displays:Graph Inspector with Successful completion

Cleaning up

To clean up the deployment, run the following commands to delete the stack associated with the AWS SAM deployment:

aws cloudformation delete-stack --stack-name <stack-name>

Conclusion

This blog post describes several challenges common to orchestrating HPC workloads. I describe how Step Functions with AWS Batch can solve many of these challenges. I provide a project that contains several sample patterns and show how to deploy and test this in your account.

For more information on serverless patterns, visit Serverless Land.

Introducing global endpoints for Amazon EventBridge

Post Syndicated from James Beswick original https://aws.amazon.com/blogs/compute/introducing-global-endpoints-for-amazon-eventbridge/

This post is written by Stephen Liedig, Sr Serverless Specialist SA.

Last year, AWS announced two new features for Amazon EventBridge that allow you to route events from any commercial AWS Region, and across your AWS accounts. This supported a wide range of use cases, allowing you to implement easily global event delivery and replication scenarios.

From today, EventBridge extends this capability with global endpoints. Global endpoints provide a simpler and more reliable way for you to improve the availability and reliability of event-driven applications. The feature allows you to fail over event ingestion automatically to a secondary Region during service disruptions. Global endpoints also provide optional managed event replication, simplifying your event bus configuration and reducing the risk of event loss during any service disruption.

This blog post explains how to configure global endpoints in your AWS account, update your applications to publish events to the endpoint, and how to test endpoint failover.

How global endpoints work

Customers building multi-Region architectures today are building more resilience by using self-managed replication via EventBridge’s cross-Region capabilities. With this architecture, events are sent directly to an event bus in a primary Region and replicated to another event bus in a secondary Region.

Architecture

This event flow can be interrupted if there is a service disruption. In this scenario, event producers in the primary Region cannot PutEvents to their event bus, and event replication to the secondary Region is impacted.

To put more resiliency around multi-Region architectures, you can now use global endpoints. Global endpoints solve these issues by introducing two core service capabilities:

  1. A global endpoint is a managed Amazon Route 53 DNS endpoint. It routes events to the event buses in either Region, depending on the health of the service in the primary Region.
  2. There is a new EventBridge metric called IngestionToInvocationStartLatency. This exposes the time to process events from the point at which they are ingested by EventBridge to the point the first invocation of a target in your rules is made. This is a service-level metric measured across all of your rules and provides an indication of the health of the EventBridge service. Any extended periods of high latency over 30 seconds may indicate a service disruption.

These two features provide you with the ability to failover event ingestion automatically to the event bus in the secondary Region. The failover is triggered via a Route 53 health check that monitors a CloudWatch alarm that observes the IngestionToInvocationStartLatency in the primary Region.

If the metric exceeds the configured threshold of 30 seconds consecutively for 5 minutes, the alarm state changes to “ALARM”. This causes the Route 53 health check state to become unhealthy, and updates the routing of the global endpoint. All events from that point on are delivered to the event bus in the secondary Region.

The diagram below illustrates how global endpoints reroutes events being delivered from the event bus in the primary Region to the event bus in the secondary Region when CloudWatch alarms trigger the failover of the Route 53 health check.

Rerouting events with global endpoints

Once events are routed to the secondary Region, you have a couple of options:

  1. Continue processing events by deploying the same solution that processes events in the primary Region to the secondary Region.
  2. Create an EventBridge archive to persist all events coming through the secondary event bus. EventBridge archives provide you with a type of “Active/Archive” architecture allowing you to replay events to the event bus once the primary Region is healthy again.

When the global endpoint alarm returns to a healthy state, the health check updates the endpoint configuration, and begins routing events back to the primary Region.

Global endpoints can be optionally configured to replicate events across Regions. When enabled, managed rules are created on your primary and secondary event buses that define the event bus in the other Region as the rule target.

Under normal operating conditions, events being sent to the primary event bus are also sent to the secondary in near-real-time to keep both Regions synchronized. When a failover occurs, consumers in the secondary Region have an up-to-date state of processed events, or the ability to replay messages delivered to the secondary Region, before the failover happens.

When the secondary Region is active, the replication rule attempts to send events back to the event bus in the primary Region. If the event bus in the primary Region is not available, EventBridge attempts to redeliver the events for up to 24 hours, per its default event retry policy. As this is a managed rule, you cannot change this. To manage for a longer period, you can archive events being ingested by the secondary event bus.

How do you identify if the event has been replicated from another Region? Events routed via global endpoints have identical resource fields, which contain the Amazon Resource Name (ARN) of the global endpoint that routed the event to the event bus. The region field shows the origin of the event. In the following example, the event is sent to the event bus in the primary Region and replicated to the event bus in the secondary Region. The event in the secondary Region is us-east-1, showing the source of the event was the event bus in the primary Region.

If there is a failover, events are routed to the secondary Region and replicated to the primary Region. Inspecting these events, you would expect to see us-west-2 as the source Region.

Replicated events

The two preceding events are identical except for the id. Event IDs can change across API calls so correlating events across Regions requires you to have an immutable, unique identifier. Consumers should also be designed with idempotency in mind. If you are replicating events, or replaying them from archives, this ensures that there are no side effects from duplicate processing.

Setting up a global endpoint

To configure a Global endpoint, define two event buses — one in the “primary” Region (this is the same Region you configure the endpoint in) and one in a “secondary” Region. To ensure that events are routed correctly, the event bus in the secondary Region must have the same name, in the same account, as the primary event bus.

  1. Create two event buses in different Regions with the same name. This is quickly set up using the AWS Command Line Interface (AWS CLI):Primary event bus:
    aws events create-event-bus --name orders-bus --region us-east-1Secondary event bus:
    aws events create-event-bus --name orders-bus --region us-west-2
  2. Open the Amazon EventBridge console in the Region where you want to create the global endpoint. This aligns with your primary Region. Navigate to the new global endpoints page and create a new endpoint.
    EventBridge console
  3. In the Endpoint details panel, specify a name for your global endpoint (for example, OrdersGlobalEndpoint) and enter a description.
  4. Select the event bus in the primary Region, orders-bus.
  5. Select the Region used when creating the secondary event bus previously. the secondary event bus by choosing the Region it was created in from the dropdown.Create global endpoint
  6. Select the Route 53 health check for triggering failover and recovery. If you have not created one before, choose New health check. This opens an AWS CloudFormation console to create the “LatencyFailuresHealthCheck” health check and CloudWatch alarm in your account. EventBridge provides a template with recommended defaults for a CloudWatch alarm that is triggered when the average latency exceeds 30 seconds for 5 minutes.Endpoint configuration
  7. Once the CloudFormation stack is deployed, return to the EventBridge console and refresh the dropdown list of health checks. Select the physical ID of the health check you created.Failover and recovery
  8. Ensure that event replication is enabled, and create the endpoint.
    Event replication
  9. Once the endpoint is created, it appears in the console. The global endpoint URL contains the EndpointId, which you must specify in PutEvents API calls to publish events to the endpoint.
    Endpoint listed in console

Testing failover

Once you have created an endpoint, you can test the configuration by creating “catch all” rules on the primary and secondary event buses. The simplest way to see events being processed is to create rules with CloudWatch log group target.

Testing global endpoint failure over is accomplished by inverting the Route 53 health check. This can be accomplished using any of the Route 53 APIs. Using the console, open the Route 53 health checks landing page and edit the “LatencyFailuresHealthCheck” associated with your global endpoint. Check “Invert health check status” and save to update the health check.

Within a few minutes, the health check changes state from “Healthy” to “Unhealthy” and you see events flowing to the event bus in the secondary.

Configure health check

Using the PutEvents API with global endpoints

To use global endpoints in your applications, you must update your current PutEvents API call. All AWS SDKs have been updated to include an optional EndpointId parameter that you must set when publishing events to a global endpoint. Even though you are no longer putting events directly on the event bus, the EventBusName must be defined to validate the endpoint configuration.

PutEvents SDK support for global endpoints requires the AWS Common Runtime (CRT) library, which is available for multiple programming languages, including Python, Node.js, and Java:

https://github.com/awslabs/aws-crt-python
https://github.com/awslabs/aws-crt-nodejs
https://github.com/awslabs/aws-crt-java

To install the awscrt module for Python using pip, run:

python3 -m pip install boto3 awscrt

This example shows how to send an event to a global endpoint using the Python SDK:

import json
import boto3
from datetime import datetime
import uuid
import random

client = session.client('events', config=my_config)

detail = {
    "order_date": datetime.now().isoformat(),
    "customer_id": str(uuid.uuid4()),
    "order_id": str(uuid.uuid4()),
    "order_total": round(random.uniform(1.0, 1000.0), 2)
}

put_response = client.put_events(
    EndpointId=" y6gho8g4kc.veo",
    Entries=[
        {
            'Source': 'com.aws.Orders',
            'DetailType': 'OrderCreated',
            'Detail': json.dumps(detail),
            'EventBusName': 'orders-bus'
        }
    ]
)

Event producers can suffer data loss if the PutEvents API call fails, even if you are using global endpoints. Global endpoints allow you to automate the re-routing of events to another event-bus in another Region, but the health checks triggering the failover won’t be invoked for at least 5 minutes. It’s possible that your applications experience increased error rates for PutEvents operations before the failover occurs and events are routed to a healthy Region. To safeguard against message loss during this time, it’s best practice to use exponential retry and back-off patterns and durable store-and-forward capability at the producer level.

Conclusion

This blog shows how to create an EventBridge global endpoint to improve the availability and reliability of event ingestion of event-driven applications. This example shows how to use the PutEvents in the Python AWS SDK to publish events to a global endpoint.

To create a global endpoint using the API, see CreateEndpoint in the Amazon EventBridge API Reference. You can also create a global endpoint by using AWS CloudFormation using an AWS::Events:: Endpoints resource.

To learn more about EventBridge global endpoints, see the EventBridge Developer Guide. For more serverless learning resources, visit Serverless Land.

Improve reusability and security using Amazon Athena parameterized queries

Post Syndicated from Blayze Stefaniak original https://aws.amazon.com/blogs/big-data/improve-reusability-and-security-using-amazon-athena-parameterized-queries/

Amazon Athena is a serverless interactive query service that makes it easy to analyze data in Amazon Simple Storage Service (Amazon S3) using standard SQL, and you only pay for the amount of data scanned by your queries. If you use SQL to analyze your business on a daily basis, you may find yourself repeatedly running the same queries, or similar queries with minor adjustments. Athena parameterized queries enable you to prepare statements you can reuse with different argument values you provide at run time. Athena parameterized queries also provide a layer of security against SQL injection attacks, and mask the query string in AWS CloudTrail for workloads with sensitive data.

This post shows you how to create and run parameterized queries in Athena. This post provides an example of how Athena parameterized queries protect against SQL injection, and shows the CloudTrail events with the masked query string. Lastly, the post reviews functions related to managing Athena prepared statements. If you want to follow along, this post provides steps to set up the components with a sample dataset; alternatively, you can use your own dataset.

Reusability

Athena prepared statements allow you to run and reuse queries within your Athena workgroup. By decoupling the queries from the code, you can update your prepared statements and your applications independent from one another. If a data lake has schema updates, it could require query updates. If multiple applications share the same Athena workgroup and are using similar queries, you can create a new query or update the existing query to serve multiple use cases, without each application being required to adjust similar queries in their own source code. Parameterized queries are currently supported for SELECT, INSERT INTO, CTAS, and UNLOAD statements. For the most current list, refer to Considerations and Limitations in Querying with Prepared Statements.

Security

Athena prepared statements provide a layer of protection against SQL injection. If you are using Athena behind an application interface, free text inputs inherently present a SQL injection threat vector which, if left unmitigated, could result in data exfiltration. When the parameterized query is run, Athena interprets the arguments as literal values, not as executable commands nor SQL fragments like SQL operators.

When using Athena, CloudTrail captures all Athena API calls as audit events to provide a record of actions taken by an AWS user, role, or AWS service. Customers with sensitive data in their data lakes, such as personally identifiable information (PII), have told us they don’t want query strings in their CloudTrail event history for compliance reasons. When running parameterized queries, the query string is masked with HIDDEN_DUE_TO_SECURITY_REASONS in the CloudTrail event, so you don’t show protected data within your log streams.

Solution overview

This post documents the steps using the public Amazon.com customer reviews dataset; however, you can follow similar steps to use your own dataset.

The example query is to find a product’s 4-star (out of 5 stars) reviews voted as the most helpful by other customers. The intent behind the query is to find query results that indicate constructive product feedback. The intent is to validate the feedback and get helpful feedback incorporated into the product roadmap. The product used in this use case is the Amazon Smile eGift Card.

Prerequisites

As a prerequisite, you need a foundational understanding of SQL syntax, as well as a foundational understanding the following AWS services:

This post assumes you have:

Deploy resources for the example dataset

If you’re using the example dataset, follow the steps in this section. The data is in an S3 bucket in an AWS-managed AWS account. You need to create Athena and AWS Glue resources to get started.

This post provides a CloudFormation template that deploys the following resources in your AWS account:

  • AthenaWorkGroup – An Athena workgroup for your dataset and prepared statements. On the console, this workgroup is named PreparedStatementsWG.
  • GlueDatabase – A database in the AWS Glue Data Catalog for table metadata. The database is named athena_prepared_statements.
  • GlueTableAmazonReviews – An external table with Amazon.com customer reviews in the Data Catalog.

The following diagram shows how the resources interact when the query runs.
Diagram depicting a customer's AWS account and an AWS managed AWS account. In the customer account, there is a region box. In the region, there is an Amazon Athena workgroup taking 3 steps. In the first step, the workgroup accesses metadata from the AWS Glue Data Catalog named default. The catalog has a dotted line to an AWS Glue table called amazon_reviews_parquet, which has the attributes and S3 bucket location. The second step from the workgroup queries data from the S3 bucket. The S3 bucket is in the AWS managed AWS account. The bucket is for the Amazon Customer Reviews dataset. In the third step, the workgroup stores the query results in the Amazon S3 bucket in the customer AWS account. The query results can then be read by users with read access to the Athena workgroup.

To deploy the CloudFormation template, follow these steps:

  1. Navigate to this post’s GitHub repository.
  2. Clone the repository or copy the CloudFormation template athena-prepared-statements.yaml.
  3. On the AWS CloudFormation console, choose Create stack.
  4. Select Upload a template file and choose Choose file.
  5. Upload athena-prepared-statements.yaml, then choose Next.
  6. On the Specify stack details page, enter the stack name athena-prepared-statements-blog.
  7. For S3QueryResultsBucketName, enter your S3 bucket name.
  8. If you leave AthenaWorkGroupName as default, the Athena workgroup is named PreparedStatementsWG. If you change the value, the Athena workgroup name must be unique in your AWS Region.
  9. Choose Next.
  10. On the Configure stack options page, choose Next.
  11. On the Review page, choose Create stack.

The script takes less than a minute to run and change to a CREATE_COMPLETE state. If you deploy the stack twice in the same AWS account and Region, the AWS Glue database, table, or Athena workgroup may already exist, and the process fails with a message indicating that the resource already exists in another template.

For least-privilege authorization for deployment of the CloudFormation template, you can create an AWS CloudFormation service role with the following IAM policy actions. To do this, you must create an IAM policy and IAM role, and choose this role when configuring stack options.

{
  "Version": "2012-10-17",
  "Statement": [
    {
      "Effect": "Allow",
      "Action": [
        "glue:CreateDatabase"
      ],
      "Resource": [
        "arn:${Partition}:glue:${Region}:${Account}:catalog",
        "arn:${Partition}:glue:${Region}:${Account}:database/athena_prepared_statements"
      ]
    },
    {
      "Effect": "Allow",
      "Action": [
        "glue:DeleteDatabase"
      ],
      "Resource": [
        "arn:${Partition}:glue:${Region}:${Account}:catalog",
        "arn:${Partition}:glue:${Region}:${Account}:database/athena_prepared_statements",
        "arn:${Partition}:glue:${Region}:${Account}:table/athena_prepared_statements/*",
        "arn:${Partition}:glue:${Region}:${Account}:userDefinedFunction/athena_prepared_statements/*"
      ]
    },
    {
      "Effect": "Allow",
      "Action": [
        "glue:CreateTable"
      ],
      "Resource": [
        "arn:${Partition}:glue:${Region}:${Account}:catalog",
        "arn:${Partition}:glue:${Region}:${Account}:database/athena_prepared_statements",
        "arn:${Partition}:glue:${Region}:${Account}:table/athena_prepared_statements/amazon_reviews_parquet"
      ]
    },
    {
      "Effect": "Allow",
      "Action": [
        "glue:DeleteTable"
      ],
      "Resource": [
        "arn:${Partition}:glue:${Region}:${Account}:catalog",
        "arn:${Partition}:glue:${Region}:${Account}:database/athena_prepared_statements",
        "arn:${Partition}:glue:${Region}:${Account}:table/athena_prepared_statements/amazon_reviews_parquet"
      ]
    },
    {
      "Effect": "Allow",
      "Action": [
        "athena:CreateWorkGroup",
        "athena:DeleteWorkGroup",
        "athena:GetWorkGroup"
      ],
      "Resource": "arn:${Partition}:athena:${Region}:${Account}:workgroup/PreparedStatementsWG"
    }
  ]
}

For authorization for the IAM principal running the CloudFormation template and following along, this post was tested with the following AWS managed policies and the customer managed policy below.

AWS managed policies:

  • AmazonAthenaFullAccess
  • AWSCloudTrailReadOnlyAccess
  • AWSCloudFormationFullAccess

Customer managed policy:

{
    "Version": "2012-10-17",
    "Statement": [
        {
            "Sid": "ViewS3BucketsWithoutErrors",
            "Effect": "Allow",
            "Action": [
                "s3:ListAllMyBuckets"
            ],
            "Resource": [
                "*"
            ]
        },
        {
            "Sid": "InteractWithMyBucketAndDataSetBucket",
            "Effect": "Allow",
            "Action": [
                "s3:GetObject",
                "s3:GetBucketLocation",
                "s3:ListBucket",
                "s3:PutObject"
            ],
            "Resource": [
                "arn:aws:s3:::${my-bucket-name}*",
                "arn:aws:s3:::amazon-reviews-pds*"
            ]
        },
        {
            "Sid": "UploadCloudFormationTemplate",
            "Effect": "Allow",
            "Action": "s3:PutObject",
            "Resource": "arn:aws:s3:::cf-template*"
        },
        {
            "Sid": "CleanUpResults",
            "Effect": "Allow",
            "Action": [
                "s3:DeleteObject"
            ],
            "Resource": [
                "arn:aws:s3:::${my-bucket-name}/results*"
            ]
        },
        {
            "Sid": "ListRolesForCloudFormationDeployment",
            "Effect": "Allow",
            "Action": [
                "iam:ListRoles"
            ],
            "Resource": [
                "*"
            ]
        },
        {
            "Sid": "IAMRoleForCloudFormationDeployment",
            "Effect": "Allow",
            "Action": [
                "iam:PassRole"
            ],
            "Resource": [
                "arn:${Partition}:iam::${Account}:role/${role-name}"
            ],
            "Condition": {
                "StringEquals": {
                    "iam:PassedToService": "cloudformation.amazonaws.com"
                }
            }
        }
    ]
}

Partition the example dataset

The CloudFormation template created an external table pointing at a dataset of over 130 million customer reviews from Amazon.com. Partitioning data improves query performance and reduces cost by restricting the amount of data scanned by each query. The external table for this dataset has Hive-compatible partitions. The MSCK REPAIR TABLE SQL statement scans the prefix paths in the S3 bucket and updates the metadata in the Data Catalog with the partition metadata. To access the dataset, the external table’s partitions must be updated.

After you deploy the CloudFormation template, complete the following steps:

  1. On the Athena console, choose Query editor in the navigation pane.
  2. For Data Source, enter AwsDataCatalog.
  3. For Database, enter athena_prepared_statements.
  4. On the Workgroup drop-down menu, choose PreparedStatementsWG.
  5. Choose Acknowledge to confirm.
  6. In the query editor pane, run the following SQL statement for your external table:
MSCK REPAIR TABLE athena_prepared_statements.amazon_reviews_parquet;

This query takes approximately 15 seconds to run when tested in us-east-1.

  1. Run the following query to list the available partitions. The example dataset has partitions based on product_category.
SHOW PARTITIONS athena_prepared_statements.amazon_reviews_parquet;
  1. Run a SELECT statement to output a sample of data available in the table:
SELECT * FROM athena_prepared_statements.amazon_reviews_parquet limit 10;

Create prepared statements

To use Athena parameterized queries, first you run the PREPARE SQL statement and specify your positional parameters, denoted by question marks. The Athena prepared statement is stored with a name you specify.

Run the following PREPARE statement in the Athena query editor. This example query, named product_helpful_reviews, provides customer reviews with three parameters for a specified product ID, star rating provided by the reviewer, and minimum number of helpful votes provided to the review by other Amazon.com customers.

PREPARE product_helpful_reviews FROM
SELECT product_id, product_title, star_rating, helpful_votes, review_headline, review_body
FROM amazon_reviews_parquet WHERE product_id = ? AND star_rating = ? AND helpful_votes > ?
ORDER BY helpful_votes DESC
LIMIT 10;

You could also use the CreatePreparedStatement API or SDK. For example, to create your prepared statement from AWS CLI, run the following command:

aws athena create-prepared-statement \
--statement-name "product_helpful_reviews" \
--query-statement "SELECT product_id, product_title, star_rating, helpful_votes, review_headline, review_body FROM amazon_reviews_parquet WHERE product_id = ? AND star_rating = ? AND helpful_votes > ? ORDER BY helpful_votes DESC LIMIT 10;" \
--work-group PreparedStatementsWG \
--region region

For more information on creating prepared statements, refer to SQL Statements in Querying with Prepared Statements.

Run parameterized queries

You can run a parameterized query against the prepared statement with the EXECUTE SQL statement and a USING clause. The USING clause specifies the argument values for the prepared statement’s parameters.

Run the following EXECUTE statement in the Athena query editor. The prepared statement created in the previous section is run with parameters to output 4-star reviews for the Amazon Smile eGift Card product ID with at least 10 helpful votes.

EXECUTE product_helpful_reviews USING 'BT00DDVMVQ', 4, 10;

If you receive the message PreparedStatement product_helpful_reviews was not found in workGroup primary, make sure you selected the PreparedStatementsWG workgroup.

For more information on running parameterized queries, refer to SQL Statements in Querying with Prepared Statements.

Mask query string data in CloudTrail events using parameterized queries

You may want to use parameterized queries to redact sensitive data from the query string visible in CloudTrail events. For example, you may have columns containing PII as parameters, which you don’t want visible in logs. Athena automatically masks query strings from CloudTrail events for EXECUTE statements, replacing the query string with the value HIDDEN_DUE_TO_SECURITY_REASONS. This helps you avoid displaying protected data in your log streams.

To access the CloudTrail event for the query, complete the following steps:

  1. Navigate to the Event history page on the CloudTrail console.
  2. On the drop-down menu, choose Event name.
  3. Search for StartQueryExecution events.

CloudTrail event records for parameterized queries include a queryString value redacted with HIDDEN_DUE_TO_SECURITY_REASONS. The query string is visible in the Athena workgroup’s query history. You can control access by using least-privilege IAM policies to Athena, the AWS Glue Data Catalog, and the Amazon S3 query output location in your workgroup settings. For more information on viewing recent queries, refer to Viewing Recent Queries. For more information on IAM policies, refer to Actions, resources, and condition keys for AWS services.

Layer of protection for SQL injection

In this section, you’re shown an example of a SQL injection attack, and how prepared statements can protect against the same attack. We use the Athena console to invoke the StartQueryExecution API against a table named users with three rows.

SQL injection is an attempt to insert malicious SQL code into requests to change the statement and extract data from your dataset’s tables. Without Athena parameterized queries, if you’re querying a dataset directly or appending user input to a SQL query, and users can append SQL fragments, the dataset may be vulnerable to SQL injection attacks which return unauthorized data in the result set.

This post shows an example of inserting a SQL fragment in a malicious way. In the example, an OR condition which will always return true (such as OR 1=1) is appended to the WHERE clause. The same example query is shown with Athena parameterized queries, and the query fails because it contains an invalid parameter value, since the parameter value is expected to be an integer but contains the characters “OR”. If the parameter was based on a String column, then the same SQL injection attempt would result in the query returning no results because the positional argument is interpreted as a literal parameter value.

Athena provides an additional layer of defense against multi-statement SQL injection attacks. Attempting to perform SQL injection with an executable command (such as DROP) results in a failed query with Athena providing an error Only one sql statement is allowed, because Athena only accepts one executable command per SQL statement submission.

Although Athena prepared statements provide a layer of protection against SQL injection attacks, other precautions provide additional layers of defense. Athena prepared statements can be a part of your defense-in-depth strategy. For more information on layers of security, refer to Amazon Athena Security.

SQL injection example

The intended use of the SELECT query in the example is to receive a small set of values. However, an attacker can manipulate the input to append malicious SQL code. For example, an attacker can input a value of 1 OR 1=1, which appends a true condition to the WHERE clause and returns all records in the table:

SELECT * FROM users WHERE id = 1 OR 1=1;

By appending malicious SQL code, the attacker can retrieve all rows of the users table, as shown in the following screenshot.
An image of the Athena graphical user interface. A query SELECT * FROM users WHERE id = 1 OR 1=1; has been run. All 3 users in the table, with ids 1, 2, and 3, returned with all columns of the table.

SQL injection attempt with a prepared statement

If we create prepared statements with the same query from the previous example, the executable command is passed as a literal argument for the parameter’s value. If a user tries to pass additional SQL, they receive a syntax error because the WHERE clause is based on ID, which expects an integer value.

  1. Create a prepared statement using the same query against the users table:
PREPARE get_user FROM SELECT * FROM users WHERE id = ?
  1. Set the parameter to a legitimate value:
EXECUTE get_user USING 1

The expected result returns, as shown in the following screenshot.

Graphical user interface of Athena running query EXECUTE get_user USING 1. Only the user with id 1 returned.

  1. Now, attempt to pass a malicious value:
EXECUTE get_user USING 1 OR 1=1

Running this prepared statement produces a syntax error, because an integer value is expected, but it receives an invalid integer value of 1 OR 1=1. The query and syntax error are shown in the following screenshot.

Graphical user interface of Athena querying EXECUTE get_user USING 1 OR 1=1. There is an error. The error says "SYNTAX_ERROR: line 1:24: Left side of logical expression must evaluate to a boolean (actual: integer). This query ran against the "default" database, unless qualified by the query. Please post the error message in our forum."

Working with prepared statements

This section describes administrative functions to make it easier to work with prepared statements.

List all prepared statements in my AWS account

To list all prepared statements in an Athena workgroup from the AWS Command Line Interface (AWS CLI), you can run the following command:

aws athena list-prepared-statements --work-group workgroup_name --region region_name

If following the example above, the command will return the following response.

{
  "PreparedStatements": [
    {
      "StatementName": "product_helpful_reviews",
      "LastModifiedTime": "2022-01-14T15:33:07.935000+00:00"
    }
  ]
}

To list all available prepared statements in your AWS account, you can use the AWS APIs. This post provides a sample script using the AWS SDK for Python (Boto3) to loop through all Regions in your account, and provide the prepared statements per Athena workgroup.

Make sure you have AWS credentials where you plan to run the Python script. For more information, refer to Credentials.

Clone the GitHub repo or copy the Python script list-prepared-statements.py from the repo and run the script:

python3 list-prepared-statements.py

Replace <my-profile-name> with your AWS profile name when it prompts you, or leave empty to use default local credentials.

Enter the AWS CLI profile name or leave blank if using instance profile: <my-profile-name>

The following text is the output of the script. If following along, the response returns only the product_helpful_reviews prepared statement.

eu-north-1:
ap-south-1:
eu-west-3:
eu-west-2:
eu-west-1:
ap-northeast-3:
ap-northeast-2:
ap-northeast-1:
sa-east-1:
ca-central-1:
ap-southeast-1:
ap-southeast-2:
eu-central-1:
us-east-1:
        athena-v2-wg: my_select
        PreparedStatementsWG: get_user
        PreparedStatementsWG: get_contacts_by_company
        PreparedStatementsWG: product_helpful_reviews
        PreparedStatementsWG: count_stars
        PreparedStatementsWG: helpful_reviews
        PreparedStatementsWG: get_product_info
        PreparedStatementsWG: check_avg_stars_of_category
        PreparedStatementsWG: my_select_v1
        PreparedStatementsWG: my_select_v2
us-east-2:
us-west-1:
us-west-2:

Update prepared statements

You have a few options for updating prepared statements. You may want to do this to optimize your query performance, change the values you select, or for several other reasons.

  1. Rerun the PREPARE statement with the changes in the Athena query editor or against the StartQueryExecution API.
  2. Use the UpdatePreparedStatement API via the AWS CLI or SDK.

You can use this API to add a description to your prepared statements or update your queries. To update your query statement via this method, you must provide the statement name, workgroup name, updated query statement, and optionally a new description. For more information about the UpdatePreparedStatement API, refer to update-prepared-statement.

You may want to roll out versions of your query. To maintain backward-compatibility for users, you could create a new prepared statement with a different name. For example, the prepared statement could have a version number in its name (such as my_select_v1 and my_select_v2). When necessary, you could communicate changes to teams who rely on the prepared statement, and later deallocate the old prepared statement versions.

Delete prepared statements

To delete a prepared statement, you can use the following query syntax when against the StartQueryExecution API, or from within the Athena query editor:

DEALLOCATE PREPARE product_helpful_reviews

You could also use the DeletePreparedStatement API or SDK. For example, to delete your prepared statement from AWS CLI, run the following command:

aws athena delete-prepared-statement --statement-name product_helpful_reviews --work-group PreparedStatementsWG --region region

Clean up

If you followed along with this post, you created several components that may incur costs. To avoid future charges, remove the resources with the following steps:

  1. Delete the S3 bucket’s results prefix created after you run a query on your workgroup.

With the default template, it’s named <S3QueryResultsBucketName>/athena-results. Use caution in this step. Unless you are using versioning on your S3 bucket, deleting S3 objects cannot be undone.

  1. Delete the Athena prepared statements in the PreparedStatementsWG

You can follow the steps in the Delete prepared statements section of this post using either the DEALLOCATE PREPARE statement or delete-prepared-statement API for each prepared statement you created.

  1. To remove the CloudFormation stack, select the stack on the AWS CloudFormation console, choose Delete, and confirm.

Conclusion

Athena parameterized queries make it easy to decouple your code base from your queries by providing a way to store common queries within your Athena workgroup. This post provided information about how Athena parameterized queries can improve your code reusability and data lake security. We showed how you can set up a sample data lake and start using parameterized queries today. We also provided an example of the protections parameterized queries offers, and detailed additional administrative functions.

You can get started with Athena prepared statements via the Athena console, the AWS CLI, or the AWS SDK. To learn more about Athena, refer to the Amazon Athena User Guide.

Thanks for reading this post! If you have questions about Athena parameterized queries, don’t hesitate to leave a comment in the comments section.


About the Authors

Blayze Stefaniak is a Senior Solutions Architect at AWS who works with public sector, federal financial, and healthcare organizations. Blayze is based out of Pittsburgh. He is passionate about breaking down complex situations into something practical and actionable. His interests include artificial intelligence, distributed systems, and Excel formula gymnastics. Blayze holds a B.S.B.A. in Accounting and B.S. in Information Systems from Clarion University of Pennsylvania. In his spare time, you can find Blayze listening to Star Wars audiobooks, trying to make his dogs laugh, and probably talking on mute.

Daniel Tatarkin is a Solutions Architect at Amazon Web Services (AWS) supporting Federal Financial organizations. He is passionate about big data analytics and serverless technologies. Outside of work, he enjoys learning about personal finance, coffee, and trying out new programming languages for fun.

Federated access to Amazon Redshift clusters in AWS China Regions with Active Directory Federation Services

Post Syndicated from Clement Yuan original https://aws.amazon.com/blogs/big-data/federated-access-to-amazon-redshift-clusters-in-aws-china-regions-with-active-directory-federation-services/

Many customers already manage user identities through identity providers (IdPs) for single sign-on access. With an IdP such as Active Directory Federation Services (AD FS), you can set up federated access to Amazon Redshift clusters as a mechanism to control permissions for the database objects by business groups. This provides a seamless user experience, and centralizes the governance of authentication and permissions for end-users. For more information, refer to the blog post series “Federate access to your Amazon Redshift cluster with Active Directory Federation Services (AD FS)” (part 1, part 2).

Due to the differences in the implementation of Amazon Web Services in China, customers have to adjust the configurations accordingly. For example, AWS China Regions (Beijing and Ningxia) are in a separate AWS partition, therefore all the Amazon Resource Names (ARNs) include the suffix -cn. AWS China Regions are also hosted at a different domain: www.amazonaws.cn.

This post introduces a step-by-step procedure to set up federated access to Amazon Redshift in AWS China Regions. It pinpoints the key differences you should pay attention to and provides a troubleshooting guide for common errors.

Solution overview

The following diagram illustrates the process of Security Assertion Markup Language 2.0 (SAML)-based federation access to Amazon Redshift in AWS China Regions. The workflow includes the following major steps:

  1. The SQL client provides a user name and password to AD FS.
  2. AD FS authenticates the credential and returns a SAML response if successful.
  3. The SQL client makes an API call to AWS Security Token Service (AWS STS) to assume a preferred role with SAML.
  4. AWS STS authenticates the SAML response based on the mutual trust and returns temporary credentials if successful.
  5. The SQL client communicates with Amazon Redshift to get back a database user with temporary credentials, then uses it to join database groups and connect to the specified database.

The architecture

We organize the walkthrough in the following high-level steps:

  1. Configure an AD FS relying party trust for AWS China Regions and define basic claim rules.
  2. Provision an AWS Identity and Access Management (IAM) identity provider and roles.
  3. Complete the remaining relying party trust’s claim rules based on the IAM resources.
  4. Connect to Amazon Redshift with federated access via a JDBC-based SQL client.

Prerequisites

This post assumes that you have the following prerequisites:

  • Windows Server 2016
  • The ability to create users and groups in AD
  • The ability to configure a relying party trust and define claim rules in AD FS
  • An AWS account
  • Sufficient permissions to provision IAM identity providers, roles, Amazon Virtual Private Cloud (Amazon VPC) related resources, and an Amazon Redshift cluster via AWS Cloud Development Kit (AWS CDK)

Configure an AD FS relying party trust and define claim rules

A relying party trust allows AWS and AD FS to communicate with each other. It is possible to configure two relying party trusts for both AWS China Regions and AWS Regions in the same AD FS at the same time. For AWS China Regions, we need to use a different SAML metadata document at https://signin.amazonaws.cn/static/saml-metadata.xml. The relying party’s identifier for AWS China Regions is urn:amazon:webservices:cn-north-1, whereas that for AWS Global Regions is urn:amazon:webservices. Note down this identifier to use later in this post.

Relying party metadata XML

Add AD groups and users

With SAML-based federation, end-users assume an IAM role and use it to join multiple database (DB) groups. The permissions on such roles and DB groups can be effectively managed by AD groups. We use different prefixes in AD group names to distinguish them, which help map to roles and DB group claim rules. It’s important to distinguish correctly the two types of AD groups because they’re mapped to different AWS resources.

We continue our walkthrough with an example. Suppose in business there are two roles: data scientist and data engineer, and two DB groups: oncology and pharmacy. Data scientists can join both groups, and data engineers can only join the pharmacy group. On the AD side, we define one AD group for each role and group. On the AWS side, we define one IAM role for each role and one Amazon Redshift DB group for each DB group. Suppose Clement is a data scientist and Jimmy is a data engineer, and both are already managed by AD. The following diagram illustrates this relationship.

AD group and user mapping to IAM role and DB group

You may create the AD groups and users with either the AWS Command Line Interface (AWS CLI) or the AWS Management Console. We provide sample commands in the README file in the GitHub repo.

Follow substeps a to o of Step 2 in Setting up JDBC or ODBC Single Sign-on authentication with AD FS to set up the relying party with the correct SAML metadata document for AWS China Regions and define the first three claim rules (NameId, RoleSessionName, and Get AD Groups). We resume after the IAM identity provider and roles are provisioned.

Provision an IAM identity provider and roles

You establish the trust for AD with AWS by provisioning an IAM identity provider. The IAM identity provider and assumed roles should be in one AWS account, otherwise you get the following error message during federated access: “Principal exists outside the account of the Role being assumed.” Follow these steps to provision the resources:

  1. Download the metadata file at https://yourcompany.com/FederationMetadata/2007-06/FederationMetadata.xml from your AD FS server.
  2. Save it locally at /tmp/FederationMetadata.xml.
  3. Check out the AWS CDK code on GitHub.
  4. Use AWS CDK to deploy the stack named redshift-cn:
export AWS_ACCOUNT=YOUR_AWS_ACCOUNT
export AWS_DEFAULT_REGION=cn-north-1
export AWS_PROFILE=YOUR_PROFILE

cdk deploy redshift-cn --require-approval never

The AWS CDK version should be 2.0 or newer. For testing purposes, you may use the AdministratorAccess managed policy for the deployment. For production usage, use a profile with least privilege.

The following table summarizes the resources that the AWS CDK package provisions.

Service Resource Count Notes
Amazon VPC VPC 1 .
Subnet 2 .
Internet gateway 1 .
Route table 1 .
Security group 1 .
IAM SAML Identity provider 1 .
Role 3 1 service role for cluster
2 federated roles
Amazon Redshift Cluster 1 1 node, dc2.large
AWS Secrets Manager Secret 1 .

In this example, the Publicly Accessible setting of the Amazon Redshift cluster is set to Enabled for simplicity. However, in a production environment, you should disable this setting and place the cluster inside a private subnet group. Refer to How can I access a private Amazon Redshift cluster from my local machine for more information.

Configure a security group

Add an inbound rule for your IP address to allow connection to the Amazon Redshift cluster.

  1. Find the security group named RC Default Security Group.
  2. Obtain the pubic IP address of your machine.
  3. Add an inbound rule for this IP address and the default port for Amazon Redshift 5439.

Complete the remaining claim rules

After you provision the IAM identity provider and roles, add a claim rule to define SAML roles. We add a customer claim rule with the name Roles. It finds AD groups with the prefix role_ and replaces it with a combined ARN string. Pay attention to the ARNs of the resources where the partition is aws-cn. Replace AWS_ACCOUNT with your AWS account ID. The following table demonstrates how the selected AD groups are transformed to IAM role ARNs.

Selected AD Group Transformed IAM Role ARN
role_data_scientist arn:aws-cn:iam::AWS_ACCOUNT:role/rc_data_scientist
role_data_engineer arn:aws-cn:iam::AWS_ACCOUNT:role/rc_data_engineer

Relying party claim rule

To add the claim rule, open the AD FS management console in your Windows Server and complete the following steps:

  1. Choose Relying Party Trusts, then choose the relying party for AWS China.
  2. Choose Edit Claim Issuance Policy, then choose Add Role.
  3. On the Claim rule template menu, choose Send Claims Using a Custom Rule.
  4. For Claim rule name, enter Roles.
  5. In the Custom rule section, enter the following:
c:[Type == "http://temp/variable", Value =~ "(?i)^role_"]
=> issue(Type = "https://aws.amazon.com/SAML/Attributes/Role",
Value = RegExReplace(c.Value, "role_",
"arn:aws-cn:iam::AWS_ACCOUNT:saml-provider/rc-provider,arn:aws-cn:iam::AWS_ACCOUNT:role/rc_"));

The optional parameters of DbUser, AutoCreate, and DbGroups can be provided via either JDBC connection parameters or SAML attribute values. The benefit of user federation is to manage users in one place centrally. Therefore, the DbUser value should be automatically provided by the SAML attribute. The AutoCreate parameter should always be true, otherwise you have to create DB users beforehand. Finally, the DbGroups parameter could be provided by SAML attributes provided that such relationship is defined in AD.

To summarize, we recommend to provide at least DbUser and AutoCreate in SAML attributes, such that the end-user can save time by composing shorter connection strings. In our example, we provide all three parameters via SAML attributes.

  1. Add a customer claim rule named DbUser. We use an email address as the value for DbUser:
c:[Type == "http://schemas.microsoft.com/ws/2008/06/identity/claims/windowsaccountname", 
 Issuer == "AD AUTHORITY"]
=> issue(store = "Active Directory",
types = ("https://redshift.amazon.com/SAML/Attributes/DbUser"),
query = ";mail;{0}", param = c.Value);

You can also choose a Security Accounts Manager (SAM) account name, which is usually the user name of the email address. Using an email address plays an important role in IAM role policy setting. We revisit this issue later.

  1. Add the custom claim rule named AutoCreate:
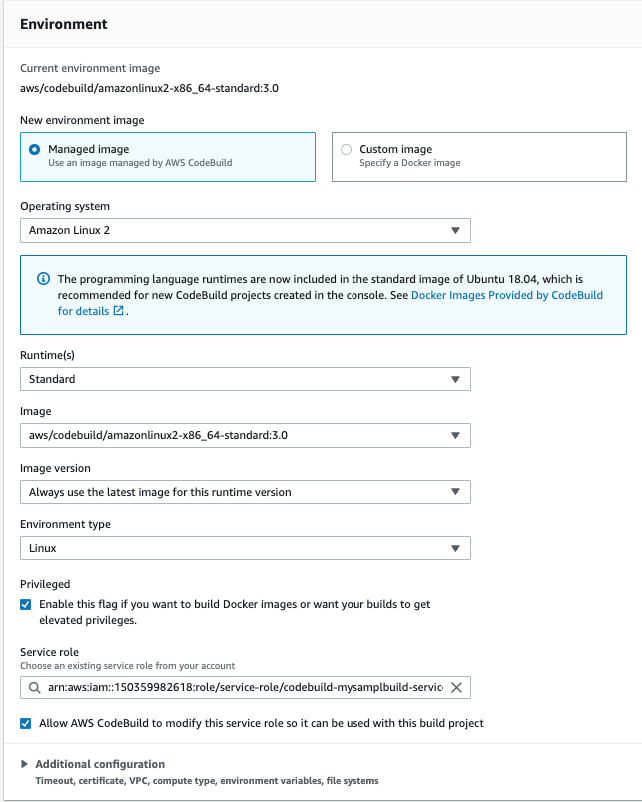
=> issue(type = "https://redshift.amazon.com/SAML/Attributes/AutoCreate", value = "true");
  1. Add a customer claim rule named DbGroups. It finds all AD groups with the prefix group_ and lists them as values for DbGroups:
c:[Type == "http://temp/variable", Value =~ "(?i)^group_"]
=> issue(Type = "https://redshift.amazon.com/SAML/Attributes/DbGroups", Value = c.Value);

You can test the preceding setting is correct by obtaining the SAML response via your browser.

  1. Visit https://yourcompany.com/adfs/ls/IdpInitiatedSignOn.aspx on your Windows Server, log in with user clement, and check that the following SAML attributes exist. For user jimmy, the role is rc_data_engineer and the DB group contains only group_pharmacy.
<AttributeStatement>
    <Attribute Name="https://aws.amazon.com/SAML/Attributes/RoleSessionName">
        <AttributeValue>[email protected]</AttributeValue>
    </Attribute>
    <Attribute Name="https://aws.amazon.com/SAML/Attributes/Role">
        <AttributeValue>arn:aws-cn:iam::AWS_ACCOUNT:saml-provider/rc-provider,arn:aws-cn:iam::AWS_ACCOUNT:role/rc_data_scientist</AttributeValue>
    </Attribute>
    <Attribute Name="https://redshift.amazon.com/SAML/Attributes/DbUser">
        <AttributeValue>[email protected]</AttributeValue>
    </Attribute>
    <Attribute Name="https://redshift.amazon.com/SAML/Attributes/AutoCreate">
        <AttributeValue>true</AttributeValue>
    </Attribute>
    <Attribute Name="https://redshift.amazon.com/SAML/Attributes/DbGroups">
        <AttributeValue>group_pharmacy</AttributeValue>
        <AttributeValue>group_oncology</AttributeValue>
    </Attribute>
</AttributeStatement>

The preceding SAML attribute names are verified valid for AWS China Regions. The URLs end with amazon.com. It’s incorrect to change them to amazonaws.cn or amazon.cn.

Connect to Amazon Redshift with a SQL client

We use JDBC-based SQL Workbench/J (SQL client) to connect to the Amazon Redshift cluster. Amazon Redshift uses a DB group to collect DB users. The database privileges are managed collectively at group level. In this post, we don’t dive deep into privilege management. However, you need to create the preceding two DB groups.

  1. Connect to the provisioned cluster and create the groups. You can connect on the AWS Management Console via the query editor with temporary credentials, or via a SQL client with database user admin and password. The password is stored in AWS Secrets Manager. You may need proper permissions for the above operations.
create group group_oncology;
create group group_pharmacy;
  1. Follow the instructions in Connect to your cluster by using SQL Workbench/J to download and install the SQL client and the Amazon Redshift JDBC driver.

We recommend the JDBC driver version 2.1 with AWS SDK driver-dependent libraries.

  1. Test that the cluster is connectable via its endpoint. The primary user name is admin. You retrieve the secret value of the cluster’s password via Secrets Manager. Specify DSILogLevel and LogPath to collect driver logs and help diagnosis. The connection string looks like the following code. Replace CLUSTER_ENDPOINT with the correct value and delete all line breakers. We split the line for readability.
jdbc:redshift://CLUSTER_ENDPOINT.cn-north-1.redshift.amazonaws.com.cn:5439/main
;ssl_insecure=true
;DSILogLevel=3
;LogPath=/tmp

For AWS China Regions, one extra JDBC driver option loginToRp must be set as you set up a separate relying party trust for the AWS China Regions. If an AD user is mapped to more than one AWS role, in the connection string, use preferred_role to specify the exact role to assume for federated access.

  1. Copy the role ARN directly and pay attention to the aws-cn partition.

If the user is mapped to only one role, this option can be omitted.

  1. Replace CLUSTER_ID with the correct cluster identifier. For the user name, enter yourcompany\clement; for the password, enter the credential from AD:
jdbc:redshift:iam://CLUSTER_ID:cn-north-1/main
;ssl_insecure=true
;DSILogLevel=3
;LogPath=/tmp
;loginToRp=urn:amazon:webservices:cn-north-1
;plugin_name=com.amazon.redshift.plugin.AdfsCredentialsProvider
;idp_host=adfsserver.yourcompany.com
;preferred_role=arn:aws-cn:iam::AWS_ACCOUNT:role/rc_data_scientist
  1. When you’re connected, run the SQL statement as shown in the following screenshot.

The user prefixed with IAMA indicates that the user connected with federated access and was auto-created.

SQL Workbench to query users

  1. As an optional step, in the connection string, you can set the DbUser, AutoCreate, and DbGroups parameters.

Parameters from the connection string are before those from SAML attributes. We recommend you set at least DbUser and AutoCreate via SAML attributes. If it’s difficult to manage DB groups in AD users or you want flexibility, specify DbGroups in the connection string. See the following code:

jdbc:redshift:iam://CLUSTER_ID:cn-north-1/main
;ssl_insecure=true
;DSILogLevel=3
;LogPath=/tmp
;loginToRp=urn:amazon:webservices:cn-north-1
;plugin_name=com.amazon.redshift.plugin.AdfsCredentialsProvider
;idp_host=adfsserver.yourcompany.com
;preferred_role=arn:aws-cn:iam::AWS_ACCOUNT:role/rc_data_scientist
;[email protected]
;AutoCreate=true
;DbGroups=group_oncology

Use an email or SAM account name as DB user

The role policy follows the example policy for using GetClusterCredentials. It further allows redshift:DescribeClusters on the cluster because the role queries the cluster endpoint and port based on its identifier and Region. To make sure that the DB user is the same as the AD user, in this post, we use the following condition to check, where ROLE_ID is the unique identifier of the role:

{"StringEqualsIgnoreCase": {"aws:userid": "ROLD_ID:${redshift:DbUser}"}}

The example policy uses the following condition:

{"StringEqualsIgnoreCase": {"aws:userid": "ROLD_ID:${redshift:DbUser}@yourcompany.com"}}

The difference is apparent. The aws:userid contains the RoleSessionName, which is the email address. The SAM account name is the string before @ in the email address. Because the connection string parameter is before the SAML attribute parameter, we summarize the possible cases as follows:

  • If SAML attributes contain DbUser:
    • If the condition value contains a domain suffix:
      • If the DbUser SAML attribute value is an email address, DbUser must be in the connection string without the domain suffix.
      • If the DbUser SAML attribute value is a SAM account name, DbUser can be omitted in the connection string. Otherwise, the value must not contain a domain suffix.
    • If the condition value doesn’t contain a domain suffix:
      • If the DbUser SAML attribute value is an email address, DbUser can be omitted in the connection string. Otherwise, the value must contain a domain suffix.
      • If the DbUser SAML attribute value is a SAM account name, DbUser must be in the connection string with a domain suffix.
  • If SAML attributes don’t contain DbUser:
    • If the condition value contains a domain suffix, DbUser must be in the connection string without a domain suffix.
    • If the condition value doesn’t contain a domain suffix, DbUser can be omitted in the connection string, because RoleSessionName value which is the email address acts as DbUser. Otherwise, the value must contain a domain suffix.

IAM policy condition judgment workflow

Troubleshooting

Federated access to Amazon Redshift is a non-trivial process. However, it consists of smaller steps that we can divide and conquer when problems occur. Refer to the access diagram in the solution overview. We can split the process into three phrases:

  1. Is SAML-based federation successful? Verify this by visiting the single sign-on page of AD FS and make sure you can sign in to the console with the federated role. Do you configure the relying party with the AWS China specific metadata document? Obtain the SAML response and check if the destination is https://signin.amazonaws.cn/saml. Are the SAML provider ARN and IAM role ARNs correct? Check if the role’s trust relationship contains the correct value for SAML:aud. For other possible checkpoints, refer to Troubleshooting SAML 2.0 federation with AWS.
  2. Are the role policies correct? If SAML-based federation is successful, check the role policies are correct. Compare yours with those provided by this post. Did you use aws where aws-cn should be used? If the policy condition contains a domain suffix, is it the correct domain suffix? You can obtain the domain suffix in use if you get the error that the assumed role isn’t authorized to perform an action.
  3. Is the SQL client connecting successfully? Is the cluster identifier correct? Make sure that your connection string contains the loginToRp option and points to the AWS China relying party. If multiple IAM roles are mapped, make sure preferred_role is one of them with the correct role ARN. You can get the list of roles in the SAML response. Try to set ssl_insecure to true temporarily for debugging. Check the previous subsection and make sure the DbUser is properly used or set according to the DbUser SAML attribute and condition value for aws:user. Turn on the driver logs and get debug hints there. Sometimes you may need to restart the SQL client to clear the cache and retry.

Security concerns

In a production environment, we suggest applying the following security settings, which aren’t used in this post.

For the Amazon Redshift cluster, complete the following:

  • Disable the publicly accessible option and place the cluster inside a private or isolated subnet group
  • Encrypt the cluster, for example, with a customer managed AWS Key Management Service (AWS KMS) key
  • Enable enhanced VPC routing such that the network doesn’t leave your VPC
  • Configure the cluster to require Secure Sockets Layer (SSL) and use one-way SSL authentication

For the IAM federated roles:

  • Specify the exact DB groups for action redshift:JoinGroup. If you want to use a wildcard, make sure it doesn’t permit unwanted DB groups.
  • Check StringEquals for aws:user against the role ID along with the Amazon Redshift DB user. This condition can be checked for GetClusterCredentials, CreateClusterUser, and JoinGroup actions. Refer to the sample code for detailed codes.

In Amazon Redshift, the DB group is used to manage privileges for a collection of DB users. A DB user joins some DB groups during a login session and is granted the privileges associated to the groups. As we discussed before, you can use either the SAML attribute value or the connection property to specify the DB groups. The Amazon Redshift driver prefers the value from the connection string to that from the SAML attribute. As a result, the end-user can override the DB groups in the connection string. Therefore, to confine the privileges a DB user can be granted, the IAM role policy must restrict which DB groups the DB user is allowed to join safely, otherwise there might be a security risk. The following policy snippet shows such a risk. Always follow the least privilege principle when defining permission policies.

{
    "Effect": "Allow",
    "Action": "redshift:JoinGroup",
    "Resource": "*"
}

Clean up

Run the following command to destroy the resources and stop incurring charges:

cdk destroy redshift-cn --force

Remove the users and groups created in the AD FS. Finally, remove the relying party trust for AWS China Regions in your AD FS if you don’t need it anymore.

Conclusion

In this post, we walked you through how to connect to Amazon Redshift in China with federated access based on AD FS. AWS China Regions are in a partition different from other AWS Regions, so you must pay special attention during the configuration. In summary, you need to check AWS resources ARNs with the aws-cn partition, SAML-based federation with the AWS China specific metadata document, and an Amazon Redshift JDBC driver with extra connecting options. This post also discusses different usage scenarios for the redshift:Dbuser parameter and provides common troubleshooting suggestions.

For more information, refer to the Amazon Redshift Cluster Management Guide. Find the code used for this post in the following GitHub repository.


About the Authors


Clement YuanWenjun Yuan
is a Cloud Infra Architect in AWS Professional Services based in Chengdu, China. He works with various customers, from startups to international enterprises, helping them build and implement solutions with state-of-the-art cloud technologies and achieve more in their cloud explorations. He enjoys reading poetry and traveling around the world in his spare time.

Khoa NguyễnKhoa Nguyen is a Big Data Architect in AWS Professional Services. He works with large enterprise customers and AWS partners to accelerate customers’ business outcomes by providing expertise in Big Data and AWS services.

Yewei Li is a Data Architect in AWS Professional Services based in Shanghai, China. He works with various enterprise customers to design and build data warehousing and data lake solutions on AWS. In his spare time, he loves reading and doing sports.

How to re-platform and modernize Java web applications on AWS

Post Syndicated from Rick Armstrong original https://aws.amazon.com/blogs/compute/re-platform-java-web-applications-on-aws/

This post is written by: Bill Chan, Enterprise Solutions Architect

According to a report from Grand View Research, “the global application server market size was valued at USD 15.84 billion in 2020 and is expected to expand at a compound annual growth rate (CAGR) of 13.2% from 2021 to 2028.” The report also suggests that Java based application servers “accounted for the largest share of around 50% in 2020.” This means that many organizations continue to rely on Java application server capabilities to deliver middleware services that underpin the web applications running their transactional, content management and business process workloads.

The maturity of the application server technology also means that many of these web applications were built on traditional three-tier web architectures running in on-premises data centers. And as organizations embark on their journey to cloud, the question arises as to what is the best approach to migrate these applications?

There are seven common migration strategies when moving applications to the cloud, including:

  • Retain – keeping applications running as is and revisiting the migration at a later stage
  • Retire – decommissioning applications that are no longer required
  • Repurchase – switching from existing applications to a software-as-a-service (SaaS) solution
  • Rehost – moving applications as is (lift and shift), without making any changes to take advantage of cloud capabilities
  • Relocate – moving applications as is, but at a hypervisor level
  • Replatform – moving applications as is, but introduce capabilities that take advantage of cloud-native features
  • Refactor – re-architect the application to take full advantage of cloud-native features

Refer to Migrating to AWS: Best Practices & Strategies and the 6 Strategies for Migrating Applications to the Cloud for more details.

This blog focuses on the ‘replatform’ strategy, which suits customers who have large investments in application server technologies and the business case for re-architecting doesn’t stack up. By re-platforming their applications into the cloud, customers can benefit from the flexibility of a ‘pay-as-you-go’ model, dynamically scale to meet demand and provision infrastructure as code. Additionally, customers can increase the speed and agility to modernize existing applications and build new cloud-native applications to deliver better customer experiences.

In this post, we walk through the steps to replatform a simple contact management Java application running on an open-source Tomcat application server, along with modernization aspects that include:

  • Deploying a Tomcat web application with automatic scaling capabilities
  • Integrating Tomcat with Redis cache (using Redisson Session Manager for Tomcat)
  • Integrating Tomcat with Amazon Cognito for authentication (using Boyle Software’s OpenID Connect Authenticator for Tomcat)
  • Delegating user log in and sign up to Amazon Cognito

Overview of solution

Solution architecture overview diagram

The solution is comprised of the following components:

  • A VPC across two Availability Zones
  • Two public subnets, two private app subnets, and two private DB subnets
  • An Internet Gateway attached to the VPC
    • A public route table routing internet traffic to the Internet Gateway
    • Two private route tables routing traffic internally within the VPC
  • A frontend web server application Elastic Load Balancing that routes traffic to the Apache Web Servers
  • An Auto Scaling group that launches additional Apache Web Servers based on defined scaling policies. Each instance of the web server is based on a launch template, which defines the same configuration for each new web server.
  • A hosted zone in Amazon Route 53 with a domain name that routes to the frontend web server Elastic Load Balancing
  • An application Elastic Load Balancing that routes traffic to the Tomcat application servers
  • An Auto Scaling group that launches additional Tomcat Application Servers based on defined scaling policies. Each instance of the Tomcat application server is based on a launch template, which defines the same configuration and software components for each new application server
  • A Redis cache cluster with a primary and replica node to store session data after the user has authenticated, making your application servers stateless
  • A Redis open-source Java client, with a Tomcat Session Manager implementation to store authenticated user session data in Redis cache
  • A MySQL Amazon Relational Database Service (Amazon RDS) Multi-AZ deployment for MySQL RDS to store the contact management and role access tables
  • An Amazon Simple Storage Service (Amazon S3) bucket to store the application and framework artifacts, images, scripts and configuration files that are referenced by any new Tomcat application server instances provisioned by automatic scaling
  • Amazon Cognito with a sign-up Lambda function to register users and insert a corresponding entry in the user account tables. Cognito acts as an identity provider and performs the user authentication using an OpenID Connect Authenticator Java component

Walkthrough

The following steps overviews how to deploy the blog solution:

  • Clone and build the Sample Web Application and AWS Signup Lambda Maven projects from GitHub repository
  • Deploy the CloudFormation template (java-webapp-infra.yaml) to create the AWS networking infrastructure and the CloudFormation template (java-webapp-rds.yaml) to create the database instance
  • Update and build the sample web application and signup Lambda function
  • Upload the packages into your S3 bucket
  • Deploy the CloudFormation template (java-webapp-components.yaml) to create the blog solution components
  • Update the solution configuration files and upload them into your S3 bucket
  • Run a script to provision the underlying database tables
  • Validate the web application, session cache and automatic scaling functionality
  • Clean up resources

Prerequisites

For this walkthrough, you should have the following prerequisites:

  • An AWS account
  • An Amazon Elastic Compute Cloud (Amazon EC2) key pair (required for authentication). For more details, see Amazon EC2 key pairs
  • A Java Integrated Development Environment (IDE) such as Eclipse or NetBeans. AWS also offers a cloud-based IDE that lets you write, run and debug code in your browser without having to install files or configure your development machine, called AWS Cloud9. I will show how AWS Cloud9 can be used as part of a DevOps solution in a subsequent post
  • A valid domain name and SSL certificate for the deployed web application. To validate the OAuth 2.0 integration, Cognito requires the URL that the user is redirected to after successful sign-in to be HTTPS. Refer to a configuring a user pool app client for more details
  • Downloaded the following JARs:

Note: the solution was validated in the preceding versions and therefore, the launch template created for the CloudFormation solution stack refers to these specific JARs. If you decide to use different versions, then the ‘java-webapp-components.yaml’ will need to be updated to reflect the new versions. Alternatively, you can externalize the parameters in the template.

Clone the GitHub repository to your local machine

This repository contains the sample code for the Java web application and post confirmation sign-up Lambda function. It also contains the CloudFormation templates required to set up the AWS infrastructure, SQL script to create the supporting database and configuration files for the web server, Tomcat application server and Redis cache.

Deploy infrastructure CloudFormation template

  1. Log in to the AWS Management Console and open the CloudFormation service.

Diagram showing the first step in creating a CloudFormation stack.

2. Create the infrastructure stack using the java-webapp-infra.yaml template (located in the ‘config’ directory of the repo).

3. Infrastructure stack outputs:

Diagram showing the outputs generated from the infrastructure stack creation

Deploy database CloudFormation template

  1.  Log in to the AWS Management Console and open the CloudFormation service.
  2. Create the infrastructure stack using the java-webapp-rds.yaml template (located in the ‘config’ directory of the repo).
  3. Database stack outputs.

Diagram showing the outputs generated from the relational database service stack creation

Update and build sample web application and signup Lambda function

  1. Import the ‘sample-webapp’ and ‘aws-signup-lambda’ Maven projects from the repository into your IDE.
  2. Update the sample-webapp’s UserDAO class to reflect the RDSEndpoint, DBUserName, and DBPassword from the previous step:”
    // Externalize and update jdbcURL, jdbcUsername, jdbcPassword parameters specific to your environment
    	private String jdbcURL = "jdbc:mysql://<RDSEndpoint>:3306/webappdb?useSSL=false";
    	private String jdbcUsername = "<DBUserName>";
    	private String jdbcPassword = "<DBPassword>";

  3. To build the ‘sample-webapp’ Maven project, use the standard ‘clean install’ goals.
  4. Update the aws-signup-lambda’s signupHandler class to reflect RDSEndpoint, DBUserName, and DBPassword from the solution stack:
    // Update with your database connection details
    		String jdbcURL = "jdbc:mysql://<RDSEndpoint>:3306/webappdb?useSSL=false";
    		String jdbcUsername = "<DBUserName>";
    		String jdbcPassword = "<DBPassword>";

  5. To build the aws-signup-lambda Maven project, use the ‘package shade:shade’ goals to include all dependencies in the package.
  6. Two packages are created in their respective target directory: ‘sample-webapp.war’ and ‘create-user-lambda-1.0.jar’

Upload the packages into your S3 bucket

  1. Log in to the AWS Management Console and open the S3 service.
  2. Select the bucket created by the infrastructure CloudFormation template in an earlier step.

Diagram showing the S3 bucket interface with no objects.

3.  Create a ‘config’ and ‘lib’ folder in the bucket.

Diagram showing the S3 bucket interface with the new folders.

4.  Upload the ‘sample-webapp.war’ and ‘create-user-lambda-1.0.jar’ created an earlier step (along with the downloaded packages from the pre-requisites section) into the ‘lib’ folder of the bucket. The ‘lib’ folder should look like this:

Diagram showing the S3 bucket interface and objects in the lib folder

Note: the solution was validated in the preceding versions and therefore, the launch template created for the CloudFormation solution stack refers to these specific package names.

Deploy the solution components CloudFormation template

1.       Log in to the AWS Management Console and open the CloudFormation service (if you aren’t already logged in from the previous step).

2.       Create the web application solution stack using the ‘java-webapp-components.yaml’ template (located in the ‘config’ directory of the repo).

3.       Guidance on the different template input parameters:

a.       BastionSGSource – default is 0.0.0.0/0, but it is recommended to restrict this to your allowed IPv4 CIDR range for additional security

b.       BucketName – the bucket name created as part of the infrastructure stack. This blog uses the bucket name is ‘chanbi-java-webapp-bucket’

c.       CallbackURL – the URL that the user is redirected to after successful sign up/sign in is composed of your domain name (blog.example.com), the application root (sample-webapp), and the authentication form action ‘j_security_check’. As noted earlier, this needs to be over HTTPS

d.       CreateUserLambdaKey – the S3 object key for the signup Lambda package. This blog uses the key ‘lib/create-user-lambda-1.0.jar’

e.       DBUserName – the database user name for the MySQL RDS. Make note of this as it will be required in a subsequent step

f.        DBUserPassword – the database user password. Make note of this as it will be required in a subsequent step

g.       KeyPairName – the key pair to use when provisioning the EC2 instances. This key pair was created in the pre-requisite step

h.       WebALBSGSource – the IPv4 CIDR range allowed to access the web app. Default is 0.0.0.0/0

i.         The remaining parameters are import names from the infrastructure stack. Use default settings

4.       After successful stack creation, you should see the following java web application solution stack output:

 Diagram showing the outputs generated from the solution components stack creation.

Update configuration files

  1. The GitHub repository’s ‘config’ folder contains the configuration files for the web server, Tomcat application server and Redis cache, which needs to be updated to reflect the parameters specific to your stack output in the previous step.
  2. Update the virtual hosts in ‘httpd.conf’ to proxy web traffic to the internal app load balancer. Use the value defined by the key ‘AppALBLoadBalancerDNS’ from the stack output.
    <VirtualHost *:80>
    ProxyPass / http://<AppALBLoadBalancerDNS>:8080/
    ProxyPassReverse / http://<AppALBLoadBalancerDNS>:8080/
    </VirtualHost>

  3. Update JDBC resource for the ‘webappdb’ in the ‘context.xml, with the values defined by the RDSEndpoint, DBUserName, and DBPassword from the solution components CloudFormation stack:
    <Resource name="jdbc/webappdb" auth="Container" type="javax.sql.DataSource"
                   maxTotal="100" maxIdle="30" maxWaitMillis="10000"
                   username="<DBUserName>" password="<DBPassword>" driverClassName="com.mysql.jdbc.Driver"
                   url="jdbc:mysql://<RDSEndpoint>:3306/webappdb"/>

  4. Log in to the AWS Management Console and open the Amazon Cognito service. Select ‘Manage User Pools’ and you will notice that a ‘java-webapp-pool’ has been created by the solution components CloudFormation stack. Select the ‘java-webapp-pool’ and make note of the ‘Pool Id’, ‘App client id’ and ‘App client secret’.

Diagram showing the Cognito User Pool interface general settings

Diagram showing the Cognito User Pool interface app client settings

5.  Update ‘Valve’ configuration in the ‘context.xml’, with the ‘Pool Id’, ‘App client id’ and ‘App client secret’ values from the previous step. The Cognito IDP endpoint specific to your Region can be found here. The host base URI needs to be replaced with the domain for your web application.

    <Valve className="org.bsworks.catalina.authenticator.oidc.tomcat90.OpenIDConnectAuthenticator"
       providers="[
           {
               name: 'Amazon Cognito',
               issuer: https://<cognito-idp-endpoint-for-you-region>/<cognito-pool-id>,
               clientId: <user-pool-app-client-id>,
               clientSecret: <user-pool-app-client-secret>
           }
       ]"
        hostBaseURI="https://<your-sample-webapp-domain>" usernameClaim="email" />

6.  Update the ‘address’ parameter in ‘redisson.yaml’ with Redis cluster endpoint. Use the value defined by the key ‘RedisClusterEndpoint’ from the solution components CloudFormation stack output.

singleServerConfig:
    address: "redis://<RedisClusterEndpoint>:6379"

7.  No updates are required to the following files:

a.  server.xml – defines a data source realm for the user names, passwords, and roles assigned to users

      <Realm className="org.apache.catalina.realm.DataSourceRealm"
   dataSourceName="jdbc/webappdb" localDataSource="true"
   userTable="user_accounts" userNameCol="user_name" userCredCol="user_pass"
   userRoleTable="user_account_roles" roleNameCol="role_name" debug="9" />
      </Realm>

b.  tomcat.service – allows Tomcat to run as a service

c.  uninstall-sample-webapp.sh – removes the sample web application

Upload configuration files into your S3 bucket

  1. Upload the configuration files from the previous step into the ‘config’ folder of the bucket. The ‘config’ folder should look like this:

Diagram showing the S3 bucket interface and objects in the config folder

Update the Auto Scaling groups

  1. Auto Scaling groups manage the provisioning and removal of the web and application instances in our solution. To start an instance of the web server, update the Auto Scaling group’s desired capacity (1), minimum capacity (1) and maximum capacity (2) as shown in the following image:

Diagram showing the web server auto scaling group interface and group details.

2.  To start an instance of the application server, update the Auto Scaling group’s desired capacity (1), minimum capacity (1) and maximum capacity (2) for as shown in the following image:

Diagram showing the web server auto scaling group interface and group details.

The web and application scaling groups will show a status of “Updating capacity” (as shown in the following image) as the instances start up.

Diagram showing the auto scaling groups interface and updating capacity status.

After web and application servers have started, an instance will appear under ‘Instance management’ with a ‘Healthy’ status for each Auto Scaling group (as shown in the following image).

Diagram showing the web server auto scaling group interface and instance status

Diagram showing the application server auto scaling group interface and instance status

Run the database script webappdb_create_tables.sql

  1. The database script creates the database and underlying tables required by the web application. As the database server resides in the DB private subnet and is only accessible from the application server instance, we need to first connect (via SSH) to the bastion host (using public IPv4 DNS), and from there we can connect (via SSH) to the application server instance (using its private IPv4 address). This will in turn allow us to connect to the database instance and run the database script. Refer to connecting to your Linux instance using SSH for more details. Instance details are located under the ‘Instances’ view (as shown in the following image).

Diagram showing the instances interface and the running instances for the VPC

2.  Transfer the database script webappdb_create_tables.sql to the application server instance via the Bastion Host. Refer to transferring files using a client for details.

3.  Once connected to the application server via SSH, execute the command to connect to the database instance:

mysql -h <RDSEndpoint> -P 3306 -u <DBUserName> -p

4. Enter the DB user password used when creating the database instance. You will be presented with the MySQL prompt after successful login:

Welcome to the MariaDB monitor.  Commands end with ; or \g.
Your MySQL connection id is 300
Server version: 8.0.23 Source distribution

Copyright (c) 2000, 2018, Oracle, MariaDB Corporation Ab and others.

Type 'help;' or '\h' for help. Type '\c' to clear the current input statement.

MySQL [(none)]>

5. Run the command to run the database script webappdb_create_tables.sql:

source /home/ec2-user/webappdb_create_tables.sql

Add an HTTPS listener to the external web load balancer

  1. Log in to the AWS Management Console and select Load Balancers as part of the EC2 service
    Diagram showing the load balancer interface
  2. Add a HTTPS listener on port 443 for the web load balancer. The default action for the listener is to forward traffic to the web instance target group. Refer to create an HTTPS listener for your Application Load Balancer for more details.
    Diagram showing the load balancer add listener interface

Reference the SSL certificate for your domain. In the following example, I have used a certificate from AWS Certificate Manager (ACM) for my domain. You also have the option of using a certificate from Identity Access Management or importing your own certificate.

Diagram showing the secure listener settings interface

Update your DNS to route traffic from the external web load balancer

  1. In this example, I use Amazon Route 53 as the Domain Name Server (DNS) service, but the steps will be similar when using your own DNS service.
  2. Create an A record type that routes traffic from your domain name to the external web load balancer. For more details, refer to creating records by using the Amazon Route 53 console.
    Diagram showing the hosted zone interface

Validate the web application

  1. In your browser, access the following https://<yourdomain.example.com>/sample-webapp
    Diagram showing the log in page for the sample web application.
  2. Select “Amazon Cognito” to authenticate using Cognito as the Identity Provider (IdP). You will be redirected to the login page for your Cognito domain.
    Diagram showing the sign in page provided by Amazon Cognito
  3. Select the “Sign up” to create a new user and enter your email and password. Note the password strength requirements that can be configured as part of the user pool’s policies.
    Diagram showing the sign up page provided by Amazon Cognito
  4. An email with the verification code will be sent to the sign-up email address. Enter the code on the verification code screen.
    Diagram showing the account confirmation page with verification code provided by Amazon Cognito
  5. After successful confirmation, you will be re-directed to the authenticated landing page for the web application.
    Diagram showing the main page with the list of contacts for the sample web application.
  6. The simple web application allows you to add, edit, and delete contacts as shown in the following image.
    Diagram showing the list of contacts for the sample web application with edit and delete functionality.

Validate the session data on Redis

  1. Follow the steps outlined in connecting to nodes for details on connecting to your Redis cache cluster. You will need to connect to your application server instance (via the bastion host) to perform this as the Redis cache is only accessible from the private subnet.
  2. After successfully installing the Redis client, search for your authenticated user session key in the cluster by running the command (from within the ‘redis-stable’ directory):
    src/redis-cli -c -h <RedisClusterEndpoint> -p 6379 -–bigkeys

  3. You should see an output with your Tomcat authenticated session (if you can’t, perform another login via the Cognito login screen):
    # Scanning the entire keyspace to find biggest keys as well as
    # average sizes per key type.  You can use -i 0.1 to sleep 0.1 sec
    # per 100 SCAN commands (not usually needed).
    
    [00.00%] Biggest hash   found so far '"redisson:tomcat_session:AE647D93F2BECEFEE07B5B42C435E3DE"' with 8 fields

  4. Connect to the cache cluster:
    # src/redis-cli -c -h <RedisClusterEndpoint> -p 6379

  5. Run the HGETALL command to get the session details:
    java-webapp-redis-cluster.<xxxxxx>.0001.apse2.cache.amazonaws.com:6379> HGETALL "redisson:tomcat_session:AE647D93F2BECEFEE07B5B42C435E3DE"
     1) "session:creationTime"
     2) "\x04L\x00\x00\x01}\x16\x92\x1bX"
     3) "session:lastAccessedTime"
     4) "\x04L\x00\x00\x01}\x16\x92%\x9c"
     5) "session:principal"
     6) "\x04\x04\t>@org.apache.catalina.realm.GenericPrincipal$SerializablePrincipal\x00\x00\x00\x00\x00\x00\x00\x01\x00\x00\x00\x04>\x04name\x16\x00>\bpassword\x16\x00>\tprincipal\x16\x00>\x05roles\x16\x00\x16>\[email protected]>\[email protected]\x01B\x01\x14>\bstandard"
     7) "session:maxInactiveInterval"
     8) "\x04K\x00\x00\a\b"
     9) "session:isValid"
    10) "\x04P"
    11) "session:authtype"
    12) "\x04>\x04FORM"
    13) "session:isNew"
    14) "\x04Q"
    15) "session:thisAccessedTime"
    16) "\x04L\x00\x00\x01}\x16\x92%\x9c"

Scale your web and application server instances

  1. Amazon EC2 Auto Scaling provides several ways for you to scale instances in your Auto Scaling group such as scaling manually as we did in an earlier step. But you also have the option to scale dynamically to meet changes in demand (such as maintaining CPU Utilization at 50%), predictively scale in advance of daily and weekly patterns in traffic flows, or scale based on a scheduled time. Refer to scaling the size of your Auto Scaling group for more details.
    Diagram showing the auto scaling groups interface and scaling policies
  2. We will create a scheduled action to provision another application server instance.
    Diagram showing the auto scaling group's create schedule action interface.
  3. As per our scheduled action, at 11.30 am, an additional application server instance is started.
    Diagram showing the activity history for the instance.
  4. Under instance management, you will see an additional instance in ‘Pending’ state as it starts.
    Diagram showing the auto scaling groups interface and additional instances.
  5. To test the stateless nature of your application, you can manually stop the original application server instance and observe that your end-user experience is unaffected i.e. you are not prompted to re-authenticate and can continue using the application as your session data is stored in Redis ElastiCache and not tied to the original instance.

Cleaning up

To avoid incurring future charges, remove the resources by deleting the java-webapp-components, java-webapp-rds and java-webapp-infra CloudFormation stacks.

Conclusion

Customers with significant investments in Java application server technologies have options to migrate to the cloud without requiring a complete re-architecture of their applications. In this blog, we’ve shown an approach to modernizing Java applications running on Tomcat Application Server in AWS. And in doing so, take advantage of cloud-native features such as automatic scaling, provisioning infrastructure as code, and leveraging managed services (such as ElastiCache for Redis and Amazon RDS) to make our application stateless. We also demonstrated modernization features such as authentication and user provisioning via an external IdP (Amazon Cognito). For more information on different re-platforming patterns refer to the AWS Prescriptive Guidance on Migration.