This post is written by Luca Mezzalira, Principal Specialist Solutions Architect, Serverless.
The previous blog post describes the architecture for creating a server-side rendering micro-frontend in AWS. This and subsequent posts explain the different parts that compose this architecture in detail. The code for the example is available on a AWS Samples GitHub repository.
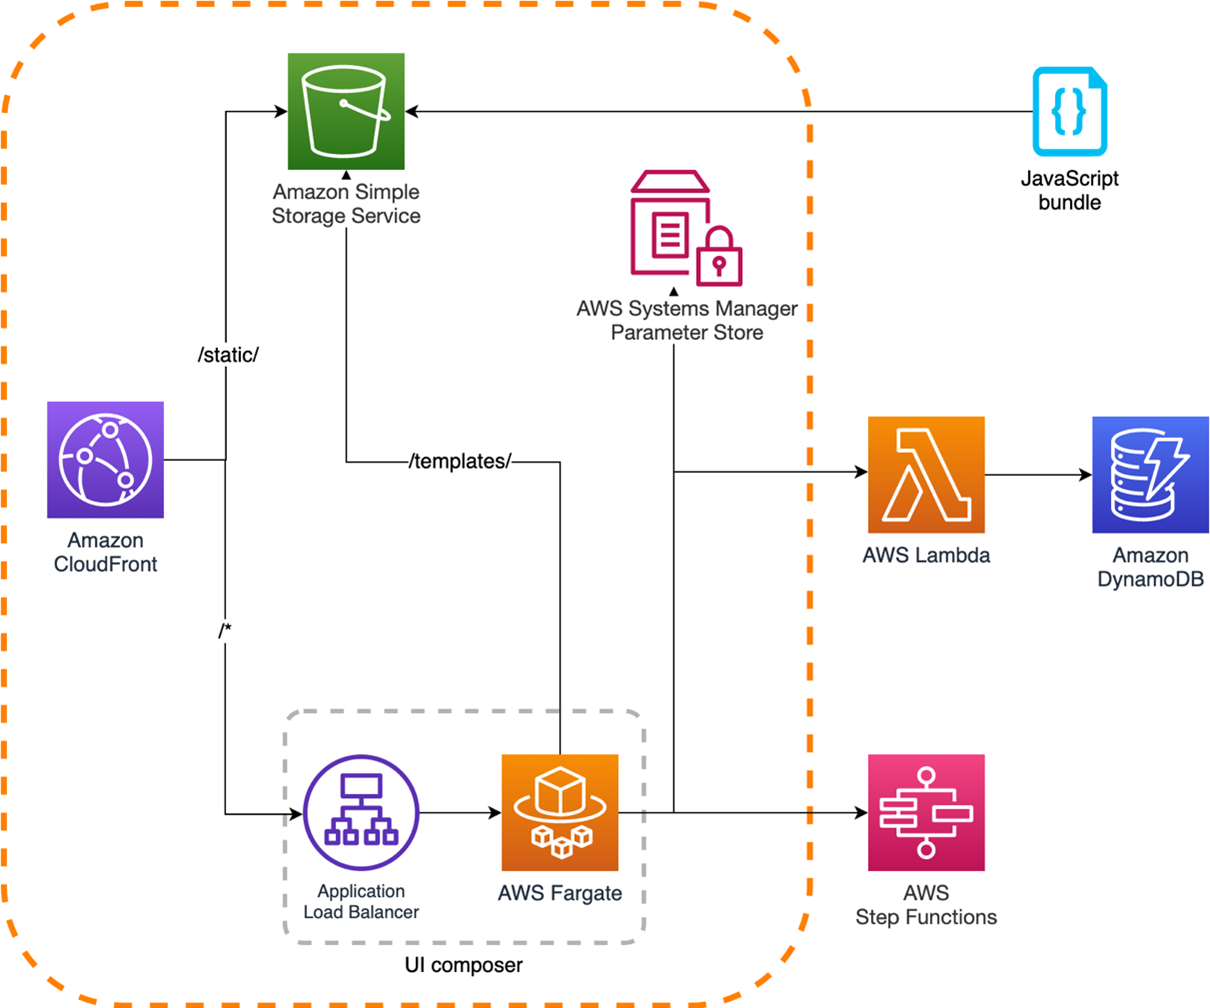
For context, this post covers the infrastructure related to the UI composer, and why you need an Amazon S3 bucket for storing static assets:
The rest of the series explores the micro-frontends composition, how to design micro-frontends using serverless services, different caching and performance optimization strategies, and the organization structure implications associated with frontend distributed systems.
A user’s request journey
The best way to navigate through this distributed system is by simulating a user request that touches all the parts implemented in the architecture.
The application example shows a product details page of a hypothetical ecommerce platform:
When a user selects an article from the catalog page, the DNS resolves the URL to an Amazon CloudFront distribution that is the reference CDN for this project.
The request is immediately fulfilled if the page is cached. Therefore, no additional logic is requested by the cloud infrastructure and the response is fast (less than the 500 ms shown in this example).
When the page is not available in the CloudFront points of presence (PoPs), the request is forwarded to the Application Load Balancer (ALB). It arrives at the AWS Fargate cluster where the UI Composer generates the page for fulfilling the request.
Using CloudFront in the architecture
CDNs are known for accelerating application delivery thanks to caching static files from nearby PoPs. CloudFront can also accelerate uncacheable content such as dynamic APIs or personalized content.
With a network of over 450 points of presence, CloudFront terminates user TCP/TLS connections within 20-30 milliseconds on average. Traffic to origin servers is carried over the AWS global network instead of the public internet. This infrastructure is a purpose-built, highly available, and low-latency private infrastructure built on a global, fully redundant, metro fiber network that is linked via terrestrial and trans-oceanic cables across the world. In addition to terminating connections close to users, CloudFront accelerates dynamic content thanks to modern internet protocols such as QUIC and TLS1.3, and persisting TCP connections to the origin servers.
CloudFront also has security benefits, offering protection in AWS against infrastructure DDoS attacks. It integrates with AWS Web Application Firewall and AWS Shield Advanced, giving you controls to block application-level DDoS attacks. CloudFront also offers native security controls such as HTTP to HTTPS redirections, CORS management, geo-blocking, tokenization, and managing security response headers.
UI Composer application logic
When the request is not fulfilled by the CloudFront cache, it is routed to the Fargate cluster. Here, multiple tasks compute and serve the page requested.
This example uses Fastify, a fast Node.js framework that is gaining popularity among the Node.js community. When the web server initializes, it loads external parameters and the template for composing a page.
To maintain team independence and avoid redeploying the UI composer for every application change, the HTML templates are loaded from an S3 bucket. All teams responsible for micro-frontends in the same page can position their micro-frontends into the right place of the HTML template and delegate the composition task to the UI composer.
In this demo, the initial parameters and the catalog template are retrieved once. However, in a real scenario, it’s more likely you retrieve the parameters at initialization and at a regular cadence. The template might be loaded at runtime for every request or have another background routine fetching the initialization parameters in a similar way.
When the request reaches the product details route, the web application logic calls a transformTemplate function. It passes the catalog template, retrieved from the S3 bucket at the server initialization. It returns a 200 response if the page is composed without any issues.
The page composition is the key responsibility of the UI composer. There are several viable approaches for composing micro-frontends in a server-side rendering system, covered in the next post.
Micro-frontends discovery
To decouple workloads for multiple teams, you must use architectural patterns that support it. In a microservices architecture, a pattern that allows independent evolution of a service without coupling the DNS or IP to any microservice is the service discovery pattern.
In this example, AWS System Managers Parameters Store acts as a services registry. Every micro-frontend available in the workload registers itself once the infrastructure is provisioned.
In this way, the UI composer can request the micro-frontend ID found inside the HTML template. It can retrieve the correct way to consume the micro-frontend API using an ARN or a remote HTTP URL, for instance.
Using ARN over HTTP requests inside the workload network can help you to reduce the latency thanks to fewer network hops. Moreover, the security is delegated to IAM policies providing a robust security implementation.
The UI composer takes care to retrieve the micro-frontends endpoints at runtime before loading them into the HTML template. This is a simpler yet powerful approach for maintaining the boundaries within your organization and allowing independent teams to evolve their architecture autonomously.
Micro-frontends discovery evolution
Using Parameter Store as a service discovery system, you can deploy a new micro-frontend by adding a new key-value into the service discovery.
A more sophisticated option could be creating a service that acts as a registry and also shapes the traffic towards different micro-frontends versions using deployment strategies like canary releases or blue/green deployments.
You can start iteratively with a simple key-value store system and evolve the architecture with a more complex approach when the workload requires, providing a robust way to roll out micro-frontends services in your system.
When this is in place, it’s likely to increase the release cadence of your micro-frontends. This is because developers often feel safer releasing in production without affecting the entire user base and they can run tests alongside real traffic.
Performance considerations
This architecture uses Fargate for composing the micro-frontends instead of Lambda functions. This allows incremental rendering offered by browsers, displaying the HTML page partially before it’s completely returned.
Consider a scenario where a micro-frontend takes longer to render due to a downstream dependency or a faulty version deployed into production. Without the streaming capability, you must wait until all the micro-frontends responses arrive, buffer them in memory, compose the page and then send the final output to the browser.
Instead, by using the streaming API offered by Node.js frameworks, you can send a partial HTML page (for example, the head tag and subsequently the rest of the page), to be rendered by a browser.
Streaming also improves server overhead, because the servers don’t have to buffer entire pages. By incrementally flushing data to browsers, servers keep memory pressure low, which lets them process more requests and save overhead costs.
However, in case your workload doesn’t require these capabilities, one or multiple Lambda functions might be suitable for your project as well, reducing the infrastructure management complexity to handle.
Conclusion
This post looks at how to use the UI Composer and micro-frontends discoverability. Once this part is developed, it won’t need to change regularly. This represents the foundation for building server-side rendering micro-frontends using HTML-over-the-wire. There might be other approaches to follow for other frameworks such as Next.js due to the architectural implementation of the framework itself.
The next post will cover how the UI composer includes micro-frontends output inside an HTML template.
For more serverless learning resources, visit Serverless Land.
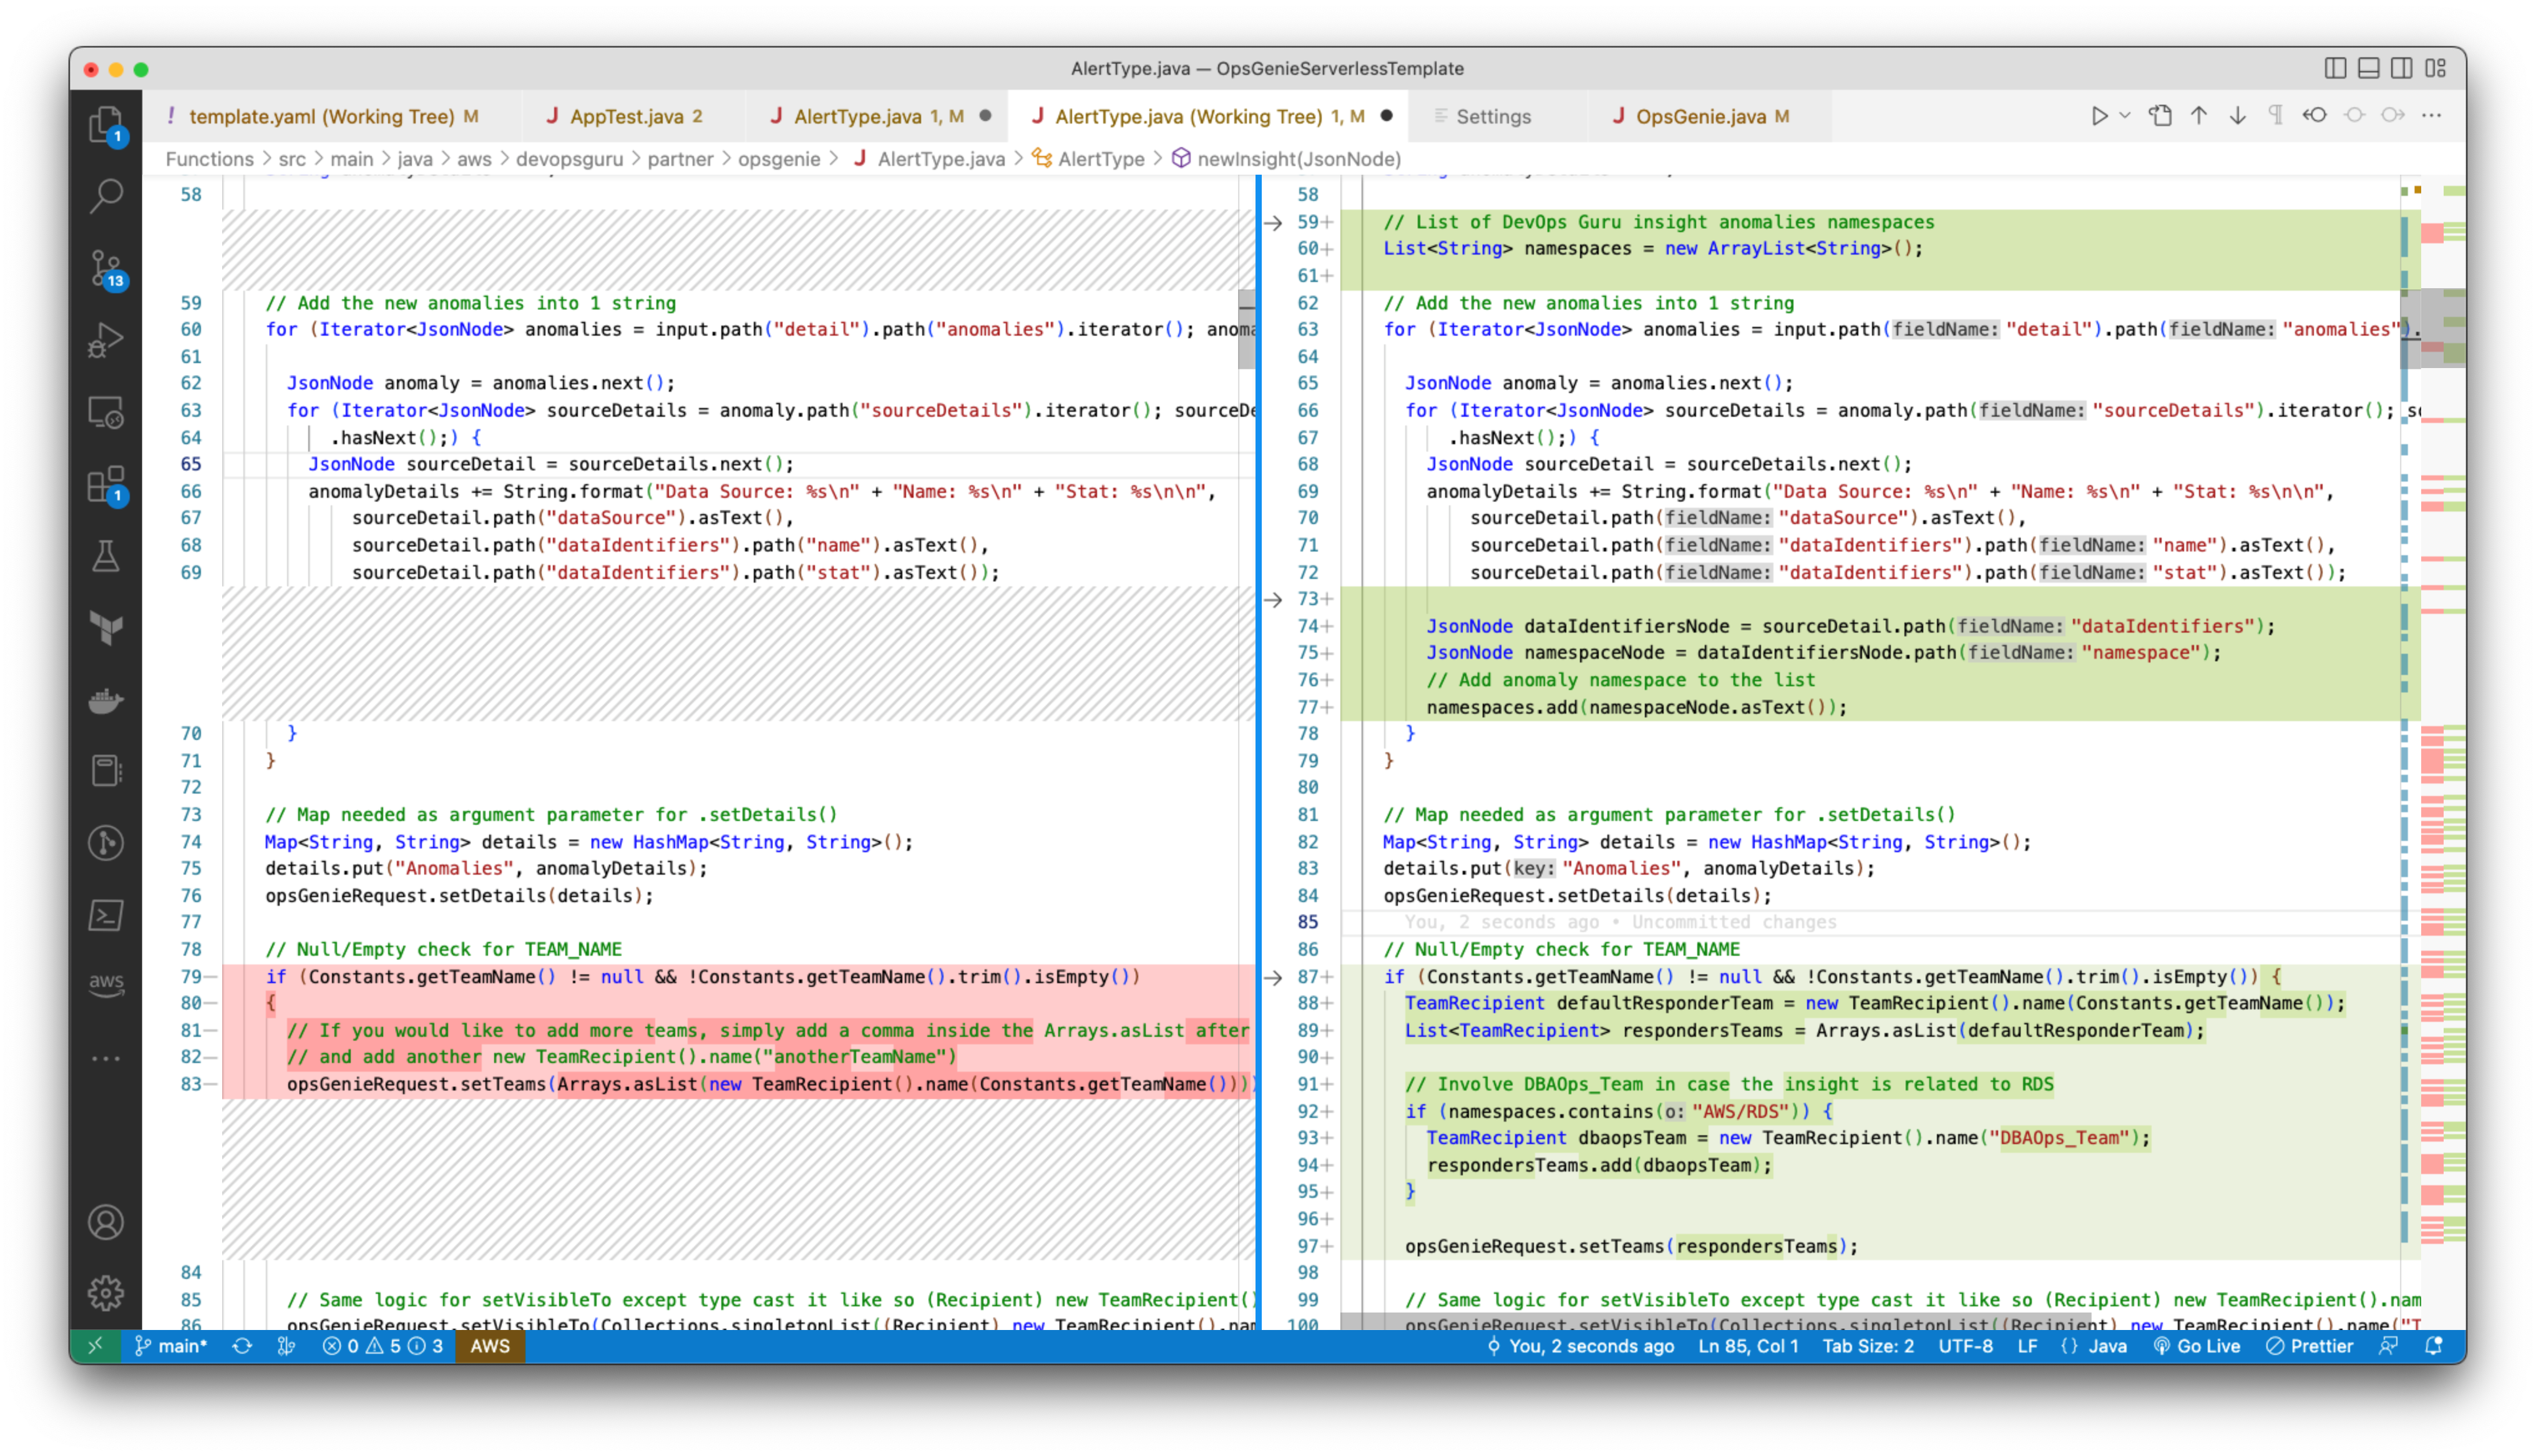
Data proliferation has become a norm and as organizations become more data driven, automating data pipelines that enable data ingestion, curation, and processing is vital. Since many organizations have thousands of time-bound, automated, complex pipelines, monitoring their telemetry information is critical. Keeping track of telemetry data helps businesses monitor and recover their pipelines faster which results in better customer experiences.
In our blog post, we explain how you can collect telemetry from your data pipeline jobs and use machine learning (ML) to build a lower- and upper-bound threshold to help operators identify anomalies in near-real time.
The applications of anomaly detection on telemetry data from job pipelines are wide-ranging, including these and more:
Detecting abnormal runtimes
Detecting jobs running slower than expected
Proactive monitoring
Notifications
Key tenets of telemetry analytics
There are five key tenets of telemetry analytics, as in Figure 1.
Figure 1. Key tenets of telemetry analytics
The key tenets for near real-time telemetry analytics for data pipelines are:
Collecting the metrics
Aggregating the metrics
Identify anomaly
Notify and resolve issues
Persist for compliance reasons, historical trend analysis, and to visualize
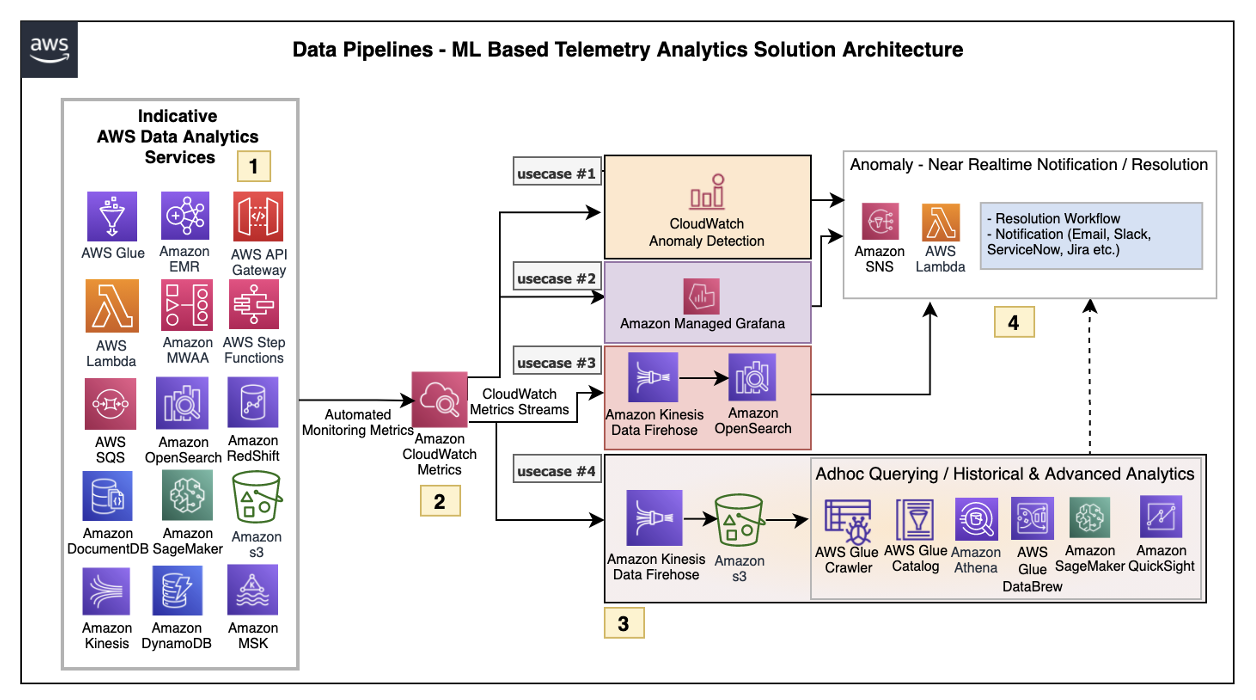
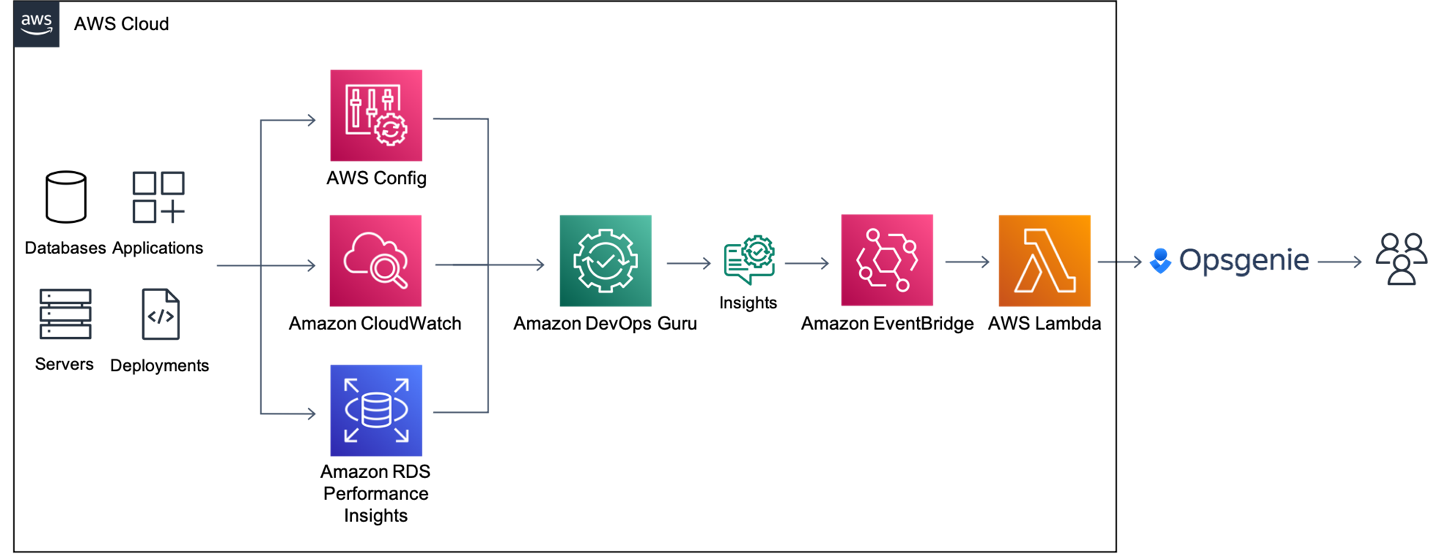
The architecture defined here helps customers incrementally enable features with AWS LCNC solutions by leveraging AWS managed services to avoid the overhead of infrastructure provisioning. Most of the steps are configurations of the features provided by AWS services. This enables customers to make their applications resilient by tracking and resolving anomalies in near real time, as in Figure 2.
Let’s explore each of the architecture steps in detail.
1.Indicative AWS data analytics services: Choose from a broad range of AWS analytics services, including data movement, data storage, data lakes, big data analytics, log analytics, and streaming analytics to business intelligence, ML, and beyond. This diagram shows a subset of these data analytics services. You may use one or a combination of many, depending on your use case.
2.Amazon CloudWatch metrics for telemetry analytics: Collecting and visualizing real-time logs, metrics, and event data is a key step in any process. CloudWatch helps you accomplish these tasks without any infrastructure provisioning. Almost every AWS data analytics service is integrated with CloudWatch to enable automatic capturing of the detailed metrics needed for telemetry analytics.
3.Near real-time use case examples: Step three presents practical, near real-time use cases that represent a range of real-world applications, one or more of which may apply to your own business needs.
Use case 1: Anomaly detection
CloudWatch provides the functionality to apply anomaly detection for a metric. The key business use case of this feature is to apply statistical and ML algorithms on a per-metrics basis of business critical applications to proactively identify issues and raise alarms.
The focus is on a single set of metrics that will be important for the application’s functioning—for example, AWS Lambda metrics of a 24/7 credit card company’s fraud monitoring application.
Use case 2: Unified metrics using Amazon Managed Grafana
For proper insights into telemetry data, it is important to unify metrics and collaboratively identify and troubleshoot issues in analytical systems. Amazon Managed Grafana helps to visualize, query, and corelate metrics from CloudWatch in near real-time.
For example, Amazon Managed Grafana can be used to monitor container metrics for Amazon EMR running on Amazon Elastic Kubernetes Service (Amazon EKS), which supports processing high-volume data from business critical Internet of Things (IoT) applications like connected factories, offsite refineries, wind farms, and more.
Use case 3: Combined business and metrics data using Amazon OpenSearch Service
Amazon OpenSearch Service provides the capability to perform near real-time, ML-based interactive log analytics, application monitoring, and search by combining business and telemetry data.
As an example, customers can combine AWS CloudTrail logs for AWS logins, Amazon Athena, and Amazon RedShift query access times with employee reference data to detect insider threats.
This log analytics use case architecture integrates into OpenSearch, as in Figure 3.
Figure 3. Log analytics use case architecture overview with OpenSearch
Use case 4: ML-based advanced analytics
Using Amazon Simple Storage Service (Amazon S3) as data storage, data lake customers can tap into AWS analytics services such as the AWS Glue Catalog, AWS Glue DataBrew, and Athena for preparing and transforming data, as well as build trend analysis using ML models in Amazon SageMaker. This mechanism helps with performing ML-based advanced analytics to identify and resolve recurring issues.
4.Anomaly resolution: When an alert is generated either by CloudWatch alarm, OpenSearch, or Amazon Managed Grafana, you have the option to act on the alert in near-real time. Amazon Simple Notification Service (Amazon SNS) and Lambda can help build workflows. Lambda also helps integrate with ServiceNow ticket creation, Slack channel notifications, or other ticketing systems.
Simple data pipeline example
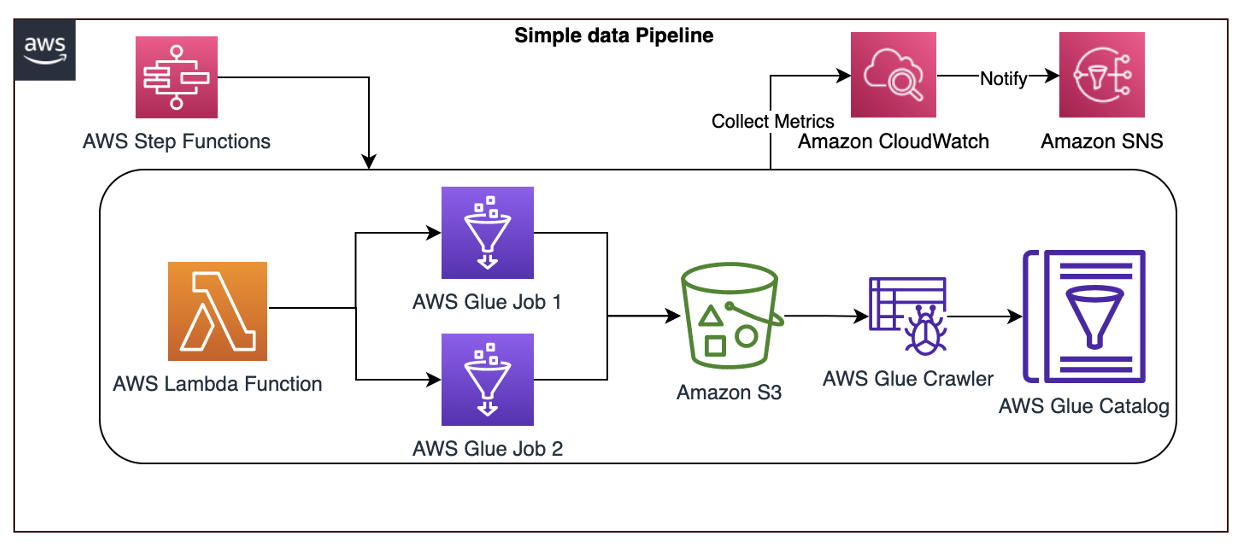
Let’s explore another practical example using an architecture that demonstrates how AWS Step Functions orchestrates Lambda, AWS Glue jobs, and crawlers.
To report an anomaly on AWS Glue jobs based on total number of records processed, you can leverage the glue.driver.aggregate.recordsRead CloudWatch metric and set up a CloudWatch alarm based on anomaly detection, Amazon SNS topic for notifications, and Lambda for resolution, as in Figure 4.
Here are the steps involved in the architecture proposed:
CloudWatch automatically captures the metric glue.driver.aggregate.recordsRead from AWS Glue jobs.
Customers set a CloudWatch alarm based on the anomaly detection of glue.driver.aggregate.recordsRead metric and set a notification to Amazon SNS topic.
CloudWatch applies a ML algorithm to the metric’s past data and creates a model of metric’s expected values.
When the number of records increases significantly, the metric from the CloudWatch anomaly detection model notifies the Amazon SNS topic.
Customers can notify an email group and trigger a Lambda function to resolve the issue, or create tickets in their operational monitoring system.
Customers can also unify all the AWS Glue metrics using Amazon Managed Grafana. Using Amazon S3, data lake customers can crawl and catalog the data in the AWS Glue catalog and make it available for ad-hoc querying. Amazon SageMaker can be used for custom model training and inferencing.
Conclusion
In this blog post, we covered a recommended architecture to enable near-real time telemetry analytics for data pipelines, anomaly detection, notification, and resolution. This provides resiliency to the customer applications by proactively identifying and resolving issues.
Build AI and ML into Email & SMS for customer engagement
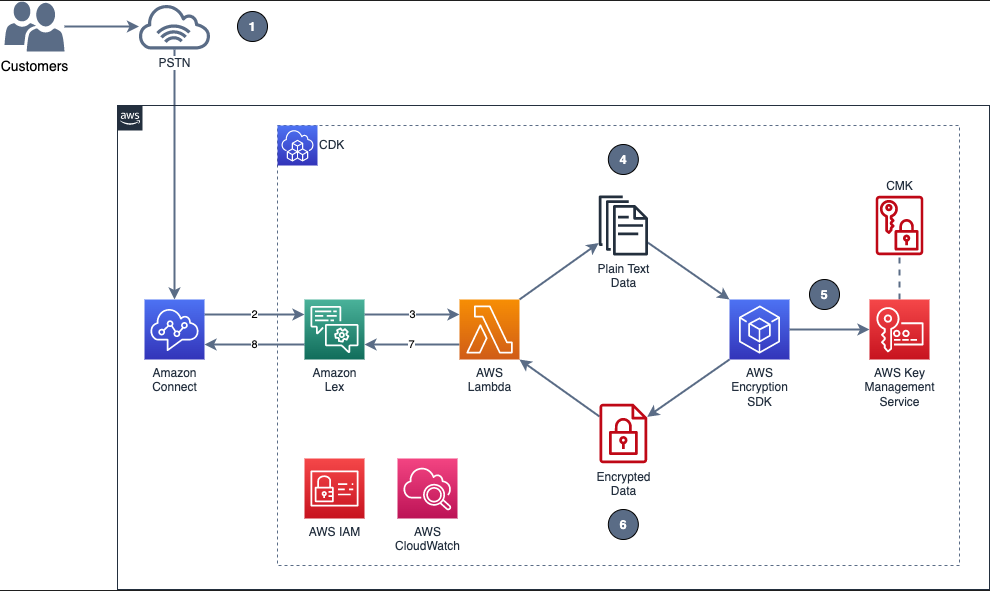
Customers engage with businesses through various channels like email, SMS, Push, and in-app. With the availability and ease of usage of mobile phones, businesses can use 2-way Short Service Messages (SMS) to engage with their customers. Text messaging does not need applications and provides immediate interaction with your customers. Amazon Pinpoint enables businesses & organizations to interact in 2-way SMS messages with their customers. Since it is not practical and scalable for organizations to have people responding to millions of their customer’s texts, we can leverage Amazon Lex which helps build the conversational AI into the 2-way SMS. Amazon Lex is a fully managed artificial intelligent (AI) AWS service with advanced natural language models to design, build, test, and deploy conversational interfaces in applications. Machine Learning (ML) is used in digital marketing to help businesses detect patterns in customer bhevaior.
Today, if customers want to know the latest status on their order, they have to send an email, which is hard for businesses to monitor and respond, and time consuming for the customer to call regarding their order status and also expensive for businesses to field the calls.
This blog post shows how you can elevate your customer’s experience using Amazon Pinpoint’s omni-channel capabilities, Amazon Lex’s AI powered chat, and ML-powered personalization using Amazon Personalize.
The solution presented in this blog helps resolve all the above issues. The example I have used to depict this where a customer orders a bike and since the delivery has been delayed, he wants to get timely updates on the progress. He has been given a phone number by the bike company to text them with any questions. This solution elevates the customer’s experience by providing him with timely update by checking the latest from the database and also sending additional product recommendations, predicting what the customer might need.
Go to Amazon S3 console and create a bucket. I created one for this example as ‘pinpointreinventaiml-code’. Under that S3 bucket, create a sub-folder and name it Lambda.
Upload the 2 zip files you downloaded earlier from the Github.
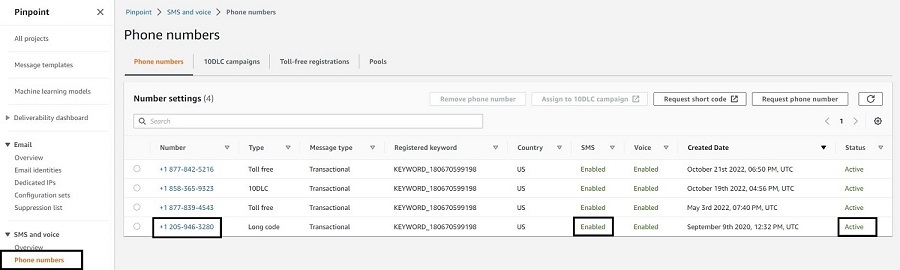
In Amazon Pinpoint > Phone numbers, Check to make sure the phone number you are using is enabled for SMS and its status is active.
Give a Bot name ‘Order Status’ under Bot name Configuration. (Use the same Bot name as mentioned here. If you change the Bot name here, your CloudFormation will fail)
Under IAM permissions, select the radio button Create a role with basic Amazon Lex permissions.
For COPPA, choose No. Click Next
Under Language dropdown, choose the language of usage. I chose Language as English in my example.
Click Done, to complete the Bot creation.
You have to create an Intent within the Bot you just created
Click on the Bot you just created. Click on Intents and click the dropdown Add intent and select Add empty intent.
Give an intent name and click Ok.
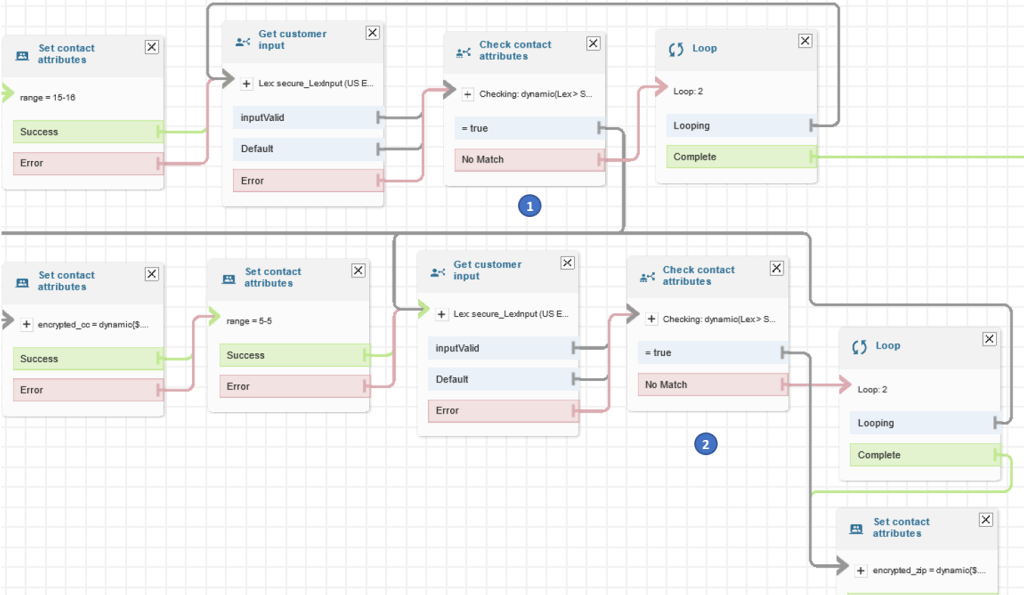
Once the intent is created, go to the intent and open the Conversation flow section in the intent and create a flow that that has the following info and looks like below image:
Click on Sample utterance and it takes you to Sample Utterance and type in Order status.
Click on initial response and type in Okay, I can help with that. What is your order number?
Click on the slot value and click on Add a slot. Name: OrderNumber and Slot type is AMAZON.AlphaNumeric. In the prompt, enter Please enter your order number.
Click on Save Intent button. The conversation flow should look like the below screenshot:
6. Go back to the Intent you just created and click on the Build button that is to the right side of the page.
7. Once the build is successfully completed, go back to the Bot you created and click on Aliases on the left frame. Click on the Alias that was created earlier, TestBotAlias.
8. In the Languages section, click on the English language that we created earlier. 9. Open the Lambda function – optional section and point the source to RE_Order_Validation Lambda that we downloaded earlier. 10. For Lambda function version or alias, select $LATEST. Click on Save.
11. Go to Intents, choose the intent you just built and click on Build button again. Once build is complete, you can test the intent.
Import and execute CloudFormation:
Navigate to the Amazon CloudFormation console in the AWS region you want to deploy this solution.
Select Create stack and With new resources. Choose Template is ready as Prerequisite – Prepare template and Upload a template file as Specify template. Upload the template downloaded in step 1 under Preparation section of this document. Click Next.
Fill the AWS CloudFormation parameters as shown below:
Stack name: Give a name to this stack.
Under Parameters, for BotAlias: The Bot Alias that you created as part of Amazon Lex above.
BotId: The Bot ID for the bot that you created as part of Amazon Lex above.
CodeS3Bucket: Give the name of the S3 bucket you created in step3 of the Preparation topic above.
OriginationNumber: This is the origination identity phone number you created in step4 of the Preparation topic above.
PinpointProjectId: Use the ProjectID you have from step2 of the Prerequisites phase above.
After entering all the parameter info, it would look something like this below:
Click Next. Leave the default options on the next page and click Next again.
Check the box I acknowledge that AWS CloudFormation might create IAM resources with custom names. Click Submit.
Set up data in Amazon Dynamo DB
We are using DynamoDB table here as the transactional database that stores order information for the bike store.
Once the solution has been successfully deployed, navigate to the Amazon DynamoDB console and access the OrderStatus DynamoDB table. Each row created in this table represents an order and it’s details. Each row should have a unique Order_Num that holds the order number and it’s related information. You can put additional information about the order like the example below:
Once you enter the data, it should look like the image below. Click on Create item.
Set up Amazon Simple Notification Service (SNS) topic
We need the Amazon Simple Notification Service here, to provide internal message delivery from publishers (customer’s text message) to subscribers (Amazon Lex in this example). This is used for internal notifications in this use case.
As part of the CloudFormation above, check if you have an SNS topic created by the name LexPinpointIntegrationDemo.
Now, we have successfully created an Amazon SNS topic.
Set up Lambda Functions
Go to AWS Lambda console and open the Lambda function LexIntegration. Under the Function overview, click on the Add trigger. Under Trigger configuration dropdown, select SNS and under SNS Topic select LexPinpointIntegrationDemo topic. Click on Add.
Note: In this example, I used Node.js in a Lambda and Python in another, to show how AWS Lambda functions are flexible to use the scripting language of your choice.
Setting up 2-way SMS in Amazon Pinpoint
Go to Amazon Pinpoint console and click on Phone numbers under SMS & Voice in the left frame. If you don’t see any phone numbers, please refer to #3 under prerequisites section above.
This is how your screen should look like
Click on the number.
On the right frame, expand Two-way SMS drop down arrow.
Click on the check box ‘Enable two-way SMS’.
In the ‘Incoming message destination’ select the radio button ‘Choose an existing SNS topic’ and in the drop down below, choose the SNS topic you built above.
The result would look like the screenshot below:
Click on Save.
Import Machine Learning model into Pinpoint
Go to Amazon Pinpoint.
Click on Machine Learning Models. Click on Add recommender model.
Give a recommender model name and description under model details.
Under Model configuration, choose the radio button ‘Automatically create a role’ and give an IAM role name in the textbox below.
Under recommender model, choose the recommender model campaign that you created in Amazon Personalize earlier in the project.
If you did not create it, use this Pinpoint workshop to create a recommender model in Amazon Personalize.
The data used in this example is for retail industry, please edit the data as needed for your use case and industry.
Under the settings section:
Select ‘User Id’ as identifier.
Click on the drop down ‘Number of recommendations per message’ and select 3.
For Processing method, choose ‘Use value returned by model’.
Click on Next.
You are presented with attributes section. Give a display name as ‘product_name’ for the attributes and click next.
On the next screen, you can review all the information provided and click on Publish.
The completed model after publishing looks like the screen below:
Once the template is created, you need to add recommendations to the message template using this Amazon Pinpoint Workshop details. Change the type of data needed for your use case and industry in this workshop. I used sample retail data.
To create a Amazon Pinpoint Journey, navigate to the Amazon Pinpoint console , select Journeys and click on Create journey.
Give a name, click on Set entry condition in the Journey entry block.
Choose the radio button Add participants when they perform an activity.
Click in the ‘Events’ text box and type in OrderStatus.
Click on Add activity and select Send an email.
Click on choose an email template and select the email message template we created earlier in this blog. Click on choose template button.
Select a Sender email address from the drop down list.
Click Save. The final journey should look like this:
Click on Actions > Settings where you will review the journey settings. There you set the start and end date of the journey if applicable as well as other advanced settings. Configure your journey settings to look like the screenshot below and click Save.
To publish your journey click on Review. On the Review your journey click Next > Mark as reviewed > Publish. A 5 minutes countdown will begin after, which your journey will be live.
Once the journey is live, we need to pass the event OrderStatus and the endpoints will go through that journey and will receive an email.
Testing the solution
Use a phone with a valid number (in this example, I took a US phone number) and send a text ‘Order Status’ to the number generated in Amazon Pinpoint above.
You should get a response “Okay, I can help with that. What is your order number?”
You should type in the order number you generated earlier and stored it in Amazon DynamoDB table.
You should get a response “Your order <order number> was shipped on <shipped_dt> and is expected to be delivered to your address on <delivery_dt>. Your order details have been emailed to you.”
Alternatively, you can test this solution from the Lex bot.
In Amazon Lex, go to the intent you created above and click on the Test button. Next steps:
In the text box, enter Order Status.
Bot should respond with Okay, I can help with that. What is your order number?
You can respond with the order number you entered in the DynamoDB table.
Bot should respond with Your order <Order_Num> was shipped on <Shipping_Dt> and is expected to be delivered to your address on <Delivery_Dt>. Your order details have been emailed to you.
Conclusion
Using this blog post, you can elevate your customer’s experience by using Amazon Lex’s AI chat capabilities, Amazon Personalize’s ML recommendation models and trigger a Pinpoint Journey. This blog highlights how organizations can interact in a 2-way SMS with their customers and convert that engagement to a triggered email, with product recommendations, if needed.
Next Steps
You can use the above solution and modify it easily to use it across different verticals and applicable use cases. You can also extend this solution to Amazon Connect to an agent via SMS chat, using this blog.
Clean-up
To delete the solution, go to CloudFormation you created as part od this project. Click on the stack and click Delete.
Navigate to Amazon Pinpoint and stop the Journey you ran in this solution. Delete the Journey, Machine learning models, Message templates you created for this solution. Delete the Project you created for this solution.
In Amazon Lex, delete the intent and bot you created for this solution.
Delete the folder and bucket you created in S3 as part of this project.
Amazon Personalize resources like Dataset groups, datasets, etc. are not created via AWS Cloudformation, thus you have to delete them manually. Please follow the instructions in the AWS documentation on how to clean up the created resources.
Vinay Ujjini is an Amazon Pinpoint and Amazon Simple Email Service Principal Specialist Solutions Architect at AWS. He has been solving customer’s omni-channel challenges for over 15 years. In his spare time, he enjoys playing tennis & cricket.
This blog post is written by Amir Khairalomoum, Senior Solutions Architect.
Modern applications are built with modular architectural patterns, serverless operational models, and agile developer processes. They allow you to innovate faster, reduce risk, accelerate time to market, and decrease your total cost of ownership (TCO). A microservices architecture comprises many distributed parts that can introduce complexity to application observability. Modern observability must respond to this complexity, the increased frequency of software deployments, and the short-lived nature of AWS Lambda execution environments.
The Serverless Applications Lens for the AWS Well-Architected Framework focuses on how to design, deploy, and architect your serverless application workloads in the AWS Cloud. AWS Lambda Powertools for .NET translates some of the best practices defined in the serverless lens into a suite of utilities. You can use these in your application to apply structured logging, distributed tracing, and monitoring of metrics.
This post shows how to use the new open source Powertools library to implement observability best practices with minimal coding. It walks through getting started, with the provided examples available in the Powertools GitHub repository.
About Powertools
Powertools for .NET is a suite of utilities that helps with implementing observability best practices without needing to write additional custom code. It currently supports Lambda functions written in C#, with support for runtime versions .NET 6 and newer. Powertools provides three core utilities:
Tracing provides a simpler way to send traces from functions to AWS X-Ray. It provides visibility into function calls, interactions with other AWS services, or external HTTP requests. You can add attributes to traces to allow filtering based on key information. For example, when using the Tracing attribute, it creates a ColdStart annotation. You can easily group and analyze traces to understand the initialization process.
Logging provides a custom logger that outputs structured JSON. It allows you to pass in strings or more complex objects, and takes care of serializing the log output. The logger handles common use cases, such as logging the Lambda event payload, and capturing cold start information. This includes appending custom keys to the logger.
Metrics simplifies collecting custom metrics from your application, without the need to make synchronous requests to external systems. This functionality allows capturing metrics asynchronously using Amazon CloudWatch Embedded Metric Format (EMF) which reduces latency and cost. This provides convenient functionality for common cases, such as validating metrics against CloudWatch EMF specification and tracking cold starts.
Getting started
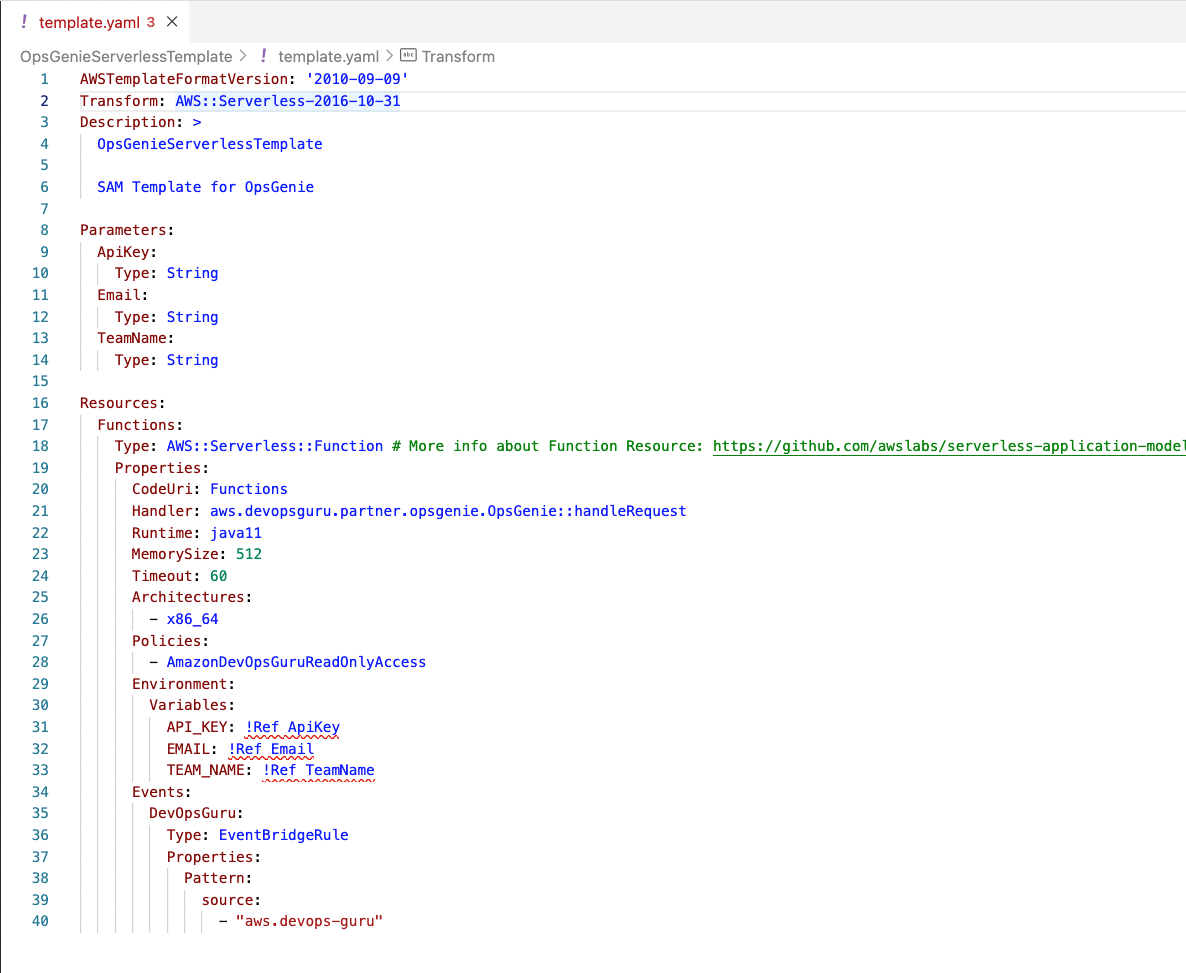
The following steps explain how to use Powertools to implement structured logging, add custom metrics, and enable tracing with AWS X-Ray. The example application consists of an Amazon API Gateway endpoint, a Lambda function, and an Amazon DynamoDB table. It uses the AWS Serverless Application Model (AWS SAM) to manage the deployment.
When you send a GET request to the API Gateway endpoint, the Lambda function is invoked. This function calls a location API to find the IP address, stores it in the DynamoDB table, and returns it with a greeting message to the client.
Example application
The AWS Lambda Powertools for .NET utilities are available as NuGet packages. Each core utility has a separate NuGet package. It allows you to add only the packages you need. This helps to make the Lambda package size smaller, which can improve the performance.
To implement each of these core utilities in a separate example, use the Globals sections of the AWS SAM template to configure Powertools environment variables and enable active tracing for all Lambda functions and Amazon API Gateway stages.
Sometimes resources that you declare in an AWS SAM template have common configurations. Instead of duplicating this information in every resource, you can declare them once in the Globals section and let your resources inherit them.
Logging
The following steps explain how to implement structured logging in an application. The logging example shows you how to use the logging feature.
To add the Powertools logging library to your project, install the packages from NuGet gallery, from Visual Studio editor, or by using following .NET CLI command:
dotnet add package AWS.Lambda.Powertools.Logging
Use environment variables in the Globals sections of the AWS SAM template to configure the logging library:
Decorate the Lambda function handler method with the Logging attribute in the code. This enables the utility and allows you to use the Logger functionality to output structured logs by passing messages as a string. For example:
[Logging]
public async Task<APIGatewayProxyResponse> FunctionHandler
         (APIGatewayProxyRequest apigProxyEvent, ILambdaContext context)
{
  ...
  Logger.LogInformation("Getting ip address from external service");
  var location = await GetCallingIp();
  ...
}
Another common use case, especially when developing new Lambda functions, is to print a log of the event received by the handler. You can achieve this by enabling LogEvent on the Logging attribute. This is disabled by default to prevent potentially leaking sensitive event data into logs.
With logs available as structured JSON, you can perform searches on this structured data using CloudWatch Logs Insights. To search for all logs that were output during a Lambda cold start, and display the key fields in the output, run following query:
Using the Tracing attribute, you can instruct the library to send traces and metadata from the Lambda function invocation to AWS X-Ray using the AWS X-Ray SDK for .NET. The tracing example shows you how to use the tracing feature.
When your application makes calls to AWS services, the SDK tracks downstream calls in subsegments. AWS services that support tracing, and resources that you access within those services, appear as downstream nodes on the service map in the X-Ray console.
You can instrument all of your AWS SDK for .NET clients by calling RegisterXRayForAllServices before you create them.
public class Function
{
  private static IDynamoDBContext _dynamoDbContext;
  public Function()
  {
    AWSSDKHandler.RegisterXRayForAllServices();
    ...
  }
  ...
}
To add the Powertools tracing library to your project, install the packages from NuGet gallery, from Visual Studio editor, or by using following .NET CLI command:
dotnet add package AWS.Lambda.Powertools.Tracing
Use environment variables in the Globals sections of the AWS SAM template to configure the tracing library.
Decorate the Lambda function handler method with the Tracing attribute to enable the utility. To provide more granular details for your traces, you can use the same attribute to capture the invocation of other functions outside of the handler. For example:
Once traffic is flowing, you see a generated service map in the AWS X-Ray console. Decorating the Lambda function handler method, or any other method in the chain with the Tracing attribute, provides an overview of all the traffic flowing through the application.
AWS X-Ray trace service view
You can also view the individual traces that are generated, along with a waterfall view of the segments and subsegments that comprise your trace. This data can help you pinpoint the root cause of slow operations or errors within your application.
AWS X-Ray waterfall trace view
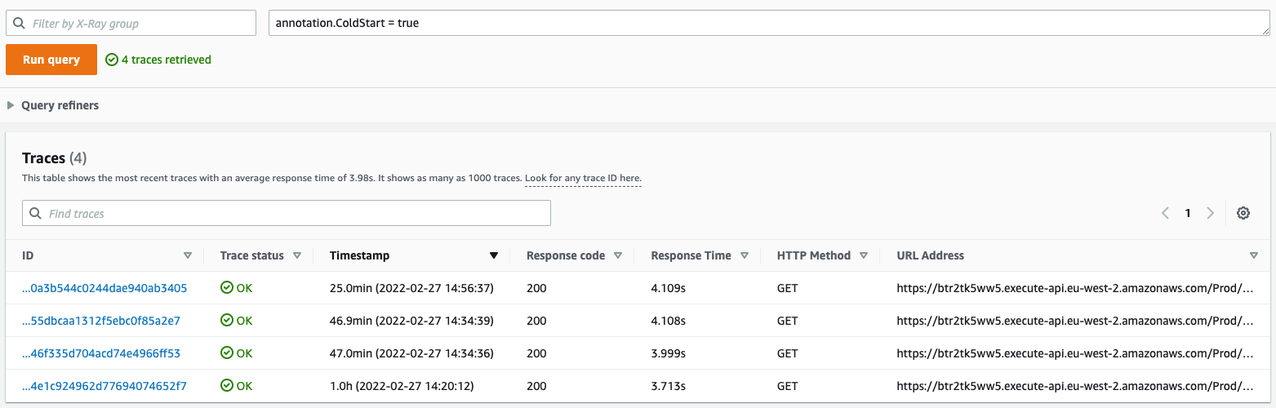
You can also filter traces by annotation and create custom service maps with AWS X-Ray Trace groups. In this example, use the filter expression annotation.ColdStart = true to filter traces based on the ColdStart annotation. The Tracing attribute adds these automatically when used within the handler method.
View trace attributes
Metrics
CloudWatch offers a number of included metrics to help answer general questions about the application’s throughput, error rate, and resource utilization. However, to understand the behavior of the application better, you should also add custom metrics relevant to your workload.
In the sample application, you want to understand how often your service is calling the location API to identify the IP addresses. The metrics example shows you how to use the metrics feature.
To add the Powertools metrics library to your project, install the packages from the NuGet gallery, from the Visual Studio editor, or by using the following .NET CLI command:
dotnet add package AWS.Lambda.Powertools.Metrics
Use environment variables in the Globals sections of the AWS SAM template to configure the metrics library:
To create custom metrics, decorate the Lambda function with the Metrics attribute. This ensures that all metrics are properly serialized and flushed to logs when the function finishes its invocation.
You can then emit custom metrics by calling AddMetric or push a single metric with a custom namespace, service and dimensions by calling PushSingleMetric. You can also enable the CaptureColdStart on the attribute to automatically create a cold start metric.
[Metrics(CaptureColdStart = true)]
public async Task<APIGatewayProxyResponse> FunctionHandler
         (APIGatewayProxyRequest apigProxyEvent, ILambdaContext context)
{
  ...
  // Add Metric to capture the amount of time
  Metrics.PushSingleMetric(
        metricName: "CallingIP",
        value: 1,
        unit: MetricUnit.Count,
        service: "lambda-powertools-metrics-example",
        defaultDimensions: new Dictionary<string, string>
        {
            { "Metric Type", "Single" }
        });
  ...
}
Conclusion
CloudWatch and AWS X-Ray offer functionality that provides comprehensive observability for your applications. Lambda Powertools .NET is now available in preview. The library helps implement observability when running Lambda functions based on .NET 6 while reducing the amount of custom code.
It simplifies implementing the observability best practices defined in the Serverless Applications Lens for the AWS Well-Architected Framework for a serverless application and allows you to focus more time on the business logic.
You can find the full documentation and the source code for Powertools in GitHub. We welcome contributions via pull request, and encourage you to create an issue if you have any feedback for the project. Happy building with AWS Lambda Powertools for .NET.
For more serverless learning resources, visit Serverless Land.
This blog post is written by Uri Segev, Principal Serverless Specialist Solutions Architect
When developing new applications or modernizing existing ones, you might face a dilemma: which compute technology to use? A serverless compute service such as AWS Lambda or maybe containers? Often, serverless can be the better approach thanks to automatic scaling, built-in high availability, and a pay-for-use billing model. However, you may hesitate to choose serverless for reasons such as:
Perceived higher cost or difficulty in estimating cost
It is a paradigm shift, which requires learning to bridge the knowledge gap
Misconceptions about Lambda capabilities and use cases
Concern that using Lambda will result in lock-in
Existing investments in non-serverless platforms and tooling
This blog post suggests best practices for developing portable Lambda functions that allow you to easily port your code to containers if you later choose to. By doing so, you can avoid lock-in and try out the serverless approach in a risk-free way.
Each section of this blog post describes what you need to consider when writing portable code and the steps needed to migrate this code from Lambda to containers, if you later choose to do so.
Best practices for portable Lambda functions
Separate business logic and Lambda handler
Lambda functions are event-driven in nature. When a specific event happens, it invokes the Lambda function by calling its handler method. The handler method receives an event object which contains information regarding the reason for the function invocation. Once the function execution completes, it returns from the handler method. Whatever is returned from the handler is the function’s return value.
To write portable code, we recommend using the handler method only as an interface between the Lambda runtime (event object) and the business logic. Using Hexagonal architecture terminology, the handler should be a driving adapter making calls into the port, which is the interface exposed by the business logic The handler should extract all required information from the event object and then call a separate method that implements the business logic.
When that method returns, the handler constructs the result in the format expected by the function invoker and returns it. We also recommend splitting the handler code and the business logic code into separate files. Should you choose to migrate to containers later, you simply migrate your business logic code files with no additional changes.
The following pseudocode shows a Lambda handler that extracts information from the event object and calls the business logic. Once the business logic is done, the handler places the response in the function’s return value:
import business_logic

# The Lambda handler extracts needed information from the event
# object and invokes the business logic
handler(event, context) {
  # Extract needed information from event object payload = event[‘payload’]

  # Invoke business logic
  result = do_some_logic(payload)

  # Construct result for API Gateway
  return {
    statusCode: 200,
	body: result
  }
}
The following pseudocode shows the business logic. It’s located in a separate file and is unaware that it is being invoked from a Lambda function. It is pure logic.
# This is the business logic. It knows nothing about who invokes it.
do_some_logic(data) {
result = "This is my result."
  return result
}
This approach also makes it easier to run unit tests on the business logic without the need to construct event objects and to invoke the Lambda handler.
If you migrate to containers later, you include the business logic files in your container with new interface code as described in the following section.
Event source integration
One benefit of Lambda functions is the event source integration. For instance, if you integrate Lambda with Amazon Simple Queue Service (Amazon SQS), the Lambda service will take care of polling the queue, invoking the Lambda function and deleting the messages from the queue when done. By using this integration, you need to write less boilerplate code. You can focus only on implementing business logic and not the integration with the event source.
The following pseudocode shows how the Lambda handler looks like for an SQS event source:
import business_logic

handler(event, context) {
  entries = []
  # Iterate over all the messages in the event object
  for message in event[‘Records’] {
    # Call the business logic to process a single message
    success = handle_message(message)

    # Start building the response
    if Not success {
      entries.append({
      'itemIdentifier': message['messageId']
      })
    }
  }

  # Notify Lambda about failed items.
  if (let(entries) > 0) {
    return {
      'batchItemFailures': entries
    }
  }
}
As you can see in the previous code, the Lambda function has almost no knowledge that it is being invoked from SQS. There are no SQS API calls. It only knows the structure of the event object, which is specific to SQS.
When moving to a container, the integration responsibility moves from the Lambda service to you, the developer. There are different event sources in AWS, and each of them will require a different approach for consuming events and invoking business logic. For example, if the event source is Amazon API Gateway, your application will need to create an HTTP server that listens on an HTTP port and waits for incoming requests in order to invoke the business logic.
If the event source is Amazon Kinesis Data Streams, your application will need to run a poller that reads records from the shards, keep track of processed records, handle the case of a change in the number of shards in the stream, retry on errors, and more. Regardless of the event source, if you follow the previous recommendations, you will not need to change anything in the business logic code.
The following pseudocode shows how the integration with SQS will look like in a container. Note that you will lose some features such as batching, filtering, and, of course, automatic scaling.
import aws_sdk
import business_logic

QUEUE_URL = os.environ['QUEUE_URL']
BATCH_SIZE = os.environ.get('BATCH_SIZE', 1)
sqs_client = aws_sdk.client('sqs')

main() {
  # Infinite loop to poll for messages from SQS
  while True {

    # Receive a batch of messages from the queue
    response = sqs_client.receive_message(
      QueueUrl = QUEUE_URL,
      MaxNumberOfMessages = BATCH_SIZE,
      WaitTimeSeconds = 20 )

    # Loop over the messages in the batch
    entries = []
    i = 1
    for message in response.get('Messages',[]) {
      # Process a single message
      success = handle_message(message)

      # Append the message handle to an array that is later
      # used to delete processed messages
      if success {
        entries.append(
          {
            'Id': f'index{i}',
            'ReceiptHandle': message['receiptHandle']
          }
        )
        i += 1
      }
    }

    # Delete all the processed messages
    if (len(entries) > 0) {
      sqs_client.delete_message_batch(
        QueueUrl = QUEUE_URL,
        Entries = entries
      )
    }
  }
}
Another point to consider here is Lambda destinations. If your function is invoked asynchronously and you configured a destination for your function, you will need to include that in the interface code. It will need to catch any business logic error and, based on that, invoke the right destination.
Package functions as containers
Lambda supports packaging functions as .zip files and container images. To develop portable code, we recommend using container images as your default packaging method. Even though you package the function as a container image, you can’t run it on other container platforms such as Amazon Elastic Container Service (Amazon ECS) or Amazon Elastic Kubernetes Service (EKS). However, by packaging it this way, the migration to containers later will be easier as you are already using the same tools and you already created a Dockerfile that will require minimal changes.
An example Dockerfile for Lambda looks like this:
FROM public.ecr.aws/lambda/python:3.9
COPY *.py requirements.txt ./
RUN python3.9 -m pip install -r requirements.txt -t .
CMD ["app.lambda_handler"]
If you move to containers later, you will need to change the Dockerfile to use a different base image and adapt the CMD line that defines how to start the application. This is in addition to the code changes described in the previous section.
The corresponding Dockerfile for the container will look like this:
FROM python:3.9
COPY *.py requirements.txt ./
RUN python3.9 -m pip install -r requirements.txt -t .
CMD ["python", "./app.py"]
The deployment pipeline also needs to change as we deploy to a different target. However, building the artifacts remains the same.
Single invocation per instance
Lambda functions run in their own isolated runtime environment. Each environment handles a single request at a time which works great for Lambda. However, if you migrate your application to containers, you will likely invoke the business logic from multiple threads in a single process at the same time.
This section discusses aspects of moving from a single invocation to multiple concurrent invocations within the same process.
Static variables
Static variables are those that are instantiated once and then reused across multiple invocations. Examples of such variables are database connections or configuration information.
For function optimization, and specifically for reducing cold starts and the duration of warm function invocations, we recommend initializing all static variables outside the function handler and storing them in global variables so that further invocations will reuse them.
We recommend using an initialization function that you write as part of the business logic module and that you invoke from outside the handler. This function saves information in global variables that the business logic code reuses across invocations.
The following pseudocode shows the Lambda function:
import business_logic

# Call the initialization code
initialize()

handler(event, context) {
  ...
  # Call the business logic
  ...
}
And the business logic code will look like this:
# Global variables used to store static data
var config

initialize() {
  config = read_Config()
}

do_some_logic(data) {
  # Do something with config object
  ...
}
The same also applies to containers. You will usually initialize static variables when the process starts and not for every single request. When moving to containers, all you need to do is call the initialization function before starting the main application loop.
import business_logic

# Call the initialization code
initialize()

main() {
  while True {
    ...
    # Call the business logic
    ...
  }
}
As you can see, there are no changes in the business logic code.
Database connections
As Lambda functions share nothing between the runtime environments, unlike containers they can’t rely on connection pools when connecting to a relational database. For this reason, we created Amazon RDS Proxy, which acts as a centralized connection pool used by many functions.
To write portable Lambda functions, we recommend using a connection pool object with a single connection. Your business logic code will always ask for a connection from the pool when making a database request. You will still need to use RDS Proxy.
If you later move to containers, you can increase the number of connections in the pool to a larger number with no further changes and the application will scale without overwhelming the database.
File system
Lambda functions come with a writable /tmp folder in the size of 512 MB to 10 GB. As each function instance runs in an isolated runtime environment, developers usually use fixed file names for files stored in that folder. If you run the same business logic code in a container in multiple threads, the different threads will overwrite the files created by others.
We recommended using unique file names in each invocation. Append a UUID or another random number to the file name. Delete the files once you are done with them to avoid running out of space.
If you move your code to containers later, there is nothing to do.
Portable web applications
If you develop a web application, there is another way to achieve portability. You can use the AWS Lambda Web Adapter project to host a web app inside a Lambda function. This way you can develop a web application with familiar frameworks (e.g., Express.js, Next.js, Flask, Spring Boot, Laravel, or anything that uses HTTP 1.1/1.0), and run it on Lambda. If you package your web application as a container, the same Docker image can run on Lambda (using the web adapter) and containers.
Porting from containers to Lambda
This blog post demonstrates how to develop portable Lambda functions you can easily port to containers. Taking these recommendations into consideration can also help develop portable code in general, which allows you to port containers to Lambda functions.
Some things to consider:
Separate the business logic from the interface code in the container. The interface code should interact with the event sources and invoke the business logic.
As Lambda functions only have a /tmp writable folder, replicate this in your containers (even though you could write to different locations).
Conclusion
This blog post suggests best practices for developing Lambda functions that allow you to gain the benefits of a serverless approach without risking lock-in.
By following these best practices for separating business logic from Lambda handlers, packaging functions as containers, handling Lambda’s single invocation per instance, and more, you can develop portable Lambda functions. As a consequence, you will be able to port your code from Lambda to containers with minimal effort if you choose to move to containers later.
Refer to these best practices and code samples to ease the adoption of a serverless approach when developing your next application.
For more serverless learning resources, visit Serverless Land.
This blog post is written by Alexey Paramonov, Solutions Architect, ISV and Maximilian Schellhorn, Solutions Architect ISV
This blog post demonstrates a solution based on AWS Step Functions and Amazon API Gateway WebSockets to track execution progress of a long running workflow. The solution updates the frontend regularly and users are able to track the progress and receive detailed status messages.
Websites with long-running processes often don’t provide feedback to users, leading to a poor customer experience. You might have experienced this when booking tickets, searching for hotels, or buying goods online. These sites often call multiple backend and third-party endpoints and aggregate the results to complete your request, causing the delay. In these long running scenarios, a transparent progress tracking solution can create a better user experience.
API Gateway to provide a WebSocket API for bidirectional communications between clients and the backend.
Amazon DynamoDB for storing connection IDs from the clients.
The example provides different options to report the progress back to the WebSocket connection by using Step Functions SDK integration, Lambda integrations, or Amazon EventBridge.
The following diagram outlines the example:
The user opens a connection to WebSocket API. The OnConnect and OnDisconnect Lambda functions in the “WebSocket Connection Management” section persist this connection in DynamoDB (see documentation). The connection is bidirectional, meaning that the user can send requests through the open connection and the backend can respond with a new progress status whenever it is available.
The user sends a new order through the WebSocket API. API Gateway routes the request to the “OnOrder” AWS Lambda function, which starts the state machine execution.
As the request propagates through the state machine, we send progress updates back to the user via the WebSocket API using AWS SDK service integrations.
For more customized status responses, we can use a centralized AWS Lambda function “ReportProgress” that updates the WebSocket API.
How to respond to the client?
To send the status updates back to the client via the WebSocket API, three options are explored:
Option 1: AWS SDK integration with API Gateway invocation
As the diagram shows, the API Gateway workflow tasks starting with the prefix “Report:” send responses directly to the client via the WebSocket API. This is an example of the state machine definition for this step:
This option reports the progress directly without using any additional Lambda functions. This limits the system complexity, reduces latency between the progress update and the response delivered to the client, and potentially reduces costs by reducing Lambda execution duration. A potential drawback is the limited customization of the response and getting familiar with the definition language.
Option 2: Using a Lambda function for reporting the progress status
To further customize response logic, create a Lambda function for reporting. As shown in point 4 of the diagram, you can also invoke a “ReportProgress” function directly from the state machine. This Python code snippet reports the progress status back to the WebSocket API:
This option allows for more customizations and integration into the business logic of other Lambda functions to track progress in more detail. For example, execution of loops and reporting back on every iteration. The tradeoff is that you must handle exceptions and retries in your code. It also increases overall system complexity and additional costs associated with Lambda execution.
Option 3: Using EventBridge
You can combine option 2 with EventBridge to provide a centralized solution for reporting the progress status. The solution also handles retries with back-off if the “ReportProgress” function can’t communicate with the WebSocket API.
You can also use AWS SDK integrations from the state machine to EventBridge instead of using API Gateway. This has the additional benefit of a loosely coupled and resilient system but you could experience increased latency due to the additional services used. The combination of EventBridge and the Lambda function adds a minimal latency, but it might not be acceptable for short-lived workflows. However, if the workflow takes tens of seconds to complete and involves numerous steps, option 3 may be more suitable.
This is the architecture:
As before.
As before.
AWS SDK integration sends the status message to EventBridge.
The message propagates to the “ReportProgress” Lambda function.
The Lambda function sends the processed message through the WebSocket API back to the client.
Deploying the example
Prerequisites
Make sure you can manage AWS resources from your terminal.
Copy the value of WebSocketURL in the output for later.
The backend is now running. To test it, use a hosted frontend.
Alternatively, you can deploy the React-based frontend on your local machine:
Navigate to “progress-tracker-frontend/”:
cd progress-tracker-frontend
Launch the react app:
npm start
The command opens the React app in your default browser. If it does not happen automatically, navigate to http://localhost:3000/ manually.
Now the application is ready to test.
Testing the example application
The webpage requests a WebSocket URL – this is the value from the AWS SAM template deployment. Paste it into Enter WebSocket URL in the browser and choose Connect.
On the next page, choose Send Order and watch how the progress changes. This sends the new order request to the state machine. As it progresses, you receive status messages back through the WebSocket API.
Optionally, you can inspect the raw messages arriving to the client. Open the Developer tools in your browser and navigate to the Network tab. Filter for WS (stands for WebSocket) and refresh the page. Specify the WebSocket URL, choose Connect and then choose Send Order.
Cleaning up
The services used in this solution are eligible for AWS Free Tier. To clean up the resources, in the root directory of the repository run:
sam delete
This removes all resources provisioned by the template.yml file.
Conclusion
In this post, you learn how to augment your Step Functions workflows with low latency progress tracking via API Gateway WebSockets. Consider adding the progress tracking to your long running workflows to improve the customer experience and provide a reactive look and feel for your application.
Navigate to the GitHub repository and review the implementation to see how your solution could become more user friendly and responsive. Start with examining the template.yml and the state machine’s definition and see how the frontend handles WebSocket communication and message visualization.
For more serverless learning resources, visit Serverless Land.
In this blog post, we show you how to build an event-driven and serverless solution for property leasing and search that is scalable and resilient. This solution was created for AvalonBay Communities, Inc.—a leading residential Real Estate Investment Trusts (REITs). It enables:
More than 150,000 multi-parameter searches per day
The processing of more than 3,500 lease applications and 85,000 individual rent payments per month
Introduction
AvalonBay is an equity REIT. The company has a long track record of developing, redeveloping, acquiring, and managing apartment homes in top U.S. markets. AvalonBay builds long-term value for customers using innovative technology solutions.
The company understands that data-driven insights contribute to targeted business growth. But AvalonBay found that managing the complex interdependencies between multiple data sets—from real estate and property management systems to financial and payment systems—required a new solution.
The challenge
AvalonBay owned or held a direct or indirect ownership interest in 293 apartment communities containing 88,405 apartment homes in 12 states and Washington, D.C., as of September 30, 2022.
Of these, 18 communities were under development and one was under redevelopment. This presented a unique challenge to both internal and external users looking to search and lease apartment units based on multi-parameter selection criteria in geographically dispersed regions. For example, finding units in buildings with specific amenities, lease terms, furnishings and availability dates.
Overview of solution
AvalonBay’s fully managed leasing solution for applicants and residents is hosted by Amazon Web Services (AWS). The solution is secure, autoscaling, and multi-region, ensuring resiliency and performance with efficient resource usage.
In this event-driven solution, AvalonBay’s leasing service is hosted in multiple AWS Regions to provide low latency response to users across various geolocations. This blog post focuses on showing use case implementation in only one region—Region East— as shown in Figure 1.
Figure 1. AvalonBay lease processing platform
Several AWS services come together in this solution to meet key company objectives. Let’s explore each one and its purpose within the architecture.
Amazon Route 53: For AvalonBay’s Lease Processing solution, any non-transient service failure is unacceptable. In addition to providing a high degree of resiliency through a Multi-AZ architecture, Lease Processing also provides regional-level high availability through its multi-Region active-active architecture. Route 53 with latency-based routing allows dynamic rerouting of requests within seconds to alternate Regions.
AWS Lambda with provisioned concurrency: The Lambda services are set up for automatic scaling, secured through a private subnet, and span across Availability Zones. This provides horizontal scaling capability, self-healing capacity, and resiliency across Availability Zones. Provisioned concurrency minimizes the estimate of cold starts by generating execution environments. It also greatly reduces time spent on APIs invocations.
Amazon Aurora V2 for Amazon Relational Database Service (Amazon RDS) PostgreSQL-Compatible Edition: Aurora Serverless V2 is an on-demand, autoscaling configuration for Aurora. Serverless Aurora V2 PostgreSQL-Compatible is used for the Lease Processing solution. The global database was configured with two Regions; us-east-1 as the primary cluster and us-west-2 as the secondary cluster. Automated Aurora global database endpoint management for planned and unplanned failover is configured through a Route 53 private hosted zone, Amazon EventBridge, and Lambda.
Amazon RDS Proxy for Aurora: Amazon RDS Proxy allows the leasing application to pool and share database connections to improve its ability to scale. It also makes the leasing solution more resilient to database failures by automatically connecting to a standby database instance while preserving application connections.
Amazon EventBridge: EventBridge supports the solution through two primary purposes:
Oversees lease flow events – During the lease application process, the solution generates various events which are consumed by AvalonBay and external applications such as property management, finance portals, administration, and more. Leasing events are sent to EventBridge and various event rules are configured for multiple destinations including Lambda, Amazon Simple Notification Service (Amazon SNS), and external API endpoints.
Handles global Aurora V2 failover – Aurora generates events when certain actions are taken or events occur, including any type of global database activity.
When a managed planned failover is initiated—either via the AWS Command Line Interface (AWS CLI), API, or console—the global database failover process starts and generates an event.
When an Aurora cluster is removed from a global cluster through the AWS CLI, API, or console, the Aurora cluster is promoted as a single primary cluster. Once this process is completed, it generates an event.
An EventBridge rule is created to match an event pattern any time a global database managed planned failover completes successfully in a Region. When a failover is completed, the completion event is detected, and this rule is triggered. The event rule is configured to invoke a Lambda function that is triggered on global database failover and updates the Amazon CloudFront CNAME record to the correct value.
Scalable search solution
Leasing professionals need to easily scan a huge amount of property information using AvalonBay’s Search Solution to obtain required information.
Using the Amazon OpenSearch Service, agents can generate property profiles and other asset data to identify matching units and quickly respond to end customers. OpenSearch is a fully open-source search and analytics engine that securely unlocks real-time search, monitoring, and analysis of business and operational data. It is employed for use cases such as application monitoring, log analytics, observability, and website search.
The AvalonBay Search Service solution architecture featuring OpenSearch is shown in Figure 2.
Figure 2: AvalonBay Search Service solution architecture
OpenSearch automatically detects and replaces failed OpenSearch Service nodes, reducing the overhead associated with self-managed infrastructures.
Let’s explore this architecture further by step.
Amazon Kinesis event stream – The AvalonBay community requires near real-time updates to search attributes such as amenities, features, promotion, and pricing. Events created through various producers are streamed through Kinesis and inserted or updated through OpenSearch.
Amazon OpenSearch – OpenSearch is used for end-to-end community search—a managed service making it easy to deploy, operate, and scale OpenSearch clusters in the AWS Cloud. As community search data is read-only, UltraWarm and cold storage are also used based on usage frequency.
This post showed how AvalonBay has built and deployed custom leasing and search solutions on AWS serverless platforms without compromising resiliency, performance, and capacity requirements. This is a 24/7, fully managed solution with no additional equipment on-premises.
Choosing AWS for leasing and search solutions gives AvalonBay the ability to dynamically scale and meet future growth demands while introducing cost advantages. In addition, the global availability of AWS services makes it possible to deploy services across geographic locations to meet performance requirements.
This blog post is written by Wassim Benhallam, Sr Cloud Application Architect AWS WWCO ProServe, and Rajesh Kesaraju, Sr. Specialist Solution Architect, EC2 Flexible Compute.
Scaling an Amazon EC2 Auto Scaling group based on Amazon Simple Queue Service (Amazon SQS) is a commonly used design pattern in decoupled applications. For example, an EC2 Auto Scaling Group can be used as a worker tier to offload the processing of audio files, images, or other files sent to the queue from an upstream tier (e.g., web tier). For latency-sensitive applications, AWS guidance describes a common pattern that allows an Auto Scaling group to scale in response to the backlog of an Amazon SQS queue while accounting for the average message processing duration (MPD) and the application’s desired latency.
This post builds on that guidance to focus on latency-sensitive applications where the MPD varies over time. Specifically, we demonstrate how to dynamically update the target value of the Auto Scaling group’s target tracking policy based on observed changes in the MPD. We also cover the utilization of Amazon EC2 Spot instances, mixed instance policies, and attribute-based instance selection in the Auto Scaling Groups as well as best practice implementation to achieve greater cost savings.
The challenge
The key challenge that this post addresses is applications that fail to honor their acceptable/target latency in situations where the MPD varies over time. Latency refers here to the time required for any queue message to be consumed and fully processed.
Consider the example of a customer using a worker tier to process image files (e.g., resizing, rescaling, or transformation) uploaded by users within a target latency of 100 seconds. The worker tier consists of an Auto Scaling group configured with a target tracking policy. To achieve the target latency mentioned previously, the customer assumes that each image can be processed in one second, and configures the target value of the scaling policy so that the average image backlog per instance is maintained at approximately 100 images.
In the first week, the customer submits 1000 images to the Amazon SQS queue for processing, each of which takes one second of processing time. Therefore, the Auto Scaling group scales to 10 instances, each of which processes 100 images in 100s, thereby honoring the target latency of 100s.
In the second week, the customer submits 1000 slightly larger images for processing. Since an image’s processing duration scales with its size, each image takes two seconds to process. As in the first week, the Auto Scaling group scales to 10 instances, but this time each instance processes 100 images in 200s, which is twice as long as was needed in the first round. As a result, the application fails to process the latter images within its acceptable latency.
Therefore, the challenge is common to any latency-sensitive application where the MPD is subject to change. Applications where the processing duration scales with input data size are particularly vulnerable to this problem. This includes image processing, document processing, computational jobs, and others.
Solution overview
Before we dive into the solution, let’s briefly review the target tracking policy’s scaling metric and its corresponding target value. A target tracking scaling policy works by adjusting the capacity to keep a scaling metric at, or close to, the specified target value. When scaling in response to an Amazon SQS backlog, it’s good practice to use a scaling metric known as the Backlog Per Instance (BPI) and a target value based on the acceptable BPI. These are computed as follows:
Given the acceptable BPI equation, a longer MPD requires us to use a smaller target value if we are to process these messages in the same acceptable latency, and vice versa. Therefore, the solution we propose here works by monitoring the average MPD over time and dynamically adjusting the target value of the Auto Scaling group’s target tracking policy (acceptable BPI) based on the observed changes in the MPD. This allows the scaling policy to adapt to variations in the average MPD over time, and thus enables the application to honor its acceptable latency.
Solution architecture
To demonstrate how the approach above can be implemented in practice, we put together an example architecture highlighting the services involved (see the following figure). We also provide an automated deployment solution for this architecture using an AWS Serverless Application Model (AWS SAM) template and some Python code (repository link). The repository also includes a README file with detailed instructions that you can follow to deploy the solution. The AWS SAM template deploys several resources, including an autoscaling group, launch template, target tracking scaling policy, an Amazon SQS queue, and a few AWS Lambda functions that serve various functions described as follows.
The Amazon SQS queue is used to accumulate messages intended for processing, while the Auto Scaling group instances are responsible for polling the queue and processing any messages received. To do this, a launch template defines a bootstrap script that allows the group’s instances to download and execute a Python code when first launched. The Python code consumes messages from the Amazon SQS queue and simulates their processing by sleeping for the MPD duration specified in the message body. After processing each message, the instance publishes the MPD as an Amazon CloudWatch metric (see the following figure).
Figure 1: Architecture diagram showing the components deployed by the AWS SAM template.
To enable scaling, the Auto Scaling group is configured with a target tracking scaling policy that specifies BPI as the scaling metric and with an initial target value provided by the user.
The BPI CloudWatch metric is calculated and published by the “Metric-Publisher” Lambda function which is invoked every one minute using an Amazon EventBridge rate expression. To calculate BPI, the Lambda function simply takes the ratio of the number of messages visible in the Amazon SQS queue by the total number of in-service instances in the Auto Scaling group, as shown in equation (2) above.
On the other hand, the scaling policy’s target value is updated by the “Target-Setter” Lambda function, which is invoked every 30 minutes using another EventBridge rate expression. To calculate the new target value, the Lambda function simply takes the ratio of the user-defined acceptable latency value by the current average MPD queried from the corresponding CloudWatch metric, as shown in the previous equation (1).
Finally, to help you quickly test this solution, a Lambda function “Testing Lambda” is also provided and can be used to send messages to the Amazon SQS queue with a processing duration of your choice. This is specified within each message’s body. You can invoke this Lambda function with different MPDs (by modifying the corresponding environment variable) to verify how the Auto Scaling group scales in response. A CloudWatch dashboard is also deployed to enable you to track key scaling metrics through time. These include the number of messages visible in the queue, the number of in-service instances in the Auto Scaling group, the MPD, and BPI vs acceptable BPI.
Solution testing
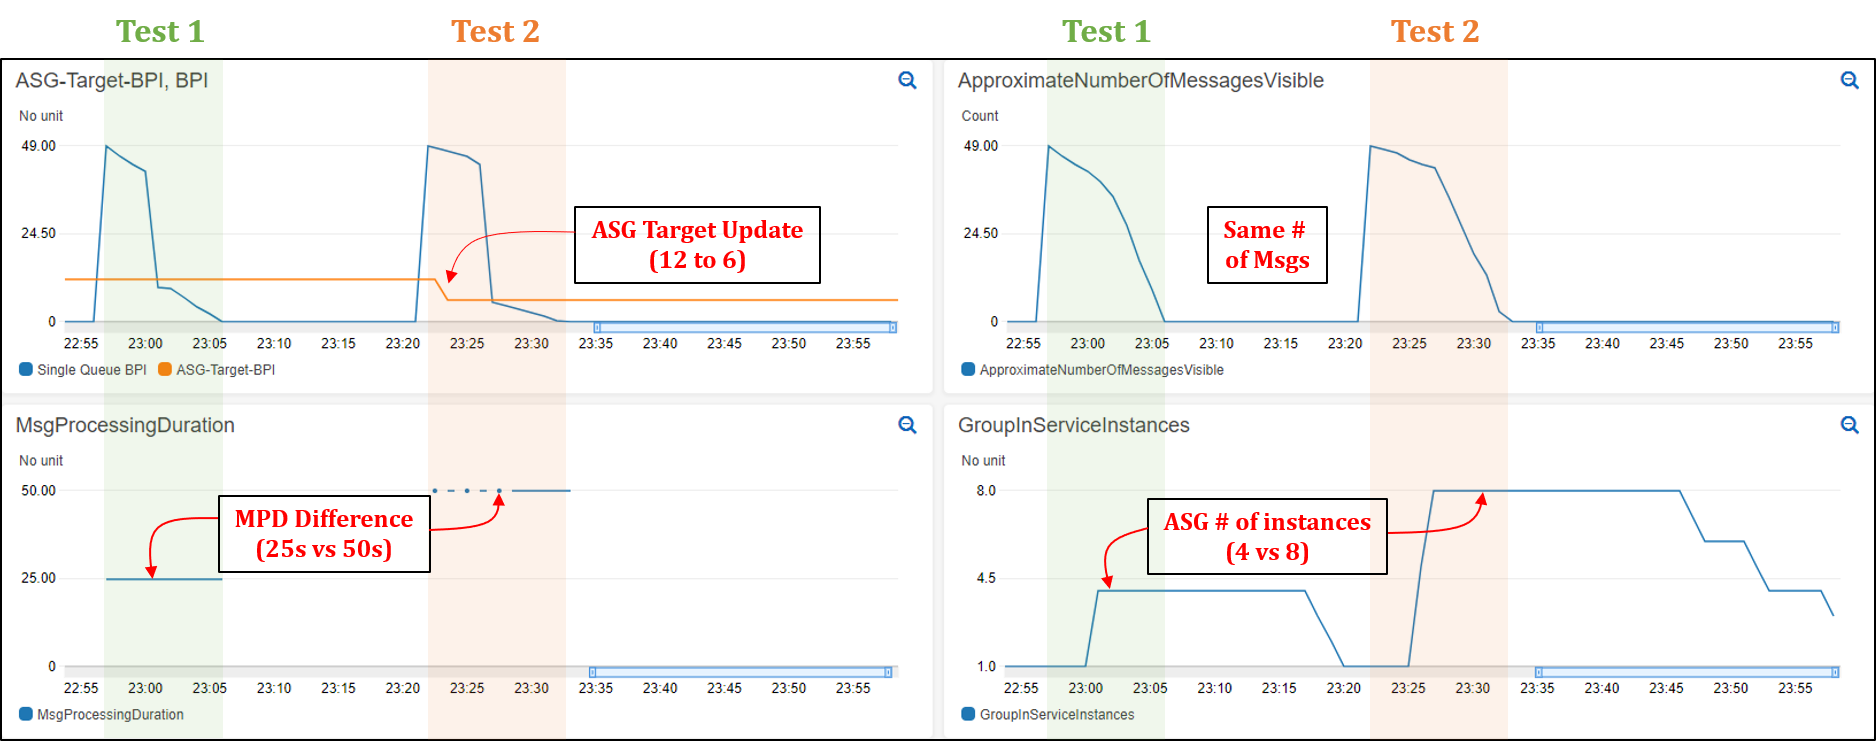
To demonstrate the solution in action and its impact on application latency, we conducted two tests that you can reproduce by following the instructions described in the “Testing” section of the repository’s README file (repository link). In both tests, we assume a hypothetical application with a target latency of 300s. We also modified the invocation frequency of the “Target Setter” Lambda function to one minute to quickly assess the impact of target value changes. In both tests, we submit 50 messages to the Amazon SQS queue through the provided helper lambda. An MPD of 25s and 50s was used for the first and second test, respectively. The provided CloudWatch dashboard shows that the ASG scales to a total of four instances in the first test, and eight instances in the second (see the following figure). See README file for a detailed description of how various metrics evolve over time.
Comparison of Tests 1 and 2
Since Test 2 messages take twice as long to process, the Auto Scaling group launched twice as many instances to attempt to process all of the messages in the same amount of time as Test 1 (latency). The following figure shows that the total time to process all 50 messages in Test 1 was 9 mins vs 10 mins in Test 2. In contrast, if we were to use a static/fixed acceptable BPI of 12, then a total of four instances would have been operational in Test 2, thereby requiring double the time of Test 1 (~20 minutes) to process all of the messages. This demonstrates the value of using a dynamic scaling target when processing messages from Amazon SQS queues, especially in circumstances where the MPD is prone to vary with time.
Figure 2: CloudWatch dashboard showing Auto Scaling group scaling test results (Test 1 and 2).
Recommended best practices for Auto Scaling groups
This section highlights a few key best practices that we recommend adopting when deploying and working with Auto Scaling groups.
Reducing cost using EC2 Spot instances
Amazon SQS helps build loosely coupled application architectures, while providing reliable asynchronous communication between the various layers/components of an application. If a worker node fails to process a message within the Amazon SQS message visibility time-out, then the message is returned to the queue and another worker node can pick up and process that message. This makes Amazon SQS-backed applications fault-tolerant by design and thus a great fit for EC2 Spot instances. EC2 spot instances are spare compute capacity in the AWS cloud that is available to you at steep discounts as compared to On-Demand prices.
Maximizing capacity using attribute-based instance selection
With the recently released attribute-based instance selection feature, you can define infrastructure requirements based on application needs such as vCPU, RAM, and processor family (e.g., x86, ARM). This removes the need to define specific instances in your Auto Scaling group configuration, and it eliminates the burden of identifying the correct instance families and sizes. In addition, newly released instance types will be automatically considered if they fit your requirements. Attribute-based instance selection lets you tap into hundreds of different EC2 instance pools, which increases the chance of getting EC2 (Spot/On-demand) instances. When using attribute-based instance selection with the capacity optimized allocation strategy, Amazon EC2 allocates instances from deeper Spot capacity pools, thereby further reducing the chance of Spot interruption.
The following sample configuration creates an Auto Scaling group with attribute-based instance selection:
As can be seen from the test results, this approach demonstrates how an Auto Scaling group can honor a user-provided acceptable latency constraint while accomodating variations in the MPD over time. This is possible because the average MPD is monitored and regularly updated as a CloudWatch metric. In turn, this is continously used to update the target value of the group’s target tracking policy. Moreover, we have covered additional Auto Scaling group best practices suitable for this use case, including the use of Spot instances to reduce costs and attribute-based instance selection to simplify the selection of relevant instance types.
This post is written by Arthi Jaganathan, Principal SA, Serverless and Dhiraj Mahapatro, Principal SA, Serverless.
Today, AWS is announcing three new Amazon CloudWatch metrics for asynchronous AWS Lambda function invocations: AsyncEventsReceived, AsyncEventAge, and AsyncEventsDropped. These metrics provide visibility for asynchronous Lambda function invocations.
Previously, customers found it challenging to monitor the processing of asynchronous invocations. With these new metrics for asynchronous function invocations, you can identify the root cause of processing issues. These issues include throttling, concurrency limit, function errors, processing latency because of retries, missing events, and taking corrective action.
This blog and the sample application provide examples that highlight the usage of the new metrics.
Overview
AWS services such as Amazon S3, Amazon SNS, and Amazon EventBridge invoke Lambda functions asynchronously. Lambda uses an internal queue to store events. A separate process reads events from the queue and sends them to the function.
By default, Lambda discards events from its event queue if the retry policy has exceeded the number of configured retries or the event reached its maximum age. However, the event once discarded from the event queue goes to the destination or DLQ, if configured.
Function errors (returned from code or runtime, such as timeouts)
Retry twice
Set retry attempt on function between 0-2
Throttles (429) and system errors (5xx)
Retry for a maximum of 6 hours
Set maximum age of event on function between 60 seconds to 6 hours
Zero reserved concurrency
No retry
N/A
What’s new
The AsyncEventsReceived metric is a measure of the number of events enqueued in Lambda’s internal queue. You can track events from the client using custom CloudWatch metrics or extract it from logs using Embedded Metric Format (EMF). In case this metric is lower than the number of events that you expect, it shows that the source did not emit events or events did not arrive at the Lambda service. This is possible because of transient networking issues. Lambda does not emit this metric for retried events.
The AsyncEventAge metric is a measure of the difference between the time that an event is first enqueued in the internal queue and the time the Lambda service invokes the function. With retries, Lambda emits this metric every time it attempts to invoke the function with the event. An increasing value shows retries because of error or throttles. Customers can set alarms on this metric to alert on SLA breaches.
The AsyncEventsDropped metric is a measure of the number of events dropped because of processing failure.
How to use the new async event metrics
This flowchart shows the way that you can combine the new metrics with existing metrics to troubleshoot problems with asynchronous processing:
Example application
You can deploy a sample Lambda function to show how to use the new metrics for troubleshooting.
To test the following scenarios, you must install:
Choose All Metrics under Metrics in the left-hand panel in the CloudWatch console and search for “async”:
Choose Lambda > By Function Name and choose AsyncEventsReceived for the function you created. Under “Graphed metrics”, change the statistic to sum and “Period” to 1 minute. You see one record. After waiting a few seconds, refresh if you don’t see the metric immediately.
Scenarios
These scenarios show how you can use the three new metrics.
Scenario 1: Troubleshooting delays due to function error
Lambda retries processing the asynchronous invocation event for a maximum of two times, in case of function error or exception. Lambda drops the event from its internal queue if the retries are exhausted.
To simulate a function error, throw an exception from the Lambda handler:
Edit the function code in hello_world/app.py to raise an exception:
def handler(event, context):
  print(“Hello from AWS Lambda”)
  raise Exception(“Lambda function throwing exception”)
It is best practice to alert on function errors using the error metric and use the metrics to get better insights into retry behavior, such as interval between retries. For example, if a function errors because of a downstream system being overwhelmed, you can use AsyncEventAge and Concurrency metrics.
If you received an alert for function error, you see data points for AsyncEventsDropped. It is 1 for this scenario. Overlaying the Errors and Throttles metrics reconfirms function error causes this.
There are two retries before the Lambda service drops the event. No throttling confirms the function error. Next, you can confirm that the AsyncEventAge is increasing. Lambda publishes this metric every time it polls from the event queue and sends it to the function. This creates multiple data points for the metric.
You can duplicate the metric to see both statistics on a single graph. Here, the two lines overlap because there is only one data point published in each 1-minute interval.
The event spent 37ms in the internal queue before the first invoke attempt. Lambda’s first retry happens after 63.5 seconds. The second and final retry happens after 189.6 seconds.
Scenario 2: Troubleshooting delays because of concurrency limits
In case of throttling or system errors, Lambda retries invoking the event up to the configured MaximumEventAgeInSeconds (the maximum is 6 hours). To simulate the throttling error without hitting the account concurrency limit, you can:
Set the function reserved concurrency to 1
Introduce a 90 seconds sleep in the function code to simulate a lengthy function execution.
The Lambda service throttles new invocations while the first request is in progress. You invoke the function in quick succession from the command line to simulate throttling and observe the retry behavior:
Set the function reserved concurrency to 1 by updating the AWS SAM template.
Edit the function code in hello_world/app.py to introduce a 90-second sleep. Replace existing code with the following in app.py:
import time

def handler(event, context):
  time.sleep(90)
  print("Hello from AWS Lambda")
Build and deploy:
sam build && sam deploy --region $REGION
Invoke the function twice in succession from the command line:
for i in {1..2}; do aws lambda invoke \
  --region $REGION \
  --function-name $FUNCTION_NAME \
  --invocation-type Event out_file.txt; done
In a real-world use case, missing the processing SLA should trigger the troubleshooting workflow. Start with AsyncEventsReceived to confirm events enqueued by the Lambda service. This is 2 in this scenario. Look for dropped events using AsyncEventsDropped metric.
AsyncEventAge verifies delays in processing. As mentioned in the previous section, there can be multiple data points for this metric in a one-minute interval. You can duplicate the metric to compare minimum and maximum values.
There are 2 data points in the first minute. The event age increases to 31 seconds during this period.
There is only one data point for the metric in the remaining one-minute intervals, so the lines overlap. The event age increases to 59,153ms (~59 seconds) in one interval and then to 130,315ms (~130 seconds) in the next one-minute interval. Since the function sleeps for 90 seconds, it explains why the final retry is at around 2 minutes since the function received the event.
Checking function throttling, this screenshot confirms throttling six times in the first minute (07:12 UTC timestamp) and once in the subsequent minute (07:13 UTC timestamp).
This is because of the back-off behavior of Lambda’s internal queue. The data for AsyncEventAge shows that there is only one throttle in the second interval. Lambda delivers the event during the next one-minute interval after spending around 2 minutes in the internal queue.
Overlaying the ConcurrentExecutions and AsyncEventsReceived metrics provides more information. You see receipt of two events, but concurrency stayed at 1. This results in one event being throttled:
There are multiple ways to resolve throttling errors. You optimize the function to run faster or increase the function or account concurrency limits to address throttling errors.
Use the following command and follow the prompts to clean up the resources:
sam delete lambda-async-metric --region $REGION
Conclusion
Using these new CloudWatch metrics, you can gain visibility into the processing of Lambda asynchronous invocations. This blog explained the new metrics AsyncEventsReceived, AsyncEventAge, and AsyncEventsDropped and how to use them to troubleshoot issues. With these new metrics, you can track the asynchronous invocation requests sent to Lambda functions. You monitor any delays in processing, and take corrective actions if required.
This post is written by John Ritsema (Principal Solutions Architect)
Continuous integration and continuous delivery (CI/CD) pipelines are effective mechanisms that allow teams to turn source code into running applications. When a developer makes a code change and pushes it to a remote repository, a pipeline with a series of steps can process the change. A pipeline integrates a change with the full code base, verifies the style and formatting, runs security checks, and runs unit tests. As the final step, it builds the code into an artifact that is deployable to an environment for consumption.
When using GitHub or many other hosted Git providers, a pull request or merge request can be submitted for a particular code change. This creates a focused place for discussion and collaboration on the change before it is approved and merged into a shared code branch.
A powerful mechanism for collaboration involves deploying a pull request (PR) to a running environment. This allows stakeholders to preview the changes live and see how they would look. Spinning up a running environment quickly allows teammates to provide almost immediate feedback, expediting the entire development process.
Deploying PRs to ephemeral environments encourages teams to make many small changes that can be previewed and tested in parallel. This avoids having to first merge into a common source branch and deploy to long-lived environments that are always on and incur costs.
Creating this mechanism has several challenges including setup complexity, environment creation time, and environment cost. This post addresses these challenges by showing how to create a CI/CD pipeline for previewing changes to web applications in ephemeral, quick-to-provision, low-cost, and scale-to-zero environments. This post walks through the steps required to set up a sample application.
Example architecture
The concepts in this post can be implemented using a number of tools and hosted Git providers that connect to CI/CD pipelines. The example code shared in this post uses GitHub Actions to trigger a workflow. The workflow uses a small Terraform module with Docker to build the application source code into a container image, push it to Amazon Elastic Container Registry (ECR), and create an AWS Lambda function with the image.
The container running on Lambda is accessible from a web browser through a Lambda function URL. This provides a dedicated HTTPS endpoint for a function.
This is used instead of AWS App Runner, Amazon ECS Fargate with an Application Load Balancer (ALB), or Amazon EKS with ALB ingress because of speed of provisioning and low cost. Lambda function URLs are ideal for occasionally used ephemeral PR environments as they can be provisioned quickly. Lambda’s scale-to-zero compute environment leads to lower cost, as charges are only incurred for actual HTTP requests. This is useful for PRs that may only be reviewed infrequently and then sit idle until the PR is either merged or closed.
This is the example architecture:
Setting up the example
The sample project shows how to implement this example. It consists of a vanilla web application written in Node.js. All of the code needed to implement the architecture is contained within the .github directory. To enable ephemeral environments for a new project, copy over the .github directory without cluttering your project files.
There are two main resources needed to run Terraform inside of GitHub Actions: an AWS IAM role and a place to store Terraform state. AWS credentials are required to give the pipeline permission to provision AWS resources.
Instead of using static IAM user credentials that must be rotated and secured, assume an IAM role to obtain temporary credentials. Terraform remote state is needed to dispose of the environment when the PR is merged or closed. The sample project uses an Amazon S3 bucket to store Terraform state.
You can use the Terraform module located under .github/setup to create these required resources.
Provide the name of your GitHub organization and repository in the terraform.tfvars file as input parameters. You can replace aws-samples with your GitHub user name:
cd .github/setup
terraform init && terraform apply
Store the outputted terraform.tfstate file safely so that you can manage these resources in the future if needed.
Place the Region, generated IAM role, and bucket name into the configuration file located under .github/workflows/config.env. This configuration file is read and used by the GitHub Actions workflow.
export AWS_REGION="<add region from setup>"

export AWS_ROLE="<add role from setup>"

export TF_BACKEND_S3_BUCKET="<add bucket from setup>"
This IAM role has an inline policy that contains the minimum set of permissions needed to provision the AWS resources. This assumes that your application does not interact with external services like databases or caches. If your application needs this additional access, you can add the required permissions to the policy located here.
Running a web server in Lambda
The sample web (HTTP) application includes a Dockerfile that contains instructions for packaging the web app into a process-based container image. A Lambda extension called Lambda Web Adapter enables you to run this standard web server process on Lambda. The CI/CD workflow makes a copy of the Dockerfile and adds the following line.
This line copies the Lambda Web Adapter executable binary from a public ECR image and writes it into the container in the /opt/extensions/ directory. When the container starts, Lambda starts the Lambda Web Adapter extension. This translates Lambda event payloads from HTTP-based triggers into actual HTTP requests that it proxies to the web app running inside the container. This is the architecture:
By default, Lambda Web Adapter assumes that the web app is listening on port 8080. However, you can change this in the Dockerfile by setting the PORT environment variable.
The containerized web app experiences a “cold start”. However, this is likely not too much of a concern, as the app will only be previewed internally by teammates.
Workflow pipeline
The GitHub Actions job defined in the up.yml workflow is triggered when a PR is opened or reopened against the repository’s main branch. The following is a summary of the steps that the Job performs.
Read the configuration from .github/workflows/config.env
Assume the IAM Role, which has minimal permissions to deploy AWS resources
Install the Terraform CLI
Add the Lambda Web Adapter extension to the copy of the Dockerfile
Run terraform apply to provision the AWS resources using the S3 bucket for Terraform remote state
Obtain the HTTPS endpoint from Terraform and add it to the PR as a comment
The following code snippet shows the key steps (4-6) from the up.yml workflow.
The main.tf file (in the same directory) includes infrastructure as code (IaC) that is responsible for creating an ECR repository, building and pushing the container image to it, and spinning up a Lambda function based on the image. The following is a snippet from the Terraform configuration. You can see how concisely this can be configured.
Terraform outputs the generated HTTPS endpoint. The workflow writes it back to the PR as a comment so that teammates can click on the link to preview the changes:
The workflow takes about 60 seconds to spin up a new isolated containerized web application in an ephemeral environment that can be previewed.
Pull request collaboration
The following screenshot shows an example PR as the author collaborates with their team. After implementing this example, when a new PR arrives, the changes are deployed to a new ephemeral environment. Stakeholders can use the link to preview what the changes look like and provide feedback.
Once the changes are approved and merged into the main branch, the GitHub Actions down.yml workflow disposes of the environment. This means that the ephemeral environment is de-provisioned, including resources like the Lambda function and the ECR repository.
Conclusion
This post discusses some of the benefits of using ephemeral environments in CI/CD pipelines. It shows how to implement a pipeline using GitHub Actions and Lambda Function URLs for fast, low-cost, and ephemeral environments.
With this example, you can deploy PRs quickly, and the cost is based on HTTP requests made to the environment. There are no compute costs incurred while a PR is open and no one is previewing the environment. The only charges are for Lambda invocations, while stakeholders are actively interacting with the environment. When a PR is merged or closed, the cloud infrastructure is disposed of. You can find all of the example code referenced in this post here.
For more serverless learning resources, visit Serverless Land.
This blog post is written by Katja-Maja Krödel, IoT Specialist Solutions Architect, and Benjamin Meyer, Senior Solutions Architect, Game Tech.
Customers use Amazon Elastic Compute Cloud (Amazon EC2) instances to develop, deploy, and test applications. To use those instances most effectively, customers have expressed the need to set back their instance to a previous state within minutes or even seconds. They want to find a quick and automated way to manage setting back their instances at scale.
The feature of replacing Root Volumes of Amazon EC2 instances enables customers to replace the root volumes of running EC2 instances to a specific snapshot or its launch state. Without stopping the instance, this allows customers to fix issues while retaining the instance store data, networking, and AWS Identity and Access Management (IAM) configuration. Customers can resume their operations with their instance store data intact. This works for all virtualized EC2 instances and bare metal EC2 Mac instances today.
In this post, we show you how to design your architecture for automated Root Volume Replacement using this Amazon EC2 feature. We start with the automated snapshot creation, continue with automatically replacing the root volume, and finish with how to keep your environment clean after your replacement job succeeds.
What is Root Volume Replacement?
Amazon EC2 enables customers to replace the root Amazon Elastic Block Store (Amazon EBS) volume for an instance without stopping the instance to which it’s attached. An Amazon EBS root volume is replaced to the launch state, or any snapshot taken from the EBS volume itself. This allows issues to be fixed, such as root volume corruption or guest OS networking errors. Replacing the root volume of an instance includes the following steps:
A new EBS volume is created from a previously taken snapshot or the launch state
Reboot of the instance
While rebooting, the current root volume is detached and the new root volume is attached
The previous EBS root volume isn’t deleted and can be attached to an instance for later investigation of the volume. If replacing to a different state of the EBS than the launch state, then a snapshot of the current root volume is used.
An example use case is a continuous integration/continuous deployment (CI/CD) System that builds on EC2 instances to build artifacts. Within this system, you could alter the installed tools on the host and may cause failing builds on the same machine. To prevent any unclean builds, the introduced architecture is used to clean up the machine by replacing the root volume to a previously known good state. This is especially interesting for EC2 Mac Instances, as their Dedicated Host won’t undergo the scrubbing process, and the instance is more quickly restored than launching a fresh EC2 Mac instance on the same host.
Overview
The feature of replacing Root Volumes was introduced in April 2021 and has just been <TBD> extended to work for Bare Metal EC2 Mac Instances. This means that EC2 Mac Instances are included. If you want to reset an EC2 instance to a previously known good state, then you can create Snapshots of your EBS volumes. To reset the root volume to its launch state, no snapshot is needed. For non-root volumes, you can use these Snapshots to create new EBS volumes, and then attach those to your instance as well as detach them. To automate the process of replacing your root volume not only once, but also in a repeatable manner, we’re introducing you to an architecture that can fully-automate this process.
In the case that you use a snapshot to create a new root volume, you must take a new snapshot of that volume to be able to get back to that state later on. You can’t use a snapshot of a different volume to restore to, which is the reason that the architecture includes the automatic snapshot creation of a fresh root volume.
The architecture is built in three steps:
Automation of Snapshot Creation for new EBS volumes
Automation of replacing your Root Volume
Preparation of the environment for the next Root Volume Replacement
The following diagram illustrates the architecture of this solution.
In the next sections, we go through these concepts to design the automatic Root Volume Replacement Task.
Automation of Snapshot Creation for new EBS volumes
The figure above illustrates the architecture for automatically creating a snapshot of an existing EBS volume. In this architecture, we focus on the automation of creating a snapshot whenever a new EBS root volume is created.
Amazon EventBridge is used to invoke an AWS Lambda function on an emitted createVolume event. For automated reaction to the event, you can add a rule to the EventBridge which will forward the event to an AWS Lambda function whenever a new EBS volume is created. The rule within EventBridge looks like this:
The code of the function uses the resource ARN within the received event and requests resource details about the EBS volume from the Amazon EC2 APIs. Since the event doesn’t include information if it’s a root volume, then you must verify this using the Amazon EC2 API.
The following is a summary of the tasks of the Lambda function:
Extract the EBS ARN from the EventBridge Event
Verify that it’s a root volume of an EC2 Instance
Call the Amazon EC2 API create-snapshot to create a snapshot of the root volume and add a tag replace-snapshot=true
Then, the tag is used to clean up the environment and get rid of snapshots that aren’t needed.
As an alternative, you can emit your own event to EventBridge. This can be used to automatically create snapshots to which you can restore your volume. Instead of reacting to the createVolume event, you can use a customized approach for this architecture.
Automation of replacing your Root Volume
The figure above illustrates the procedure of replacing the EBS root volume. It starts with the event, which is created through the AWS Command Line Interface (AWS CLI), console, or usage of the API. This leads to creating a new volume from a snapshot or using the initial launch state. The EC2 instance is rebooted, and during that time the old root volume is detached and a new volume gets attached as the root volume.
To invoke the create-replace-root-volume-task, you can call the Amazon EC2 API with the following AWS CLI command:
After running this command, AWS will create a new EBS volume, add the tag to the old EBS replaced-volume=true, restart your instance, and attach the new volume to the instance as the root volume. The tag is used later to detect old root volumes and clean up the environment.
If this is combined with the earlier explained automation, then the automation will immediately take a snapshot from the new EBS volume. A restore operation can only be done to a snapshot of the current EBS root volume. Therefore, if no snapshot is taken from the freshly restored EBS volume, then no restore operation is possible except the restore to launch state.
Preparation of the Environment for the next Root Volume Replacement
After the task is completed, the old root volume isn’t removed. Additionally, snapshots of previous root volumes can’t be used to restore current root volumes. To clean up your environment, you can schedule a Lambda function which does the following steps:
Delete detached EBS volumes with the tag delete-volume=true
Delete snapshots with the tag replace-snapshot=true, which aren’t associated with an existing EBS volume
Conclusion
In this post, we described an architecture to quickly restore EC2 instances through Root Volume Replacement. The feature of replacing Root Volumes of Amazon EC2 instances, now including Bare Metal EC2 Mac instances, enables customers to replace the root volumes of running EC2 instances to a specific snapshot or its launch state. Customers can resume their operations with their instance store data intact. We’ve split the process of doing this in an automated and quick manner into three steps: Create a snapshot, run the replacement task, and reset your environment to be prepared for a following replacement task. If you want to learn more about this feature, then see the Announcement of replacing Root Volumes, as well as the documentation for this feature. <TBD Announcement Bare Metal>
Leading modern application platform space OutSystems is a low-code platform that provides tools for companies to develop, deploy, and manage omnichannel enterprise applications.
Security is a top priority at OutSystems. Their Security Operations Center (SOC) deals with thousands of incidents a year, each with a set of response actions that need to be executed as quickly as possible. Providing security at such large scale is a challenge, even for the most well-prepared organizations. Manual and repetitive tasks account for the majority of the response time involved in this process, and decreasing this key metric requires orchestration and automation.
Security orchestration, automation, and response (SOAR) systems are designed to translate security analysts’ manual procedures into automated actions, making them faster and more scalable.
In this blog post, we’ll explore how OutSystems lowered their incident response time by 99 percent by designing and deploying a custom SOAR using Serverless services on AWS.
Solution architecture
Security incidents happen with unknown frequency, making serverless services a natural fit to boost security at OutSystems because of their increased agility and capability to scale to zero.
There are two ways to trigger SOAR actions in this architecture:
Automatically through Security Information and Event Management (SIEM) security incident findings
On-demand through chat application
Using the first method, when a security incident is detected by the SIEM, an event is published to Amazon Simple Notification Service (Amazon SNS). This triggers an AWS Lambda function that creates a ticket in an internal ticketing system. Then the Lambda Playbooks function triggers to decide which playbook to run depending on the incident details.
Each playbook is a set of actions that are executed in response to a trigger. Playbooks are the key component behind automated tasks. OutSystems uses AWS Step Functions to orchestrate the actions and Lambda functions to execute them.
But this solution does not exist in isolation. Depending on the playbook, Step Functions interacts with other components such as AWS Secrets Manager or external APIs.
Using the second method, the on-demand trigger for OutSystems SOAR relies on a chat application. This application calls a Lambda function URL that interacts with the playbooks we just discussed.
Figure 1 represents the high-level architecture of OutSystems’ custom SOAR.
This same IaC architecture is used when new playbooks or updates to existing ones are made. Code changes that are committed to a source control repository trigger the CodePipeline which uses AWS CodeBuild and CloudFormation change sets to deploy the updates to the affected resources.
Use cases
The use cases that OutSystems has deployed playbooks for to date include:
SQL injection
Unauthorized access to credentials
Issuance of new certificates
Login brute forces
Impossible travel
Let’s explore the Impossible travel use case. Impossible travel happens when a user logs in from one location, and then later logs in from a different location that would be impossible to travel between within the elapsed time.
When the SIEM identifies this behavior, it triggers an alert and the following actions are performed:
A ticket is created
An IP address check is performed in reputation databases, such as AbuseIPDB or VirusTotal
An IP address check is performed in the internal database, and the IP address is added if it is not found
A search is performed for past events with the same IP address
Recent logins of the user are identified in the SIEM, along with all related information
All of this information is automatically added to the ticket. Every step listed here was previously performed manually; a task that took an average of 15 minutes. Now, the process takes just 8 seconds—a 99.1% incident response time improvement.
The following remediation actions can also be automated, along with many others:
Some of these remediation actions are already in place, while others are in development.
Conclusion
At OutSystems, much like at AWS, security is considered “job zero.” It is not only important to be proactive in preventing security incidents, but when they happen, the response must be quick, effective, and as immune to human error as possible.
With the implementation of this custom SOAR, OutSystems reduced the average response time to security incidents by 99%. Tasks that previously took 76 hours of analysts’ time are now accomplished automatically within 31 minutes.
During the evaluation period, SOAR addressed hundreds of real-world incidents with some threat intel use cases being executed thousands of times.
An architecture composed of serverless services ensures OutSystems does not pay for systems that are standing by waiting for work, and at the same time, not compromising on performance.
Secrets managers are a great tool to securely store your secrets and provide access to secret material to a set of individuals, applications, or systems that you trust. Across your environments, you might have multiple secrets managers hosted on different providers, which can increase the complexity of maintaining a consistent operating model for your secrets. In these situations, centralizing your secrets in a single source of truth, and replicating subsets of secrets across your other secrets managers, can simplify your operating model.
This blog post explains how you can use your third-party secrets manager as the source of truth for your secrets, while replicating a subset of these secrets to AWS Secrets Manager. By doing this, you will be able to use secrets that originate and are managed from your third-party secrets manager in Amazon Web Services (AWS) applications or in AWS services that use Secrets Manager secrets.
I’ll demonstrate this approach in this post by setting up a sample open-source HashiCorp Vault to create and maintain secrets and create a replication mechanism that enables you to use these secrets in AWS by using AWS Secrets Manager. Although this post uses HashiCorp Vault as an example, you can also modify the replication mechanism to use secrets managers from other providers.
Important: This blog post is intended to provide guidance that you can use when planning and implementing a secrets replication mechanism. The examples in this post are not intended to be run directly in production, and you will need to take security hardening requirements into consideration before deploying this solution. As an example, HashiCorp provides tutorials on hardening production vaults.
You can use these links to navigate through this post:
The primary use case for this post is for customers who are running applications on AWS and are currently using a third-party secrets manager to manage their secrets, hosted on-premises, in the AWS Cloud, or with a third-party provider. These customers typically have existing secrets vending processes, deployment pipelines, and procedures and processes around the management of these secrets. Customers with such a setup might want to keep their existing third-party secrets manager and have a set of secrets that are accessible to workloads running outside of AWS, as well as workloads running within AWS, by using AWS Secrets Manager.
Another use case is for customers who are in the process of migrating workloads to the AWS Cloud and want to maintain a (temporary) hybrid form of secrets management. By replicating secrets from an existing third-party secrets manager, customers can migrate their secrets to the AWS Cloud one-by-one, test that they work, integrate the secrets with the intended applications and systems, and once the migration is complete, remove the third-party secrets manager.
Additionally, some AWS services, such as Amazon Relational Database Service (Amazon RDS) Proxy, AWS Direct Connect MACsec, and AD Connector seamless join (Linux), only support secrets from AWS Secrets Manager. Customers can use secret replication if they have a third-party secrets manager and want to be able to use third-party secrets in services that require integration with AWS Secrets Manager. That way, customers don’t have to manage secrets in two places.
Two approaches to secrets replication
In this post, I’ll discuss two main models to replicate secrets from an external third-party secrets manager to AWS Secrets Manager: a pull model and a push model.
Pull model In a pull model, you can use AWS services such as Amazon EventBridge and AWS Lambda to periodically call your external secrets manager to fetch secrets and updates to those secrets. The main benefit of this model is that it doesn’t require any major configuration to your third-party secrets manager. The AWS resources and mechanism used for pulling secrets must have appropriate permissions and network access to those secrets. However, there could be a delay between the time a secret is created and updated and when it’s picked up for replication, depending on the time interval configured between pulls from AWS to the external secrets manager.
Push model In this model, rather than periodically polling for updates, the external secrets manager pushes updates to AWS Secrets Manager as soon as a secret is added or changed. The main benefit of this is that there is minimal delay between secret creation, or secret updating, and when that data is available in AWS Secrets Manager. The push model also minimizes the network traffic required for replication since it’s a unidirectional flow. However, this model adds a layer of complexity to the replication, because it requires additional configuration in the third-party secrets manager. More specifically, the push model is dependent on the third-party secrets manager’s ability to run event-based push integrations with AWS resources. This will require a custom integration to be developed and managed on the third-party secrets manager’s side.
This blog post focuses on the pull model to provide an example integration that requires no additional configuration on the third-party secrets manager.
Replicate secrets to AWS Secrets Manager with the pull model
In this section, I’ll walk through an example of how to use the pull model to replicate your secrets from an external secrets manager to AWS Secrets Manager.
Solution overview
Figure 1: Secret replication architecture diagram
The architecture shown in Figure 1 consists of the following main steps, numbered in the diagram:
A Cron expression in Amazon EventBridge invokes an AWS Lambda function every 30 minutes.
To connect to the third-party secrets manager, the Lambda function, written in NodeJS, fetches a set of user-defined API keys belonging to the secrets manager from AWS Secrets Manager. These API keys have been scoped down to give read-only access to secrets that should be replicated, to adhere to the principle of least privilege. There is more information on this in Step 3: Update the Vault connection secret.
The third step has two variants depending on where your third-party secrets manager is hosted:
The Lambda function is configured to fetch secrets from a third-party secrets manager that is hosted outside AWS. This requires sufficient networking and routing to allow communication from the Lambda function.
Note: Depending on the location of your third-party secrets manager, you might have to consider different networking topologies. For example, you might need to set up hybrid connectivity between your external environment and the AWS Cloud by using AWS Site-to-Site VPN or AWS Direct Connect, or both.
Important: To simplify the deployment of this example integration, I’ll use a secrets manager hosted on a publicly available Amazon EC2 instance within the same VPC as the Lambda function (3b). This minimizes the additional networking components required to interact with the secrets manager. More specifically, the EC2 instance runs an open-source HashiCorp Vault. In the rest of this post, I’ll refer to the HashiCorp Vault’s API keys as Vault tokens.
The Lambda function compares the version of the secret that it just fetched from the third-party secrets manager against the version of the secret that it has in AWS Secrets Manager (by tag). The function will create a new secret in AWS Secrets Manager if the secret does not exist yet, and will update it if there is a new version. The Lambda function will only consider secrets from the third-party secrets manager for replication if they match a specified prefix. For example, hybrid-aws-secrets/.
In case there is an error synchronizing the secret, an email notification is sent to the email addresses which are subscribed to the Amazon Simple Notification Service (Amazon SNS) Topic deployed. This sample application uses email notifications with Amazon SNS as an example, but you could also integrate with services like ServiceNow, Jira, Slack, or PagerDuty. Learn more about how to use webhooks to publish Amazon SNS messages to external services.
Step 1: Deploy the solution by using the AWS CDK toolkit
For this blog post, I’ve created an AWS Cloud Development Kit (AWS CDK) script, which can be found in this AWS GitHub repository. Using the AWS CDK, I’ve defined the infrastructure depicted in Figure 1 as Infrastructure as Code (IaC), written in TypeScript, ready for you to deploy and try out. The AWS CDK is an open-source software development framework that allows you to write your cloud application infrastructure as code using common programming languages such as TypeScript, Python, Java, Go, and so on.
Prerequisites:
To deploy the solution, the following should be in place on your system:
AWS CDK Toolkit. Install using npm (included in Node setup) by running npm install -g aws-cdk in a local terminal.
An AWS access key ID and secret access key configured as this setup will interact with your AWS account. See Configuration basics in the AWS Command Line Interface User Guide for more details.
Clone the CDK script for secret replication. git clone https://github.com/aws-samples/aws-secrets-manager-hybrid-secret-replication-from-hashicorp-vault.git SecretReplication
Use the cloned project as the working directory. cd SecretReplication
Install the required dependencies to deploy the application. npm install
Adjust any configuration values for your setup in the cdk.json file. For example, you can adjust the secretsPrefix value to change which prefix is used by the Lambda function to determine the subset of secrets that should be replicated from the third-party secrets manager.
Bootstrap your AWS environments with some resources that are required to deploy the solution. With correctly configured AWS credentials, run the following command. cdk bootstrap
This command deploys the infrastructure shown in Figure 1 for you by using AWS CloudFormation. For a full list of resources, you can view the SecretsManagerReplicationStack in AWS CloudFormation after the deployment has completed.
Note: If your local environment does not have a terminal that allows you to run these commands, consider using AWS Cloud9 or AWS CloudShell.
After the deployment has finished, you should see an output in your terminal that looks like the one shown in Figure 2. If successful, the output provides the IP address of the sample HashiCorp Vault and its web interface.
Figure 2: AWS CDK deployment output
Step 2: Initialize the HashiCorp Vault
As part of the output of the deployment script, you will be given a URL to access the user interface of the open-source HashiCorp Vault. To simplify accessibility, the URL points to a publicly available Amazon EC2 instance running the HashiCorp Vault user interface as shown in step 3b in Figure 1.
Let’s look at the HashiCorp Vault that was just created. Go to the URL in your browser, and you should see the Raft Storage initialize page, as shown in Figure 3.
The vault requires an initial configuration to set up storage and get the initial set of root keys. You can go through the steps manually in the HashiCorp Vault’s user interface, but I recommend that you use the initialise_vault.sh script that is included as part of the SecretsManagerReplication project instead.
Using the HashiCorp Vault API, the initialization script will automatically do the following:
Initialize the Raft storage to allow the Vault to store secrets locally on the instance.
Create an initial set of unseal keys for the Vault. Importantly, for demo purposes, the script uses a single key share. For production environments, it’s recommended to use multiple key shares so that multiple shares are needed to reconstruct the root key, in case of an emergency.
Store the unseal keys in init/vault_init_output.json in your project.
Unseals the HashiCorp Vault by using the unseal keys generated earlier.
Enables two key-value secrets engines:
An engine named after the prefix that you’re using for replication, defined in the cdk.json file. In this example, this is hybrid-aws-secrets. We’re going to use the secrets in this engine for replication to AWS Secrets Manager.
An engine called super-secret-engine, which you’re going to use to show that your replication mechanism does not have access to secrets outside the engine used for replication.
Creates three example secrets, two in hybrid-aws-secrets, and one in super-secret-engine.
Creates a read-only policy, which you can see in the init/replication-policy-payload.json file after the script has finished running, that allows read-only access to only the secrets that should be replicated.
Creates a new vault token that has the read-only policy attached so that it can be used by the AWS Lambda function later on to fetch secrets for replication.
To run the initialization script, go back to your terminal, and run the following command. ./initialise_vault.sh
The script will then ask you for the IP address of your HashiCorp Vault. Provide the IP address (excluding the port) and choose Enter. Input y so that the script creates a couple of sample secrets.
If everything is successful, you should see an output that includes tokens to access your HashiCorp Vault, similar to that shown in Figure 4.
The setup script has outputted two tokens: one root token that you will use for administrator tasks, and a read-only token that will be used to read secret information for replication. Make sure that you can access these tokens while you’re following the rest of the steps in this post.
Note: The root token is only used for demonstration purposes in this post. In your production environments, you should not use root tokens for regular administrator actions. Instead, you should use scoped down roles depending on your organizational needs. In this case, the root token is used to highlight that there are secrets under super-secret-engine/ which are not meant for replication. These secrets cannot be seen, or accessed, by the read-only token.
Go back to your browser and refresh your HashiCorp Vault UI. You should now see the Sign in to Vault page. Sign in using the Token method, and use the root token. If you don’t have the root token in your terminal anymore, you can find it in the init/vault_init_output.json file.
After you sign in, you should see the overview page with three secrets engines enabled for you, as shown in Figure 5.
If you explore hybrid-aws-secrets and super-secret-engine, you can see the secrets that were automatically created by the initialization script. For example, first-secret-for-replication, which contains a sample key-value secret with the key secrets and value manager.
If you navigate to Policies in the top navigation bar, you can also see the aws-replication-read-only policy, as shown in Figure 6. This policy provides read-only access to only the hybrid-aws-secrets path.
Figure 6: Read-only HashiCorp Vault token policy
The read-only policy is attached to the read-only token that we’re going to use in the secret replication Lambda function. This policy is important because it scopes down the access that the Lambda function obtains by using the token to a specific prefix meant for replication. For secret replication we only need to perform read operations. This policy ensures that we can read, but cannot add, alter, or delete any secrets in HashiCorp Vault using the token.
You can verify the read-only token permissions by signing into the HashiCorp Vault user interface using the read-only token rather than the root token. Now, you should only see hybrid-aws-secrets. You no longer have access to super-secret-engine, which you saw in Figure 5. If you try to create or update a secret, you will get a permission denied error.
Great! Your HashiCorp Vault is now ready to have its secrets replicated from hybrid-aws-secrets to AWS Secrets Manager. The next section describes a final configuration that you need to do to allow access to the secrets in HashiCorp Vault by the replication mechanism in AWS.
Step 3: Update the Vault connection secret
To allow secret replication, you must give the AWS Lambda function access to the HashiCorp Vault read-only token that was created by the initialization script. To do that, you need to update the vault-connection-secret that was initialized in AWS Secrets Manager as part of your AWS CDK deployment.
For demonstration purposes, I’ll show you how to do that by using the AWS Management Console, but you can also do it programmatically by using the AWS Command Line Interface (AWS CLI) or AWS SDK with the update-secret command.
To update the Vault connection secret (console)
In the AWS Management Console, go to AWS Secrets Manager > Secrets > hybrid-aws-secrets/vault-connection-secret.
Under Secret Value, choose Retrieve Secret Value, and then choose Edit.
Update the vaultToken value to contain the read-only token that was generated by the initialization script.
Step 4: (Optional) Set up email notifications for replication failures
As highlighted in Figure 1, the Lambda function will send an email by using Amazon SNS to a designated email address whenever one or more secrets fails to be replicated. You will need to configure the solution to use the correct email address. To do this, go to the cdk.json file at the root of the SecretReplication folder and adjust the notificationEmail parameter to an email address that you own. Once done, deploy the changes using the cdk deploy command. Within a few minutes, you’ll get an email requesting you to confirm the subscription. Going forward, you will receive an email notification if one or more secrets fails to replicate.
Test your secret replication
You can either wait up to 30 minutes for the Lambda function to be invoked automatically to replicate the secrets, or you can manually invoke the function.
To test your secret replication
Open the AWS Lambda console and find the Secret Replication function (the name starts with SecretsManagerReplication-SecretReplication).
Navigate to the Test tab.
For the text event action, select Create new event, create an event using the default parameters, and then choose the Test button on the right-hand side, as shown in Figure 8.
Figure 8: AWS Lambda – Test page to manually invoke the function
This will run the function. You should see a success message, as shown in Figure 9. If this is the first time the Lambda function has been invoked, you will see in the results that two secrets have been created.
Figure 9: AWS Lambda function output
You can find the corresponding logs for the Lambda function invocation in a Log group in AWS CloudWatch matching the name /aws/lambda/SecretsManagerReplication-SecretReplicationLambdaF-XXXX.
To verify that the secrets were added, navigate to AWS Secrets Manager in the console, and in addition to the vault-connection-secret that you edited before, you should now also see the two new secrets with the same hybrid-aws-secrets prefix, as shown in Figure 10.
Figure 10: AWS Secrets Manager overview – New replicated secrets
For example, if you look at first-secret-for-replication, you can see the first version of the secret, with the secret key secrets and secret value manager, as shown in Figure 11.
Figure 11: AWS Secrets Manager – New secret overview showing values and version number
Success! You now have access to the secret values that originate from HashiCorp Vault in AWS Secrets Manager. Also, notice how there is a version tag attached to the secret. This is something that is necessary to update the secret, which you will learn more about in the next two sections.
Update a secret
It’s a recommended security practice to rotate secrets frequently. The Lambda function in this solution not only replicates secrets when they are created — it also periodically checks if existing secrets in AWS Secrets Manager should be updated when the third-party secrets manager (HashiCorp Vault in this case) has a new version of the secret. To validate that this works, you can manually update a secret in your HashiCorp Vault and observe its replication in AWS Secrets Manager in the same way as described in the previous section. You will notice that the version tag of your secret gets updated automatically when there is a new secret replication from the third-party secrets manager to AWS Secrets Manager.
Secret replication logic
This section will explain in more detail the logic behind the secret replication. Consider the following sequence diagram, which explains the overall logic implemented in the Lambda function.
Figure 12: State diagram for secret replication logic
This diagram highlights that the Lambda function will first fetch a list of secret names from the HashiCorp Vault. Then, the function will get a list of secrets from AWS Secrets Manager, matching the prefix that was configured for replication. AWS Secrets Manager will return a list of the secrets that match this prefix and will also return their metadata and tags. Note that the function has not fetched any secret material yet.
Next, the function will loop through each secret name that HashiCorp Vault gave and will check if the secret exists in AWS Secrets Manager:
If there is no secret that matches that name, the function will fetch the secret material from HashiCorp Vault, including the version number, and create a new secret in AWS Secrets Manager. It will also add a version tag to the secret to match the version.
If there is a secret matching that name in AWS Secrets Manager already, the Lambda function will first fetch the metadata from that secret in HashiCorp Vault. This is required to get the version number of the secret, because the version number was not exposed when the function got the list of secrets from HashiCorp Vault initially. If the secret version from HashiCorp Vault does not match the version value of the secret in AWS Secrets Manager (for example, the version in HashiCorp vault is 2, and the version in AWS Secrets manager is 1), an update is required to get the values synchronized again. Only now will the Lambda function fetch the actual secret material from HashiCorp Vault and update the secret in AWS Secrets Manager, including the version number in the tag.
The Lambda function fetches metadata about the secrets, rather than just fetching the secret material from HashiCorp Vault straight away. Typically, secrets don’t update very often. If this Lambda function is called every 30 minutes, then it should not have to add or update any secrets in the majority of invocations. By using metadata to determine whether you need the secret material to create or update secrets, you minimize the number of times secret material is fetched both from HashiCorp Vault and AWS Secrets Manager.
Note: The AWS Lambda function has permissions to pull certain secrets from HashiCorp Vault. It is important to thoroughly review the Lambda code and any subsequent changes to it to prevent leakage of secrets. For example, you should ensure that the Lambda function does not get updated with code that unintentionally logs secret material outside the Lambda function.
Use your secret
Now that you have created and replicated your secrets, you can use them in your AWS applications or AWS services that are integrated with Secrets Manager. For example, you can use the secrets when you set up connectivity for a proxy in Amazon RDS, as follows.
To use a secret when creating a proxy in Amazon RDS
Go to the Amazon RDS service in the console.
In the left navigation pane, choose Proxies, and then choose Create Proxy.
On the Connectivity tab, you can now select first-secret-for-replicationorsecond-secret-for-replication, which were created by the Lambda function after replicating them from the HashiCorp Vault.
Figure 13: Amazon RDS Proxy – Example of using replicated AWS Secrets Manager secrets
Due to the sensitive nature of the secrets, it is important that you scope down the permissions to the least amount required to prevent inadvertent access to your secrets. The setup adopts a least-privilege permission strategy, where only the necessary actions are explicitly allowed on the resources that are required for replication. However, the permissions should be reviewed in accordance to your security standards.
In the architecture of this solution, there are two main places where you control access to the management of your secrets in Secrets Manager.
Lambda execution IAM role: The IAM role assumed by the Lambda function during execution contains the appropriate permissions for secret replication. There is an additional safety measure, which explicitly denies any action to a resource that is not required for the replication. For example, the Lambda function only has permission to publish to the Amazon SNS topic that is created for the failed replications, and will explicitly deny a publish action to any other topic. Even if someone accidentally adds an allow to the policy for a different topic, the explicit deny will still block this action.
AWS KMS key policy: When other services need to access the replicated secret in AWS Secrets Manager, they need permission to use the hybrid-aws-secrets-encryption-key AWS KMS key. You need to allow the principal these permissions through the AWS KMS key policy. Additionally, you can manage permissions to the AWS KMS key for the principal through an identity policy. For example, this is required when accessing AWS KMS keys across AWS accounts. See Permissions for AWS services in key policies and Specifying KMS keys in IAM policy statements in the AWS KMS Developer Guide.
Options for customizing the sample solution
The solution that was covered in this post provides an example for replication of secrets from HashiCorp Vault to AWS Secrets Manager using the pull model. This section contains additional customization options that you can consider when setting up the solution, or your own variation of it.
Depending on the solution that you’re using, you might have access to different metadata attached to the secrets, which you can use to determine if a secret should be updated. For example, if you have access to data that represents a last_updated_datetime property, you could use this to infer whether or not a secret ought to be updated.
It is a recommended practice to not use long-lived tokens wherever possible. In this sample, I used a static vault token to give the Lambda function access to the HashiCorp Vault. Depending on the solution that you’re using, you might be able to implement better authentication and authorization mechanisms. For example, HashiCorp Vault allows you to use IAM auth by using AWS IAM, rather than a static token.
This post addressed the creation of secrets and updating of secrets, but for your production setup, you should also consider deletion of secrets. Depending on your requirements, you can choose to implement a strategy that works best for you to handle secrets in AWS Secrets Manager once the original secret in HashiCorp Vault has been deleted. In the pull model, you could consider removing a secret in AWS Secrets Manager if the corresponding secret in your external secrets manager is no longer present.
In the sample setup, the same AWS KMS key is used to encrypt both the environment variables of the Lambda function, and the secrets in AWS Secrets Manager. You could choose to add an additional AWS KMS key (which would incur additional cost), to have two separate keys for these tasks. This would allow you to apply more granular permissions for the two keys in the corresponding KMS key policies or IAM identity policies that use the keys.
Conclusion
In this blog post, you’ve seen how you can approach replicating your secrets from an external secrets manager to AWS Secrets Manager. This post focused on a pull model, where the solution periodically fetched secrets from an external HashiCorp Vault and automatically created or updated the corresponding secret in AWS Secrets Manager. By using this model, you can now use your external secrets in your AWS Cloud applications or services that have an integration with AWS Secrets Manager.
If you have feedback about this post, submit comments in the Comments section below. If you have questions about this post, start a new thread on the AWS Secrets Manager re:Post or contact AWS Support.
Want more AWS Security news? Follow us on Twitter.
As organizations continue to grow and scale their applications, the need for teams to be able to quickly and autonomously detect anomalous operational behaviors becomes increasingly important. Amazon DevOps Guru offers a fully managed AIOps service that enables you to improve application availability and resolve operational issues quickly. DevOps Guru helps ease this process by leveraging machine learning (ML) powered recommendations to detect operational insights, identify the exhaustion of resources, and provide suggestions to remediate issues. Many organizations running business critical applications use different tools to be notified about anomalous events in real-time for the remediation of critical issues. Atlassian is a modern team collaboration and productivity software suite that helps teams organize, discuss, and complete shared work. You can deliver these insights in near-real time to DevOps teams by integrating DevOps Guru with Atlassian Opsgenie. Opsgenie is a modern incident management platform that receives alerts from your monitoring systems and custom applications and categorizes each alert based on importance and timing.
This blog post walks you through how to integrate Amazon DevOps Guru with Atlassian Opsgenie to receive notifications for new operational insights detected by DevOps Guru with more flexibility and customization using Amazon EventBridge and AWS Lambda. The Lambda function will be used to demonstrate how to customize insights sent to Opsgenie.
Solution overview
Figure 1: Amazon EventBridge Integration with Opsgenie using AWS Lambda
Amazon DevOps Guru directly integrates with Amazon EventBridge to notify you of events relating to generated insights and updates to insights. To begin routing these notifications to Opsgenie, you can configure routing rules to determine where to send notifications. As outlined below, you can also use pre-defined DevOps Guru patterns to only send notifications or trigger actions that match that pattern. You can select any of the following pre-defined patterns to filter events to trigger actions in a supported AWS resource. Here are the following predefined patterns supported by DevOps Guru:
DevOps Guru New Insight Open
DevOps Guru New Anomaly Association
DevOps Guru Insight Severity Upgraded
DevOps Guru New Recommendation Created
DevOps Guru Insight Closed
By default, the patterns referenced above are enabled so we will leave all patterns operational in this implementation. However, you do have flexibility to change which of these patterns to choose to send to Opsgenie. When EventBridge receives an event, the EventBridge rule matches incoming events and sends it to a target, such as AWS Lambda, to process and send the insight to Opsgenie.
Prerequisites
The following prerequisites are required for this walkthrough:
In this step, you will navigate to Opsgenie to create the integration with DevOps Guru and to obtain the API key and team name within your account. These parameters will be used as inputs in a later section of this blog.
Navigate to Teams, and take note of the team name you have as shown below, as you will need this parameter in a later section.
Figure 2: Opsgenie team names
Click on the team to proceed and navigate to Integrations on the left-hand pane. Click on Add Integration and select the Amazon DevOps Guru option.
Figure 3: Integration option for DevOps Guru
Now, scroll down and take note of the API Key for this integration and copy it to your notes as it will be needed in a later section. Click Save Integration at the bottom of the page to proceed.
Figure 4: API Key for DevOps Guru Integration
Now, the Opsgenie integration has been created and we’ve obtained the API key and team name. The email of any team member will be used in the next section as well.
Review & launch the AWS SAM template to deploy the solution
In this step, you will review & launch the SAM template. The template will deploy an AWS Lambda function that is triggered by an Amazon EventBridge rule when Amazon DevOps Guru generates a new event. The Lambda function will retrieve the parameters obtained from the deployment and pushes the events to Opsgenie via an API.
Reviewing the template
Below is the SAM template that will be deployed in the next step. This template launches a few key components specified earlier in the blog. The Transform section of the template allows us takes an entire template written in the AWS Serverless Application Model (AWS SAM) syntax and transforms and expands it into a compliant CloudFormation template. Under the Resources section this solution will deploy an AWS Lamba function using the Java runtime as well as an Amazon EventBridge Rule/Pattern. Another key aspect of the template are the Parameters. As shown below, the ApiKey, Email, and TeamName are parameters we will use for this CloudFormation template which will then be used as environment variables for our Lambda function to pass to OpsGenie.
Figure 5: Review of SAM Template
Launching the Template
Navigate to the directory of choice within a terminal and clone the GitHub repository with the following command:
Change directories with the command below to navigate to the directory of the SAM template.
cd amazon-devops-guru-connector-opsgenie/OpsGenieServerlessTemplate
From the CLI, use the AWS SAM to build and process your AWS SAM template file, application code, and any applicable language-specific files and dependencies.
sam build
From the CLI, use the AWS SAM to deploy the AWS resources for the pattern as specified in the template.yml file.
sam deploy --guided
You will now be prompted to enter the following information below. Use the information obtained from the previous section to enter the Parameter ApiKey, Parameter Email, and Parameter TeamName fields.
Stack Name
AWS Region
Parameter ApiKey
Parameter Email
Parameter TeamName
Allow SAM CLI IAM Role Creation
Test the solution
Follow this blog to enable DevOps Guru and generate an operational insight.
When DevOps Guru detects a new insight, it will generate an event in EventBridge. EventBridge then triggers Lambda and sends the event to Opsgenie as shown below.
Figure 6: Event Published to Opsgenie with details such as the source, alert type, insight type, and a URL to the insight in the AWS console.enecccdgruicnuelinbbbigebgtfcgdjknrjnjfglclt
Cleaning up
To avoid incurring future charges, delete the resources.
From the command line, use AWS SAM to delete the serverless application along with its dependencies.
sam delete
Customizing Insights published using Amazon EventBridge & AWS Lambda
The foundation of the DevOps Guru and Opsgenie integration is based on Amazon EventBridge and AWS Lambda which allows you the flexibility to implement several customizations. An example of this would be the ability to generate an Opsgenie alert when a DevOps Guru insight severity is high. Another example would be the ability to forward appropriate notifications to the AIOps team when there is a serverless-related resource issue or forwarding a database-related resource issue to your DBA team. This section will walk you through how these customizations can be done.
EventBridge customization
EventBridge rules can be used to select specific events by using event patterns. As detailed below, you can trigger the lambda function only if a new insight is opened and the severity is high. The advantage of this kind of customization is that the Lambda function will only be invoked when needed.
Open the file template.yaml reviewed in the previous section and implement the changes as highlighted below under the Events section within resources (original file on the left, changes on the right hand side).
Figure 7: CloudFormation template file changed so that the EventBridge rule is only triggered when the alert type is “DevOps Guru New Insight Open” and insightSeverity is “high”.
Save the changes and use the following command to apply the changes
sam deploy --template-file template.yaml
Accept the changeset deployment
Determining the Ops team based on the resource type
Another customization would be to change the Lambda code to route and control how alerts will be managed. Let’s say you want to get your DBA team involved whenever DevOps Guru raises an insight related to an Amazon RDS resource. You can change the AlertType Java class as follows:
To begin this customization of the Lambda code, the following changes need to be made within the AlertType.java file:
At the beginning of the file, the standard java.util.List and java.util.ArrayList packages were imported
Line 60: created a list of CloudWatch metrics namespaces
Line 74: Assigned the dataIdentifiers JsonNode to the variable dataIdentifiersNode
Line 75: Assigned the namespace JsonNode to a variable namespaceNode
Line 77: Added the namespace to the list for each DevOps Insight which is always raised as an EventBridge event with the structure detail►anomalies►0►sourceDetails►0►dataIdentifiers►namespace
Line 88: Assigned the default responder team to the variable defaultResponderTeam
Line 89: Created the list of responders and assigned it to the variable respondersTeam
Line 92: Check if there is at least one AWS/RDS namespace
Line 93: Assigned the DBAOps_Team to the variable dbaopsTeam
Line 93: Included the DBAOps_Team team as part of the responders list
Line 97: Set the OpsGenie request teams to be the responders list
Figure 8: java.util.List and java.util.ArrayList packages were imported
Figure 9: AlertType Java class customized to include DBAOps_Team for RDS-related DevOps Guru insights.
You then need to generate the jar file by using the mvn clean package command.
As result, the DBAOps_Team will be assigned to the Opsgenie alert in the case a DevOps Guru Insight is related to RDS.
Figure 10: Opsgenie alert assigned to both DBAOps_Team and AIOps_Team.
Conclusion
In this post, you learned how Amazon DevOps Guru integrates with Amazon EventBridge and publishes insights to Opsgenie using AWS Lambda. By creating an Opsgenie integration with DevOps Guru, you can now leverage Opsgenie strengths, incident management, team communication, and collaboration when responding to an insight. All of the insight data can be viewed and addressed in Opsgenie’s Incident Command Center (ICC). By customizing the data sent to Opsgenie via Lambda, you can empower your organization even more by fine tuning and displaying the most relevant data thus decreasing the MTTR (mean time to resolve) of the responding operations team.
This blog post is written by Jonathan Tuliani, Principal Product Manager.
Today, AWS Lambda is announcing runtime management controls which provide more visibility and control over when Lambda applies runtime updates to your functions. Lambda is also changing how it rolls out automatic runtime updates to your functions. Together, these changes provide more flexibility in how you take advantage of the latest runtime features, performance improvements, and security updates.
By default, all functions will continue to receive automatic runtime updates. You do not need to change how you use Lambda to continue to benefit from the security and operational simplicity of the managed runtimes Lambda provides. The runtime controls are optional capabilities for advanced customers that require more control over their runtime changes.
This post explains what new runtime management controls are available and how you can take advantage of this new capability.
Overview
For each runtime, Lambda provides a managed execution environment. This includes the underlying Amazon Linux operating system, programming language runtime, and AWS SDKs. Lambda takes on the operational burden of applying patches and security updates to all these components. Customers tell us how much they appreciate being able to deploy a function and leave it, sometimes for years, without having to apply patches. With Lambda, patching ‘just works’, automatically.
Lambda strives to provide updates which are backward compatible with existing functions. However, as with all software patching, there are rare cases where a patch can expose an underlying issue with an existing function that depends on the previous behavior. For example, consider a bug in one of the runtime OS packages. Applying a patch to fix the bug is the right choice for the vast majority of customers and functions. However, in rare cases, a function may depend on the previous (incorrect) behavior. Customers with critical workloads running in Lambda tell us they would like a way to further mitigate even this slight risk of disruption.
With the launch of runtime management controls, Lambda now offers three new capabilities. First, Lambda provides visibility into which patch version of a runtime your function is using and when runtime updates are applied. Second, you can optionally synchronize runtime updates with function deployments. This provides you with control over when Lambda applies runtime updates and enables early detection of rare runtime update incompatibilities. Third, in the rare case where a runtime update incompatibility occurs, you can roll back your function to an earlier runtime version. This keeps your function working and minimizes disruption, providing time to remedy the incompatibility before returning to the latest runtime version.
Runtime identifiers and runtime versions
Lambda runtimes define the components of the execution environment in which your function code runs. This includes the OS, programming language runtime, environment variables, and certificates. For Python, Node.js and Ruby, the runtime also includes the AWS SDK. Each Lambda runtime has a unique runtime identifier, for example, nodejs18.x, or python3.9. Each runtime identifier represents a distinct major release of the programming language.
Runtime management controls introduce the concept of Lambda runtime versions. A runtime version is an immutable version of a particular runtime. Each Lambda runtime, such as Node.js 16, or Python 3.9, starts with an initial runtime version. Every time Lambda updates the runtime, it adds a new runtime version to that runtime. These updates cover all runtime components (OS, language runtime, etc.) and therefore use a Lambda-defined numbering scheme, independent of the version numbers used by the programming language. For each runtime version, Lambda also publishes a corresponding base image for customers who package their functions as container images.
New runtime identifiers represent a major release for the programming language, and sometimes other runtime components, such as the OS or SDK. Lambda cannot guarantee compatibility between runtime identifiers, although most times you can upgrade your functions with little or no modification. You control when you upgrade your functions to a new runtime identifier. In contrast, new runtime versions for the same runtime identifier have a very high level of backward compatibility with existing functions. By default, Lambda automatically applies runtime updates by moving functions from the previous runtime version to a newer runtime version.
Each runtime version has a version number, and an Amazon Resource Name (ARN). You can view the version in a new platform log line, INIT_START. Lambda emits this log line each time it creates a new execution environment during the cold start initialization process.
INIT_START Runtime Version: python:3.9.v14 Runtime Version ARN: arn:aws:lambda:eu-south-1::runtime:7b620fc2e66107a1046b140b9d320295811af3ad5d4c6a011fad1fa65127e9e6I
INIT_START Runtime Version: python:3.9.v14 Runtime Version ARN: arn:aws:lambda:eu-south-1::runtime:7b620fc2e66107a1046b140b9d320295811af3ad5d4c6a011fad1fa65127e9e6I
Runtime versions improve visibility into managed runtime updates. You can use the INIT_START log line to identify when the function transitions from one runtime version to another. This helps you investigate whether a runtime update might have caused any unexpected behavior of your functions. Changes in behavior caused by runtime updates are very rare. If your function isn’t behaving as expected, by far the most likely cause is an error in the function code or configuration.
Runtime management modes
With runtime management controls, you now have more control over when Lambda applies runtime updates to your functions. You can now specify a runtime management configuration for each function. You can set the runtime management configuration independently for $LATEST and each published function version.
You can specify one of three runtime update modes: auto, function update, or manual. The runtime update mode controls when Lambda updates the function version to a new runtime version. By default, all functions receive runtime updates automatically, the alternatives are for advanced users in specific cases.
Automatic
Auto updates are the default, and are the right choice for most customers to ensure that you continue to benefit from runtime version updates. They help minimize your operational overheads by letting Lambda take care of runtime updates.
While Lambda has always provided automatic runtime updates, this release includes a change to how automatic runtime updates are rolled out. Previously, Lambda applied runtime updates to all functions in each region, following a region-by-region deployment sequence. With this release, functions configured to use the auto runtime update mode now receive runtime updates in two phases. Initially, Lambda only applies a new runtime version to newly created or updated functions. After this initial period is complete, Lambda then applies the runtime update to any remaining functions configured to use the auto runtime update mode.
This two-phase rollout synchronizes runtime updates with function updates for customers who are actively developing their functions. This makes it easier to detect and respond to any unexpected changes in behavior. For functions not in active development, auto mode continues to provide the operational benefits of fully automatic runtime updates.
Function update
In function update mode, Lambda updates your function to the latest available runtime version whenever you change your function code or configuration. This is the same as the first phase of auto mode. The difference is that, in auto mode, there is a second phase when Lambda applies runtime updates to functions which have not been changed. In function update mode, if you do not change a function, it continues to use the current runtime version indefinitely. This means that when using function update mode, you must update your functions regularly to keep their runtimes up-to-date. If you do not update a function regularly, you should use the auto runtime update mode.
Synchronizing runtime updates with function deployments gives you control over when Lambda applies runtime updates. For example, you can avoid applying updates during business-critical events, such as a product launch or holiday sales.
When used with CI/CD pipelines, function update mode enables early detection and mitigation in the rare event of a runtime update incompatibility. This is especially effective if you create a new published function version with each deployment. Each published function version captures a static copy of the function code and configuration, so that you can roll back to a previously published function version if required. Using function update mode extends the published function version to also capture the runtime version. This allows you to synchronize rollout and rollback of the entire Lambda execution environment, including function code, configuration, and runtime version.
Manual
Consider the rare event that a runtime update is incompatible with one of your functions. With runtime management controls, you can now roll back to an earlier runtime version. This keeps your function working and minimizes disruption, giving you time to remedy the incompatibility before returning to the latest runtime version.
There are two ways to implement a runtime version rollback. You can use function update mode with a published function version to synchronize the rollback of code, configuration, and runtime version. Or, for functions using the default auto runtime update mode, you can roll back your runtime version by using manual mode.
The manual runtime update mode provides you with full control over which runtime version your function uses. When enabling manual mode, you must specify the ARN of the runtime version to use, which you can find from the INIT_START log line.
Lambda does not impose a time limit on how long you can use any particular runtime version. However, AWS strongly recommends using manual mode only for short-term remediation of code incompatibilities. Revert your function back to auto mode as soon as you resolve the issue. Functions using the same runtime version for an extended period may eventually stop working due to, for example, a certificate expiry.
From the Lambda console, navigate to a specific function. You can find runtime management controls on the Code tab, in the Runtime settings panel. Expand Runtime management configuration to view the current runtime update mode and runtime version ARN.
Runtime settings
To change runtime update mode, select Edit runtime management configuration. You can choose between automatic, function update, and manual runtime update modes.
Edit runtime management configuration (Auto)
In manual mode, you must also specify the runtime version ARN.
Edit runtime management configuration (Manual)
AWS SAM
AWS SAM is an open-source framework for building serverless applications. You can specify runtime management settings using the RuntimeManagementConfig property.
You can also manage runtime management settings using the AWS CLI. You configure runtime management controls via a dedicated command aws lambda put-runtime-management-config, rather than aws lambda update-function-configuration.
The current runtime version ARN is also returned by aws lambda get-function and aws lambda get-function-configuration.
Conclusion
Runtime management controls provide more visibility and flexibility over when and how Lambda applies runtime updates to your functions. You can specify one of three update modes: auto, function update, or manual. These modes allow you to continue to take advantage of Lambda’s automatic patching, synchronize runtime updates with your deployments, and rollback to an earlier runtime version in the rare event that a runtime update negatively impacts your function.
For more information on runtime management controls, see our documentation page.
For more serverless learning resources, visit Serverless Land.
This post is written by Adrian Hornsby (Principal System Dev Engineer) and Marcia Villalba (Principal Developer Advocate).
AWS Lambda comprises over 80 services working together to provide the serverless compute service that it offers to customers. Under the hood, many of these services are built on top of Amazon Elastic Compute Cloud (Amazon EC2) instances, provisioned within Availability Zones. However, AWS Lambda is a Regional service. This means that customers use Lambda services from the Region level and its services are designed to be resilient to impairments that the underlying Availability Zones might have.
Availability Zones are physically isolated sections of an AWS Region, designed to operate but also fail independently. They are separated by a meaningful distance from each other, up to 100 kilometers (60 miles), to prevent correlated failures, but close enough to use synchronous replication with single-digit millisecond latency.
Customers and AWS services have been using Availability Zones for years to build highly available, fault tolerant, and scalable applications. In particular, AWS Regional services such as AWS Lambda, Amazon DynamoDB, Amazon Simple Queue Service (Amazon SQS), and Amazon Simple Storage Service (Amazon S3), have achieved their high availability promises by spreading multiple independent replicas of their services across multiple Availability Zones. It uses the principles of independence and redundancy of Availability Zones to maximize the overall availability of that service.
Each replica is called a zonal replica. The system is designed so that any of the replicas can fail at any time. When a replica fails, it can be temporarily removed from the system until everything works as expected again. When that happens, the load is shared between the remaining zonal replicas.
Designing for failures
One lesson we learned at AWS when building services is when there is an Availability Zone impairment, it is better not to rely on control plane operations to remediate the failure. A control plane operation can, for example, be provisioning more capacity in an Availability Zone that is not affected by the impairment.
This principle is called static stability, and it describes the capability for a system to keep its original steady-state (or behavior) even when subjected to disruptive events without having to make any changes. A statically stable service should have as few dependencies as possible for its recovery process.
For a Regional service like AWS Lambda, this means that the remaining capacity in the healthy Availability Zones can absorb the traffic from a potentially impaired Availability Zone without having to scale up. This implies over-provisioning resources in all Availability Zones. Having that extra capacity pre-provisioned helps Lambda achieve its static stability. It is a tradeoff between the cost of over-provisioning resources and service availability. Since AWS Lambda promises high availability to its customers, with a monthly uptime service commitment of 99.95%, that tradeoff falls towards service availability.
How to prepare for failures
Preparing for an Availability Zone impairment is difficult because the symptoms and size of the impact can vary widely. An Availability Zone may be partially accessible or totally unreachable, and everything in between. Causes for the impairment can range from fiber cuts, power issues, overheating, hardware malfunctions, networking problems, capacity issues, and other unexpected situations. While those happen, they happen rarely. The most common categories of failures are bad deployments and bad configurations.
While some of these failures can be difficult to infer or reproduce, common symptoms include disruption of connectivity, increased latency, increased traffic due to retry storms, increased CPU and memory usage, and slow I/O.
At AWS, we learned to expect the unexpected and plan for failure. This means injecting faults in the system to reproduce some of the common symptoms of Availability Zone impairments, then observe how the system responds, and implement improvements. In addition, injecting faults in the system helps uncover potential monitoring and alarming blind spots, and gives an opportunity for teams to practice and improve their response to events with a focus on reducing time to recovery.
How Lambda tests its response to an Availability Zone impairment
Lambda’s approach to being resilient to Availability Zone impairments is to rely on static stability and automated systems. Humans are slower than machines for detecting issues and mitigating them. Therefore, Lambda must ensure that its services can detect issues within a zonal replica and remediate automatically within minutes and with no operator intervention. This auto-remediation is done by shifting customer traffic away from the affected Availability Zone to healthy ones, and it is called Availability Zone evacuation.
To do this, Lambda built a tool that detects failures and performs the Availability Zone evacuation when needed. This tool does a statistical comparison of metrics between different Availability Zones and EC2 instances in order to identify unhealthy Availability Zones. If an Availability Zone is found to have issues, the tool starts the evacuation out of the unhealthy Availability Zone automatically. This automation cuts the time to the first action from 30 minutes to less than 3 minutes.
How AWS Lambda uses AWS FIS
To verify the automation continuously works as expected, Lambda performs a wide variety of tests, which includes Availability Zone failure testing in their pre-production environment. The main objective of these tests is to verify the services are statically stable in the presence of Availability Zone impairments, and to verify that the Availability Zone evacuation can be successfully initiated. The benefit of having an automated test is that teams can repeat it regularly and don’t need to have special skills. One click is all it takes to launch the test.
For these tests, Lambda uses AWS FIS to inject faults into their large fleet of EC2 instances. They use AWS FIS with support of the AWS System Manager (SSM) agent and resource filters to target their fleet of EC2 instances in a particular Availability Zone. This is a versatile approach that can inject resource faults, such as CPU and memory exhaustion, and networking faults, such as packet latency, loss, or drop.
Injecting packet loss or latency is very important, since these symptoms can have a serious impact on application and network performance. Indeed, latency and loss, even in small quantities, can create inefficiencies and prevent applications from running at their peak performance. For Lambda, being able to detect increased latency or loss before it affects customers is critical.
How to recover your applications rapidly from Availability Zones failures
You can build a similar solution to rapidly recover your applications from a zonal failure. The solution must have a mechanism to evacuate an impaired Availability Zone, a monitoring system that allows you to detect when a zonal replica is impaired, and a way to test the static stability of your system. AWS provides many tools and services that can help you build this solution to achieve Lambda’s resiliency strategy.
For performing Availability Zone evacuation, you can use the new zonal shift capability from Route 53 ARC, which at the time of writing is in preview. Zonal shift lets you evacuate an Availability Zone for applications that are uses Elastic Load Balancing. If you find out that a zonal replica is impaired or unhealthy, you can use zonal shift to evacuate the Availability Zone for a period of time, while the issue gets fixed.
For performing the zonal shift, you must detect when a zonal replica is unhealthy. Your application must provide a signal of its health per Availability Zone. There are two common ways to capture this signal. First, passively, you can check your metrics, like response times, HTTP status codes, and other metrics that can help track fatal errors in your applications. Or actively, using synthetic monitoring, which allows you to create synthetic requests against your production application to provide a more complete view of the customer experience.
Amazon CloudWatch Synthetics provides canaries, which are scripts that run on a schedule and perform synthetic requests in your application endpoints and APIs. Canaries perform the same actions as customers and continuously verify the customer experience. You can create a canary for each zonal replica of your application and monitor the results independently.
With this information, if the user experience diminishes in one of the replicas, you can start an Availability Zone evacuation using zonal shift and minimize the bad experience for the user while you find and fix the sources of the failure.
To ensure that you can successfully recover from a failure, you must test the solution in advance. Without testing, it is just an assumption. To prove or disprove your assumptions about your system’s capability to handle disruptive events such as issues within an Availability Zones, you can use FIS.
Typical use cases for testing a workload’s resilience to Availability Zones impairment are, for example, terminating all compute resources and databases within a particular Availability Zone, injecting latency or packet loss, increasing resource consumption (CPU, memory, and I/O) in compute resources in a particular Availability Zone, or impacting network communication within or between Availability Zones.
For more information and a step-by-step example of how to recover rapidly from application failures in a single Availability Zone and testing it with AWS FIS, read this blog post.
Conclusion
This article discusses static stability, a mechanism that is used by AWS services such as Lambda to build resilient Regional services. It also discusses how AWS takes advantage of the same services and infrastructure as customers. It shows how Lambda uses multiple Availability Zones and services like AWS FIS to build highly available services and improve its recovery time from unexpected failures to only a few minutes without human intervention. Finally, it shows a solution that you can implement for your applications to achieve Lambda’s resilience strategy.
Text data is a common type of unstructured data found in analytics. It is often stored without a predefined format and can be hard to obtain and process.
For example, web pages contain text data that data analysts collect through web scraping and pre-process using lowercasing, stemming, and lemmatization. After pre-processing, the cleaned text is analyzed by data scientists and analysts to extract relevant insights.
This blog post covers how to effectively handle text data using a data lake architecture on Amazon Web Services (AWS). We explain how data teams can independently extract insights from text documents using OpenSearch as the central search and analytics service. We also discuss how to index and update text data in OpenSearch and evolve the architecture towards automation.
Architecture overview
This architecture outlines the use of AWS services to create an end-to-end text analytics solution, starting from the data collection and ingestion up to the data consumption in OpenSearch (Figure 1).
Figure 1. Data lake architecture with OpenSearch
Collect data from various sources, such as SaaS applications, edge devices, logs, streaming media, and social networks.
Validate, clean, normalize, transform, and enrich the data through a series of pre-processing steps using AWS Glue or Amazon EMR.
Place the data that is ready to be indexed in the indexing zone.
Use AWS Lambda to index the documents into OpenSearch and store them back in the data lake with a unique identifier.
Use the clean zone as the source of truth for teams to consume the data and calculate additional metrics.
Develop, train, and generate new metrics using machine learning (ML) models with Amazon SageMaker or artificial intelligence (AI) services like Amazon Comprehend.
Store the new metrics in the enriching zone along with the identifier of the OpenSearch document.
Use the identifier column from the initial indexing phase to identify the correct documents and update them in OpenSearch with the newly calculated metrics using AWS Lambda.
Use OpenSearch to search through the documents and visualize them with metrics using OpenSearch Dashboards.
Considerations
Data lake orchestration among teams
This architecture allows data teams to work independently on text documents at different stages of their lifecycles. The data engineering team manages the raw and indexing zones, who also handle data ingestion and preprocessing for indexing in OpenSearch.
The cleaned data is stored in the clean zone, where data analysts and data scientists generate insights and calculate new metrics. These metrics are stored in the enrich zone and indexed as new fields in the OpenSearch documents by the data engineering team (Figure 2).
Figure 2. Data lake orchestration among teams
Let’s explore an example. Consider a company that periodically retrieves blog site comments and performs sentiment analysis using Amazon Comprehend. In this case:
The comments are ingested into the raw zone of the data lake.
The data engineering team processes the comments and stores them in the indexing zone.
A Lambda function indexes the comments into OpenSearch, enriches the comments with the OpenSearch document ID, and saves it in the clean zone.
The data science team consumes the comments and performs sentiment analysis using Amazon Comprehend.
The sentiment analysis metrics are stored in the metrics zone of the data lake. A second Lambda function updates the comments in OpenSearch with the new metrics.
If the raw data does not require any preprocessing steps, the indexing and clean zones can be combined. You can explore this specific example, along with code implementation, in the AWS samples repository.
Schema evolution
As your data progresses through data lake stages, the schema changes and gets enriched accordingly. Continuing with our previous example, Figure 3 explains how the schema evolves.
Figure 3. Schema evolution through the data lake stages
In the raw zone, there is a raw text field received directly from the ingestion phase. It’s best practice to keep a raw version of the data as a backup, or in case the processing steps need to be repeated later.
In the indexing zone, the clean text field replaces the raw text field after being processed.
In the clean zone, we add a new ID field that is generated during indexing and identifies the OpenSearch document of the text field.
In the enrich zone, the ID field is required. Other fields with metric names are optional and represent new metrics calculated by other teams that will be added to OpenSearch.
Consumption layer with OpenSearch
In OpenSearch, data is organized into indices, which can be thought of as tables in a relational database. Each index consists of documents—similar to table rows—and multiple fields, similar to table columns. You can add documents to an index by indexing and updating them using various client APIs for popular programming languages.
Now, let’s explore how our architecture integrates with OpenSearch in the indexing and updating stage.
Indexing and updating documents using Python
The index document API operation allows you to index a document with a custom ID, or assigns one if none is provided. To speed up indexing, we can use the bulk index API to index multiple documents in one call.
We need to store the IDs back from the index operation to later identify the documents we’ll update with new metrics. Let’s explore two ways of doing this:
Use the requests library to call the REST Bulk Index API (preferred): the response returns the auto-generated IDs we need.
Use the Python Low-Level Client for OpenSearch: The IDs are not returned and need to be pre-assigned to later store them. We can use an atomic counter in Amazon DynamoDB to do so. This allows multiple Lambda functions to index documents in parallel without ID collisions.
As in Figure 4, the Lambda function:
Increases the atomic counter by the number of documents that will index into OpenSearch.
Gets the value of the counter back from the API call.
Indexes the documents using the range that goes between [current counter value, current counter value – number of documents].
Figure 4. Storing the IDs back from the bulk index operation using the Python Low-Level Client for OpenSearch
Data flow automation
As architectures evolve towards automation, the data flow between data lake stages becomes event-driven. Following our previous example, we can automate the processing steps of the data when moving from the raw to the indexing zone (Figure 5).
The same approach can be applied to the other data lake stages to achieve a fully automated architecture. Explore this implementation for an automated language use case.
Conclusion
In this blog post, we covered designing an architecture to effectively handle text data using a data lake on AWS. We explained how different data teams can work independently to extract insights from text documents at different lifecycle stages using OpenSearch as the search and analytics service.
In the telecommunications industry, sensitive authentication and user data are typically received through mobile voice and keypads, and companies are responsible for protecting the data obtained through these channels. The increasing use of voice-driven interactive voice response (IVR) has resulted in a need to provide solutions that can protect user data that is gathered from mobile voice inputs. In this blog post, you’ll see how to protect a caller’s sensitive voice data that was captured through Amazon Lex by using data encryption implemented through AWS Lambda functions. The solution described in this post helps you to protect customer data received through voice channels from inadvertent or unknown access. The solution also includes decryption capabilities, which give an authorized administrator or operator the ability to decrypt user data from a Lambda console.
Solution overview
To demonstrate the IVR solution described in this post, a caller speaks two sensitive pieces of data—credit card number and zip code—from an Amazon Connect contact flow. The spoken values are encrypted and returned to the contact flow to be stored in contact attributes. The encrypted ciphertext is retained as a contact attribute for decryption purposes. Amazon CloudWatch Logs is enabled in the contact flow, but only the encrypted values are logged in log streams.
In the newly created Amazon Connect instance, under the Overview section, find the access URL with the format https://<aliasname>.awsapps.com/connect/login
Make note of the access URL, which you will use later to log in to the Amazon Connect Dashboard.
From the Routing menu on the left side, choose Contact flows to show the list of contact flows.
Choose Create Contact flow.
Choose the arrow to the right of the Save button and choose Import flow (beta). This imports the contact flow that you previously downloaded in the procedure To clone or download the solution.
The contact flow already has the Amazon Lex bot configured.
Figure 5: Select Import flow (beta)
In the upper right corner of the contact flow, choose Save, and then choose OK to save the changes.
Choose Publish to make the contact flow ready for use during the validation steps.
(Optional) Claim a phone number (if none is available), using the following steps:
In the Connect Dashboard, on the navigation menu, choose Channels, and then choose Phone numbers.
On the right side of the page, choose Claim a number.
Select the DID(Direct Inward Dialing) tab. Use the drop-down arrow to choose your country/region. When numbers are returned, choose one.
Write down the phone number. You call it later in this post.
(Optional) On the Edit Phone number page, in the Description box, you can type a note if desired.
To assign the contact flow to your claimed phone number, for Contact flow / IVR, choose the drop-down arrow, and then choose Secure_Lex_Input.
Choose Save.
Figure 6: Under Contact flow / IVR, select the imported contact flow
Dial the test phone number to go through the voice prompt flow.
When prompted, speak a 16-digit credit card number (you have a maximum of two retries), then speak a 5-digit zip code (also a maximum of two retries).
After you complete your test call, review the log streams in Amazon CloudWatch Logs to confirm that the digits that you entered are now encrypted and stored as a contact attribute. The two entered values zipcode and creditcard are stored in contact attributes. Both are encrypted.
Figure 7: Sample log showing encrypted values for zipcode and creditcard
Log in to your Amazon Connect Dashboard as a Supervisor. The URL is provided after the connect instance has been created. In the navigation menu, choose Contact search.
Figure 8: Choose Contact search to look for the call information
Locate your inbound call on the Contact search list. Note that it can take up to 60 seconds for data to appear in the Contact search list.
Select the Contact ID for your call.
Figure 9: The Contact search showing the contact details for your test call
Copy the encrypted values for creditcard and zipcode and make note of them; you will use these values in the next procedure.
Figure 10: Contact attributes stored in a contact flow are registered as part of the contact details
Use the Search bar to look for the dev-encryption-core-DecryptFn Lambda function, and then select the name link to open it.
Under folder encryption-master, open the test folder. Under the tab \events, locate the file decrypt.json.
Use the following steps to create a sample test event in the console by using the contents from decrypt.json. For more details, see Testing Lambda functions in the console.
Use the encrypted values saved in the Validate a solution procedure and replace the ones in the recently created test event.
Figure 11: Replace the creditcard or zipCode values with the ones from the Contact Search page
Choose Test. The output from the test shows the values decrypted by the Lambda function. This is shown in Figure 12under the Execution result tab.
Figure 12: Result from the decryption operation
Note: Make sure that only the appropriate authorized administrator or operator, application, or AWS service is able to invoke the decryption Lambda function.
You have now successfully implemented the solution by encrypting and decrypting the voice input of your test call, which you collected through Amazon Lex.
Cleanup
To avoid incurring future charges, follow these steps to clean up the deployed resources that you created when implementing this solution.
To delete the Amazon Connect instance
In the Amazon Connect console, under Instance alias, select the name of the Amazon Connect instance, and choose Delete.
When prompted, type the name of the instance, and then choose Delete.
To delete the Amazon Lex bot
In the Amazon Lex console, choose the bot that you created in the To configure the Amazon Lex bot procedure.
Choose Delete, and then choose Continue.
To delete the AWS CloudFormation stack
In the AWS CloudFormation console, on the Stacks page, select the stack you created in the procedure To create AWS resources needed for encryption and decryption.
In the stack details pane, choose Delete.
Choose Delete stack when prompted. This deletes the Amazon S3 bucket, IAM roles and AWS Lambda functions you created for testing. This will also schedule a deletion date on the AWS KMS key.
Conclusion
In this post, you learned how an Amazon Connect contact flow can collect voice inputs from a caller by using Amazon Lex, and how you can encrypt these inputs by using your own AWS KMS key. This solution can help improve the security of voice input that is collected through Amazon Connect. For cost information, see the Amazon Connect pricing page.
For more information, see the blog post Creating a secure IVR solution with Amazon Connect and the topic Encrypt customer input (using OpenSSL) in the Amazon Connect Administrator Guide. As previously mentioned, the increasing use of voice-driven IVR has resulted in a need to provide solutions that can protect user data gathered from mobile voice inputs.
If you need help with setting up this solution, you can get assistance from AWS Professional Services. You can also seek assistance from Amazon Connect partners available worldwide.
If you have feedback about this post, submit comments in the Comments section below. If you have questions about this post, contact AWS Support.
Want more AWS Security news? Follow us on Twitter.
AWS re:Invent returned to Las Vegas, Nevada, November 28 to December 2, 2022. After a virtual event in 2020 and a hybrid 2021 edition, spirits were high as over 51,000 in-person attendees returned to network and learn about the latest AWS innovations.
Now in its 11th year, the conference featured 5 keynotes, 22 leadership sessions, and more than 2,200 breakout sessions and hands-on labs at 6 venues over 5 days.
With well over 100 service and feature announcements—and innumerable best practices shared by AWS executives, customers, and partners—distilling highlights is a challenge. From a security perspective, three key themes emerged.
Turn data into actionable insights
Security teams are always looking for ways to increase visibility into their security posture and uncover patterns to make more informed decisions. However, as AWS Vice President of Data and Machine Learning, Swami Sivasubramanian, pointed out during his keynote, data often exists in silos; it isn’t always easy to analyze or visualize, which can make it hard to identify correlations that spark new ideas.
“Data is the genesis for modern invention.” – Swami Sivasubramanian, AWS VP of Data and Machine Learning
At AWS re:Invent, we launched new features and services that make it simpler for security teams to store and act on data. One such service is Amazon Security Lake, which brings together security data from cloud, on-premises, and custom sources in a purpose-built data lake stored in your account. The service, which is now in preview, automates the sourcing, aggregation, normalization, enrichment, and management of security-related data across an entire organization for more efficient storage and query performance. It empowers you to use the security analytics solutions of your choice, while retaining control and ownership of your security data.
Amazon Security Lake has adopted the Open Cybersecurity Schema Framework (OCSF), which AWS cofounded with a number of organizations in the cybersecurity industry. The OCSF helps standardize and combine security data from a wide range of security products and services, so that it can be shared and ingested by analytics tools. More than 37 AWS security partners have announced integrations with Amazon Security Lake, enhancing its ability to transform security data into a powerful engine that helps drive business decisions and reduce risk. With Amazon Security Lake, analysts and engineers can gain actionable insights from a broad range of security data and improve threat detection, investigation, and incident response processes.
Strengthen security programs
According to Gartner, by 2026, at least 50% of C-Level executives will have performance requirements related to cybersecurity risk built into their employment contracts. Security is top of mind for organizations across the globe, and as AWS CISO CJ Moses emphasized during his leadership session, we are continuously building new capabilities to help our customers meet security, risk, and compliance goals.
In addition to Amazon Security Lake, several new AWS services announced during the conference are designed to make it simpler for builders and security teams to improve their security posture in multiple areas.
Identity and networking
Authorization is a key component of applications. Amazon Verified Permissions is a scalable, fine-grained permissions management and authorization service for custom applications that simplifies policy-based access for developers and centralizes access governance. The new service gives developers a simple-to-use policy and schema management system to define and manage authorization models. The policy-based authorization system that Amazon Verified Permissions offers can shorten development cycles by months, provide a consistent user experience across applications, and facilitate integrated auditing to support stringent compliance and regulatory requirements.
Additional services that make it simpler to define authorization and service communication include Amazon VPC Lattice, an application-layer service that consistently connects, monitors, and secures communications between your services, and AWS Verified Access, which provides secure access to corporate applications without a virtual private network (VPN).
Threat detection and monitoring
Monitoring for malicious activity and anomalous behavior just got simpler. Amazon GuardDuty RDS Protection expands the threat detection capabilities of GuardDuty by using tailored machine learning (ML) models to detect suspicious logins to Amazon Aurora databases. You can enable the feature with a single click in the GuardDuty console, with no agents to manually deploy, no data sources to enable, and no permissions to configure. When RDS Protection detects a potentially suspicious or anomalous login attempt that indicates a threat to your database instance, GuardDuty generates a new finding with details about the potentially compromised database instance. You can view GuardDuty findings in AWS Security Hub, Amazon Detective (if enabled), and Amazon EventBridge, allowing for integration with existing security event management or workflow systems.
To bolster vulnerability management processes, Amazon Inspector now supports AWS Lambda functions, adding automated vulnerability assessments for serverless compute workloads. With this expanded capability, Amazon Inspector automatically discovers eligible Lambda functions and identifies software vulnerabilities in application package dependencies used in the Lambda function code. Actionable security findings are aggregated in the Amazon Inspector console, and pushed to Security Hub and EventBridge to automate workflows.
Data protection and privacy
The first step to protecting data is to find it. Amazon Macie now automatically discovers sensitive data, providing continual, cost-effective, organization-wide visibility into where sensitive data resides across your Amazon Simple Storage Service (Amazon S3) estate. With this new capability, Macie automatically and intelligently samples and analyzes objects across your S3 buckets, inspecting them for sensitive data such as personally identifiable information (PII), financial data, and AWS credentials. Macie then builds and maintains an interactive data map of your sensitive data in S3 across your accounts and Regions, and provides a sensitivity score for each bucket. This helps you identify and remediate data security risks without manual configuration and reduce monitoring and remediation costs.
Encryption is a critical tool for protecting data and building customer trust. The launch of the end-to-end encrypted enterprise communication service AWS Wickr offers advanced security and administrative controls that can help you protect sensitive messages and files from unauthorized access, while working to meet data retention requirements.
Management and governance
Maintaining compliance with regulatory, security, and operational best practices as you provision cloud resources is key. AWS Config rules, which evaluate the configuration of your resources, have now been extended to support proactive mode, so that they can be incorporated into infrastructure-as-code continuous integration and continuous delivery (CI/CD) pipelines to help identify noncompliant resources prior to provisioning. This can significantly reduce time spent on remediation.
Managing the controls needed to meet your security objectives and comply with frameworks and standards can be challenging. To make it simpler, we launched comprehensive controls management with AWS Control Tower. You can use it to apply managed preventative, detective, and proactive controls to accounts and organizational units (OUs) by service, control objective, or compliance framework. You can also use AWS Control Tower to turn on Security Hub detective controls across accounts in an OU. This new set of features reduces the time that it takes to define and manage the controls required to meet specific objectives, such as supporting the principle of least privilege, restricting network access, and enforcing data encryption.
Do more with less
As we work through macroeconomic conditions, security leaders are facing increased budgetary pressures. In his opening keynote, AWS CEO Adam Selipsky emphasized the effects of the pandemic, inflation, supply chain disruption, energy prices, and geopolitical events that continue to impact organizations.
Now more than ever, it is important to maintain your security posture despite resource constraints. Citing specific customer examples, Selipsky underscored how the AWS Cloud can help organizations move faster and more securely. By moving to the cloud, agricultural machinery manufacturer Agco reduced costs by 78% while increasing data retrieval speed, and multinational HVAC provider Carrier Global experienced a 40% reduction in the cost of running mission-critical ERP systems.
“If you’re looking to tighten your belt, the cloud is the place to do it.” – Adam Selipsky, AWS CEO
Security teams can do more with less by maximizing the value of existing controls, and bolstering security monitoring and analytics capabilities. Services and features announced during AWS re:Invent—including Amazon Security Lake, sensitive data discovery with Amazon Macie, support for Lambda functions in Amazon Inspector, Amazon GuardDuty RDS Protection, and more—can help you get more out of the cloud and address evolving challenges, no matter the economic climate.
Security is our top priority
AWS re:Invent featured many more highlights on a variety of topics, such as Amazon EventBridge Pipes and the pre-announcement of GuardDuty EKS Runtime protection, as well as Amazon CTO Dr. Werner Vogels’ keynote, and the security partnerships showcased on the Expo floor. It was a whirlwind week, but one thing is clear: AWS is working harder than ever to make our services better and to collaborate on solutions that ease the path to proactive security, so that you can focus on what matters most—your business.
This blog post is written by Solutions Architects John Lee and Jeetendra Vaidya.
AWS Lambda now provides a way to control the maximum number of concurrent functions invoked by Amazon SQS as an event source. You can use this feature to control the concurrency of Lambda functions processing messages in individual SQS queues.
This post describes how to set the maximum concurrency of SQS triggers when using SQS as an event source with Lambda. It also provides an overview of the scaling behavior of Lambda using this architectural pattern, challenges this feature helps address, and a demo of the maximum concurrency feature.
Overview
Lambda uses an event source mapping to process items from a stream or queue. The event source mapping reads from an event source, such as an SQS queue, optionally filters the messages, batches them, and invokes the mapped Lambda function.
The scaling behavior for Lambda integration with SQS FIFO queues is simple. A single Lambda function processes batches of messages within a single message group to ensure that messages are processed in order.
For SQS standard queues, the event source mapping polls the queue to consume incoming messages, starting at five concurrent batches with five functions at a time. As messages are added to the SQS queue, Lambda continues to scale out to meet demand, adding up to 60 functions per minute, up to 1,000 functions, to consume those messages. To learn more about Lambda scaling behavior, read ”Understanding how AWS Lambda scales with Amazon SQS standard queues.”
Lambda processing standard SQS queues
Challenges
When a large number of messages are in the SQS queue, Lambda scales out, adding additional functions to process the messages. The scale out can consume the concurrency quota in the account. To prevent this from happening, you can set reserved concurrency for individual Lambda functions. This ensures that the specified Lambda function can always scale to that much concurrency, but it also cannot exceed this number.
When the Lambda function concurrency reaches the reserved concurrency limit, the queue configuration specifies the subsequent behavior. The message is returned to the queue and retried based on the redrive policy, expired based on its retention policy, or sent to another SQS dead-letter queue (DLQ). While sending unprocessed messages to a DLQ is a good option to preserve messages, it requires a separate mechanism to inspect and process messages from the DLQ.
The following example shows a Lambda function reaching its reserved concurrency quota of 10.
Lambda reaching reserved concurrency of 10.
Maximum Lambda concurrency with SQS as an event source
The launch of maximum concurrency for SQS as an event source allows you to control Lambda function concurrency per source. You set the maximum concurrency on the event source mapping, not on the Lambda function.
This event source mapping setting does not change the scaling or batching behavior of Lambda with SQS. You can continue to batch messages with a customized batch size and window. It rather sets a limit on the maximum number of concurrent function invocations per SQS event source. Once Lambda scales and reaches the maximum concurrency configured on the event source, Lambda stops reading more messages from the queue. This feature also provides you with the flexibility to define the maximum concurrency for individual event sources when the Lambda function has multiple event sources.
Maximum concurrency is set to 10 for the SQS queue.
This feature can help prevent a Lambda function from consuming all available Lambda concurrency of the account and avoids messages returning to the queue unnecessarily because of Lambda functions being throttled. It provides an easier way to control and consume messages at a desired pace, controlled by the maximum number of concurrent Lambda functions.
The maximum concurrency setting does not replace the existing reserved concurrency feature. Both serve distinct purposes and the two features can be used together. Maximum concurrency can help prevent overwhelming downstream systems and unnecessary throttled invocations. Reserved concurrency guarantees a maximum number of concurrent instances for the function.
When used together, the Lambda function can have its own allocated capacity (reserved concurrency), while being able to control the throughput for each event source (maximum concurrency). When using the two features together, you must set the function reserved concurrency higher than the maximum concurrency on the SQS event source mapping to prevent throttling.
Setting maximum concurrency for SQS as an event source
The following demo compares Lambda receiving and processes messages differently when using maximum concurrency compared to reserved concurrency.
This GitHub repository contains an AWS SAM template that deploys the following resources:
ReservedConcurrencyQueue (SQS queue)
ReservedConcurrencyDeadLetterQueue (SQS queue)
ReservedConcurrencyFunction (Lambda function)
MaxConcurrencyQueue (SQS queue)
MaxConcurrencyDeadLetterQueue (SQS queue)
MaxConcurrencyFunction (Lambda function)
CloudWatchDashboard (CloudWatch dashboard)
The AWS SAM template provisions two sets of identical architectures and an Amazon CloudWatch dashboard to monitor the resources. Each architecture comprises a Lambda function receiving messages from an SQS queue, and a DLQ for the SQS queue.
The maxReceiveCount is set as 1 for the SQS queues, which sends any returned messages directly to the DLQ. The ReservedConcurrencyFunction has its reserved concurrency set to 5, and the MaxConcurrencyFunction has the maximum concurrency for the SQS event source set to 5.
Pre-requisites
Running this demo requires the AWS CLI and the AWS SAM CLI. After installing both CLIs, clone this GitHub repository and navigate to the root of the directory:
git clone https://github.com/aws-samples/aws-lambda-amazon-sqs-max-concurrency
cd aws-lambda-amazon-sqs-max-concurrency
Deploying the AWS SAM template
Build the AWS SAM template with the build command to prepare for deployment to your AWS environment.
sam build
Use the guided deploy command to deploy the resources in your account.
sam deploy --guided
Give the stack a name and accept the remaining default values. Once deployed, you can track the progress through the CLI or by navigating to the AWS CloudFormation page in the AWS Management Console.
Note the queue URLs from the Outputs tab in the AWS SAM CLI, CloudFormation console, or navigate to the SQS console to find the queue URLs.
The Outputs tab of the launched AWS SAM template provides URLs to CloudWatch dashboard and SQS queues.
Running the demo
The deployed Lambda function code simulates processing by sleeping for 10 seconds before returning a 200 response. This allows the function to reach a high function concurrency number with only a small number of messages.
To add 25 messages to the Reserved Concurrency queue, run the following commands. Replace <ReservedConcurrencyQueueURL> with your queue URL from the AWS SAM Outputs.
for i in {1..25}; do aws sqs send-message --queue-url <ReservedConcurrencyQueueURL> --message-body testing; done
To add 25 messages to the Maximum Concurrency queue, run the following commands. Replace <MaxConcurrencyQueueURL> with your queue URL from the AWS SAM Outputs.
for i in {1..25}; do aws sqs send-message --queue-url <MaxConcurrencyQueueURL> --message-body testing; done
After sending messages to both queues, navigate to the dashboard URL available in the Outputs tab to view the CloudWatch dashboard.
Validating results
Both Lambda functions have the same number of invocations and the same concurrent invocations fixed at 5. The CloudWatch dashboard shows the ReservedConcurrencyFunction experienced throttling and 9 messages, as seen in the top-right metric, were sent to the corresponding DLQ. The MaxConcurrencyFunction did not experience any throttling and messages were not delivered to the DLQ.
CloudWatch dashboard showing throttling and DLQs.
Clean up
To remove all the resources created in this demo, use the delete command and follow the prompts:
sam delete
Conclusion
You can now control the maximum number of concurrent functions invoked by SQS as a Lambda event source. This post explains the scaling behavior of Lambda using this architectural pattern, challenges this feature helps address, and a demo of maximum concurrency in action.
There are no additional charges to use this feature besides the standard SQS and Lambda charges. You can start using maximum concurrency for SQS as an event source with new or existing event source mappings by connecting it with SQS. This feature is available in all Regions where Lambda and SQS are available.
For more serverless learning resources, visit Serverless Land.
The collective thoughts of the interwebz
Manage Consent
To provide the best experiences, we use technologies like cookies to store and/or access device information. Consenting to these technologies will allow us to process data such as browsing behavior or unique IDs on this site. Not consenting or withdrawing consent, may adversely affect certain features and functions.
Functional
Always active
The technical storage or access is strictly necessary for the legitimate purpose of enabling the use of a specific service explicitly requested by the subscriber or user, or for the sole purpose of carrying out the transmission of a communication over an electronic communications network.
Preferences
The technical storage or access is necessary for the legitimate purpose of storing preferences that are not requested by the subscriber or user.
Statistics
The technical storage or access that is used exclusively for statistical purposes.The technical storage or access that is used exclusively for anonymous statistical purposes. Without a subpoena, voluntary compliance on the part of your Internet Service Provider, or additional records from a third party, information stored or retrieved for this purpose alone cannot usually be used to identify you.
Marketing
The technical storage or access is required to create user profiles to send advertising, or to track the user on a website or across several websites for similar marketing purposes.