Tag Archives: Best practices

Patterns for enterprise data sharing at scale

Post Syndicated from Venkata Sistla original https://aws.amazon.com/blogs/big-data/patterns-for-enterprise-data-sharing-at-scale/

Data sharing is becoming an important element of an enterprise data strategy. AWS services like AWS Data Exchange provide an avenue for companies to share or monetize their value-added data with other companies. Some organizations would like to have a data sharing platform where they can establish a collaborative and strategic approach to exchange data with a restricted group of companies in a closed, secure, and exclusive environment. For example, financial services companies and their auditors, or manufacturing companies and their supply chain partners. This fosters development of new products and services and helps improve their operational efficiency.

Data sharing is a team effort, it’s important to note that in addition to establishing the right infrastructure, successful data sharing also requires organizations to ensure that business owners sponsor data sharing initiatives. They also need to ensure that data is of high quality. Data platform owners and security teams should encourage proper data use and fix any privacy and confidentiality issues.

This blog discusses various data sharing options and common architecture patterns that organizations can adopt to set up their data sharing infrastructure based on AWS service availability and data compliance.

Data sharing options and data classification types

Organizations operate across a spectrum of security compliance constraints. For some organizations, it’s possible to use AWS services like AWS Data Exchange. However, organizations working in heavily regulated industries like federal agencies or financial services might be limited by the allow listed AWS service options. For example, if an organization is required to operate in a Fedramp Medium or Fedramp High environment, their options to share data may be limited by the AWS services that are available and have been allow listed. Service availability is based on platform certification by AWS, and allow listing is based on the organizations defining their security compliance architecture and guidelines.

The kind of data that the organization wants to share with its partners may also have an impact on the method used for data sharing. Complying with data classification rules may further limit their choice of data sharing options they may choose.

The following are some general data classification types:

  • Public data – Important information, though often freely available for people to read, research, review and store. It typically has the lowest level of data classification and security.
  • Private data – Information you might want to keep private like email inboxes, cell phone content, employee identification numbers, or employee addresses. If private data were shared, destroyed, or altered, it might pose a slight risk to an individual or the organization.
  • Confidential or restricted data – A limited group of individuals or parties can access sensitive information often requiring special clearance or special authorization. Confidential or restricted data access might involve aspects of identity and authorization management. Examples of confidential data include Social Security numbers and vehicle identification numbers.

The following is a sample decision tree that you can refer to when choosing your data sharing option based on service availability, classification type, and data format (structured or unstructured). Other factors like usability, multi-partner accessibility, data size, consumption patterns like bulk load/API access, and more may also affect the choice of data sharing pattern.

decisiontree

In the following sections, we discuss each pattern in more detail.

Pattern 1: Using AWS Data Exchange

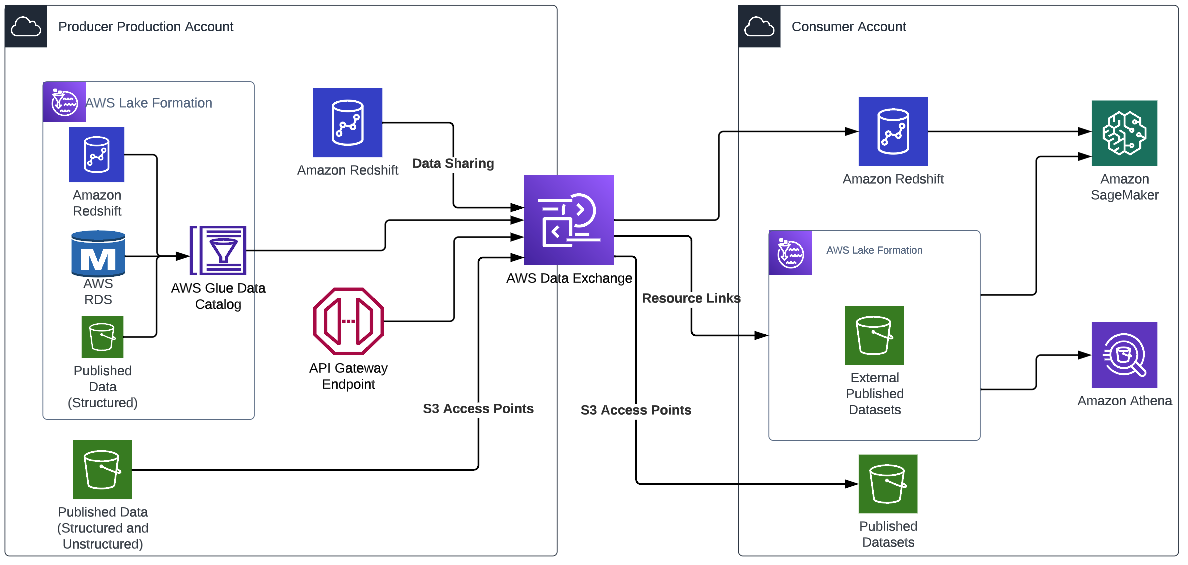
AWS Data Exchange makes exchanging data easier, helping organizations lower costs, become more agile, and innovate faster. Organizations can choose to share data privately using AWS Data Exchange with their external partners. AWS Data Exchange offers perimeter controls that are applied at identity and resource levels. These controls decide which external identities have access to specific data resources. AWS Data Exchange provides multiple different patterns for external parties to access data, such as the following:

The following diagram illustrates an example architecture.

pattern1

With AWS Data Exchange, once the dataset to share (or sell) is configured, AWS Data Exchange automatically manages entitlements (and billing) between the producer and the consumer. The producer doesn’t have to manage policies, set up new access points, or create new Amazon Redshift data shares for each consumer, and access is automatically revoked if the subscription ends. This can significantly reduce the operational overhead in sharing data.

Pattern 2: Using AWS Lake Formation for centralized access management

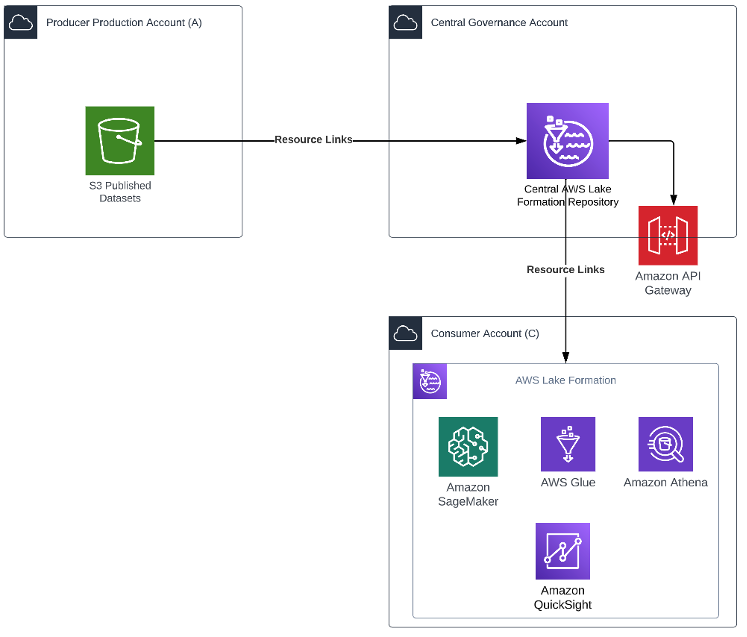
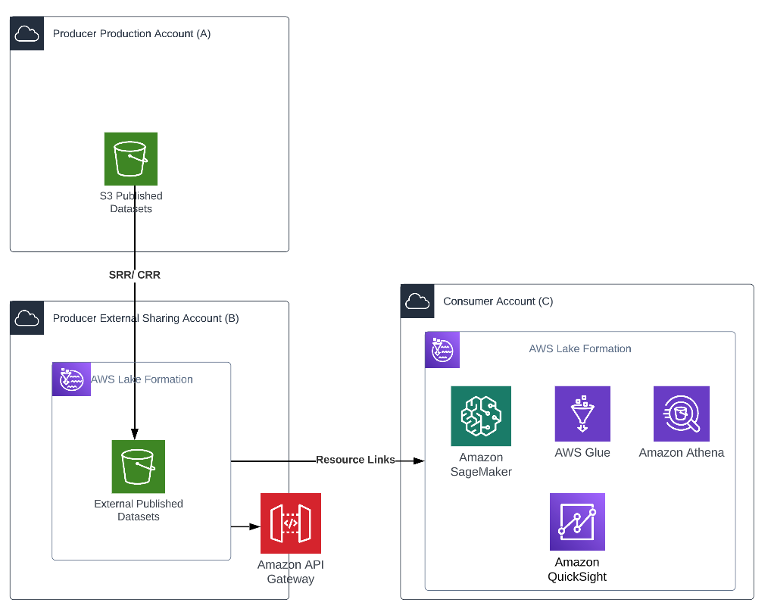
You can use this pattern in cases where both the producer and consumer are on the AWS platform with an AWS account that is enabled to use AWS Lake Formation. This pattern provides a no-code approach to data sharing. The following diagram illustrates an example architecture.

pattern2

In this pattern, the central governance account has Lake Formation configured for managing access across the producer’s org accounts. Resource links from the production account Amazon Simple Storage Service (Amazon S3) bucket are created in Lake Formation. The producer grants Lake Formation permissions on an AWS Glue Data Catalog resource to an external account, or directly to an AWS Identity and Access Management (IAM) principal in another account. Lake Formation uses AWS Resource Access Manager (AWS RAM) to share the resource. If the grantee account is in the same organization as the grantor account, the shared resource is available immediately to the grantee. If the grantee account is not in the same organization, AWS RAM sends an invitation to the grantee account to accept or reject the resource grant. To make the shared resource available, the consumer administrator in the grantee account must use the AWS RAM console or AWS Command Line Interface (AWS CLI) to accept the invitation.

Authorized principals can share resources explicitly with an IAM principal in an external account. This feature is useful when the producer wants to have control over who in the external account can access the resources. The permissions the IAM principal receives are a union of direct grants and the account-level grants that are cascaded down to the principals. The data lake administrator of the recipient account can view the direct cross-account grants, but can’t revoke permissions.

Pattern 3: Using AWS Lake Formation from the producer external sharing account

The producer may have stringent security requirements where no external consumer should access their production account or their centralized governance account. They may also not have Lake Formation enabled on their production platform. In such cases, as shown in the following diagram, the producer production account (Account A) is dedicated to its internal organization users. The producer creates another account, the producer external sharing account (Account B), which is dedicated for external sharing. This gives the producer more latitude to create specific policies for specific organizations.

The following architecture diagram shows an overview of the pattern.

pattern3

The producer implements a process to create an asynchronous copy of data in Account B. The bucket can be configured for Same Region Replication (SRR) or Cross Region Replication (CRR) for objects that need to be shared. This facilitates automated refresh of data to the external account to the “External Published Datasets” S3 bucket without having to write any code.

Creating a copy of the data allows the producer to add another degree of separation between the external consumer and its production data. It also helps meet any compliance or data sovereignty requirements.

Lake Formation is set up on Account B, and the administrator creates resources links for the “External Published Datasets” S3 bucket in its account to grant access. The administrator follows the same process to grant access as described earlier.

Pattern 4: Using Amazon Redshift data sharing

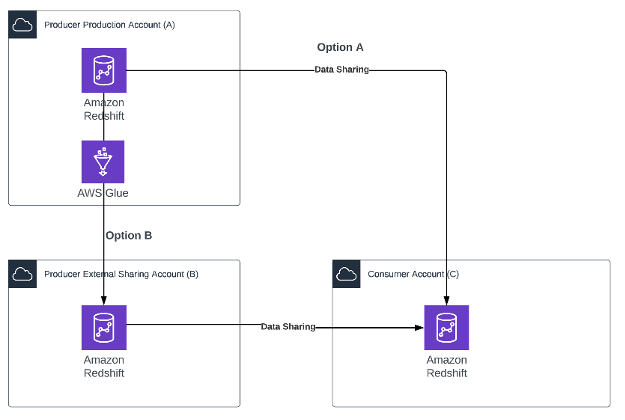
This pattern is ideally suited for a producer who has most of their published data products on Amazon Redshift. This pattern also requires the producer’s external sharing account (Account B) and the consumer account (Account C) to have an encrypted Amazon Redshift cluster or Amazon Redshift Serverless endpoint that meets the prerequisites for Amazon Redshift data sharing.

The following architecture diagram shows an overview of the pattern.

pattern4

Two options are possible depending on the producer’s compliance constraints:

  • Option A – The producer enables data sharing directly on the production Amazon Redshift cluster.
  • Option B – The producer may have constraints with respect to sharing the production cluster. The producer creates a simple AWS Glue job that copies data from the Amazon Redshift cluster in the production Account A to the Amazon Redshift cluster in the external Account B. This AWS Glue job can be scheduled to refresh data as needed by the consumer. When the data is available in Account B, the producer can create multiple views and multiple data shares as needed.

In both options, the producer maintains complete control over what data is being shared, and the consumer admin maintains full control over who can access the data within their organization.

After both the producer and consumer admins approve the data sharing request, the consumer user can access this data as if it were part of their own account without have to write any additional code.

Pattern 5: Sharing data securely and privately using APIs

You can adopt this pattern when the external partner doesn’t have a presence on AWS. You can also use this pattern when published data products are spread across various services like Amazon S3, Amazon Redshift, Amazon DynamoDB, and Amazon OpenSearch Service but the producer would like to maintain a single data sharing interface.

Here’s an example use case: Company A would like to share some of its log data in near-real time with its partner Company B, who uses this data to generate predictive insights for Company A. Company A stores this data in Amazon Redshift. The company wants to share this transactional information with its partner after masking the personally identifiable information (PII) in a cost-effective and secure way to generate insights. Company B doesn’t use the AWS platform.

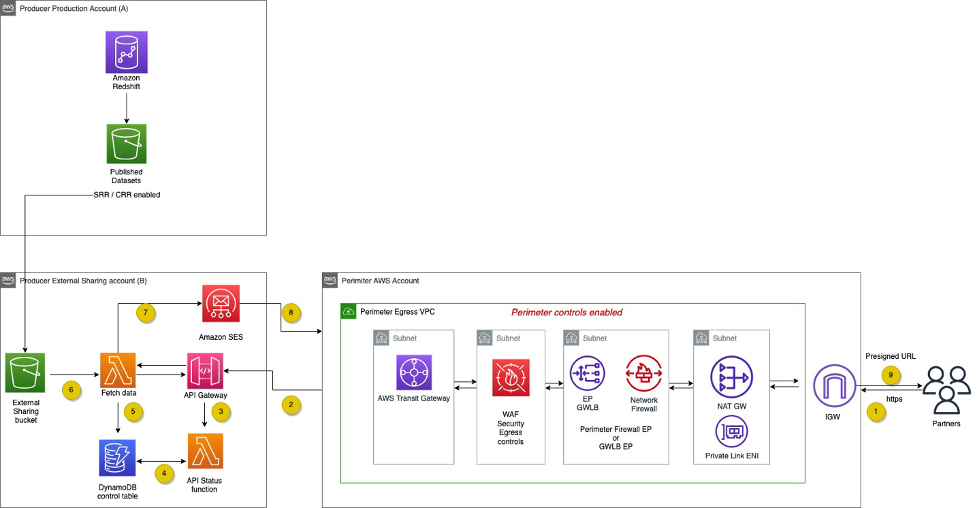
Company A establishes a microbatch process using an AWS Lambda function or AWS Glue that queries Amazon Redshift to get incremental log data, applies the rules to redact the PII, and loads this data to the “Published Datasets” S3 bucket. This instantiates an SRR/CRR process that refreshes this data in the “External Sharing” S3 bucket.

The following diagram shows how the consumer can then use an API-based approach to access this data.

pattern5

The workflow contains the following steps:

  1. An HTTPS API request is sent from the API consumer to the API proxy layer.
  2. The HTTPS API request is forwarded from the API proxy to Amazon API Gateway in the external sharing AWS account.
  3. Amazon API Gateway calls the request receiver Lambda function.
  4. The request receiver function writes the status to a DynamoDB control table.
  5. A second Lambda function, the poller, checks the status of the results in the DynamoDB table.
  6. The poller function fetches results from Amazon S3.
  7. The poller function sends a presigned URL to download the file from the S3 bucket to the requestor via Amazon Simple Email Service (Amazon SES).
  8. The requestor downloads the file using the URL.
  9. The network perimeter AWS account only allows egress internet connection.
  10. The API proxy layer enforces both the egress security controls and perimeter firewall before the traffic leaves the producer’s network perimeter.
  11. The AWS Transit Gateway security egress VPC routing table only allows connectivity from the required producer’s subnet, while preventing internet access.

Pattern 6: Using Amazon S3 access points

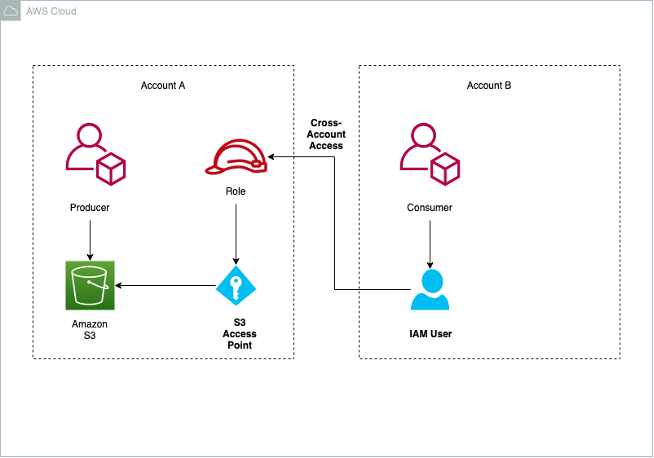
Data scientists may need to work collaboratively on image, videos, and text documents. Legal and audit groups may want to share reports and statements with the auditing agencies. This pattern discusses an approach to sharing such documents. The pattern assumes that the external partners are also on AWS. Amazon S3 access points allow the producer to share access with their consumer by setting up cross-account access without having to edit bucket policies.

Access points are named network endpoints that are attached to buckets that you can use to perform S3 object operations, such as GetObject and PutObject. Each access point has distinct permissions and network controls that Amazon S3 applies for any request that is made through that access point. Each access point enforces a customized access point policy that works in conjunction with the bucket policy attached to the underlying bucket.

The following architecture diagram shows an overview of the pattern.

pattern6

The producer creates an S3 bucket and enables the use of access points. As part of the configuration, the producer specifies the consumer account, IAM role, and privileges for the consumer IAM role.

The consumer users with the IAM role in the consumer account can access the S3 bucket via the internet or restricted to an Amazon VPC via VPC endpoints and AWS PrivateLink.

Conclusion

Each organization has its unique set of constraints and requirements that it needs to fulfill to set up an efficient data sharing solution. In this post, we demonstrated various options and best practices available to organizations. The data platform owner and security team should work together to assess what works best for your specific situation. Your AWS account team is also available to help.

Related resources

For more information on related topics, refer to the following:


About the Authors


Venkata Sistla
is a Cloud Architect – Data & Analytics at AWS. He specializes in building data processing capabilities and helping customers remove constraints that prevent them from leveraging their data to develop business insights.

Santosh Chiplunkar is a Principal Resident Architect at AWS. He has over 20 years of experience helping customers solve their data challenges. He helps customers develop their data and analytics strategy and provides them with guidance on how to make it a reality.

Securely validate business application resilience with AWS FIS and IAM

Post Syndicated from Dr. Rudolf Potucek original https://aws.amazon.com/blogs/devops/securely-validate-business-application-resilience-with-aws-fis-and-iam/

To avoid high costs of downtime, mission critical applications in the cloud need to achieve resilience against degradation of cloud provider APIs and services.

In 2021, AWS launched AWS Fault Injection Simulator (FIS), a fully managed service to perform fault injection experiments on workloads in AWS to improve their reliability and resilience. At the time of writing, FIS allows to simulate degradation of Amazon Elastic Compute Cloud (EC2) APIs using API fault injection actions and thus explore the resilience of workflows where EC2 APIs act as a fault boundary. 

In this post we show you how to explore additional fault boundaries in your applications by selectively denying access to any AWS API. This technique is particularly useful for fully managed, “black box” services like Amazon Simple Storage Service (S3) or Amazon Simple Queue Service (SQS) where a failure of read or write operations is sufficient to simulate problems in the service. This technique is also useful for injecting failures in serverless applications without needing to modify code. While similar results could be achieved with network disruption or modifying code with feature flags, this approach provides a fine granular degradation of an AWS API without the need to re-deploy and re-validate code.

Overview

We will explore a common application pattern: user uploads a file, S3 triggers an AWS Lambda function, Lambda transforms the file to a new location and deletes the original:

S3 upload and transform logical workflow: User uploads file to S3, upload triggers AWS Lambda execution, Lambda writes transformed file to a new bucket and deletes original. Workflow can be disrupted at file deletion.

Figure 1. S3 upload and transform logical workflow: User uploads file to S3, upload triggers AWS Lambda execution, Lambda writes transformed file to a new bucket and deletes original. Workflow can be disrupted at file deletion.

We will simulate the user upload with an Amazon EventBridge rate expression triggering an AWS Lambda function which creates a file in S3:

S3 upload and transform implemented demo workflow: Amazon EventBridge triggers a creator Lambda function, Lambda function creates a file in S3, file creation triggers AWS Lambda execution on transformer function, Lambda writes transformed file to a new bucket and deletes original. Workflow can be disrupted at file deletion.

Figure 2. S3 upload and transform implemented demo workflow: Amazon EventBridge triggers a creator Lambda function, Lambda function creates a file in S3, file creation triggers AWS Lambda execution on transformer function, Lambda writes transformed file to a new bucket and deletes original. Workflow can be disrupted at file deletion.

Using this architecture we can explore the effect of S3 API degradation during file creation and deletion. As shown, the API call to delete a file from S3 is an application fault boundary. The failure could occur, with identical effect, because of S3 degradation or because the AWS IAM role of the Lambda function denies access to the API.

To inject failures we use AWS Systems Manager (AWS SSM) automation documents to attach and detach IAM policies at the API fault boundary and FIS to orchestrate the workflow.

Each Lambda function has an IAM execution role that allows S3 write and delete access, respectively. If the processor Lambda fails, the S3 file will remain in the bucket, indicating a failure. Similarly, if the IAM execution role for the processor function is denied the ability to delete a file after processing, that file will remain in the S3 bucket.

Prerequisites

Following this blog posts will incur some costs for AWS services. To explore this test application you will need an AWS account. We will also assume that you are using AWS CloudShell or have the AWS CLI installed and have configured a profile with administrator permissions. With that in place you can create the demo application in your AWS account by downloading this template and deploying an AWS CloudFormation stack:

git clone https://github.com/aws-samples/fis-api-failure-injection-using-iam.git
cd fis-api-failure-injection-using-iam
aws cloudformation deploy --stack-name test-fis-api-faults --template-file template.yaml --capabilities CAPABILITY_NAMED_IAM

Fault injection using IAM

Once the stack has been created, navigate to the Amazon CloudWatch Logs console and filter for /aws/lambda/test-fis-api-faults. Under the EventBridgeTimerHandler log group you should find log events once a minute writing a timestamped file to an S3 bucket named fis-api-failure-ACCOUNT_ID. Under the S3TriggerHandler log group you should find matching deletion events for those files.

Once you have confirmed object creation/deletion, let’s take away the permission of the S3 trigger handler lambda to delete files. To do this you will attach the FISAPI-DenyS3DeleteObject  policy that was created with the template:

ROLE_NAME=FISAPI-TARGET-S3TriggerHandlerRole
ROLE_ARN=$( aws iam list-roles --query "Roles[?RoleName=='${ROLE_NAME}'].Arn" --output text )
echo Target Role ARN: $ROLE_ARN

POLICY_NAME=FISAPI-DenyS3DeleteObject
POLICY_ARN=$( aws iam list-policies --query "Policies[?PolicyName=='${POLICY_NAME}'].Arn" --output text )
echo Impact Policy ARN: $POLICY_ARN

aws iam attach-role-policy \
  --role-name ${ROLE_NAME}\
  --policy-arn ${POLICY_ARN}

With the deny policy in place you should now see object deletion fail and objects should start showing up in the S3 bucket. Navigate to the S3 console and find the bucket starting with fis-api-failure. You should see a new object appearing in this bucket once a minute:

S3 bucket listing showing files not being deleted because IAM permissions DENY file deletion during FIS experiment.

Figure 3. S3 bucket listing showing files not being deleted because IAM permissions DENY file deletion during FIS experiment.

If you would like to graph the results you can navigate to AWS CloudWatch, select “Logs Insights“, select the log group starting with /aws/lambda/test-fis-api-faults-S3CountObjectsHandler, and run this query:

fields @timestamp, @message
| filter NumObjects >= 0
| sort @timestamp desc
| stats max(NumObjects) by bin(1m)
| limit 20

This will show the number of files in the S3 bucket over time:

AWS CloudWatch Logs Insights graph showing the increase in the number of retained files in S3 bucket over time, demonstrating the effect of the introduced failure.

Figure 4. AWS CloudWatch Logs Insights graph showing the increase in the number of retained files in S3 bucket over time, demonstrating the effect of the introduced failure.

You can now detach the policy:

ROLE_NAME=FISAPI-TARGET-S3TriggerHandlerRole
ROLE_ARN=$( aws iam list-roles --query "Roles[?RoleName=='${ROLE_NAME}'].Arn" --output text )
echo Target Role ARN: $ROLE_ARN

POLICY_NAME=FISAPI-DenyS3DeleteObject
POLICY_ARN=$( aws iam list-policies --query "Policies[?PolicyName=='${POLICY_NAME}'].Arn" --output text )
echo Impact Policy ARN: $POLICY_ARN

aws iam detach-role-policy \
  --role-name ${ROLE_NAME}\
  --policy-arn ${POLICY_ARN}

We see that newly written files will once again be deleted but the un-processed files will remain in the S3 bucket. From the fault injection we learned that our system does not tolerate request failures when deleting files from S3. To address this, we should add a dead letter queue or some other retry mechanism.

Note: if the Lambda function does not return a success state on invocation, EventBridge will retry. In our Lambda functions we are cost conscious and explicitly capture the failure states to avoid excessive retries.

Fault injection using SSM

To use this approach from FIS and to always remove the policy at the end of the experiment, we first create an SSM document to automate adding a policy to a role. To inspect this document, open the SSM console, navigate to the “Documents” section, find the FISAPI-IamAttachDetach document under “Owned by me”, and examine the “Content” tab (make sure to select the correct region). This document takes the name of the Role you want to impact and the Policy you want to attach as parameters. It also requires an IAM execution role that grants it the power to list, attach, and detach specific policies to specific roles.

Let’s run the SSM automation document from the console by selecting “Execute Automation”. Determine the ARN of the FISAPI-SSM-Automation-Role from CloudFormation or by running:

POLICY_NAME=FISAPI-DenyS3DeleteObject
POLICY_ARN=$( aws iam list-policies --query "Policies[?PolicyName=='${POLICY_NAME}'].Arn" --output text )
echo Impact Policy ARN: $POLICY_ARN

Use FISAPI-SSM-Automation-Role, a duration of 2 minutes expressed in ISO8601 format as PT2M, the ARN of the deny policy, and the name of the target role FISAPI-TARGET-S3TriggerHandlerRole:

Image of parameter input field reflecting the instructions in blog text.

Figure 5. Image of parameter input field reflecting the instructions in blog text.

Alternatively execute this from a shell:

ASSUME_ROLE_NAME=FISAPI-SSM-Automation-Role
ASSUME_ROLE_ARN=$( aws iam list-roles --query "Roles[?RoleName=='${ASSUME_ROLE_NAME}'].Arn" --output text )
echo Assume Role ARN: $ASSUME_ROLE_ARN

ROLE_NAME=FISAPI-TARGET-S3TriggerHandlerRole
ROLE_ARN=$( aws iam list-roles --query "Roles[?RoleName=='${ROLE_NAME}'].Arn" --output text )
echo Target Role ARN: $ROLE_ARN

POLICY_NAME=FISAPI-DenyS3DeleteObject
POLICY_ARN=$( aws iam list-policies --query "Policies[?PolicyName=='${POLICY_NAME}'].Arn" --output text )
echo Impact Policy ARN: $POLICY_ARN

aws ssm start-automation-execution \
  --document-name FISAPI-IamAttachDetach \
  --parameters "{
      \"AutomationAssumeRole\": [ \"${ASSUME_ROLE_ARN}\" ],
      \"Duration\": [ \"PT2M\" ],
      \"TargetResourceDenyPolicyArn\": [\"${POLICY_ARN}\" ],
      \"TargetApplicationRoleName\": [ \"${ROLE_NAME}\" ]
    }"

Wait two minutes and then examine the content of the S3 bucket starting with fis-api-failure again. You should now see two additional files in the bucket, showing that the policy was attached for 2 minutes during which files could not be deleted, and confirming that our application is not resilient to S3 API degradation.

Permissions for injecting failures with SSM

Fault injection with SSM is controlled by IAM, which is why you had to specify the FISAPI-SSM-Automation-Role:

Visual representation of IAM permission used for fault injections with SSM. It shows the SSM execution role permitting access to use SSM automation documents as well as modify IAM roles and policies via the SSM document. It also shows the SSM user needing to have a pass-role permission to grant the SSM execution role to the SSM service.

Figure 6. Visual representation of IAM permission used for fault injections with SSM.

This role needs to contain an assume role policy statement for SSM to allow assuming the role:

      AssumeRolePolicyDocument:
        Statement:
          - Action:
             - 'sts:AssumeRole'
            Effect: Allow
            Principal:
              Service:
                - "ssm.amazonaws.com"

The role also needs to contain permissions to describe roles and their attached policies with an optional constraint on which roles and policies are visible:

          - Sid: GetRoleAndPolicyDetails
            Effect: Allow
            Action:
              - 'iam:GetRole'
              - 'iam:GetPolicy'
              - 'iam:ListAttachedRolePolicies'
            Resource:
              # Roles
              - !GetAtt EventBridgeTimerHandlerRole.Arn
              - !GetAtt S3TriggerHandlerRole.Arn
              # Policies
              - !Ref AwsFisApiPolicyDenyS3DeleteObject

Finally the SSM role needs to allow attaching and detaching a policy document. This requires

  1. an ALLOW statement
  2. a constraint on the policies that can be attached
  3. a constraint on the roles that can be attached to

In the role we collapse the first two requirements into an ALLOW statement with a condition constraint for the Policy ARN. We then express the third requirement in a DENY statement that will limit the '*' resource to only the explicit role ARNs we want to modify:

          - Sid: AllowOnlyTargetResourcePolicies
            Effect: Allow
            Action:  
              - 'iam:DetachRolePolicy'
              - 'iam:AttachRolePolicy'
            Resource: '*'
            Condition:
              ArnEquals:
                'iam:PolicyARN':
                  # Policies that can be attached
                  - !Ref AwsFisApiPolicyDenyS3DeleteObject
          - Sid: DenyAttachDetachAllRolesExceptApplicationRole
            Effect: Deny
            Action: 
              - 'iam:DetachRolePolicy'
              - 'iam:AttachRolePolicy'
            NotResource: 
              # Roles that can be attached to
              - !GetAtt EventBridgeTimerHandlerRole.Arn
              - !GetAtt S3TriggerHandlerRole.Arn

We will discuss security considerations in more detail at the end of this post.

Fault injection using FIS

With the SSM document in place you can now create an FIS template that calls the SSM document. Navigate to the FIS console and filter for FISAPI-DENY-S3PutObject. You should see that the experiment template passes the same parameters that you previously used with SSM:

Image of FIS experiment template action summary. This shows the SSM document ARN to be used for fault injection and the JSON parameters passed to the SSM document specifying the IAM Role to modify and the IAM Policy to use.

Figure 7. Image of FIS experiment template action summary. This shows the SSM document ARN to be used for fault injection and the JSON parameters passed to the SSM document specifying the IAM Role to modify and the IAM Policy to use.

You can now run the FIS experiment and after a couple minutes once again see new files in the S3 bucket.

Permissions for injecting failures with FIS and SSM

Fault injection with FIS is controlled by IAM, which is why you had to specify the FISAPI-FIS-Injection-EperimentRole:

Visual representation of IAM permission used for fault injections with FIS and SSM. It shows the SSM execution role permitting access to use SSM automation documents as well as modify IAM roles and policies via the SSM document. It also shows the FIS execution role permitting access to use FIS templates, as well as the pass-role permission to grant the SSM execution role to the SSM service. Finally it shows the FIS user needing to have a pass-role permission to grant the FIS execution role to the FIS service.

Figure 8. Visual representation of IAM permission used for fault injections with FIS and SSM. It shows the SSM execution role permitting access to use SSM automation documents as well as modify IAM roles and policies via the SSM document. It also shows the FIS execution role permitting access to use FIS templates, as well as the pass-role permission to grant the SSM execution role to the SSM service. Finally it shows the FIS user needing to have a pass-role permission to grant the FIS execution role to the FIS service.

This role needs to contain an assume role policy statement for FIS to allow assuming the role:

      AssumeRolePolicyDocument:
        Statement:
          - Action:
              - 'sts:AssumeRole'
            Effect: Allow
            Principal:
              Service:
                - "fis.amazonaws.com"

The role also needs permissions to list and execute SSM documents:

            - Sid: RequiredReadActionsforAWSFIS
              Effect: Allow
              Action:
                - 'cloudwatch:DescribeAlarms'
                - 'ssm:GetAutomationExecution'
                - 'ssm:ListCommands'
                - 'iam:ListRoles'
              Resource: '*'
            - Sid: RequiredSSMStopActionforAWSFIS
              Effect: Allow
              Action:
                - 'ssm:CancelCommand'
              Resource: '*'
            - Sid: RequiredSSMWriteActionsforAWSFIS
              Effect: Allow
              Action:
                - 'ssm:StartAutomationExecution'
                - 'ssm:StopAutomationExecution'
              Resource: 
                - !Sub 'arn:aws:ssm:${AWS::Region}:${AWS::AccountId}:automation-definition/${SsmAutomationIamAttachDetachDocument}:$DEFAULT'

Finally, remember that the SSM document needs to use a Role of its own to execute the fault injection actions. Because that Role is different from the Role under which we started the FIS experiment, we need to explicitly allow SSM to assume that role with a PassRole statement which will expand to FISAPI-SSM-Automation-Role:

            - Sid: RequiredIAMPassRoleforSSMADocuments
              Effect: Allow
              Action: 'iam:PassRole'
              Resource: !Sub 'arn:aws:iam::${AWS::AccountId}:role/${SsmAutomationRole}'

Secure and flexible permissions

So far, we have used explicit ARNs for our guardrails. To expand flexibility, we can use wildcards in our resource matching. For example, we might change the Policy matching from:

            Condition:
              ArnEquals:
                'iam:PolicyARN':
                  # Explicitly listed policies - secure but inflexible
                  - !Ref AwsFisApiPolicyDenyS3DeleteObject

or the equivalent:

            Condition:
              ArnEquals:
                'iam:PolicyARN':
                  # Explicitly listed policies - secure but inflexible
                  - !Sub 'arn:${AWS::Partition}:iam::${AWS::AccountId}:policy/${FullPolicyName}

to a wildcard notation like this:

            Condition:
              ArnEquals:
                'iam:PolicyARN':
                  # Wildcard policies - secure and flexible
                  - !Sub 'arn:${AWS::Partition}:iam::${AWS::AccountId}:policy/${PolicyNamePrefix}*'

If we set PolicyNamePrefix to FISAPI-DenyS3 this would now allow invoking FISAPI-DenyS3PutObject and FISAPI-DenyS3DeleteObject but would not allow using a policy named FISAPI-DenyEc2DescribeInstances.

Similarly, we could change the Resource matching from:

            NotResource: 
              # Explicitly listed roles - secure but inflexible
              - !GetAtt EventBridgeTimerHandlerRole.Arn
              - !GetAtt S3TriggerHandlerRole.Arn

to a wildcard equivalent like this:

            NotResource: 
              # Wildcard policies - secure and flexible
              - !Sub 'arn:${AWS::Partition}:iam::${AWS::AccountId}:role/${RoleNamePrefixEventBridge}*'
              - !Sub 'arn:${AWS::Partition}:iam::${AWS::AccountId}:role/${RoleNamePrefixS3}*'
and setting RoleNamePrefixEventBridge to FISAPI-TARGET-EventBridge and RoleNamePrefixS3 to FISAPI-TARGET-S3.

Finally, we would also change the FIS experiment role to allow SSM documents based on a name prefix by changing the constraint on automation execution from:

            - Sid: RequiredSSMWriteActionsforAWSFIS
              Effect: Allow
              Action:
                - 'ssm:StartAutomationExecution'
                - 'ssm:StopAutomationExecution'
              Resource: 
                # Explicitly listed resource - secure but inflexible
                # Note: the $DEFAULT at the end could also be an explicit version number
                # Note: the 'automation-definition' is automatically created from 'document' on invocation
                - !Sub 'arn:aws:ssm:${AWS::Region}:${AWS::AccountId}:automation-definition/${SsmAutomationIamAttachDetachDocument}:$DEFAULT'

to

            - Sid: RequiredSSMWriteActionsforAWSFIS
              Effect: Allow
              Action:
                - 'ssm:StartAutomationExecution'
                - 'ssm:StopAutomationExecution'
              Resource: 
                # Wildcard resources - secure and flexible
                # 
                # Note: the 'automation-definition' is automatically created from 'document' on invocation
                - !Sub 'arn:aws:ssm:${AWS::Region}:${AWS::AccountId}:automation-definition/${SsmAutomationDocumentPrefix}*'

and setting SsmAutomationDocumentPrefix to FISAPI-. Test this by updating the CloudFormation stack with a modified template:

aws cloudformation deploy --stack-name test-fis-api-faults --template-file template2.yaml --capabilities CAPABILITY_NAMED_IAM

Permissions governing users

In production you should not be using administrator access to use FIS. Instead we create two roles FISAPI-AssumableRoleWithCreation and FISAPI-AssumableRoleWithoutCreation for you (see this template). These roles require all FIS and SSM resources to have a Name tag that starts with FISAPI-. Try assuming the role without creation privileges and running an experiment. You will notice that you can only start an experiment if you add a Name tag, e.g. FISAPI-secure-1, and you will only be able to get details of experiments and templates that have proper Name tags.

If you are working with AWS Organizations, you can add further guard rails by defining SCPs that control the use of the FISAPI-* tags similar to this blog post.

Caveats

For this solution we are choosing to attach policies instead of permission boundaries. The benefit of this is that you can attach multiple independent policies and thus simulate multi-step service degradation. However, this means that it is possible to increase the permission level of a role. While there are situations where this might be of interest, e.g. to simulate security breaches, please implement a thorough security review of any fault injection IAM policies you create. Note that modifying IAM Roles may trigger events in your security monitoring tools.

The AttachRolePolicy and DetachRolePolicy calls from AWS IAM are eventually consistent, meaning that in some cases permission propagation when starting and stopping fault injection may take up to 5 minutes each.

Cleanup

To avoid additional cost, delete the content of the S3 bucket and delete the CloudFormation stack:

# Clean up policy attachments just in case
CLEANUP_ROLES=$(aws iam list-roles --query "Roles[?starts_with(RoleName,'FISAPI-')].RoleName" --output text)
for role in $CLEANUP_ROLES; do
  CLEANUP_POLICIES=$(aws iam list-attached-role-policies --role-name $role --query "AttachedPolicies[?starts_with(PolicyName,'FISAPI-')].PolicyName" --output text)
  for policy in $CLEANUP_POLICIES; do
    echo Detaching policy $policy from role $role
    aws iam detach-role-policy --role-name $role --policy-arn $policy
  done
done
# Delete S3 bucket content
ACCOUNT_ID=$( aws sts get-caller-identity --query Account --output text )
S3_BUCKET_NAME=fis-api-failure-${ACCOUNT_ID}
aws s3 rm --recursive s3://${S3_BUCKET_NAME}
aws s3 rb s3://${S3_BUCKET_NAME}
# Delete cloudformation stack
aws cloudformation delete-stack --stack-name test-fis-api-faults
aws cloudformation wait stack-delete-complete --stack-name test-fis-api-faults

Conclusion 

AWS Fault Injection Simulator provides the ability to simulate various external impacts to your application to validate and improve resilience. We’ve shown how combining FIS with IAM to selectively deny access to AWS APIs provides a generic path to explore fault boundaries across all AWS services. We’ve shown how this can be used to identify and improve a resilience problem in a common S3 upload workflow. To learn about more ways to use FIS, see this workshop.

About the authors:

Dr. Rudolf Potucek

Dr. Rudolf Potucek is Startup Solutions Architect at Amazon Web Services. Over the past 30 years he gained a PhD and worked in different roles including leading teams in academia and industry, as well as consulting. He brings experience from working with academia, startups, and large enterprises to his current role of guiding startup customers to succeed in the cloud.

Rudolph Wagner

Rudolph Wagner is a Premium Support Engineer at Amazon Web Services who holds the CISSP and OSCP security certifications, in addition to being a certified AWS Solutions Architect Professional. He assists internal and external Customers with multiple AWS services by using his diverse background in SAP, IT, and construction.

Improve collaboration between teams by using AWS CDK constructs

Post Syndicated from Joerg Woehrle original https://aws.amazon.com/blogs/devops/improve-collaboration-between-teams-by-using-aws-cdk-constructs/

There are different ways to organize teams to deliver great software products. There are companies that give the end-to-end responsibility for a product to a single team, like Amazon’s Two-Pizza teams, and there are companies where multiple teams split the responsibility between infrastructure (or platform) teams and application development teams. This post provides guidance on how collaboration efficiency can be improved in the case of a split-team approach with the help of the AWS Cloud Development Kit (CDK).

The AWS CDK is an open-source software development framework to define your cloud application resources. You do this by using familiar programming languages like TypeScript, Python, Java, C# or Go. It allows you to mix code to define your application’s infrastructure, traditionally expressed through infrastructure as code tools like AWS CloudFormation or HashiCorp Terraform, with code to bundle, compile, and package your application.

This is great for autonomous teams with end-to-end responsibility, as it helps them to keep all code related to that product in a single place and single programming language. There is no need to separate application code into a different repository than infrastructure code with a single team, but what about the split-team model?

Larger enterprises commonly split the responsibility between infrastructure (or platform) teams and application development teams. We’ll see how to use the AWS CDK to ensure team independence and agility even with multiple teams involved. We’ll have a look at the different responsibilities of the participating teams and their produced artifacts, and we’ll also discuss how to make the teams work together in a frictionless way.

This blog post assumes a basic level of knowledge on the AWS CDK and its concepts. Additionally, a very high level understanding of event driven architectures is required.

Team Topologies

Let’s first have a quick look at the different team topologies and each team’s responsibilities.

One-Team Approach

In this blog post we will focus on the split-team approach described below. However, it’s still helpful to understand what we mean by “One-Team” Approach: A single team owns an application from end-to-end. This cross-functional team decides on its own on the features to implement next, which technologies to use and how to build and deploy the resulting infrastructure and application code. The team’s responsibility is infrastructure, application code, its deployment and operations of the developed service.

If you’re interested in how to structure your AWS CDK application in a such an environment have a look at our colleague Alex Pulver’s blog post Recommended AWS CDK project structure for Python applications.

Split-Team Approach

In reality we see many customers who have separate teams for application development and infrastructure development and deployment.

Infrastructure Team

What I call the infrastructure team is also known as the platform or operations team. It configures, deploys, and operates the shared infrastructure which other teams consume to run their applications on. This can be things like an Amazon SQS queue, an Amazon Elastic Container Service (Amazon ECS) cluster as well as the CI/CD pipelines used to bring new versions of the applications into production.
It is the infrastructure team’s responsibility to get the application package developed by the Application Team deployed and running on AWS, as well as provide operational support for the application.

Application Team

Traditionally the application team just provides the application’s package (for example, a JAR file or an npm package) and it’s the infrastructure team’s responsibility to figure out how to deploy, configure, and run it on AWS. However, this traditional setup often leads to bottlenecks, as the infrastructure team will have to support many different applications developed by multiple teams. Additionally, the infrastructure team often has little knowledge of the internals of those applications. This often leads to solutions which are not optimized for the problem at hand: If the infrastructure team only offers a handful of options to run services on, the application team can’t use options optimized for their workload.

This is why we extend the traditional responsibilities of the application team in this blog post. The team provides the application and additionally the description of the infrastructure required to run the application. With “infrastructure required” we mean the AWS services used to run the application. This infrastructure description needs to be written in a format which can be consumed by the infrastructure team.

While we understand that this shift of responsibility adds additional tasks to the application team, we think that in the long term it is worth the effort. This can be the starting point to introduce DevOps concepts into the organization. However, the concepts described in this blog post are still valid even if you decide that you don’t want to add this responsibility to your application teams. The boundary of who is delivering what would then just move more into the direction of the infrastructure team.

To be successful with the given approach, the two teams need to agree on a common format on how to hand over the application, its infrastructure definition, and how to bring it to production. The AWS CDK with its concept of Constructs provides a perfect means for that.

Primer: AWS CDK Constructs

In this section we take a look at the concepts the AWS CDK provides for structuring our code base and how these concepts can be used to fit a CDK project into your team topology.

Constructs

Constructs are the basic building block of an AWS CDK application. An AWS CDK application is composed of multiple constructs which in the end define how and what is deployed by AWS CloudFormation.

The AWS CDK ships with constructs created to deploy AWS services. However, it is important to understand that you are not limited to the out-of-the-box constructs provided by the AWS CDK. The true power of AWS CDK is the possibility to create your own abstractions on top of the default constructs to create solutions for your specific requirement. To achieve this you write, publish, and consume your own, custom constructs. They codify your specific requirements, create an additional level of abstraction and allow other teams to consume and use your construct.

We will use a custom construct to separate the responsibilities between the the application and the infrastructure team. The application team will release a construct which describes the infrastructure along with its configuration required to run the application code. The infrastructure team will consume this construct to deploy and operate the workload on AWS.

How to use the AWS CDK in a Split-Team Setup

Let’s now have a look at how we can use the AWS CDK to split the responsibilities between the application and infrastructure team. I’ll introduce a sample scenario and then illustrate what each team’s responsibility is within this scenario.

Scenario

Our fictitious application development team writes an AWS Lambda function which gets deployed to AWS. Messages in an Amazon SQS queue will invoke the function. Let’s say the function will process orders (whatever this means in detail is irrelevant for the example) and each order is represented by a message in the queue.

The application development team has full flexibility when it comes to creating the AWS Lambda function. They can decide which runtime to use or how much memory to configure. The SQS queue which the function will act upon is created by the infrastructure team. The application team does not have to know how the messages end up in the queue.

With that we can have a look at a sample implementation split between the teams.

Application Team

The application team is responsible for two distinct artifacts: the application code (for example, a Java jar file or an npm module) and the AWS CDK construct used to deploy the required infrastructure on AWS to run the application (an AWS Lambda Function along with its configuration).

The lifecycles of these artifacts differ: the application code changes more frequently than the infrastructure it runs in. That’s why we want to keep the artifacts separate. With that each of the artifacts can be released at its own pace and only if it was changed.

In order to achieve these separate lifecycles, it is important to notice that a release of the application artifact needs to be completely independent from the release of the CDK construct. This fits our approach of separate teams compared to the standard CDK way of building and packaging application code within the CDK construct.

But how will this be done in our example solution? The team will build and publish an application artifact which does not contain anything related to CDK.
When a CDK Stack with this construct is synthesized it will download the pre-built artifact with a given version number from AWS CodeArtifact and use it to create the input zip file for a Lambda function. There is no build of the application package happening during the CDK synth.

With the separation of construct and application code, we need to find a way to tell the CDK construct which specific version of the application code it should fetch from CodeArtifact. We will pass this information to the construct via a property of its constructor.

For dependencies on infrastructure outside of the responsibility of the application team, I follow the pattern of dependency injection. Those dependencies, for example a shared VPC or an Amazon SQS queue, are passed into the construct from the infrastructure team.

Let’s have a look at an example. We pass in the external dependency on an SQS Queue, along with details on the desired appPackageVersion and its CodeArtifact details:

export interface OrderProcessingAppConstructProps {
    queue: aws_sqs.Queue,
    appPackageVersion: string,
    codeArtifactDetails: {
        account: string,
        repository: string,
        domain: string
    }
}

export class OrderProcessingAppConstruct extends Construct {

    constructor(scope: Construct, id: string, props: OrderProcessingAppConstructProps) {
        super(scope, id);

        const lambdaFunction = new lambda.Function(this, 'OrderProcessingLambda', {
            code: lambda.Code.fromDockerBuild(path.join(__dirname, '..', 'bundling'), {
                buildArgs: {
                    'PACKAGE_VERSION' : props.appPackageVersion,
                    'CODE_ARTIFACT_ACCOUNT' : props.codeArtifactDetails.account,
                    'CODE_ARTIFACT_REPOSITORY' : props.codeArtifactDetails.repository,
                    'CODE_ARTIFACT_DOMAIN' : props.codeArtifactDetails.domain
                }
            }),
            runtime: lambda.Runtime.NODEJS_16_X,
            handler: 'node_modules/order-processing-app/dist/index.lambdaHandler'
        });
        const eventSource = new SqsEventSource(props.queue);
        lambdaFunction.addEventSource(eventSource);
    }
}

Note the code lambda.Code.fromDockerBuild(...): We use AWS CDK’s functionality to bundle the code of our Lambda function via a Docker build. The only things which happen inside of the provided Dockerfile are:

  • the login into the AWS CodeArtifact repository which holds the pre-built application code’s package
  • the download and installation of the application code’s artifact from AWS CodeArtifact (in this case via npm)

If you are interested in more details on how you can build, bundle and deploy your AWS CDK assets I highly recommend a blog post by my colleague Cory Hall: Building, bundling, and deploying applications with the AWS CDK. It goes into much more detail than what we are covering here.

Looking at the example Dockerfile we can see the two steps described above:

FROM public.ecr.aws/sam/build-nodejs16.x:latest

ARG PACKAGE_VERSION
ARG CODE_ARTIFACT_AWS_REGION
ARG CODE_ARTIFACT_ACCOUNT
ARG CODE_ARTIFACT_REPOSITORY

RUN aws codeartifact login --tool npm --repository $CODE_ARTIFACT_REPOSITORY --domain $CODE_ARTIFACT_DOMAIN --domain-owner $CODE_ARTIFACT_ACCOUNT --region $CODE_ARTIFACT_AWS_REGION
RUN npm install order-processing-app@$PACKAGE_VERSION --prefix /asset

Please note the following:

  • we use --prefix /asset with our npm install command. This tells npm to install the dependencies into the folder which CDK will mount into the container. All files which should go into the output of the docker build need to be placed here.
  • the aws codeartifact login command requires credentials with the appropriate permissions to proceed. In case you run this on for example AWS CodeBuild or inside of a CDK Pipeline you need to make sure that the used role has the appropriate policies attached.

Infrastructure Team

The infrastructure team consumes the AWS CDK construct published by the application team. They own the AWS CDK Stack which composes the whole application. Possibly this will only be one of several Stacks owned by the Infrastructure team. Other Stacks might create shared infrastructure (like VPCs, networking) and other applications.

Within the stack for our application the infrastructure team consumes and instantiates the application team’s construct, passes any dependencies into it and then deploys the stack by whatever means they see fit (e.g. through AWS CodePipeline, GitHub Actions or any other form of continuous delivery/deployment).

The dependency on the application team’s construct is manifested in the package.json of the infrastructure team’s CDK app:

{
  "name": "order-processing-infra-app",
  ...
  "dependencies": {
    ...
    "order-app-construct" : "1.1.0",
    ...
  }
  ...
}

Within the created CDK Stack we see the dependency version for the application package as well as how the infrastructure team passes in additional information (like e.g. the queue to use):

export class OrderProcessingInfraStack extends cdk.Stack {
  constructor(scope: Construct, id: string, props?: cdk.StackProps) {
    super(scope, id, props);   

    const orderProcessingQueue = new Queue(this, 'order-processing-queue');

    new OrderProcessingAppConstruct(this, 'order-processing-app', {
       appPackageVersion: "2.0.36",
       queue: orderProcessingQueue,
       codeArtifactDetails: { ... }
     });
  }
}

Propagating New Releases

We now have the responsibilities of each team sorted out along with the artifacts owned by each team. But how do we propagate a change done by the application team all the way to production? Or asked differently: how can we invoke the infrastructure team’s CI/CD pipeline with the updated artifact versions of the application team?

We will need to update the infrastructure team’s dependencies on the application teams artifacts whenever a new version of either the application package or the AWS CDK construct is published. With the dependencies updated we can then start the release pipeline.

One approach is to listen and react to events published by AWS CodeArtifact via Amazon EventBridge. On each release AWS CodeArtifact will publish an event to Amazon EventBridge. We can listen to that event, extract the version number of the new release from its payload and start a workflow to update either our dependency on the CDK construct (e.g. in the package.json of our CDK application) or a update the appPackageVersion which the infrastructure team passes into the consumed construct.

Here’s how a release of a new app version flows through the system:

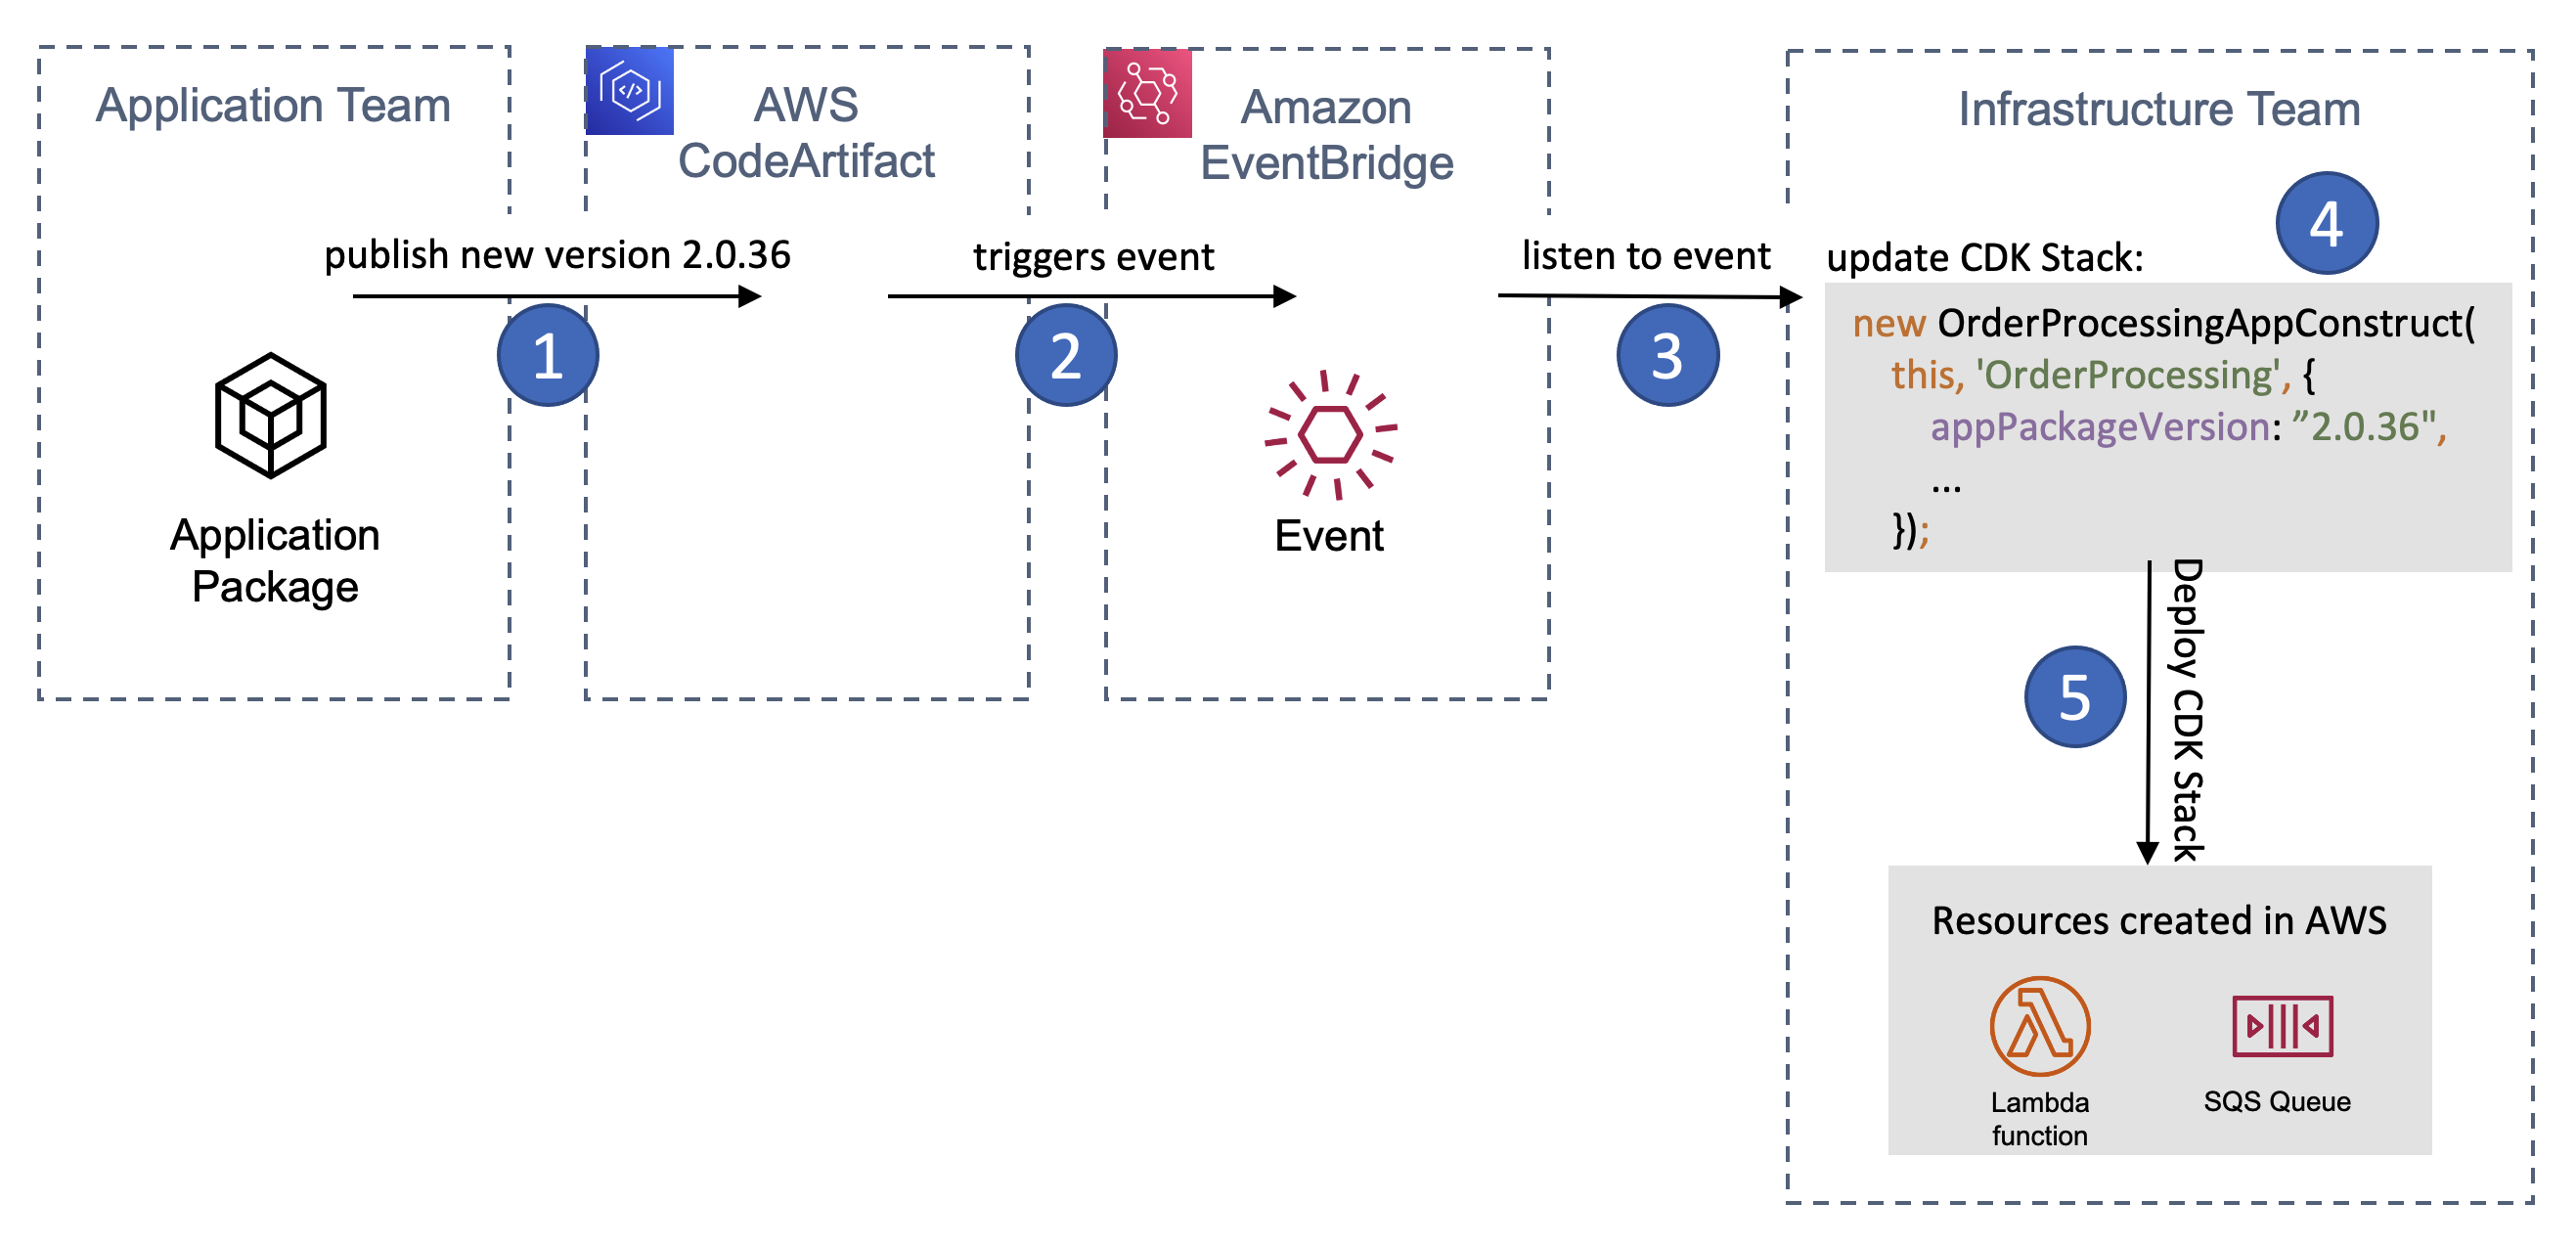
A release of the application package triggers a change and deployment of the infrastructure team's CDK Stack

Figure 1 – A release of the application package triggers a change and deployment of the infrastructure team’s CDK Stack

  1. The application team publishes a new app version into AWS CodeArtifact
  2. CodeArtifact triggers an event on Amazon EventBridge
  3. The infrastructure team listens to this event
  4. The infrastructure team updates its CDK stack to include the latest appPackageVersion
  5. The infrastructure team’s CDK Stack gets deployed

And very similar the release of a new version of the CDK Construct:

A release of the application team's CDK construct triggers a change and deployment of the infrastructure team's CDK Stack

Figure 2 – A release of the application team’s CDK construct triggers a change and deployment of the infrastructure team’s CDK Stack

  1. The application team publishes a new CDK construct version into AWS CodeArtifact
  2. CodeArtifact triggers an event on Amazon EventBridge
  3. The infrastructure team listens to this event
  4. The infrastructure team updates its dependency to the latest CDK construct
  5. The infrastructure team’s CDK Stack gets deployed

We will not go into the details on how such a workflow could look like, because it’s most likely highly custom for each team (think of different tools used for code repositories, CI/CD). However, here are some ideas on how it can be accomplished:

Updating the CDK Construct dependency

To update the dependency version of the CDK construct the infrastructure team’s package.json (or other files used for dependency tracking like pom.xml) needs to be updated. You can build automation to checkout the source code and issue a command like npm install sample-app-construct@NEW_VERSION (where NEW_VERSION is the value read from the EventBridge event payload). You then automatically create a pull request to incorporate this change into your main branch. For a sample on what this looks like see the blog post Keeping up with your dependencies: building a feedback loop for shared librares.

Updating the appPackageVersion

To update the appPackageVersion used inside of the infrastructure team’s CDK Stack you can either follow the same approach outlined above, or you can use CDK’s capability to read from an AWS Systems Manager (SSM) Parameter Store parameter. With that you wouldn’t put the value for appPackageVersion into source control, but rather read it from SSM Parameter Store. There is a how-to for this in the AWS CDK documentation: Get a value from the Systems Manager Parameter Store. You then start the infrastructure team’s pipeline based on the event of a change in the parameter.

To have a clear understanding of what is deployed at any given time and in order to see the used parameter value in CloudFormation I’d recommend using the option described at Reading Systems Manager values at synthesis time.

Conclusion

You’ve seen how the AWS Cloud Development Kit and its Construct concept can help to ensure team independence and agility even though multiple teams (in our case an application development team and an infrastructure team) work together to bring a new version of an application into production. To do so you have put the application team in charge of not only their application code, but also of the parts of the infrastructure they use to run their application on. This is still in line with the discussed split-team approach as all shared infrastructure as well as the final deployment is in control of the infrastructure team and is only consumed by the application team’s construct.

About the Authors

Picture of the author Joerg Woehrle As a Solutions Architect Jörg works with manufacturing customers in Germany. Before he joined AWS in 2019 he held various roles like Developer, DevOps Engineer and SRE. With that Jörg enjoys building and automating things and fell in love with the AWS Cloud Development Kit.
Picture of the author Mohamed Othman Mo joined AWS in 2020 as a Technical Account Manager, bringing with him 7 years of hands-on AWS DevOps experience and 6 year as System operation admin. He is a member of two Technical Field Communities in AWS (Cloud Operation and Builder Experience), focusing on supporting customers with CI/CD pipelines and AI for DevOps to ensure they have the right solutions that fit their business needs.

How to use granular geographic match rules with AWS WAF

Post Syndicated from Mohit Mysore original https://aws.amazon.com/blogs/security/how-to-use-granular-geographic-match-rules-with-aws-waf/

In November 2022, AWS introduced support for granular geographic (geo) match conditions in AWS WAF. This blog post demonstrates how you can use this new feature to customize your AWS WAF implementation and improve the security posture of your protected application.

AWS WAF provides inline inspection of inbound traffic at the application layer. You can use AWS WAF to detect and filter common web exploits and bots that could affect application availability or security, or consume excessive resources. Inbound traffic is inspected against web access control list (web ACL) rules. A web ACL rule consists of rule statements that instruct AWS WAF on how to inspect a web request.

The AWS WAF geographic match rule statement functionality allows you to restrict application access based on the location of your viewers. This feature is crucial for use cases like licensing and legal regulations that limit the delivery of your applications outside of specific geographic areas.

AWS recently released a new feature that you can use to build precise geographic rules based on International Organization for Standardization (ISO) 3166 country and area codes. With this release, you can now manage access at the ISO 3166 region level. This capability is available across AWS Regions where AWS WAF is offered and for all AWS WAF supported services. In this post, you will learn how to use this new feature with Amazon CloudFront and Elastic Load Balancing (ELB) origin types.

Summary of concepts

Before we discuss use cases and setup instructions, make sure that you are familiar with the following AWS services and concepts:

  • Amazon CloudFront: CloudFront is a web service that gives businesses and web application developers a cost-effective way to distribute content with low latency and high data transfer speeds.
  • Amazon Simple Storage Service (Amazon S3): Amazon S3 is an object storage service built to store and retrieve large amounts of data from anywhere.
  • Application Load Balancer: Application Load Balancer operates at the request level (layer 7), routing traffic to targets—Amazon Elastic Compute Cloud (Amazon EC2) instances, IP addresses, and Lambda functions—based on the content of the request.
  • AWS WAF labels: Labels contain metadata that can be added to web requests when a rule is matched. Labels can alter the behavior or default action of managed rules.
  • ISO (International Organization for Standardization) 3166 codes: ISO codes are internationally recognized codes that designate for every country and most of the dependent areas a two- or three-letter combination. Each code consists of two parts, separated by a hyphen. For example, in the code AU-QLD, AU is the ISO 3166 alpha-2 code for Australia, and QLD is the subdivision code of the state or territory—in this case, Queensland.

How granular geo labels work

Previously, geo match statements in AWS WAF were used to allow or block access to applications based on country of origin of web requests. With updated geographic match rule statements, you can control access at the region level.

In a web ACL rule with a geo match statement, AWS WAF determines the country and region of a request based on its IP address. After inspection, AWS WAF adds labels to each request to indicate the ISO 3166 country and region codes. You can use labels generated in the geo match statement to create a label match rule statement to control access.

AWS WAF generates two types of labels based on origin IP or a forwarded IP configuration that is defined in the AWS WAF geo match rule. These labels are the country and region labels.

By default, AWS WAF uses the IP address of the web request’s origin. You can instruct AWS WAF to use an IP address from an alternate request header, like X-Forwarded-For, by enabling forwarded IP configuration in the rule statement settings. For example, the country label for the United States with origin IP and forwarded IP configuration are awswaf:clientip:geo:country:US and awswaf:forwardedip:geo:country:US, respectively. Similarly, the region labels for a request originating in Oregon (US) with origin and forwarded IP configuration are awswaf:clientip:geo:region:US-OR and awswaf:forwardedip:geo:region:US-OR, respectively.

To demonstrate this AWS WAF feature, we will outline two distinct use cases.

Use case 1: Restrict content for copyright compliance using AWS WAF and CloudFront

Licensing agreements might prevent you from distributing content in some geographical locations, regions, states, or entire countries. You can deploy the following setup to geo-block content in specific regions to help meet these requirements.

In this example, we will use an AWS WAF web ACL that is applied to a CloudFront distribution with an S3 bucket origin. The web ACL contains a geo match rule to tag requests from Australia with labels, followed by a label match rule to block requests from the Queensland region. All other requests with source IP originating from Australia are allowed.

To configure the AWS WAF web ACL rule for granular geo restriction

  1. Follow the steps to create an Amazon S3 bucket and CloudFront distribution with the S3 bucket as origin.
  2. After the CloudFront distribution is created, open the AWS WAF console.
  3. In the navigation pane, choose Web ACLs, select Global (CloudFront) from the dropdown list, and then choose Create web ACL.
  4. For Name, enter a name to identify this web ACL.
  5. For Resource type, choose the CloudFront distribution that you created in step 1, and then choose Add.
  6. Choose Next.
  7. Choose Add rules, and then choose Add my own rules and rule groups.
  8. For Name, enter a name to identify this rule.
  9. For Rule type, choose Regular rule.
  10. Configure a rule statement for a request that matches the statement Originates from a Country and select the Australia (AU) country code from the dropdown list.
  11. Set the IP inspection configuration parameter to Source IP address.
  12. Under Action, choose Count, and then choose Add Rule.
  13. Create a new rule by following the same actions as in step 7 and enter a name to identify the rule.
  14. For Rule type, choose Regular rule.
  15. Configure a rule statement for a request that matches the statement Has a Label and enter awswaf:clientip:geo:region:AU-QLD for the match key.
  16. Set the action to Block and choose Add rule.
  17. For Actions, keep the default action of Allow.
  18. For Amazon CloudWatch metrics, select the AWS WAF rules that you created in steps 8 and 14.
  19. For Request sampling options, choose Enable sampled requests, and then choose Next.
  20. Review and create the web ACL rule.

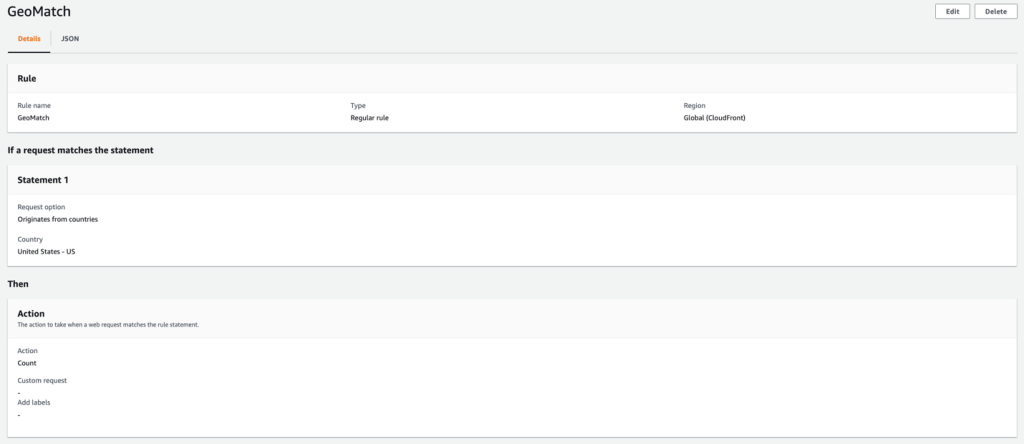
After the web ACL is created, you should see the web ACL configuration, as shown in the following figures. Figure 1 shows the geo match rule configuration.

Figure 1: Web ACL rule configuration

Figure 1: Web ACL rule configuration

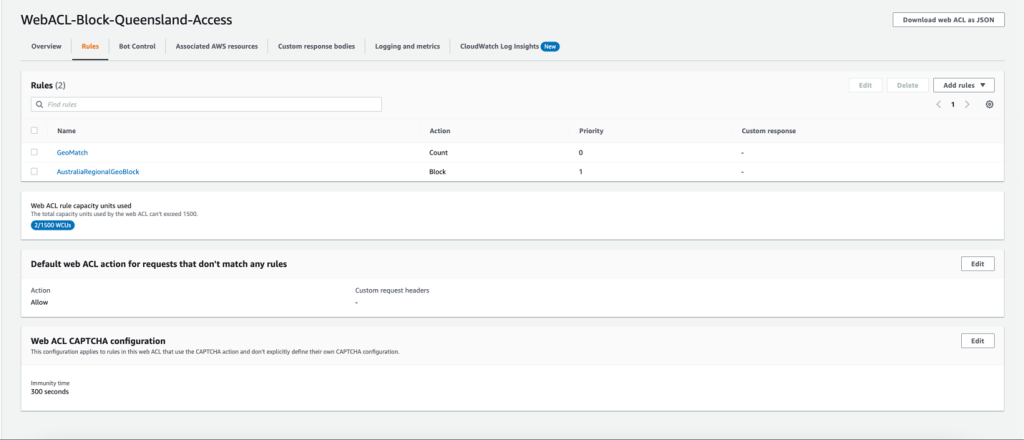
Figure 2 shows the Queensland regional geo restriction.

Figure 2: Queensland regional geo restriction - web ACL configuration<

Figure 2: Queensland regional geo restriction – web ACL configuration<

The setup is now complete—you have a web ACL with two regular rules. The first rule matches requests that originate from Australia and adds geographic labels automatically. The label match rule statement inspects requests with Queensland granular geo labels and blocks them. To understand where requests are originating from, you can configure logging on the AWS WAF web ACL.

You can test this setup by making requests from Queensland, Australia, to the DNS name of the CloudFront distribution to invoke a block. CloudFront will return a 403 error, similar to the following example.

$ curl -IL https://abcdd123456789.cloudfront.net
HTTP/2 403 
server: CloudFront
date: Tue, 21 Feb 2023 22:06:25 GMT
content-type: text/html
content-length: 919
x-cache: Error from cloudfront
via: 1.1 abcdd123456789.cloudfront.net (CloudFront)
x-amz-cf-pop: SYD1-C1

As shown in these test results, requests originating from Queensland, Australia, are blocked.

Use case 2: Allow incoming traffic from specific regions with AWS WAF and Application Load Balancer

We recently had a customer ask us how to allow traffic from only one region, and deny the traffic from other regions within a country. You might have similar requirements, and the following section will explain how to achieve that. In the example, we will show you how to allow only visitors from Washington state, while disabling traffic from the rest of the US.

This example uses an AWS WAF web ACL applied to an application load balancer in the US East (N. Virginia) Region with an Amazon EC2 instance as the target. The web ACL contains a geo match rule to tag requests from the US with labels. After we enable forwarded IP configuration, we will inspect the X-Forwarded-For header to determine the origin IP of web requests. Next, we will add a label match rule to allow requests from the Washington region. All other requests from the United States are blocked.

To configure the AWS WAF web ACL rule for granular geo restriction

  1. Follow the steps to create an internet-facing application load balancer in the US East (N. Virginia) Region.
  2. After the application load balancer is created, open the AWS WAF console.
  3. In the navigation pane, choose Web ACLs, and then choose Create web ACL in the US east (N. Virginia) Region.
  4. For Name, enter a name to identify this web ACL.
  5. For Resource type, choose the application load balancer that you created in step 1 of this section, and then choose Add.
  6. Choose Next.
  7. Choose Add rules, and then choose Add my own rules and rule groups.
  8. For Name, enter a name to identify this rule.
  9. For Rule type, choose Regular rule.
  10. Configure a rule statement for a request that matches the statement Originates from a Country in, and then select the United States (US) country code from the dropdown list.
  11. Set the IP inspection configuration parameter to IP address in Header.
  12. Enter the Header field name as X-Forwarded-For.
  13. For Match, choose Fallback for missing IP address. Web requests without a valid IP address in the header will be treated as a match and will be allowed.
  14. Under Action, choose Count, and then choose Add Rule.
  15. Create a new rule by following the same actions as in step 7 of this section, and enter a name to identify the rule.
  16. For Rule type, choose Regular rule.
  17. Configure a rule statement for a request that matches the statement Has a Label, and for the match key, enter awswaf:forwardedip:geo:region:US-WA.
  18. Set the action to Allow and add choose Add Rule.
  19. For Default web ACL action for requests that don’t match any rules, set the Action to Block.
  20. For Amazon CloudWatch metrics, select the AWS WAF rules that you created in steps 8 and 14 of this section.
  21. For Request sampling options, choose Enable sampled requests, and then choose Next.
  22. Review and create the web ACL rule.

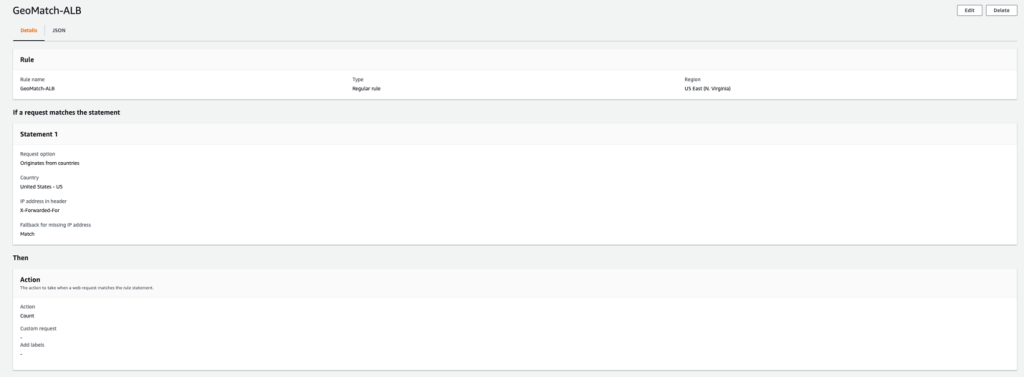
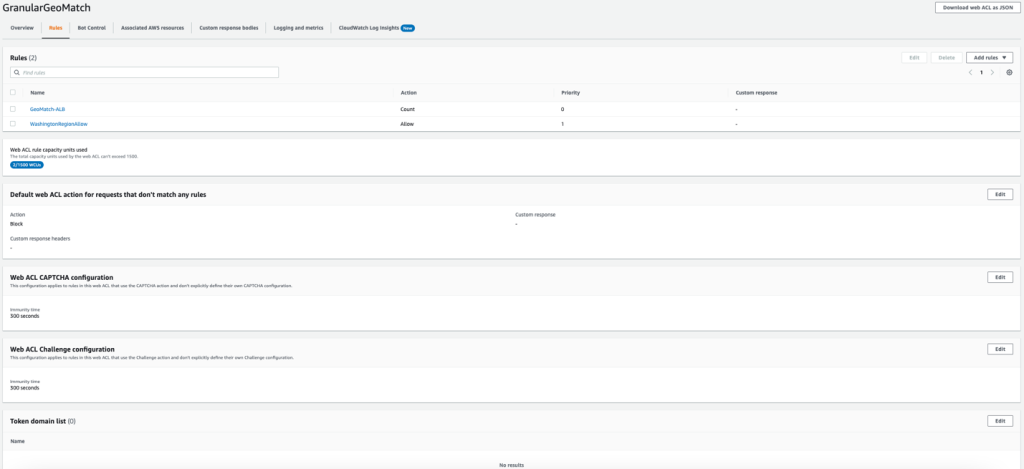
After the web ACL is created, you should see the web ACL configuration, as shown in the following figures. Figure 3 shows the geo match rule

Figure 3: Geo match rule

Figure 3: Geo match rule

Figure 4 shows the Washington regional geo restriction.

Figure 4: Washington regional geo restriction - web ACL configuration

Figure 4: Washington regional geo restriction – web ACL configuration

The following is a JSON representation of the rule:

{
  "Name": "WashingtonRegionAllow",
  "Priority": 1,
  "Statement": {
    "LabelMatchStatement": {
      "Scope": "LABEL",
      "Key": "awswaf:forwardedip:geo:region:US-WA"
    }
  },
  "Action": {
    "Allow": {}
  },
  "VisibilityConfig": {
    "SampledRequestsEnabled": true,
    "CloudWatchMetricsEnabled": true,
    "MetricName": "USRegionalRestriction"
  }
}

The setup is now complete—you have a web ACL with two regular rules. The first rule matches requests that originate from the US after inspecting the origin IP in the X-Forwarded-For header, and adds geographic labels. The label match rule statement inspects requests with the Washington region granular geo labels and allows these requests.

If a user makes a web request from outside of the Washington region, the request will be blocked and a HTTP 403 error response will be returned, similar to the following.

curl -IL https://GeoBlock-1234567890.us-east-1.elb.amazonaws.com
HTTP/1.1 403 Forbidden
Server: awselb/2.0
Date: Tue, 21 Feb 2023 22:07:54 GMT
Content-Type: text/html
Content-Length: 118
Connection: keep-alive

Conclusion

AWS WAF now supports the ability to restrict traffic based on granular geographic labels. This gives you further control based on geographic location within a country.

In this post, we demonstrated two different use cases that show how this feature can be applied with CloudFront distributions and application load balancers. Note that, apart from CloudFront and application load balancers, this feature is supported by other origin types that are supported by AWS WAF, such as Amazon API Gateway and Amazon Cognito.

If you have feedback about this post, submit comments in the Comments section below. If you have questions about this post, start a new thread on the AWS WAF re:Post or contact AWS Support.

Want more AWS Security news? Follow us on Twitter.

Mohit Mysore

Mohit Mysore

Mohit is a Technical Account Manager with over 5 years of experience working with AWS Customers. He is passionate about network and system administration. Outside work, He likes to travel, watch soccer and F1 and spend time with his family.

Maintaining Code Quality with Amazon CodeCatalyst Reports

Post Syndicated from Imtranur Rahman original https://aws.amazon.com/blogs/devops/maintaining-code-quality-with-amazon-codecatalyst-reports/

Amazon CodeCatalyst reports contain details about tests that occur during a workflow run. You can create tests such as unit tests, integration tests, configuration tests, and functional tests. You can use a test report to help troubleshoot a problem during a workflow.

Introduction

In prior posts in this series, I discussed reading The Unicorn Project, by Gene Kim, and how the main character, Maxine, struggles with a complicated Software Development Lifecycle (SDLC) after joining a new team. One of the challenges she encounters is the difficulties in shipping secure, functioning code without an automated testing mechanism. To quote Gene Kim, “Without automated testing, the more code we write, the more money it takes for us to test.”

Software Developers know that shipping vulnerable or non-functioning code to a production environment is to be avoided at all costs; the monetary impact is high and the toll it takes on team morale can be even greater. During the SDLC, developers need a way to easily identify and troubleshoot errors in their code.

In this post, I will focus on how developers can seamlessly run tests as a part of workflow actions as well as configure unit test and code coverage reports with Amazon CodeCatalyst. I will also outline how developers can access these reports to gain insights into their code quality.

Prerequisites

If you would like to follow along with this walkthrough, you will need to:

Walkthrough

As with the previous posts in the CodeCatalyst series, I am going to use the Modern Three-tier Web Application blueprint. Blueprints provide sample code and CI/CD workflows to help you get started easily across different combinations of programming languages and architectures. To follow along, you can re-use a project you created previously, or you can refer to a previous post that walks through creating a project using the Three-tier blueprint.

Once the project is deployed, CodeCatalyst opens the project overview. This view shows the content of the README file from the project’s source repository, workflow runs, pull requests, etc. The source repository and workflow are created for me by the project blueprint. To view the source code, I select Code → Source Repositories from the left-hand navigation bar. Then, I select the repository name link from the list of source repositories.

Figure 1. List of source repositories including Mythical Mysfits source code.

Figure 1. List of source repositories including Mythical Mysfits source code.

From here I can view details such as the number of branches, workflows, commits, pull requests and source code of this repo. In this walkthrough, I’m focused on the testing capabilities of CodeCatalyst. The project already includes unit tests that were created by the blueprint so I will start there.

From the Files list, navigate to web → src → components→ __tests__ → TheGrid.spec.js. This file contains the front-end unit tests which simply check if the strings “Good”, “Neutral”, “Evil” and “Lawful”, “Neutral”, “Chaotic” have rendered on the web page. Take a moment to examine the code. I will use these tests throughout the walkthrough.

Figure 2. Unit test for the front-end that test strings have been rendered properly.

Figure 2. Unit test for the front-end that test strings have been rendered properly. 

Next, I navigate to the  workflow that executes the unit tests. From the left-hand navigation bar, select CI/CD → Workflows. Then, find ApplicationDeploymentPipeline, expand Recent runs and select  Run-xxxxx . The Visual tab shows a graphical representation of the underlying YAML file that makes up this workflow. It also provides details on what started the workflow run, when it started,  how long it took to complete, the source repository and whether it succeeded.

Figure 3. The Deployment workflow open in the visual designer.

Figure 3. The Deployment workflow open in the visual designer.

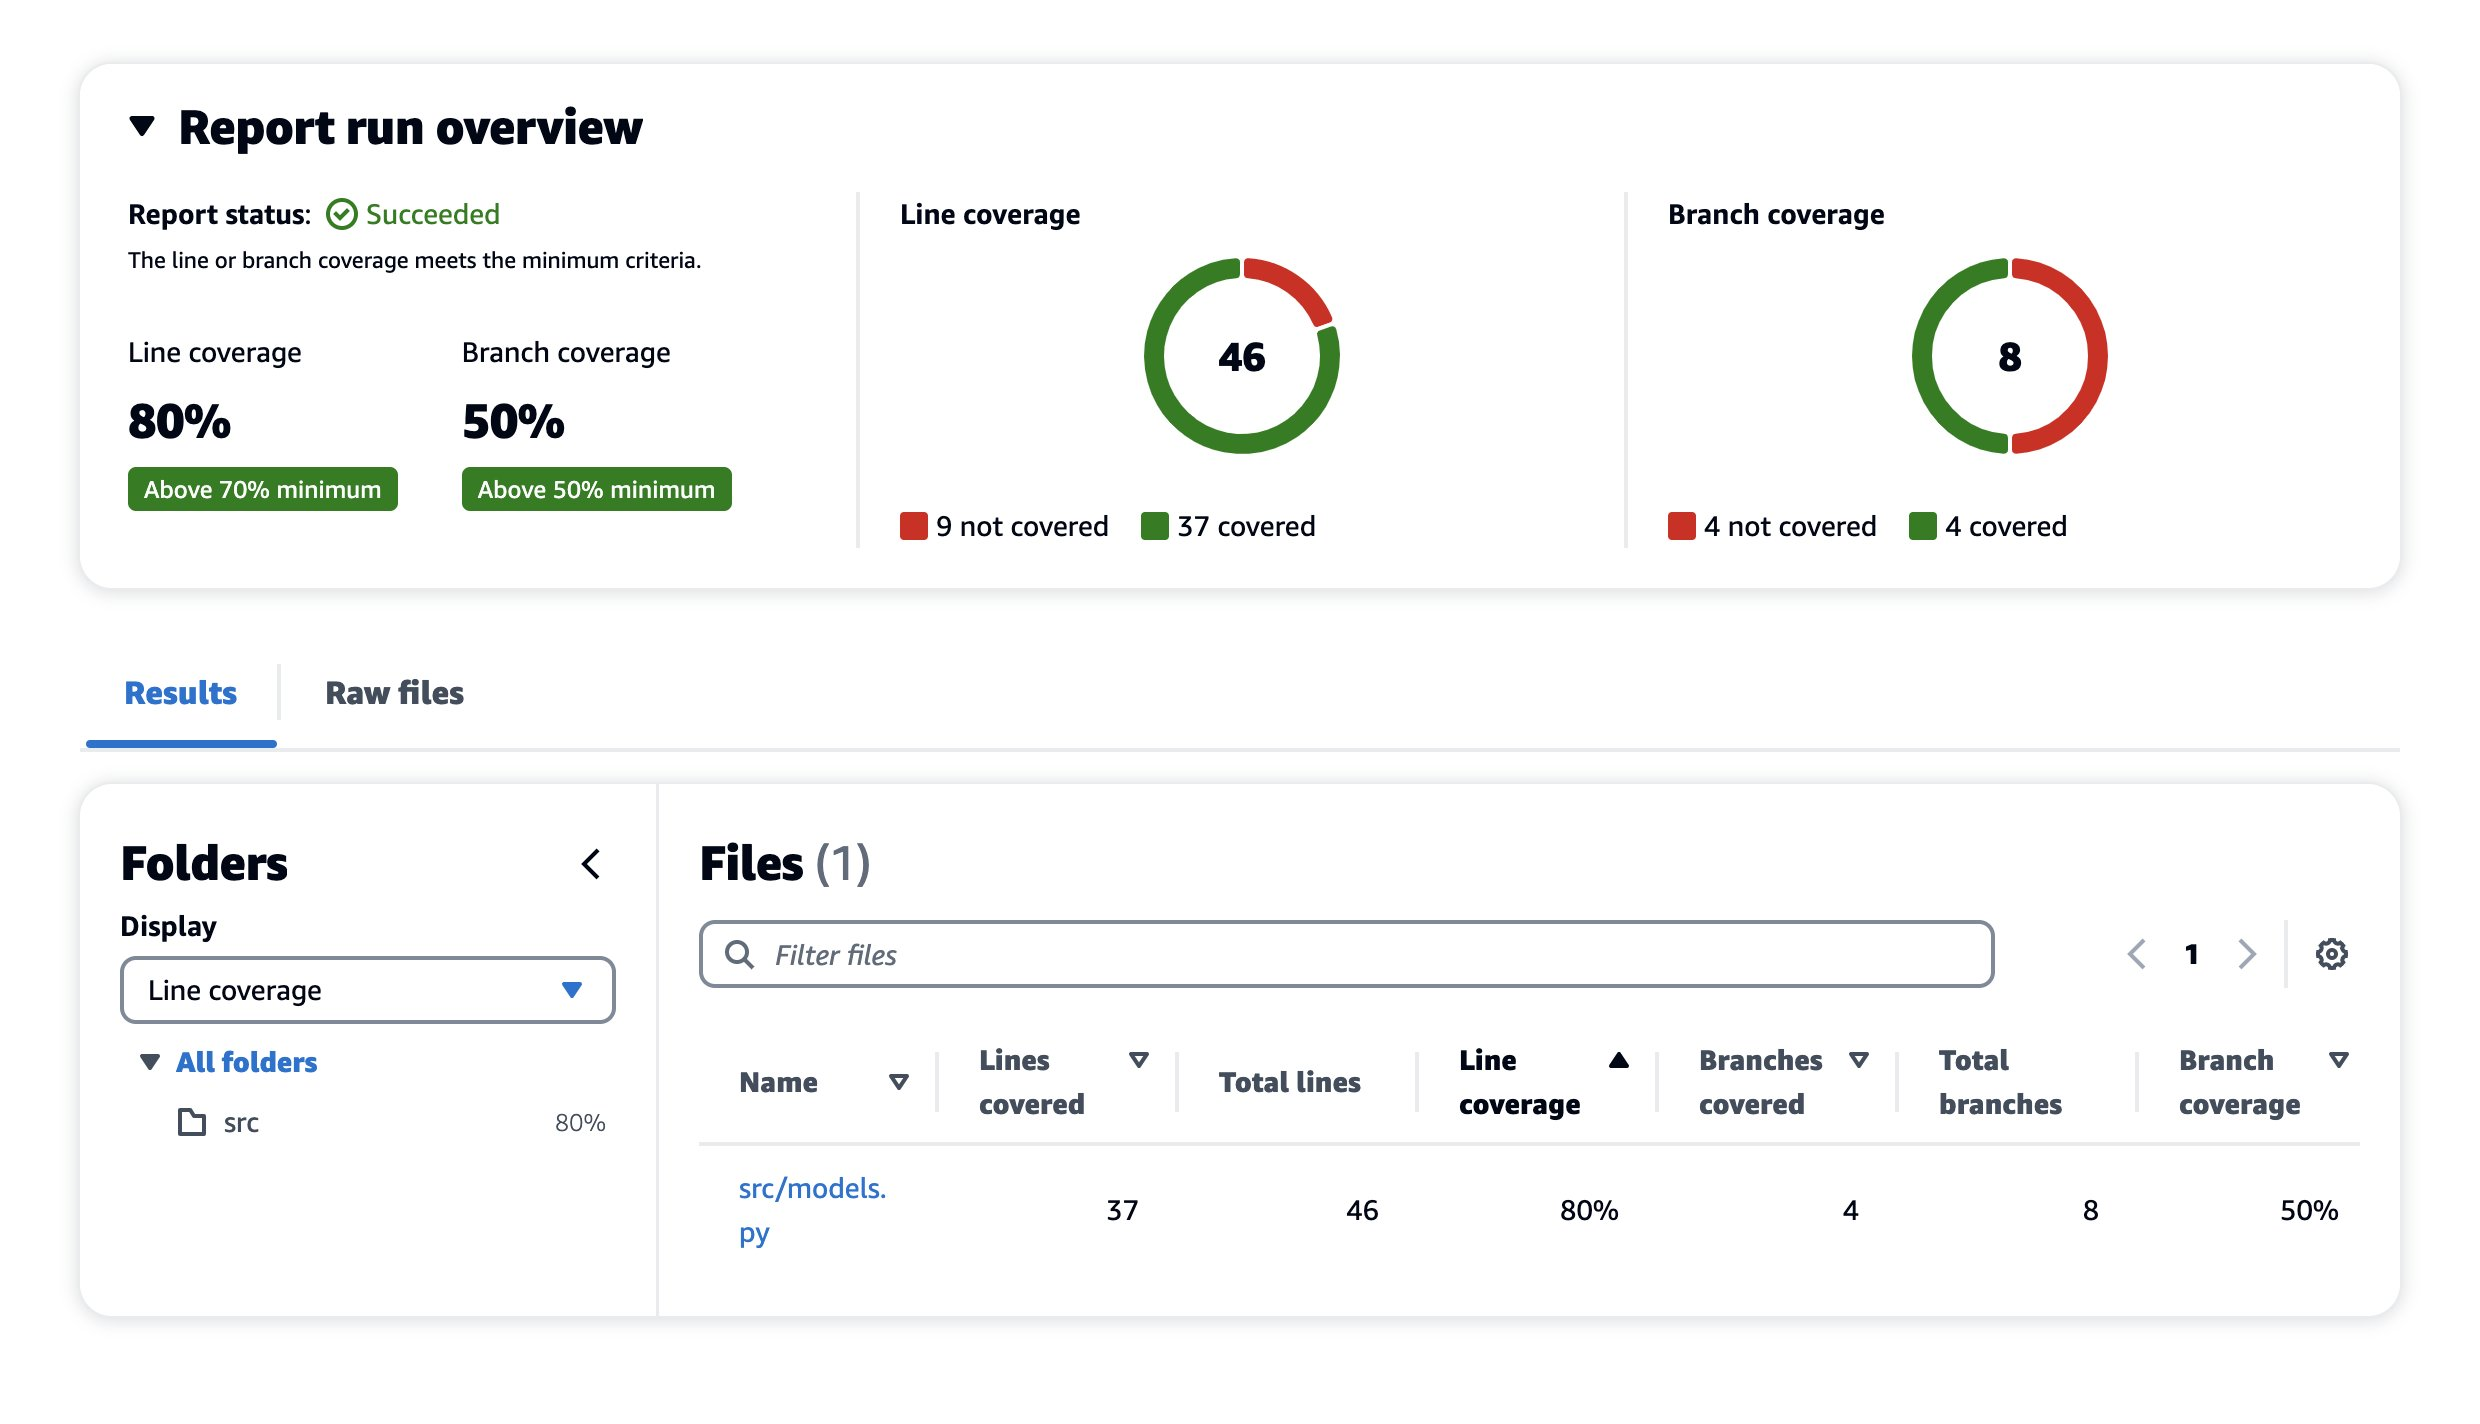
Workflows are comprised of a source and one or more actions. I examined test reports for the back-end in a prior post. Therefore, I will focus on the front-end tests here. Select the build_and_test_frontend action to view logs on what the action ran, its configuration details, and the reports it generated. I’m specifically interested in the Unit Test and Code Coverage reports under the Reports tab:

Figure 4. Reports tab showing line and branch coverage.

Figure 4. Reports tab showing line and branch coverage.

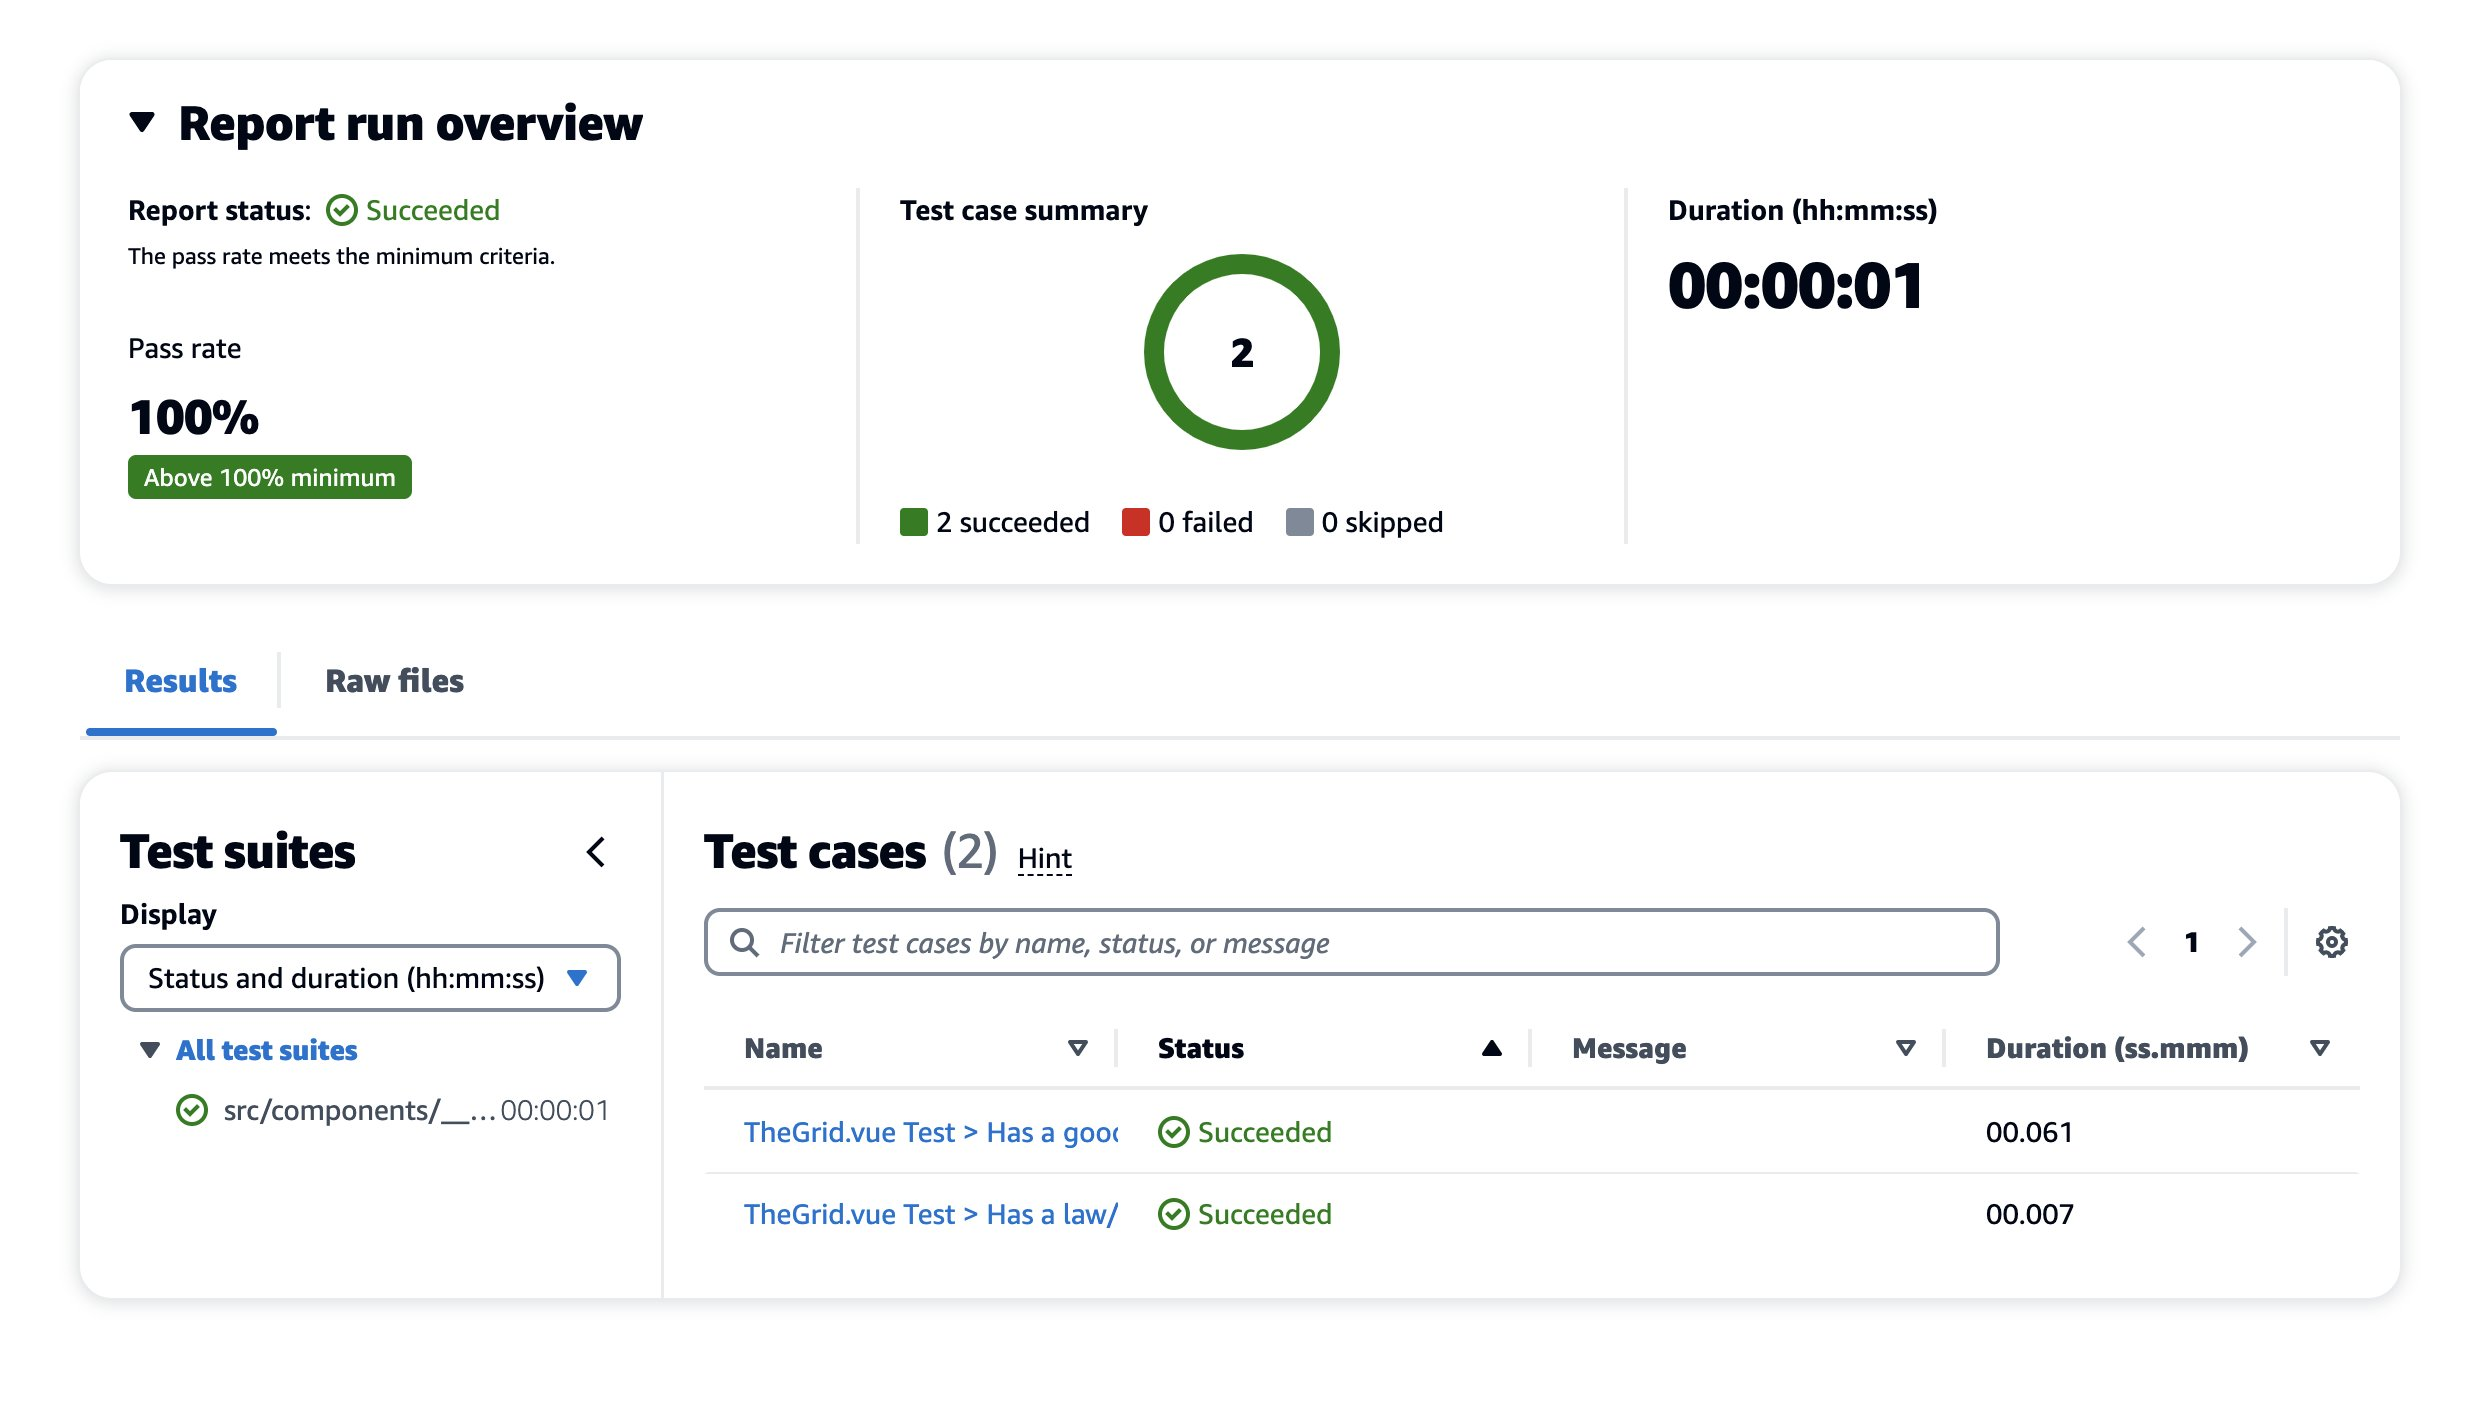
Select the report unitTests.xml (you may need to scroll). Here, you can see an overview of this specific report with metrics like pass rate, duration, test suites, and the test cases for those suites:

Figure 5. Detailed report for the front-end tests

Figure 5. Detailed report for the front-end tests.

This report has passed all checks.  To make this report more interesting, I’ll intentionally edit the unit test to make it fail. First, navigate back to the source repository and open web → src → components→ __tests__→TheGrid.spec.js. This test case is looking for the string “Good” so change it to say “Best” instead and commit the changes.

Figure 6. Front-End Unit Test Code Change.

Figure 6. Front-End Unit Test Code Change.

This will automatically start a new workflow run. Navigating back to CI/CD →  Workflows, you can see a new workflow run is in progress (takes ~7 minutes to complete).

Once complete, you can see that the build_and_test_frontend action failed. Opening the unitTests.xml report again, you can see that the report status is in a Failed state. Notice that the minimum pass rate for this test is 100%, meaning that if any test case in this unit test ever fails, the build fails completely.

There are ways to configure these minimums which will be explored when looking at Code Coverage reports. To see more details on the error message in this report, select the failed test case.

Figure 7. Failed Test Case Error Message.

Figure 7. Failed Test Case Error Message.

As expected, this indicates that the test was looking for the string “Good” but instead, it found the string “Best”. Before continuing, I return to the TheGrid.spec.js file and change the string back to “Good”.

CodeCatalyst also allows me to specify code and branch coverage criteria. Coverage is a metric that can help you understand how much of your source was tested. This ensures source code is properly tested before shipping to a production environment. Coverage is not configured for the front-end, so I will examine the coverage of the back-end.

I select Reports on the left-hand navigation bar, and open the report called backend-coverage.xml. You can see details such as line coverage, number of lines covered, specific files that were scanned, etc.

Figure 8. Code Coverage Report Succeeded.

Figure 8. Code Coverage Report Succeeded.

The Line coverage minimum is set to 70% but the current coverage is 80%, so it succeeds. I want to push the team to continue improving, so I will edit the workflow to raise the minimum threshold to 90%. Navigating back to CI/CD → Workflows → ApplicationDeploymentPipeline, select the Edit button. On the Visual tab, select build_backend. On the Outputs tab, scroll down to Success Criteria and change Line Coverage to 90%.

Figure 9. Configuring Code Coverage Success Criteria.

Figure 9. Configuring Code Coverage Success Criteria.

On the top-right, select Commit. This will push the changes to the repository and start a new workflow run. Once the run has finished, navigate back to the Code Coverage report. This time, you can see it reporting a failure to meet the minimum threshold for Line coverage.

Figure 10. Code Coverage Report Failed.

There are other success criteria options available to experiment with. To learn more about success criteria, see Configuring success criteria for tests.

Cleanup

If you have been following along with this workflow, you should delete the resources you deployed so you do not continue to incur charges. First, delete the two stacks that CDK deployed using the AWS CloudFormation console in the AWS account you associated when you launched the blueprint. These stacks will have names like mysfitsXXXXXWebStack and mysfitsXXXXXAppStack. Second, delete the project from CodeCatalyst by navigating to Project settings and choosing Delete project.

Summary

In this post, I demonstrated how Amazon CodeCatalyst can help developers quickly configure test cases, run unit/code coverage tests, and generate reports using CodeCatalyst’s workflow actions. You can use these reports to adhere to your code testing strategy as a software development team. I also outlined how you can use success criteria to influence the outcome of a build in your workflow.  In the next post, I will demonstrate how to configure CodeCatalyst workflows and integrate Software Composition Analysis (SCA) reports. Stay tuned!

About the authors:

Imtranur Rahman

Imtranur Rahman is an experienced Sr. Solutions Architect in WWPS team with 14+ years of experience. Imtranur works with large AWS Global SI partners and helps them build their cloud strategy and broad adoption of Amazon’s cloud computing platform.Imtranur specializes in Containers, Dev/SecOps, GitOps, microservices based applications, hybrid application solutions, application modernization and loves innovating on behalf of his customers. He is highly customer obsessed and takes pride in providing the best solutions through his extensive expertise.

Wasay Mabood

Wasay is a Partner Solutions Architect based out of New York. He works primarily with AWS Partners on migration, training, and compliance efforts but also dabbles in web development. When he’s not working with customers, he enjoys window-shopping, lounging around at home, and experimenting with new ideas.

How to use AWS Private Certificate Authority short-lived certificate mode

Post Syndicated from Zachary Miller original https://aws.amazon.com/blogs/security/how-to-use-aws-private-certificate-authority-short-lived-certificate-mode/

AWS Private Certificate Authority (AWS Private CA) is a highly available, fully managed private certificate authority (CA) service that you can use to create CA hierarchies and issue private X.509 certificates. You can use these private certificates to establish endpoints for TLS encryption, cryptographically sign code, authenticate users, and more.

Based on customer feedback for prorated certificate pricing options, AWS Private CA now offers short-lived certificate mode, a lower cost mode of AWS Private CA that is designed to issue short-lived certificates. In this blog post, we will compare the original general-purpose and new short-lived CA modes and discuss use cases for each of them.

The general-purpose mode of AWS Private CA supports certificates of any validity period. The addition of short-lived CA mode is intended to facilitate use cases where you want certificates with a short validity period, defined as 7 days or less. Keep in mind this doesn’t mean that the root CA certificate must also be short lived. Although a typical root CA certificate is valid for 10 years, you can customize the certificate validity period for CAs in either mode when you install the CA certificate.

You select the CA mode when you create a certificate authority. The CA mode cannot be changed for an existing CA. Both modes (general-purpose and short-lived) have distinct pricing for the different use cases that they support.

The short-lived CA mode offers an accessible pricing model for customers who need to issue certificates with a short-term validity period. You can use these short-lived certificates for on-demand AWS workloads and align the validity of the certificate with the lifetime of the certificate holder. For example, if you’re using certificate-based authentication for a virtual workstation that is rebuilt each day, you can configure your certificates to expire after 24 hours.

In this blog post, we will compare the two CA modes, examine their pricing models, and discuss several potential use cases for short-lived certificates. We will also provide a walkthrough that shows you how to create a short-lived mode CA by using the AWS Command Line Interface (AWS CLI). To create a short-lived mode CA using the AWS Management Console, see Procedure for creating a CA (console).

Comparing general-purpose mode CAs to short-lived mode CAs

You might be wondering, “How is the short-lived CA mode different from the general-purpose CA mode? I can already create certificates with a short validity period by using AWS Private CA.” The key difference between these two CA modes is cost. Short-lived CA mode is priced to better serve use cases where you reissue private certificates frequently, such as for certificate-based authentication (CBA).

With CBA, users can authenticate once and then seamlessly access resources, including Amazon WorkSpaces and Amazon AppStream 2.0, without re-entering their credentials. This use case demonstrates the security value of short-lived certificates. A short validity period for the certificate reduces the impact of a compromised certificate because the certificate can only be used for authentication during a small window before it’s automatically invalidated. This method of authentication is useful for customers who are looking to adopt a Zero Trust security strategy.

Before the release of the short-lived CA mode, using AWS Private CA for CBA could be cost prohibitive for some customers. This is because CBA needs a new certificate for each user at regular intervals, which can require issuing a high volume of certificates. The best practice for CBA is to use short-lived CA mode, which can issue certificates at a lower cost that can be used to authenticate a user and then expire shortly afterward.

Let’s take a closer look at the pricing models for the two CA modes that are available when you use AWS Private CA.

Pricing model comparison

You can issue short-lived certificates from both the general-purpose and short-lived CA modes of AWS Private CA. However, the general-purpose mode CAs incur a monthly charge of $400 per CA. The cost of issuing certificates from a general-purpose mode CA is based on the number of certificates that you issue per month, per AWS Region.

The following table shows the pricing tiers for certificates issued by AWS Private CA by using a general-purpose mode CA.

Number of private certificates created each month (per Region) Price (per certificate)
1–1,000 $0.75 USD
1,001–10,000 $0.35 USD
10,001 and above $0.001 USD

The short-lived mode CA will only incur a monthly charge of $50 per CA. The cost of issuing certificates from a short-lived mode CA is the same regardless of the volume of certificates issued: $0.058 per certificate. This pricing structure is more cost effective than general-purpose mode if you need to frequently issue new, short-lived certificates for a use case like certificate-based authentication. Figure 1 compares costs between modes at different certificate volumes.

Figure 1: Cost comparison of AWS Private CA modes

Figure 1: Cost comparison of AWS Private CA modes

It’s important to note that if you already issue a high volume of certificates each month from AWS Private CA, the short-lived CA mode might not be more cost effective than the general-purpose mode. Consider a customer who has one CA and issues 80,000 certificates per month using the general-purpose CA mode: This will incur a total monthly cost of $4,370. A breakdown of the total cost per month in this scenario is as follows.

1 private CA x 400 USD per month = 400 USD per month for operation of AWS Private CA

Tiered price for 80,000 issued certificates:
1,000 issued certificates x 0.75 USD = 750 USD
9,000 issued certificates x 0.35 USD = 3,150 USD
70,000 issued certificates x 0.001 USD = 70 USD
Total tier cost: 750 USD + 3,150 USD + 70 USD = 3,970 USD per month for certificates issued
400 USD for instances + 3,970 USD for certificate issued = 4,370 USD
Total cost (monthly): 4,370 USD

Now imagine that same customer chose to use a short-lived mode CA to issue the same number of private certificates. Although the cost per month of the short-lived mode CA instance is lower, the price of issuing short-lived certificates would still be greater than the 70,000 certificates issued at a cost of $0.001 with the general-purpose mode CA. The total cost of issuing this many certificates from a single short-lived mode CA is $4,690. A breakdown of the total cost per month in this scenario is as follows.

1 private CA x 50 USD per month = 50 USD per month for operation of AWS Private CA (short-lived CA mode)

Price for 80,000 issued certificates (short-lived CA mode):
80,000 issued certificates x 0.058 USD = 4,640 USD
50 USD for instances + 4,640 USD for certificate issued = 4,690 USD
Total cost (monthly): 4,690 USD

At very high volumes of certificate issuance, the short-lived CA mode is not as cost effective as the general-purpose CA mode. It’s important to consider the volume of certificates that your organization will be issuing when you decide which CA mode to use. Figure 1 shows the cost difference at various volumes of certificate issuance. This difference will vary based on the number of certificates issued, as well as the number of CAs that your organization used.

You should also evaluate the various use cases that your organization has for using private certificates. For example, private certificates that are used to terminate TLS traffic typically have a validity of a year or more, meaning that the short-lived CA mode could not facilitate this use case. The short-lived CA mode can only issue certificates with a validity of 7 days or less.

However, you can create multiple private CAs and select the appropriate certificate authority mode for each CA based on your requirements. We recommend that you evaluate your use cases and estimate your certificate volume when you consider which CA mode to use.

In general, you should use the new short-lived CA mode for use cases where you require certificates with a short validity period (less than 7 days) and you are not planning to issue more than 75,000 certificates per month. You should use the general-purpose CA mode for scenarios where you need to issue certificates with a validity period of more than 7 days, or when you need short-lived certificates but will be issuing very high volumes of certificates each month (for example, over 75,000).

Use cases

The short-lived certificate feature was initially developed for certificate-based authentication with Amazon WorkSpaces and Amazon AppStream 2.0. For a step-by-step guide on how to configure certificate-based authentication for Amazon Workspaces, see How to configure certificate-based authentication for Amazon WorkSpaces. However, there are other ways to get value from the AWS Private CA short-lived CA mode, which we will describe in the following sections.

IAM Roles Anywhere

For customers who use AWS Identity and Access Management (IAM) Roles Anywhere, you might want to reduce the time period for which a certificate can be used to retrieve temporary credentials to assume an IAM role. If you frequently issue X.509 certificates to servers outside of AWS for use with IAM Roles Anywhere, and you want to use short-lived certificates, the pricing model for short-lived CA mode will be more cost effective in most cases (see Figure 1).

Short-lived credentials are useful for administrative personas that have broad permissions to AWS resources. For instance, you might use IAM Roles Anywhere to allow an entity outside AWS to assume an IAM role with the AdministratorAccess AWS managed policy attached. To help manage the risk of this access pattern, we want the certificate to expire relatively quickly, which reduces the time period during which a compromised certificate could potentially be used to authenticate to a highly privileged IAM role.

Furthermore, IAM Roles Anywhere requires that you manually upload a certificate revocation list (CRL), and does not support the CRL and Online Certificate Status Protocol (OCSP) mechanisms that are native to AWS Private CA. Using short-lived certificates is a way to reduce the impact of a potential credential compromise without needing to configure revocation for IAM Roles Anywhere. The need for certificate revocation is greatly reduced if the certificates are only valid for a single day and can’t be used to retrieve temporary credentials to assume an IAM role after the certificate expires.

Mutual TLS between workloads

Consider a highly sensitive workload running on Amazon Elastic Kubernetes Service (Amazon EKS). AWS Private CA supports an open-source plugin for cert-manager, a widely adopted solution for TLS certificate management in Kubernetes, that offers a more secure CA solution for Kubernetes containers. You can use cert-manager and AWS Private CA to issue certificates to identify cluster resources and encrypt data in transit with TLS.

If you use mutual TLS (mTLS) to protect network traffic between Kubernetes pods, you might want to align the validity period of the private certificates with the lifetime of the pods. For example, if you rebuild the worker nodes for your EKS cluster each day, you can issue certificates that expire after 24 hours and configure your application to request a new short-lived certificate before the current certificate expires.

This enables resource identification and mTLS between pods without requiring frequent revocation of certificates that were issued to resources that no longer exist. As stated previously, this method of issuing short-lived certificates is possible with the general-purpose CA mode—but using the new short-lived CA mode makes this use case more cost effective for customers who issue fewer than 75,000 certificates each month.

Create a short-lived mode CA by using the AWS CLI

In this section, we show you how to use the AWS CLI to create a new private certificate authority with the usage mode set to SHORT_LIVED_CERTIFICATE. If you don’t specify a usage mode, AWS Private CA creates a general-purpose mode CA by default. We won’t use a form of revocation, because the short-lived CA mode makes revocation less useful. The certificates expire quickly as part of normal operations. For more examples of how to create CAs with the AWS CLI, see Procedure for creating a CA (CLI). For instructions to create short-lived mode CAs with the AWS console, see Procedure for creating a CA (Console).

This walkthrough has the following prerequisites:

  1. A terminal with the .aws configuration directory set up with a valid default Region, endpoint, and credentials. For information about configuring your AWS CLI environment, see Configuration and credential file settings.
  2. An AWS Identity and Access Management (IAM) user or role that has permissions to create a certificate authority by using AWS Private CA.
  3. A certificate authority configuration file to supply when you create the CA. This file provides the subject details for the CA certificate, as well as the key and signing algorithm configuration.

    Note: We provide an example CA configuration file, but you will need to modify this example to meet your requirements.

To use the create-certificate-authority command with the AWS CLI

  1. We will use the following ca_config.txt file to create the certificate authority. You will need to modify this example to meet your requirements.
    {
       "KeyAlgorithm":"RSA_2048",
       "SigningAlgorithm":"SHA256WITHRSA",
       "Subject":{
          "Country":"US",
          "Organization":"Example Corp",
          "OrganizationalUnit":"Sales",
          "State":"WA",
          "Locality":"Seattle",
          "CommonName":"Example Root CA G1"
       }
    }

  2. Enter the following command to create a short-lived mode root CA by using the parameters supplied in the ca_config.txt file.

    Note: Make sure that ca_config.txt is located in your current directory, or specify the full path to the file.

    aws acm-pca create-certificate-authority \
    --certificate-authority-configuration file://ca_config.txt \
    --certificate-authority-type "ROOT" \
    --usage-mode SHORT_LIVED_CERTIFICATE \
    --tags Key=usageMode,Value=SHORT_LIVED_CERTIFICATE

  3. Use the describe-certificate-authority command to view the status of your new root CA. The status will show Pending_Certificate, until you install a self-signed root CA certificate. You will need to replace the certificate authority Amazon Resource Name (ARN) in the following command with your own CA ARN.

    sh-4.2$ aws acm-pca describe-certificate-authority --certificate-authority-arn arn:aws:acm-pca:region:account:certificate-authority/CA_ID

    The output of this command is as follows:

    {
        "CertificateAuthority": {
            "Arn": "arn:aws:acm-pca:region:account:certificate-authority/CA_ID",
            "OwnerAccount": "account",
            "CreatedAt": "2022-11-02T23:12:46.916000+00:00",
            "LastStateChangeAt": "2022-11-02T23:12:47.779000+00:00",
            "Type": "ROOT",
            "Status": "PENDING_CERTIFICATE",
            "CertificateAuthorityConfiguration": {
                "KeyAlgorithm": "RSA_2048",
                "SigningAlgorithm": "SHA256WITHRSA",
                "Subject": {
                    "Country": "US",
                    "Organization": "Example Corp",
                    "OrganizationalUnit": "Sales",
                    "State": "WA",
                    "CommonName": "Example Root CA G1",
                    "Locality": "Seattle"
                }
            },
            "RevocationConfiguration": {
                "CrlConfiguration": {
                    "Enabled": false
                },
                "OcspConfiguration": {
                    "Enabled": false
                }
            },
            "KeyStorageSecurityStandard": "FIPS_140_2_LEVEL_3_OR_HIGHER",
            "UsageMode": "SHORT_LIVED_CERTIFICATE"
        }
    }

  4. Generate a certificate signing request for your root CA certificate by running the following command. Make sure to replace the certificate authority ARN in the command with your own CA ARN.

    aws acm-pca get-certificate-authority-csr \
    --certificate-authority-arn arn:aws:acm-pca:region:account:certificate-authority/CA_ID \
    --output text > ca.csr

  5. Using the ca.csr file from the previous step as the argument for the --csr parameter, issue the root certificate with the following command. Make sure to replace the certificate authority ARN in the command with your own CA ARN.

    aws acm-pca issue-certificate \
    --certificate-authority-arn arn:aws:acm-pca:region:account:certificate-authority/CA_ID \
    --csr fileb://ca.csr \
    --signing-algorithm SHA256WITHRSA \
    --template-arn arn:aws:acm-pca:::template/RootCACertificate/V1 \
    --validity Value=10,Type=YEARS

  6. The response will include the CertificateArn for the issued root CA certificate. Next, use your CA ARN and the certificate ARN provided in the response to retrieve the certificate by using the get-certificate CLI command, as follows.

    aws acm-pca get-certificate \
    --certificate-authority-arn arn:aws:acm-pca:region:account:certificate-authority/CA_ID \
    --certificate-arn arn:aws:acm-pca:region:account:certificate-authority/CA_ID/certificate/CERTIFICATE_ID \
    --output text > cert.pem

  7. Notice that we created a new file, cert.pem, that contains the certificate we retrieved in the previous command. We will import this certificate to our short-lived mode root CA by running the following command. Make sure to replace the certificate authority ARN in the command with your own CA ARN.

    aws acm-pca import-certificate-authority-certificate \
    --certificate-authority-arn arn:aws:acm-pca:region:account:certificate-authority/CA_ID \
    --certificate fileb://cert.pem

  8. Check the status of your short-lived mode CA again by using the describe-certificate-authority command. Make sure to replace the certificate authority ARN in the following command with your own CA ARN.

    sh-4.2$ aws acm-pca describe-certificate-authority \
    > --certificate-authority-arn arn:aws:acm-pca:region:account:certificate-authority/CA_ID \
    > --output json

    The output of this command is as follows:

    {
        "CertificateAuthority": {
            "Arn": "arn:aws:acm-pca:region:account:certificate-authority/CA_ID",
            "OwnerAccount": "account",
            "CreatedAt": "2022-11-02T23:12:46.916000+00:00",
            "LastStateChangeAt": "2022-11-02T23:39:23.482000+00:00",
            "Type": "ROOT",
            "Serial": "serial",
            "Status": "ACTIVE",
            "NotBefore": "2022-11-02T22:34:50+00:00",
            "NotAfter": "2032-11-02T23:34:50+00:00",
            "CertificateAuthorityConfiguration": {
                "KeyAlgorithm": "RSA_2048",
                "SigningAlgorithm": "SHA256WITHRSA",
                "Subject": {
                    "Country": "US",
                    "Organization": "Example Corp",
                    "OrganizationalUnit": "Sales",
                    "State": "WA",
                    "CommonName": "Example Root CA G1",
                    "Locality": "Seattle"
                }
            },
            "RevocationConfiguration": {
                "CrlConfiguration": {
                    "Enabled": false
                },
                "OcspConfiguration": {
                    "Enabled": false
                }
            },
            "KeyStorageSecurityStandard": "FIPS_140_2_LEVEL_3_OR_HIGHER",
            "UsageMode": "SHORT_LIVED_CERTIFICATE"
        }
    }

  9. Great! As shown in the output from the preceding command, the new short-lived mode root CA has a status of ACTIVE, meaning it can now issue certificates. This certificate authority will be able to issue end-entity certificates that have a validity period of up to 7 days, as shown in the UsageMode: SHORT_LIVED_CERTIFICATE parameter.

Conclusion

In this post, we introduced the short-lived CA mode that is offered by AWS Private CA, explained how it differs from the general-purpose CA mode, and compared the pricing models for both CA modes. We also provided some recommendations for choosing the appropriate CA mode based on your certificate issuance volume and use cases. Finally, we showed you how to create a short-lived mode CA by using the AWS CLI.

Get started using AWS Private CA, and consult the AWS Private CA User Guide for more details on the short-lived CA mode.

If you have feedback about this post, submit comments in the Comments section below. If you have questions about this post, start a new thread on the AWS Certificate Manager re:Post or contact AWS Support.

Want more AWS Security news? Follow us on Twitter.

Zach Miller

Zach Miller

Zach is a Senior Security Specialist Solutions Architect at AWS. His background is in data protection and security architecture, focused on a variety of security domains, including cryptography, secrets management, and data classification. Today, he is focused on helping enterprise AWS customers adopt and operationalize AWS security services to increase security effectiveness and reduce risk.

Rushir Patel

Rushir Patel

Rushir is a Senior Security Specialist at AWS focused on data protection and cryptography services. His goal is to make complex topics simple for customers and help them adopt better security practices. Prior to AWS, he worked in security product management, engineering, and operations roles.

Trevor Freeman

Trevor Freeman

Trevor is an innovative and solutions-oriented Product Manager at Amazon Web Services, focusing on AWS Private CA. With over 20 years of experience in software and service development, he became an expert in Cloud Services, Security, Enterprise Software, and Databases. Being adept in product architecture and quality assurance, Trevor takes great pride in providing exceptional customer service.

How to Connect Business and Technology to Embrace Strategic Thinking (Book Review)

Post Syndicated from Danilo Poccia original https://aws.amazon.com/blogs/aws/how-to-connect-business-and-technology-to-embrace-strategic-thinking-book-review/

The Value Flywheel Effect: Power the Future and Accelerate Your Organization to the Modern Cloud
by David Anderson with Mark McCann and Michael O’Reilly

With this post, I’d like to share a new book that got my attention. It’s a book at the intersection of business, technology, and people. This is a great read for anyone who wants to understand how organizations can evolve to maximize the business impact of new technologies and speed up their internal processes.

The Value FlyWheel Effect book with David Anderson and Danilo Poccia

Last year at re:Invent, I had the opportunity to meet David Anderson. As Director of Technology at Liberty Mutual, he drove the technology change when the global insurance company, founded in 1912, moved its services to the cloud and adopted a serverless-first strategy. He created an environment where experimentation was normal, and software engineers had time and space to learn. This worked so well that, at some point, he had four AWS Heroes in his extended team.

A few months before, I heard that David was writing a book with Mark McCann and Michael O’Reilly. They all worked together at Liberty Mutual, and they were distilling their learnings to help other organizations implement a similar approach. The book was just out when we met, and I was curious to learn more, starting from the title. We met in the expo area, and David was kind enough to give me a signed copy of the book.

The book is published by IT Revolution, the same publisher behind some of my favorite books such as The Phoenix Project, Team Topologies, and Accelerate. The book is titled The Value Flywheel Effect because when you connect business and technology in an organization, you start to turn a flywheel that builds momentum with each small win.

The Value Flywhell
The four phases of the Value Flywheel are:

  1. Clarity of Purpose – This is the part where you look at what is really important for your organization, what makes your company different, and define your North Star and how to measure your distance from it. In this phase, you look at the company through the eyes of the CEO.
  2. Challenge & Landscape – Here you prepare the organization and set up the environment for the teams. We often forget the social aspect of technical teams and great focus is given here on how to set up the right level of psychological safety for teams to operate. This phase is for engineers.
  3. Next Best Action – In this phase, you think like a product leader and plan the next steps with a focus on how to improve the developer experience. One of the key aspects is that “code is a liability” and the less code you write to solve a business problem, the better it is for speed and maintenance. For example, you can avoid some custom implementations and offload their requirements to capabilities offered by cloud providers.
  4. Long-Term Value – This is the CTO perspective, looking at how to set up a problem-preventing culture with well-architected systems and a focus on observability and sustainability. Sustainability here is not just considering the global environment but also the teams and the people working for the organization.

As you would expect from a flywheel, you should iterate on these four phases so that every new spin gets easier and faster.

Wardley Mapping
One thing that I really appreciate from the book is how it made it easy for me to use Wardley mapping (usually applied to a business context) in a technical scenario. Wardley maps, invented by Simon Wardley, provide a visual representation of the landscape in which a business operates.

Each map consists of a value chain, where you draw the components that your customers need. The components are connected to show how they depend on each other. The position of the components is based on how visible they are to customers (vertical) and their evolution status from genesis to being a product or a commodity (horizontal). Over time, some components evolve from being custom-built to becoming a product or being commoditized. This displays on the map with a natural movement to the right as things evolve. For example, data centers were custom-built in the past, but then they became a standard product, and cloud computing made them available as a commodity.

Wardley mapping – Basic elements of a map

Basic elements of a map – Provided courtesy of Simon Wardley, CC BY-SA 4.0.

With mapping, you can more easily understand what improvements you need and what gaps you have in your technical solution. In this way, engineers can identify which components they should focus on to maximize their impact and what parts are not strategic and can be offloaded to a SaaS solution. It’s a sort of evolutionary architecture where mapping gives a way to look ahead at how the system should evolve over time and where inertia can slow down the evolution of part of the system.

Sometimes it seems the same best practices apply everywhere but this is not true. An advantage of mapping is that it helps identify the best team and methodology to use based on a component evolution status as described by its horizontal position on a map. For example, an “explorer” attitude is best suited for components in their genesis or being custom built, a “villager” works best on products, and when something becomes a commodity you need a “town planner.”

More Tools and Less Code
The authors look at many available tools and frameworks. For example, the book introduces the North Star Framework, a way to manage products by first identifying their most important metric (the North Star), and Gojko Adzic‘s Impact Mapping, a collaborative planning technique that focuses on leading indicators to help teams make a big impact with their software products. By the way, Gojko is also an AWS Serverless Hero.

Another interesting point is how to provide engineers with the necessary time and space to learn. I specifically like how internal events are called out and compared to public conferences. In internal events, engineers have a chance to use a new technology within their company environment, making it easier to demonstrate what can be done with all the limits of an actual scenario.

Finally, I’d like to highlight this part that clearly defines what the book intends by the statements, “code is a liability”:

“When you ask a software team to build something, they deliver a system, not lines of code. The asset is not the code; the asset is the system. The less code in the system, the less overhead you have bought. Some developers may brag about how much code they’ve written, but this isn’t something to brag about.”

This is not a programming book, and serverless technologies are used as examples of how you can speed up the flywheel. If you are looking for a technical deep dive on serverless technologies, you can find more on Serverless Land, a site that brings together the latest information and learning resources for serverless computing, or have a look at the Serverless Architectures on AWS book.

Now that every business is a technology business, The Value Flywheel Effect is about how to accelerate and transform an organization. It helps set the right environment, purpose, and stage to modernize your applications as you adopt cloud computing and get the benefit of it.

You can meet David, Mark, and Michael at the Serverless Edge, where a team of engineers, tech enthusiasts, marketers, and thought leaders obsessed with technology help learn and communicate how serverless can transform a business model.

Danilo

How to create custom health checks for your Amazon EC2 Auto Scaling Fleet

Post Syndicated from Sheila Busser original https://aws.amazon.com/blogs/compute/how-to-create-custom-health-checks-for-your-amazon-ec2-auto-scaling-fleet/

This blog post is written by Gaurav Verma, Cloud Infrastructure Architect, Professional Services AWS.

Amazon EC2 Auto Scaling helps you maintain application availability and lets you automatically add or remove Amazon Elastic Compute Cloud (Amazon EC2) instances according to the conditions that you define. You can use dynamic and predictive scaling to scale-out and scale-in EC2 instances. Auto Scaling helps to maintain the self-healing Amazon EC2 environment for an application where Auto Scaling can use the status of Amazon EC2 health checks to determine if an instance is faulty and needs replacement. Amazon EC2 Auto Scaling provides three types of health checks, which are discussed below.

EC2 Status check: AWS provides two types of health checks for EC2 instances: System status check and instance status check. System status checks monitor the AWS system on which an instance is running. If the problem is with underlying system, AWS will fix the problem. Instance status check monitors the software and network configuration of an instance. If the instance status check fails, then you can fix the problem by following the steps in the troubleshoot instances with failed status checks documentation.

Elastic Load Balancer Health Check: Auto Scaling groups are generally connected to Elastic Load Balancers (ELB). ELB provides the application-level health check by monitoring the endpoint (a webpage, or a health page in a web application) of an application. ELB health check monitors the application and marks the instance unhealthy if there is no response from an instance in the configured time.

Custom Health Check: You can use custom health checks to mark any instance as unhealthy if the instance fails for the check you define. Custom health checks can be used to implement various user requirements, such as the presence of instance tags added upon completion of a required workflow. The user data script is executed at instance boot time, and it can perform additional investigation into whether or not the user requirements are met before confirming that the instance is ready to accept load. For example, this approach could be used to confirm that the instance was successfully integrated with other parts of a complex application stack.

In some cases, a customer may add multiple checks either in the Amazon EC2 AMI or in the boot sequence to keep the instance secure and compliant. These checks can increase the boot time for the EC2 instance, and they can reboot the EC2 instance multiple times before an instance can be marked as compliant. Therefore, in some cases, an EC2 instance boot period can take forty to fifty minutes or longer.

If an EC2 instance isn’t marked as healthy within a defined time, Auto Scaling will mark an instance unhealthy, even though the instance wasn’t yet ready for evaluation. Custom health checks can help manage these situations. You can write the Amazon EC2 user data script to perform the custom health check and force Auto Scaling to wait until the instance is truly healthy (i.e., functional, secure, and compliant).

This blog describes a method to write a custom health check. We write an Amazon EC2 user data script to perform the custom health check and automate it for future EC2 instances in the Auto Scaling group. This script can wait for an instance to successfully complete the boot process and then mark the instance as healthy.

Prerequisites

You must have an AWS Identity and Access Management (IAM) role for Amazon EC2 with an Auto Scaling policy, which has these two actions allowed for the Auto Scaling group:

autoscaling:CompleteLifecycleAction

autoscaling:RecordLifecycleActionHeartbeat

Furthermore, we use the Amazon EC2 Auto Scaling lifecycle hooks. Lifecycle hooks let you create a solutions that are aware of events in Auto Scaling instance lifecycle, and then perform a custom action on instances when the lifecycle event occurs. As mentioned previously, typically a custom health check is needed when determining the workload readiness of an instance would be longer than the usual boot time for an EC2 instance that Auto Scaling assumes. Therefore, we utilize lifecycle hooks to keep the checks running until the instance is marked healthy.

Create custom health check

Let’s look at an example where an instance can only be marked as healthy if the instance has a tag with the key “Compliance-Check” and value “Successful”. Until this tag is both (a) present and (b) carries the value “Successful”, the instance shouldn’t be marked as “InService”.

  1. Create the Auto Scaling launch template for Amazon EC2 Auto Scaling. Name your Launch template “test”. In the additional configuration for user data, use this shell script as text.

The Following script will install the AWS Command Line Interface (AWS CLI) to interact with the AWS tagging and Auto Scaling APIs. Then, the script will run the while loop until the instance has a tag with the key “Compliance-Check” and value “Successful”. Once the instance has a tag, it will mark the instance as healthy and the instance will move into the “InService” state.

#!/bin/bash
curl "https://awscli.amazonaws.com/awscli-exe-linux-x86_64.zip" -o "awscliv2.zip"
unzip awscliv2.zip
sudo ./aws/install
#get instance id
instance=$(curl http://169.254.169.254/latest/meta-data/instance-id)

#Checking instance status
while true
do
readystatus=$(aws ec2 describe-instances --instance-ids $instance --filters "Name=tag: Compliance-Check,Values= Successful" |grep -i $instance)
if [[ $readystatus = *"InstanceId"* ]]; then
        echo $readystatus >> /home/ec2-user/user-script-output.txt
        aws autoscaling set-instance-health --instance-id $instance --health-status Healthy
        aws autoscaling complete-lifecycle-action --lifecycle-action-result CONTINUE --instance-id $instance --lifecycle-hook-name test --auto-scaling-group-name my-asg
        break 
else
	aws autoscaling set-instance-health --instance-id $instance --health-status Unhealthy
	sleep 5  
fi

done
  1. Create an Amazon EC2 Auto Scaling group using the AWS CLI with the “test” launch template that you just created and a predefined lifecycle hook. First, create a JSON file “config.json” in a system where you will run the AWS command to create the Auto Scaling group.
{
    "AutoScalingGroupName": "my-asg",
    "LaunchTemplate": {"LaunchTemplateId": "lt-1234567890abcde12"} ,
    "MinSize": 2,
    "MaxSize": 4,
    "DesiredCapacity": 2,
    "VPCZoneIdentifier": "subnet-12345678, subnet-90123456",
    "NewInstancesProtectedFromScaleIn": true,
    "LifecycleHookSpecificationList": [
        {
            "LifecycleHookName": "test",
            "LifecycleTransition": "autoscaling:EC2_INSTANCE_LAUNCHING",
            "HeartbeatTimeout": 300,
            "DefaultResult": "ABANDON"
        }
    ],
    "Tags": [
        {
            "ResourceId": "my-asg",
            "ResourceType": "auto-scaling-group",
            "Key": "Compliance-Check",
            "Value": "UnSuccessful",
            "PropagateAtLaunch": true
        }
    ]
}

To create the Auto Scaling group with the AWS CLI, you must run the following command at the same location where you saved the preceding JSON file. Make sure to replace the relevant subnets that you intend to use in the VPCZoneIdentifier.

>> aws autoscaling create-auto-scaling-group –cli-input-json file://config.json

This command will create the Auto Scaling group with a configuration defined in the JSON file. This Auto Scaling group should have two instances and a lifecycle hook called “test” with a 300 second wait period at the time of launch of an instance.

Tests

Now is the time to test the newly-created instances with a custom health check. Instances in Auto Scaling should be in the “Pending:Wait” stage, not the “InService” stage. Instances will be in this stage for approximately five minutes because we have a lifecycle hook time of 300 seconds in the config.json file.

If the workload readiness evaluation takes more than 300 seconds in your environment, then you can increase the lifecycle hook period to as long as 7200 seconds.

Change the tag value for one instance from “UnSuccessful” to “Successful”. If you’ve changed the tag within the five minutes of instances creation, then the instance should be in the “InService” state and marked as healthy.

Change Compliance-Check value from "UnSuccessful" to "Successful".

This test is a simulation of the situation where the health check of an instance depends on the tag values, and the tag values are only updated if the instance passes all of the checks as per the organization standards. Here we change the tag value manually, but in a real use case scenario, this value would be changed by the booting process when instances are marked as compliant.

Another test case could be that an instance should be marked as healthy if it’s added to the configuration management database, but not before that. For these checks, you can use the API with the curl command and look for the desired result. An example to call an API is in the above script, where it calls the AWS API to get the instance ID.

In case your custom health check script needs more than 7200 seconds, you can use this command to increase the lifecycle hook time:

>> aws autoscaling record-lifecycle-action-heartbeat –lifecycle-hook-name <lh_
name> –auto-scaling-group-name <asg_name> –instance-id <instance_id>

This command will give you the extra time equal to the time that you have configured in the life cycle hook.

Cleanup

Once you successfully test the solution, to avoid ongoing charges for resources you created, you should delete the resources.

To delete the Amazon EC2 Auto Scaling group, run the following command:

aws autoscaling delete-auto-scaling-group --auto-scaling-group-name my-asg

To delete the launch template, run the following command:

aws ec2 delete-launch-template --launch-template-id lt-1234567890abcde12

Delete the role and policy as well if you no longer need it.

Conclusion

EC2 Auto Scaling custom health checks are useful when system or instance health is insufficient, and you want instances to be marked as healthy only after additional checks. Typically, because of these different checks, the Amazon EC2 boot period can be longer than usual, and this may impact the scale-out process when an application needs more resources.

You can start by exploring EC2 Auto Scaling warm pools for these environments. You can keep the healthy marked instances in the warm pool in the Stopped stage. Then, these instances can be brought into the main pool at the time of scale-out without spending time on the boot process and lengthy health check. If you enable scale-in protection, then these healthy instances can move back to the warm pool at the time of scale-in rather than being terminated altogether.

Scaling an ASG using target tracking with a dynamic SQS target

Post Syndicated from Sheila Busser original https://aws.amazon.com/blogs/compute/scaling-an-asg-using-target-tracking-with-a-dynamic-sqs-target/

This blog post is written by Wassim Benhallam, Sr Cloud Application Architect AWS WWCO ProServe, and Rajesh Kesaraju, Sr. Specialist Solution Architect, EC2 Flexible Compute.

Scaling an Amazon EC2 Auto Scaling group based on Amazon Simple Queue Service (Amazon SQS) is a commonly used design pattern in decoupled applications. For example, an EC2 Auto Scaling Group can be used as a worker tier to offload the processing of audio files, images, or other files sent to the queue from an upstream tier (e.g., web tier). For latency-sensitive applications, AWS guidance describes a common pattern that allows an Auto Scaling group to scale in response to the backlog of an Amazon SQS queue while accounting for the average message processing duration (MPD) and the application’s desired latency.

This post builds on that guidance to focus on latency-sensitive applications where the MPD varies over time. Specifically, we demonstrate how to dynamically update the target value of the Auto Scaling group’s target tracking policy based on observed changes in the MPD. We also cover the utilization of Amazon EC2 Spot instances, mixed instance policies, and attribute-based instance selection in the Auto Scaling Groups as well as best practice implementation to achieve greater cost savings.

The challenge

The key challenge that this post addresses is applications that fail to honor their acceptable/target latency in situations where the MPD varies over time. Latency refers here to the time required for any queue message to be consumed and fully processed.

Consider the example of a customer using a worker tier to process image files (e.g., resizing, rescaling, or transformation) uploaded by users within a target latency of 100 seconds. The worker tier consists of an Auto Scaling group configured with a target tracking policy. To achieve the target latency mentioned previously, the customer assumes that each image can be processed in one second, and configures the target value of the scaling policy so that the average image backlog per instance is maintained at approximately 100 images.

In the first week, the customer submits 1000 images to the Amazon SQS queue for processing, each of which takes one second of processing time. Therefore, the Auto Scaling group scales to 10 instances, each of which processes 100 images in 100s, thereby honoring the target latency of 100s.

In the second week, the customer submits 1000 slightly larger images for processing. Since an image’s processing duration scales with its size, each image takes two seconds to process. As in the first week, the Auto Scaling group scales to 10 instances, but this time each instance processes 100 images in 200s, which is twice as long as was needed in the first round. As a result, the application fails to process the latter images within its acceptable latency.

Therefore, the challenge is common to any latency-sensitive application where the MPD is subject to change. Applications where the processing duration scales with input data size are particularly vulnerable to this problem. This includes image processing, document processing, computational jobs, and others.

Solution overview

Before we dive into the solution, let’s briefly review the target tracking policy’s scaling metric and its corresponding target value. A target tracking scaling policy works by adjusting the capacity to keep a scaling metric at, or close to, the specified target value. When scaling in response to an Amazon SQS backlog, it’s good practice to use a scaling metric known as the Backlog Per Instance (BPI) and a target value based on the acceptable BPI. These are computed as follows:

BPI equation, Saling metric and target value.

Given the acceptable BPI equation, a longer MPD requires us to use a smaller target value if we are to process these messages in the same acceptable latency, and vice versa. Therefore, the solution we propose here works by monitoring the average MPD over time and dynamically adjusting the target value of the Auto Scaling group’s target tracking policy (acceptable BPI) based on the observed changes in the MPD. This allows the scaling policy to adapt to variations in the average MPD over time, and thus enables the application to honor its acceptable latency.

Solution architecture

To demonstrate how the approach above can be implemented in practice, we put together an example architecture highlighting the services involved (see the following figure). We also provide an automated deployment solution for this architecture using an AWS Serverless Application Model (AWS SAM) template and some Python code (repository link). The repository also includes a README file with detailed instructions that you can follow to deploy the solution. The AWS SAM template deploys several resources, including an autoscaling group, launch template, target tracking scaling policy, an Amazon SQS queue, and a few AWS Lambda functions that serve various functions described as follows.

The Amazon SQS queue is used to accumulate messages intended for processing, while the Auto Scaling group instances are responsible for polling the queue and processing any messages received. To do this, a launch template defines a bootstrap script that allows the group’s instances to download and execute a Python code when first launched. The Python code consumes messages from the Amazon SQS queue and simulates their processing by sleeping for the MPD duration specified in the message body. After processing each message, the instance publishes the MPD as an Amazon CloudWatch metric (see the following figure).

Figure 1: Architecture diagram showing the components deployed by the AWS SAM template. These include an SQS queue, an Auto Scaling group responsible for polling and processing queue messages, a Lambda function that regularly updates the BPI CloudWatch metric, and a “Target Setter” Lambda function that regularly updates the Auto Scaling group’s target tracking scaling policy.

Figure 1: Architecture diagram showing the components deployed by the AWS SAM template.

To enable scaling, the Auto Scaling group is configured with a target tracking scaling policy that specifies BPI as the scaling metric and with an initial target value provided by the user.

The BPI CloudWatch metric is calculated and published by the “Metric-Publisher” Lambda function which is invoked every one minute using an Amazon EventBridge rate expression. To calculate BPI, the Lambda function simply takes the ratio of the number of messages visible in the Amazon SQS queue by the total number of in-service instances in the Auto Scaling group, as shown in equation (2) above.

On the other hand, the scaling policy’s target value is updated by the “Target-Setter” Lambda function, which is invoked every 30 minutes using another EventBridge rate expression. To calculate the new target value, the Lambda function simply takes the ratio of the user-defined acceptable latency value by the current average MPD queried from the corresponding CloudWatch metric, as shown in the previous equation (1).

Finally, to help you quickly test this solution, a Lambda function “Testing Lambda” is also provided and can be used to send messages to the Amazon SQS queue with a processing duration of your choice. This is specified within each message’s body. You can invoke this Lambda function with different MPDs (by modifying the corresponding environment variable) to verify how the Auto Scaling group scales in response. A CloudWatch dashboard is also deployed to enable you to track key scaling metrics through time. These include the number of messages visible in the queue, the number of in-service instances in the Auto Scaling group, the MPD, and BPI vs acceptable BPI.

Solution testing

To demonstrate the solution in action and its impact on application latency, we conducted two tests that you can reproduce by following the instructions described in the “Testing” section of the repository’s README file (repository link). In both tests, we assume a hypothetical application with a target latency of 300s. We also modified the invocation frequency of the “Target Setter” Lambda function to one minute to quickly assess the impact of target value changes. In both tests, we submit 50 messages to the Amazon SQS queue through the provided helper lambda. An MPD of 25s and 50s was used for the first and second test, respectively. The provided CloudWatch dashboard shows that the ASG scales to a total of four instances in the first test, and eight instances in the second (see the following figure). See README file for a detailed description of how various metrics evolve over time.

Comparison of Tests 1 and 2

Since Test 2 messages take twice as long to process, the Auto Scaling group launched twice as many instances to attempt to process all of the messages in the same amount of time as Test 1 (latency). The following figure shows that the total time to process all 50 messages in Test 1 was 9 mins vs 10 mins in Test 2. In contrast, if we were to use a static/fixed acceptable BPI of 12, then a total of four instances would have been operational in Test 2, thereby requiring double the time of Test 1 (~20 minutes) to process all of the messages. This demonstrates the value of using a dynamic scaling target when processing messages from Amazon SQS queues, especially in circumstances where the MPD is prone to vary with time.

Figure 2: CloudWatch dashboard showing Auto Scaling group scaling test results (Test 1 and 2). Although Test 2 messages require double the MPD of Test 1 messages, the Auto Scaling group processed Test 2 messages in the same amount of time as Test 1 by launching twice as many instances.

Figure 2: CloudWatch dashboard showing Auto Scaling group scaling test results (Test 1 and 2).

Recommended best practices for Auto Scaling groups

This section highlights a few key best practices that we recommend adopting when deploying and working with Auto Scaling groups.

Reducing cost using EC2 Spot instances

Amazon SQS helps build loosely coupled application architectures, while providing reliable asynchronous communication between the various layers/components of an application. If a worker node fails to process a message within the Amazon SQS message visibility time-out, then the message is returned to the queue and another worker node can pick up and process that message. This makes Amazon SQS-backed applications fault-tolerant by design and thus a great fit for EC2 Spot instances. EC2 spot instances are spare compute capacity in the AWS cloud that is available to you at steep discounts as compared to On-Demand prices.

Maximizing capacity using attribute-based instance selection

With the recently released attribute-based instance selection feature, you can define infrastructure requirements based on application needs such as vCPU, RAM, and processor family (e.g., x86, ARM). This removes the need to define specific instances in your Auto Scaling group configuration, and it eliminates the burden of identifying the correct instance families and sizes. In addition, newly released instance types will be automatically considered if they fit your requirements. Attribute-based instance selection lets you tap into hundreds of different EC2 instance pools, which increases the chance of getting EC2 (Spot/On-demand) instances. When using attribute-based instance selection with the capacity optimized allocation strategy, Amazon EC2 allocates instances from deeper Spot capacity pools, thereby further reducing the chance of Spot interruption.

The following sample configuration creates an Auto Scaling group with attribute-based instance selection:

AutoScalingGroupName: 'my-asg' # [REQUIRED] 
MixedInstancesPolicy:
  LaunchTemplate:
    LaunchTemplateSpecification:
      LaunchTemplateId: 'lt-0537239d9aef10a77'
    Overrides:
    - InstanceRequirements:
        VCpuCount: # [REQUIRED] 
          Min: 2
          Max: 4
        MemoryMiB: # [REQUIRED] 
          Min: 2048
  InstancesDistribution:
    SpotAllocationStrategy: 'capacity-optimized'
MinSize: 0 # [REQUIRED] 
MaxSize: 100 # [REQUIRED] 
DesiredCapacity: 4
VPCZoneIdentifier: 'subnet-e76a128a,subnet-e66a128b,subnet-e16a128c'

Conclusion

As can be seen from the test results, this approach demonstrates how an Auto Scaling group can honor a user-provided acceptable latency constraint while accomodating variations in the MPD over time. This is possible because the average MPD is monitored and regularly updated as a CloudWatch metric. In turn, this is continously used to update the target value of the group’s target tracking policy. Moreover, we have covered additional Auto Scaling group best practices suitable for this use case, including the use of Spot instances to reduce costs and attribute-based instance selection to simplify the selection of relevant instance types.

For more information on scaling options for Auto Scaling groups, visit the Amazon EC2 Auto Scaling documentation page and the SQS-based scaling guide.

How to choose between CoIP and Direct VPC routing modes on AWS Outposts rack

Post Syndicated from Sheila Busser original https://aws.amazon.com/blogs/compute/how-to-choose-between-coip-and-direct-vpc-routing-modes-on-aws-outposts-rack/

This blog post is written by Sumit Menaria, Senior Hybrid Solutions Architect AWS WWSO Core Services.

AWS Outposts Rack is a fully-managed service that extends AWS infrastructure, services, APIs, and tools to customer premises. By providing local access to AWS managed infrastructure and services, Outposts rack enables customers to build and run applications on premises using the same programming interfaces as in AWS Regions, while using local compute and storage resources for low latency, local data processing, and data residency needs.

There are various data sources on premises that you might want to connect from your Outpost. These sources can include field devices, on-premises databases, mainframes, storage arrays, or end users. Each Outpost supports a single Local Gateway (LGW) construct, which enables connectivity from your Outpost subnets to an on-premises network. Note that this post is specific to Outposts racks and a different method of local communication is used for AWS Outposts servers.

Two different options for facilitating communication between your Outpost based resources and on-premises network: Direct VPC routing and customer-owned IP pool. Both of these are mutually exclusive options, and routing works differently based on your choice of the mode. The two modes are the attributes of the LGW route table that your Outpost subnets’ VPC is associated with, which specifies the communication mode for the Outpost subnets.

Direct VPC routing mode

Direct VPC routing uses the private IP address of the instances in the VPC CIDR block to facilitate communication with your on-premises network. These addresses are advertised to your on-premises network with Border Gateway Protocol (BGP). Advertisement via BGP is only for the private IP addresses that belong to the subnets on your Outpost and have a route pointing to the LGW via the subnet’s route table. This type of routing is the default mode for Outposts Rack. In this mode, the LGW doesn’t perform Network Address Translation (NAT) for instances. Furthermore, you don’t have to assign an Elastic IP address to your Amazon Elastic Compute Cloud (Amazon EC2) instance from a (CoIP) to enable communication with your on-premises resources.

A diagram showing how an EC2 instance on an Outpost communicates with on-premises network using direct VPC routing mode

In this diagram, when the instance Y wants to communicate with an on-premises server, it traverses the LGW and can talk to the on-premises server using its source address (10.0.1.11) in the Subnet CIDR range (10.0.1.0/24) that is advertised over BGP from the LGW to the Customer Network Device. Similarly when the on-premises server wants to initiate communication with the Outpost based EC2 instance, it uses the instance’s private IP address (10.0.1.11) as the destination IP address to set up the connection.

CoIP mode

Utilizing CoIP mode means that you must provide a separate IP address range from your on-premises IP space for AWS to create an address pool, known as a CoIP. With CoIP, when an Outpost based resources, such as EC2 instances, Application Load Balancer (ALB), or Amazon Relational Database Service (Amazon RDS) instances, need to communicate to your on-premises network, the Local Gateway will perform 1:1 NAT from the resource’s private IP address from the Outpost subnet range to an IP address from the CoIP pool. The subnet-to-CoIP address mapping is done by assigning an Elastic IP (EIP) from the CoIP address range allocated for resources such as EC2 instances. To enable the communication with the CoIP pool from the on-premises network, and then the LGW advertises the CoIP pool through BGP over its peering with the Customer Network Device.

A diagram showing how an EC2 instance on an Outpost communicates with on-premises network using CoIP mode

In this diagram, when the instance Y wants to talk to an on-premises server, the traffic traverses the LGW and the source IP address (10.0.1.11) of the instance gets translated to an IP address (192.168.0.11) in the CoIP range that is associated with the instance. Similarly, when the on-premises server initiates the communication, the request will be sent with the CoIP address (192.168.0.11) of the instance as the destination IP address. This will be changed to the instance’s private IP address (10.0.1.11) via NAT at the LGW. The CoIP pool (192.168.0.0/26) is advertised via BGP to the Customer Network Device to provide the route to the on-premises environment for reaching the Outpost based resources.

When to choose CoIP routing mode

CoIP is particularly useful when you want to isolate your Outpost based workloads from the on-premises infrastructure and only need specific resources on the Outpost to be able to communicate to the on-premises infrastructure. This is useful in situations where large enterprise networks have hundreds of IP pools allocated and there is a high chance of overlap between IP addresses allocated to Outpost based VPCs/Subnets and those allocated to on-premises infrastructure. Furthermore, CoIP can act as another layer of security, as you may choose to allocate the CoIP addresses to only the resources which must communicate with the on-premises network. Then you can allocate for the rest of them using the subnet private IP address range for communication within the Outpost or Region based resources.

This means that you don’t need to have the number of IPs in the CoIP pool be equal to the number of resources on your Outpost. For example, you may choose to configure a /26 CoIP range and a /22 pool for subnets to meet your workload requirements.

CoIP mode can also be useful when using an external ALB on Outpost and you want to make it routable through the local internet connectivity. By using a smaller internet routable CoIP address range assignment for your external ALB, you can route traffic to the ALB on the Outpost without needing to traverse through the internet gateway (IGW) in the parent Region.

When to choose Direct VPC routing mode

You can choose Direct VPC routing if you don’t want the operational overhead of managing the additional IP pools for NAT between your Outpost based resources and on-premises network. There are also few applications which may not work well if there is an NAT of IPs between the two endpoints communicating with each other. Some examples you may see are Active Directory communication with on-premises based servers, or iSCSI mount of your instances as an additional storage to on-premises Storage Area Network (SAN). These applications may not work or may need additional tuning if they encounter NATed IP addresses between an Outpost based client on an EC2 instance and on-premises based server for a two-way communication.

When Direct VPC routing mode is used, multiple VPCs can be associated to an Outpost LGW route table, and the Outpost subnets with the LGW as the route target, are automatically advertised to the on-premises network through BGP. Therefore, you must make sure that appropriate IP planning is in place to avoid any overlap of the Outpost VPC/Subnet IP range with the on-premises IP range, as they are directly advertised from LGW toward the Customer Network Device. Having overlapping IP subnets in your network can lead to undesired effects on your application connectivity and you must pay special attention when allocating IP pools for your on-premises and Outpost based VPC address space. You can use Amazon VPC IP Address Manager (IPAM) to plan the IP space of your VPCs and CoIP pools, as well as add on-premises based IP Pools using manual allocation.

Conclusion

You can select either Direct VPC routing or CoIP mode for routing through an Outpost Local Gateway. Since this selection affects the routing for all of the subnets on your Outpost associated with the LGW route table, it should be selected based on your workload requirements and existing IP infrastructure planning. You can also change the LGW route table mode at a later stage. However, that involves network disruption and the creation of a new LGW route table. To learn more about Outposts Racks routing, visit the LGW Route table documentation.

Using GitHub Actions with Amazon CodeCatalyst

Post Syndicated from Dr. Rahul Sharad Gaikwad original https://aws.amazon.com/blogs/devops/using-github-actions-with-amazon-codecatalyst/

An Amazon CodeCatalyst workflow is an automated procedure that describes how to build, test, and deploy your code as part of a continuous integration and continuous delivery (CI/CD) system. You can use GitHub Actions alongside native CodeCatalyst actions in a CodeCatalyst workflow.

Introduction:

In a prior post in this series, Using Workflows to Build, Test, and Deploy with Amazon CodeCatalyst, I discussed creating CI/CD pipelines in CodeCatalyst and how that relates to The Unicorn Project’s main protagonist, Maxine. CodeCatalyst workflows help you reliably deliver high-quality application updates frequently, quickly, and securely. CodeCatalyst allows you to quickly assemble and configure actions to compose workflows that automate your CI/CD pipeline, test reporting, and other manual processes. Workflows use provisioned compute, Lambda compute, custom container images, and a managed build infrastructure to scale execution easily without sacrificing flexibility. In this post, I will return to workflows and discuss running GitHub Actions alongside native CodeCatalyst actions.

Prerequisites

If you would like to follow along with this walkthrough, you will need to:

Walkthrough

As with the previous posts in the CodeCatalyst series, I am going to use the Modern Three-tier Web Application blueprint. Blueprints provide sample code and CI/CD workflows to help you get started easily across different combinations of programming languages and architectures. To follow along, you can re-use a project you created previously, or you can refer to a previous post that walks through creating a project using the Three-tier blueprint.

As the team has grown, I have noticed that code quality has decreased. Therefore, I would like to add a few additional tools to validate code quality when a new pull request is submitted. In addition, I would like to create a Software Bill of Materials (SBOM) for each pull request so I know what components are used by the code. In the previous post on workflows, I focused on the deployment workflow. In this post, I will focus on the OnPullRequest workflow. You can view the OnPullRequest pipeline by expanding CI/CD from the left navigation, and choosing Workflows. Next, choose OnPullRequest and you will be presented with the workflow shown in the following screenshot. This workflow runs when a new pull request is submitted and currently uses Amazon CodeGuru to perform an automated code review.

OnPullRequest Workflow with CodeGuru code review

Figure 1. OnPullRequest Workflow with CodeGuru code review

While CodeGuru provides intelligent recommendations to improve code quality, it does not check style. I would like to add a linter to ensure developers follow our coding standards. While CodeCatalyst supports a rich collection of native actions, this does not currently include a linter. Fortunately, CodeCatalyst also supports GitHub Actions. Let’s use a GitHub Action to add a linter to the workflow.

Select Edit in the top right corner of the Workflow screen. If the editor opens in YAML mode, switch to Visual mode using the toggle above the code. Next, select “+ Actions” to show the list of actions. Then, change from Amazon CodeCatalyst to GitHub using the dropdown. At the time this blog was published, CodeCatalyst includes about a dozen curated GitHub Actions. Note that you are not limited to the list of curated actions. I’ll show you how to add GitHub Actions that are not on the list later in this post. For now, I am going to use Super-Linter to check coding style in pull requests. Find Super-Linter in the curated list and click the plus icon to add it to the workflow.

Super-Linter action with add icon

Figure 2. Super-Linter action with add icon

This will add a new action to the workflow and open the configuration dialog box. There is no further configuration needed, so you can simply close the configuration dialog box. The workflow should now look like this.

Workflow with the new Super-Linter action

Figure 3. Workflow with the new Super-Linter action

Notice that the actions are configured to run in parallel. In the previous post, when I discussed the deployment workflow, the steps were sequential. This made sense since each step built on the previous step. For the pull request workflow, the actions are independent, and I will allow them to run in parallel so they complete faster. I select Validate, and assuming there are no issues, I select Commit to save my changes to the repository.

While CodeCatalyst will start the workflow when a pull request is submitted, I do not have a pull request to submit. Therefore, I select Run to test the workflow. A notification at the top of the screen includes a link to view the run. As expected, Super Linter fails because it has found issues in the application code. I click on the Super Linter action and review the logs. Here are few issues that Super Linter reported regarding app.py used by the backend application. Note that the log has been modified slightly to fit on a single line.

/app.py:2:1: F401 'os' imported but unused
/app.py:2:1: F401 'time' imported but unused
/app.py:2:1: F401 'json' imported but unused
/app.py:2:10: E401 multiple imports on one line
/app.py:4:1: F401 'boto3' imported but unused
/app.py:6:9: E225 missing whitespace around operator
/app.py:8:1: E402 module level import not at top of file
/app.py:10:1: E402 module level import not at top of file
/app.py:15:35: W291 trailing whitespace
/app.py:16:5: E128 continuation line under-indented for visual indent
/app.py:17:5: E128 continuation line under-indented for visual indent
/app.py:25:5: E128 continuation line under-indented for visual indent
/app.py:26:5: E128 continuation line under-indented for visual indent
/app.py:33:12: W292 no newline at end of file

With Super-Linter working, I turn my attention to creating a Software Bill of Materials
(SBOM). I am going to use OWASP CycloneDX to create the SBOM. While there is a GitHub Action for CycloneDX, at the time I am writing this post, it is not available from the list of curated GitHub Actions in CodeCatalyst. Fortunately, CodeCatalyst is not limited to the curated list. I can use most any GitHub Action in CodeCatalyst. To add a GitHub Action that is not in the curated list, I return to edit mode, find GitHub Actions in the list of curated actions, and click the plus icon to add it to the workflow.

Figure 4. GitHub Action with add icon

Figure 4. GitHub Action with add icon

CodeCatalyst will add a new action to the workflow and open the configuration dialog box. I choose the Configuration tab and use the pencil icon to change the Action Name to Software-Bill-of-Materials. Then, I scroll down to the configuration section, and change the GitHub Action YAML. Note that you can copy the YAML from the GitHub Actions Marketplace, including the latest version number. In addition, the CycloneDX action expects you to pass the path to the Python requirements file as an input parameter.

GitHub Action YAML configuration

Figure 5. GitHub Action YAML configuration

Since I am using the generic GitHub Action, I must tell CodeCatalyst which artifacts are produced by the action and should be collected after execution. CycloneDX creates an XML file called bom.xml which I configure as an artifact. Note that a CodeCatalyst artifact is the output of a workflow action, and typically consists of a folder or archive of files. You can share artifacts with subsequent actions.

Artifact configuration with the path to bom.xml

Figure 6. Artifact configuration with the path to bom.xml

Once again, I select Validate, and assuming there are no issues, I select Commit to save my changes to the repository. I now have three actions that run in parallel when a pull request is submitted: CodeGuru, Super-Linter, and Software Bill of Materials.

Figure 7. Workflow including the software bill of materials

Figure 7. Workflow including the software bill of materials

As before, I select Run to test my workflow and click the view link in the notification. As expected, the workflow fails because Super-Linter is still reporting issues. However, the new Software Bill of Materials has completed successfully. From the artifacts tab I can download the SBOM.

Figure 8. Artifacts tab listing code review and SBOM

Figure 8. Artifacts tab listing code review and SBOM

The artifact is a zip archive that includes the bom.xml created by CycloneDX. This includes, among other information, a list of components used in the backend application.

    <components>
        <component type="library" bom-ref="7474f0f6-8aa2-46db-bebf-a7648cff84e1">
            <name>Jinja2</name>
            <version>3.1.2</version>
            <purl>pkg:pypi/[email protected]</purl>
        </component>
        <component type="library" bom-ref="fad0708b-d007-4f98-a80c-056b136015df">
            <name>aws-cdk-lib</name>
            <version>2.43.0</version>
            <purl>pkg:pypi/[email protected]</purl>
        </component>
        <component type="library" bom-ref="23e3aaae-b4e1-4f3b-b026-fcd298c9cb9b">
            <name>aws-cdk.aws-apigatewayv2-alpha</name>
            <version>2.43.0a0</version>
            <purl>pkg:pypi/[email protected]</purl>
        </component>
        <component type="library" bom-ref="d283cf17-9125-422c-b55c-cabb64d18f79">
            <name>aws-cdk.aws-apigatewayv2-integrations-alpha</name>
            <version>2.43.0a0</version>
            <purl>pkg:pypi/[email protected]</purl>
        </component>
        <component type="library" bom-ref="0f095c84-c9e9-4d6c-a4ed-c4a6c7605426">
            <name>aws-cdk.aws-lambda-python-alpha</name>
            <version>2.43.0a0</version>
            <purl>pkg:pypi/[email protected]</purl>
        </component>
        <component type="library" bom-ref="b248b85b-ba27-4796-bcdf-6bd82ad47295">
            <name>constructs</name>
            <version>&gt;=10.0.0,&lt;11.0.0</version>
            <purl>pkg:pypi/constructs@%3E%3D10.0.0%2C%3C11.0.0</purl>
        </component>
        <component type="library" bom-ref="72b1da33-19c2-4b5c-bd58-7f719dafc28a">
            <name>simplejson</name>
            <version>3.17.6</version>
            <purl>pkg:pypi/[email protected]</purl>
        </component>
    </components>

The workflow is now enforcing code quality and generating a SBOM like I wanted. Note that while this is a great start, there is still room for improvement. First, I could collect reports generated by the actions in my workflow, and define success criteria for code quality. Second, I could scan the SBOM for known security vulnerabilities using a Software Composition Analysis (SCA) solution. I will be covering this in a future post in this series.

Cleanup

If you have been following along with this workflow, you should delete the resources you deployed so you do not continue to incur charges. First, delete the two stacks that CDK deployed using the AWS CloudFormation console in the AWS account you associated when you launched the blueprint. These stacks will have names like mysfitsXXXXXWebStack and mysfitsXXXXXAppStack. Second, delete the project from CodeCatalyst by navigating to Project settings and choosing Delete project.

Conclusion

In this post, you learned how to add GitHub Actions to a CodeCatalyst workflow. I used GitHub Actions alongside native CodeCatalyst actions in my workflow. I also discussed adding actions from both the curated list of actions and others not in the curated list. Read the documentation to learn more about using GitHub Actions in CodeCatalyst.

About the authors:

Dr. Rahul Gaikwad

Dr. Rahul is a DevOps Lead Consultant at AWS. He helps customers to migrate and modernize workloads to AWS Cloud with a special focus on DevOps and IaC. He is passionate about building innovative solutions using technology and enjoys collaborating with customers and peers. He contributes to open-source community projects. Outside of work, Rahul has completed Ph.D. in AIOps and he enjoys travelling and spending time with his family.

Anirudh Sharma

Anirudh is a Cloud Support Engineer 2 with an extensive background in DevOps offerings at AWS, he is also a Subject Matter Expert in AWS ElasticBeanstalk and AWS CodeDeploy services. He loves helping customers and learning new services and technologies. He also loves travelling and has a goal to visit Japan someday, is a Golden State Warriors fan and loves spending time with his family.

Navdeep Pareek

Navdeep is Lead Migration Consultant at AWS. He helps customer to migrate and modernize customer workloads to AWS Cloud and have specialisation in automation, DevOps. In his spare time, he enjoys travelling, cooking and spending time with family and friends.

Define a custom session duration and terminate active sessions in IAM Identity Center

Post Syndicated from Ron Cully original https://aws.amazon.com/blogs/security/define-a-custom-session-duration-and-terminate-active-sessions-in-iam-identity-center/

Managing access to accounts and applications requires a balance between delivering simple, convenient access and managing the risks associated with active user sessions. Based on your organization’s needs, you might want to make it simple for end users to sign in and to operate long enough to get their work done, without the disruptions associated with requiring re-authentication. You might also consider shortening the session to help meet your compliance or security requirements. At the same time, you might want to terminate active sessions that your users don’t need, such as sessions for former employees, sessions for which the user failed to sign out on a second device, or sessions with suspicious activity.

With AWS IAM Identity Center (successor to AWS Single Sign-On), you now have the option to configure the appropriate session duration for your organization’s needs while using new session management capabilities to look up active user sessions and revoke unwanted sessions.

In this blog post, I show you how to use these new features in IAM Identity Center. First, I walk you through how to configure the session duration for your IAM Identity Center users. Then I show you how to identify existing active sessions and terminate them.

What is IAM Identity Center?

IAM Identity Center helps you securely create or connect your workforce identities and manage their access centrally across AWS accounts and applications. IAM Identity Center is the recommended approach for workforce identities to access AWS resources. In IAM Identity Center, you can integrate with an external identity provider (IdP), such as Okta Universal Directory, Microsoft Azure Active Directory, or Microsoft Active Directory Domain Services, as an identity source or you can create users directly in IAM Identity Center. The service is built on the capabilities of AWS Identity and Access Management (IAM) and is offered at no additional cost.

IAM Identity Center sign-in and sessions

You can use IAM Identity Center to access applications and accounts and to get credentials for the AWS Management Console, AWS Command Line Interface (AWS CLI), and AWS SDK sessions. When you log in to IAM Identity Center through a browser or the AWS CLI, an AWS access portal session is created. When you federate into the console, IAM Identity Center uses the session duration setting on the permission set to control the duration of the session.

Note: The access portal session duration for IAM Identity Center differs from the IAM permission set session duration, which defines how long a user can access their account through the IAM Identity Center console.

Before the release of the new session management feature, the AWS access portal session duration was fixed at 8 hours. Now you can configure the session duration for the AWS access portal in IAM Identity Center from 15 minutes to 7 days. The access portal session duration determines how long the user can access the portal, applications, and accounts, and run CLI commands without re-authenticating. If you have an external IdP connected to IAM Identity Center, the access portal session duration will be the lesser of either the session duration that you set in your IdP or the session duration defined in IAM Identity Center. Users can access accounts and applications until the access portal session expires and initiates re-authentication.

When users access accounts or applications through IAM Identity Center, it creates an additional session that is separate but related to the AWS access portal session. AWS CLI sessions use the AWS access portal session to access roles. The duration of console sessions is defined as part of the permission set that the user accessed. When a console session starts, it continues until the duration expires or the user ends the session. IAM Identity Center-enabled application sessions re-verify the AWS access portal session approximately every 60 minutes. These sessions continue until the AWS access portal session terminates, until another application-specific condition terminates the session, or until the user terminates the session.

To summarize:

  • After a user signs in to IAM Identity Center, they can access their assigned roles and applications for a fixed period, after which they must re-authenticate.
  • If a user accesses an assigned permission set, the user has access to the corresponding role for the duration defined in the permission set (or by the user terminating the session).
  • The AWS CLI uses the AWS access portal session to access roles. The AWS CLI refreshes the IAM permission set in the background. The CLI job continues to run until the access portal session expires.
  • If users access an IAM Identity Center-enabled application, the user can retain access to an application for up to an hour after the access portal session has expired.

Note: IAM Identity Center doesn’t currently support session management capabilities for Active Directory identity sources.

For more information about session management features, see Authentication sessions in the documentation.

Configure session duration

In this section, I show you how to configure the session duration for the AWS access portal in IAM Identity Center. You can choose a session duration between 15 minutes and 7 days.

Session duration is a global setting in IAM Identity Center. After you set the session duration, the maximum session duration applies to IAM Identity Center users.

To configure session duration for the AWS access portal:

  1. Open the IAM Identity Center console.
  2. In the left navigation pane, choose Settings.
  3. On the Settings page, choose the Authentication tab.
  4. Under Authentication, next to Session settings, choose Configure.
  5. For Configure session settings, choose a maximum session duration from the list of pre-defined session durations in the dropdown. To set a custom session duration, select Custom duration, enter the length for the session in minutes, and then choose Save.
Figure 1: Set access portal session duration

Figure 1: Set access portal session duration

Congratulations! You have just modified the session duration for your users. This new duration will take effect on each user’s next sign-in.

Find and terminate AWS access portal sessions

With this new release, you can find active portal sessions for your IAM Identity Center users, and if needed, you can terminate the sessions. This can be useful in situations such as the following:

  • A user no longer works for your organization or was removed from projects that gave them access to applications or permission sets that they should no longer use.
  • If a device is lost or stolen, the user can contact you to end the session. This reduces the risk that someone will access the device and use the open session.

In these cases, you can find a user’s active sessions in the AWS access portal, select the session that you’re interested in, and terminate it. Depending on the situation, you might also want to deactivate sign-in for the user from the system before revoking the user’s session. You can deactivate sign-in for users in the IAM Identity Center console or in your third-party IdP.

If you first deactivate the user’s sign-in in your IdP, and then deactivate the user’s sign-in in IAM Identity Center, deactivation will take effect in IAM Identity Center without synchronization latency. However, if you deactivate the user in IAM Identity Center first, then it is possible that the IdP could activate the user again. By first deactivating the user’s sign-in in your IdP, you can prevent the user from signing in again when you revoke their session. This action is advisable when a user has left your organization and should no longer have access, or if you suspect a valid user’s credentials were stolen and you want to block access until you reset the user’s passwords.

Termination of the access portal session does not affect the active permission set session started from the access portal. IAM role session duration when assumed from the access portal will last as long as the duration specified in the permission set. For AWS CLI sessions, it can take up to an hour for the CLI to terminate after the access portal session is terminated.

Tip: Activate multi-factor authentication (MFA) wherever possible. MFA offers an additional layer of protection to help prevent unauthorized individuals from gaining access to systems or data.

To manage active access portal sessions in the AWS access portal:

  1. Open the IAM Identity Center console.
  2. In the left navigation pane, choose Users.
  3. On the Users page, choose the username of the user whose sessions you want to manage. This takes you to a page with the user’s information.
  4. On the user’s page, choose the Active sessions tab. The number in parentheses next to Active sessions indicates the number of current active sessions for this user.
    Figure 2: View active access portal sessions

    Figure 2: View active access portal sessions

  5. Select the sessions that you want to delete, and then choose Delete session. A dialog box appears that confirms you’re deleting active sessions for this user.
    Figure 3: Delete selected active sessions

    Figure 3: Delete selected active sessions

  6. Review the information in the dialog box, and if you want to continue, choose Delete session.

Conclusion

In this blog post, you learned how IAM Identity Center manages sessions, how to modify the session duration for the AWS access portal, and how to view, search, and terminate active access portal sessions. I also shared some tips on how to think about the appropriate session duration for your use case and related steps that you should take when terminating sessions for users who shouldn’t have permission to sign in again after their session has ended.

With this new feature, you now have more control over user session management. You can use the console to set configurable session lengths based on your organization’s security requirements and desired end-user experience, and you can also terminate sessions, enabling you to manage sessions that are no longer needed or potentially suspicious.

To learn more, see Manage IAM Identity Center integrated application sessions.

 
If you have feedback about this post, submit comments in the Comments section below. If you have questions about this post, contact AWS Support.

Want more AWS Security news? Follow us on Twitter.

Ron Cully

Ron is a Principal Product Manager at AWS where he has led feature and roadmap planning for workforce identity products for over 6 years. He has over 25 years of experience leading networking and directory related product delivery. Ron is passionate about delivering solutions to help make it easier for you to migrate identity-aware workloads, simplify resource and application authorization, and give people a simple sign-in and access experience in the cloud.

Palak Arora

Palak Arora

Palak is a Senior Product Manager at AWS Identity. She has over eight years of cyber security experience with specialization in Identity and Access Management (IAM) domain. She has helped various customers across different sectors to define their enterprise and customer IAM roadmap and strategy, and improve the overall technology risk landscape.

New – Deployment Pipelines Reference Architecture and Reference Implementations

Post Syndicated from Sébastien Stormacq original https://aws.amazon.com/blogs/aws/new_deployment_pipelines_reference_architecture_and_-reference_implementations/

Today, we are launching a new reference architecture and a set of reference implementations for enterprise-grade deployment pipelines. A deployment pipeline automates the building, testing, and deploying of applications or infrastructures into your AWS environments. When you deploy your workloads to the cloud, having deployment pipelines is key to gaining agility and lowering time to market.

When I talk with you at conferences or on social media, I frequently hear that our documentation and tutorials are good resources to get started with a new service or a new concept. However, when you want to scale your usage or when you have complex or enterprise-grade use cases, you often lack resources to dive deeper.

This is why we have created over the years hundreds of reference architectures based on real-life use cases and also the security reference architecture. Today, we are adding a new reference architecture to this collection.

We used the best practices and lessons learned at Amazon and with hundreds of customer projects to create this deployment pipeline reference architecture and implementations. They go well beyond the typical “Hello World” example: They document how to architect and how to implement complex deployment pipelines with multiple environments, multiple AWS accounts, multiple Regions, manual approval, automated testing, automated code analysis, etc. When you want to increase the speed at which you deliver software to your customers through DevOps and continuous delivery, this new reference architecture shows you how to combine AWS services to work together. They document the mandatory and optional components of the architecture.

Having an architecture document and diagram is great, but having an implementation is even better. Each pipeline type in the reference architecture has at least one reference implementation. One of the reference implementations uses an AWS Cloud Development Kit (AWS CDK) application to deploy the reference architecture on your accounts. It is a good starting point to study or customize the reference architecture to fit your specific requirements.

You will find this reference architecture and its implementations at https://pipelines.devops.aws.dev.

Deployment pipeline reference architecture

Let’s Deploy a Reference Implementation
The new deployment pipeline reference architecture demonstrates how to build a pipeline to deploy a Java containerized application and a database. It comes with two reference implementations. We are working on additional pipeline types to deploy Amazon EC2 AMIs, manage a fleet of accounts, and manage dynamic configuration for your applications.

The sample application is developed with SpringBoot. It runs on top of Corretto, the Amazon-provided distribution of the OpenJDK. The application is packaged with the CDK and is deployed on AWS Fargate. But the application is not important here; you can substitute your own application. The important parts are the infrastructure components and the pipeline to deploy an application. For this pipeline type, we provide two reference implementations. One deploys the application using Amazon CodeCatalyst, the new service that we announced at re:Invent 2022, and one uses AWS CodePipeline. This is the one I choose to deploy for this blog post.

The pipeline starts building the applications with AWS CodeBuild. It runs the unit tests and also runs Amazon CodeGuru to review code quality and security. Finally, it runs Trivy to detect additional security concerns, such as known vulnerabilities in the application dependencies. When the build is successful, the pipeline deploys the application in three environments: beta, gamma, and production. It deploys the application in the beta environment in a single Region. The pipeline runs end-to-end tests in the beta environment. All the tests must succeed before the deployment continues to the gamma environment. The gamma environment uses two Regions to host the application. After deployment in the gamma environment, the deployment into production is subject to manual approval. Finally, the pipeline deploys the application in the production environment in six Regions, with three waves of deployments made of two Regions each.

Deployment Pipelines Reference Architecture

I need four AWS accounts to deploy this reference implementation: one to deploy the pipeline and tooling and one for each environment (beta, gamma, and production). At a high level, there are two deployment steps: first, I bootstrap the CDK for all four accounts, and then I create the pipeline itself in the toolchain account. You must plan for 2-3 hours of your time to prepare your accounts, create the pipeline, and go through a first deployment.

Once the pipeline is created, it builds, tests, and deploys the sample application from its source in AWS CodeCommit. You can commit and push changes to the application source code and see it going through the pipeline steps again.

My colleague Irshad Buch helped me try the pipeline on my account. He wrote a detailed README with step-by-step instructions to let you do the same on your side. The reference architecture that describes this implementation in detail is available on this new web page. The application source code, the AWS CDK scripts to deploy the application, and the AWS CDK scripts to create the pipeline itself are all available on AWS’s GitHub. Feel free to contribute, report issues or suggest improvements.

Available Now
The deployment pipeline reference architecture and its reference implementations are available today, free of charge. If you decide to deploy a reference implementation, we will charge you for the resources it creates on your accounts. You can use the provided AWS CDK code and the detailed instructions to deploy this pipeline on your AWS accounts. Try them today!

— seb

Reduce risk by implementing HttpOnly cookie authentication in Amazon API Gateway

Post Syndicated from Marc Borntraeger original https://aws.amazon.com/blogs/security/reduce-risk-by-implementing-httponly-cookie-authentication-in-amazon-api-gateway/

Some web applications need to protect their authentication tokens or session IDs from cross-site scripting (XSS). It’s an Open Web Application Security Project (OWASP) best practice for session management to store secrets in the browsers’ cookie store with the HttpOnly attribute enabled. When cookies have the HttpOnly attribute set, the browser will prevent client-side JavaScript code from accessing the value. This reduces the risk of secrets being compromised.

In this blog post, you’ll learn how to store access tokens and authenticate with HttpOnly cookies in your own workloads when using Amazon API Gateway as the client-facing endpoint. The tutorial in this post will show you a solution to store OAuth2 access tokens in the browser cookie store, and verify user authentication through Amazon API Gateway. This post describes how to use Amazon Cognito to issue OAuth2 access tokens, but the solution is not limited to OAuth2. You can use other kinds of tokens or session IDs.

The solution consists of two decoupled parts:

  1. OAuth2 flow
  2. Authentication check

Note: This tutorial takes you through detailed step-by-step instructions to deploy an example solution. If you prefer to deploy the solution with a script, see the api-gw-http-only-cookie-auth GitHub repository.

Prerequisites

No costs should incur when you deploy the application from this tutorial because the services you’re going to use are included in the AWS Free Tier. However, be aware that small charges may apply if you have other workloads running in your AWS account and exceed the free tier. Make sure to clean up your resources from this tutorial after deployment.

Solution architecture

This solution uses Amazon Cognito, Amazon API Gateway, and AWS Lambda to build a solution that persists OAuth2 access tokens in the browser cookie store. Figure 1 illustrates the solution architecture for the OAuth2 flow.

Figure 1: OAuth2 flow solution architecture

Figure 1: OAuth2 flow solution architecture

  1. A user authenticates by using Amazon Cognito.
  2. Amazon Cognito has an OAuth2 redirect URI pointing to your API Gateway endpoint and invokes the integrated Lambda function oAuth2Callback.
  3. The oAuth2Callback Lambda function makes a request to the Amazon Cognito token endpoint with the OAuth2 authorization code to get the access token.
  4. The Lambda function returns a response with the Set-Cookie header, instructing the web browser to persist the access token as an HttpOnly cookie. The browser will automatically interpret the Set-Cookie header, because it’s a web standard. HttpOnly cookies can’t be accessed through JavaScript—they can only be set through the Set-Cookie header.

After the OAuth2 flow, you are set up to issue and store access tokens. Next, you need to verify that users are authenticated before they are allowed to access your protected backend. Figure 2 illustrates how the authentication check is handled.

Figure 2: Authentication check solution architecture

Figure 2: Authentication check solution architecture

  1. A user requests a protected backend resource. The browser automatically attaches HttpOnly cookies to every request, as defined in the web standard.
  2. The Lambda function oAuth2Authorizer acts as the Lambda authorizer for HTTP APIs. It validates whether requests are authenticated. If requests include the proper access token in the request cookie header, then it allows the request.
  3. API Gateway only passes through requests that are authenticated.

Amazon Cognito is not involved in the authentication check, because the Lambda function can validate the OAuth2 access tokens by using a JSON Web Token (JWT) validation check.

1. Deploying the OAuth2 flow

In this section, you’ll deploy the first part of the solution, which is the OAuth2 flow. The OAuth2 flow is responsible for issuing and persisting OAuth2 access tokens in the browser’s cookie store.

1.1. Create a mock protected backend

As shown in in Figure 2, you need to protect a backend. For the purposes of this post, you create a mock backend by creating a simple Lambda function with a default response.

To create the Lambda function

  1. In the Lambda console, choose Create function.

    Note: Make sure to select your desired AWS Region.

  2. Choose Author from scratch as the option to create the function.
  3. In the Basic information section as shown in , enter or select the following values:
  4. Choose Create function.
    Figure 3: Configuring the getProtectedResource Lambda function

    Figure 3: Configuring the getProtectedResource Lambda function

The default Lambda function code returns a simple Hello from Lambda message, which is sufficient to demonstrate the concept of this solution.

1.2. Create an HTTP API in Amazon API Gateway

Next, you create an HTTP API by using API Gateway. Either an HTTP API or a REST API will work. In this example, choose HTTP API because it’s offered at a lower price point (for this tutorial you will stay within the free tier).

To create the API Gateway API

  1. In the API Gateway console, under HTTP API, choose Build.
  2. On the Create and configure integrations page, as shown in Figure 4, choose Add integration, then enter or select the following values:
    • Select Lambda.
    • For Lambda function, select the getProtectedResource Lambda function that you created in the previous section.
    • For API name, enter a name. In this example, I used MyApp.
    • Choose Next.
    Figure 4: Configuring API Gateway integrations and API name

    Figure 4: Configuring API Gateway integrations and API name

  3. On the Configure routes page, as shown in Figure 5, enter or select the following values:
    • For Method, select GET.
    • For Resource path, enter / (a single forward slash).
    • For Integration target, select the getProtectedResource Lambda function.
    • Choose Next.
    Figure 5: Configuring API Gateway routes

    Figure 5: Configuring API Gateway routes

  4. On the Configure stages page, keep all the default options, and choose Next.
  5. On the Review and create page, choose Create.
  6. Note down the value of Invoke URL, as shown in Figure 6.
    Figure 6: Note down the invoke URL

    Figure 6: Note down the invoke URL

Now it’s time to test your API Gateway API. Paste the value of Invoke URL into your browser. You’ll see the following message from your Lambda function: Hello from Lambda.

1.3. Use Amazon Cognito

You’ll use Amazon Cognito user pools to create and maintain a user directory, and add sign-up and sign-in to your web application.

To create an Amazon Cognito user pool

  1. In the Amazon Cognito console, choose Create user pool.
  2. On the Authentication providers page, as shown in Figure 7, for Cognito user pool sign-in options, select Email, then choose Next.
    Figure 7: Configuring authentication providers

    Figure 7: Configuring authentication providers

  3. In the Multi-factor authentication pane of the Configure Security requirements page, as shown in Figure 8, choose your MFA enforcement. For this example, choose No MFA to make it simpler for you to test your solution. However, in production for data sensitive workloads you should choose Require MFA – Recommended. Choose Next.
    Figure 8: Configuring MFA

    Figure 8: Configuring MFA

  4. On the Configure sign-up experience page, keep all the default options and choose Next.
  5. On the Configure message delivery page, as shown in Figure 9, choose your email provider. For this example, choose Send email with Cognito to make it simple to test your solution. In production workloads, you should choose Send email with Amazon SES – Recommended. Choose Next.
    Figure 9: Configuring email

    Figure 9: Configuring email

  6. In the User pool name section of the Integrate your app page, as shown in Figure 10, enter or select the following values:
    1. For User pool name, enter a name. In this example, I used MyUserPool.
      Figure 10: Configuring user pool name

      Figure 10: Configuring user pool name

    2. In the Hosted authentication pages section, as shown in Figure 11, select Use the Cognito Hosted UI.
      Figure 11: Configuring hosted authentication pages

      Figure 11: Configuring hosted authentication pages

    3. In the Domain section, as shown in Figure 12, for Domain type, choose Use a Cognito domain. For Cognito domain, enter a domain name. Note that domains in Cognito must be unique. Make sure to enter a unique name, for example by appending random numbers at the end of your domain name. For this example, I used https://http-only-cookie-secured-app.
      Figure 12: Configuring an Amazon Cognito domain

      Figure 12: Configuring an Amazon Cognito domain

    4. In the Initial app client section, as shown in Figure 13, enter or select the following values:
      • For App type, keep the default setting Public client.
      • For App client name, enter a friendly name. In this example, I used MyAppClient.
      • For Client secret, keep the default setting Don’t generate a client secret.
      • For Allowed callback URLs, enter <API_GW_INVOKE_URL>/oauth2/callback, replacing <API_GW_INVOKE_URL> with the invoke URL you noted down from API Gateway in the previous section.
        Figure 13: Configuring the initial app client

        Figure 13: Configuring the initial app client

    5. Choose Next.
  7. Choose Create user pool.

Next, you need to retrieve some Amazon Cognito information for later use.

To note down Amazon Cognito information

  1. In the Amazon Cognito console, choose the user pool you created in the previous steps.
  2. Under User pool overview, make note of the User pool ID value.
  3. On the App integration tab, under Cognito Domain, make note of the Domain value.
  4. Under App client list, make note of the Client ID value.
  5. Under App client list, choose the app client name you created in the previous steps.
  6. Under Hosted UI, make note of the Allowed callback URLs value.

Next, create the user that you will use in a later section of this post to run your test.

To create a user

  1. In the Amazon Cognito console, choose the user pool you created in the previous steps.
  2. Under Users, choose Create user.
  3. For Email address, enter [email protected]. For this tutorial, you don’t need to send out actual emails, so the email address does not need to actually exist.
  4. Choose Mark email address as verified.
  5. For password, enter a password you can remember (or even better: use a password generator).
  6. Remember the email and password for later use.
  7. Choose Create user.

1.4. Create the Lambda function oAuth2Callback

Next, you create the Lambda function oAuth2Callback, which is responsible for issuing and persisting the OAuth2 access tokens.

To create the Lambda function oAuth2Callback

  1. In the Lambda console, choose Create function.

    Note: Make sure to select your desired Region.

  2. For Function name, enter oAuth2Callback.
  3. For Runtime, select Node.js 16.x.
  4. For Architecture, select arm64.
  5. Choose Create function.

After you create the Lambda function, you need to add the code. Create a new folder on your local machine and open it with your preferred integrated development environment (IDE). Add the package.json and index.js files, as shown in the following examples.

package.json

{
  "name": "oAuth2Callback",
  "version": "0.0.1",
  "dependencies": {
    "axios": "^0.27.2",
    "qs": "^6.11.0"
  }
}

In a terminal at the root of your created folder, run the following command.

$ npm install

In the index.js example code that follows, be sure to replace the placeholders with your values.

index.js

const qs = require("qs");
const axios = require("axios").default;
exports.handler = async function (event) {
  const code = event.queryStringParameters?.code;
  if (code == null) {
    return {
      statusCode: 400,
      body: "code query param required",
    };
  }
  const data = {
    grant_type: "authorization_code",
    client_id: "<your client ID from Cognito>",
    // The redirect has already happened, but you still need to pass the URI for validation, so a valid oAuth2 access token can be generated
    redirect_uri: encodeURI("<your callback URL from Cognito>"),
    code: code,
  };
  // Every Cognito instance has its own token endpoints. For more information check the documentation: https://docs.aws.amazon.com/cognito/latest/developerguide/token-endpoint.html
  const res = await axios.post(
    "<your App Client Cognito domain>/oauth2/token",
    qs.stringify(data),
    {
      headers: {
        "Content-Type": "application/x-www-form-urlencoded",
      },
    }
  );
  return {
    statusCode: 302,
    // These headers are returned as part of the response to the browser.
    headers: {
      // The Location header tells the browser it should redirect to the root of the URL
      Location: "/",
      // The Set-Cookie header tells the browser to persist the access token in the cookie store
      "Set-Cookie": `accessToken=${res.data.access_token}; Secure; HttpOnly; SameSite=Lax; Path=/`,
    },
  };
};

Along with the HttpOnly attribute, you pass along two additional cookie attributes:

  • Secure – Indicates that cookies are only sent by the browser to the server when a request is made with the https: scheme.
  • SameSite – Controls whether or not a cookie is sent with cross-site requests, providing protection against cross-site request forgery attacks. You set the value to Lax because you want the cookie to be set when the user is forwarded from Amazon Cognito to your web application (which runs under a different URL).

For more information, see Using HTTP cookies on the MDN Web Docs site.

Afterwards, upload the code to the oAuth2Callback Lambda function as described in Upload a Lambda Function in the AWS Toolkit for VS Code User Guide.

1.5. Configure an OAuth2 callback route in API Gateway

Now, you configure API Gateway to use your new Lambda function through a Lambda proxy integration.

To configure API Gateway to use your Lambda function

  1. In the API Gateway console, under APIs, choose your API name. For me, the name is MyApp.
  2. Under Develop, choose Routes.
  3. Choose Create.
  4. Enter or select the following values:
    • For method, select GET.
    • For path, enter /oauth2/callback.
  5. Choose Create.
  6. Choose GET under /oauth2/callback, and then choose Attach integration.
  7. Choose Create and attach an integration.
    • For Integration type, choose Lambda function.
    • For Lambda function, choose oAuth2Callback from the last step.
  8. Choose Create.

Your route configuration in API Gateway should now look like Figure 14.

Figure 14: Routes for API Gateway

Figure 14: Routes for API Gateway

2. Testing the OAuth2 flow

Now that you have the components in place, you can test your OAuth2 flow. You test the OAuth2 flow by invoking the login on your browser.

To test the OAuth2 flow

  1. In the Amazon Cognito console, choose your user pool name. For me, the name is MyUserPool.
  2. Under the navigation tabs, choose App integration.
  3. Under App client list, choose your app client name. For me, the name is MyAppClient.
  4. Choose View Hosted UI.
  5. In the newly opened browser tab, open your developer tools, so you can inspect the network requests.
  6. Log in with the email address and password you set in the previous section. Change your password, if you’re asked to do so. You can also choose the same password as you set in the previous section.
  7. You should see your Hello from Lambda message.

To test that the cookie was accurately set

  1. Check your browser network tab in the browser developer settings. You’ll see the /oauth2/callback request, as shown in Figure 15.
    Figure 15: Callback network request

    Figure 15: Callback network request

    The response headers should include a set-cookie header, as you specified in your Lambda function. With the set-cookie header, your OAuth2 access token is set as an HttpOnly cookie in the browser, and access is prohibited from any client-side code.

  2. Alternatively, you can inspect the cookie in the browser cookie storage, as shown in Figure 16.

  3. If you want to retry the authentication, navigate in your browser to your Amazon Cognito domain that you chose in the previous section and clear all site data in the browser developer tools. Do the same with your API Gateway invoke URL. Now you can restart the test with a clean state.

3. Deploying the authentication check

In this section, you’ll deploy the second part of your application: the authentication check. The authentication check makes it so that only authenticated users can access your protected backend. The authentication check works with the HttpOnly cookie, which is stored in the user’s cookie store.

3.1. Create the Lambda function oAuth2Authorizer

This Lambda function checks that requests are authenticated.

To create the Lambda function

  1. In the Lambda console, choose Create function.

    Note: Make sure to select your desired Region.

  2. For Function name, enter oAuth2Authorizer.
  3. For Runtime, select Node.js 16.x.
  4. For Architecture, select arm64.
  5. Choose Create function.

After you create the Lambda function, you need to add the code. Create a new folder on your local machine and open it with your preferred IDE. Add the package.json and index.js files as shown in the following examples.

package.json

{
  "name": "oAuth2Authorizer",
  "version": "0.0.1",
  "dependencies": {
    "aws-jwt-verify": "^3.1.0"
  }
}

In a terminal at the root of your created folder, run the following command.

$ npm install

In the index.js example code, be sure to replace the placeholders with your values.

index.js

const { CognitoJwtVerifier } = require("aws-jwt-verify");
function getAccessTokenFromCookies(cookiesArray) {
  // cookieStr contains the full cookie definition string: "accessToken=abc"
  for (const cookieStr of cookiesArray) {
    const cookieArr = cookieStr.split("accessToken=");
    // After splitting you should get an array with 2 entries: ["", "abc"] - Or only 1 entry in case it was a different cookie string: ["test=test"]
    if (cookieArr[1] != null) {
      return cookieArr[1]; // Returning only the value of the access token without cookie name
    }
  }
  return null;
}
// Create the verifier outside the Lambda handler (= during cold start),
// so the cache can be reused for subsequent invocations. Then, only during the
// first invocation, will the verifier actually need to fetch the JWKS.
const verifier = CognitoJwtVerifier.create({
  userPoolId: "<your user pool ID from Cognito>",
  tokenUse: "access",
  clientId: "<your client ID from Cognito>",
});
exports.handler = async (event) => {
  if (event.cookies == null) {
    console.log("No cookies found");
    return {
      isAuthorized: false,
    };
  }
  // Cookies array looks something like this: ["accessToken=abc", "otherCookie=Random Value"]
  const accessToken = getAccessTokenFromCookies(event.cookies);
  if (accessToken == null) {
    console.log("Access token not found in cookies");
    return {
      isAuthorized: false,
    };
  }
  try {
    await verifier.verify(accessToken);
    return {
      isAuthorized: true,
    };
  } catch (e) {
    console.error(e);
    return {
      isAuthorized: false,
    };
  }
};

After you add the package.json and index.js files, upload the code to the oAuth2Authorizer Lambda function as described in Upload a Lambda Function in the AWS Toolkit for VS Code User Guide.

3.2. Configure the Lambda authorizer in API Gateway

Next, you configure your authorizer Lambda function to protect your backend. This way you control access to your HTTP API.

To configure the authorizer Lambda function

  1. In the API Gateway console, under APIs, choose your API name. For me, the name is MyApp.
  2. Under Develop, choose Routes.
  3. Under / (a single forward slash) GET, choose Attach authorization.
  4. Choose Create and attach an authorizer.
  5. Choose Lambda.
  6. Enter or select the following values:
    • For Name, enter oAuth2Authorizer.
    • For Lambda function, choose oAuth2Authorizer.
    • Clear Authorizer caching. For this tutorial, you disable authorizer caching to make testing simpler. See the section Bonus: Enabling authorizer caching for more information about enabling caching to increase performance.
    • Under Identity sources, choose Remove.

      Note: Identity sources are ignored for your Lambda authorizer. These are only used for caching.

    • Choose Create and attach.
  7. Under Develop, choose Routes to inspect all routes.

Now your API Gateway route /oauth2/callback should be configured as shown in Figure 17.

Figure 17: API Gateway route configuration

Figure 17: API Gateway route configuration

4. Testing the OAuth2 authorizer

You did it! From your last test, you should still be authenticated. So, if you open the API Gateway Invoke URL in your browser, you’ll be greeted from your protected backend.

In case you are not authenticated anymore, you’ll have to follow the steps again from the section Testing the OAuth2 flow to authenticate.

When you inspect the HTTP request that your browser makes in the developer tools as shown in Figure 18, you can see that authentication works because the HttpOnly cookie is automatically attached to every request.

Figure 18: Browser requests include HttpOnly cookies

Figure 18: Browser requests include HttpOnly cookies

To verify that your authorizer Lambda function works correctly, paste the same Invoke URL you noted previously in an incognito window. Incognito windows do not share the cookie store with your browser session, so you see a {"message":"Forbidden"} error message with HTTP response code 403 – Forbidden.

Cleanup

Delete all unwanted resources to avoid incurring costs.

To delete the Amazon Cognito domain and user pool

  1. In the Amazon Cognito console, choose your user pool name. For me, the name is MyUserPool.
  2. Under the navigation tabs, choose App integration.
  3. Under Domain, choose Actions, then choose Delete Cognito domain.
  4. Confirm by entering your custom Amazon Cognito domain, and choose Delete.
  5. Choose Delete user pool.
  6. Confirm by entering your user pool name (in my case, MyUserPool), and then choose Delete.

To delete your API Gateway resource

  1. In the API Gateway console, select your API name. For me, the name is MyApp.
  2. Under Actions, choose Delete and confirm your deletion.

To delete the AWS Lambda functions

  1. In the Lambda console, select all three of the Lambda functions you created.
  2. Under Actions, choose Delete and confirm your deletion.

Bonus: Enabling authorizer caching

As mentioned earlier, you can enable authorizer caching to help improve your performance. When caching is enabled for an authorizer, API Gateway uses the authorizer’s identity sources as the cache key. If a client specifies the same parameters in identity sources within the configured Time to Live (TTL), then API Gateway uses the cached authorizer result, rather than invoking your Lambda function.

To enable caching, your authorizer must have at least one identity source. To cache by the cookie request header, you specify $request.header.cookie as the identity source. Be aware that caching will be affected if you pass along additional HttpOnly cookies apart from the access token.

For more information, see Working with AWS Lambda authorizers for HTTP APIs in the Amazon API Gateway Developer Guide.

Conclusion

In this blog post, you learned how to implement authentication by using HttpOnly cookies. You used Amazon API Gateway and AWS Lambda to persist and validate the HttpOnly cookies, and you used Amazon Cognito to issue OAuth2 access tokens. If you want to try an automated deployment of this solution with a script, see the api-gw-http-only-cookie-auth GitHub repository.

The application of this solution to protect your secrets from potential cross-site scripting (XSS) attacks is not limited to OAuth2. You can protect other kinds of tokens, sessions, or tracking IDs with HttpOnly cookies.

In this solution, you used NodeJS for your Lambda functions to implement authentication. But HttpOnly cookies are widely supported by many programing frameworks. You can find more implementation options on the OWASP Secure Cookie Attribute page.

Although this blog post gives you a tutorial on how to implement HttpOnly cookie authentication in API Gateway, it may not meet all your security and functional requirements. Make sure to check your business requirements and talk to your stakeholders before you adopt techniques from this blog post.

Furthermore, it’s a good idea to continuously test your web application, so that cookies are only set with your approved security attributes. For more information, see the OWASP Testing for Cookies Attributes page.

 
If you have feedback about this post, submit comments in the Comments section below. If you have questions about this post, start a new thread on the Amazon API Gateway re:Post or contact AWS Support.

Want more AWS Security news? Follow us on Twitter.

Marc Borntraeger

Marc Borntraeger

Marc is a Solutions Architect in healthcare, based in Zurich, Switzerland. He helps security-sensitive customers such as hospitals to re-innovate themselves with AWS.

Deliver Operational Insights to Atlassian Opsgenie using DevOps Guru

Post Syndicated from Brendan Jenkins original https://aws.amazon.com/blogs/devops/deliver-operational-insights-to-atlassian-opsgenie-using-devops-guru/

As organizations continue to grow and scale their applications, the need for teams to be able to quickly and autonomously detect anomalous operational behaviors becomes increasingly important. Amazon DevOps Guru offers a fully managed AIOps service that enables you to improve application availability and resolve operational issues quickly. DevOps Guru helps ease this process by leveraging machine learning (ML) powered recommendations to detect operational insights, identify the exhaustion of resources, and provide suggestions to remediate issues. Many organizations running business critical applications use different tools to be notified about anomalous events in real-time for the remediation of critical issues. Atlassian is a modern team collaboration and productivity software suite that helps teams organize, discuss, and complete shared work. You can deliver these insights in near-real time to DevOps teams by integrating DevOps Guru with Atlassian Opsgenie. Opsgenie is a modern incident management platform that receives alerts from your monitoring systems and custom applications and categorizes each alert based on importance and timing.

This blog post walks you through how to integrate Amazon DevOps Guru with Atlassian Opsgenie to
receive notifications for new operational insights detected by DevOps Guru with more flexibility and customization using Amazon EventBridge and AWS Lambda. The Lambda function will be used to demonstrate how to customize insights sent to Opsgenie.

Solution overview

Figure 1: Amazon EventBridge Integration with Opsgenie using AWS Lambda

Figure 1: Amazon EventBridge Integration with Opsgenie using AWS Lambda

Amazon DevOps Guru directly integrates with Amazon EventBridge to notify you of events relating to generated insights and updates to insights. To begin routing these notifications to Opsgenie, you can configure routing rules to determine where to send notifications. As outlined below, you can also use pre-defined DevOps Guru patterns to only send notifications or trigger actions that match that pattern. You can select any of the following pre-defined patterns to filter events to trigger actions in a supported AWS resource. Here are the following predefined patterns supported by DevOps Guru:

  • DevOps Guru New Insight Open
  • DevOps Guru New Anomaly Association
  • DevOps Guru Insight Severity Upgraded
  • DevOps Guru New Recommendation Created
  • DevOps Guru Insight Closed

By default, the patterns referenced above are enabled so we will leave all patterns operational in this implementation.  However, you do have flexibility to change which of these patterns to choose to send to Opsgenie. When EventBridge receives an event, the EventBridge rule matches incoming events and sends it to a target, such as AWS Lambda, to process and send the insight to Opsgenie.

Prerequisites

The following prerequisites are required for this walkthrough:

Push Insights using Amazon EventBridge & AWS Lambda

In this tutorial, you will perform the following steps:

  1. Create an Opsgenie integration
  2. Launch the SAM template to deploy the solution
  3. Test the solution

Create an Opsgenie integration

In this step, you will navigate to Opsgenie to create the integration with DevOps Guru and to obtain the API key and team name within your account. These parameters will be used as inputs in a later section of this blog.

  1. Navigate to Teams, and take note of the team name you have as shown below, as you will need this parameter in a later section.
Figure 2: Opsgenie team names

Figure 2: Opsgenie team names

  1. Click on the team to proceed and navigate to Integrations on the left-hand pane. Click on Add Integration and select the Amazon DevOps Guru option.
Figure 3: Integration option for DevOps Guru

Figure 3: Integration option for DevOps Guru

  1. Now, scroll down and take note of the API Key for this integration and copy it to your notes as it will be needed in a later section. Click Save Integration at the bottom of the page to proceed.

­­­

 Figure 4: API Key for DevOps Guru Integration

Figure 4: API Key for DevOps Guru Integration

  1. Now, the Opsgenie integration has been created and we’ve obtained the API key and team name. The email of any team member will be used in the next section as well.

Review & launch the AWS SAM template to deploy the solution

In this step, you will review & launch the SAM template. The template will deploy an AWS Lambda function that is triggered by an Amazon EventBridge rule when Amazon DevOps Guru generates a new event. The Lambda function will retrieve the parameters obtained from the deployment and pushes the events to Opsgenie via an API.

Reviewing the template

Below is the SAM template that will be deployed in the next step. This template launches a few key components specified earlier in the blog. The Transform section of the template allows us takes an entire template written in the AWS Serverless Application Model (AWS SAM) syntax and transforms and expands it into a compliant CloudFormation template. Under the Resources section this solution will deploy an AWS Lamba function using the Java runtime as well as an Amazon EventBridge Rule/Pattern. Another key aspect of the template are the Parameters. As shown below, the ApiKey, Email, and TeamName are parameters we will use for this CloudFormation template which will then be used as environment variables for our Lambda function to pass to OpsGenie.

Figure 5: Review of SAM Template

Figure 5: Review of SAM Template

Launching the Template

  1. Navigate to the directory of choice within a terminal and clone the GitHub repository with the following command:
  1. Change directories with the command below to navigate to the directory of the SAM template.
cd amazon-devops-guru-connector-opsgenie/OpsGenieServerlessTemplate
  1. From the CLI, use the AWS SAM to build and process your AWS SAM template file, application code, and any applicable language-specific files and dependencies.
sam build
  1. From the CLI, use the AWS SAM to deploy the AWS resources for the pattern as specified in the template.yml file.
sam deploy --guided
  1. You will now be prompted to enter the following information below. Use the information obtained from the previous section to enter the Parameter ApiKey, Parameter Email, and Parameter TeamName fields.
  •  Stack Name
  • AWS Region
  • Parameter ApiKey
  • Parameter Email
  • Parameter TeamName
  • Allow SAM CLI IAM Role Creation

Test the solution

  1. Follow this blog to enable DevOps Guru and generate an operational insight.
  2. When DevOps Guru detects a new insight, it will generate an event in EventBridge. EventBridge then triggers Lambda and sends the event to Opsgenie as shown below.
Figure 6: Event Published to Opsgenie with details such as the source, alert type, insight type, and a URL to the insight in the AWS console.

Figure 6: Event Published to Opsgenie with details such as the source, alert type, insight type, and a URL to the insight in the AWS console.enecccdgruicnuelinbbbigebgtfcgdjknrjnjfglclt

Cleaning up

To avoid incurring future charges, delete the resources.

  1. Delete resources deployed from this blog.
  2. From the command line, use AWS SAM to delete the serverless application along with its dependencies.
sam delete

Customizing Insights published using Amazon EventBridge & AWS Lambda

The foundation of the DevOps Guru and Opsgenie integration is based on Amazon EventBridge and AWS Lambda which allows you the flexibility to implement several customizations. An example of this would be the ability to generate an Opsgenie alert when a DevOps Guru insight severity is high. Another example would be the ability to forward appropriate notifications to the AIOps team when there is a serverless-related resource issue or forwarding a database-related resource issue to your DBA team. This section will walk you through how these customizations can be done.

EventBridge customization

EventBridge rules can be used to select specific events by using event patterns. As detailed below, you can trigger the lambda function only if a new insight is opened and the severity is high. The advantage of this kind of customization is that the Lambda function will only be invoked when needed.

{
  "source": [
    "aws.devops-guru"
  ],
  "detail-type": [
    "DevOps Guru New Insight Open"
  ],
  "detail": {
    "insightSeverity": [
         "high"
         ]
  }
}

Applying EventBridge customization

  1. Open the file template.yaml reviewed in the previous section and implement the changes as highlighted below under the Events section within resources (original file on the left, changes on the right hand side).
Figure 7: CloudFormation template file changed so that the EventBridge rule is only triggered when the alert type is "DevOps Guru New Insight Open" and insightSeverity is “high”.

Figure 7: CloudFormation template file changed so that the EventBridge rule is only triggered when the alert type is “DevOps Guru New Insight Open” and insightSeverity is “high”.

  1. Save the changes and use the following command to apply the changes
sam deploy --template-file template.yaml
  1. Accept the changeset deployment

Determining the Ops team based on the resource type

Another customization would be to change the Lambda code to route and control how alerts will be managed.  Let’s say you want to get your DBA team involved whenever DevOps Guru raises an insight related to an Amazon RDS resource. You can change the AlertType Java class as follows:

  1. To begin this customization of the Lambda code, the following changes need to be made within the AlertType.java file:
  • At the beginning of the file, the standard java.util.List and java.util.ArrayList packages were imported
  • Line 60: created a list of CloudWatch metrics namespaces
  • Line 74: Assigned the dataIdentifiers JsonNode to the variable dataIdentifiersNode
  • Line 75: Assigned the namespace JsonNode to a variable namespaceNode
  • Line 77: Added the namespace to the list for each DevOps Insight which is always raised as an EventBridge event with the structure detail►anomalies►0►sourceDetails►0►dataIdentifiers►namespace
  • Line 88: Assigned the default responder team to the variable defaultResponderTeam
  • Line 89: Created the list of responders and assigned it to the variable respondersTeam
  • Line 92: Check if there is at least one AWS/RDS namespace
  • Line 93: Assigned the DBAOps_Team to the variable dbaopsTeam
  • Line 93: Included the DBAOps_Team team as part of the responders list
  • Line 97: Set the OpsGenie request teams to be the responders list
Figure 8: java.util.List and java.util.ArrayList packages were imported

Figure 8: java.util.List and java.util.ArrayList packages were imported


Figure 9: AlertType Java class customized to include DBAOps_Team for RDS-related DevOps Guru insights.

Figure 9: AlertType Java class customized to include DBAOps_Team for RDS-related DevOps Guru insights.


  1. You then need to generate the jar file by using the mvn clean package command.
  • The function needs to be updated with:
    • FUNCTION_NAME=$(aws lambda
      list-functions –query ‘Functions[?contains(FunctionName, `DevOps-Guru`) ==
      `true`].FunctionName’ –output text)
    • aws lambda update-function-code –region
      us-east-1 –function-name $FUNCTION_NAME –zip-file fileb://target/Functions-1.0.jar
  1. As result, the DBAOps_Team will be assigned to the Opsgenie alert in the case a DevOps Guru Insight is related to RDS.
Figure 10: Opsgenie alert assigned to both DBAOps_Team and AIOps_Team.

Figure 10: Opsgenie alert assigned to both DBAOps_Team and AIOps_Team.

Conclusion

In this post, you learned how Amazon DevOps Guru integrates with Amazon EventBridge and publishes insights to Opsgenie using AWS Lambda. By creating an Opsgenie integration with DevOps Guru, you can now leverage Opsgenie strengths, incident management, team communication, and collaboration when responding to an insight. All of the insight data can be viewed and addressed in Opsgenie’s Incident Command Center (ICC).  By customizing the data sent to Opsgenie via Lambda, you can empower your organization even more by fine tuning and displaying the most relevant data thus decreasing the MTTR (mean time to resolve) of the responding operations team.

About the authors:

Brendan Jenkins

Brendan Jenkins is a solutions architect working with Enterprise AWS customers providing them with technical guidance and helping achieve their business goals. He has an area of interest around DevOps and Machine Learning technology. He enjoys building solutions for customers whenever he can in his spare time.

Pablo Silva

Pablo Silva is a Sr. DevOps consultant that guide customers in their decisions on technology strategy, business model, operating model, technical architecture, and investments.

He holds a master’s degree in Artificial Intelligence and has more than 10 years of experience with telecommunication and financial companies.

Joseph Simon

Joseph Simon is a solutions architect working with mid to large Enterprise AWS customers. He has been in technology for 13 years with 5 of those centered around DevOps. He has a passion for Cloud, DevOps and Automation and in his spare time, likes to travel and spend time with his family.

Adopt Recommendations and Monitor Predictive Scaling for Optimal Compute Capacity

Post Syndicated from Sheila Busser original https://aws.amazon.com/blogs/compute/evaluating-predictive-scaling-for-amazon-ec2-capacity-optimization/

This post is written by Ankur Sethi, Sr. Product Manager, EC2, and Kinnar Sen, Sr. Specialist Solution Architect, AWS Compute.

Amazon EC2 Auto Scaling helps customers optimize their Amazon EC2 capacity by dynamically responding to varying demand. Based on customer feedback, we enhanced the scaling experience with the launch of predictive scaling policies. Predictive scaling proactively adds EC2 instances to your Auto Scaling group in anticipation of demand spikes. This results in better availability and performance for your applications that have predictable demand patterns and long initialization times. We recently launched a couple of features designed to help you assess the value of predictive scaling – prescriptive recommendations on whether to use predictive scaling based on its potential availability and cost impact, and integration with Amazon CloudWatch to continuously monitor the accuracy of predictions. In this post, we discuss the features in detail and the steps that you can easily adopt to enjoy the benefits of predictive scaling.

Recap: Predictive Scaling

EC2 Auto Scaling helps customers maintain application availability by managing the capacity and health of the underlying cluster. Prior to predictive scaling, EC2 Auto Scaling offered dynamic scaling policies such as target tracking and step scaling. These dynamic scaling policies are configured with an Amazon CloudWatch metric that represents an application’s load. EC2 Auto Scaling constantly monitors this metric and responds according to your policies, thereby triggering the launch or termination of instances. Although it’s extremely effective and widely used, this model is reactive in nature, and for larger spikes, may lead to unfulfilled capacity momentarily as the cluster is scaling out. Customers mitigate this by adopting aggressive scale out and conservative scale in to manage the additional buffer of instances. However, sometimes applications take a long time to initialize or have a recurring pattern with a sudden spike of high demand. These can have an impact on the initial response of the system when it is scaling out. Customers asked for a proactive scaling mechanism that can scale capacity ahead of predictable spikes, and so we delivered predictive scaling.

Predictive scaling was launched to make the scaling action proactive as it anticipates the changes required in the compute demand and scales accordingly. The scaling action is determined by ensemble machine learning (ML) built with data from your Auto Scaling group’s scaling patterns, as well as billions of data points from our observations. Predictive scaling should be used for applications where demand changes rapidly but with a recurring pattern, instances require a long time to initialize, or where you’re manually invoking scheduled scaling for routine demand patterns. Predictive scaling not only forecasts capacity requirements based on historical usage, but also learns continuously, thereby making forecasts more accurate with time. Furthermore, predictive scaling policy is designed to only scale out and not scale in your Auto Scaling groups, eliminating the risk of ending with lesser capacity because of inexact predictions. You must use dynamic scaling policy, scheduled scaling, or your own custom mechanism for scale-ins. In case of exceptional demand spikes, this addition of dynamic scaling policy can also improve your application performance by bridging the gap between demand and predicted capacity.

What’s new with predictive scaling

Predictive scaling policies can be configured in a non-mutative ‘Forecast Only’ mode to evaluate the accuracy of forecasts. When you’re ready to start scaling, you can switch to the ‘Forecast and Scale’ mode. Now we prescriptively recommend whether your policy should be switched to ‘Forecast and Scale’ mode if it can potentially lead to better availability and lower costs, saving you the time and effort of doing such an evaluation manually. You can test different configurations by creating multiple predictive scaling policies in ‘Forecast Only’ mode, and choose the one that performs best in terms of availability and cost improvements.

Monitoring and observability are key elements of AWS Well Architected Framework. Now we also offer CloudWatch metrics for your predictive scaling policies so that that you can programmatically monitor your predictive scaling policy for demand pattern changes or prolonged periods of inaccurate predictions. This will enable you to monitor the key performance metrics and make it easier to adopt AWS Well-Architected best practices.

In the following sections, we deep dive into the details of these two features.

Recommendations for predictive scaling

Once you set up an Auto Scaling group with predictive scaling policy in Forecast Only mode as explained in this introduction to predictive scaling blog post , you can review the results of the forecast visually and adjust any parameters to more accurately reflect the behavior that you desire. Evaluating simply on the basis of visualization may not be very intuitive if the scaling patterns are erratic. Moreover, if you keep higher minimum capacities, then the graph may show a flat line for the actual capacity as your Auto Scaling group capacity is an outcome of existing scaling policy configurations and the minimum capacity that you configured. This makes it difficult to contemplate whether the lower capacity predicted by predictive scaling wouldn’t leave your Auto Scaling group under-scaled.

This new feature provides a prescriptive guidance to switch on predictive scaling in Forecast and Scale mode based on the factors of availability and cost savings. To determine the availability and cost savings, we compare the predictions against the actual capacity and the optimal, required capacity. This required capacity is inferred based on whether your instances were running at a higher or lower value than the target value for scaling metric that you defined as part of the predictive scaling policy configuration. For example, if an Auto Scaling group is running 10 instances at 20% CPU Utilization while the target defined in predictive scaling policy is 40%, then the instances are running under-utilized by 50% and the required capacity is assumed to be 5 instances (half of your current capacity). For an Auto Scaling group, based on the time range in which you’re interested (two weeks as default), we aggregate the cost saving and availability impact of predictive scaling. The availability impact measures for the amount of time that the actual metric value was higher than the target value that you defined to be optimal for each policy. Similarly, cost savings measures the aggregated savings based on the capacity utilization of the underlying Auto Scaling group for each defined policy. The final cost and availability will lead us to a recommendation based on:

  • If availability increases (or remains same) and cost reduces (or remains same), then switch on Forecast and Scale
  • If availability reduces, then disable predictive scaling
  • If availability increase comes at an increased cost, then the customer should take the call based on their cost-availability tradeoff threshold

This figure shows the console view of how the recommendations look like on the Auto Scaling console. For each policy we make prescriptive recommendation of whether to switch to Forecast And Scale mode along with whether doing so can lead to better availability and lower costFigure 1: Predictive Scaling Recommendations on EC2 Auto Scaling console

The preceding figure shows how the console reflects the recommendation for a predictive scaling policy. You get information on whether the policy can lead to higher availability and lower cost, which leads to a recommendation to switch to Forecast and Scale. To achieve this cost saving, you might have to lower your minimum capacity and aim for higher utilization in dynamic scaling policies.

To get the most value from this feature, we recommend that you create multiple predictive scaling policies in Forecast Only mode with different configurations, choosing different metrics and/or different target values. Target value is an important lever that changes how aggressive the capacity forecasts must be. A lower target value increases your capacity forecast resulting in better availability for your application. However, this also means more dollars to be spent on the Amazon EC2 cost. Similarly, a higher target value can leave you under-scaled while reactive scaling bridges the gap in just a few minutes. Separate estimates of cost and availability impact are provided for each of the predictive scaling policies. We recommend using a policy if either availability or cost are improved and the other variable improves or stays the same. As long as there is a predictable pattern, Auto Scaling enhanced with predictive scaling maintains high availability for your applications.

Continuous Monitoring of predictive scaling

Once you’re using a predictive scaling policy in Forecast and Scale mode based on the recommendation, you must monitor the predictive scaling policy for demand pattern changes or inaccurate predictions. We introduced two new CloudWatch Metrics for predictive scaling called ‘PredictiveScalingLoadForecast’ and ‘PredictiveScalingCapacityForecast’. Using CloudWatch mertic math feature, you can create a customized metric that measures the accuracy of predictions. For example, to monitor whether your policy is over or under-forecasting, you can publish separate metrics to measure the respective errors. In the following graphic, we show how the metric math expressions can be used to create a Mean Absolute Error for over-forecasting on the load forecasts. Because predictive scaling can only increase capacity, it is useful to alert when the policy is excessively over-forecasting to prevent unnecessary cost.This figure shows the CloudWatch graph of three metrics – the total CPU Utilization of the Auto Scaling group, the load forecast generated by predictive scaling, and the derived metric using metric math that measures error for over-forecastingFigure 2: Graphing an accuracy metric using metric math on CloudWatch

In the previous graph, the total CPU Utilization of the Auto Scaling group is represented by m1 metric in orange color while the predicted load by the policy is represented by m2 metric in green color. We used the following expression to get the ratio of over-forecasting error with respect to the actual value.

IF((m2-m1)>0, (m2-m1),0))/m1

Next, we will setup an alarm to automatically send notifications using Amazon Simple Notification Service (Amazon SNS). You can create similar accuracy monitoring for capacity forecasts, but remember that once the policy is in Forecast and Scale mode, it already starts influencing the actual capacity. Hence, putting alarms on load forecast accuracy might be more intuitive as load is generally independent of the capacity of an Auto Scaling group.

This figure shows creation of alarm when 10 out of 12 data points breach 0.02 threshold for the accuracy metricFigure 3: Creating a CloudWatch Alarm on the accuracy metric

In the above screenshot, we have set an alarm that triggers when our custom accuracy metric goes above 0.02 (20%) for 10 out of last 12 data points which translates to 10 hours of the last 12 hours. We prefer to alarm on a greater number of data points so that we get notified only when predictive scaling is consistently giving inaccurate results.

Conclusion

With these new features, you can make a more informed decision about whether predictive scaling is right for you and which configuration makes the most sense. We recommend that you start off with Forecast Only mode and switch over to Forecast and Scale based on the recommendations. Once in Forecast and Scale mode, predictive scaling starts taking proactive scaling actions so that your instances are launched and ready to contribute to the workload in advance of the predicted demand. Then continuously monitor the forecast to maintain high availability and cost optimization of your applications. You can also use the new predictive scaling metrics and CloudWatch features, such as metric math, alarms, and notifications, to monitor and take actions when predictions are off by a set threshold for prolonged periods.

Build a serverless analytics application with Amazon Redshift and Amazon API Gateway

Post Syndicated from David Zhang original https://aws.amazon.com/blogs/big-data/build-a-serverless-analytics-application-with-amazon-redshift-and-amazon-api-gateway/

Serverless applications are a modernized way to perform analytics among business departments and engineering teams. Business teams can gain meaningful insights by simplifying their reporting through web applications and distributing it to a broader audience.

Use cases can include the following:

  • Dashboarding – A webpage consisting of tables and charts where each component can offer insights to a specific business department.
  • Reporting and analysis – An application where you can trigger large analytical queries with dynamic inputs and then view or download the results.
  • Management systems – An application that provides a holistic view of the internal company resources and systems.
  • ETL workflows – A webpage where internal company individuals can trigger specific extract, transform, and load (ETL) workloads in a user-friendly environment with dynamic inputs.
  • Data abstraction – Decouple and refactor underlying data structure and infrastructure.
  • Ease of use – An application where you want to give a large set of user-controlled access to analytics without having to onboard each user to a technical platform. Query updates can be completed in an organized manner and maintenance has minimal overhead.

In this post, you will learn how to build a serverless analytics application using Amazon Redshift Data API and Amazon API Gateway WebSocket and REST APIs.

Amazon Redshift is fully managed by AWS, so you no longer need to worry about data warehouse management tasks such as hardware provisioning, software patching, setup, configuration, monitoring nodes and drives to recover from failures, or backups. The Data API simplifies access to Amazon Redshift because you don’t need to configure drivers and manage database connections. Instead, you can run SQL commands to an Amazon Redshift cluster by simply calling a secured API endpoint provided by the Data API. The Data API takes care of managing database connections and buffering data. The Data API is asynchronous, so you can retrieve your results later.

API Gateway is a fully managed service that makes it easy for developers to publish, maintain, monitor, and secure APIs at any scale. With API Gateway, you can create RESTful APIs and WebSocket APIs that enable real-time two-way communication applications. API Gateway supports containerized and serverless workloads, as well as web applications. API Gateway acts as a reverse proxy to many of the compute resources that AWS offers.

Event-driven model

Event-driven applications are increasingly popular among customers. Analytical reporting web applications can be implemented through an event-driven model. The applications run in response to events such as user actions and unpredictable query events. Decoupling the producer and consumer processes allows greater flexibility in application design and building decoupled processes. This design can be achieved with the Data API and API Gateway WebSocket and REST APIs.

Both REST API calls and WebSocket establish communication between the client and the backend. Due to the popularity of REST, you may wonder why WebSockets are present and how they contribute to an event-driven design.

What are WebSockets and why do we need them?

Unidirectional communication is customary when building analytical web solutions. In traditional environments, the client initiates a REST API call to run a query on the backend and either synchronously or asynchronously waits for the query to complete. The “wait” aspect is engineered to apply the concept of polling. Polling in this context is when the client doesn’t know when a backend process will complete. Therefore, the client will consistently make a request to the backend and check.

What is the problem with polling? Main challenges include the following:

  • Increased traffic in your network bandwidth – A large number of users performing empty checks will impact your backend resources and doesn’t scale well.
  • Cost usage – Empty requests don’t deliver any value to the business. You pay for the unnecessary cost of resources.
  • Delayed response – Polling is scheduled in time intervals. If the query is complete in-between these intervals, the user can only see the results after the next check. This delay impacts the user experience and, in some cases, may result in UI deadlocks.

For more information on polling, check out From Poll to Push: Transform APIs using Amazon API Gateway REST APIs and WebSockets.

WebSockets is another approach compared to REST when establishing communication between the front end and backend. WebSockets enable you to create a full duplex communication channel between the client and the server. In this bidirectional scenario, the client can make a request to the server and is notified when the process is complete. The connection remains open, with minimal network overhead, until the response is received.

You may wonder why REST is present, since you can transfer response data with WebSockets. A WebSocket is a light weight protocol designed for real-time messaging between systems. The protocol is not designed for handling large analytical query data and in API Gateway, each frame’s payload can only hold up to 32 KB. Therefore, the REST API performs large data retrieval.

By using the Data API and API Gateway, you can build decoupled event-driven web applications for your data analytical needs. You can create WebSocket APIs with API Gateway and establish a connection between the client and your backend services. You can then initiate requests to perform analytical queries with the Data API. Due to the Data API’s asynchronous nature, the query completion generates an event to notify the client through the WebSocket channel. The client can decide to either retrieve the query results through a REST API call or perform other follow-up actions. The event-driven architecture enables bidirectional interoperable messages and data while keeping your system components agnostic.

Solution overview

In this post, we show how to create a serverless event-driven web application by querying with the Data API in the backend, establishing a bidirectional communication channel between the user and the backend with the WebSocket feature in API Gateway, and retrieving the results using its REST API feature. Instead of designing an application with long-running API calls, you can use the Data API. The Data API allows you to run SQL queries asynchronously, removing the need to hold long, persistent database connections.

The web application is protected using Amazon Cognito, which is used to authenticate the users before they can utilize the web app and also authorize the REST API calls when made from the application.

Other relevant AWS services in this solution include AWS Lambda and Amazon EventBridge. Lambda is a serverless, event-driven compute resource that enables you to run code without provisioning or managing servers. EventBridge is a serverless event bus allowing you to build event-driven applications.

The solution creates a lightweight WebSocket connection between the browser and the backend. When a user submits a request using WebSockets to the backend, a query is submitted to the Data API. When the query is complete, the Data API sends an event notification to EventBridge. EventBridge signals the system that the data is available and notifies the client. Afterwards, a REST API call is performed to retrieve the query results for the client to view.

We have published this solution on the AWS Samples GitHub repository and will be referencing it during the rest of this post.

The following architecture diagram highlights the end-to-end solution, which you can provision automatically with AWS CloudFormation templates run as part of the shell script with some parameter variables.

The application performs the following steps (note the corresponding numbered steps in the process flow):

  1. A web application is provisioned on AWS Amplify; the user needs to sign up first by providing their email and a password to access the site.
  2. The user verifies their credentials using a pin sent to their email. This step is mandatory for the user to then log in to the application and continue access to the other features of the application.
  3. After the user is signed up and verified, they can sign in to the application and requests data through their web or mobile clients with input parameters. This initiates a WebSocket connection in API Gateway. (Flow 1, 2)
  4. The connection request is handled by a Lambda function, OnConnect, which initiates an asynchronous database query in Amazon Redshift using the Data API. The SQL query is taken from a SQL script in Amazon Simple Storage Service (Amazon S3) with dynamic input from the client. (Flow 3, 4, 6, 7)
  5. In addition, the OnConnect Lambda function stores the connection, statement identifier, and topic name in an Amazon DynamoDB database. The topic name is an extra parameter that can be used if users want to implement multiple reports on the same webpage. This allows the front end to map responses to the correct report. (Flow 3, 4, 5)
  6. The Data API runs the query, mentioned in step 2. When the operation is complete, an event notification is sent to EventBridge. (Flow 8)
  7. EventBridge activates an event rule to redirect that event to another Lambda function, SendMessage. (Flow 9)
  8. The SendMessage function notifies the client that the SQL query is complete via API Gateway. (Flow 10, 11, 12)
  9. After the notification is received, the client performs a REST API call (GET) to fetch the results. (Flow 13, 14, 15, 16)
  10. The GetResult function is triggered, which retrieves the SQL query result and returns it to the client.
  11. The user is now able to view the results on the webpage.
  12. When clients disconnect from their browser, API Gateway automatically deletes the connection information from the DynamoDB table using the onDisconnect function. (Flow 17, 18,19)

Prerequisites

Prior to deploying your event-driven web application, ensure you have the following:

  • An Amazon Redshift cluster in your AWS environment – This is your backend data warehousing solution to run your analytical queries. For instructions to create your Amazon Redshift cluster, refer to Getting started with Amazon Redshift.
  • An S3 bucket that you have access to – The S3 bucket will be your object storage solution where you can store your SQL scripts. To create your S3 bucket, refer to Create your first S3 bucket.

Deploy CloudFormation templates

The code associated to the design is available in the following GitHub repository. You can clone the repository inside an AWS Cloud9 environment in our AWS account. The AWS Cloud9 environment comes with AWS Command Line Interface (AWS CLI) installed, which is used to run the CloudFormation templates to set up the AWS infrastructure. Make sure that the jQuery library is installed; we use it to parse the JSON output during the run of the script.

The complete architecture is set up using three CloudFormation templates:

  • cognito-setup.yaml – Creates the Amazon Cognito user pool to web app client, which is used for authentication and protecting the REST API
  • backend-setup.yaml – Creates all the required Lambda functions and the WebSocket and Rest APIs, and configures them on API Gateway
  • webapp-setup.yaml – Creates the web application hosting using Amplify to connect and communicate with the WebSocket and Rest APIs.

These CloudFormation templates are run using the script.sh shell script, which takes care of all the dependencies as required.

A generic template is provided for you to customize your own DDL SQL scripts as well as your own query SQL scripts. We have created sample scripts for you to follow along.

  1. Download the sample DDL script and upload it to an existing S3 bucket.
  2. Change the IAM role value to your Amazon Redshift cluster’s IAM role with permissions to AmazonS3ReadOnlyAccess.

For this post, we copy the New York Taxi Data 2015 dataset from a public S3 bucket.

  1. Download the sample query script and upload it to an existing S3 bucket.
  2. Upload the modified sample DDL script and the sample query script into a preexisting S3 bucket that you own, and note down the S3 URI path.

If you want to run your own customized version, modify the DDL and query script to fit your scenario.

  1. Edit the script.sh file before you run it and set the values for the following parameters:
    • RedshiftClusterEndpoint (aws_redshift_cluster_ep) – Your Amazon Redshift cluster endpoint available on the AWS Management Console
    • DBUsername (aws_dbuser_name) – Your Amazon Redshift database user name
    • DDBTableName (aws_ddbtable_name) – The name of your DynamoDB table name that will be created
    • WebsocketEndpointSSMParameterName (aws_wsep_param_name) – The parameter name that stores the WebSocket endpoint in AWS Systems Manager Parameter Store.
    • RestApiEndpointSSMParameterName (aws_rapiep_param_name) – The parameter name that stores the REST API endpoint in Parameter Store.
    • DDLScriptS3Path (aws_ddl_script_path) – The S3 URI to the DDL script that you uploaded.
    • QueryScriptS3Path (aws_query_script_path) – The S3 URI to the query script that you uploaded.
    • AWSRegion (aws_region) – The Region where the AWS infrastructure is being set up.
    • CognitoPoolName (aws_user_pool_name) – The name you want to give to your Amazon Cognito user pool
    • ClientAppName (aws_client_app_name) – The name of the client app to be configured for the web app to handle the user authentication for the users

The default acceptable values are already provided as part of the downloaded code.

  1. Run the script using the following command:
./script.sh

During deployment, AWS CloudFormation creates and triggers the Lambda function SetupRedshiftLambdaFunction, which sets up an Amazon Redshift database table and populates data into the table. The following diagram illustrates this process.

Use the demo app

When the shell script is complete, you can start interacting with the demo web app:

  1. On the Amplify console, under All apps in the navigation pane, choose DemoApp.
  2. Choose Run build.

The DemoApp web application goes through a phase of Provision, Build, Deploy.

  1. When it’s complete, use the URL provided to access the web application.

The following screenshot shows the web application page. It has minimal functionality: you can sign in, sign up, or verify a user.

  1. Choose Sign Up.

  1. For Email ID, enter an email.
  2. For Password, enter a password that is at least eight characters long, has at least one uppercase and lowercase letter, at least one number, and at least one special character.
  3. Choose Let’s Enroll.

The Verify your Login to Demo App page opens.

  1. Enter your email and the verification code sent to the email you specified.
  2. Choose Verify.


You’re redirected to a login page.

  1. Sign in using your credentials.

You’re redirected to the demoPage.html website.

  1. Choose Open Connection.

You now have an active WebSocket connection between your browser and your backend AWS environment.

  1. For Trip Month, specify a month (for this example, December) and choose Submit.

You have now defined the month and year you want to query your data upon. After a few seconds, you can to see the output delivered from the WebSocket.

You may continue using the active WebSocket connection for additional queries—just choose a different month and choose Submit again.

  1. When you’re done, choose Close Connection to close the WebSocket connection.

For exploratory purposes, while your WebSocket connection is active, you can navigate to your DynamoDB table on the DynamoDB console to view the items that are currently stored. After the WebSocket connection is closed, the items stored in DynamoDB are deleted.

Clean up

To clean up your resources, complete the following steps:

  1. On the Amazon S3 console, navigate to the S3 bucket containing the sample DDL script and query script and delete them from the bucket.
  2. On the Amazon Redshift console, navigate to your Amazon Redshift cluster and delete the data you copied over from the sample DDL script.
    1. Run truncate nyc_yellow_taxi;
    2. Run drop table nyc_yellow_taxi;
  3. On the AWS CloudFormation console, navigate to the CloudFormation stacks and choose Delete. Delete the stacks in the following order:
    1. WebappSetup
    2. BackendSetup
    3. CognitoSetup

All resources created in this solution will be deleted.

Monitoring

You can monitor your event-driven web application events, user activity, and API usage with Amazon CloudWatch and AWS CloudTrail. Most areas of this solution already have logging enabled. To view your API Gateway logs, you can turn on CloudWatch Logs. Lambda comes with default logging and monitoring and can be accessed with CloudWatch.

Security

You can secure access to the application using Amazon Cognito, which is a developer-centric and cost-effective customer authentication, authorization, and user management solution. It provides both identity store and federation options that can scale easily. Amazon Cognito supports logins with social identity providers and SAML or OIDC-based identity providers, and supports various compliance standards. It operates on open identity standards (OAuth2.0, SAML 2.0, and OpenID Connect). You can also integrate it with API Gateway to authenticate and authorize the REST API calls either using the Amazon Cognito client app or a Lambda function.

Considerations

The nature of this application includes a front-end client initializing SQL queries to Amazon Redshift. An important component to consider are potential malicious activities that the client can perform, such as SQL injections. With the current implementation, that is not possible. In this solution, the SQL queries preexist in your AWS environment and are DQL statements (they don’t alter the data or structure). However, as you develop this application to fit your business, you should evaluate these areas of risk.

AWS offers a variety of security services to help you secure your workloads and applications in the cloud, including AWS Shield, AWS Network Firewall, AWS Web Application Firewall, and more. For more information and a full list, refer to Security, Identity, and Compliance on AWS.

Cost optimization

The AWS services that the CloudFormation templates provision in this solution are all serverless. In terms of cost optimization, you only pay for what you use. This model also allows you to scale without manual intervention. Review the following pages to determine the associated pricing for each service:

Conclusion

In this post, we showed you how to create an event-driven application using the Amazon Redshift Data API and API Gateway WebSocket and REST APIs. The solution helps you build data analytical web applications in an event-driven architecture, decouple your application, optimize long-running database queries processes, and avoid unnecessary polling requests between the client and the backend.

You also used severless technologies, API Gateway, Lambda, DynamoDB, and EventBridge. You didn’t have to manage or provision any servers throughout this process.

This event-driven, serverless architecture offers greater extensibility and simplicity, making it easier to maintain and release new features. Adding new components or third-party products is also simplified.

With the instructions in this post and the generic CloudFormation templates we provided, you can customize your own event-driven application tailored to your business. For feedback or contributions, we welcome you to contact us through the AWS Samples GitHub Repository by creating an issue.


About the Authors

David Zhang is an AWS Data Architect in Global Financial Services. He specializes in designing and implementing serverless analytics infrastructure, data management, ETL, and big data systems. He helps customers modernize their data platforms on AWS. David is also an active speaker and contributor to AWS conferences, technical content, and open-source initiatives. During his free time, he enjoys playing volleyball, tennis, and weightlifting. Feel free to connect with him on LinkedIn.

Manash Deb is a Software Development Manager in the AWS Directory Service team. With over 18 years of software dev experience, his passion is designing and delivering highly scalable, secure, zero-maintenance applications in the AWS identity and data analytics space. He loves mentoring and coaching others and to act as a catalyst and force multiplier, leading highly motivated engineering teams, and building large-scale distributed systems.

Pavan Kumar Vadupu Lakshman Manikya is an AWS Solutions Architect who helps customers design robust, scalable solutions across multiple industries. With a background in enterprise architecture and software development, Pavan has contributed in creating solutions to handle API security, API management, microservices, and geospatial information system use cases for his customers. He is passionate about learning new technologies and solving, automating, and simplifying customer problems using these solutions.

Introducing AWS Lambda runtime management controls

Post Syndicated from Julian Wood original https://aws.amazon.com/blogs/compute/introducing-aws-lambda-runtime-management-controls/

This blog post is written by Jonathan Tuliani, Principal Product Manager.

Today, AWS Lambda is announcing runtime management controls which provide more visibility and control over when Lambda applies runtime updates to your functions. Lambda is also changing how it rolls out automatic runtime updates to your functions. Together, these changes provide more flexibility in how you take advantage of the latest runtime features, performance improvements, and security updates.

By default, all functions will continue to receive automatic runtime updates. You do not need to change how you use Lambda to continue to benefit from the security and operational simplicity of the managed runtimes Lambda provides. The runtime controls are optional capabilities for advanced customers that require more control over their runtime changes.

This post explains what new runtime management controls are available and how you can take advantage of this new capability.

Overview

For each runtime, Lambda provides a managed execution environment. This includes the underlying Amazon Linux operating system, programming language runtime, and AWS SDKs. Lambda takes on the operational burden of applying patches and security updates to all these components. Customers tell us how much they appreciate being able to deploy a function and leave it, sometimes for years, without having to apply patches. With Lambda, patching ‘just works’, automatically.

Lambda strives to provide updates which are backward compatible with existing functions. However, as with all software patching, there are rare cases where a patch can expose an underlying issue with an existing function that depends on the previous behavior. For example, consider a bug in one of the runtime OS packages. Applying a patch to fix the bug is the right choice for the vast majority of customers and functions. However, in rare cases, a function may depend on the previous (incorrect) behavior. Customers with critical workloads running in Lambda tell us they would like a way to further mitigate even this slight risk of disruption.

With the launch of runtime management controls, Lambda now offers three new capabilities. First, Lambda provides visibility into which patch version of a runtime your function is using and when runtime updates are applied. Second, you can optionally synchronize runtime updates with function deployments. This provides you with control over when Lambda applies runtime updates and enables early detection of rare runtime update incompatibilities. Third, in the rare case where a runtime update incompatibility occurs, you can roll back your function to an earlier runtime version. This keeps your function working and minimizes disruption, providing time to remedy the incompatibility before returning to the latest runtime version.

Runtime identifiers and runtime versions

Lambda runtimes define the components of the execution environment in which your function code runs. This includes the OS, programming language runtime, environment variables, and certificates. For Python, Node.js and Ruby, the runtime also includes the AWS SDK. Each Lambda runtime has a unique runtime identifier, for example, nodejs18.x, or python3.9. Each runtime identifier represents a distinct major release of the programming language.

Runtime management controls introduce the concept of Lambda runtime versions. A runtime version is an immutable version of a particular runtime. Each Lambda runtime, such as Node.js 16, or Python 3.9, starts with an initial runtime version. Every time Lambda updates the runtime, it adds a new runtime version to that runtime. These updates cover all runtime components (OS, language runtime, etc.) and therefore use a Lambda-defined numbering scheme, independent of the version numbers used by the programming language. For each runtime version, Lambda also publishes a corresponding base image for customers who package their functions as container images.

New runtime identifiers represent a major release for the programming language, and sometimes other runtime components, such as the OS or SDK. Lambda cannot guarantee compatibility between runtime identifiers, although most times you can upgrade your functions with little or no modification. You control when you upgrade your functions to a new runtime identifier. In contrast, new runtime versions for the same runtime identifier have a very high level of backward compatibility with existing functions. By default, Lambda automatically applies runtime updates by moving functions from the previous runtime version to a newer runtime version.

Each runtime version has a version number, and an Amazon Resource Name (ARN). You can view the version in a new platform log line, INIT_START. Lambda emits this log line each time it creates a new execution environment during the cold start initialization process.

INIT_START Runtime Version: python:3.9.v14	Runtime Version ARN: arn:aws:lambda:eu-south-1::runtime:7b620fc2e66107a1046b140b9d320295811af3ad5d4c6a011fad1fa65127e9e6I

INIT_START Runtime Version: python:3.9.v14 Runtime Version ARN: arn:aws:lambda:eu-south-1::runtime:7b620fc2e66107a1046b140b9d320295811af3ad5d4c6a011fad1fa65127e9e6I

Runtime versions improve visibility into managed runtime updates. You can use the INIT_START log line to identify when the function transitions from one runtime version to another. This helps you investigate whether a runtime update might have caused any unexpected behavior of your functions. Changes in behavior caused by runtime updates are very rare. If your function isn’t behaving as expected, by far the most likely cause is an error in the function code or configuration.

Runtime management modes

With runtime management controls, you now have more control over when Lambda applies runtime updates to your functions. You can now specify a runtime management configuration for each function. You can set the runtime management configuration independently for $LATEST and each published function version.

You can specify one of three runtime update modes: auto, function update, or manual. The runtime update mode controls when Lambda updates the function version to a new runtime version. By default, all functions receive runtime updates automatically, the alternatives are for advanced users in specific cases.

Automatic

Auto updates are the default, and are the right choice for most customers to ensure that you continue to benefit from runtime version updates. They help minimize your operational overheads by letting Lambda take care of runtime updates.

While Lambda has always provided automatic runtime updates, this release includes a change to how automatic runtime updates are rolled out. Previously, Lambda applied runtime updates to all functions in each region, following a region-by-region deployment sequence. With this release, functions configured to use the auto runtime update mode now receive runtime updates in two phases. Initially, Lambda only applies a new runtime version to newly created or updated functions. After this initial period is complete, Lambda then applies the runtime update to any remaining functions configured to use the auto runtime update mode.

This two-phase rollout synchronizes runtime updates with function updates for customers who are actively developing their functions. This makes it easier to detect and respond to any unexpected changes in behavior. For functions not in active development, auto mode continues to provide the operational benefits of fully automatic runtime updates.

Function update

In function update mode, Lambda updates your function to the latest available runtime version whenever you change your function code or configuration. This is the same as the first phase of auto mode. The difference is that, in auto mode, there is a second phase when Lambda applies runtime updates to functions which have not been changed. In function update mode, if you do not change a function, it continues to use the current runtime version indefinitely. This means that when using function update mode, you must update your functions regularly to keep their runtimes up-to-date. If you do not update a function regularly, you should use the auto runtime update mode.

Synchronizing runtime updates with function deployments gives you control over when Lambda applies runtime updates. For example, you can avoid applying updates during business-critical events, such as a product launch or holiday sales.

When used with CI/CD pipelines, function update mode enables early detection and mitigation in the rare event of a runtime update incompatibility. This is especially effective if you create a new published function version with each deployment. Each published function version captures a static copy of the function code and configuration, so that you can roll back to a previously published function version if required. Using function update mode extends the published function version to also capture the runtime version. This allows you to synchronize rollout and rollback of the entire Lambda execution environment, including function code, configuration, and runtime version.

Manual

Consider the rare event that a runtime update is incompatible with one of your functions. With runtime management controls, you can now roll back to an earlier runtime version. This keeps your function working and minimizes disruption, giving you time to remedy the incompatibility before returning to the latest runtime version.

There are two ways to implement a runtime version rollback. You can use function update mode with a published function version to synchronize the rollback of code, configuration, and runtime version. Or, for functions using the default auto runtime update mode, you can roll back your runtime version by using manual mode.

The manual runtime update mode provides you with full control over which runtime version your function uses. When enabling manual mode, you must specify the ARN of the runtime version to use, which you can find from the INIT_START log line.

Lambda does not impose a time limit on how long you can use any particular runtime version. However, AWS strongly recommends using manual mode only for short-term remediation of code incompatibilities. Revert your function back to auto mode as soon as you resolve the issue. Functions using the same runtime version for an extended period may eventually stop working due to, for example, a certificate expiry.

Using runtime management controls

You can configure runtime management controls via the Lambda AWS Management Console and AWS Command Line Interface (AWS CLI). You can also use infrastructure as code tools such as AWS CloudFormation and the AWS Serverless Application Model (AWS SAM).

Console

From the Lambda console, navigate to a specific function. You can find runtime management controls on the Code tab, in the Runtime settings panel. Expand Runtime management configuration to view the current runtime update mode and runtime version ARN.

Runtime settings

Runtime settings

To change runtime update mode, select Edit runtime management configuration. You can choose between automatic, function update, and manual runtime update modes.

Edit runtime management configuration (Auto)

Edit runtime management configuration (Auto)

In manual mode, you must also specify the runtime version ARN.

Edit runtime management configuration (Manual)

Edit runtime management configuration (Manual)

AWS SAM

AWS SAM is an open-source framework for building serverless applications. You can specify runtime management settings using the RuntimeManagementConfig property.

Resources:
  HelloWorldFunction:
    Type: AWS::Serverless::Function
    Properties:
      Handler: lambda_function.handler
      Runtime: python3.9
      RuntimeManagementConfig:
        UpdateOn: Manual
        RuntimeVersionArn: arn:aws:lambda:eu-west-1::runtime:7b620fc2e66107a1046b140b9d320295811af3ad5d4c6a011fad1fa65127e9e6

AWS CLI

You can also manage runtime management settings using the AWS CLI. You configure runtime management controls via a dedicated command aws lambda put-runtime-management-config, rather than aws lambda update-function-configuration.

aws lambda put-runtime-management-config --function-name <function_arn> --update-runtime-on Manual --runtime-version-arn <runtime_version_arn>

To view the existing runtime management configuration, use aws lambda get-runtime-management-config.

aws lambda get-runtime-management-config --function-name <function_arn>

The current runtime version ARN is also returned by aws lambda get-function and aws lambda get-function-configuration.

Conclusion

Runtime management controls provide more visibility and flexibility over when and how Lambda applies runtime updates to your functions. You can specify one of three update modes: auto, function update, or manual. These modes allow you to continue to take advantage of Lambda’s automatic patching, synchronize runtime updates with your deployments, and rollback to an earlier runtime version in the rare event that a runtime update negatively impacts your function.

For more information on runtime management controls, see our documentation page.

For more serverless learning resources, visit Serverless Land.

Managing Dev Environments with Amazon CodeCatalyst

Post Syndicated from Ryan Bachman original https://aws.amazon.com/blogs/devops/managing-dev-environments-with-amazon-codecatalyst/

An Amazon CodeCatalyst Dev Environment is a cloud-based development environment that you can use in CodeCatalyst to quickly work on the code stored in the source repositories of your project. The project tools and application libraries included in your Dev Environment are defined by a devfile in the source repository of your project.

Introduction

In the previous CodeCatalyst post, Team Collaboration with Amazon CodeCatalyst, I focused on CodeCatalyst’s collaboration capabilities and how that related to The Unicorn Project’s main protaganist. At the beginning of Chapter 2, Maxine is struggling to configure her development environment. She is two days into her new job and still cannot build the application code. She has identified over 100 dependencies she is missing. The documentation is out of date and nobody seems to know where the dependencies are stored. I can sympathize with Maxine. In this post, I will focus on managing development environments to show how CodeCatalyst removes the burden of managing workload specific configurations and produces reliable on-demand development environments.

Prerequisites

If you would like to follow along with this walkthrough, you will need to:

Have an AWS Builder ID for signing in to CodeCatalyst.

Belong to a space and have the space administrator role assigned to you in that space. For more information, see Creating a space in CodeCatalystManaging members of your space, and Space administrator role.

Have an AWS account associated with your space and have the IAM role in that account. For more information about the role and role policy, see Creating a CodeCatalyst service role.

Walkthrough

As with the previous posts in our CodeCatalyst series, I am going to use the Modern Three-tier Web Application blueprint.  Blueprints provide sample code and CI/CD workflows to help make getting started easier across different combinations of programming languages and architectures. To follow along, you can re-use a project you created previously, or you can refer to a previous post that walks through creating a project using the blueprint.

One of the most difficult aspects of my time spent as a developer was finding ways to quickly contribute to a new project. Whenever I found myself working on a new project, getting to the point where I could meaningfully contribute to a project’s code base was always more difficult than writing the actual code. A major contributor to this inefficiency, was the lack of process managing my local development environment. I will be exploring how CodeCatalyst can help solve this challenge.  For this walkthrough, I want to add a new test that will allow local testing of Amazon DynamoDB. To achieve this, I will use a CodeCatalyst dev environment.

CodeCatalyst Dev Environments are managed cloud-based development environments that you can use to access and modify code stored in a source repository. You can launch a project specific dev environment that will automate check-out of your project’s repo or you can launch an empty environment to use for accessing third-party source providers.  You can learn more about CodeCatalyst Dev Environments in the CodeCatalyst User Guide.

CodeCatalyst user interface showing Create Dev Environment

Figure 1. Creating a new Dev Environment

To begin, I navigate to the Dev Environments page under the Code section of the navigaiton menu.  I then use the Create Dev Environment to launch my environment.  For this post, I am using the AWS Cloud9 IDE, but you can follow along with the IDE you are most comfortable using.  In the next screen, I select Work in New Branch and assign local_testing for the new branch name, and I am branching from main.  I leave the remaining default options and Create.

Create Dev Environment user interface with work in a new branch selected

Figure 2. Dev Environment Create Options

After waiting less than a minute, my IDE is ready in a new tab and I am ready to begin work.  The first thing I see in my dev environment is an information window asking me if I want to navigate to the Dev Environment Settings.  Because I need to enable local testing of Dynamodb, not only for myself, but other developers that will collaborate on this project, I need to update the project’s devfile.  I select to navigate to the settings tab because I know that contains information on the project’s devfile and allows me to access the file to edit.

AWS Toolkit prompting to Open Dev Environment Settings.

Figure 3. Toolkit Welcome Banner

Devfiles allow you to model a Dev Environment’s configuration and dependencies so that you can re-produce consisent Dev Environments and reduce the manual effort in setting up future environments.  The tools and application libraries included in your Dev Environment are defined by the devfile in the source repository of your project.  Since this project was created from a blueprint, there is one provided.  For blank projects, a default CodeCatalyst devfile is created when you first launch an environment.  To learn more about the devfile, see https://devfile.io.

In the settings tab, I find a link to the devfile that is configured.  When I click the edit button, a new file tab launches and I can now make changes.  I first add an env section to the container that hosts our dev environment.  By adding an environment variable and value, anytime a new dev environment is created from this project’s repository, that value will be included.  Next, I add a second container to the dev environment that will run DynamoDB locally.  I can do this by adding a new container component.  I use Amazon’s verified DynamoDB docker image for my environment. Attaching additional images allow you to extend the dev environment and include tools or services that can be made available locally.  My updates are highlighted in the green sections below.

Devfile.yaml with environment variable and DynamoDB container added

Figure 4. Example Devfile

I save my changes and navigate back to the Dev Environment Settings tab. I notice that my changes were automatically detected and I am prompted to restart my development environment for the changes to take effect.  Modifications to the devfile requires a restart. You can restart a dev environment using the toolkit, or from the CodeCatalyst UI.

AWS Toolkit prompt asking to restart the dev environment

Figure 5. Dev Environment Settings

After waiting a few seconds for my dev environment to restart, I am ready to write my test.  I use the IDE’s file explorer, expand the repo’s ./tests/unit folder, and create a new file named test_dynamodb.py.  Using the IS_LOCAL environment variable I configured in the devfile, I can include a conditional in my test that sets the endpoint that Amazon’s python SDK ( Boto3 ) will use to connect to the Dynamodb service.  This way, I can run tests locally before pushing my changes and still have tests complete successfully in my project’s workflow.  My full test file is included below.

Python unit test with local code added

Figure 6. Dynamodb test file

Now that I have completed my changes to the dev environment using the devfile and added a test, I am ready to run my test locally to verify.  I will use pytest to ensure the tests are passing before pushing any changes.  From the repo’s root folder, I run the command pip install -r requirements-dev.txt.  Once my dependencies are installed, I then issue the command pytest -k unit.  All tests pass as I expect.

Result of the pytest shown at the command line

Figure 7. Pytest test results

Rather than manually installing my development dependencies in each environment, I could also use the devfile to include commands and automate the execution of those commands during the dev environment lifecycle events.  You can refer to the links for commands and events for more information.

Finally, I am ready to push my changes back to my CodeCatalyst source repository.  I use the git extension of Cloud9 to review my changes.  After reviewing my changes are what I expect, I use the git extension to stage, commit, and push the new test file and the modified devfile so other collaborators can adopt the improvements I made.

Figure 8.  Changes reviewed in CodeCatalyst Cloud9 git extension.

Figure 8.  Changes reviewed in CodeCatalyst Cloud9 git extension.

Cleanup

If you have been following along with this workflow, you  should delete the resources you deployed so you do not continue to incur  charges. First, delete the two stacks that CDK deployed using the AWS CloudFormation console in the AWS account you associated when you launched the blueprint. These stacks will have names like mysfitsXXXXXWebStack and mysfitsXXXXXAppStack. Second, delete the project from CodeCatalyst by navigating to Project settings and choosing Delete project.

Conclusion

In this post, you learned how CodeCatalyst provides configurable on-demand dev environments.  You also learned how devfiles help you define a consistent experience for developing within a CodeCatalyst project.  Please follow our DevOps blog channel as I continue to explore how CodeCatalyst solve Maxine’s and other builders’ challenges.

About the author:

Ryan Bachman

Ryan Bachman is a Sr. Specialist Solutions Architect at AWS, and specializes in working with customers to improve their DevOps practices. Ryan has over 20 years of professional experience as a technologist, and has held roles in many different domains to include development, networking architecture, and technical product management. He is passionate about automation and helping customers increase software development productivity.

Journey to adopt Cloud-Native DevOps platform Series #2: Progressive delivery on Amazon EKS with Flagger and Gloo Edge Ingress Controller

Post Syndicated from Purna Sanyal original https://aws.amazon.com/blogs/devops/journey-to-adopt-cloud-native-devops-platform-series-2-progressive-delivery-on-amazon-eks-with-flagger-and-gloo-edge-ingress-controller/

In the last post, OfferUp modernized its DevOps platform with Amazon EKS and Flagger to accelerate time to market, we talked about hypergrowth and the technical challenges encountered by OfferUp in its existing DevOps platform. As a reminder, we presented how OfferUp modernized its DevOps platform with Amazon Elastic Kubernetes Service (Amazon EKS) and Flagger to gain developer’s velocity, automate faster deployment, and achieve lower cost of ownership.

In this post, we discuss the technical steps to build a DevOps platform that enables the progressive deployment of microservices on Amazon Managed Amazon EKS. Progressive delivery exposes a new version of the software incrementally to ingress traffic and continuously measures the success rate of the metrics before allowing all of the new traffics to a newer version of the software. Flagger is the Graduate project of Cloud Native Computing Foundations (CNCF) that enables progressive canary delivery, along with bule/green and A/B Testing, while measuring metrics like HTTP/gRPC request success rate and latency. Flagger shifts and routes traffic between app versions using a service mesh or an Ingress controller

We leverage Gloo Ingress Controller for traffic routing, Prometheus, Datadog, and Amazon CloudWatch for application metrics analysis and Slack to send notification. Flagger will post messages to slack when a deployment has been initialized, when a new revision has been detected, and if the canary analysis failed or succeeded.

Prerequisite steps to build the modern DevOps platform

You need an AWS Account and AWS Identity and Access Management (IAM) user to build the DevOps platform. If you don’t have an AWS account with Administrator access, then create one now by clicking here. Create an IAM user and assign admin role. You can build this platform in any AWS region however, I will you us-west-1 region throughout this post. You can use a laptop (Mac or Windows) or an Amazon Elastic Compute Cloud (AmazonEC2) instance as a client machine to install all of the necessary software to build the GitOps platform. For this post, I launched an Amazon EC2 instance (with Amazon Linux2 AMI) as the client and install all of the prerequisite software. You need the awscli, git, eksctl, kubectl, and helm applications to build the GitOps platform. Here are the prerequisite steps,

  1. Create a named profile(eks-devops)  with the config and credentials file:

aws configure --profile eks-devops

AWS Access Key ID [None]: xxxxxxxxxxxxxxxxxxxxxx

AWS Secret Access Key [None]: xxxxxxxxxxxxxxxxxx

Default region name [None]: us-west-1

Default output format [None]:

View and verify your current IAM profile:

export AWS_PROFILE=eks-devops

aws sts get-caller-identity

  1. If the Amazon EC2 instance doesn’t have git preinstalled, then install git in your Amazon EC2 instance:

sudo yum update -y

sudo yum install git -y

Check git version

git version

Git clone the repo and download all of the prerequisite software in the home directory.

git clone https://github.com/aws-samples/aws-gloo-flux.git

  1. Download all of the prerequisite software from install.sh which includes awscli, eksctl, kubectl, helm, and docker:

cd aws-gloo-flux/eks-flagger/

ls -lt

chmod 700 install.sh ecr-setup.sh

. install.sh

Check the version of the software installed:

aws --version

eksctl version

kubectl version -o json

helm version

docker --version

docker info

If the docker info shows an error like “permission denied”, then reboot the Amazon EC2 instance or re-log in to the instance again.

  1. Create an Amazon Elastic Container Repository (Amazon ECR) and push application images.

Amazon ECR is a fully-managed container registry that makes it easy for developers to share and deploy container images and artifacts. ecr setup.sh script will create a new Amazon ECR repository and also push the podinfo images (6.0.0, 6.0.1, 6.0.2, 6.1.0, 6.1.5 and 6.1.6) to the Amazon ECR. Run ecr-setup.sh script with the parameter, “ECR repository name” (e.g. ps-flagger-repository) and region (e.g. us-west-1)

./ecr-setup.sh <ps-flagger-repository> <us-west-1>

You’ll see output like the following (truncated).

###########################################################

Successfully created ECR repository and pushed podinfo images to ECR #

Please note down the ECR repository URI          

xxxxxx.dkr.ecr.us-west-1.amazonaws.com/ps-flagger-repository                                                   

Technical steps to build the modern DevOps platform

This post shows you how to use the Gloo Edge ingress controller and Flagger to automate canary releases for progressive deployment on the Amazon EKS cluster. Flagger requires a Kubernetes cluster v1.16 or newer and Gloo Edge ingress 1.6.0 or newer. This post will provide a step-by-step approach to install the Amazon EKS cluster with managed node group, Gloo Edge ingress controller, and Flagger for Gloo in the Amazon EKS cluster. Now that the cluster, metrics infrastructure, and Flagger are installed, we can install the sample application itself. We’ll use the standard Podinfo application used in the Flagger project and the accompanying loadtester tool. The Flagger “podinfo” backend service will be called by Gloo’s “VirtualService”, which is the root routing object for the Gloo Gateway. A virtual service describes the set of routes to match for a set of domains. We’ll automate the canary promotion, with the new image of the “podinfo” service, from version 6.0.0 to version 6.0.1. We’ll also create a scenario by injecting an error for automated canary rollback while deploying version 6.0.2.

  1. Use myeks-cluster.yaml to create your Amazon EKS cluster with managed nodegroup. myeks-cluster.yaml deployment file has “cluster name” value as ps-eks-66, region value as us-west-1, availabilityZones as [us-west-1a, us-west-1b], Kubernetes version as 1.24, and nodegroup Amazon EC2 instance type as m5.2xlarge. You can change this value if you want to build the cluster in a separate region or availability zone.

eksctl create cluster -f myeks-cluster.yaml

Check the Amazon EKS Cluster details:

kubectl cluster-info

kubectl version -o json

kubectl get nodes -o wide

kubectl get pods -A -o wide

Deploy the Metrics Server:

kubectl apply -f https://github.com/kubernetes-sigs/metrics-server/releases/latest/download/components.yaml

kubectl get deployment metrics-server -n kube-system

Update the kubeconfig file to interact with you cluster:

# aws eks update-kubeconfig --name <ekscluster-name> --region <AWS_REGION>

kubectl config view

cat $HOME/.kube/config

  1. Create a namespace “gloo-system” and Install Gloo with Helm Chart. Gloo Edge is an Envoy-based Kubernetes-native ingress controller to facilitate and secure application traffic.

helm repo add gloo https://storage.googleapis.com/solo-public-helm

kubectl create ns gloo-system

helm upgrade -i gloo gloo/gloo --namespace gloo-system

  1. Install Flagger and the Prometheus add-on in the same gloo-system namespace. Flagger is a Cloud Native Computing Foundation project and part of Flux family of GitOps tools.

helm repo add flagger https://flagger.app

helm upgrade -i flagger flagger/flagger \

--namespace gloo-system \

--set prometheus.install=true \

--set meshProvider=gloo

  1. [Optional] If you’re using Datadog as a monitoring tool, then deploy Datadog agents as a DaemonSet using the Datadog Helm chart. Replace RELEASE_NAME and DATADOG_API_KEY accordingly. If you aren’t using Datadog, then skip this step. For this post, we leverage the Prometheus open-source monitoring tool.

helm repo add datadog https://helm.datadoghq.com

helm repo update

helm install <RELEASE_NAME> \

    --set datadog.apiKey=<DATADOG_API_KEY> datadog/datadog

Integrate Amazon EKS/ K8s Cluster with the Datadog Dashboard – go to the Datadog Console and add the Kubernetes integration.

  1. [Optional] If you’re using Slack communication tool and have admin access, then Flagger can be configured to send alerts to the Slack chat platform by integrating the Slack alerting system with Flagger. If you don’t have admin access in Slack, then skip this step.

helm upgrade -i flagger flagger/flagger \

--set slack.url=https://hooks.slack.com/services/YOUR/SLACK/WEBHOOK \

--set slack.channel=general \

--set slack.user=flagger \

--set clusterName=<my-cluster>

  1. Create a namespace “apps”, and applications and load testing service will be deployed into this namespace.

kubectl create ns apps

Create a deployment and a horizontal pod autoscaler for your custom application or service for which canary deployment will be done.

kubectl -n apps apply -k app

kubectl get deployment -A

kubectl get hpa -n apps

Deploy the load testing service to generate traffic during the canary analysis.

kubectl -n apps apply -k tester

kubectl get deployment -A

kubectl get svc -n apps

  1. Use apps-vs.yaml to create a Gloo virtual service definition that references a route table that will be generated by Flagger.

kubectl apply -f ./apps-vs.yaml

kubectl get vs -n apps

[Optional] If you have your own domain name, then open apps-vs.yaml in vi editor and replace podinfo.example.com with your own domain name to run the app in that domain.

  1. Use canary.yaml to create a canary custom resource. Review the service, analysis, and metrics sections of the canary.yaml file.

kubectl apply -f ./canary.yaml

After a couple of seconds, Flagger will create the canary objects. When the bootstrap finishes, Flagger will set the canary status to “Initialized”.

kubectl -n apps get canary podinfo

NAME      STATUS        WEIGHT   LASTTRANSITIONTIME

podinfo   Initialized   0        2023-xx-xxTxx:xx:xxZ

Gloo automatically creates an ELB. Once the load balancer is provisioned and health checks pass, we can find the sample application at the load balancer’s public address. Note down the ELB’s Public address:

kubectl get svc -n gloo-system --field-selector 'metadata.name==gateway-proxy'   -o=jsonpath='{.items[0].status.loadBalancer.ingress[0].hostname}{"\n"}'

Validate if your application is running, and you’ll see an output with version 6.0.0.

curl <load balancer’s public address> -H "Host:podinfo.example.com"

Trigger progressive deployments and monitor the status

You can Trigger a canary deployment by updating the application container image from 6.0.0 to 6.01.

kubectl -n apps set image deployment/podinfo  podinfod=<ECR URI>:6.0.1

Flagger detects that the deployment revision changed and starts a new rollout.

kubectl -n apps describe canary/podinfo

Monitor all canaries, as the promoted status condition can have one of the following statuses: initialized, Waiting, Progressing, Promoting, Finalizing, Succeeded, and Failed.

watch kubectl get canaries --all-namespaces

curl < load balancer’s public address> -H "Host:podinfo.example.com"

Once canary is completed, validate your application. You can see that the version of the application is changed from 6.0.0 to 6.0.1.

{

  "hostname": "podinfo-primary-658c9f9695-4pqbl",

  "version": "6.0.1",

  "revision": "",

  "color": "#34577c",

  "logo": "https://raw.githubusercontent.com/stefanprodan/podinfo/gh-pages/cuddle_clap.gif",

  "message": "greetings from podinfo v6.0.1",

}

[Optional] Open podinfo application from the laptop browser

Find out both of the IP addresses associated with load balancer.

dig < load balancer’s public address >

Open /etc/hosts file in the laptop and add both of the IPs of load balancer in the host file.

sudo vi /etc/hosts

<Public IP address of LB Target node> podinfo.example.com

e.g.

xx.xx.xxx.xxx podinfo.example.com

xx.xx.xxx.xxx podinfo.example.com

Type “podinfo.example.com” in your browser and you’ll find the application in form similar to this:

Figure 1: Greetings from podinfo v6.0.1

Automated rollback

While doing the canary analysis, you’ll generate HTTP 500 errors and high latency to check if Flagger pauses and rolls back the faulted version. Flagger performs automatic Rollback in the case of failure.

Introduce another canary deployment with podinfo image version 6.0.2 and monitor the status of the canary.

kubectl -n apps set image deployment/podinfo podinfod=<ECR URI>:6.0.2

Run HTTP 500 errors or a high-latency error from a separate terminal window.

Generate HTTP 500 errors:

watch curl -H 'Host:podinfo.example.com' <load balancer’s public address>/status/500

Generate high latency:

watch curl -H 'Host:podinfo.example.com' < load balancer’s public address >/delay/2

When the number of failed checks reaches the canary analysis threshold, the traffic is routed back to the primary, the canary is scaled to zero, and the rollout is marked as failed.

kubectl get canaries --all-namespaces

kubectl -n apps describe canary/podinfo

Cleanup

When you’re done experimenting, you can delete all of the resources created during this series to avoid any additional charges. Let’s walk through deleting all of the resources used.

Delete Flagger resources and apps namespace
kubectl delete canary podinfo -n  apps

kubectl delete HorizontalPodAutoscaler podinfo -n apps

kubectl delete deployment podinfo -n   apps

helm -n gloo-system delete flagger

helm -n gloo-system delete gloo

kubectl delete namespace apps

Delete Amazon EKS Cluster
After you’ve finished with the cluster and nodes that you created for this tutorial, you should clean up by deleting the cluster and nodes with the following command:

eksctl delete cluster --name <cluster name> --region <region code>

Delete Amazon ECR

aws ecr delete-repository --repository-name ps-flagger-repository  --force

Conclusion

This post explained the process for setting up Amazon EKS cluster and how to leverage Flagger for progressive deployments along with Prometheus and Gloo Ingress Controller. You can enhance the deployments by integrating Flagger with Slack, Datadog, and webhook notifications for progressive deployments. Amazon EKS removes the undifferentiated heavy lifting of managing and updating the Kubernetes cluster. Managed node groups automate the provisioning and lifecycle management of worker nodes in an Amazon EKS cluster, which greatly simplifies operational activities such as new Kubernetes version deployments.

We encourage you to look into modernizing your DevOps platform from monolithic architecture to microservice-based architecture with Amazon EKS, and leverage Flagger with the right Ingress controller for secured and automated service releases.

Further Reading

Journey to adopt Cloud-Native DevOps platform Series #1: OfferUp modernized DevOps platform with Amazon EKS and Flagger to accelerate time to market

About the authors:

Purna Sanyal

Purna Sanyal is a technology enthusiast and an architect at AWS, helping digital native customers solve their business problems with successful adoption of cloud native architecture. He provides technical thought leadership, architecture guidance, and conducts PoCs to enable customers’ digital transformation. He is also passionate about building innovative solutions around Kubernetes, database, analytics, and machine learning.