Tag Archives: Technical How-to

How to set up ongoing replication from your third-party secrets manager to AWS Secrets Manager

Post Syndicated from Laurens Brinker original https://aws.amazon.com/blogs/security/how-to-set-up-ongoing-replication-from-your-third-party-secrets-manager-to-aws-secrets-manager/

Secrets managers are a great tool to securely store your secrets and provide access to secret material to a set of individuals, applications, or systems that you trust. Across your environments, you might have multiple secrets managers hosted on different providers, which can increase the complexity of maintaining a consistent operating model for your secrets. In these situations, centralizing your secrets in a single source of truth, and replicating subsets of secrets across your other secrets managers, can simplify your operating model.

This blog post explains how you can use your third-party secrets manager as the source of truth for your secrets, while replicating a subset of these secrets to AWS Secrets Manager. By doing this, you will be able to use secrets that originate and are managed from your third-party secrets manager in Amazon Web Services (AWS) applications or in AWS services that use Secrets Manager secrets.

I’ll demonstrate this approach in this post by setting up a sample open-source HashiCorp Vault to create and maintain secrets and create a replication mechanism that enables you to use these secrets in AWS by using AWS Secrets Manager. Although this post uses HashiCorp Vault as an example, you can also modify the replication mechanism to use secrets managers from other providers.

Important: This blog post is intended to provide guidance that you can use when planning and implementing a secrets replication mechanism. The examples in this post are not intended to be run directly in production, and you will need to take security hardening requirements into consideration before deploying this solution. As an example, HashiCorp provides tutorials on hardening production vaults.

You can use these links to navigate through this post:

Why and when to consider replicating secrets
Two approaches to secrets replication
Replicate secrets to AWS Secrets Manager with the pull model
Solution overview
Set up the solution
Step 1: Deploy the solution by using the AWS CDK toolkit
Step 2: Initialize the HashiCorp Vault
Step 3: Update the Vault connection secret
Step 4: (Optional) Set up email notifications for replication failures
Test your secret replication
Update a secret
Secret replication logic
Use your secret
Manage permissions
Options for customizing the sample solution

Why and when to consider replicating secrets

The primary use case for this post is for customers who are running applications on AWS and are currently using a third-party secrets manager to manage their secrets, hosted on-premises, in the AWS Cloud, or with a third-party provider. These customers typically have existing secrets vending processes, deployment pipelines, and procedures and processes around the management of these secrets. Customers with such a setup might want to keep their existing third-party secrets manager and have a set of secrets that are accessible to workloads running outside of AWS, as well as workloads running within AWS, by using AWS Secrets Manager.

Another use case is for customers who are in the process of migrating workloads to the AWS Cloud and want to maintain a (temporary) hybrid form of secrets management. By replicating secrets from an existing third-party secrets manager, customers can migrate their secrets to the AWS Cloud one-by-one, test that they work, integrate the secrets with the intended applications and systems, and once the migration is complete, remove the third-party secrets manager.

Additionally, some AWS services, such as Amazon Relational Database Service (Amazon RDS) Proxy, AWS Direct Connect MACsec, and AD Connector seamless join (Linux), only support secrets from AWS Secrets Manager. Customers can use secret replication if they have a third-party secrets manager and want to be able to use third-party secrets in services that require integration with AWS Secrets Manager. That way, customers don’t have to manage secrets in two places.

Two approaches to secrets replication

In this post, I’ll discuss two main models to replicate secrets from an external third-party secrets manager to AWS Secrets Manager: a pull model and a push model.

Pull model
In a pull model, you can use AWS services such as Amazon EventBridge and AWS Lambda to periodically call your external secrets manager to fetch secrets and updates to those secrets. The main benefit of this model is that it doesn’t require any major configuration to your third-party secrets manager. The AWS resources and mechanism used for pulling secrets must have appropriate permissions and network access to those secrets. However, there could be a delay between the time a secret is created and updated and when it’s picked up for replication, depending on the time interval configured between pulls from AWS to the external secrets manager.

Push model
In this model, rather than periodically polling for updates, the external secrets manager pushes updates to AWS Secrets Manager as soon as a secret is added or changed. The main benefit of this is that there is minimal delay between secret creation, or secret updating, and when that data is available in AWS Secrets Manager. The push model also minimizes the network traffic required for replication since it’s a unidirectional flow. However, this model adds a layer of complexity to the replication, because it requires additional configuration in the third-party secrets manager. More specifically, the push model is dependent on the third-party secrets manager’s ability to run event-based push integrations with AWS resources. This will require a custom integration to be developed and managed on the third-party secrets manager’s side.

This blog post focuses on the pull model to provide an example integration that requires no additional configuration on the third-party secrets manager.

Replicate secrets to AWS Secrets Manager with the pull model

In this section, I’ll walk through an example of how to use the pull model to replicate your secrets from an external secrets manager to AWS Secrets Manager.

Solution overview

Figure 1: Secret replication architecture diagram

Figure 1: Secret replication architecture diagram

The architecture shown in Figure 1 consists of the following main steps, numbered in the diagram:

  1. A Cron expression in Amazon EventBridge invokes an AWS Lambda function every 30 minutes.
  2. To connect to the third-party secrets manager, the Lambda function, written in NodeJS, fetches a set of user-defined API keys belonging to the secrets manager from AWS Secrets Manager. These API keys have been scoped down to give read-only access to secrets that should be replicated, to adhere to the principle of least privilege. There is more information on this in Step 3: Update the Vault connection secret.
  3. The third step has two variants depending on where your third-party secrets manager is hosted:
    1. The Lambda function is configured to fetch secrets from a third-party secrets manager that is hosted outside AWS. This requires sufficient networking and routing to allow communication from the Lambda function.

      Note: Depending on the location of your third-party secrets manager, you might have to consider different networking topologies. For example, you might need to set up hybrid connectivity between your external environment and the AWS Cloud by using AWS Site-to-Site VPN or AWS Direct Connect, or both.

    2. The Lambda function is configured to fetch secrets from a third-party secrets manager running on Amazon Elastic Compute Cloud (Amazon EC2).

    Important: To simplify the deployment of this example integration, I’ll use a secrets manager hosted on a publicly available Amazon EC2 instance within the same VPC as the Lambda function (3b). This minimizes the additional networking components required to interact with the secrets manager. More specifically, the EC2 instance runs an open-source HashiCorp Vault. In the rest of this post, I’ll refer to the HashiCorp Vault’s API keys as Vault tokens.

  4. The Lambda function compares the version of the secret that it just fetched from the third-party secrets manager against the version of the secret that it has in AWS Secrets Manager (by tag). The function will create a new secret in AWS Secrets Manager if the secret does not exist yet, and will update it if there is a new version. The Lambda function will only consider secrets from the third-party secrets manager for replication if they match a specified prefix. For example, hybrid-aws-secrets/.
  5. In case there is an error synchronizing the secret, an email notification is sent to the email addresses which are subscribed to the Amazon Simple Notification Service (Amazon SNS) Topic deployed. This sample application uses email notifications with Amazon SNS as an example, but you could also integrate with services like ServiceNow, Jira, Slack, or PagerDuty. Learn more about how to use webhooks to publish Amazon SNS messages to external services.

Set up the solution

In this section, I walk through deploying the pull model solution displayed in Figure 1 using the following steps:
Step 1: Deploy the solution by using the AWS CDK toolkit
Step 2: Initialize the HashiCorp Vault
Step 3: Update the Vault connection secret
Step 4: (Optional) Set up email notifications for replication failures

Step 1: Deploy the solution by using the AWS CDK toolkit

For this blog post, I’ve created an AWS Cloud Development Kit (AWS CDK) script, which can be found in this AWS GitHub repository. Using the AWS CDK, I’ve defined the infrastructure depicted in Figure 1 as Infrastructure as Code (IaC), written in TypeScript, ready for you to deploy and try out. The AWS CDK is an open-source software development framework that allows you to write your cloud application infrastructure as code using common programming languages such as TypeScript, Python, Java, Go, and so on.

Prerequisites:

To deploy the solution, the following should be in place on your system:

  1. Git
  2. Node (version 16 or higher)
  3. jq
  4. AWS CDK Toolkit. Install using npm (included in Node setup) by running npm install -g aws-cdk in a local terminal.
  5. An AWS access key ID and secret access key configured as this setup will interact with your AWS account. See Configuration basics in the AWS Command Line Interface User Guide for more details.
  6. Docker installed and running on your machine

To deploy the solution

  1. Clone the CDK script for secret replication.
    git clone https://github.com/aws-samples/aws-secrets-manager-hybrid-secret-replication-from-hashicorp-vault.git SecretReplication
  2. Use the cloned project as the working directory.
    cd SecretReplication
  3. Install the required dependencies to deploy the application.
    npm install
  4. Adjust any configuration values for your setup in the cdk.json file. For example, you can adjust the secretsPrefix value to change which prefix is used by the Lambda function to determine the subset of secrets that should be replicated from the third-party secrets manager.
  5. Bootstrap your AWS environments with some resources that are required to deploy the solution. With correctly configured AWS credentials, run the following command.
    cdk bootstrap

    The core resources created by bootstrapping are an Amazon Elastic Container Registry (Amazon ECR) repository for the AWS Lambda Docker image, an Amazon Simple Storage Service (Amazon S3) bucket for static assets, and AWS Identity and Access Management (IAM) roles with corresponding IAM policies. You can find a full list of the resources by going to the CDKToolkit stack in AWS CloudFormation after the command has finished.

  6. Deploy the infrastructure.
    cdk deploy

    This command deploys the infrastructure shown in Figure 1 for you by using AWS CloudFormation. For a full list of resources, you can view the SecretsManagerReplicationStack in AWS CloudFormation after the deployment has completed.

Note: If your local environment does not have a terminal that allows you to run these commands, consider using AWS Cloud9 or AWS CloudShell.

After the deployment has finished, you should see an output in your terminal that looks like the one shown in Figure 2. If successful, the output provides the IP address of the sample HashiCorp Vault and its web interface.

Figure 2: AWS CDK deployment output

Figure 2: AWS CDK deployment output

Step 2: Initialize the HashiCorp Vault

As part of the output of the deployment script, you will be given a URL to access the user interface of the open-source HashiCorp Vault. To simplify accessibility, the URL points to a publicly available Amazon EC2 instance running the HashiCorp Vault user interface as shown in step 3b in Figure 1.

Let’s look at the HashiCorp Vault that was just created. Go to the URL in your browser, and you should see the Raft Storage initialize page, as shown in Figure 3.

Figure 3: HashiCorp Vault Raft Storage initialize page

Figure 3: HashiCorp Vault Raft Storage initialize page

The vault requires an initial configuration to set up storage and get the initial set of root keys. You can go through the steps manually in the HashiCorp Vault’s user interface, but I recommend that you use the initialise_vault.sh script that is included as part of the SecretsManagerReplication project instead.

Using the HashiCorp Vault API, the initialization script will automatically do the following:

  1. Initialize the Raft storage to allow the Vault to store secrets locally on the instance.
  2. Create an initial set of unseal keys for the Vault. Importantly, for demo purposes, the script uses a single key share. For production environments, it’s recommended to use multiple key shares so that multiple shares are needed to reconstruct the root key, in case of an emergency.
  3. Store the unseal keys in init/vault_init_output.json in your project.
  4. Unseals the HashiCorp Vault by using the unseal keys generated earlier.
  5. Enables two key-value secrets engines:
    1. An engine named after the prefix that you’re using for replication, defined in the cdk.json file. In this example, this is hybrid-aws-secrets. We’re going to use the secrets in this engine for replication to AWS Secrets Manager.
    2. An engine called super-secret-engine, which you’re going to use to show that your replication mechanism does not have access to secrets outside the engine used for replication.
  6. Creates three example secrets, two in hybrid-aws-secrets, and one in super-secret-engine.
  7. Creates a read-only policy, which you can see in the init/replication-policy-payload.json file after the script has finished running, that allows read-only access to only the secrets that should be replicated.
  8. Creates a new vault token that has the read-only policy attached so that it can be used by the AWS Lambda function later on to fetch secrets for replication.

To run the initialization script, go back to your terminal, and run the following command.
./initialise_vault.sh

The script will then ask you for the IP address of your HashiCorp Vault. Provide the IP address (excluding the port) and choose Enter. Input y so that the script creates a couple of sample secrets.

If everything is successful, you should see an output that includes tokens to access your HashiCorp Vault, similar to that shown in Figure 4.

Figure 4: Initialize HashiCorp Vault bash script output

Figure 4: Initialize HashiCorp Vault bash script output

The setup script has outputted two tokens: one root token that you will use for administrator tasks, and a read-only token that will be used to read secret information for replication. Make sure that you can access these tokens while you’re following the rest of the steps in this post.

Note: The root token is only used for demonstration purposes in this post. In your production environments, you should not use root tokens for regular administrator actions. Instead, you should use scoped down roles depending on your organizational needs. In this case, the root token is used to highlight that there are secrets under super-secret-engine/ which are not meant for replication. These secrets cannot be seen, or accessed, by the read-only token.

Go back to your browser and refresh your HashiCorp Vault UI. You should now see the Sign in to Vault page. Sign in using the Token method, and use the root token. If you don’t have the root token in your terminal anymore, you can find it in the init/vault_init_output.json file.

After you sign in, you should see the overview page with three secrets engines enabled for you, as shown in Figure 5.

Figure 5: HashiCorp Vault secrets engines overview

Figure 5: HashiCorp Vault secrets engines overview

If you explore hybrid-aws-secrets and super-secret-engine, you can see the secrets that were automatically created by the initialization script. For example, first-secret-for-replication, which contains a sample key-value secret with the key secrets and value manager.

If you navigate to Policies in the top navigation bar, you can also see the aws-replication-read-only policy, as shown in Figure 6. This policy provides read-only access to only the hybrid-aws-secrets path.

Figure 6: Read-only HashiCorp Vault token policy

Figure 6: Read-only HashiCorp Vault token policy

The read-only policy is attached to the read-only token that we’re going to use in the secret replication Lambda function. This policy is important because it scopes down the access that the Lambda function obtains by using the token to a specific prefix meant for replication. For secret replication we only need to perform read operations. This policy ensures that we can read, but cannot add, alter, or delete any secrets in HashiCorp Vault using the token.

You can verify the read-only token permissions by signing into the HashiCorp Vault user interface using the read-only token rather than the root token. Now, you should only see hybrid-aws-secrets. You no longer have access to super-secret-engine, which you saw in Figure 5. If you try to create or update a secret, you will get a permission denied error.

Great! Your HashiCorp Vault is now ready to have its secrets replicated from hybrid-aws-secrets to AWS Secrets Manager. The next section describes a final configuration that you need to do to allow access to the secrets in HashiCorp Vault by the replication mechanism in AWS.

Step 3: Update the Vault connection secret

To allow secret replication, you must give the AWS Lambda function access to the HashiCorp Vault read-only token that was created by the initialization script. To do that, you need to update the vault-connection-secret that was initialized in AWS Secrets Manager as part of your AWS CDK deployment.

For demonstration purposes, I’ll show you how to do that by using the AWS Management Console, but you can also do it programmatically by using the AWS Command Line Interface (AWS CLI) or AWS SDK with the update-secret command.

To update the Vault connection secret (console)

  1. In the AWS Management Console, go to AWS Secrets Manager > Secrets > hybrid-aws-secrets/vault-connection-secret.
  2. Under Secret Value, choose Retrieve Secret Value, and then choose Edit.
  3. Update the vaultToken value to contain the read-only token that was generated by the initialization script.
Figure 7: AWS Secrets Manager - Vault connection secret page

Figure 7: AWS Secrets Manager – Vault connection secret page

Step 4: (Optional) Set up email notifications for replication failures

As highlighted in Figure 1, the Lambda function will send an email by using Amazon SNS to a designated email address whenever one or more secrets fails to be replicated. You will need to configure the solution to use the correct email address. To do this, go to the cdk.json file at the root of the SecretReplication folder and adjust the notificationEmail parameter to an email address that you own. Once done, deploy the changes using the cdk deploy command. Within a few minutes, you’ll get an email requesting you to confirm the subscription. Going forward, you will receive an email notification if one or more secrets fails to replicate.

Test your secret replication

You can either wait up to 30 minutes for the Lambda function to be invoked automatically to replicate the secrets, or you can manually invoke the function.

To test your secret replication

  1. Open the AWS Lambda console and find the Secret Replication function (the name starts with SecretsManagerReplication-SecretReplication).
  2. Navigate to the Test tab.
  3. For the text event action, select Create new event, create an event using the default parameters, and then choose the Test button on the right-hand side, as shown in Figure 8.
Figure 8: AWS Lambda - Test page to manually invoke the function

Figure 8: AWS Lambda – Test page to manually invoke the function

This will run the function. You should see a success message, as shown in Figure 9. If this is the first time the Lambda function has been invoked, you will see in the results that two secrets have been created.

Figure 9: AWS Lambda function output

Figure 9: AWS Lambda function output

You can find the corresponding logs for the Lambda function invocation in a Log group in AWS CloudWatch matching the name /aws/lambda/SecretsManagerReplication-SecretReplicationLambdaF-XXXX.

To verify that the secrets were added, navigate to AWS Secrets Manager in the console, and in addition to the vault-connection-secret that you edited before, you should now also see the two new secrets with the same hybrid-aws-secrets prefix, as shown in Figure 10.

Figure 10: AWS Secrets Manager overview - New replicated secrets

Figure 10: AWS Secrets Manager overview – New replicated secrets

For example, if you look at first-secret-for-replication, you can see the first version of the secret, with the secret key secrets and secret value manager, as shown in Figure 11.

Figure 11: AWS Secrets Manager – New secret overview showing values and version number

Figure 11: AWS Secrets Manager – New secret overview showing values and version number

Success! You now have access to the secret values that originate from HashiCorp Vault in AWS Secrets Manager. Also, notice how there is a version tag attached to the secret. This is something that is necessary to update the secret, which you will learn more about in the next two sections.

Update a secret

It’s a recommended security practice to rotate secrets frequently. The Lambda function in this solution not only replicates secrets when they are created — it also periodically checks if existing secrets in AWS Secrets Manager should be updated when the third-party secrets manager (HashiCorp Vault in this case) has a new version of the secret. To validate that this works, you can manually update a secret in your HashiCorp Vault and observe its replication in AWS Secrets Manager in the same way as described in the previous section. You will notice that the version tag of your secret gets updated automatically when there is a new secret replication from the third-party secrets manager to AWS Secrets Manager.

Secret replication logic

This section will explain in more detail the logic behind the secret replication. Consider the following sequence diagram, which explains the overall logic implemented in the Lambda function.

Figure 12: State diagram for secret replication logic

Figure 12: State diagram for secret replication logic

This diagram highlights that the Lambda function will first fetch a list of secret names from the HashiCorp Vault. Then, the function will get a list of secrets from AWS Secrets Manager, matching the prefix that was configured for replication. AWS Secrets Manager will return a list of the secrets that match this prefix and will also return their metadata and tags. Note that the function has not fetched any secret material yet.

Next, the function will loop through each secret name that HashiCorp Vault gave and will check if the secret exists in AWS Secrets Manager:

  • If there is no secret that matches that name, the function will fetch the secret material from HashiCorp Vault, including the version number, and create a new secret in AWS Secrets Manager. It will also add a version tag to the secret to match the version.
  • If there is a secret matching that name in AWS Secrets Manager already, the Lambda function will first fetch the metadata from that secret in HashiCorp Vault. This is required to get the version number of the secret, because the version number was not exposed when the function got the list of secrets from HashiCorp Vault initially. If the secret version from HashiCorp Vault does not match the version value of the secret in AWS Secrets Manager (for example, the version in HashiCorp vault is 2, and the version in AWS Secrets manager is 1), an update is required to get the values synchronized again. Only now will the Lambda function fetch the actual secret material from HashiCorp Vault and update the secret in AWS Secrets Manager, including the version number in the tag.

The Lambda function fetches metadata about the secrets, rather than just fetching the secret material from HashiCorp Vault straight away. Typically, secrets don’t update very often. If this Lambda function is called every 30 minutes, then it should not have to add or update any secrets in the majority of invocations. By using metadata to determine whether you need the secret material to create or update secrets, you minimize the number of times secret material is fetched both from HashiCorp Vault and AWS Secrets Manager.

Note: The AWS Lambda function has permissions to pull certain secrets from HashiCorp Vault. It is important to thoroughly review the Lambda code and any subsequent changes to it to prevent leakage of secrets. For example, you should ensure that the Lambda function does not get updated with code that unintentionally logs secret material outside the Lambda function.

Use your secret

Now that you have created and replicated your secrets, you can use them in your AWS applications or AWS services that are integrated with Secrets Manager. For example, you can use the secrets when you set up connectivity for a proxy in Amazon RDS, as follows.

To use a secret when creating a proxy in Amazon RDS

  1. Go to the Amazon RDS service in the console.
  2. In the left navigation pane, choose Proxies, and then choose Create Proxy.
  3. On the Connectivity tab, you can now select first-secret-for-replication or second-secret-for-replication, which were created by the Lambda function after replicating them from the HashiCorp Vault.
Figure 13: Amazon RDS Proxy - Example of using replicated AWS Secrets Manager secrets

Figure 13: Amazon RDS Proxy – Example of using replicated AWS Secrets Manager secrets

It is important to remember that the consumers of the replicated secrets in AWS Secrets Manager will require scoped-down IAM permissions to use the secrets and AWS Key Management Service (AWS KMS) keys that were used to encrypt the secrets. For example, see Step 3: Create IAM role and policy on the Set up shared database connections with Amazon RDS Proxy page.

Manage permissions

Due to the sensitive nature of the secrets, it is important that you scope down the permissions to the least amount required to prevent inadvertent access to your secrets. The setup adopts a least-privilege permission strategy, where only the necessary actions are explicitly allowed on the resources that are required for replication. However, the permissions should be reviewed in accordance to your security standards.

In the architecture of this solution, there are two main places where you control access to the management of your secrets in Secrets Manager.

Lambda execution IAM role: The IAM role assumed by the Lambda function during execution contains the appropriate permissions for secret replication. There is an additional safety measure, which explicitly denies any action to a resource that is not required for the replication. For example, the Lambda function only has permission to publish to the Amazon SNS topic that is created for the failed replications, and will explicitly deny a publish action to any other topic. Even if someone accidentally adds an allow to the policy for a different topic, the explicit deny will still block this action.

AWS KMS key policy: When other services need to access the replicated secret in AWS Secrets Manager, they need permission to use the hybrid-aws-secrets-encryption-key AWS KMS key. You need to allow the principal these permissions through the AWS KMS key policy. Additionally, you can manage permissions to the AWS KMS key for the principal through an identity policy. For example, this is required when accessing AWS KMS keys across AWS accounts. See Permissions for AWS services in key policies and Specifying KMS keys in IAM policy statements in the AWS KMS Developer Guide.

Options for customizing the sample solution

The solution that was covered in this post provides an example for replication of secrets from HashiCorp Vault to AWS Secrets Manager using the pull model. This section contains additional customization options that you can consider when setting up the solution, or your own variation of it.

  1. Depending on the solution that you’re using, you might have access to different metadata attached to the secrets, which you can use to determine if a secret should be updated. For example, if you have access to data that represents a last_updated_datetime property, you could use this to infer whether or not a secret ought to be updated.
  2. It is a recommended practice to not use long-lived tokens wherever possible. In this sample, I used a static vault token to give the Lambda function access to the HashiCorp Vault. Depending on the solution that you’re using, you might be able to implement better authentication and authorization mechanisms. For example, HashiCorp Vault allows you to use IAM auth by using AWS IAM, rather than a static token.
  3. This post addressed the creation of secrets and updating of secrets, but for your production setup, you should also consider deletion of secrets. Depending on your requirements, you can choose to implement a strategy that works best for you to handle secrets in AWS Secrets Manager once the original secret in HashiCorp Vault has been deleted. In the pull model, you could consider removing a secret in AWS Secrets Manager if the corresponding secret in your external secrets manager is no longer present.
  4. In the sample setup, the same AWS KMS key is used to encrypt both the environment variables of the Lambda function, and the secrets in AWS Secrets Manager. You could choose to add an additional AWS KMS key (which would incur additional cost), to have two separate keys for these tasks. This would allow you to apply more granular permissions for the two keys in the corresponding KMS key policies or IAM identity policies that use the keys.

Conclusion

In this blog post, you’ve seen how you can approach replicating your secrets from an external secrets manager to AWS Secrets Manager. This post focused on a pull model, where the solution periodically fetched secrets from an external HashiCorp Vault and automatically created or updated the corresponding secret in AWS Secrets Manager. By using this model, you can now use your external secrets in your AWS Cloud applications or services that have an integration with AWS Secrets Manager.

If you have feedback about this post, submit comments in the Comments section below. If you have questions about this post, start a new thread on the AWS Secrets Manager re:Post or contact AWS Support.

Want more AWS Security news? Follow us on Twitter.

Laurens Brinker

Laurens Brinker

Laurens is a Software Development Engineer working for AWS Security and is based in London. Previously, Laurens worked as a Security Solutions Architect at AWS, where he helped customers running their workloads securely in the AWS Cloud. Outside of work, Laurens enjoys cycling, a casual game of chess, and building open source projects.

New – Deployment Pipelines Reference Architecture and Reference Implementations

Post Syndicated from Sébastien Stormacq original https://aws.amazon.com/blogs/aws/new_deployment_pipelines_reference_architecture_and_-reference_implementations/

Today, we are launching a new reference architecture and a set of reference implementations for enterprise-grade deployment pipelines. A deployment pipeline automates the building, testing, and deploying of applications or infrastructures into your AWS environments. When you deploy your workloads to the cloud, having deployment pipelines is key to gaining agility and lowering time to market.

When I talk with you at conferences or on social media, I frequently hear that our documentation and tutorials are good resources to get started with a new service or a new concept. However, when you want to scale your usage or when you have complex or enterprise-grade use cases, you often lack resources to dive deeper.

This is why we have created over the years hundreds of reference architectures based on real-life use cases and also the security reference architecture. Today, we are adding a new reference architecture to this collection.

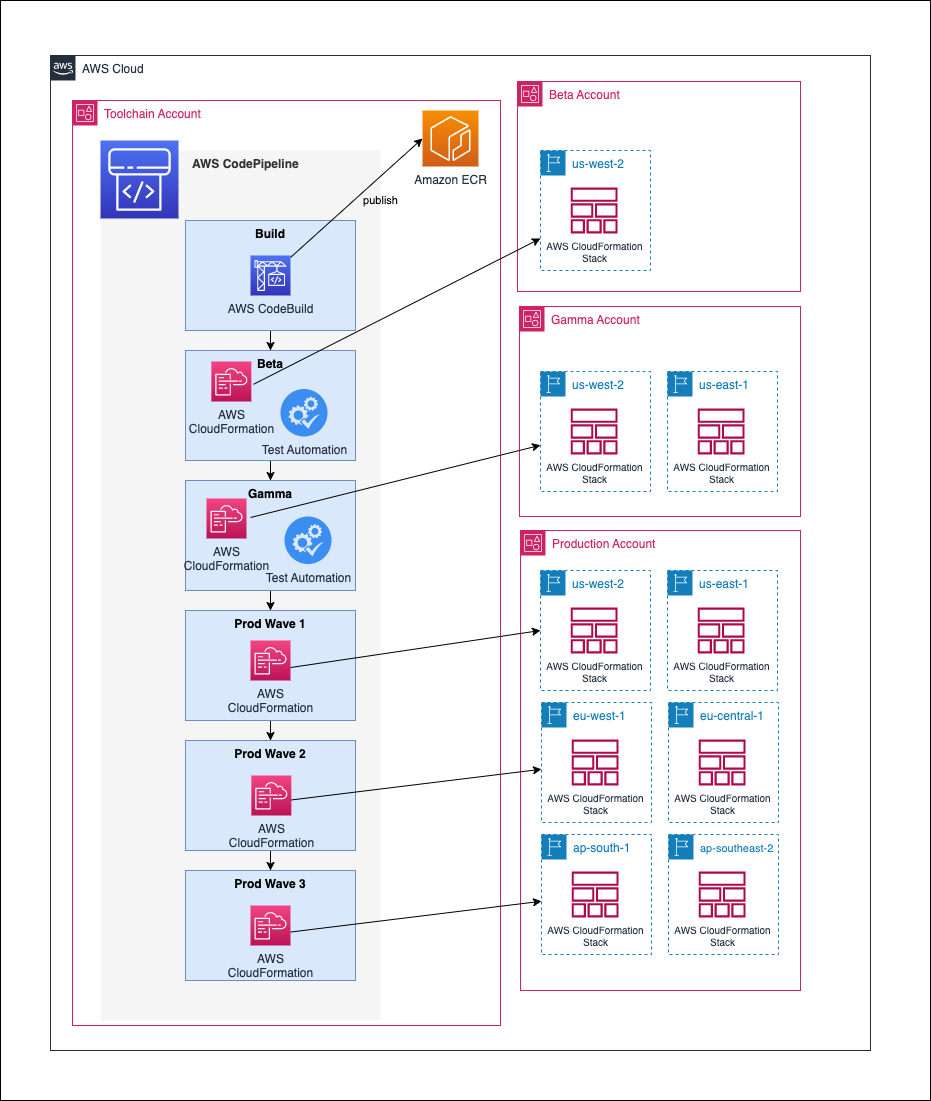
We used the best practices and lessons learned at Amazon and with hundreds of customer projects to create this deployment pipeline reference architecture and implementations. They go well beyond the typical “Hello World” example: They document how to architect and how to implement complex deployment pipelines with multiple environments, multiple AWS accounts, multiple Regions, manual approval, automated testing, automated code analysis, etc. When you want to increase the speed at which you deliver software to your customers through DevOps and continuous delivery, this new reference architecture shows you how to combine AWS services to work together. They document the mandatory and optional components of the architecture.

Having an architecture document and diagram is great, but having an implementation is even better. Each pipeline type in the reference architecture has at least one reference implementation. One of the reference implementations uses an AWS Cloud Development Kit (AWS CDK) application to deploy the reference architecture on your accounts. It is a good starting point to study or customize the reference architecture to fit your specific requirements.

You will find this reference architecture and its implementations at https://pipelines.devops.aws.dev.

Deployment pipeline reference architecture

Let’s Deploy a Reference Implementation
The new deployment pipeline reference architecture demonstrates how to build a pipeline to deploy a Java containerized application and a database. It comes with two reference implementations. We are working on additional pipeline types to deploy Amazon EC2 AMIs, manage a fleet of accounts, and manage dynamic configuration for your applications.

The sample application is developed with SpringBoot. It runs on top of Corretto, the Amazon-provided distribution of the OpenJDK. The application is packaged with the CDK and is deployed on AWS Fargate. But the application is not important here; you can substitute your own application. The important parts are the infrastructure components and the pipeline to deploy an application. For this pipeline type, we provide two reference implementations. One deploys the application using Amazon CodeCatalyst, the new service that we announced at re:Invent 2022, and one uses AWS CodePipeline. This is the one I choose to deploy for this blog post.

The pipeline starts building the applications with AWS CodeBuild. It runs the unit tests and also runs Amazon CodeGuru to review code quality and security. Finally, it runs Trivy to detect additional security concerns, such as known vulnerabilities in the application dependencies. When the build is successful, the pipeline deploys the application in three environments: beta, gamma, and production. It deploys the application in the beta environment in a single Region. The pipeline runs end-to-end tests in the beta environment. All the tests must succeed before the deployment continues to the gamma environment. The gamma environment uses two Regions to host the application. After deployment in the gamma environment, the deployment into production is subject to manual approval. Finally, the pipeline deploys the application in the production environment in six Regions, with three waves of deployments made of two Regions each.

Deployment Pipelines Reference Architecture

I need four AWS accounts to deploy this reference implementation: one to deploy the pipeline and tooling and one for each environment (beta, gamma, and production). At a high level, there are two deployment steps: first, I bootstrap the CDK for all four accounts, and then I create the pipeline itself in the toolchain account. You must plan for 2-3 hours of your time to prepare your accounts, create the pipeline, and go through a first deployment.

Once the pipeline is created, it builds, tests, and deploys the sample application from its source in AWS CodeCommit. You can commit and push changes to the application source code and see it going through the pipeline steps again.

My colleague Irshad Buch helped me try the pipeline on my account. He wrote a detailed README with step-by-step instructions to let you do the same on your side. The reference architecture that describes this implementation in detail is available on this new web page. The application source code, the AWS CDK scripts to deploy the application, and the AWS CDK scripts to create the pipeline itself are all available on AWS’s GitHub. Feel free to contribute, report issues or suggest improvements.

Available Now
The deployment pipeline reference architecture and its reference implementations are available today, free of charge. If you decide to deploy a reference implementation, we will charge you for the resources it creates on your accounts. You can use the provided AWS CDK code and the detailed instructions to deploy this pipeline on your AWS accounts. Try them today!

— seb

Run Apache Spark workloads 3.5 times faster with Amazon EMR 6.9

Post Syndicated from Sekar Srinivasan original https://aws.amazon.com/blogs/big-data/run-apache-spark-workloads-3-5-times-faster-with-amazon-emr-6-9/

The Amazon EMR runtime for Apache Spark is a performance-optimized runtime for Apache Spark that is 100% API compatible with open-source Apache Spark. With Amazon EMR release 6.9.0, the EMR runtime for Apache Spark supports equivalent Spark version 3.3.0.

With Amazon EMR 6.9.0, you can now run your Apache Spark 3.x applications faster and at lower cost without requiring any changes to your applications. In our performance benchmark tests, derived from TPC-DS performance tests at 3 TB scale, we found the EMR runtime for Apache Spark 3.3.0 provides a 3.5 times (using total runtime) performance improvement on average over open-source Apache Spark 3.3.0.

In this post, we analyze the results from our benchmark tests running a TPC-DS application on open-source Apache Spark and then on Amazon EMR 6.9, which comes with an optimized Spark runtime that is compatible with open-source Spark. We walk through a detailed cost analysis and finally provide step-by-step instructions to run the benchmark.

Results observed

To evaluate the performance improvements, we used an open-source Spark performance test utility that is derived from the TPC-DS performance test toolkit. We ran the tests on a seven-node (six core nodes and one primary node) c5d.9xlarge EMR cluster with the EMR runtime for Apache Spark, and a second seven-node self-managed cluster on Amazon Elastic Compute Cloud (Amazon EC2) with the equivalent open-source version of Spark. We ran both the tests with data in Amazon Simple Storage Service (Amazon S3).

Dynamic Resource Allocation (DRA) is a great feature to use for varying workloads. However, for a benchmarking exercise where we compare two platforms purely on performance, and test data volumes don’t change (3 TB in our case), we believe it’s best to avoid variability in order to run an apples-to-apples comparison. In our tests in both open-source Spark and Amazon EMR, we disabled DRA while running the benchmarking application.

The following table shows the total job runtime for all queries (in seconds) in the 3 TB query dataset between Amazon EMR version 6.9.0 and open-source Spark version 3.3.0. We observed that our TPC-DS tests had a total job runtime on Amazon EMR on Amazon EC2 that was 3.5 times faster than that using an open-source Spark cluster of the same configuration.

The per-query speedup on Amazon EMR 6.9 with and without the EMR runtime for Apache Spark is illustrated in the following chart. The horizontal axis shows each query in the 3 TB benchmark. The vertical axis shows the speedup of each query due to the EMR runtime. Notable performance gains are over 10 times faster for TPC-DS queries 24b, 72, 95, and 96.

Cost analysis

The performance improvements of the EMR runtime for Apache Spark directly translate to lower costs. We were able to realize a 67% cost savings running the benchmark application on Amazon EMR in comparison with the cost incurred to run the same application on open-source Spark on Amazon EC2 with the same cluster sizing due to reduced hours of Amazon EMR and Amazon EC2 usage. Amazon EMR pricing is for EMR applications running on EMR clusters with EC2 instances. The Amazon EMR price is added to the underlying compute and storage prices such as EC2 instance price and Amazon Elastic Block Store (Amazon EBS) cost (if attaching EBS volumes). Overall, the estimated benchmark cost in the US East (N. Virginia) Region is $27.01 per run for the open-source Spark on Amazon EC2 and $8.82 per run for Amazon EMR.

Benchmark Job Runtime (Hour) Estimated Cost Total EC2 Instance Total vCPU Total Memory (GiB) Root Device (Amazon EBS)

Open-source Spark on Amazon EC2

(1 primary and 6 core nodes)

2.23 $27.01 7 252 504 20 GiB gp2

Amazon EMR on Amazon EC2

(1 primary and 6 core nodes)

0.63 $8.82 7 252 504 20 GiB gp2

Cost breakdown

The following is the cost breakdown for the open-source Spark on Amazon EC2 job ($27.01):

  • Total Amazon EC2 cost – (7 * $1.728 * 2.23) = (number of instances * c5d.9xlarge hourly rate * job runtime in hour) = $26.97
  • Amazon EBS cost – ($0.1/730 * 20 * 7 * 2.23) = (Amazon EBS per GB-hourly rate * root EBS size * number of instances * job runtime in hour) = $0.042

The following is the cost breakdown for the Amazon EMR on Amazon EC2 job ($8.82):

  • Total Amazon EMR cost – (7 * $0.27 * 0.63) = ((number of core nodes + number of primary nodes)* c5d.9xlarge Amazon EMR price * job runtime in hour) = $1.19
  • Total Amazon EC2 cost – (7 * $1.728 * 0.63) = ((number of core nodes + number of primary nodes)* c5d.9xlarge instance price * job runtime in hour) = $7.62
  • Amazon EBS cost – ($0.1/730 * 20 GiB * 7 * 0.63) = (Amazon EBS per GB-hourly rate * EBS size * number of instances * job runtime in hour) = $0.012

Set up OSS Spark benchmarking

In the following sections, we provide a brief outline of the steps involved in setting up the benchmarking. For detailed instructions with examples, refer to the GitHub repo.

For our OSS Spark benchmarking, we use the open-source tool Flintrock to launch our Amazon EC2-based Apache Spark cluster. Flintrock provides a quick way to launch an Apache Spark cluster on Amazon EC2 using the command line.

Prerequisites

Complete the following prerequisite steps:

  1. Have Python 3.7.x or above.
  2. Have Pip3 22.2.2 or above.
  3. Add the Python bin directory to your environment path. The Flintrock binary will be installed in this path.
  4. Run aws configure to configure your AWS Command Line Interface (AWS CLI) shell to point to the benchmarking account. Refer to Quick configuration with aws configure for instructions.
  5. Have a key pair with restrictive file permissions to access the OSS Spark primary node.
  6. Create a new S3 bucket in your test account if needed.
  7. Copy the TPC-DS source data as input to your S3 bucket.
  8. Build the benchmark application following the steps provided in Steps to build spark-benchmark-assembly application. Alternatively, you can download a pre-built spark-benchmark-assembly-3.3.0.jar if you want a Spark 3.3.0-based application.

Deploy the Spark cluster and run the benchmark job

Complete the following steps:

  1. Install the Flintrock tool via pip as shown in Steps to setup OSS Spark Benchmarking.
  2. Run the command flintrock configure, which pops up a default configuration file.
  3. Modify the default config.yaml file based on your needs. Alternatively, copy and paste the config.yaml file content to the default configure file. Then save the file to where it was.
  4. Finally, launch the 7-node Spark cluster on Amazon EC2 via Flintrock.

This should create a Spark cluster with one primary node and six worker nodes. If you see any error messages, double-check the config file values, especially the Spark and Hadoop versions and the attributes of download-source and the AMI.

The OSS Spark cluster doesn’t come with YARN resource manager. To enable it, we need to configure the cluster.

  1. Download the yarn-site.xml and enable-yarn.sh files from the GitHub repo.
  2. Replace <private ip of primary node> with the IP address of the primary node in your Flintrock cluster.

You can retrieve the IP address from the Amazon EC2 console.

  1. Upload the files to all the nodes of the Spark cluster.
  2. Run the enable-yarn script.
  3. Enable Snappy support in Hadoop (the benchmark job reads Snappy compressed data).
  4. Download the benchmark utility application JAR file spark-benchmark-assembly-3.3.0.jar to your local machine.
  5. Copy this file to the cluster.
  6. Log in to the primary node and start YARN.
  7. Submit the benchmark job on the open-source Spark cluster as shown in Submit the benchmark job.

Summarize the results

Download the test result file from the output S3 bucket s3://$YOUR_S3_BUCKET/EC2_TPCDS-TEST-3T-RESULT/timestamp=xxxx/summary.csv/xxx.csv. (Replace $YOUR_S3_BUCKET with your S3 bucket name.) You can use the Amazon S3 console and navigate to the output S3 location or use the AWS CLI.

The Spark benchmark application creates a timestamp folder and writes a summary file inside a summary.csv prefix. Your timestamp and file name will be different from the one shown in the preceding example.

The output CSV files have four columns without header names. They are:

  • Query name
  • Median time
  • Minimum time
  • Maximum time

The following screenshot shows a sample output. We have manually added column names. The way we calculate the geomean and the total job runtime is based on arithmetic means. We first take the mean of the med, min, and max values using the formula AVERAGE(B2:D2). Then we take a geometric mean of the Avg column using the formula GEOMEAN(E2:E105).

Set up Amazon EMR benchmarking

For detailed instructions, see Steps to setup EMR Benchmarking.

Prerequisites

Complete the following prerequisite steps:

  1. Run aws configure to configure your AWS CLI shell to point to the benchmarking account. Refer to Quick configuration with aws configure for instructions.
  2. Upload the benchmark application to Amazon S3.

Deploy the EMR cluster and run the benchmark job

Complete the following steps:

  1. Spin up Amazon EMR in your AWS CLI shell using command line as shown in Deploy EMR Cluster and run benchmark job.
  2. Configure Amazon EMR with one primary (c5d.9xlarge) and six core (c5d.9xlarge) nodes. Refer to create-cluster for a detailed description of AWS CLI options.
  3. Store the cluster ID from the response. You need this in the next step.
  4. Submit the benchmark job in Amazon EMR using add-steps in the AWS CLI.

Summarize the results

Summarize the results from the output bucket s3://$YOUR_S3_BUCKET/blog/EMRONEC2_TPCDS-TEST-3T-RESULT in the same manner as we did for the OSS results and compare.

Clean up

To avoid incurring future charges, delete the resources you created using the instructions in the Cleanup section of the GitHub repo.

  1. Stop the EMR and OSS Spark clusters. You may also delete them if you don’t want to retain the content. You can delete these resources by running the script cleanup-benchmark-env.sh from a terminal in your benchmark environment.
  2. If you used AWS Cloud9 as your IDE for building the benchmark application JAR file using Steps to build spark-benchmark-assembly application, you may want to delete the environment as well.

Conclusion

You can run your Apache Spark workloads 3.5 times (based on total runtime) faster and at lower cost without making any changes to your applications by using Amazon EMR 6.9.0.

To keep up to date, subscribe to the Big Data Blog’s RSS feed to learn more about the EMR runtime for Apache Spark, configuration best practices, and tuning advice.

For past benchmark tests, see Run Apache Spark 3.0 workloads 1.7 times faster with Amazon EMR runtime for Apache Spark. Note that the past benchmark result of 1.7 times performance was based on geometric mean. Based on geometric mean, the performance in Amazon EMR 6.9 was two times faster.


About the authors

Sekar Srinivasan is a Sr. Specialist Solutions Architect at AWS focused on Big Data and Analytics. Sekar has over 20 years of experience working with data. He is passionate about helping customers build scalable solutions modernizing their architecture and generating insights from their data. In his spare time he likes to work on non-profit projects, especially those focused on underprivileged Children’s education.

Prabu Ravichandran is a Senior Data Architect with Amazon Web Services, focussed on Analytics, data Lake architecture and implementation. He helps customers architect and build scalable and robust solutions using AWS services. In his free time, Prabu enjoys traveling and spending time with family.

Deliver Operational Insights to Atlassian Opsgenie using DevOps Guru

Post Syndicated from Brendan Jenkins original https://aws.amazon.com/blogs/devops/deliver-operational-insights-to-atlassian-opsgenie-using-devops-guru/

As organizations continue to grow and scale their applications, the need for teams to be able to quickly and autonomously detect anomalous operational behaviors becomes increasingly important. Amazon DevOps Guru offers a fully managed AIOps service that enables you to improve application availability and resolve operational issues quickly. DevOps Guru helps ease this process by leveraging machine learning (ML) powered recommendations to detect operational insights, identify the exhaustion of resources, and provide suggestions to remediate issues. Many organizations running business critical applications use different tools to be notified about anomalous events in real-time for the remediation of critical issues. Atlassian is a modern team collaboration and productivity software suite that helps teams organize, discuss, and complete shared work. You can deliver these insights in near-real time to DevOps teams by integrating DevOps Guru with Atlassian Opsgenie. Opsgenie is a modern incident management platform that receives alerts from your monitoring systems and custom applications and categorizes each alert based on importance and timing.

This blog post walks you through how to integrate Amazon DevOps Guru with Atlassian Opsgenie to
receive notifications for new operational insights detected by DevOps Guru with more flexibility and customization using Amazon EventBridge and AWS Lambda. The Lambda function will be used to demonstrate how to customize insights sent to Opsgenie.

Solution overview

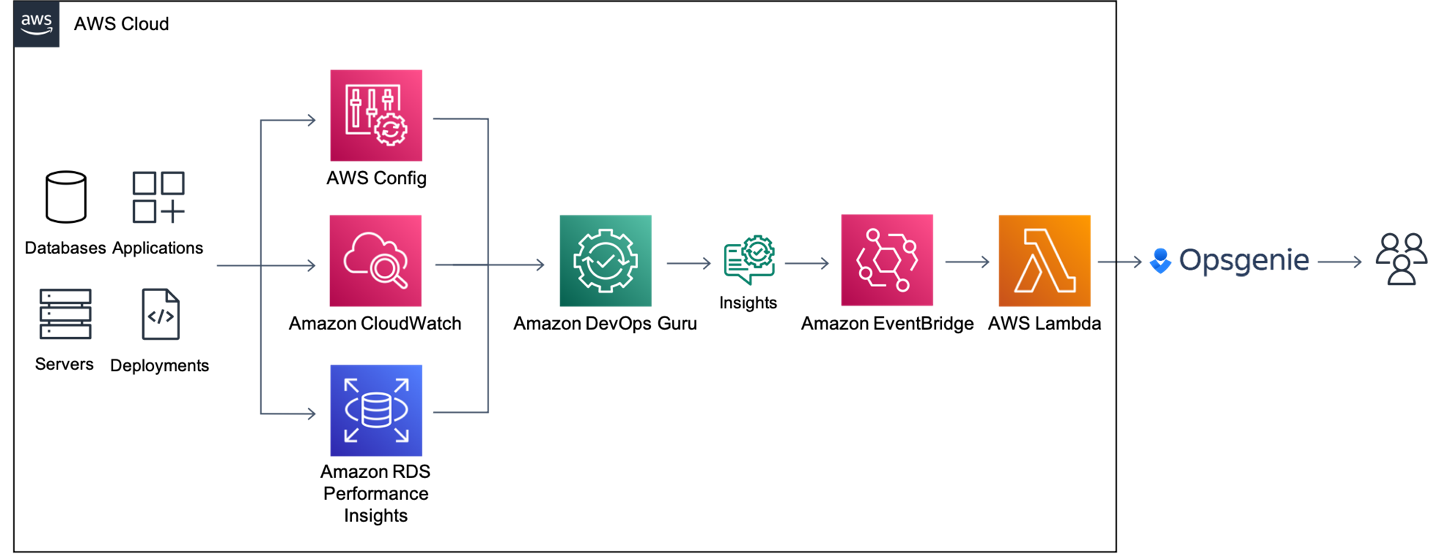
Figure 1: Amazon EventBridge Integration with Opsgenie using AWS Lambda

Figure 1: Amazon EventBridge Integration with Opsgenie using AWS Lambda

Amazon DevOps Guru directly integrates with Amazon EventBridge to notify you of events relating to generated insights and updates to insights. To begin routing these notifications to Opsgenie, you can configure routing rules to determine where to send notifications. As outlined below, you can also use pre-defined DevOps Guru patterns to only send notifications or trigger actions that match that pattern. You can select any of the following pre-defined patterns to filter events to trigger actions in a supported AWS resource. Here are the following predefined patterns supported by DevOps Guru:

  • DevOps Guru New Insight Open
  • DevOps Guru New Anomaly Association
  • DevOps Guru Insight Severity Upgraded
  • DevOps Guru New Recommendation Created
  • DevOps Guru Insight Closed

By default, the patterns referenced above are enabled so we will leave all patterns operational in this implementation.  However, you do have flexibility to change which of these patterns to choose to send to Opsgenie. When EventBridge receives an event, the EventBridge rule matches incoming events and sends it to a target, such as AWS Lambda, to process and send the insight to Opsgenie.

Prerequisites

The following prerequisites are required for this walkthrough:

Push Insights using Amazon EventBridge & AWS Lambda

In this tutorial, you will perform the following steps:

  1. Create an Opsgenie integration
  2. Launch the SAM template to deploy the solution
  3. Test the solution

Create an Opsgenie integration

In this step, you will navigate to Opsgenie to create the integration with DevOps Guru and to obtain the API key and team name within your account. These parameters will be used as inputs in a later section of this blog.

  1. Navigate to Teams, and take note of the team name you have as shown below, as you will need this parameter in a later section.
Figure 2: Opsgenie team names

Figure 2: Opsgenie team names

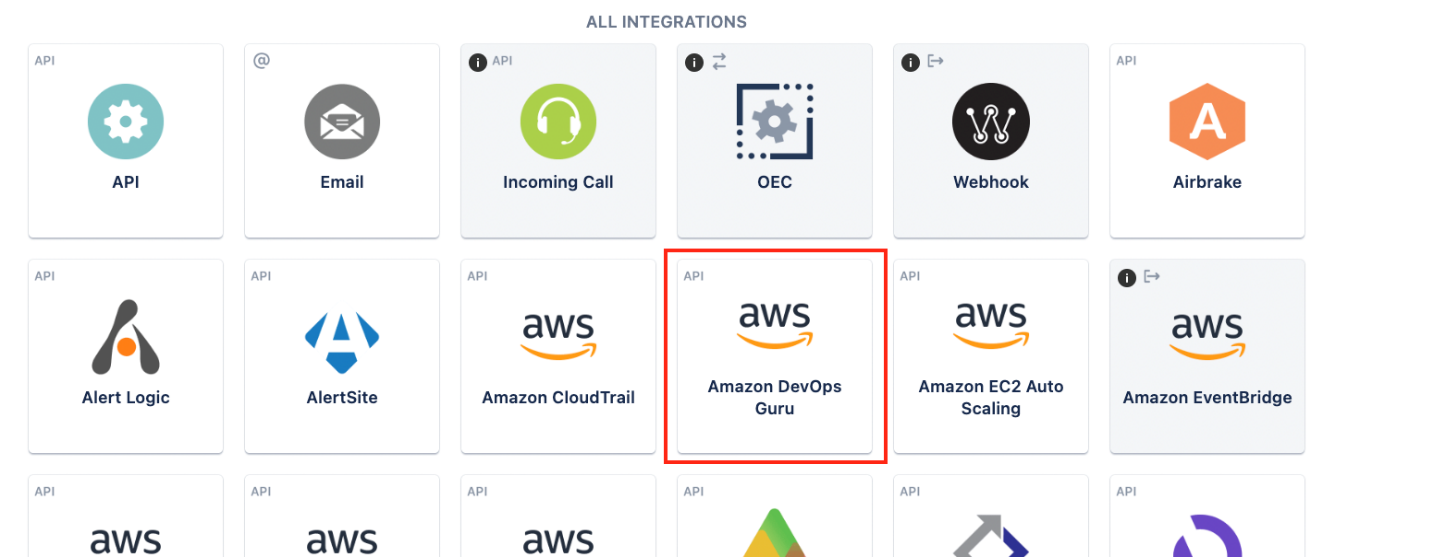
  1. Click on the team to proceed and navigate to Integrations on the left-hand pane. Click on Add Integration and select the Amazon DevOps Guru option.
Figure 3: Integration option for DevOps Guru

Figure 3: Integration option for DevOps Guru

  1. Now, scroll down and take note of the API Key for this integration and copy it to your notes as it will be needed in a later section. Click Save Integration at the bottom of the page to proceed.

­­­

 Figure 4: API Key for DevOps Guru Integration

Figure 4: API Key for DevOps Guru Integration

  1. Now, the Opsgenie integration has been created and we’ve obtained the API key and team name. The email of any team member will be used in the next section as well.

Review & launch the AWS SAM template to deploy the solution

In this step, you will review & launch the SAM template. The template will deploy an AWS Lambda function that is triggered by an Amazon EventBridge rule when Amazon DevOps Guru generates a new event. The Lambda function will retrieve the parameters obtained from the deployment and pushes the events to Opsgenie via an API.

Reviewing the template

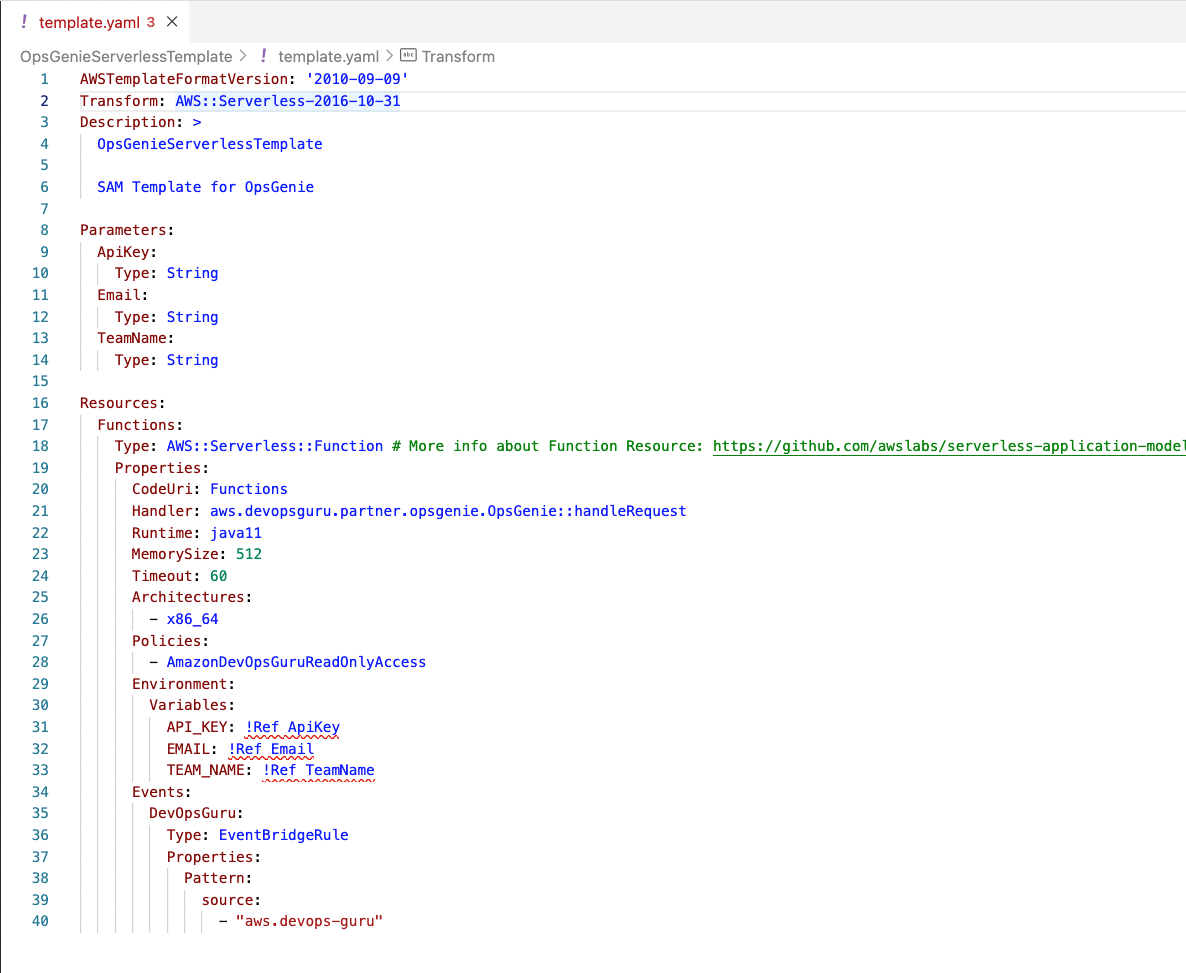
Below is the SAM template that will be deployed in the next step. This template launches a few key components specified earlier in the blog. The Transform section of the template allows us takes an entire template written in the AWS Serverless Application Model (AWS SAM) syntax and transforms and expands it into a compliant CloudFormation template. Under the Resources section this solution will deploy an AWS Lamba function using the Java runtime as well as an Amazon EventBridge Rule/Pattern. Another key aspect of the template are the Parameters. As shown below, the ApiKey, Email, and TeamName are parameters we will use for this CloudFormation template which will then be used as environment variables for our Lambda function to pass to OpsGenie.

Figure 5: Review of SAM Template

Figure 5: Review of SAM Template

Launching the Template

  1. Navigate to the directory of choice within a terminal and clone the GitHub repository with the following command:
  1. Change directories with the command below to navigate to the directory of the SAM template.
cd amazon-devops-guru-connector-opsgenie/OpsGenieServerlessTemplate
  1. From the CLI, use the AWS SAM to build and process your AWS SAM template file, application code, and any applicable language-specific files and dependencies.
sam build
  1. From the CLI, use the AWS SAM to deploy the AWS resources for the pattern as specified in the template.yml file.
sam deploy --guided
  1. You will now be prompted to enter the following information below. Use the information obtained from the previous section to enter the Parameter ApiKey, Parameter Email, and Parameter TeamName fields.
  •  Stack Name
  • AWS Region
  • Parameter ApiKey
  • Parameter Email
  • Parameter TeamName
  • Allow SAM CLI IAM Role Creation

Test the solution

  1. Follow this blog to enable DevOps Guru and generate an operational insight.
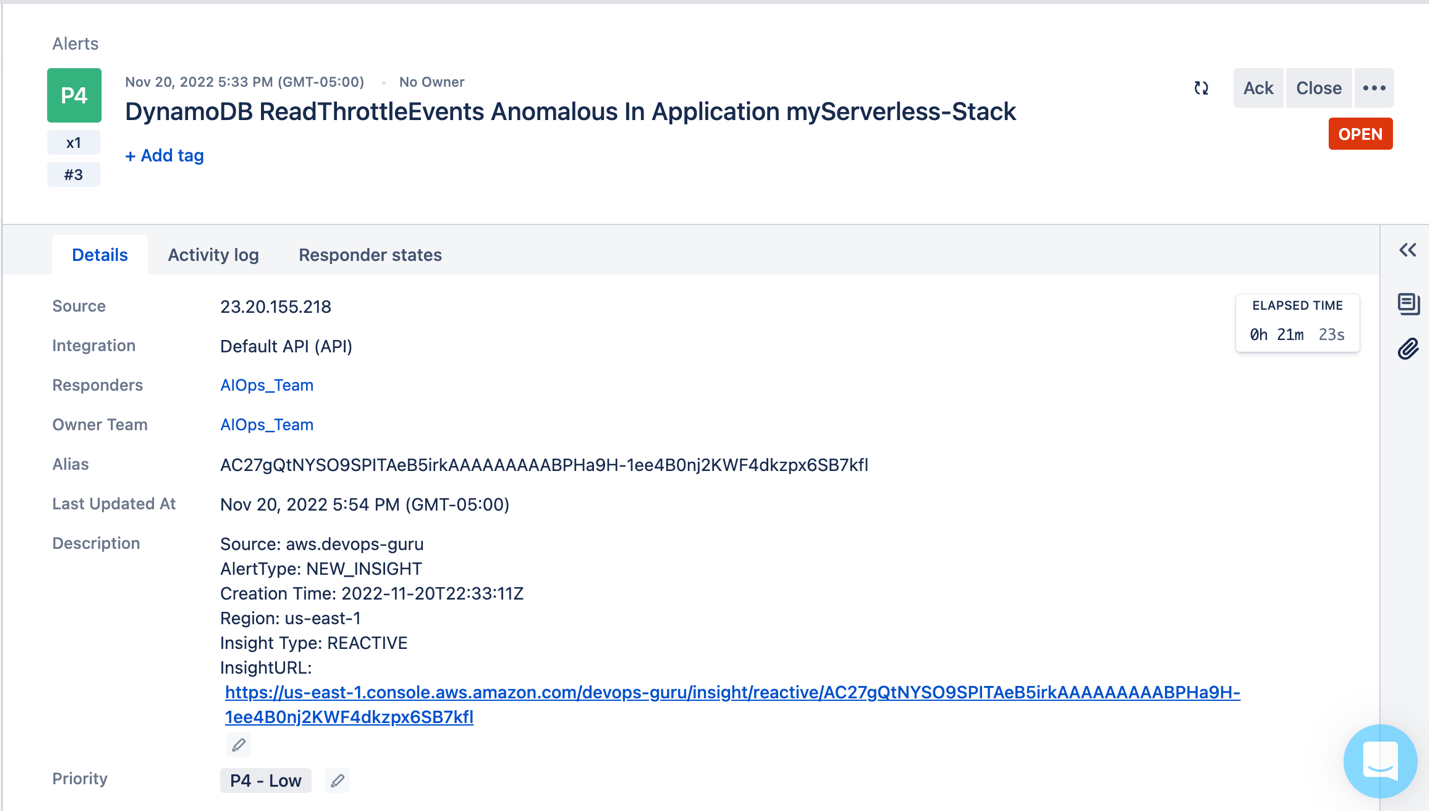
  2. When DevOps Guru detects a new insight, it will generate an event in EventBridge. EventBridge then triggers Lambda and sends the event to Opsgenie as shown below.
Figure 6: Event Published to Opsgenie with details such as the source, alert type, insight type, and a URL to the insight in the AWS console.

Figure 6: Event Published to Opsgenie with details such as the source, alert type, insight type, and a URL to the insight in the AWS console.enecccdgruicnuelinbbbigebgtfcgdjknrjnjfglclt

Cleaning up

To avoid incurring future charges, delete the resources.

  1. Delete resources deployed from this blog.
  2. From the command line, use AWS SAM to delete the serverless application along with its dependencies.
sam delete

Customizing Insights published using Amazon EventBridge & AWS Lambda

The foundation of the DevOps Guru and Opsgenie integration is based on Amazon EventBridge and AWS Lambda which allows you the flexibility to implement several customizations. An example of this would be the ability to generate an Opsgenie alert when a DevOps Guru insight severity is high. Another example would be the ability to forward appropriate notifications to the AIOps team when there is a serverless-related resource issue or forwarding a database-related resource issue to your DBA team. This section will walk you through how these customizations can be done.

EventBridge customization

EventBridge rules can be used to select specific events by using event patterns. As detailed below, you can trigger the lambda function only if a new insight is opened and the severity is high. The advantage of this kind of customization is that the Lambda function will only be invoked when needed.

{
  "source": [
    "aws.devops-guru"
  ],
  "detail-type": [
    "DevOps Guru New Insight Open"
  ],
  "detail": {
    "insightSeverity": [
         "high"
         ]
  }
}

Applying EventBridge customization

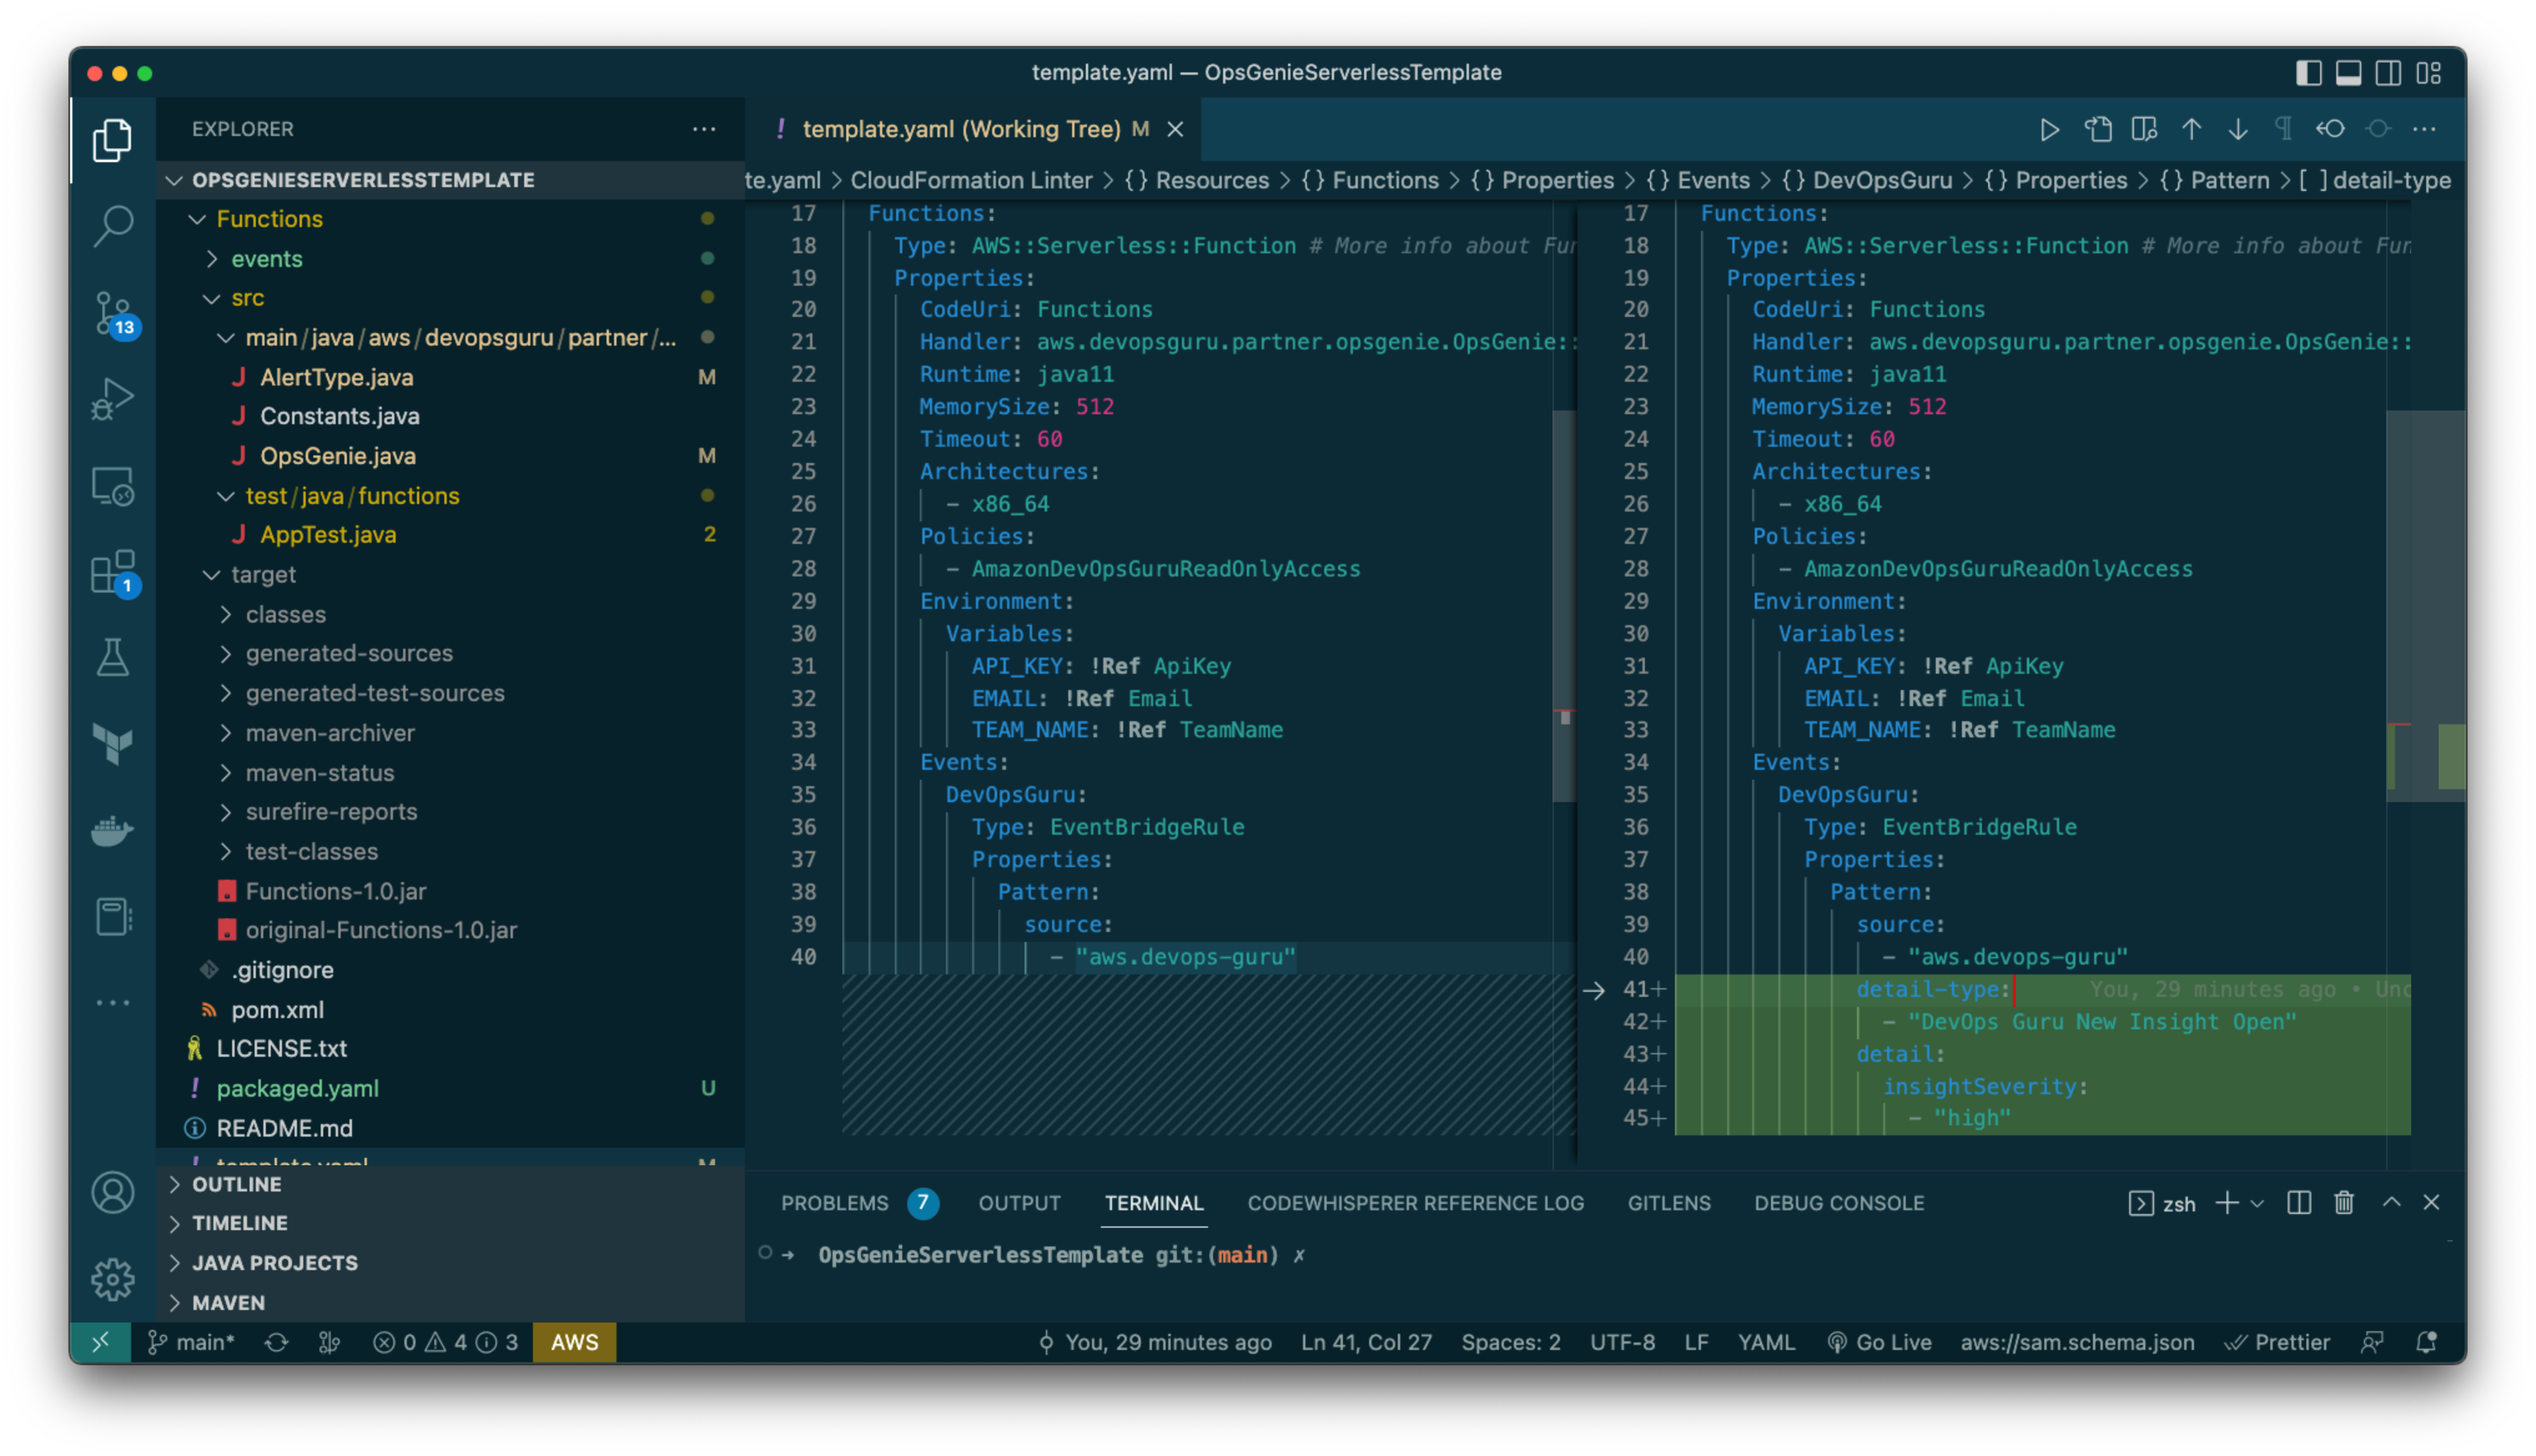
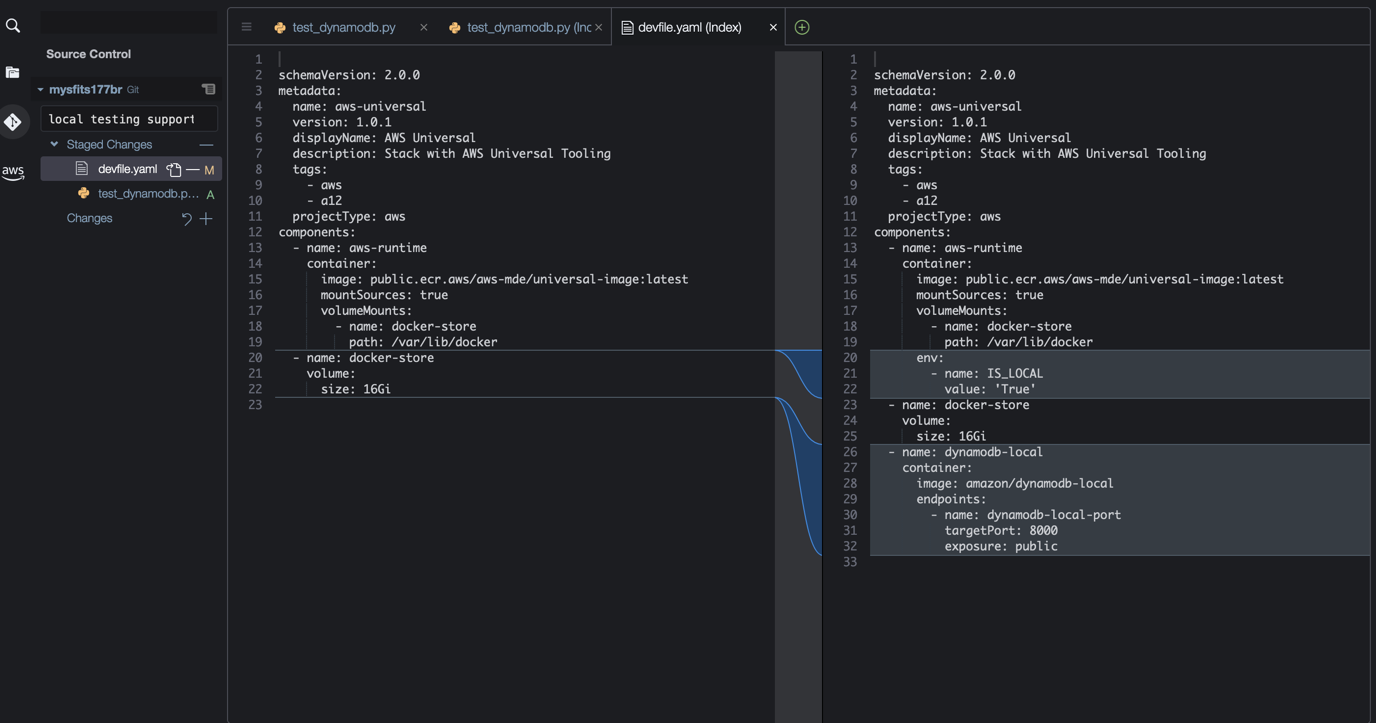
  1. Open the file template.yaml reviewed in the previous section and implement the changes as highlighted below under the Events section within resources (original file on the left, changes on the right hand side).
Figure 7: CloudFormation template file changed so that the EventBridge rule is only triggered when the alert type is "DevOps Guru New Insight Open" and insightSeverity is “high”.

Figure 7: CloudFormation template file changed so that the EventBridge rule is only triggered when the alert type is “DevOps Guru New Insight Open” and insightSeverity is “high”.

  1. Save the changes and use the following command to apply the changes
sam deploy --template-file template.yaml
  1. Accept the changeset deployment

Determining the Ops team based on the resource type

Another customization would be to change the Lambda code to route and control how alerts will be managed.  Let’s say you want to get your DBA team involved whenever DevOps Guru raises an insight related to an Amazon RDS resource. You can change the AlertType Java class as follows:

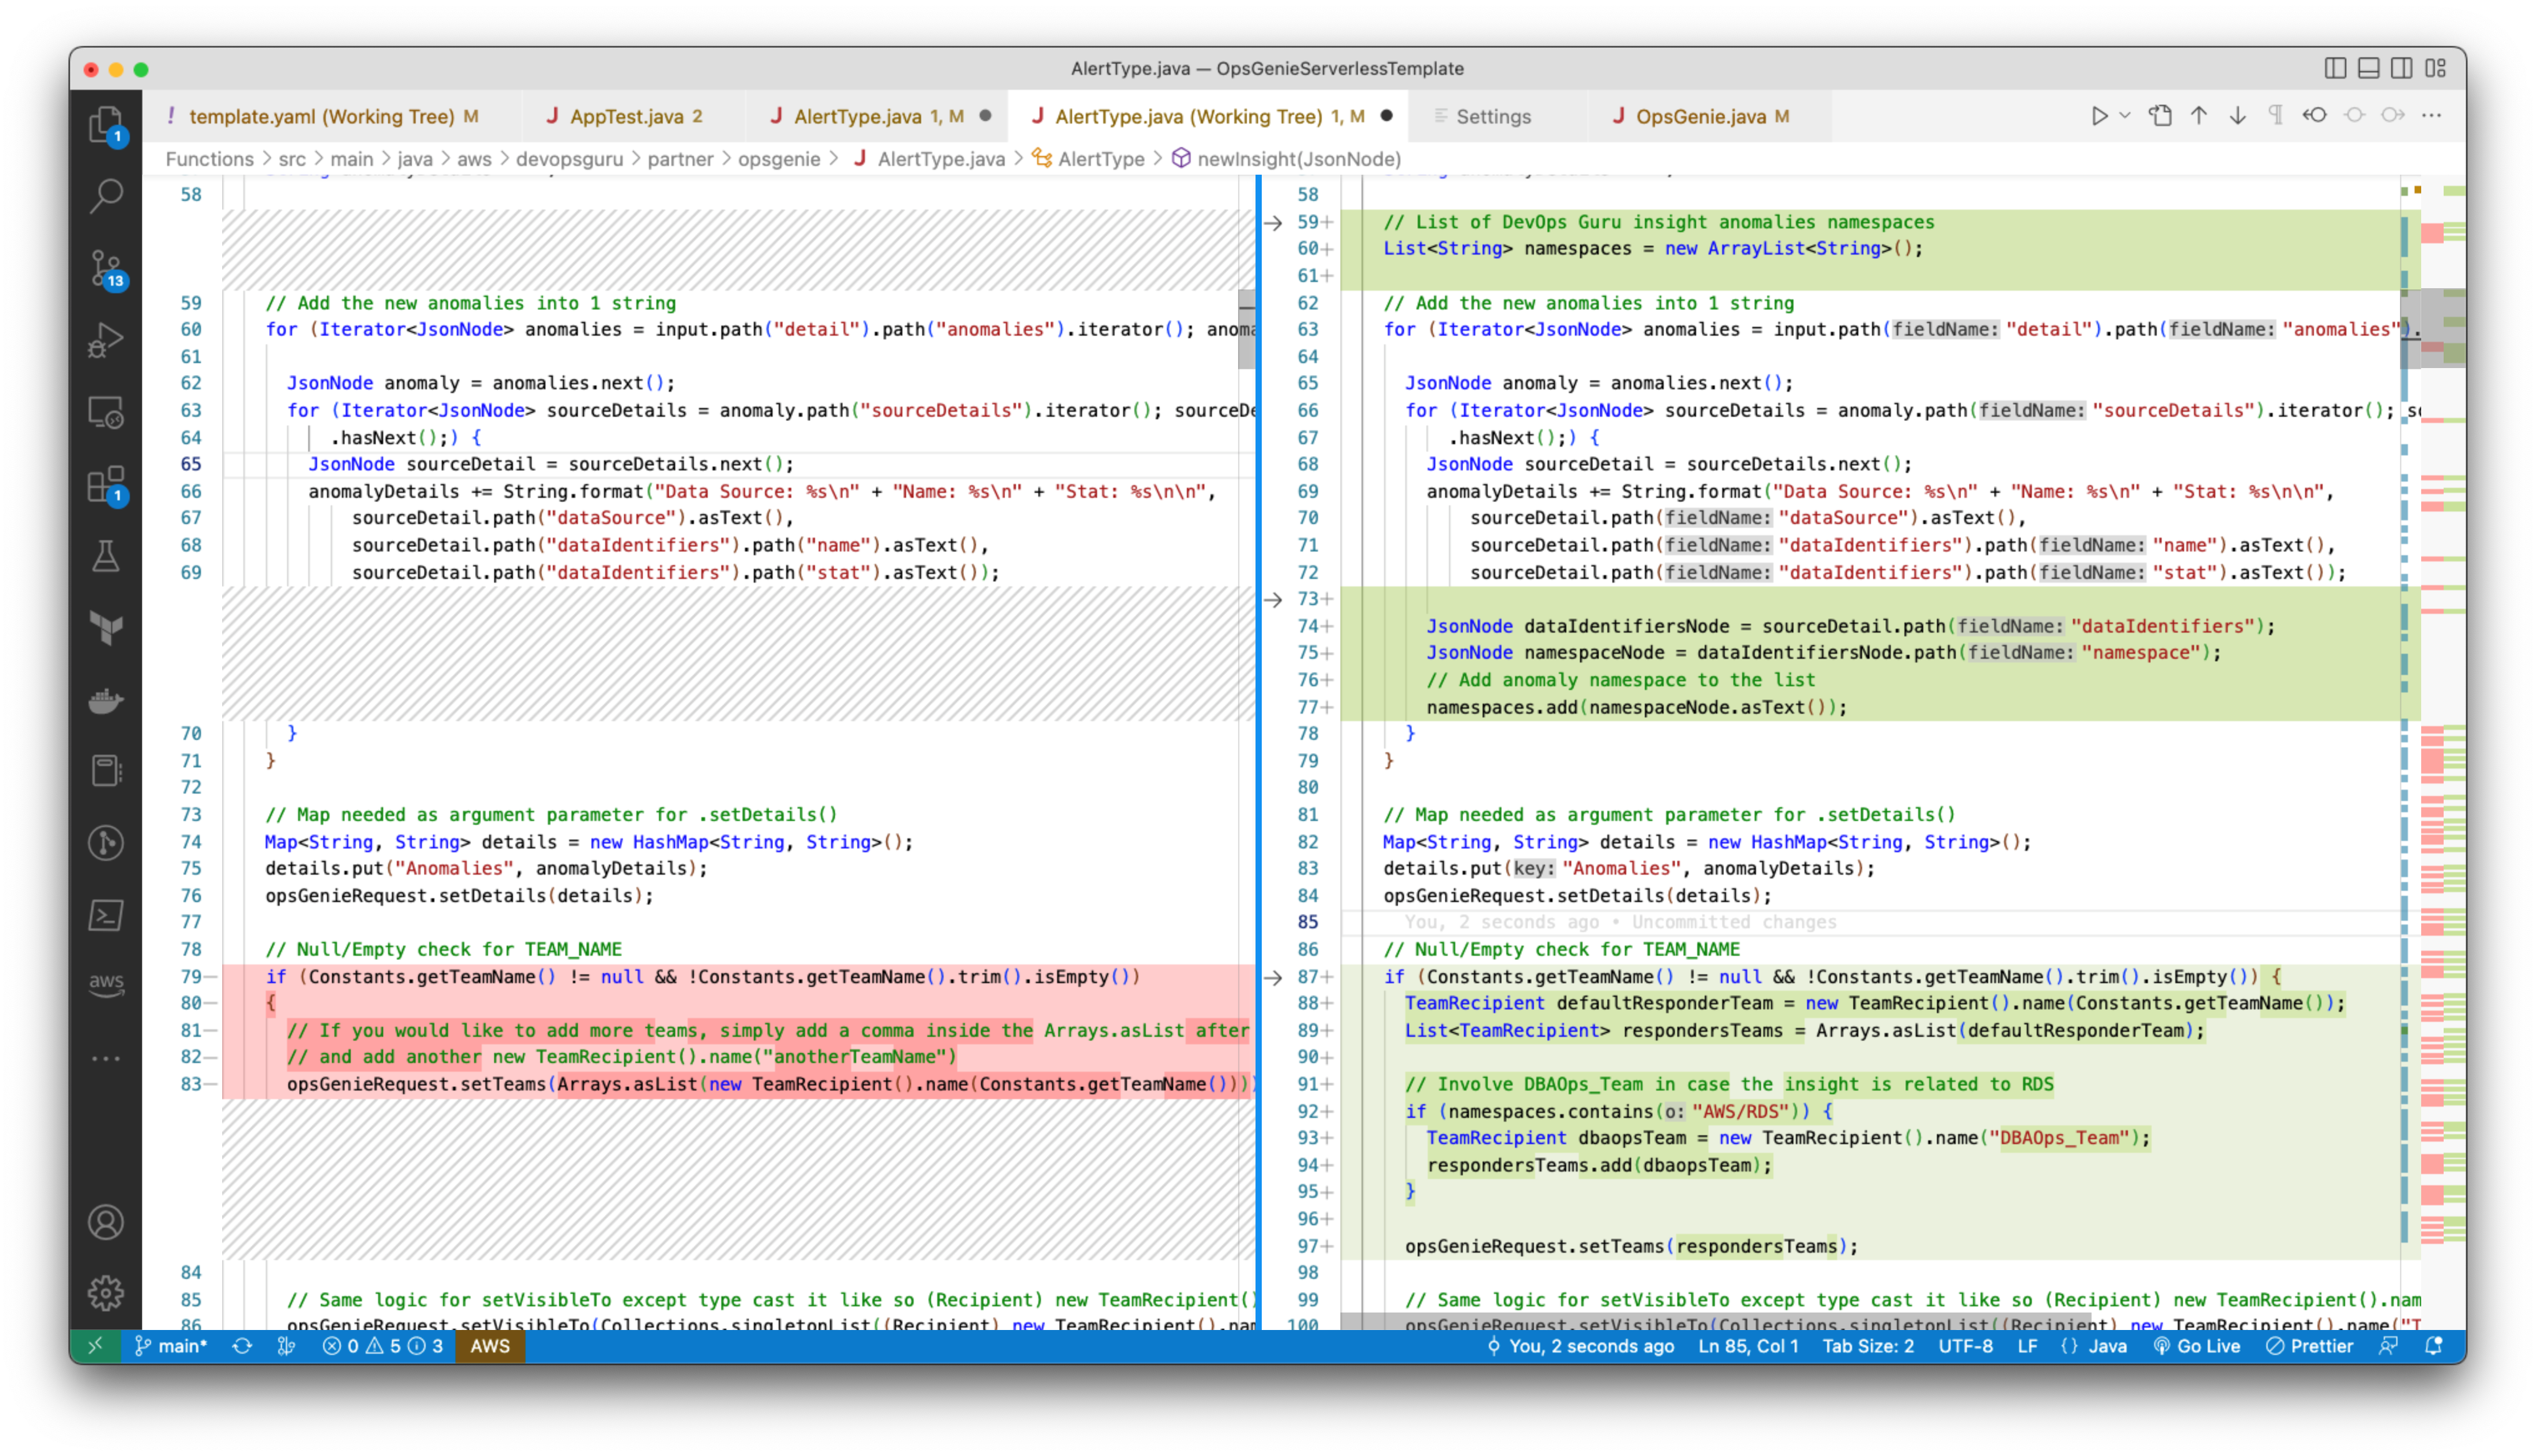
  1. To begin this customization of the Lambda code, the following changes need to be made within the AlertType.java file:
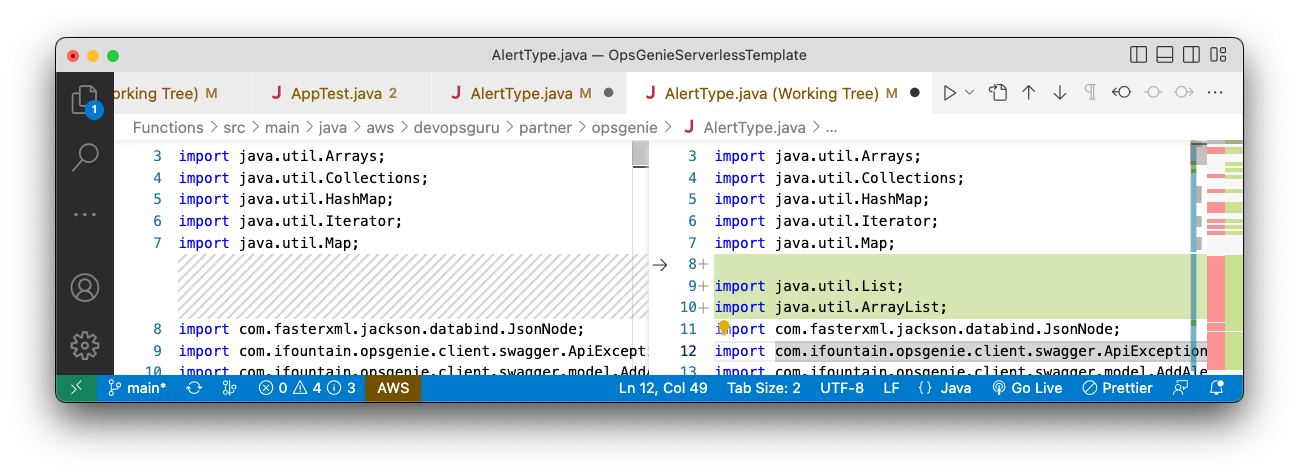
  • At the beginning of the file, the standard java.util.List and java.util.ArrayList packages were imported
  • Line 60: created a list of CloudWatch metrics namespaces
  • Line 74: Assigned the dataIdentifiers JsonNode to the variable dataIdentifiersNode
  • Line 75: Assigned the namespace JsonNode to a variable namespaceNode
  • Line 77: Added the namespace to the list for each DevOps Insight which is always raised as an EventBridge event with the structure detail►anomalies►0►sourceDetails►0►dataIdentifiers►namespace
  • Line 88: Assigned the default responder team to the variable defaultResponderTeam
  • Line 89: Created the list of responders and assigned it to the variable respondersTeam
  • Line 92: Check if there is at least one AWS/RDS namespace
  • Line 93: Assigned the DBAOps_Team to the variable dbaopsTeam
  • Line 93: Included the DBAOps_Team team as part of the responders list
  • Line 97: Set the OpsGenie request teams to be the responders list
Figure 8: java.util.List and java.util.ArrayList packages were imported

Figure 8: java.util.List and java.util.ArrayList packages were imported


Figure 9: AlertType Java class customized to include DBAOps_Team for RDS-related DevOps Guru insights.

Figure 9: AlertType Java class customized to include DBAOps_Team for RDS-related DevOps Guru insights.


  1. You then need to generate the jar file by using the mvn clean package command.
  • The function needs to be updated with:
    • FUNCTION_NAME=$(aws lambda
      list-functions –query ‘Functions[?contains(FunctionName, `DevOps-Guru`) ==
      `true`].FunctionName’ –output text)
    • aws lambda update-function-code –region
      us-east-1 –function-name $FUNCTION_NAME –zip-file fileb://target/Functions-1.0.jar
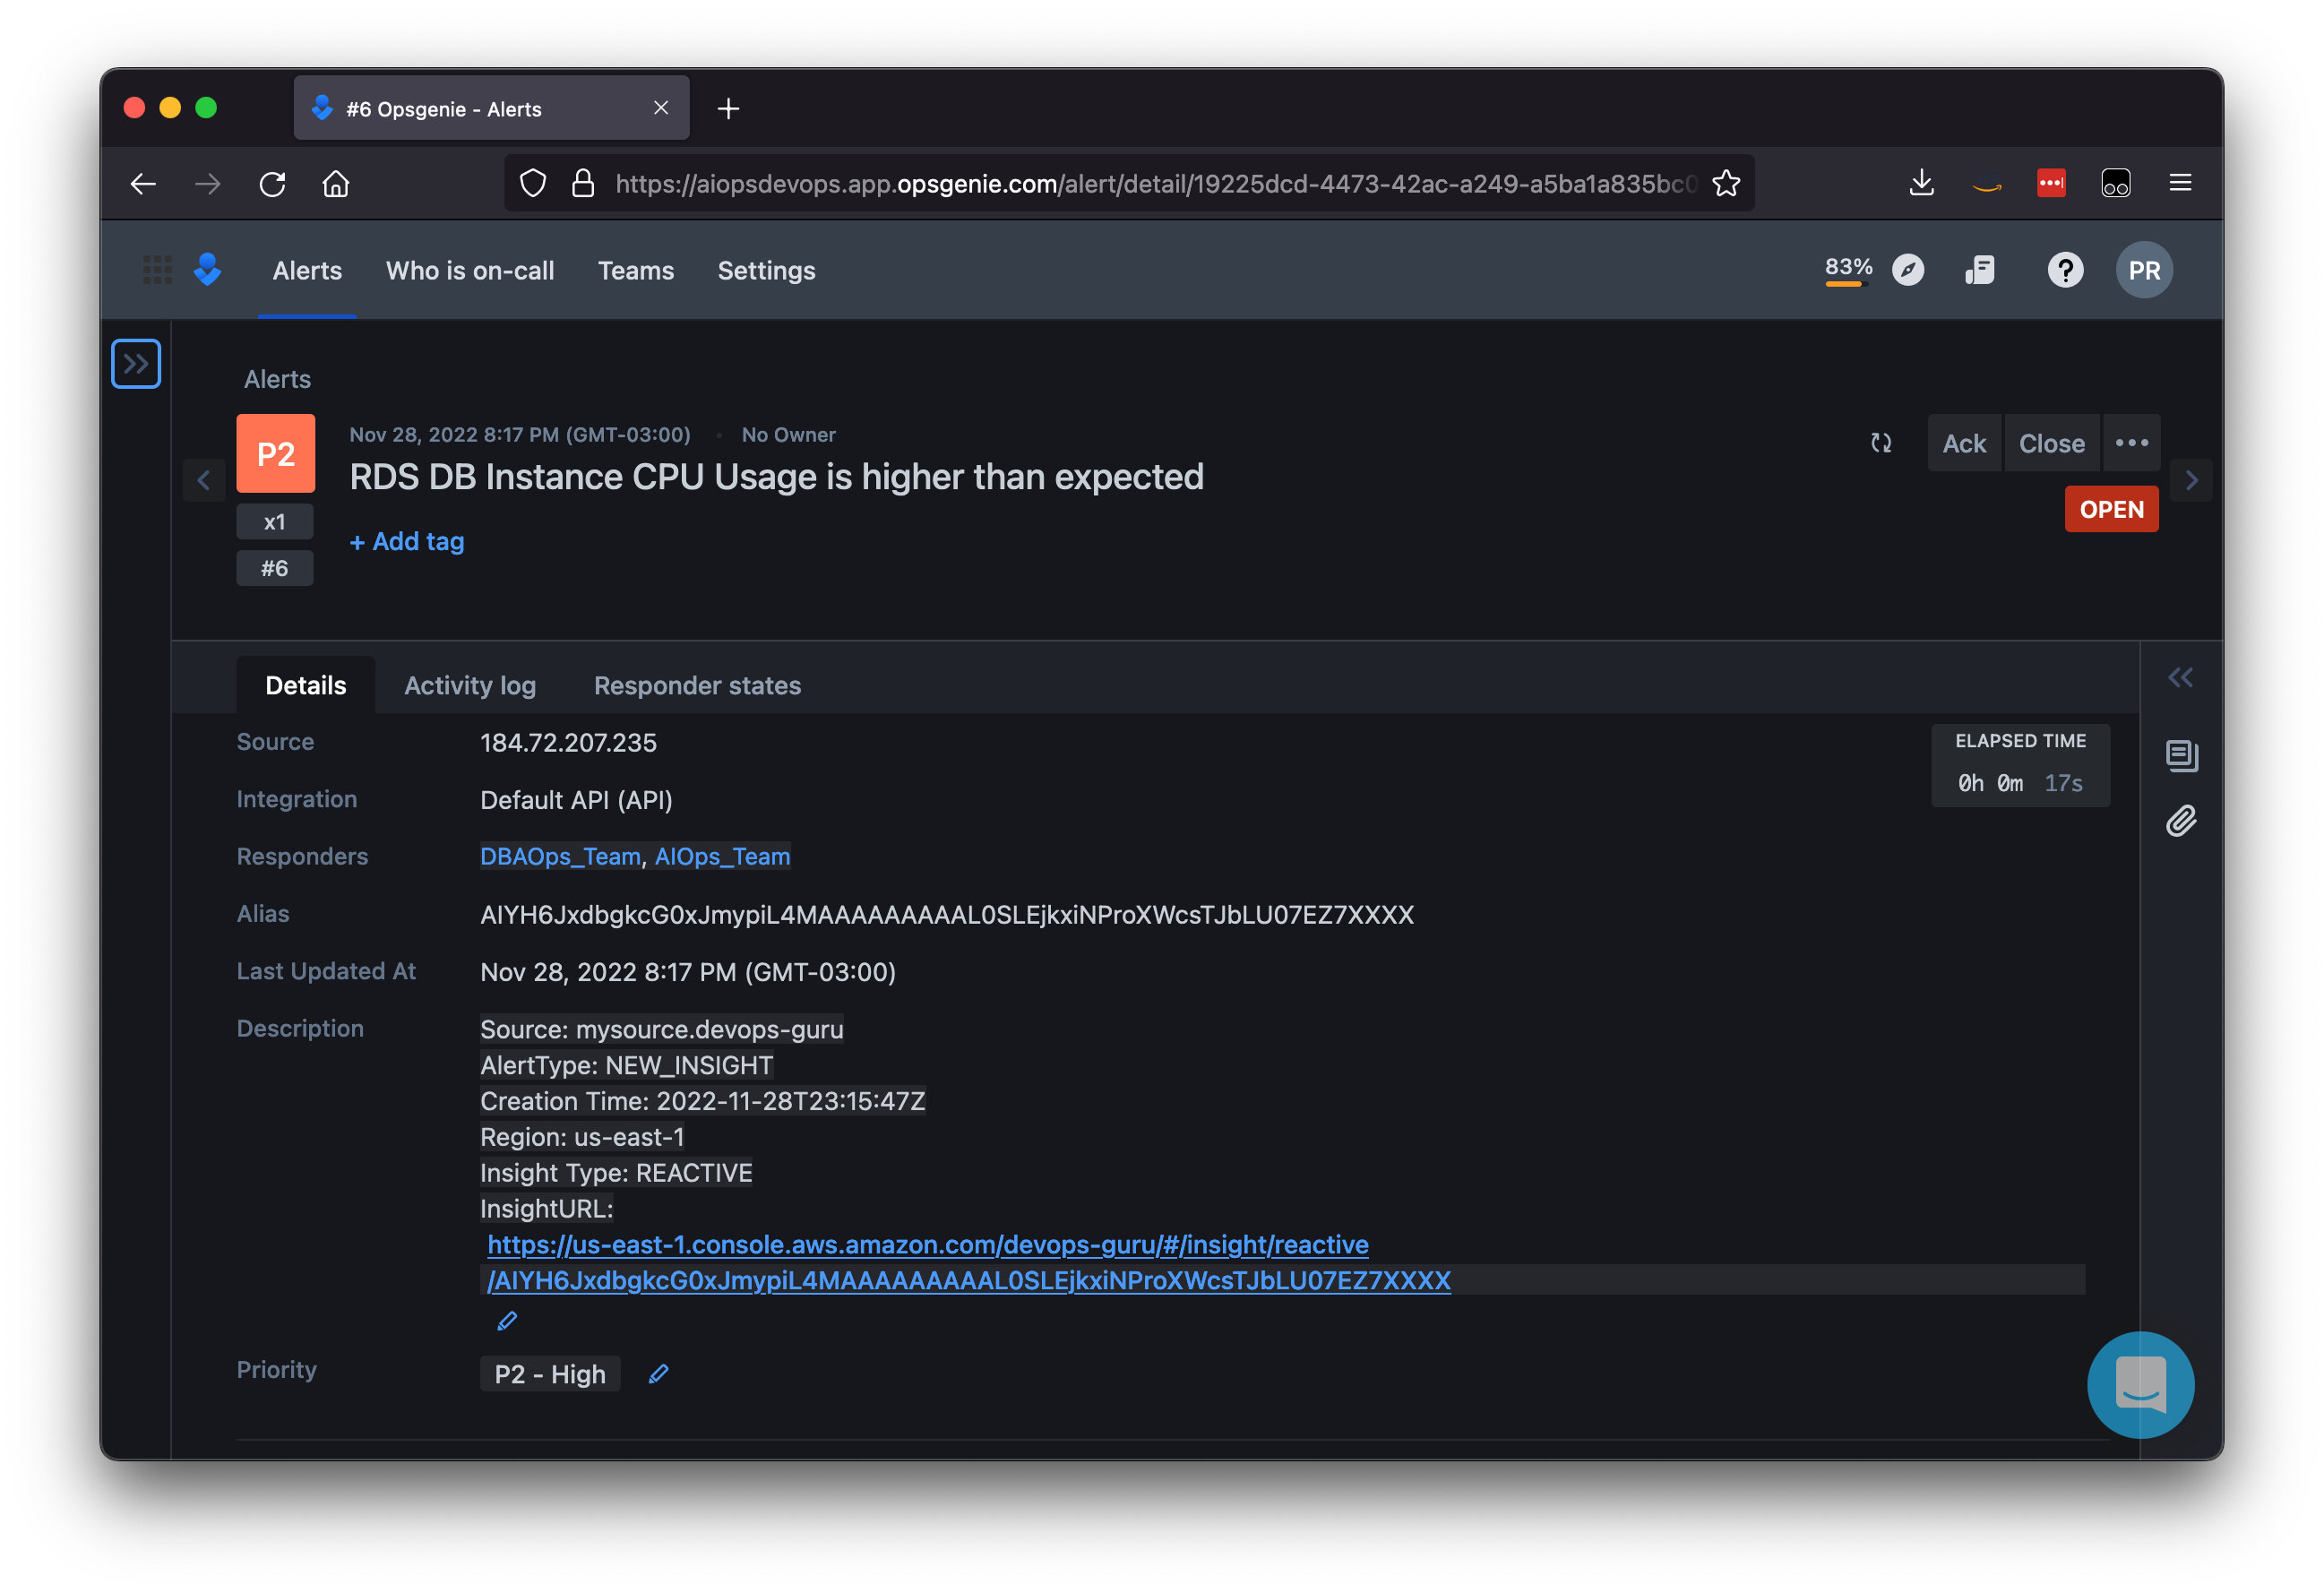
  1. As result, the DBAOps_Team will be assigned to the Opsgenie alert in the case a DevOps Guru Insight is related to RDS.
Figure 10: Opsgenie alert assigned to both DBAOps_Team and AIOps_Team.

Figure 10: Opsgenie alert assigned to both DBAOps_Team and AIOps_Team.

Conclusion

In this post, you learned how Amazon DevOps Guru integrates with Amazon EventBridge and publishes insights to Opsgenie using AWS Lambda. By creating an Opsgenie integration with DevOps Guru, you can now leverage Opsgenie strengths, incident management, team communication, and collaboration when responding to an insight. All of the insight data can be viewed and addressed in Opsgenie’s Incident Command Center (ICC).  By customizing the data sent to Opsgenie via Lambda, you can empower your organization even more by fine tuning and displaying the most relevant data thus decreasing the MTTR (mean time to resolve) of the responding operations team.

About the authors:

Brendan Jenkins

Brendan Jenkins is a solutions architect working with Enterprise AWS customers providing them with technical guidance and helping achieve their business goals. He has an area of interest around DevOps and Machine Learning technology. He enjoys building solutions for customers whenever he can in his spare time.

Pablo Silva

Pablo Silva is a Sr. DevOps consultant that guide customers in their decisions on technology strategy, business model, operating model, technical architecture, and investments.

He holds a master’s degree in Artificial Intelligence and has more than 10 years of experience with telecommunication and financial companies.

Joseph Simon

Joseph Simon is a solutions architect working with mid to large Enterprise AWS customers. He has been in technology for 13 years with 5 of those centered around DevOps. He has a passion for Cloud, DevOps and Automation and in his spare time, likes to travel and spend time with his family.

Visualize AWS WAF logs with an Amazon CloudWatch dashboard

Post Syndicated from Diana Alvarado original https://aws.amazon.com/blogs/security/visualize-aws-waf-logs-with-an-amazon-cloudwatch-dashboard/

AWS WAF is a web application firewall service that helps you protect your applications from common exploits that could affect your application’s availability and your security posture. One of the most useful ways to detect and respond to malicious web activity is to collect and analyze AWS WAF logs. You can perform this task conveniently by sending your AWS WAF logs to Amazon CloudWatch Logs and visualizing them through an Amazon CloudWatch dashboard.

In this blog post, I’ll show you how to use Amazon CloudWatch to monitor and analyze AWS WAF activity using the options in CloudWatch metrics, Contributor Insights, and Logs Insights. I’ll also walk you through how to deploy this solution in your own AWS account by using an AWS CloudFormation template.

Prerequisites

This blog post builds on the concepts introduced in the blog post Analyzing AWS WAF Logs in Amazon CloudWatch Logs. There we introduced how to natively set up AWS WAF logging to Amazon CloudWatch logs, and discussed the basic options that are available for visualizing and analyzing the data provided in the logs.

The only AWS services that you need to turn on for this solution are Amazon CloudWatch and AWS WAF. The solution assumes that you’ve previously set up AWS WAF log delivery to Amazon CloudWatch Logs. If you have not done so, follow the instructions for AWS WAF logging destinations – CloudWatch Logs.

You will need to provide the following parameters for the CloudFormation template:

  • CloudWatch log group name for the AWS WAF logs
  • The AWS Region for the logs
  • The name of the AWS WAF web access control list (web ACL)

Solution overview

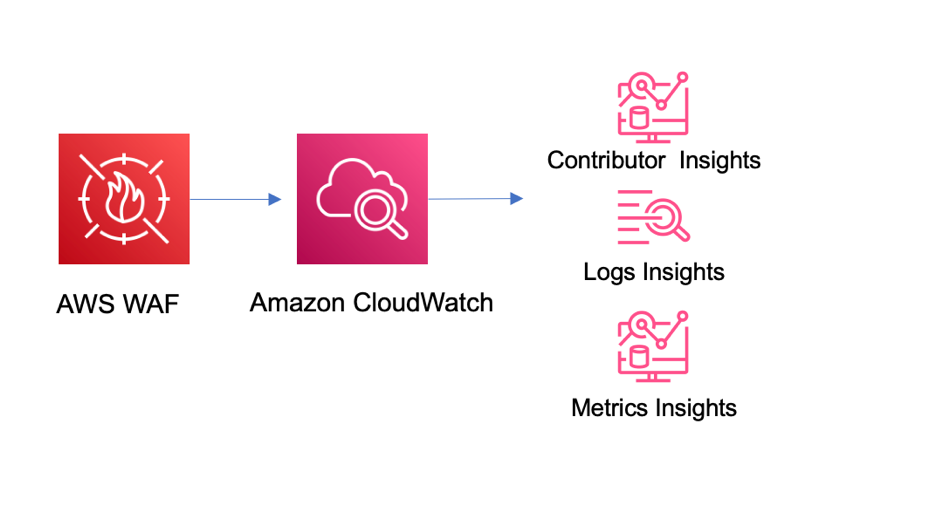
The architecture of the solution is outlined in Figure 1. The solution takes advantage of the native integration available between AWS WAF and CloudWatch, which simplifies the setup and management of this solution.

Figure 1: Solution architecture

Figure 1: Solution architecture

In the solution, the logs are sent to CloudWatch (when you enable log delivery). From there, they’re ready to be consumed by all the different service options that CloudWatch offers, including the ones that we’ll use in this solution: CloudWatch Logs Insights and Contributor Insights.

Deploy the solution

Choose the following Launch stack button to launch the CloudFormation stack in your account.

Launch Stack

You’ll be redirected to the CloudFormation service in the AWS US East (N. Virginia) Region, which is the default Region to deploy this solution, although this can vary depending on where your web ACL is located. You can change the Region as preferred. The template will spin up multiple cloud resources, such as the following:

  • CloudWatch Logs Insights queries
  • CloudWatch Contributor Insights visuals
  • CloudWatch dashboard

The solution is quickly deployed to your account and is ready to use in less than 30 minutes. You can use the solution when the status of the stack changes to CREATE_COMPLETE.

As a measure to control costs, you can also choose whether to create the Contributor Insights rules and enable them by default. For more information on costs, see the Cost considerations section later in this post.

Explore and validate the dashboard

When the CloudFormation stack is complete, you can choose the Output tab in the CloudFormation console and then choose the dashboard link. This will take you to the CloudWatch service in the AWS Management Console. The dashboard time range presents information for the last hour of activity by default, and can go up to one week, but keep in mind that Contributor Insights has a maximum time range of 24 hours. You can also select a different dashboard refresh interval from 10 seconds up to 15 minutes.

The dashboard provides the following information from CloudWatch.

Rule name Description
WAF_top_terminating_rules This rule shows the top rules where the requests are being terminated by AWS WAF. This can help you understand the main cause of blocked requests.
WAF_top_ips This rule shows the top source IPs for requests. This can help you understand if the traffic and activity that you see is spread across many IPs or concentrated in a small group of IPs.
WAF_top_countries This rule shows the main source countries for the IPs in the requests. This can help you visualize where the traffic is originating.
WAF_top_user_agents This rule shows the main user agents that are being used to generate the requests. This will help you isolate problematic devices or identify potential false positives.
WAF_top_uri This rule shows the main URIs in the requests that are being evaluated. This can help you identify if one specific path is the target of activity.
WAF_top_http This rule shows the HTTP methods used for the requests examined by AWS WAF. This can help you understand the pattern of behavior of the traffic.
WAF_top_referrer_hosts This rule shows the main referrer from which requests are being sent. This can help you identify incorrect or suspicious origins of requests based on the known application flow.
WAF_top_rate_rules This rule shows the main rate rules being applied to traffic. It helps understand volumetric activity identified by AWS WAF.
WAF_top_labels This rule shows the top labels found in logs. This can help you visualize the main rules that are matching on the requests evaluated by AWS WAF.

The dashboard also provides the following information from the default CloudWatch metrics sent by AWS WAF.

Rule name Description
AllowedvsBlockedRequests This metric shows the number of all blocked and allowed requests. This can help you understand the number of requests that AWS WAF is actively blocking.
Bot Requests vs non-Bot requests This visual shows the number of requests identified as bots versus non-bots (if you’re using AWS WAF Bot Control).
All Requests This metric shows the number of all requests, separated by bot and non-bot origin. This can help you understand all requests that AWS WAF is evaluating.
CountedRequests This metric shows the number of all counted requests. This can help you understand the requests that are matching a rule but not being blocked, and aid the decision of a configuration change during the testing phase.
CaptchaRequests This metric shows requests that go through the CAPTCHA rule.

Figure 2 shows an example of how the CloudWatch dashboard displays the data within this solution. You can rearrange and customize the elements within the dashboard as needed.

You can review each of the queries and rules deployed with this solution. You can also customize these baseline queries and rules to provide more detailed information or to add custom queries and rules to the solution code. For more information on how to build queries and use CloudWatch Logs and Contributor Insights, see the CloudWatch documentation.

Use the dashboard for monitoring

After you’ve set up the dashboard, you can monitor the activity of the sites that are protected by AWS WAF. If suspicious activity is reported, you can use the visuals to understand the traffic in more detail, and drive incident response actions as needed.

Let’s consider an example of how to use your new dashboard and its data to drive security operations decisions. Suppose that you have a website that sells custom clothing at a bargain price. It has a sign-up link to receive offers, and you’re getting reports of unusual activity by the application team. By looking at the metrics for the web ACL that protects the site, you can see the main country for source traffic and the contributing URIs, as shown in Figure 3. You can also see that most of the activity is being detected by rules that you have in place, so you can set the rules to block traffic, or if they are already blocking, you can just monitor the activity.

You can use the same visuals to decide whether an AWS WAF rule with high activity can be changed to autoblock suspicious web traffic without affecting valid customer traffic. By looking at the top terminating rules and cross-referencing information, such as source IPs, user agents, top URIs, and other request identifiers, you can understand the traffic pattern and activity of different applications and endpoints. From here, you can investigate further by using specific queries with CloudWatch Logs Insights.

Operational and security management with CloudWatch Logs Insights

You can use CloudWatch Logs Insights to interactively search and analyze log data in Amazon CloudWatch Logs using advanced queries to effectively investigate operational issues and security incidents.

Examine a bot reported as a false positive

You can use CloudWatch Logs Insights to identify requests that have specific labels to understand where the traffic is originating from based on source IP address and other essential event details. A simple example is investigating requests flagged as potential false positives.

Imagine that you have a reported false positive request that was flagged as a non-browser by AWS WAF Bot Control. You can run the non-browser user agent query that was created by the provided template on CloudWatch Logs Insights, as shown in the following example, and then verify the source IPs for the top hits for this rule group. Or you can look for a specific request that has been flagged as a false positive, in order to review the details and make adjustments as needed.

fields @timestamp, httpRequest.clientIp 
| filter @message like "awswaf:managed:aws:botcontrol:signal:non_browser_user_agent" 
| parse @message ""labels":[*]"as Labels 
| stats count(*) as requestCount by httpRequest.clientIP 
| display @timestamp,httpRequest.clientIp, httpRequest.uri,Labels 
| sort requestCount desc 
| limit 10

The non-browser user agent query also allows you confirm whether this request has other rule hits that were in count mode and were non-terminating; you can do this by examining the labels. If there are multiple rules matching the requests, that can be an indicator of suspicious activity.

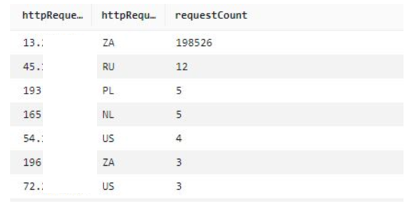
If you have a CAPTCHA challenge configured on the endpoint, you can also look at CAPTCHA responses. The CaptchaTokenqueryDefinition query provided in this solution uses a variation of the preceding format, and can display the main IPs from which bad tokens are being sent. An example query is shown following, along with the query results in Figure 4. If you have signals from non-browser user agents and CAPTCHA tokens missing, then that is a strong indicator of suspicious activity.

fields @timestamp, httpRequest.clientIp 
| filter captchaResponse.failureReason = "TOKEN_MISSING" 
| stats count(*) as requestCount by httpRequest.clientIp, httpRequest.country 
| sort requestCount desc 
| limit 10
Figure 4: Main IP addresses and number of counts for CAPTCHA responses

Figure 4: Main IP addresses and number of counts for CAPTCHA responses

This information can provide an indication of the main source of activity. You can then use other visuals, like top user agents or top referrers, to provide more context to the information and inform further actions, such as adding new rules to the AWS WAF configuration.

You can adapt the queries provided in the sample solution to other use cases by using the fields provided in the left-hand pane of CloudWatch Logs Insights.

Cost considerations

Configuring AWS WAF to send logs to Amazon CloudWatch logs doesn’t have an additional cost. The cost incurred is for the use of the CloudWatch features and services, such as log storage and retention, Contributor Insights rules enabled, Logs Insights queries run, matched log events, and CloudWatch dashboards. For detailed information on the pricing of these features, see the CloudWatch Logs pricing information. You can also get an estimate of potential costs by using the AWS pricing calculator for CloudWatch.

One way to help offset the cost of CloudWatch features and services is to restrict the use of the dashboard and enforce a log retention policy for AWS WAF that makes it cost effective. If you use the queries and monitoring only as-needed, this can also help reduce costs. By limiting the running of queries and the matched log events for the Contributor Insights rules, you can enable the rules only when you need them. AWS WAF also provides the option to filter the logs that are sent when logging is enabled. For more information, see AWS WAF log filtering.

Conclusion

In this post, you learned how to use a pre-built CloudWatch dashboard to monitor AWS WAF activity by using metrics and Contributor Insights rules. The dashboard can help you identify traffic patterns and activity, and you can use the sample Logs Insights queries to explore the log information in more detail and examine false positives and suspicious activity, for rule tuning.

For more information on AWS WAF and the features mentioned in this post, see the AWS WAF documentation.

If you have feedback about this post, submit comments in the Comments section below. If you have questions about this post, start a new thread on AWS WAF re:Post.

Want more AWS Security news? Follow us on Twitter.
Diana Alvarado

Diana Alvarado

Diana is Sr security solutions architect at AWS. She is passionate about helping customers solve difficult cloud challenges, she has a soft spot for all things logs.

How to run AWS CloudHSM workloads in container environments

Post Syndicated from Derek Tumulak original https://aws.amazon.com/blogs/security/how-to-run-aws-cloudhsm-workloads-on-docker-containers/

January 25, 2023: We updated this post to reflect the fact that CloudHSM SDK3 does not support serverless environments and we strongly recommend deploying SDK5.


AWS CloudHSM provides hardware security modules (HSMs) in the AWS Cloud. With CloudHSM, you can generate and use your own encryption keys in the AWS Cloud, and manage your keys by using FIPS 140-2 Level 3 validated HSMs. Your HSMs are part of a CloudHSM cluster. CloudHSM automatically manages synchronization, high availability, and failover within a cluster.

CloudHSM is part of the AWS Cryptography suite of services, which also includes AWS Key Management Service (AWS KMS), AWS Secrets Manager, and AWS Private Certificate Authority (AWS Private CA). AWS KMS, Secrets Manager, and AWS Private CA are fully managed services that are convenient to use and integrate. You’ll generally use CloudHSM only if your workload requires single-tenant HSMs under your own control, or if you need cryptographic algorithms or interfaces that aren’t available in the fully managed alternatives.

CloudHSM offers several options for you to connect your application to your HSMs, including PKCS#11, Java Cryptography Extensions (JCE), OpenSSL Dynamic Engine, or Microsoft Cryptography API: Next Generation (CNG). Regardless of which library you choose, you’ll use the CloudHSM client to connect to HSMs in your cluster.

In this blog post, I’ll show you how to use Docker to develop, deploy, and run applications by using the CloudHSM SDK, and how to manage and orchestrate workloads by using tools and services like Amazon Elastic Container Service (Amazon ECS), Kubernetes, Amazon Elastic Kubernetes Service (Amazon EKS), and Jenkins.

Solution overview

This solution demonstrates how to create a Docker container that uses the CloudHSM JCE SDK to generate a key and use it to encrypt and decrypt data.

Note: In this example, you must manually enter the crypto user (CU) credentials as environment variables when you run the container. For production workloads, you’ll need to consider how to secure and automate the handling and distribution of these credentials. You should work with your security or compliance officer to ensure that you’re using an appropriate method of securing HSM login credentials. For more information on securing credentials, see AWS Secrets Manager.

Figure 1 shows the solution architecture. The Java application, running in a Docker container, integrates with JCE and communicates with CloudHSM instances in a CloudHSM cluster through HSM elastic network interfaces (ENIs). The Docker container runs in an EC2 instance, and access to the HSM ENIs is controlled with a security group.

Figure 1: Architecture diagram

Figure 1: Architecture diagram

Prerequisites

To implement this solution, you need to have working knowledge of the following items:

  • CloudHSM
  • Docker 20.10.17 – used at the time of this post
  • Java 8 or Java 11 – supported at the time of this post
  • Maven 3.05 – used at the time of this post

Here’s what you’ll need to follow along with my example:

  1. An active CloudHSM cluster with at least one active HSM instance. You can follow the CloudHSM getting started guide to create, initialize, and activate a CloudHSM cluster.

    Note: For a production cluster, you should have at least two active HSM instances spread across Availability Zones in the Region.

  2. An Amazon Linux 2 EC2 instance in the same virtual private cloud (VPC) in which you created your CloudHSM cluster. The Amazon Elastic Compute Cloud (Amazon EC2) instance must have the CloudHSM cluster security group attached—this security group is automatically created during the cluster initialization and is used to control network access to the HSMs. To learn about attaching security groups to allow EC2 instances to connect to your HSMs, see Create a cluster in the AWS CloudHSM User Guide.
  3. A CloudHSM crypto user (CU) account. You can create a CU by following the steps in the topic Managing HSM users in AWS CloudHSM in the AWS CloudHSM User Guide.

Solution details

In this section, I’ll walk you through how to download, configure, compile, and run a solution in Docker.

To set up Docker and run the application that encrypts and decrypts data with a key in AWS CloudHSM

  1. On your Amazon Linux EC2 instance, install Docker by running the following command.

    # sudo yum -y install docker

  2. Start the docker service.

    # sudo service docker start

  3. Create a new directory and move to it. In my example, I use a directory named cloudhsm_container. You’ll use the new directory to configure the Docker image.

    # mkdir cloudhsm_container
    # cd cloudhsm_container

  4. Copy the CloudHSM cluster’s trust anchor certificate (customerCA.crt) to the directory that you just created. You can find the trust anchor certificate on a working CloudHSM client instance under the path /opt/cloudhsm/etc/customerCA.crt. The certificate is created during initialization of the CloudHSM cluster and is required to connect to the CloudHSM cluster. This enables our application to validate that the certificate presented by the CloudHSM cluster was signed by our trust anchor certificate.
  5. In your new directory (cloudhsm_container), create a new file with the name run_sample.sh that includes the following contents. The script runs the Java class that is used to generate an Advanced Encryption Standard (AES) key to encrypt and decrypt your data.
    #! /bin/bash
    
    # start application
    echo -e "\n* Entering AES GCM encrypt/decrypt sample in Docker ... \n"
    
    java -ea -jar target/assembly/aesgcm-runner.jar -method environment
    
    echo -e "\n* Exiting AES GCM encrypt/decrypt sample in Docker ... \n"

  6. In the new directory, create another new file and name it Dockerfile (with no extension). This file will specify that the Docker image is built with the following components:
    • The CloudHSM client package.
    • The CloudHSM Java JCE package.
    • OpenJDK 1.8 (Java 8). This is needed to compile and run the Java classes and JAR files.
    • Maven, a build automation tool that is needed to assist with building the Java classes and JAR files.
    • The AWS CloudHSM Java JCE samples that will be downloaded and built as part of the solution.
  7. Cut and paste the following contents into Dockerfile.

    Note: You will need to customize your Dockerfile, as follows:

    • Make sure to specify the SDK version to replace the one specified in the pom.xml file in the sample code. As of the writing of this post, the most current version is 5.7.0. To find the SDK version, follow the steps in the topic Check your client SDK version. For more information, see the Building section in the README file for the Cloud HSM JCE examples.
    • Make sure to update the HSM_IP line with the IP of an HSM in your CloudHSM cluster. You can get your HSM IPs from the CloudHSM console, or by running the describe-clusters AWS CLI command.
      	# Use the amazon linux image
      	FROM amazonlinux:2
      
      	# Pass HSM IP address as a build argument
      	ARG HSM_IP
      
      	# Install CloudHSM client
      	RUN yum install -y https://s3.amazonaws.com/cloudhsmv2-software/CloudHsmClient/EL7/cloudhsm-jce-latest.el7.x86_64.rpm
      
      	# Install Java, Maven, wget, unzip and ncurses-compat-libs
      	RUN yum install -y java maven wget unzip ncurses-compat-libs
              
      	# Create a work dir
      	WORKDIR /app
              
      	# Download sample code
      	RUN wget https://github.com/aws-samples/aws-cloudhsm-jce-examples/archive/refs/heads/sdk5.zip
              
      	# unzip sample code
      	RUN unzip sdk5.zip
             
      	# Change to the create directory
      	WORKDIR aws-cloudhsm-jce-examples-sdk5
      
      # Build JAR files using the installed CloudHSM JCE Provider version
      RUN export CLOUDHSM_CLIENT_VERSION=`rpm -qi cloudhsm-jce | awk -F': ' '/Version/ {print $2}'` \
              && mvn validate -DcloudhsmVersion=$CLOUDHSM_CLIENT_VERSION \
              && mvn clean package -DcloudhsmVersion=$CLOUDHSM_CLIENT_VERSION
              
        # Configure cloudhsm-client
        COPY customerCA.crt /opt/cloudhsm/etc/
        RUN /opt/cloudhsm/bin/configure-jce -a $HSM_IP
             
        # Copy the run_sample.sh script
        COPY run_sample.sh .
              
        # Run the script
        CMD ["bash","run_sample.sh"]

  8. Now you’re ready to build the Docker image. Run the following command, with the name jce_sample. This command will let you use the Dockerfile that you created in step 6 to create the image.

    # sudo docker build --build-arg HSM_IP=”<your HSM IP address>” -t jce_sample .

  9. To run a Docker container from the Docker image that you just created, run the following command. Make sure to replace the user and password with your actual CU username and password. (If you need help setting up your CU credentials, see prerequisite 3. For more information on how to provide CU credentials to the AWS CloudHSM Java JCE Library, see Providing credentials to the JCE provider in the CloudHSM User Guide).

    # sudo docker run --env HSM_USER=<user> --env HSM_PASSWORD=<password> jce_sample

    If successful, the output should look like this:

    	* Entering AES GCM encrypt/decrypt sample in Docker ... 
    
    	737F92D1B7346267D329C16E
    	Successful decryption
    
    	* Exiting AES GCM encrypt/decrypt sample in Docker ...

Conclusion

This solution provides an example of how to run CloudHSM client workloads in Docker containers. You can use the solution as a reference to implement your cryptographic application in a way that benefits from the high availability and load balancing built in to CloudHSM without compromising the flexibility that Docker provides for developing, deploying, and running applications.

If you have comments about this post, submit them in the Comments section below.

Want more AWS Security how-to content, news, and feature announcements? Follow us on Twitter.

Derek Tumulak

Derek Tumulak

Derek joined AWS in May 2021 as a Principal Product Manager. He is a data protection and cybersecurity expert who is enthusiastic about assisting customers with a wide range of sophisticated use cases.

How to improve security incident investigations using Amazon Detective finding groups

Post Syndicated from Anna McAbee original https://aws.amazon.com/blogs/security/how-to-improve-security-incident-investigations-using-amazon-detective-finding-groups/

Uncovering the root cause of an Amazon GuardDuty finding can be a complex task, requiring security operations center (SOC) analysts to collect a variety of logs, correlate information across logs, and determine the full scope of affected resources.

Sometimes you need to do this type of in-depth analysis because investigating individual security findings in insolation doesn’t always capture the full impact of affected resources.

With Amazon Detective, you can analyze and visualize various logs and relationships between AWS entities to streamline your investigation. In this post, you will learn how to use a feature of Detective—finding groups—to simplify and expedite the investigation of a GuardDuty finding.

Detective uses machine learning, statistical analysis, and graph theory to generate visualizations that help you to conduct faster and more efficient security investigations. The finding groups feature reduces triage time and provides a clear view of related GuardDuty findings. With finding groups, you can investigate entities and security findings that might have been overlooked in isolation. Finding groups also map GuardDuty findings and their relevant tactics, techniques, and procedures to the MITRE ATT&CK framework. By using MITRE ATT&CK, you can better understand the event lifecycle of a finding group.

Finding groups are automatically enabled for both existing and new customers in AWS Regions that support Detective. There is no additional charge for finding groups. If you don’t currently use Detective, you can start a free 30-day trial.

Use finding groups to simplify an investigation

Because finding groups are enabled by default, you start your investigation by simply navigating to the Detective console. You will see these finding groups in two different places: the Summary and the Finding groups pages. On the Finding groups overview page, you can also use the search capability to look for collected metadata for finding groups, such as severity, title, finding group ID, observed tactics, AWS accounts, entities, finding ID, and status. The entities information can help you narrow down finding groups that are more relevant for specific workloads.

Figure 1 shows the finding groups area on the Summary page in the Amazon Detective console, which provides high-level information on some of the individual finding groups.

Figure 1: Detective console summary page

Figure 1: Detective console summary page

Figure 2 shows the Finding groups overview page, with a list of finding groups filtered by status. The finding group shown has a status of Active.

Figure 2: Detective console finding groups overview page

Figure 2: Detective console finding groups overview page

You can choose the finding group title to see details like the severity of the finding group, the status, scope time, parent or child finding groups, and the observed tactics from the MITRE ATT&CK framework. Figure 3 shows a specific finding group details page.

Figure 3: Detective console showing a specific finding group details page

Figure 3: Detective console showing a specific finding group details page

Below the finding group details, you can review the entities and associated findings for this finding group, as shown in Figure 4. From the Involved entities tab, you can pivot to the entity profile pages for more details about that entity’s behavior. From the Involved findings tab, you can select a finding to review the details pane.

Figure 4: Detective console showing involved entities of a finding group

Figure 4: Detective console showing involved entities of a finding group

In Figure 4, the search functionality on the Involved entities tab is being used to look at involved entities that are of type AWS role or EC2 instance. With such a search filter in Detective, you have more data in a single place to understand which Amazon Elastic Compute Cloud (Amazon EC2) instances and AWS Identity and Access Management (IAM) roles were involved in the GuardDuty finding and what findings were associated with each entity. You can also select these different entities to see more details. With finding groups, you no longer have to craft specific log searches or search for the AWS resources and entities that you should investigate. Detective has done this correlation for you, which reduces the triage time and provides a more comprehensive investigation.

With the release of finding groups, Detective infers relationships between findings and groups them together, providing a more convenient starting point for investigations. Detective has evolved from helping you determine which resources are related to a single entity (for example, what EC2 instances are communicating with a malicious IP), to correlating multiple related findings together and showing what MITRE tactics are aligned across those findings, helping you better understand a more advanced single security event.

Conclusion

In this blog post, we showed how you can use Detective finding groups to simplify security investigations through grouping related GuardDuty findings and AWS entities, which provides a more comprehensive view of the lifecycle of the potential security incident. Finding groups are automatically enabled for both existing and new customers in AWS Regions that support Detective. There is no additional charge for finding groups. If you don’t currently use Detective, you can start a free 30-day trial. For more information on finding groups, see Analyzing finding groups in the Amazon Detective User Guide.

If you have feedback about this post, submit comments in the Comments section below. You can also start a new thread on the Amazon Detective re:Post or contact AWS Support.

Want more AWS Security news? Follow us on Twitter.

Author

Anna McAbee

Anna is a Security Specialist Solutions Architect focused on threat detection and incident response at AWS. Before AWS, she worked as an AWS customer in financial services on both the offensive and defensive sides of security. Outside of work, Anna enjoys cheering on the Florida Gators football team, wine tasting, and traveling the world.

Author

Marshall Jones

Marshall is a Worldwide Security Specialist Solutions Architect at AWS. His background is in AWS consulting and security architecture, focused on a variety of security domains including edge, threat detection, and compliance. Today, he is focused on helping enterprise AWS customers adopt and operationalize AWS security services to increase security effectiveness and reduce risk.

Luis Pastor

Luis Pastor

Luis is a Security Specialist Solutions Architect focused on infrastructure security at AWS. Before AWS he worked with large and boutique system integrators, helping clients in an array of industries improve their security posture and reach and maintain compliance in hybrid environments. Luis enjoys keeping active, cooking and eating spicy food, specially Mexican cuisine.

Build a serverless analytics application with Amazon Redshift and Amazon API Gateway

Post Syndicated from David Zhang original https://aws.amazon.com/blogs/big-data/build-a-serverless-analytics-application-with-amazon-redshift-and-amazon-api-gateway/

Serverless applications are a modernized way to perform analytics among business departments and engineering teams. Business teams can gain meaningful insights by simplifying their reporting through web applications and distributing it to a broader audience.

Use cases can include the following:

  • Dashboarding – A webpage consisting of tables and charts where each component can offer insights to a specific business department.
  • Reporting and analysis – An application where you can trigger large analytical queries with dynamic inputs and then view or download the results.
  • Management systems – An application that provides a holistic view of the internal company resources and systems.
  • ETL workflows – A webpage where internal company individuals can trigger specific extract, transform, and load (ETL) workloads in a user-friendly environment with dynamic inputs.
  • Data abstraction – Decouple and refactor underlying data structure and infrastructure.
  • Ease of use – An application where you want to give a large set of user-controlled access to analytics without having to onboard each user to a technical platform. Query updates can be completed in an organized manner and maintenance has minimal overhead.

In this post, you will learn how to build a serverless analytics application using Amazon Redshift Data API and Amazon API Gateway WebSocket and REST APIs.

Amazon Redshift is fully managed by AWS, so you no longer need to worry about data warehouse management tasks such as hardware provisioning, software patching, setup, configuration, monitoring nodes and drives to recover from failures, or backups. The Data API simplifies access to Amazon Redshift because you don’t need to configure drivers and manage database connections. Instead, you can run SQL commands to an Amazon Redshift cluster by simply calling a secured API endpoint provided by the Data API. The Data API takes care of managing database connections and buffering data. The Data API is asynchronous, so you can retrieve your results later.

API Gateway is a fully managed service that makes it easy for developers to publish, maintain, monitor, and secure APIs at any scale. With API Gateway, you can create RESTful APIs and WebSocket APIs that enable real-time two-way communication applications. API Gateway supports containerized and serverless workloads, as well as web applications. API Gateway acts as a reverse proxy to many of the compute resources that AWS offers.

Event-driven model

Event-driven applications are increasingly popular among customers. Analytical reporting web applications can be implemented through an event-driven model. The applications run in response to events such as user actions and unpredictable query events. Decoupling the producer and consumer processes allows greater flexibility in application design and building decoupled processes. This design can be achieved with the Data API and API Gateway WebSocket and REST APIs.

Both REST API calls and WebSocket establish communication between the client and the backend. Due to the popularity of REST, you may wonder why WebSockets are present and how they contribute to an event-driven design.

What are WebSockets and why do we need them?

Unidirectional communication is customary when building analytical web solutions. In traditional environments, the client initiates a REST API call to run a query on the backend and either synchronously or asynchronously waits for the query to complete. The “wait” aspect is engineered to apply the concept of polling. Polling in this context is when the client doesn’t know when a backend process will complete. Therefore, the client will consistently make a request to the backend and check.

What is the problem with polling? Main challenges include the following:

  • Increased traffic in your network bandwidth – A large number of users performing empty checks will impact your backend resources and doesn’t scale well.
  • Cost usage – Empty requests don’t deliver any value to the business. You pay for the unnecessary cost of resources.
  • Delayed response – Polling is scheduled in time intervals. If the query is complete in-between these intervals, the user can only see the results after the next check. This delay impacts the user experience and, in some cases, may result in UI deadlocks.

For more information on polling, check out From Poll to Push: Transform APIs using Amazon API Gateway REST APIs and WebSockets.

WebSockets is another approach compared to REST when establishing communication between the front end and backend. WebSockets enable you to create a full duplex communication channel between the client and the server. In this bidirectional scenario, the client can make a request to the server and is notified when the process is complete. The connection remains open, with minimal network overhead, until the response is received.

You may wonder why REST is present, since you can transfer response data with WebSockets. A WebSocket is a light weight protocol designed for real-time messaging between systems. The protocol is not designed for handling large analytical query data and in API Gateway, each frame’s payload can only hold up to 32 KB. Therefore, the REST API performs large data retrieval.

By using the Data API and API Gateway, you can build decoupled event-driven web applications for your data analytical needs. You can create WebSocket APIs with API Gateway and establish a connection between the client and your backend services. You can then initiate requests to perform analytical queries with the Data API. Due to the Data API’s asynchronous nature, the query completion generates an event to notify the client through the WebSocket channel. The client can decide to either retrieve the query results through a REST API call or perform other follow-up actions. The event-driven architecture enables bidirectional interoperable messages and data while keeping your system components agnostic.

Solution overview

In this post, we show how to create a serverless event-driven web application by querying with the Data API in the backend, establishing a bidirectional communication channel between the user and the backend with the WebSocket feature in API Gateway, and retrieving the results using its REST API feature. Instead of designing an application with long-running API calls, you can use the Data API. The Data API allows you to run SQL queries asynchronously, removing the need to hold long, persistent database connections.

The web application is protected using Amazon Cognito, which is used to authenticate the users before they can utilize the web app and also authorize the REST API calls when made from the application.

Other relevant AWS services in this solution include AWS Lambda and Amazon EventBridge. Lambda is a serverless, event-driven compute resource that enables you to run code without provisioning or managing servers. EventBridge is a serverless event bus allowing you to build event-driven applications.

The solution creates a lightweight WebSocket connection between the browser and the backend. When a user submits a request using WebSockets to the backend, a query is submitted to the Data API. When the query is complete, the Data API sends an event notification to EventBridge. EventBridge signals the system that the data is available and notifies the client. Afterwards, a REST API call is performed to retrieve the query results for the client to view.

We have published this solution on the AWS Samples GitHub repository and will be referencing it during the rest of this post.

The following architecture diagram highlights the end-to-end solution, which you can provision automatically with AWS CloudFormation templates run as part of the shell script with some parameter variables.

The application performs the following steps (note the corresponding numbered steps in the process flow):

  1. A web application is provisioned on AWS Amplify; the user needs to sign up first by providing their email and a password to access the site.
  2. The user verifies their credentials using a pin sent to their email. This step is mandatory for the user to then log in to the application and continue access to the other features of the application.
  3. After the user is signed up and verified, they can sign in to the application and requests data through their web or mobile clients with input parameters. This initiates a WebSocket connection in API Gateway. (Flow 1, 2)
  4. The connection request is handled by a Lambda function, OnConnect, which initiates an asynchronous database query in Amazon Redshift using the Data API. The SQL query is taken from a SQL script in Amazon Simple Storage Service (Amazon S3) with dynamic input from the client. (Flow 3, 4, 6, 7)
  5. In addition, the OnConnect Lambda function stores the connection, statement identifier, and topic name in an Amazon DynamoDB database. The topic name is an extra parameter that can be used if users want to implement multiple reports on the same webpage. This allows the front end to map responses to the correct report. (Flow 3, 4, 5)
  6. The Data API runs the query, mentioned in step 2. When the operation is complete, an event notification is sent to EventBridge. (Flow 8)
  7. EventBridge activates an event rule to redirect that event to another Lambda function, SendMessage. (Flow 9)
  8. The SendMessage function notifies the client that the SQL query is complete via API Gateway. (Flow 10, 11, 12)
  9. After the notification is received, the client performs a REST API call (GET) to fetch the results. (Flow 13, 14, 15, 16)
  10. The GetResult function is triggered, which retrieves the SQL query result and returns it to the client.
  11. The user is now able to view the results on the webpage.
  12. When clients disconnect from their browser, API Gateway automatically deletes the connection information from the DynamoDB table using the onDisconnect function. (Flow 17, 18,19)

Prerequisites

Prior to deploying your event-driven web application, ensure you have the following:

  • An Amazon Redshift cluster in your AWS environment – This is your backend data warehousing solution to run your analytical queries. For instructions to create your Amazon Redshift cluster, refer to Getting started with Amazon Redshift.
  • An S3 bucket that you have access to – The S3 bucket will be your object storage solution where you can store your SQL scripts. To create your S3 bucket, refer to Create your first S3 bucket.

Deploy CloudFormation templates

The code associated to the design is available in the following GitHub repository. You can clone the repository inside an AWS Cloud9 environment in our AWS account. The AWS Cloud9 environment comes with AWS Command Line Interface (AWS CLI) installed, which is used to run the CloudFormation templates to set up the AWS infrastructure. Make sure that the jQuery library is installed; we use it to parse the JSON output during the run of the script.

The complete architecture is set up using three CloudFormation templates:

  • cognito-setup.yaml – Creates the Amazon Cognito user pool to web app client, which is used for authentication and protecting the REST API
  • backend-setup.yaml – Creates all the required Lambda functions and the WebSocket and Rest APIs, and configures them on API Gateway
  • webapp-setup.yaml – Creates the web application hosting using Amplify to connect and communicate with the WebSocket and Rest APIs.

These CloudFormation templates are run using the script.sh shell script, which takes care of all the dependencies as required.

A generic template is provided for you to customize your own DDL SQL scripts as well as your own query SQL scripts. We have created sample scripts for you to follow along.

  1. Download the sample DDL script and upload it to an existing S3 bucket.
  2. Change the IAM role value to your Amazon Redshift cluster’s IAM role with permissions to AmazonS3ReadOnlyAccess.

For this post, we copy the New York Taxi Data 2015 dataset from a public S3 bucket.

  1. Download the sample query script and upload it to an existing S3 bucket.
  2. Upload the modified sample DDL script and the sample query script into a preexisting S3 bucket that you own, and note down the S3 URI path.

If you want to run your own customized version, modify the DDL and query script to fit your scenario.

  1. Edit the script.sh file before you run it and set the values for the following parameters:
    • RedshiftClusterEndpoint (aws_redshift_cluster_ep) – Your Amazon Redshift cluster endpoint available on the AWS Management Console
    • DBUsername (aws_dbuser_name) – Your Amazon Redshift database user name
    • DDBTableName (aws_ddbtable_name) – The name of your DynamoDB table name that will be created
    • WebsocketEndpointSSMParameterName (aws_wsep_param_name) – The parameter name that stores the WebSocket endpoint in AWS Systems Manager Parameter Store.
    • RestApiEndpointSSMParameterName (aws_rapiep_param_name) – The parameter name that stores the REST API endpoint in Parameter Store.
    • DDLScriptS3Path (aws_ddl_script_path) – The S3 URI to the DDL script that you uploaded.
    • QueryScriptS3Path (aws_query_script_path) – The S3 URI to the query script that you uploaded.
    • AWSRegion (aws_region) – The Region where the AWS infrastructure is being set up.
    • CognitoPoolName (aws_user_pool_name) – The name you want to give to your Amazon Cognito user pool
    • ClientAppName (aws_client_app_name) – The name of the client app to be configured for the web app to handle the user authentication for the users

The default acceptable values are already provided as part of the downloaded code.

  1. Run the script using the following command:
./script.sh

During deployment, AWS CloudFormation creates and triggers the Lambda function SetupRedshiftLambdaFunction, which sets up an Amazon Redshift database table and populates data into the table. The following diagram illustrates this process.

Use the demo app

When the shell script is complete, you can start interacting with the demo web app:

  1. On the Amplify console, under All apps in the navigation pane, choose DemoApp.
  2. Choose Run build.

The DemoApp web application goes through a phase of Provision, Build, Deploy.

  1. When it’s complete, use the URL provided to access the web application.

The following screenshot shows the web application page. It has minimal functionality: you can sign in, sign up, or verify a user.

  1. Choose Sign Up.

  1. For Email ID, enter an email.
  2. For Password, enter a password that is at least eight characters long, has at least one uppercase and lowercase letter, at least one number, and at least one special character.
  3. Choose Let’s Enroll.

The Verify your Login to Demo App page opens.

  1. Enter your email and the verification code sent to the email you specified.
  2. Choose Verify.


You’re redirected to a login page.

  1. Sign in using your credentials.

You’re redirected to the demoPage.html website.

  1. Choose Open Connection.

You now have an active WebSocket connection between your browser and your backend AWS environment.

  1. For Trip Month, specify a month (for this example, December) and choose Submit.

You have now defined the month and year you want to query your data upon. After a few seconds, you can to see the output delivered from the WebSocket.

You may continue using the active WebSocket connection for additional queries—just choose a different month and choose Submit again.

  1. When you’re done, choose Close Connection to close the WebSocket connection.

For exploratory purposes, while your WebSocket connection is active, you can navigate to your DynamoDB table on the DynamoDB console to view the items that are currently stored. After the WebSocket connection is closed, the items stored in DynamoDB are deleted.

Clean up

To clean up your resources, complete the following steps:

  1. On the Amazon S3 console, navigate to the S3 bucket containing the sample DDL script and query script and delete them from the bucket.
  2. On the Amazon Redshift console, navigate to your Amazon Redshift cluster and delete the data you copied over from the sample DDL script.
    1. Run truncate nyc_yellow_taxi;
    2. Run drop table nyc_yellow_taxi;
  3. On the AWS CloudFormation console, navigate to the CloudFormation stacks and choose Delete. Delete the stacks in the following order:
    1. WebappSetup
    2. BackendSetup
    3. CognitoSetup

All resources created in this solution will be deleted.

Monitoring

You can monitor your event-driven web application events, user activity, and API usage with Amazon CloudWatch and AWS CloudTrail. Most areas of this solution already have logging enabled. To view your API Gateway logs, you can turn on CloudWatch Logs. Lambda comes with default logging and monitoring and can be accessed with CloudWatch.

Security

You can secure access to the application using Amazon Cognito, which is a developer-centric and cost-effective customer authentication, authorization, and user management solution. It provides both identity store and federation options that can scale easily. Amazon Cognito supports logins with social identity providers and SAML or OIDC-based identity providers, and supports various compliance standards. It operates on open identity standards (OAuth2.0, SAML 2.0, and OpenID Connect). You can also integrate it with API Gateway to authenticate and authorize the REST API calls either using the Amazon Cognito client app or a Lambda function.

Considerations

The nature of this application includes a front-end client initializing SQL queries to Amazon Redshift. An important component to consider are potential malicious activities that the client can perform, such as SQL injections. With the current implementation, that is not possible. In this solution, the SQL queries preexist in your AWS environment and are DQL statements (they don’t alter the data or structure). However, as you develop this application to fit your business, you should evaluate these areas of risk.

AWS offers a variety of security services to help you secure your workloads and applications in the cloud, including AWS Shield, AWS Network Firewall, AWS Web Application Firewall, and more. For more information and a full list, refer to Security, Identity, and Compliance on AWS.

Cost optimization

The AWS services that the CloudFormation templates provision in this solution are all serverless. In terms of cost optimization, you only pay for what you use. This model also allows you to scale without manual intervention. Review the following pages to determine the associated pricing for each service:

Conclusion

In this post, we showed you how to create an event-driven application using the Amazon Redshift Data API and API Gateway WebSocket and REST APIs. The solution helps you build data analytical web applications in an event-driven architecture, decouple your application, optimize long-running database queries processes, and avoid unnecessary polling requests between the client and the backend.

You also used severless technologies, API Gateway, Lambda, DynamoDB, and EventBridge. You didn’t have to manage or provision any servers throughout this process.

This event-driven, serverless architecture offers greater extensibility and simplicity, making it easier to maintain and release new features. Adding new components or third-party products is also simplified.

With the instructions in this post and the generic CloudFormation templates we provided, you can customize your own event-driven application tailored to your business. For feedback or contributions, we welcome you to contact us through the AWS Samples GitHub Repository by creating an issue.


About the Authors

David Zhang is an AWS Data Architect in Global Financial Services. He specializes in designing and implementing serverless analytics infrastructure, data management, ETL, and big data systems. He helps customers modernize their data platforms on AWS. David is also an active speaker and contributor to AWS conferences, technical content, and open-source initiatives. During his free time, he enjoys playing volleyball, tennis, and weightlifting. Feel free to connect with him on LinkedIn.

Manash Deb is a Software Development Manager in the AWS Directory Service team. With over 18 years of software dev experience, his passion is designing and delivering highly scalable, secure, zero-maintenance applications in the AWS identity and data analytics space. He loves mentoring and coaching others and to act as a catalyst and force multiplier, leading highly motivated engineering teams, and building large-scale distributed systems.

Pavan Kumar Vadupu Lakshman Manikya is an AWS Solutions Architect who helps customers design robust, scalable solutions across multiple industries. With a background in enterprise architecture and software development, Pavan has contributed in creating solutions to handle API security, API management, microservices, and geospatial information system use cases for his customers. He is passionate about learning new technologies and solving, automating, and simplifying customer problems using these solutions.

Managing Dev Environments with Amazon CodeCatalyst

Post Syndicated from Ryan Bachman original https://aws.amazon.com/blogs/devops/managing-dev-environments-with-amazon-codecatalyst/

An Amazon CodeCatalyst Dev Environment is a cloud-based development environment that you can use in CodeCatalyst to quickly work on the code stored in the source repositories of your project. The project tools and application libraries included in your Dev Environment are defined by a devfile in the source repository of your project.

Introduction

In the previous CodeCatalyst post, Team Collaboration with Amazon CodeCatalyst, I focused on CodeCatalyst’s collaboration capabilities and how that related to The Unicorn Project’s main protaganist. At the beginning of Chapter 2, Maxine is struggling to configure her development environment. She is two days into her new job and still cannot build the application code. She has identified over 100 dependencies she is missing. The documentation is out of date and nobody seems to know where the dependencies are stored. I can sympathize with Maxine. In this post, I will focus on managing development environments to show how CodeCatalyst removes the burden of managing workload specific configurations and produces reliable on-demand development environments.

Prerequisites

If you would like to follow along with this walkthrough, you will need to:

Have an AWS Builder ID for signing in to CodeCatalyst.

Belong to a space and have the space administrator role assigned to you in that space. For more information, see Creating a space in CodeCatalystManaging members of your space, and Space administrator role.

Have an AWS account associated with your space and have the IAM role in that account. For more information about the role and role policy, see Creating a CodeCatalyst service role.

Walkthrough

As with the previous posts in our CodeCatalyst series, I am going to use the Modern Three-tier Web Application blueprint.  Blueprints provide sample code and CI/CD workflows to help make getting started easier across different combinations of programming languages and architectures. To follow along, you can re-use a project you created previously, or you can refer to a previous post that walks through creating a project using the blueprint.

One of the most difficult aspects of my time spent as a developer was finding ways to quickly contribute to a new project. Whenever I found myself working on a new project, getting to the point where I could meaningfully contribute to a project’s code base was always more difficult than writing the actual code. A major contributor to this inefficiency, was the lack of process managing my local development environment. I will be exploring how CodeCatalyst can help solve this challenge.  For this walkthrough, I want to add a new test that will allow local testing of Amazon DynamoDB. To achieve this, I will use a CodeCatalyst dev environment.

CodeCatalyst Dev Environments are managed cloud-based development environments that you can use to access and modify code stored in a source repository. You can launch a project specific dev environment that will automate check-out of your project’s repo or you can launch an empty environment to use for accessing third-party source providers.  You can learn more about CodeCatalyst Dev Environments in the CodeCatalyst User Guide.

CodeCatalyst user interface showing Create Dev Environment

Figure 1. Creating a new Dev Environment

To begin, I navigate to the Dev Environments page under the Code section of the navigaiton menu.  I then use the Create Dev Environment to launch my environment.  For this post, I am using the AWS Cloud9 IDE, but you can follow along with the IDE you are most comfortable using.  In the next screen, I select Work in New Branch and assign local_testing for the new branch name, and I am branching from main.  I leave the remaining default options and Create.

Create Dev Environment user interface with work in a new branch selected

Figure 2. Dev Environment Create Options

After waiting less than a minute, my IDE is ready in a new tab and I am ready to begin work.  The first thing I see in my dev environment is an information window asking me if I want to navigate to the Dev Environment Settings.  Because I need to enable local testing of Dynamodb, not only for myself, but other developers that will collaborate on this project, I need to update the project’s devfile.  I select to navigate to the settings tab because I know that contains information on the project’s devfile and allows me to access the file to edit.

AWS Toolkit prompting to Open Dev Environment Settings.

Figure 3. Toolkit Welcome Banner

Devfiles allow you to model a Dev Environment’s configuration and dependencies so that you can re-produce consisent Dev Environments and reduce the manual effort in setting up future environments.  The tools and application libraries included in your Dev Environment are defined by the devfile in the source repository of your project.  Since this project was created from a blueprint, there is one provided.  For blank projects, a default CodeCatalyst devfile is created when you first launch an environment.  To learn more about the devfile, see https://devfile.io.

In the settings tab, I find a link to the devfile that is configured.  When I click the edit button, a new file tab launches and I can now make changes.  I first add an env section to the container that hosts our dev environment.  By adding an environment variable and value, anytime a new dev environment is created from this project’s repository, that value will be included.  Next, I add a second container to the dev environment that will run DynamoDB locally.  I can do this by adding a new container component.  I use Amazon’s verified DynamoDB docker image for my environment. Attaching additional images allow you to extend the dev environment and include tools or services that can be made available locally.  My updates are highlighted in the green sections below.

Devfile.yaml with environment variable and DynamoDB container added

Figure 4. Example Devfile

I save my changes and navigate back to the Dev Environment Settings tab. I notice that my changes were automatically detected and I am prompted to restart my development environment for the changes to take effect.  Modifications to the devfile requires a restart. You can restart a dev environment using the toolkit, or from the CodeCatalyst UI.

AWS Toolkit prompt asking to restart the dev environment

Figure 5. Dev Environment Settings

After waiting a few seconds for my dev environment to restart, I am ready to write my test.  I use the IDE’s file explorer, expand the repo’s ./tests/unit folder, and create a new file named test_dynamodb.py.  Using the IS_LOCAL environment variable I configured in the devfile, I can include a conditional in my test that sets the endpoint that Amazon’s python SDK ( Boto3 ) will use to connect to the Dynamodb service.  This way, I can run tests locally before pushing my changes and still have tests complete successfully in my project’s workflow.  My full test file is included below.

Python unit test with local code added

Figure 6. Dynamodb test file

Now that I have completed my changes to the dev environment using the devfile and added a test, I am ready to run my test locally to verify.  I will use pytest to ensure the tests are passing before pushing any changes.  From the repo’s root folder, I run the command pip install -r requirements-dev.txt.  Once my dependencies are installed, I then issue the command pytest -k unit.  All tests pass as I expect.

Result of the pytest shown at the command line

Figure 7. Pytest test results

Rather than manually installing my development dependencies in each environment, I could also use the devfile to include commands and automate the execution of those commands during the dev environment lifecycle events.  You can refer to the links for commands and events for more information.

Finally, I am ready to push my changes back to my CodeCatalyst source repository.  I use the git extension of Cloud9 to review my changes.  After reviewing my changes are what I expect, I use the git extension to stage, commit, and push the new test file and the modified devfile so other collaborators can adopt the improvements I made.

Figure 8.  Changes reviewed in CodeCatalyst Cloud9 git extension.

Figure 8.  Changes reviewed in CodeCatalyst Cloud9 git extension.

Cleanup

If you have been following along with this workflow, you  should delete the resources you deployed so you do not continue to incur  charges. First, delete the two stacks that CDK deployed using the AWS CloudFormation console in the AWS account you associated when you launched the blueprint. These stacks will have names like mysfitsXXXXXWebStack and mysfitsXXXXXAppStack. Second, delete the project from CodeCatalyst by navigating to Project settings and choosing Delete project.

Conclusion

In this post, you learned how CodeCatalyst provides configurable on-demand dev environments.  You also learned how devfiles help you define a consistent experience for developing within a CodeCatalyst project.  Please follow our DevOps blog channel as I continue to explore how CodeCatalyst solve Maxine’s and other builders’ challenges.

About the author:

Ryan Bachman

Ryan Bachman is a Sr. Specialist Solutions Architect at AWS, and specializes in working with customers to improve their DevOps practices. Ryan has over 20 years of professional experience as a technologist, and has held roles in many different domains to include development, networking architecture, and technical product management. He is passionate about automation and helping customers increase software development productivity.

Use AWS WAF CAPTCHA to protect your application against common bot traffic

Post Syndicated from Abhinav Bannerjee original https://aws.amazon.com/blogs/security/use-aws-waf-captcha-to-protect-your-application-against-common-bot-traffic/

In this blog post, you’ll learn how you can use a Completely Automated Public Turing test to tell Computers and Humans Apart (CAPTCHA) with other AWS WAF controls as part of a layered approach to provide comprehensive protection against bot traffic. We’ll describe a workflow that tracks the number of incoming requests to a site’s store page. The workflow then limits those requests if they exceed a certain threshold. Requests from IP addresses that exceed the threshold will be presented a CAPTCHA challenge to prove that the requests are being made by a human.

Amazon Web Services (AWS) offers many tools and recommendations that companies can use as they face challenges with bot traffic on their websites. Web applications can be compromised through a variety of vectors, including cross-site scripting, SQL injection, path traversal, local file inclusion, and distributed denial-of-service (DDoS) attacks. AWS WAF offers managed rules that are designed to provide protection against common application vulnerabilities or other unwanted web traffic, without requiring you to write your own rules.

There are some web attacks like web scraping, credential stuffing, and layer 7 DDoS attempts conducted by bots (as well as by humans) that target sensitive areas of your website, such as your store page. A CAPTCHA mitigates undesirable traffic by requiring the visitor to complete challenges before they are allowed to access protected resources. You can implement CAPTCHA to help prevent unwanted activities. Last year, AWS introduced AWS WAF CAPTCHA, which allows customers to set up AWS WAF rules that require CAPTCHA challenges to be completed for common targets such as forms (for example, search forms).

Scenario

Consider an attack where the unauthorized user is attempting to overwhelm a site’s store page by repeatedly sending search requests for different items.

Assume that traffic visits a website that is hosted through Amazon CloudFront and attempts the above behavior on the /store URL. In this scenario, there is a rate-based rule in place that will track the number of requests coming in from each IP. This rate-based rule tracks the rate of requests for each originating IP address and invokes the rule action on IPs with rates that go over the limit. With CAPTCHA implemented as the rule action, excessive attempts to search within a 5-minute window will result in a CAPTCHA challenge being presented to the user. This workflow is shown in Figure 1.

Figure 1: User visits a store page and is evaluated by a rate-based rule

Figure 1: User visits a store page and is evaluated by a rate-based rule

When a user solves a CAPTCHA challenge, AWS automatically generates and encrypts a token and sends it to the client as a cookie. The client requests aren’t challenged again until the token has expired. AWS WAF calculates token expiration by using the immunity time configuration. You can configure the immunity time in a web access control list (web ACL) CAPTCHA configuration and in the configuration for a rule’s action setting. When a user provides an incorrect answer to a CAPTCHA challenge, the challenge informs the user and loads a new puzzle. When the user solves the challenge, the challenge automatically submits the original web request, updated with the CAPTCHA token from the successful puzzle completion.

Walkthrough

This workflow will require an AWS WAF rule within a new or existing rule group or web ACL. The rule will define how web requests are inspected and the action to take.

To create an AWS WAF rate-based rule

  1. Open the AWS WAF console and in the left navigation pane, choose Web ACLs.
  2. Choose an existing web ACL, or choose Create web ACL at the top right to create a new web ACL.
  3. Under Rules, choose Add rules, and then in the drop-down list, choose Add my own rules and rule groups.
  4. For Rule type, choose Rule builder.
  5. In the Rule builder section, for Name, enter your rule name. For Type, choose Rate-based rule.
  6. In the Request rate details section, enter your rate limit (for example, 100). For IP address to use for rate limiting, choose Source IP address, and for Criteria to count requests toward rate limit, choose Only consider requests that match criteria in a rule statement.
  7. For Count only the requests that match the following statement, choose Matches the statement from the drop-down list.
  8. In the Statement section, for Inspect, choose URI path. For Match type , choose Contains string.
  9. For String to match, enter the URI path of your web page (for example, /store).
  10. In the Action section, choose CAPTCHA.
  11. (Optional) For Immunity time, choose Set a custom immunity time for this rule, or keep the default value (300 seconds).
  12. To finish, choose Add rule, and then choose Save to add the rule to your web ACL.

After you add the rule, go to the Rules tab of your web ACL and navigate to your rule. Confirm that the output resembles what is shown in Figure 2. You should have a rate-based rule with a scope-down statement that matches the store URI path you entered earlier, and the action should be set to CAPTCHA.

The following is the JSON for the CAPTCHA rule that you just created. You can use this to validate your configuration. You can also use this JSON in the rule builder while creating the rule.

{
  "Name": "CaptchaOnRBR",
  "Priority": 0,
  "Statement": {
    "RateBasedStatement": {
      "Limit": 100,
      "AggregateKeyType": "IP",
      "ScopeDownStatement": {
        "ByteMatchStatement": {
          "SearchString": "/store",
          "FieldToMatch": {
            "UriPath": {}
          },
          "TextTransformations": [
            {
              "Priority": 0,
              "Type": "NONE"
            }
          ],
          "PositionalConstraint": "CONTAINS"
        }
      }
    }
  },
  "Action": {
    "Captcha": {}
  },
  "VisibilityConfig": {
    "SampledRequestsEnabled": true,
    "CloudWatchMetricsEnabled": true,
    "MetricName": "CaptchaOnRBR"
  },
  "CaptchaConfig": {
    "ImmunityTimeProperty": {
      "ImmunityTime": 60
    }
  }
}

After you complete this configuration, the rule will be invoked when an IP address unsuccessfully attempts to search the store at a rate that exceeds the threshold. This user will be presented with a CAPTCHA challenge, as shown in Figure 6. If the user is successful, they will be routed back to the store page. Otherwise, they will be served a new puzzle until it is solved.

Figure 3: CAPTCHA challenge presented to a request that exceeded the threshold

Figure 3: CAPTCHA challenge presented to a request that exceeded the threshold

Implementing rate-based rules and CAPTCHA also allows you to track IP addresses, limit the number of invalid search attempts, and use the specific IP information available to you within sampled requests and AWS WAF logs to work to prevent that traffic from affecting your resources. Additionally, you have visibility into IPs addresses blocked by rate-based rules so that you can later add these addresses to a block list or create custom logic as needed to mitigate false positives.

Conclusion

In this blog post, you learned how to configure and deploy a CAPTCHA challenge with AWS WAF that checks for web requests that exceed a certain rate threshold and requires the client sending such requests to solve a challenge. Please note the additional charge for enabling CAPTCHA on your web ACL (pricing can be found here). Although CAPTCHA challenges are simple for humans to complete, they should be harder for common bots to complete with any meaningful rate of success. You can use a CAPTCHA challenge when a block action would stop too many legitimate requests, but letting all traffic through would result in unacceptably high levels of unwanted requests, such as from bots.

For more information and guidance on AWS WAF rate-based rules, see the blog post The three most important AWS WAF rate-based rules and the AWS whitepaper AWS Best Practices for DDoS Resiliency. You can also check out these additional resources:

 
If you have feedback about this blog post, submit comments in the Comments section below. You can also start a new thread on AWS WAF re:Post to get answers from the community.

Want more AWS Security news? Follow us on Twitter.

Abhinav Bannerjee

Abhinav Bannerjee

Abhinav is a Solutions Architect based out of Texas. He works closely with small to medium sized businesses to help them scale their adoption of Amazon Web Services.

Fenil Patel

Fenil Patel

Fenil is a Solutions Architect based out of New Jersey. His main focus is helping customers optimize and secure content delivery using AWS Edge Services.

Journey to adopt Cloud-Native DevOps platform Series #2: Progressive delivery on Amazon EKS with Flagger and Gloo Edge Ingress Controller

Post Syndicated from Purna Sanyal original https://aws.amazon.com/blogs/devops/journey-to-adopt-cloud-native-devops-platform-series-2-progressive-delivery-on-amazon-eks-with-flagger-and-gloo-edge-ingress-controller/

In the last post, OfferUp modernized its DevOps platform with Amazon EKS and Flagger to accelerate time to market, we talked about hypergrowth and the technical challenges encountered by OfferUp in its existing DevOps platform. As a reminder, we presented how OfferUp modernized its DevOps platform with Amazon Elastic Kubernetes Service (Amazon EKS) and Flagger to gain developer’s velocity, automate faster deployment, and achieve lower cost of ownership.

In this post, we discuss the technical steps to build a DevOps platform that enables the progressive deployment of microservices on Amazon Managed Amazon EKS. Progressive delivery exposes a new version of the software incrementally to ingress traffic and continuously measures the success rate of the metrics before allowing all of the new traffics to a newer version of the software. Flagger is the Graduate project of Cloud Native Computing Foundations (CNCF) that enables progressive canary delivery, along with bule/green and A/B Testing, while measuring metrics like HTTP/gRPC request success rate and latency. Flagger shifts and routes traffic between app versions using a service mesh or an Ingress controller

We leverage Gloo Ingress Controller for traffic routing, Prometheus, Datadog, and Amazon CloudWatch for application metrics analysis and Slack to send notification. Flagger will post messages to slack when a deployment has been initialized, when a new revision has been detected, and if the canary analysis failed or succeeded.

Prerequisite steps to build the modern DevOps platform

You need an AWS Account and AWS Identity and Access Management (IAM) user to build the DevOps platform. If you don’t have an AWS account with Administrator access, then create one now by clicking here. Create an IAM user and assign admin role. You can build this platform in any AWS region however, I will you us-west-1 region throughout this post. You can use a laptop (Mac or Windows) or an Amazon Elastic Compute Cloud (AmazonEC2) instance as a client machine to install all of the necessary software to build the GitOps platform. For this post, I launched an Amazon EC2 instance (with Amazon Linux2 AMI) as the client and install all of the prerequisite software. You need the awscli, git, eksctl, kubectl, and helm applications to build the GitOps platform. Here are the prerequisite steps,

  1. Create a named profile(eks-devops)  with the config and credentials file:

aws configure --profile eks-devops

AWS Access Key ID [None]: xxxxxxxxxxxxxxxxxxxxxx

AWS Secret Access Key [None]: xxxxxxxxxxxxxxxxxx

Default region name [None]: us-west-1

Default output format [None]:

View and verify your current IAM profile:

export AWS_PROFILE=eks-devops

aws sts get-caller-identity

  1. If the Amazon EC2 instance doesn’t have git preinstalled, then install git in your Amazon EC2 instance:

sudo yum update -y

sudo yum install git -y

Check git version

git version

Git clone the repo and download all of the prerequisite software in the home directory.

git clone https://github.com/aws-samples/aws-gloo-flux.git

  1. Download all of the prerequisite software from install.sh which includes awscli, eksctl, kubectl, helm, and docker:

cd aws-gloo-flux/eks-flagger/

ls -lt

chmod 700 install.sh ecr-setup.sh

. install.sh

Check the version of the software installed:

aws --version

eksctl version

kubectl version -o json

helm version

docker --version

docker info

If the docker info shows an error like “permission denied”, then reboot the Amazon EC2 instance or re-log in to the instance again.

  1. Create an Amazon Elastic Container Repository (Amazon ECR) and push application images.

Amazon ECR is a fully-managed container registry that makes it easy for developers to share and deploy container images and artifacts. ecr setup.sh script will create a new Amazon ECR repository and also push the podinfo images (6.0.0, 6.0.1, 6.0.2, 6.1.0, 6.1.5 and 6.1.6) to the Amazon ECR. Run ecr-setup.sh script with the parameter, “ECR repository name” (e.g. ps-flagger-repository) and region (e.g. us-west-1)

./ecr-setup.sh <ps-flagger-repository> <us-west-1>

You’ll see output like the following (truncated).

###########################################################

Successfully created ECR repository and pushed podinfo images to ECR #

Please note down the ECR repository URI          

xxxxxx.dkr.ecr.us-west-1.amazonaws.com/ps-flagger-repository                                                   

Technical steps to build the modern DevOps platform

This post shows you how to use the Gloo Edge ingress controller and Flagger to automate canary releases for progressive deployment on the Amazon EKS cluster. Flagger requires a Kubernetes cluster v1.16 or newer and Gloo Edge ingress 1.6.0 or newer. This post will provide a step-by-step approach to install the Amazon EKS cluster with managed node group, Gloo Edge ingress controller, and Flagger for Gloo in the Amazon EKS cluster. Now that the cluster, metrics infrastructure, and Flagger are installed, we can install the sample application itself. We’ll use the standard Podinfo application used in the Flagger project and the accompanying loadtester tool. The Flagger “podinfo” backend service will be called by Gloo’s “VirtualService”, which is the root routing object for the Gloo Gateway. A virtual service describes the set of routes to match for a set of domains. We’ll automate the canary promotion, with the new image of the “podinfo” service, from version 6.0.0 to version 6.0.1. We’ll also create a scenario by injecting an error for automated canary rollback while deploying version 6.0.2.

  1. Use myeks-cluster.yaml to create your Amazon EKS cluster with managed nodegroup. myeks-cluster.yaml deployment file has “cluster name” value as ps-eks-66, region value as us-west-1, availabilityZones as [us-west-1a, us-west-1b], Kubernetes version as 1.24, and nodegroup Amazon EC2 instance type as m5.2xlarge. You can change this value if you want to build the cluster in a separate region or availability zone.

eksctl create cluster -f myeks-cluster.yaml

Check the Amazon EKS Cluster details:

kubectl cluster-info

kubectl version -o json

kubectl get nodes -o wide

kubectl get pods -A -o wide

Deploy the Metrics Server:

kubectl apply -f https://github.com/kubernetes-sigs/metrics-server/releases/latest/download/components.yaml

kubectl get deployment metrics-server -n kube-system

Update the kubeconfig file to interact with you cluster:

# aws eks update-kubeconfig --name <ekscluster-name> --region <AWS_REGION>

kubectl config view

cat $HOME/.kube/config

  1. Create a namespace “gloo-system” and Install Gloo with Helm Chart. Gloo Edge is an Envoy-based Kubernetes-native ingress controller to facilitate and secure application traffic.

helm repo add gloo https://storage.googleapis.com/solo-public-helm

kubectl create ns gloo-system

helm upgrade -i gloo gloo/gloo --namespace gloo-system

  1. Install Flagger and the Prometheus add-on in the same gloo-system namespace. Flagger is a Cloud Native Computing Foundation project and part of Flux family of GitOps tools.

helm repo add flagger https://flagger.app

helm upgrade -i flagger flagger/flagger \

--namespace gloo-system \

--set prometheus.install=true \

--set meshProvider=gloo

  1. [Optional] If you’re using Datadog as a monitoring tool, then deploy Datadog agents as a DaemonSet using the Datadog Helm chart. Replace RELEASE_NAME and DATADOG_API_KEY accordingly. If you aren’t using Datadog, then skip this step. For this post, we leverage the Prometheus open-source monitoring tool.

helm repo add datadog https://helm.datadoghq.com

helm repo update

helm install <RELEASE_NAME> \

    --set datadog.apiKey=<DATADOG_API_KEY> datadog/datadog

Integrate Amazon EKS/ K8s Cluster with the Datadog Dashboard – go to the Datadog Console and add the Kubernetes integration.

  1. [Optional] If you’re using Slack communication tool and have admin access, then Flagger can be configured to send alerts to the Slack chat platform by integrating the Slack alerting system with Flagger. If you don’t have admin access in Slack, then skip this step.

helm upgrade -i flagger flagger/flagger \

--set slack.url=https://hooks.slack.com/services/YOUR/SLACK/WEBHOOK \

--set slack.channel=general \

--set slack.user=flagger \

--set clusterName=<my-cluster>

  1. Create a namespace “apps”, and applications and load testing service will be deployed into this namespace.

kubectl create ns apps

Create a deployment and a horizontal pod autoscaler for your custom application or service for which canary deployment will be done.

kubectl -n apps apply -k app

kubectl get deployment -A

kubectl get hpa -n apps

Deploy the load testing service to generate traffic during the canary analysis.

kubectl -n apps apply -k tester

kubectl get deployment -A

kubectl get svc -n apps

  1. Use apps-vs.yaml to create a Gloo virtual service definition that references a route table that will be generated by Flagger.

kubectl apply -f ./apps-vs.yaml

kubectl get vs -n apps

[Optional] If you have your own domain name, then open apps-vs.yaml in vi editor and replace podinfo.example.com with your own domain name to run the app in that domain.

  1. Use canary.yaml to create a canary custom resource. Review the service, analysis, and metrics sections of the canary.yaml file.

kubectl apply -f ./canary.yaml

After a couple of seconds, Flagger will create the canary objects. When the bootstrap finishes, Flagger will set the canary status to “Initialized”.

kubectl -n apps get canary podinfo

NAME      STATUS        WEIGHT   LASTTRANSITIONTIME

podinfo   Initialized   0        2023-xx-xxTxx:xx:xxZ

Gloo automatically creates an ELB. Once the load balancer is provisioned and health checks pass, we can find the sample application at the load balancer’s public address. Note down the ELB’s Public address:

kubectl get svc -n gloo-system --field-selector 'metadata.name==gateway-proxy'   -o=jsonpath='{.items[0].status.loadBalancer.ingress[0].hostname}{"\n"}'

Validate if your application is running, and you’ll see an output with version 6.0.0.

curl <load balancer’s public address> -H "Host:podinfo.example.com"

Trigger progressive deployments and monitor the status

You can Trigger a canary deployment by updating the application container image from 6.0.0 to 6.01.

kubectl -n apps set image deployment/podinfo  podinfod=<ECR URI>:6.0.1

Flagger detects that the deployment revision changed and starts a new rollout.

kubectl -n apps describe canary/podinfo

Monitor all canaries, as the promoted status condition can have one of the following statuses: initialized, Waiting, Progressing, Promoting, Finalizing, Succeeded, and Failed.

watch kubectl get canaries --all-namespaces

curl < load balancer’s public address> -H "Host:podinfo.example.com"

Once canary is completed, validate your application. You can see that the version of the application is changed from 6.0.0 to 6.0.1.

{

  "hostname": "podinfo-primary-658c9f9695-4pqbl",

  "version": "6.0.1",

  "revision": "",

  "color": "#34577c",

  "logo": "https://raw.githubusercontent.com/stefanprodan/podinfo/gh-pages/cuddle_clap.gif",

  "message": "greetings from podinfo v6.0.1",

}

[Optional] Open podinfo application from the laptop browser

Find out both of the IP addresses associated with load balancer.

dig < load balancer’s public address >

Open /etc/hosts file in the laptop and add both of the IPs of load balancer in the host file.

sudo vi /etc/hosts

<Public IP address of LB Target node> podinfo.example.com

e.g.

xx.xx.xxx.xxx podinfo.example.com

xx.xx.xxx.xxx podinfo.example.com

Type “podinfo.example.com” in your browser and you’ll find the application in form similar to this:

Figure 1: Greetings from podinfo v6.0.1

Automated rollback

While doing the canary analysis, you’ll generate HTTP 500 errors and high latency to check if Flagger pauses and rolls back the faulted version. Flagger performs automatic Rollback in the case of failure.

Introduce another canary deployment with podinfo image version 6.0.2 and monitor the status of the canary.

kubectl -n apps set image deployment/podinfo podinfod=<ECR URI>:6.0.2

Run HTTP 500 errors or a high-latency error from a separate terminal window.

Generate HTTP 500 errors:

watch curl -H 'Host:podinfo.example.com' <load balancer’s public address>/status/500

Generate high latency:

watch curl -H 'Host:podinfo.example.com' < load balancer’s public address >/delay/2

When the number of failed checks reaches the canary analysis threshold, the traffic is routed back to the primary, the canary is scaled to zero, and the rollout is marked as failed.

kubectl get canaries --all-namespaces

kubectl -n apps describe canary/podinfo

Cleanup

When you’re done experimenting, you can delete all of the resources created during this series to avoid any additional charges. Let’s walk through deleting all of the resources used.

Delete Flagger resources and apps namespace
kubectl delete canary podinfo -n  apps

kubectl delete HorizontalPodAutoscaler podinfo -n apps

kubectl delete deployment podinfo -n   apps

helm -n gloo-system delete flagger

helm -n gloo-system delete gloo

kubectl delete namespace apps

Delete Amazon EKS Cluster
After you’ve finished with the cluster and nodes that you created for this tutorial, you should clean up by deleting the cluster and nodes with the following command:

eksctl delete cluster --name <cluster name> --region <region code>

Delete Amazon ECR

aws ecr delete-repository --repository-name ps-flagger-repository  --force

Conclusion

This post explained the process for setting up Amazon EKS cluster and how to leverage Flagger for progressive deployments along with Prometheus and Gloo Ingress Controller. You can enhance the deployments by integrating Flagger with Slack, Datadog, and webhook notifications for progressive deployments. Amazon EKS removes the undifferentiated heavy lifting of managing and updating the Kubernetes cluster. Managed node groups automate the provisioning and lifecycle management of worker nodes in an Amazon EKS cluster, which greatly simplifies operational activities such as new Kubernetes version deployments.

We encourage you to look into modernizing your DevOps platform from monolithic architecture to microservice-based architecture with Amazon EKS, and leverage Flagger with the right Ingress controller for secured and automated service releases.

Further Reading

Journey to adopt Cloud-Native DevOps platform Series #1: OfferUp modernized DevOps platform with Amazon EKS and Flagger to accelerate time to market

About the authors:

Purna Sanyal

Purna Sanyal is a technology enthusiast and an architect at AWS, helping digital native customers solve their business problems with successful adoption of cloud native architecture. He provides technical thought leadership, architecture guidance, and conducts PoCs to enable customers’ digital transformation. He is also passionate about building innovative solutions around Kubernetes, database, analytics, and machine learning.

Automate data lineage on Amazon MWAA with OpenLineage

Post Syndicated from Stephen Said original https://aws.amazon.com/blogs/big-data/automate-data-lineage-on-amazon-mwaa-with-openlineage/

In modern data architectures, datasets are combined across an organization using a variety of purpose-built services to unlock insights. As a result, data governance becomes a key component for data consumers and producers to know that their data-driven decisions are based on trusted and accurate datasets. One aspect of data governance is data lineage, which captures the flow of data as it goes through various systems and allows consumers to understand how a dataset was derived.

In order to capture data lineage consistently across various analytical services, you need to use a common lineage model and a robust job orchestration that is able to tie together diverse data flows. One possible solution is the open-source OpenLineage project. It provides a technology-agnostic metadata model for capturing data lineage and integrates with widely used tools. For job orchestration, it integrates with Apache Airflow, which you can run on AWS conveniently through the managed service Amazon Managed Workflows for Apache Airflow (Amazon MWAA). OpenLineage provides a plugin for Apache Airflow that extracts data lineage from Directed Acyclic Graphs (DAGs).

In this post, we show how to get started with data lineage on AWS using OpenLineage. We provide a step-by-step configuration guide for the openlineage-airflow plugin on Amazon MWAA. Additionally, we share an AWS Cloud Development Kit (AWS CDK) project that deploys a pre-configured demo environment for evaluating and experiencing OpenLineage first-hand.

OpenLineage on Apache Airflow

In the following example, Airflow turns OLTP data into a star schema on Amazon Redshift Serverless.

After staging and preparing source data from Amazon Simple Storage Service (Amazon S3), fact and dimension tables are eventually created. For this, Airflow orchestrates the execution of SQL statements that create and populate tables on Redshift Serverless.

Overview on DAGs in Amazon MWAA

The openlineage-airflow plugin collects metadata about creation of datasets and dependencies between them. This allows us to move from a jobs-centric approach of Airflow to a datasets-centric approach, improving the observability of workflows.

The following screenshot shows parts of the captured lineage for the previous example. It’s displayed in Marquez, an open-source metadata service for collection and visualization of data lineage with support for the OpenLineage standard. In Marquez, you can analyze the upstream datasets and transformations that eventually create the user dimension table on the right.

Data lineage graph in marquez

The example in this post is based on SQL and Amazon Redshift. OpenLineage also supports other transformation engines and data stores such as Apache Spark and dbt.

Solution overview

The following diagram shows the AWS setup required to capture data lineage using OpenLineage.

Solution overview

The workflow includes the following components:

  1. The openlineage-airflow plugin is configured on Airflow as a lineage backend. Metadata about the DAG runs is passed by Airflow core to the plugin, which converts it into OpenLineage format and sends it to an external metadata store. In our demo setup, we use Marquez as the metadata store.
  2. The openlineage-airflow plugin receives its configuration from environment variables. To populate these variables on Amazon MWAA, a custom Airflow plugin is used. First, the plugin reads source values from AWS Secrets Manager. Then, it creates environment variables.
  3. Secrets Manager is configured as a secrets backend. Typically, this type of configuration is stored in Airflow’s native metadata database. However, this approach has limitations. For instance, in case of multiple Airflow environments, you need to track and store credentials across multiple environments, and updating credentials requires you to update all the environments. With a secrets backend, you can centralize configuration.
  4. For demo purposes, we collect data lineage from a data pipeline, which creates a star schema in Redshift Serverless.

In the following sections, we walk you through the steps for end-to-end configuration.

Install the openlineage-airflow plugin

Specify the following dependency in the requirements.txt file of the Amazon MWAA environment. Note that the latest Airflow version currently available on Amazon MWAA is 2.4.3; for this post, use the compatible version 0.19.2 of the plugin:

openlineage-airflow==0.19.2

For more details on installing Python dependencies on Amazon MWAA, refer to Installing Python dependencies.

For Airflow < 2.3, configure the plugin’s lineage backend through the following configuration overrides on the Amazon MWAA environment and load it immediately at Airflow start by disabling lazy load of plugins:

AirflowConfigurationOptions:
    core.lazy_load_plugins: False
    lineage.backend: openlineage.lineage_backend.OpenLineageBackend

For more information on configuration overrides, refer to Configuration options overview.

Configure the Secrets Manager backend with Amazon MWAA

Using Secrets Manager as a secrets backend for Amazon MWAA is straightforward. First, provide the execution role of Amazon MWAA with read permission to Secrets Manager. You can use the following policy template as a starting point:

{
  "Version": "2012-10-17",
  "Statement": [
    {
      "Effect": "Allow",
      "Action": [
        "secretsmanager:GetResourcePolicy",
        "secretsmanager:GetSecretValue",
        "secretsmanager:DescribeSecret",
        "secretsmanager:ListSecretVersionIds"
      ],
      "Resource": "arn:aws:secretsmanager:AWS_REGION:<YOUR_ACCOUNT_ID>:secret:"
    },
    {
      "Effect": "Allow",
      "Action": "secretsmanager:ListSecrets",
      "Resource": ""
    }
  ]
}

Second, configure Secrets Manager as a backend in Amazon MWAA through the following configuration overrides:

AirflowConfigurationOptions:
secrets.backend: airflow.contrib.secrets.aws_secrets_manager.SecretsManagerBackend
secrets.backend_kwargs: '{"connections_prefix" : "airflow/connections", "variables_prefix" : "airflow/variables"}'

For more information configuring a secrets backend in Amazon MWAA, refer to Configuring an Apache Airflow connection using a Secrets Manager secret and Move your Apache Airflow connections and variables to AWS Secrets Manager.

Deploy a custom envvar plugin to Amazon MWAA

Apache Airflow has a built-in plugin manager through which it can be extended with custom functionality. In our case, this functionality is to populate OpenLineage-specific environment variables based on values in Secrets Manager. Natively, Amazon MWAA allows environment variables with the prefix AIRFLOW__, but the openlineage-airflow plugin expects the prefix OPENLINEAGE__.

The following Python code is used in the plugin. We assume the file is called envvar_plugin.py:

from airflow.plugins_manager import AirflowPlugin
from airflow.models import Variable
import os

os.environ["OPENLINEAGE_URL"] = Variable.get('OPENLINEAGE_URL', default_var='')

class EnvVarPlugin(AirflowPlugin):
  name = "env_var_plugin"

Amazon MWAA has a mechanism to install a plugin through a zip archive. You zip your code, upload the archive to an S3 bucket, and pass the URL to the file to Amazon MWAA:

zip plugins.zip envvar_plugin.py

Upload plugins.zip to an S3 bucket and configure the URL in Amazon MWAA. The following screenshot shows the configuration via the Amazon MWAA console.

Configuration of a custom plugin in Amazon MWAA

For more information on installing custom plugins on Amazon MWAA, refer to Creating a custom plugin that generates runtime environment variables.

Configure connectivity between the openlineage-airflow plugin and Marquez

As a last step, store the URL to Marquez in Secrets Manager. For this, create a secret called airflow/variables/OPENLINEAGE_URL with value <protocol>://<hostname/ip>:<port> (for example, https://marquez.mysite.com:5000).

Configuration of OPENLINEAGE_URL as secret

In case you need to spin up Marquez on AWS, you have multiple options to host, including running it on Amazon Elastic Kubernetes Service (Amazon EKS) or Amazon Elastic Compute Cloud (Amazon EC2). Refer to Running Marquez on AWS or check out our infrastructure template in the next section to deploy Marquez on AWS.

Deploy with an AWS CDK-based solution template

Assuming you want to set up a demo infrastructure for all of the above in one step, you can use the following template based on the AWS CDK.

The template has the following prerequisites:

Complete the following steps to deploy the template:

  1. Clone GitHub repository and install Python dependencies. Bootstrap the AWS CDK if required.
    git clone https://github.com/aws-samples/aws-mwaa-openlineage 
    	cd aws-mwaa-openlineage
    	python3 -m venv .env && source .env/bin/activate
    	python3 -m pip install -r requirements.txt
    	cdk bootstrap

  2. Update the value for the variable EXTERNAL_IP in constants.py to your outbound IP for connecting to the internet:
    # Set variable to outbound IP for connecting to the internet.
    EXTERNAL_IP = "255.255.255.255"

    This configures security groups so that you can access Marquez but block other clients. constants.py is found in the root folder of the cloned repository.

  3. Deploy the VPC_S3 stack to provision a new VPC dedicated for this solution as well as the security groups that are used by the different components:
    cdk deploy vpc-s3

    It creates a new S3 bucket and uploads the source raw data based on the TICKIT sample database. This serves as the landing area from the OLTP database. We then need to parse the metadata of these files through an AWS Glue crawler, which facilitates the native integration between Amazon Redshift and the S3 data lake.

  4. Deploy the lineage stack to create an EC2 instance that hosts Marquez:
    cdk deploy marquez

    Access the Marquez web UI through https://{ec2.public_dns_name}:3000/. This URL is also available as part of the AWS CDK outputs for the lineage stack.

  5. Deploy the Amazon Redshift stack to create a Redshift Serverless endpoint:
    cdk deploy redshift

  6. Deploy the Amazon MWAA stack to create an Amazon MWAA environment:
    cdk deploy mwaa

    You can access the Amazon MWAA UI through the URL provided in the AWS CDK output.

Test a sample data pipeline

On Amazon MWAA, you can see an example data pipeline deployed that consists of two DAGs. It builds a star schema on top of the TICKIT sample database. One DAG is responsible for loading data from the S3 data lake into an Amazon Redshift staging layer; the second DAG loads data from the staging layer to the dimensional model.

Datamodel of star schema

Open the Amazon MWAA UI through the URL obtained in the deployment steps and launch the following DAGs: rs_source_to_staging and rs_staging_to_dm. As part of the run, the lineage metadata is sent to Marquez.

After the DAG has been run, open the Marquez URL obtained in the deployment steps. In Marquez, you can find the lineage metadata for the computed star schema and related data assets on Amazon Redshift.

Clean up

Delete the AWS CDK stacks to avoid ongoing charges for the resources that you created. Run the following command in the aws-mwaa-openlineage project directory so that all resources are undeployed:

cdk destroy --all

Summary

In this post, we showed you how to automate data lineage with OpenLineage on Amazon MWAA. As part of this, we covered how to install and configure the openlineage-airflow plugin on Amazon MWAA. Additionally, we provided a ready-to-use infrastructure template for a complete demo environment.

We encourage you to explore what else can be achieved with OpenLineage. A job orchestrator like Apache Airflow is only one piece of a data platform and not all possible data lineage can be captured on it. We recommend exploring OpenLineage’s integration with other platforms like Apache Spark or dbt. For more information, refer to Integrations.

Additionally, we recommend you visit the AWS Big Data Blog for other useful blog posts on Amazon MWAA and data governance on AWS.


About the Authors

Stephen Said is a Senior Solutions Architect and works with Digital Native Businesses. His areas of interest are data analytics, data platforms and cloud-native software engineering.

Vishwanatha Nayak is a Senior Solutions Architect at AWS. He works with large enterprise customers helping them design and build secure, cost-effective, and reliable modern data platforms using the AWS cloud. He is passionate about technology and likes sharing knowledge through blog posts and twitch sessions.

Paul Villena is an Analytics Solutions Architect with expertise in building modern data and analytics solutions to drive business value. He works with customers to help them harness the power of the cloud. His areas of interests are infrastructure-as-code, serverless technologies and coding in Python.

Manually Approving Security Changes in CDK Pipeline

Post Syndicated from original https://aws.amazon.com/blogs/devops/manually-approving-security-changes-in-cdk-pipeline/

In this post I will show you how to add a manual approval to AWS Cloud Development Kit (CDK) Pipelines to confirm security changes before deployment. With this solution, when a developer commits a change, CDK pipeline identifies an IAM permissions change, pauses execution, and sends a notification to a security engineer to manually approve or reject the change before it is deployed.

Introduction

In my role I talk to a lot of customers that are excited about the AWS Cloud Development Kit (CDK). One of the things they like is that L2 constructs often generate IAM and other security policies. This can save a lot of time and effort over hand coding those policies. Most customers also tell me that the policies generated by CDK are more secure than the policies they generate by hand.

However, these same customers are concerned that their security engineering team does not know what is in the policies CDK generates. In the past, these customers spent a lot of time crafting a handful of IAM policies that developers can use in their apps. These policies were well understood, but overly permissive because they were often reused across many applications.

Customers want more visibility into the policies CDK generates. Luckily CDK provides a mechanism to approve security changes. If you are using CDK, you have probably been prompted to approve security changes when you run cdk deploy at the command line. That works great on a developer’s machine, but customers want to build the same confirmation into their continuous delivery pipeline. CDK provides a mechanism for this with the ConfirmPermissionsBroadening action. Note that ConfirmPermissionsBroadening is only supported by the AWS CodePipline deployment engine.

Background

Before I talk about ConfirmPermissionsBroadening, let me review how CDK creates IAM policies. Consider the “Hello, CDK” application created in AWS CDK Workshop. At the end of this module, I have an AWS Lambda function and an Amazon API Gateway defined by the following CDK code.

// defines an AWS Lambda resource
const hello = new lambda.Function(this, 'HelloHandler', {
  runtime: lambda.Runtime.NODEJS_14_X,    // execution environment
  code: lambda.Code.fromAsset('lambda'),  // code loaded from "lambda" directory
  handler: 'hello.handler'                // file is "hello", function is "handler"
});

// defines an API Gateway REST API resource backed by our "hello" function.
new apigw.LambdaRestApi(this, 'Endpoint', {
  handler: hello
});

Note that I did not need to define the IAM Role or Lambda Permissions. I simply passed a refence to the Lambda function to the API Gateway (line 10 above). CDK understood what I was doing and generated the permissions for me. For example, CDK generated the following Lambda Permission, among others.

{
  "Effect": "Allow",
  "Principal": {
    "Service": "apigateway.amazonaws.com"
  },
  "Action": "lambda:InvokeFunction",
  "Resource": "arn:aws:lambda:us-east-1:123456789012:function:HelloHandler2E4FBA4D",
  "Condition": {
    "ArnLike": {
      "AWS:SourceArn": "arn:aws:execute-api:us-east-1:123456789012:9y6ioaohv0/prod/*/"
    }
  }
}

Notice that CDK generated a narrowly scoped policy, that allows a specific API (line 10 above) to call a specific Lambda function (line 7 above). This policy cannot be reused elsewhere. Later in the same workshop, I created a Hit Counter Construct using a Lambda function and an Amazon DynamoDB table. Again, I associated them using a single line of CDK code.

table.grantReadWriteData(this.handler);

As in the prior example, CDK generated a narrowly scoped IAM policy. This policy allows the Lambda function to perform certain actions (lines 4-11) on a specific table (line 14 below).

{
  "Effect": "Allow",
  "Action": [
    "dynamodb:BatchGetItem",
    "dynamodb:ConditionCheckItem",
    "dynamodb:DescribeTable",
    "dynamodb:GetItem",
    "dynamodb:GetRecords",
    "dynamodb:GetShardIterator",
    "dynamodb:Query",
    "dynamodb:Scan"
  ],
  "Resource": [
    "arn:aws:dynamodb:us-east-1:123456789012:table/HelloHitCounterHits"
  ]
}

As you can see, CDK is doing a lot of work for me. In addition, CDK is creating narrowly scoped policies for each resource, rather than sharing a broadly scoped policy in multiple places.

CDK Pipelines Permissions Checks

Now that I have reviewed how CDK generates policies, let’s discuss how I can use this in a Continuous Deployment pipeline. Specifically, I want to allow CDK to generate policies, but I want a security engineer to review any changes using a manual approval step in the pipeline. Of course, I don’t want security to be a bottleneck, so I will only require approval when security statements or traffic rules are added. The pipeline should skip the manual approval if there are no new security rules added.

Let’s continue to use CDK Workshop as an example. In the CDK Pipelines module, I used CDK to configure AWS CodePipeline to deploy the “Hello, CDK” application I discussed above. One of the last things I do in the workshop is add a validation test using a post-deployment step. Adding a permission check is similar, but I will use a pre-deployment step to ensure the permission check happens before deployment.

First, I will import ConfirmPermissionsBroadening from the pipelines package

import {ConfirmPermissionsBroadening} from "aws-cdk-lib/pipelines";

Then, I can simply add ConfirmPermissionsBroadening to the deploySatage using the addPre method as follows.

const deploy = new WorkshopPipelineStage(this, 'Deploy');
const deployStage = pipeline.addStage(deploy);

deployStage.addPre(    
  new ConfirmPermissionsBroadening("PermissionCheck", {
    stage: deploy
})

deployStage.addPost(
    // Post Deployment Test Code Omitted
)

Once I commit and push this change, a new manual approval step called PermissionCheck.Confirm is added to the Deploy stage of the pipeline. In the future, if I push a change that adds additional rules, the pipeline will pause here and await manual approval as shown in the screenshot below.

Figure 1. Pipeline waiting for manual review

Figure 1. Pipeline waiting for manual review

When the security engineer clicks the review button, she is presented with the following dialog. From here, she can click the URL to see a summary of the change I am requesting which was captured in the build logs. She can also choose to approve or reject the change and add comments if needed.

Figure 2. Manual review dialog with a link to the build logsd

Figure 2. Manual review dialog with a link to the build logs

When the security engineer clicks the review URL, she is presented with the following sumamry of security changes.

Figure 3. Summary of security changes in the build logs

Figure 3. Summary of security changes in the build logs

The final feature I want to add is an email notification so the security engineer knows when there is something to approve. To accomplish this, I create a new Amazon Simple Notification Service (SNS) topic and subscription and associate it with the ConfirmPermissionsBroadening Check.

// Create an SNS topic and subscription for security approvals
const topic = new sns.Topic(this, 'SecurityApproval’);
topic.addSubscription(new subscriptions.EmailSubscription('[email protected]')); 

deployStage.addPre(    
  new ConfirmPermissionsBroadening("PermissionCheck", {
    stage: deploy,
    notificationTopic: topic
})

With the notification configured, the security engineer will receive an email when an approval is needed. She will have an opportunity to review the security change I made and assess the impact. This gives the security engineering team the visibility they want into the policies CDK is generating. In addition, the approval step is skipped if a change does not add security rules so the security engineer does not become a bottle neck in the deployment process.

Conclusion

AWS Cloud Development Kit (CDK) automates the generation of IAM and other security policies. This can save a lot of time and effort but security engineering teams want visibility into the policies CDK generates. To address this, CDK Pipelines provides the ConfirmPermissionsBroadening action. When you add ConfirmPermissionsBroadening to your CI/CD pipeline, CDK will wait for manual approval before deploying a change that includes new security rules.

About the author:

Brian Beach

Brian Beach has over 20 years of experience as a Developer and Architect. He is currently a Principal Solutions Architect at Amazon Web Services. He holds a Computer Engineering degree from NYU Poly and an MBA from Rutgers Business School. He is the author of “Pro PowerShell for Amazon Web Services” from Apress. He is a regular author and has spoken at numerous events. Brian lives in North Carolina with his wife and three kids.

Enable cross-account sharing with direct IAM principals using AWS Lake Formation Tags

Post Syndicated from Aarthi Srinivasan original https://aws.amazon.com/blogs/big-data/enable-cross-account-sharing-with-direct-iam-principals-using-aws-lake-formation-tags/

With AWS Lake Formation, you can build data lakes with multiple AWS accounts in a variety of ways. For example, you could build a data mesh, implementing a centralized data governance model and decoupling data producers from the central governance. Such data lakes enable the data as an asset paradigm and unleash new possibilities with data discovery and exploration across organization-wide consumers. While enabling the power of data in decision-making across your organization, it’s also crucial to secure the data. With Lake Formation, sharing datasets across accounts only requires a few simple steps, and you can control what you share.

Lake Formation has launched Version 3 capabilities for sharing AWS Glue Data Catalog resources across accounts. When moving to Lake Formation cross-account sharing V3, you get several benefits. When moving from V1, you get more optimized usage of AWS Resource Access Manager (AWS RAM) to scale sharing of resources. When moving from V2, you get a few enhancements. First, you don’t have to maintain AWS Glue resource policies to share using LF-tags because Version 3 uses AWS RAM. Second, you can share with AWS Organizations using LF-tags. Third, you can share to individual AWS Identity and Access Management (IAM) users and roles in other accounts, thereby providing data owners control over which individuals can access their data.

Lake Formation tag-based access control (LF-TBAC) is an authorization strategy that defines permissions based on attributes called LF-tags. LF-tags are different from IAM resource tags and are associated only with Lake Formation databases, tables, and columns. LF-TBAC allows you to define the grant and revoke permissions policy by grouping Data Catalog resources, and therefore helps in scaling permissions across a large number of databases and tables. LF-tags are inherited from a database to all its tables and all the columns of each table.

Version 3 offers the following benefits:

  • True central governance with cross-account sharing to specific IAM principals in the target account
  • Ease of use in not having to maintain an AWS Glue resource policy for LF-TBAC
  • Efficient reuse of AWS RAM shares
  • Ease of use in scaling to hundreds of accounts with LF-TBAC

In this post, we illustrate the new features of cross-account sharing Version 3 in a producer-consumer scenario using TPC datasets. We walk through the setup of using LF-TBAC to share data catalog resources from the data producer account to direct IAM users in the consumer account. We also go through the steps in the receiving account to accept the shares and query the data.

Solution overview

To demonstrate the Lake Formation cross-account Version 3 features, we use the TPC datasets available at s3://aws-data-analytics-workshops/shared_datasets/tpcparquet/. The solution consists of steps in both accounts.

In account A, complete the following steps:

  1. As a data producer, register the dataset with Lake Formation and create AWS Glue Data Catalog tables.
  2. Create LF-tags and associate them with the database and tables.
  3. Grant LF-tag based permissions on resources directly to personas in consumer account B.

The following steps take place in account B:

  1. The consumer account data lake admin reviews and accepts the AWS RAM invitations.
  2. The data lake admin gives CREATE DATABASE access to the IAM user lf_business_analysts.
  3. The data lake admin creates a database for the marketing team and grants CREATE TABLE access to lf_campaign_manager.
  4. The IAM users create resource links on the shared database and tables and query them in Amazon Athena.

The producer account A has the following personas:

  • Data lake admin – Manages the data lake in the producer account
  • lf-producersteward – Manages the data and user access

The consumer account B has the following personas:

  • Data lake admin – Manages the data lake in the consumer account
  • lf-business-analysts – The business analysts in the sales team needs access to non-PII data
  • lf-campaign-manager – The manager in the marketing team needs access to data related to products and promotions

Prerequisites

You need the following prerequisites:

  • Two AWS accounts. For this demonstration of how AWS RAM invites are created and accepted, you should use two accounts that are not part of the same organization.
  • An admin IAM user in both accounts to launch the AWS CloudFormation stacks.
  • Lake Formation mode enabled in both the producer and consumer account with cross-account Version 3. For instructions, refer to Change the default permission model.

Lake Formation and AWS CloudFormation setup in account A

To keep the setup simple, we have an IAM admin registered as the data lake admin.

  1. Sign into the AWS Management Console in the us-east-1 Region.
  2. On the Lake Formation console, under Permissions in the navigation pane, choose Administrative roles and tasks.
  3. Select Choose Administrators under Datalake administrators.
  4. In the pop-up window Manage data lake administrators, under IAM users and roles, choose IAM admin user and choose Save.
  5. Choose Launch Stack to deploy the CloudFormation template:
    BDB-2063-launch-cloudformation-stack
  6. Choose Next.
  7. Provide a name for the stack and choose Next.
  8. On the next page, choose Next.
  9. Review the details on the final page and select I acknowledge that AWS CloudFormation might create IAM resources.
  10. Choose Create.

Stack creation should take about 2–3 minutes. The stack establishes the producer setup as follows:

  • Creates an Amazon Simple Storage Service (Amazon S3) data lake bucket
  • Registers the data lake bucket with Lake Formation
  • Creates an AWS Glue database and tables
  • Creates an IAM user (lf-producersteward) who will act as producer steward
  • Creates LF-tags and assigns them to the created catalog resources as specified in the following table
Database Table LF-Tag Key LF-Tag Value Resource Tagged
lftpcdb . Sensitivity Public DATABASE
lftpcdb items HasCampaign true TABLE
lftpcdb promotions HasCampaign true TABLE
lftpcdb customers table columns = "c_last_name","c_first_name","c_email_address" Sensitivity Confidential TABLECOLUMNS

Verify permissions in account A

After the CloudFormation stack launches, complete the following steps in account A:

  1. On the AWS CloudFormation console, navigate to the Outputs tab of the stack.

  1. Choose the LFProducerStewardCredentials value to navigate to the AWS Secrets Manager console.
  2. In the Secret value section, choose Retrieve secret value.
  3. Note down the secret value for the password for IAM user lf-producersteward.

You need this to log in to the console later as the user lf-producersteward.

  1. On the LakeFormation console, choose Databases on the navigation pane.
  2. Open the database lftpcdb.
  3. Verify the LF-tags on the database are created.

  1. Choose View tables and choose the items table to verify the LF-tags.

  1. Repeat the steps for the promotions and customers tables to verify the LF-tags assigned.

  1. On the Lake Formation console, under Data catalog in the navigation pane, choose Databases.
  2. Select the database lftpcdb and on the Actions menu, choose View Permissions.
  3. Verify that there are no default permissions granted on the database lftpcdb for IAMAllowedPrincipals.
  4. If you find any, select the permission and choose Revoke to revoke the permission.
  5. On the AWS Management Console, choose the AWS CloudShell icon on the top menu.

This opens AWS CloudShell in another tab of the browser. Allow a few minutes for the CloudShell environment to set up.

  1. Run the following AWS Command Line Interface (AWS CLI) command after replacing {BUCKET_NAME} with DataLakeBucket from the stack output.
aws s3 cp s3://aws-data-analytics-workshops/shared_datasets/tpcparquet/ s3://${BUCKET_NAME}/tpcparquet/  --recursive

If CloudShell isn’t available in your chosen Region, run the following AWS CLI command to copy the required dataset from your preferred AWS CLI environment as the IAM admin user.

  1. Verify that your S3 bucket has the dataset copied in it.
  2. Log out as the IAM admin user.

Grant permissions in account A

Next, we continue granting Lake Formation permissions to the dataset as a data steward within the producer account. The data steward grants the following LF-tag-based permissions to the consumer personas.

Consumer Persona LF-tag Policy
lf-business-analysts Sensitivity=Public
lf-campaign-manager HasCampaign=true
  1. Log in to account A as user lf-producersteward, using the password you noted from Secrets Manager earlier.
  2. On the Lake Formation console, under Permissions in the navigation pane, choose Data Lake permissions.
  3. Choose Grant.
  4. Under Principals, select External accounts.
  5. Provide the ARN of the IAM user in the consumer account (arn:aws:iam::<accountB_id>:user/lf-business-analysts) and press Enter.

  1. Under LF_Tags or catalog resources, select Resources matched by LF-Tags.
  2. Choose Add LF-Tag to add a new key-value pair.
  3. For the key, choose Sensitivity and for the value, choose Public.
  4. Under Database permissions, select Describe, and under Table permissions, select Select and Describe.

  1. Choose Grant to apply the permissions.
  2. On the Lake Formation console, under Permissions in the navigation pane, choose Data Lake permissions.
  3. Choose Grant.
  4. Under Principals, select External accounts.
  5. Provide the ARN of the IAM user in the consumer account (arn:aws:iam::<accountB_id>:user/lf-campaign-manager) and press Enter.
  6. Under LF_Tags or catalog resources, select Resources matched by LF-Tags.
  7. Choose Add LF-Tag to add a new key-value pair.
  8. For the key, choose HasCampaign and for the value, choose true.

  1. Under Database permissions, select Describe, and under Table permissions, select Select and Describe.
  2. Choose Grant to apply the permissions.
  3.  Verify on the Data lake permissions tab that the permissions you have granted show up correctly.

AWS CloudFormation setup in account B

Complete the following steps in the consumer account:

  1. Log in as an IAM admin user in account B and launch the CloudFormation stack:
    BDB-2063-launch-cloudformation-stack
  2. Choose Next.
  3. Provide a name for the stack, then choose Next.
  4. On the next page, choose Next.
  5. Review the details on the final page and select I acknowledge that AWS CloudFormation might create IAM resources.
  6. Choose Create.

Stack creation should take about 2–3 minutes. The stack sets up the following resources in account B:

  • IAM users datalakeadmin1, lf-business-analysts, and lf-campaign-manager, with relevant IAM and Lake Formation permissions
  • A database called db_for_shared_tables with Create_Table permissions to the lf-campaign-manager user
  • An S3 bucket named lfblog-athenaresults-<your-accountB-id>-us-east-1 with ListBucket and write permissions to lf-business-analysts and lf-campaign-manager

Note down the stack output details.

Accept resource shares in account B

After you launch the CloudFormation stack, complete the following steps in account B:

  1. On the CloudFormation stack Outputs tab, choose the link for DataLakeAdminCredentials.

This takes you to the Secrets Manager console.

  1. On the Secrets Manager console, choose Retrieve secret value and copy the password for DataLakeAdmin user.
  2. Use the ConsoleIAMLoginURL value from the CloudFormation template output to log in to account B with the data lake admin user name datalakeadmin1 and the password you copied from Secrets Manager.
  3. Open the AWS RAM console in another browser tab.
  4. In the navigation pane, under Shared with me, choose Resource shares to view the pending invitations.

You should see two resource share invitations from the producer account A: one for database-level share and one for table-level share.

  1. Choose each resource share link, review the details, and choose Accept.

After you accept the invitations, the status of the resource shares changes from Active from Pending.

Grant permissions in account B

To grant permissions in account B, complete the following steps:

  1. On the Lake Formation console, under Permissions on the navigation pane, choose Administrative roles and tasks.

  1. Under Database creators, choose Grant.

  1. Under IAM users and roles, choose lf-business-analysts.
  2. For Catalog permissions, select Create database.
  3. Choose Grant.
  4. Log out of the console as the data lake admin user.

Query the shared datasets as consumer users

To validate the lf-business-analysts user’s data access, perform the following steps:

  1. Log in to the console as lf-business-analysts, using the credentials noted from the CloudFormation stack output.
  2. On the Lake Formation console, under Data catalog in the navigation pane, choose Databases.

  1. Select the database lftpcdb and on the Actions menu, choose Create resource link.

  1. Under Resource link name, enter rl_lftpcdb.
  2. Choose Create.
  3. After the resource link is created, select the resource link and choose View tables.

You can now see the four tables in the shared database.

  1. Open the Athena console in another browser tab and choose the lfblog-athenaresults-<your-accountB-id>-us-east-1 bucket as the query results location.
  2. Verify data access using the following query (for more information, refer to Running SQL queries using Amazon Athena):
Select * from rl_lftpcdb.customers limit 10;

The following screenshot shows the query output.

Notice that account A shared the database lftpcdb to account B using the LF-tag expression Sensitivity=Public. Columns c_first_name, c_last_name, and c_email_address in table customers were overwritten with Sensitivity=Confidential. Therefore, these three columns are not visible to user lf-business-analysts.

You can preview the other tables from the database similarly to see the available columns and data.

  1. Log out of the console as lf-business-analysts.

Now we can validate the lf-campaign-manager user’s data access.

  1. Log in to the console as lf-campaign-manager using the credentials noted from the CloudFormation stack output.
  2. On the Lake Formation console, under Data catalog in the navigation pane, choose Databases.
  3. Verify that you can see the database db_for_shared_tables shared by the data lake admin.

  1. Under Data catalog in the navigation pane, choose Tables.

You should be able to see the two tables shared from account A using the LF-tag expression HasCampaign=true. The two tables show the Owner account ID as account A.

Because lf-campaign-manager received table level shares, this user will create table-level resource links for querying in Athena.

  1. Select the promotions table, and on the Actions menu, choose Create resource link.

  1. For Resource link name, enter rl_promotions.

  1. Under Database, choose db_for_shared_tables for the database to contain the resource link.
  2. Choose Create.
  3. Repeat the table resource link creation for the other table items.

Notice that the resource links show account B as owner, whereas the actual tables show account A as the owner.

  1. Open the Athena console in another browser tab and choose the lfblog-athenaresults-<your-accountB-id>-us-east-1 bucket as the query results location.
  2. 11. Query the tables using the resource links.

As shown in the following screenshot, all columns of both tables are accessible to lf-campaign-manager.

In summary, you have seen how LF-tags are used to share a database and select tables from one account to another account’s IAM users.

Clean up

To avoid incurring charges on the AWS resources created in this post, you can perform the following steps.

First, clean up resources in account A:

  1. Empty the S3 bucket created for this post by deleting the downloaded objects from your S3 bucket.
  2. Delete the CloudFormation stack.

This deletes the S3 bucket, custom IAM roles, policies, and the LF database, tables, and permissions.

  1. You may choose to undo the Lake Formation settings also and add IAM access back from the Lake Formation console Settings page.

Now complete the following steps in account B:

  1. Empty the S3 bucket lfblog-athenaresults-<your-accountB-id>-us-east-1 used as the Athena query results location.
  2. Revoke permission to lf-business-analysts as database creator.
  3. Delete the CloudFormation stack.

This deletes the IAM users, S3 bucket, Lake Formation database db_for_shared_tables, resource links, and all the permissions from Lake Formation.

If there are any resource links and permissions left, delete them manually in Lake Formation from both accounts.

Conclusion

In this post, we illustrated the benefits of using Lake Formation cross-account sharing Version 3 using LF-tags to direct IAM principals and how to receive the shared tables in the consumer account. We used a two-account scenario in which a data producer account shares a database and specific tables to individual IAM users in another account using LF-tags. In the receiving account, we showed the role played by a data lake admin vs. the receiving IAM users. We also illustrated how to overwrite column tags to mask and share PII data.

With Version 3 of cross-account sharing features, Lake Formation makes possible more modern data mesh models, where a producer can directly share to an IAM principal in another account, instead of the entire account. Data mesh implementation becomes easier for data administrators and data platform owners because they can easily scale to hundreds of consumer accounts using the LF-tags based sharing to organizational units or IDs.

We encourage you to upgrade your Lake Formation cross-account sharing to Version 3 and benefit from the enhancements. For more details, see Updating cross-account data sharing version settings.


About the authors

Aarthi Srinivasan is a Senior Big Data Architect with AWS Lake Formation. She likes building data lake solutions for AWS customers and partners. When not on the keyboard, she explores the latest science and technology trends and spends time with her family.

Srividya Parthasarathy is a Senior Big Data Architect on the AWS Lake Formation team. She enjoys building analytics and data mesh solutions on AWS and sharing them with the community.

How to encrypt sensitive caller voice input in Amazon Lex

Post Syndicated from Herbert Guerrero original https://aws.amazon.com/blogs/security/how-to-encrypt-sensitive-caller-authentication-voice-input-in-amazon-lex/

In the telecommunications industry, sensitive authentication and user data are typically received through mobile voice and keypads, and companies are responsible for protecting the data obtained through these channels. The increasing use of voice-driven interactive voice response (IVR) has resulted in a need to provide solutions that can protect user data that is gathered from mobile voice inputs. In this blog post, you’ll see how to protect a caller’s sensitive voice data that was captured through Amazon Lex by using data encryption implemented through AWS Lambda functions. The solution described in this post helps you to protect customer data received through voice channels from inadvertent or unknown access. The solution also includes decryption capabilities, which give an authorized administrator or operator the ability to decrypt user data from a Lambda console.

Solution overview

To demonstrate the IVR solution described in this post, a caller speaks two sensitive pieces of data—credit card number and zip code—from an Amazon Connect contact flow. The spoken values are encrypted and returned to the contact flow to be stored in contact attributes. The encrypted ciphertext is retained as a contact attribute for decryption purposes. Amazon CloudWatch Logs is enabled in the contact flow, but only the encrypted values are logged in log streams.

For this solution, conversation logs for this Amazon Lex bot are not enabled. An operator with assigned AWS Identity and Access Management (IAM) permissions can monitor the logged encrypted entries from CloudWatch Logs. For more information, see Working with log groups and log streams in the Amazon CloudWatch Logs User Guide.

Solution architecture

Figure 1 shows the overview of the solution described in this blog post.

Figure 1: Example of solution architecture

Figure 1: Example of solution architecture

Figure 1 shows the following high-level steps of the solution, and the number labels correspond to the following steps.

  1. A caller places an inbound call.
  2. An Amazon Connect contact flow leverages a Get customer input block, backed by an Amazon Lex bot, to prompt the caller for numerical data.
  3. The Amazon Lex bot invokes the Lambda function dev-encryption-core-EncryptFn.
  4. The Lambda function uses the AWS Encryption SDK to encrypt the caller’s plain text data.
  5. The AWS Encryption SDK obtains encryption keys from AWS Key Management Service (AWS KMS).
  6. The caller’s data is encrypted by using the AWS KMS keys obtained from AWS KMS.
  7. The Lambda function appends the encrypted data to the Amazon Lex bot session attributes.
  8. Amazon Lex returns the fully encrypted data back to Amazon Connect.

Overview of a contact flow

Figure 2: Contact flow captures input values using Amazon Lex and returns their encrypted values

Figure 2: Contact flow captures input values using Amazon Lex and returns their encrypted values

Figure 2 shows an overview of the contact flow, which has two main steps:

  1. The first numerical data (in this example, an encrypted credit card number value) is stored in contact attributes.
  2. The second numerical data (in this example, an encrypted zip code value) is stored in contact attributes.

Prerequisites

This solution uses the following AWS services:

The following need to be installed in your local machine:

To implement the solution in this post, you first need the Amazon Connect instance prerequisite in place.

To set up the Amazon Connect instance (if none exists)

  1. Create an Amazon Connect instance with a claimed phone number and a configured Amazon Connect user linked to a basic routing profile. For more information about setting up a contact center, see Set up your contact center in the Amazon Connect Administrator Guide.
  2. Assign the CallCenterManager or Admin security profile to an Amazon Connect user.
  3. In the newly created Amazon Connect instance, under the Overview section, find the access URL with the format
    https://<aliasname>.awsapps.com/connect/login

    • Make note of the access URL, which you will use later to log in to the Amazon Connect Dashboard.
  4. Log in to your Amazon Connect instance with a Connect user that has Admin or CallCenterManager permissions.

Solution procedures

This solution includes the following procedures:

  1. Clone the project or download the solution zip file.
  2. Create AWS resources needed for encryption and decryption.
  3. Configure the Amazon Lex bot in Amazon Connect.
  4. Create the contact flow in Amazon Connect.
  5. Validate the solution.
  6. Decrypt the collected data.

To clone or download the solution

  • Log in to the GitHub repo.
  • Clone or download the solution files to your local machine.

The downloaded file contains the artifacts needed for the deployment.

To create AWS resources needed for encryption and decryption

  1. From the command line, change directory to the project’s root directory.
  2. Run npm install.
  3. Run npm run build to transpile TypeScript to JavaScript and package code and its dependencies before deploying to AWS.
  4. Run cdk deploy CoreStack.

To configure the Amazon Lex bot in your Amazon Connect instance

  1. In the Amazon Connect console, choose Contact flows and scroll to the Amazon Lex section.
    Figure 3: Select Contact flows

    Figure 3: Select Contact flows

  2. From the Bot menu, select secure_LexInput(Classic). Then select +Add Amazon Lex Bot.
    Figure 4: Configure the Amazon Lex bot to Amazon Connect

    Figure 4: Configure the Amazon Lex bot to Amazon Connect

To import contact flow into Amazon Connect

  1. In the Amazon Connect console, choose Overview, and then choose Login as administrator.
  2. From the Routing menu on the left side, choose Contact flows to show the list of contact flows.
  3. Choose Create Contact flow.
  4. Choose the arrow to the right of the Save button and choose Import flow (beta). This imports the contact flow that you previously downloaded in the procedure To clone or download the solution.

    The contact flow already has the Amazon Lex bot configured.

    Figure 5: Select Import flow (beta)

    Figure 5: Select Import flow (beta)

  5. In the upper right corner of the contact flow, choose Save, and then choose OK to save the changes.
  6. Choose Publish to make the contact flow ready for use during the validation steps.
  7. (Optional) Claim a phone number (if none is available), using the following steps:
    1. In the Connect Dashboard, on the navigation menu, choose Channels, and then choose Phone numbers.
    2. On the right side of the page, choose Claim a number.
    3. Select the DID (Direct Inward Dialing) tab. Use the drop-down arrow to choose your country/region. When numbers are returned, choose one.
    4. Write down the phone number. You call it later in this post.
  8. (Optional) On the Edit Phone number page, in the Description box, you can type a note if desired.
  9. To assign the contact flow to your claimed phone number, for Contact flow / IVR, choose the drop-down arrow, and then choose Secure_Lex_Input.
  10. Choose Save.
    Figure 6: Under Contact flow / IVR, select the imported contact flow

    Figure 6: Under Contact flow / IVR, select the imported contact flow

For more information, see Set up phone numbers for your contact center in the Amazon Connect Administrator Guide.

To validate the solution

  1. Dial the test phone number to go through the voice prompt flow.
  2. When prompted, speak a 16-digit credit card number (you have a maximum of two retries), then speak a 5-digit zip code (also a maximum of two retries).
  3. After you complete your test call, review the log streams in Amazon CloudWatch Logs to confirm that the digits that you entered are now encrypted and stored as a contact attribute. The two entered values zipcode and creditcard are stored in contact attributes. Both are encrypted.
    Figure 7: Sample log showing encrypted values for zipcode and creditcard

    Figure 7: Sample log showing encrypted values for zipcode and creditcard

  4. Log in to your Amazon Connect Dashboard as a Supervisor. The URL is provided after the connect instance has been created. In the navigation menu, choose Contact search.
    Figure 8: Choose Contact search to look for the call information

    Figure 8: Choose Contact search to look for the call information

  5. Locate your inbound call on the Contact search list. Note that it can take up to 60 seconds for data to appear in the Contact search list.
  6. Select the Contact ID for your call.
    Figure 9: The Contact search showing the contact details for your test call

    Figure 9: The Contact search showing the contact details for your test call

  7. Copy the encrypted values for creditcard and zipcode and make note of them; you will use these values in the next procedure.
    Figure 10: Contact attributes stored in a contact flow are registered as part of the contact details

    Figure 10: Contact attributes stored in a contact flow are registered as part of the contact details

To decrypt the collected data

  1. In the AWS Lambda console, choose Functions.
  2. Use the Search bar to look for the dev-encryption-core-DecryptFn Lambda function, and then select the name link to open it.
  3. Under folder encryption-master, open the test folder. Under the tab \events, locate the file decrypt.json.
  4. Use the following steps to create a sample test event in the console by using the contents from decrypt.json. For more details, see Testing Lambda functions in the console.
    1. Choose the down arrow on the right side of Test.
    2. Choose Configure test event.
    3. Choose Create new test event.
    4. For Event name, enter decryptTest.
    5. Paste the contents from decrypt.json.
      {
          "Details": {
              "Parameters": {
                  "encrypted": "<encrypted-value-here>"
              }
          }
      }

    6. Choose Save.
  5. Use the encrypted values saved in the Validate a solution procedure and replace the ones in the recently created test event.
    Figure 11: Replace the creditcard or zipCode values with the ones from the Contact Search page

    Figure 11: Replace the creditcard or zipCode values with the ones from the Contact Search page

  6. Choose Test. The output from the test shows the values decrypted by the Lambda function. This is shown in Figure 12 under the Execution result tab.
    Figure 12: Result from the decryption operation

    Figure 12: Result from the decryption operation

Note: Make sure that only the appropriate authorized administrator or operator, application, or AWS service is able to invoke the decryption Lambda function.

You have now successfully implemented the solution by encrypting and decrypting the voice input of your test call, which you collected through Amazon Lex.

Cleanup

To avoid incurring future charges, follow these steps to clean up the deployed resources that you created when implementing this solution.

To delete the Amazon Connect instance

  1. In the Amazon Connect console, under Instance alias, select the name of the Amazon Connect instance, and choose Delete.
  2. When prompted, type the name of the instance, and then choose Delete.

To delete the Amazon Lex bot

  1. In the Amazon Lex console, choose the bot that you created in the To configure the Amazon Lex bot procedure.
  2. Choose Delete, and then choose Continue.

To delete the AWS CloudFormation stack

  1. In the AWS CloudFormation console, on the Stacks page, select the stack you created in the procedure To create AWS resources needed for encryption and decryption.
  2. In the stack details pane, choose Delete.
  3. Choose Delete stack when prompted. This deletes the Amazon S3 bucket, IAM roles and AWS Lambda functions you created for testing. This will also schedule a deletion date on the AWS KMS key.

Conclusion

In this post, you learned how an Amazon Connect contact flow can collect voice inputs from a caller by using Amazon Lex, and how you can encrypt these inputs by using your own AWS KMS key. This solution can help improve the security of voice input that is collected through Amazon Connect. For cost information, see the Amazon Connect pricing page.

For more information, see the blog post Creating a secure IVR solution with Amazon Connect and the topic Encrypt customer input (using OpenSSL) in the Amazon Connect Administrator Guide. As previously mentioned, the increasing use of voice-driven IVR has resulted in a need to provide solutions that can protect user data gathered from mobile voice inputs.

Additional resources include the AWS Lambda Developer Guide, the Amazon Lex Developer Guide, the Amazon Connect Administrator Guide, the AWS Nodejs SDK, and the AWS SDK for Python (Boto3).

If you need help with setting up this solution, you can get assistance from AWS Professional Services. You can also seek assistance from Amazon Connect partners available worldwide.

 
If you have feedback about this post, submit comments in the Comments section below. If you have questions about this post, contact AWS Support.

Want more AWS Security news? Follow us on Twitter.

Herbert Guerrero

Herbert Guerrero

Herbert is a Senior Proserve Consultant for Connect. He enjoys designing and developing high-usability and scalable solutions. Understanding success criteria helps Herbert work backwards and deliver well-architected solutions. His engineering background informs the way he engages with customers’ mental models of what their solutions should look like.

Ed Valdez

Ed Valdez

Ed is a Specialty Consultant with Amazon Web Services. As a software development professional with over 23 years of experience, he specializes on designing and delivering customer-centric solutions within the contact center domain.

How to revoke federated users’ active AWS sessions

Post Syndicated from Matt Howard original https://aws.amazon.com/blogs/security/how-to-revoke-federated-users-active-aws-sessions/

When you use a centralized identity provider (IdP) for human user access, changes that an identity administrator makes to a user within the IdP won’t invalidate the user’s existing active Amazon Web Services (AWS) sessions. This is due to the nature of session durations that are configured on assumed roles. This situation presents a challenge for identity administrators.

In this post, you’ll learn how to revoke access to specific users’ sessions on AWS assumed roles through the use of AWS Identity and Access Management (IAM) policies and service control policies (SCPs) via AWS Organizations.

Session duration overview

When you configure IAM roles, you have the option of configuring a maximum session duration that specifies how long a session is valid. By default, the temporary credentials provided to the user will last for one hour, but you can change this to a value of up to 12 hours.

When a user assumes a role in AWS by using their IdP credentials, that role’s credentials will remain valid for the length of their session duration. It’s convenient for end users to have a maximum session duration set to 12 hours, because this prevents their sessions from frequently timing out and then requiring re-login. However, a longer session duration also poses a challenge if you, as an identity administrator, attempt to revoke or modify a user’s access to AWS from your IdP.

For example, user John Doe is leaving the company and you want to verify that John has his privileges within AWS revoked. If John has access to IAM roles with long-session durations, then he might have residual access to AWS despite having his session revoked or his user identity deleted within the IdP. Perhaps John assumed a role for his daily work at 8 AM and then you revoked his credentials within the IdP at 9 AM. Because John had already assumed an AWS role, he would still have access to AWS through that role for the duration of the configured session, 8 PM if the session was configured for 12 hours. Therefore, as a security best practice, AWS recommends that you do not set the session duration length longer than is needed. This example is displayed in Figure 1.

Figure 1: Session duration overview

Figure 1: Session duration overview

In order to restrict access despite the session duration being active, you could update the roles that are assumable from an IdP with a deny-all policy or delete the role entirely. However, this is a disruptive action for the users that have access to this role. If the role was deleted or the policy was updated to deny all, then users would no longer be able to assume the role or access their AWS environment. Instead, the recommended approach is to revoke access based on the specific user’s principalId or sourceIdentity values.

The principalId is the unique identifier for the entity that made the API call. When requests are made with temporary credentials, such as assumed roles through IdPs, this value also includes the session name, such as [email protected]. The sourceIdentity identifies the original user identity that is making the request, such as a user who is authenticated through SAML federation from an IdP. As a best practice, AWS recommends that you configure this value within the IdP, because this improves traceability for user sessions within AWS. You can find more information on this functionality in the blog post, How to integrate AWS STS SourceIdentity with your identity provider.

Identify the principalId and sourceIdentity by using CloudTrail

You can use AWS CloudTrail to review the actions taken by a user, role, or AWS service that are recorded as events. In the following procedure, you will use CloudTrail to identify the principalId and sourceIdentity contained in the CloudTrail record contents for your IdP assumed role.

To identify the principalId and sourceIdentity by using CloudTrail

  1. Assume a role in AWS by signing in through your IdP.
  2. Perform an action such as a creating an S3 bucket.
  3. Navigate to the CloudTrail service.
  4. In the navigation pane, choose Event History.
  5. For Lookup attributes, choose Event name. For Event name, enter CreateBucket.
  6. Figure 2: Looking up the CreateBucket event in the CloudTrail event history

    Figure 2: Looking up the CreateBucket event in the CloudTrail event history

  7. Select the corresponding event record and review the event details. An example showing the userIdentity element is as follows.

"userIdentity": {
	"type": "AssumedRole",
	"principalId": 
"AROATVGBKRLCHXEXAMPLE:[email protected]",
	"arn": "arn:aws:sts::111122223333:assumed-
role/roleexample/[email protected]",
	"accountId": "111122223333",
	"accessKeyId": "ASIATVGBKRLCJEXAMPLE",
	"sessionContext": {
		"sessionIssuer": {
			"type": "Role",
			"principalId": "AROATVGBKRLCHXEXAMPLE",
			"arn": 
"arn:aws:iam::111122223333:role/roleexample",
			"accountId": "111122223333",
			"userName": "roleexample"
		},
		"webIdFederationData": {},
		"attributes": {
			"creationDate": "2022-07-05T15:48:28Z",
			"mfaAuthenticated": "false"
		},
		"sourceIdentity": "[email protected]"
	}
}

In this event record, you can see that principalId is “AROATVGBKRLCHXEXAMPLE:[email protected] and sourceIdentity was specified as [email protected]. Now that you have these values, let’s explore how you can revoke access by using SCP and IAM policies.

Use an SCP to deny users based on IdP user name or revoke session token

First, you will create an SCP, a policy that can be applied to an organization to offer central control of the maximum available permissions across the accounts in the organization. More information on SCPs, including steps to create and apply them, can be found in the AWS Organizations User Guide.

The SCP will have a deny-all statement with a condition for aws:userid, which will evaluate the principalId field; and a condition for aws:SourceIdentity, which will evaluate the sourceIdentity field. In the following example SCP, the users John Doe and Mary Major are prevented from accessing AWS, in member accounts, regardless of their session duration, because each action will check against their aws:userid and aws:SourceIdentity values and be denied accordingly.

SCP to deny access based on IdP user name


{
	"Version": "2012-10-17",
	"Statement": [
		{
			"Effect": "Deny",
			"Action": "*",
			"Resource": "*",
			"Condition": {
				"StringLike": {
					"aws:userid": [
						"*:[email protected]",
						"*:[email protected]"
				]
			}
		}
	},
	{
			"Effect": "Deny",
			"Action": "*",
			"Resource": "*",
			"Condition": {
				"StringEquals": {
					"aws:SourceIdentity": [
						"[email protected]",
						"[email protected]"
					]
				}
			}
		}
	]
}

Use an IAM policy to revoke access in the AWS Organizations management account

SCPs do not affect users or roles in the AWS Organizations management account and instead only affect the member accounts in the organization. Therefore, using an SCP alone to deny access may not be sufficient. However, identity administrators can revoke access in a similar way within their management account by using the following procedure.

To create an IAM policy in the management account

  1. Sign in to the AWS Management Console by using your AWS Organizations management account credentials.
  2. Follow these steps to use the JSON policy editor to create an IAM policy. Use the JSON of the SCP shown in the preceding section, SCP to deny access based on IdP user name, in the IAM JSON editor.
  3. Follow these steps to add the IAM policy to roles that IdP users may assume within the account.

Revoke active sessions when role chaining

At this point, the user actions on the IdP assumable roles within the AWS organization have been blocked. However, there is still an edge case if the target users use role chaining (use an IdP assumedRole credential to assume a second role) that uses a different RoleSessionName than the one assigned by the IdP. In a role chaining situation, the users will still have access by using the cached credentials for the second role.

This is where the sourceIdentity field is valuable. After a source identity is set, it is present in requests for AWS actions that are taken during the role session. The value that is set persists when a role is used to assume another role (role chaining). The value that is set cannot be changed during the role session. Therefore, it’s recommended that you configure the sourceIdentity field within the IdP as explained previously. This concept is shown in Figure 3.

Figure 3: Role chaining with sourceIdentity configured

Figure 3: Role chaining with sourceIdentity configured

A user assumes an IAM role via their IdP (#1), and the CloudTrail record displays sourceIdentity: [email protected] (#2). When the user assumes a new role within AWS (#3), that CloudTrail record continues to display sourceIdentity: [email protected] despite the principalId changing (#4).

However, if a second role is assumed in the account through role chaining and the sourceIdentity is not set, then it’s recommended that you revoke the issued session tokens for the second role. In order to do this, you can use the SCP policy at the end of this section, SCP to revoke active sessions for assumed roles. When you use this policy, the issued credentials related to the roles specified will be revoked for the users currently using them, and only users who were not denied through the previous SCP or IAM policies restricting their aws:userid will be able to reassume the target roles to obtain a new temporary credential.

If you take this approach, you will need to use an SCP to apply across the organization’s member accounts. The SCP must have the human-assumable roles for role chaining listed and a token issue time set to a specific time when you want users’ access revoked. (Normally, this time window would be set to the present time to immediately revoke access, but there might be circumstances in which you wish to revoke the access at a future date, such as when a user moves to a new project or team and therefore requires different access levels.) In addition, you will need to follow the same procedures in your management account by creating a customer-managed policy by using the same JSON with the condition statement for aws:PrincipalArn removed. Then attach the customer managed policy to the individual roles that are human-assumable through role chaining.

SCP to revoke active sessions for assumed roles


{
	"Version": "2012-10-17",
	"Statement": [
		{
			"Sid": "RevokeActiveSessions",
			"Effect": "Deny",
			"Action": [
				"*"
			],
			"Resource": [
				"*"
			],
			"Condition": {
				"StringEquals": {
					"aws:PrincipalArn": [
						"arn:aws:iam::<account-id>:role/<role-name>",
						"arn:aws:iam::<account-id>:role/<role-name>"
					]
				},
				"DateLessThan": {
					"aws:TokenIssueTime": "2022-06-01T00:00:00Z"
				}
			}
		}
	]
}

Conclusion and final recommendations

In this blog post, I demonstrated how you can revoke a federated user’s active AWS sessions by using SCPs and IAM policies that restrict the use of the aws:userid and aws:SourceIdentity condition keys. I also shared how you can handle a role chaining situation with the aws:TokenIssueTime condition key.

This exercise demonstrates the importance of configuring the session duration parameter on IdP assumed roles. As a security best practice, you should set the session duration to no longer than what is needed to perform the role. In some situations, that could mean an hour or less in a production environment and a longer session in a development environment. Regardless, it’s important to understand the impact of configuring the maximum session duration in the user’s environment and also to have proper procedures in place for revoking a federated user’s access.

This post also covered the recommendation to set the sourceIdentity for assumed roles through the IdP. This value cannot be changed during role sessions and therefore persists when a user conducts role chaining. Following this recommendation minimizes the risk that a user might have assumed another role with a different session name than the one assigned by the IdP and helps prevent the edge case scenario of revoking active sessions based on TokenIssueTime.

You should also consider other security best practices, described in the Security Pillar of the AWS Well-Architected Framework, when you revoke users’ AWS access. For example, rotating credentials such as IAM access keys in situations in which IAM access keys are regularly used and shared among users. The example solutions in this post would not have prevented a user from performing AWS actions if that user had IAM access keys configured for a separate IAM user in the environment. Organizations should limit long-lived security credentials such as IAM keys and instead rotate them regularly or avoid their use altogether. Also, the concept of least privilege is highly important to limit the access that users have and scope it solely to the requirements that are needed to perform their job functions. Lastly, you should adopt a centralized identity provider coupled with the AWS IAM Identity Center (successor to AWS Single Sign-On) service in order to centralize identity management and avoid the need for multiple credentials for users.

If you have feedback about this post, submit comments in the Comments section below. If you have questions about this post, start a new thread on the AWS Identity and Access Management re:Post or contact AWS Support.

Want more AWS Security news? Follow us on Twitter.

Author

Matt Howard

Matt is a Principal Technical Account Manager (TAM) for AWS Enterprise Support. As a TAM, Matt provides advocacy and technical guidance to help customers plan and build solutions using AWS best practices. Outside of AWS, Matt enjoys spending time with family, sports, and video games.

Setting up a secure CI/CD pipeline in a private Amazon Virtual Private Cloud with no public internet access

Post Syndicated from MJ Kubba original https://aws.amazon.com/blogs/devops/setting-up-a-secure-ci-cd-pipeline-in-a-private-amazon-virtual-private-cloud-with-no-public-internet-access/

With the rise of the cloud and increased security awareness, the use of private Amazon VPCs with no public internet access also expanded rapidly. This setup is recommended to make sure of proper security through isolation. The isolation requirement also applies to code pipelines, in which developers deploy their application modules, software packages, and other dependencies and bundles throughout the development lifecycle. This is done without having to push larger bundles from the developer space to the staging space or the target environment. Furthermore, AWS CodeArtifact is used as an artifact management service that will help organizations of any size to securely store, publish, and share software packages used in their software development process.

We’ll walk through the steps required to build a secure, private continuous integration/continuous development (CI/CD) pipeline with no public internet access while maintaining log retention in Amazon CloudWatch. We’ll utilize AWS CodeCommit for source, CodeArtifact for the Modules and software packages, and Amazon Simple Storage Service (Amazon S3) as artifact storage.

Prerequisites

The prerequisites for following along with this post include:

  • An AWS Account
  • A Virtual Private Cloud (Amazon VPC)
  • A CI/CD pipeline – This can be CodePipeline, Jenkins or any CI/CD tool you want to integrate CodeArtifact with, we will use CodePipeline in our walkthrough here.

Solution walkthrough

The main service we’ll focus on is CodeArtifact, a fully managed artifact repository service that makes it easy for organizations of any size to securely store, publish, and share software packages used in their software development process. CodeArtifact works with commonly used package managers and build tools, such as Maven and Gradle (Java), npm and yarn (JavaScript), pip and twine (Python), or NuGet (.NET).

user checkin code to CodeCommit, CodePipeline will detect the change and start the pipeline, in CodeBuild the build stage will utilize the private endpoints and download the software packages needed without the need to go over the internet.

Users push code to CodeCommit, CodePipeline will detect the change and start the pipeline, in CodeBuild the build stage will utilize the private endpoints and download the software packages needed without the need to go over the internet.

The preceding diagram shows how the requests remain private within the VPC and won’t go through the Internet gateway, by going from CodeBuild over the private endpoint to CodeArtifact service, all within the private subnet.

The requests will use the following VPC endpoints to connect to these AWS services:

  • CloudWatch Logs endpoint (for CodeBuild to put logs in CloudWatch)
  • CodeArtifact endpoints
  • AWS Security Token Service (AWS STS) endpoint
  • Amazon Simple Storage Service (Amazon S3) endpoint

Walkthrough

  1. Create a CodeCommit Repository:
    1. Navigate to your CodeCommit Console then click on Create repository
Screenshot: Create repository button

Figure 2. Screenshot: Create repository button.

    1. Type in name for the repository then click Create
Screenshot: Repository setting with name shown as "Private" and empty Description

Figure 3. Screenshot: Repository setting with name shown as “Private” and empty Description.

    1. Scroll down and click Create file
Figure 4. Create file button.

Figure 4. Create file button.

    1. Copy the example buildspec.yml file and paste it to the editor

Example buildspec.yml file:

version: 0.2
phases:
  install:
    runtime-versions:
        nodejs: 16
    
commands:
      - export AWS_STS_REGIONAL_ENDPOINTS=regional
      - ACCT=`aws sts get-caller-identity --region ${AWS_REGION} --query Account --output text`
      - aws codeartifact login --tool npm --repository Private --domain private --domain-owner ${ACCT}
      - npm install
  build:
    commands:
      - node index.js
    1. Name the file buildspec.yml, type in your name and your email address then Commit changes
Figure 5. Screenshot: Create file page.

Figure 5. Screenshot: Create file page.

  1. Create CodeArtifact
    1. Navigate to your CodeArtifact Console then click on Create repository
    2. Give it a name and select npm-store as public upsteam repository
Figure 6. Screenshot: Create repository page with Repository name "Private".

Figure 6. Screenshot: Create repository page with Repository name “Private”.

    1. For the Domain Select this AWS account and enter a domain name
Figure 7. Screenshot: Select domain page.

Figure 7. Screenshot: Select domain page.

    1. Click Next then Create repository
Figure 8. Screenshot: Create repository review page.

Figure 8. Screenshot: Create repository review page.

  1. Create a CI/CD using CodePipeline
    1. Navigate to your CodePipeline Console then click on Create pipeline
Figure 9. Screenshot: Create pipeline button.

Figure 9. Screenshot: Create pipeline button.

    1. Type a name, leave the Service role as “New service role” and click next
Figure 10. Screenshot: Choose pipeline setting page with pipeline name "Private".

Figure 10. Screenshot: Choose pipeline setting page with pipeline name “Private”.

    1. Select AWS CodeCommit as your Source provider
    2. Then choose the CodeCommit repository you created earlier and for branch select main then click Next
Figure 11. Screenshot: Create pipeline add source stage.

Figure 11. Screenshot: Create pipeline add source stage.

    1. For the Build Stage, Choose AWS CodeBuild as the build provider, then click Create Project
Figure 12. Screenshot: Create pipeline add build stage.

Figure 12. Screenshot: Create pipeline add build stage.

    1. This will open new window to create the new Project, Give this project a name
Figure 13. Screenshot: Create pipeline create build project window.

Figure 13. Screenshot: Create pipeline create build project window.

    1.  Scroll down to the Environment section: select pick Managed image,
    2. For Operating system select “Amazon Linux 2”,
    3. Runtime “Standard” and
    4. For Image select the aws/codebuild/amazonlinux2-x86+64-standard:4.0
      For the Image version: Always use the latest image for this runtime version
    5. Select Linux for the Environment type
    6. Leave the Privileged option unchecked and set Service Role to “New service role”
Figure 14. Screenshot: Create pipeline create build project, setting up environment window.

Figure 14. Screenshot: Create pipeline create build project, setting up environment window.

    1. Expand Additional configurations and scroll down to the VPC section, select the desired VPC, your Subnets (we recommend selecting multiple AZs, to ensure high availability), and Security Group (the security group rules must allow resources that will use the VPC endpoint to communicate with the AWS service to communicate with the endpoint network interface, default VPC security group will be used here as an example)
Figure 15. Screenshot: Create pipeline create build project networking window.

Figure 15. Screenshot: Create pipeline create build project networking window.

    1. Scroll down to the Buildspec and select “Use a buildspec file” and type “buildspec.yml” for the Buildspec name
Figure 16. Screenshot: Create pipeline create build project buildspec window.

Figure 16. Screenshot: Create pipeline create build project buildspec window.

    1. Select the CloudWatch logs option you can leave the group name and stream empty this will let the service use the default values and click Continue to CodePipeline
Figure 17. Screenshot: Create pipeline create build project logs window.

Figure 17. Screenshot: Create pipeline create build project logs window.

    1. This will create the new CodeBuild Project, update the CodePipeline page, now you can click Next
Figure 18. Screenshot: Create pipeline add build stage window.

Figure 18. Screenshot: Create pipeline add build stage window.

    1.  Since we are not deploying this to any environment, you can skip the deploy stage and click “Skip deploy stage”

Figure 19. Screenshot: Create pipeline add deploy stage.

Figure 20. Screenshot: Create pipeline skip deployment stage confirmation.

Figure 20. Screenshot: Create pipeline skip deployment stage confirmation.

    1. After you get the popup click skip again you’ll see the review page, scroll all the way down and click Create Pipeline
  1. Create a VPC endpoint for Amazon CloudWatch Logs. This will enable CodeBuild to send execution logs to CloudWatch:
    1. Navigate to your VPC console, and from the navigation menu on the left select “Endpoints”.
Figure 21. Screenshot: VPC endpoint.

Figure 21. Screenshot: VPC endpoint.

    1.  click Create endpoint Button.
Figure 22. Screenshot: Create endpoint.

Figure 22. Screenshot: Create endpoint.

    1. For service Category, select “AWS Services”. You can set a name for the new endpoint, and make sure to use something descriptive.
Figure 23. Screenshot: Create endpoint page.

Figure 23. Screenshot: Create endpoint page.

    1. From the list of services, search for the endpoint by typing logs in the search bar and selecting the one with com.amazonaws.us-west-2.logs.
      This walkthrough can be done in any region that supports the services. I am going to be using us-west-2, please select the appropriate region for your workload.
Figure 24. Screenshot: create endpoint select services with com.amazonaws.us-west-2.logs selected.

Figure 24. Screenshot: create endpoint select services with com.amazonaws.us-west-2.logs selected.

    1. Select the VPC that you want the endpoint to be associated with, and make sure that the Enable DNS name option is checked under additional settings.
Figure 25. Screenshot: create endpoint VPC setting shows VPC selected.

Figure 25. Screenshot: create endpoint VPC setting shows VPC selected.

    1. Select the Subnets where you want the endpoint to be associated, and you can leave the security group as default and the policy as empty.
Figure 26. Screenshot: create endpoint subnet setting shows 2 subnet selected and default security group selected.

Figure 26. Screenshot: create endpoint subnet setting shows 2 subnet selected and default security group selected.

    1. Select Create Endpoint.
Figure 27. Screenshot: create endpoint button.

Figure 27. Screenshot: create endpoint button.

  1. Create a VPC endpoint for CodeArtifact. At the time of writing this article, CodeArifact has two endpoints: one is for API operations like service level operations and authentication, and the other is for using the service such as getting modules for our code. We’ll need both endpoints to automate working with CodeArtifact. Therefore, we’ll create both endpoints with DNS enabled.

In addition, we’ll need AWS Security Token Service (AWS STS) endpoint for get-caller-identity API call:

Follow steps a-c from the steps that were used from the creating the Logs endpoint above.

a. From the list of services, you can search for the endpoint by typing codeartifact in the search bar and selecting the one with com.amazonaws.us-west-2.codeartifact.api.

Figure 28. Screenshot: create endpoint select services with com.amazonaws.us-west-2.codeartifact.api selected.

Figure 28. Screenshot: create endpoint select services with com.amazonaws.us-west-2.codeartifact.api selected.

Follow steps e-g from Part 4.

Then, repeat the same for com.amazon.aws.us-west-2.codeartifact.repositories service.

Figure 29. Screenshot: create endpoint select services with com.amazonaws.us-west-2.codeartifact.api selected.

Figure 29. Screenshot: create endpoint select services with com.amazonaws.us-west-2.codeartifact.api selected.

  1. Enable a VPC endpoint for AWS STS:

Follow steps a-c from Part 4

a. From the list of services you can search for the endpoint by typing sts in the search bar and selecting the one with com.amazonaws.us-west-2.sts.

Figure 30.Screenshot: create endpoint select services with com.amazon.aws.us-west-2.codeartifact.repositories selected.

Figure 30.Screenshot: create endpoint select services with com.amazon.aws.us-west-2.codeartifact.repositories selected.

Then follow steps e-g from Part 4.

  1. Create a VPC endpoint for S3:

Follow steps a-c from Part 4

a. From the list of services you can search for the endpoint by typing sts in the search bar and selecting the one with com.amazonaws.us-west-2.s3, select the one with type of Gateway

Then select your VPC, and select the route tables for your subnets, this will auto update the route table with the new S3 endpoint.

Figure 31. Screenshot: create endpoint select services with com.amazonaws.us-west-2.s3 selected.

Figure 31. Screenshot: create endpoint select services with com.amazonaws.us-west-2.s3 selected.

  1. Now we have all of the endpoints set. The last step is to update your pipeline to point at the CodeArtifact repository when pulling your code dependencies. I’ll use CodeBuild buildspec.yml as an example here.

Make sure that your CodeBuild AWS Identity and Access Management (IAM) role has the permissions to perform STS and CodeArtifact actions.

Navigate to IAM console and click Roles from the left navigation menu, then search for your IAM role name, in our case since we selected “New service role” option in step 2.k was created with the name “codebuild-Private-service-role” (codebuild-<BUILD PROJECT NAME>-service-role)

Figure 32. Screenshot: IAM roles with codebuild-Private-service-role role shown in search.

Figure 32. Screenshot: IAM roles with codebuild-Private-service-role role shown in search.

From the Add permissions menu, click on Create inline policy

Search for STS in the services then select STS

Figure 34. Screenshot: IAM visual editor with sts shown in search.

Figure 34. Screenshot: IAM visual editor with sts shown in search.

Search for “GetCallerIdentity” and select the action

Figure 35. Screenshot: IAM visual editor with GetCallerIdentity in search and action selected.

Figure 35. Screenshot: IAM visual editor with GetCallerIdentity in search and action selected.

Repeat the same with “GetServiceBearerToken”

Figure 36. Screenshot: IAM visual editor with GetServiceBearerToken in search and action selected.

Figure 36. Screenshot: IAM visual editor with GetServiceBearerToken in search and action selected.

Click on Review, add a name then click on Create policy

Figure 37. Screenshot: Review page and Create policy button.

Figure 37. Screenshot: Review page and Create policy button.

You should see the new inline policy added to the list

Figure 38. Screenshot: shows the new in-line policy in the list.

Figure 38. Screenshot: shows the new in-line policy in the list.

For CodeArtifact actions we will do the same on that role, click on Create inline policy

Figure 39. Screenshot: attach policies.

Figure 39. Screenshot: attach policies.

Search for CodeArtifact in the services then select CodeArtifact

Figure 40. Screenshot: select service with CodeArtifact in search.

Figure 40. Screenshot: select service with CodeArtifact in search.

Search for “GetAuthorizationToken” in actions and select that action in the check box

Figure 41. CodeArtifact: with GetAuthorizationToken in search.

Figure 41. CodeArtifact: with GetAuthorizationToken in search.

Repeat for “GetRepositoryEndpoint” and “ReadFromRepository”

Click on Resources to fix the 2 warnings, then click on Add ARN on the first one “Specify domain resource ARN for the GetAuthorizationToken action.”

Figure 42. Screenshot: with all selected filed and 2 warnings.

Figure 42. Screenshot: with all selected filed and 2 warnings.

You’ll get a pop up with fields for Region, Account and Domain name, enter your region, your account number, and the domain name, we used “private” when we created our domain earlier.

Figure 43. Screenshot: Add ARN page.

Figure 43. Screenshot: Add ARN page.

Then click Add

Repeat the same process for “Specify repository resource ARN for the ReadFromRepository and 1 more”, and this time we will provide Region, Account ID, Domain name and Repository name, we used “Private” for the repository we created earlier and “private” for domain

Figure 44. Screenshot: add ARN page.

Figure 44. Screenshot: add ARN page.

Note it is best practice to specify the resource we are targeting, we can use the checkbox for “Any” but we want to narrow the scope of our IAM role best we can.

  1. Navigate to CodeCommit then click on the repo you created earlier in step1
Figure 45. Screenshot: CodeCommit repo.

Figure 45. Screenshot: CodeCommit repo.

Click on Add file dropdown, then Create file button

Paste the following in the editor space:

{
  "dependencies": {
    "mathjs": "^11.2.0"
  }
}

Name the file “package.json”

Add your name and email, and optional commit message

Repeat this process for “index.js” and paste the following in the editor space:

const { sqrt } = require('mathjs')
console.log(sqrt(49).toString())

Figure 46. Screenshot: CodeCommit Commit changes button.

Figure 46. Screenshot: CodeCommit Commit changes button.


This will force the pipeline to kick off and start building the application

Figure 47. Screenshot: CodePipeline.

Figure 47. Screenshot: CodePipeline.

This is a very simple application that gets the square root of 49 and log it to the screen, if you click on the Details link from the pipeline build stage, you’ll see the output of running the NodeJS application, the logs are stored in CloudWatch and you can navigate there by clicking on the link the View entire log “Showing the last xx lines of the build log. View entire log”

Figure 48. Screenshot: Showing the last 54 lines of the build log. View entire log.

Figure 48. Screenshot: Showing the last 54 lines of the build log. View entire log.

We used npm example in the buildspec.yml above, Similar setup will be used for pip and twine,

For Maven, Gradle, and NuGet, you must set Environment variables and change your settings.xml and build.gradle, as well as install the plugin for your IDE. For more information, see here.

Cleanup

Navigate to VPC endpoint from the AWS console and delete the endpoints that you created.

Navigate to CodePipeline and delete the Pipeline you created.

Navigate to CodeBuild and delete the Build Project created.

Navigate to CodeCommit and delete the Repository you created.

Navigate to CodeArtifact and delete the Repository and the domain you created.

Navigate to IAM and delete the Roles created:

For CodeBuild: codebuild-<Build Project Name>-service-role

For CodePipeline: AWSCodePipelineServiceRole-<Region>-<Project Name>

Conclusion

In this post, we deployed a full CI/CD pipeline with CodePipeline orchestrating CodeBuild to build and test a small NodeJS application, using CodeArtifact to download the application code dependencies. All without going to the public internet and maintaining the logs in CloudWatch.

About the author:

MJ Kubba

MJ Kubba is a Solutions Architect who enjoys working with public sector customers to build solutions that meet their business needs. MJ has over 15 years of experience designing and implementing software solutions. He has a keen passion for DevOps and cultural transformation.

re:Invent 2022 DevOps and Developer Productivity Playlist

Post Syndicated from original https://aws.amazon.com/blogs/devops/reinvent-2022-devops-and-developer-productivity-playlist/

Danielle Kucera, Karun Bakshi, and I were privileged to organize the DevOps and Developer Productivity (DOP) track for re:Invent 2022. For 2022, the DOP track included 58 sessions and nearly 100 speakers.  If you weren’t able to attend, I have compiled a list of the on-demand sessions for you below.

Leadership Sessions

Delighting developers: Builder experience at AWS Adam Seligman, Vice President of Developer Experience, and Emily Freeman, Head of Community Development, share the latest AWS tools and experiences for teams developing in the cloud. Adam recaps the latest launches and demos how key services can integrate to accelerate developer productivity.
Amazon CodeCatalyst

Amazon CodeCatalyst, announced during Dr. Werner Vogels Keynote, is a unified software development service that makes it faster to build and deliver on AWS.

Introducing Amazon CodeCatalyst – Harry Mower, Director of DevOps Services, and Doug Clauson, Product Manager, provide an overview of Amazon CodeCatalyst. CodeCatalyst provides one place where you can plan work, collaborate on code, and build, test, and deploy applications with nearly continuous integration/continuous delivery (CI/CD) tools.

Deep dive on CodeCatalyst Workspaces – Tmir Karia, Sr. Product Manager, and Rahul Gulati, Sr. Product Manager,  discuss how Amazon CodeCatalyst Workspaces decreases the time you spend creating and maintaining a local development environment and allows you to quickly set up a cloud development workspace, switch between projects, and replicate the development workspace configuration across team members.

DevOps

AWS Well-Architected best practices for DevOps on AWS Elamaran Shanmugam, Sr. Container Specialist, and Deval Perikh, Sr. Enterprise Solutions Architect, discuss the components required to align your DevOps practices to the pillars of the AWS Well-Architected Framework.

Best practices for securing your software delivery lifecycle Jams Bland, Principal Solutions Architect, and Curtis Rissi, Principal Solutions Architect, discus ways you can secure your CI/CD pipeline on AWS. Review topics like security of the pipeline versus security in the pipeline, ways to incorporate security checkpoints across various pipeline stages, security event management, and aggregating vulnerability findings into a single pane of glass.

Build it & run it: Streamline your DevOps capabilities with machine learning Rafael Ramos, Shivansh Singh, and Jared Reimer discuss how to use machine learning–powered tools like Amazon CodeWhisperer, Amazon CodeGuru, and Amazon DevOps Guru to boost your applications’ availability and write software faster and more reliably.

Infrastructure as Code

AWS infrastructure as code: A year in review  Tatiana Cooke, Principal Product Manager, and Ben Perak, Principal Product Manage, discuss the new features and improvements for AWS infrastructure as code with AWS CloudFormation and AWS CDK.

How to reuse patterns when developing infrastructure as code Ryan Bachman, Ethan Rucinski, and Ravi Palakodeti explore AWS Cloud Development Kit (AWS CDK) constructs and AWS CloudFormation modules and how they make it easier to build applications on AWS.

Governance and security with infrastructure as code David Hessler, Senior DevOps Consultant, and Eric Beard, Senior Solutions Architect, discuss how to use AWS CloudFormation and the AWS CDK to deploy cloud applications in regulated environments while enforcing security controls.

Developer Productivity

Building on AWS with AWS tools, services, and SDKs Kyle Thomson, Senior Software Development Engineer and Deval Parikh, Senior Solutions Architect, discuss the ways developers can set up secure development environments and use their favorite IDEs to interact with, and deploy to, the AWS Cloud.

The Amazon Builders’ Library: 25 years of operational excellence at Amazon Colm MacCarthaigh, Distinguished Engineer, and David Yanacek, Sr. Principal Engineer, discuss how Amazon practices have changed and improved over time and what we’ve learned as builders and as operators.

Sustainability in the cloud with Rust and AWS Graviton Emil Lerch, Principal DevOps Specialist, and Esteban Kuber, Principal Engineer, discuss the benefits of Rust and AWS Graviton that can reduce energy consumption and increase productivity.
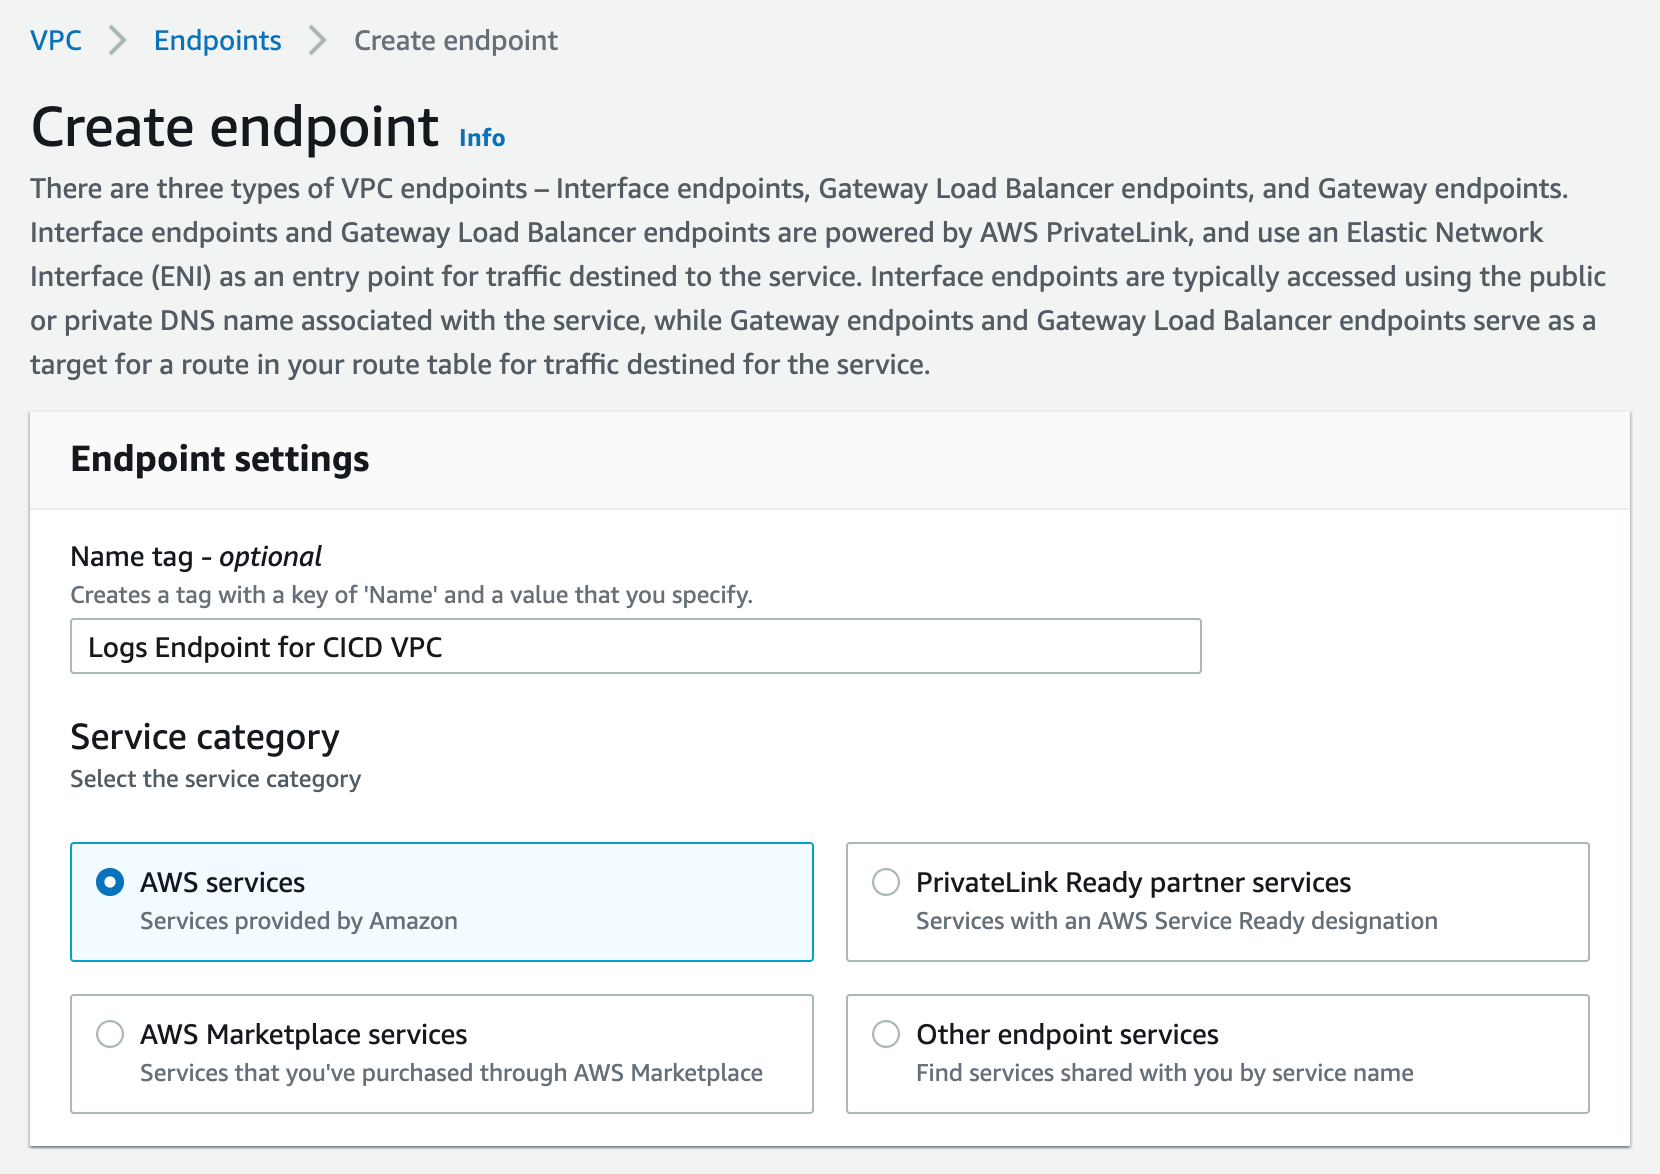


About the author:

Brian Beach

Brian Beach has over 20 years of experience as a Developer and Architect. He is currently a Principal Solutions Architect at Amazon Web Services. He holds a Computer Engineering degree from NYU Poly and an MBA from Rutgers Business School. He is the author of “Pro PowerShell for Amazon Web Services” from Apress. He is a regular author and has spoken at numerous events. Brian lives in North Carolina with his wife and three kids.

Team Collaboration with Amazon CodeCatalyst

Post Syndicated from original https://aws.amazon.com/blogs/devops/team-collaboration-with-amazon-codecatalyst/

Amazon CodeCatalyst enables teams to collaborate on features, tasks, bugs, and any other work involved when building software. CodeCatalyst was announced at re:Invent 2022 and is currently in preview.

Introduction:

In a prior post in this series, Using Workflows to Build, Test, and Deploy with Amazon CodeCatalyst, I discussed reading The Unicorn Project, by Gene Kim, and how the main character, Maxine, struggles with a complicated software development lifecycle (SLDC) after joining a new team. Some of the challenges she encounters include:

  • Continually delivering high-quality updates is complicated and slow
  • Collaborating efficiently with others is challenging
  • Managing application environments is increasingly complex
  • Setting up a new project is a time-consuming chore

In this post, I will focus on the second bullet, and how CodeCatalyst helps you collaborate from anywhere with anyone.

Prerequisites

If you would like to follow along with this walkthrough, you will need to:

Walkthrough

Similar to the prior post, I am going to use the Modern Three-tier Web Application blueprint in this walkthrough. A CodeCatalyst blueprint provides a template for a new project. If you would like to follow along, you can launch the blueprint as described in Creating a project in Amazon CodeCatalyst.  This will deploy the Mythical Mysfits sample application shown in the following image.

The Mythical Mysfits user interface showing header and three Mysfits

Figure 1. The Mythical Mysfits user interface showing header and three Mysfits

For this Walkthrough, let us assume that I need to make a simple change to the application. The legal department would like to add a footer that includes the text “© 2023 Demo Organization.” I will create an issue in CodeCatalyst to track this work and use CodeCatalyst to track the change throughout the entire Software Development Life Cycle (SDLC).

CodeCatalyst organizes projects into Spaces. A space represents your company, department, or group; and contains projects, members, and the associated cloud resources you create in CodeCatalyst. In this walkthrough, my Space currently includes two members, Brian Beach and Panna Shetty, as shown in the following screenshot.  Note that both users are administrators, but CodeCatalyst supports multiple roles. You can read more about roles in members of your space.

The space members configuration page showing two users

Figure 2. The space members configuration page showing two users

To begin, Brian creates a new issue to track the request from legal. He assigns the issue to Panna, but leaves it in the backlog for now. Note that CodeCatalyst supports multiple metadata fields to organize your work. This issue is not impacting users and is relatively simple to fix. Therefore, Brian has categorized it as low priority and estimated the effort as extra small (XS). Brian has also added a label, so all the requests from legal can be tracked together. Note that these metadata fields are customizable. You can read more in configuring issue settings.

Create issue dialog box with name, description and metadata

Figure 3. Create issue dialog box with name, description and metadata

CodeCatalyst supports rich markdown in the description field. You can read about this in Markdown tips and tricks. In the following screenshot, Brian types “@app.vue” which brings up an inline search for people, issues, and code to help Panna find the relevant bit of code that needs changing later.

Create issue dialog box with type-ahead overlay

Figure 4. Create issue dialog box with type-ahead overlay

When Panna is ready to begin work on the new feature, she moves the issue from the “Backlog“ to ”In progress.“ CodeCatalyst allows users to manage their work using a Kanban style board. Panna can simply drag-and-drop issues on the board to move the issue from one state to another. Given the small team, Brian and Panna use a single board. However, CodeCatalyst allows you to create multiple views filtered by the metadata fields discussed earlier. For example, you might create a label called Sprint-001, and use that to create a board for the sprint.

Kanban board showing to do, in progress and in review columns

Figure 5. Kanban board showing to do, in progress and in review columns

Panna creates a new branch for the change called feature_add_copyright and uses the link in the issue description to navigate to the source code repository. This change is so simple that she decides to edit the file in the browser and commits the change. Note that for more complex changes, CodeCatalyst supports Dev Environments. The next post in this series will be dedicated to Dev Environments. For now, you just need to know that a Dev Environment is a cloud-based development environment that you can use to quickly work on the code stored in the source repositories of your project.
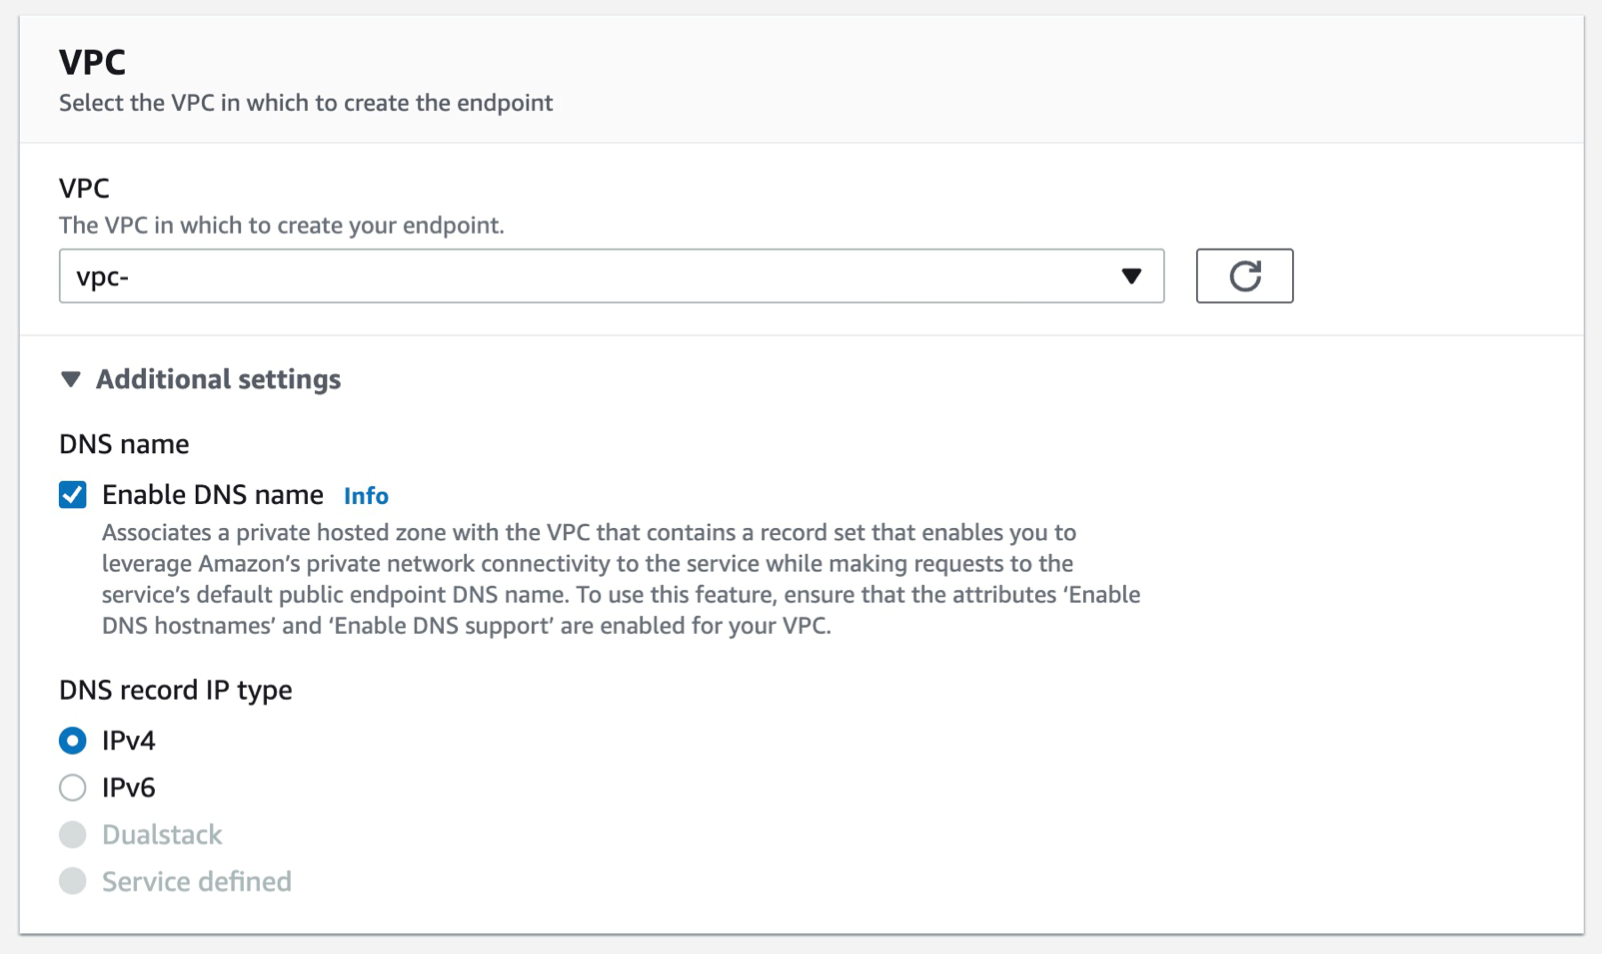
Editor with new lines highlighted

Figure 6. Editor with new lines highlighted

Panna also creates a pull request to merge the feature branch in to the main branch. She identifies Brian as a required reviewer. Panna then moves the issue to the “In review” column on the Kanban board so the rest of the team can track the progress. Once Brian reviews the change, he approves and merges the pull request.

Pull request details with title, description, and reviewed assigned

Figure 7. Pull request details with title, description, and reviewed assigned

When the pull request is merged, a workflow is configured to run automatically on code changes to build, test, and deploy the change. Note that Workflows were covered in the prior post in this series. Once the workflow is complete, Panna is notified in the team’s Slack channel. You can read more about notifications in working with notifications in CodeCatalyst. She verifies the change in production and moves the issue to the done column on the Kanban board.

Kanban board showing in progress, in review, and done columns

Figure 8. Kanban board showing in progress, in review, and done columns

Once the deployment completes, you will see the footer added at the bottom of the page.

Figure 9. The Mythical Mysfits user interface showing footer and three Mysfits

At this point the issue is complete and you have seen how this small team collaborated to progress through the entire software development lifecycle (SDLC).

Cleanup

If you have been following along with this workflow, you should delete the resources you deployed so you do not continue to incur charges. First, delete the two stacks that CDK deployed using the AWS CloudFormation console in the AWS account you associated when you launched the blueprint. These stacks will have names like mysfitsXXXXXWebStack and mysfitsXXXXXAppStack. Second, delete the project from CodeCatalyst by navigating to Project settings and choosing Delete project.

Conclusion

In this post, you learned how CodeCatalyst can help you rapidly collaborate with other developers. I used issues to track feature and bugs, assigned code reviews, and managed pull requests. In future posts I will continue to discuss how CodeCatalyst can address the rest of the challenges Maxine encountered in The Unicorn Project.

About the authors:

Brian Beach

Brian Beach has over 20 years of experience as a Developer and Architect. He is currently a Principal Solutions Architect at Amazon Web Services. He holds a Computer Engineering degree from NYU Poly and an MBA from Rutgers Business School. He is the author of “Pro PowerShell for Amazon Web Services” from Apress. He is a regular author and has spoken at numerous events. Brian lives in North Carolina with his wife and three kids.

Panna Shetty

Panna Shetty is a Sr. Solutions Architect with Amazon Web Services (AWS), working with public sector customers. She enjoys helping customers architect and build scalable and
reliable modern applications using cloud-native technologies.

Secure CDK deployments with IAM permission boundaries

Post Syndicated from Brian Farnhill original https://aws.amazon.com/blogs/devops/secure-cdk-deployments-with-iam-permission-boundaries/

The AWS Cloud Development Kit (CDK) accelerates cloud development by allowing developers to use common programming languages when modelling their applications. To take advantage of this speed, developers need to operate in an environment where permissions and security controls don’t slow things down, and in a tightly controlled environment this is not always the case. Of particular concern is the scenario where a developer has permission to create AWS Identity and Access Management (IAM) entities (such as users or roles), as these could have permissions beyond that of the developer who created them, allowing for an escalation of privileges. This approach is typically controlled through the use of permission boundaries for IAM entities, and in this post you will learn how these boundaries can now be applied more effectively to CDK development – allowing developers to stay secure and move fast.

Time to read 10 minutes
Learning level Advanced (300)
Services used

AWS Cloud Development Kit (CDK)

AWS Identity and Access Management (IAM)

Applying custom permission boundaries to CDK deployments

When the CDK deploys a solution, it assumes a AWS CloudFormation execution role to perform operations on the user’s behalf. This role is created during the bootstrapping phase by the AWS CDK Command Line Interface (CLI). This role should be configured to represent the maximum set of actions that CloudFormation can perform on the developers behalf, while not compromising any compliance or security goals of the organisation. This can become complicated when developers need to create IAM entities (such as IAM users or roles) and assign permissions to them, as those permissions could be escalated beyond their existing access levels. Taking away the ability to create these entities is one way to solve the problem. However, doing this would be a significant impediment to developers, as they would have to ask an administrator to create them every time. This is made more challenging when you consider that security conscious practices will create individual IAM roles for every individual use case, such as each AWS Lambda Function in a stack. Rather than taking this approach, IAM permission boundaries can help in two ways – first, by ensuring that all actions are within the overlap of the users permissions and the boundary, and second by ensuring that any IAM entities that are created also have the same boundary applied. This blocks the path to privilege escalation without restricting the developer’s ability to create IAM identities. With the latest version of the AWS CLI these boundaries can be applied to the execution role automatically when running the bootstrap command, as well as being added to IAM entities that are created in a CDK stack.

To use a permission boundary in the CDK, first create an IAM policy that will act as the boundary. This should define the maximum set of actions that the CDK application will be able to perform on the developer’s behalf, both during deployment and operation. This step would usually be performed by an administrator who is responsible for the security of the account, ensuring that the appropriate boundaries and controls are enforced. Once created, the name of this policy is provided to the bootstrap command. In the example below, an IAM policy called “developer-policy” is used to demonstrate the command.
cdk bootstrap –custom-permissions-boundary developer-policy
Once this command runs, a new bootstrap stack will be created (or an existing stack will be updated) so that the execution role has this boundary applied to it. Next, you can ensure that any IAM entities that are created will have the same boundaries applied to them. This is done by either using a CDK context variable, or the permissionBoundary attribute on those resources. To explain this in some detail, let’s use a real world scenario and step through an example that shows how this feature can be used to restrict developers from using the AWS Config service.

Installing or upgrading the AWS CDK CLI

Before beginning, ensure that you have the latest version of the AWS CDK CLI tool installed. Follow the instructions in the documentation to complete this. You will need version 2.54.0 or higher to make use of this new feature. To check the version you have installed, run the following command.

cdk --version

Creating the policy

First, let’s begin by creating a new IAM policy. Below is a CloudFormation template that creates a permission policy for use in this example. In this case the AWS CLI can deploy it directly, but this could also be done at scale through a mechanism such as CloudFormation Stack Sets. This template has the following policy statements:

  1. Allow all actions by default – this allows you to deny the specific actions that you choose. You should carefully consider your approach to allow/deny actions when creating your own policies though.
  2. Deny the creation of users or roles unless the “developer-policy” permission boundary is used. Additionally limit the attachment of permissions boundaries on existing entities to only allow “developer-policy” to be used. This prevents the creation or change of an entity that can escalate outside of the policy.
  3. Deny the ability to change the policy itself so that a developer can’t modify the boundary they will operate within.
  4. Deny the ability to remove the boundary from any user or role
  5. Deny any actions against the AWS Config service

Here items 2, 3 and 4 all ensure that the permission boundary works correctly – they are controls that prevent the boundary being removed, tampered with, or bypassed. The real focus of this policy in terms of the example are items 1 and 5 – where you allow everything, except the specific actions that are denied (creating a deny list of actions, rather than an allow list approach).

Resources:
  PermissionsBoundary:
    Type: AWS::IAM::ManagedPolicy
    Properties:
      PolicyDocument:
        Statement:
          # ----- Begin base policy ---------------
          # If permission boundaries do not have an explicit allow
          # then the effect is deny
          - Sid: ExplicitAllowAll
            Action: "*"
            Effect: Allow
            Resource: "*"
          # Default permissions to prevent privilege escalation
          - Sid: DenyAccessIfRequiredPermBoundaryIsNotBeingApplied
            Action:
              - iam:CreateUser
              - iam:CreateRole
              - iam:PutRolePermissionsBoundary
              - iam:PutUserPermissionsBoundary
            Condition:
              StringNotEquals:
                iam:PermissionsBoundary:
                  Fn::Sub: arn:${AWS::Partition}:iam::${AWS::AccountId}:policy/developer-policy
            Effect: Deny
            Resource: "*"
          - Sid: DenyPermBoundaryIAMPolicyAlteration
            Action:
              - iam:CreatePolicyVersion
              - iam:DeletePolicy
              - iam:DeletePolicyVersion
              - iam:SetDefaultPolicyVersion
            Effect: Deny
            Resource:
              Fn::Sub: arn:${AWS::Partition}:iam::${AWS::AccountId}:policy/developer-policy
          - Sid: DenyRemovalOfPermBoundaryFromAnyUserOrRole
            Action: 
              - iam:DeleteUserPermissionsBoundary
              - iam:DeleteRolePermissionsBoundary
            Effect: Deny
            Resource: "*"
          # ----- End base policy ---------------
          # -- Begin Custom Organization Policy --
          - Sid: DenyModifyingOrgCloudTrails
            Effect: Deny
            Action: config:*
            Resource: "*"
          # -- End Custom Organization Policy --
        Version: "2012-10-17"
      Description: "Bootstrap Permission Boundary"
      ManagedPolicyName: developer-policy
      Path: /

Save the above locally as developer-policy.yaml and then you can deploy it with a CloudFormation command in the AWS CLI:

aws cloudformation create-stack --stack-name DeveloperPolicy \
        --template-body file://developer-policy.yaml \
        --capabilities CAPABILITY_NAMED_IAM

Creating a stack to test the policy

To begin, create a new CDK application that you will use to test and observe the behaviour of the permission boundary. Create a new directory with a TypeScript CDK application in it by executing these commands.

mkdir DevUsers && cd DevUsers
cdk init --language typescript

Once this is done, you should also make sure that your account has a CDK bootstrap stack deployed with the cdk bootstrap command – to start with, do not apply a permission boundary to it, you can add that later an observe how it changes the behaviour of your deployment. Because the bootstrap command is not using the --cloudformation-execution-policies argument, it will default to arn:aws:iam::aws:policy/AdministratorAccess which means that CloudFormation will have full access to the account until the boundary is applied.

cdk bootstrap

Once the command has run, create an AWS Config Rule in your application to be sure that this works without issue before the permission boundary is applied. Open the file lib/dev_users-stack.ts and edit its contents to reflect the sample below.


import * as cdk from 'aws-cdk-lib';
import { ManagedRule, ManagedRuleIdentifiers } from 'aws-cdk-lib/aws-config';
import { Construct } from "constructs";

export class DevUsersStack extends cdk.Stack {
  constructor(scope: Construct, id: string, props?: cdk.StackProps) {
    super(scope, id, props);

    new ManagedRule(this, 'AccessKeysRotated', {
      configRuleName: 'access-keys-policy',
      identifier: ManagedRuleIdentifiers.ACCESS_KEYS_ROTATED,
      inputParameters: {
        maxAccessKeyAge: 60, // default is 90 days
      },
    });
  }
}

Next you can deploy with the CDK CLI using the cdk deploy command, which will succeed (the output below has been truncated to show a summary of the important elements).

❯ cdk deploy
✨  Synthesis time: 3.05s
✅  DevUsersStack
✨  Deployment time: 23.17s

Stack ARN:
arn:aws:cloudformation:ap-southeast-2:123456789012:stack/DevUsersStack/704a7710-7c11-11ed-b606-06d79634f8d4

✨  Total time: 26.21s

Before you deploy the permission boundary, remove this stack again with the cdk destroy command.

❯ cdk destroy
Are you sure you want to delete: DevUsersStack (y/n)? y
DevUsersStack: destroying... [1/1]
✅ DevUsersStack: destroyed

Using a permission boundary with the CDK test application

Now apply the permission boundary that you created above and observe the impact it has on the same deployment. To update your booststrap with the permission boundary, re-run the cdk bootstrap command with the new custom-permissions-boundary parameter.

cdk bootstrap --custom-permissions-boundary developer-policy

After this command executes, the CloudFormation execution role will be updated to use that policy as a permission boundary, which based on the deny rule for config:* will cause this same application deployment to fail. Run cdk deploy again to confirm this and observe the error message.

❌ Deployment failed: Error: Stack Deployments Failed: Error: The stack
named DevUsersStack failed creation, it may need to be manually deleted 
from the AWS console: 
  ROLLBACK_COMPLETE: 
    User: arn:aws:sts::123456789012:assumed-role/cdk-hnb659fds-cfn-exec-role-123456789012-ap-southeast-2/AWSCloudFormation
    is not authorized to perform: config:PutConfigRule on resource: access-keys-policy with an explicit deny in a
    permissions boundary

This shows you that the action was denied specifically due to the use of a permissions boundary, which is what was expected.

Applying permission boundaries to IAM entities automatically

Next let’s explore how the permission boundary can be extended to IAM entities that are created by a CDK application. The concern here is that a developer who is creating a new IAM entity could assign it more permissions than they have themselves – the permission boundary manages this by ensuring that entities can only be created that also have the boundary attached. You can validate this by modifying the stack to deploy a Lambda function that uses a role that doesn’t include the boundary. Open the file lib/dev_users-stack.ts again and edit its contents to reflect the sample below.

import * as cdk from 'aws-cdk-lib';
import { PolicyStatement } from "aws-cdk-lib/aws-iam";
import {
  AwsCustomResource,
  AwsCustomResourcePolicy,
  PhysicalResourceId,
} from "aws-cdk-lib/custom-resources";
import { Construct } from "constructs";

export class DevUsersStack extends cdk.Stack {
  constructor(scope: Construct, id: string, props?: cdk.StackProps) {
    super(scope, id, props);

    new AwsCustomResource(this, "Resource", {
      onUpdate: {
        service: "ConfigService",
        action: "putConfigRule",
        parameters: {
          ConfigRule: {
            ConfigRuleName: "SampleRule",
            Source: {
              Owner: "AWS",
              SourceIdentifier: "ACCESS_KEYS_ROTATED",
            },
            InputParameters: '{"maxAccessKeyAge":"60"}',
          },
        },
        physicalResourceId: PhysicalResourceId.of("SampleConfigRule"),
      },
      policy: AwsCustomResourcePolicy.fromStatements([
        new PolicyStatement({
          actions: ["config:*"],
          resources: ["*"],
        }),
      ]),
    });
  }
}

Here the AwsCustomResource is used to provision a Lambda function that will attempt to create a new config rule. This is the same result as the previous stack but in this case the creation of the rule is done by a new IAM role that is created by the CDK construct for you. Attempting to deploy this will result in a failure – run cdk deploy to observe this.

❌ Deployment failed: Error: Stack Deployments Failed: Error: The stack named 
DevUsersStack failed creation, it may need to be manually deleted from the AWS 
console: 
  ROLLBACK_COMPLETE: 
    API: iam:CreateRole User: arn:aws:sts::123456789012:assumed-
role/cdk-hnb659fds-cfn-exec-role-123456789012-ap-southeast-2/AWSCloudFormation
    is not authorized to perform: iam:CreateRole on resource:
arn:aws:iam::123456789012:role/DevUsersStack-
AWS679f53fac002430cb0da5b7982bd2287S-1EAD7M62914OZ
    with an explicit deny in a permissions boundary

The error message here details that the stack was unable to deploy because the call to iam:CreateRole failed because the boundary wasn’t applied. The CDK now offers a straightforward way to set a default permission boundary on all IAM entities that are created, via the CDK context variable core:permissionsBoundary in the cdk.json file.

{
  "context": {
     "@aws-cdk/core:permissionsBoundary": {
       "name": "developer-policy"
     }
  }
}

This approach is useful because now you can import constructs that create IAM entities (such as those found on Construct Hub or out of the box constructs that create default IAM roles) and have the boundary apply to them as well. There are alternative ways to achieve this, such as setting a boundary on specific roles, which can be used in scenarios where this approach does not fit. Make the change to your cdk.json file and run the CDK deploy again. This time the custom resource will attempt to create the config rule using its IAM role instead of the CloudFormation execution role. It is expected that the boundary will also protect this Lambda function in the same way – run cdk deploy again to confirm this. Note that the deployment updates from CloudFormation show that this time the role creation succeeds this time, and a new error message is generated.

❌ Deployment failed: Error: Stack Deployments Failed: Error: The stack named
DevUsersStack failed creation, it may need to be manually deleted from the AWS 
console:
  ROLLBACK_COMPLETE: 
    Received response status [FAILED] from custom resource. Message returned: User:
    arn:aws:sts::123456789012:assumed-role/DevUsersStack-
AWS679f53fac002430cb0da5b7982bd2287S-84VFVA7OGC9N/DevUsersStack-
AWS679f53fac002430cb0da5b7982bd22872-MBnArBmaaLJp
    is not authorized to perform: config:PutConfigRule on resource: SampleRule with an explicit deny in a permissions boundary

In this error message you can see that the user it refers to is DevUsersStack-AWS679f53fac002430cb0da5b7982bd2287S-84VFVA7OGC9N rather than the CloudFormation execution role. This is the role being used by the custom Lambda function resource, and when it attempts to create the Config rule it is rejected because of the permissions boundary in the same way. Here you can see how the boundary is being applied consistently to all IAM entities that are created in your CDK app, which ensures the administrative controls can be applied consistently to everything a developer does with a minimal amount of overhead.

Cleanup

At this point you can either choose to remove the CDK bootstrap stack if you no longer require it, or remove the permission boundary from the stack. To remove it, delete the CDKToolkit stack from CloudFormation with this AWS CLI command.

aws cloudformation delete-stack --stack-name CDKToolkit

If you want to keep the bootstrap stack, you can remove the boundary by following these steps:

  1. Browse to the CloudFormation page in the AWS console, and select the CDKToolit stack.
  2. Select the ‘Update’ button. Choose “Use Current Template” and then press ‘Next’
  3. On the parameters page, find the value InputPermissionsBoundary which will have developer-policy as the value, and delete the text in this input to leave it blank. Press ‘Next’ and the on the following page, press ‘Next’ again
  4. On the final page, scroll to the bottom and check the box acknowledging that CloudFormation might create IAM resources with custom names, and choose ‘Submit’

With the permission boundary no longer being used, you can now remove the stack that created it as the final step.

aws cloudformation delete-stack --stack-name DeveloperPolicy

Conclusion

Now you can see how IAM permission boundaries can easily be integrated in to CDK development, helping ensure developers have the control they need while administrators can ensure that security is managed in a way that meets the needs of the organisation as well.

With this being understood, there are next steps you can take to further expand on the use of permission boundaries. The CDK Security and Safety Developer Guide document on GitHub outlines these approaches, as well as ways to think about your approach to permissions on deployment. It’s recommended that developers and administrators review this, and work to develop and appropriate approach to permission policies that suit your security goals.

Additionally, the permission boundary concept can be applied in a multi-account model where each Stage has a unique boundary name applied. This can allow for scenarios where a lower-level environment (such as a development or beta environment) has more relaxed permission boundaries that suit troubleshooting and other developer specific actions, but then the higher level environments (such as gamma or production) could have the more restricted permission boundaries to ensure that security risks are more appropriately managed. The mechanism for implement this is defined in the security and safety developer guide also.

About the authors:

Brian Farnhill

Brian Farnhill is a Software Development Engineer at AWS, helping public sector customers in APAC create impactful solutions running in the cloud. His background is in building solutions and helping customers improve DevOps tools and processes. When he isn’t working, you’ll find him either coding for fun or playing online games.

David Turnbull

David Turnbull is a Software Development Engineer at AWS, helping public sector customers in APAC create impactful solutions running in the cloud. He likes to comprehend new programming languages and has used this to stray out of his line. David writes computer simulations for fun.