Tag Archives: announcements

Announcing AWS Transfer Family web apps for fully managed Amazon S3 file transfers

Post Syndicated from Jeff Barr original https://aws.amazon.com/blogs/aws/announcing-aws-transfer-family-web-apps-for-fully-managed-amazon-s3-file-transfers/

Today I would like to introduce you to AWS Transfer Family web apps, the newest AWS Transfer Family resource. You can create a fully managed, no-code web app that allows authenticated users to list, upload, download, copy, and delete files in specific Amazon Simple Storage Service (Amazon S3) buckets. Non-developer, line-of-business users inside and outside of your organization can easily exchange file data without the need for desktop clients, scripts, faded instructions on sticky notes, or local IT help.

As the web apps administrator, you get full control over authentication, access, and permissions, and can customize the web app with a page title and a favicon. Here is the web app that I created while writing this blog post:

I can click files to download them, click folders to open them, and click columns to sort. The vertical ellipses menu provides additional options:

Each web app supports uploading and downloading of files up to 160 GiB in size, and uses multipart uploads for large files. Files are transferred across HTTPS connections protected by TLS, with automatic retries and a CRC32 end-to-end integrity check.

All about Transfer Family web apps
I will show you how to create your own web app in just a minute. But first, let’s take a look at some of the essential features and benefits…

Security – Transfer Family web apps use AWS IAM Identity Center, allowing you to use your existing SAML or OIDC identity provider or the built-in Identity Store. Either way, you can use S3 Access Grants to exercise full, fine-grained control over the users and groups that are allowed to see, download, delete, and upload files and to create directories. Your organization can also benefit from AWS Transfer Family’s compliance with SOC, PCI DSS, FedRAMP, HIPAA, and other programs.

Customization – You can customize each Transfer Family web app with a page title and a favicon. You can also put a Amazon CloudFront distribution in front of the web app and host it at a custom domain name, with HTTPS access and a public certificate.

AWS Ecosystem – Transfer Family web apps are hosted on AWS and as such are scalable and highly available. All files are stored in designated S3 buckets, with eleven nines (99.999999999%) of durability. You can take advantage of S3 features including S3 Versioning, S3 server access logging, S3 Event Notifications, and more. You can also use Amazon EventBridge to orchestrate complex post-upload workflows.

Creating a Transfer Family web app
Let’s go through the steps to create a Transfer Family web app. Each web app exists in a specific AWS Region, so I open the AWS Transfer Family console, choose the desired Region (us-east-2 for this post), and select Web apps on the left:

Then I click Create web app to proceed:

I connect to my IAM Identity Center if necessary, then create or choose an IAM service role (details) that allows the Transfer Family web app to access S3 and S3 Access Grants:

I add a Name tag and set the maximum number of concurrent web app users, then click Next:

Now I design my web app, setting the page title and the logo (both optional) before clicking Next:

On the next page I review my settings and click Create to move ahead:

And my web app is created and almost ready to use (I still need to set up permissions and users):

I will use the Access endpoint in the CORS policy that I will soon create for the bucket associated with the web app, so I copy and save it.

Setting Permissions and Users
I create an IAM custom trust policy that provides the necessary read and write permissions to the S3 bucket(s) that will be accessible through my web app (details). This policy will be referenced in an S3 Access Grant that I will create in a minute:

Moving right along, I create the initial set of users and groups in IAM Identity Center (I can add more later):

Next, I create an S3 bucket in the same region as the web app and create an S3 Access Grant. Each S3 Access Grant allows a particular IAM Identity Center identity (a user or a group) to access a specific scope (a bucket or a prefixed part of a bucket) for reading and/or writing:

I also need to attach a CORS policy (details) to the bucket so that the web app is allowed to access it from the browser:

The final step is to associate the users with the new web app. I return to the AWS Transfer Family Web apps page, find my app, and click Assign users and groups:

I can add new users to my directory or pick existing ones:

I’ll add myself to start:

Once assigned, I can share the Access endpoint (as seen above) with the user and they (me, in this case) can log in to the web app:

The Web app endpoint and the Access endpoint are the same by default. If you set up a CloudFront distribution for your web app, the Access endpoint will reflect the URL of the endpoint.

I have shown you the express path through the setup process. As you probably noticed, there are lots of options to control read and write access at the individual and group level. Be sure to explore and fully understand all of these options before you set up your production web app!

Things to Know
Here are a couple of things to know about S3 Transfer Family web apps:

Regions – Web apps can be created in nine AWS Regions; check out the web app documentation for a current list.

Pricing – Pricing is per web app/hour.

API and CLI – You can create and manage web apps programmatically by using create-web-app, describe-web-app, and other AWS Transfer Family actions.

Storage Browser for S3 – Transfer Family web apps are built using Storage Browser for Amazon S3 and offer the same end-user functionality in a fully managed offering.

Getting Started – You can get started with Transfer Family web apps in the Transfer Family console.

Jeff;

Use your on-premises infrastructure in Amazon EKS clusters with Amazon EKS Hybrid Nodes

Post Syndicated from Channy Yun (윤석찬) original https://aws.amazon.com/blogs/aws/use-your-on-premises-infrastructure-in-amazon-eks-clusters-with-amazon-eks-hybrid-nodes/

Today, we’re announcing the general availability of Amazon Elastic Kubernetes Service (Amazon EKS) Hybrid Nodes, a new feature that you can use to attach your on-premises and edge infrastructure as nodes to EKS clusters in the cloud.

With Amazon EKS Hybrid Nodes, you can unify Kubernetes management across cloud and on-premises environments and take advantage of the scale and availability of Amazon EKS in all the places your applications need to run. You can use your existing on-premises hardware, while offloading the responsibility for managing Kubernetes control planes to EKS and conserving on-premises capacity for your workloads. Using Amazon EKS Hybrid Nodes, you can adopt consistent operational practices and tooling across your cloud and on-premises environments.

Amazon EKS Hybrid Nodes expands our support for hybrid Kubernetes deployments, adding to Amazon EKS on AWS Outposts and Amazon EKS Anywhere, which we introduced previously. You can compare how Kubernetes and hardware components are managed with each of the EKS hybrid deployment options.

Component EKS on Outposts EKS Hybrid Nodes EKS Anywhere
Hardware Managed by AWS Managed by customer
Kubernetes control plane Hosted and managed by AWS Hosted and managed by customer
Kubernetes nodes Amazon EC2 Customer-managed physical or virtual machines

When you use Amazon EKS Hybrid Nodes to attach your on-premises and edge infrastructure to EKS clusters, you can use other Amazon EKS features and integrations, including Amazon EKS add-ons, Pod Identities, cluster access entries, cluster insights, and extended Kubernetes version support. Amazon EKS Hybrid Nodes inherently integrates with AWS services including AWS Systems Manager, AWS IAM Roles Anywhere, Amazon Managed Service for Prometheus, Amazon CloudWatch, and Amazon GuardDuty for centralized monitoring, logging, and identity management.

Get started with Amazon EKS Hybrid Nodes
Here are steps to use Amazon EKS Hybrid Nodes. First, create an EKS cluster and specify your on-premises node and pod subnets. After setting up network connectivity and AWS Identity and Access Management (AWS IAM) permissions for your on-premises environment, run the Amazon EKS Hybrid Nodes CLI (nodeadm) on each host that will join the cluster. When hybrid nodes join your cluster, required networking components, such as kube-proxy and CoreDNS, are automatically installed. Before your hybrid nodes become ready to serve applications, you must install a compatible Container Network Interface (CNI) driver. The Cilium and Calico CNI drivers are supported for use with Amazon EKS Hybrid Nodes.

1. Prerequisites

You must have certain prerequisites in place before your on-premises infrastructure can join your EKS cluster as hybrid nodes, including the following:

  • Hybrid network connectivity from your on-premises environment to and from AWS using with AWS Site-to-Site VPN, AWS Direct Connect, or another virtual private network (VPN) solution
  • A virtual private cloud (VPC) with routes in its routing table for your on-premises node and, optionally, pod networks, with your virtual private gateway (VGW) or transit gateway (TGW) as the target
  • Infrastructure in the form of physical or virtual machines
  • Operating system that is compatible with hybrid nodes
  • Either AWS IAM Roles Anywhere or AWS Systems Manager set up to authenticate your hybrid nodes with the control plane
  • An EKS cluster IAM role and an EKS Hybrid Nodes IAM role

You can use Amazon Linux 2023, Ubuntu 20.04, Ubuntu 22.04, Ubuntu 24.04, or Red Hat Enterprise Linux (RHEL) 8 and 9 as the node operating system for your hybrid nodes. AWS supports the hybrid nodes integration with these operating systems but doesn’t provide support for the operating systems themselves. You’re responsible for operating system provisioning and management.

To learn more, visit Prerequisites for EKS Hybrid Nodes in the Amazon EKS User Guide.

2. Create EKS cluster and enable hybrid nodes

Go to the Amazon EKS console and start to create your EKS cluster. In the Step 2 Specify networking screen, turn on Specify the CIDR blocks for your on-premises environments that you will use for hybrid nodes in the Configure remote networks to enable hybrid nodes option.

The Classless Inter-Domain Routing (CIDRs) of remote nodes and pods need to be RFC-1918 IPv4 IPv4 addresses, and they can’t overlap with the VPC CIDR or the EKS cluster Kubernetes service CIDR. Additionally, the remote node CIDR and the remote pod CIDR can’t overlap. Specifying a pod CIDR block is required if you will run webhooks on your nodes or if your CNI doesn’t use NAT for pod addresses as pod traffic leaves your nodes.

You can also create an EKS cluster using AWS Comand Line Interface (AWS CLI), eksctl, and AWS CloudFormation. To enable your cluster for Amazon EKS Hybrid Nodes, use the remote-network-config flag to specify your remote node and, optionally, your remote pod CIDR blocks.

$ aws eks create-cluster --name channy-hybrid-cluster --region=us-east-1 \
    --role-arn arn:aws:iam::012345678910:role/eks-cluster-role \
    --resources-vpc-config subnetIds=subnet-1234a11a,subnet-5678b11b \
    --remote-network-config \
{"remoteNodeNetworks":[{"cidrs":["10.80.0.0/16"]}],"remotePodNetworks":[{"cidrs":["10.85.0.0/16"]}]}}

Your cluster must be configured with API or API_AND_CONFIG_MAP cluster access authentication modes. Create an Amazon EKS access entry for your EKS Hybrid Nodes IAM role to enable nodes to join the cluster.

$ aws eks create-access-entry \
  --cluster-name my-hybrid-cluster \
  --principal-arn arn:aws:iam::012345678910:role/eksHybridNodesRole \ 
  --type HYBRID_LINUX

Amazon EKS Hybrid Nodes use temporary IAM credentials provisioned by AWS Systems Manager hybrid activations or AWS IAM Roles Anywhere to authenticate with the EKS cluster. Before connecting your on-premises nodes, you must either create an AWS Systems Manager hybrid activation or add certificates and keys to your nodes for use with AWS IAM Roles Anywhere. To learn more, visit Prepare credentials for EKS Hybrid Nodes in the Amazon EKS User Guide.

3. Connect your hybrid nodes to the EKS cluster

You’re now ready to connect Amazon EKS Hybrid Nodes to your EKS cluster. You can use the Amazon EKS Hybrid Nodes CLI (nodeadm) to simplify the installation, configuration, and registration of your hosts as hybrid nodes. nodeadm automatically installs the required AWS Systems Manager or IAM Roles Anywhere components when you run the nodeadm install command.

You can run the nodeadm install process on each running host, or you can run nodeadm install as part of your operating system build pipelines to produce an image with the components needed to join your host to an EKS cluster.

$ nodeadm install 1.31 --credential-provider <ssm, iam-ra>
{"level":"info","ts":...,"caller":"...","msg":"Loading configuration","configSource":"file://nodeConfig.yaml"}
{"level":"info","ts":...,"caller":"...","msg":"Validating configuration"}
{"level":"info","ts":...,"caller":"...","msg":"Validating Kubernetes version","kubernetes version":"1.30"}
{"level":"info","ts":...,"caller":"...","msg":"Using Kubernetes version","kubernetes version":"1.30.0"}
{"level":"info","ts":...,"caller":"...","msg":"Installing SSM agent installer..."}
{"level":"info","ts":...,"caller":"...","msg":"Installing kubelet..."}
{"level":"info","ts":...,"caller":"...","msg":"Installing kubectl..."}
{"level":"info","ts":...,"caller":"...","msg":"Installing cni-plugins..."}
{"level":"info","ts":...,"caller":"...","msg":"Installing image credential provider..."}
{"level":"info","ts":...,"caller":"...","msg":"Installing IAM authenticator..."}
{"level":"info","ts":...,"caller":"...","msg":"Finishing up install..."}

Create a nodeConfig.yaml file on each host that contains the information required to connect to your EKS cluster. Here is an example nodeConfig.yaml that uses AWS Systems Manager hybrid activations.

apiVersion: node.eks.aws/v1alpha1
kind: NodeConfig
metadata:
  name: hybrid-node
spec:
  cluster:
    name: my-cluster
    region: us-east-1
  hybrid:
    roleArn: arn:aws:iam:012345678910:role/eksHybridNodesRole
    ssm:
      activationCode: <activation-code>
      activationId: <activation-id>

Now, run nodeadm on each host.

$ nodeadm init -c file:/// nodeConfig.yaml

If the preceding command is completed successfully, your hybrid node has joined your EKS cluster. You can verify this in the Amazon EKS console or with the kubectl get nodes command. Before your hybrid nodes have status as Ready, you must install a compatible CNI. To learn more, visit Install CNI for EKS Hybrid Nodes in the Amazon EKS User Guide.

4. View and manage connected your hybrid nodes in EKS console

Now that the nodes are ready, you can view your hybrid nodes and the resources running on them in the EKS console.

You’re responsible for managing your hybrid nodes and updating the software they run. You can update to the latest version of the Amazon EKS Hybrid Nodes CLI to pull in the latest fixes and updates and upgrade Kubernetes versions. To learn more, visit Upgrade EKS Hybrid Nodes in the Amazon EKS User Guide.

Now available
Amazon EKS Hybrid Nodes is now available in all AWS Regions except the AWS GovCloud (US) Regions and the China Regions.

There are no upfront commitments or minimum fees, and you pay for the hourly usage of your EKS cluster and EKS Hybrid Nodes as you use them. EKS clusters with your hybrid nodes have the same per cluster per hour cost as EKS clusters with nodes running in AWS Cloud for both standard and extended support. Additionally, EKS clusters with your hybrid nodes incur an hourly fee per hybrid node vCPU. To learn more, visit the Amazon EKS pricing page.

Give EKS Hybrid Nodes a try in the Amazon EKS console. To learn more, visit the EKS Hybrid Nodes documentation and send feedback to AWS re:Post for EKS or through your usual AWS Support contacts.

Channy

Streamline Kubernetes cluster management with new Amazon EKS Auto Mode

Post Syndicated from Channy Yun (윤석찬) original https://aws.amazon.com/blogs/aws/streamline-kubernetes-cluster-management-with-new-amazon-eks-auto-mode/

Today, we’re announcing the general availability of Amazon Elastic Kubernetes Service (Amazon EKS) Auto Mode, a new capability to streamline Kubernetes cluster management for compute, storage, and networking, from provisioning to on-going maintenance with a single click. You can achieve higher agility, performance, and cost-efficiency by eliminating the operational overhead of managing the cluster infrastructure required to run production-grade Kubernetes applications at scale on Amazon Web Services (AWS).

Customers choose Amazon EKS because they can use the open standards and portability of Kubernetes with the security, scalability, and availability of AWS cloud. While Kubernetes gives advanced customers deep controls over application operations, other customers find managing the components required for production-grade Kubernetes applications to be complex and labor-intensive.

With the EKS Auto Mode, you can automate cluster management without deep Kubernetes expertise, because it selects optimal compute instances, dynamically scales resources, continuously optimizes costs, manages core add-ons, patches operating systems, and integrates with AWS security services. AWS expands its operational responsibility in EKS Auto Mode compared to customer-managed infrastructure in your EKS clusters. In addition to the EKS control plane, AWS will configure, manage, and secure the AWS infrastructure in EKS clusters that your applications need to run.

You can now get started quickly, improve performance, and reduce overhead, enabling you to focus on building applications that drive innovation instead of on cluster management tasks. EKS Auto Mode also reduces the work required to acquire and run cost-efficient GPU-accelerated instances so that your generative AI workloads have the capacity they need when they need it.

Get started with Amazon EKS Auto Mode
To get started, go to the Amazon EKS console and start to create your EKS cluster. You’ll have two options, Quick configuration (with EKS Auto Mode) and Custom configuration.

After you choose quick configuration, enter your cluster name and Kubernetes version, IAM roles, VPC subnets. You can view configuration default values in EKS Auto Mode whether you can edit after the cluster is created.

EKS Auto Mode enables the following Kubernetes capabilities in your EKS cluster:

  • Compute auto scaling and management
  • Application load balancing management
  • Pod and service networking and network policies
  • Cluster DNS and GPU support
  • Block storage volume support

When you choose Create, your EKS cluster with Auto Mode will be deployed in minutes with a single click.

If you choose the custom configuration option, you can customize other aspects of your cluster. You can use EKS Auto Mode in this option too.

You can also create an EKS Auto Mode cluster using AWS Command Line Interface (AWS CLI), eksctl, and AWS CloudFormation. Run the following eksctl command to create a new EKS Auto Mode cluster with:

$ eksctl create cluster --name=<cluster-name> --enable-auto-mode

To learn more, visit Create cluster with EKS Auto Mode in the Amazon EKS User Guide.

If you want to enable EKS Auto Mode for an existing EKS cluster, choose Manage in the EKS Auto Mode section of the Overview tab in the EKS cluster detail page.

Select the box next to Use EKS Auto Mode to enable the EKS Auto Mode. You can unselect the EKS Auto Mode that will be configured in the cluster. The default is to create both a system and a default node pool and a node class.

You can also migrate from Karpenter, EKS Managed Node Groups, and EKS Fargate to EKS Auto Mode. To learn more, visit Enable EKS Auto Mode on existing EKS clusters in the Amazon EKS User Guide.

To meet your workload requirements, you can configure specific aspects of your EKS Auto Mode clusters. While EKS Auto Mode manages most infrastructure components automatically, you can customize node networking settings, node compute resources, storage class settings, and application load balancing behaviors while maintaining the benefits of automated infrastructure management. To learn more, visit Change EKS Auto cluster settings in the Amazon EKS User Guide.

Now, you can deploy different types of workloads to Amazon EKS clusters running in EKS Auto Mode. We provide key workload patterns including sample applications, load-balanced web applications, stateful workloads using persistent storage, and workloads with specific node placement requirements. Each example includes complete manifests and step-by-step deployment instructions that you can use as templates for your own applications. To learn more, visit Run workloads in EKS Auto Mode clusters in the Amazon EKS User Guide.

Now available
Amazon EKS Auto Mode is now available in all commercial AWS Regions except China Regions where Amazon EKS is available. You can enable EKS Auto Mode in any EKS cluster running Kubernetes 1.29 and above with no upfront fees or commitments—you pay for the management of the compute resources provisioned, in addition to your regular EC2 costs. To learn more, visit Amazon EKS pricing page.

Please register for the online webinar: Simplifying Kubernetes operations with Amazon EKS Auto Mode on December 12, 2024 to learn more about how EKS Auto Mode can accelerate your time to deploy workloads to production and reduce the operational overheads of Kubernetes. To learn more, visit Automate cluster infrastructure with EKS Auto Mode in the Amazon EKS User Guide.

Give EKS Auto Mode a try in the Amazon EKS console and send feedback to AWS re:Post for EKS or through your usual AWS Support contacts.

Channy

Introducing storage optimized Amazon EC2 I8g instances powered by AWS Graviton4 processors and 3rd gen AWS Nitro SSDs

Post Syndicated from Channy Yun (윤석찬) original https://aws.amazon.com/blogs/aws/introducing-storage-optimized-amazon-ec2-i8g-instances-powered-by-aws-graviton4-processors-and-3rd-gen-aws-nitro-ssds/

Today, we’re announcing the general availability of Amazon EC2 I8g instances, a new storage optimized instance type to provide the highest real-time storage performance among storage-optimized EC2 instances with the third generation of AWS Nitro SSDs and AWS Graviton4 processors.

AWS Graviton4 is the most powerful and energy efficient processor we have ever designed for a broad range of workloads running on EC2 instances using a 64-bit ARM instruction set architecture. AWS Nitro System SSDs are custom built by AWS and offer high I/O performance, low latency, minimal latency variability, and security with always-on encryption.

EC2 I8g instances are the first instance type to use third-generation AWS Nitro SSDs. These instances offer up to 22.5 TB local NVME SSD storage with up to 65 percent better real-time storage performance per TB and 60 percent lower latency variability compared to the previous generation I4g instances. Based on the AWS Graviton4 processors, I8g instances deliver up to 60 percent better compute performance and two times larger caches compared to I4g.

I8g instances offer up to 96 vCPUs, 768 GiB of memory, and 22.5 TB of storage to deliver more compute and storage choices compared with I4g instances.

Instance name vCPUs Memory (Gib) Storage (GB) Network bandwidth (Gbps) EBS bandwidth (Gbps)
I8g.large 2 16 468 up to 10 up to 10 Gbps
I8g.xlarge 4 32 937 up to 10 up to 10 Gbps
I8g.2xlarge 8 64 1,875 up to 12 up to 10 Gbps
I8g.4xlarge 16 128 3,750 up to 25 up to 10 Gbps
I8g.8xlarge 32 256 7,500
(2 x 3,750)
up to 25 10 Gbps
I8g.12xlarge 48 384 11,520
(3 x 3,750)
up to 28.125 15 Gbps
I8g.16xlarge 64 512 15,000
(4 x 3,750)
up to 37.5 20 Gbps
I8g.24xlarge 96 768 22,500
(6 x 3,750)
up to 56.25 20 Gbps
I8g.metal-24×1 96 768 22,500
(6 x 3,750)
up to 56.25 30 Gbps

You can use I8g instances for I/O intensive workloads that require low latency access to data such as transactional databases (MySQL and PostgreSQL), real-time databases, NoSQL databases, (Aerospike, Apache Druid, MongoDB) and real-time analytics such as Apache Spark.

Additionally, I8g instances are built on the AWS Nitro System, which offloads CPU virtualization, storage, and networking functions to dedicated hardware and software to enhance the performance and security of your workloads. The Graviton4 processors offer you enhanced security by fully encrypting all high-speed physical hardware interfaces.

Things to know
Here are some things that you should know about EC2 I8g instances:

  • Operating system – EC2 I8g instances support Amazon Linux 2023, Amazon Linux 2, CentOS Stream 8 or newer, Ubuntu 18.04 or newer, SUSE 15 SP2 or newer, Debian 11 or newer, Red Hat Enterprise 8.2 or newer, CentOS 8.2 or newer, FreeBSD 13 or newer, Rocky Linux 8.4 or newer, Alma Linux 8.4 or newer, and Alpine Linux 3.12.7 or newer.
  • Networking – You can use I8g instances in storage intensive workloads that typically have burst network usage patterns. All I8g instance sizes have burst network bandwidth and can burst more than 60 minutes, depending on the instance sizes, to support the majority of the workloads requiring instance storage data hydration, backup, and snapshot over the network.
  • Migration – If you’re using I4g instances now, you will have straightforward experience migrating storage intensive workloads to I8g instances because these instances offer similar memory and storage ratios to existing I4g instances.

Now available
Amazon EC2 I8g instances are now available in the US East (N. Virginia) and US West (Oregon) AWS Regions through On-Demand instances, Savings Plans, Spot Instances, Dedicated Instances, or Dedicated Hosts.

Give EC2 I8g instances a try in the Amazon EC2 console. To learn more, visit the EC2 I8g instances page and send feedback to AWS re:Post for EC2 or through your usual AWS Support contacts.

Channy

Now available: Storage optimized Amazon EC2 I7ie instances

Post Syndicated from Jeff Barr original https://aws.amazon.com/blogs/aws/now-available-storage-optimized-amazon-ec2-i7ie-instances/

The new storage optimized Amazon Elastic Compute Cloud (Amazon EC2) I7ie instances feature up to 120 TB of low latency NVMe storage and 5th generation Intel Xeon Scalable Processors with an all-core turbo frequency of 3.2 GHz. Fueled by 3rd Generation AWS Nitro SSDs, these instances deliver the highest storage density available in the cloud today. When compared to the previous generation of storage optimized instances, they provide:

  • Up to 65% better real-time storage performance per TB
  • Up to 50% lower I/O latency with up to 65% lower latency variability
  • Up to 40% better compute performance
  • Up to twice as many vCPUs and twice as much memory
  • 20% better price-performance

The instances are designed to support I/O intensive workloads that need a high degree of random IOPS: NoSQL databases, distributed file systems, search engines, data warehouses, and analytics.

I7ie instances are available in nine sizes with up to 192 vCPUs and 1.5 TiB of memory:

Instance Name vCPUs
Memory
NVMe Storage
(Nitro SSD)
EBS Bandwidth
Network Bandwidth
I7ie.large 2 16 GiB 1.25 TB
(1 x 1.25 TB)
Up to 10 Gbps Up to 25 Gbps
I7ie.xlarge 4 32 GiB 2.5 TB
(1 x 2.5 TB)
Up to 10 Gbps Up to 25 Gbps
I7ie.2xlarge 8 64 GiB 5 TB
(2 x 2.5 TB)
Up to 10 Gbps Up to 25 Gbps
I7ie.3xlarge 12 96 GiB 7.5 TB
(3 x 2.5 TB)
Up to 10 Gbps Up to 25 Gbps
I7ie.6xlarge 24 192 GiB 15 TB
(2 x 7.5 TB)
Up to 10 Gbps Up to 25 Gbps
I7ie.12xlarge 48 384 GiB 30 TB
(4 x 7.5 TB)
15 Gbps Up to 25 Gbps
I7ie.18xlarge 72 576 GiB 45 TB
(6 x 7.5 TB)
22.5 Gbps Up to 75 Gbps
I7ie.24xlarge 96 768 GiB 60 TB
(8 x 7.5 TB)
30 Gbps Up to 100 Gbps
I7ie.48xlarge 192 1,536 GiB 120 TB
(16 x 7.5 TB)
60 Gbps 100 Gbps

A larger L3 cache, increased memory bandwidth, and other improvements deliver increased processing power. The VP2INTERSECT instruction (part of AVX-512) accelerates Machine Learning and graph processing workloads; the Advanced Matrix Extensions (AMX) increase deep learning training and inferencing performance.

On the network side, the instances feature over 3x the EBS bandwidth of the previous generation of storage optimized instances. This accelerates just about every I/O-intensive use case, and is especially helpful when hydrating an in-memory database or caching server. All instances sizes support the Elastic Network Adapter (ENA) and can be launched in cluster placement groups; the 48xlarge instance size also supports the Elastic Fabric Adapter (EFA).

Things to Know
Here are a couple of things that you should know about these new instances:

Regions – We are launching in the US East (Ohio, N. Virginia), US West (Oregon), Asia Pacific (Tokyo), and Europe (Frankfurt, London) AWS Regions today, with plans to expand to others in the future.

Purchase Options – I7ie instances are available in On-Demand, Spot, Savings Plan, Dedicated Instance, and Dedicated Host form.

Jeff;

New Amazon CloudWatch Database Insights: Comprehensive database observability from fleets to instances

Post Syndicated from Jeff Barr original https://aws.amazon.com/blogs/aws/new-amazon-cloudwatch-database-insights-comprehensive-database-observability-from-fleets-to-instances/

Observing your Amazon Aurora databases is now a whole lot easier. Instead of spending time setting up telemetry, building dashboards, and configuring alarms, you just open Amazon CloudWatch Database Insights and take a look. With no further setup, you can monitor the health of all of your Amazon Aurora MySQL and PostgreSQL instances in the selected Region:

Each of the sections contains a wealth of detail and I’ll get to that in a moment (this may be the ultimate “but wait, there’s more” post). From this view, I can open the filter control on the left and filter the set of instances in a couple of different ways. For example, I can filter for all of the instances running Amazon Aurora MySQL, and see that I have 66 such instances, with 3 raising alarms:

I can save the filter as a Fleet (note that Fleets are defined by specific properties and tags of the database instances and as such are inherently dynamic):

And then I can see the overall health of the fleet with a click. The entire page updates to reflect the fleet; I focus on the summary:

Behind the scenes, Database Insights looks for CloudWatch alarms that include a DBInstanceIdentifier dimension, and uses these alarms to establish a correlation between database instances and alarms. This, along with other built-in heuristics and correlation steps, allows Database Insights to deliver helpful, well-organized information that will help you to better understand the overall health of your fleet and to dive deep in order to find bottlenecks and other issues.

Clicking on an instance (represented by a hexagon) reveals details; I click on the instance name (demo-mysql-reader0) to learn more:

In the per-instance view I can also see a myriad of details:

Each of the tabs at the bottom provides additional insights into what’s happening inside the database instance. For example, selecting DB Load Analysis / Top SQL / SQL Metrics shows me which SQL statements are imposing the heaviest load, along with 29 additional metrics (not shown):

From past experience, I know that finding and understanding slow queries is a tedious yet important task. with Database Insights I can see patterns that are common to the slow queries, as well as the actual queries:

With help from AWS X-Ray, Application Signals, and the AWS Distro for OpenTelemetry SDK, I can see the services and operations that originate the queries to the database instance:

The red X indicates that this operation is failing the associated Service Level Objective (SLO), an application performance monitoring aspect of Application Signals. An SLO defines the reliability of a service against customer expectations, and can be set up by selecting the service and clicking Create SLO. There are a couple of steps and some very helpful options, but at the core a SLO is measured as a percentage of successful requests over an extended period of time:

If the database instance is configured to send logs to CloudWatch Logs, I can see and search the logs, filtered by the selected time period, and within a particular log group:

There’s still a lot more to explore at the fleet level. For example, I can see the ten calling services which drive the highest DB load (again, this is powered by AWS X-Ray, Application Signals, and the AWS Distro for OpenTelemetry SDK):

And I can see the top 10 instances with respect to any of eight different metrics:

I could go on all day, but I will leave the rest for you to explore. As I never tire of saying, this feature is available now and you can start using it today.

Things to Know
Here are a couple of things to know about Database Insights:

Supported Databases – You can use Database Insights with Amazon Aurora MySQL and Amazon Aurora PostgreSQL database instances.

Pricing – There is a per-hour, per-database instance charge based on the average number of vCPUs used (for provisioned instances) or Aurora Capacity Units (for Serverless v2 databases) monitored, with separate charges for ingestion and storage of database logs. See the CloudWatch Pricing page for more information.

Regions – This feature is available in all commercial AWS Regions.

Jeff;

New Amazon CloudWatch and Amazon OpenSearch Service launch an integrated analytics experience

Post Syndicated from Elizabeth Fuentes original https://aws.amazon.com/blogs/aws/new-amazon-cloudwatch-and-amazon-opensearch-service-launch-an-integrated-analytics-experience/

Today, Amazon Web Services (AWS) announces a new integrated analytics experience and zero-ETL integration between Amazon CloudWatch and Amazon OpenSearch Service. This integration simplifies log data analysis and visualization without data duplication, streamlining log management while reducing technical overhead and operational costs. CloudWatch Logs customers now have access to two additional query languages beyond CloudWatch Logs Insights QL, while OpenSearch customers can query CloudWatch logs in place without creating separate extract, transform, and load (ETL) pipelines.

Organizations often need different analytics capabilities for their log data. Some teams prefer CloudWatch Logs for its scalability and simplicity in centralizing logs from all their systems, applications, and AWS services. Others require OpenSearch Service for advanced analytics and visualizations. Previously, integration between these services required maintaining separate ingestion pipelines or creating ETL processes. This new integration helps customers get the best of both services by eliminating this complexity by bringing the power of OpenSearch analytics directly to CloudWatch Logs, without any data copy.

Amazon CloudWatch Logs now supports OpenSearch Piped Processing Language (PPL) and OpenSearch SQL directly within the CloudWatch Logs Insights console. You can use SQL to analyze data and correlate logs using JOIN. You can use SQL functions (such as JSON, mathematical, datetime, and string functions) for intuitive log analytics. You can also use the OpenSearch PPL to filter, aggregate, and analyze data. With a few clicks, you can access pre-built, out-of-the-box dashboards for vended logs, such as Amazon Virtual Private Cloud (VPC), AWS CloudTrail, and AWS WAF. These dashboards enable faster monitoring and troubleshooting through visualizations, such as analyzing flows over time, top talkers, megabytes, and packets transferred over time, without having to configure individual widgets or build specific queries. You can analyze VPC flows over time, identify top talkers, track network traffic metrics, monitor web request trends in AWS WAF, or analyze API activity patterns in AWS CloudTrail.

Additionally, OpenSearch Service users can now analyze CloudWatch logs using OpenSearch Discover and run SQL and PPL, similar to how they analyze data in Amazon Simple Storage (Amazon S3), and build indexes and create dashboards directly without any ETL operations or separate ingestion pipelines.

Let’s explore how this integration works
To demonstrate the new OpenSearch SQL and PPL query capabilities in CloudWatch, I start in the CloudWatch console. In the navigation pane, I choose Logs then Logs Insights. After selecting log groups for the query, I can now use OpenSearch PPL or OpenSearch SQL query languages directly within CloudWatch Logs Insights, with no additional setup or integration required. Using this new capability, I can write complex queries using familiar SQL syntax or OpenSearch PPL, making log analysis more intuitive and efficient. In the Query commands menu, you can find sample queries to help you get started.

This example demonstrates how to use SQL JOIN to combine data from two log groups: pet adoptions and pet availability. By filtering for specific customer IDs, you can analyze related log records and trace IDs for troubleshooting purposes.

One of the powerful features of this integration for CloudWatch Logs customers is the ability to create pre-built dashboards for Amazon VPC Flows, AWS CloudTrail and AWS WAF logs. Let’s explore this by creating a dashboard for AWS WAF logs. In the Analyze with OpenSearch tab, I choose Settings and follow the steps.

After a few minutes, my integration is ready and I go to Create an OpenSearch dashboard. In the options Select automatic dashboard type, I choose AWS WAF logs.

In the Dashboard data configuration tab, I can select Data synchronization frequency to occur every 15 minutes. I Select the log groups and View log samples of the selected log groups. I finish by choosing Create a dashboard.

After creating my dashboard, I can explore my logs. The AWS WAF logs dashboard provides comprehensive visibility into web application firewall metrics and events, with automatically configured visualizations that help you monitor and analyze security patterns.

Similarly, the CloudTrail dashboard offers deep insights into API activity across your AWS environment. It’s useful for monitoring API activity, auditing actions, and identifying potential security or compliance issues. 

The VPC Flow Logs dashboard provides detailed visualization of key metrics from your logs for network traffic analysis. You can analyze network traffic, detect unusual patterns, and monitor resource usage. The dashboard currently supports only VPC v2 fields (default format). Custom formatted fields are not supported.

With zero-ETL to access CloudWatch data from OpenSearch Services, I also can build an OpenSearch dashboard from the OpenSearch Service console without having to build and maintain an ETL process. For this, I go to Central management, then I select the new Connected data sources menu, click choose Connect to create a new connected data source, and choose CloudWatch Logs.

In the next step, I name my data source and choose to Create a new role, which must have the necessary permissions to execute actions on OpenSearch Service. You can see them in the Sample custom policy.

https://d2908q01vomqb2.cloudfront.net/artifacts/AWSNews/2024/AWSNEWS-1365-Role.gif

In the Set up OpenSearch step, configure a OpenSearch data connection for CloudWatch Logs by selecting Create a new collection. As part of setting up the CloudWatch Logs source, a new OpenSearch Service serverless collection and OpenSearch UI application is created to store the indexed views and provide a user interface to analyze your CloudWatch Logs data. I create a new collection, name it, and configure the OpenSearch application and workspace within the application. After setting the Data retention days, I choose Next and finish with Review and connect.

When the integration with CloudWatch is ready, I can choose between Explore logs without indexing data which will take me to a querying interface in Discover or Explore vended logs by creating a dashboard for Amazon VPC Flows, CloudTrail and AWS WAF logs.

After I select Explore logs, OpenSearch UI takes me to Discover in the application workspace I created during the data source setup. In Discover, I select the data picker and choose View all available data to access my CloudWatch Logs data source and log groups.

After I select the log groups, I can analyze my CloudWatch logs using OpenSearch SQL and PPL directly in Discover, without having to switch between applications.

To create a dashboard, I return to the Connected data sources overview page on the console. From there, I select Create dashboard, which allows me to visually analyze my CloudWatch data without having to define queries or build visualizations, as I previously did in the CloudWatch console

After the dashboard is created, I navigate to OpenSearch resources where I can see the newly created indexes being populated with data in my Collection. After I have the data, I can go to the dashboard with the data from the CloudWatch logs that I selected in the configuration, and as more data comes in, it will be displayed in near real-time on the OpenSearch dashboard.

With this zero-ETL integration you can ingest data directly into OpenSearch, using its powerful query capabilities and visualization features while maintaining data consistency and reducing operational overhead.

Integration Highlights
For CloudWatch customers:

  • Query capabilities – Streamline log investigation by using OpenSearch SQL and PPL queries directly within the CloudWatch Logs Insights console.
  • Analytics features – With a few clicks, access pre-built, out-of-the-box dashboards for vended logs, such as VPC, AWS WAF, and CloudTrail logs. These dashboards enable faster monitoring and troubleshooting through visualizations for analyzing flows over time, top talkers, megabytes, and packets transferred over time, without having to configure individual widgets or build specific queries.
  • Getting started for CloudWatch users – Configure integration from CloudWatch Logs to OpenSearch Service. For more information refer to the Amazon CloudWatch Logs query capabilities and Amazon CloudWatch Logs vended dashboard documentation.

For OpenSearch Service customers:

  • Zero-ETL integration – Access and analyze CloudWatch data directly from OpenSearch Service without building or maintaining ETL processes. This integration eliminates separate ingestion pipelines while reducing storage costs and operational overhead through simplified data management and zero data duplication.
  • Getting started for OpenSearch users – Create a data connection selecting CloudWatch as a data source from OpenSearch Service. For more information, refer to the Amazon OpenSearch Service Developer Guide.

Regional availability and pricing
This integration is now available in AWS Regions where Amazon OpenSearch Service direct query is available. For pricing details and free trial information, you can visit the Amazon CloudWatch Pricing and Amazon OpenSearch Service Pricing pages.

PS: Writing a blog post at AWS is always a team effort, even when you see only one name under the post title. In this case, I want to thank Joshua Bright, Ashok Swaminathan, Abeetha Bala, Calvin Weng, and Ronil Prasad for their generous help with screenshots, technical guidance, and sharing their expertise in both services, which made this integration overview possible and comprehensive.

Eli

Amazon FSx for Lustre increases throughput to GPU instances by up to 12x

Post Syndicated from Danilo Poccia original https://aws.amazon.com/blogs/aws/amazon-fsx-for-lustre-unlocks-full-network-bandwidth-and-gpu-performance/

Today, we are announcing support for Elastic Fabric Adapter (EFA) and NVIDIA GPUDirect Storage (GDS) on Amazon FSx for Lustre. EFA is a network interface for Amazon EC2 instances that makes it possible to run applications requiring high levels of inter-node communications at scale. GDS is a technology that creates a direct data path between local or remote storage and GPU memory. With these enhancements, Amazon FSx for Lustre with EFA/GDS support provides up to 12 times higher (up to 1200 Gbps) per-client throughput compared to the previous FSx for Lustre version.

You can use FSx for Lustre to build and run the most performance demanding applications, such as deep learning training, drug discovery, financial modeling, and autonomous vehicle development. As datasets grow and new technologies emerge, you can adopt increasingly powerful GPU and HPC instances such as Amazon EC2 P5, Trn1, and Hpc7a. Until now, when accessing FSx for Lustre file systems, the use of traditional TCP networking limited throughput to 100 Gbps for individual client instances. This adoption is driving the need for FSx for Lustre file systems to provide the performance necessary to optimally utilize the increasing network bandwidth of these cutting-edge EC2 instances when accessing large datasets.

With EFA and GDS support in FSx for Lustre, you can now achieve up to 1,200 Gbps throughput per client instance (twelve times more throughput than previously) when using P5 GPU instances and NVIDIA CUDA in your applications.

With this new capability, you can fully utilize the network bandwidth of the most powerful compute instances and accelerate your machine learning (ML) and HPC workloads. EFA enhances performance by bypassing the operating system and using the AWS Scalable Reliable Datagram (SRD) protocol to optimize data transfer. GDS further improves performance by enabling direct data transfer between the file system and GPU memory, bypassing the CPU and eliminating redundant memory copies.

Let’s see how this works in practice.

Creating an Amazon FSx for Lustre file system with EFA enabled
To get started, in the Amazon FSx console, I choose Create file system and then Amazon FSx for Lustre.

I enter a name for the file system. In the Deployment and storage type section, I select Persistent, SSD and the new with EFA enabled option. I select 1000 MB/s/TiB in the Throughput per unit of storage section. With these settings, I enter 4.8 TiB for Storage capacity, which is the minimum supported with these settings.

Console screenshot.

For networking, I use the default virtual private cloud (VPC) and an EFA-enabled security group. I leave all other options to their default values.

Console screenshot.

I review all the options and proceed to create the file system. After a few minutes, the file system is ready to be used.

Mounting an Amazon FSx for Lustre file system with EFA enabled from an Amazon EC2 instance
In the Amazon EC2 console, I choose Launch instance, enter a name for the instance, and select the Ubuntu Amazon Machine Image (AMI). For Instance type, I select trn1.32xlarge.

Console screenshot.

In Network settings, I edit the default settings and select the same subnet used by the FSx Lustre file system. In Firewall (security groups), I select three existing security groups: the EFA-enabled security group used by the FSx for Lustre file system, the default security group, and a security group that provides Secure Shell (SSH) access.

Console screenshot.

In Advanced network configuration, I select ENA and EFA as Interface type. Without this setting, the instance would use traditional TCP networking and the connection with the FSx for Lustre file system would still be limited to 100 Gbps in throughput.

Console screenshot.

To have more throughput, I can add more EFA network interfaces, depending on the instance type.

I launch the instance and, when the instance is ready, I connect using EC2 Instance Connect and follow the instructions for installing the Lustre client in the FSx for Lustre User Guide and configuring EFA clients.

Then, I follow the instructions for mounting an FSx for Lustre file system from an EC2 instance.

I create a folder to use as mount point:

sudo mkdir -p /fsx

I select the file system in the FSx console and lookup the DNS name and Mount name. Using these values, I mount the file system:

sudo mount -t lustre -o relatime,flock file_system_dns_name@tcp:/mountname /fsx

EFA is automatically used when you access an EFA-enabled file system from client instances that support EFA and are using Lustre version 2.15 or higher.

Things to know
EFA and GDS support is available today with no additional cost on new Amazon FSx for Lustre file systems in all AWS Regions where persistent 2 is offered. FSx for Lustre automatically uses EFA when customers access an EFA-enabled file system from client instances that support EFA, without requiring any additional configuration. For a list of EC2 client instances that support EFA, see supported instance types in the Amazon EC2 User Guide. This network specifications table describes network bandwidths and EFA support for instance types in the accelerated computing category.

To use EFA-enabled instances with FSx for Lustre file systems, you must use Lustre 2.15 clients on Ubuntu 22.04 with kernel 6.8 or higher.

Note that your client instances and your file systems must be located in the same subnet within your Amazon Virtual Private Cloud (Amazon VPC) connection.

GDS is automatically supported on EFA-enabled file systems. To use GDS with your FSx for Lustre file systems, you need the NVIDIA Compute Unified Device Architecture (CUDA) package, the open source NVIDIA driver, and the NVIDIA GPUDirect Storage Driver installed on your client instance. These packages come preinstalled on the AWS Deep Learning AMI. You can then use your CUDA-enabled application to use GPUDirect storage for data transfer between your file system and GPUs.

When planning your deployment, note that EFA-enabled file systems have larger minimum storage capacity increments than file systems that are not EFA-enabled. For instance, if you choose the 1,000 MB/s/TiB throughput tier, the minimum storage capacity for EFA-enabled file systems starts at 4.8 TiB as compared to 1.2TB for FSx for Lustre file systems not enabling EFA. If you’re looking to migrate your existing workloads, you can use AWS DataSync to move your data from an existing file system to a new one that supports EFA and GDS.

For maximum flexibility, FSx for Lustre maintains compatibility with both EFA and non-EFA workloads. When accessing an EFA-enabled file system, traffic from non-EFA client instances automatically flows over traditional TCP/IP networking using Elastic Network Adapter (ENA), allowing seamless access for all workloads without any additional configuration.

To learn more about EFA and GDS support on FSx for Lustre, including detailed setup instructions and best practices, visit the Amazon FSx for Lustre documentation. Get started today and experience the fastest storage performance available for your GPU instances in the cloud.

Danilo

Update 11/27: post updated to reflect 12x throughput

Time-based snapshot copy for Amazon EBS

Post Syndicated from Jeff Barr original https://aws.amazon.com/blogs/aws/time-based-snapshot-copy-for-amazon-ebs/

You can now specify a desired completion duration (15 minutes to 48 hours) when you copy an Amazon Elastic Block Store (Amazon EBS) snapshot within or between AWS Regions and/or accounts. This will help you to meet time-based compliance and business requirements for critical workloads. For example:

Testing – Distribute fresh data on a timely basis as part of your Test Data Management (TDM) plan.

Development – Provide your developers with updated snapshot data on a regular and frequent basis.

Disaster Recovery – Ensure that critical snapshots are copied in order to meet a Recovery Point Objective (RPO).

Regardless of your use case, this new feature gives you consistent and predictable copies. This does not affect the performance or reliability of standard copies—you can choose the option and timing that works best for each situation.

Creating a Time-Based Snapshot Copy
I can create time-based snapshot copies from the AWS Management Console, CLI (copy-snapshot), or API (CopySnapshot). While working on this post I created two EBS volumes (100 GiB and 1 TiB), filled each one with files, and created snapshots:

To create a time-based snapshot, I select the source as usual and choose Copy snapshot from the Action menu. I enter a description for the copy, choose the us-east-1 AWS Region as the destination, select Enable time-based copy, and (because this is a time-critical snapshot), enter a 15 minute Completion duration:

When I click Copy snapshot, the request will be accepted (and the copy will become Pending) only if my account’s throughput quotas are not already exceeded due to the throughput consumed by other active copies that I am making to the destination region. If the account level throughput quota is already exceeded, the console will display an error.

I can click Launch copy duration calculator to get a better idea of the minimum achievable copy duration for the snapshot. I open the calculator, enter my account’s throughput limit, and choose an evaluation period:

The calculator then uses historical data collected over the course of previous snapshot copies to tell me the minimum achievable completion duration. In this example I copied 1,800,000 MiB in the last 24 hours; with time-based copy and my current account throughput quota of 2000 MiB/second I can copy this much data in 15 minutes.

While the copy is in progress, I can monitor progress using the console or by calling DescribeSnapshots and examining the progress field of the result. I can also use the following Amazon EventBridge events to take actions (if the copy operation crosses regions, the event is sent in the destination region):

copySnapshot – Sent after the copy operation completes.

copyMissedCompletionDuration – Sent if the copy is still pending when the deadline has passed.

Things to Know
And that’s just about all there is to it! Here’s what you need to know about time-based snapshot copies:

CloudWatch Metrics – The SnapshotCopyBytesTransferred metric is emitted in the destination region, and reflect the amount of data transferred between the source and destination region in bytes.

Duration – The duration can range from 15 minutes to 48 hours in 15 minute increments, and is specified on a per-copy basis.

Concurrency – If a snapshot is being copied and I initiate a second copy of the same snapshot to the same destination, the duration for the second one starts when the first one is completed.

Throughput – There is a default per-account limit of 2000 MiB/second between each source and destination pair. If you need additional throughput in order to meet your RPO you can request an increase via the AWS Support Center. Maximum per-snapshot throughput is 500 MiB/second and cannot be increased.

Pricing – Refer to the Amazon EBS Pricing page for complete pricing information.

Regions – Time-based snapshot copies are available in all AWS Regions.

Jeff;

Announcing future-dated Amazon EC2 On-Demand Capacity Reservations

Post Syndicated from Channy Yun (윤석찬) original https://aws.amazon.com/blogs/aws/announcing-future-dated-amazon-ec2-on-demand-capacity-reservations/

Customers use Amazon Elastic Compute Cloud (Amazon EC2) to run every type of workload imaginable, including web hosting, big data processing, high-performance computing (HPC), virtual desktops, live event streaming, and databases. Some of these workloads are so critical that customers asked for the ability to reserve capacity for them.

To help customers flexibly reserve capacity, we launched EC2 On-Demand Capacity Reservations (ODCRs) in 2018. Since then, customers have used capacity reservations (CRs) to run critical applications like hosting consumer websites, streaming lives sporting events and processing financial transactions.

Today, we’re announcing the ability to get capacity for future workloads using CRs. Many customers have future events such as product launches, large migrations, or end-of-year sales events like Cyber Monday or Diwali. These events are critical, and customers want to ensure they have the capacity when and where they need it.

While CRs helped customers reserve capacity for these events, they were only available just-in-time. So customers either needed to provision the capacity ahead of time and pay for it or plan with precision to provision CRs just-in-time at the start of the event.

Now you can plan and schedule your CRs up to 120 days in advance. To get started you specify the capacity you need, the start date, delivery preference, and the minimum duration you commit to use the capacity reservation. There are no upfront charges to schedule a capacity reservation. After Amazon EC2 evaluates and approves the request, it will activate the reservation on the start date, and customers can use it to immediately launch instances.

Getting started with future-dated capacity reservations
To reserve your future-dated capacity, choose Capacity Reservations on the Amazon EC2 console and select Create On-Demand Capacity Reservation, and choose Get started.

To create a capacity reservation, specify the instance type, platform, Availability Zone, platform, tenancy, and number of instances you are requesting.

future-dated-2a

In the Capacity Reservation details section, choose At a future date in the Capacity Reservation starts option and choose your start date and commitment duration.

future-dated-1a

You can also choose to end the capacity reservation at a specific time or manually. If you select Manually, the reservation has no end date. It will remain active in your account and continue to be billed until you manually cancel it. To reserve this capacity, choose Create.

future-dated-4

After you create your capacity request, it appears in the dashboard with an Assessing status. During this state, AWS systems will work to determine if your request is supportable which is usually done within 5 days. Once the systems determine the request is supportable, the status will be changed to Scheduled. In rare cases, your request may be unsupported.

On your scheduled date, the capacity reservation will change to an Active state, the total instance count will be increased to the amount requested, and you can immediately launch instances.

After activation, you must hold the reservation for at least the commitment duration. After the commitment duration elapses, you can continue to hold and use the reservation if you’d like or cancel it if no longer needed.

Things to know
Here are some things that you should know about the future-dated CRs:

  • Evaluation – Amazon EC2 considers multiple factors when evaluating your request. Along with forecasted supply, Amazon EC2 considers how long you plan to hold the capacity, how early you create the Capacity Reservation relative to your start date, and the size of your request. To improve the ability of Amazon EC2 to support your request, create your reservation at least 56 days (8 weeks) before the start date. You need to submit a request for at least 100 vCPUs for only C, M, R, T, I instance types. The recommended minimum commitment for most requests will be 14 days.
  • Notification – We recommend monitoring the status of your request through the console or Amazon EventBridge You can use these notifications to trigger automation or send an email or text update. To learn more, visit Send an email when events happen using Amazon EventBridge in the Amazon EventBridge User Guide.
  • Pricing – Future dated capacity reservations are billed just like regular CRs. It is charged at the equivalent On-Demand rate whether you run instances in reserved capacity or not. For example, if you create a future dated CR for 20 instances and run 15 instances, you will be charged for 15 active instances and for 5 unused instances in the reservation including the minimum duration. Savings Plans apply to both unused reservations and instances running on the reservation. To learn more, visit Capacity Reservation pricing and billing in the Amazon EC2 User Guide.

Now available
Future dated EC2 Capacity Reservations are now available today in all AWS Regions where Amazon EC2 Capacity Reservations are available.

Give Amazon EC2 Capacity Reservations a try in the Amazon EC2 console. To learn more, visit On-Demand Capacity Reservations in the Amazon EC2 User Guide and send feedback to AWS re:Post for Amazon EC2 or through your usual AWS Support contacts.

Channy

AWS Weekly Roundup: 197 new launches, AI training partnership with Anthropic, and join AWS re:Invent virtually (Nov 25, 2024)

Post Syndicated from Channy Yun (윤석찬) original https://aws.amazon.com/blogs/aws/aws-weekly-roundup-197-new-launches-ai-training-partnership-with-anthropic-and-join-aws-reinvent-virtually-nov-25-2024/

Last week, I saw an astonishing 197 new service launches from AWS. This means we are getting closer to AWS re:Invent 2024! Our News Blog team is also finalizing blog posts for re:Invent to introduce some awesome launches from service teams for your reading pleasure.

The most interesting news is that we’re expanding our strategic collaboration with Anthropic as our primary training partner for development of our AWS Trainium chips. This is in addition to being their primary cloud provider for deploying Anthropic’s Claude models in Amazon Bedrock. We’ll keep pushing the boundaries of what customers can achieve with generarive AI technologies with these kinds of collaborations.

Last week’s launches
Here are some AWS bundled feature launches:

Amazon Aurora – Amazon Aurora Serverless v2 now supports scaling to 0 Aurora Capacity Units (ACUs). With 0 ACUs, you can now save cost during periods of database inactivity. Instead of scaling down to 0.5 ACUs, the database can now scale down to 0 ACUs. Amazon Aurora is now compatible with MySQL 8.0.39 and PostgreSQL 17.0 in the Amazon RDS Database preview environment.

Amazon Bedrock – You can quickly build and execute complex generative AI workflows without writing code with the general availability of Amazon Bedrock Flows (previously known as Prompt Flows). Amazon Bedrock Knowledge Bases now supports binary vector embeddings for building Retrieval Augmented Generation (RAG) applications. Amazon Bedrock also introduce a preview launch of Prompt Optimization to rewrite prompts for higher quality responses from foundational models (FMs). You can use AWS Amplify AI kit to easily leverage your data to get customized responses from Bedrock AI models to build web apps with AI capabilities such as chat, conversational search, and summarization.

Amazon CloudFront – You can use gRPC applications in Amazon CloudFront that allows bidirectional communication between a client and a server over HTTP/2 connections. Amazon CloudFront introduces Virtual Private Cloud (VPC) origins to deliver content from applications hosted in VPC private subnets, and Anycast Static IPs to provide you with a dedicated list of IP addresses for connecting to all CloudFront edge locations worldwide. You can also conditionally change or update origin servers on each request with origin modification within CloudFront Functions, and use new log configuration and delivery options.

Amazon CloudWatch – You can use field indexes and log transformation to improve log analytics at scale in the CloudWatch Logs. You can also use enhanced search and analytics experience and runtime metrics support with CloudWatch Application Signals, and percentile aggregation and simplified events-based troubleshooting directly from the web vitals anomaly in CloudWatch Real User Monitoring (RUM).

Amazon Cognito – You can secure user access to your applications with passwordless authentication, including sign-in with passkeys, email, and text message. Amazon Cognito introduces Managed Login, hosted sign-in and sign-up experience that customers can personalize to align with their company or application branding. Cognito launches new user pool feature tiers: Essentials and Plus as well as a new developer-focused console experience. To learn more, visit Donnie’s blog post.

Amazon Connect – You can use new customer profiles and outbound campaigns to help you proactively address customer needs before they become potential issues. Amazon Connect Contact Lens now supports creating custom dashboards, as well as adding or removing widgets from existing dashboards. With new Amazon Connect Email, you can receive and respond to emails sent by customers to business addresses or submitted via web forms on your website or mobile app.

Amazon EC2 – You can shift the launches of EC2 instances in an Auto Scaling Group (ASG) away from an impaired Availability Zone (AZ) to quickly recover your unhealthy application in another AZ with Amazon Application Recovery Controller (ARC) zonal shift and zonal autoshift. Application Load Balancer (ALB) now supports HTTP request and response header modification giving you greater controls to manage your application’s traffic and security posture without having to alter your application code.

AWS End User Messaging (aka Amazon Pinpoint) – You can now track feedback for messages sent through the SMS and MMS channel, explicitly block or allow messages to individual phone numbers overriding your country rule settings, and cost allocation tags for SMS resources to track spend for each tag associated with a resource. AWS End User Messaging also now support integration with Amazon EventBridge.

AWS Lambda – You can use Lambda SnapStart for Python and .NET functions to deliver as low as sub-second startup performance. AWS Lambda now supports Amazon S3 as a failed-event destination for asynchronous invocations and Amazon CloudWatch Application Signals to easily monitor the health and performance of serverless applications built using Lambda. You can also use a new Node.js 22 runtime and Provisioned Mode for event source mappings (ESMs) that subscribe to Apache Kafka event sources.

Amazon OpenSearch Service – You can scale a single cluster to 1000 data nodes (1000 hot nodes and/or 750 warm nodes) to manage 25 petabytes of data. Amazon OpenSearch Service introduces Custom Plugins, a new plugin management option to extend the search and analysis functions in OpenSearch.

Amazon Q Business – You can use tabular search to extract answers from tables embedded in documents ingested in Q Business. You can drag and drop files to upload and reuse any recently uploaded files in new conversations without uploading the files again. Amazon Q Business now supports integrations to Smartsheet in general, and Asana, Google Calendar in preview to automatically sync your index with your selected data sources. You can also use Q Business browser extensions for Google Chrome, Mozilla Firefox, and Microsoft Edge.

Amazon Q Developer – You can ask questions directly related to the AWS Management Console page you’re viewing, eliminating the need to specify the service or resource in your query. You can also use customizable chat responses generated by Q Developer in the IDE to securely connect Q Developer to your private codebases to receive more precise chat responses. Finally, you can use voice input and output capabilities in the AWS Console Mobile App along conversational prompts to list resources in your AWS account.

Amazon QuickSight – You can use Layer Map to visualize custom geographic boundaries, such as sales territories, or user-defined regions, and Image Component to upload your images directly for a variety of use cases, such as adding company logos. Amazon QuickSight also provides the ability to import visuals from an existing dashboard or analysis into your current analysis and Highcharts visuals to create custom visualizations using the Highcharts Core library in preview.

Amazon Redshift – You can ingest data from a wider range of streaming sources from Confluent Managed Cloud and self-managed Apache Kafka clusters on Amazon EC2 instances. You can also use enhanced security defaults which helps you adhere to best practices in data security and reduce the risk of potential misconfigurations.

AWS System Manager – You can use a new and improved version of AWS Systems Manager that brings a highly requested cross-account, and cross-Region experience for managing nodes at scale. AWS Systems Manager now supports instances running Windows Server 2025, Ubuntu Server 24.04, and Ubuntu Server 24.10.

Amazon S3 – You can configure S3 Lifecycle rules for S3 Express One Zone to expire objects on your behalf and append data to objects in S3 Express One Zone. You can also use Amazon S3 Express One Zone as a high performance read cache with Mountpoint for Amazon S3. Amazon S3 Connector for PyTorch now supports Distributed Checkpoint (DCP), improving the time to write checkpoints to Amazon S3.

Amazon VPC – You can use Block Public Access (BPA) for VPC, a new centralized declarative control that enables network and security administrators to authoritatively block Internet traffic for their VPCs. Amazon VPC Lattice now provides native integration with Amazon ECS, easily to deploy, manage, and scale containerized applications.

There’s a lot more launch news that I haven’t covered here. See AWS What’s New for more details.

See you virtually in AWS re:Invent
AWS re:Invent 2023Next week we’ll hear the latest news from AWS, learn from experts, and connect with the global cloud community in Las Vegas. If you come, check out the agenda, session catalog, and attendee guides before your departure.

If you’re not able to attend re:Invent in person, we’re offering the option to livestream our Keynotes and Innovation Talks. With the registration for online pass, you will have access to on-demand keynote, Innovation Talks, and selected breakout sessions after the event. You can also register with AWS Builder ID, a personal account that enables one-click event registration and provides access to many AWS tools and services.

Please stay tuned in the next week!

Channy

Introducing a new experience for AWS Systems Manager

Post Syndicated from Matheus Guimaraes original https://aws.amazon.com/blogs/aws/introducing-a-new-experience-for-aws-system-manager/

Today, I’m excited to introduce a new and improved version of AWS Systems Manager that brings a highly requested cross-account, and cross-Region experience for managing nodes at scale.

The new System Manager experience provides centralized visibility of all your managed nodes which include various infrastructure types, such as Amazon Elastic Compute Cloud (EC2) instances, containers, virtual machines on other cloud providers, on-premise servers, and edge Internet of Things (IoT) devices. They are referred to as “managed nodes” when they have the Systems Manager Agent (SSM Agent) installed and are connected to Systems Manager.

If an SSM Agent stops working on a node for whatever reason, then Systems Manager loses connection to it and that node is then referred to as an “unmanaged node.” With the new update, Systems Manager can also help you to easily discover and troubleshoot unmanaged nodes. You can run and even schedule an automated diagnosis that provides you with recommended runbooks that you can execute to fix any issues and reestablish connection so they become managed nodes again.

Systems Manager is also now integrated with Amazon Q Developer, the most capable generative AI–powered assistant for software development. You can ask questions about your managed nodes to Amazon Q Developer using natural language and it will provide you with rapid insights plus links straight to Systems Manager where you can perform actions or continue to explore further.

With this release, you can also use AWS Organizations, to allow a delegated administrator to centrally manage nodes across the organization thanks to the new integration with Systems Manager.

the new systems manager experience

Let’s examine a quick example that helps to demonstrate some of these new capabilities.

Imagine a scenario where you are a cloud platform engineer leading a migration plan aiming to replace all nodes running Windows Server 2016 Datacenter in the organization. Let’s use the new Systems Manager experience to quickly gather information about all the nodes that needs to be included in our plan.

Step 1 – Asking Amazon Q Developer
The easiest starting point is using Amazon Q Developer to ask what you want to find using natural language. Using the AWS Console, I open the Amazon Q chatbot and type Find all of my managed nodes running Microsoft Windows Server 2016 Datacenter in my organization.

Amazon Q quickly comes back with an answer: it tells us that there are ten nodes that fit the criteria and provides a list with an overview of each one.

There is also a link that redirects to the new Explore nodes page in System Manager where we can learn more information. Let’s follow it.

Step 2 – Reviewing our infrastructure
The Explore nodes page provides a comprehensive overview of all managed nodes across your organization, with options to group and filter results for quick access. In this case, we can see that the results are already filtered by Operating system name providing us with a list of all the nodes that are running Microsoft Windows Server 2016 Datacenter.

This is a great start! We could just finish here by downloading the report and add those nodes to our migration plan, however, this page only shows you information about your managed nodes. Could it be that there are unmanaged nodes that need to included in our plan? Let’s find out.

Step 3 – Handling unmanaged nodes
Open the menu, and navigate to the Review node insights page. Here you can see a dashboard with widgets that provide insightful interactive charts that you can use to drill down and discover more information about your nodes or even take actions. For example, the Managed node types pie chart shows the types of managed nodes we have whereas the SSM Agent versions graph provides us with an overview of all the different versions of SSM Agent running on them. You can also customize this view by adding and replacing widgets.

We want to investigate any unmanaged nodes to make sure we don’t miss any that may need to be added to our migration plan. The Node summary widget clearly shows that there are two unmanaged nodes. This could mean that these nodes don’t have the SSM Agent installed in which case we will need to investigate them manually. However, it could also just mean there are issues with the SSM agent permissions or network connectivity preventing Systems Manager from managing these nodes and treating them like any other managed node. The new Systems Manager experience allows you easily troubleshoot and remediate SSM Agents issues so let’s attempt to do this now.

Start by selecting the piece of the chart displaying our unmanaged nodes. This pops up an option to initiate a comprehensive diagnosis of all our unmanaged nodes with only one click. Let’s run this.

The diagnosis reviews key configurations such as missing virtual private cloud (VPC) endpoints, misconfigured VPC DNS settings, and misconfigured instance security groups that may be preventing the SSM Agent from connecting to Systems Manager. After the scanning is complete, we can see that it displays two Misconfigured VPC endpoint findings. It also gives you a link that you can use to open a side panel containing a recommended runbook that you can execute to solve the issues as well as links to relevant documentation.

Choosing to execute the recommended runbook presents you with a detailed preview of the changes which include a thorough overview of the actions it’s going to take in addition to the input parameters used, a link to view a breakdown of the steps involved, and the target nodes for this execution.

Let’s choose to go ahead and select Execute. Keep in mind that this may incur costs, so make sure to review them before executing. You can keep an eye on progress on this page as it goes through the steps to attempt to fix the issues on each node.

Aha! After the remediation is complete, we can see that Systems Manager has found and corrected issues with the SSM Agent with two nodes. This means that Systems Manager is able to connect with the SSM Agent running in those nodes successfully making them “managed nodes.” We can verify this by returning to the Explore nodes page and noticing that the count of “unmanaged nodes” has been reduced to zero now.

Now that all of our nodes are managed, we’re ready to get a full list of all of those that need to be added to our migration plan.

Step 4 – Downloading a report
Back on the Explore nodes page we can see that the count for nodes running Microsoft Windows Server 2016 Datacenter has gone up from ten to twelve! That means that those previously unmanaged nodes that we fixed through the automated diagnosis are indeed running our target operating system.

This is exactly what we need so we choose to download a Report. You give it a file name, and then choose from a few options such as which columns to include. In this case, we choose to download a CSV file with a row containing the column names.

That’s it! We have our CSV with detailed information about the nodes that need upgrading across our entire infrastructure. And the best part? You can also use Systems Manager to automate the upgrade once you’re ready to go ahead with the migration.

Conclusion
Systems Manager is a critical tool for gaining visibility and control over your compute infrastructure and performing operational actions at scale. The new experience offers a centralized cross-account, cross-Region view of all your nodes in your AWS accounts, on-premises, and multicloud environments through a centralized dashboard, offering integration with Amazon Q Developer for natural language queries, and one-click SSM Agent troubleshooting. You can enable the new experience at no extra cost by navigating to the Systems Manager console and following the straightforward instructions.

To learn more, see the documentation for more detail about the new Systems Manager experience.

Check out this interactive demo for a full visual tour of this experience.

Introducing generative AI troubleshooting for Apache Spark in AWS Glue (preview)

Post Syndicated from Noritaka Sekiyama original https://aws.amazon.com/blogs/big-data/introducing-generative-ai-troubleshooting-for-apache-spark-in-aws-glue-preview/

Organizations run millions of Apache Spark applications each month to prepare, move, and process their data for analytics and machine learning (ML). Building and maintaining these Spark applications is an iterative process, where developers spend significant time testing and troubleshooting their code. During development, data engineers often spend hours sifting through log files, analyzing execution plans, and making configuration changes to resolve issues. This process becomes even more challenging in production environments due to the distributed nature of Spark, its in-memory processing model, and the multitude of configuration options available. Troubleshooting these production issues requires extensive analysis of logs and metrics, often leading to extended downtimes and delayed insights from critical data pipelines.

Today, we are excited to announce the preview of generative AI troubleshooting for Spark in AWS Glue. This is a new capability that enables data engineers and scientists to quickly identify and resolve issues in their Spark applications. This feature uses ML and generative AI technologies to provide automated root cause analysis for failed Spark applications, along with actionable recommendations and remediation steps. This post demonstrates how you can debug your Spark applications with generative AI troubleshooting.

How generative AI troubleshooting for Spark works

For Spark jobs, the troubleshooting feature analyzes job metadata, metrics and logs associated with the error signature of your job to generates a comprehensive root cause analysis. You can initiate the troubleshooting and optimization process with a single click on the AWS Glue console. With this feature, you can reduce your mean time to resolution from days to minutes, optimize your Spark applications for cost and performance, and focus more on deriving value from your data.

Manually debugging Spark applications can get challenging for data engineers and ETL developers due to a few different reasons:

  • Extensive connectivity and configuration options to a variety of resources with Spark while makes it a popular data processing platform, often makes it challenging to root cause issues when configurations are not correct, especially related to resource setup (S3 bucket, databases, partitions, resolved columns) and access permissions (roles and keys).
  • Spark’s in-memory processing model and distributed partitioning of datasets across its workers while good for parallelism, often make it difficult for users to identify root cause of failures resulting from resource exhaustion issues like out of memory and disk exceptions.
  • Lazy evaluation of Spark transformations while good for performance, makes it challenging to accurately and quickly identify the application code and logic which caused the failure from the distributed logs and metrics emitted from different executors.

Let’s look at a few common and complex Spark troubleshooting scenarios where Generative AI Troubleshooting for Spark can save hours of manual debugging time required to deep dive and come up with the exact root cause.

Resource setup or access errors

Spark applications allows to integrate data from a variety of resources like datasets with several partitions and columns on S3 buckets and Data Catalog tables, use the associated job IAM roles and KMS keys for correct permissions to access these resources, and require these resources to exist and be available in the right regions and locations referenced by their identifiers. Users can mis-configure their applications that result in errors requiring deep dive into the logs to understand the root cause being a resource setup or permission issue.

Manual RCA: Failure reason and Spark application Logs

Following example shows the failure reason for such a common setup issue for S3 buckets in a production job run. The failure reason coming from Spark does not help understand the root cause or the line of code that needs to be inspected for fixing it.

Exception in User Class: org.apache.spark.SparkException : Job aborted due to stage failure: Task 0 in stage 0.0 failed 4 times, most recent failure: Lost task 0.3 in stage 0.0 (TID 3) (172.36.245.14 executor 1): com.amazonaws.services.glue.util.NonFatalException: Error opening file:

After deep diving into the logs of one of the many distributed Spark executors, it becomes clear that the error was caused due to a S3 bucket not existing, however the error stack trace is usually quite long and truncated to understand the precise root cause and location within Spark application where the fix is needed.

Caused by: java.io.IOException: com.amazon.ws.emr.hadoop.fs.shaded.com.amazonaws.services.s3.model.AmazonS3Exception: The specified bucket does not exist (Service: Amazon S3; Status Code: 404; Error Code: NoSuchBucket; Request ID: 80MTEVF2RM7ZYAN9; S3 Extended Request ID: AzRz5f/Amtcs/QatfTvDqU0vgSu5+v7zNIZwcjUn4um5iX3JzExd3a3BkAXGwn/5oYl7hOXRBeo=; Proxy: null), S3 Extended Request ID: AzRz5f/Amtcs/QatfTvDqU0vgSu5+v7zNIZwcjUn4um5iX3JzExd3a3BkAXGwn/5oYl7hOXRBeo=
at com.amazon.ws.emr.hadoop.fs.s3n.Jets3tNativeFileSystemStore.list(Jets3tNativeFileSystemStore.java:423)
at com.amazon.ws.emr.hadoop.fs.s3n.Jets3tNativeFileSystemStore.isFolderUsingFolderObject(Jets3tNativeFileSystemStore.java:249)
at com.amazon.ws.emr.hadoop.fs.s3n.Jets3tNativeFileSystemStore.isFolder(Jets3tNativeFileSystemStore.java:212)
at com.amazon.ws.emr.hadoop.fs.s3n.S3NativeFileSystem.getFileStatus(S3NativeFileSystem.java:518)
at com.amazon.ws.emr.hadoop.fs.s3n.S3NativeFileSystem.open(S3NativeFileSystem.java:935)
at com.amazon.ws.emr.hadoop.fs.s3n.S3NativeFileSystem.open(S3NativeFileSystem.java:927)
at org.apache.hadoop.fs.FileSystem.open(FileSystem.java:983)
at com.amazon.ws.emr.hadoop.fs.EmrFileSystem.open(EmrFileSystem.java:197)
at com.amazonaws.services.glue.hadoop.TapeHadoopRecordReaderSplittable.initialize(TapeHadoopRecordReaderSplittable.scala:168)
... 29 more

With Generative AI Spark Troubleshooting: RCA and Recommendations

With Spark Troubleshooting, you simply click the Troubleshooting analysis button on your failed job run, and the service analyzes the debug artifacts of your failed job to identify the root cause analysis along with the line number in your Spark application that you can inspect to further resolve the issue.

Spark Out of Memory Errors

Let’s take a common but relatively complex error that requires significant manual analysis to conclude its because of a Spark job running out of memory on Spark driver (master node) or one of the distributed Spark executors. Usually, troubleshooting requires an experienced data engineer to manually go over the following steps to identify the root cause.

  • Search through Spark driver logs to find the exact error message
  • Navigate to the Spark UI to analyze memory usage patterns
  • Review executor metrics to understand memory pressure
  • Analyze the code to identify memory-intensive operations

This process often takes hours because the failure reason from Spark is usually not challenging to understand that it was a out of memory issue on the Spark driver and what is the remedy to fix it.

Manual RCA: Failure reason and Spark application Logs

Following example shows the failure reason for the error.

Py4JJavaError: An error occurred while calling o4138.collectToPython. java.lang.StackOverflowError

Spark driver logs require extensive search to find the exact error message. In this case, the error stack trace consisted of more than hundred function calls and is challenging to understand the precise root cause as the Spark application terminated abruptly.

py4j.protocol.Py4JJavaError: An error occurred while calling o4138.collectToPython.
: java.lang.StackOverflowError
 at org.apache.spark.sql.catalyst.trees.TreeNode$$Lambda$1942/131413145.get$Lambda(Unknown Source)
 at org.apache.spark.sql.catalyst.trees.TreeNode.$anonfun$mapChildren$1(TreeNode.scala:798)
 at org.apache.spark.sql.catalyst.trees.TreeNode.mapProductIterator(TreeNode.scala:459)
 at org.apache.spark.sql.catalyst.trees.TreeNode.mapChildren(TreeNode.scala:781)
 at org.apache.spark.sql.catalyst.trees.TreeNode.clone(TreeNode.scala:881)
 at org.apache.spark.sql.catalyst.plans.logical.LogicalPlan.org$apache$spark$sql$catalyst$plans$logical$AnalysisHelper$$super$clone(LogicalPlan.scala:30)
 at org.apache.spark.sql.catalyst.plans.logical.AnalysisHelper.clone(AnalysisHelper.scala:295)
 at org.apache.spark.sql.catalyst.plans.logical.AnalysisHelper.clone$(AnalysisHelper.scala:294)
 at org.apache.spark.sql.catalyst.plans.logical.LogicalPlan.clone(LogicalPlan.scala:30)
 at org.apache.spark.sql.catalyst.plans.logical.LogicalPlan.clone(LogicalPlan.scala:30)
 at org.apache.spark.sql.catalyst.trees.TreeNode.$anonfun$clone$1(TreeNode.scala:881)
 at org.apache.spark.sql.catalyst.trees.TreeNode.applyFunctionIfChanged$1(TreeNode.scala:747)
 at org.apache.spark.sql.catalyst.trees.TreeNode.$anonfun$mapChildren$1(TreeNode.scala:783)
 at org.apache.spark.sql.catalyst.trees.TreeNode.mapProductIterator(TreeNode.scala:459)
 ... repeated several times with hundreds of function calls

With Generative AI Spark Troubleshooting: RCA and Recommendations

With Spark Troubleshooting, you can click the Troubleshooting analysis button on your failed job run and get a detailed root cause analysis with the line of code which you can inspect, and also recommendations on best practices to optimize your Spark application for fixing the problem.

Spark Out of Disk Errors

Another complex error pattern with Spark is when it runs out of disk storage on one of the many Spark executors in the Spark application. Similar to Spark OOM exceptions, manual troubleshooting requires extensive deep dive into distributed executor logs and metrics to understand the root cause and identify the application logic or code causing the error due to Spark’s lazy execution of its transformations.

Manual RCA: Failure Reason and Spark application Logs

The associated failure reason and error stack trace in the application logs is again quiet long requiring the user to gather more insights from Spark UI and Spark metrics to identify the root cause and identify the resolution.

An error occurred while calling o115.parquet. No space left on device
py4j.protocol.Py4JJavaError: An error occurred while calling o115.parquet.
: org.apache.spark.SparkException: Job aborted.
 at org.apache.spark.sql.errors.QueryExecutionErrors$.jobAbortedError(QueryExecutionErrors.scala:638)
 at org.apache.spark.sql.execution.datasources.FileFormatWriter$.write(FileFormatWriter.scala:279)
 at org.apache.spark.sql.execution.datasources.InsertIntoHadoopFsRelationCommand.run(InsertIntoHadoopFsRelationCommand.scala:193)
 at org.apache.spark.sql.execution.command.DataWritingCommandExec.sideEffectResult$lzycompute(commands.scala:113)
 at org.apache.spark.sql.execution.command.DataWritingCommandExec.sideEffectResult(commands.scala:111)
 at org.apache.spark.sql.execution.command.DataWritingCommandExec.executeCollect(commands.scala:125)
 ....

With Generative AI Spark Troubleshooting: RCA and Recommendations

With Spark Troubleshooting, it provides the RCA and the line number of code in the script where the data shuffle operation was lazily evaluated by Spark. It also points to best practices guide for optimizing the shuffle or wide transforms or using S3 shuffle plugin on AWS Glue.

Debug AWS Glue for Spark jobs

To use this troubleshooting feature for your failed job runs, complete following:

  1. On the AWS Glue console, choose ETL jobs in the navigation pane.
  2. Choose your job.
  3. On the Runs tab, choose your failed job run.
  4. Choose Troubleshoot with AI to start the analysis.
  5. You will be redirected to the Troubleshooting analysis tab with generated analysis.

You will see Root Cause Analysis and Recommendations sections.

The service analyzes your job’s debug artifacts and provide the results. Let’s look at a real example of how this works in practice.

We show below an end-to-end example where Spark Troubleshooting helps a user with identification of the root cause for a resource setup issue and help fix the job to resolve the error.

Considerations

During preview, the service focuses on common Spark errors like resource setup and access issues, out of memory exceptions on Spark driver and executors, out of disk exceptions on Spark executors, and will clearly indicate when an error type is not yet supported. Your jobs must run on AWS Glue version 4.0.

The preview is available at no additional charge in all AWS commercial Regions where AWS Glue is available. When you use this capability, any validation runs triggered by you to test proposed solutions will be charged according to the standard AWS Glue pricing.

Conclusion

This post demonstrated how generative AI troubleshooting for Spark in AWS Glue helps your day-to-day Spark application debugging. It simplifies the debugging process for your Spark applications by using generative AI to automatically identify the root cause of failures and provides actionable recommendations to resolve the issues.

To learn more about this new troubleshooting feature for Spark, please visit Troubleshooting Spark jobs with AI.

A special thanks to everyone who contributed to the launch of generative AI troubleshooting for Apache Spark in AWS Glue: Japson Jeyasekaran, Rahul Sharma, Mukul Prasad, Weijing Cai, Jeremy Samuel, Hirva Patel, Martin Ma, Layth Yassin, Kartik Panjabi, Maya Patwardhan, Anshi Shrivastava, Henry Caballero Corzo, Rohit Das, Peter Tsai, Daniel Greenberg, McCall Peltier, Takashi Onikura, Tomohiro Tanaka, Sotaro Hikita, Chiho Sugimoto, Yukiko Iwazumi, Gyan Radhakrishnan, Victor Pleikis, Sriram Ramarathnam, Matt Sampson, Brian Ross, Alexandra Tello, Andrew King, Joseph Barlan, Daiyan Alamgir, Ranu Shah, Adam Rohrscheib, Nitin Bahadur, Santosh Chandrachood, Matt Su, Kinshuk Pahare, and William Vambenepe.


About the Authors

Noritaka Sekiyama is a Principal Big Data Architect on the AWS Glue team. He is responsible for building software artifacts to help customers. In his spare time, he enjoys cycling with his road bike.

Vishal Kajjam is a Software Development Engineer on the AWS Glue team. He is passionate about distributed computing and using ML/AI for designing and building end-to-end solutions to address customers’ data integration needs. In his spare time, he enjoys spending time with family and friends.

Shubham Mehta is a Senior Product Manager at AWS Analytics. He leads generative AI feature development across services such as AWS Glue, Amazon EMR, and Amazon MWAA, using AI/ML to simplify and enhance the experience of data practitioners building data applications on AWS.

Wei Tang is a Software Development Engineer on the AWS Glue team. She is strong developer with deep interests in solving recurring customer problems with distributed systems and AI/ML.

XiaoRun Yu is a Software Development Engineer on the AWS Glue team. He is working on building new features for AWS Glue to help customers. Outside of work, Xiaorun enjoys exploring new places in the Bay Area.

Jake Zych is a Software Development Engineer on the AWS Glue team. He has deep interest in distributed systems and machine learning. In his spare time, Jake likes to create video content and play board games.

Savio Dsouza is a Software Development Manager on the AWS Glue team. His team works on distributed systems & new interfaces for data integration and efficiently managing data lakes on AWS.

Mohit Saxena is a Senior Software Development Manager on the AWS Glue team. His team focuses on building distributed systems to enable customers with interactive and simple-to-use interfaces to efficiently manage and transform petabytes of data across data lakes on Amazon S3, and databases and data warehouses on the cloud.

Introducing generative AI upgrades for Apache Spark in AWS Glue (preview)

Post Syndicated from Noritaka Sekiyama original https://aws.amazon.com/blogs/big-data/introducing-generative-ai-upgrades-for-apache-spark-in-aws-glue-preview/

Organizations run millions of Apache Spark applications each month on AWS, moving, processing, and preparing data for analytics and machine learning. As these applications age, keeping them secure and efficient becomes increasingly challenging. Data practitioners need to upgrade to the latest Spark releases to benefit from performance improvements, new features, bug fixes, and security enhancements. However, these upgrades are often complex, costly, and time-consuming.

Today, we are excited to announce the preview of generative AI upgrades for Spark, a new capability that enables data practitioners to quickly upgrade and modernize their Spark applications running on AWS. Starting with Spark jobs in AWS Glue, this feature allows you to upgrade from an older AWS Glue version to AWS Glue version 4.0. This new capability reduces the time data engineers spend on modernizing their Spark applications, allowing them to focus on building new data pipelines and getting valuable analytics faster.

Understanding the Spark upgrade challenge

The traditional process of upgrading Spark applications requires significant manual effort and expertise. Data practitioners must carefully review incremental Spark release notes to understand the intricacies and nuances of breaking changes, some of which may be undocumented. They then need to modify their Spark scripts and configurations, updating features, connectors, and library dependencies as needed.

Testing these upgrades involves running the application and addressing issues as they arise. Each test run may reveal new problems, resulting in multiple iterations of changes. After the upgraded application runs successfully, practitioners must validate the new output against the expected results in production. This process often turns into year-long projects that cost millions of dollars and consume tens of thousands of engineering hours.

How generative AI upgrades for Spark works

The Spark upgrades feature uses AI to automate both the identification and validation of required changes to your AWS Glue Spark applications. Let’s explore how these capabilities work together to simplify your upgrade process.

AI-driven upgrade plan generation

When you initiate an upgrade, the service analyzes your application using AI to identify necessary changes across both PySpark code and Spark configurations. During preview, Spark Upgrades supports upgrading from Glue 2.0 (Spark 2.4.3, Python 3.7) to Glue 4.0 (Spark 3.3.0, Python 3.10), automatically handling changes that would typically require extensive manual review of public Spark, Python and Glue version migration guides, followed by development, testing, and verification. Spark Upgrades addresses four key areas of changes:

  • Spark SQL API methods and functions
  • Spark DataFrame API methods and operations
  • Python language updates (including module deprecations and syntax changes)
  • Spark SQL and Core configuration settings

The complexity of these upgrades becomes evident when you consider migrating from Spark 2.4.3 to Spark 3.3.0 involves over a hundred version-specific changes. Several factors contribute to the challenges of performing manual upgrades:

  • Highly expressive language with a mix of imperative and declarative programming styles, allows users to easily develop Spark applications. However, this increases the complexity of identifying impacted code during upgrades.
  • Lazy execution of transformations in a distributed Spark application improves performance but makes runtime verification of application upgrades challenging for users.
  • Spark configurations changes in default values or the introduction of new configurations across versions can impact application behavior in different ways, making it difficult for users to identify issues during upgrades.

For example, in Spark 3.2, Spark SQL TRANSFORM operator can’t support alias in inputs. In Spark 3.1 and earlier, you could write a script transform like SELECT TRANSFORM(a AS c1, b AS c2) USING 'cat' FROM TBL.

# Original code (Glue 2.0)
query = """
SELECT TRANSFORM(item as product_name, price as product_price, number as product_number)
   USING 'cat'
FROM goods
WHERE goods.price > 5
"""
spark.sql(query)

# Updated code (Glue 4.0)
query = """
SELECT TRANSFORM(item, price, number)
   USING 'cat' AS (product_name, product_price, product_number)
FROM goods
WHERE goods.price > 5
"""
spark.sql(query)

In Spark 3.1, loading and saving timestamps before 1900-01-01 00:00:00Z as INT96 in Parquet files causes errors. In Spark 3.0, this wouldn’t fail but could result in timestamp shifts due to calendar rebasing. To restore the old behavior in Spark 3.1, you would need to configure the Spark SQL configurations for spark.sql.legacy.parquet.int96RebaseModeInRead and spark.sql.legacy.parquet.int96RebaseModeInWrite to LEGACY.

# Original code (Glue 2.0)
data = [(1, "1899-12-31 23:59:59"), (2, "1900-01-01 00:00:00")]
schema = StructType([ StructField("id", IntegerType(), True), StructField("timestamp", TimestampType(), True) ])
df = spark.createDataFrame(data, schema=schema)
df.write.mode("overwrite").parquet("path/to/parquet_file") 

# Updated code (Glue 4.0)
qspark.conf.set("spark.sql.legacy.parquet.int96RebaseModeInRead", "LEGACY") 
spark.conf.set("spark.sql.legacy.parquet.int96RebaseModeInWrite", "LEGACY")

data = [(1, "1899-12-31 23:59:59"), (2, "1900-01-01 00:00:00")]
schema = StructType([ StructField("id", IntegerType(), True), StructField("timestamp", TimestampType(), True) ])
df = spark.createDataFrame(data, schema=schema)
df.write.mode("overwrite").parquet("path/to/parquet_file")

Automated validation in your environment

After identifying the necessary changes, Spark Upgrades validates the upgraded application by running it as an AWS Glue job in your AWS account. The service iterates through multiple validation runs, up to 10, reviewing any errors encountered in each iteration and refining the upgrade plan until it achieves a successful run. You can run a Spark Upgrade Analysis in your development account using mock datasets supplied through Glue job parameters used for validation runs.

After Spark Upgrades has successfully validated the changes, it presents an upgrade plan for you to review. You can then accept and apply the changes to your job in the development account, before replicating them to your job in the production account. The Spark Upgrade plan includes the following:

  • An upgrade summary with an explanation of code updates made during the process
  • The final script that you can use in place of your current script
  • Logs from validation runs showing how issues were identified and resolved

You can review all aspects of the upgrade, including intermediate validation attempts and any error resolutions, before deciding to apply the changes to your production job. This approach ensures you have full visibility into and control over the upgrade process while benefiting from AI-driven automation.

Get started with generative AI Spark upgrades

Let’s walk through the process of upgrading an AWS Glue 2.0 job to AWS Glue 4.0. Complete the following steps:

  1. On the AWS Glue console, choose ETL jobs in the navigation pane.
  2. Select your AWS Glue 2.0 job, and choose Run upgrade analysis with AI.
  3. For Result path, enter s3://aws-glue-assets-<account-id>-<region>/scripts/upgraded/ (provide your own account ID and AWS Region).
  4. Choose Run.
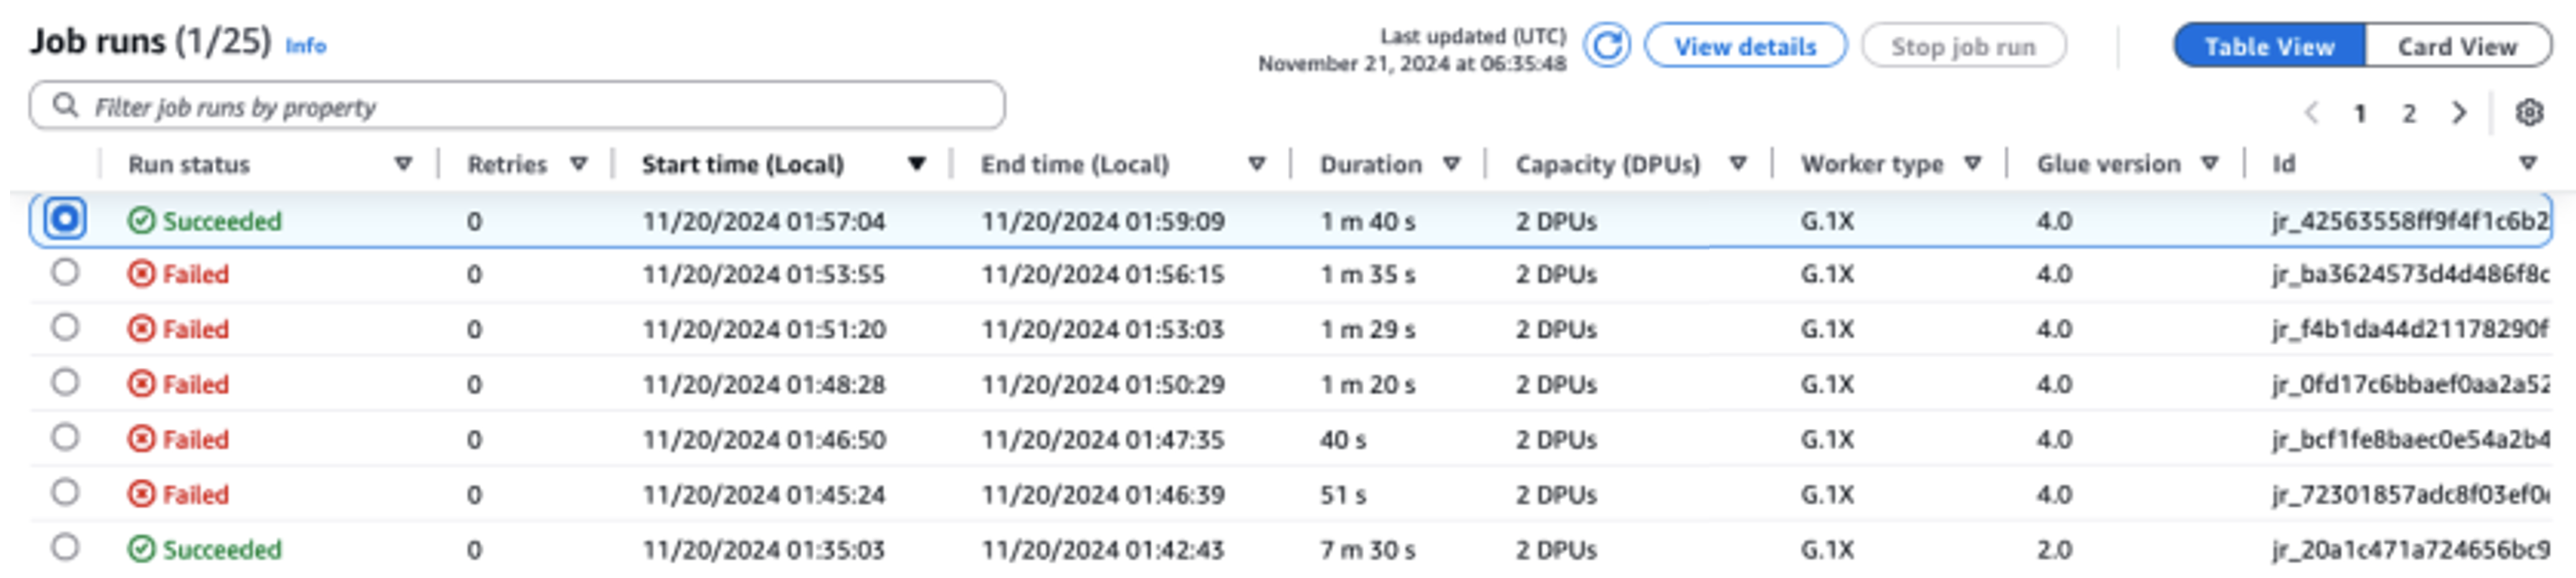
  5. On the Upgrade analysis tab, wait for the analysis to be completed.

    While an analysis is running, you can view the intermediate job analysis attempts (up to 10) for validation under the Runs tab. Additionally, the Upgraded summary in S3 documents the upgrades made by the Spark Upgrade service so far, refining the upgrade plan with each attempt. Each attempt will display a different failure reason, which the service tries to address in the subsequent attempt through code or configuration updates.
    After a successful analysis, the upgraded script and a summary of changes will be uploaded to Amazon Simple Storage Service (Amazon S3).
  6. Review the changes to make sure they meet your requirements, then choose Apply upgraded script.

Your job has now been successfully upgraded to AWS Glue version 4.0. You can check the Script tab to verify the updated script and the Job details tab to review the modified configuration.

Understanding the upgrade process through an example

We now show a production Glue 2.0 job that we would like to upgrade to Glue 4.0 using the Spark Upgrade feature. This Glue 2.0 job reads a dataset, updated daily in an S3 bucket under different partitions, containing new book reviews from an online marketplace and runs SparkSQL to gather insights into the user votes for the book reviews.

Original code (Glue 2.0) – before upgrade

import sys
from awsglue.transforms import *
from awsglue.utils import getResolvedOptions
from pyspark.context import SparkContext
from awsglue.context import GlueContext
from awsglue.job import Job
sc = SparkContext.getOrCreate()
glueContext = GlueContext(sc)
spark = glueContext.spark_session
job = Job(glueContext)
from collections import Sequence
from pyspark.sql.types import DecimalType
from pyspark.sql.functions import lit, to_timestamp, col

def is_data_type_sequence(coming_dict):
    return True if isinstance(coming_dict, Sequence) else False

def dataframe_to_dict_list(df):
    return [row.asDict() for row in df.collect()]

books_input_path = (
    "s3://aws-bigdata-blog/generated_synthetic_reviews/data/product_category=Books/"
)
view_name = "books_temp_view"
static_date = "2010-01-01"
books_source_df = (
    spark.read.option("header", "true")
    .option("recursiveFileLookup", "true")
    .option("path", books_input_path)
    .parquet(books_input_path)
)
books_source_df.createOrReplaceTempView(view_name)
books_with_new_review_dates_df = spark.sql(
    f"""
        SELECT 
        {view_name}.*,
            DATE_ADD(to_date(review_date), "180.8") AS next_review_date,
            CASE 
                WHEN DATE_ADD(to_date(review_date), "365") < to_date('{static_date}') THEN 'Yes' 
                ELSE 'No' 
            END AS Actionable
        FROM {view_name}
    """
)
books_with_new_review_dates_df.createOrReplaceTempView(view_name)
aggregate_books_by_marketplace_df = spark.sql(
    f"SELECT marketplace, count({view_name}.*) as total_count, avg(star_rating) as average_star_ratings, avg(helpful_votes) as average_helpful_votes, avg(total_votes) as average_total_votes  FROM {view_name} group by marketplace"
)
aggregate_books_by_marketplace_df.show()
data = dataframe_to_dict_list(aggregate_books_by_marketplace_df)
if is_data_type_sequence(data):
    print("data is valid")
else:
    raise ValueError("Data is invalid")

aggregated_target_books_df = aggregate_books_by_marketplace_df.withColumn(
    "average_total_votes_decimal", col("average_total_votes").cast(DecimalType(3, -2))
)
aggregated_target_books_df.show()

New code (Glue 4.0) – after upgrade

import sys
from awsglue.transforms import *
from awsglue.utils import getResolvedOptions
from pyspark.context import SparkContext
from awsglue.context import GlueContext
from awsglue.job import Job
from collections.abc import Sequence
from pyspark.sql.types import DecimalType
from pyspark.sql.functions import lit, to_timestamp, col

sc = SparkContext.getOrCreate()
glueContext = GlueContext(sc)
spark = glueContext.spark_session
spark.conf.set("spark.sql.adaptive.enabled", "false")
spark.conf.set("spark.sql.legacy.allowStarWithSingleTableIdentifierInCount", "true")
spark.conf.set("spark.sql.legacy.allowNegativeScaleOfDecimal", "true")
job = Job(glueContext)

def is_data_type_sequence(coming_dict):
    return True if isinstance(coming_dict, Sequence) else False

def dataframe_to_dict_list(df):
    return [row.asDict() for row in df.collect()]

books_input_path = (
    "s3://aws-bigdata-blog/generated_synthetic_reviews/data/product_category=Books/"
)
view_name = "books_temp_view"
static_date = "2010-01-01"
books_source_df = (
    spark.read.option("header", "true")
    .option("recursiveFileLookup", "true")
    .load(books_input_path)
)
books_source_df.createOrReplaceTempView(view_name)
books_with_new_review_dates_df = spark.sql(
    f"""
        SELECT 
        {view_name}.*,
            DATE_ADD(to_date(review_date), 180) AS next_review_date,
            CASE 
                WHEN DATE_ADD(to_date(review_date), 365) < to_date('{static_date}') THEN 'Yes' 
                ELSE 'No' 
            END AS Actionable
        FROM {view_name}
    """
)
books_with_new_review_dates_df.createOrReplaceTempView(view_name)
aggregate_books_by_marketplace_df = spark.sql(
    f"SELECT marketplace, count({view_name}.*) as total_count, avg(star_rating) as average_star_ratings, avg(helpful_votes) as average_helpful_votes, avg(total_votes) as average_total_votes  FROM {view_name} group by marketplace"
)
aggregate_books_by_marketplace_df.show()
data = dataframe_to_dict_list(aggregate_books_by_marketplace_df)
if is_data_type_sequence(data):
    print("data is valid")
else:
    raise ValueError("Data is invalid")

aggregated_target_books_df = aggregate_books_by_marketplace_df.withColumn(
    "average_total_votes_decimal", col("average_total_votes").cast(DecimalType(3, -2))
)
aggregated_target_books_df.show()

Upgrade summary

In Spark 3.2, spark.sql.adaptive.enabled is enabled by default. To restore the behavior before Spark 3.2, 
you can set spark.sql.adaptive.enabled to false.

No suitable migration rule was found in the provided context for this specific error. The change was made based on the error message, which indicated that Sequence could not be imported from collections module. In Python 3.10, Sequence has been moved to the collections.abc module.

In Spark 3.1, path option cannot coexist when the following methods are called with path parameter(s): DataFrameReader.load(), DataFrameWriter.save(), DataStreamReader.load(), or DataStreamWriter.start(). In addition, paths option cannot coexist for DataFrameReader.load(). For example, spark.read.format(csv).option(path, /tmp).load(/tmp2) or spark.read.option(path, /tmp).csv(/tmp2) will throw org.apache.spark.sql.AnalysisException. In Spark version 3.0 and below, path option is overwritten if one path parameter is passed to above methods; path option is added to the overall paths if multiple path parameters are passed to DataFrameReader.load(). To restore the behavior before Spark 3.1, you can set spark.sql.legacy.pathOptionBehavior.enabled to true.

In Spark 3.0, the `date_add` and `date_sub` functions accepts only int, smallint, tinyint as the 2nd argument; fractional and non-literal strings are not valid anymore, for example: `date_add(cast('1964-05-23' as date), '12.34')` causes `AnalysisException`. Note that, string literals are still allowed, but Spark will throw `AnalysisException` if the string content is not a valid integer. In Spark version 2.4 and below, if the 2nd argument is fractional or string value, it is coerced to int value, and the result is a date value of `1964-06-04`.

In Spark 3.2, the usage of count(tblName.*) is blocked to avoid producing ambiguous results. Because count(*) and count(tblName.*) will output differently if there is any null values. To restore the behavior before Spark 3.2, you can set spark.sql.legacy.allowStarWithSingleTableIdentifierInCount to true.

In Spark 3.0, negative scale of decimal is not allowed by default, for example, data type of literal like 1E10BD is DecimalType(11, 0). In Spark version 2.4 and below, it was DecimalType(2, -9). To restore the behavior before Spark 3.0, you can set spark.sql.legacy.allowNegativeScaleOfDecimal to true.

As seen in the updated Glue 4.0 (Spark 3.3.0) script diff compared to the Glue 2.0 (Spark 2.4.3) script and the resulting upgrade summary, a total of six different code and configuration updates were applied across the six attempts of the Spark Upgrade Analysis.

  • Attempt #1 included a Spark SQL configuration (spark.sql.adaptive.enabled) to restore the application behavior as a new feature for Spark SQL adaptive query execution is introduced starting Spark 3.2. Users can inspect this configuration change and can further enable or disable it as per their preference.
  • Attempt #2 resolved a Python language change between Python 3.7 and 3.10 with the introduction of a new abstract base class (abc) under the Python collections module for importing Sequence.
  • Attempt #3 resolved an error encountered due to a change in behavior of DataFrame API starting Spark 3.1 where path option cannot exist with other DataFrameReader operations.
  • Attempt #4 resolved an error caused by a change in the Spark SQL function API signature for DATE_ADD which now only accepts integers as the second argument starting from Spark 3.0.
  • Attempt #5 resolved an error encountered due to the change in behavior Spark SQL function API for count(tblName.*) starting Spark 3.2. The behavior was restored with the introduction of a new Spark SQL configuration spark.sql.legacy.allowStarWithSingleTableIdentifierInCount
  • Attempt #6 successfully completed the analysis and ran the new script on Glue 4.0 without any new errors. The final attempt resolved an error encountered due to the prohibited use of negative scale for cast(DecimalType(3, -6) in Spark DataFrame API starting Spark 3.0. The issue was addressed by enabling the new Spark SQL configuration spark.sql.legacy.allowNegativeScaleOfDecimal.

Important considerations for preview

As you begin using automated Spark upgrades during the preview period, there are several important aspects to consider for optimal usage of the service:

  • Service scope and limitations – The preview release focuses on PySpark code upgrades from AWS Glue versions 2.0 to version 4.0. At the time of writing, the service handles PySpark code that doesn’t rely on additional library dependencies. You can run automated upgrades for up to 10 jobs concurrently in an AWS account, allowing you to efficiently modernize multiple jobs while maintaining system stability.
  • Optimizing costs during the upgrade process – Because the service uses generative AI to validate the upgrade plan through multiple iterations, with each iteration running as an AWS Glue job in your account, it’s essential to optimize the validation job run configurations for cost-efficiency. To achieve this, we recommend specifying a run configuration when starting an upgrade analysis as follows:
    • Using non-production developer accounts and selecting sample mock datasets that represent your production data but are smaller in size for validation with Spark Upgrades.
    • Using right-sized compute resources, such as G.1X workers, and selecting an appropriate number of workers for processing your sample data.
    • Enabling Glue auto scaling when applicable to automatically adjust resources based on workload.

    For example, if your production job processes terabytes of data with 20 G.2X workers, you might configure the upgrade job to process a few gigabytes of representative data with 2 G.2X workers and auto scaling enabled for validation.

  • Preview best practices – During the preview period, we strongly recommend starting your upgrade journey with non-production jobs. This approach allows you to familiarize yourself with the upgrade workflow, and understand how the service handles different types of Spark code patterns.

Your experience and feedback are crucial in helping us enhance and improve this feature. We encourage you to share your insights, suggestions, and any challenges you encounter through AWS Support or your account team. This feedback will help us improve the service and add capabilities that matter most to you during preview.

Conclusion

This post demonstrates how automated Spark upgrades can assist with migrating your Spark applications in AWS Glue. It simplifies the migration process by using generative AI to automatically identify the necessary script changes across different Spark versions.

To learn more about this feature in AWS Glue, see Generative AI upgrades for Apache Spark in AWS Glue.

A special thanks to everyone who contributed to the launch of generative AI upgrades for Apache Spark in AWS Glue: Shuai Zhang, Mukul Prasad, Liyuan Lin, Rishabh Nair, Raghavendhar Thiruvoipadi Vidyasagar, Tina Shao, Chris Kha, Neha Poonia, Xiaoxi Liu, Japson Jeyasekaran, Suthan Phillips, Raja Jaya Chandra Mannem, Yu-Ting Su, Neil Jonkers, Boyko Radulov, Sujatha Rudra, Mohammad Sabeel, Mingmei Yang, Matt Su, Daniel Greenberg, Charlie Sim, McCall Petier, Adam Rohrscheib, Andrew King, Ranu Shah, Aleksei Ivanov, Bernie Wang, Karthik Seshadri, Sriram Ramarathnam, Asterios Katsifodimos, Brody Bowman, Sunny Konoplev, Bijay Bisht, Saroj Yadav, Carlos Orozco, Nitin Bahadur, Kinshuk Pahare, Santosh Chandrachood, and William Vambenepe.


About the Authors

Noritaka Sekiyama is a Principal Big Data Architect on the AWS Glue team. He is responsible for building software artifacts to help customers. In his spare time, he enjoys cycling with his new road bike.

Keerthi Chadalavada is a Senior Software Development Engineer at AWS Glue, focusing on combining generative AI and data integration technologies to design and build comprehensive solutions for customers’ data and analytics needs.

Shubham Mehta is a Senior Product Manager at AWS Analytics. He leads generative AI feature development across services such as AWS Glue, Amazon EMR, and Amazon MWAA, using AI/ML to simplify and enhance the experience of data practitioners building data applications on AWS.

Pradeep Patel is a Software Development Manager on the AWS Glue team. He is passionate about helping customers solve their problems by using the power of the AWS Cloud to deliver highly scalable and robust solutions. In his spare time, he loves to hike and play with web applications.

Chuhan LiuChuhan Liu is a Software Engineer at AWS Glue. He is passionate about building scalable distributed systems for big data processing, analytics, and management. He is also keen on using generative AI technologies to provide brand-new experience to customers. In his spare time, he likes sports and enjoys playing tennis.

Vaibhav Naik is a software engineer at AWS Glue, passionate about building robust, scalable solutions to tackle complex customer problems. With a keen interest in generative AI, he likes to explore innovative ways to develop enterprise-level solutions that harness the power of cutting-edge AI technologies.

Mohit Saxena is a Senior Software Development Manager on the AWS Glue and Amazon EMR team. His team focuses on building distributed systems to enable customers with simple-to-use interfaces and AI-driven capabilities to efficiently transform petabytes of data across data lakes on Amazon S3, and databases and data warehouses on the cloud.

Accelerate your data workflows with Amazon Redshift Data API persistent sessions

Post Syndicated from Dipal Mahajan original https://aws.amazon.com/blogs/big-data/accelerate-your-data-workflows-with-amazon-redshift-data-api-persistent-sessions/

Amazon Redshift is a fast, scalable, secure, and fully managed cloud data warehouse that you can use to analyze your data at scale. Tens of thousands of customers use Amazon Redshift to process exabytes of data to power their analytical workloads.The Amazon Redshift Data API simplifies programmatic access to Amazon Redshift data warehouses by providing a secure HTTP endpoint for executing SQL queries, so that you don’t have to deal with managing drivers, database connections, network configurations, authentication flows, and other connectivity complexities.

Amazon Redshift has launched a session reuse capability for the Data API that can significantly streamline multi-step, stateful workloads such as exchange, transform, and load (ETL) pipelines, reporting processes, and other flows that involve sequential queries. This persistent session model provides the following key benefits:

  1. The ability to create temporary tables that can be referenced across the entire session lifespan.
  2. Maintaining reusable database sessions to help optimize the use of database connections, preventing the API server from exhausting the available connections and improving overall system scalability.
  3. Reusing database sessions to simplify the connection management logic in your API implementation, reducing the complexity of the code and making it more straightforward to maintain and scale.
  4. Redshift Data API provides a secure HTTP endpoint and integration with AWS SDKs. You can use the endpoint to run SQL statements without managing connections. Calls to the Data API are asynchronous. The Data API uses either credentials stored in AWS Secrets Manager or temporary database credentials

A common use case that can particularly benefit from session reuse is ETL pipelines in Amazon Redshift data warehouses. ETL processes often need to stage raw data extracts into temporary tables, run a series of transformations while referencing those interim datasets, and finally load the transformed results into production data marts. Before session reuse was available, the multi-phase nature of ETL workflows meant that data engineers had to persist the intermediate results and repeatedly re-establish database connections after each step, which resulted in continually tearing down sessions; recreating, repopulating, and truncating temporary tables; and incurring overhead from connection cycling. The engineers could also reuse the entire API call, but this could lead to a single point of failure for the entire script because it doesn’t support restarting from the point where it failed.

With Data API session reuse, you can use a single long-lived session at the start of the ETL pipeline and use that persistent context across all ETL phases. You can create temporary tables once and reference them throughout, without having to constantly refresh database connections and restart from scratch.

In this post, we’ll walk through an example ETL process that uses session reuse to efficiently create, populate, and query temporary staging tables across the full data transformation workflow—all within the same persistent Amazon Redshift database session. You’ll learn best practices for optimizing ETL orchestration code, reducing job runtimes by reducing connection overhead, and simplifying pipeline complexity. Whether you’re a data engineer, an analyst generating reports, or working on any other stateful data, understanding how to use Data API session reuse is worth exploring. Let’s dive in!

Scenario

Imagine you’re building an ETL process to maintain a product dimension table for an ecommerce business. This table needs to track changes to product details over time for analysis purposes.

The ETL will:

  1. Load data extracted from the source system into a temporary table
  2. Identify new and updated products by comparing them to the existing dimension
  3. Merge the staged changes into the product dimension using a slowly changing dimension (SCD) Type 2 approach

Prerequisites

To walk through the example in this post, you need:

  • An AWS Account
  • An Amazon Redshift Serverless workgroup or provisioned cluster

Redshift Data API Commands

This command executes a Redshift Data API query to create a temporary table called stage_stores in Redshift.

 aws redshift-data execute-statement 
       --session-keep-alive-seconds 30 
       --sql "CREATE TEMP TABLE stage_stores (LIKE stores)" 
       --database dev 
       --workgroup-name blog_test

This command performs a COUNT(*) operation on the newly created table from the previous command, using the –session-id returned in the response of the first command.

 aws redshift-data execute-statement
    --sql "select count(*) from dev.stage_stores"
    --session-id 5a254dc6-4fc2-4203-87a8-551155432ee4
    --session-keep-alive-seconds 10

Solution walkthrough

  1. You will use AWS Step Functions to call the Data API because this is one of the more straightforward ways to create a codeless ETL. The first step is to load the extracted data into a temporary table.
    • Start by creating a temporary table based on the same columns as the final table using CREATE TEMP TABLE stage_stores (LIKE stores)”.
    • When using Redshift Serverless you must use WorkgroupName. If using Redshift Provisioned cluster, you should use ClusterIdentifier.

Temporary table creation

  1. In the next step, copy data from Amazon Simple Storage Service (Amazon S3) to the temporary table. Instead of re-establishing the session, reuse it.
    • Use SessionId and Sql as parameters.
    • Database is a required parameter for Step Functions, but it doesn’t have to have a value when using the SessionId.

Copy data to Redshift

  1. Lastly, use Merge to merge the target and temporary (source) tables to insert or update data based on the new data from the files.

Merge to Redshift

As shown in the preceding figures, we used a wait component because the query was fast enough for the session not to be captured. If the session isn’t captured, you will receive a Session is not available error. If you encounter that or a similar error, try adding a 1-second wait component.

At the end, the Data API use case should be completed, as shown in the following figure.

Step Function

Other relevant use cases

The Amazon Redshift Data API isn’t a replacement for JDBC and ODBC drivers and is suitable for use cases where you don’t need a persistent connection to a cluster. It’s applicable in the following use cases:

  • Accessing Amazon Redshift from custom applications with any programming language supported by the AWS SDK. This enables you to integrate web-based applications to access data from Amazon Redshift using an API to run SQL statements. For example, you can run SQL from JavaScript.
  • Building a serverless data processing workflow.
  • Designing asynchronous web dashboards because the Data API lets you run long-running queries without having to wait for it to complete.
  • Running your query one time and retrieving the results multiple times without having to run the query again within 24 hours.
  • Building your ETL pipelines with Step Functions, AWS Lambda, and stored procedures.
  • Having simplified access to Amazon Redshift from Amazon SageMaker and Jupyter Notebooks.
  • Building event-driven applications with Amazon EventBridgeand Lambda.
  • Scheduling SQL scripts to simplify data load, unload, and refresh of materialized views.

Key considerations for using session reuse

When you make a Data API request to run a SQL statement, if the parameter SessionKeepAliveSeconds isn’t set, the session where the SQL runs is terminated when the SQL is finished. To keep the session active for a specified number of seconds you must set SessionKeepAliveSeconds in the Data API ExecuteStatement and BatchExecuteStatement. A SessionId field will be present in the response JSON containing the identity of the session, which can then be used in subsequent ExecuteStatement and BatchExecuteStatement operations. In subsequent calls you can specify another SessionKeepAliveSeconds to change the idle timeout time. If the SessionKeepAliveSeconds isn’t changed, the initial idle timeout setting remains. Consider the following when using session reuse:

  • The maximum value of SessionKeepAliveSeconds is 24 hours. After 24 hours the session is forcibly closed, and in-progress queries are terminated.
  • The maximum number of sessions per Amazon Redshift cluster or Redshift Serverless workgroup is 500. Please refer to Redshift Quotas and Limits here.
  • It’s not possible to run parallel executions of the same session. You need to wait until the query is finished to run the next query in the same session. That is, you cannot run queries in parallel in a single session.
  • The Data API can’t queue queries for a given session.

Best practices

We recommend the following best practices when using the Data API:

  • Federate your IAM credentials to the database to connect with Amazon Redshift. Amazon Redshift allows users to get temporary database credentials with GetClusterCredentials. We recommend scoping the access to a specific cluster and database user if you’re granting your users temporary credentials. For more information, see Example policy for using GetClusterCredentials.
  • Use a custom policy to provide fine-grained access to the Data API in the production environment if you don’t want your users to use temporary credentials. You can use AWS Secrets Manager to manage your credentials in such use cases.
  • The maximum record size to be retrieved is 64 KB. More than that will raise an error.
  • Don’t retrieve a large amount of data from your client and use the UNLOAD command to export the query results to Amazon S3. You’re limited to retrieving no more than 100 MB of data using the Data API.
  • Query results are stored by 24 hours and discarded after that. If you need the same result after 24 hours, you will need to rerun the script to obtain the result.
  • Remember that the session will be available for the amount of time specified by the SessionKeepAliveSeconds parameter in the Redshift Data API call. The session will terminate after the specified duration.Based on your security requirements, configure this value according to your ETL and ensure sessions are properly closed by setting SessionKeepAliveSeconds to 1 second to terminate them.
  • When invoking Redshift API commands, all activities, including the user who executed the command and those who reused the session, are logged in CloudWatch. Additionally, you can configure alerts for monitoring.
  • If a Redshift session is terminated or closed and you attempt to access it via the API, you will receive an error message stating, “Session is not available.”

Conclusion

In this post, we introduced you to the newly launched Amazon Redshift Data API session reuse functionality. We also demonstrated how to use the Data API from the Amazon Redshift console query editor and Python using the AWS SDK. We also provided best practices for using the Data API.

To learn more, see Using the Amazon Redshift Data API or visit the Data API GitHub repository for code examples. For serverless, see Use the Amazon Redshift Data API to interact with Amazon Redshift Serverless.

—————————————————————————————————————————————————–

About the Author

Dipal Mahajan is a Lead Consultant with Amazon Web Services based out of India, where he guides global customers to build highly secure, scalable, reliable, and cost-efficient applications on the cloud. He brings extensive experience on Software Development, Architecture and Analytics from industries like finance, telecom, retail and healthcare.

Anusha Challa is a Senior Analytics Specialist Solutions Architect focused on Amazon Redshift. She has helped many customers build large-scale data warehouse solutions in the cloud and on premises. She is passionate about data analytics and data science.

Debu Panda is a Senior Manager, Product Management at AWS. He is an industry leader in analytics, application platform, and database technologies, and has more than 25 years of experience in the IT world.

Ricardo Serafim is a Senior Analytics Specialist Solutions Architect at AWS.

From data lakes to insights: dbt adapter for Amazon Athena now supported in dbt Cloud

Post Syndicated from Darshit Thakkar original https://aws.amazon.com/blogs/big-data/from-data-lakes-to-insights-dbt-adapter-for-amazon-athena-now-supported-in-dbt-cloud/

At AWS, we are committed to empowering organizations with tools that streamline data analytics and transformation processes. We are excited to announce that the dbt adapter for Amazon Athena is now officially supported in dbt Cloud. This integration enables data teams to efficiently transform and manage data using Athena with dbt Cloud’s robust features, enhancing the overall data workflow experience.

In this post, we discuss the advantages of dbt Cloud over dbt Core, common use cases, and how to get started with Amazon Athena using the dbt adapter.

The need for streamlined data transformations

As organizations increasingly adopt cloud-based data lakes and warehouses, the demand for efficient data transformation tools has grown. Athena plays a critical role in this ecosystem by providing a serverless, interactive query service that simplifies analyzing vast amounts of data stored in Amazon Simple Storage Service (Amazon S3) using standard SQL. This enables you to extract insights from your data without the complexity of managing infrastructure.

dbt has emerged as a leading framework, allowing data teams to transform and manage data pipelines effectively. With the dbt adapter for Athena adapter now supported in dbt Cloud, you can seamlessly integrate your AWS data architecture with dbt Cloud, taking advantage of the scalability and performance of Athena to simplify and scale your data workflows efficiently.

Benefits of the dbt adapter for Athena

We have collaborated with dbt Labs and the open source community on an adapter for dbt that enables dbt to interface directly with Athena. Previously, the dbt adapter for Athena was only compatible with dbt Core, requiring teams to manually manage configurations and execute transformations locally or through custom setups. Now, with support for dbt Cloud, you can access a managed, cloud-based environment that automates and enhances your data transformation workflows. This upgrade allows you to build, test, and deploy data models in dbt with greater ease and efficiency, using all the features that dbt Cloud provides.

The support of the dbt adapter for Athena in dbt Cloud offers several advantages over using it with dbt Core:

  • Managed infrastructure – dbt Cloud provides a fully managed environment for running dbt projects, eliminating the need for local setup, maintenance, and configuration. This saves time and effort, especially for teams looking to minimize infrastructure management and focus solely on data modeling.
  • Scheduling and automation – dbt Cloud comes with a job scheduler, allowing you to automate the execution of dbt models. This feature makes sure your datasets are always up to date without needing to set up and maintain external scheduling systems like Apache Airflow. You can also set up dependencies between jobs easily within dbt Cloud, making sure that transformations run in the correct sequence without manual oversight.
  • Enhanced collaboration and version control – You can use a web-based interface for editing and reviewing dbt models, enabling collaboration among data teams. You can review code changes directly on the platform, facilitating efficient teamwork. Additionally, dbt Cloud integrates with Git providers, making version control and code collaboration more streamlined. This makes sure your data models are well-documented, versioned, and straightforward to manage within a collaborative environment.
  • Monitoring and alerting – You get built-in tools for monitoring job executions and performance to set up alerts and notifications for job failures, providing quick response times and minimizing disruptions. Furthermore, you can gain insights into the performance of your data transformations with detailed execution logs and metrics, all accessible through the dbt Cloud interface.

Common use cases for using the dbt adapter with Athena

The following are common use cases for using the dbt adapter with Athena:

  • Building a data warehouse – Many organizations are moving towards a data warehouse architecture, combining the flexibility of data lakes with the performance and structure of data warehouses. Using Athena and the dbt adapter, you can transform raw data in Amazon S3 into well-structured tables suitable for analytics. This setup allows businesses to build a scalable and efficient data lakehouse where they can perform SQL-based transformations and make sure data is clean and ready for analytics without investing heavily in data warehouse infrastructure.
  • Incremental data processing – The adapter allows for incremental data processing, where only new or updated data is transformed and processed. This feature reduces the amount of data scanned by Athena, resulting in faster query performance and lower costs. For example, instead of processing an entire dataset daily, dbt can be configured to transform only the data ingested in the last 24 hours, making data operations more efficient and cost-effective.
  • Cost management and optimization – Because Athena charges based on the amount of data scanned by each query, cost optimization is critical. The adapter enables data teams to optimize transformations by creating efficient data models, such as partitioning and compressing data to minimize scan costs. Additionally, dbt’s automated scheduling in dbt Cloud can be used to manage the frequency of data transformations, making sure queries are run only when necessary, helping to control costs effectively.
  • Data archiving and tiered storage – Organizations with a large amount of historical data can use Athena to query archived data stored in the lower-cost storage classes of Amazon S3 (such as Amazon S3 Glacier). With the adapter, data teams can build models that segment and process data based on usage patterns, making sure frequently accessed data is optimized for quick queries while older data remains accessible but cost-efficient. Alternatively, you can use Amazon S3 Intelligent-Tiering to optimize storage costs by moving data between two access tiers when access patterns change. This approach helps in managing storage costs while maintaining the flexibility to analyze historical trends when needed.
  • Event-driven data transformations – In scenarios where organizations need to process data in near real time, such as for streaming event logs or Internet of Things (IoT) data, you can integrate the adapter into an event-driven architecture. For example, event data can be continuously loaded into Amazon S3, and dbt models can be configured to run incrementally, transforming the new data into structured formats for immediate analysis. This setup supports agile data processing while taking advantage of the serverless architecture of Athena to keep operational costs low.
  • Compliance and data governance – For organizations managing sensitive or regulated data, you can use Athena and the adapter to enforce data governance rules. With dbt, teams can define data quality checks and access controls as part of their transformation workflow. This makes sure that only compliant, high-quality data is made available for analytics, and costs are optimized by processing only the data that meets governance standards. Additionally, dbt’s documentation features help maintain a clear record of data transformations, supporting audit and compliance efforts.

How to use the dbt adapter for Athena

To get started, create a project and set up a connection with Athena in dbt Cloud. The following figure shows the steps to create a project using dbt Cloud and configure the Athena connection.

Next, use the dbt Cloud interactive development environment (IDE) to deploy your project. The following figure demonstrates how to build dbt runs and deploy changes to Athena using the dbt Cloud interface.

Conclusion

At AWS, we are committed to providing you with the best possible tools and services to help you succeed in the cloud. dbt has emerged as a leading data transformation platform, trusted by thousands of organizations worldwide. By partnering with dbt Labs, we are able to bring the power of dbt directly to the AWS Cloud, empowering you to seamlessly integrate your data transformation workflows into the broader cloud infrastructure. This partnership is a testament to our shared vision of making data more accessible, reliable, and valuable for organizations of all sizes.

We are excited to see how you will use the dbt Cloud compatible dbt adapter for Athena to drive your data-driven initiatives forward. The combination of dbt and Athena creates a powerful and efficient environment for transforming and analyzing data in a serverless architecture. This synergy allows you to take advantage of the strengths of both tools, making it straightforward to manage complex data pipelines, reduce costs, and scale your operations.


About the Authors

Darshit Thakkar is a Technical Product Manager with AWS and works with the Amazon Athena team.

Selman Ay is a Data Architect in the AWS Professional Services team.

BP Yau is a Sr Partner Solutions Architect at AWS helping customers architect big data solutions to process data at scale

Improve your app authentication workflow with new Amazon Cognito features

Post Syndicated from Donnie Prakoso original https://aws.amazon.com/blogs/aws/improve-your-app-authentication-workflow-with-new-amazon-cognito-features/

Introduced 10 years ago, Amazon Cognito is a service that helps you implement customer identity and access management (CIAM) in your web and mobile applications. You can use Amazon Cognito for various use cases, from providing your customers to quickly add sign-in and sign-up experiences to your applications and authorization to securing machine-to-machine authentication and enabling role-based access to AWS resources.

Today, I’m excited to share a series of significant updates to Amazon Cognito. These enhancements aim to provide you with more flexibility, improved security, and a better user experience for your applications.

Here’s a quick summary:

A new developer-focused console experience
Amazon Cognito now offers a streamlined getting-started experience featuring a quick wizard and use case-specific recommendations. This new approach helps you set up configurations and reach your end users faster and more efficiently than ever before.

This is the new Amazon Cognito flow to help you quickly set up your application. You can get started in three steps:

  1. Choose the type of application you need to build
  2. Configure the sign-in options according to the type of your application
  3. Follow the instructions to integrate the sign-in and sign-up pages with your application

Then, select Create.

Amazon Cognito then automatically creates your application and a new user pool, which is a user directory for authentication and authorization. From here, you can review your sign-in page by selecting View login page or get started with the example code for your application. Furthermore, Amazon Cognito supports major application frameworks and offers detailed instructions for integrating them using standard OpenID Connect (OIDC) and OAuth open source libraries.

This is the new overview dashboard for your application. The user pool dashboard now provides important information in the Details section, as well as a set of Recommendations to help you continue your development journey.

On this page, you can customize your users’ sign-in and sign-up experience with the Managed Login feature. This is a good segue for me to provide you with a quick overview of the next new feature.

Introducing Managed Login
The introduction of Managed Login brings a new level of customization to Amazon Cognito. Managed Login handles the heavy lifting of availability, scaling, and security for your company. Once integrated, you automatically get all the new security patches and future features without further code changes.

This feature allows you to create personalized sign-up and sign-in experiences that are a seamless part of your company’s application for your end users.

Before you can use Managed Login, you need to assign a domain. There are two ways to do this: use a prefix domain, a randomly generated sub-domain of Amazon Cognito domain, or use your own custom domain to provide your users with a familiar domain name.

Then, you can choose your Branding version, selecting either Managed login or classic Hosted UI.

If you’re an existing Amazon Cognito user, you might be familiar with the classic Hosted UI feature. Managed Login is the improved version of Hosted UI, offering a new collection of web interfaces for sign-up and sign-in, built-in responsiveness for different screen sizes, multi-factor authentication, and password-reset activities in your user pool.

With Managed Login, you can use the new branding designer, a no-code visual editor for managed login assets and style, and a set of API operations for programmatic configuration or deployment via infrastructure-as-code with AWS CloudFormation.

With the branding designer, you have the flexibility to customize the look and feel of the entire user journey, from sign up and sign in to password recovery and multi-factor authentication. This feature provides a real time preview and convenient shortcuts to preview screens in different screen sizes and display modes before you launch it.

You can learn more about Managed Login by visiting the Managed Login documentation page.

Passwordless login support
The Managed Login feature also offers pre-built integrations for passwordless authentication methods, including signing in with passkeys, email OTP (one-time-password) and SMS OTP. Passkey support allows users to authenticate using cryptographic keys stored securely on their devices, offering better security compared to traditional passwords. This capability helps you implement low-friction and secure authentication methods without the need to understand and implement WebAuthn related protocols.

By reducing the friction associated with traditional password-based sign-ins, this feature simplifies application access for your users while maintaining high security standards.

Visit the user pools authentication flow documentation page to learn more about the passwordless login support.

More options on pricing tiers: Lite, Essentials and Plus
Amazon Cognito has introduced new user pool feature tiers: Lite, Essentials, and Plus. These tiers are designed to cater to different customer needs and use cases with the Essentials tier being the default tier for new users pools created by customers. This new tier structure also allows you to choose the most appropriate option based on your application requirements, with the flexibility to switch between tiers as needed.

To check your current tier, you can go to your application dashboard and select Feature plan. You can also select Settings from the navigation menu.

On this page, you’ll get detailed information for each tier and the option to downgrade or upgrade your plan.

Here’s a quick overview of each tier:

  1. Lite tier: Existing features such as user registration, password-based authentication, and social identity provider integration are now packaged in this tier. If you’re an existing Amazon Cognito user, you can continue using these features without making changes to your user pools. 

  2. Essentials tier: Offers comprehensive authentication and access control features, allowing you to implement secure, scalable, and customized sign-up and sign-in experiences for your application within minutes. It includes all capabilities in Lite along with supporting Managed Login and passwordless login options using passkeys, email, or SMS. Essentials also supports customizing access tokens and disallowing password reuse.

  3. Plus tier: Builds upon the Essentials tier, focusing on elevated security needs. It includes all Essentials features plus threat protection capabilities against suspicious login activity, detection of compromised credentials, risk-based adaptive authentication, and the ability to export user authentication event logs for threat analysis.

Pricing for the Lite, Essentials and Plus tiers is based on monthly active users. Customers currently using the advanced security features of Amazon Cognito should consider the Plus tier, which includes all the advanced security features, additional capabilities such as passwordless, and up to 60 percent savings as compared to using the standalone advanced security features.

If you want to learn about these new pricing tiers, see the Amazon Cognito pricing page.

Things you need to know

  • Availability – The Essentials and Plus tier are available in all AWS Regions where Amazon Cognito is available except AWS GovCloud (US) Regions.
  • Free tier on Lite and Essentials tiers – Customers on the Lite and Essentials tiers can enjoy the free tier each month that does not automatically expire. It is available to both existing and new AWS customers indefinitely. For more details on free tier, please visit the Amazon Cognito pricing page.

  • Extended pricing benefit for existing customers – Customers are eligible to upgrade their user pools without advanced security features (ASF) in their existing accounts to Essentials and pay the same price as Cognito user pools until November 30, 2025. To be eligible, customers’ accounts must have had at least 1 monthly active user (MAU) in the last 12 months on or before 10:00am Pacific Time, November 22, 2024. These customers are also eligible to create new user pools with Essentials tier at the same price as Cognito users pools in those accounts until November 30, 2025.

With these updates, you can implement secure, scalable, and customizable authentication solutions for your applications with Amazon Cognito.

Happy building,
Donnie

Node.js 22 runtime now available in AWS Lambda

Post Syndicated from Julian Wood original https://aws.amazon.com/blogs/compute/node-js-22-runtime-now-available-in-aws-lambda/

This post is written by Julian Wood, Principal Developer Advocate, and Andrea Amorosi, Senior SA Engineer.

You can now develop AWS Lambda functions using the Node.js 22 runtime, which is in active LTS status and ready for production use. Node.js 22 includes a number of additions to the language, including require()ing ES modules, as well as changes to the runtime implementation and the standard library. With this release, Node.js developers can take advantage of these new features and enhancements when creating serverless applications on Lambda.

You can develop Node.js 22 Lambda functions using the AWS Management ConsoleAWS Command Line Interface (AWS CLI)AWS SDK for JavaScriptAWS Serverless Application Model (AWS SAM)AWS Cloud Development Kit (AWS CDK), and other infrastructure as code tools.

To use this new version, specify a runtime parameter value of nodejs22.x when creating or updating functions or by using the appropriate container base image.

You can use Node.js 22 with Powertools for AWS Lambda (TypeScript), a developer toolkit to implement serverless best practices and increase developer velocity. Powertools for AWS Lambda includes libraries to support common tasks such as observability, AWS Systems Manager Parameter Store integration, idempotency, batch processing, and more. You can also use Node.js 22 with Lambda@Edge to customize low-latency content delivered through Amazon CloudFront.

This blog post highlights important changes to the Node.js runtime, notable Node.js language updates, and how you can use the new Node.js 22 runtime in your serverless applications.

Node.js 22 language updates

Node.js 22 introduces several language updates and features that enhance developer productivity and improve application performance.

This release adds support for loading ECMAScript modules (ESM) using require(). You can enable this feature using the --experimental-require-module flag by configuring the NODE_OPTIONS environment variable. require() support for synchronous ESM graphs bridges the gap between CommonJS and ESM, providing more flexibility in module loading. It is important to note that this feature is currently experimental and may change in future releases.

WebSocket support which was previously available behind the --experimental-websocket flag is now enabled by default in Node.js 22. This brings a browser-compatible WebSocket client implementation to Node.js with no need for external dependencies. Native support simplifies building real-time applications and enhances the overall WebSocket experience in Node.js environments.

The new runtime also includes performance improvements to AbortSignal creation. This makes network operations faster and more efficient for the Fetch API and test runner. The Fetch API is also now considered stable in Node.js 22.

For TypeScript users, Node.js 22 introduces experimental support for transforming TypeScript-only syntax into JavaScript code. By using the --experimental-transform-types flag, you can enable this feature to support TypeScript syntax such as Enum and namespace directly. While you can enable the feature in Lambda, your function entrypoint (i.e. index.mjs or app.cjs) cannot currently be written using TypeScript as the runtime expects a file with a JavaScript extension. You can use TypeScript for any other module imported within your codebase.

For a detailed overview of Node.js 22 language features, see the Node.js 22 release blog post and the Node.js 22 changelog.

Experimental features that are unavailable

Node.js 22 includes an experimental feature to detect the module syntax automatically (CommonJS or ES Modules). This feature must be enabled when the Node.js runtime is compiled. Since the Lambda-provided Node.js 22 runtime is intended for production workloads, this experimental feature is not enabled in the Lambda build and cannot be enabled via an execution-time flag. To use this feature in Lambda, you need to deploy your own Node.js runtime using a custom runtime or container image with experimental module syntax detection enabled.

Performance considerations

At launch, new Lambda runtimes receive less usage than existing established runtimes. This can result in longer cold start times due to reduced cache residency within internal Lambda sub-systems. Cold start times typically improve in the weeks following launch as usage increases. As a result, AWS recommends not drawing conclusions from side-by-side performance comparisons with other Lambda runtimes until the performance has stabilized. Since performance is highly dependent on workload, customers with performance-sensitive workloads should conduct their own testing, instead of relying on generic test benchmarks.

Builders should continue to measure and test function performance and optimize function code and configuration for any impact. To learn more about how to optimize Node.js performance in Lambda, see Performance optimization in the Lambda Operator Guide, and our blog post Optimizing Node.js dependencies in AWS Lambda.

Migration from earlier Node.js runtimes

AWS SDK for JavaScript

Up until Node.js 16, Lambda’s Node.js runtimes included the AWS SDK for JavaScript version 2. This has since been superseded by the AWS SDK for JavaScript version 3, which was released in December 2022. Starting with Node.js 18, and continuing with Node.js 22, the Lambda Node.js runtimes include version 3. When upgrading from Node.js 16 or earlier runtimes and using the included version 2, you must upgrade your code to use the v3 SDK.

For optimal performance, and to have full control over your code dependencies, we recommend bundling and minifying the AWS SDK in your deployment package, rather than using the SDK included in the runtime. For more information, see Optimizing Node.js dependencies in AWS Lambda.

Amazon Linux 2023

The Node.js 22 runtime is based on the provided.al2023 runtime, which is based on the Amazon Linux 2023 minimal container image. The Amazon Linux 2023 minimal image uses microdnf as a package manager, symlinked as dnf. This replaces the yum package manager used in Node.js 18 and earlier AL2-based images. If you deploy your Lambda function as a container image, you must update your Dockerfile to use dnf instead of yum when upgrading to the Node.js 22 base image from Node.js 18 or earlier.

Additionally AL2 includes curl and gnupg2 as their minimal versions curl-minimal and gnupg2-minimal.

Learn more about the provided.al2023 runtime in the blog post Introducing the Amazon Linux 2023 runtime for AWS Lambda and the Amazon Linux 2023 launch blog post.

Using the Node.js 22 runtime in AWS Lambda

AWS Management Console

To use the Node.js 22 runtime to develop your Lambda functions, specify a runtime parameter value Node.js 22.x when creating or updating a function. The Node.js 22 runtime version is now available in the Runtime dropdown on the Create function page in the AWS Lambda console:

Creating Node.js function in AWS Management Console

Creating Node.js function in AWS Management Console

To update an existing Lambda function to Node.js 22, navigate to the function in the Lambda console, then choose Node.js 22.x in the Runtime settings panel. The new version of Node.js is available in the Runtime dropdown:

Changing a function to Node.js 22

Changing a function to Node.js 22

AWS Lambda container image

Change the Node.js base image version by modifying the FROM statement in your Dockerfile.

FROM public.ecr.aws/lambda/nodejs:22
# Copy function code
COPY lambda_handler.xx ${LAMBDA_TASK_ROOT}

AWS Serverless Application Model (AWS SAM)

In AWS SAM, set the Runtime attribute to node22.x to use this version:

AWSTemplateFormatVersion: "2210-09-09"
Transform: AWS::Serverless-2216-10-31

Resources:
  MyFunction:
    Type: AWS::Serverless::Function
    Properties:
      Handler: lambda_function.lambda_handler
      Runtime: nodejs22.x
      CodeUri: my_function/.
      Description: My Node.js Lambda Function

When you add function code directly in an AWS SAM or AWS CloudFormation template as an inline function, it is seen as common.js.

AWS SAM supports generating this template with Node.js 22 for new serverless applications using the sam init command. Refer to the AWS SAM documentation.

AWS Cloud Development Kit (AWS CDK)

In AWS CDK, set the runtime attribute to Runtime.NODEJS_22_X to use this version.

import * as cdk from "aws-cdk-lib";
import * as lambda from "aws-cdk-lib/aws-lambda";
import * as path from "path";
import { Construct } from "constructs";

export class CdkStack extends cdk.Stack {
  constructor(scope: Construct, id: string, props?: cdk.StackProps) {
    super(scope, id, props);

    // The code that defines your stack goes here

    // The Node.js 22 enabled Lambda Function
    const lambdaFunction = new lambda.Function(this, "node22LambdaFunction", {
      runtime: lambda.Runtime.NODEJS_22_X,
      code: lambda.Code.fromAsset(path.join(__dirname, "/../lambda")),
      handler: "index.handler",
    });
  }
}


Conclusion

Lambda now supports Node.js 22 as a managed language runtime. This release uses the Amazon Linux 2023 OS as well as other improvements detailed in this blog post.

You can build and deploy functions using Node.js 22 using the AWS Management Console, AWS CLI, AWS SDK, AWS SAM, AWS CDK, or your choice of infrastructure as code tool. You can also use the Node.js 22 container base image if you prefer to build and deploy your functions using container images.

The Node.js 22 runtime helps developers build more efficient, powerful, and scalable serverless applications. Read about the Node.js programming model in the Lambda documentation to learn more about writing functions in Node.js 22. Try the Node.js runtime in Lambda today.

For more serverless learning resources, visit Serverless Land.

Introducing new capabilities to AWS CloudTrail Lake to enhance your cloud visibility and investigations

Post Syndicated from Esra Kayabali original https://aws.amazon.com/blogs/aws/introducing-new-capabilities-to-aws-cloudtrail-lake-to-enhance-your-cloud-visibility-and-investigations/

Today, I’m excited to announce new updates to AWS CloudTrail Lake, which is a managed data lake you can use to aggregate, immutably store, and query events recorded by AWS CloudTrail for auditing, security investigation, and operational troubleshooting.

The new updates in CloudTrail Lake are:

  • Enhanced filtering options for CloudTrail events
  • Cross-account sharing of event data stores
  • General availability of the generative AI–powered natural language query generation
  • AI-powered query results summarization capability in preview
  • Comprehensive dashboard capabilities, including a high-level overview dashboard with AI-powered insights (AI-powered insights is in preview), a suite of 14 pre-built dashboards for various use cases, and the ability to create custom dashboards with scheduled refreshes

Let’s look into the new features one by one.

Enhanced filtering options for CloudTrail events ingested into event data stores
Enhanced event filtering capabilities give you greater control over which CloudTrail events are ingested into your event data stores. These enhanced filtering options provide tighter control over your AWS activity data, improving the efficiency and precision of security, compliance, and operational investigations. Additionally, the new filtering options help you reduce your analysis workflow costs by ingesting only the most relevant event data into your CloudTrail Lake event data stores.

You can filter both management and data events based on attributes such as eventSource, eventType, eventName, userIdentity.arn, and sessionCredentialFromConsole.

I go to the AWS CloudTrail console and choose Event data stores under Lake in the navigation pane. I choose Create event data store. In the first step, I enter a name in the Event data store name field. For this demo, I leave other fields as default. You can choose the pricing and retention options that suit your needs. In the next step, I choose Managements events and Data events under CloudTrail events. You can include all the options you need under CloudTrail events. You also have the option to choose ingestion options. I choose Ingest events to start ingesting when it’s created. There may be scenarios, when you want to deselect the Ingest events option to stop an event data store from ingesting events. For example, you may be copying trail events to the event data store and do not want the event data store to collect any future events. You can also choose to enable ingestion for all accounts in your organization or include only the current region in your event data store.

The following example shows an out of the box template for filtering, which excludes any management events that are initiated by an AWS Service. I choose Advanced event collection under the Management events. I choose Exclude AWS service-initiated events from the Log selector template dropdown. You can also expand the JSON view to see how the filters actually apply.

Under the Data events, the following example creates a filter to include DynamoDB data events initiated by a certain user, helping me to log events based on an IAM principal. I choose DynamoDB as Resource type. I choose Custom as Log selector template. Under the Advanced event selector, I choose userIdentity.arn as Field and equals as Operator. I enter the user’s ARN as Value. I choose Next and choose Create event data store in the final step.

Now, I have my event data store that gives me granular control over the ingested CloudTrail data.

This expanded set of filtering options helps you to be more selective in capturing only the most relevant events for your security, compliance, and operational needs.

Cross-account sharing of event data stores
You can use the cross-account sharing feature of event data stores to enhance collaborative analysis within organizations. It enables secure sharing of event data stores with selected AWS principals through Resource-Based Policies (RBP). This functionality allows authorized entities to query shared event data stores within the same AWS Region where they were created. 

To use this feature, I go to the AWS CloudTrail console and choose Event data stores under Lake in the navigation pane. I choose an event data store from the list and navigate to its details page. I choose Edit in the Resource policy section. The following example policy includes a statement that allows root users in accounts 111111111111, 222222222222, and 333333333333 to run queries and get query results on the event data store owned by account ID 999999999999. I choose Save changes to save the policy.

Generative AI–powered natural language query generation in CloudTrail Lake is now generally available
In June, we announced this feature for CloudTrail Lake in preview. With this launch, you can generate SQL queries using natural language questions to easily explore and analyze AWS activity logs (only management, data, and network activity events) without needing technical SQL expertise. The feature uses generative AI to convert natural language questions into ready-to-use SQL queries you can run directly in the CloudTrail Lake console. This simplifies the process of exploring event data stores and retrieving insights such as error counts, top services used, and the causes of errors. This feature is also accessible through the AWS Command Line Interface (AWS CLI), providing additional flexibility for users who prefer command-line operations. The preview blog post provides step-by-step instructions on how to get started with the natural language query generation feature in CloudTrail Lake.

CloudTrail Lake generative AI–powered query results summarization capability in preview
Building on the capability of natural language query generation, we’re introducing a new AI-powered query results summarization feature in preview to further simplify the process of analyzing AWS account activity. With this feature, you can easily extract valuable insights from your AWS activity logs (only management, data, and network activity events) by automatically summarizing the key points from your query results in natural language, reducing the time and effort required to understand the information.

To try this feature, I go to the AWS CloudTrail console and choose Query under Lake in the navigation pane. I choose an event data store for my CloudTrail Lake query from the dropdown list in Event data store. You can use summarization regardless of whether the query was written manually or generated by generative AI. For this example, I will use the natural language query generation capability. In the Query generator, I enter the following prompt in the Prompt field using natural language:

How many errors were logged during the past month for each service and what was the cause of each error?

Then, I choose Generate query. The following SQL query is automatically generated:

SELECT eventsource,
    errorcode,
    errormessage,
    count(*) as errorcount
FROM a0******
WHERE eventtime >= '2024-10-14 00:00:00'
    AND eventtime <= '2024-11-14 23:59:59'
    AND (
        errorcode IS NOT NULL
        OR errormessage IS NOT NULL
    )
GROUP BY 1,
    2,
    3
ORDER BY 4 DESC;

I choose Run to get the results. To use the summarization capability, I choose Summarize results in the Query results tab. CloudTrail automatically analyzes the query results and provides a natural language summary of the key insights. It’s important to note that there’s a monthly quota of 3 MB for query results that can be summarized.

This new summarization capability can save you time and effort in understanding your AWS activity data by automatically generating meaningful summaries of the key findings.

Comprehensive dashboard capabilities
Lastly, let me tell you about the new dashboard capabilities of CloudTrail Lake to enhance visibility and analysis across your AWS environments.

The first one is a Highlights dashboard that provides you with an easy-to-view summary of the data captured in your CloudTrail Lake management and data events stored in event data stores. This dashboard makes it easier to quickly identify and understand important insights, such as the top failed API calls, trends in failed login attempts, and spikes in resource creation. It surfaces any anomalies or unusual trends in the data.

I go to the AWS CloudTrail console and choose Dashboard under Lake in the navigation pane to check out the Highlights dashboard. First, I enable Highlights dashboard by choosing Agree and enable Highlights.

I check out the Highlights dashboard once it populates with data.

The second addition to the new dashboard capabilities is a suite of 14 pre-built dashboards. These dashboards are designed for different personas and use cases. For example, the security-focused dashboards help you to track and analyze key security indicators, such as top access denied events, failed console login attempts, and users who have disabled multi-factor authentication (MFA). There are also pre-built dashboards for operational monitoring, highlighting trends in errors and availability issues, such as top APIs with throttling errors and top users with errors. You can also use the dashboards focused on specific AWS services such as Amazon EC2 and Amazon DynamoDB, which help you identify security risks or operational problems within those particular service environments.

You can create your own dashboards and optionally set schedules for refreshing them. This level of customization helps you tailor the CloudTrail Lake analysis capabilities to your precise monitoring and investigative needs across your AWS environments.

I switch to the Managed and custom dashboards to observe the custom and pre-built dashboards.

I choose IAM activity dashboard pre-built dashboard to observe overall IAM activity. You can choose Save as new dashboard to customize this dashboard.

To create a custom dashboard from scratch, I go to Dashboard under Lake in the navigation pane and choose Build my own dashboard. I enter a name in the Enter a name for the dashboard field and choose event data stores under Permissions, to visualize the events. Next, I choose Create dashboard.

Now, I can add widgets to my dashboard. You have the flexibility to customize your dashboards in multiple ways. You can select from a list of pre-built sample widgets using Add sample widget, or you can create your own custom widgets using Create new widget. For each widget, you can choose the type of visualization you prefer, such as a line graph, bar graph, or other options to best represent your data.

Now available
The new features in AWS CloudTrail Lake represent a major advancement in providing a comprehensive audit logging and analysis solution. These enhancements provide the ability to gain more profound understanding and conduct investigations more rapidly, assisting with more preventative monitoring and faster incident handling across your entire AWS environments.

You can now start using generative AI–powered natural language query generation in CloudTrail Lake in US East (N. Virginia), US West (Oregon), Asia Pacific (Mumbai), Asia Pacific (Sydney), Asia Pacific (Tokyo), Canada (Central), and Europe (London) AWS Regions.

CloudTrail Lake generative AI–powered query results summarization capability is available in preview in US East (N. Virginia), US West (Oregon), and Asia Pacific (Tokyo) Regions.

Enhanced filtering options, cross-account sharing of event data stores and dashboards are available in all the Regions where CloudTrail Lake is available, with the exception of generative AI–powered summarization feature on the Highlights dashboard being available only in US East (N. Virginia), US West (Oregon), and Asia Pacific (Tokyo) Regions.

Running queries will incur CloudTrail Lake query charges. For more details on pricing, visit AWS CloudTrail pricing.

— Esra

AWS Glue Data Catalog supports automatic optimization of Apache Iceberg tables through your Amazon VPC

Post Syndicated from Noritaka Sekiyama original https://aws.amazon.com/blogs/big-data/aws-glue-data-catalog-supports-automatic-optimization-of-apache-iceberg-tables-through-your-amazon-vpc/

The AWS Glue Data Catalog supports automatic table optimization of Apache Iceberg tables, including compaction, snapshots, and orphan data management. The data compaction optimizer constantly monitors table partitions and kicks off the compaction process when the threshold is exceeded for the number of files and file sizes.

The Iceberg table compaction process starts and will continue if the table or any of the partitions within the table has more than the configured number of files (default five files), each smaller than 75% of the target file size. The snapshot retention process runs periodically (default daily) to identify and remove snapshots that are older than the specified retention configuration from the table properties, while keeping the most recent snapshots up to the configured limit. Similarly, the orphan file deletion process scans the table metadata and the actual data files, identifies the unreferenced files, and deletes them to reclaim storage space. These storage optimizations can help you reduce metadata overhead, control storage costs, and improve query performance.

Although automatic table optimization has simplified day-to-day Iceberg table maintenance tasks, certain industries and customers have advanced requirements to access their Iceberg tables from specific virtual private clouds (VPCs). This access control is needed for not only data ingestion and querying, but also for table maintenance.

To help achieve such requirements, we provide the capability where the Data Catalog optimizes Iceberg tables to run in your specific VPC. This post demonstrates how it works with step-by-step instructions.

How the table optimizer works with AWS Glue network connection

By default, a table optimizer is not associated with any of your VPCs and subnets. With this new capability of supporting data access from VPCs, you can associate a table optimizer with an AWS Glue network connection to run in a specific VPC, subnet, and security group. An AWS Glue network connection is commonly used to run an AWS Glue job with a specific VPC, subnet, and security group. The following diagram illustrates how it works.

In the next sections, we demonstrate how to configure a table optimizer with an AWS Glue network connection.

Prerequisites

To run through this instruction, you must have the following prerequisites:

Set up resources with AWS CloudFormation

This post includes a sample AWS CloudFormation template that enables a quick setup of the solution resources. You can review and customize the template to suit your needs.

The CloudFormation template generates the following resources:

  • An Amazon Simple Storage Service (Amazon S3) bucket to store the dataset, AWS Glue job scripts, and so on. (See Appendix 1 at the end of this post for manual instructions.)
  • A Data Catalog database.
  • An AWS Glue job that creates and modifies sample customer data in your S3 bucket with a trigger every 10 minutes.
  • AWS IAM roles and policies.
  • A VPC, public subnet, two private subnets, internet gateway, and route tables.
  • Amazon Virtual Private Cloud (Amazon VPC) endpoints for AWS Glue, AWS Lake Formation, Amazon CloudWatch, Amazon S3, and AWS Security Token Service (AWS STS). The endpoint names are as follows:
    • AWS Gluecom.amazonaws.<region>.glue (for example, com.amazonaws.us-east-1.glue).
    • Lake Formationcom.amazonaws.<region>.lakeformation (only if tables are registered with Lake Formation).
    • CloudWatchcom.amazonaws.<region>.monitoring.
    • Amazon S3com.amazonaws.<region>.s3.
    • AWS STScom.amazonaws.<region>.sts.
  • An AWS Glue network connection configured with the VPC and subnet. (See Appendix 2 at the end of this post for manual instructions.)

To launch the CloudFormation stack, complete the following steps:

  1. Sign in to the AWS CloudFormation console.
  2. Choose Launch Stack.
    Launch Stack
  3. Choose Next.
  4. For SubnetAz1, choose your preferred Availability Zone.
  5. For SubnetAz2, choose your preferred Availability Zone. This needs to be different from SubnetAz1.
  6. Leave the other parameters as default or make appropriate changes based on your requirements, then choose Next.
  7. Review the details on the final page and select I acknowledge that AWS CloudFormation might create IAM resources.
  8. Choose Create.

This stack can take around 5–10 minutes to complete, after which you can view the deployed stack on the AWS CloudFormation console.

Configure automatic table optimization with an AWS Glue network connection

Complete following steps to configure automatic table optimization with an AWS Glue network connection:

  1. On the AWS Glue console, choose Databases in the navigation pane.
  2. Choose iceberg_optimizer_vpc_db.
  3. Under Tables, choose customer.
  4. On the Table optimization – new tab, choose Enable optimization.

  1. For Optimization configuration, choose Customize settings.
  2. For IAM role, choose the iceberg-optimizer-vpc-MyGlueTableOptimizerRole-xxx role created by the CloudFormation stack.
  3. For Virtual private cloud (VPC) – optional, choose myvpc_private_network_connection.

  1. Select I acknowledge that expired data will be deleted as part of the optimizers and choose Enable optimization.

Now the table optimizer has been configured with your VPC. After a while, you can see how the optimizer worked.

  1. Under Table optimization – new, choose View optimization history on the Actions menu.

You can confirm that the table optimizer worked successfully for this Iceberg table.

You have now seen how to set up the table optimizer with an AWS Glue network connection to run it through a specific VPC.

Clean up

When you have finished all the preceding steps, remember to clean up all the AWS resources you created using AWS CloudFormation:

  1. Delete the S3 bucket storing the Iceberg table and the AWS Glue job script.
  2. Delete the CloudFormation stack.

Conclusion

This post demonstrated how the Data Catalog supports automatic optimization of Iceberg tables through your VPC. With this enhancement, you can simplify table maintenance for your Iceberg tables under advanced security requirements. This feature is available today in all AWS Glue supported AWS Regions.

Try out this solution for your own use case, and share your feedback and questions in the comments.


About the Authors

Noritaka Sekiyama is a Principal Big Data Architect on the AWS Glue team. He is responsible for building software artifacts to help customers. In his spare time, he enjoys cycling with his new road bike.

Paul Villena is an Analytics Solutions Architect in AWS with expertise in building modern data and analytics solutions to drive business value. He works with customers to help them harness the power of the cloud. His areas of interest are infrastructure as code, serverless technologies, and coding in Python.

Justin Lin is a software engineer on the AWS Lake Formation team. He works on delivering managed optimization solutions for open table formats to enhance customer data management and query performance. In his spare time, he enjoys playing tennis.

Himani Desai is a Software Engineer on the AWS Lake Formation team. She works on providing managed optimization solutions for Iceberg tables.

Abishek Shankar is a software engineer on the AWS Lake Formation team, working on providing managed optimization solutions for Iceberg tables.

Shyam Rathi is a Software Development Manager on the AWS Lake Formation team, working on delivering new features and enhancements related to modern data lakes.

Sandeep Adwankar is a Senior Product Manager at AWS. Based in the California Bay Area, he works with customers around the globe to translate business and technical requirements into products that enable customers to improve how they manage, secure, and access data.


Appendix 1: Configure your S3 bucket to allow access only from a specific VPC

The instructions provided in this post help you configure your S3 bucket automatically through the CloudFormation template, but you can also manually configure your S3 bucket to allow access only from a specific VPC. This is an optional step to simulate the strict security regulation on your Iceberg table. Complete following steps:

  1. On the Amazon S3 console, choose Buckets in the navigation pane.
  2. Choose your S3 bucket.
  3. Choose Permissions.
  4. Under Bucket policy, choose Edit.
  5. Enter following bucket policy:
{
    "Version": "2012-10-17",
    "Id": "S3BucketPolicyVPCAccessOnly",
    "Statement": [
        {
            "Sid": "DenyIfNotFromAllowedVPC",
            "Effect": "Deny",
            "Principal": "*",
            "Action": [
                "s3:GetObject",
                "s3:ListBucket",
                "s3:PutObject"
            ],
            "Resource": [
                "arn:aws:s3:::<your-bucket-name>",
                "arn:aws:s3:::<your-bucket-name>/*"
            ],
            "Condition": {
                "StringNotEquals": {
                    "aws:SourceVpc": "<your-vpc-id>",
                    "aws:PrincipalArn": [
                        "arn:aws:iam::<your-account-id>:role/<your-IAM-role-name>"
                    ]
                }
            }
        }
    ]
}
  1. Choose Save changes.

Now this S3 bucket prevents any data operations not from the VPC. You can try uploading files to the bucket through Amazon S3 console to see that this operation fails as expected.

Appendix 2: Create an AWS Glue network connection

You can also can manually configure the AWS Glue network connection with the following steps:

  1. On the AWS Glue console, choose Data connections in the navigation pane.
  2. Under Connections, choose Create connection.
  3. Select Network, and choose Next.
  4. For VPC, choose your VPC created by the CloudFormation stack. The VPC ID is shown on the Outputs tab of the CloudFormation stack.
  5. For Subnet, choose your private subnet created by the CloudFormation stack. The subnet ID is shown on the Outputs tab of the CloudFormation stack.
  6. For Security groups, choose your security group created by the CloudFormation stack. The security group ID is shown on the Outputs tab of the CloudFormation stack.
  7. Choose Next.
  8. For Name, enter myvpc_private_network_connection.
  9. Choose Next.
  10. Review the configurations and choose Create connection.