Tag Archives: How-to

Simplifying Zabbix API workflows with named Zabbix API tokens

Post Syndicated from Arturs Lontons original https://blog.zabbix.com/simplifying-zabbix-api-workflows-with-named-zabbix-api-tokens/16653/

Zabbix API enables you to collect any and all information from your Zabbix instance by using a multitude of API methods. You can even utilize Zabbix API calls in your HTTP items. For example, this can be used to monitor the number of particular sets of metrics and visualize their growth over time. With named Zabbix API tokens, such use cases are a lot more simple to implement.

Before Zabbix 5.4 we had to perform the user.login API call to obtain the authentication token. Once the user session was closed, we had to relog, obtain the new authentication token and use it in the subsequent API calls.

With the pre-defined named Zabbix API tokens, you don’t have to constantly check if the authentication token needs to be updated. Starting from Zabbix 5.4 you can simply create a new named Zabbix API token with an expiration date and use it in your API calls.

Creating a new named Zabbix API token

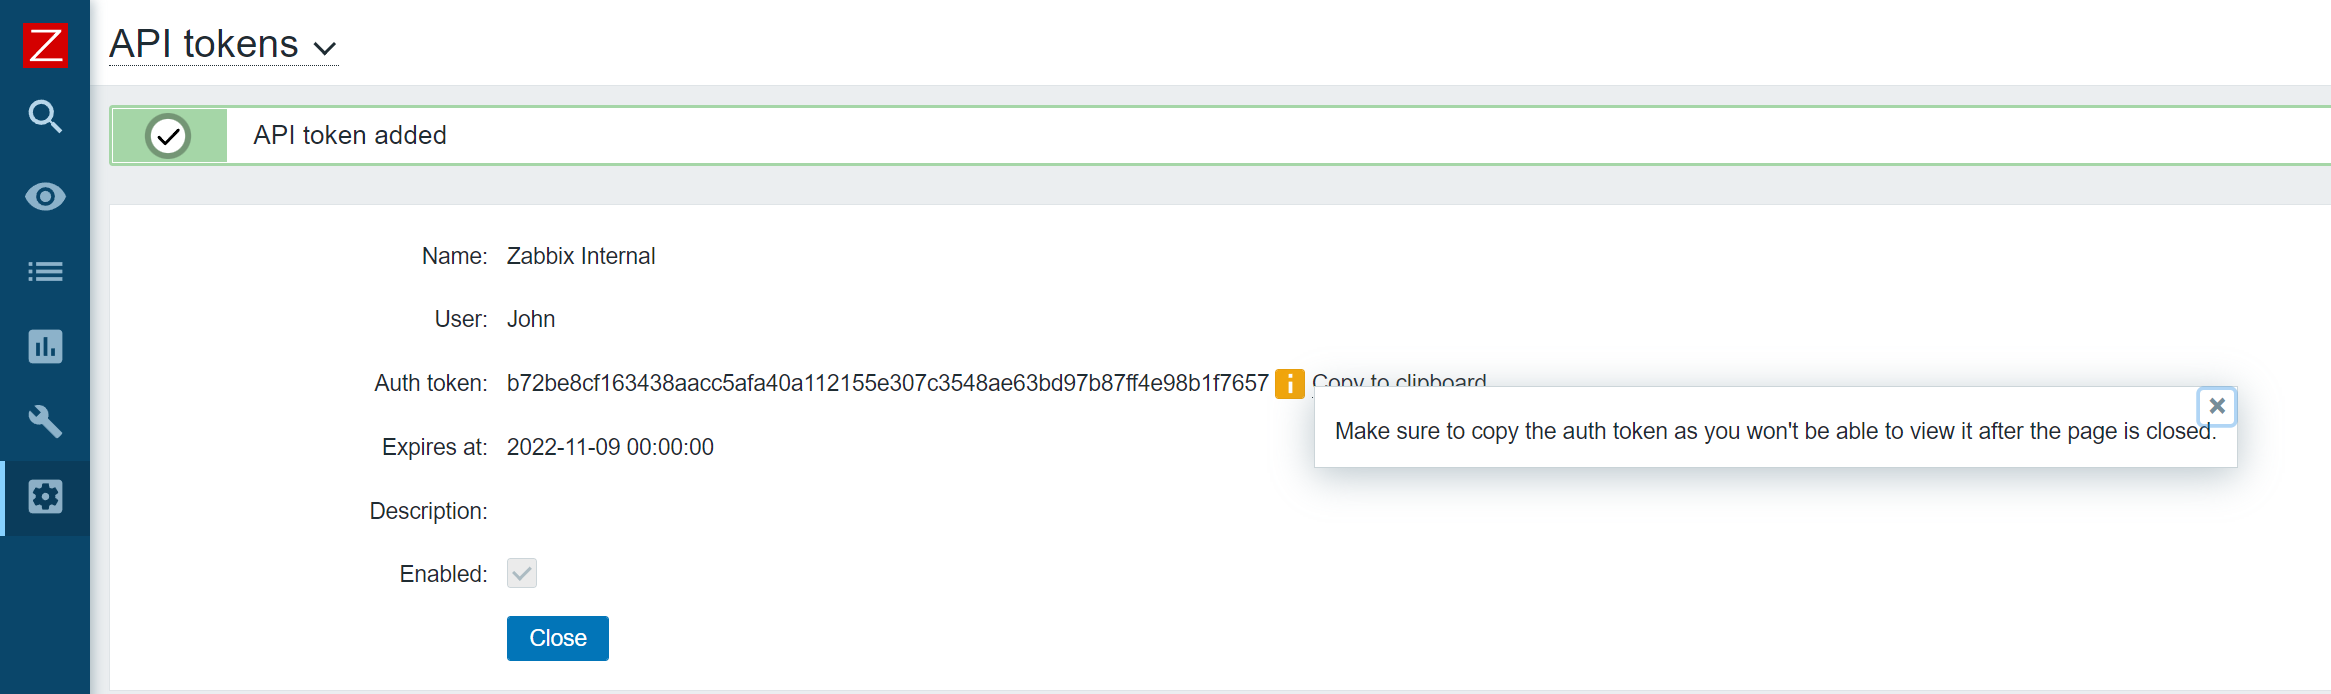
The Zabbix API token creation process is extremely simple. All you have to do is navigate to Administration – General – API tokens and create a new API token. The named API tokens are created for a particular user and can have an optional expiration date and time – otherwise, the tokens are defined without an expiry date.

You can create a named API token in the API tokens section, under Administration – General

Once the Token has been created, make sure to store it somewhere safe, since you won’t be able to recover it afterward. If the token is lost – you will have to recreate it.

Make sure to store the auth token!

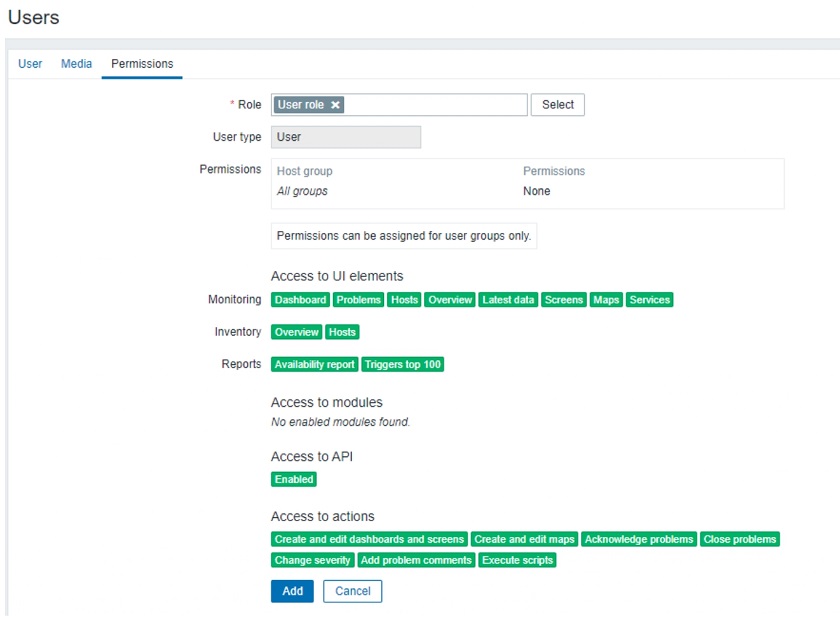
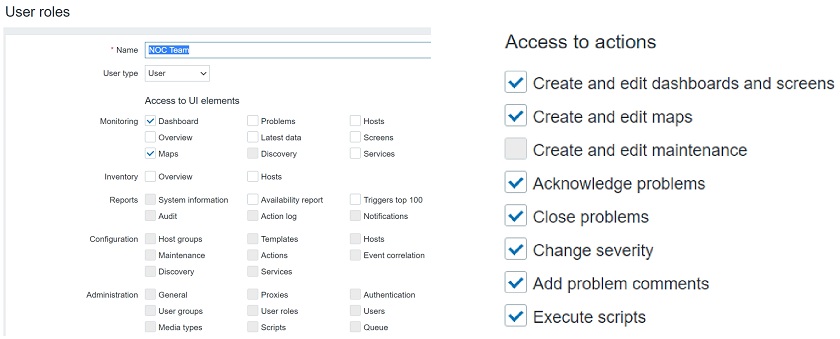
Don’t forget, that when defining a role for the particular API user, we can restrict which API methods this user has access to.

Simplifying API tasks with the named API token

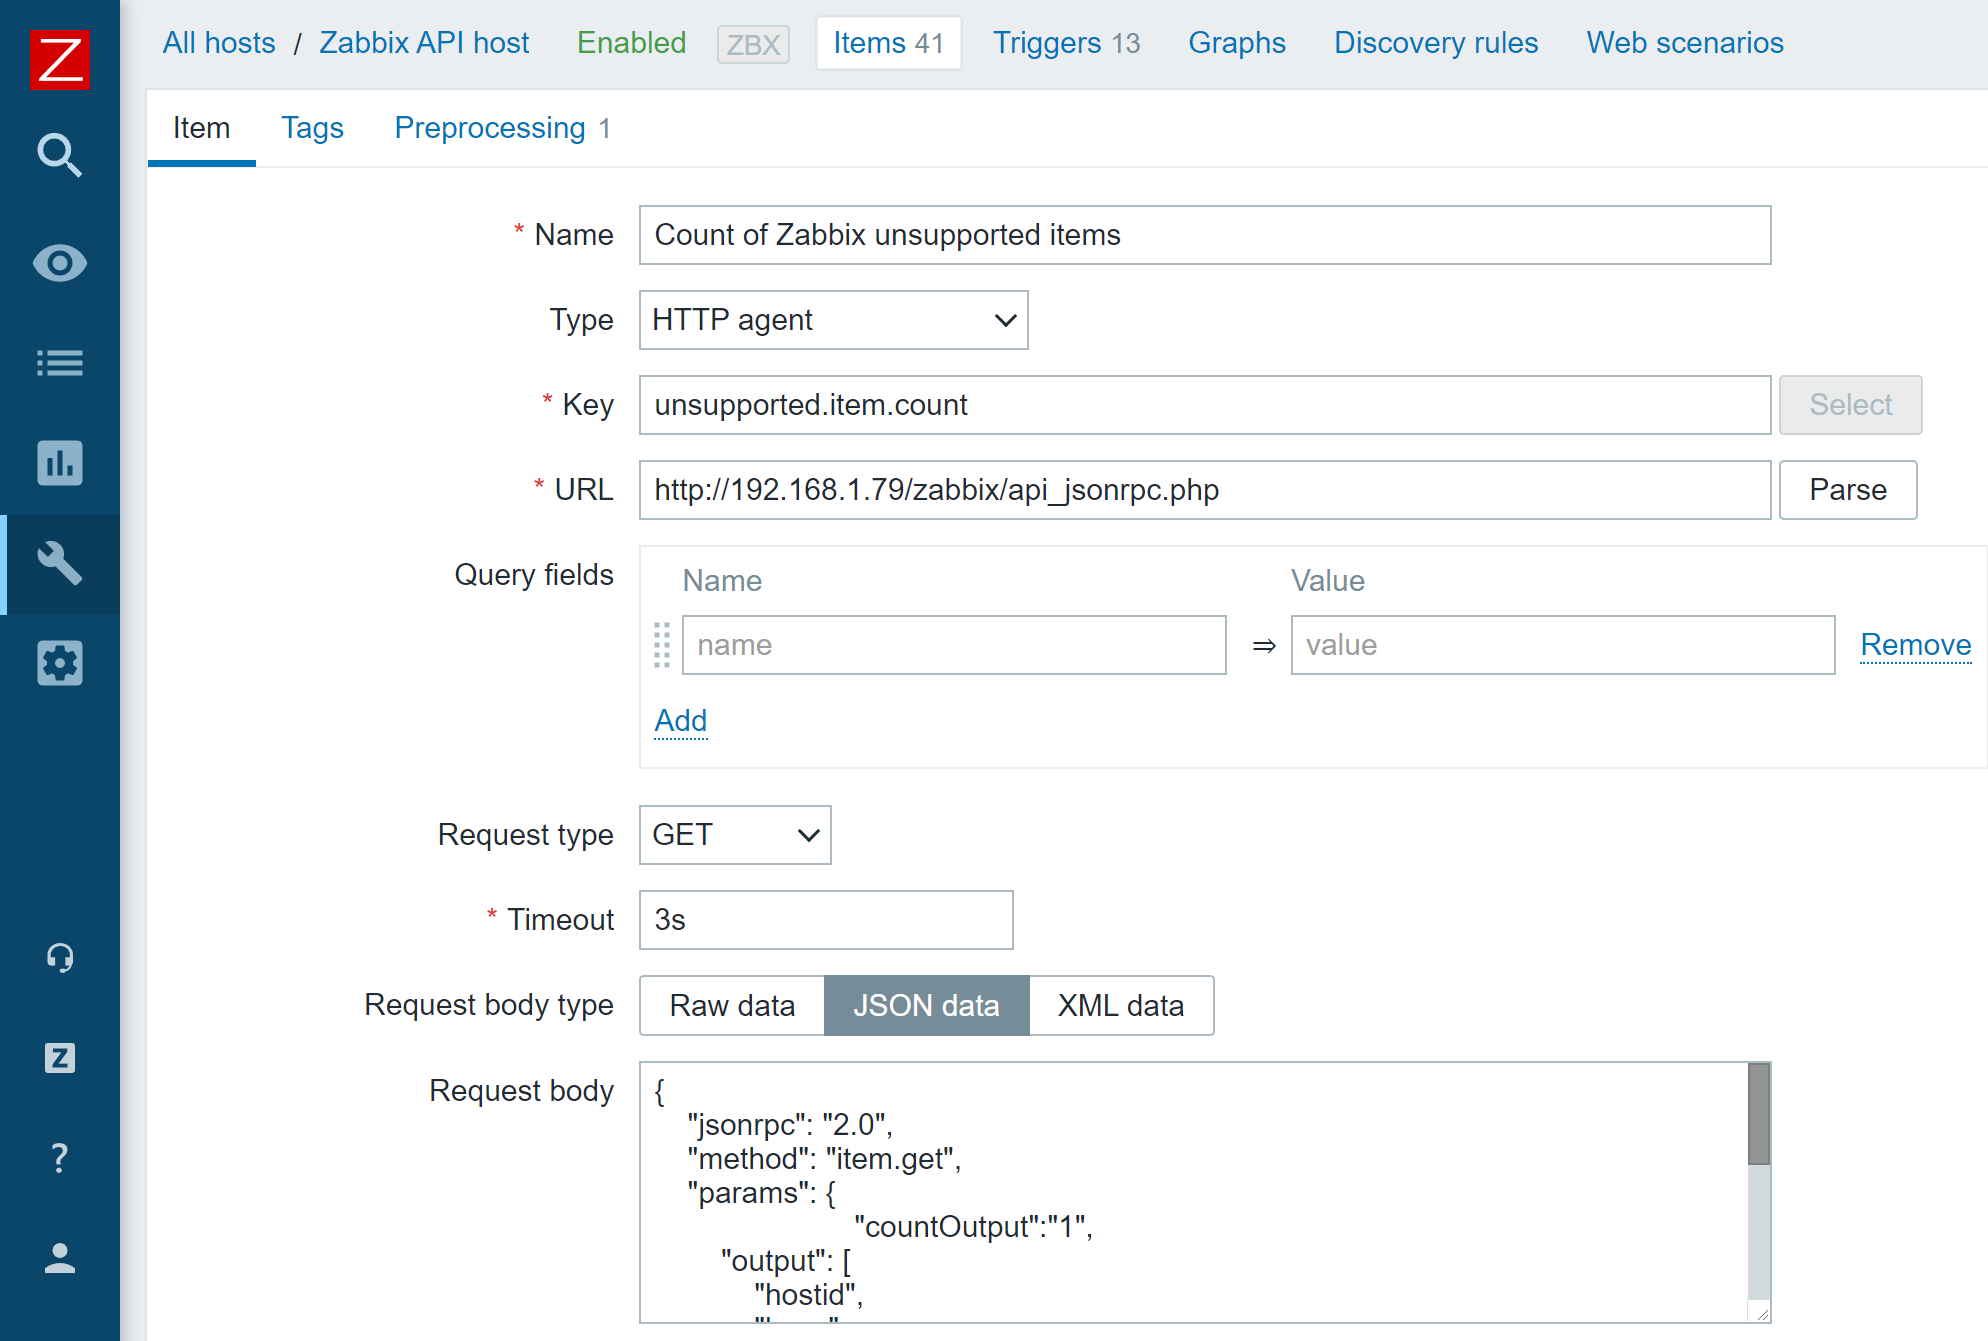
There are many different use cases where you could implement Zabbix API calls to collect some additional information. For this blog post, I will create an HTTP item that uses item.get API call to monitor the number of unsupported items.

To achieve that, I will create an HTTP item on a host (This can be the default Zabbix server host or a host dedicated to collecting metrics via Zabbix API calls) and provide the API call in the request body. Since the named API token now provides a static authentication token until it expires, I can simply use it in my API call without the need to constantly keep it updated.

An HTTP agent item that uses a Zabbix API call in its request body

{
    "jsonrpc": "2.0",
    "method": "item.get",
    "params": {
			"countOutput":"1",
			 "filter": {
 "state": "1"
 }
    },
    "id": 2,
    "auth": "b72be8cf163438aacc5afa40a112155e307c3548ae63bd97b87ff4e98b1f7657"
}

HTTP item request body, which returns a count of unsupported items

I will also use regular expression preprocessing to obtain the numeric value from the API call result – otherwise, we won’t be able to graph our value or calculate trends for it.

Regular expression preprocessing step to obtain a numeric value from our Zabbix API call result

Utilizing Zabbix API scripts in Actions

In one of our previous blog posts, we covered resolving problems automatically with the event.acknowledge API method. The logic defined in the blog post was quite complex since we needed to keep an eye out for the authentication tokens and use a custom script to keep them up to date. With named Zabbix API tokens, this use case is a lot more simple.

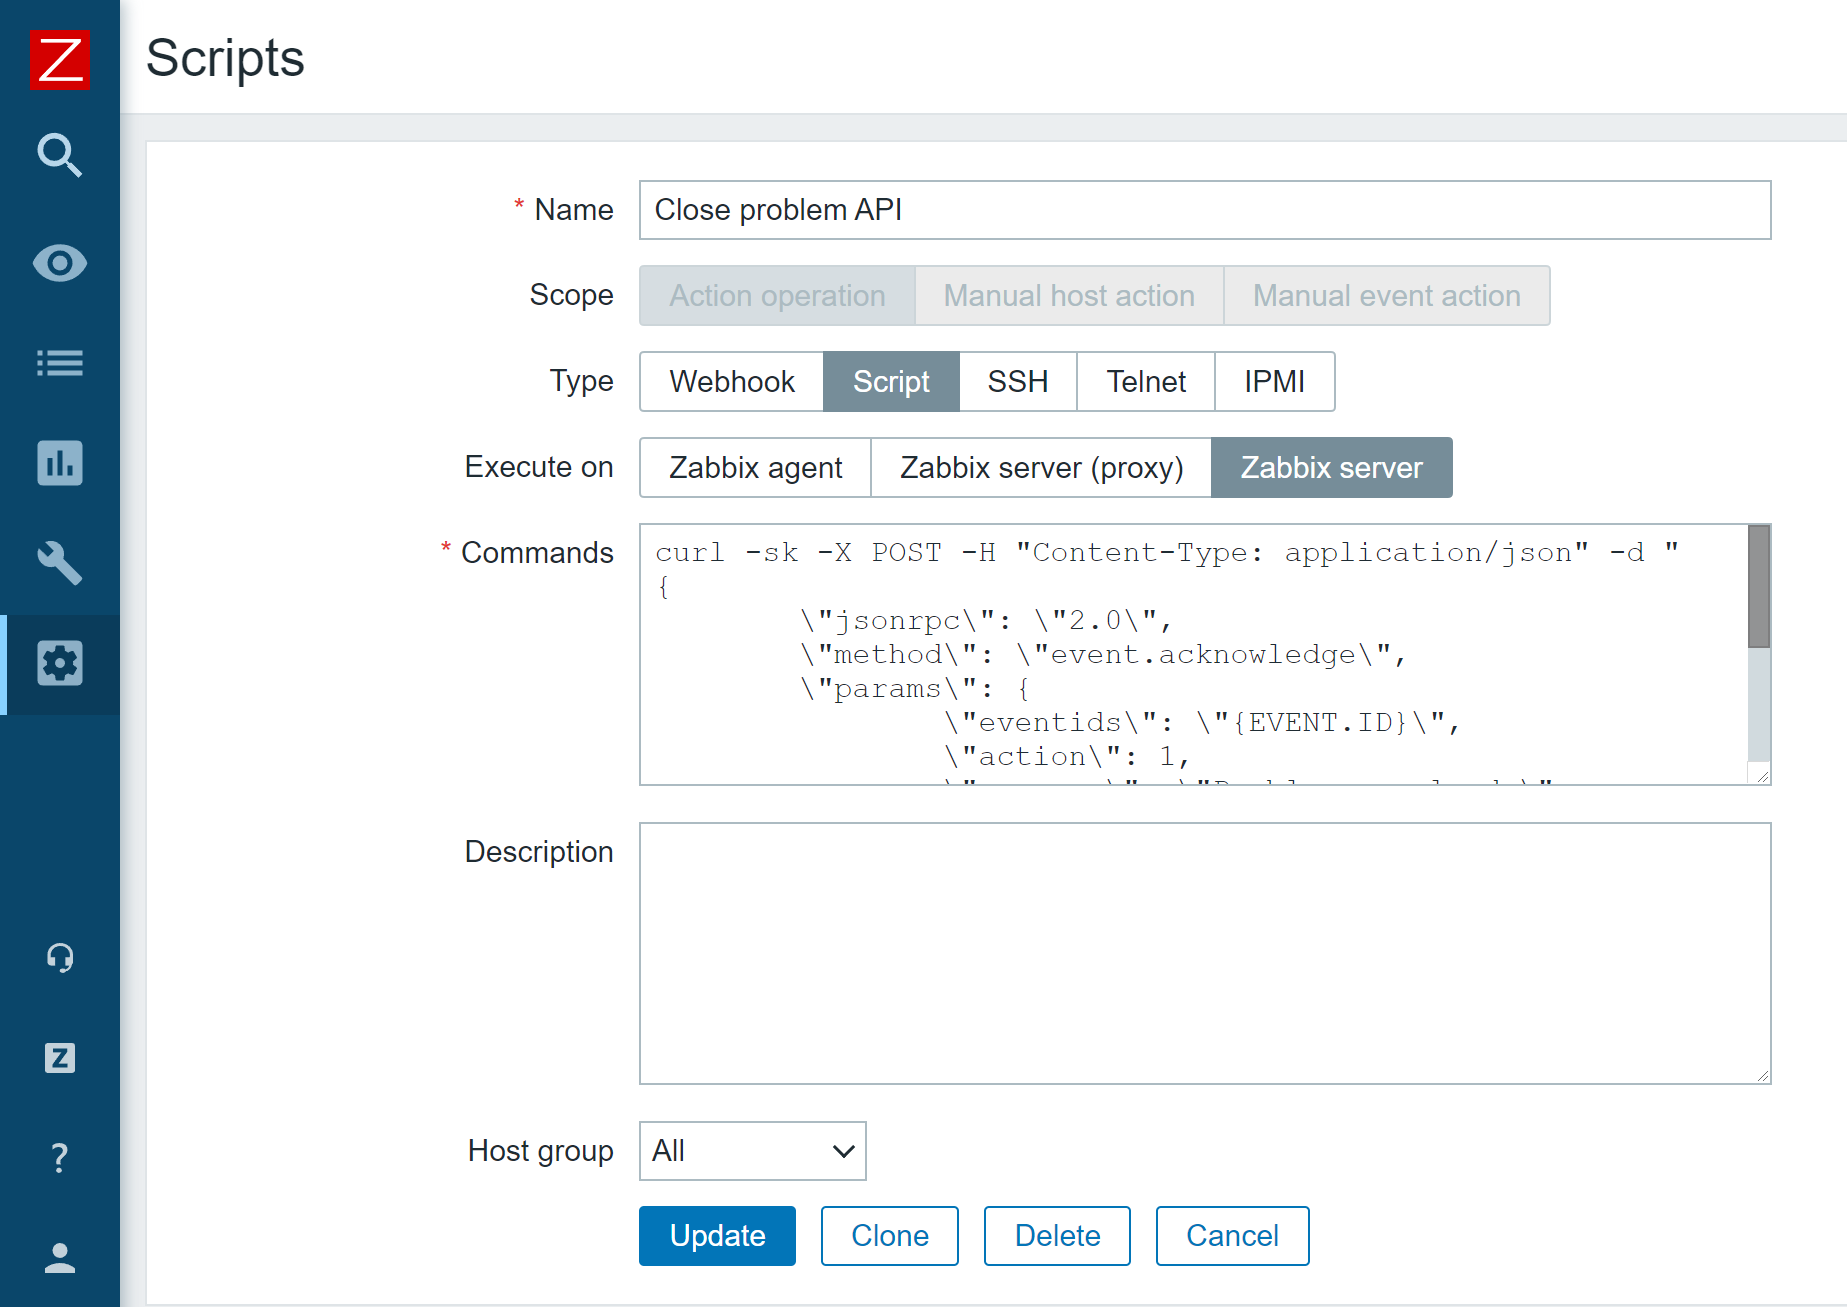
All I have to do is create an Action operation script containing my API call and pass it to an action operation.

Action operation script that invokes Zabbix event.acknowledge API method

curl -sk -X POST -H "Content-Type: application/json" -d "
{
\"jsonrpc\": \"2.0\",
\"method\": \"event.acknowledge\",
\"params\": {
\"eventids\": \"{EVENT.ID}\",
\"action\": 1,
\"message\": \"Problem resolved.\"
},
\"auth\": \"<Place your authentication token here>",
\"id\": 2
}" <Place your Zabbix API endpoint URL here>

Problem remediation script example

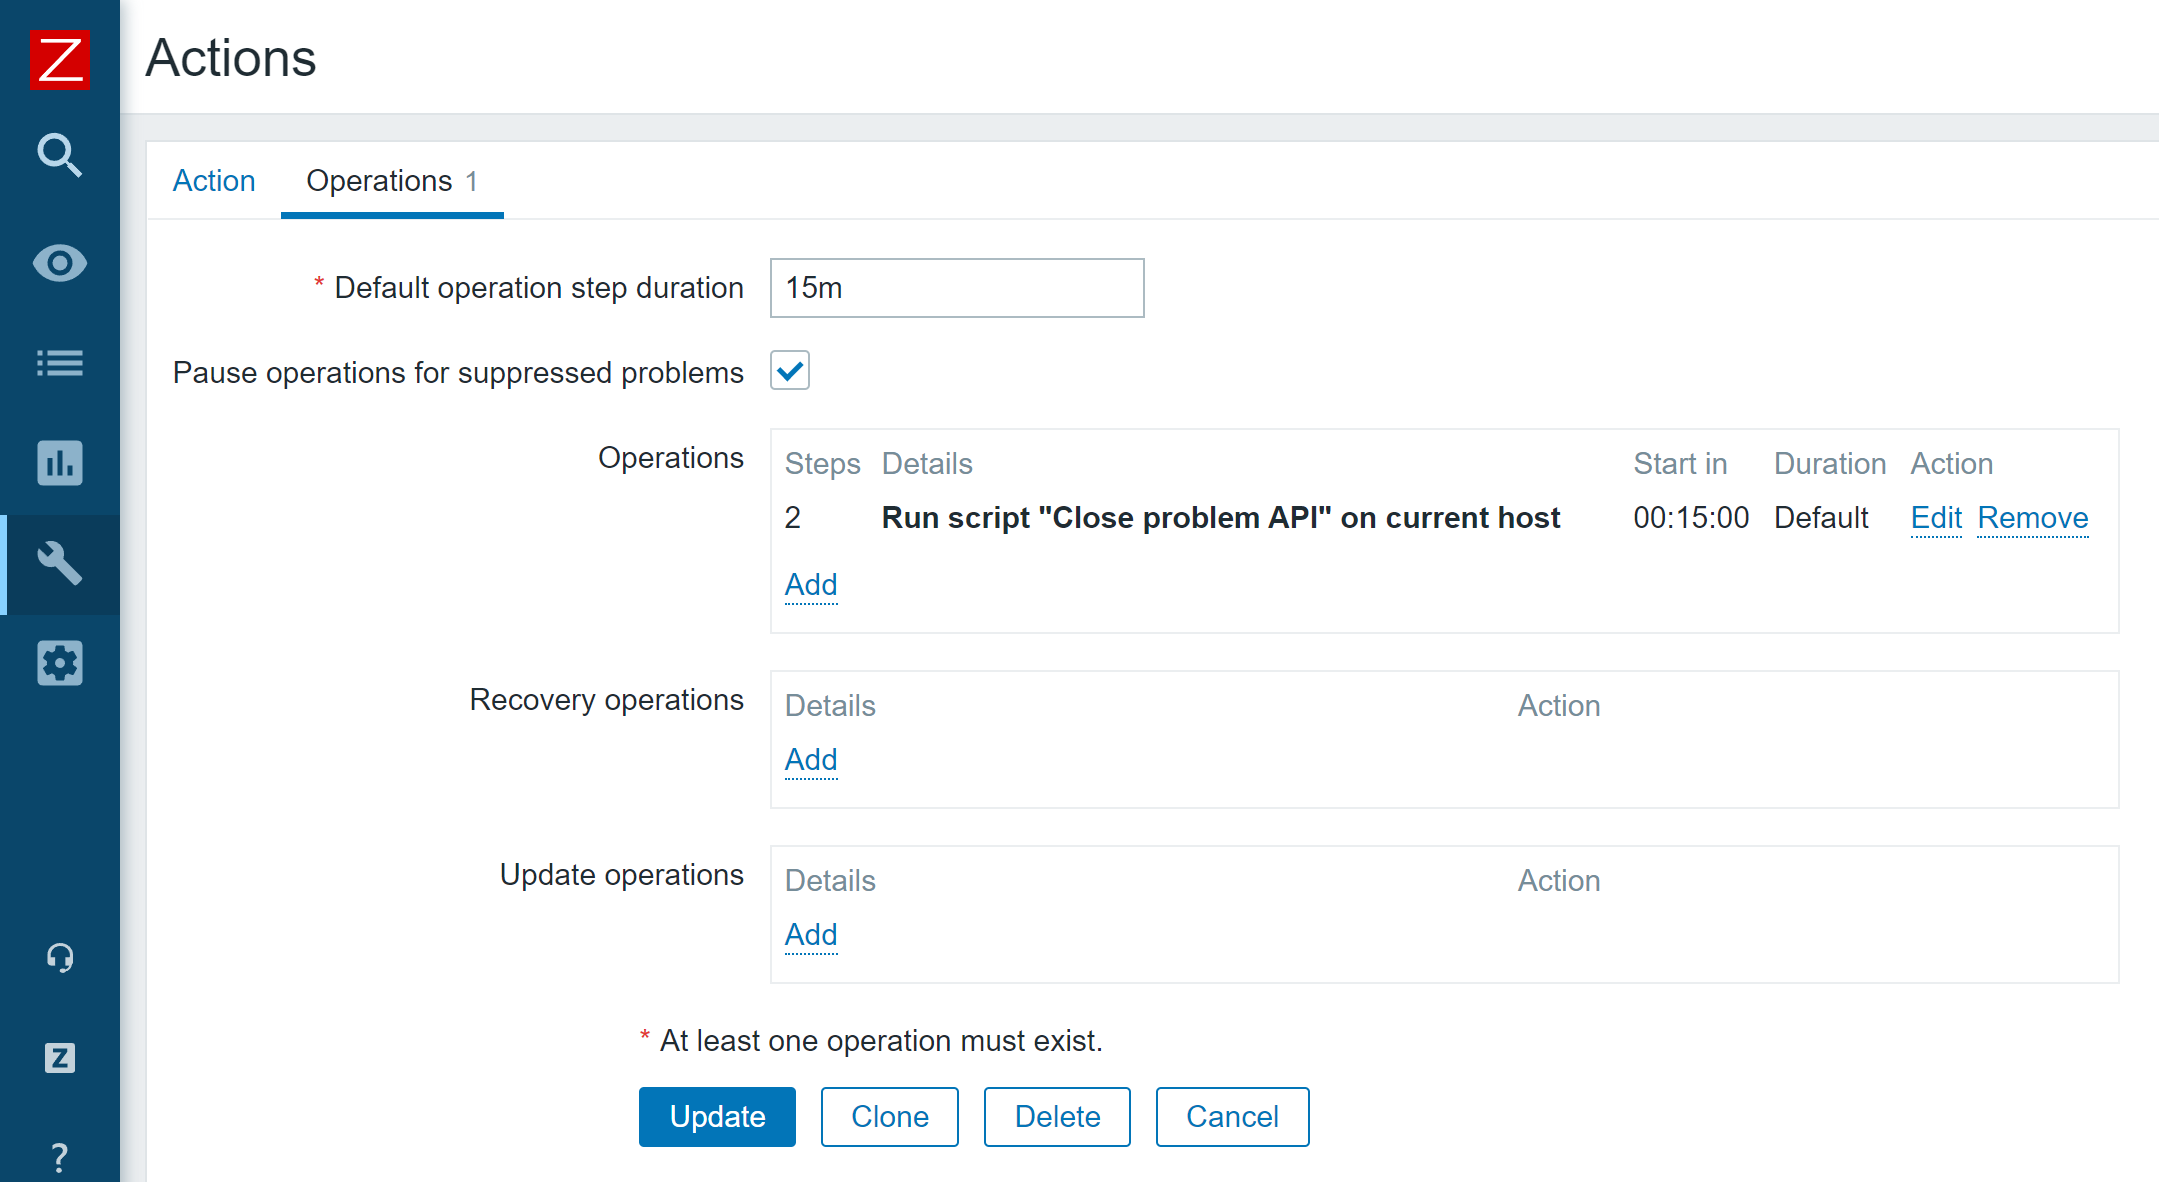
Now my problems will get closed automatically after the time period which I have defined in my action.

Action operation which runs our event.acknowledge Zabbix API script

These are but a few examples that we can now achieve by using API tokens. A lot of information can be obtained and filtered in a unique way via Zabbix API, thus providing you with a granular analysis of your monitored environment. If you have recently upgraded to Zabbix 5.4 or plan to upgrade to Zabbix 6.0 LTS in the future, I would recommend implementing named Zabbix API tokens to simplify your day-to-day workflow and consider the possibilities that this new feature opens up for you.

If you have any questions or if you wish to share your particular use case for data collection or task automation with Zabbix API – feel free to share them in the comments section below!

Combining preprocessing with storing only trend data for high-frequency monitoring

Post Syndicated from Arturs Lontons original https://blog.zabbix.com/combining-preprocessing-with-storing-only-trend-data-for-high-frequency-monitoring/16568/

There are many design choices to consider when we build our monitoring environment for high-frequency monitoring. How to minimize performance impact? What are the data retention policies with storage space in mind? What are the available out-of-the-box features to solve these potential problems?
In this blog post, we will discuss when you should use preprocessing and when it is better to use the “Do not keep history” option for your metrics, and what are the pros and cons for both of these approaches.

Throttling and other preprocessing steps

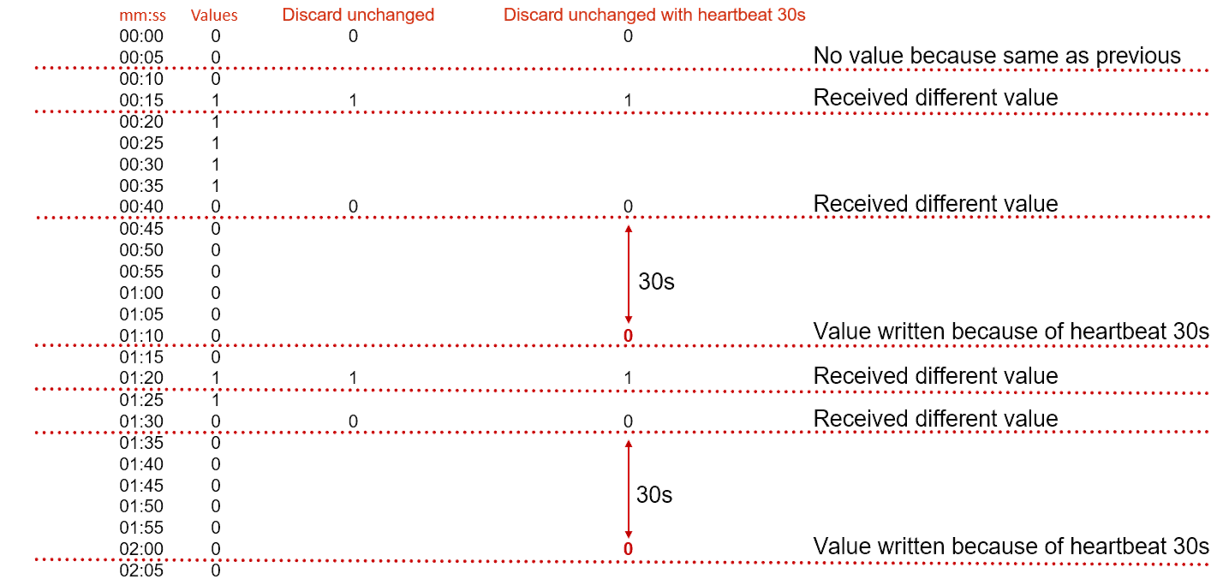
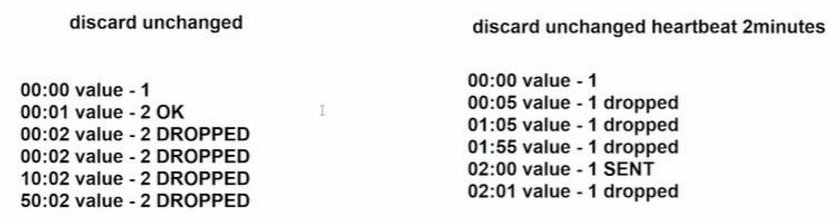
We’ve discussed throttling previously as the go-to approach for high-frequency monitoring. Indeed, with throttling, you can discard repeated values and do so with a heartbeat. This is extremely useful with metrics that come as discreet values – services states, network port statuses, and so on.
Example of throttling with and without heartbeat
In addition, since starting from Zabbix 4.2 all preprocessing is also performed by Zabbix proxies. This means we can discard the repeated values before they reach the Zabbix server. This can help us both with the performance (fewer metrics to insert in the Zabbix server DB) and reduce the DB size (Fewer metrics stored in the DB. This also helps with improving overall Zabbix performance)
There are a few caveats with this approach – since metrics get discarded before they reach the Zabbix server, the triggers will not react on these metrics (This is where having a heartbeat is useful) and, since trends are calculated by Zabbix server based on the received history data, there could be a lack of trend information for these metrics. Keep in mind that this applies not only to throttling preprocessing rules – any preprocessing can be done on the proxy and any preprocessing rules can be used to transform your data.

Understanding “Do not keep history” option

The behavior of “Do not keep history” which we can define when configuring an item is a bit different though. If we collect an item by a Proxy and configure the item with “Do not keep history”, the history won’t always get discarded! There are a couple of reasons for this.
  • First off, let’s not forget that some of our values can populate host inventory! If the particular item is configured to populate an inventory field – it will be forwarded to the Zabbix server, but it will not get stored in the history tables.
  • If the item does not populate an inventory field – the text data such as character, log and text will indeed get discarded before reaching the Zabbix server, but Numeric values – both float and integer, will get forwarded to the server. The reason for that is deriving trend information from the numeric values. Mind that the numeric data will still not get stored in the history tables, only trends will be available for these items.

Note: This behavior has been properly implemented starting from Zabbix 5.2. See ZBX-17548

Setting the “Do not keep history” option for an item

Using trend functions with high-frequency monitoring

With the specifics of “Do not keep history” in mind, we should now recall that starting from Zabbix 5.2 we have trend functions available at our disposal!
History functions such as trendavg, trendcount, trendmax, trendmin, trendsum allow us to perform different kinds of trend calculations – from counting the number of trend values to retrieving min/max/avg trend values for a time period.
This means, that if we require only the metric trend for specific time periods (hours, days, weeks, etc) we can use these trend functions together with “Do not keep history” option, thus discarding unnecessary data and improving our Zabbix server performance!
There are two approaches two using trend functions:
  • If you wish to collect and display the trend data, you need to create the item which will collect the metrics (say, a net.if.in Agent item for collecting incoming network traffic) and then create a separate calculated item that uses the trend function to calculate the avg/min/max value for the trend over a time period. The original item can then have “Do not keep history” option selected for it.

trendavg item for calculating hourly trends from the net.if.in[ifHCInOctets.5] item


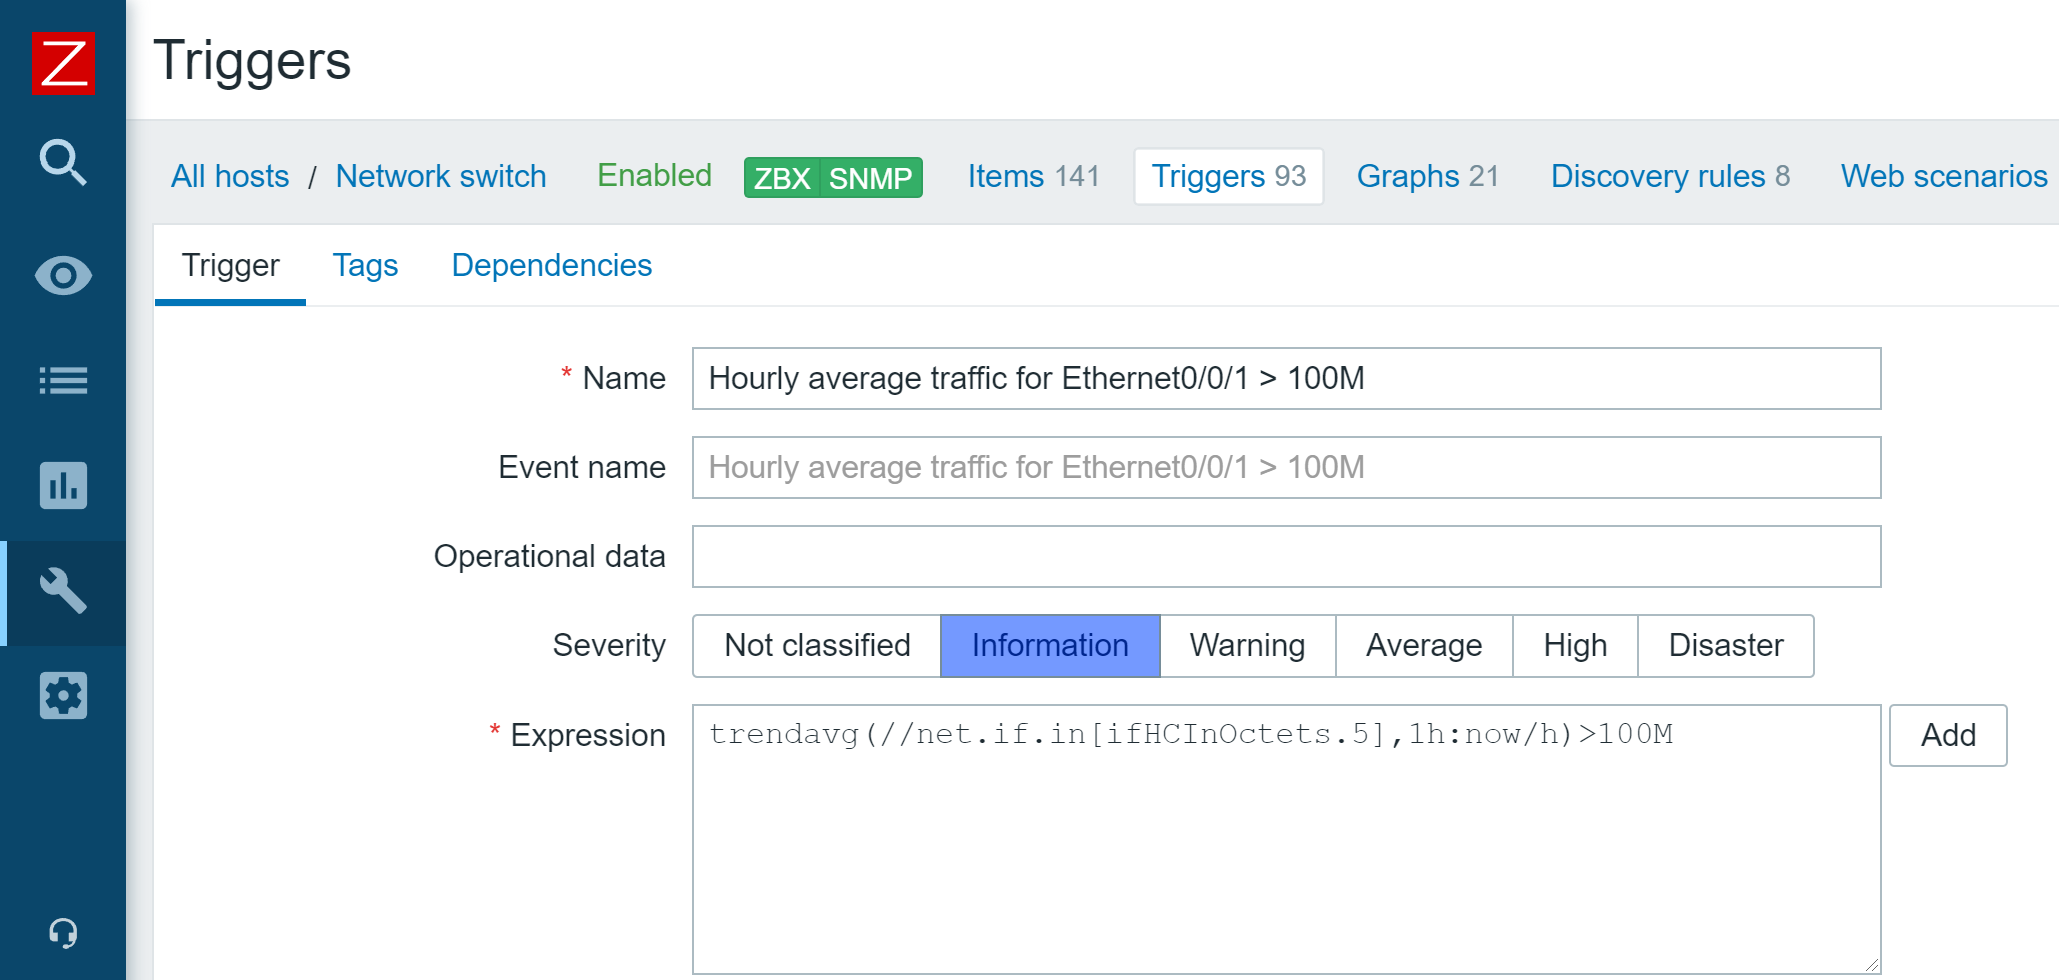
  • If you wish to simply define triggers and react on long-term trends and are not required to collect the trend values, then we can skip the creation of the calculated item and simply use the trend function on the original item in the trigger.

This trigger fires if the hourly average trend value exceeds 100M.
Note: In this case only the original item is required.

By combining these approaches in our environment – using preprocessing when we wish to discard or transform the data and also implementing opting out of storing the history data, whenever this is appropriate, we can minimize the performance impact on our Zabbix instance. Add a layer of distributed Zabbix proxies on top of this and you can truly achieve a large, scalable Zabbix infrastructure optimized for high-frequency ingestion and processing of your data.

Keeping your Zabbix templates up to date

Post Syndicated from Arturs Lontons original https://blog.zabbix.com/keeping-your-zabbix-templates-up-to-date/16412/

Have you recently updated your Zabbix environment but are still wondering – why haven’t the templates been updated? Where can I obtain the latest official Zabbix templates, and how should I update them? In this blog post, we will discuss why it is vital to keep your templates up to date and how we the template update process looks like.

Updating your templates

“Will updating Zabbix also update my templates?” is a question that I receive quite often. The answer to that question is – no changes are made to your templates whenever you update your Zabbix instance – be it a minor or a major update. The reasoning behind that is quite simple – we always recommend that you tune the out-of-the-box templates as per your particular requirements. That may consist of changing update intervals, disabling items/triggers, or even changing the existing trigger expressions or adding whole new entities to the template.

This is where the current behavior with template updates starts to make more sense. If Zabbix were to automatically update your templates, there could be a chance of overwriting your custom changes and could potentially disrupt the monitoring of your environment. That is something that we definitely wish to avoid.

The question still stands – Then how am I supposed to update my templates?

The answer – you can find the latest official Zabbix templates on our official git page – https://git.zabbix.com/

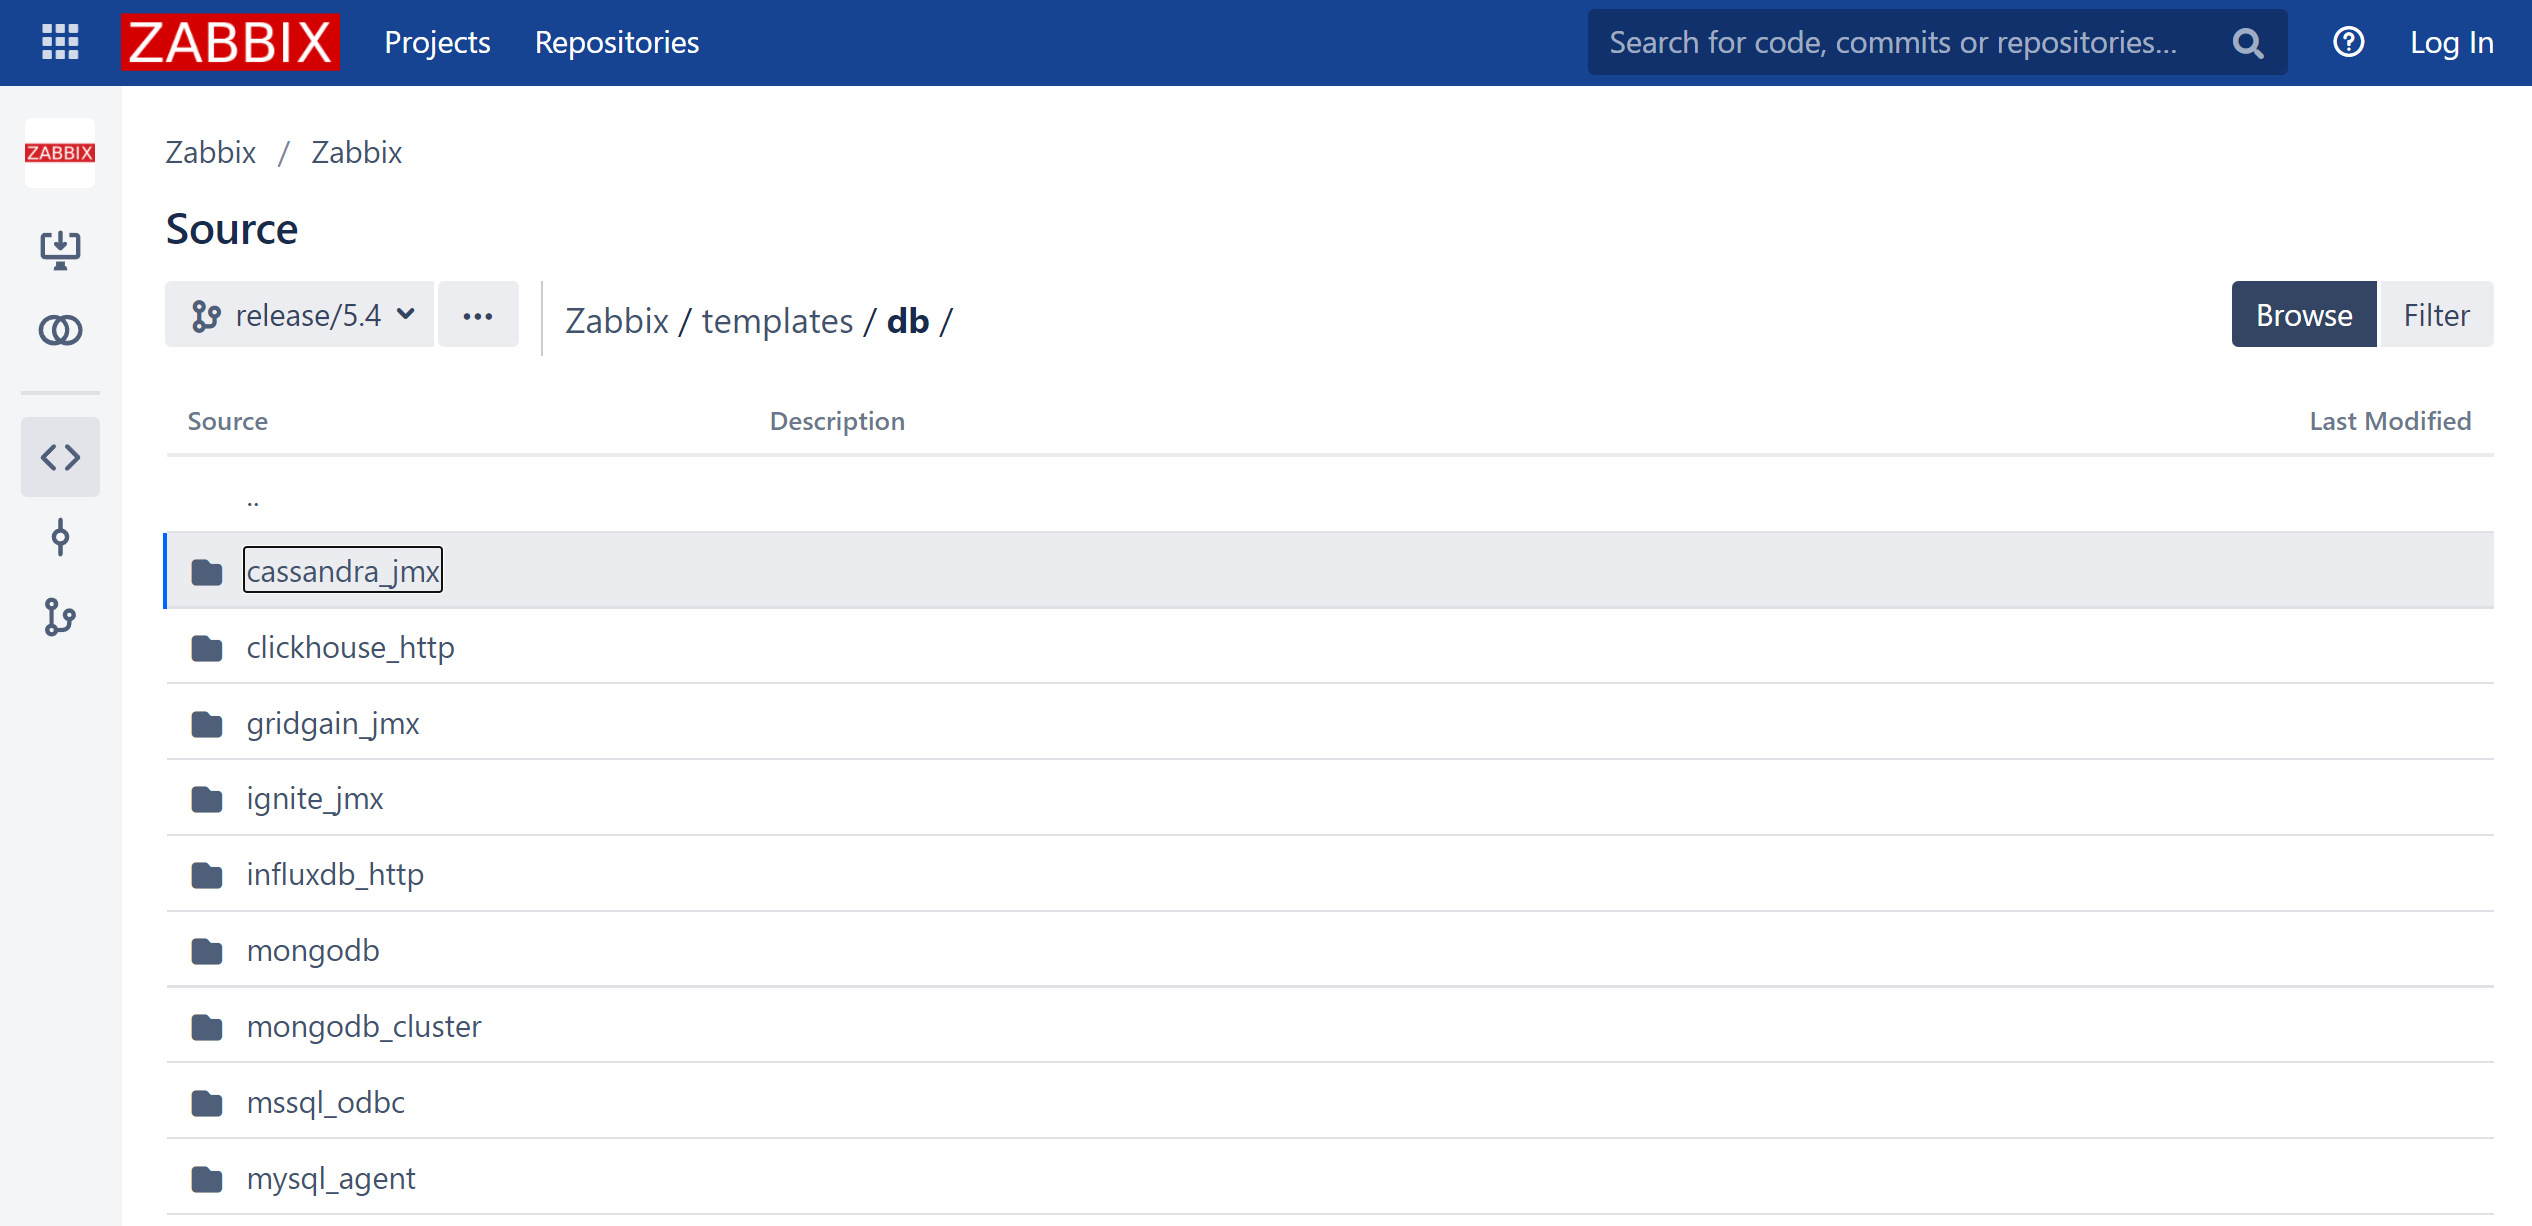
First, navigate to the Zabbix repository and open the Templates folder. Then, select the release branch that matches your Zabbix instance version. Here you can find all of our official templates and also the official media types under the media folder. All you have to do now is open the template up and download the raw template file.

Zabbix 5.4 release git templates/db folder

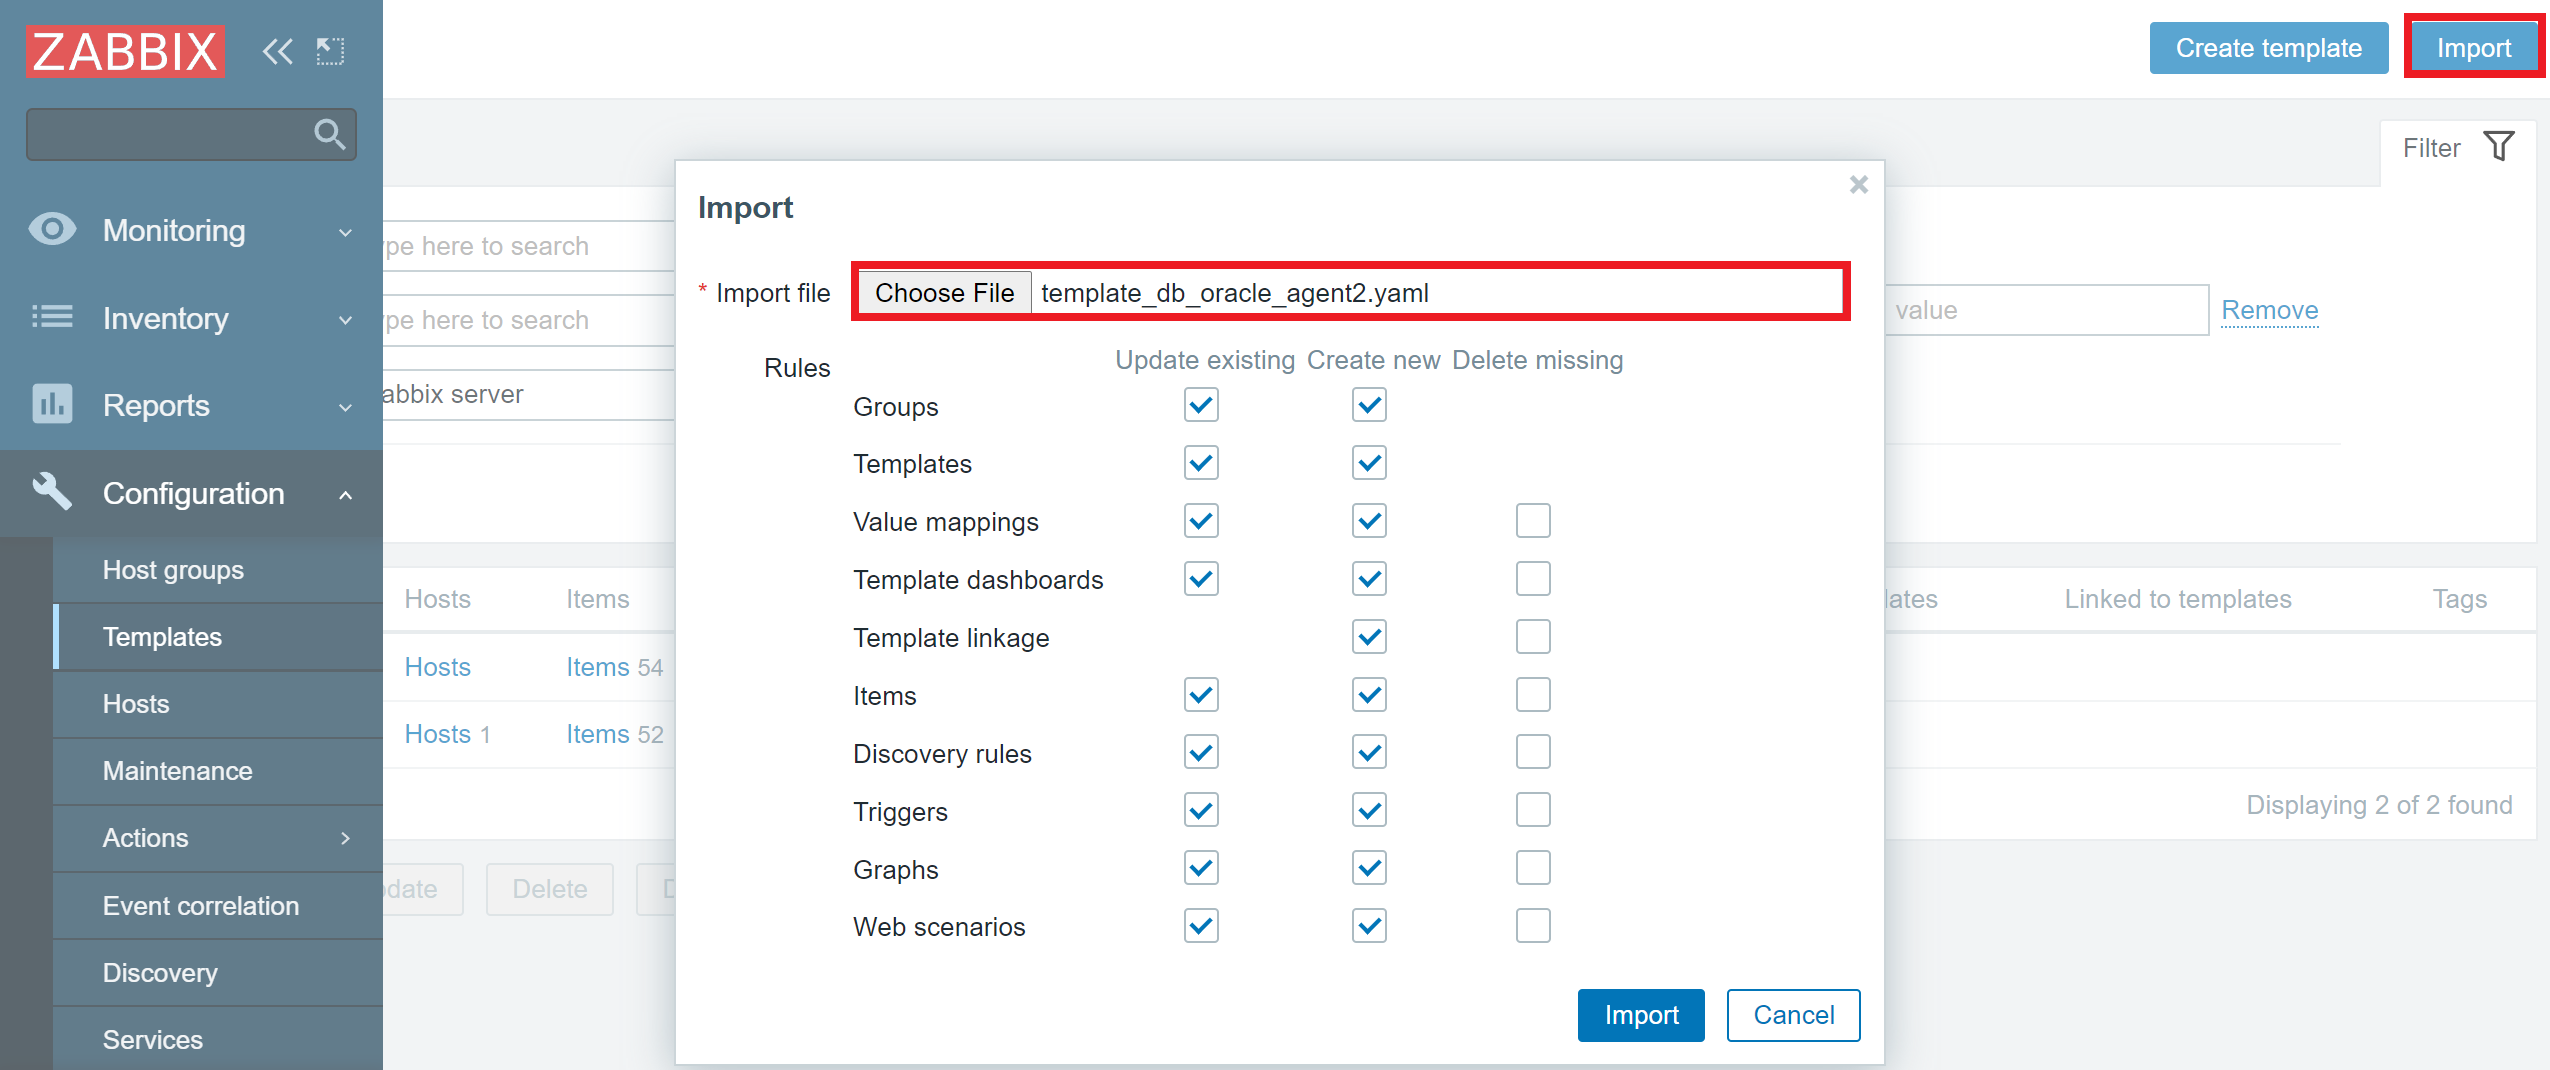
Once that is done, we can import the template into our Zabbix environment

Template template_db_oracle_agent2 import

Don’t forget to back up your existing templates, especially if you have made some custom changes to them! Ideally – add a prefix to their names, so the new and old templates can live side by side, and you can then manually copy over the changes from the latest official template to your custom template.

The benefits of keeping templates up to date

But what is the point of updating your templates – what do you get out of it? Well, that varies on the specific fixes or improvements we make to the particular template over time. Sometimes the updated template will provide improved trigger expressions or preprocessing logic. Other times the updated template will provide extra value to your monitoring with completely new items and triggers. In the case of Webhook media types – the updates usually contain fixes or improvements for some particular use cases, for example – fixing a compatibility issue for a specific OS.

You can always track these changes either in the release notes of a particular Zabbix version or by looking up a specific bug or a feature request in our bug tracker – https://support.zabbix.com

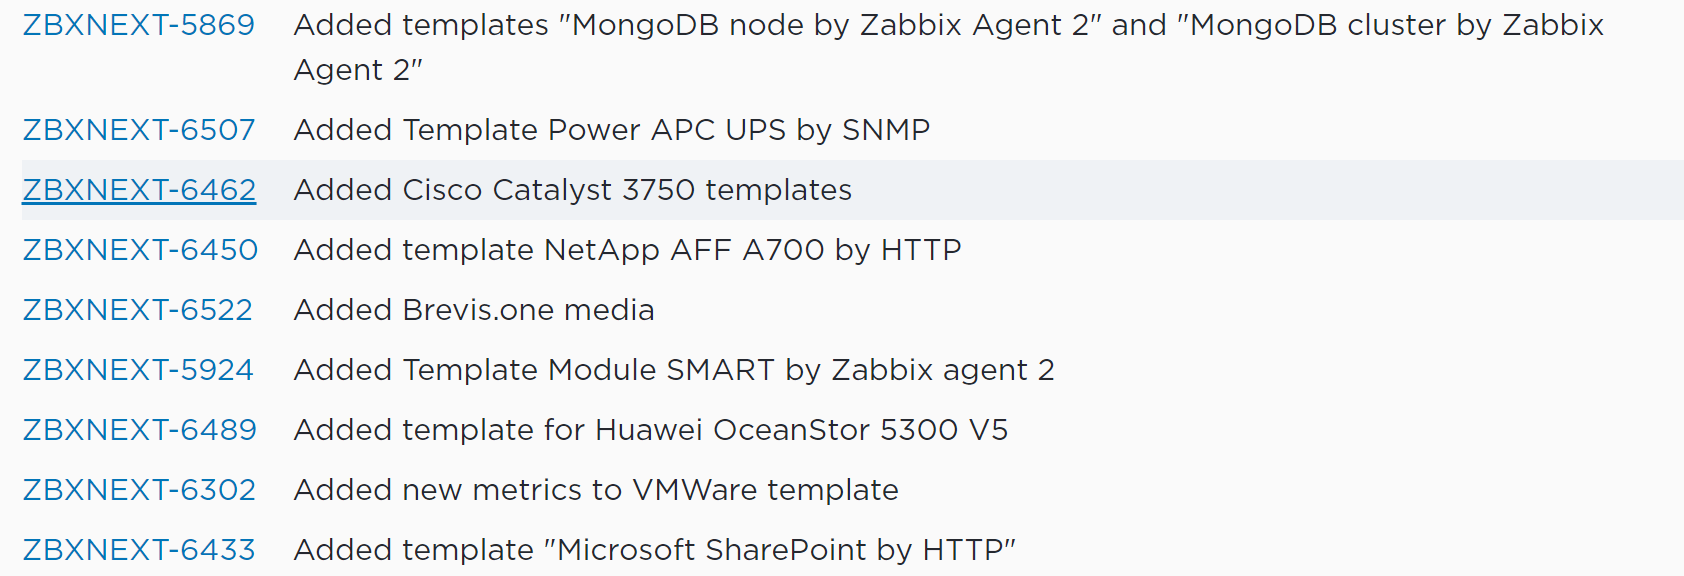
Some of the template changes in Zabbix 5.4 major update

Zabbix self-monitoring templates

Another key aspect of why it’s important to keep your templates up to date is so you can implement the changes made to the Zabbix self-monitoring templates. For example, if we compare Zabbix 5.0 to Zabbix 5.4, there are multiple new Zabbix processes and caches added to Zabbix 5.4, such as report writer/manager process, availability manager process, trend function caches, and other new components.

Zabbix server health template version 5.0 and 5.4 difference in the number of entities

So, if you update from Zabbix 5.0 to 5.4 (or Zabbix 6.0 if you’re sticking with LTS versions), you WILL NOT be monitoring these processes and caches if you don’t update your Zabbix server and Zabbix proxy templates to the current Zabbix versions. This means that you will be completely unaware of any potential performance issues related to these processes or caches.

Tracking template changes

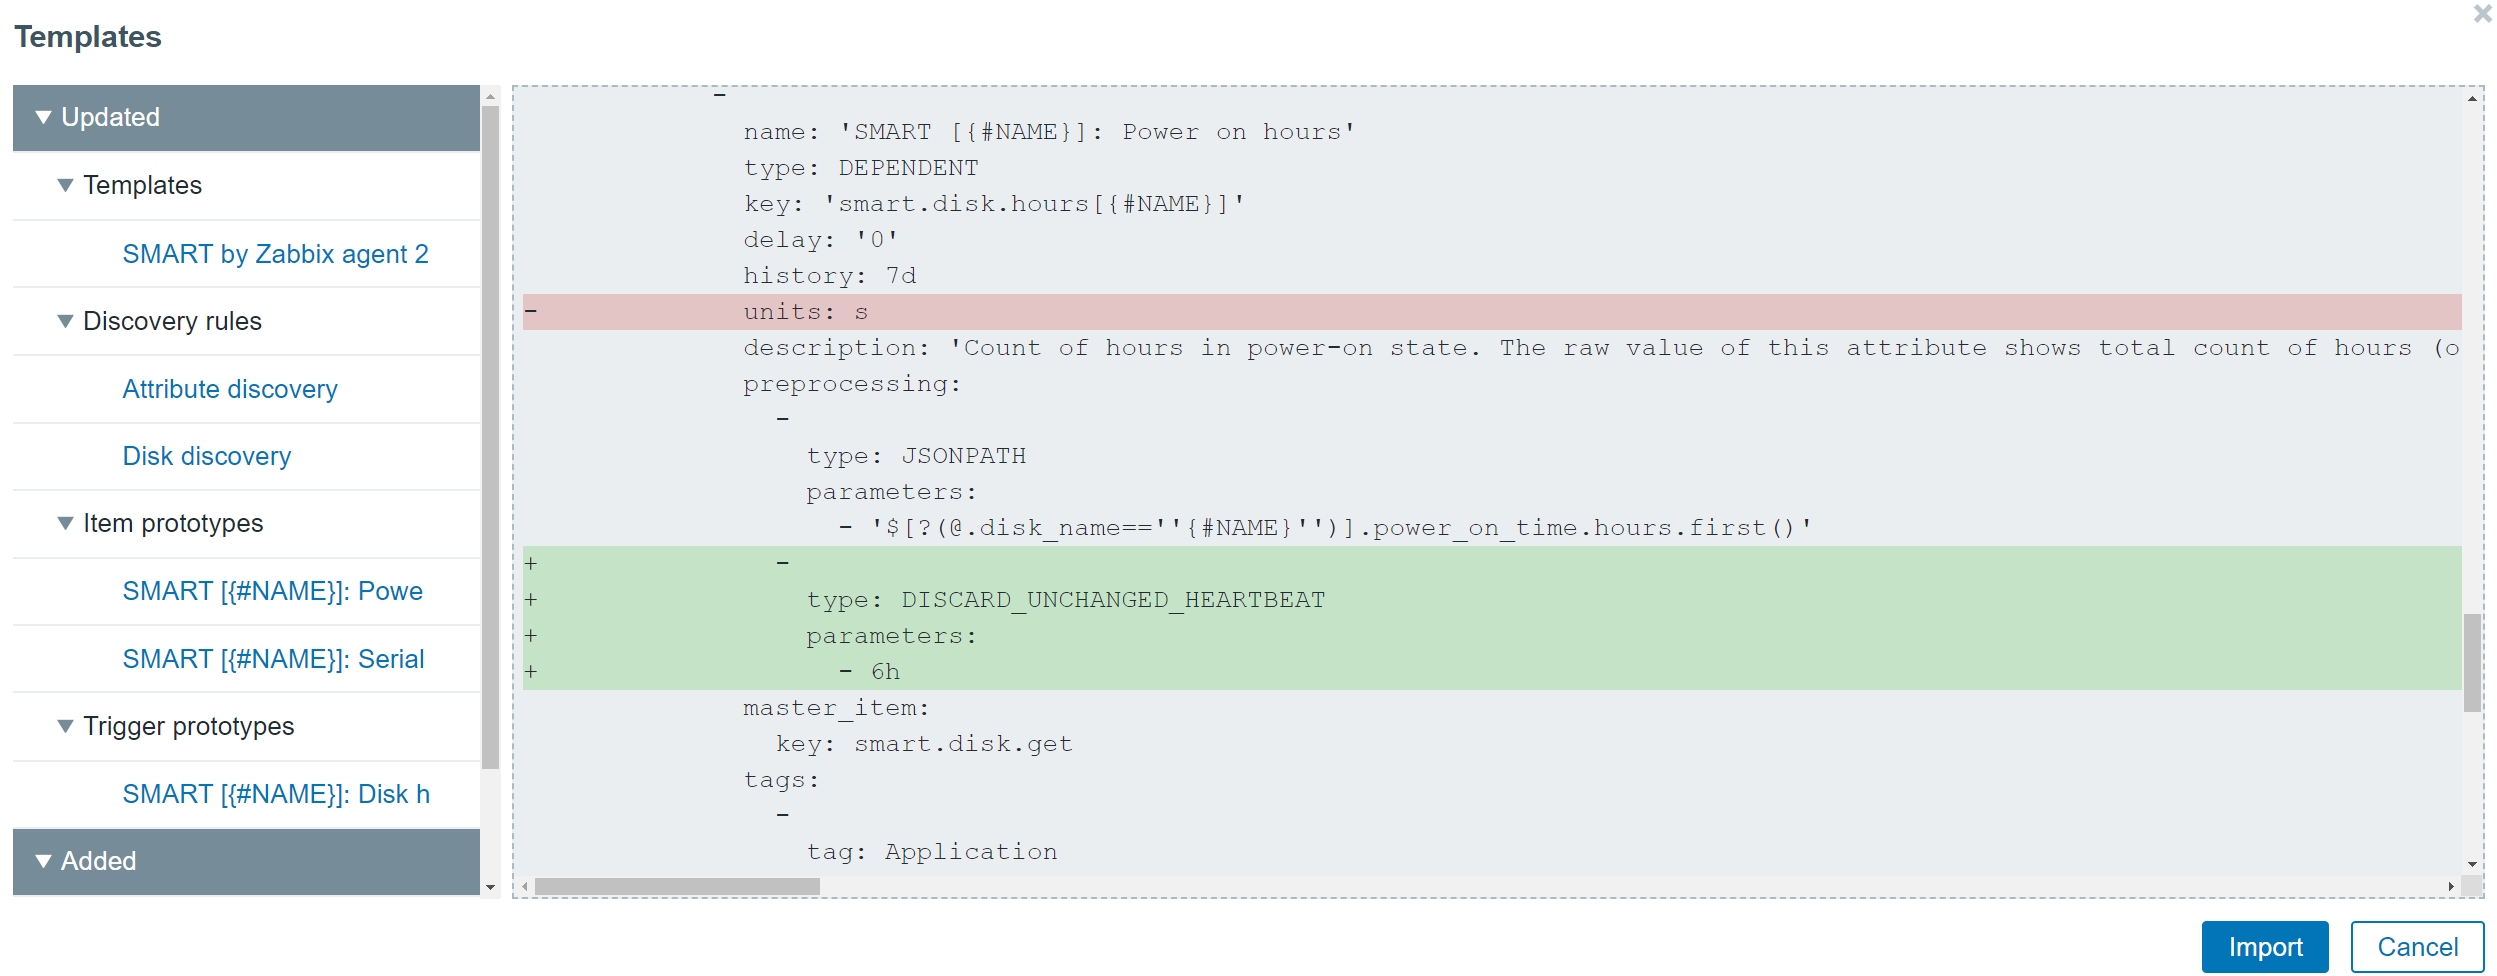
With Zabbix 5.4 and later, you will notice some great improvements to the template import process. If you’re wondering what has changed when comparing an older template version with a newer one, you will now be able to see the changes during the import process. The added and removed elements will be highlighted in red or green accordingly.

Preview of the changes made during the template import process

How often should you update the templates? Ideally, you would follow the Zabbix update release notes and take note of any changes made to the templates that are of use in your environment. At the very least – definitely check for changes in the self-monitoring templates when moving to a newer major version of Zabbix. Otherwise, you risk losing track of potential issues in your Zabbix environment.

Now that you know the answer to the question “How can I update my Zabbix templates?” try and think back to when you last updated your Zabbix instance to a new version – did you also check the official templates for updates? If not, then don’t hesitate and visit https://git.zabbix.com/ to find the latest templates for your Zabbix version. Chances are that you will be pleasantly surprised with a set of new and updated templates for your monitoring endpoints and new webhook media types to help you integrate Zabbix with your existing systems.

Copy large datasets from Google Cloud Storage to Amazon S3 using Amazon EMR

Post Syndicated from Andrew Lee original https://aws.amazon.com/blogs/big-data/copy-large-datasets-from-google-cloud-storage-to-amazon-s3-using-amazon-emr/

Many organizations have data sitting in various data sources in a variety of formats. Even though data is a critical component of decision-making, for many organizations this data is spread across multiple public clouds. Organizations are looking for tools that make it easy and cost-effective to copy large datasets across cloud vendors. With Amazon EMR and the Hadoop file copy tools Apache DistCp and S3DistCp, we can migrate large datasets from Google Cloud Storage (GCS) to Amazon Simple Storage Service (Amazon S3).

Apache DistCp is an open-source tool for Hadoop clusters that you can use to perform data transfers and inter-cluster or intra-cluster file transfers. AWS provides an extension of that tool called S3DistCp, which is optimized to work with Amazon S3. Both these tools use Hadoop MapReduce to parallelize the copy of files and directories in a distributed manner. Data migration between GCS and Amazon S3 is possible by utilizing Hadoop’s native support for S3 object storage and using a Google-provided Hadoop connector for GCS. This post demonstrates how to configure an EMR cluster for DistCp and S3DistCP, goes over the settings and parameters for both tools, performs a copy of a test 9.4 TB dataset, and compares the performance of the copy.

Prerequisites

The following are the prerequisites for configuring the EMR cluster:

  1. Install the AWS Command Line Interface (AWS CLI) on your computer or server. For instructions, see Installing, updating, and uninstalling the AWS CLI.
  2. Create an Amazon Elastic Compute Cloud (Amazon EC2) key pair for SSH access to your EMR nodes. For instructions, see Create a key pair using Amazon EC2.
  3. Create an S3 bucket to store the configuration files, bootstrap shell script, and the GCS connector JAR file. Make sure that you create a bucket in the same Region as where you plan to launch your EMR cluster.
  4. Create a shell script (sh) to copy the GCS connector JAR file and the Google Cloud Platform (GCP) credentials to the EMR cluster’s local storage during the bootstrapping phase. Upload the shell script to your bucket location: s3://<S3 BUCKET>/copygcsjar.sh. The following is an example shell script:
#!/bin/bash
sudo aws s3 cp s3://<S3 BUCKET>/gcs-connector-hadoop3-latest.jar /tmp/gcs-connector-hadoop3-latest.jar
sudo aws s3 cp s3://<S3 BUCKET>/gcs.json /tmp/gcs.json
  1. Download the GCS connector JAR file for Hadoop 3.x (if using a different version, you need to find the JAR file for your version) to allow reading of files from GCS.
  2. Upload the file to s3://<S3 BUCKET>/gcs-connector-hadoop3-latest.jar.
  3. Create GCP credentials for a service account that has access to the source GCS bucket. The credentials should be named json and be in JSON format.
  4. Upload the key to s3://<S3 BUCKET>/gcs.json. The following is a sample key:
{
   "type":"service_account",
   "project_id":"project-id",
   "private_key_id":"key-id",
   "private_key":"-----BEGIN PRIVATE KEY-----\nprivate-key\n-----END PRIVATE KEY-----\n",
   "client_email":"service-account-email",
   "client_id":"client-id",
   "auth_uri":"https://accounts.google.com/o/oauth2/auth",
   "token_uri":"https://accounts.google.com/o/oauth2/token",
   "auth_provider_x509_cert_url":"https://www.googleapis.com/oauth2/v1/certs",
   "client_x509_cert_url":"https://www.googleapis.com/robot/v1/metadata/x509/service-account-email"
}
  1. Create a JSON file named gcsconfiguration.json to enable the GCS connector in Amazon EMR. Make sure the file is in the same directory as where you plan to run your AWS CLI commands. The following is an example configuration file:
[
   {
      "Classification":"core-site",
      "Properties":{
         "fs.AbstractFileSystem.gs.impl":"com.google.cloud.hadoop.fs.gcs.GoogleHadoopFS",
         "google.cloud.auth.service.account.enable":"true",
         "google.cloud.auth.service.account.json.keyfile":"/tmp/gcs.json",
         "fs.gs.status.parallel.enable":"true"
      }
   },
   {
      "Classification":"hadoop-env",
      "Configurations":[
         {
            "Classification":"export",
            "Properties":{
               "HADOOP_USER_CLASSPATH_FIRST":"true",
               "HADOOP_CLASSPATH":"$HADOOP_CLASSPATH:/tmp/gcs-connector-hadoop3-latest.jar"
            }
         }
      ]
   },
   {
      "Classification":"mapred-site",
      "Properties":{
         "mapreduce.application.classpath":"/tmp/gcs-connector-hadoop3-latest.jar"
      }
   }
]

Launch and configure Amazon EMR

For our test dataset, we start with a basic cluster consisting of one primary node and four core nodes for a total of five c5n.xlarge instances. You should iterate on your copy workload by adding more core nodes and check on your copy job timings in order to determine the proper cluster sizing for your dataset.

  1. We use the AWS CLI to launch and configure our EMR cluster (see the following basic create-cluster command):
aws emr create-cluster \
--name "My First EMR Cluster" \
--release-label emr-6.3.0 \
--applications Name=Hadoop \
--ec2-attributes KeyName=myEMRKeyPairName \
--instance-type c5n.xlarge \
--instance-count 5 \
--use-default-roles

  1. Create a custom bootstrap action to be performed at cluster creation to copy the GCS connector JAR file and GCP credentials to the EMR cluster’s local storage. You can add the following parameter to the create-cluster command to configure your custom bootstrap action:
--bootstrap-actions Path="s3://<S3 BUCKET>/copygcsjar.sh"

Refer to Create bootstrap actions to install additional software for more details about this step.

  1. To override the default configurations for your cluster, you need to supply a configuration object. You can add the following parameter to the create-cluster command to specify the configuration object:
--configurations file://gcsconfiguration.json

Refer to Configure applications when you create a cluster for more details on how to supply this object when creating the cluster.

Putting it all together, the following code is an example of a command to launch and configure an EMR cluster that can perform migrations from GCS to Amazon S3:

aws emr create-cluster \
--name "My First EMR Cluster" \
--release-label emr-6.3.0 \
--applications Name=Hadoop \
--ec2-attributes KeyName=myEMRKeyPairName \
--instance-type c5n.xlarge \
--instance-count 5 \
--use-default-roles \
--bootstrap-actions Path="s3:///copygcsjar.sh" \
--configurations file://gcsconfiguration.json

Submit S3DistCp or DistCp as a step to an EMR cluster

You can run the S3DistCp or DistCp tool in several ways.

When the cluster is up and running, you can SSH to the primary node and run the command in a terminal window, as mentioned in this post.

You can also start the job as part of the cluster launch. After the job finishes, the cluster can either continue running or be stopped. You can do this by submitting a step directly via the AWS Management Console when creating a cluster. Provide the following details:

  • Step type – Custom JAR
  • NameS3DistCp Step
  • JAR locationcommand-runner.jar
  • Argumentss3-dist-cp --src=gs://<GCS BUCKET>/ --dest=s3://<S3 BUCKET>/
  • Action of failure – Continue

We can always submit a new step to the existing cluster. The syntax here is slightly different than in previous examples. We separate arguments by commas. In the case of a complex pattern, we shield the whole step option with single quotation marks:

aws emr add-steps \
--cluster-id j-ABC123456789Z \
--steps 'Name=LoadData,Jar=command-runner.jar,ActionOnFailure=CONTINUE,Type=CUSTOM_JAR,Args=s3-dist-cp,--src=gs://<GCS BUCKET>/, --dest=s3://<S3 BUCKET>/'

DistCp settings and parameters

In this section, we optimize the cluster copy throughput by adjusting the number of maps or reducers and other related settings.

Memory settings

We use the following memory settings:

-Dmapreduce.map.memory.mb=1536
-Dyarn.app.mapreduce.am.resource.mb=1536

Both parameters determine the size of the map containers that are used to parallelize the transfer. Setting this value in line with the cluster resources and the number of maps defined is key to ensuring efficient memory usage. You can calculate the number of launched containers by using the following formula:

Total number of launched containers = Total memory of cluster / Map container memory

Dynamic strategy settings

We use the following dynamic strategy settings:

-Ddistcp.dynamic.max.chunks.tolerable=4000
-Ddistcp.dynamic.split.ratio=3 -strategy dynamic

The dynamic strategy settings determine how DistCp splits up the copy task into dynamic chunk files. Each of these chunks is a subset of the source file listing. The map containers then draw from this pool of chunks. If a container finishes early, it can get another unit of work. This makes sure that containers finish the copy job faster and perform more work than slower containers. The two tunable settings are split ratio and max chunks tolerable. The split ratio determines how many chunks are created from the number of maps. The max chunks tolerable setting determines the maximum number of chunks to allow. The setting is determined by the ratio and the number of maps defined:

Number of chunks = Split ratio * Number of maps
Max chunks tolerable must be > Number of chunks

Map settings

We use the following map setting:

-m 640

This determines the number of map containers to launch.

List status settings

We use the following list status setting:

-numListstatusThreads 15

This determines the number of threads to perform the file listing of the source GCS bucket.

Sample command

The following is a sample command when running with 96 core or task nodes in the EMR cluster:

hadoop distcp
-Dmapreduce.map.memory.mb=1536 \
-Dyarn.app.mapreduce.am.resource.mb=1536 \
-Ddistcp.dynamic.max.chunks.tolerable=4000 \
-Ddistcp.dynamic.split.ratio=3 \
-strategy dynamic \
-update \
-m 640 \
-numListstatusThreads 15 \
gs://<GCS BUCKET>/ s3://<S3 BUCKET>/

S3DistCp settings and parameters

When running large copies from GCS using S3DistCP, make sure you have the parameter fs.gs.status.parallel.enable (also shown earlier in the sample Amazon EMR application configuration object) set in core-site.xml. This helps parallelize getFileStatus and listStatus methods to reduce latency associated with file listing. You can also adjust the number of reducers to maximize your cluster utilization. The following is a sample command when running with 24 core or task nodes in the EMR cluster:

s3-dist-cp -Dmapreduce.job.reduces=48 --src=gs://<GCS BUCKET>/--dest=s3://<S3 BUCKET>/

Testing and performance

To test the performance of DistCp with S3DistCp, we used a test dataset of 9.4 TB (157,000 files) stored in a multi-Region GCS bucket. Both the EMR cluster and S3 bucket were located in us-west-2. The number of core nodes that we used in our testing varied from 24–120.

The following are the results of the DistCp test:

  • Workload – 9.4 TB and 157,098 files
  • Instance types – 1x c5n.4xlarge (primary), c5n.xlarge (core)
Nodes Throughput Transfer Time Maps
24 1.5GB/s 100 mins 168
48 2.9GB/s 53 mins 336
96 4.4GB/s 35 mins 640
120 5.4GB/s 29 mins 840

The following are the results of the S3DistCp test:

  • Workload – 9.4 TB and 157,098 files
  • Instance types – 1x c5n.4xlarge (primary), c5n.xlarge (core)
Nodes Throughput Transfer Time Reducers
24 1.9GB/s 82 mins 48
48 3.4GB/s 45 mins 120
96 5.0GB/s 31 mins 240
120 5.8GB/s 27 mins 240

The results show that S3DistCP performed slightly better than DistCP for our test dataset. In terms of node count, we stopped at 120 nodes because we were satisfied with the performance of the copy. Increasing nodes might yield better performance if required for your dataset. You should iterate through your node counts to determine the proper number for your dataset.

Using Spot Instances for task nodes

Amazon EMR supports the capacity-optimized allocation strategy for EC2 Spot Instances for launching Spot Instances from the most available Spot Instance capacity pools by analyzing capacity metrics in real time. You can now specify up to 15 instance types in your EMR task instance fleet configuration. For more information, see Optimizing Amazon EMR for resilience and cost with capacity-optimized Spot Instances.

Clean up

Make sure to delete the cluster when the copy job is complete unless the copy job was a step at the cluster launch and the cluster was set up to stop automatically after the completion of the copy job.

Conclusion

In this post, we showed how you can copy large datasets from GCS to Amazon S3 using an EMR cluster and two Hadoop file copy tools: DistCp and S3DistCp.

We also compared the performance of DistCp with S3DistCp with a test dataset stored in a multi-Region GCS bucket. As a follow-up to this post, we will run the same test on Graviton instances to compare the performance/cost of the latest x86 based instances vs. Graviton 2 instances.

You should conduct your own tests to evaluate both tools and find the best one for your specific dataset. Try copying a dataset using this solution and let us know your experience by submitting a comment or starting a new thread on one of our forums.


About the Authors

Hammad Ausaf is a Sr Solutions Architect in the M&E space. He is a passionate builder and strives to provide the best solutions to AWS customers.

Andrew Lee is a Solutions Architect on the Snap Account, and is based in Los Angeles, CA.

Back to the future with Zabbix

Post Syndicated from TimSmit original https://blog.zabbix.com/back-to-the-future-with-zabbix/15701/

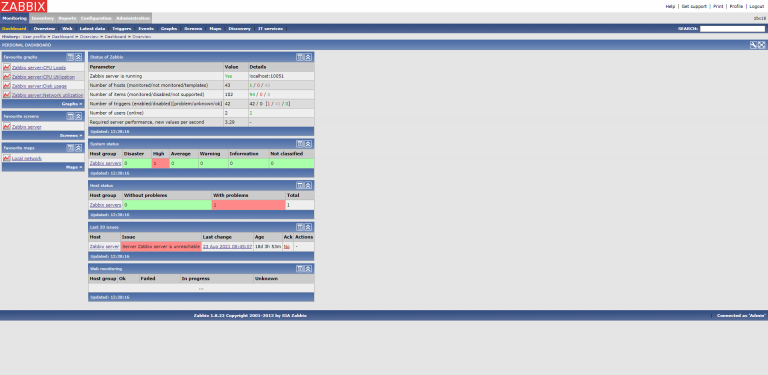
In this blog post, we would like to show you a new theme that might seem a little familiar to you. Let’s take a little nostalgic trip down memory lane and take a look at this special frontend theme for Zabbix 5.4 reminiscent of Zabbix 1.8.

How it looks

Although the old Zabbix 1.8 design understandably has an outdated look, the colors have a nice feel to them, especially the old shade of blue.

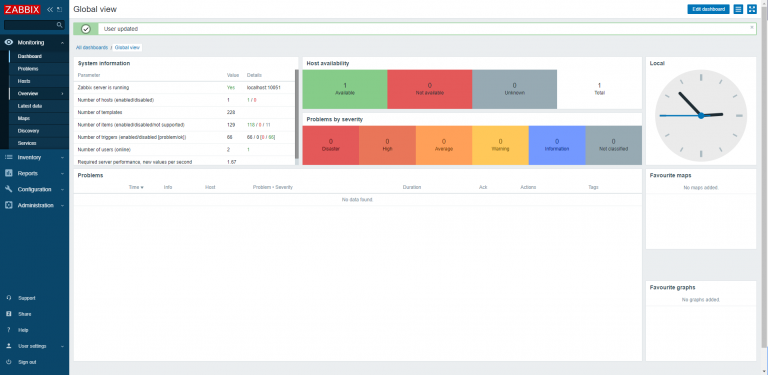
The Zabbix 5.4 design is up to date with current standards and has a modern look and feel to it. It is meant to be simplistic with a lot of white and barely any color except for the navigation bar and widgets like the problems and availability.

My theme combines the two. It is up to date with modern standards, and it has a trusted feel to it with the old color scheme. The old color scheme gives us a nostalgic look, which will hopefully bring some joy both to the veterans and newcomers to Zabbix!

How it works

The way I made this was fairly simple. I copied a css file from the styles folder, placed it in the same folder, and renamed it. I also put the image used to change the appearance into the same folder so it is easy to find.

blue-theme.css
dark-theme.css
hc-dark.css
hc-dark.css
oldisnew.css
table_head2.gif


To figure out which changes should be made, I had the Zabbix GUI open in a web browser with the element inspect function. in the css file I would find the same tag/name/class/etc as in the web browser and change it to look like the appearance of version 1.8.

.menu-main > li {
line-height: 16px; }
.menu-main > li.is-selected > a {
background: url(../styles/table_head2.gif) repeat-x top left;
border-left-color: #87d1ff;
color: #ffffff; }
.menu-main > li.is-expanded > a, .menu-main > li.is-expanded > a:focus {
border-left-color: transparent;
color: #ffffff; }
.menu-main > li:not(.is-expanded) .submenu {
max-height: 0 !important; }
.menu-main > li > a {
background:url(../styles/table_head2.gif) repeat-x top left;
color: #ffffff; }

For example here is where I changed the background of the dropdowns from the side menu into the image from Zabbix 1.8 which gives the menu an appealing new look.

For the theme to show up in the User settings it uses an add-on for the APP.php.

class APP extends ZBase {
   public static function getThemes() {
   return array_merge(parent::getThemes(),
   ['oldisnew' => _('Old is New')]);
}
}

The add-on is included in our Github Repository, you can copy and paste it into the APP.php file.

I hope you like the theme. It is available for download at the Opensource ICT Solutions Github. Just follow the link below:

https://github.com/OpensourceICTSolutions/zabbix-5-old-version-1_8-theme .

The Github contains an up-to-date Readme for installation, but, here is a short explanation on how to install it:

1. Navigate to the link above.
2. Download the three files: (oldisnew.css),(tablehead2.gif) and (APP_add_on.text).
3. On your Zabbix server CLI there should be a directory called /usr/share/zabbix/assets/styles/. Put the (oldsinew.css) and (tablehead2.gif) files here.
4. For (APP_add_on.txt) add the text to the APP.php located at the directory /usr/share/zabbix/include/classes/core/ inside of (class APP extends ZBase). (this allows you to actually see the theme inside of the dropdown.)
5. Now, at the Zabbix GUI navigate to Profile under User settings and change the theme.
6. Enjoy your new theme!

Monitoring MongoDB nodes and clusters with Zabbix

Post Syndicated from Dmitry Lambert original https://blog.zabbix.com/monitoring-mongodb-nodes-and-clusters-with-zabbix/16031/

Zabbix Agent 2 enables our users to monitor a whole set of new systems with minimal configuration required on the monitored systems. Forget about writing custom monitoring scripts, deploying additional packages, or configuring ODBC. A great use-case for Zabbix Agent 2  is monitoring one of the most popular NoSQL DB backends – MongoDB. Below, you can read a detailed description and step-by-step guide through the use case or refer to the video available here.

Zabbix MongoDB template

For this example, we will be using Zabbix version 5.4, but MongoDB monitoring by Zabbix Agent 2 is supported starting from version 5.0. If you have a fresh deployment of Zabbix version 5.0 or newer, you will be able to find the MongoDB template in your ‘Configuration‘ – ‘Templates‘ section.

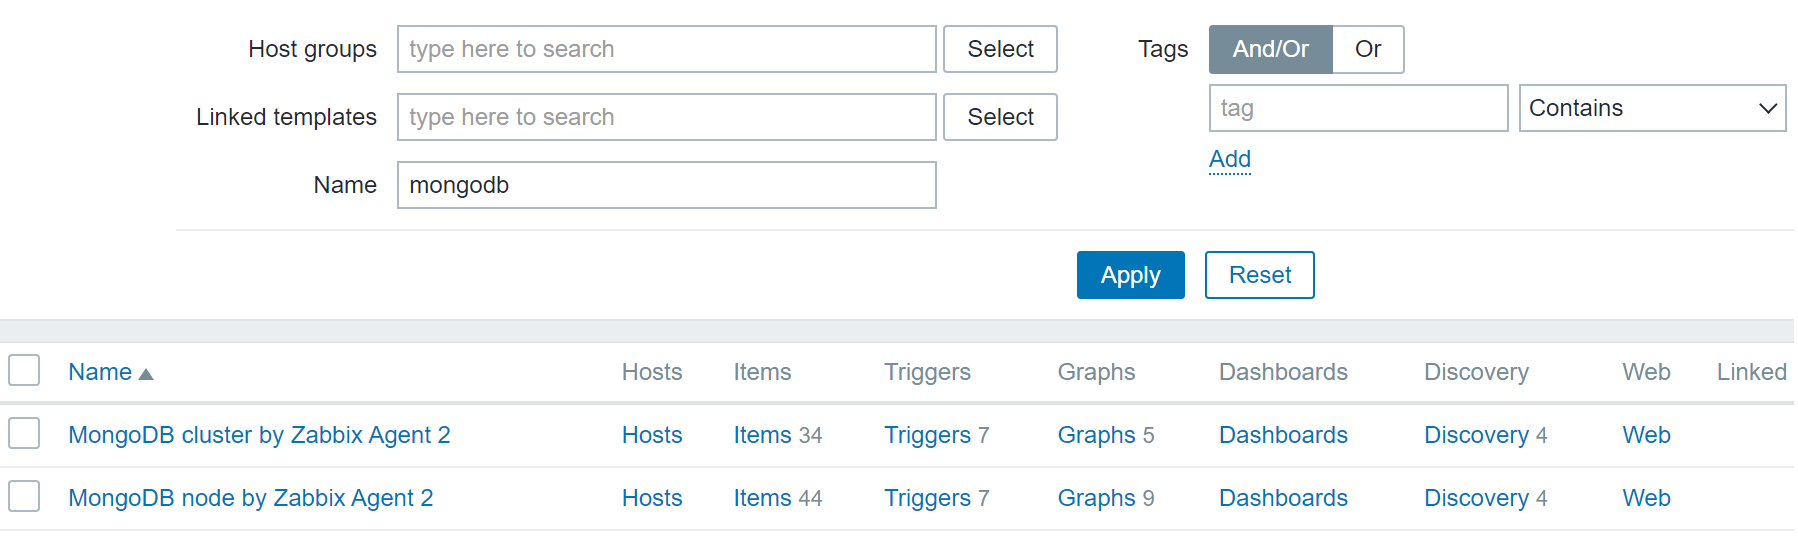
MongoDB Node and Cluster templates

On the other hand, if you have an instance that you deployed before the release of Zabbix 5.0 and then upgraded to Zabbix 5.0 or newer, you will have to import the template manually from our git page. Let’s remember that Zabbix DOES NOT apply new templates or modify existing templates during an upgrade. Therefore, newly released templates have to be IMPORTED MANUALLY!

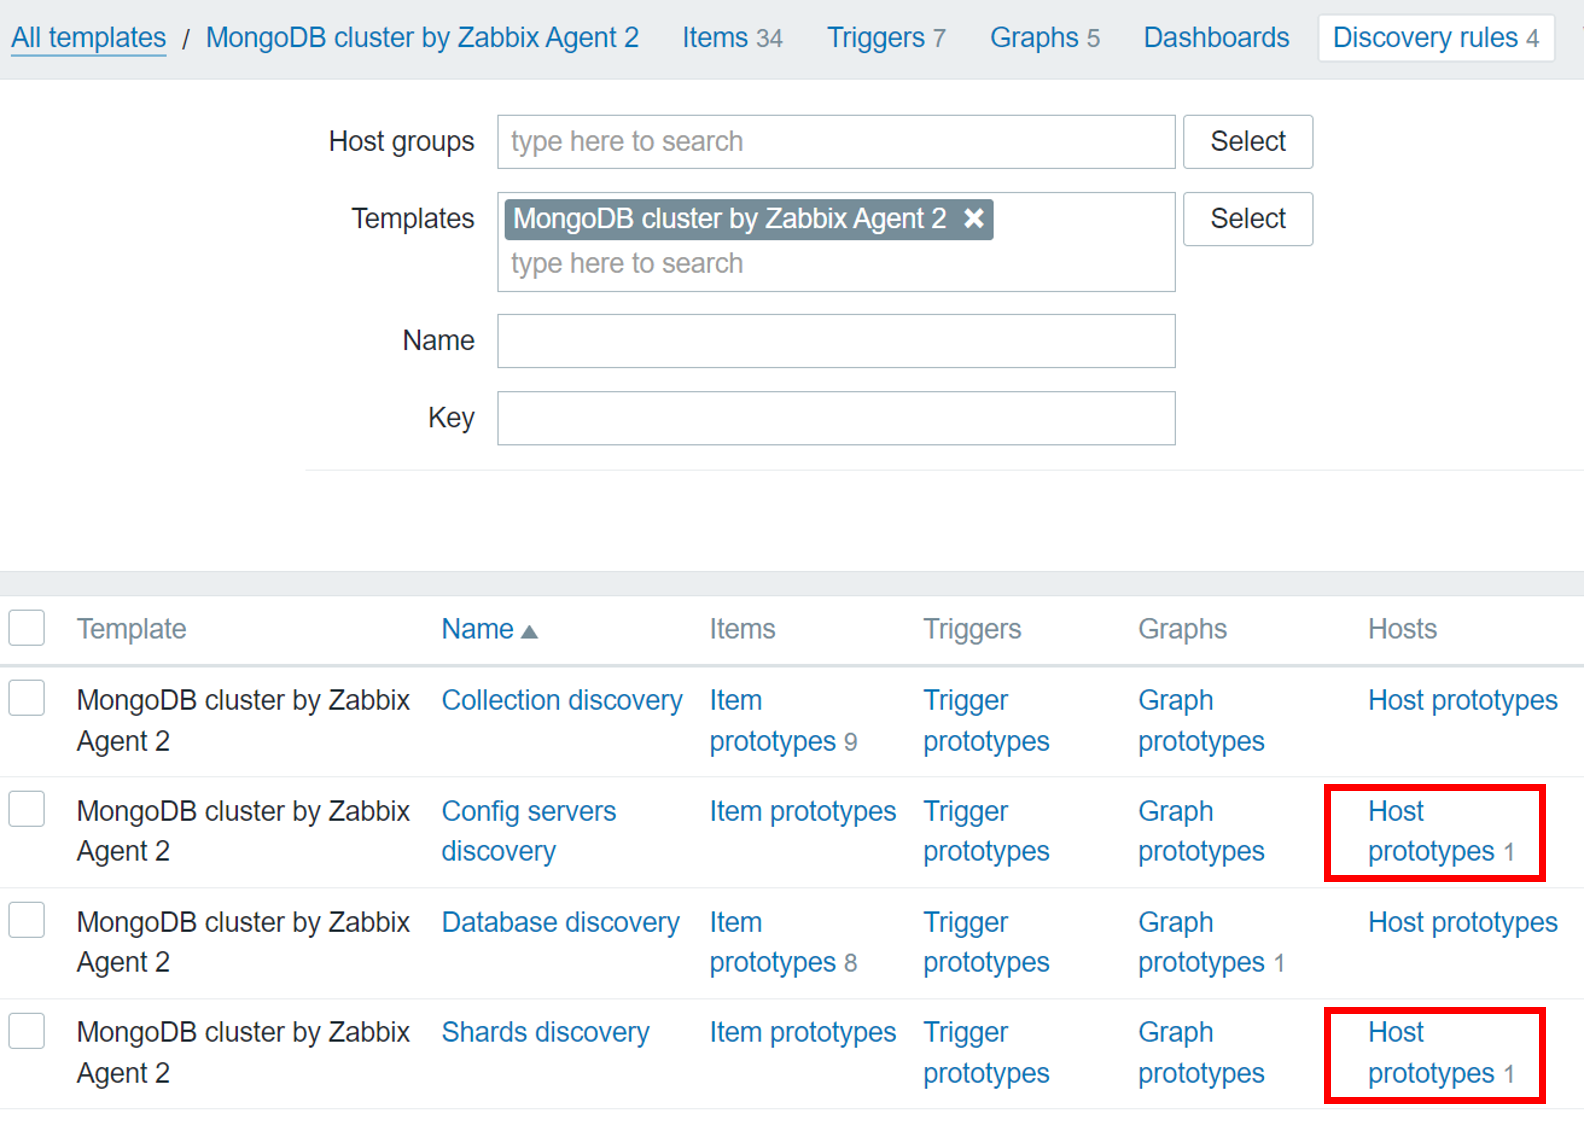
We can see that we have two MongoDB templates – ‘MongoDB cluster by Zabbix Agent 2’ and ‘MongoDB node by Zabbix agent 2’. Depending on your MongoDB setup – individual nodes or a cluster, apply the corresponding template. Note that the MongoDB cluster template can automatically create hosts for your config servers and shards and apply the MongoDB node template on these hosts.

Host prototypes for config servers and shards

Deploying Zabbix Agent 2 on your Host

Since the data collection is done by Zabbix Agent 2, first, let’s deploy Zabbix Agent 2 on our MongoDB node or cluster host. Let’s start with adding the Zabbix 5.4 repository and install the Zabbix Agent 2 via a  package.

Add the Zabbix 5.4 repository:

rpm -Uvh https://repo.zabbix.com/zabbix/5.4/rhel/8/x86_64/zabbix-release-5.4-1.el8.noarch.rpm

Install Zabbix Agent 2:

yum install zabbix-agent2

What if you already have the regular Zabbix Agent running on this machine? In this case, we have two options for how we can proceed. We can simply remove the regular Zabbix Agent and Deploy Zabbix Agent 2. In this case, make sure you make a backup of the Zabbix Agent configuration file and migrate all of the changes to the Zabbix Agent 2 configuration file.

The second option is running both of the Zabbix Agents in parallel. In this case, we need to make sure that both agents – Zabbix Agent and Zabbix Agent 2 are listening on their own specific ports because, by default, both agents are listening for connections on port 10050. This can be configured in the Zabbix Agent configuration file by changing the ‘ListenPort’ parameter.

Don’t forget to specify the ‘Server‘ parameter in the Zabbix Agent 2 configuration file. This parameter should contain your Zabbix Server address or DNS name. By defining it here, you will allow Zabbix Agent 2 to accept the metric poll requests from Zabbix Server.

After you have made the configuration changes in the Zabbix Agent 2 configuration file, don’t forget to restart Zabbix Agent 2 to apply the changes:

systemctl restart zabbix-agent2

Creating a MongoDB user for monitoring

Once the agent has been deployed and configured, you need to ensure that you have a MongoDB database user that we can use for monitoring purposes. Below you can find a brief example of how you can create a MongoDB user:

Access the MongoDB shell:

mongosh

Switch to the MongoDB admin database:

use admin

Create a user with ‘userAdminAnyDatabase‘ permissions:

db.createUser(
... {
..... user: "zabbix_mon",
..... pwd: "zabbix_mon",
..... roles: [ { role: "userAdminAnyDatabase", db: "admin" } ]
..... }
... )

The username for the newly created user is ‘zabbix_mon’. The password is also ‘zabbix_mon‘ – feel free to change these as per your security policy.

Creating and configuring a MongoDB host

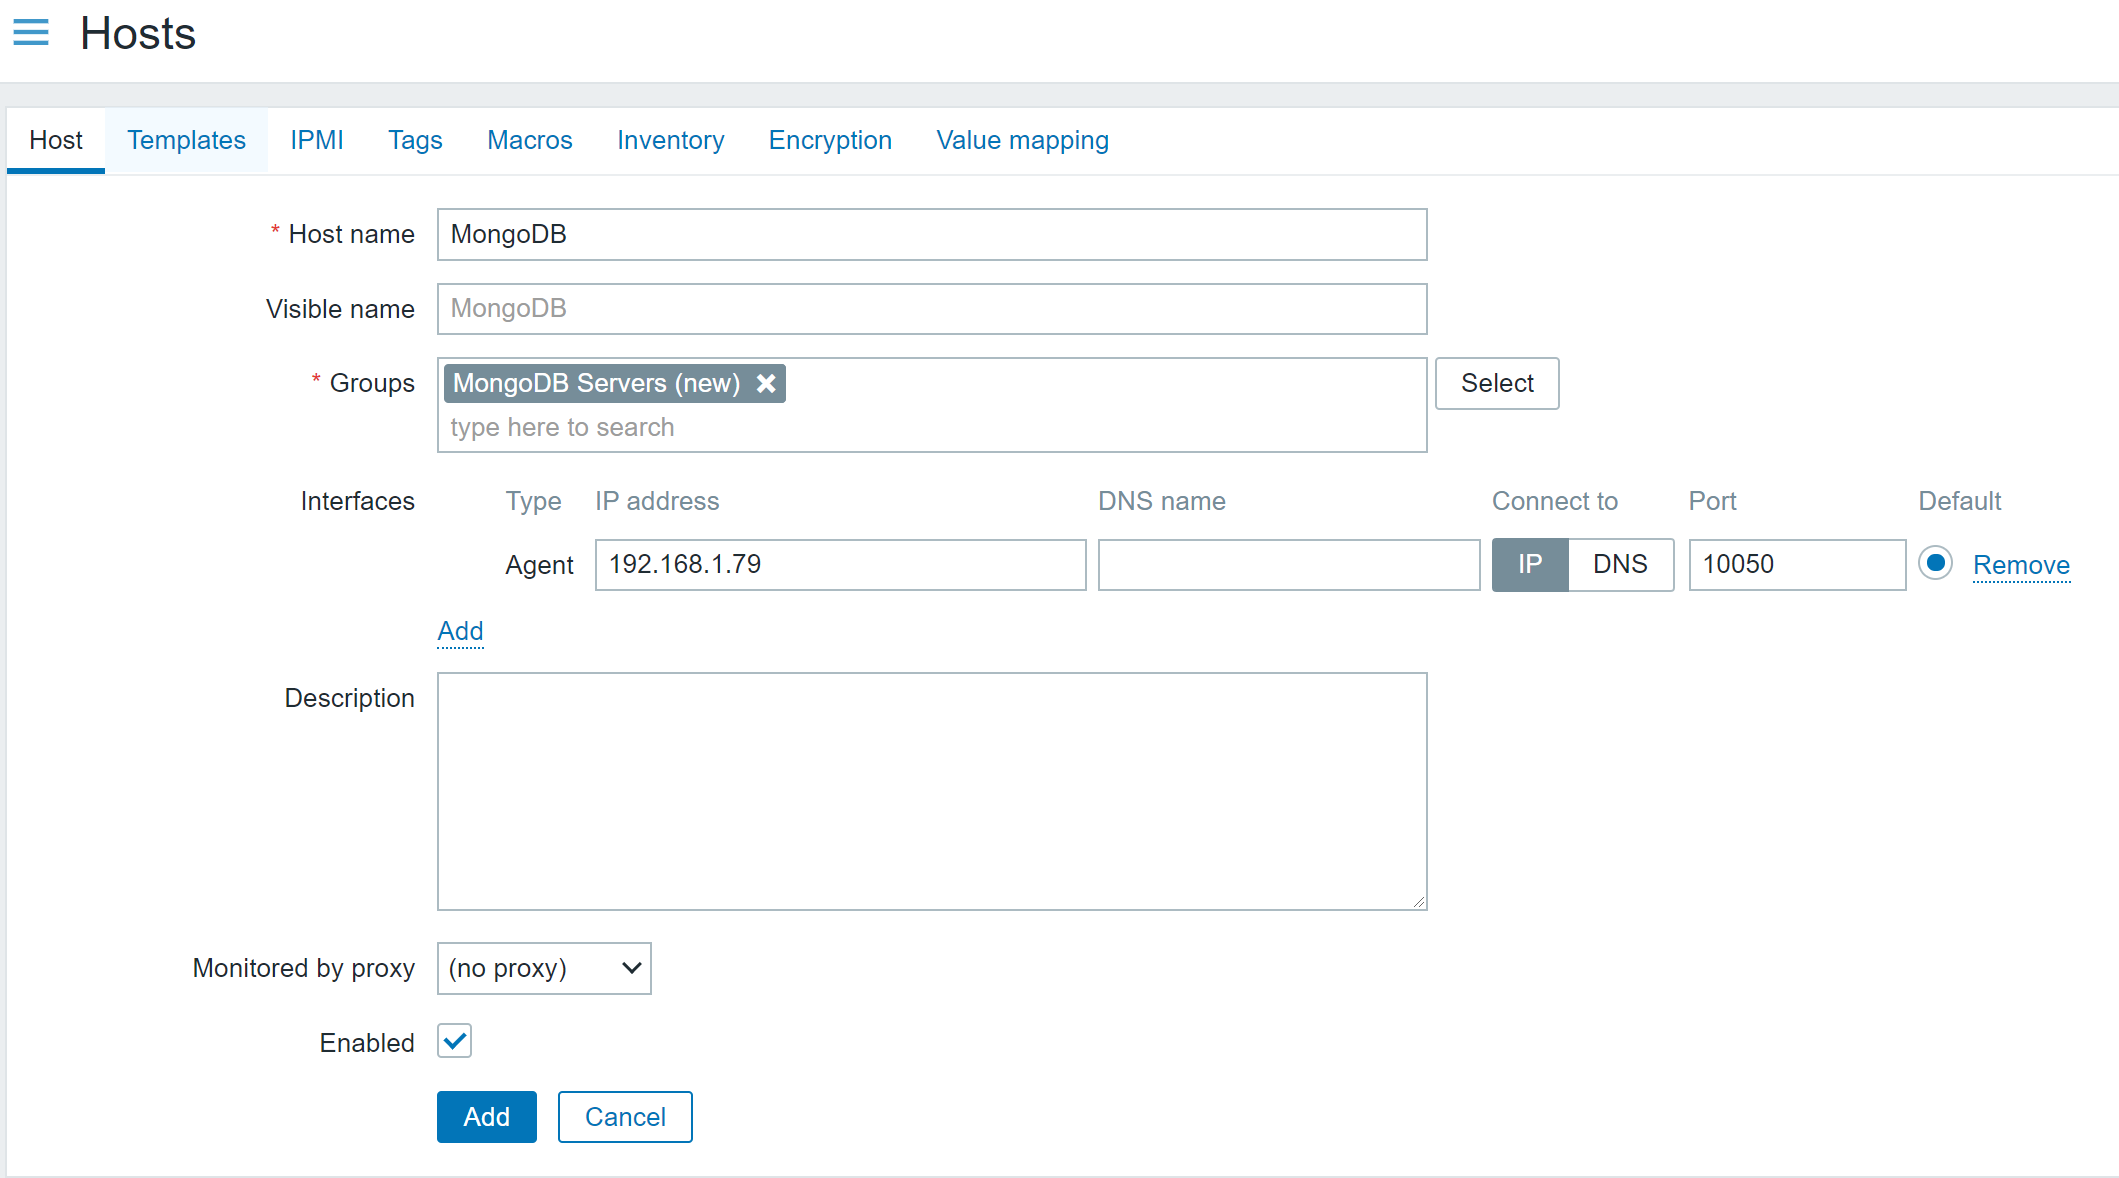
Next, you need to open your Zabbix frontend and create a new host representing your MongoDB node. You can see that in our example, we called our node ‘MongoDB’ and assigned it to a ‘MongoDB Servers’ host group. You can use more detailed naming in a production environment and use your own host group assignment logic. But remember – a host needs to belong to AT LEAST a single host group! 

Since the metrics are collected by Zabbix Agent 2, you must also create an Agent interface on the host. Zabbix Server will connect to this interface and request the metrics from the Zabbix Agent 2. Define the IP address or DNS name of your MongoDB host, where you previously deployed Zabbix Agent 2. Mind the port – by default, we have port 10050 defined over here, but if you have modified the ‘ListenPort’ parameter in the Zabbix Agent 2 config and changed the value from the default one (10050) to something else, you also need to use the same port number here.

MongoDB host configuration example

Next, navigate to the ‘Templates’ tab and assign the corresponding template – either ‘MongoDB node by Zabbix agent 2’ or ‘MongoDB cluster by Zabbix Agent 2’. In our example, we will assign the MongoDB node template.

Before adding the host, you also need to provide authentication and connection parameters by editing the corresponding User Macros. These User Macros are used by the items that specify which metrics should we be collecting. Essentially, we are forwarding the connectivity and authentication information to Zabbix Agent 2, telling it to use these values when collecting the metrics from our MongoDB instance.

To do this, navigate to the ‘Macros’ tab in the host configuration screen. Then, select ‘Inherited and host macros’ to display macros inherited from the MongoDB template.

We can see a bunch of macros here – some of them are related to trigger thresholds and discovery filters, but what we’re interested in right now are the following macros:

  • {$MONGODB.PASSWORD} –  MongoDB username. For our example, we will set this to zabbix_mon
  • {$MONGODB.USER} – MongoDB password. For our example, we will set this to zabbix_mon
  • {$MONGODB.CONNSTRING} – MongoDB connection string. Specify the MongoDB address and port here to which the Zabbix Agent 2 should connect and perform the metric collection

Now we are ready to add the host. Once the host has been added, we might have to wait for a minute or so before Zabbix begins to monitor the host. This is because Zabbix Server doesn’t instantly pick up the configuration changes. By default, Zabbix Server updates the Configuration Cache once a minute.

Fine-tuning MongoDB monitoring

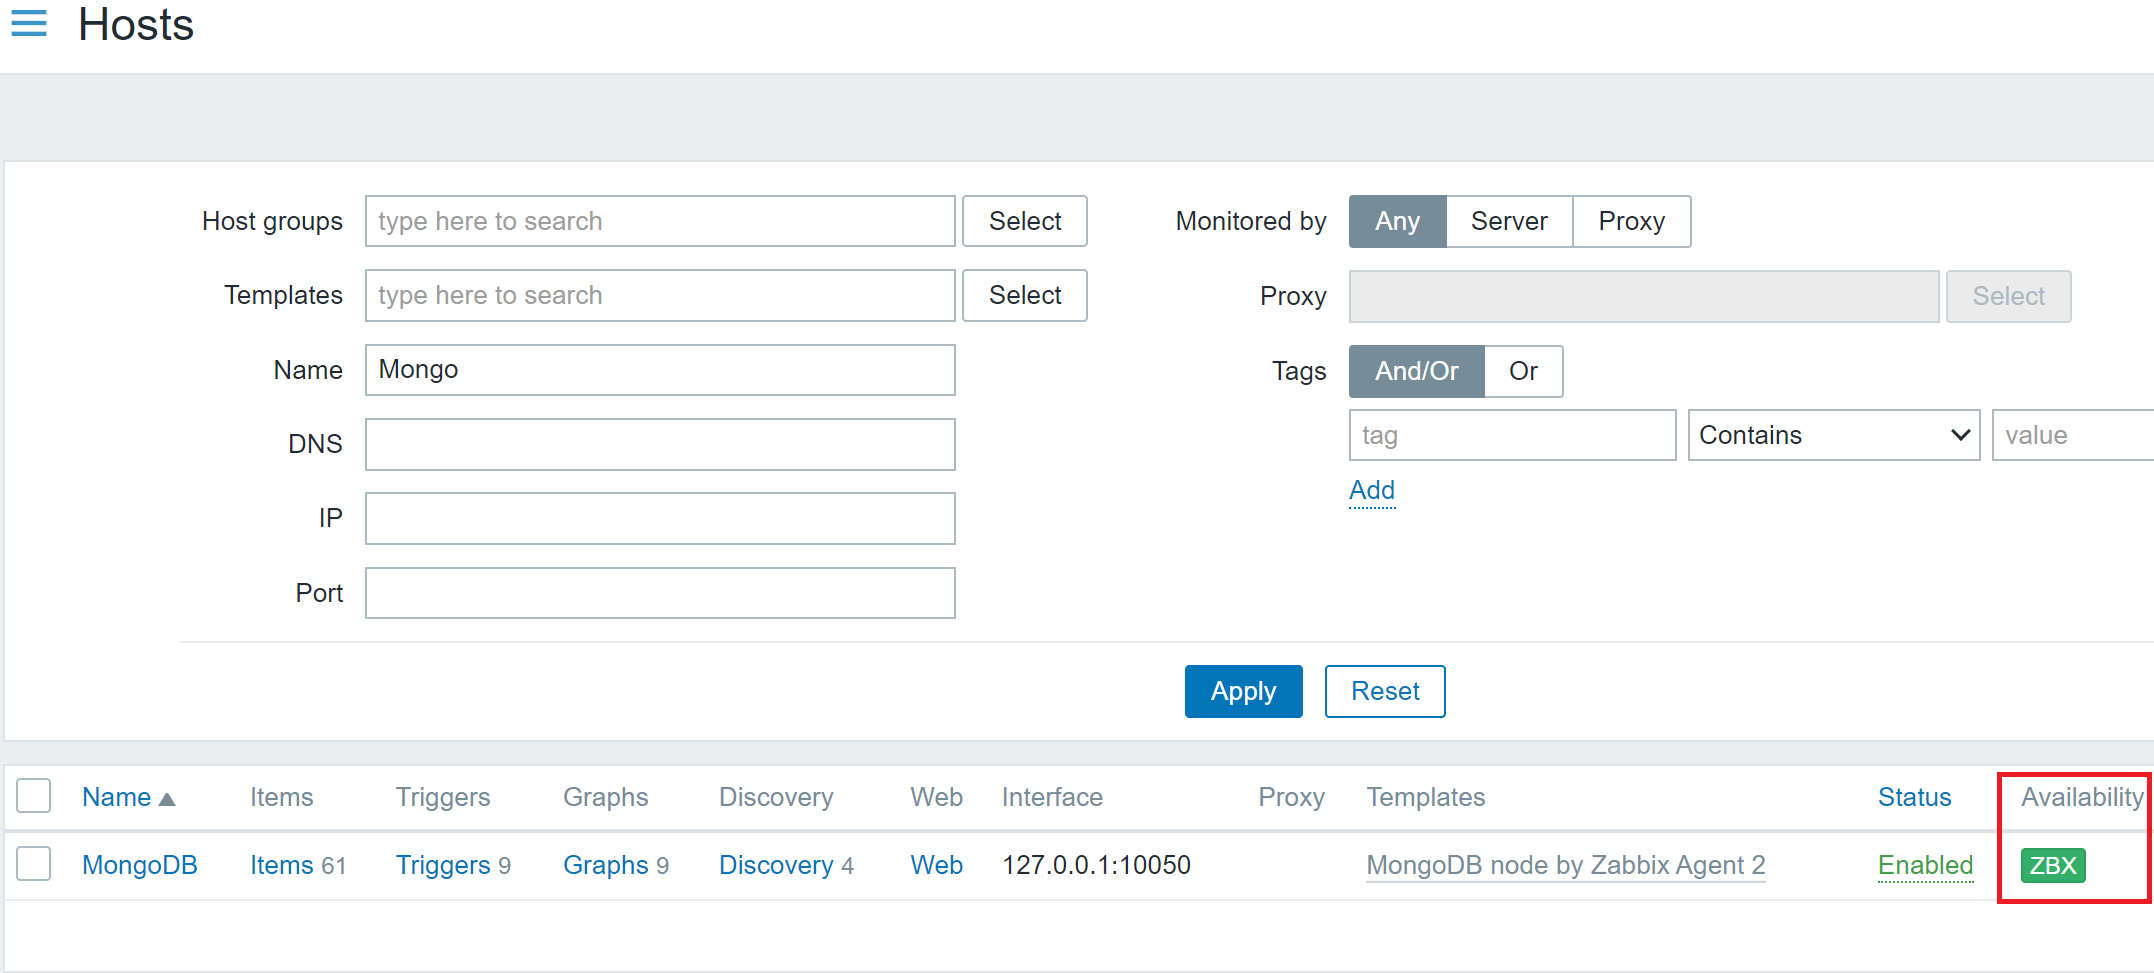
At this point, we should see a green ZBX Icon next to our MongoDB host.

Data collection on the MongoDB host has started – note the green ‘ZBX’ icon.

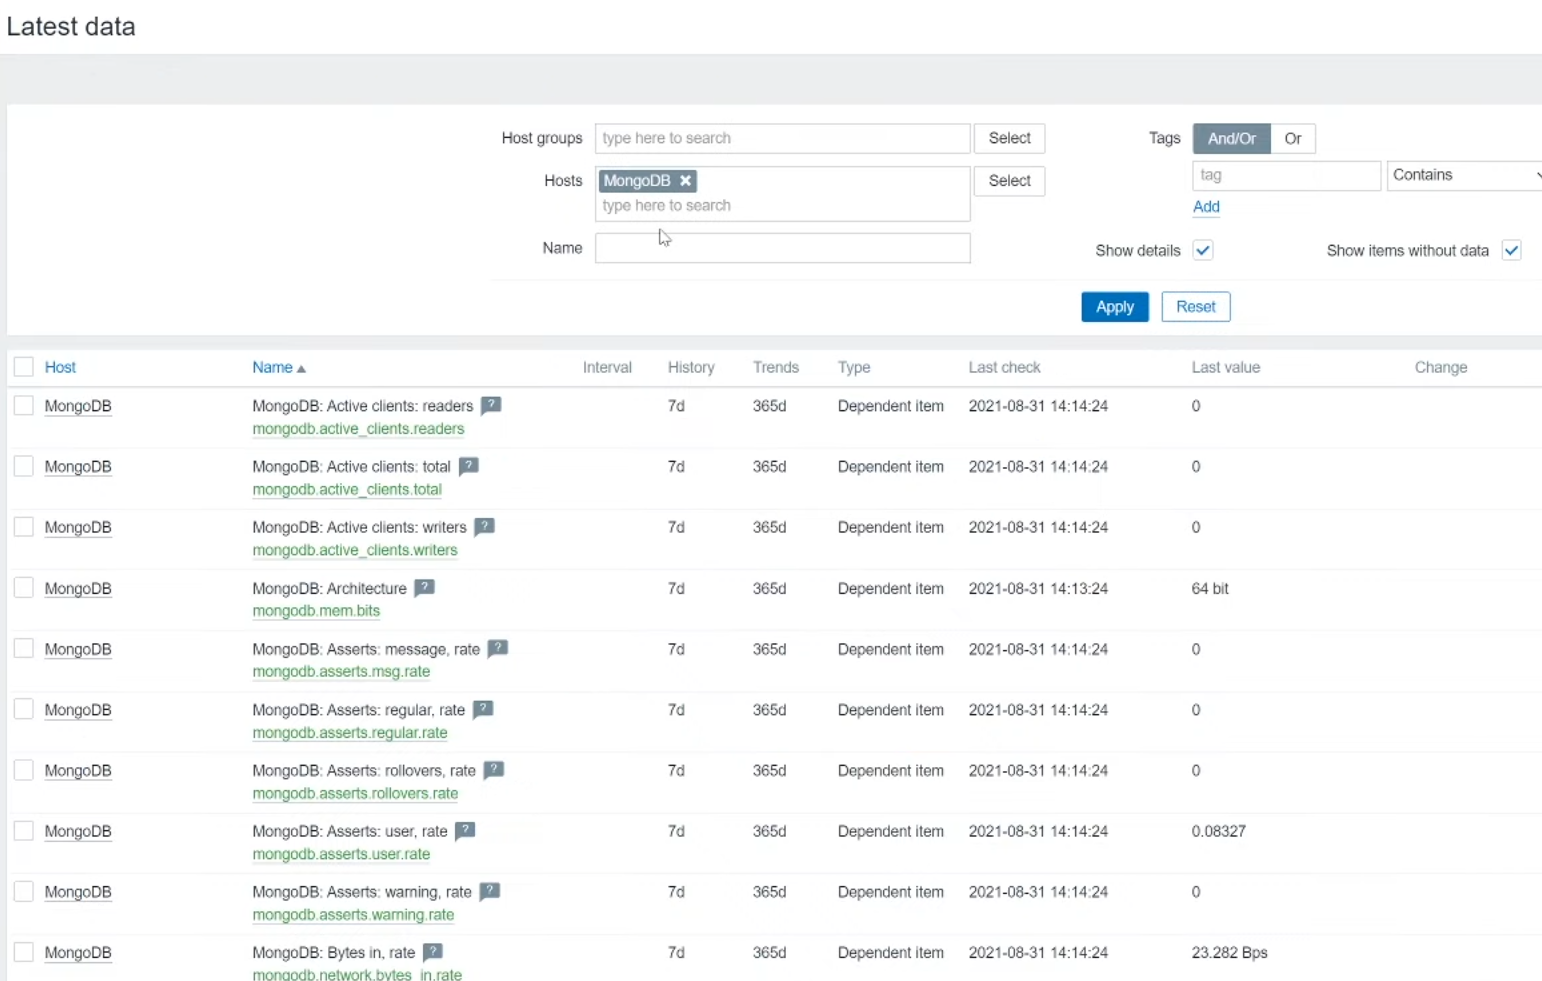
This means that the Zabbix Server has successfully connected to our Zabbix Agent 2, and the metric collection has begun. You can now navigate to the ‘Monitoring’ – ‘Latest data’ section, filter the view by your MongoDB host, and you should see all of the collected metrics here.

MongoDB metrics in ‘Monitoring’ – ‘Latest data’

The final task is to tune the MongoDB monitoring on your hosts, collecting only the required metrics. Navigate to ‘Configuration’ –Hosts’, find your MongoDB hosts, and go through the different entity types on the host – items, triggers, discovery rules. See an item that you don’t wish to collect metrics for? Feel free to disable it. Open up the discovery rules – change the update intervals on them or disable the unnecessary ones.

Note: Be careful not to disable master items. Many of the items and discovery rules here are of type ‘Dependent item’ which means, that they require a so-called ‘Master item’. Feel free to read more about dependent items here.

Remember the ‘Macros’ section in the host configuration? Let’s return to it. here we can see some macros which are used in our trigger thresholds, like:

  • {$MONGODB.REPL.LAG.MAX.WARN} – Maximum replication lag in seconds
  • {$MONGODB.CURSOR.OPEN.MAX.WARN} – Maximum number of open cursors

Feel free to change these as per your problem threshold requirements.

One last thing here – we can filter which elements get discovered by our discovery rules. This is once again defined by user macros like:

  • {$MONGODB.LLD.FILTER.DB.MATCHES} – Databases that should be discovered (By default, the value here is ‘.*’, which will match everything)
  • {$MONGODB.LLD.FILTER.DB.NOT_MATCHES} – Databases that should be excluded from the discovery

And that’s it! After some additional tuning has been applied, we are good to go – our MongoDB entities are being discovered, metrics are getting collected, and problem thresholds have been defined. And all of it has been done with the native Zabbix Agent 2 functionality and an out-of-the-box MongoDB template!

Zabbix frontend as a control panel for your devices

Post Syndicated from Aigars Kadiķis original https://blog.zabbix.com/zabbix-frontend-as-a-control-panel-for-your-devices/15545/

The ability to define and execute scripts on different Zabbix components in different scenarios can be extremely powerful. There are many different use cases where we can execute these scripts – to remediate an issue, forward our alerts to an external system, and much more. In this post, we will cover one of the lesser-known use cases – creating a control panel of sorts in which we can execute different scripts directly from our frontend.


Configuration cache

Let’s use two very popular Zabbix runtime commands for our use case –  ‘zabbix_server -R config_cache_reload’ and ‘zabbix_proxy -R config_cache_reload’. These commands can be used to force the Zabbix server and Zabbix proxy components to load the configuration changes on demand.

First, let’s discuss how these commands work:

It all starts with the configuration cache frequency, which is configured for the central Zabbix server. Have a look at the output:

grep CacheUpdateFrequency= /etc/zabbix/zabbix_server.conf

And on the Zabbix proxy side, there is a similar setting. Let’s take a look:

grep ConfigFrequency= /etc/zabbix/zabbix_proxy.conf

With a stock installation we have ‘CacheUpdateFrequency=60‘ for ‘zabbix-server‘ and we have ‘ConfigFrequency=3600‘ for ‘zabbix-proxy‘. This parameter represents how fast the Zabbix component will pick up the configuration changes that we have made in the GUI.

Apart from the frequency, we have also another variable which is: how long it actually takes to run one configuration sync cycle. To find the precise time value, we can use this command:

ps auxww | egrep -o "[s]ynced.*sec"

The output will produce a line like:

synced configuration in 14.295782 sec, idle 60 sec

This means that it takes approximately 14 seconds to load the configuration cache from the database. Then there is a break for the next 60 seconds. After that, the process repeats.

When the monitoring infrastructure gets big, we might need to start using larger values for ‘CacheUpdateFrequency‘ and ‘ConfigFrequency‘. By reducing the configuration reload frequency, we can offload our database. The best possible configuration performance-wise is to install ‘CacheUpdateFrequency=3600‘ in ‘zabbix_server.conf‘ and use ‘ConfigFrequency=3600‘ (it’s the default value) in ‘zabbix_proxy.conf‘.

Some repercussions arise with such a configuration. When we use values that are this large, there will be a delay of one hour until newly created entities are monitored or changes are applied to the existing entities.

Setting up the scripts

I would like to introduce a way we can force the configuration to be reloaded via GUI.
Some prerequisites must be configured:

1) Make sure the  ‘Zabbix server‘ host belongs to the “Zabbix servers” host group.

2) On the server where service ‘zabbix-server‘ runs, install a new sudoers rule:

cd /etc/sudoers.d
echo 'zabbix ALL=(ALL) NOPASSWD: /usr/sbin/zabbix_server -R config_cache_reload' | sudo tee zabbix_server_config_cache_reload
chmod 0440 zabbix_server_config_cache_reload

The sudoers file is required because out of the box the service ‘zabbix-server‘ runs with user ‘zabbix‘ which does not have access to interact with the local system.

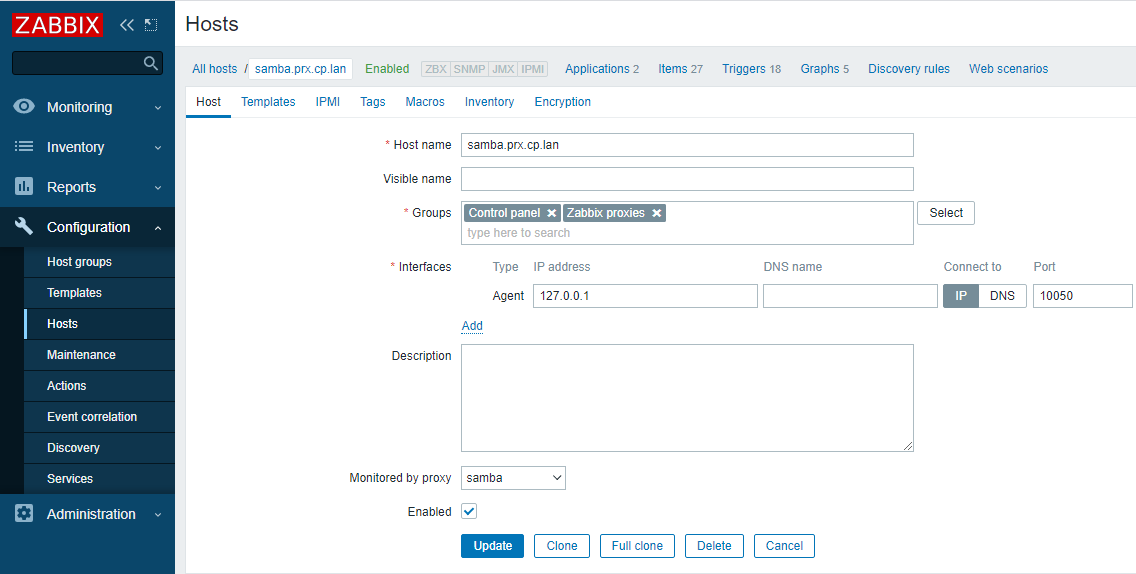
3) We will also create Zabbix hosts representing our Zabbix proxies. These hosts must belong to the ‘Zabbix proxies’ host group.

Notice that in the screenshot the host ‘127.0.0.1′ is using ‘Monitored by proxy‘. This is extremely important since we do not care about the agent interface in the use case with proxies – the interface can contain an arbitrary address/DNS name. What we care about is the ‘Monitored by proxy’ field. Our command will be executed on the proxy that we select here.

4) On the server where service ‘zabbix-proxy‘ runs, install a new sudoers rule:

cd /etc/sudoers.d
echo 'zabbix ALL=(ALL) NOPASSWD: /usr/sbin/zabbix_proxy -R config_cache_reload' | sudo tee zabbix_proxy_config_cache_reload
chmod 0440 zabbix_proxy_config_cache_reload

5) Make the following changes in the ‘/etc/zabbix/zabbix_proxy.conf‘ proxy configuration file: ‘EnableRemoteCommands=1‘. Restart the ‘zabbix-proxy’ service afterwards.

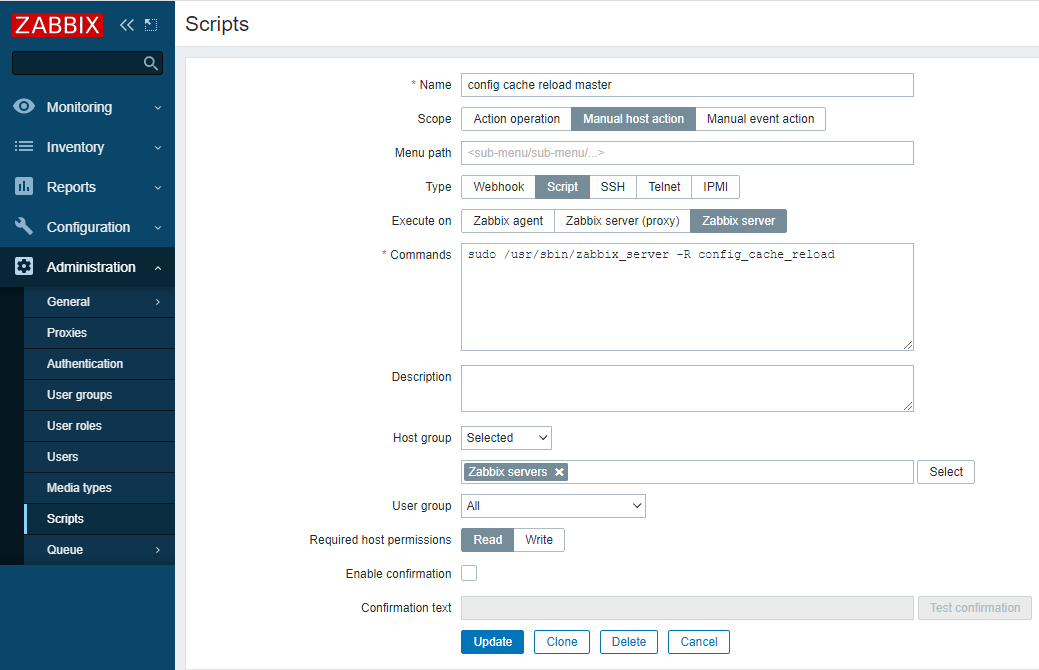
6) Open ‘Administration’ => ‘Scripts’ and define the following commands:
For the ‘Zabbix servers’ host group:

sudo /usr/sbin/zabbix_server -R config_cache_reload	

Since this is a custom command that we will execute, the type of the script will be ‘Script’. The first script will be executed on the Zabbix server – we are forcing the central Zabbix server to reload its configuration cache. In this example, all users with at least ‘Read’ access to the Zabbix server host will be able to execute the script. You can limit this as per your internal Zabbix policies.

Below you can see how it should look:

For the ‘Zabbix proxies’ host group:

sudo /usr/sbin/zabbix_proxy -R config_cache_reload	

The only thing that we change for the proxy script is the ‘Command’ and ‘Execute on’ parameters, since now the command will be executed on the Zabbix proxy which is monitoring the target host:

Frontend as a control panel

I prefer to add an additional host group “Control panel” which contains the central Zabbix server and all Zabbix proxies.

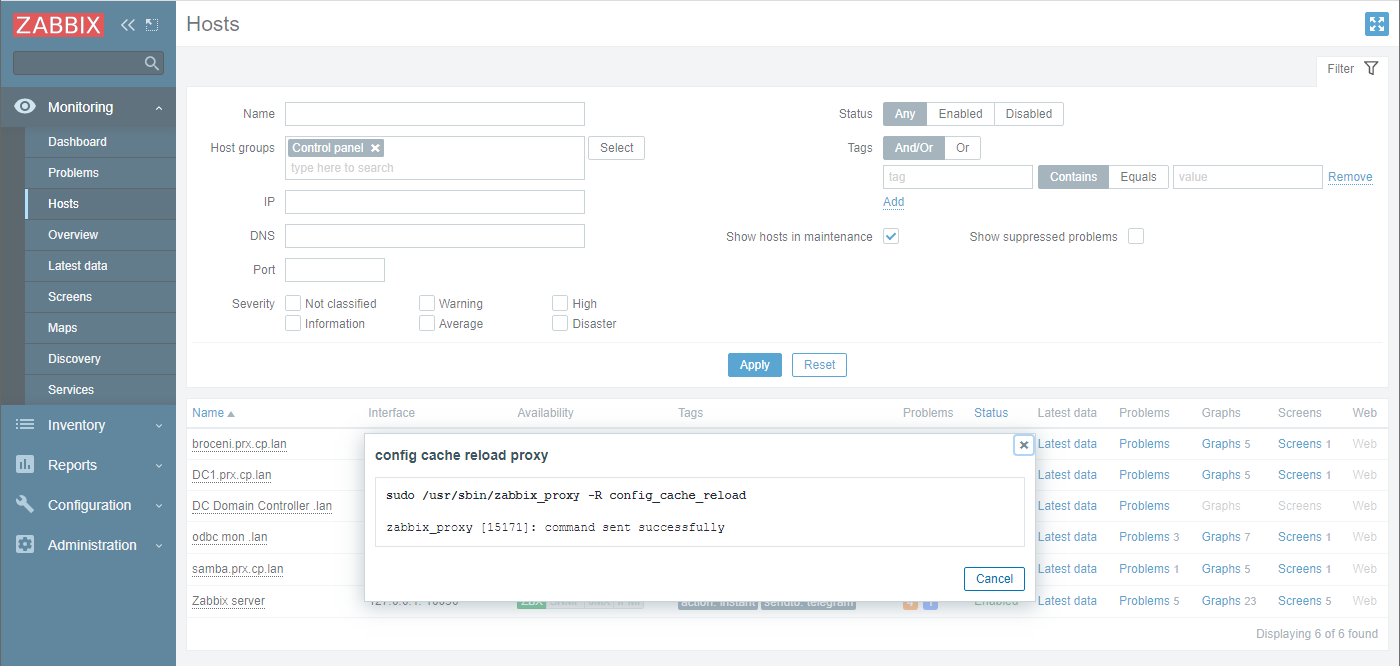
Now when we need to reload our configuration cache, we can open ‘Monitoring’ => ‘Hosts‘ and filter out host group ‘Control panel’. Then click on the proxy host in question and select ‘config cache reload proxy’:

It takes 5 seconds to complete and then we will see the result of script execution. In this case – ‘command sent successfully’:

By the way, we can bookmark this page too 😉

With this approach, you can create ‘Control panel’ host groups and scripts for different types of tasks that you can execute directly from the Zabbix frontend! This allows us to use our Zabbix frontend not just for configuration and data overview, but also as a control panel of sorts for our hosts.
If you have any questions, comments, or wish to share your use cases for using scripts in the frontend – leave us a comment! Your use case could be the one to inspire many other Zabbix community members to give it a try.

Agentless Oracle database monitoring with ODBC

Post Syndicated from Aigars Kadiķis original https://blog.zabbix.com/agentless-oracle-database-monitoring-with-odbc/15589/

Did you know that Zabbix has an out-of-the-box template for collecting Oracle database metrics? With this template, we can collect data like database, tablespace, ASM, and many other metrics agentlessly, by using ODBC. This blog post will guide you on how to set up ODBC monitoring for Oracle 11.2, 12.1, 18.5, or 19.2 database servers. This post can serve as the perfect set of guidelines for deploying Oracle database monitoring in your environment.

Download Instant client and SQLPlus

The provided commands apply for the following operating systems: CentOS 8, Oracle Linux 8, or Rocky Linux.

First we have to download the following packages:
oracle-instantclient19.12-basic-19.12.0.0.0-1.x86_64.rpm
oracle-instantclient19.12-sqlplus-19.12.0.0.0-1.x86_64.rpm
oracle-instantclient19.12-odbc-19.12.0.0.0-1.x86_64.rpm

Here we are downloading

Oracle instant client – required, to establish connectivity to an Oracle database
SQLPlus  – A tool that we can use to test the connectivity to an Oracle database
Oracle ODBC package – contains the required ODBC drivers and configuration scripts to enable ODBC connectivity to an Oracle database

Upload the packages to the Zabbix server (or proxy, if you wish to monitor your Oracle DB on a proxy) and place it in:

/tmp/oracle-instantclient19.12-basic-19.12.0.0.0-1.x86_64.rpm
/tmp/oracle-instantclient19.12-sqlplus-19.12.0.0.0-1.x86_64.rpm
/tmp/oracle-instantclient19.12-odbc-19.12.0.0.0-1.x86_64.rpm

Solve OS dependencies

Install ‘libaio’ and ‘libnsl’ library:

dnf -y install libaio-devel libnsl

Otherwise, we will receive errors:

# rpm -ivh /tmp/oracle-instantclient19.12-basic-19.12.0.0.0-1.x86_64.rpm
error: Failed dependencies:
        libaio is needed by oracle-instantclient19.12-basic-19.12.0.0.0-1.x86_64
        libnsl.so.1()(64bit) is needed by oracle-instantclient19.12-basic-19.12.0.0.0-1.x86_64
# rpm -ivh /tmp/oracle-instantclient19.12-basic-19.12.0.0.0-1.x86_64.rpm
error: Failed dependencies:
        libnsl.so.1()(64bit) is needed by oracle-instantclient19.12-basic-19.12.0.0.0-1.x86_64

Check if Oracle components have been previously deployed on the system. The commands below should provide an empty output:

rpm -qa | grep oracle
ldconfig -p | grep oracle

Install Oracle Instant Client

rpm -ivh /tmp/oracle-instantclient19.12-basic-19.12.0.0.0-1.x86_64.rpm

Make sure that the package ‘oracle-instantclient19.12-basic-19.12.0.0.0-1.x86_64’ is installed:

rpm -qa | grep oracle

LD config

The official Oracle template page at git.zabbix.com talks about the method to configure Oracle ENV Usage for the service. For this version 19.12 of instant client, it is NOT REQUIRED to create a ‘/etc/sysconfig/zabbix-server’ file with content:

export ORACLE_HOME=/usr/lib/oracle/19.12/client64
export PATH=$PATH:$ORACLE_HOME/bin
export LD_LIBRARY_PATH=$ORACLE_HOME/lib:/usr/lib64:/usr/lib:$ORACLE_HOME/bin
export TNS_ADMIN=$ORACLE_HOME/network/admin

While we did install the rpm package, the Oracle 19.12 client package did auto-configure LD path at the global level – it means every user on the system can use the Oracle instant client. We can see the LD path have been configured under:

cat /etc/ld.so.conf.d/oracle-instantclient.conf

This will print:

/usr/lib/oracle/19.12/client64/lib

To ensure that the required Oracle libraries are recognized by the OS, we can run:

ldconfig -p | grep oracle

It should print:

liboramysql19.so (libc6,x86-64) => /usr/lib/oracle/19.12/client64/lib/liboramysql19.so
libocijdbc19.so (libc6,x86-64) => /usr/lib/oracle/19.12/client64/lib/libocijdbc19.so
libociei.so (libc6,x86-64) => /usr/lib/oracle/19.12/client64/lib/libociei.so
libocci.so.19.1 (libc6,x86-64) => /usr/lib/oracle/19.12/client64/lib/libocci.so.19.1
libnnz19.so (libc6,x86-64) => /usr/lib/oracle/19.12/client64/lib/libnnz19.so
libmql1.so (libc6,x86-64) => /usr/lib/oracle/19.12/client64/lib/libmql1.so
libipc1.so (libc6,x86-64) => /usr/lib/oracle/19.12/client64/lib/libipc1.so
libclntshcore.so.19.1 (libc6,x86-64) => /usr/lib/oracle/19.12/client64/lib/libclntshcore.so.19.1
libclntshcore.so (libc6,x86-64) => /usr/lib/oracle/19.12/client64/lib/libclntshcore.so
libclntsh.so.19.1 (libc6,x86-64) => /usr/lib/oracle/19.12/client64/lib/libclntsh.so.19.1
libclntsh.so (libc6,x86-64) => /usr/lib/oracle/19.12/client64/lib/libclntsh.so

Note: If for some reason the ldconfig command shows links to other dynamic libraries – that’s when we might have to create a separate ENV file for Zabbix server/Proxy, which would link the Zabbix application to the correct dynamic libraries, as per the example at the start of this section.

Check if the Oracle service port is reachable

To save us some headache down the line, let’s first check the network connectivity to our Oracle database host. Let’s check if we can reach the default Oracle port at the network level. In this example, we will try to connect to the default Oracle database port, 1521. Depending on which port your Oracle database is listening for connections, adjust accordingly,. Make sure the output says ‘Connected to 10.1.10.15:1521’:

nc -zv 10.1.10.15 1521

Test connection with SQLPlus

We can simulate the connection to the Oracle database before moving on with the ODBC configuration. Make sure that the Oracle username and password used in the command are correct. For this task, we will first need to install the SQLPlus package.:

rpm -ivh /tmp/oracle-instantclient19.12-sqlplus-19.12.0.0.0-1.x86_64.rpm

To simulate the connection, we can use a one-liner command. In the example command I’m using the username ‘system’ together with the password ‘oracle’ to reach out to the Oracle database server ‘10.1.10.15’ via port ‘1521’ and connect to the service name ‘xe’:

sqlplus64 'system/oracle@(DESCRIPTION=(ADDRESS_LIST=(ADDRESS=(PROTOCOL=TCP)(HOST=10.1.10.15)(PORT=1521)))(CONNECT_DATA=(SERVER=DEDICATED)(SERVICE_NAME=xe)))'

In the output we can see: we are using the 19.12 client to connect to 11.2 server:

SQL*Plus: Release 19.0.0.0.0 - Production on Mon Sep 6 13:47:36 2021
Version 19.12.0.0.0
Copyright (c) 1982, 2021, Oracle.  All rights reserved.
Connected to:
Oracle Database 11g Express Edition Release 11.2.0.2.0 - 64bit Production

Note: This gives us an extra hint regarding the Oracle instant client – newer versions of the client are backwards compatible with the older versions of the Oracle database server. Though this doesn’t apply to every version of Oracle client/server, please check the Oracle instant client documentation first.

ODBC connector

When it comes to configuring ODBC, let’s first install the ODBC driver manager

dnf -y install unixODBC

Now we can see that we have two new files –  ‘/etc/odbc.ini’ (possibly empty) and ‘/etc/odbcinst.ini’.

The file ‘/etc/odbcinst.ini’ describes driver relation. Currently, when we ‘grep’ the keyword ‘oracle’ there is no oracle relation installed, the output is empty when we run:

grep -i oracle /etc/odbcinst.ini

Our next step is to Install Oracle ODBC driver package:

rpm -ivh /tmp/oracle-instantclient19.12-odbc-19.12.0.0.0-1.x86_64.rpm

The ‘oracle-instantclient*-odbc’ package contains a script that will update the ‘/etc/odbcinst.ini’ configuration automatically:

cd /usr/lib/oracle/19.12/client64/bin
./odbc_update_ini.sh / /usr/lib/oracle/19.12/client64/lib

It will print:

 *** ODBCINI environment variable not set,defaulting it to HOME directory!

Now when we print the file on the screen:

cat /etc/odbcinst.ini

We will see that there is the Oracle 19 ODBC driver section added at the end of the file::

[Oracle 19 ODBC driver]
Description     = Oracle ODBC driver for Oracle 19
Driver          = /usr/lib/oracle/19.12/client64/lib/libsqora.so.19.1
Setup           =
FileUsage       =
CPTimeout       =
CPReuse         =

It’s important to check if there are no errors produced in the output when executing the ‘ldd’ command. This ensures that the dependencies are satisfied and accessible and there are no conflicts with the library versioning:

ldd /usr/lib/oracle/19.12/client64/lib/libsqora.so.19.1

It will print something similar like:

linux-vdso.so.1 (0x00007fff121b5000)
libdl.so.2 => /lib64/libdl.so.2 (0x00007fb18601c000)
libm.so.6 => /lib64/libm.so.6 (0x00007fb185c9a000)
libpthread.so.0 => /lib64/libpthread.so.0 (0x00007fb185a7a000)
libnsl.so.1 => /lib64/libnsl.so.1 (0x00007fb185861000)
librt.so.1 => /lib64/librt.so.1 (0x00007fb185659000)
libaio.so.1 => /lib64/libaio.so.1 (0x00007fb185456000)
libresolv.so.2 => /lib64/libresolv.so.2 (0x00007fb18523f000)
libclntsh.so.19.1 => /usr/lib/oracle/19.12/client64/lib/libclntsh.so.19.1 (0x00007fb1810e6000)
libclntshcore.so.19.1 => /usr/lib/oracle/19.12/client64/lib/libclntshcore.so.19.1 (0x00007fb180b42000)
libodbcinst.so.2 => /lib64/libodbcinst.so.2 (0x00007fb18092c000)
libc.so.6 => /lib64/libc.so.6 (0x00007fb180567000)
/lib64/ld-linux-x86-64.so.2 (0x00007fb1864da000)
libnnz19.so => /usr/lib/oracle/19.12/client64/lib/libnnz19.so (0x00007fb17fdba000)
libltdl.so.7 => /lib64/libltdl.so.7 (0x00007fb17fbb0000)

When we executed the ‘odbc_update_ini.sh’ script, a new DSN (data source name) file was made in ‘/root/.odbc.ini’. This is a sample configuration ODBC configuration file which describes what settings this version of ODBC driver supports.

Let’s move this configuration file from the user directories to a location accessible system-wide:

cat /root/.odbc.ini | sudo tee -a /etc/odbc.ini

And remove the file from the user directory completely:

rm /root/.odbc.ini

This way, every user in the system will use only this one ODBC configuration file.

We can now alter the existing configuration – /etc/odbc.ini. I’m highlighting things that have been changed from the defaults:

[Oracle11g]
AggregateSQLType = FLOAT
Application Attributes = T
Attributes = W
BatchAutocommitMode = IfAllSuccessful
BindAsFLOAT = F
CacheBufferSize = 20
CloseCursor = F
DisableDPM = F
DisableMTS = T
DisableRULEHint = T
Driver = Oracle 19 ODBC driver
DSN = Oracle11g
EXECSchemaOpt =
EXECSyntax = T
Failover = T
FailoverDelay = 10
FailoverRetryCount = 10
FetchBufferSize = 64000
ForceWCHAR = F
LobPrefetchSize = 8192
Lobs = T
Longs = T
MaxLargeData = 0
MaxTokenSize = 8192
MetadataIdDefault = F
QueryTimeout = T
ResultSets = T
ServerName = //10.1.10.15:1521/xe
SQLGetData extensions = F
SQLTranslateErrors = F
StatementCache = F
Translation DLL =
Translation Option = 0
UseOCIDescribeAny = F
UserID = system
Password = oracle

DNS – Data source name. Should match the section name in brackets, e.g.:[Oracle11g]
ServerName – Oracle server address
UserID – Oracle user name
Password – Oracle user password

To test the connection from the command line, let’s use the isql command-line tool which should simulate the ODBC connection akin to what the Zabbix is doing when gathering metrics:

isql -v Oracle11g

The isql command in this example picks up the ODBC settings (Username, Password, Server address) from the odbc.ini file. All we have to do is reference the particular DSN – Oracle11g

On the other hand, if we do not prefer to keep the password on the filesystem (/etc/odbc.ini), we can erase the lines ‘UserID’ and ‘Password’. Then we can test the ODBC connection with:

isql -v Oracle11g 'system' 'oracle'

In case of a successful connection it should print:

+---------------------------------------+
| Connected!                            |
|                                       |
| sql-statement                         |
| help [tablename]                      |
| quit                                  |
|                                       |
+---------------------------------------+
SQL>

And that’s it for the ODBC configuration! Now we should be able to apply the Oracle by ODBC template in Zabbix

Don’t forget that we also need to provide the necessary Oracle credentials to start collecting Oracle database metrics:

The lessons learned in this blog post can be easily applied to ODBC monitoring and troubleshooting in general, not just Oracle. If you’re having any issues or wish to share your experience with ODBC or Oracle database monitoring – feel free to leave us a comment!

Maintaining Zabbix API token via JavaScript

Post Syndicated from Aigars Kadiķis original https://blog.zabbix.com/maintaining-zabbix-api-token-via-javascript/15561/

In this blog post, we will talk about maintaining and storing the Zabbix API session key in an automated fashion. The blog post builds upon the Close problem automatically via Zabbix API subject and can be used as extra configuration for this particular use-case. The blog post also shares a great example of synthetic monitoring by way of JavaScript preprocessing – how to emulate a scenario in an automated fashion and get alerted in case of any problems.

Prerequisites

First, let us create the Zabbix API user and user macros where we will store our username, password, Zabbix URL and the API session key.

1) Open “Administration” => “Users”. Create a new user ‘api’ with password ‘zabbix’. At the permissions tab set User Type “Zabbix Super Admin”.

2) Go to “Administration” => “General” => “Macros”. Configure base characteristics:

      {$Z_API_PHP} = http://demo.zabbix.demo/api_jsonrpc.php
     {$Z_API_USER} = api
 {$Z_API_PASSWORD} = zabbix
{$Z_API_SESSIONID} =

It’s OK to leave {$Z_API_SESSIONID} empty for now.

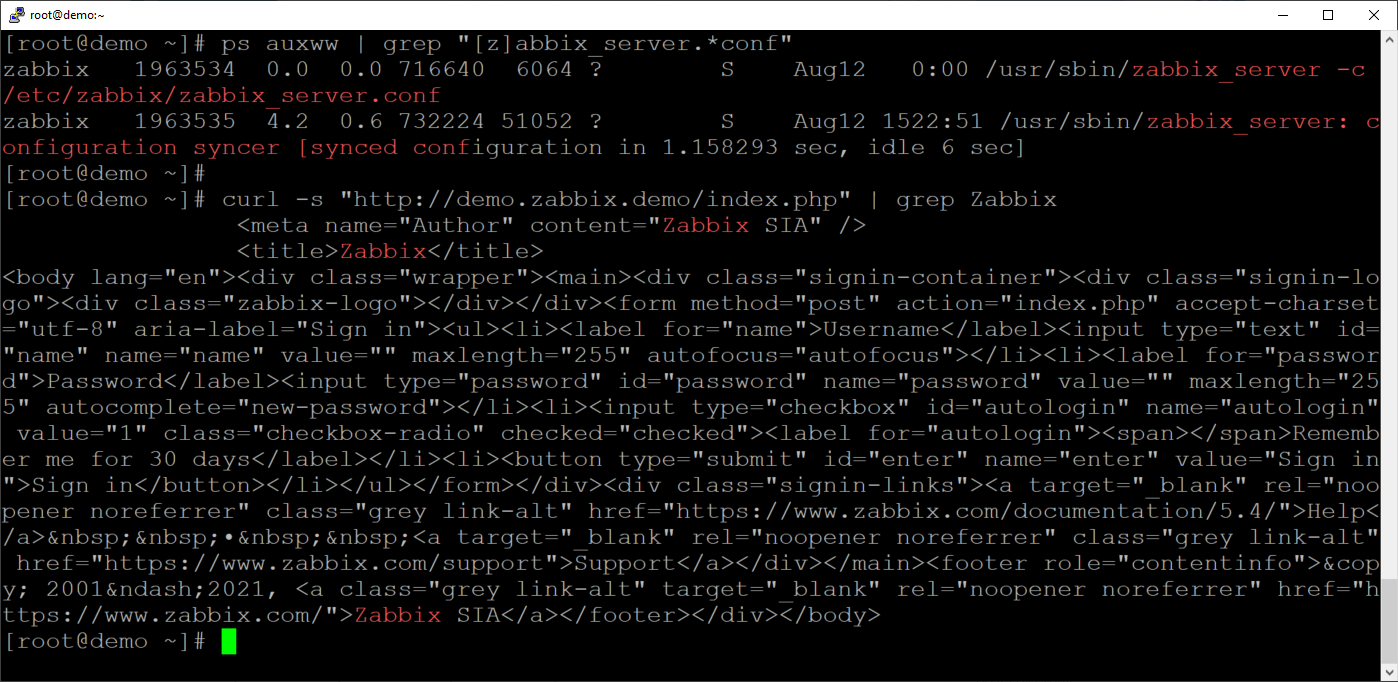
3) Let’s check if the Zabbix backend server can reach the Zabbix frontend server. Make sure that you are logged into the Zabbix backend server by looking up the zabbix_server process:

ps auxww | grep "[z]abbix_server.*conf"

Ensure that we can reach the Zabbix frontend by curling the Zabbix frontend server from the Zabbix backend server:

curl -s "http://demo.zabbix.demo/index.php" | grep Zabbix

4) Download template “Check and repair Zabbix API token” and import it in your instance.

5) Create a new host with an Agent interface and link the template. The IP address of the host does not matter. The template will use an agentless check to do the monitoring, it will use an “HTTP agent” item.

How it works

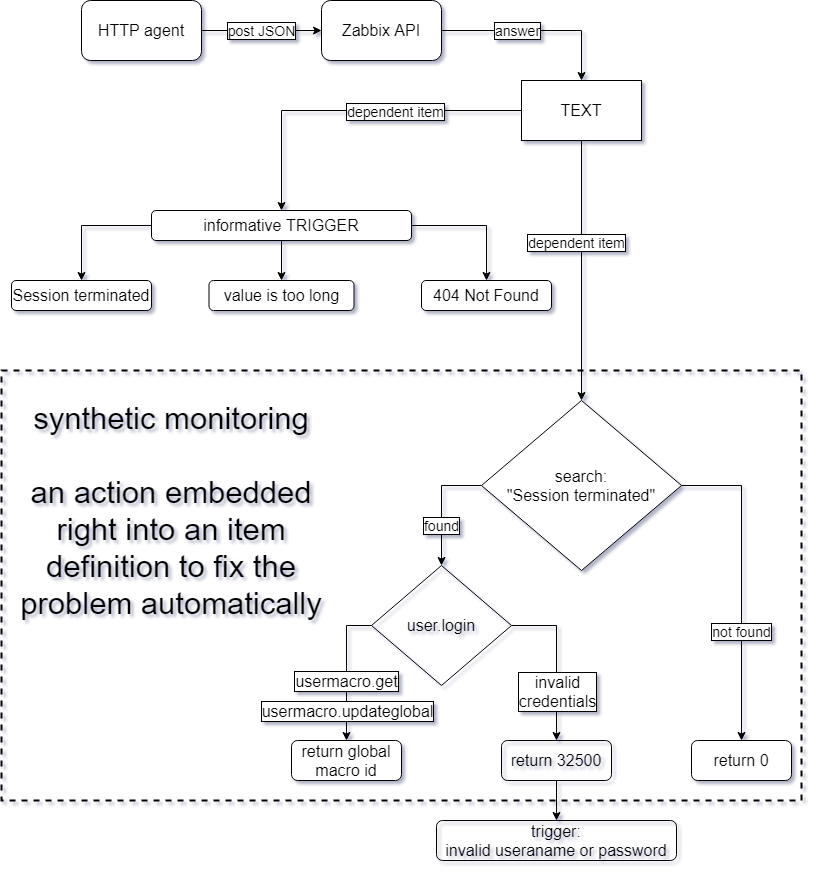
Our goal for today is to figure out a way to keep the Zabbix API authentication token up to date in a user macro. This way we can reuse the macro repeatedly for items, action operations and scripts that require for us to use the Zabbix API. We need to ensure that even if the token changes, the macro gets automatically updated with the new token value! Let’s try and understand each step of the underlying workflow required for us to achieve this goal.

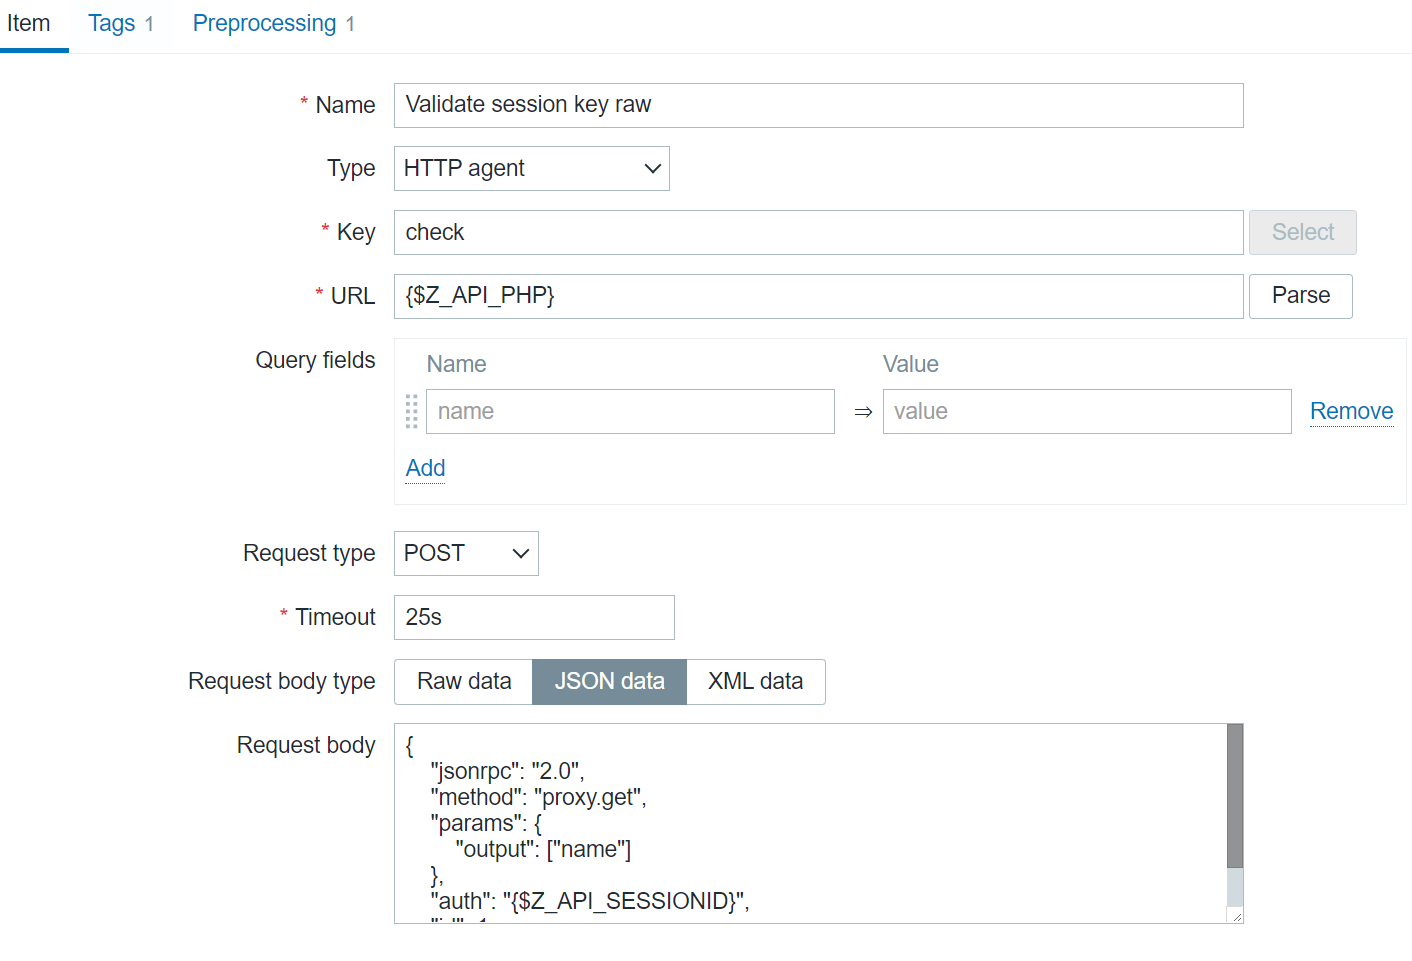
The first component of our workflow is the “Validate session key raw” item. This is an HTTP agent item that performs a POST request with an arbitrary method – proxy.get in this case, but we could have used ANY other method. We simply want to check if an arbitrary Zabbix API call can be executed with the current {$Z_API_SESSIONID} macro value.

The second part of the workflow is the “Repair session key” dependent item. This item utilizes the JavaScript preprocessing step with custom JavaScript code to check the values obtained by the previous item and generate a new authentication token if that is necessary.

The third item – “Status”, is another dependent item that uses regular expression preprocessing steps to check for different error messages or status codes in the value of the “Validate session key raw” item. Most of the triggers defined in this template will react to the values obtained by this item.


Below you can see the full underlying workflow:

Code-wise, the magic is implemented with the following JavaScript code snippet:

if (value.match(/Session terminated/)) {

var req = new CurlHttpRequest();

// Zabbix API
var json_rpc='{$Z_API_PHP}'

// lib curl header
req.AddHeader('Content-Type: application/json');

// First request to get authentication token
var token =  JSON.parse(req.Post(json_rpc,
'{"jsonrpc":"2.0","method":"user.login","params":{"user":"{$Z_API_USER}","password":"{$Z_API_PASSWORD}"},"id":1,"auth":null}'
));

// If authentication was unsuccessful
if ( token.error )
{
// Login name or password is incorrect
return 32500;
}

else {
// Update the macro

// Get the global macro ID
// We cannot plot here a very native Zabbix macro because it will be automatically expanded
// Must use a workaround to distinguish a dollar sign from the actual macro name and merge with '+'
var id = JSON.parse(req.Post(json_rpc,
'{"jsonrpc":"2.0","method":"usermacro.get","params":{"output":["globalmacroid"],"globalmacro":true,"filter":{"macro":"{$'+'Z_API_SESSIONID'+'}"}},"auth":"'+token.result+'","id":1}'
)).result[0].globalmacroid;

// This line contains a keyword '+value+' which will grab exactly the previous value outside this JavaScript snippet
var overwrite = JSON.parse(req.Post(json_rpc,
'{"jsonrpc":"2.0","method":"usermacro.updateglobal","params":{"globalmacroid":"'+id+'","value":"'+token.result+'"},"auth":"'+token.result+'","id":1}'
));

// Return the id (an integer) of the macro, which was updated
return overwrite.result.globalmacroids[0];
}

} else {
return 0;
}

Throughout the JavaScript code, we are extracting a value from one step and using that as an input for the next step.

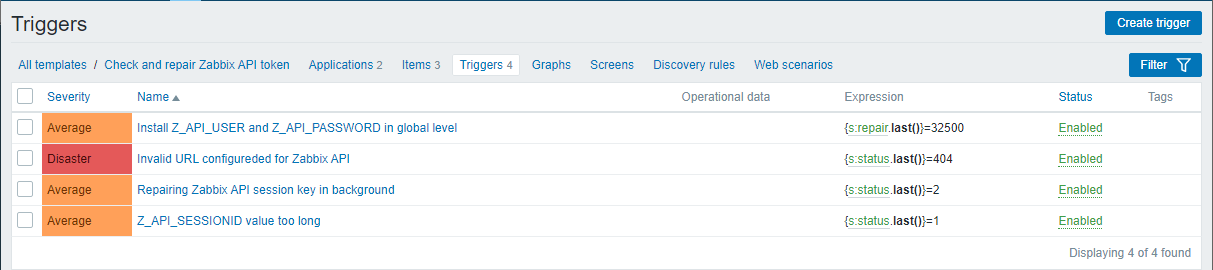
After the data has been collected, the values are analyzed by 4 triggers. 3 out of these 4 triggers prints a misconfiguration problem that requires a human investigation. We also have a “repairing Zabbix API session key in background” title, which is the main trigger that indicates a token has been expired and repair automatically.

And that’s it – now any integration that requires a Zabbix API authentication token can receive the current token value by referencing the user macro that we created in the article. We’ve ensured that the token is always going to stay up to date and in case of any issues, we will receive an alert from Zabbix!

Setting up manual ticket creation using Zabbix frontend scripts

Post Syndicated from Nathan Liefting original https://blog.zabbix.com/setting-up-manual-ticket-creation-using-zabbix-frontend-scripts/15550/

In this blog post, you will learn how to set up manual ticket creation through the use of Zabbix frontend scripts. We will use Jira Service Desk as an example, but this guide should work for any type of service desk or help desk system, as we can apply this technique for other systems in a similar fashion.


Introduction

Zabbix already has the ability to automatically create tickets through the use of Media Types and Actions. This way we can filter out certain issues based on host groups, severity, tags and a lot more. But what if your action misses a problem because of your filters? Or what if you simply want to limit the number of tickets that are created by actions? That’s when we can use Zabbix Frontend Scripts to manually create a ticket from the Zabbix Frontend, while automatically filling in the ticket info with a click of a button.

Let’s check take a look at how we can achieve this.

How to

Setting up Jira

As mentioned, in this example we’ll use Jira. Why? Simply because personally I am a big fan of the Atlassian product suite and it’s what I had available on hand. Feel free to apply this technique to any service desk system out there though, as we are definitely not limited to Jira Service Desk.

To make the frontend script work we are going to need a working integration (Media Type in Zabbix terminology). You can check out https://zabbix.com/integrations to see if the service desk system of your choosing is already available out of the box. If not, you can always use a community solution or build your own integration. Jira Service Desk is already available though, meaning we can use the settings pre-defined in Zabbix. For Jira Service Desk we’ll need:

  • jira_url – The actual URL of your Jira instance. For example: https://company.atlassian.net/
  • jira_user– Jira user login, in our instance this is my email.
  • jira_project_key– Numeric key of the Jira project. We can find this in the URL once we go to our Jira Service Desk project settings. For example: pid=10054
  • jira_issue_type– Number of the issue type to be used when creating new issues from Zabbix. Check out the Project Settings -> Request types and use the number in the URL for the request type you’d like to use.
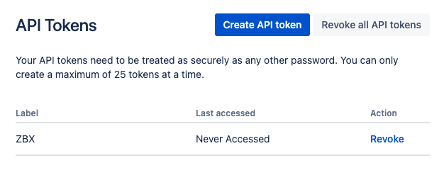
  • jira_password– Password or API token. We can create this at: https://id.atlassian.com/manage/api-tokens

Make sure to save the API token somewhere, as you can only copy it over once.

Setting up the frontend script

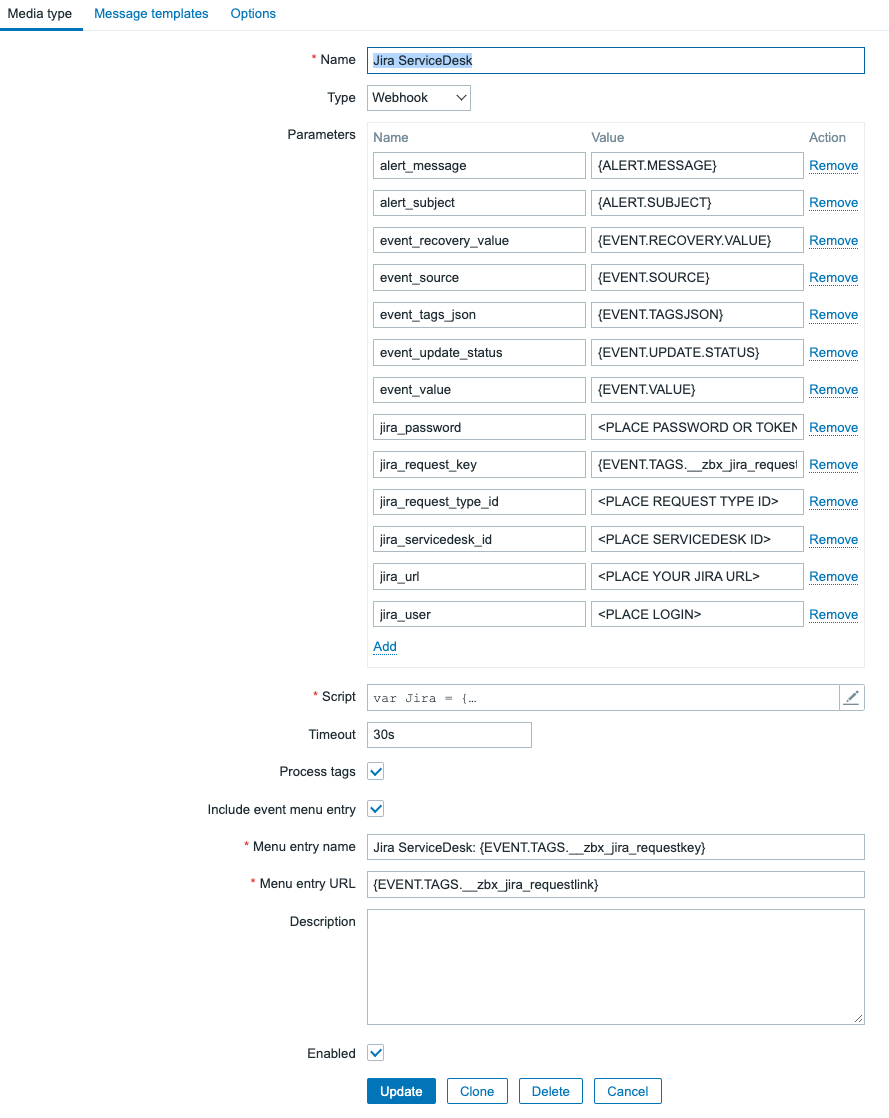
Now once you have set up everything on the Jira (or which ever other service desk you use) side, we can continue with the next step which is setting up the Frontend script. If we look at the particular Zabbix Media Type, we can see something interesting.

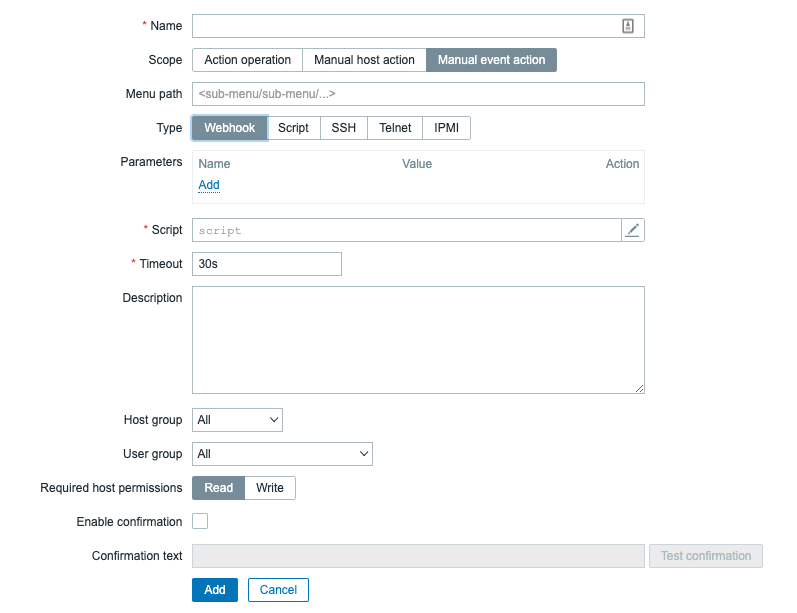
The Jira ServiceDesk default Media Type is of course already set up, but that’s not the most interesting part – although super useful nevertheless. Looking at the Media Type we have our Parameters and the Javascript script. If we take a look at the Frontend Script configuration and compare it with our Media Type, that’s when it gets interesting:

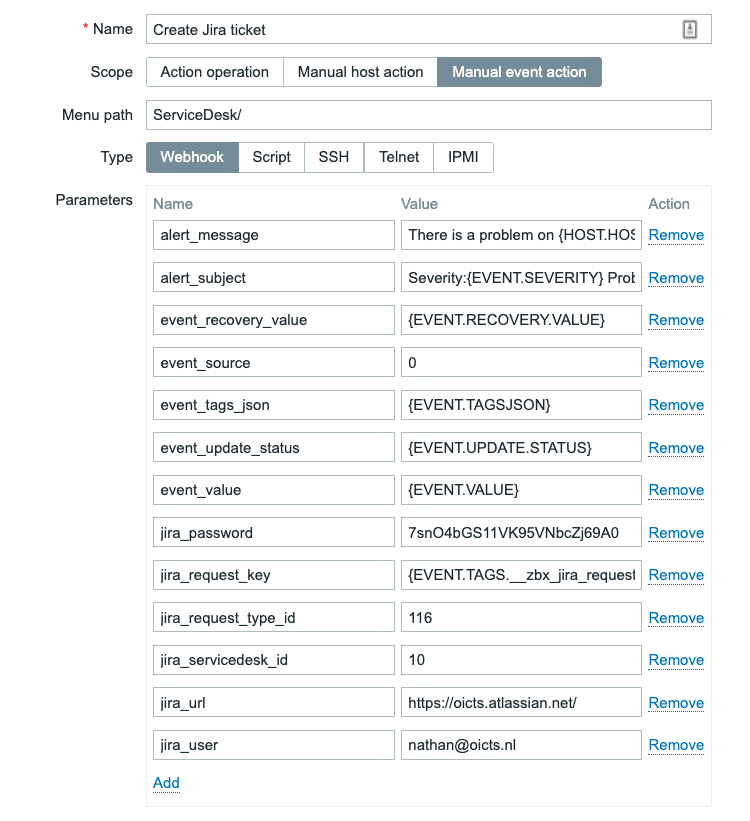
With release of Zabbix 5.4 it is now possible possible for us to execute webhooks directly with a Frontend script, as we can see we have the same Parameter and Script options available in this section. Meaning that most of what we have to do is navigate to Administration -> Scripts and copy over the Media Type Parameters and script. So, let’s do that and fill in the parameters with default values:

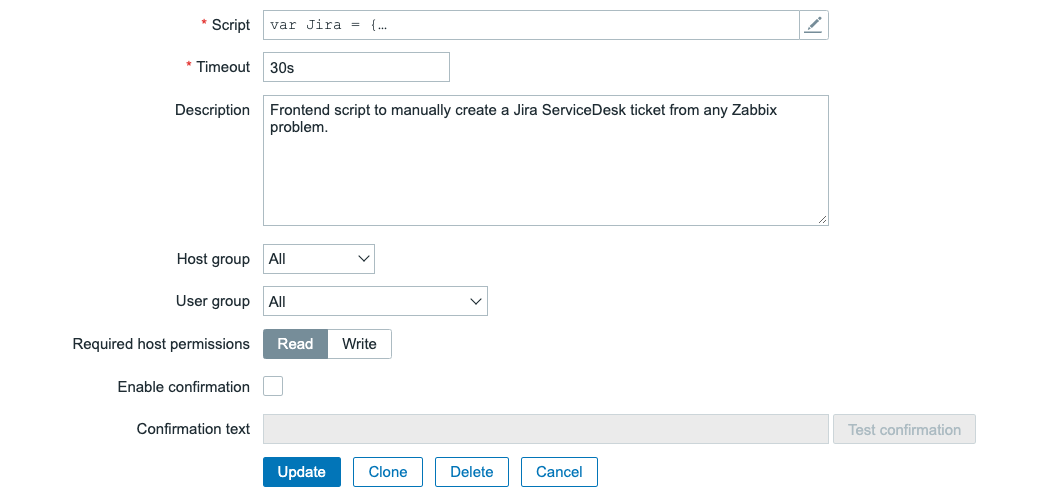
Do not forget to do the same thing for the script part:

Once you’ve set this up, we aren’t completely done yet. We have copied the default parameter values as defined by Zabbix in the default Jira ServiceDesk Media Type. Now that we’ve copied those from the Media Type to the Frontend script, we still need to edit them to reflect our Jira ServiceDesk parameters. We need to edit the following fields:

alert_message: We can add our own alert message here, which will be filling out the body of our Jira Service Desk ticket. Use the Zabbix built-in macro’s wisely here. Something like:

There is a problem on {HOST.HOST} - {EVENT.NAME} with severity: {EVENT.SEVERITY} since {EVENT.DATE}

alert_subject: This will be the subject of our Jira ticket, again heavily reliant on Built-in Macro’s. It can be something like:

Severity:{EVENT.SEVERITY} Problem on:{HOST.HOST} - {EVENT.NAME}

event_source: We set this to 0, meaning it is a problem. Normally this is dynamic, but we can make it static for the script.

0


Then, as discussed in the earlier part of this post we need to edit the following parameters:

jira_password 

jira_request_type_id 

jira_servicedesk_id

jira_url 

jira_user 


Once you have set up all of those parameters, it should now look like this:

The result

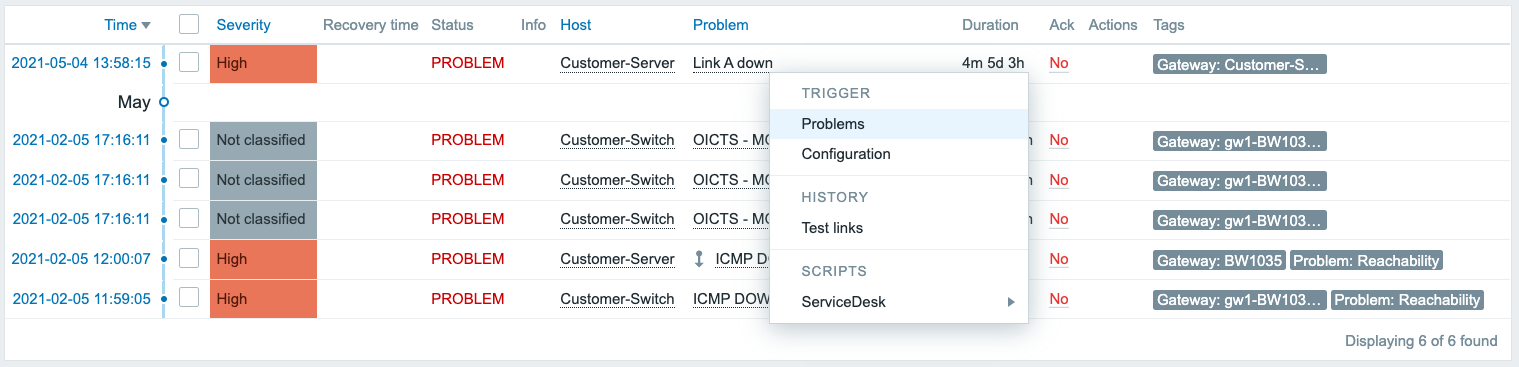
Now, if all of the information from the previous steps is filled in, we can test the integration. Navigate to Monitoring -> Problems and click on any of the problem names:

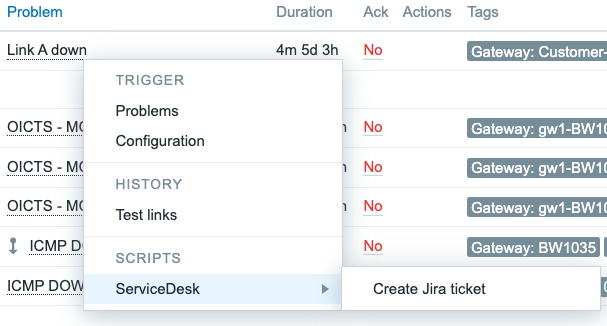
Which will open a dropdown menu. Go to ServiceDesk and click the Create Jira ticket button.

This will then kick of our new Zabbix frontend script. The webhook script will be using the Jira API to create a ticket and voila:

A ticket is created, right from the frontend. It’s just that easy.

Conclusion

Using Media Types is great and I would definitely recommend using them. If you have set up the correct filtering using host groups, severities, tags and perhaps more than that, you can already keep the ticket count to a minimum. But there’s always a downside to using a lot of filters, you might miss something. That’s where our Frontend Script implementation kicks in. Maybe your filter missed a ticket, maybe you don’t want automated tickets at all. We can use the script to manually create tickets, quickly from the frontend and solve that issue.

You’ve now got a powerful way to do so, fully compatible with Zabbix most of the times out of the box! As Zabbix adds more and more of this functionality it becomes easier and easier to do so, if you just know where to look.

I hope you enjoyed reading this blog post and if you have any questions or need help configuring anything on your Zabbix setup feel free to contact me and the team at Opensource ICT Solutions. We build a ton of cool integrations like this and much more!

Nathan Liefting

https://oicts.com

A close up of a logo Description automatically generated

Extend your Low-level discovery rules with overrides

Post Syndicated from Arturs Lontons original https://blog.zabbix.com/extend-your-low-level-discovery-rules-with-overrides/15496/

Overrides is an often overlooked feature of Low-level discovery that makes the discovery of different entities in your environment so much more flexible. In this blog post, we will take a look at how overrides work and how we can use them to extend our Low-level discovery rules with additional logic.


When it comes to Zabbix, Low-level discovery (also known as LLD) is a vital part of the Zabbix feature set. Automated creation of items, triggers, graphs, and hosts, based on existing entities is invaluable in larger environments, where creating these entities by hand is simply not feasible.

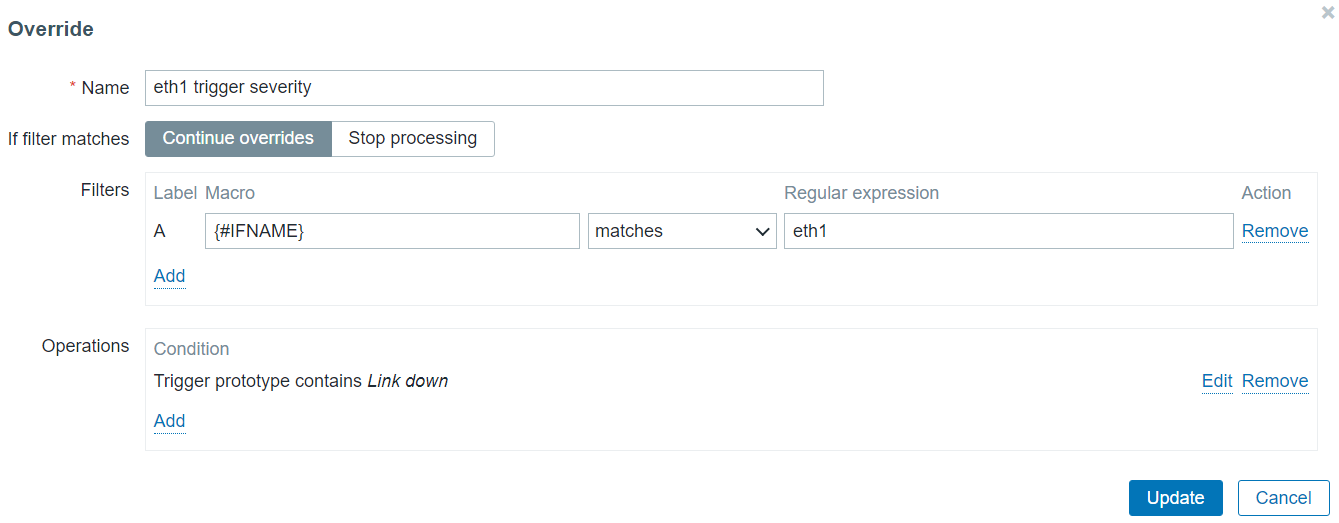
But what about use cases where some of your entities need to be created in a somewhat unique fashion compared to the rest of the discovered entities? Say, one of the items needs to have a unique update interval because it’s more critical than the rest. Or what if some of my network interfaces need to have lower trigger severities since they are not mission-critical?

Before Zabbix 5.0 this used to be a common question – how can I work around use cases like that? The only solution used to be creating separate discovery rules and utilizing LLD filters, for example:

LLD rule A discovers one set of entities with their own properties, and filters out everything else, while LLD rule B discovers the few unique entities that require different configuration parameters while filtering out the entities already discovered by the LLD rule A.

Not very elegant, is it? You can also imagine the LLD rule bloat that would occur in large infrastructures with many unique entities. Thankfully, overrides introduced in Zabbix 5.0 address the question in a very efficient manner.

Low-level discovery overrides

Let’s recall how LLD works. Under the hood LLD is a JSON array with LLD macro and macro value pairs:

[{"{#IFNAME}":"eth0"},{"{#IFNAME}":"lo"},{"{#IFNAME}":"eth2"},{"{#IFNAME}":"eth1"}]

In this small example of an LLD JSON, we can see each of our interfaces next to the LLD macro – these are our discovered entities. With overrides, we can define modify objects related to each of these discovered entities.

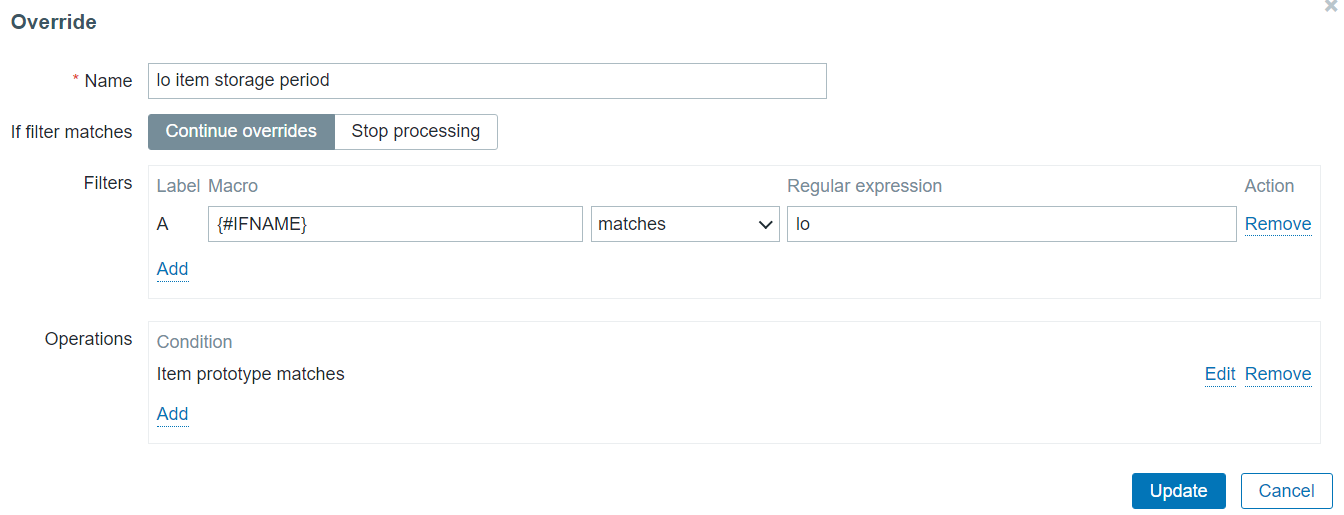
Overrides are available for each of your LLD rules. Once you open the particular LLD rule, navigate to the “Overrides” tab and add a new override. There are three parts to Overrides:

  • Filters define which of the discovered entities we are going to modify with this override. This is done by matching against the contents of a specific LLD macro or simply checking if a specific LLD macro exists for a discovered entity.
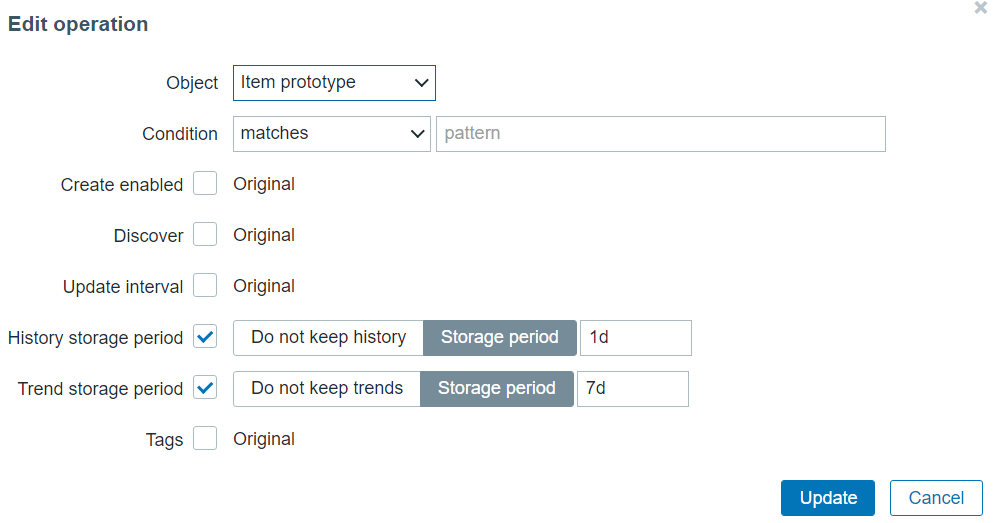
  • Operation conditions define which of the objects (items, triggers, graphs, hosts) we are going to override for the discovered entity.
  • Lastly, we have to define which of the object attributes we are going to change (item update intervals, trigger severity, item history storage period, etc.)

Multiple overrides in a single Low-level discovery rule

In use cases where we have defined multiple overrides in a single LLD rule, there are few things that we need to consider. First off, the override order does matter! The overrides are displayed in a reorderable drag-and-drop list, so we can change the ordering of the overrides by dragging them around.

Secondly, when defining configuring an LLD override we can select from two behaviors if the override matches the discovered entity:

  • Continue overrides – subsequent overrides for the current entity will be processed.
  • Stop processing – subsequent overrides for the current entity will be ignored.

For this reason, the order of our overrides can have a significant impact, especially if we have selected to Stop processing subsequent overrides if one of our overrides matches a discovered entity.

 Network interface discovery override

Let’s take a look at an example of how we can use overrides and define unique settings for some of the discovered network interfaces.

Without any overrides, we can see that we are discovering interfaces eth0, eth1, eth2, and lo. All of them have the same update interval and history/trend retention settings. When we open up the trigger section, we can also see that the triggers for all of the interfaces have the same severity settings, all are enabled and discovered.

Discovered triggers without using any overrides

Now let’s implement a few overrides.

  • Change severity to high for the eth1 interface down trigger
  • Change the history/trend storage period for the items created for the lo interface

Let’s define our first override. We are going to be overriding a trigger prototype on {#IFNAME} matches eth1.
Override only interfaces that match eth1 in the {#IFNAME} macro value

For this entity, we will be changing the severity of the Trigger prototype containing the string “Link down” in the trigger prototype name. Change trigger severity only for triggers that contain Link down in their name

For our second override let’s change the history and trend storage period on items for the entity where {#IFNAME} matches lo, since storing history data for the loopback interface isn’t critical for us.

Override only interfaces that match lo in the {#IFNAME} macro value

To apply this override on the items created from any item prototype in this discovery rule, my operation condition is going to contain an empty matches pattern.

Change item History/Trend storage period for any item created for the lo interface 

Once we re-run the discovery rule, we will see that the changes have been applied to our items and triggers created from the corresponding prototypes.

Note the lo interface History/Trend storage periods – they have been changed as per our override

Note the eth1 trigger severity – it’s now High, as per our override

This way we can finally create any discovered object with a set of unique properties, despite our object prototypes having static settings. The example above is just a general use case of how we can utilize overrides – there can be many complex scenarios for utilizing overrides, especially if we take the execution order and stop/continue processing settings into account. If you are interested in the full list of changes that we can perform on different objects by using overrides, feel free to take a look at the Overrides section in our documentation.

Hopefully, the blog post gave you a glimpse of the flexibility that the override feature is capable of delivering. If you have an interesting use case for overrides or any questions/comments – you are very much welcome to share those in the comments section below the post!

Code a Spectrum-style Crazy Golf game | Wireframe #54

Post Syndicated from Ryan Lambie original https://www.raspberrypi.org/blog/code-a-spectrum-style-crazy-golf-game-wireframe-54/

Putt the ball around irrational obstacles in our retro take on golf. Mark Vanstone has the code

First released by Mr. Micro in 1983 – then under the banner of Sinclair Research – Krazy Golf was, confusingly, also called Crazy Golf. The loading screen featured the Krazy spelling, but on the cover, it was plain old Crazy Golf.

Designed for the ZX Spectrum, the game provided nine holes and a variety of obstacles to putt the ball around. Crazy Golf was released at a time when dozens of other games were hitting the Spectrum market, and although it was released under the Sinclair name and reviewed in magazines such as Crash, it didn’t make much impact. The game itself employed a fairly rudimentary control system, whereby the player selects the angle of the shot at the top left of the screen, sets the range via a bar along the top, and then presses the RETURN key to take the shot.

The game was called Crazy Golf on the cover, but weirdly, the loading screen spelled the name as Krazy Golf. The early games industry was strange.

If you’ve been following our Source Code articles each month, you will have seen the pinball game where a ball bounces off various surfaces. In that example, we used a few shortcuts to approximate the bounce angles. Here, we’re only going to have horizontal and vertical walls, so we can use some fairly straightforward maths to calculate more precisely the new angle as the ball bounces off a surface. In the original game, the ball was limited to only 16 angles, and the ball moved at the same speed regardless of the strength of the shot. We’re going to improve on this a bit so that there’s more flexibility around the shot angle; we’ll also get the ball to start moving fast and then reduce its speed until it stops.

Horizontal or vertical obstruction?

To make this work, we need to have a way of defining whether an obstruction is horizontal or vertical, as the calculation is different for each. We’ll have a background graphic showing the course and obstacles, but we’ll also need another map to check our collisions. We need to make a collision map that just has the obstacles on it, so we need a white background; mark all the horizontal surfaces red and all the vertical surfaces blue.

As we move the ball around the screen (in much the same way as our pinball game) we check to see if it has collided with a surface by sampling the colours of the pixels from the collision map. If the pixel’s blue, we know that the ball has hit a vertical wall; if it’s red, the wall’s horizontal. We then calculate the new angle for the ball. If we mark the hole as black, then we can also test for collision with that – if the ball’s in the hole, the game ends.

The pointer’s angle is rotated using degrees, but we’ll use radians for our ball direction as it will simplify our movement and bounce calculations.

Get the code

We have our ball bouncing mechanism, so now we need our user interaction system. We’ll use the left and right arrow keys to rotate our pointer, which designates the direction of the next shot. We also need a range-setting gizmo, which will be shown as a bar at the top of the screen. We can make that grow and shrink with the up and down arrows.

Then when we press the RETURN key, we transfer the pointer angle and the range to the ball and watch it go. We ought to count each shot so that we can display a tally to the player once they’ve putted the ball into the hole. From this point, it’s a simple task to create another eight holes – and then you’ll have a full crazy golf game!

Here’s Mark’s code for a simple golf game. To get it running on your system, you’ll need to install Pygame Zero. And for the full code, head to our Github.

Get your copy of Wireframe issue 55

You can read more features like this one in Wireframe issue 54, available directly from Raspberry Pi Press — we deliver worldwide.

And if you’d like a handy digital version of the magazine, you can also download issue 54 for free in PDF format.

The post Code a Spectrum-style Crazy Golf game | Wireframe #54 appeared first on Raspberry Pi.

Build Next-Generation Microservices with .NET 5 and gRPC on AWS

Post Syndicated from Matt Cline original https://aws.amazon.com/blogs/devops/next-generation-microservices-dotnet-grpc/

Modern architectures use multiple microservices in conjunction to drive customer experiences. At re:Invent 2015, AWS senior project manager Rob Brigham described Amazon’s architecture of many single-purpose microservices – including ones that render the “Buy” button, calculate tax at checkout, and hundreds more.

Microservices commonly communicate with JSON over HTTP/1.1. These technologies are ubiquitous and human-readable, but they aren’t optimized for communication between dozens or hundreds of microservices.

Next-generation Web technologies, including gRPC and HTTP/2, significantly improve communication speed and efficiency between microservices. AWS offers the most compelling experience for builders implementing microservices. Moreover, the addition of HTTP/2 and gRPC support in Application Load Balancer (ALB) provides an end-to-end solution for next-generation microservices. ALBs can inspect and route gRPC calls, enabling features like health checks, access logs, and gRPC-specific metrics.

This post demonstrates .NET microservices communicating with gRPC via Application Load Balancers. The microservices run on AWS Graviton2 instances, utilizing a custom-built 64-bit Arm processor to deliver up to 40% better price/performance than x86.

Architecture Overview

Modern Tacos is a new restaurant offering delivery. Customers place orders via mobile app, then they receive real-time status updates as their order is prepared and delivered.

The tutorial includes two microservices: “Submit Order” and “Track Order”. The Submit Order service receives orders from the app, then it calls the Track Order service to initiate order tracking. The Track Order service provides streaming updates to the app as the order is prepared and delivered.

Each microservice is deployed in an Amazon EC2 Auto Scaling group. Each group is behind an ALB that routes gRPC traffic to instances in the group.

Shows the communication flow of gRPC traffic from users through an ALB to EC2 instances.
This architecture is simplified to focus on ALB and gRPC functionality. Microservices are often deployed in
containers for elastic scaling, improved reliability, and efficient resource utilization. ALB, gRPC, and .NET all work equally effectively in these architectures.

Comparing gRPC and JSON for microservices

Microservices typically communicate by sending JSON data over HTTP. As a text-based format, JSON is readable, flexible, and widely compatible. However, JSON also has significant weaknesses as a data interchange format. JSON’s flexibility makes enforcing a strict API specification difficult — clients can send arbitrary or invalid data, so developers must write rigorous data validation code. Additionally, performance can suffer at scale due to JSON’s relatively high bandwidth and parsing requirements. These factors also impact performance in constrained environments, such as smartphones and IoT devices. gRPC addresses all of these issues.

gRPC is an open-source framework designed to efficiently connect services. Instead of JSON, gRPC sends messages via a compact binary format called Protocol Buffers, or protobuf. Although protobuf messages are not human-readable, they utilize less network bandwidth and are faster to encode and decode. Operating at scale, these small differences multiply to a significant performance gain.

gRPC APIs define a strict contract that is automatically enforced for all messages. Based on this contract, gRPC implementations generate client and server code libraries in multiple programming languages. This allows developers to use higher-level constructs to call services, rather than programming against “raw” HTTP requests.

gRPC also benefits from being built on HTTP/2, a major revision of the HTTP protocol. In addition to the foundational performance and efficiency improvements from HTTP/2, gRPC utilizes the new protocol to support bi-directional streaming data. Implementing real-time streaming prior to gRPC typically required a completely separate protocol (such as WebSockets) that might not be supported by every client.

gRPC for .NET developers

Several recent updates have made gRPC more useful to .NET developers. .NET 5 includes significant performance improvements to gRPC, and AWS has broad support for .NET 5. In May 2021, the .NET team announced their focus on a gRPC implementation written entirely in C#, called “grpc-dotnet”, which follows C# conventions very closely.

Instead of working with JSON, dynamic objects, or strings, C# developers calling a gRPC service use a strongly-typed client, automatically generated from the protobuf specification. This obviates much of the boilerplate validation required by JSON APIs, and it enables developers to use rich data structures. Additionally, the generated code enables full IntelliSense support in Visual Studio.

For example, the “Submit Order” microservice executes this code in order to call the “Track Order” microservice:

using var channel = GrpcChannel.ForAddress("https://track-order.example.com");

var trackOrderClient = new TrackOrder.Protos.TrackOrder.TrackOrderClient(channel);

var reply = await trackOrderClient.StartTrackingOrderAsync(new TrackOrder.Protos.Order
{
    DeliverTo = "Address",
    LastUpdated = Timestamp.FromDateTime(DateTime.UtcNow),
    OrderId = order.OrderId,
    PlacedOn = order.PlacedOn,
    Status = TrackOrder.Protos.OrderStatus.Placed
});

This code calls the StartTrackingOrderAsync method on the Track Order client, which looks just like a local method call. The method intakes a data structure that supports rich data types like DateTime and enumerations, instead of the loosely-typed JSON. The methods and data structures are defined by the Track Order service’s protobuf specification, and the .NET gRPC tools automatically generate the client and data structure classes without requiring any developer effort.

Configuring ALB for gRPC

To make gRPC calls to targets behind an ALB, create a load balancer target group and select gRPC as the protocol version. You can do this through the AWS Management Console, AWS Command Line Interface (CLI), AWS CloudFormation, or AWS Cloud Development Kit (CDK).

Screenshot of the AWS Management Console, showing how to configure a load balancer's target group for gRPC communication.

This CDK code creates a gRPC target group:

var targetGroup = new ApplicationTargetGroup(this, "TargetGroup", new ApplicationTargetGroupProps
{
    Protocol = ApplicationProtocol.HTTPS,
    ProtocolVersion = ApplicationProtocolVersion.GRPC,
    Vpc = vpc,
    Targets = new IApplicationLoadBalancerTarget {...}
});

gRPC requests work with target groups utilizing HTTP/2, but the gRPC protocol enables additional features including health checks, request count metrics, access logs that differentiate gRPC requests, and gRPC-specific response headers. gRPC also works with native ALB features like stickiness, multiple load balancing algorithms, and TLS termination.

Deploy the Tutorial

The sample provisions AWS resources via the AWS Cloud Development Kit (CDK). The CDK code is provided in C# so that .NET developers can use a familiar language.

The solution deployment steps include:

  • Configuring a domain name in Route 53.
  • Deploying the microservices.
  • Running the mobile app on AWS Device Farm.

The source code is available on GitHub.

Prerequisites

For this tutorial, you should have these prerequisites:

Configure the environment variables needed by the CDK. In the sample commands below, replace AWS_ACCOUNT_ID with your numeric AWS account ID. Replace AWS_REGION with the name of the region where you will deploy the sample, such as us-east-1 or us-west-2.

If you’re using a *nix shell such as Bash, run these commands:

export CDK_DEFAULT_ACCOUNT=AWS_ACCOUNT_ID
export CDK_DEFAULT_REGION=AWS_REGION

If you’re using PowerShell, run these commands:

$Env:CDK_DEFAULT_ACCOUNT="AWS_ACCOUNT_ID"
$Env:CDK_DEFAULT_REGION="AWS_REGION"
Set-DefaultAWSRegion -Region AWS_REGION

Throughout this tutorial, replace RED TEXT with the appropriate value.

Save the directory path where you cloned the GitHub repository. In the sample commands below, replace EXAMPLE_DIRECTORY with this path.

In your terminal or PowerShell, run these commands:

cd EXAMPLE_DIRECTORY/src/ModernTacoShop/Common/cdk
cdk bootstrap --context domain-name=PARENT_DOMAIN_NAME
cdk deploy --context domain-name=PARENT_DOMAIN_NAME

The CDK output includes the name of the S3 bucket that will store deployment packages. Save the name of this bucket. In the sample commands below, replace SHARED_BUCKET_NAME with this name.

Deploy the Track Order microservice

Compile the Track Order microservice for the Arm microarchitecture utilized by AWS Graviton2 processors. The TrackOrder.csproj file includes a target that automatically packages the compiled microservice into a ZIP file. You will upload this ZIP file to S3 for use by CodeDeploy. Next, you will utilize the CDK to deploy the microservice’s AWS infrastructure, and then install the microservice on the EC2 instance via CodeDeploy.

The CDK stack deploys these resources:

  • An Amazon EC2 Auto Scaling group.
  • An Application Load Balancer (ALB) using gRPC, targeting the Auto Scaling group and configured with microservice health checks.
  • A subdomain for the microservice, targeting the ALB.
  • A DynamoDB table used by the microservice.
  • CodeDeploy infrastructure to deploy the microservice to the Auto Scaling group.

If you’re using the AWS CLI, run these commands:

cd EXAMPLE_DIRECTORY/src/ModernTacoShop/TrackOrder/src/
dotnet publish --runtime linux-arm64 --self-contained
aws s3 cp ./bin/TrackOrder.zip s3://SHARED_BUCKET_NAME
etag=$(aws s3api head-object --bucket SHARED_BUCKET_NAME \
    --key TrackOrder.zip --query ETag --output text)
cd ../cdk
cdk deploy

The CDK output includes the name of the CodeDeploy deployment group. Use this name to run the next command:

aws deploy create-deployment --application-name ModernTacoShop-TrackOrder \
    --deployment-group-name TRACK_ORDER_DEPLOYMENT_GROUP_NAME \
    --s3-location bucket=SHARED_BUCKET_NAME,bundleType=zip,key=TrackOrder.zip,etag=$etag \
    --file-exists-behavior OVERWRITE

If you’re using PowerShell, run these commands:

cd EXAMPLE_DIRECTORY/src/ModernTacoShop/TrackOrder/src/
dotnet publish --runtime linux-arm64 --self-contained
Write-S3Object -BucketName SHARED_BUCKET_NAME `
    -Key TrackOrder.zip `
    -File ./bin/TrackOrder.zip
Get-S3ObjectMetadata -BucketName SHARED_BUCKET_NAME `
    -Key TrackOrder.zip `
    -Select ETag `
    -OutVariable etag
cd ../cdk
cdk deploy

The CDK output includes the name of the CodeDeploy deployment group. Use this name to run the next command:

New-CDDeployment -ApplicationName ModernTacoShop-TrackOrder `
    -DeploymentGroupName TRACK_ORDER_DEPLOYMENT_GROUP_NAME `
    -S3Location_Bucket SHARED_BUCKET_NAME `
    -S3Location_BundleType zip `
    -S3Location_Key TrackOrder.zip `
    -S3Location_ETag $etag[0] `
    -RevisionType S3 `
    -FileExistsBehavior OVERWRITE

Deploy the Submit Order microservice

The steps to deploy the Submit Order microservice are identical to the Track Order microservice. See that section for details.

If you’re using the AWS CLI, run these commands:

cd EXAMPLE_DIRECTORY/src/ModernTacoShop/SubmitOrder/src/
dotnet publish --runtime linux-arm64 --self-contained
aws s3 cp ./bin/SubmitOrder.zip s3://SHARED_BUCKET_NAME
etag=$(aws s3api head-object --bucket SHARED_BUCKET_NAME \
    --key SubmitOrder.zip --query ETag --output text)
cd ../cdk
cdk deploy

The CDK output includes the name of the CodeDeploy deployment group. Use this name to run the next command:

aws deploy create-deployment --application-name ModernTacoShop-SubmitOrder \
    --deployment-group-name SUBMIT_ORDER_DEPLOYMENT_GROUP_NAME \
    --s3-location bucket=SHARED_BUCKET_NAME,bundleType=zip,key=SubmitOrder.zip,etag=$etag \
    --file-exists-behavior OVERWRITE

If you’re using PowerShell, run these commands:

cd EXAMPLE_DIRECTORY/src/ModernTacoShop/SubmitOrder/src/
dotnet publish --runtime linux-arm64 --self-contained
Write-S3Object -BucketName SHARED_BUCKET_NAME `
    -Key SubmitOrder.zip `
    -File ./bin/SubmitOrder.zip
Get-S3ObjectMetadata -BucketName SHARED_BUCKET_NAME `
    -Key SubmitOrder.zip `
    -Select ETag `
    -OutVariable etag
cd ../cdk
cdk deploy

The CDK output includes the name of the CodeDeploy deployment group. Use this name to run the next command:

New-CDDeployment -ApplicationName ModernTacoShop-SubmitOrder `
    -DeploymentGroupName SUBMIT_ORDER_DEPLOYMENT_GROUP_NAME `
    -S3Location_Bucket SHARED_BUCKET_NAME `
    -S3Location_BundleType zip `
    -S3Location_Key SubmitOrder.zip `
    -S3Location_ETag $etag[0] `
    -RevisionType S3 `
    -FileExistsBehavior OVERWRITE

Data flow diagram

Architecture diagram showing the complete data flow of the sample gRPC microservices application.
  1. The app submits an order via gRPC.
  2. The Submit Order ALB routes the gRPC call to an instance.
  3. The Submit Order instance stores order data.
  4. The Submit Order instance calls the Track Order service via gRPC.
  5. The Track Order ALB routes the gRPC call to an instance.
  6. The Track Order instance stores tracking data.
  7. The app calls the Track Order service, which streams the order’s location during delivery.

Test the microservices

Once the CodeDeploy deployments have completed, test both microservices.

First, check the load balancers’ status. Go to Target Groups in the AWS Management Console, which will list one target group for each microservice. Click each target group, then click “Targets” in the lower details pane. Every EC2 instance in the target group should have a “healthy” status.

Next, verify each microservice via gRPCurl. This tool lets you invoke gRPC services from the command line. Install gRPCurl using the instructions, and then test each microservice:

grpcurl submit-order.PARENT_DOMAIN_NAME:443 modern_taco_shop.SubmitOrder/HealthCheck
grpcurl track-order.PARENT_DOMAIN_NAME:443 modern_taco_shop.TrackOrder/HealthCheck

If a service is healthy, it will return an empty JSON object.

Run the mobile app

You will run a pre-compiled version of the app on AWS Device Farm, which lets you test on a real device without managing any infrastructure. Alternatively, compile your own version via the AndroidApp.FrontEnd project within the solution located at EXAMPLE_DIRECTORY/src/ModernTacoShop/AndroidApp/AndroidApp.sln.

Go to Device Farm in the AWS Management Console. Under “Mobile device testing projects”, click “Create a new project”. Enter “ModernTacoShop” as the project name, and click “Create Project”. In the ModernTacoShop project, click the “Remote access” tab, then click “Start a new session”. Under “Choose a device”, select the Google Pixel 3a running OS version 10, and click “Confirm and start session”.

Screenshot of the AWS Device Farm showing a Google Pixel 3a.

Once the session begins, click “Upload” in the “Install applications” section. Unzip and upload the APK file located at EXAMPLE_DIRECTORY/src/ModernTacoShop/AndroidApp/com.example.modern_tacos.grpc_tacos.apk.zip, or upload an APK that you created.

Screenshot of the gRPC microservices demo Android app, showing the map that displays streaming location data.

Screenshot of the gRPC microservices demo Android app, on the order preparation screen.

Once the app has uploaded, drag up from the bottom of the device screen in order to reach the “All apps” screen. Click the ModernTacos app to launch it.

Once the app launches, enter the parent domain name in the “Domain Name” field. Click the “+” and “-“ buttons next to each type of taco in order to create your order, then click “Submit Order”. The order status will initially display as “Preparing”, and will switch to “InTransit” after about 30 seconds. The Track Order service will stream a random route to the app, updating with new position data every 5 seconds. After approximately 2 minutes, the order status will change to “Delivered” and the streaming updates will stop.

Once you’ve run a successful test, click “Stop session” in the console.

Cleaning up

To avoid incurring charges, use the cdk destroy command to delete the stacks in the reverse order that you deployed them.

You can also delete the resources via CloudFormation in the AWS Management Console.

In addition to deleting the stacks, you must delete the Route 53 hosted zone and the Device Farm project.

Conclusion

This post demonstrated multiple next-generation technologies for microservices, including end-to-end HTTP/2 and gRPC communication over Application Load Balancer, AWS Graviton2 processors, and .NET 5. These technologies enable builders to create microservices applications with new levels of performance and efficiency.

Matt Cline

Matt Cline

Matt Cline is a Solutions Architect at Amazon Web Services, supporting customers in his home city of Pittsburgh PA. With a background as a full-stack developer and architect, Matt is passionate about helping customers deliver top-quality applications on AWS. Outside of work, Matt builds (and occasionally finishes) scale models and enjoys running a tabletop role-playing game for his friends.

Ulili Nhaga

Ulili Nhaga

Ulili Nhaga is a Cloud Application Architect at Amazon Web Services in San Diego, California. He helps customers modernize, architect, and build highly scalable cloud-native applications on AWS. Outside of work, Ulili loves playing soccer, cycling, Brazilian BBQ, and enjoying time on the beach.

Create CIS hardened Windows images using EC2 Image Builder

Post Syndicated from Vinay Kuchibhotla original https://aws.amazon.com/blogs/devops/cis-windows-ec2-image-builder/

Many organizations today require their systems to be compliant with the CIS (Center for Internet Security) Benchmarks. Enterprises have adopted the guidelines or benchmarks drawn by CIS to maintain secure systems. Creating secure Linux or Windows Server images on the cloud and on-premises can involve manual update processes or require teams to build automation scripts to maintain images. This blog post details the process of automating the creation of CIS compliant Windows images using EC2 Image Builder.

EC2 Image Builder simplifies the building, testing, and deployment of Virtual Machine and container images for use on AWS or on-premises. Keeping Virtual Machine and container images up-to-date can be time consuming, resource intensive, and error-prone. Currently, customers either manually update and snapshot VMs or have teams that build automation scripts to maintain images. EC2 Image Builder significantly reduces the effort of keeping images up-to-date and secure by providing a simple graphical interface, built-in automation, and AWS-provided security settings. With Image Builder, there are no manual steps for updating an image nor do you have to build your own automation pipeline. EC2 Image Builder is offered at no cost, other than the cost of the underlying AWS resources used to create, store, and share the images.

Hardening is the process of applying security policies to a system and thereby, an Amazon Machine Image (AMI) with the CIS security policies in place would be a CIS hardened AMI. CIS benchmarks are a published set of recommendations that describe the security policies required to be CIS-compliant. They cover a wide range of platforms including Windows Server and Linux. For example, a few recommendations in a Windows Server environment are to:

  • Have a password requirement and rotation policy.
  • Set an idle timer to lock the instance if there is no activity.
  • Prevent guest users from using Remote Desktop Protocol (RDP) to access the instance.

While Deploying CIS L1 hardened AMIs with EC2 Image Builder discusses about Linux AMIs, this blog post demonstrates how EC2 Image Builder can be used to publish hardened Windows 2019 AMIs. This solutions uses the following AWS services:

EC2 Image Builder provides all the necessary resources needed for publishing AMIs and that involves –

  • Creating a pipeline by providing details such as a name, description, tags, and a schedule to run automated builds.
  • Creating a recipe by providing a name and version, select a source operating system image, and choose components to add for building and testing. Components are the building blocks that are consumed by an image recipe or a container recipe. For example, packages for installation, security hardening steps, and tests. The selected source operating system image and components make up an image recipe.
  • Defining infrastructure configuration – Image Builder launches Amazon EC2 instances in your account to customize images and run validation tests. The Infrastructure configuration settings specify infrastructure details for the instances that will run in your AWS account during the build process.
  • After the build is complete and has passed all its tests, the pipeline automatically distributes the developed AMIs to the select AWS accounts and regions as defined in the distribution configuration.
    More details on creating an Image Builder pipeline using the AWS console wizard can be found here.

Solution Overview and prerequisites

The objective of this pipeline is to publish CIS L1 compliant Windows 2019 AMIs and this is achieved by applying a Windows Group Policy Object(GPO) stored in an Amazon S3 bucket for creating the hardened AMIs. The workflow includes the following steps:

  • Download and modify the CIS Microsoft Windows Server 2019 Benchmark Build Kit available on the Center for Internet Security website. Note: Access to the benchmarks on the CIS site requires a paid subscription.
  • Upload the modified GPO file to an S3 bucket in an AWS account.
  • Create a custom Image Builder component by referencing the GPO file uploaded to the S3 bucket.
  • Create an IAM Instance Profile that the
  • Launch the EC2 Image Builder pipeline for publishing CIS L1 hardened Windows 2019 AMIs.

Make sure to have these prerequisites checked before getting started:

Implementation

Now that you have the prerequisites met, let’s begin with modifying the downloaded GPO file.

Creating the GPO File

This step involves modifying two files, registry.pol and GptTmpl.inf

  • On your workstation, create a folder of your choice, lets say C:\Utils
  • Move both the CIS Benchmark build kit and the LGPO utility to C:\Utils
  • Unzip the benchmark file to C:\Utils\Server2019v1.1.0. You should find the following folder structure in the benchmark build kit.

Screenshot of folder structure

  • To make the GPO file work with AWS EC2 instances, you need to change the GPO file to prevent it from applying the following CIS recommendations mentioned in the below table and execute the commands mentioned below the table for getting there:


Benchmark rule # Recommendation Value to be configured Reason
2.2.21 (L1) Configure ‘Deny Access to this computer from the network’ Guests Does not include ‘Local account and member of Administrators group’ to allow for remote login.
2.2.26 (L1) Ensure ‘Deny log on through Remote Desktop Services’ is set to include ‘Guests, Local account’ Guests Does not include ‘Local account’ to allow for RDP login.
2.3.1.1 (L1) Ensure ‘Accounts: Administrator account status’ is set to ‘Disabled’ Not Configured Administrator account remains enabled in support of allowing login to the instance after launch.
2.3.1.5 (L1) Ensure ‘Accounts: Rename administrator account’ is configured Not Configured We have retained “Administrator” as the default administrative account for the sake of provisioning scripts that may not have knowledge of “CISAdmin” as defined in the CIS remediation kit.
2.3.1.6 (L1) Configure ‘Accounts: Rename guest account’ Not Configured Sysprep process renames this account to default of ‘Guest’.
2.3.7.4 Interactive logon: Message text for users attempting to log on Not Configured This recommendation is not configured as it causes issues with AWS Scanner.
2.3.7.5 Interactive logon: Message title for users attempting to log on Not Configured This recommendation is not configured as it causes issues with AWS Scanner.
9.3.5 (L1) Ensure ‘Windows Firewall: Public: Settings: Apply local firewall rules’ is set to ‘No’ Not Configured This recommendation is not configured as it causes issues with RDP.
9.3.6 (L1) Ensure ‘Windows Firewall: Public: Settings: Apply local connection security rules’ Not Configured This recommendation is not configured as it causes issues with RDP.
18.2.1 (L1) Ensure LAPS AdmPwd GPO Extension / CSE is installed (MS only) Not Configured LAPS is not configured by default in the AWS environment.
18.9.58.3.9.1 (L1) Ensure ‘Always prompt for password upon connection’ is set to ‘Enabled’ Not Configured This recommendation is not configured as it causes issues with RDP.


  • Parse the policy file located inside MS-L1\{6B8FB17A-45D6-456D-9099-EB04F0100DE2}\DomainSysvol\GPO\Machine\registry.pol into a text file using the command:

C:\Utils\LGPO.exe /parse /m C:\Utils\Server2019v1.1.0\MS-L1\DomainSysvol\GPO\Machine\registry.pol >> C:\Utils\MS-L1.txt

  • Open the generated MS-L1.txt file and delete the following sections:

Computer
Software\Policies\Microsoft\Windows NT\Terminal Services
fPromptForPassword
DWORD:1

Computer
Software\Policies\Microsoft\WindowsFirewall\PublicProfile
AllowLocalPolicyMerge
DWORD:0

Computer
Software\Policies\Microsoft\WindowsFirewall\PublicProfile
AllowLocalIPsecPolicyMerge
DWORD:0

  • Save the file and convert it back to policy file using command:

C:\Utils\LGPO.exe /r C:\Utils\MS-L1.txt /w C:\Utils\registry.pol

  • Copy the newly generated registry.pol file from C:\Utils\ to C:\Utils\Server2019v1.1.0\MS-L1\DomainSysvol\GPO\Machine\. Note:This will replace the existing registry.pol file.
  • Next, open C:\Utils\Server2019v1.1.0\MS-L1\DomainSysvol\GPO\Machine\microsoft\windows nt\SecEdit\GptTmpl.inf using Notepad.
  • Under the [System Access] section, delete the following lines:

NewAdministratorName = "CISADMIN"
NewGuestName = "CISGUEST"
EnableAdminAccount = 0

  • Under the section [Privilege Rights], modify the values as given below:

SeDenyNetworkLogonRight = *S-1-5-32-546
SeDenyRemoteInteractiveLogonRight = *S-1-5-32-546

  • Under the section [Registry Values], remove the following two lines:

MACHINE\Software\Microsoft\Windows\CurrentVersion\Policies\System\LegalNoticeCaption=1,"ADD TEXT HERE"
MACHINE\Software\Microsoft\Windows\CurrentVersion\Policies\System\LegalNoticeText=7,ADD TEXT HERE

  • Save the C:\Utils\Server2019v1.1.0\MS-L1\DomainSysvol\GPO\Machine\microsoft\windows nt\SecEdit\GptTmpl.inf file.
  • Rename the root folder C:\Utils\Server2019v1.1.0 to a simpler name like C:\Utilis\gpos
  • Compress both the C:\Utilis\gpos folder along with the C:\Utils\LGPO.exe file and name it as C:\Utilis\cisbuild.zip and upload it to the image-builder-assets S3 bucket.

Create Build Component

Next step for us is to develop the build component file that details what gets to be installed on the AMI that will be created at the end of the process. For example, you can use the component definition for installing external tools like Python. To build a component, you must provide a YAML-based document, which represents the phases and steps to create the component. Create the CISL1Component following the below steps:

  • Login to the AWS Console and open the EC2 Image Builder dashboard.
  • Click on Components in the left pane.
  • Click on Create Component.
  • Choose Windows for Image Operating System (OS).
  • Type a name for the Component, in this case, we will name it as CIS-Windows-2019-Build-Component.
  • Type in a component version. Since it is the first version, we will choose 1.0.0
  • Optionally, under KMS keys, if you have a custom KMS key to encrypt the image, you can choose that or leave as default.
  • Type in a meaningful description.
  • Under Definition Document, choose “Define document content” and paste the following YAML code:

name: CISLevel1Build
description: Build Component to build a CIS Level 1 Image along with additional libraries
schemaVersion: 1.0

phases:
  - name: build
    steps:
      - name: DownloadUtilities
        action: ExecutePowerShell
        inputs:
          commands:
            - New-Item -ItemType directory -Path C:\Utils
            - Invoke-WebRequest -Uri "https://www.python.org/ftp/python/3.8.2/python-3.8.2-amd64.exe" -OutFile "C:\Utils\python.exe"
      - name: BuildKitDownload
        action: S3Download
        inputs:
          - source: s3://image-builder-assets/cisbuild.zip
            destination: C:\Utils\BuildKit.zip
      - name: InstallPython
        action: ExecuteBinary
        onFailure: Continue
        inputs:
          path: 'C:\Utils\python.exe'
          arguments:
            - '/quiet'
      - name: InstallGPO
        action: ExecutePowerShell
        inputs:
          commands:
            - Expand-Archive -LiteralPath C:\Utils\BuildKit.Zip -DestinationPath C:\Utils
            - "$GPOPath=Get-ChildItem -Path C:\\Utils\\gpos\\USER-L1 -Exclude \"*.xml\""
            - "&\"C:\\Utils\\LGPO.exe\" /g \"$GPOPath\""
            - "$GPOPath=Get-ChildItem -Path C:\\Utils\\gpos\\MS-L1 -Exclude \"*.xml\""
            - "&\"C:\\Utils\\LGPO.exe\" /g \"$GPOPath\""
            - New-NetFirewallRule -DisplayName "WinRM Inbound for AWS Scanner" -Direction Inbound -Action Allow -EdgeTraversalPolicy Block -Protocol TCP -LocalPort 5985
      - name: RebootStep
        action: Reboot
        onFailure: Abort
        maxAttempts: 2
        inputs:
          delaySeconds: 60


The above template has a build phase with the following steps:

  • DownloadUtilities – Executes a command to create a directory (C:\Utils) and another command to download Python from the internet and save it in the created directory as python.exe. Both are executed in PowerShell.
  • BuildKitDownload – Downloads the GPO archive created in the previous section from the bucket we stored it in.
  • InstallPython – Installs Python in the system using the executable downloaded in the first step.
  • InstallGPO – Installs the GPO files we prepared from the previous section to apply the CIS security policies. In this example, we are creating a Level 1 CIS hardened AMI.
    • Note: In order to create a Level 2 CIS hardened AMIs, you need to apply User-L1, User-L2, MS-L1, MS-L2 GPOs.
    • To apply the policy, we use the LGPO.exe tool and run the following command:
      LGPO.exe /g "Path\of\GPO\directory"
    • As an example, to apply the MS-L1 GPO, the command would be as follows:
      LGPO.exe /g "C:\Utils\gpos\MS-L1\DomainSysvol"
    • The last command opens the 5985 port in the firewall to allow AWS Scanner inbound connection. This is a CIS recommendation.
  • RebootStep – Reboots the instance after applying the security policies. A reboot is necessary to apply the policies.

Note: If you need to run any tests/validation you need to include another phase to run the test scripts. Guidelines on that can be found here.

Create an instance profile role for the Image Pipeline

Image Builder launches Amazon EC2 instances in your account to customize images and run validation tests. The Infrastructure configuration settings specify infrastructure details for the instances that will run in your AWS account during the build process. In this step, you will create an IAM Role to attach to the instance that the Image Pipeline will use to create an image. Create the IAM Instance Profile following the below steps:

  • Open the AWS Identity and Access Management (AWS IAM) console and click on Roles on the left pane.
  • Click on Create Role.
  • Choose AWS service for trusted entity and choose EC2 and click Next.
  • Attach the following policies: AmazonEC2RoleforSSM, AmazonS3ReadOnlyAccess, EC2InstanceProfileForImageBuilder and click Next.
  • Optionally, add tags and click Next
  • Give the role a name and description and review if all the required policies are attached. In this case, we will name the IAM Instance Profile as CIS-Windows-2019-Instance-Profile
  • Click Create role.

Create Image Builder Pipeline

In this step, you create the image pipeline which will produce the desired AMI as an output. Image Builder image pipelines provide an automation framework for creating and maintaining custom AMIs and container images. Pipelines deliver the following functionality:

  • Assemble the source image, components for building and testing, infrastructure configuration, and distribution settings.
  • Facilitate scheduling for automated maintenance processes using the Schedule builder in the console wizard, or entering cron expressions for recurring updates to your images.
  • Enable change detection for the source image and components, to automatically skip scheduled builds when there are no changes.

To create an Image Builder pipeline, perform the following steps:

  • Open the EC2 Image Builder console and choose create Image Pipeline.
  • Select Windows for the Image Operating System.
  • Under Select Image, choose Select Managed Images and browse for the latest Windows Server 2019 English Full Base x86 image.
  • Under Build components, choose the Build component CIS-Windows-2019-Build-Component created in the previous section.
  • Optionally, under Tests, if you have a test component created, you can select that.
  • Click Next.
  • Under Pipeline details, give the pipeline a name and a description. For IAM role, select the role CIS-Windows-2019-Instance-Profile that was created in the previous section.
  • Under Build Schedule, you can choose how frequently you want to create an image through this pipeline based on an update schedule. You can select Manual for now.
  • (Optional) Under Infrastructure Settings, select an instance type to customize your image for that type, an Amazon SNS topic to get alerts from as well as Amazon VPC settings. If you would like to troubleshoot in case the pipeline faces any errors, you can uncheck “Terminate Instance on failure” and choose an EC2 Key Pair to access the instance via Remote Desktop Protocol (RDP). You may wish to store the Logs in an S3 bucket as well. Note: Make sure the chosen VPC has outbound access to the internet in case you are downloading anything from the web as part of the custom component definition.
  • Click Next.
  • Under Configure additional settings, you can optionally choose to attach any licenses that you own through AWS License Manager to the AMI.
  • Under Output AMI, give a name and optional tags.
  • Under AMI distribution settings, choose the regions or AWS accounts you want to distribute the image to. By default, your current region is included. Click on Review.
  • Review the details and click Create Pipeline.
  • Since we have chosen Manual under the Build Schedule, manually trigger the Image Builder pipeline for kicking off the AMI creation process. On successful run, Image Builder pipeline will create the image and the output image can be found under Images on the left pane of the EC2 Image Builder console.
  • To troubleshoot any issues, the reasons for failure can be found by clicking on the Image Pipeline you created and view the corresponding output image with the Status as Failed.

Cleanup

Following the above detailed step-by-step process creates EC2 Image Builder Pipeline, Custom Component and an IAM Instance Profile. While none of these resources have any costs associated with them, you are charged for the runtime of the EC2 instance used during the AMI built process and the EBS volume costs associated with the size of the AMI. Make sure to clear the AMIs when not needed for avoiding any unwanted costs.

Conclusion

This blog post demonstrated how you can use EC2 Image Builder to create a CIS L1 hardened Windows 2019 Image in an automated fashion. Additionally, this post also demonstrated on how you can use build components to install any dependencies or executables from different sources like the internet or from an Amazon S3 bucket. Feel free to test this solution in your AWS accounts and provide feedback.

Deploying Alexa Skills with the AWS CDK

Post Syndicated from Jeff Gardner original https://aws.amazon.com/blogs/devops/deploying-alexa-skills-with-aws-cdk/

So you’re expanding your reach by leveraging voice interfaces for your applications through the Alexa ecosystem. You’ve experimented with a new Alexa Skill via the Alexa Developer Console, and now you’re ready to productionalize it for your customers. How exciting!

You are also a proponent of Infrastructure as Code (IaC). You appreciate the speed, consistency, and change management capabilities enabled by IaC. Perhaps you have other applications that you provision and maintain via DevOps practices, and you want to deploy and maintain your Alexa Skill in the same way. Great idea!

That’s where AWS CloudFormation and the AWS Cloud Development Kit (AWS CDK) come in. AWS CloudFormation lets you treat infrastructure as code, so that you can easily model a collection of related AWS and third-party resources, provision them quickly and consistently, and manage them throughout their lifecycles. The AWS CDK is an open-source software development framework for modeling and provisioning your cloud application resources via familiar programming languages, like TypeScript, Python, Java, and .NET. AWS CDK utilizes AWS CloudFormation in the background in order to provision resources in a safe and repeatable manner.

In this post, we show you how to achieve Infrastructure as Code for your Alexa Skills by leveraging powerful AWS CDK features.

Concepts

Alexa Skills Kit (ASK)

In addition to the Alexa Developer Console, skill developers can utilize the Alexa Skills Kit (ASK) to build interactive voice interfaces for Alexa. ASK provides a suite of self-service APIs and tools for building and interacting with Alexa Skills, including the ASK CLI, the Skill Management API (SMAPI), and SDKs for Node.js, Java, and Python. These tools provide a programmatic interface for your Alexa Skills in order to update them with code rather than through a user interface.

AWS CloudFormation

AWS CloudFormation lets you create templates written in either YAML or JSON format to model your infrastructure in code form. CloudFormation templates are declarative and idempotent, allowing you to check them into a versioned code repository, deploy them automatically, and track changes over time.

The ASK CloudFormation resource allows you to incorporate Alexa Skills in your CloudFormation templates alongside your other infrastructure. However, this has limitations that we’ll discuss in further detail in the Problem section below.

AWS Cloud Development Kit (AWS CDK)

Think of the AWS CDK as a developer-centric toolkit that leverages the power of modern programming languages to define your AWS infrastructure as code. When AWS CDK applications are run, they compile down to fully formed CloudFormation JSON/YAML templates that are then submitted to the CloudFormation service for provisioning. Because the AWS CDK leverages CloudFormation, you still enjoy every benefit provided by CloudFormation, such as safe deployment, automatic rollback, and drift detection. AWS CDK currently supports TypeScript, JavaScript, Python, Java, C#, and Go (currently in Developer Preview).

Perhaps the most compelling part of AWS CDK is the concept of constructs—the basic building blocks of AWS CDK apps. The three levels of constructs reflect the level of abstraction from CloudFormation. A construct can represent a single resource, like an AWS Lambda Function, or it can represent a higher-level component consisting of multiple AWS resources.

The three different levels of constructs begin with low-level constructs, called L1 (short for “level 1”) or Cfn (short for CloudFormation) resources. These constructs directly represent all of the resources available in AWS CloudFormation. The next level of constructs, called L2, also represents AWS resources, but it has a higher-level and intent-based API. They provide not only similar functionality, but also the defaults, boilerplate, and glue logic you’d be writing yourself with a CFN Resource construct. Finally, the AWS Construct Library includes even higher-level constructs, called L3 constructs, or patterns. These are designed to help you complete common tasks in AWS, often involving multiple resource types. Learn more about constructs in the AWS CDK developer guide.

One L2 construct example is the Custom Resources module. This lets you execute custom logic via a Lambda Function as part of your deployment in order to cover scenarios that the AWS CDK doesn’t support yet. While the Custom Resources module leverages CloudFormation’s native Custom Resource functionality, it also greatly reduces the boilerplate code in your CDK project and simplifies the necessary code in the Lambda Function. The open-source construct library referenced in the Solution section of this post utilizes Custom Resources to avoid some limitations of what CloudFormation and CDK natively support for Alexa Skills.

Problem

The primary issue with utilizing the Alexa::ASK::Skill CloudFormation resource, and its corresponding CDK CfnSkill construct, arises when you define the Skill’s backend Lambda Function in the same CloudFormation template or CDK project. When the Skill’s endpoint is set to a Lambda Function, the ASK service validates that the Skill has the appropriate permissions to invoke that Lambda Function. The best practice is to enable Skill ID verification in your Lambda Function. This effectively restricts the Lambda Function to be invokable only by the configured Skill ID. The problem is that in order to configure Skill ID verification, the Lambda Permission must reference the Skill ID, so it cannot be added to the Lambda Function until the Alexa Skill has been created. If we try creating the Alexa Skill without the Lambda Permission in place, insufficient permissions will cause the validation to fail. The endpoint validation causes a circular dependency preventing us from defining our desired end state with just the native CloudFormation resource.

Unfortunately, the AWS CDK also does not yet support any L2 constructs for Alexa skills. While the ASK Skill Management API is another option, managing imperative API calls within a CI/CD pipeline would not be ideal.

Solution

Overview

AWS CDK is extensible in that if there isn’t a native construct that does what you want, you can simply create your own! You can also publish your custom constructs publicly or privately for others to leverage via package registries like npm, PyPI, NuGet, Maven, etc.

We could write our own code to solve the problem, but luckily this use case allows us to leverage an open-source construct library that addresses our needs. This library is currently available for TypeScript (npm) and Python (PyPI).

The complete solution can be found at the GitHub repository, here. The code is in TypeScript, but you can easily port it to another language if necessary. See the AWS CDK Developer Guide for more guidance on translating between languages.

Prerequisites

You will need the following in order to build and deploy the solution presented below. Please be mindful of any prerequisites for these tools.

  • Alexa Developer Account
  • AWS Account
  • Docker
    • Used by CDK for bundling assets locally during synthesis and deployment.
    • See Docker website for installation instructions based on your operating system.
  • AWS CLI
    • Used by CDK to deploy resources to your AWS account.
    • See AWS CLI user guide for installation instructions based on your operating system.
  • Node.js
    • The CDK Toolset and backend runs on Node.js regardless of the project language. See the detailed requirements in the AWS CDK Getting Started Guide.
    • See the Node.js website to download the specific installer for your operating system.

Clone Code Repository and Install Dependencies

The code for the solution in this post is located in this repository on GitHub. First, clone this repository and install its local dependencies by executing the following commands in your local Terminal:

# clone repository
git clone https://github.com/aws-samples/aws-devops-blog-alexa-cdk-walkthrough
# navigate to project directory
cd aws-devops-blog-alexa-cdk-walkthrough
# install dependencies
npm install

Note that CLI commands in the sections below (ask, cdk) use npx. This executes the command from local project binaries if they exist, or, if not, it installs the binaries required to run the command. In our case, the local binaries are installed as part of the npm install command above. Therefore, npx will utilize the local version of the binaries even if you already have those tools installed globally. We use this method to simplify setup and alleviate any issues arising from version discrepancies.

Get Alexa Developer Credentials

To create and manage Alexa Skills via CDK, we will need to provide Alexa Developer account credentials, which are separate from our AWS credentials. The following values must be supplied in order to authenticate:

  • Vendor ID: Represents the Alexa Developer account.
  • Client ID: Represents the developer, tool, or organization requiring permission to perform a list of operations on the skill. In this case, our AWS CDK project.
  • Client Secret: The secret value associated with the Client ID.
  • Refresh Token: A token for reauthentication. The ASK service uses access tokens for authentication that expire one hour after creation. Refresh tokens do not expire and can retrieve a new access token when needed.

Follow the steps below to retrieve each of these values.

Get Alexa Developer Vendor ID

Easily retrieve your Alexa Developer Vendor ID from the Alexa Developer Console.

  1. Navigate to the Alexa Developer console and login with your Amazon account.
  2. After logging in, on the main screen click on the “Settings” tab.

Screenshot of Alexa Developer console showing location of Settings tab

  1. Your Vendor ID is listed in the “My IDs” section. Note this value.

Screenshot of Alexa Developer console showing location of Vendor ID

Create Login with Amazon (LWA) Security Profile

The Skill Management API utilizes Login with Amazon (LWA) for authentication, so first we must create a security profile for LWA under the same Amazon account that we will use to create the Alexa Skill.

  1. Navigate to the LWA console and login with your Amazon account.
  2. Click the “Create a New Security Profile” button.

Screenshot of Login with Amazon console showing location of Create a New Security Profile button

  1. Fill out the form with a Name, Description, and Consent Privacy Notice URL, and then click “Save”.

Screenshot of Login with Amazon console showing Create a New Security Profile form

  1. The new Security Profile should now be listed. Hover over the gear icon, located to the right of the new profile name, and click “Web Settings”.

Screenshot of Login with Amazon console showing location of Web Settings link

  1. Click the “Edit” button and add the following under “Allowed Return URLs”:
    • http://127.0.0.1:9090/cb
    • https://s3.amazonaws.com/ask-cli/response_parser.html
  2. Click the “Save” button to save your changes.
  3. Click the “Show Secret” button to reveal your Client Secret. Note your Client ID and Client Secret.

Screenshot of Login with Amazon console showing location of Client ID and Client Secret values

Get Refresh Token from ASK CLI

Your Client ID and Client Secret let you generate a refresh token for authenticating with the ASK service.

  1. Navigate to your local Terminal and enter the following command, replacing <your Client ID> and <your Client Secret> with your Client ID and Client Secret, respectively:
# ensure you are in the root directory of the repository
npx ask util generate-lwa-tokens --client-id "<your Client ID>" --client-confirmation "<your Client Secret>" --scopes "alexa::ask:skills:readwrite alexa::ask:models:readwrite"
  1. A browser window should open with a login screen. Supply credentials for the same Amazon account with which you created the LWA Security Profile previously.
  2. Click the “Allow” button to grant the refresh token appropriate access to your Amazon Developer account.
  3. Return to your Terminal. The credentials, including your new refresh token, should be printed. Note the value in the refresh_token field.

NOTE: If your Terminal shows an error like CliFileNotFoundError: File ~/.ask/cli_config not exists., you need to first initialize the ASK CLI with the command npx ask configure. This command will open a browser with a login screen, and you should enter the credentials for the Amazon account with which you created the LWA Security Profile previously. After signing in, return to your Terminal and enter n to decline linking your AWS account. After completing this process, try the generate-lwa-tokens command above again.

NOTE: If your Terminal shows an error like CliError: invalid_client, make sure that you have included the quotation marks (") around the --client_id and --client-confirmation arguments.

Add Alexa Developer Credentials to AWS SSM Parameter Store / AWS Secrets Manager

Our AWS CDK project requires access to the Alexa Developer credentials we just generated (Client ID, Client Secret, Refresh Token) in order to create and manage our Skill. To avoid hard-coding these values into our code, we can store the values in AWS Systems Manager (SSM) Parameter Store and AWS Secrets Manager, and then retrieve them programmatically when deploying our CDK project. In our case, we are using SSM Parameter Store to store the non-sensitive values in plaintext, and Secrets Manager to store the secret values in encrypted form.

The repository contains a shell script at scripts/upload-credentials.sh that can create the appropriate parameters and secrets via AWS CLI. You’ll just need to supply the credential values from the previous steps. Alternatively, instructions for creating parameters and secrets via the AWS Console or AWS CLI can each be found in the AWS Systems Manager User Guide and AWS Secrets Manager User Guide.

You will need the following resources created in your AWS account before proceeding:

Name Service Type
/alexa-cdk-blog/alexa-developer-vendor-id SSM Parameter Store String
/alexa-cdk-blog/lwa-client-id SSM Parameter Store String
/alexa-cdk-blog/lwa-client-secret Secrets Manager Plaintext / secret-string
/alexa-cdk-blog/lwa-refresh-token Secrets Manager Plaintext / secret-string

Code Walkthrough

Skill Package

When you programmatically create an Alexa Skill, you supply a Skill Package, which is a zip file consisting of a set of files defining your Skill. A skill package includes a manifest JSON file, and optionally a set of interaction model files, in-skill product files, and/or image assets for your skill. See the Skill Management API documentation for details regarding skill packages.

The repository contains a skill package that defines a simple Time Teller Skill at src/skill-package. If you want to use an existing Skill instead, replace the contents of src/skill-package with your skill package.

If you want to export the skill package of an existing Skill, use the ASK CLI:

  1. Navigate to the Alexa Developer console and log in with your Amazon account.
  2. Find the Skill you want to export and click the link under the name “Copy Skill ID”. Either make sure this stays on your clipboard or note the Skill ID for the next step.
  3. Navigate to your local Terminal and enter the following command, replacing <your Skill ID> with your Skill ID:
# ensure you are in the root directory of the repository
cd src
npx ask smapi export-package --stage development --skill-id <your Skill ID>

NOTE: To export the skill package for a live skill, replace --stage development with --stage live.

NOTE: The CDK code in this solution will dynamically populate the manifest.apis section in skill.json. If that section is populated in your skill package, either clear it out or know that it will be replaced when the project is deployed.

Skill Backend Lambda Function

The Lambda Function code for the Time Teller Alexa Skill’s backend also resides within the CDK project at src/lambda/skill-backend. If you want to use an existing Skill instead, replace the contents of src/lambda/skill-backend with your Lambda code. Also note the following if you want to use your own Lambda code:

  • The CDK code in the repository assumes that the Lambda Function runtime is Python. However, you can modify for another runtime if necessary by using either the aws-lambda or aws-lambda-nodejs CDK module instead of aws-lambda-python.
  • If you’re using your own Python Lambda Function code, please note the following to ensure the Lambda Function definition compatibility in the sample CDK project. If your Lambda Function varies from what is below, then you may need to modify the CDK code. See the Python Lambda code in the repository for an example.
    • The skill-backend/ directory should contain all of the necessary resources for your Lambda Function. For Python functions, this should include at least a file named index.py that contains your Lambda entrypoint, and a requirements.txt file containing your pip dependencies.
    • For Python functions, your Lambda handler function should be called handler(). This generally looks like handler = SkillBuilder().lambda_handler() when using the Python ASK SDK.

Open-Source Alexa Skill Construct Library

As mentioned above, this solution utilizes an open-source construct library to create and manage the Alexa Skill. This construct library utilizes the L1 CfnSkill construct along with other L1 and L2 constructs to create a complete Alexa Skill with a functioning backend Lambda Function. Utilizing this construct library means that we are no longer limited by the shortcomings of only using the Alexa::ASK::Skill CloudFormation resource or L1 CfnSkill construct.

Look into the construct library code if you’re curious. There’s only one construct—Skill—and you can follow the code to see how it dodges the Lambda Permission issue.

CDK Stack

The CDK stack code is located in lib/alexa-cdk-stack.ts. Let’s dive in to understand what’s happening. We’ll look at one section at a time:

...
const PARAM_PREFIX = '/alexa-cdk-blog/'

export class AlexaCdkStack extends cdk.Stack {
  constructor(scope: cdk.Construct, id: string, props?: cdk.StackProps) {
    super(scope, id, props);

    // Get Alexa Developer credentials from SSM Parameter Store/Secrets Manager.
    // NOTE: Parameters and secrets must have been created in the appropriate account before running `cdk deploy` on this stack.
    //       See sample script at scripts/upload-credentials.sh for how to create appropriate resources via AWS CLI.
    const alexaVendorId = ssm.StringParameter.valueForStringParameter(this, `${PARAM_PREFIX}alexa-developer-vendor-id`);
    const lwaClientId = ssm.StringParameter.valueForStringParameter(this, `${PARAM_PREFIX}lwa-client-id`);
    const lwaClientSecret = cdk.SecretValue.secretsManager(`${PARAM_PREFIX}lwa-client-secret`);
    const lwaRefreshToken = cdk.SecretValue.secretsManager(`${PARAM_PREFIX}lwa-refresh-token`);
    ...
  }
}

First, within the stack’s constructor, after calling the constructor of the base class, we retrieve the credentials we uploaded earlier to SSM and Secrets Manager. This lets us to store our account credentials in a safe place—encrypted in the case of our lwaClientSecret and lwaRefreshToken secrets—and we avoid storing sensitive data in plaintext or source control.

...
export class AlexaCdkStack extends cdk.Stack {
  constructor(scope: cdk.Construct, id: string, props?: cdk.StackProps) {
    ...
    // Create the Lambda Function for the Skill Backend
    const skillBackend = new lambdaPython.PythonFunction(this, 'SkillBackend', {
      entry: 'src/lambda/skill-backend',
      timeout: cdk.Duration.seconds(7)
    });
    ...
  }
}

Next, we create the Lambda Function containing the skill’s backend logic. In this case, we are using the aws-lambda-python module. This transparently handles every aspect of the dependency installation and packaging for us. Rather than leave the default 3-second timeout, specify a 7-second timeout to correspond with the Alexa service timeout of 8 seconds.

...

export class AlexaCdkStack extends cdk.Stack {
  constructor(scope: cdk.Construct, id: string, props?: cdk.StackProps) {
    ...
    // Create the Alexa Skill
    const skill = new Skill(this, 'Skill', {
      endpointLambdaFunction: skillBackend,
      skillPackagePath: 'src/skill-package',
      alexaVendorId: alexaVendorId,
      lwaClientId: lwaClientId,
      lwaClientSecret: lwaClientSecret,
      lwaRefreshToken: lwaRefreshToken
    });
  }
}

Finally, we create our Skill! All we need to do is pass the Lambda Function with the Skill’s backend code into where the skill package is located, as well as the credentials for authenticating into our Alexa Developer account. All of the wiring for deploying the skill package and connecting the Lambda Function to the Skill is handled transparently within the construct code.

Deploy CDK project

Now that all of our code is in place, we can deploy our project and test it out!

  1. Make sure that you have bootstrapped your AWS account for CDK. If not, you can bootstrap with the following command:
# ensure you are in the root directory of the repository
npx cdk bootstrap
  1. Make sure that the Docker daemon is running locally. This is generally done by starting the Docker Desktop application.
    • You can also use the following Terminal command to determine whether the Docker daemon is running. The command will return an error if the daemon is not running.
docker ps -q
    • See more details regarding starting the Docker daemon based on your operating system via the Docker website.
  1. Synthesize your CDK project in order to confirm that your project is building properly.
# ensure you are in the root directory of the repository
npx cdk synth

NOTE: In addition to generating the CloudFormation template for this project, this command also bundles the Lambda Function code via Docker, so it may take a few minutes to complete.

  1. Deploy!
# ensure you are in the root directory of the repository
npx cdk deploy
    • Feel free to review the IAM policies that will be created, and enter y to continue when prompted.
    • If you would like to skip the security approval requirement and deploy in one step, use cdk deploy --require-approval never instead.

Check it out!

Once your project finishes deploying, take a look at your new Skill!

  1. Navigate to the Alexa Developer console and log in with your Amazon account.
  2. After logging in, on the main screen you should now see your new Skill listed. Click on the name to go to the “Build” screen.
  3. Investigate the console to confirm that your Skill was created as expected.
  4. On the left-hand navigation menu, click “Endpoint” and confirm that the ARN for your backend Lambda Function is showing in the “Default Region” field. This ARN was added dynamically by our CDK project.

Screenshot of Alexa Developer console showing location of Endpoint text box

  1. Test the Skill to confirm that it functions properly.
    1. Click on the “Test” tab and enable testing for the “Development” stage of your skill.
    2. Type your Skill’s invocation name in the Alexa Simulator in order to launch the skill and invoke a response.
      • If you deployed the sample skill package and Lambda Function, the invocation name is “time teller”. If Alexa responds with the current time in UTC, it is working properly!

Bonus Points

Now that you can deploy your Alexa Skill via the AWS CDK, can you incorporate your new project into a CI/CD pipeline for automated deployments? Extra kudos if the pipeline is defined with the CDK 🙂 Follow these links for some inspiration:

Cleanup

After you are finished, delete the resources you created to avoid incurring future charges. This can be easily done by deleting the CloudFormation stack from the CloudFormation console, or by executing the following command in your Terminal, which has the same effect:

# ensure you are in the root directory of the repository
npx cdk destroy

Conclusion

You can, and should, strive for IaC and CI/CD in every project, and the powerful AWS CDK features make that easier with a set of simple yet flexible constructs. Leverage the simplicity of declarative infrastructure definitions with convenient default configurations and helper methods via the AWS CDK. This example also reveals that if there are any gaps in the built-in functionality, you can easily fill them with a custom resource construct, or one of the thousands of open-source construct libraries shared by fellow CDK developers around the world. Happy coding!

Carlos Santos

Jeff Gardner

Jeff Gardner is a Solutions Architect with Amazon Web Services (AWS). In his role, Jeff helps enterprise customers through their cloud journey, leveraging his experience with application architecture and DevOps practices. Outside of work, Jeff enjoys watching and playing sports and chasing around his three young children.

“ICMP Rings” for better Dependencies

Post Syndicated from Olger Diekstra original https://blog.zabbix.com/icmp-rings-for-better-dependencies/15157/

When you have devices spread across different locations and monitor these with a single Zabbix instance, you’ll encounter a challenge managing the various latencies to each location, especially when these locations span the world. Ping times can vary wildly from 10ms to 500ms and more depending on the internet connections.

Flexible latency threshold with User macros

Setting the max latency for all devices at 500ms isn’t really a good option, and overriding the {$ICMP_RESPONSE_TIME_WARN} for each individual device doesn’t scale well.

There is a better way though.

First move the {$ICMP_RESPONSE_TIME_WARN} macro from the “Template Module ICMP Ping” into a global macro (with the default value of 0.15, which is 150ms) and remove the macro from the template.

You can find global variables in the “Administration->General” menu. Click on the “GUI” dropdown and select “Macros”.


Then create templates for each location and set a custom {$ICMP_RESPONSE_TIME_WARN} macro (overriding the global macro) based on what was best for that particular location.
Lastly, add all devices for a location to the template for that location.

Now when a new device is added to a location, all that is needed is to add it to the correct template. An added benefit is that when the latency changes, changing the macro in the affected template changes the response time for every device that relies on that template.


Defining dependencies

Because networks often work as a tree structure, using dependencies can help suppress alerts for devices downstream. However, Zabbix’s dependency structure isn’t very intelligent. If an upstream device is checked just before an issue occurs, then a downstream device might hit
the 3 failed checks before the upstream device does, and alert. This can lead to many alerts even though Zabbix might suppress most of these alerts on the dashboard once it detects the upstream device is offline too.

Every network is different and this approach may need some tweaking for your network, but in our case, each remote location has a firewall that Zabbix pings, a switch that connects to that firewall, hosts that connect to the switch, and in some cases VM’s that reside on a host.
Each firewall has an external and internal interface that we monitor separately (if the internal interface is down, but the external interface up, that means something happened to the connected switch), and we monitor each.

So, we created a concept of “ICMP rings”.

The four rings

Zabbix pings the external interface of a remote firewall every 60s (default ICMP update interval). We’ll call this “Ring 0”. The internal Firewall interface is dependent on the external interface, This internal interface sits in “Ring 1”. Usually, the next device is a switch, which is dependent on the internal firewall, This switch lives in “Ring 2”. Hosts that we want to monitor on the remote network are dependent on the switch, and therefore live in “Ring 3”. We also have remote VM’s which exist on a remote host, and these live in “Ring 4”.
In each ring we increase the update interval time.


This means the further downstream a device is, the longer it takes to detect an outage.

But the upshot is that we won’t get alert storms any more.

First move the {$ICMP_UPDATE_INTERVAL} macro from the “Template Module ICMP Ping” to a global macro (with a value of 1m) and created templates called:

ICMP_Ring1_FW
ICMP_Ring2_SW
ICMP_Ring3_Hosts
ICMP_Ring4_VMs

Each Ring template has a macro {$ICMP_UPDATE_INTERVAL} set (overriding the global macro) with the below values for each ring.

ring 0 = 60s
ring 1 = 80s
ring 2 = 107s
ring 3 = 143s
ring 4 = 191s

These are not random. In order to always have an upstream device alert before a downstream device you need to take the update interval time (seconds) of the upstream ring, multiply it by its intervals+1, and then divide it by three (and round it off).
The resulting update interval will ensure an upstream device always alerts before a downstream device. The downside of this approach is that the further downstream a device is, the longer it takes to detect a problem.
(This could be mitigated by using a Zabbix proxy, but we’re working with a single instance).


🤔  How did I get to this formula? That’s pretty simple. Consider a firewall and switch, where the switch is dependent on the firewall. Now lets assume seconds after the firewall is checked (and found responsive), the link goes down. Seconds later the switch is checked, and found unresponsive. Strike one for the switch. Now the firewall is checked again, and is now unresponsive too. Strike one for the firewall. Next the switch is checked again, and its strike two. By the time the firewall hits strike 3, the switch is already well and truly alerting.

To allow the firewall to be checked 3 times we need to check the switch 4 times. We could simply increase the interval for every subsequent ring, but that’s not as efficient (we’d be adding 60s every time we increase the interval).

Rather, we can work with the seconds. 4 x 60 seconds equals 240 seconds. Divide that by 3 intervals (for the next ring) and that results in 80 seconds. If we check the switch every 80ms, that totals to 240s. We could add 1 or 2 seconds margin, to ensure the firewall has some extra time, but every second we add, we also need to add to subsequent downstream rings. Which means the time we need to detect issues becomes longer and longer.


ℹ  A tip on managing dependencies.

In Zabbix version 5.0 The url https://zabbix/triggers.php isn’t available via the menu, but it allows you to filter triggers, for instance all ICMP unavailable triggers, and see what each is dependent on. We use host groups to set locations for devices, and combining a location host group with an ICMP unavailable trigger allows to quickly review whether dependencies are (correctly) set, and if so to what. In later versions this link will not work, since it now requires a context in the URL.

Deploying and configuring Zabbix 5.4 in a multi-tenant environment

Post Syndicated from Arturs Lontons original https://blog.zabbix.com/deploying-and-configuring-zabbix-5-4-in-a-multi-tenant-environment/15109/

In this post and the video, we will discuss deploying and configuring Zabbix 5.4 in a multi-tenant environment and how Zabbix is finally ready for real multi-tenant use cases thanks to multiple features.

Contents

I. Monitoring requirements of multi-tenant environments (0:30)
II. Supported monitoring approaches (2:32)

III. Zabbix and multi-tenant environment (5:56)

IV. To-do list (21:36)
V. Questions & Answers (23:32)

Monitoring requirements of multi-tenant environments

Before talking Zabbix, let us first analyze the core requirements behind multi-tenant environments. Such environments can be quite complex with a particular set of prerequisites that we have to be sure we can satisfy before continuing further.

  • The core idea behind multi-tenancy is support for multiple customers. Therefore we need to support granular role/permission schema. The ability to define different roles for different customers and limit what they can access is key to success for such deployments.
  • Multiple customers means a lot of data. No matter if we’re talking about a single Zabbix instance or scaling by deploying multiple Zabbix instances (say, for different regions) we need to have the ability to process large amounts of data. 
  • On top of that, we must be able to scale upwards, ideally – both horizontally and vertically. More customers, different requirements, varying amounts of data to process – all of this needs to be accounted for in advance.
  • Redundancy is another key factor for us. As service providers, we absolutely cannot afford any downtime or data loss. While this may be acceptable in our own home labs or classrooms, this is not the case here. Unscheduled downtime could potentially result in a loss of a customer.

Supported monitoring approaches

Now that we have covered the architectural requirements, let’s focus on data collection. No matter the monitoring solution, the easiest approach in most cases would simply be to tell our customer to deploy an agent and be done with it. Unfortunately, this often doesn’t sit will with the end user and their security team. Let us also not forget that it is simply not possible to deploy an agent on some devices or environments – what then? Having a vast selection of monitoring methods is key for successful deployment of a multi-tenant monitoring service.

Let us take a look at this in the context of Zabbix.

Agent

  • With Zabbix agents we can obtain data in two ways – in passive (polling) and active modes (trapping). This is extremely useful while working with multiple customers, since each of them will have different internal network security policies. I have personally seen cases where only one of these approaches is supported, while the other is restricted by the security policies.
  • Agents also support deployment on different platforms (Windows, Unix, etc.), as well as execution of external third-party scripts either by way of User parameters or system.run item key.
  • Active agents are also capable of reading log files and event logs on Windows environments. This can be extremely useful, since many applications, even in-house ones, can provide a lot of monitoring data by logging it.

Agent-supported deployment on various platforms


Since we need to stay flexible, there are many other monitoring approaches supported by Zabbix that we can utilize:

  • SNMP, HTTP, IPMI and SSH agentless monitoring.
  • Simple checks (ICMP pings, port statuses).
  • Database and Java application monitoring.
  • External scripts (executed by the Zabbix server, Zabbix proxy or Zabbix agent).
  • Aggregations and calculations of existing data.
  • VMware monitoring and integration.
  • Web monitoring by creating web scenarios.
  • Synthetic monitoring for simulating real life user transactions.

Latest improvements

Why are we putting emphasis on multi tenancy just now? The reason is a couple of great features added in the last few releases. These features can finally allow us to utilize Zabbix in a truly multitenant environment:

Added in Zabbix 5.2:

  • Ability to create customizable user roles based on user types;
  • Secrets can now be stored in an, highly secure external vault;
  • Improvements in configuring frontend were also added. For example, each user can now select their time zone for frontend data display. This will be relevant for users in different geographical locations.

Added in Zabbix 5.4:

  • Users now have the ability to send scheduled reports. This is extremely useful for customers who may wish to receive scheduled reports about their environments. Now, instead of utilizing third-party scripts to export data and generate reports, you can use the native Zabbix functionality.
  • Major performance improvements have also been added, especially for really large instances with tens of thousands of new incoming values per second.

Zabbix and multi-tenant environment

How do we use Zabbix in a multi-tenant environment? Essentially, we provide Zabbix as a service. We use the Zabbix monitoring tool to monitor our clients (ABC and BCD in the image). We monitor their network traffic, their operating system statistics, application statistics, log files, etc. For each tenant, these monitoring requirements are going to be different.

Multi-tenant environment

Zabbix proxy

Multi-tenancy would not be possible without Zabbix proxies. With Zabbix proxies we can deploy them in customer offices, data centers, organization branches and collect data locally. Since proxies also perform preprocessing, we can even utilize them to transform and normalize metrics or even discard some of the collected metrics before forwarding them to the central Zabbix backend server.

  • Proxies are capable of performing preprocessing ever since Zabbix version 5.0. This allows us to normalize and transform data, for example – change our textual data to numeric data, use throttling and other pre-processing approaches. Even custom JavaScript is supported nowadays to format or normalize the data before we send it to our central Zabbix backend server. So, instead of the server being responsible for all of the preprocessing and having quite a large preprocessing overhead, now the proxy can do it and then forward the data to the server.
  • In addition, on the proxy, the data gets compressed before forwarding to the server thus saving some network traffic overhead.
  • The proxy still continues collecting data and storing it in its own database even in case of a network outage on the customer’s site.
  • Once we collect the data by the proxy, it gets sent to the server via a single connection, which is a lot more feasible from the network security perspective. In this case we need to create only a single firewall rule as opposed to a wide array of rules if we were to monitor the customer’s site directly from the central Zabbix backend server.
  • We can execute remote scripts on the proxy.
  • We can also deploy multiple proxies to improve scalability. If a single proxy cannot handle the amount of data that we are gathering or preprocessing, we can always deploy an extra proxy. They are easy to deploy, and can even use out-of-the-box SQLite databases.

Passive and active proxies

With proxies can also select the direction of the connection. We can deploy passive proxies, which get polled by the Zabbix backend server. In that case, the Zabbix server pulls the data from the proxy. In this scenario the Zabbix server is the one responsible for establishing the connection to the proxy. This adds a minor performance overhead to the Zabbix backend server. On the other hand, we can also deploy active proxies, where we remove that overhead from the server and proxy sends the data autonomously to the server.

At the end of the day, similar to how it goes with agent requirements, the proxy mode will depend on the security policies of the customer. Don’t forget that we aren’t restricted to a single type of proxy –  we can have both of these proxy types running at the same time.

Selecting the connection direction

Data preprocessing — throttling

Preprocessing can help us not only normalize our data, but we can also utilize it to save up on storage and performance overhead, which is vital in large environments.

When monitoring a service or an application state, we are going to be obtaining discrete values such as 1, 2, or 3, or any number. These numbers have a tendency to repeat – if our server stays up, we are going to continue receiving a number which represents “Up”. By using the preprocessing method called throttling, we can decrease the amount of these numbers stored by discarding repeating values. Only status changes are stored, therefore we can potentially save some database space and remove unneeded data processing overhead.

Discarding unchanged values


At this point in time, this feature sees more and more usage in many Zabbix environments, though it was severely underutilized initially when Zabbix 5.0 came out. So, if you aren’t using throttling yet and you’re running on 5.0 or newer, I definitely suggest trying to implement it to some extent. It is available in Preprocessing section of the item configuration.

Permissions

Robust permission design is essential to a multi-tenant environment. Even though permission logic has seen an addition of roles, the user group to host group relations haven’t been abandoned and still play vital role in overall permission schema.

With roles we still have to utilize the three user types – Users, Admin, and Super admins.

User role overview

Here you can see the user role and the UI elements the user has access to together with API restrictions and the actions the user can perform.

Roles grant the ability to configure access to specific UI elements, actions and restrict API calls in a granular fashion. So, when you’re configuring a role, you will see a screen similar to the one below:

Configuring user roles

User roles

Here you can select User type. The user type restrictions still apply. Users can get access only to Monitoring and Inventory, Admins can get access to except the Administration section, and Super admins can get access to every section, including Administration.

With roles we can further restrict these user types. You can have Super admins with some limitations, so that they could only do specific actions and access specific UI sections.

This option has two core benefits. The first one is security as we can limit what our customers can do and what they can access. The other benefit is in the UX, as we can simplify the UI for our users, especially people not experienced with Zabbix. We can restrict the visibility of the sections that the end users don’t have access to, so they will not be concerned with navigating through multiple sections and subsections that they are not familiar with.

User groups

We still have user groups and user groups to host groups relations, which we have to take into consideration. Access to hosts is defined on User groups. So, we have to define our user groups and assign Full/Read only/Deny permissions on particular host groups. This is how we limit what specific customers can access.

User groups

In addition, we can have host groups defined in a hierarchical manner. For instance, if you have two customers each of then having a “Network Devices” subgroup, we can select to include the root group and all of its subgroups when assigning user group to host group permissions. This is a really elegant and quick way to give a User or an Admin on the customer’s side access to all of their hosts or limit a specific organizational unit to only access what they need, e.g.: only permit access to network devices for network administrators.

Using group hierarchy

High availability

The next important decision is the HA implementation. Going without some sort of HA solution is simply too risky and therefore is not an option with such environments.

  • HA can be used to minimize downtime and add redundancy.
  • Zabbix supporst Linux HA tools – PCS, Corosync, Pacemaker, which are used to enable HA. You are also welcome to try and use other third-party tools for HA.
  • Out-of-the-box HA is planned for Zabbix 6.0.

HA setup

To achieve a quorum in our HA environment, we will require an odd number of nodes. For Zabbix backend HA it is very much recommended to have at least three nodes. Does that mean that you have to deploy 3 Zabbix servers? Not really – our third node is going to be a really small arbitration node, which is simply going to be checking connections to the two other Zabbix nodes and giving a vote to achieve quorum in case of issues with one of the nodes.

In the end we will have three nodes:  Zabbix server A, Zabbix server B, and the Arbiter node

  • An odd number of nodes is recommended to achieve quorum.
  • Only Active/Passive cluster architecture is supported.
  • We cannot have two Zabbix nodes active running at the same time and talking to the same database. It is important to use some ‘shoot the other node in the head’ mechanism — STONITH to avoid such split-brain scenarios.

Failure to abide by these requirements can result in issues with database consistency, issues with underlying queries and cleaning up or inserting data. This can cause unexpected Zabbix backend server crashes down the line.

In addition, it is very common to have a requirement for proxies to be deployed with HA. Before implementing HA for proxies, we need to decide if we really do need it. HA adds a significant configuration management overhead. We can have hundreds if not thousands of proxies, and managing HA for each of those can add a significant overhead. Of course, the more comfortable you feel with the HA tools, the easier the deployment and the management of the environment.

Another approach for  Zabbix proxy HA can also be implemented by using Zabbix API scripts. We can essentially have two proxies running without the need to have the HA suite. In this case, if proxy A is down, we can use Zabbix API to move a host from proxy A to proxy B.

Using Zabbix API script to change the proxy

Here, host.massupdate is used to change the proxy on the hosts. Combine this with a robust scripting logic and you end up with a very viable approach to move your hosts between proxies in failover scenarios.

Database replication

We have covered the HA for Zabbix server backend and let’s remember that with frontend servers, we can simply bring up additional frontends, for instance, by utilizing Docker containers. But what about the DB redundancy?

  • Database replication can be used as a form of redundancy for the Zabbix DB. No matter the DB backend – Postgres, MySQL, Oracle, we can deploy multiple DB nodes and utilize the native DB replication or use third-party tools for replication, for instance, Galera Cluster.
  • I personally prefer using native replication tools as it is a bit more simple and you don’t have to concern yourself with another configuration and management layer that could potentially fail and be a bother to troubleshoot. But this will depend on your requirements, design and skillset.

Let’s look at an example with MySQL replication. You can set it up in many different ways as multiple replication approaches are supported: master/slave, master/master, or even have multiple masters replicating to one another. It is completely up to you how to implement replication, especially if you are already experienced with such deployments.

Which approach is best? At the end of the day it will all depend on your company policies, database backend and a compromise between simplicty and extra redundancy. I definitely suggest delving deeper and studying use cases and articles for the DB backend of your choice, before you decide to go with any particular approach.

Database replication

Database performance tuning

Database tuning is vital for the long term stability of your Zabbix instance. The database defaults might be sufficient for your home office, but for large multi-tenant environments with tens of thousands new values per second they will not suffice. The database defaults depend on the database backend and the database version used, but ideally, these should be tuned and tested, preferably during the design stage, before you have deployed your Zabbix instance in production.

After installing the database backend we need to take a look at the hardware resources available. Ideally, you have already estimated the hardware resources required for your instance and ensured that DB hosts have sufficient memory, CPU resources and storage has been selected according to the I/O requirements. Now, you can move on to tuning your database backend.

As an example with Postgres I used PGTune — an online database tuning tool. This is a simple estimate that should still provide you with a somewhat adequate configuration. Though ideally, you should have a DBA on board that is aware of what kind of data loads you will be dealing with to help you with an optimal database configuration.

Database performance tuning

History table partitioning

In such large environments, you will most likely see that housekeeper cannot keep up with the amount of data stored, unable to clean it up in a timely fashion with the housekeeper processes utilization reaching reaching 100 percent for 20-30 minutes at a time. This will have a negative effect on the overall database performance for the duration of housekeeping.

At this point, it is recommended to implement partitioning for history/trend tables. We can use Postgres with TimescaleDB plugin for this. Partitioning is supported out of the box, and you can configure it in Administration > General > Housekeeping.

For MySQL and Oracle backends we would have to rely on custom partitioning scripts or procedures. In addition, community-provided partitioning scripts are publicly available.

As always – don’t forget to test 3rd party scripts in a test environment before deploying it in production!

Community partitioning solution for MySQL

You can always create your own partitioning script, but you should be aware of what you’re doing and how things should be partitioned. We should always be partitioning only history and trend tables.

History table partitioning with TimescaleDB

  • TimescaleDB plugin for PostgreSQL DB backends supports out-of-the-box partitioning. You don’t have to rely on community scripts.
  • On TimescaleDB, we need to specify the chunk_time_interval parameter, which will define the partition chunk size.
  • In addition, we can also add compression of history/trends, which helps to reduce the history table size by 60-80 percent. Again, in such scenarios, your database is going to be huge — terabytes in size with hundreds of customers, each having thousands of metrics per second. So, compression is a really valuable asset.
  • The only thing we have to take into account is that compressed data is read-only and cannot be changed post-compression. So, no more changes or inserts are possible for the compressed chunks.

History and trends compression

To-do list

  • Deploy the latest available Zabbix version. Ideally stick with an LTS version.
  • Deploy proxy servers, define and configure HA/Replication on Zabbix proxies, as well as on Zabbix servers and databases.
  • Implement partitioning to improve database performance.
  • Implement throttling to reduce the volume of the incoming data.
  • Tune your database! Either use online guides or consult with your DBA.

With our to-do list completed, we can have our Zabbix environment with deployed with redundancy in mind, providing monitoring as a service for hundreds of customers, multiple proxies running for each of the customers, HA in place, and Zabbix performing up to our expectations.

Questions & Answers

Question. Will Zabbix have its native HA solution? Will it be the whole package or does it involve installing individual components and maintaining them?

Answer. It’s planned on the roadmap to have a native HA solution in Zabbix 6.0. You should be able to get your hands on it when the 6.0 beta version gets released. Hopefully, you’ll be able to get your hands on it, test it out yourselves and give us feedback. From the looks of it it should be very much plug-and-play and will remove a lot of management overhead when comparing it with current HA implementation. Right now this is being developed only for the Zabbix backend server. As for the frontend – nothing is stopping you from having multiple frontends pointed at the same DB/Zabbix backend server. 

Question. Can I run Zabbix on a single server and sell monitoring service to several customers with fully isolated environments, not just GUI, but also items, triggers, etc.

Answer. Yes, you can. You can have a single Zabbix instance and multiple customers being monitored by this instance. The only extra step that might be required is deploying proxies on the customer’s side. By using permission restrictions, proxy servers, roles, etc., we can then monitor multiple customers from a single Zabbix instance.

Question. When we change proxy, the agent configuration has to be updated. What about HA configuration on the proxy?

Answer. That really depends on the approach. If the agent is getting pointed at the virtual IP address and HA is managed by PCS, Corosync, or Pacemaker, then it should be fine as is and the VIP should just be on the currently active host. So, you’ll be essentially rerouted. With the HA by way of API approach, you can simply allow your agent to accept connections from both proxies. With ServerActive we can also specify multiple endpoints, so agents can actually be prepared for such an environment.

Question. How to merge two different instances into a single monitoring instance?

Answer. This is a complex task. First off, both instances need to have the same major Zabbix backend version. You might simply migrate the history from one instance to another, but then you will have some problems with underlying element IDs. So, in one instance you have your own set of items, triggers, users, etc. with your own set of IDs. These will most likely conflict with the set of IDs on the other instance.

You can do partial migration or use the export function to export your templates, hosts, value maps, network maps. I would try to export as much as I can as migration on SQL level will be a real pain. It is possible if you’re stubborn enough, but it can end up being a really complex task that can take days if not weeks to fully implement and test.

Question. Do subgroups relate to templates as well?

Answer. Subgroups relate to templates in a way where we can also define permissions to reading and modifying templates. For templates, you can also create per-customer templates and assign them to host groups. Users that have access to these host groups can then read or modify the templates.
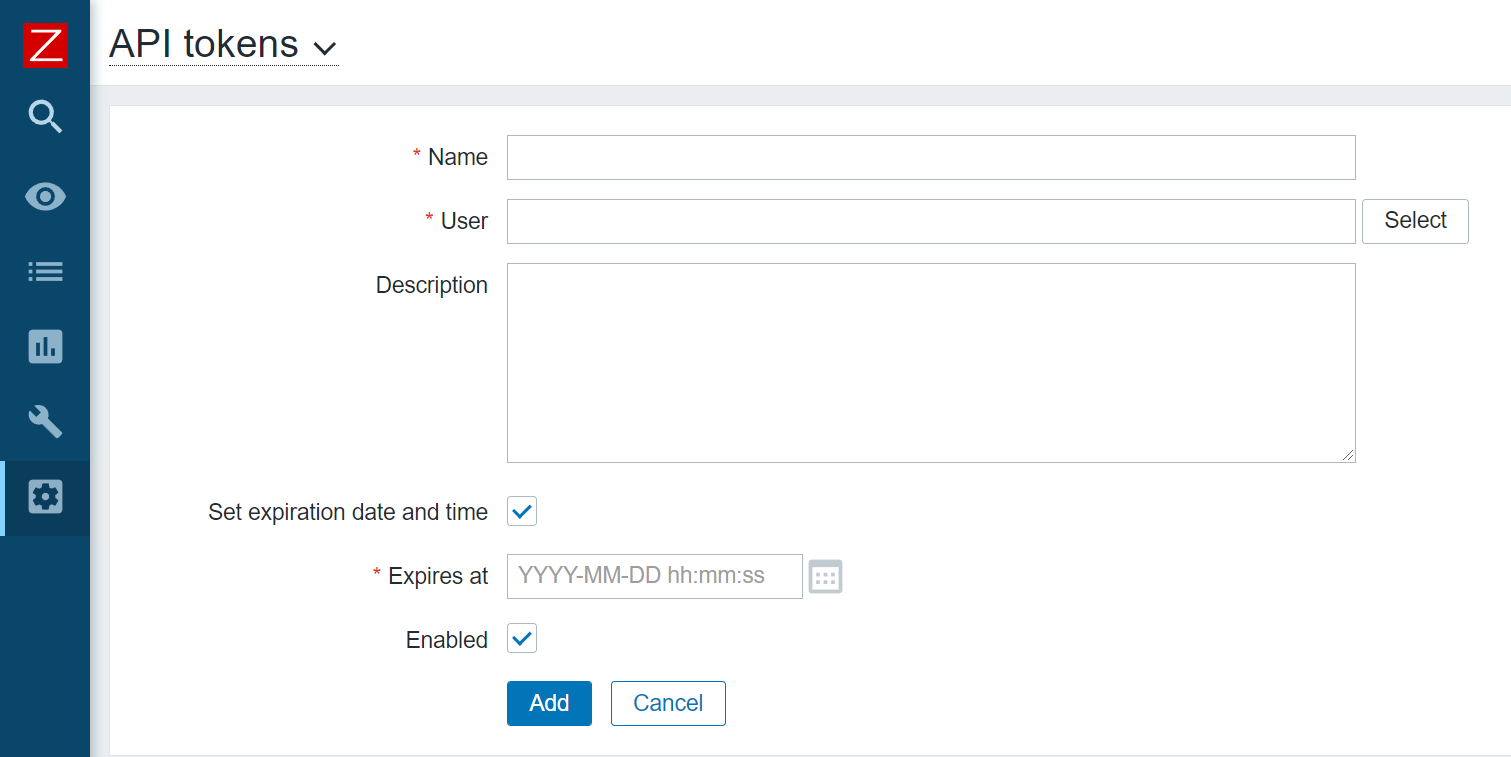
CICD on Serverless Applications using AWS CodeArtifact

Post Syndicated from Anand Krishna original https://aws.amazon.com/blogs/devops/cicd-on-serverless-applications-using-aws-codeartifact/

Developing and deploying applications rapidly to users requires a working pipeline that accepts the user code (usually via a Git repository). AWS CodeArtifact was announced in 2020. It’s a secure and scalable artifact management product that easily integrates with other AWS products and services. CodeArtifact allows you to publish, store, and view packages, list package dependencies, and share your application’s packages.

In this post, I will show how we can build a simple DevOps pipeline for a sample JAVA application (JAR file) to be built with Maven.

Solution Overview

We utilize the following AWS services/Tools/Frameworks to set up our continuous integration, continuous deployment (CI/CD) pipeline:

The following diagram illustrates the pipeline architecture and flow:


aws-codeartifact-pipeline


Our pipeline is built on CodePipeline with CodeCommit as the source (CodePipeline Source Stage). This triggers the pipeline via a CloudWatch Events rule. Then the code is fetched from the CodeCommit repository branch (main) and sent to the next pipeline phase. This CodeBuild phase is specifically for compiling, packaging, and publishing the code to CodeArtifact by utilizing a package manager—in this case Maven.

After Maven publishes the code to CodeArtifact, the pipeline asks for a manual approval to be directly approved in the pipeline. It can also optionally trigger an email alert via Amazon Simple Notification Service (Amazon SNS). After approval, the pipeline moves to another CodeBuild phase. This downloads the latest packaged JAR file from a CodeArtifact repository and deploys to the AWS Lambda function.

Clone the Repository

Clone the GitHub repository as follows:

git clone https://github.com/aws-samples/aws-cdk-codeartifact-pipeline-sample.git

Code Deep Dive

After the Git repository is cloned, the directory structure is shown as in the following screenshot :

aws-codeartifact-pipeline-code

Let’s study the files and code to understand how the pipeline is built.

The directory java-events is a sample Java Maven project. Find numerous sample applications on GitHub. For this post, we use the sample application java-events.

To add your own application code, place the pom.xml and settings.xml files in the root directory for the AWS CDK project.

Let’s study the code in the file lib/cdk-pipeline-codeartifact-new-stack.ts of the stack CdkPipelineCodeartifactStack. This is the heart of the AWS CDK code that builds the whole pipeline. The stack does the following:

  • Creates a CodeCommit repository called ca-pipeline-repository.
  • References a CloudFormation template (lib/ca-template.yaml) in the AWS CDK code via the module @aws-cdk/cloudformation-include.
  • Creates a CodeArtifact domain called cdkpipelines-codeartifact.
  • Creates a CodeArtifact repository called cdkpipelines-codeartifact-repository.
  • Creates a CodeBuild project called JarBuild_CodeArtifact. This CodeBuild phase does all of the code compiling, packaging, and publishing to CodeArtifact into a repository called cdkpipelines-codeartifact-repository.
  • Creates a CodeBuild project called JarDeploy_Lambda_Function. This phase fetches the latest artifact from CodeArtifact created in the previous step (cdkpipelines-codeartifact-repository) and deploys to the Lambda function.
  • Finally, creates a pipeline with four phases:
    • Source as CodeCommit (ca-pipeline-repository).
    • CodeBuild project JarBuild_CodeArtifact.
    • A Manual approval Stage.
    • CodeBuild project JarDeploy_Lambda_Function.


CodeArtifact shows the domain-specific and repository-specific connection settings to mention/add in the application’s pom.xml and settings.xml files as below:

aws-codeartifact-repository-connections

Deploy the Pipeline

The AWS CDK code requires the following packages in order to build the CI/CD pipeline:

  • @aws-cdk/core
  • @aws-cdk/aws-codepipeline
  • @aws-cdk/aws-codepipeline-actions
  • @aws-cdk/aws-codecommit
  • @aws-cdk/aws-codebuild
  • @aws-cdk/aws-iam
  • @aws-cdk/cloudformation-include


Install the required AWS CDK packages as below:

npm i @aws-cdk/core @aws-cdk/aws-codepipeline @aws-cdk/aws-codepipeline-actions @aws-cdk/aws-codecommit @aws-cdk/aws-codebuild @aws-cdk/pipelines @aws-cdk/aws-iam @ @aws-cdk/cloudformation-include

Compile the AWS CDK code:

npm run build

Deploy the AWS CDK code:

cdk synth
cdk deploy

After the AWS CDK code is deployed, view the final output on the stack’s detail page on the AWS CloudFormation :

aws-codeartifact-pipeline-cloudformation-stack


How the pipeline works with artifact versions (using SNAPSHOTS)

In this demo, I publish SNAPSHOT to the repository. As per the documentation here and here, a SNAPSHOT refers to the most recent code along a branch. It’s a development version preceding the final release version. Identify a snapshot version of a Maven package by the suffix SNAPSHOT appended to the package version.

The application settings are defined in the pom.xml file. For this post, we define the following:

  • The version to be used, called 1.0-SNAPSHOT.
  • The specific packaging, called jar.
  • The specific project display name, called JavaEvents.
  • The specific group ID, called JavaEvents.

The screenshot below shows the pom.xml settings we utilised in the application:

aws-codeartifact-pipeline-pom-xml


You can’t republish a package asset that already exists with different content, as per the documentation here.

When a Maven snapshot is published, its previous version is preserved in a new version called a build. Each time a Maven snapshot is published, a new build version is created.

When a Maven snapshot is published, its status is set to Published, and the status of the build containing the previous version is set to Unlisted. If you request a snapshot, the version with status Published is returned. This is always the most recent Maven snapshot version.

For example, the image below shows the state when the pipeline is run for the FIRST RUN. The latest version has the status Published and previous builds are marked Unlisted.

aws-codeartifact-repository-package-versions


For all subsequent pipeline runs, multiple Unlisted versions will occur every time the pipeline is run, as all previous versions of a snapshot are maintained in its build versions.

aws-codeartifact-repository-package-versions


Fetching the Latest Code

Retrieve the snapshot from the repository in order to deploy the code to an AWS Lambda Function. I have used AWS CLI to list and fetch the latest asset of package version 1.0-SNAPSHOT.


Listing the latest snapshot

export ListLatestArtifact = `aws codeartifact list-package-version-assets —domain cdkpipelines-codeartifact --domain-owner $Account_Id --repository cdkpipelines-codeartifact-repository --namespace JavaEvents --format maven --package JavaEvents --package-version "1.0-SNAPSHOT"| jq ".assets[].name"|grep jar|sed ’s/“//g’`

NOTE : Please note the dynamic CDK variable $Account_Id which represents AWS Account ID.


Fetching the latest code using Package Version

aws codeartifact get-package-version-asset --domain cdkpipelines-codeartifact --repository cdkpipelines-codeartifact-repository --format maven --package JavaEvents --package-version 1.0-SNAPSHOT --namespace JavaEvents --asset $ListLatestArtifact demooutput

Notice that I’m referring the last code by using variable $ListLatestArtifact. This always fetches the latest code, and demooutput is the outfile of the AWS CLI command where the content (code) is saved.


Testing the Pipeline

Now clone the CodeCommit repository that we created with the following code:

git clone https://git-codecommit.<region>.amazonaws.com/v1/repos/codeartifact-pipeline-repository


Enter the following code to push the code to the CodeCommit repository:

cp -rp cdk-pipeline-codeartifact-new /* ca-pipeline-repository
cd ca-pipeline-repository
git checkout -b main
git add .
git commit -m “testing the pipeline”
git push origin main

Once the code is pushed to Git repository, the pipeline is automatically triggered by Amazon CloudWatch events.

The following screenshots shows the second phase (AWS CodeBuild Phase – JarBuild_CodeArtifact) of the pipeline, wherein the asset is successfully compiled and published to the CodeArtifact repository by Maven:

aws-codeartifact-pipeline-codebuild-jarbuild

aws-codeartifact-pipeline-codebuild-screenshot

aws-codeartifact-pipeline-codebuild-screenshot2


The following screenshots show the last phase (AWS CodeBuild Phase – Deploy-to-Lambda) of the pipeline, wherein the latest asset is successfully pulled and deployed to AWS Lambda Function.

Asset JavaEvents-1.0-20210618.131629-5.jar is the latest snapshot code for the package version 1.0-SNAPSHOT. This is the same asset version code that will be deployed to AWS Lambda Function, as seen in the screenshots below:

aws-codeartifact-pipeline-codebuild-jardeploy

aws-codeartifact-pipeline-codebuild-screenshot-jarbuild

The following screenshot of the pipeline shows a successful run. The code was fetched and deployed to the existing Lambda function (codeartifact-test-function).

aws-codeartifact-pipeline-codepipeline

Cleanup

To clean up, You can either delete the entire stack through the AWS CloudFormation console or use AWS CDK command like below –

cdk destroy

For more information on the AWS CDK commands, please check the here or sample here.

Summary

In this post, I demonstrated how to build a CI/CD pipeline for your serverless application with AWS CodePipeline by utilizing AWS CDK with AWS CodeArtifact. Please check the documentation here for an in-depth explanation regarding other package managers and the getting started guide.

Code your own pinball game | Wireframe #53

Post Syndicated from Ryan Lambie original https://www.raspberrypi.org/blog/code-your-own-pinball-game-wireframe-53/

Get flappers flapping and balls bouncing off bumpers. Mark Vanstone has the code in the new issue of Wireframe magazine, available now.

There are so many pinball video games that it’s become a genre in its own right. For the few of you who haven’t encountered pinball for some reason, it originated as an analogue arcade machine where a metal ball would be fired onto a sloping play area and bounce between obstacles. The player operates a pair of flippers by pressing buttons on each side of the machine, which will in turn ping the ball back up the play area to hit obstacles and earn points. The game ends when the ball falls through the exit at the bottom of the play area.

NES Pinball
One of the earliest pinball video games – it’s the imaginatively-named Pinball on the NES.

Recreating pinball machines for video games

Video game developers soon started trying to recreate pinball, first with fairly rudimentary graphics and physics, but with increasingly greater realism over time – if you look at Nintendo’s Pinball from 1984, then, say, Devil’s Crush on the Sega Mega Drive in 1990, and then 1992’s Pinball Dreams on PC, you can see how radically the genre evolved in just a few years. In this month’s Source Code, we’re going to put together a very simple rendition of pinball in Pygame Zero. We’re not going to use any complicated maths or physics systems, just a little algebra and trigonometry.

Let’s start with our background. We need an image which has barriers around the outside for the ball to bounce off, and a gap at the bottom for the ball to fall through. We also want some obstacles in the play area and an entrance at the side for the ball to enter when it’s first fired. In this case, we’re going to use our background as a collision map, too, so we need to design it so that all the areas that the ball can move in are black.

Pinball in Python
Here it is: your own pinball game in less than 100 lines of code.

Next, we need some flippers. These are defined as Actors with a pivot anchor position set near the larger end, and are positioned near the bottom of the play area. We detect left and right key presses and rotate the angle of the flippers by 20 degrees within a range of -30 to +30 degrees. If no key is pressed, then the flipper drops back down. With these elements in place, we have our play area and an ability for the player to defend the exit.

All we need now is a ball to go bouncing around the obstacles we’ve made. Defining the ball as an Actor, we can add a direction and a speed parameter to it. With these values set, the ball can be moved using a bit of trigonometry. Our new x-coordinate will move by the sin of the ball direction multiplied by the speed, and the new y-coordinate will move by the cos of the ball direction multiplied by speed. We need to detect collisions with objects and obstacles, so we sample four pixels around the ball to see if it’s hit anything solid. If it has, we need to make the ball bounce.

Get the code

Here’s Mark’s pinball code. To get it working on your system, you’ll need to install Pygame Zero. And to download the full code and assets, head here.

If you wanted more realistic physics, you’d calculate the reflection angle from the surface which has been hit, but in this case, we’re going to use a shortcut which will produce a rough approximation. We work out what direction the ball is travelling in and then rotate either left or right by a quarter of a turn until the ball no longer collides with a wall. We could finesse this calculation further to create a more accurate effect, but we’ll keep it simple for this sample. Finally, we need to add some gravity. As the play area is tilted downwards, we need to increase the ball speed as it travels down and decrease it as it travels up.

All of this should give you the bare bones of a pinball game. There’s lots more you could add to increase the realism, but we’ll leave you to discover the joys of normal vectors and dot products…

Get your copy of Wireframe issue 53

You can read more features like this one in Wireframe issue 53, available directly from Raspberry Pi Press — we deliver worldwide.

And if you’d like a handy digital version of the magazine, you can also download issue 53 for free in PDF format.

The post Code your own pinball game | Wireframe #53 appeared first on Raspberry Pi.

Blue/Green deployment with AWS Developer tools on Amazon EC2 using Amazon EFS to host application source code

Post Syndicated from Rakesh Singh original https://aws.amazon.com/blogs/devops/blue-green-deployment-with-aws-developer-tools-on-amazon-ec2-using-amazon-efs-to-host-application-source-code/

Many organizations building modern applications require a shared and persistent storage layer for hosting and deploying data-intensive enterprise applications, such as content management systems, media and entertainment, distributed applications like machine learning training, etc. These applications demand a centralized file share that scales to petabytes without disrupting running applications and remains concurrently accessible from potentially thousands of Amazon EC2 instances.

Simultaneously, customers want to automate the end-to-end deployment workflow and leverage continuous methodologies utilizing AWS developer tools services for performing a blue/green deployment with zero downtime. A blue/green deployment is a deployment strategy wherein you create two separate, but identical environments. One environment (blue) is running the current application version, and one environment (green) is running the new application version. The blue/green deployment strategy increases application availability by generally isolating the two application environments and ensuring that spinning up a parallel green environment won’t affect the blue environment resources. This isolation reduces deployment risk by simplifying the rollback process if a deployment fails.

Amazon Elastic File System (Amazon EFS) provides a simple, scalable, and fully-managed elastic NFS file system for use with AWS Cloud services and on-premises resources. It scales on demand, thereby eliminating the need to provision and manage capacity in order to accommodate growth. Utilize Amazon EFS to create a shared directory that stores and serves code and content for numerous applications. Your application can treat a mounted Amazon EFS volume like local storage. This means you don’t have to deploy your application code every time the environment scales up to multiple instances to distribute load.

In this blog post, I will guide you through an automated process to deploy a sample web application on Amazon EC2 instances utilizing Amazon EFS mount to host application source code, and utilizing a blue/green deployment with AWS code suite services in order to deploy the application source code with no downtime.

How this solution works

This blog post includes a CloudFormation template to provision all of the resources needed for this solution. The CloudFormation stack deploys a Hello World application on Amazon Linux 2 EC2 Instances running behind an Application Load Balancer and utilizes Amazon EFS mount point to store the application content. The AWS CodePipeline project utilizes AWS CodeCommit as the version control, AWS CodeBuild for installing dependencies and creating artifacts,  and AWS CodeDeploy to conduct deployment on EC2 instances running in an Amazon EC2 Auto Scaling group.

Figure 1 below illustrates our solution architecture.

Sample solution architecture

Figure 1: Sample solution architecture

The event flow in Figure 1 is as follows:

  1. A developer commits code changes from their local repo to the CodeCommit repository. The commit triggers CodePipeline execution.
  2. CodeBuild execution begins to compile source code, install dependencies, run custom commands, and create deployment artifact as per the instructions in the Build specification reference file.
  3. During the build phase, CodeBuild copies the source-code artifact to Amazon EFS file system and maintains two different directories for current (green) and new (blue) deployments.
  4. After successfully completing the build step, CodeDeploy deployment kicks in to conduct a Blue/Green deployment to a new Auto Scaling Group.
  5. During the deployment phase, CodeDeploy mounts the EFS file system on new EC2 instances as per the CodeDeploy AppSpec file reference and conducts other deployment activities.
  6. After successful deployment, a Lambda function triggers in order to store a deployment environment parameter in Systems Manager parameter store. The parameter stores the current EFS mount name that the application utilizes.
  7. The AWS Lambda function updates the parameter value during every successful deployment with the current EFS location.

Prerequisites

For this walkthrough, the following are required:

Deploy the solution

Once you’ve assembled the prerequisites, download or clone the GitHub repo and store the files on your local machine. Utilize the commands below to clone the repo:

mkdir -p ~/blue-green-sample/
cd ~/blue-green-sample/
git clone https://github.com/aws-samples/blue-green-deployment-pipeline-for-efs

Once completed, utilize the following steps to deploy the solution in your AWS account:

  1. Create a private Amazon Simple Storage Service (Amazon S3) bucket by using this documentation
    AWS S3 console view when creating a bucket

    Figure 2: AWS S3 console view when creating a bucket


  2. Upload the cloned or downloaded GitHub repo files to the root of the S3 bucket. the S3 bucket objects structure should look similar to Figure 3:
    AWS S3 bucket object structure after you upload the Github repo content

    Figure 3: AWS S3 bucket object structure


  3. Go to the S3 bucket and select the template name solution-stack-template.yml, and then copy the object URL.
  4. Open the CloudFormation console. Choose the appropriate AWS Region, and then choose Create Stack. Select With new resources.
  5. Select Amazon S3 URL as the template source, paste the object URL that you copied in Step 3, and then choose Next.
  6. On the Specify stack details page, enter a name for the stack and provide the following input parameter. Modify the default values for other parameters in order to customize the solution for your environment. You can leave everything as default for this walkthrough.
  • ArtifactBucket– The name of the S3 bucket that you created in the first step of the solution deployment. This is a mandatory parameter with no default value.
Defining the stack name and input parameters for the CloudFormation stack

Figure 4: Defining the stack name and input parameters for the CloudFormation stack

  1. Choose Next.
  2. On the Options page, keep the default values and then choose Next.
  3. On the Review page, confirm the details, acknowledge that CloudFormation might create IAM resources with custom names, and then choose Create Stack.
  4. Once the stack creation is marked as CREATE_COMPLETE, the following resources are created:
  • A virtual private cloud (VPC) configured with two public and two private subnets.
  • NAT Gateway, an EIP address, and an Internet Gateway.
  • Route tables for private and public subnets.
  • Auto Scaling Group with a single EC2 Instance.
  • Application Load Balancer and a Target Group.
  • Three security groups—one each for ALB, web servers, and EFS file system.
  • Amazon EFS file system with a mount target for each Availability Zone.
  • CodePipeline project with CodeCommit repository, CodeBuild, and CodeDeploy resources.
  • SSM parameter to store the environment current deployment status.
  • Lambda function to update the SSM parameter for every successful pipeline execution.
  • Required IAM Roles and policies.

      Note: It may take anywhere from 10-20 minutes to complete the stack creation.

Test the solution

Now that the solution stack is deployed, follow the steps below to test the solution:

  1. Validate CodePipeline execution status

After successfully creating the CloudFormation stack, a CodePipeline execution automatically triggers to deploy the default application code version from the CodeCommit repository.

  • In the AWS console, choose Services and then CloudFormation. Select your stack name. On the stack Outputs tab, look for the CodePipelineURL key and click on the URL.
  • Validate that all steps have successfully completed. For a successful CodePipeline execution, you should see something like Figure 5. Wait for the execution to complete in case it is still in progress.
CodePipeline console showing execution status of all stages

Figure 5: CodePipeline console showing execution status of all stages


  1. Validate the Website URL

After completing the pipeline execution, hit the website URL on a browser to check if it’s working.

  • On the stack Outputs tab, look for the WebsiteURL key and click on the URL.
  • For a successful deployment, it should open a default page similar to Figure 6.
Sample “Hello World” application (Green deployment)

Figure 6: Sample “Hello World” application (Green deployment)


  1. Validate the EFS share

After the website deployed successfully, we will get into the application server and validate the EFS mount point and the application source code directory.

  • Open the Amazon EC2 console, and then choose Instances in the left navigation pane.
  • Select the instance named bg-sample and choose
  • For Connection method, choose Session Manager, and then choose connect

After the connection is made, run the following bash commands to validate the EFS mount and the deployed content. Figure 7 shows a sample output from running the bash commands.

sudo df –h | grep efs
ls –la /efs/green
ls –la /var/www/
Sample output from the bash command (Green deployment)

Figure 7: Sample output from the bash command (Green deployment)


  1. Deploy a new revision of the application code

After verifying the application status and the deployed code on the EFS share, commit some changes to the CodeCommit repository in order to trigger a new deployment.

  • On the stack Outputs tab, look for the CodeCommitURL key and click on the corresponding URL.
  • Click on the file html.
  • Click on
  • Uncomment line 9 and comment line 10, so that the new lines look like those below after the changes:
background-color: #0188cc; 
#background-color: #90ee90;
  • Add Author name, Email address, and then choose Commit changes.

After you commit the code, the CodePipeline triggers and executes Source, Build, Deploy, and Lambda stages. Once the execution completes, hit the Website URL and you should see a new page like Figure 8.

New Application version (Blue deployment)

Figure 8: New Application version (Blue deployment)


On the EFS side, the application directory on the new EC2 instance now points to /efs/blue as shown in Figure 9.

Sample output from the bash command (Blue deployment)

Figure 9: Sample output from the bash command (Blue deployment)

Solution review

Let’s review the pipeline stages details and what happens during the Blue/Green deployment:

1) Build stage

For this sample application, the CodeBuild project is configured to mount the EFS file system and utilize the buildspec.yml file present in the source code root directory to run the build. Following is the sample build spec utilized in this solution:

version: 0.2
phases:
  install:
    runtime-versions:
      php: latest   
  build:
    commands:
      - current_deployment=$(aws ssm get-parameter --name $SSM_PARAMETER --query "Parameter.Value" --region $REGION --output text)
      - echo $current_deployment
      - echo $SSM_PARAMETER
      - echo $EFS_ID $REGION
      - if [[ "$current_deployment" == "null" ]]; then echo "this is the first GREEN deployment for this project" ; dir='/efs/green' ; fi
      - if [[ "$current_deployment" == "green" ]]; then dir='/efs/blue' ; else dir='/efs/green' ; fi
      - if [ ! -d $dir ]; then  mkdir $dir >/dev/null 2>&1 ; fi
      - echo $dir
      - rsync -ar $CODEBUILD_SRC_DIR/ $dir/
artifacts:
  files:
      - '**/*'

During the build job, the following activities occur:

  • Installs latest php runtime version.
  • Reads the SSM parameter value in order to know the current deployment and decide which directory to utilize. The SSM parameter value flips between green and blue for every successful deployment.
  • Synchronizes the latest source code to the EFS mount point.
  • Creates artifacts to be utilized in subsequent stages.

Note: Utilize the default buildspec.yml as a reference and customize it further as per your requirement. See this link for more examples.

2) Deploy Stage

The solution is utilizing CodeDeploy blue/green deployment type for EC2/On-premises. The deployment environment is configured to provision a new EC2 Auto Scaling group for every new deployment in order to deploy the new application revision. CodeDeploy creates the new Auto Scaling group by copying the current one. See this link for more details on blue/green deployment configuration with CodeDeploy. During each deployment event, CodeDeploy utilizes the appspec.yml file to run the deployment steps as per the defined life cycle hooks. Following is the sample AppSpec file utilized in this solution.

version: 0.0
os: linux
hooks:
  BeforeInstall:
    - location: scripts/install_dependencies
      timeout: 180
      runas: root
  AfterInstall:
    - location: scripts/app_deployment
      timeout: 180
      runas: root
  BeforeAllowTraffic :
     - location: scripts/check_app_status
       timeout: 180
       runas: root  

Note: The scripts mentioned in the AppSpec file are available in the scripts directory of the CodeCommit repository. Utilize these sample scripts as a reference and modify as per your requirement.

For this sample, the following steps are conducted during a deployment:

  • BeforeInstall:
    • Installs required packages on the EC2 instance.
    • Mounts the EFS file system.
    • Creates a symbolic link to point the apache home directory /var/www/html to the appropriate EFS mount point. It also ensures that the new application version deploys to a different EFS directory without affecting the current running application.
  • AfterInstall:
    • Stops apache web server.
    • Fetches current EFS directory name from Systems Manager.
    • Runs some clean up commands.
    • Restarts apache web server.
  • BeforeAllowTraffic:
    • Checks application status if running fine.
    • Exits the deployment with error if the app returns a non 200 HTTP status code. 

3) Lambda Stage

After completing the deploy stage, CodePipeline triggers a Lambda function in order to update the SSM parameter value with the updated EFS directory name. This parameter value alternates between “blue” and “green” to help CodePipeline identify the right EFS file system path during the next deployment.

CodeDeploy Blue/Green deployment

Let’s review the sequence of events flow during the CodeDeploy deployment:

  1. CodeDeploy creates a new Auto Scaling group by copying the original one.
  2. Provisions a replacement EC2 instance in the new Auto Scaling Group.
  3. Conducts the deployment on the new instance as per the instructions in the yml file.
  4. Sets up health checks and redirects traffic to the new instance.
  5. Terminates the original instance along with the Auto Scaling Group.
  6. After completing the deployment, it should appear as shown in Figure 10.
AWS CodeDeploy console view of a Blue/Green CodeDeploy deployment on Ec2

Figure 10: AWS console view of a Blue/Green CodeDeploy deployment on Ec2

Troubleshooting

To troubleshoot any service-related issues, see the following links:

More information

Now that you have tested the solution, here are some additional points worth noting:

  • The sample template and code utilized in this blog can work in any AWS region and are mainly intended for demonstration purposes. Utilize the sample as a reference and modify it further as per your requirement.
  • This solution works with single account, Region, and VPC combination.
  • For this sample, we have utilized AWS CodeCommit as version control, but you can also utilize any other source supported by AWS CodePipeline like Bitbucket, GitHub, or GitHub Enterprise Server

Clean up

Follow these steps to delete the components and avoid any future incurring charges:

  1. Open the AWS CloudFormation console.
  2. On the Stacks page in the CloudFormation console, select the stack that you created for this blog post. The stack must be currently running.
  3. In the stack details pane, choose Delete.
  4. Select Delete stack when prompted.
  5. Empty and delete the S3 bucket created during deployment step 1.

Conclusion

In this blog post, you learned how to set up a complete CI/CD pipeline for conducting a blue/green deployment on EC2 instances utilizing Amazon EFS file share as mount point to host application source code. The EFS share will be the central location hosting your application content, and it will help reduce your overall deployment time by eliminating the need for deploying a new revision on every EC2 instance local storage. It also helps to preserve any dynamically generated content when the life of an EC2 instance ends.

Author bio

Rakesh Singh

Rakesh is a Senior Technical Account Manager at Amazon. He loves automation and enjoys working directly with customers to solve complex technical issues and provide architectural guidance. Outside of work, he enjoys playing soccer, singing karaoke, and watching thriller movies.