Post Syndicated from Guy Morton original https://aws.amazon.com/blogs/security/security-at-multiple-layers-for-web-administered-apps/
In this post, I will show you how to apply security at multiple layers of a web application hosted on AWS.
Apply security at all layers is a design principle of the Security pillar of the AWS Well-Architected Framework. It encourages you to apply security at the network edge, virtual private cloud (VPC), load balancer, compute instance (or service), operating system, application, and code.
Many popular web apps are designed with a single layer of security: the login page. Behind that login page is an in-built administration interface that is directly exposed to the internet. Admin interfaces for these apps typically have simple login mechanisms and often lack multi-factor authentication (MFA) support, which can make them an attractive target for threat actors.
The in-built admin interface can also be problematic if you want to horizontally scale across multiple servers. The admin interface is available on every server that runs the app, so it creates a large attack surface. Because the admin interface updates the software on its own server, you must synchronize updates across a fleet of instances.
Multi-layered security is about identifying (or creating) isolation boundaries around the parts of your architecture and minimizing what is permitted to cross each boundary. Adding more layers to your architecture gives you the opportunity to introduce additional controls at each layer, creating more boundaries where security controls can be enforced.
In the example app scenario in this post, you have the opportunity to add many additional layers of security.
Example of multi-layered security
This post demonstrates how you can use the Run Web-Administered Apps on AWS sample project to help address these challenges, by implementing a horizontally-scalable architecture with multi-layered security. The project builds and configures many different AWS services, each designed to help provide security at different layers.
By running this solution, you can produce a segmented architecture that separates the two functions of these apps into an unprivileged public-facing view and an admin view. This design limits access to the web app’s admin functions while creating a fleet of unprivileged instances to serve the app at scale.
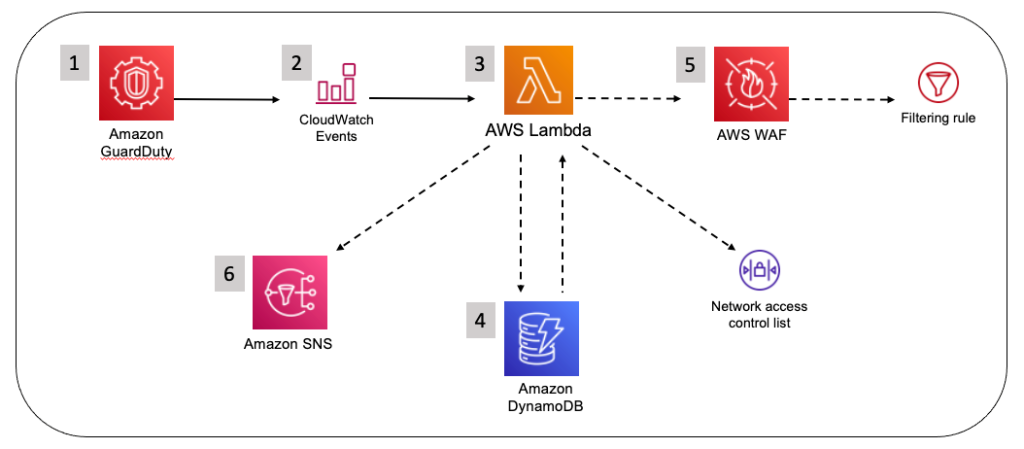
Figure 1 summarizes how the different services in this solution work to help provide security at the following layers:
- At the network edge
- Within the VPC
- At the load balancer
- On the compute instances
- Within the operating system

Figure 1: Logical flow diagram to apply security at multiple layers
Deep dive on a multi-layered architecture
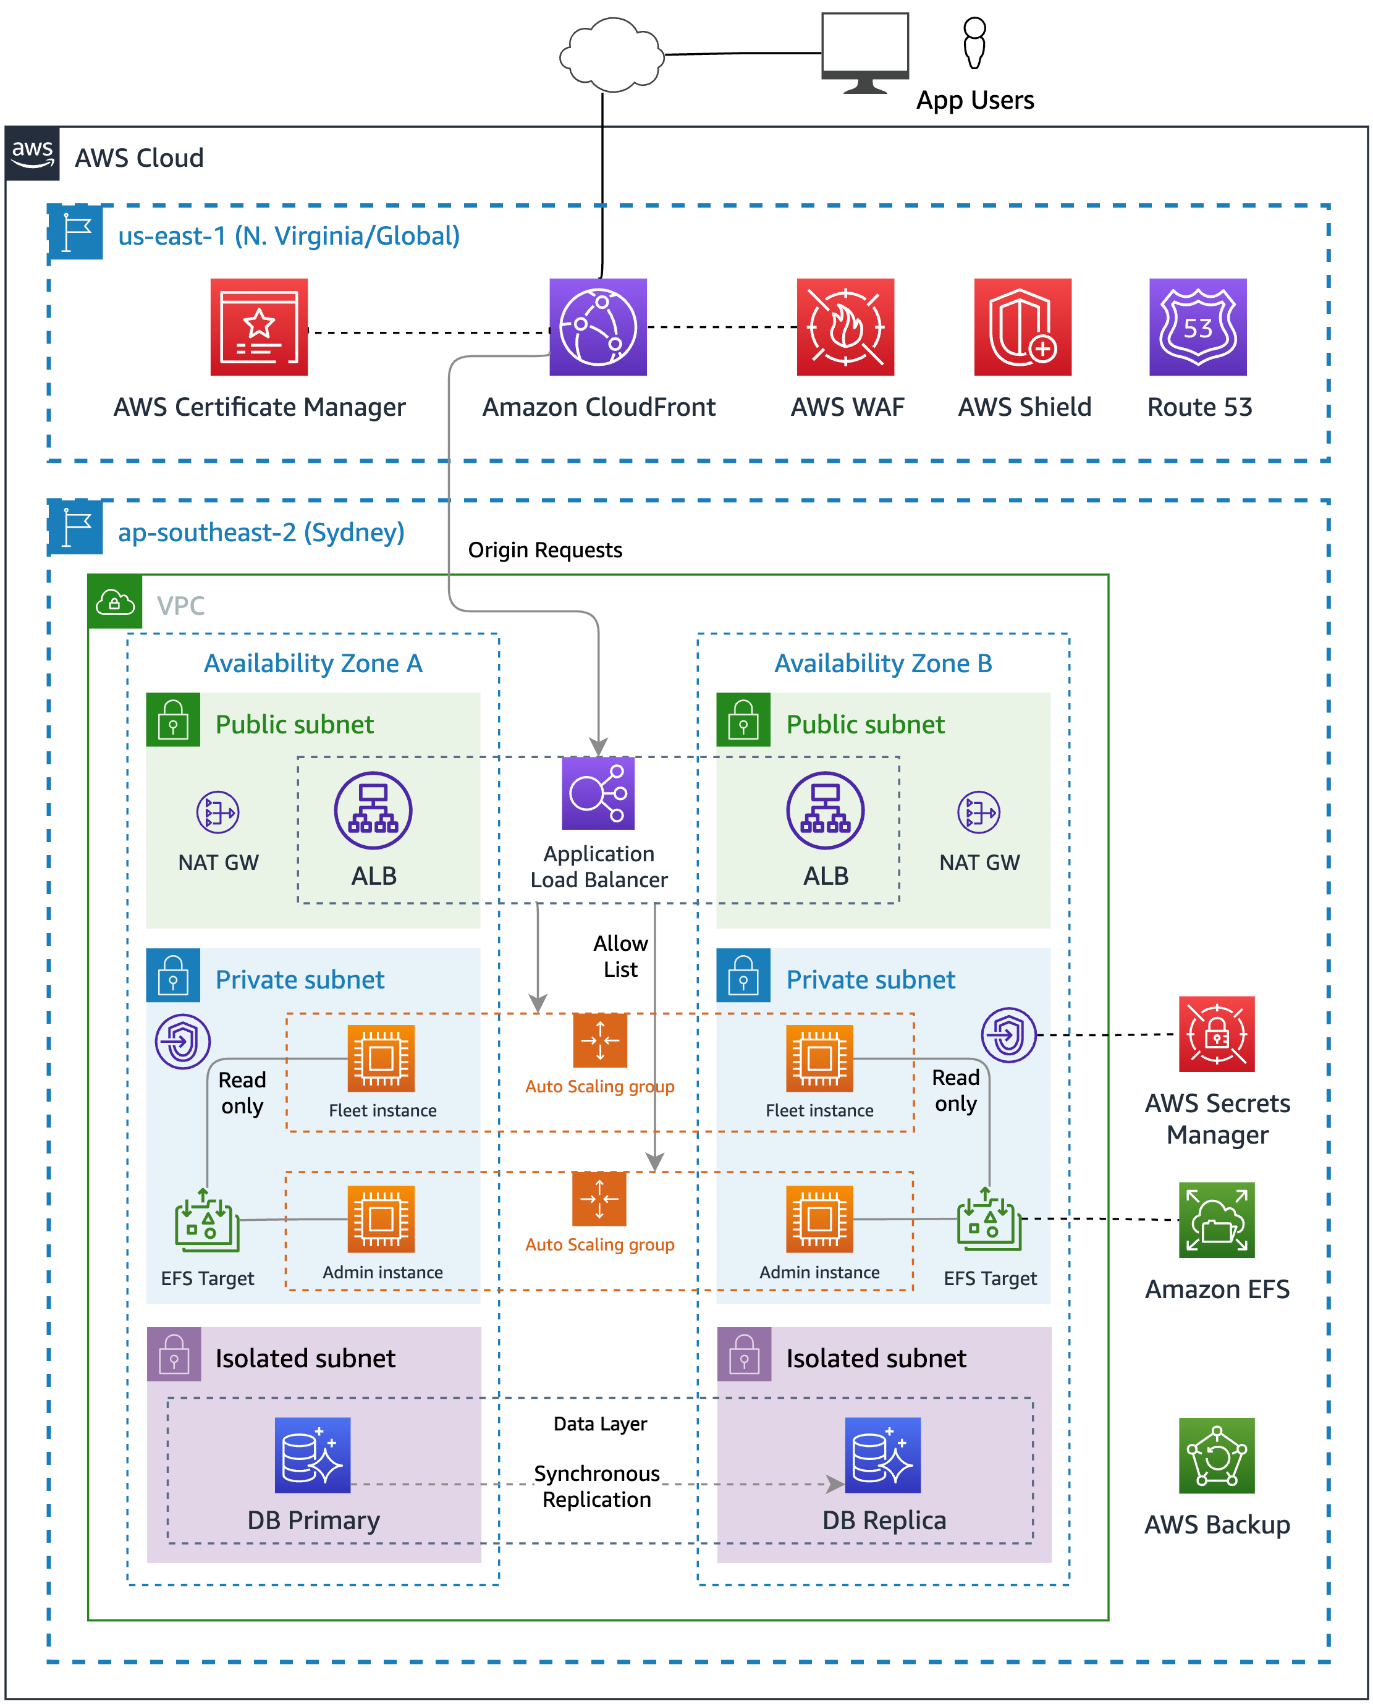
The following diagram shows the solution architecture deployed by Run Web-Administered Apps on AWS. The figure shows how the services deployed in this solution are deployed in different AWS Regions, and how requests flow from the application user through the different service layers.
Figure 2: Multi-layered architecture
This post will dive deeper into each of the architecture’s layers to see how security is added at each layer. But before we talk about the technology, let’s consider how infrastructure is built and managed — by people.
Perimeter 0 – Security at the people layer
Security starts with the people in your team and your organization’s operational practices. How your “people layer” builds and manages your infrastructure contributes significantly to your security posture.
A design principle of the Security pillar of the Well-Architected Framework is to automate security best practices. This helps in two ways: it reduces the effort required by people over time, and it helps prevent resources from being in inconsistent or misconfigured states. When people use manual processes to complete tasks, misconfigurations and missed steps are common.
The simplest way to automate security while reducing human effort is to adopt services that AWS manages for you, such as Amazon Relational Database Service (Amazon RDS). With Amazon RDS, AWS is responsible for the operating system and database software patching, and provides tools to make it simple for you to back up and restore your data.
You can automate and integrate key security functions by using managed AWS security services, such as Amazon GuardDuty, AWS Config, Amazon Inspector, and AWS Security Hub. These services provide network monitoring, configuration management, and detection of software vulnerabilities and unintended network exposure. As your cloud environments grow in scale and complexity, automated security monitoring is critical.
Infrastructure as code (IaC) is a best practice that you can follow to automate the creation of infrastructure. By using IaC to define, configure, and deploy the AWS resources that you use, you reduce the likelihood of human error when building AWS infrastructure.
Adopting IaC can help you improve your security posture because it applies the rigor of application code development to infrastructure provisioning. Storing your infrastructure definition in a source control system (such as AWS CodeCommit) creates an auditable artifact. With version control, you can track changes made to it over time as your architecture evolves.
You can add automated testing to your IaC project to help ensure that your infrastructure is aligned with your organization’s security policies. If you ever need to recover from a disaster, you can redeploy the entire architecture from your IaC project.
Another people-layer discipline is to apply the principle of least privilege. AWS Identity and Access Management (IAM) is a flexible and fine-grained permissions system that you can use to grant the smallest set of actions that your solution needs. You can use IAM to control access for both humans and machines, and we use it in this project to grant the compute instances the least privileges required.
You can also adopt other IAM best practices such as using temporary credentials instead of long-lived ones (such as access keys), and regularly reviewing and removing unused users, roles, permissions, policies, and credentials.
Perimeter 1 – network protections
The internet is public and therefore untrusted, so you must proactively address the risks from threat actors and network-level attacks.
To reduce the risk of distributed denial of service (DDoS) attacks, this solution uses AWS Shield for managed protection at the network edge. AWS Shield Standard is automatically enabled for all AWS customers at no additional cost and is designed to provide protection from common network and transport layer DDoS attacks. For higher levels of protection against attacks that target your applications, subscribe to AWS Shield Advanced.
Amazon Route 53 resolves the hostnames that the solution uses and maps the hostnames as aliases to an Amazon CloudFront distribution. Route 53 is a robust and highly available globally distributed DNS service that inspects requests to protect against DNS-specific attack types, such as DNS amplification attacks.
Perimeter 2 – request processing
CloudFront also operates at the AWS network edge and caches, transforms, and forwards inbound requests to the relevant origin services across the low-latency AWS global network. The risk of DDoS attempts overwhelming your application servers is further reduced by caching web requests in CloudFront.
The solution configures CloudFront to add a shared secret to the origin request within a custom header. A CloudFront function copies the originating user’s IP to another custom header. These headers get checked when the request arrives at the load balancer.
AWS WAF, a web application firewall, blocks known bad traffic, including cross-site scripting (XSS) and SQL injection events that come into CloudFront. This project uses AWS Managed Rules, but you can add your own rules, as well. To restrict frontend access to permitted IP CIDR blocks, this project configures an IP restriction rule on the web application firewall.
Perimeter 3 – the VPC
After CloudFront and AWS WAF check the request, CloudFront forwards it to the compute services inside an Amazon Virtual Private Cloud (Amazon VPC). VPCs are logically isolated networks within your AWS account that you can use to control the network traffic that is allowed in and out. This project configures its VPC to use a private IPv4 CIDR block that cannot be directly routed to or from the internet, creating a network perimeter around your resources on AWS.
The Amazon Elastic Compute Cloud (Amazon EC2) instances are hosted in private subnets within the VPC that have no inbound route from the internet. Using a NAT gateway, instances can make necessary outbound requests. This design hosts the database instances in isolated subnets that don’t have inbound or outbound internet access. Amazon RDS is a managed service, so AWS manages patching of the server and database software.
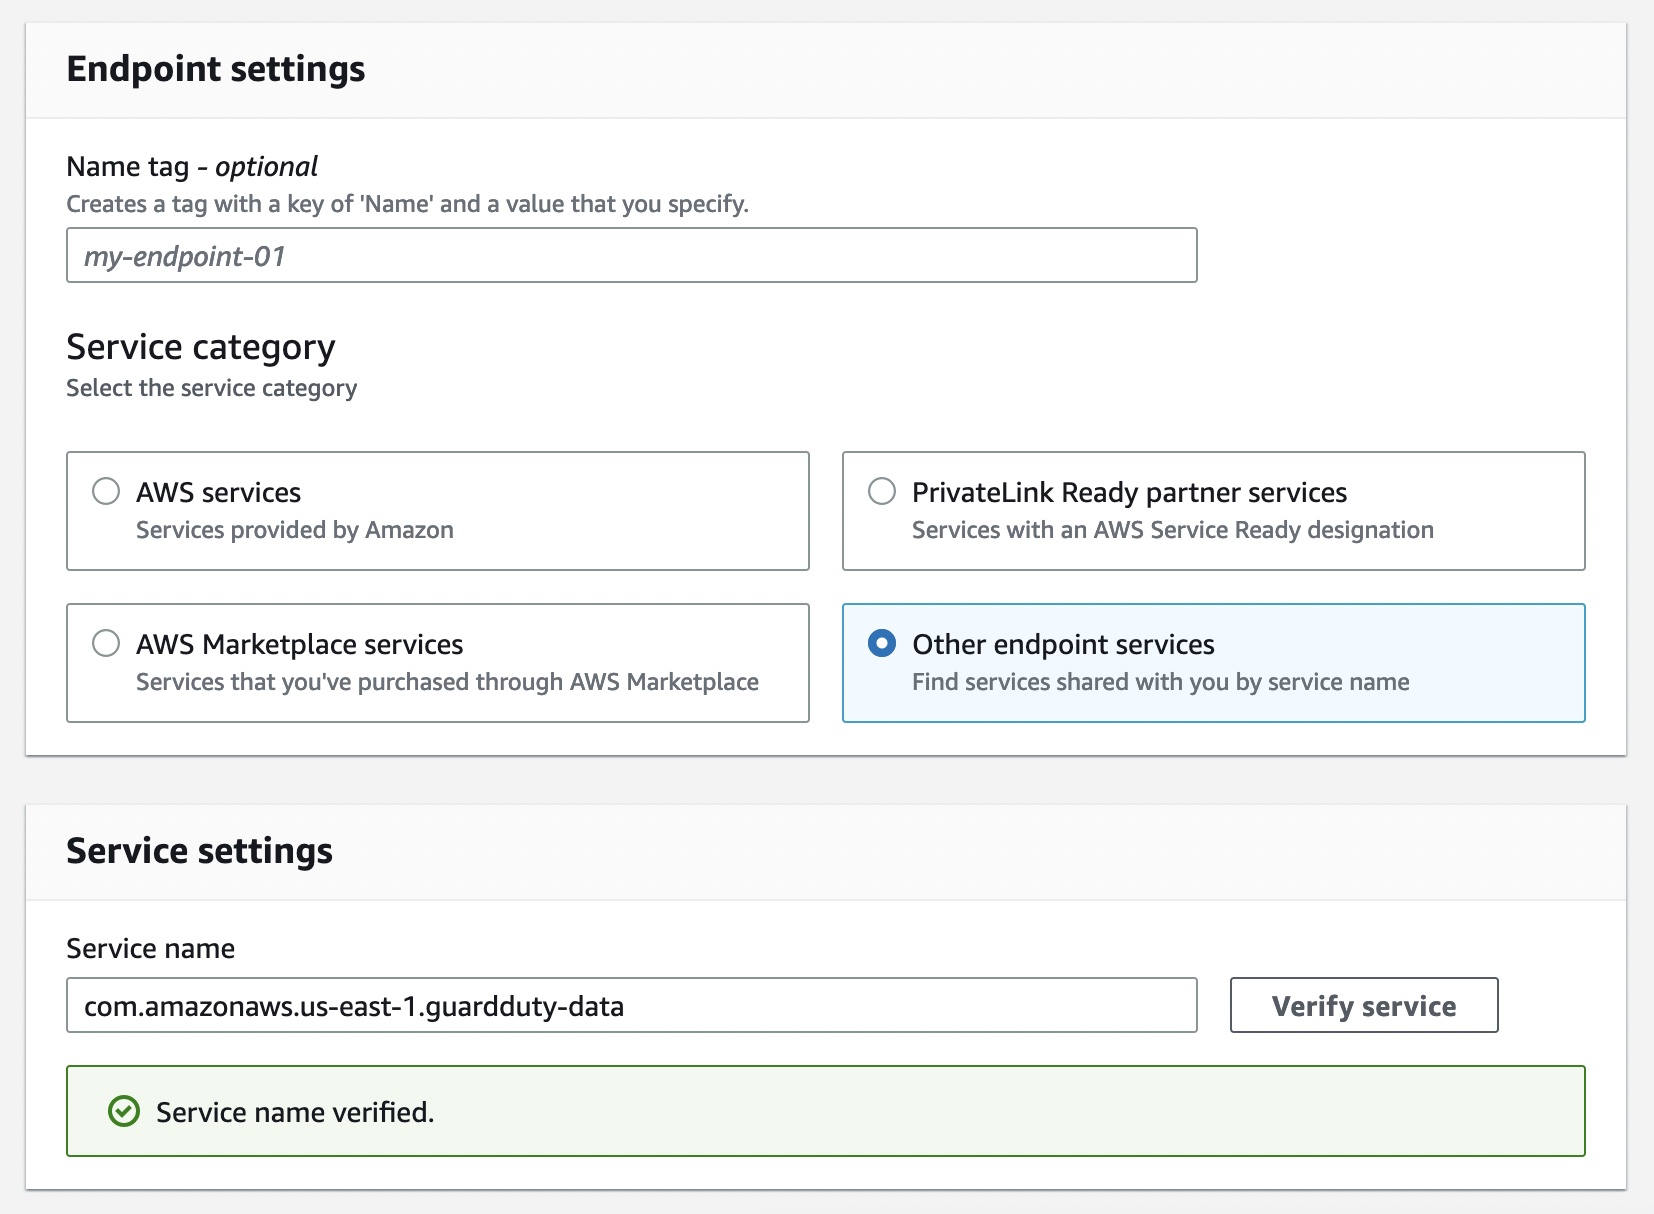
The solution accesses AWS Secrets Manager by using an interface VPC endpoint. VPC endpoints use AWS PrivateLink to connect your VPC to AWS services as if they were in your VPC. In this way, resources in the VPC can communicate with Secrets Manager without traversing the internet.
The project configures VPC Flow Logs as part of the VPC setup. VPC flow logs capture information about the IP traffic going to and from network interfaces in your VPC. GuardDuty analyzes these logs and uses threat intelligence data to identify unexpected, potentially unauthorized, and malicious activity within your AWS environment.
Although using VPCs and subnets to segment parts of your application is a common strategy, there are other ways that you can achieve partitioning for application components:
- You can use separate VPCs to restrict access to a database, and use VPC peering to route traffic between them.
- You can use a multi-account strategy so that different security and compliance controls are applied in different accounts to create strong logical boundaries between parts of a system. You can route network requests between accounts by using services such as AWS Transit Gateway, and control them using AWS Network Firewall.
There are always trade-offs between complexity, convenience, and security, so the right level of isolation between components depends on your requirements.
Perimeter 4 – the load balancer
After the request is sent to the VPC, an Application Load Balancer (ALB) processes it. The ALB distributes requests to the underlying EC2 instances. The ALB uses TLS version 1.2 to encrypt incoming connections with an AWS Certificate Manager (ACM) certificate.
Public access to the load balancer isn’t allowed. A security group applied to the ALB only allows inbound traffic on port 443 from the CloudFront IP range. This is achieved by specifying the Region-specific AWS-managed CloudFront prefix list as the source in the security group rule.
The ALB uses rules to decide whether to forward the request to the target instances or reject the traffic. As an additional layer of security, it uses the custom headers that the CloudFront distribution added to make sure that the request is from CloudFront. In another rule, the ALB uses the originating user’s IP to decide which target group of Amazon EC2 instances should handle the request. In this way, you can direct admin users to instances that are configured to allow admin tasks.
If a request doesn’t match a valid rule, the ALB returns a 404 response to the user.
Perimeter 5 – compute instance network security
A security group creates an isolation boundary around the EC2 instances. The only traffic that reaches the instance is the traffic that the security group rules allow. In this solution, only the ALB is allowed to make inbound connections to the EC2 instances.
A common practice is for customers to also open ports, or to set up and manage bastion hosts to provide remote access to their compute instances. The risk in this approach is that the ports could be left open to the whole internet, exposing the instances to vulnerabilities in the remote access protocol. With remote work on the rise, there is an increased risk for the creation of these overly permissive inbound rules.
Using AWS Systems Manager Session Manager, you can remove the need for bastion hosts or open ports by creating secure temporary connections to your EC2 instances using the installed SSM agent. As with every software package that you install, you should check that the SSM agent aligns with your security and compliance requirements. To review the source code to the SSM agent, see amazon-ssm-agent GitHub repo.
The compute layer of this solution consists of two separate Amazon EC2 Auto Scaling groups of EC2 instances. One group handles requests from administrators, while the other handles requests from unprivileged users. This creates another isolation boundary by keeping the functions separate while also helping to protect the system from a failure in one component causing the whole system to fail. Each Amazon EC2 Auto Scaling group spans multiple Availability Zones (AZs), providing resilience in the event of an outage in an AZ.
By using managed database services, you can reduce the risk that database server instances haven’t been proactively patched for security updates. Managed infrastructure helps reduce the risk of security issues that result from the underlying operating system not receiving security patches in a timely manner and the risk of downtime from hardware failures.
Perimeter 6 – compute instance operating system
When instances are first launched, the operating system must be secure, and the instances must be updated as required when new security patches are released. We recommend that you create immutable servers that you build and harden by using a tool such as EC2 Image Builder. Instead of patching running instances in place, replace them when an updated Amazon Machine Image (AMI) is created. This approach works in our example scenario because the application code (which changes over time) is stored on Amazon Elastic File System (Amazon EFS), so when you replace the instances with a new AMI, you don’t need to update them with data that has changed after the initial deployment.
Another way that the solution helps improve security on your instances at the operating system is to use EC2 instance profiles to allow them to assume IAM roles. IAM roles grant temporary credentials to applications running on EC2, instead of using hard-coded credentials stored on the instance. Access to other AWS resources is provided using these temporary credentials.
The IAM roles have least privilege policies attached that grant permission to mount the EFS file system and access AWS Systems Manager. If a database secret exists in Secrets Manager, the IAM role is granted permission to access it.
Perimeter 7 – at the file system
Both Amazon EC2 Auto Scaling groups of EC2 instances share access to Amazon EFS, which hosts the files that the application uses. IAM authorization applies IAM file system policies to control the instance’s access to the file system. This creates another isolation boundary that helps prevent the non-admin instances from modifying the application’s files.
The admin group’s instances have the file system mounted in read-write mode. This is necessary so that the application can update itself, install add-ons, upload content, or make configuration changes. On the unprivileged instances, the file system is mounted in read-only mode. This means that these instances can’t make changes to the application code or configuration files.
The unprivileged instances have local file caching enabled. This caches files from the EFS file system on the local Amazon Elastic Block Store (Amazon EBS) volume to help improve scalability and performance.
Perimeter 8 – web server configuration
This solution applies different web server configurations to the instances running in each Amazon EC2 Auto Scaling group. This creates a further isolation boundary at the web server layer.
The admin instances use the default configuration for the application that permits access to the admin interface. Non-admin, public-facing instances block admin routes, such as wp-login.php, and will return a 403 Forbidden response. This creates an additional layer of protection for those routes.
Perimeter 9 – database security
The database layer is within two additional isolation boundaries. The solution uses Amazon RDS, with database instances deployed in isolated subnets. Isolated subnets have no inbound or outbound internet access and can only be reached through other network interfaces within the VPC. The RDS security group further isolates the database instances by only allowing inbound traffic from the EC2 instances on the database server port.
By using IAM authentication for the database access, you can add an additional layer of security by configuring the non-admin instances with less privileged database user credentials.
Perimeter 10 – Security at the application code layer
To apply security at the application code level, you should establish good practices around installing updates as they become available. Most applications have email lists that you can subscribe to that will notify you when updates become available.
You should evaluate the quality of an application before you adopt it. The following are some metrics to consider:
- Number of developers who are actively working on it
- Frequency of updates to it
- How quickly the developers respond with patches when bugs are reported
Other steps that you can take
Use AWS Verified Access to help secure application access for human users. With Verified Access, you can add another user authentication stage, to help ensure that only verified users can access an application’s administrative functions.
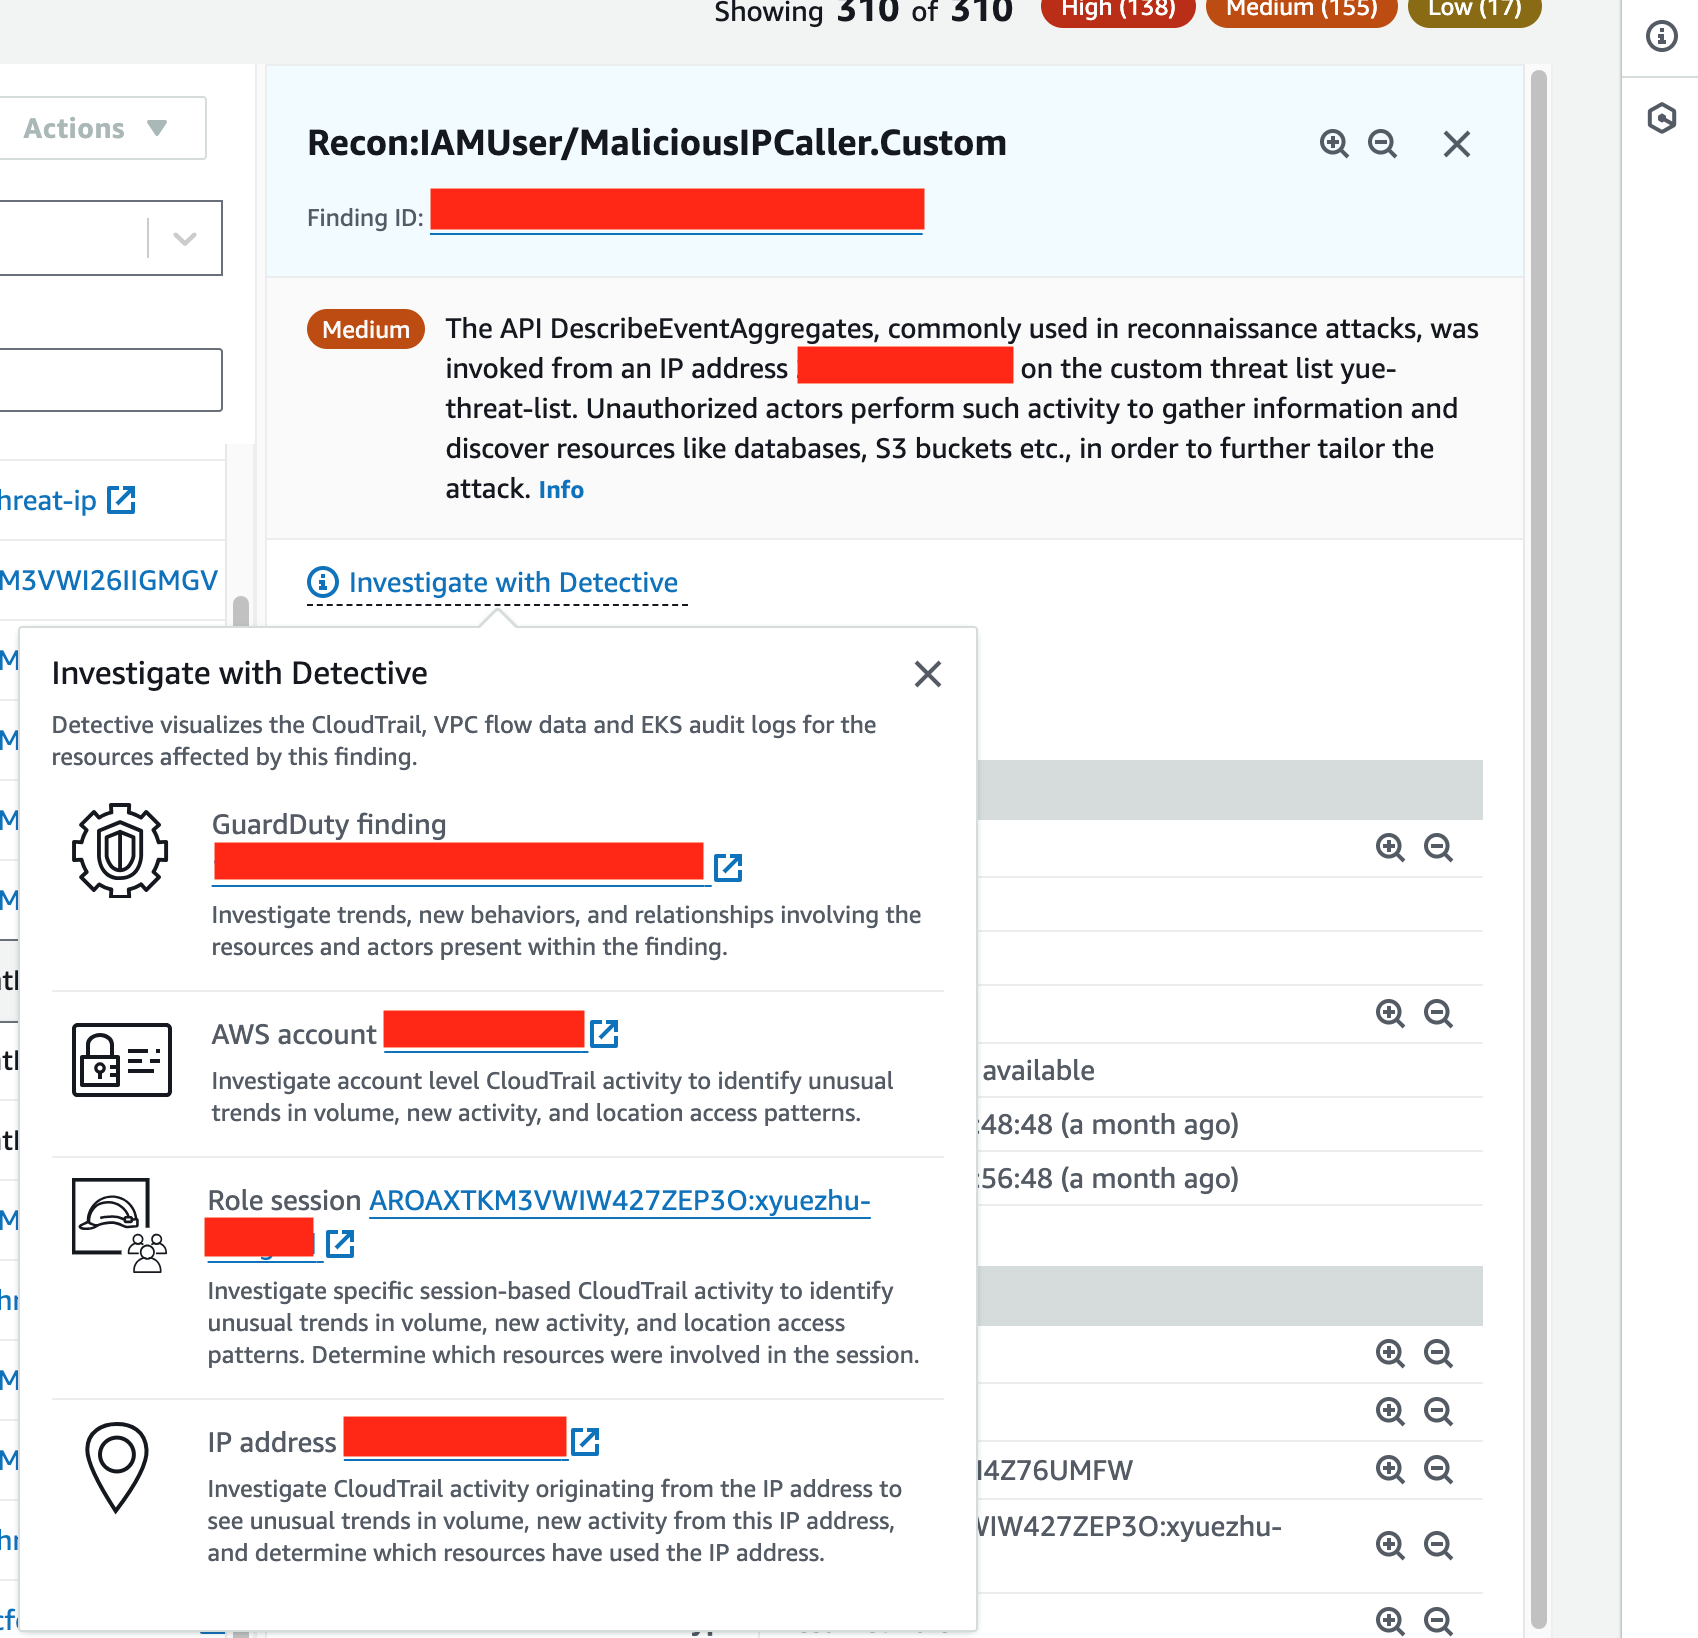
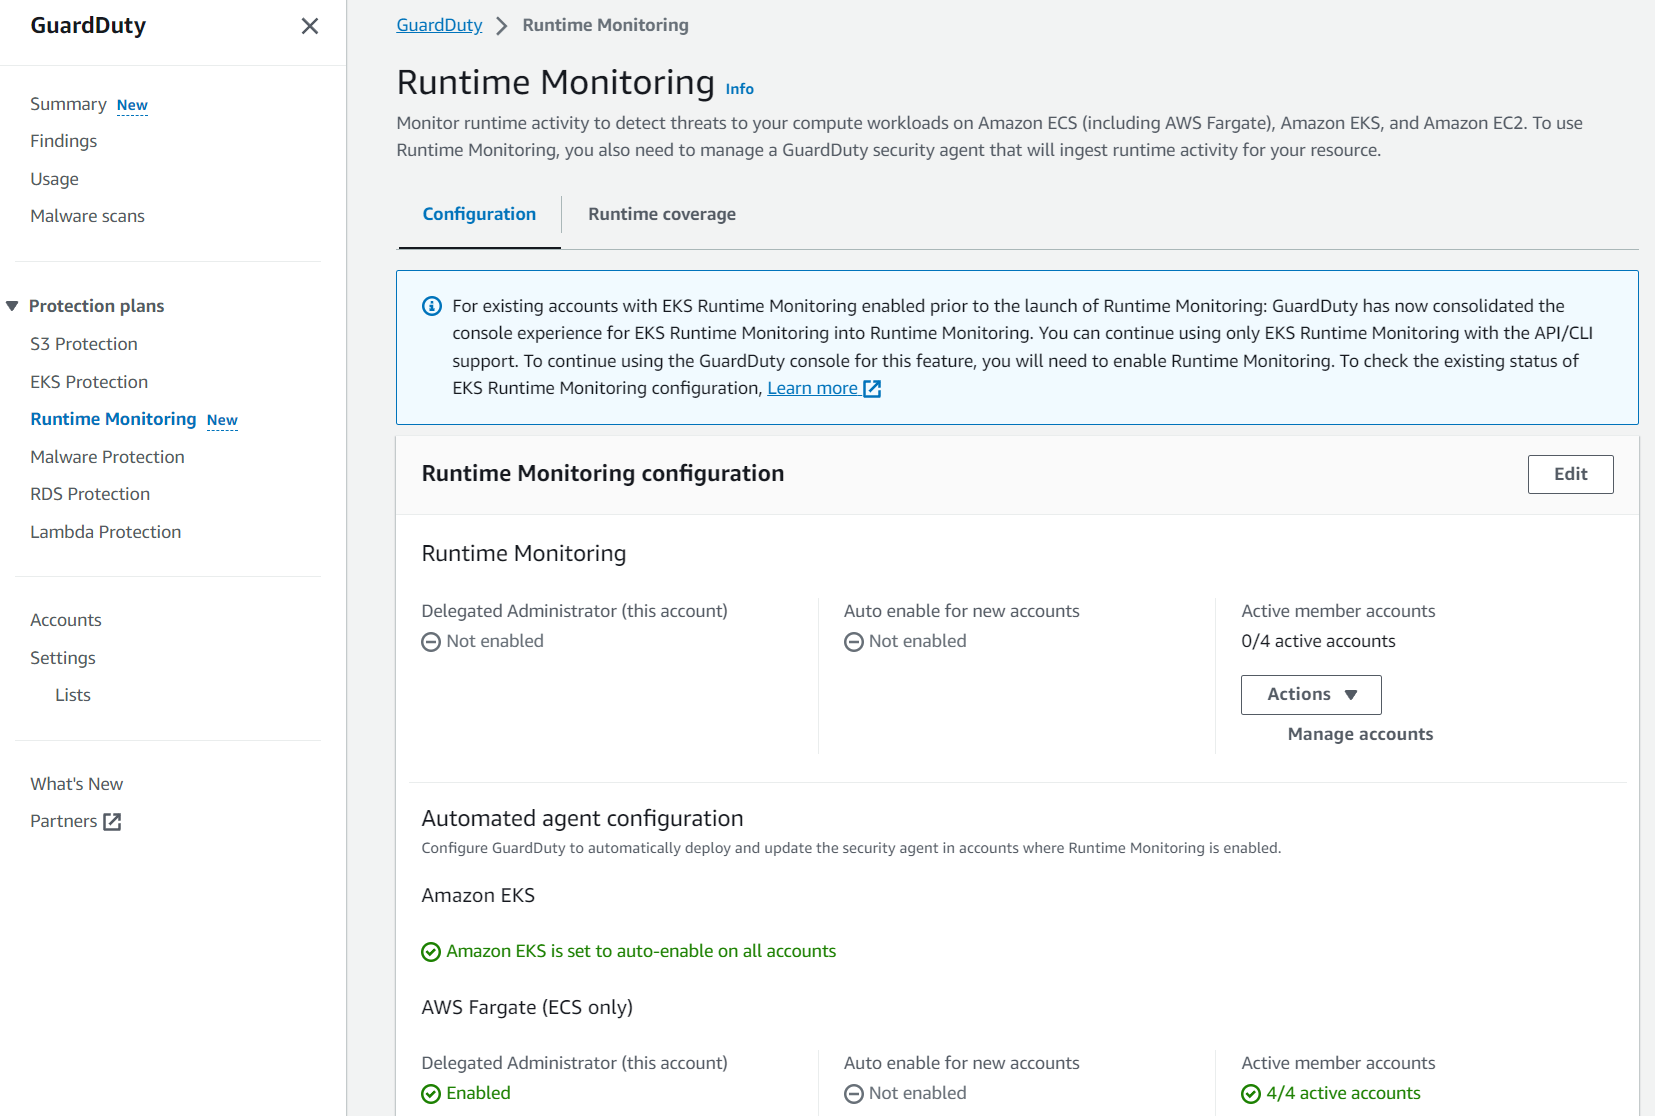
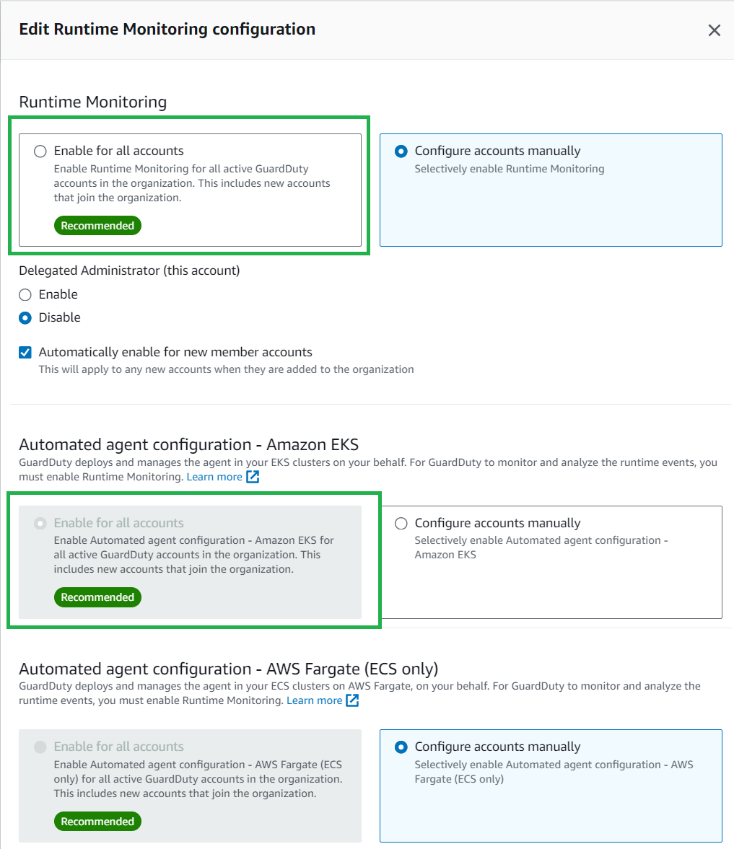
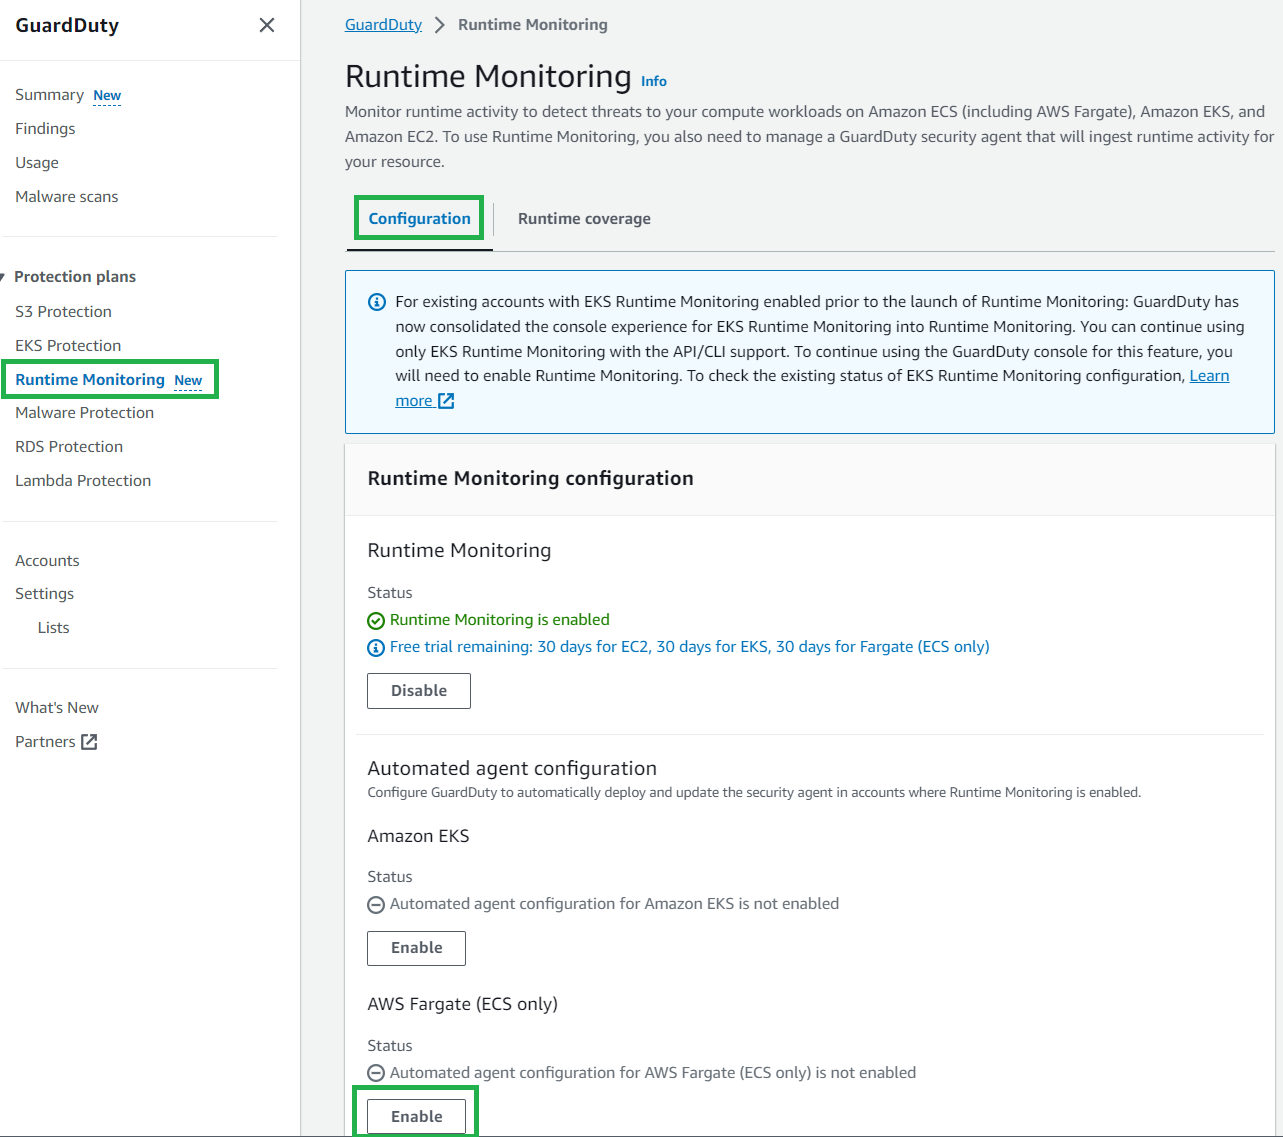
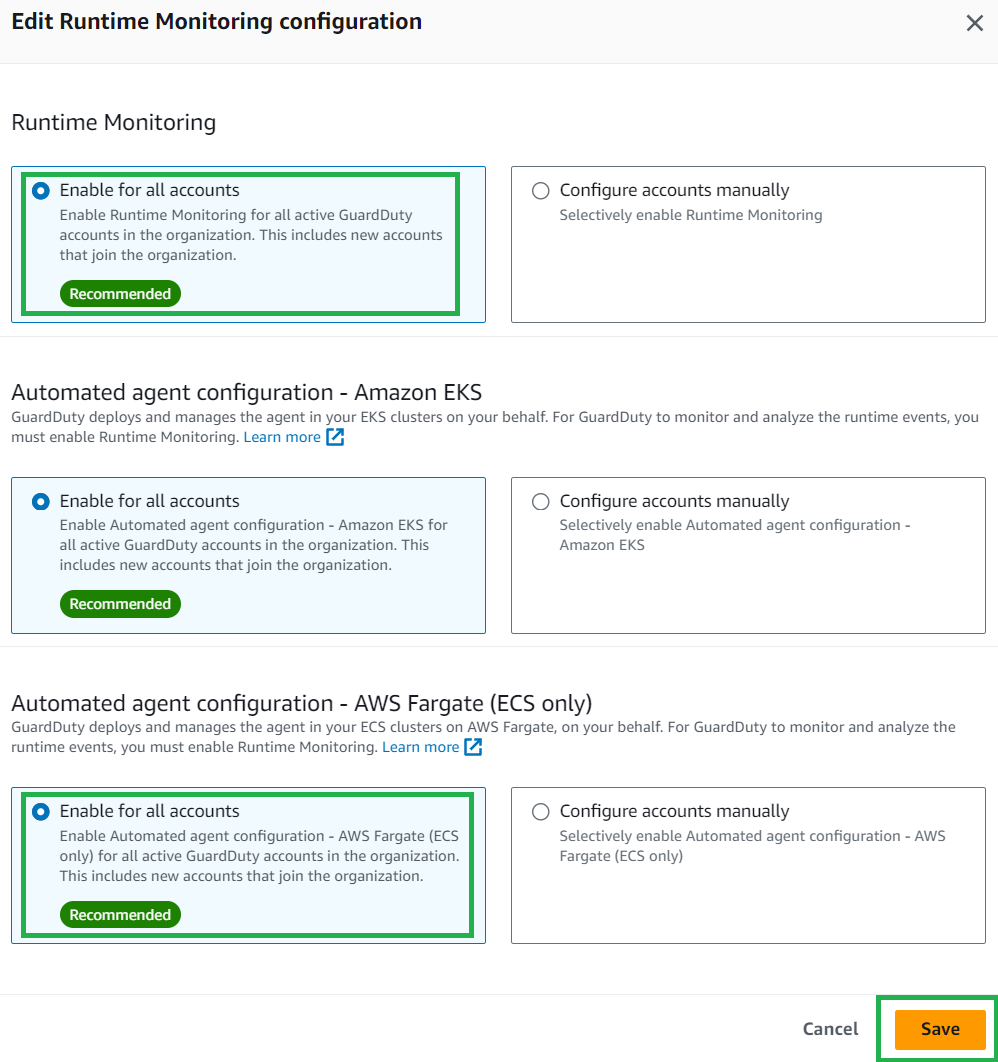
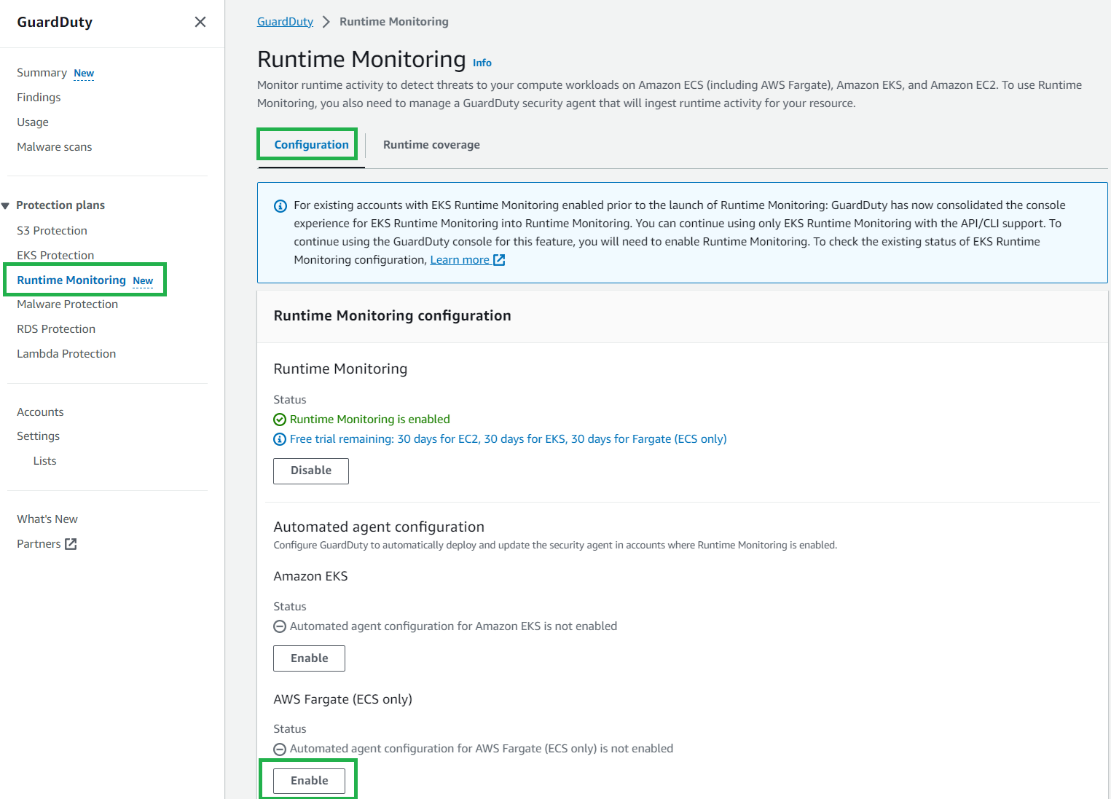
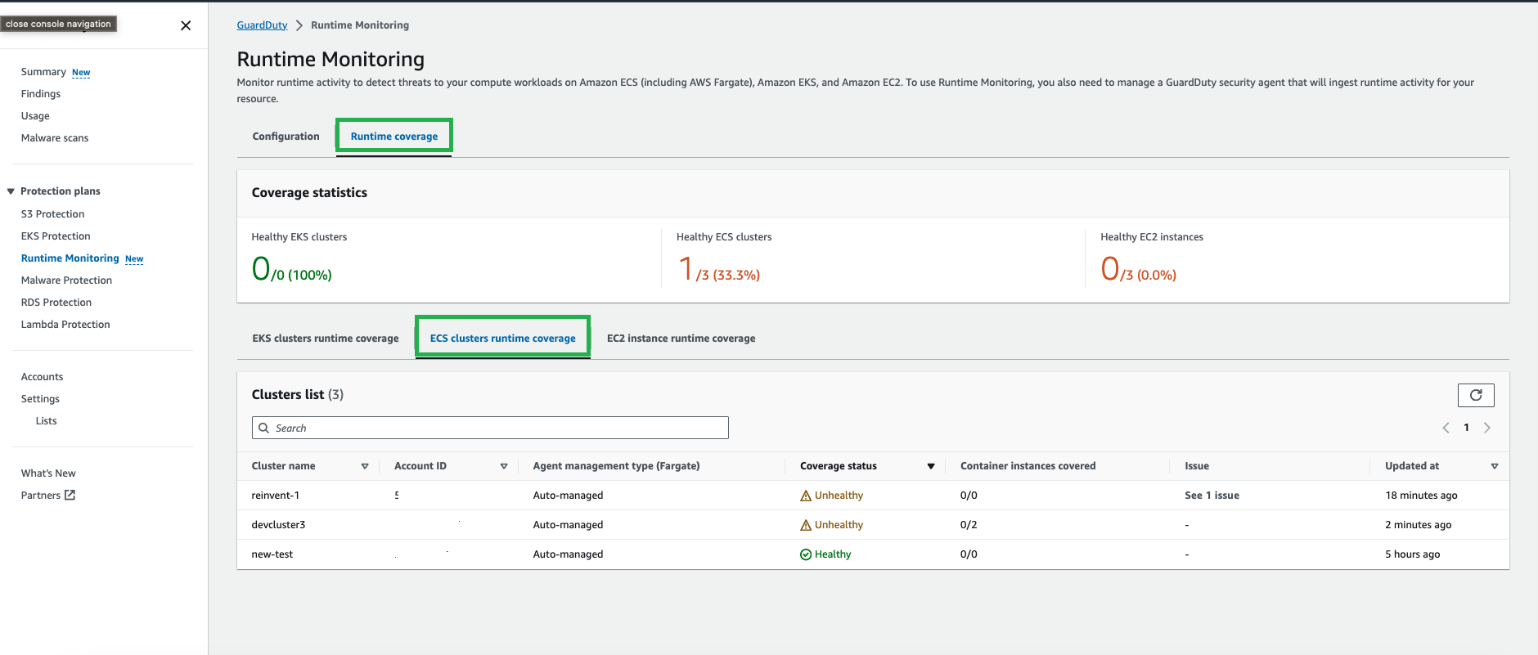
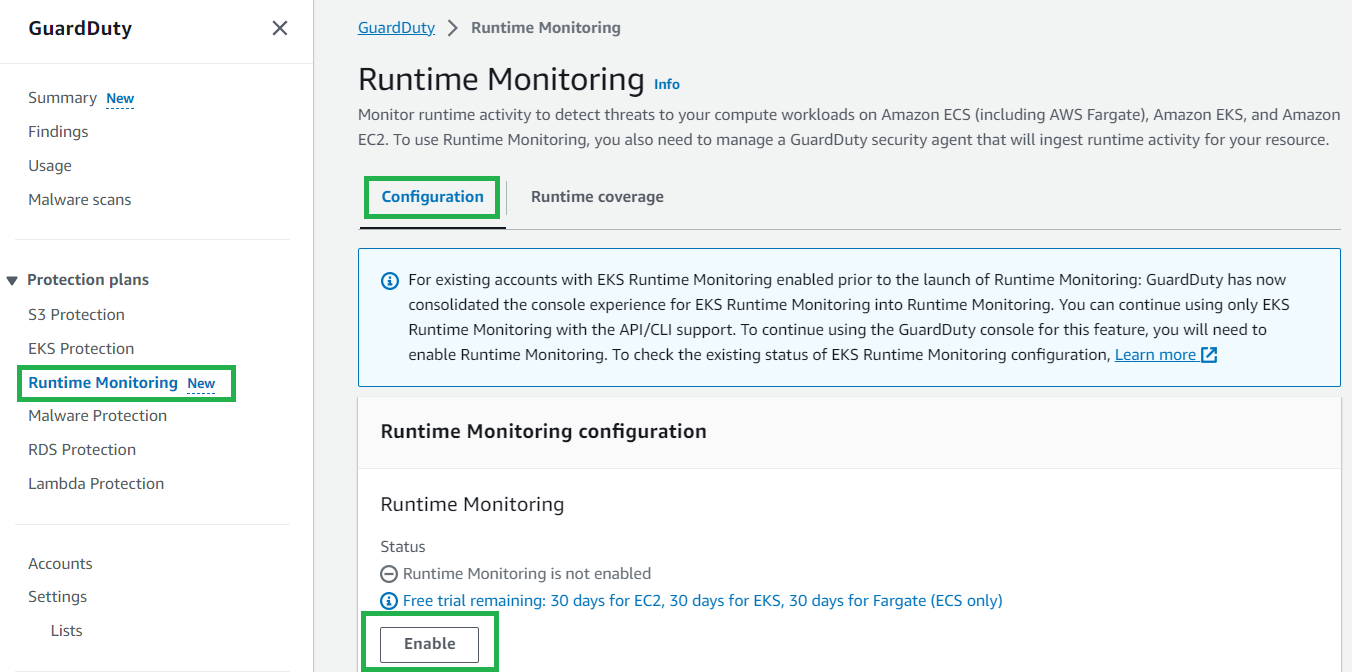
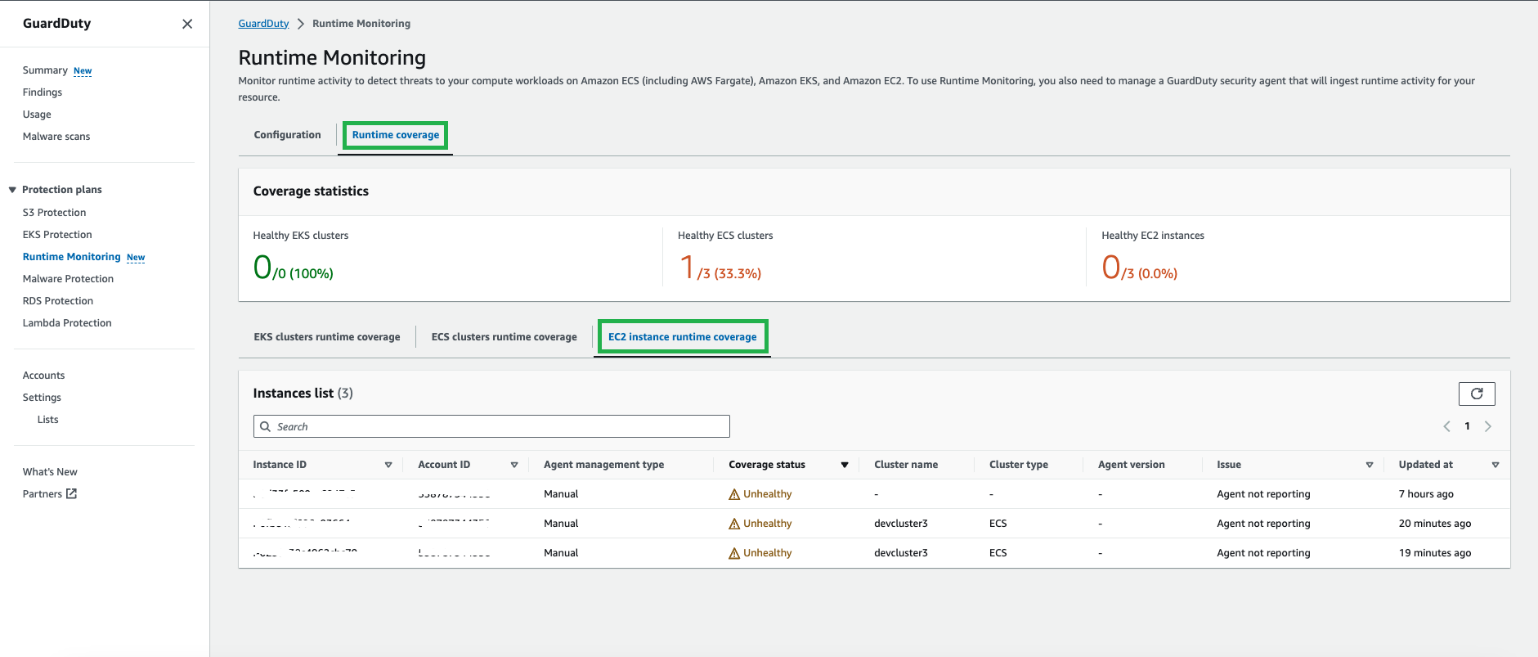
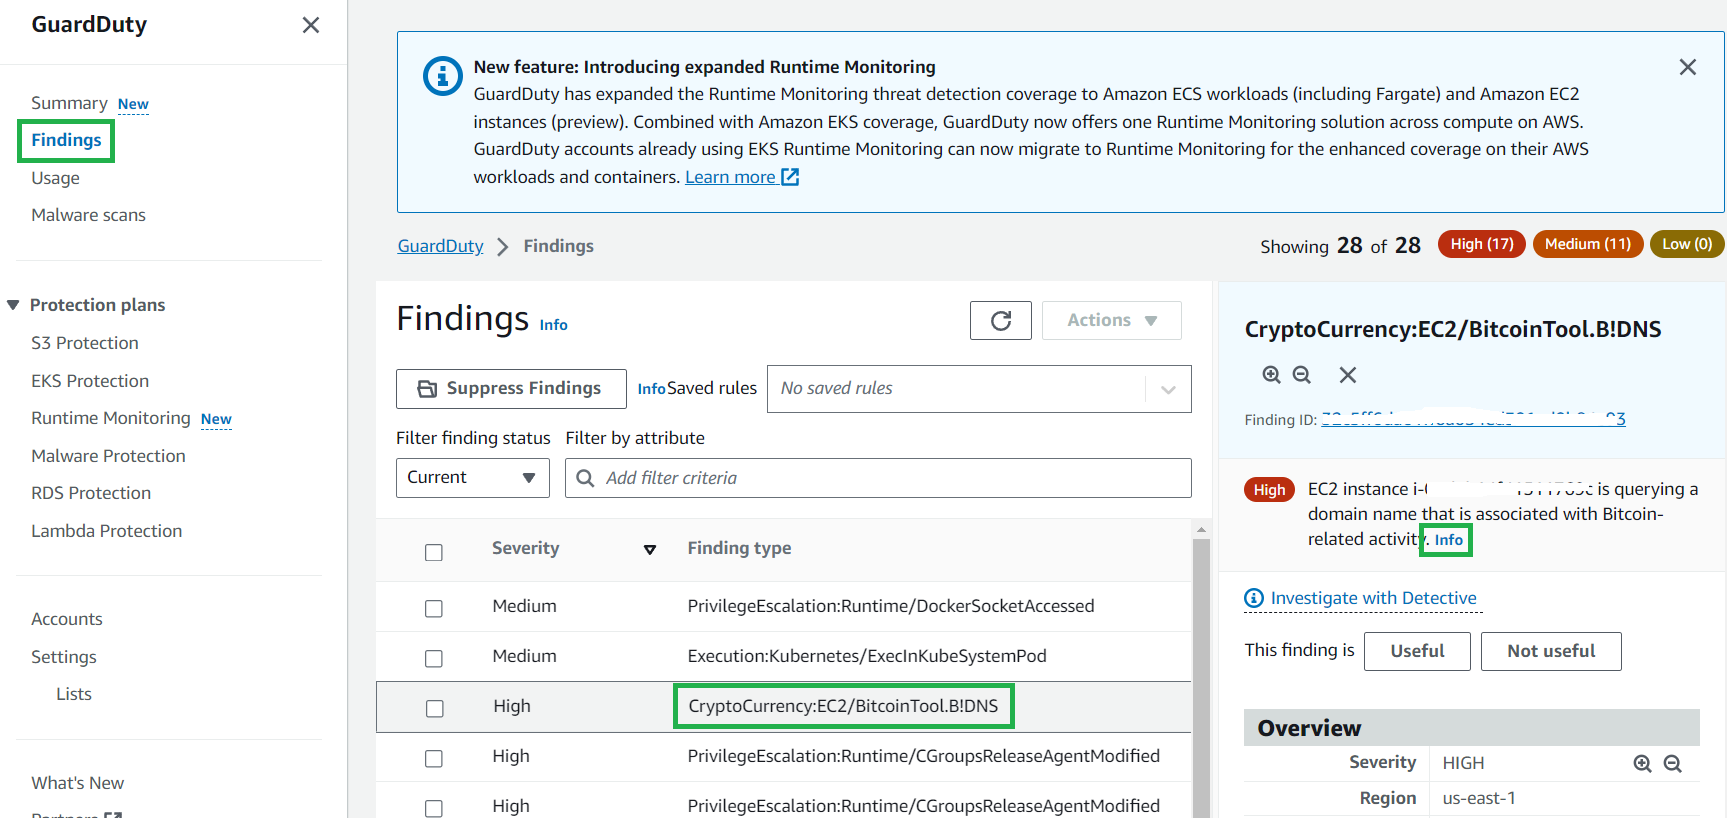
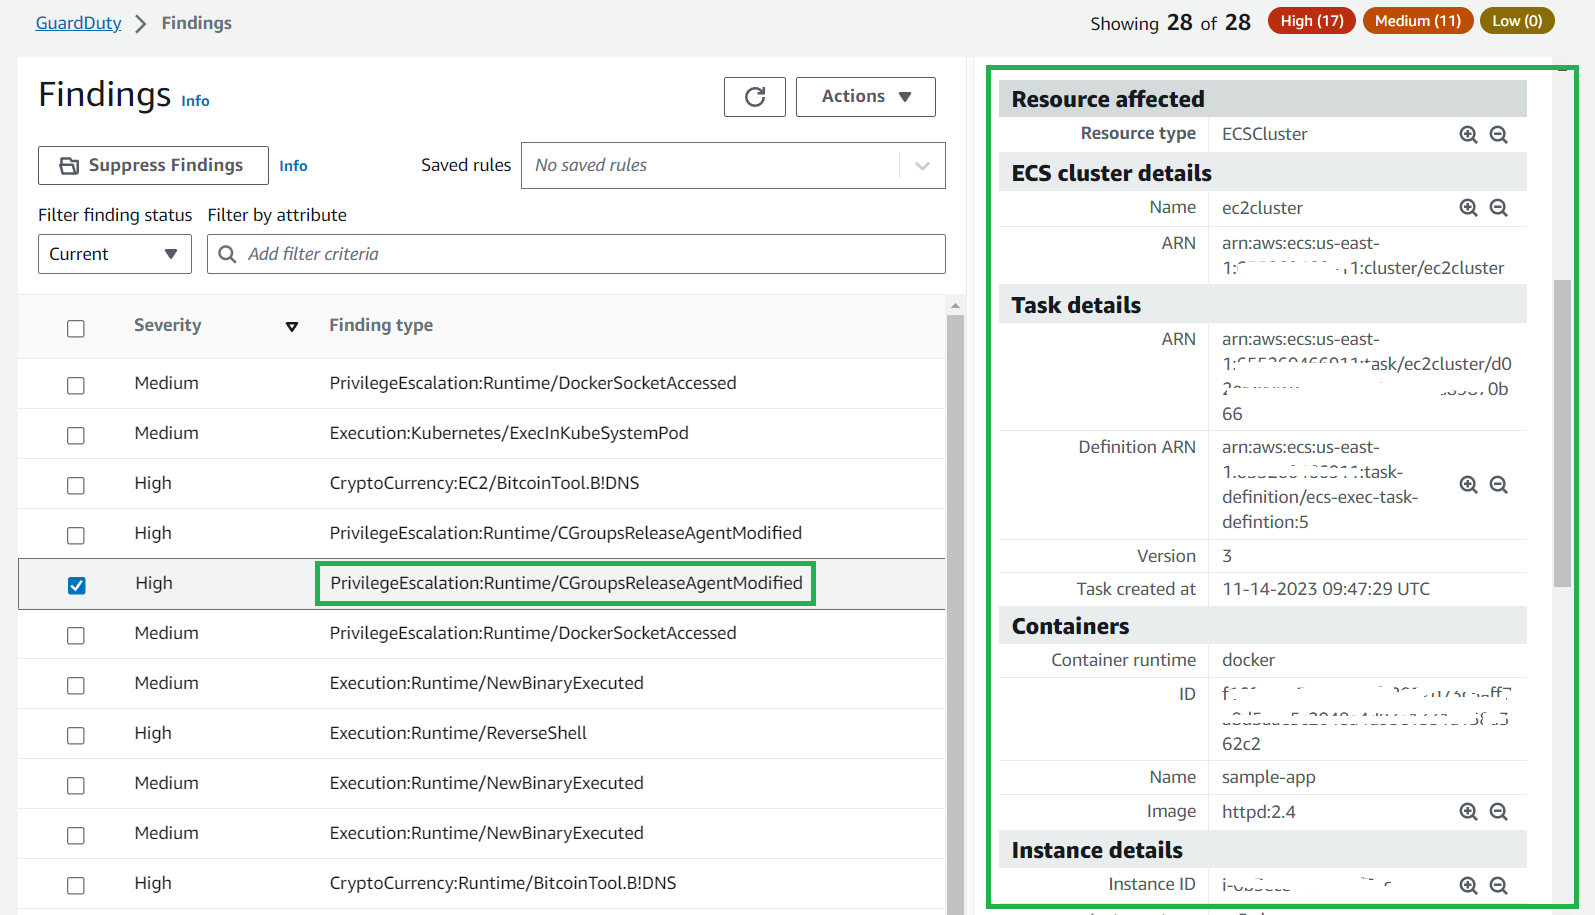
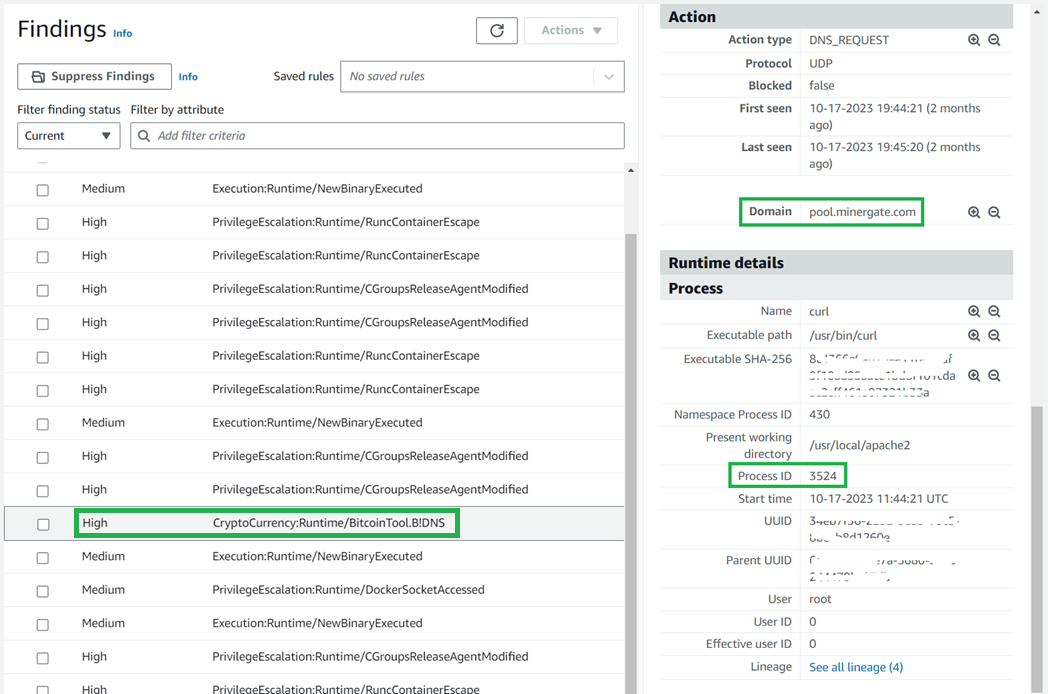
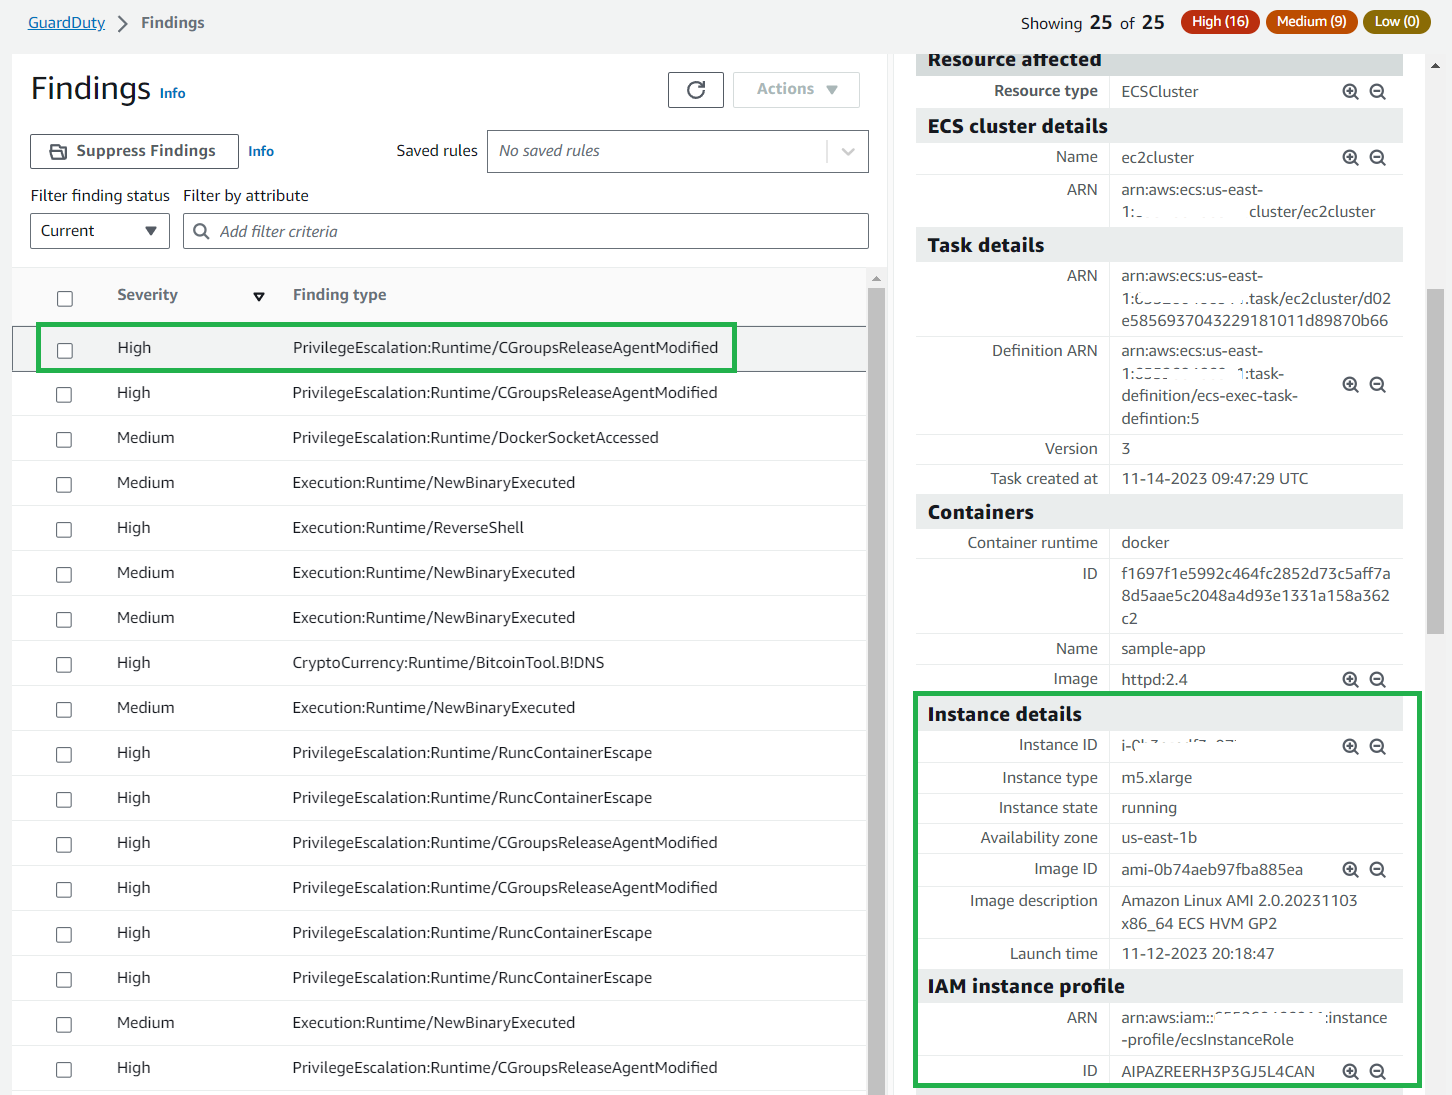
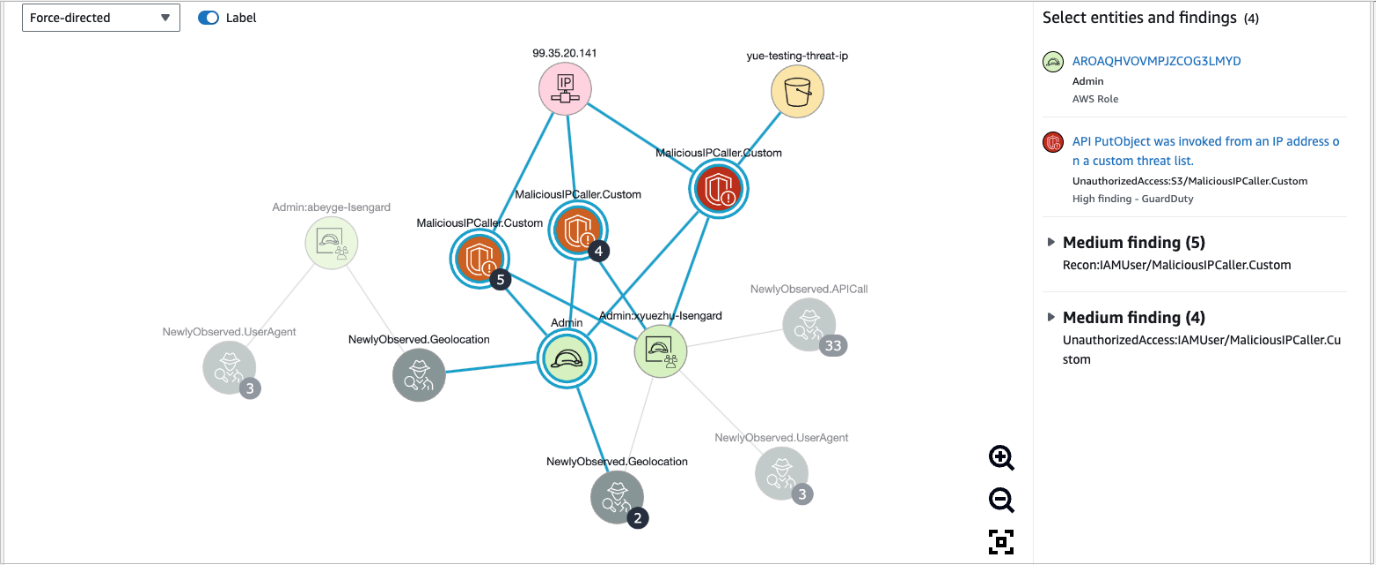
Amazon GuardDuty is a threat detection service that continuously monitors your AWS accounts and workloads for malicious activity and delivers detailed security findings for visibility and remediation. It can detect communication with known malicious domains and IP addresses and identify anomalous behavior. GuardDuty Malware Protection helps you detect the potential presence of malware by scanning the EBS volumes that are attached to your EC2 instances.
Amazon Inspector is an automated vulnerability management service that automatically discovers the Amazon EC2 instances that are running and scans them for software vulnerabilities and unintended network exposure. To help ensure that your web server instances are updated when security patches are available, use AWS Systems Manager Patch Manager.
Deploy the sample project
We wrote the Run Web-Administered Apps on AWS project by using the AWS Cloud Development Kit (AWS CDK). With the AWS CDK, you can use the expressive power of familiar programming languages to define your application resources and accelerate development. The AWS CDK has support for multiple languages, including TypeScript, Python, .NET, Java, and Go.
This project uses Python. To deploy it, you need to have a working version of Python 3 on your computer. For instructions on how to install the AWS CDK, see Get Started with AWS CDK.
Configure the project
To enable this project to deploy multiple different web projects, you must do the configuration in the parameters.properties file. Two variables identify the configuration blocks: app (which identifies the web application to deploy) and env (which identifies whether the deployment is to a dev or test environment, or to production).
When you deploy the stacks, you specify the app and env variables as CDK context variables so that you can select between different configurations at deploy time. If you don’t specify a context, a [default] stanza in the parameters.properties file specifies the default app name and environment that will be deployed.
To name other stanzas, combine valid app and env values by using the format <app>-<env>. For each stanza, you can specify its own Regions, accounts, instance types, instance counts, hostnames, and more. For example, if you want to support three different WordPress deployments, you might specify the app name as wp, and for env, you might want dev, test, and prod, giving you three stanzas: wp-dev, wp-test, and wp-prod.
The project includes sample configuration items that are annotated with comments that explain their function.
Use CDK bootstrapping
Before you can use the AWS CDK to deploy stacks into your account, you need to use CDK bootstrapping to provision resources in each AWS environment (account and Region combination) that you plan to use. For this project, you need to bootstrap both the US East (N. Virginia) Region (us-east-1) and the home Region in which you plan to host your application.
Create a hosted zone in the target account
You need to have a hosted zone in Route 53 to allow the creation of DNS records and certificates. You must manually create the hosted zone by using the AWS Management Console. You can delegate a domain that you control to Route 53 and use it with this project. You can also register a domain through Route 53 if you don’t currently have one.
Run the project
Clone the project to your local machine and navigate to the project root. To create the Python virtual environment (venv) and install the dependencies, follow the steps in the Generic CDK instructions.
To create and configure the parameters.properties file
Copy the parameters-template.properties file (in the root folder of the project) to a file called parameters.properties and save it in the root folder. Open it with a text editor and then do the following:
If you want to restrict public access to your site, change 192.0.2.0/24 to the IP range that you want to allow. By providing a comma-separated list of allowedIps, you can add multiple allowed CIDR blocks.
If you don’t want to restrict public access, set allowedIps=* instead.
If you have forked this project into your own private repository, you can commit the parameters.properties file to your repo. To do that, comment out the parameters.properties line in the .gitignore file.
To install the custom resource helper
The solution uses an AWS CloudFormation custom resource for cross-Region configuration management. To install the needed Python package, run the following command in the custom_resource directory:
cd custom_resource
pip install crhelper -t .
To learn more about CloudFormation custom resource creation, see AWS CloudFormation custom resource creation with Python, AWS Lambda, and crhelper.
To configure the database layer
Before you deploy the stacks, decide whether you want to include a data layer as part of the deployment. The dbConfig parameter determines what will happen, as follows:
- If dbConfig is left empty — no database will be created and no database credentials will be available in your compute stacks
- If dbConfig is set to instance — you will get a new Amazon RDS instance
- If dbConfig is set to cluster — you will get an Amazon Aurora cluster
- If dbConfig is set to none — if you previously created a database in this stack, the database will be deleted
If you specify either instance or cluster, you should also configure the following database parameters to match your requirements:
- dbEngine — set the database engine to either mysql or postgres
- dbSnapshot — specify the named snapshot for your database
- dbSecret — if you are using an existing database, specify the Amazon Resource Name (ARN) of the secret where the database credentials and DNS endpoint are located
- dbMajorVersion — set the major version of the engine that you have chosen; leave blank to get the default version
- dbFullVersion — set the minor version of the engine that you have chosen; leave blank to get the default version
- dbInstanceType — set the instance type that you want (note that these vary by service); don’t prefix with db. because the CDK will automatically prepend it
- dbClusterSize — if you request a cluster, set this parameter to determine how many Amazon Aurora replicas are created
You can choose between mysql or postgres for the database engine. Other settings that you can choose are determined by that choice.
You will need to use an Amazon Machine Image (AMI) that has the CLI preinstalled, such as Amazon Linux 2, or install the AWS Command Line Interface (AWS CLI) yourself with a user data command. If instead of creating a new, empty database, you want to create one from a snapshot, supply the snapshot name by using the dbSnapshot parameter.
To create the database secret
AWS automatically creates and stores the RDS instance or Aurora cluster credentials in a Secrets Manager secret when you create a new instance or cluster. You make these credentials available to the compute stack through the db_secret_command variable, which contains a single-line bash command that returns the JSON from the AWS CLI command aws secretsmanager get-secret-value. You can interpolate this variable into your user data commands as follows:
SECRET=$({db_secret_command})
USERNAME=`echo $SECRET | jq -r '.username'`
PASSWORD=`echo $SECRET | jq -r '.password'`
DBNAME=`echo $SECRET | jq -r '.dbname'`
HOST=`echo $SECRET | jq -r '.host'`
If you create a database from a snapshot, make sure that your Secrets Manager secret and Amazon RDS snapshot are in the target Region. If you supply the secret for an existing database, make sure that the secret contains at least the following four key-value pairs (replace the <placeholder values> with your values):
{
    "password":"<your-password>",
    "dbname":"<your-database-name>",
    "host":"<your-hostname>",
    "username":"<your-username>"
}
The name for the secret must match the app value followed by the env value (both in title case), followed by DatabaseSecret, so for app=wp and env=dev, your secret name should be WpDevDatabaseSecret.
To deploy the stacks
The following commands deploy the stacks defined in the CDK app. To deploy them individually, use the specific stack names (these will vary according to the info that you supplied previously), as shown in the following.
cdk deploy wp-dev-network-stack -c app=wp -c env=dev
cdk deploy wp-dev-database-stack -c app=wp -c env=dev
cdk deploy wp-dev-compute-stack -c app=wp -c env=dev
cdk deploy wp-dev-cdn-stack -c app=wp -c env=dev
To create a database stack, deploy the network and database stacks first.
cdk deploy wp-dev-network-stack -c app=wp -c env=dev
cdk deploy wp-dev-database-stack -c app=wp -c env=dev
You can then initiate the deployment of the compute stack.
cdk deploy wp-dev-compute-stack -c app=wp -c env=dev
After the compute stack deploys, you can deploy the stack that creates the CloudFront distribution.
cdk deploy wp-dev-cdn-stack -c env=dev
This deploys the CloudFront infrastructure to the US East (N. Virginia) Region (us-east-1). CloudFront is a global AWS service, which means that you must create it in this Region. The other stacks are deployed to the Region that you specified in your configuration stanza.
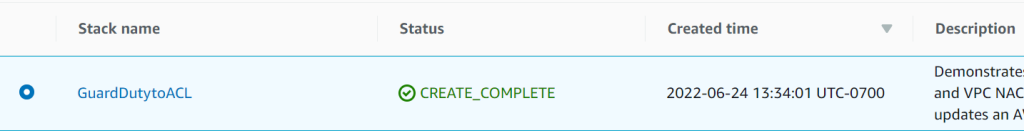
To test the results
If your stacks deploy successfully, your site appears at one of the following URLs:
- subdomain.hostedZone (if you specified a value for the subdomain) — for example, www.example.com
- appName-env.hostedZone (if you didn’t specify a value for the subdomain) — for example, wp-dev.example.com.
If you connect through the IP address that you configured in the adminIps configuration, you should be connected to the admin instance for your site. Because the admin instance can modify the file system, you should use it to do your administrative tasks.
Users who connect to your site from an IP that isn’t in your allowedIps list will be connected to your fleet instances and won’t be able to alter the file system (for example, they won’t be able to install plugins or upload media).
If you need to redeploy the same app-env combination, manually remove the parameter store items and the replicated secret that you created in us-east-1. You should also delete the cdk.context.json file because it caches values that you will be replacing.
One project, multiple configurations
You can modify the configuration file in this project to deploy different applications to different environments using the same project. Each app can have different configurations for dev, test, or production environments.
Using this mechanism, you can deploy sites for test and production into different accounts or even different Regions. The solution uses CDK context variables as command-line switches to select different configuration stanzas from the configuration file.
CDK projects allow for multiple deployments to coexist in one account by using unique names for the deployed stacks, based on their configuration.
Check the configuration file into your source control repo so that you track changes made to it over time.
Got a different web app that you want to deploy? Create a new configuration by copying and pasting one of the examples and then modify the build commands as needed for your use case.
Conclusion
In this post, you learned how to build an architecture on AWS that implements multi-layered security. You can use different AWS services to provide protections to your application at different stages of the request lifecycle.
You can learn more about the services used in this sample project by building it in your own account. It’s a great way to explore how the different services work and the full features that are available. By understanding how these AWS services work, you will be ready to use them to add security, at multiple layers, in your own architectures.
If you have feedback about this post, submit comments in the Comments section below. If you have questions about this post, contact AWS Support.
Want more AWS Security news? Follow us on Twitter.


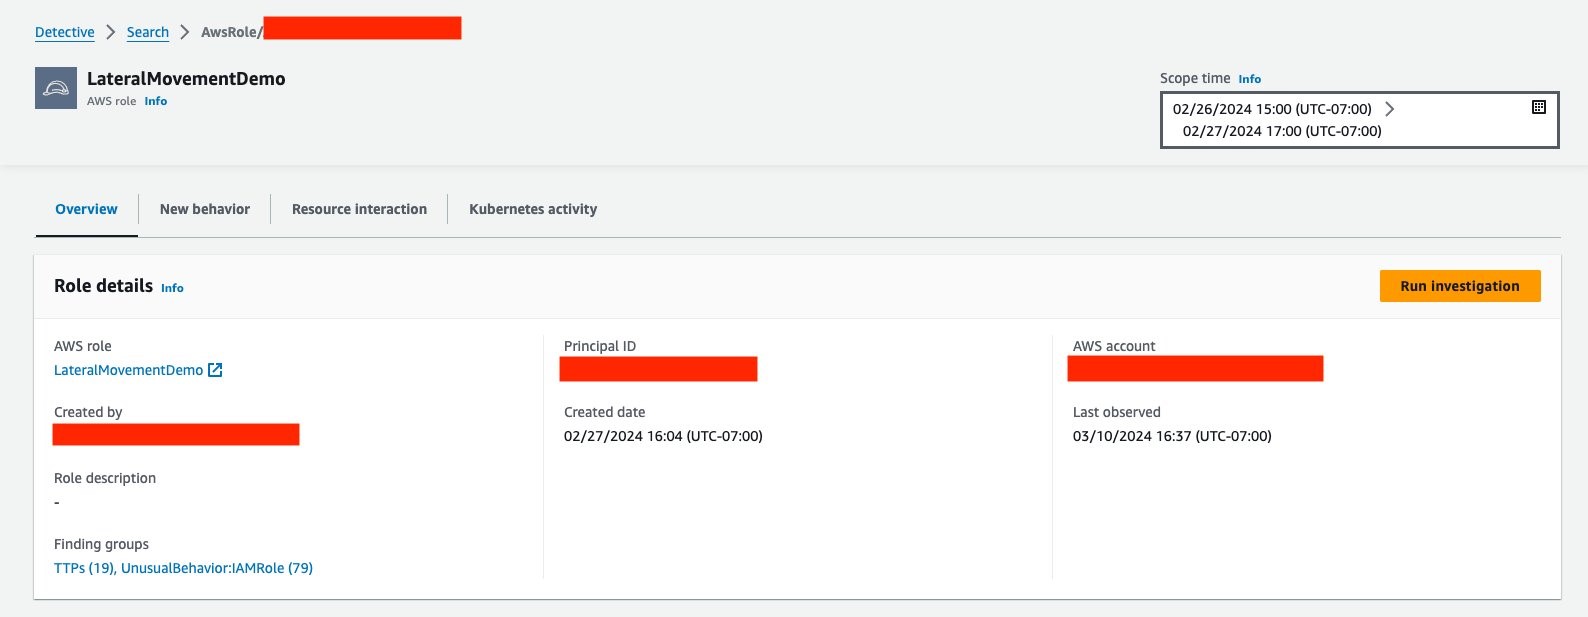
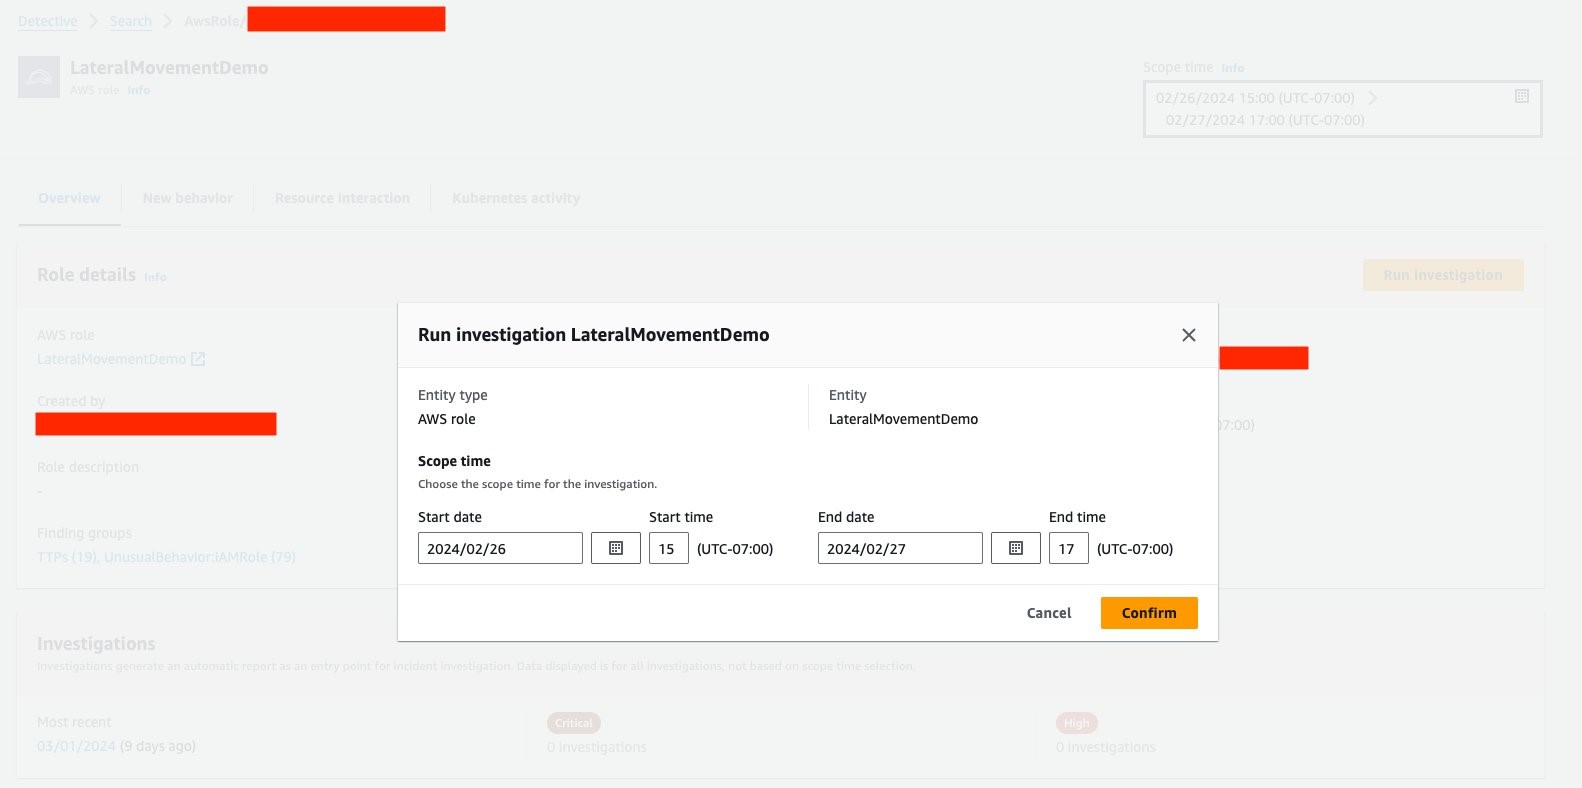
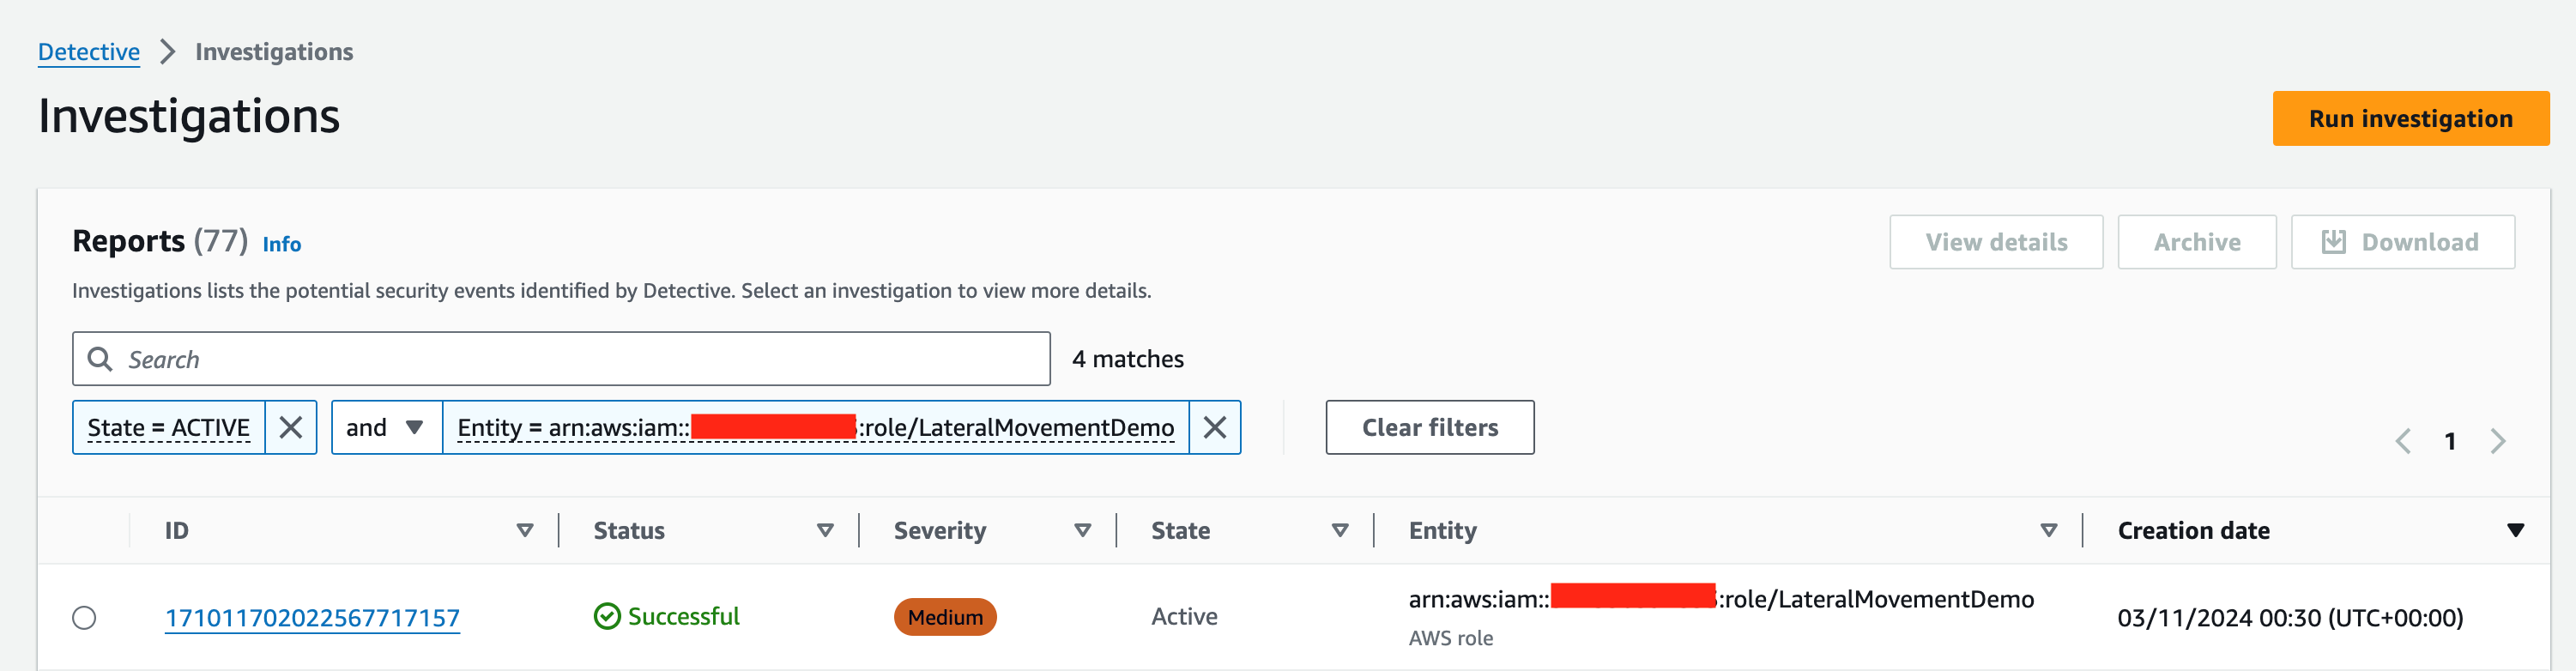
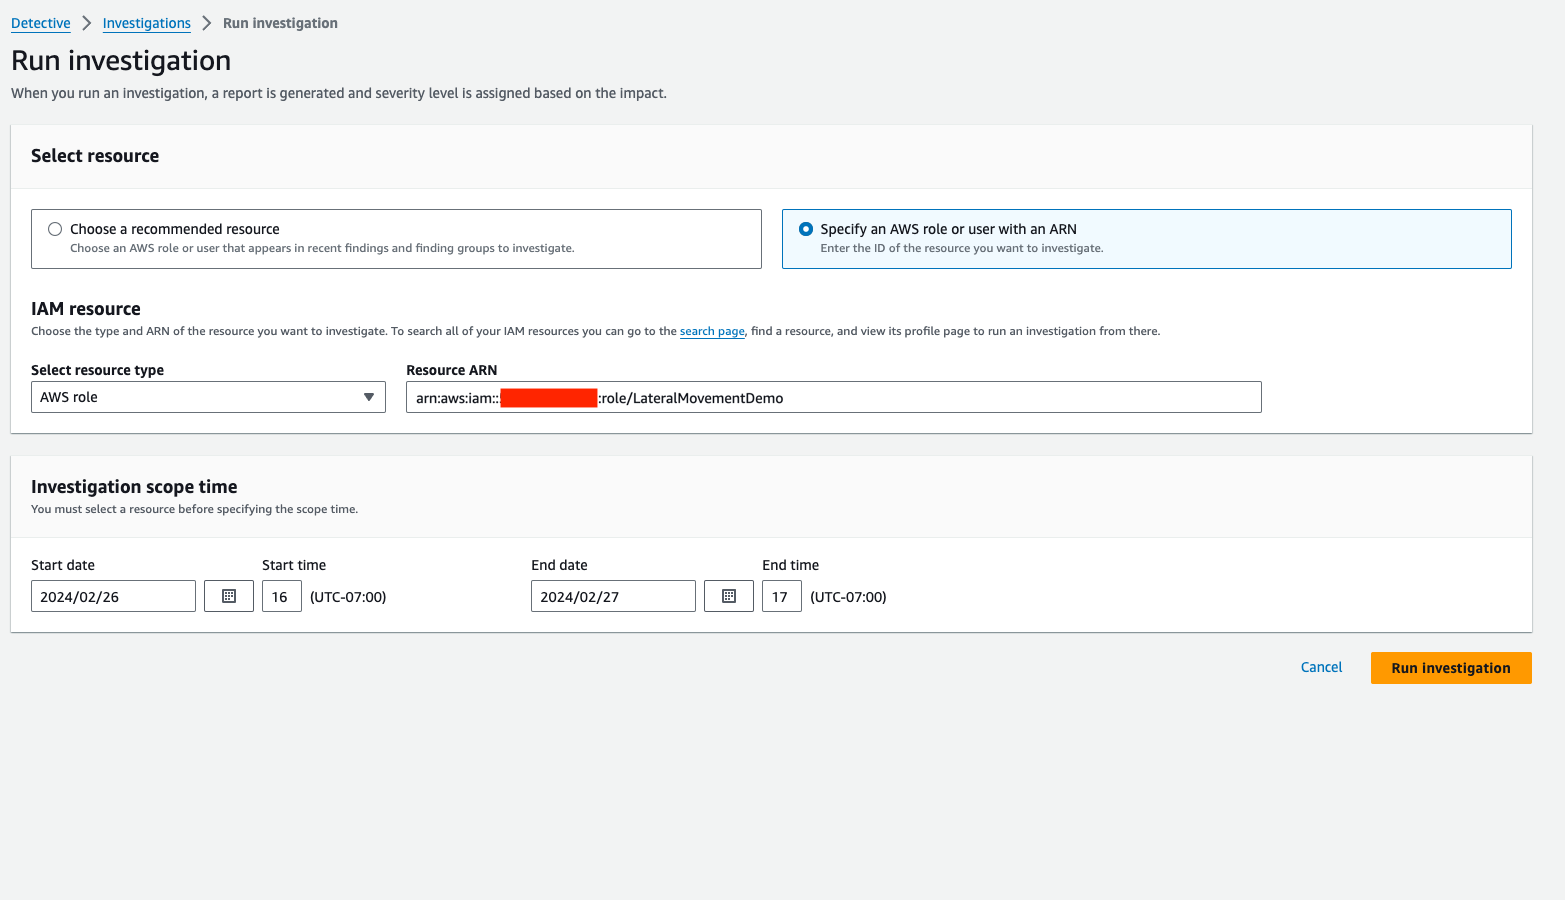
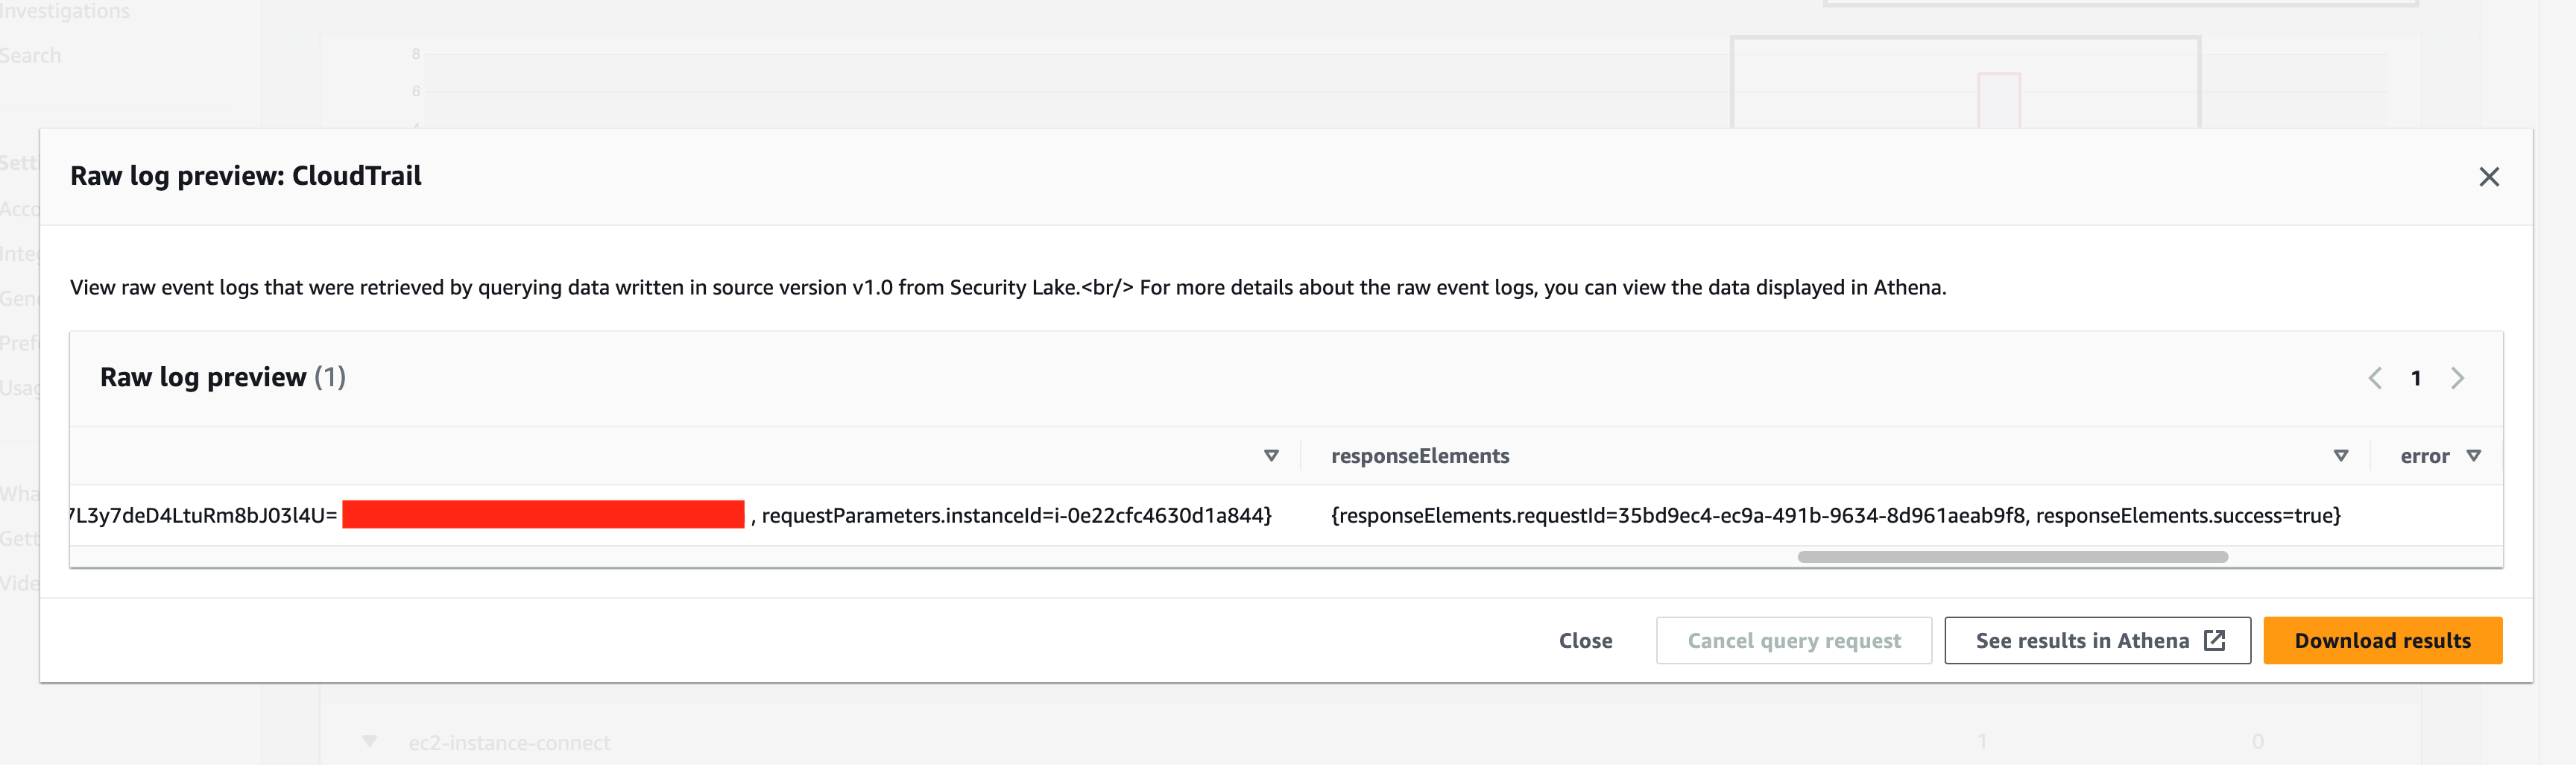
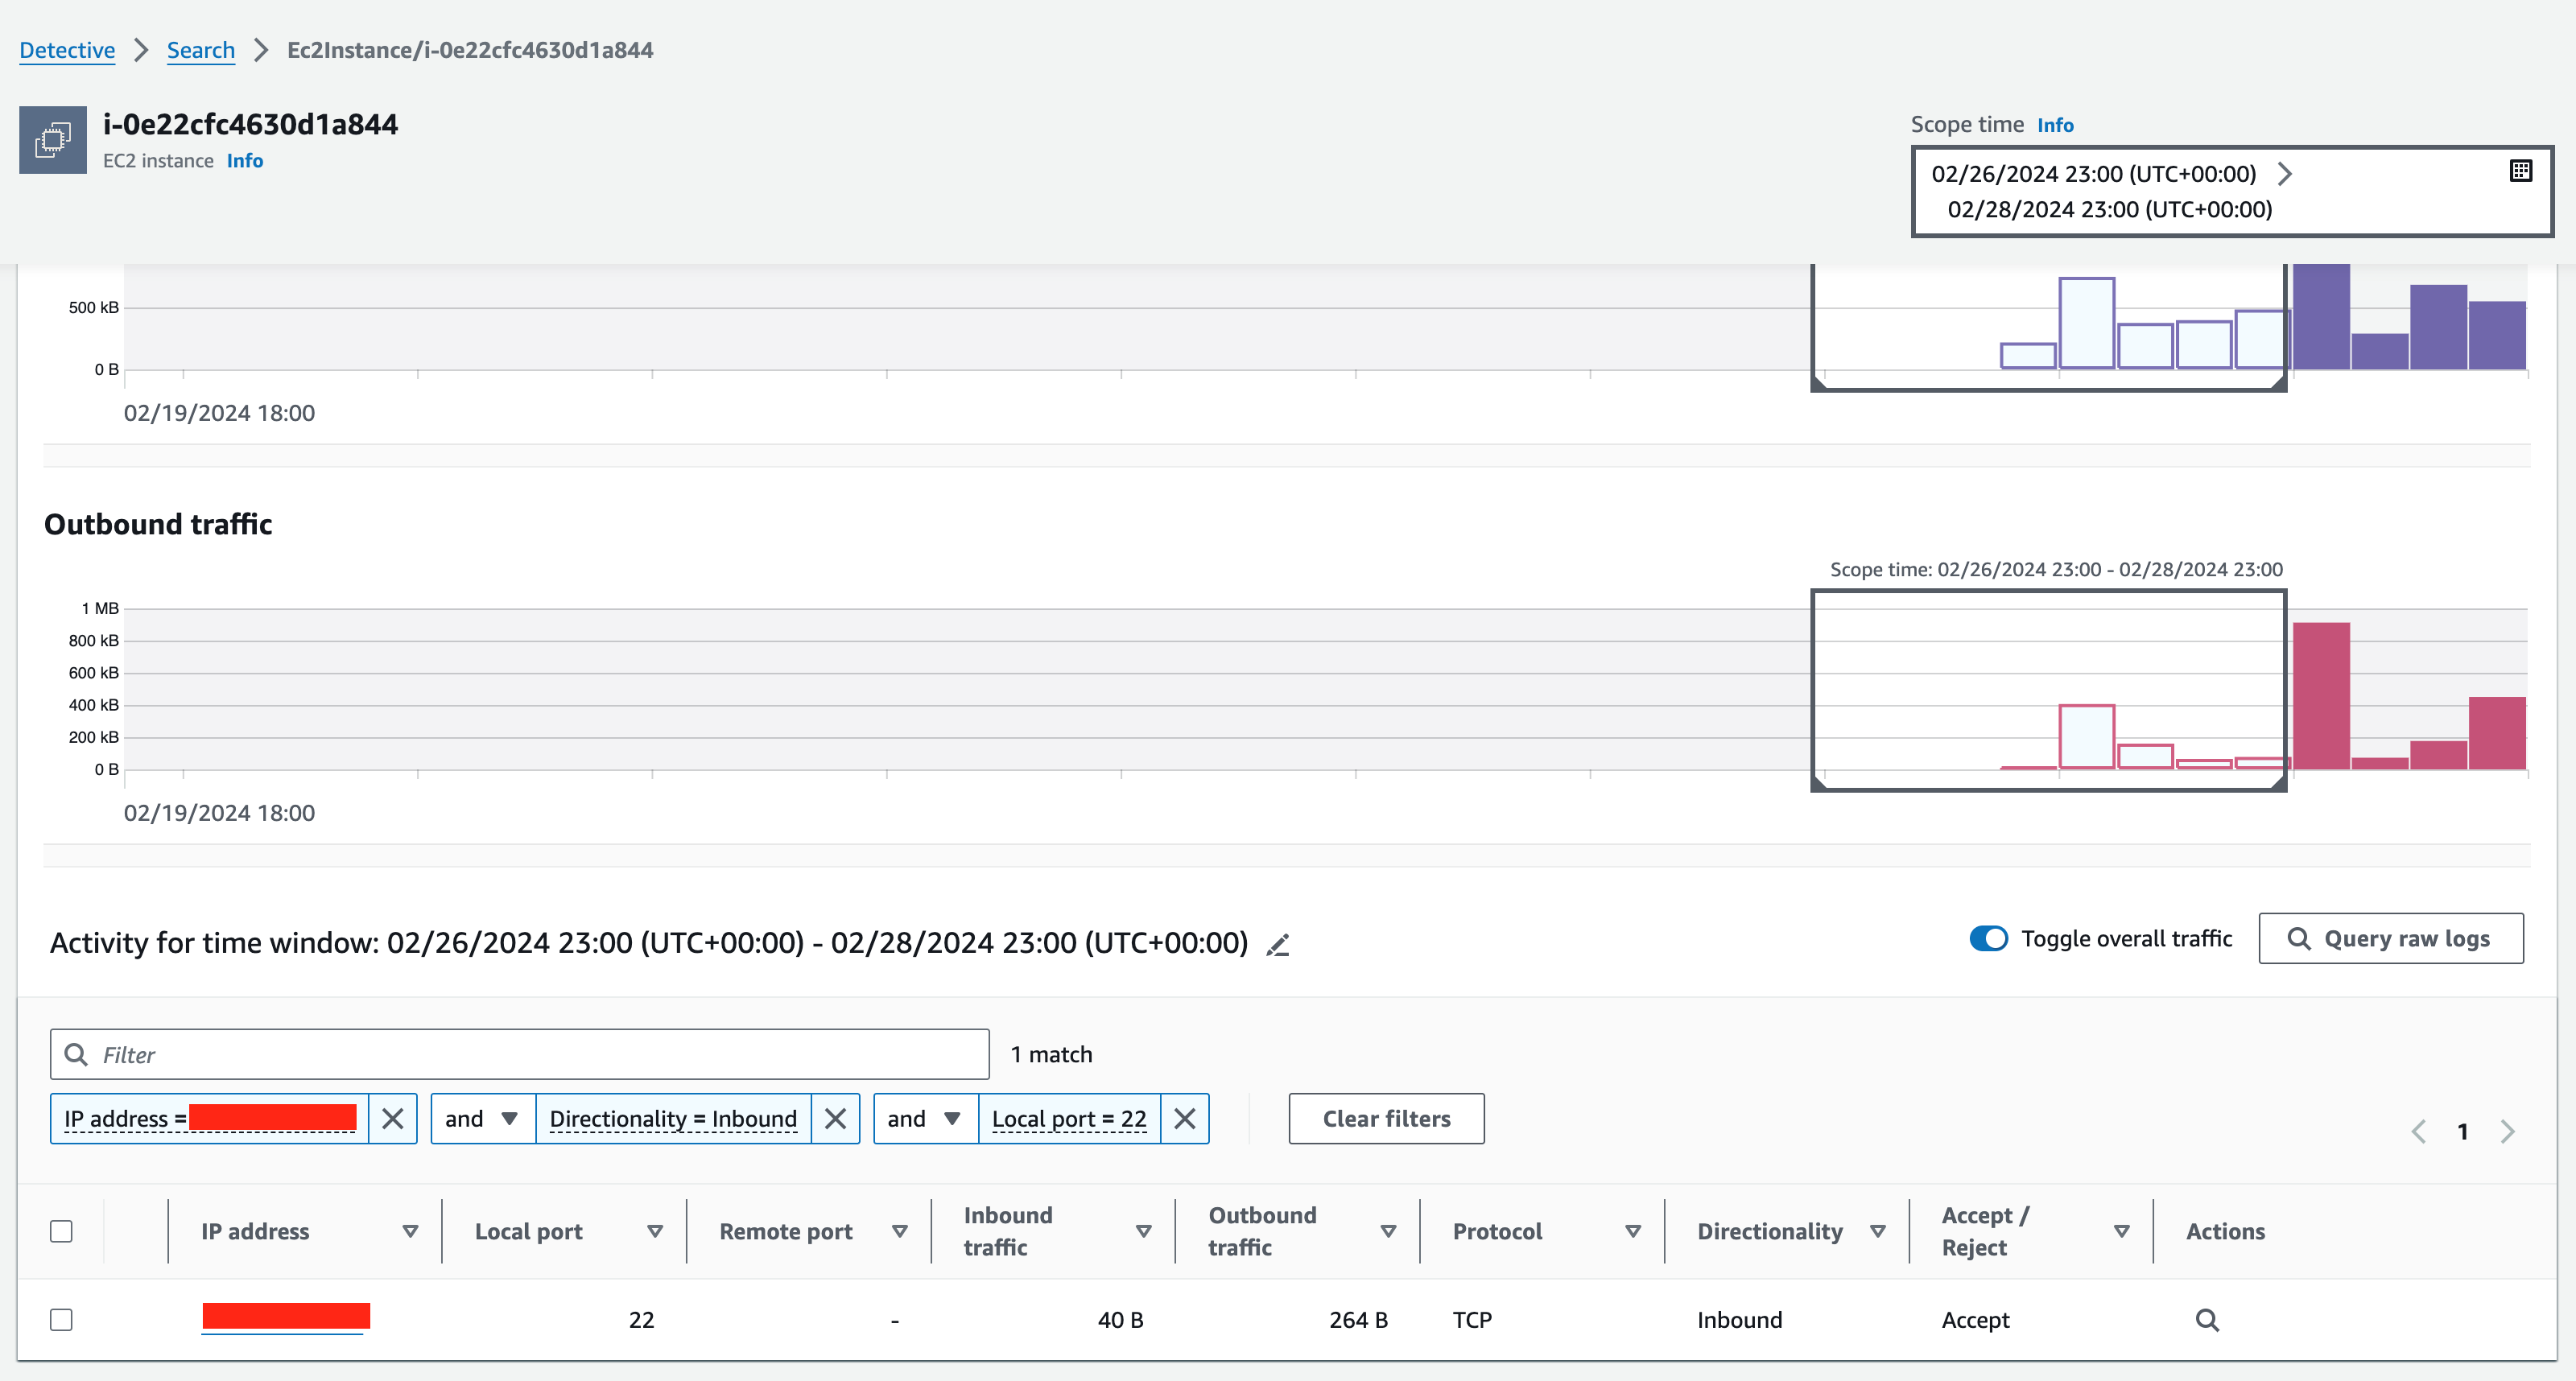
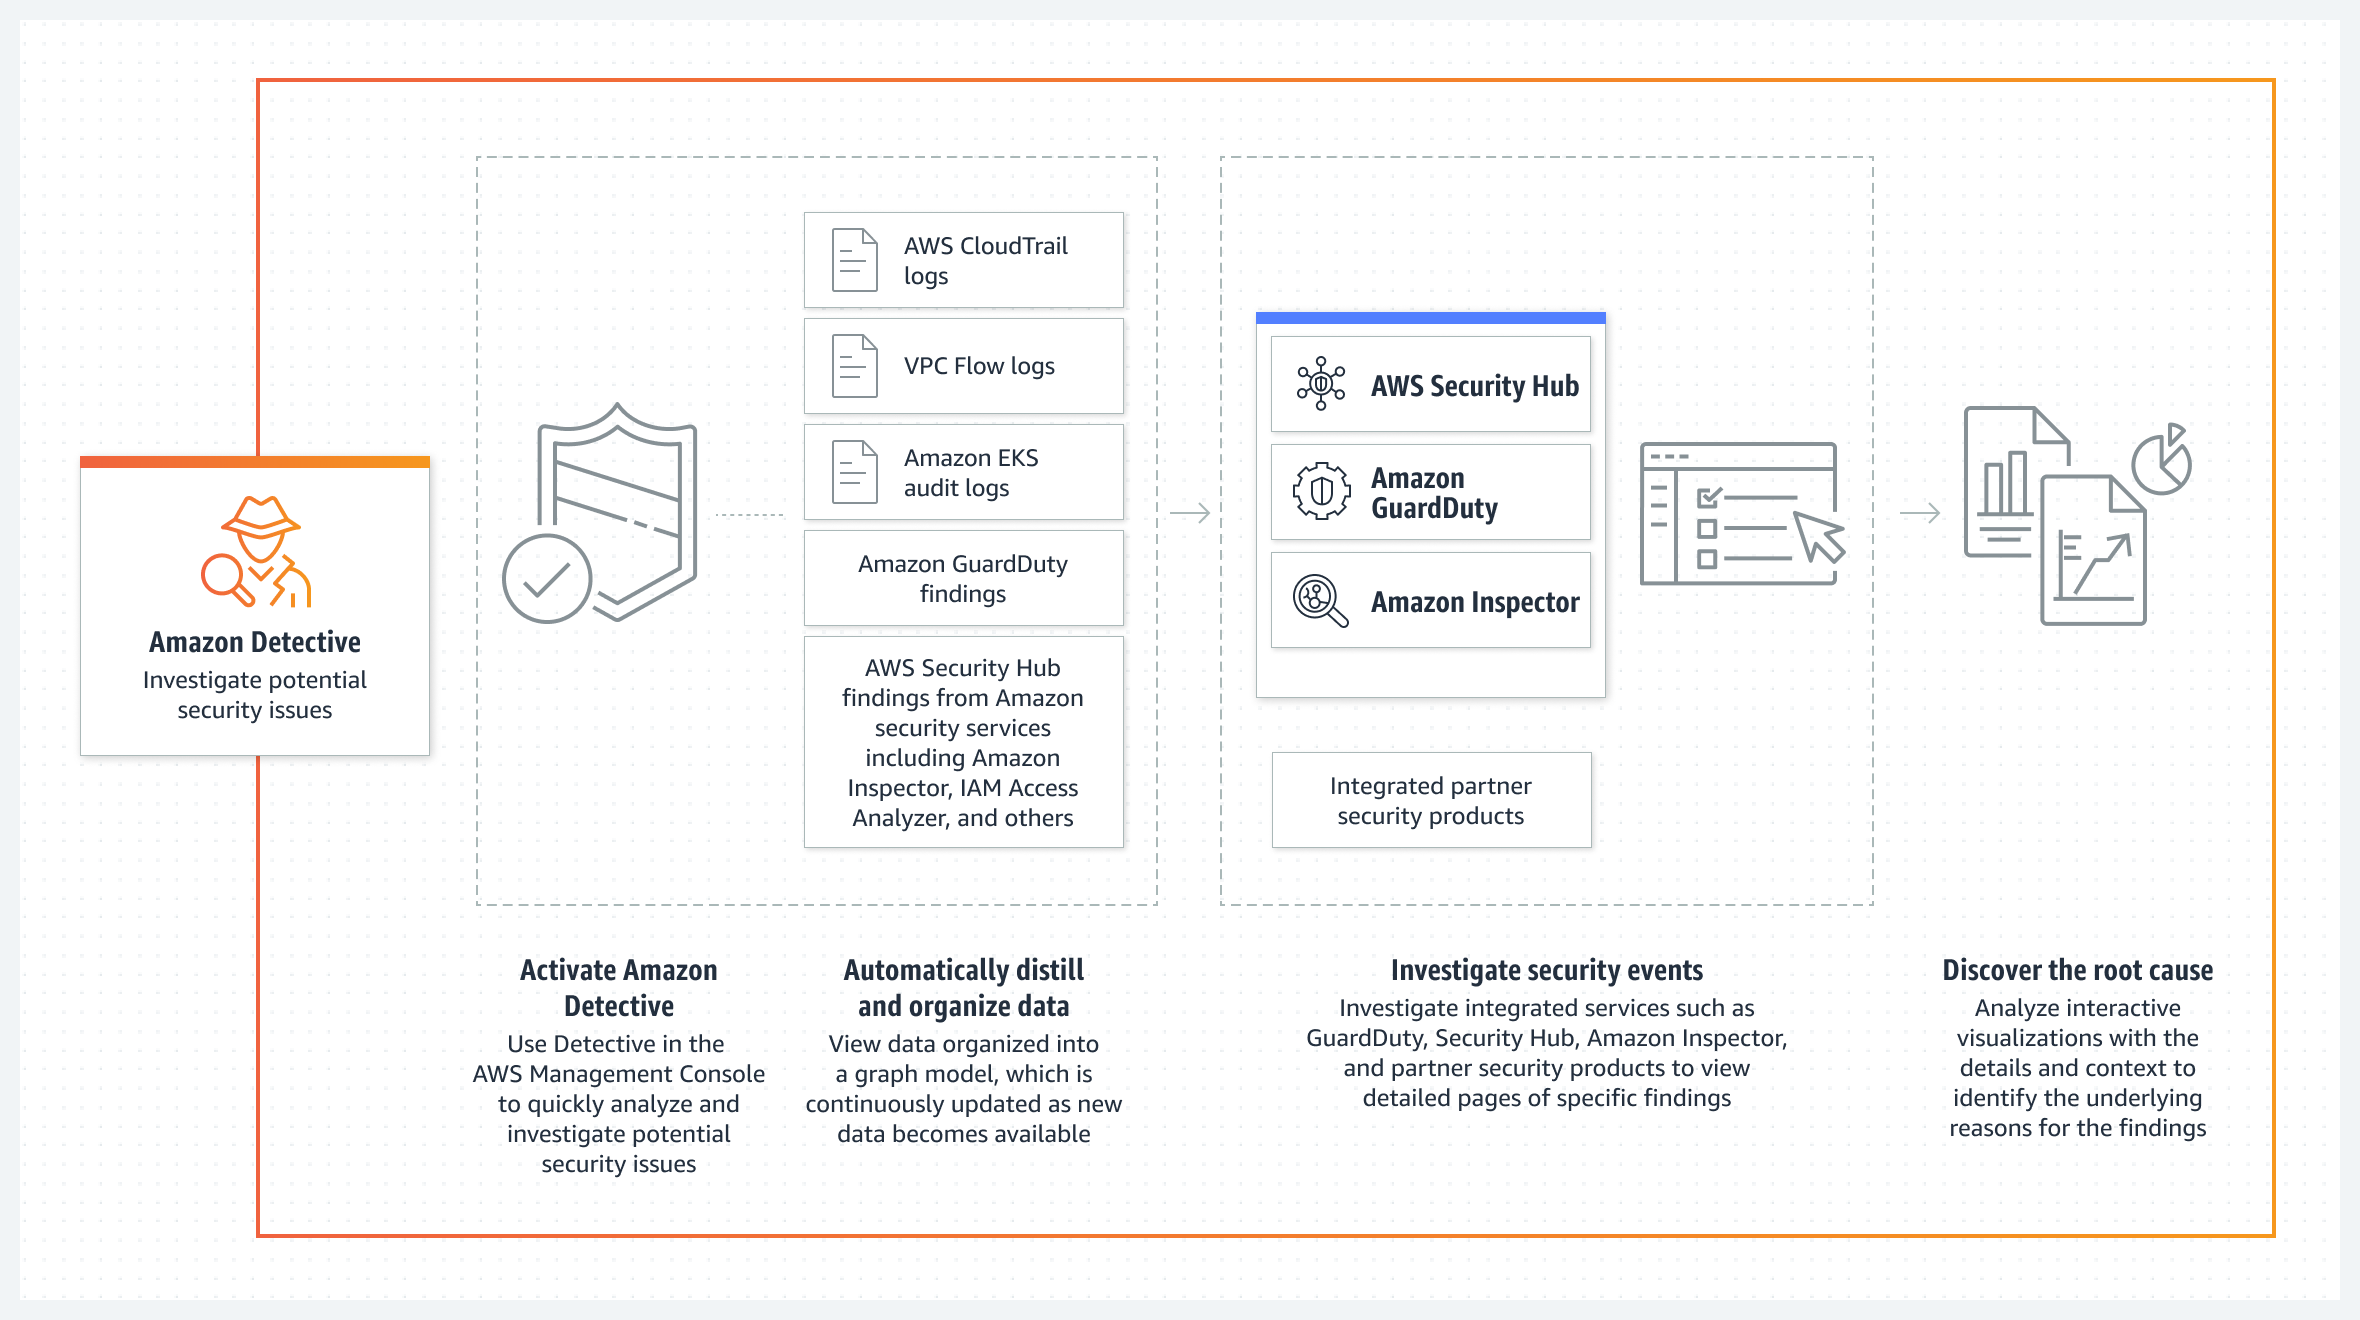
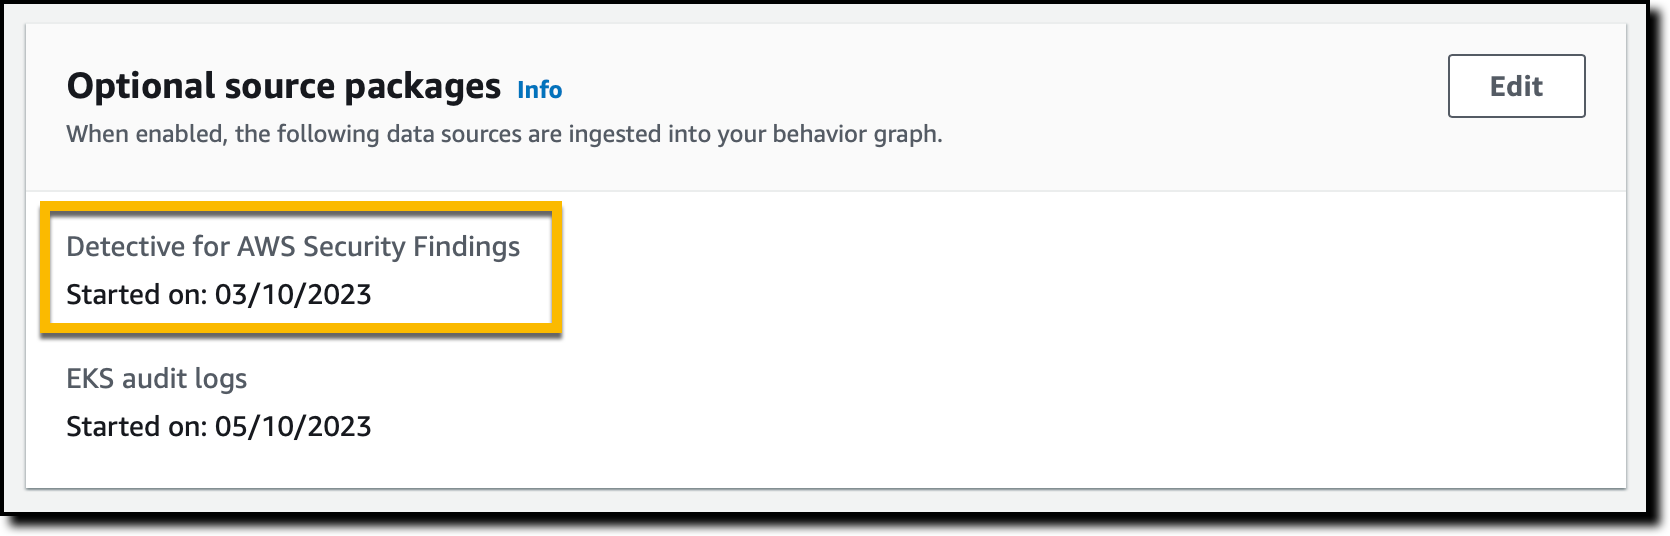
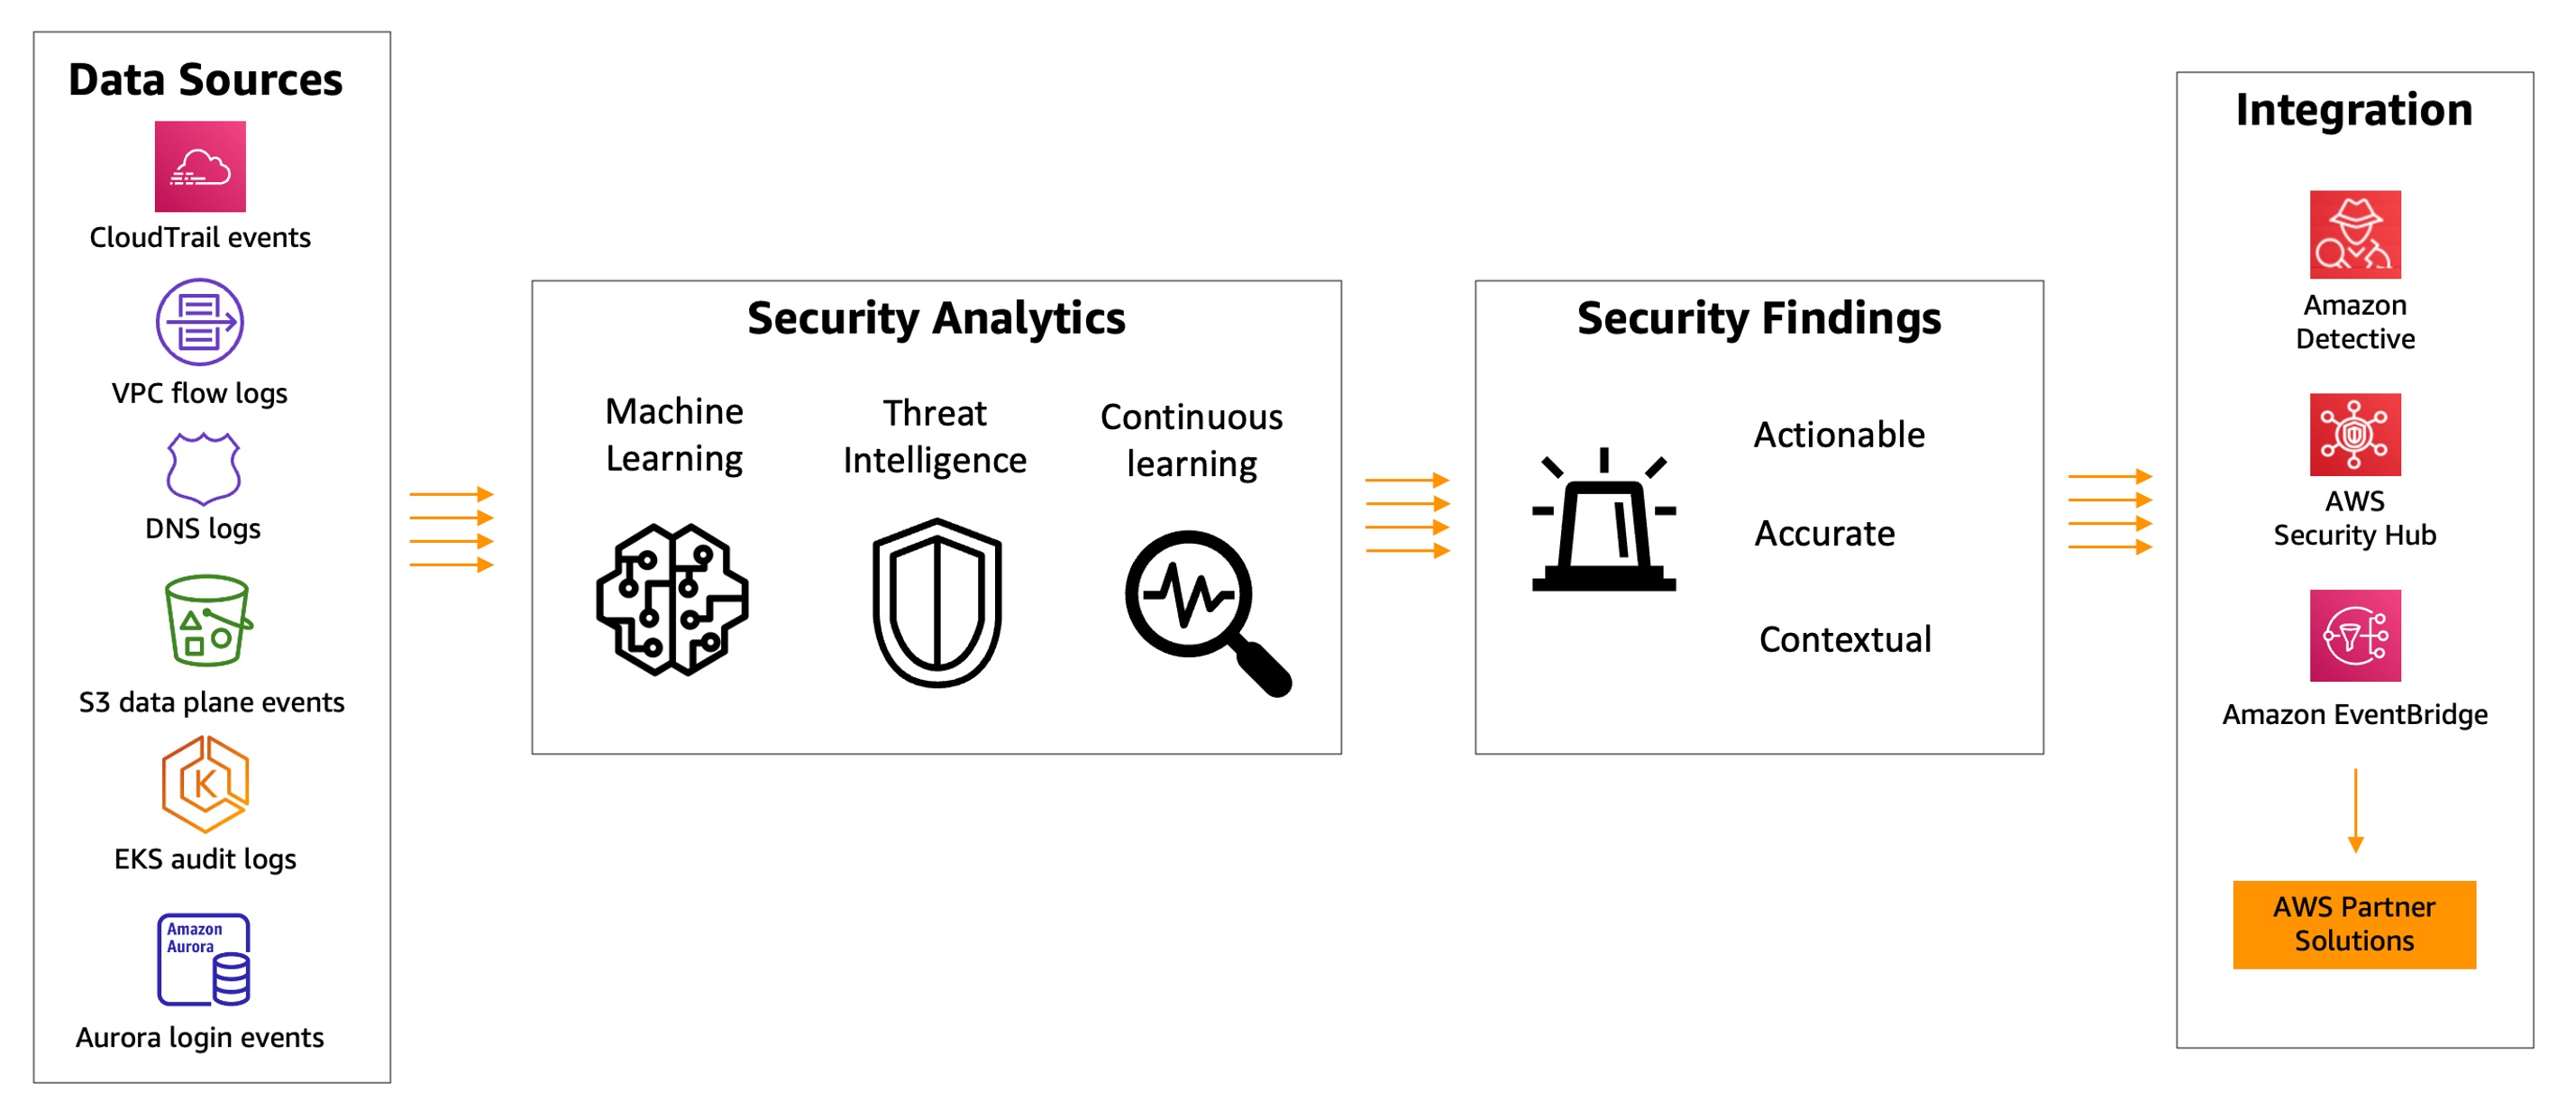
 You can set up GuardDuty Malware Protection for your S3 buckets even without GuardDuty enabled for your AWS account. However, if you enable GuardDuty in your account, you can use the full monitoring of foundational sources, such as AWS CloudTrail management events, Amazon Virtual Private Cloud (Amazon VPC) Flow Logs, and DNS query logs, as well as malware protection features. You can also have security findings sent to AWS Security Hub and Amazon Detective for further investigation.