Tag Archives: Architecture

Field Notes: Migrating File Servers to Amazon FSx and Integrating with AWS Managed Microsoft AD

Post Syndicated from Kyaw Soe Hlaing original https://aws.amazon.com/blogs/architecture/field-notes-migrating-file-servers-to-amazon-fsx-and-integrating-with-aws-managed-microsoft-ad/

Amazon FSx provides AWS customers with the native compatibility of third-party file systems with feature sets for workloads such as Windows-based storage, high performance computing (HPC), machine learning, and electronic design automation (EDA).  Amazon FSx automates the time-consuming administration tasks such as hardware provisioning, software configuration, patching, and backups. Since Amazon FSx integrates the file systems with cloud-native AWS services, this makes them even more useful for a broader set of workloads.

Amazon FSx for Windows File Server provides fully managed file storage that is accessible over the industry-standard Server Message Block (SMB) protocol. Built on Windows Server, Amazon FSx delivers a wide range of administrative features such as data deduplication, end-user file restore, and Microsoft Active Directory (AD) integration.

In this post, I explain how to migrate files and file shares from on-premises servers to Amazon FSx with AWS DataSync in a domain migration scenario. Customers are migrating their file servers to Amazon FSx as part of their migration from an on-premises Active Directory to AWS managed Active Directory. Their plan is to replace their file servers with Amazon FSx during Active Directory migration to AWS Managed AD.

Arhictecture diagram

Prerequisites

Before you begin, perform the steps outlined in this blog to migrate the user accounts and groups to the managed Active Directory.

Walkthrough

There are numerous ways to perform the Active Directory migration. Generally, the following five steps are taken:

  1. Establish two-way forest trust between on-premises AD and AWS Managed AD
  2. Migrate user accounts and group with the ADMT tool
  3. Duplicate Access Control List (ACL) permissions in the file server
  4. Migrate files and folders with existing ACL to Amazon FSx using AWS DataSync
  5. Migrate User Computers

In this post, I focus on duplication of ACL permissions and migration of files and folders using Amazon FSx and AWS DataSync. In order to perform duplication of ACL permission in file servers, I use SubInACL tool, which is available from the Microsoft website.

Duplication of the ACL is required because users want to seamlessly access file shares once their computers are migrated to AWS Managed AD. Thus all migrated files and folders have permission with Managed AD users and group objects. For enterprises, the migration of user computers does not happen overnight. Normally, migration takes place in batches or phases. With ACL duplication, both migrated and non-migrated users can access their respective file shares seamlessly during and after migration.

Duplication of Access Control List (ACL)

Before we proceed with ACL duplication, we must ensure that the migration of user accounts and groups was completed. In my demo environment, I have already migrated on-premises users to the Managed Active Directory. In the meantime, we presume that we are migrating identical users to the Managed Active Directory. There might be a scenario where migrated user accounts have different naming such as samAccount name. In this case, we will need to handle this during ACL duplication with SubInACL. For more information about syntax, refer to the SubInACL documentation.

As indicated in following screenshots, I have two users created in the on-premises Active Directory (onprem.local) and those two identical users have been created in the Managed Active Directory too (corp.example.com).

Screenshot of on-premises Active Directory (onprem.local)


Screenshot of Active Directory

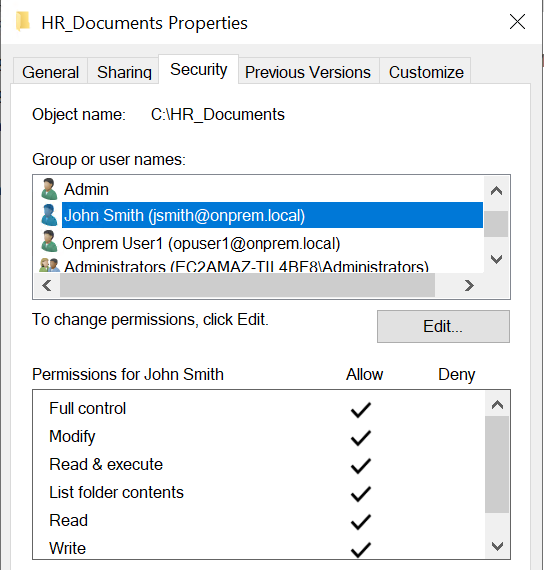
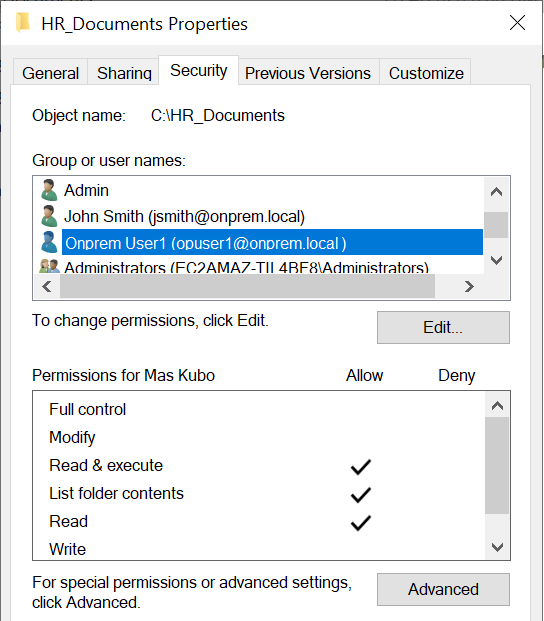
In the following screenshot, I have a shared folder called “HR_Documents” in an on-premises file server. Different users have different access rights to that folder. For example, John Smith has “Full Control” but Onprem User1 only have “Read & Execute”. Our plan is to add same access right to identical users from the Managed Active Directory, here corp.example.com, so that once John Smith is migrated to managed AD, he can access to shared folders in Amazon FSx using his Managed Active Directory credential.

Let’s verify the existing permission in the “HR_Documents” folder. Two users from onprem.local are found with different access rights.

Screenshot of HR docs

Screenshot of HR docs

Now it’s time to install SubInACL.

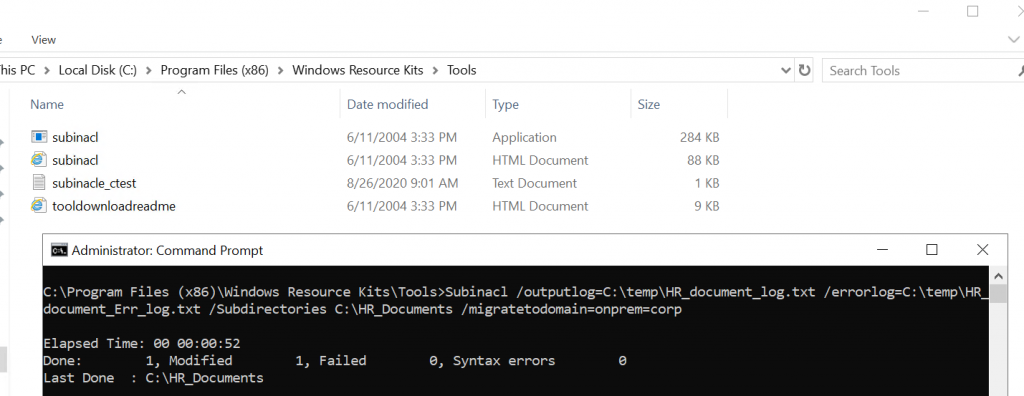
We install it in our on-premises file server. After the SubInACL tool is installed, it can be found under “C:\Program Files (x86)\Windows Resource Kits\Tools” folder by default. To perform an ACL duplication, run command prompt as administrator and run the following command;

Subinacl /outputlog=C:\temp\HR_document_log.txt /errorlog=C:\temp\HR_document_Err_log.txt /Subdirectories C:\HR_Documents\* /migratetodomain=onprem=corp

There are several parameters that I am using in the command:

  • Outputlog = where log file is saved
  • ErrorLog = where error log file is saved
  • Subdirectories = to apply permissions including subfolders and files
  • Migratetodomain= NetBIOS name of source domain and destination domain

Screenshot windows resources kits

screenshot of windows resources kit

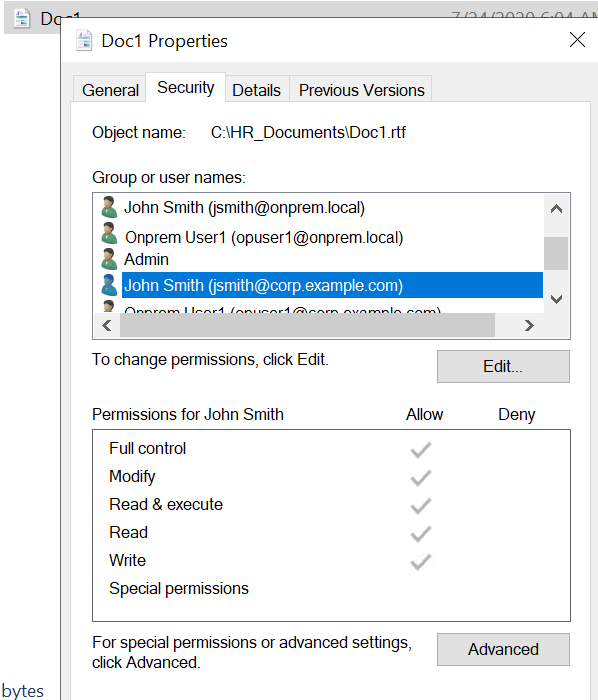
If the command is run successfully, you should able to see a summary of the results. If there is no error or failure, you can verify whether ACL permissions are duplicated as expected by looking at the folders and files. In our case, we can see that there is one ACL entry of identical account from corp.example.com is added.

Note: you will always see two ACL entries, one from onprem.local and another one from corp.example.com domain in all the files and folders that you used during migration.  Permissions are now applied to both at the folder and file level.

screenshot of payroll properties

screenshot of doc 1 properties

Migrate files and folders using AWS DataSync

AWS DataSync is an online data transfer service that simplifies, automates, and accelerates moving data between on-premises storage systems and AWS Storage services such as Amazon S3, Amazon Elastic File System (Amazon EFS), or Amazon FSx for Windows File Server. Manual tasks related to data transfers can slow down migrations and burden IT operations. AWS DataSync reduces or automatically handles many of these tasks, including scripting copy jobs, scheduling and monitoring transfers, validating data, and optimizing network utilization.

Create an AWS DataSync agent

An AWS DataSync agent deploys as a virtual machine in an on-premises data center. An AWS DataSync agent can be run on ESXi, KVM, and Microsoft Hyper-V hypervisors. The AWS DataSync agent is used to access on-premises storage systems and transfer data to the AWS DataSync managed service running on AWS. AWS DataSync always performs incremental copies by comparing from a source to a destination and only copying files that are new or have changed.

AWS DataSync supports the following SMB (Server Message Block) locations to migrate data from:

  • Network File System (NFS)
  • Server Message Block (SMB)

In this blog, I use SMB as the source location, since I am migrating from an on-premises Windows File server. AWS DataSync supports SMB 2.1 and SMB 3.0 protocols.

AWS DataSync saves metadata and special files when copying to and from file systems. When files are copied from a SMB file share and Amazon FSx for Windows File Server, AWS DataSync copies the following metadata:

  • File timestamps: access time, modification time, and creation time
  • File owner and file group security identifiers (SIDs)
  • Standard file attributes
  • NTFS discretionary access lists (DACLs): access control entries (ACEs) that determine whether to grant access to an object

Data Synchronization with AWS DataSync

When a task starts, AWS DataSyc goes through different stages. It begins with examining file system follows by data transfer to destination. Once data transfer is completed, it performs verification for consistency between source and destination file systems. You can review detailed information about the data synchronization stages.

DataSync Endpoints

You can activate your agent by using one of the following endpoint types:

  • Public endpoints – If you use public endpoints, all communication from your DataSync agent to AWS occurs over the public internet.
  • Federal Information Processing Standard (FIPS) endpoints – If you need to use FIPS 140-2 validated cryptographic modules when accessing the AWS GovCloud (US-East) or AWS GovCloud (US-West) Region, use this endpoint to activate your agent. You use the AWS CLI or API to access this endpoint.
  • Virtual private cloud (VPC) endpoints – If you use a VPC endpoint, all communication from AWS DataSync to AWS services occurs through the VPC endpoint in your VPC in AWS. This approach provides a private connection between your self-managed data center, your VPC, and AWS services. It increases the security of your data as it is copied over the network.

In my demo environment, I have implemented AWS DataSync as indicated in following diagram. The DataSync Agent can be run either on VMware or Hyper-V and KVM platform in a customer on-premises data center.

Datasync Agent Arhictecture

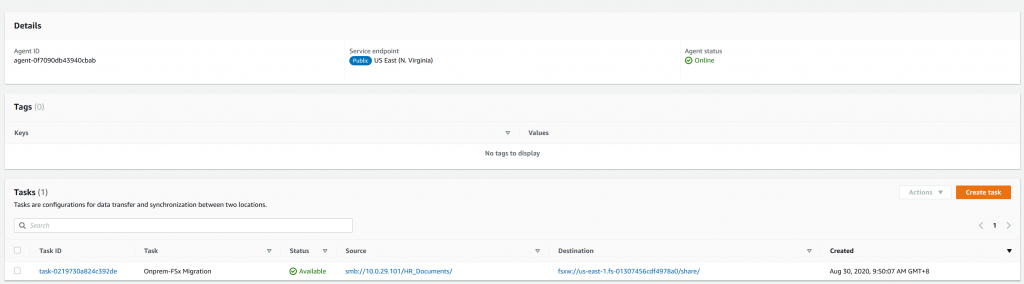
Once the AWS DataSync Agent setup is completed and the task that defined the source file servers and destination Amazon FSx server is added, you can verify agent status in the AWS Management Console.

Console screenshot

Select Task and then choose Start to start copying files and folders. This will start the replication task (or you can wait until the task runs hourly). You can check the History tab to see a history of the replication task executions.

Console screenshot

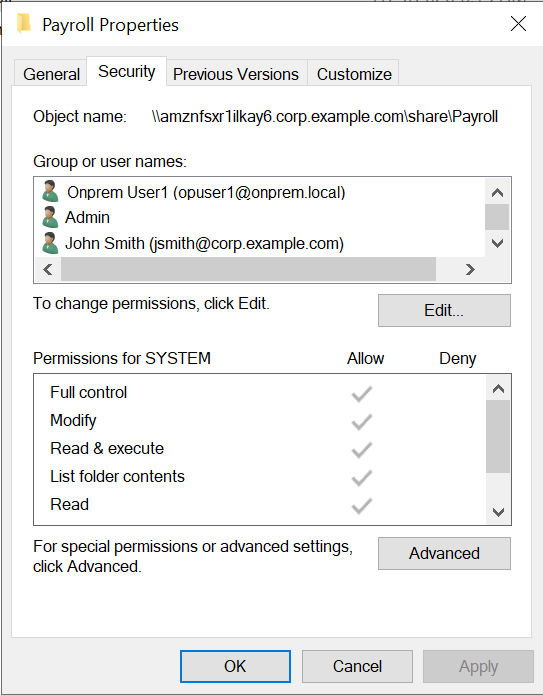
Congratulations! You have replicated the contents of an on-premises file server to Amazon FSx. Let’s look and make sure the ACL permissions are still intact in their destination after migration. As shown in the following screenshots, the ACL permissions in the Payroll folder still remains as is, both on-premises users and Managed AD users are inside. Once the user’s computers are migrated to the Managed AD, they can access the same file share in Amazon FSx server using Managed AD credentials.

Payroll properties screenshot

Payroll properties screenshot

Cleaning up

If you are performing testing by following the preceding steps in your own account, delete the following resources, to avoid incurring future charges:

  • EC2 instances
  • Managed AD
  • Amazon FSx file system
  • AWS Datasync

Conclusion

You have learned how to duplicate ACL permissions and shared folder permissions during migration of file servers to Amazon FSx. This process provides a seamless migration experience for users. Once the user’s computers are migrated to the Managed AD, they only need to remap shared folders from Amazon FSx. This can be automated by pushing down shared folders mapping with a Group Policy. If new files or folders are created in the source file server, AWS Datasync will synchronize to Amazon FSx server.

For customers who are planning to do a domain migration from on-premises to AWS Managed Microsoft AD, migration of resources like file servers are common. Handling ACL permissions plays a vital role in providing a seamless migration experience. The duplication of ACL can be an option, otherwise, the ADMT tool can be used to migrate SID information from the source Domain to destination Domain. To migrate SID history, SID filtering needs to be disabled during migration.

If you want to provide feedback about this post, you are welcome to submit in the comments section below.

Field Notes provides hands-on technical guidance from AWS Solutions Architects, consultants, and technical account managers, based on their experiences in the field solving real-world business problems for customers.

Real-Time In-Stream Inference with AWS Kinesis, SageMaker & Apache Flink

Post Syndicated from Shawn Sachdev original https://aws.amazon.com/blogs/architecture/realtime-in-stream-inference-kinesis-sagemaker-flink/

As businesses race to digitally transform, the challenge is to cope with the amount of data, and the value of that data diminishes over time. The challenge is to analyze, learn, and infer from real-time data to predict future states, as well as to detect anomalies and get accurate results. In this blog post, we’ll explain the architecture for a solution that can achieve real-time inference on streaming data. We’ll also cover the integration of Amazon Kinesis Data Analytics (KDA) with Apache Flink to asynchronously invoke any underlying services (or databases).

Managed real-time in-stream data inference is quite a mouthful; let’s break it up:

  • In-stream data refers to the capability of processing a data stream that collects, processes, and analyzes data.
  • Real-time inference refers to the ability to use data from the feed to project future state for the underlying data.

Consider a streaming application that captures credit card transactions along with the other parameters (such as source IP to capture the geographic details of the transaction as well as the  amount). This data can then be used to be used to infer fraudulent transactions instantaneously. Compare that to a traditional batch-oriented approach that identifies fraudulent transactions at the end of every business day and generates a report when it’s too late, after bad actors have already committed fraud.

Architecture overview

In this post, we discuss how you can use Amazon Kinesis Data Analytics for Apache Flink (KDA), Amazon SageMaker, Apache Flink, and Amazon API Gateway to address the challenges such as real-time fraud detection on a stream of credit card transaction data. We explore how to build a managed, reliable, scalable, and highly available streaming architecture based on managed services that substantially reduce the operational overhead compared to a self-managed environment. Our particular focus is on how to prepare and run Flink applications with KDA for Apache Flink applications.

The following diagram illustrates this architecture:

Run Apache Flink applications with KDA for Apache Flink applications

In above architecture, data is ingested in AWS Kinesis Data Streams (KDS) using Amazon Kinesis Producer Library (KPL), and you can use any ingestion patterns supported by KDS. KDS then streams the data to an Apache Flink-based KDA application. KDA manages the required infrastructure for Flink, scales the application in response to changing traffic patterns, and automatically recovers from underlying failures. The Flink application is configured to call an API Gateway endpoint using Asynchronous I/O. Residing behind the API Gateway is an AWS SageMaker endpoint, but any endpoints can be used based on your data enrichment needs. Flink distributes the data across one or more stream partitions, and user-defined operators can transform the data stream.

Let’s talk about some of the key pieces of this architecture.

What is Apache Flink?

Apache Flink is an open source distributed processing framework that is tailored to stateful computations over unbounded and bounded datasets. The architecture uses KDA with Apache Flink to run in-stream analytics and uses Asynchronous I/O operator to interact with external systems.

KDA and Apache Flink

KDA for Apache Flink is a fully managed AWS service that enables you to use an Apache Flink application to process streaming data. With KDA for Apache Flink, you can use Java or Scala to process and analyze streaming data. The service enables you to author and run code against streaming sources. KDA provides the underlying infrastructure for your Flink applications. It handles core capabilities like provisioning compute resources, parallel computation, automatic scaling, and application backups (implemented as checkpoints and snapshots).

Flink Asynchronous I/O Operator

Flink Asynchronous I/O Operator

Flink’s Asynchronous I/O operator allows you to use asynchronous request clients for external systems to enrich stream events or perform computation. Asynchronous interaction with the external system means that a single parallel function instance can handle multiple requests and receive the responses concurrently. In most cases this leads to higher streaming throughput. Asynchronous I/O API integrates well with data streams, and handles order, event time, fault tolerance, etc. You can configure this operator to call external sources like databases and APIs. The architecture pattern explained in this post is configured to call API Gateway integrated with SageMaker endpoints.

Please refer code at kda-flink-ml, a sample Flink application with implementation of Asynchronous I/O operator to call an external Sagemaker endpoint via API Gateway. Below is the snippet of code of StreamingJob.java from sample Flink application.

DataStream<HttpResponse<RideRequest>> predictFareResponse =
            // Asynchronously call predictFare Endpoint
            AsyncDataStream.unorderedWait(
                predictFareRequests,
                new Sig4SignedHttpRequestAsyncFunction<>(predictFareEndpoint, apiKeyHeader),
                30, TimeUnit.SECONDS, 20
            )
            .returns(newTypeHint<HttpResponse<RideRequest>() {});

The operator code above requires following inputs:

  1. An input data stream
  2. An implementation of AsyncFunction that dispatches the requests to the external system
  3. Timeout, which defines how long an asynchronous request may take before it considered failed
  4. Capacity, which defines how many asynchronous requests may be in progress at the same time

How Amazon SageMaker fits into this puzzle

In our architecture we are proposing a SageMaker endpoint for inferencing that is invoked via API Gateway, which can detect fraudulent transactions.

Amazon SageMaker is a fully managed service that provides every developer and data scientist with the ability to build, train, and deploy machine learning (ML) models quickly. SageMaker removes the heavy lifting from each step of the machine learning process to make it easier to build and develop high quality models. You can use these trained models in an ingestion pipeline to make real-time inferences.

You can set up persistent endpoints to get predictions from your models that are deployed on SageMaker hosting services. For an overview on deploying a single model or multiple models with SageMaker hosting services, see Deploy a Model on SageMaker Hosting Services.

Ready for a test drive

To help you get started, we would like to introduce an AWS Solution: AWS Streaming Data Solution for Amazon Kinesis (Option 4) that is available as a single-click cloud formation template to assist you in quickly provisioning resources to get your real-time in-stream inference pipeline up and running in a few minutes. In this solution we leverage AWS Lambda, but that can be switched with a SageMaker endpoint to achieve the architecture discussed earlier in this post. You can also leverage the pre-built AWS Solutions Construct, which implements an Amazon API Gateway connected to an Amazon SageMaker endpoint pattern that can replace AWS Lambda in the below solution. See the implementation guide for this solution.

The following diagram illustrates the architecture for the solution:

architecture for the solution

Conclusion

In this post we explained the architecture to build a managed, reliable, scalable, and highly available application that is capable of real-time inferencing on a data stream. The architecture was built using KDS, KDA for Apache Flink, Apache Flink, and Amazon SageMaker. The architecture also illustrates how you can use managed services so that you don’t need to spend time provisioning, configuring, and managing the underlying infrastructure. Instead, you can spend your time creating insights and inference from your data.

We also talked about the AWS Streaming Data Solution for Amazon Kinesis, which is an AWS vetted solution that provides implementations for applications you can automatically deploy directly into your AWS account. The solution automatically configures the AWS services necessary to easily capture, store, process, and infer from streaming data.

Serving Content Using a Fully Managed Reverse Proxy Architecture in AWS

Post Syndicated from Leonardo Machado original https://aws.amazon.com/blogs/architecture/serving-content-using-fully-managed-reverse-proxy-architecture/

With the trends to autonomous teams and microservice style architectures, web frontend tiers are challenged to become more flexible and integrate different components with independent architectures and technology stacks. Two scenarios are prominent:

  • Micro-Frontends, where there is a single page application and components within this page are owned by different teams
  • Web portals, where there is a landing page and subsections of the presence are owned by different teams. In the following we will refer to these as components as well.

What these scenarios have in common is that they consist of loosely coupled components that are seamlessly hidden to the end user behind a common interface. Often, a reverse proxy serves content from one single entry domain but retrieves the content from different origins. In the example in Figure 1 (below) we want to address one specific domain name, and depending on the path prefix, we retrieve the content from an on-premises webserver, from a webserver running on Amazon Elastic Cloud Compute (EC2), or from Amazon S3 Static Hosting, in the figure represented by the prefixes /hotels, /pets, and /cars, respectively. If we forward the path to the webserver without the path prefix, the component would not know what prefix it is run under and the prefix could be changed any time without impacting the component, thus making the component context-unaware.

Figure 1 - Architecture, AWS Amplify Console

Figure 1: Architecture, AWS Amplify Console

Some common requirements to these approaches are:

  • Components should be technology-agnostic, each component should be able to choose the technology stack independently.
  • Each component can be maintained by a dedicated autonomous team without depending on other teams.
  • All components are served from the same domain name. For example, this could have implications on search engine optimization.
  • Components should be unaware of the context where it is used.

The traditional approach would be to run a reverse proxy tier with rewrite rules to different origins. In this post we look into managed alternatives in AWS that take away the heavy lifting of running and scaling the proxy infrastructure.

Note: AWS Application Load Balancer can be used as a reverse proxy, but it only supports static targets (fixed IP address), no dynamic targets (domain name). Thus, we do not consider it here.

AWS Amplify Console

The AWS Amplify Console provides a Git-based workflow for hosting fullstack serverless web apps with continuous deployment. Amplify Console also offers a rewrites and redirects feature, which can be used for forwarding incoming requests with different path patterns to different origins (see Figure 2).

Figure 2 - Dashboard, AWS Amplify Console (rewrites and redirects feature)

Figure 2: Dashboard, AWS Amplify Console (rewrites and redirects feature)

Note: In Figure 2, <*> stands for a wildcard that matches any pattern. Target addresses must be HTTPS (no HTTP allowed).

This architectural option is the simplest to setup and manage and is the best approach for teams looking for the least management effort. AWS Amplify Console offers a simple interface for easily mapping incoming patterns to target addresses. It also makes it easy to serve additional static content if needed. Configuration options are limited and more complex scenarios cannot be implemented.

If you want to rewrite paths to remove the path prefix, you can accomplish this by using the wildcard pattern. The source address would contain the path prefix, but the target address would omit the prefix as seen in Figure 2.

When looking at pricing compared to the other approaches it is important to look at the outgoing traffic. With higher volumes, this can get expensive.

Amazon API Gateway

Amazon API Gateway is a fully managed service that makes it easy for developers to create, publish, maintain, monitor, and secure APIs at any scale. API Gateway’s REST API type allows users to setup HTTP proxy integrations, which can be used for forwarding incoming requests with different path patterns to different origin servers according to the API specifications (Figure 3).

Figure 3 - Dashboard, Amazon API Gateway (HTTP proxy integration)

Figure 3: Dashboard, Amazon API Gateway (HTTP proxy integration)

Note: In Figure 3, {proxy+} and {proxy} stand for the same wildcard pattern.

API Gateway, in comparison to Amplify Console, is better suited when looking for a higher customization degree. API Gateway offers multiple customization and monitoring features, such as custom gateway responses and dashboard monitoring.

Similar to Amplify Console, API Gateway provides a feature to rewrite paths and thus remove context from the path using the {proxy} wildcard.

API Gateway REST API pricing is based on the number of API calls as well as any external data transfers. External data transfers are charged at the EC2 data transfer rate.

Note: The HTTP integration type in API Gateway REST APIs does not support forwarding trailing slashes. If this is needed for your application, consider other integration types such as AWS Lambda integration or AWS service integration.

Amazon CloudFront and AWS Lambda@Edge

Amazon CloudFront is a fast content delivery network (CDN) service that securely delivers data, videos, applications, and APIs to customers globally with low latency and high transfer speeds. CloudFront is able to route incoming requests with different path patterns to different origins or origin groups by configuring its cache behavior rules (Figure 4).

Figure 4 - Dashboard, CloudFront (Cache Behavior)

Figure 4: Dashboard, CloudFront (Cache Behavior)

Additionally, Amazon CloudFront allows for integration with AWS Lambda@Edge functions. Lambda@Edge runs your code in response to events generated by CloudFront. In this scenario we can use Lambda@Edge to change the path pattern before forwarding a request to the origin and thus removing the context. For details on see this detailed re:Invent session.

This approach offers most control over caching behavior and customization. Being able to add your own custom code through a custom Lambda function adds an entire new range of possibilities when processing your request. This enables you to do everything from simple HTTP request and response processing at the edge to more advanced functionality, such as website security, real-time image transformation, intelligent bot mitigation, and search engine optimization.

Amazon CloudFront is charged by request and by Lambda@Edge invocation. The data traffic out is charged with the CloudFront regional data transfer out pricing.

Conclusion

With AWS Amplify Console, Amazon API Gateway, and Amazon CloudFront, we have seen three approaches to implement a reverse proxy pattern using managed services from AWS. The easiest approach to start with is AWS Amplify Console. If you run into more complex scenarios consider API Gateway. For most flexibility and when data traffic cost becomes a factor look into Amazon CloudFront with Lambda@Edge.

Field Notes: Setting Up Disaster Recovery in a Different Seismic Zone Using AWS Outposts

Post Syndicated from Vijay Menon original https://aws.amazon.com/blogs/architecture/field-notes-setting-up-disaster-recovery-in-a-different-seismic-zone-using-aws-outposts/

Recovering your mission-critical workloads from outages is essential for business continuity and providing services to customers with little or no interruption. That’s why many customers replicate their mission-critical workloads in multiple places using a Disaster Recovery (DR) strategy suited for their needs.

With AWS, a customer can achieve this by deploying multi Availability Zone High-Availability setup or a multi-region setup by replicating critical components of an application to another region.  Depending on the RPO and RTO of the mission-critical workload, the requirement for disaster recovery ranges from simple backup and restore, to multi-site, active-active, setup. In this blog post, I explain how AWS Outposts can be used for DR on AWS.

In many geographies, it is possible to set up your disaster recovery for a workload running in one AWS Region to another AWS Region in the same country (for example in US between us-east-1 and us-west-2). For countries where there is only one AWS Region, it’s possible to set up disaster recovery in another country where AWS Region is present. This method can be designed for the continuity, resumption and recovery of critical business processes at an agreed level and limits the impact on people, processes and infrastructure (including IT). Other reasons include to minimize the operational, financial, legal, reputational and other material consequences arising from such events.

However, for mission-critical workloads handling critical user data (PII, PHI or financial data), countries like India and Canada have regulations which mandate to have a disaster recovery setup at a “safe distance” within the same country. This ensures compliance with any data sovereignty or data localization requirements mandated by the regulators. “Safe distance” means the distance between the DR site and the primary site is such that the business can continue to operate in the event of any natural disaster or industrial events affecting the primary site. Depending on the geography, this safe distance could be 50KM or more. These regulations limit the options customers have to use another AWS Region in another country as a disaster recovery site of their primary workload running on AWS.

In this blog post, I describe an architecture using AWS Outposts which helps set up disaster recovery on AWS within the same country at a distance that can meet the requirements set by regulators. This architecture also helps customers to comply with various data sovereignty regulations in a given country. Another advantage of this architecture is the homogeneity of the primary and disaster recovery site. Your existing IT teams can set up and operate the disaster recovery site using familiar AWS tools and technology in a homogenous environment.

Prerequisites

Readers of this blog post should be familiar with basic networking concepts like WAN connectivity, BGP and the following AWS services:

Architecture Overview

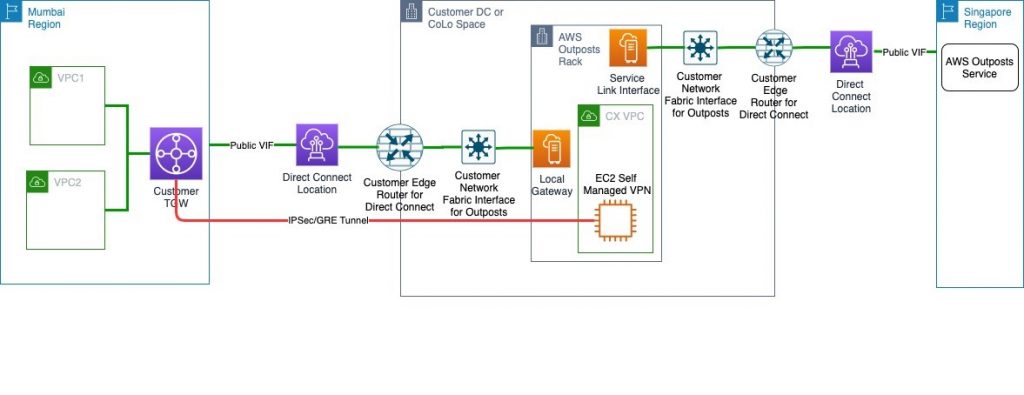
I explain the architecture using an example customer scenario in India, where a customer is using AWS Mumbai Region for their mission-critical workload. This workload needs a DR setup to comply with local regulation and the DR setup needs to be in a different seismic zone than the one for Mumbai. Also, because of the nature of the regulated business, the user/sensitive data needs to be stored within India.

Following is the architecture diagram showing the logical setup.

This solution is similar to a typical AWS Outposts use case where a customer orders the Outposts to be installed in their own Data Centre (DC) or a CoLocation site (Colo). It will follow the shared responsibility model described in AWS Outposts documentation.

The only difference is that the AWS Outpost parent Region will be the closest Region other than AWS Mumbai, in this case Singapore. Customers will then provision an AWS Direct Connect public VIF locally for a Service Link to the Singapore Region. This ensures that the control plane stays available via the AWS Singapore Region even if there is an outage in AWS Mumbai Region affecting control plane availability. You can then launch and manage AWS Outposts supported resources in the AWS Outposts rack.

For data plane traffic, which should not go out of the country, the following options are available:

  • Provision a self-managed Virtual Private Network (VPN) between an EC2 instances running router AMI in a subnet of AWS Outposts and AWS Transit Gateway (TGW) in the primary Region.
  • Provision a self-managed Virtual Private Network (VPN) between an EC2 instances running router AMI in a subnet of AWS Outposts and Virtual Private Gateway (VGW) in the primary Region.

Note: The Primary Region in this example is AWS Mumbai Region. This VPN will be provisioned via Local Gateway and DX public VIF. This ensures that data plane traffic will not traverse any network out of the country (India) to comply with data localization mandated by the regulators.

Architecture Walkthrough

  1. Make sure your data center (DC) or the choice of collocate facility (Colo) meets the requirements for AWS Outposts.
  2. Create an Outpost and order Outpost capacity as described in the documentation. Make sure that you do this step while logged into AWS Outposts console of the AWS Singapore Region.
  3. Provision connectivity between AWS Outposts and network of your DC/Colo as mentioned in AWS Outpost documentation.  This includes setting up VLANs for service links and Local Gateway (LGW).
  4. Provision an AWS Direct Connect connection and public VIF between your DC/Colo and the primary Region via the closest AWS Direct Connect location.
    • For the WAN connectivity between your DC/Colo and AWS Direct Connect location you can choose any telco provider of your choice or work with one of AWS Direct Connect partners.
    • This public VIF will be used to attach AWS Outposts to its parent Region in Singapore over AWS Outposts service link. It will also be used to establish an IPsec GRE tunnel between AWS Outposts subnet and a TGW or VGW for data plane traffic (explained in subsequent steps).
    • Alternatively, you can provision separate Direct Connect connection and public VIFs for Service Link and data plane traffic for better segregation between the two. You will have to provision sufficient bandwidth on Direct Connect connection for the Service Link traffic as well as the Data Plane traffic (like data replication between primary Region and AWS outposts).
    • For an optimal experience and resiliency, AWS recommends that you use dual 1Gbps connections to the AWS Region. This connectivity can also be achieved over Internet transit; however, I recommend using AWS Direct Connect because it provides private connectivity between AWS and your DC/Colo  environment, which in many cases can reduce your network costs, increase bandwidth throughput, and provide a more consistent network experience than Internet-based connections.
  5. Create a subnet in AWS Outposts and launch an EC2 instance running a router AMI of your choice from AWS Marketplace in this subnet. This EC2 instance is used to establish the IPsec GRE tunnel to the TGW or VGW in primary Region.
  6. Add rules in security group of these EC2 instances to allow ISAKMP (UDP 500), NAT Traversal (UDP 4500), and ESP (IP Protocol 50) from VGW or TGW endpoint public IP addresses.
  7. NAT (Network Address Translation) the EIP assigned in step 5 to a public IP address at your edge router connecting to AWS Direct connect or internet transit. This public IP will be used as the customer gateway to establish IPsec GRE tunnel to the primary Region.
  8. Create a customer gateway using the public IP address used to NAT the EC2 instances step 7. Follow the steps in similar process found at Create a Customer Gateway.
  9. Create a VPN attachment for the transit gateway using the customer gateway created in step 8. This VPN must be a dynamic route-based VPN. For steps, review Transit Gateway VPN Attachments. If you are connecting the customer gateway to VPC using VGW in primary Region then follow the steps mentioned at How do I create a secure connection between my office network and Amazon Virtual Private Cloud?.
  10. Configure the customer gateway (EC2 instance running a router AMI in AWS Outposts subnet) side for VPN connectivity. You can base this configuration suggested by AWS during the creation of VPN in step 9. This suggested sample configuration can be downloaded from AWS console post VPN setup as discussed in this document.
  11. Modify the route table of AWS outpost Subnets to point to the EC2 instance launched in step 5 as the target for any destination in your VPCs in the primary Region, which is AWS Mumbai in this example.

At this point, you will have end-to-end connectivity between VPCs in a primary Region and resources in an AWS Outposts. This connectivity can now be used to replicate data from your primary site to AWS Outposts for DR purposes. This  keeps the setup compliant with any internal or external data localization requirements.

Conclusion

In this blog post, I described an architecture using AWS Outposts for Disaster Recovery on AWS in countries without a second AWS Region. To set up disaster recovery, your existing IT teams can set up and operate the disaster recovery site using the familiar AWS tools and technology in a homogeneous environment. To learn more about AWS Outposts, refer to the documentation and FAQ.

Field Notes provides hands-on technical guidance from AWS Solutions Architects, consultants, and technical account managers, based on their experiences in the field solving real-world business problems for customers.

Fast and Cost-Effective Image Manipulation with Serverless Image Handler

Post Syndicated from Ajay Swamy original https://aws.amazon.com/blogs/architecture/fast-and-cost-effective-image-manipulation-with-serverless-image-handler/

As a modern company, you most likely have both a web-based and mobile app platform to provide content to customers who view it on a range of devices. This means you need to store multiple versions of images, depending on the device. The resulting image management can be a headache as it can be expensive and cumbersome to manage.

Serverless Image Handler (SIH) is an AWS Solution Implementation you use to store a single version of every image featured in your content, while dynamically delivering different versions at runtime based on your end user’s device. The solution simplifies code, saves on storage costs, and is ideal for use with web applications and mobile apps. SIH features include the ability to resize images, change background colors, apply formatting, and add watermarks.

Architecture overview

The SIH solution utilizes an AWS CloudFormation template to deploy the solution within minutes, and it’s for those of you who have multiple image assets needing an option to dynamically change or manipulate customer-facing images. SIH deploys best-in-class AWS services such as Amazon CloudFront, Amazon API Gateway, and AWS Lambda functions, and it connects to your Amazon Simple Storage Service (Amazon S3) bucket for storage.

Deploying this solution with the default parameters builds the following environment in AWS Cloud:

SIH: Emvironment in AWS Cloud-2

SIH uses the following AWS services:

  • Amazon CloudFront to quickly and securely  deliver images to your end users at scale
  • AWS Lambda to run code for image manipulation without the need for provisioning or managing servers (thereby reducing costs and overhead)
  • Your Amazon S3 bucket for storage of your image assets
  • AWS Secrets Manager to support the signing of image URLs so that image access is protected

How does Serverless Image Handler work?

When an HTTP request is received from a customer device, it is passed from CloudFront to API Gateway, and then forwarded to the Lambda function for processing. If the image is cached by CloudFront because of an earlier request, CloudFront will return the cached image instead of forwarding the request to the API Gateway. This reduces latency and eliminates the cost of reprocessing the image.

Requests that are not cached are passed to the API Gateway, and the entire request is forwarded to the Lambda function. The Lambda function retrieves the original image from your Amazon S3 bucket and uses Sharp (the open source image processing software) to return a modified version of the image to the API Gateway. SIH also utilizes Thumbor to apply dynamic filters on the fly. Additionally, the solution generates a CloudFront domain name that supports caching in CloudFront. The newly manipulated image is now cached at CloudFront for easy access and retrieval. The end-to-end request and response can be secured by using the solution’s signed URL feature via AWS Secrets Manager, which allows you to prevent unauthorized use of your proprietary images.

Lastly, SIH uses Amazon Rekognition for face detection in images submitted for smart cropping, allowing for easy cropping for specific content and image needs.

Code example of image manipulation

Please refer to the SIH implementation guide to quickly set up and use SIH. Using Node.js, you can create an image request as illustrated below. The code block specifies the image location as myImageBucket and specifies edits of grayscale :true to change the image to grayscale.

const imageRequest = JSON.stringify({
    bucket: “myImageBucket”,
    key: “myImage.jpg”,
    edits: {
        grayscale: true
    }
});

const url = `${CloudFrontUrl}/${Buffer.from(imageRequest).toString(‘base64’)}`;

With the generated URL, SIH can serve the grayscale image.

Conclusion

If you’re looking for a fast and cost-effective solution for image management, Serverless Image Handler provides a great way to manipulate and serve images on the fly with speed and security. Learn more about SIH and watch the accompanying Solving with AWS Solutions video below.

Field Notes: Restricting Amazon WorkSpaces Users to Run Amazon Athena Queries

Post Syndicated from Somdeb Bhattacharjee original https://aws.amazon.com/blogs/architecture/field-notes-restricting-amazon-workspaces-users-to-run-amazon-athena-queries/

One of the use cases we hear from customers is that they want to provide very limited access to Amazon Workspaces users (for example contractors, consultants) in an AWS account. At the same time they want to allow them to query Amazon Simple Storage Service (Amazon S3) data in another account using Amazon Athena over a JDBC connection.

For example, marketing companies might provide private access to the first party data to media agencies through this mechanism.

The restrictions they want to put in place are:

  • For security reasons these Amazon WorkSpaces should not have internet connectivity. So the access to Amazon Athena must be over AWS PrivateLink.
  • Public access to Athena is not allowed using the credentials used for the JDBC connection. This is to prevent the users from leveraging the credentials to query the data from anywhere else.

In this post, we show how to use Amazon Virtual Private Cloud (Amazon VPC) endpoints for Athena, along with AWS Identity and Access Management (AWS IAM) policies. This provides private access to query the Amazon S3 data while preventing users from querying the data from outside their Amazon WorkSpaces or using the Athena public endpoint.

Let’s review the steps to achieve this:

  • Initial setup of two AWS accounts (AccountA and AccountB)
  • Set up Amazon S3 bucket with sample data in AccountA
  • Set up an IAM user with Amazon S3 and Athena access in AccountA
  • Create an Amazon VPC endpoint for Athena in AccountA
  • Set up Amazon WorkSpaces for a user in AccountB
  • Install a SQL client tool (we will use DbVisualizer Free) and Athena JDBC driver in Amazon WorkSpaces in AccountB
  • Use DbVisualizer to the query the Amazon S3 data in AccountA using the Athena public endpoint
  • Update IAM policy for user in AccountA to restrict private only access

 Prerequisites

To follow the steps in this post, you need two AWS Accounts. The Amazon VPC and subnet requirements are specified in the detailed steps.

Note: The AWS CloudFormation template used in this blog post is for US-EAST-1 (N. Virginia) Region so ensure the Region setting for both the accounts are set to US-EAST-1 (N. Virginia).

Walkthrough

The two AWS accounts are:

AccountA – Contains the Amazon S3 bucket where the data is stored. For AccountA you can create a new Amazon VPC or use the default Amazon VPC.

AccountB – Amazon WorkSpaces account. Use the following AWS CloudFormation template for AccountB:

  • The AWS CloudFormation template will create a new Amazon VPC in AccountB with CIDR 10.10.0.0/16 and set up one public subnet and two private subnets.
  • It will also create a NAT Gateway in the public subnet and create both public and private route tables.
  • Since we will be launching Amazon WorkSpaces in these private subnets and not all Availability Zones (AZ) are supported by Amazon WorkSpaces, it is important to choose the right AZ when creating them.

Review the documentation to learn which AWS Regions/AZ are supported.

We have provided two parameters in the AWS CloudFormation template:

  • AZName1
  • AZName2

Step 1

Before launching the CloudFormation stack:

  • Log in to AccountB
  • Search for AWS Resource Access Manager
  • On the right-hand side, you will notice the AZ ID to AZ Name mapping. Note down the AZ Name corresponding to AZ ID use1-az2 and use1-az4
  • Now launch the CloudFormation template and remember to choose the AZ names you noted down earlier
    • https://athena-workspaces-blogpost.s3.amazonaws.com/vpc.yaml
  • Enter the CloudFormation Stack Name as – ‘AthenaWorkspaces’ and leave everything default.
  • Once the CloudFormation stack creation is complete, create a peering connection from AccountB to AccountA.
  • Update the associated route tables for the private subnets with the new peering connection.

For information on how to create a VPC peering connection, refer to AWS documentation on VPC Peering.

AccountB VPC Route Table:

AccountB VPC Route Table:

AccountA VPC Route Table:

AccountA VPC Route Table

Step 2

  • Create a new Amazon S3 bucket in AccountA with a bucket name that starts with ‘athena-’.
  • Next, you can download a sample file and upload it to the Amazon S3 bucket you just created.
  • Use the following statements to create AWS Glue database. Use an external table for the data in the Amazon S3 bucket so that you can query it from Athena.
  • Go to Athena console and define a new database:

CREATE DATABASE IF NOT EXISTS sampledb

Once the database is created, create a new table in sampledb (by selecting sampledb from the “Database” drop down menu). Replace the <<your bucket name>> with the bucket you just created:

CREATE EXTERNAL TABLE IF NOT EXISTS sampledb.amazon_reviews_tsv(
  marketplace string, 
  customer_id string, 
  review_id string, 
  product_id string, 
  product_parent string, 
  product_title string,
  product_category string,
  star_rating int, 
  helpful_votes int, 
  total_votes int, 
  vine string, 
  verified_purchase string, 
  review_headline string, 
  review_body string, 
  review_date string)
ROW FORMAT DELIMITED
  FIELDS TERMINATED BY '\t'
  ESCAPED BY '\\'
  LINES TERMINATED BY '\n'
LOCATION
  's3://<<your bucket name>>/'
TBLPROPERTIES ("skip.header.line.count"="1")


Step 3

  • In AccountA, create a new IAM user with programmatic access.
  • Save the access key and secret access key.
  • For the same user add an Inline Policy which allows the following actions:

IAM summary

{
    "Version": "2012-10-17",
    "Statement": [
        {
            "Sid": "AllowAthenaReadActions",
            "Effect": "Allow",
            "Action": [
                "athena:ListWorkGroups",
                "athena:ListDataCatalogs",
                "athena:GetExecutionEngine",
                "athena:GetExecutionEngines",
                "athena:GetNamespace",
                "athena:GetCatalogs",
                "athena:GetNamespaces",
                "athena:GetTables",
                "athena:GetTable"
            ],
            "Resource": "*"
        },
        {
            "Sid": "AllowAthenaWorkgroupActions",
            "Effect": "Allow",
            "Action": [
                "athena:StartQueryExecution",
                "athena:GetQueryResults",
                "athena:DeleteNamedQuery",
                "athena:GetNamedQuery",
                "athena:ListQueryExecutions",
                "athena:StopQueryExecution",
                "athena:GetQueryResultsStream",
                "athena:ListNamedQueries",
                "athena:CreateNamedQuery",
                "athena:GetQueryExecution",
                "athena:BatchGetNamedQuery",
                "athena:BatchGetQueryExecution",
                "athena:GetWorkGroup"
            ],
            "Resource": "*"
        },
        {
            "Sid": "AllowGlueActionsViaVPCE",
            "Effect": "Allow",
            "Action": [
                "glue:GetDatabase",
                "glue:GetDatabases",
                "glue:CreateDatabase",
                "glue:GetTables",
                "glue:GetTable"
            ],
            "Resource": "*"
        },
        {
            "Sid": "AllowGlueActionsViaAthena",
            "Effect": "Allow",
            "Action": [
                "glue:GetDatabase",
                "glue:GetDatabases",
                "glue:CreateDatabase",
                "glue:GetTables",
                "glue:GetTable"
            ],
            "Resource": "*"
        },
        {
            "Sid": "AllowS3ActionsViaAthena",
            "Effect": "Allow",
            "Action": [
                "s3:GetBucketLocation",
                "s3:GetObject",
                "s3:ListBucket",
                "s3:ListBucketMultipartUploads",
                "s3:ListMultipartUploadParts",
                "s3:AbortMultipartUpload",
                "s3:CreateBucket",
                "s3:PutObject"
            ],
            "Resource": [
                "arn:aws:s3:::athena-*"
            ]
        }
    ]
}


Step 4

  • In this step, we create an Interface VPC endpoint (AWS PrivateLink) for Athena in AccountA. When you use an interface VPC endpoint, communication between your Amazon VPC and Athena is conducted entirely within the AWS network.
  • Each VPC endpoint is represented by one or more Elastic Network Interfaces (ENIs) with private IP addresses in your VPC subnets.
  • To create an Interface VPC endpoint follow the instructions and select Athena in the AWS Services list. Do not select the checkbox for Enable Private DNS Name.
  • Ensure the security group that is attached to the Amazon VPC endpoint is open to inbound traffic on port 443 and 444 for source AccountB VPC CIDR 10.10.0.0/16. Port 444 is used by Athena to stream query results.
  • Once you create the VPC endpoint, you will get a DNS endpoint name which is in the following format. We are going to use this in JDBC connection from the SQL client.

      VPC_Endpoint_ID.athena.Region.vpce.amazonaws.com

Step 5

  • In this step we set up Amazon WorkSpaces in AccountB.
  • Each Amazon WorkSpace is associated with the specific Amazon VPC and AWS Directory Service construct that you used to create it. All Directory Service constructs (Simple AD, AD Connector, and Microsoft AD) require two subnets to operate, each in different Availability Zones. This is why we created 2 private subnets at the beginning.
  • For this blog post I have used Simple AD as the directory service for the Amazon WorkSpaces.
  • By default, IAM users don’t have permissions for Amazon WorkSpaces resources and operations.
  • To allow IAM users to manage Amazon WorkSpaces resources, you must create an IAM policy that explicitly grants them permissions
  • Then attach the policy to the IAM users or groups that require those permissions.
  • To start, go to the Amazon WorkSpaces console and select Advanced Setup.
    • Set up a new directory using the SimpleAD option.
    • Use the “small” directory size and choose the Amazon VPC and private subnets you created in Step 1 for AccountB.
    • Once you create the directory, register the directory with Amazon WorkSpaces by selecting “Register” from the “Action” menu.
    • Select private subnets you created in Step 1 for AccountB.

Directory info

  • Next, launch Amazon WorkSpaces by following the Launch WorkSpaces button.
  • Select the directory you created and create a new user.
  • For the bundle, choose Standard with Windows 10 (PCoIP).
  • After the Amazon WorkSpaces is created, you can log in to the Amazon WorkSpaces using a client software. You can download it from https://clients.amazonworkspaces.com/
  • Login to your Amazon WorkSpace, install a SQL Client of your choice. At this point your Amazon WorkSpace still has Internet access via the NAT Gateway
  • I have used DbVisualizer (the free version) as the SQL client. Once you have that installed, install the JDBC driver for Athena following the instructions
  • Now you can set up the JDBC connections to Athena using the access key and secret key you set up for an IAM user in AccountA.

Step 6

To test out both the Athena public endpoint and the Athena VPC endpoint, create two connections using the same credentials.

For the Athena public endpoint, you need to use athena.us-east-1.amazonaws.com service endpoint. (jdbc:awsathena://athena.us-east-1.amazonaws.com:443;S3OutputLocation=s3://<athena-bucket-name>/)

Athena public

For the VPC Endpoint Connection, use the VPC Endpoint you created in Step 4 (jdbc:awsathena://vpce-<>.athena.us-east-1.vpce.amazonaws.com:443;S3OutputLocation=s3://<athena-bucket-name>/)

Database connection Athena

Now run a simple query to select records from the amazon_reviews_tsv table using both the connections.

SELECT * FROM sampledb.amazon_reviews_tsv limit 10

You should be able to see results using both the connections. Since the private subnets are still connected to the internet via the NAT Gateway, you can query using the Athena public endpoint.

Run the AWS Command Line Interface (AWS CLI) command using the credentials used for the JDBC connection from your workstation. You should be able to access the Amazon S3 bucket objects and the Athena query run list using the following commands.

aws s3 ls s3://athena-workspaces-blogpost

aws athena list-query-executions

Step 7

  • Now we lock down the access as described in the beginning of this blog post by taking the following actions:
  • Update the route table for the private subnets by removing the route for the internet so access to the Athena public endpoint is restricted from the Amazon WorkSpaces. The only access will be allowed through the Athena VPC Endpoint.
  • Add conditional checks to the IAM user access policy that will restrict access to the Amazon S3 buckets and Athena only if:
    • The request came in through the VPC endpoint. For this we use the “aws:SourceVpce” check and provide the VPC Endpoint ID value.
    • The request for Amazon S3 data is through Athena. For this we use the condition “aws:CalledVia” and provide a value of “athena.amazonaws.com”.
  • In the IAM access policy below replace <<your vpce id>> with your VPC endpoint id and update the previous inline policy which was added to the IAM user in Step 3.
{
    "Version": "2012-10-17",
    "Statement": [
        {
            "Sid": "AllowAthenaReadActions",
            "Effect": "Allow",
            "Action": [
                "athena:ListWorkGroups",
                "athena:ListDataCatalogs",
                "athena:GetExecutionEngine",
                "athena:GetExecutionEngines",
                "athena:GetNamespace",
                "athena:GetCatalogs",
                "athena:GetNamespaces",
                "athena:GetTables",
                "athena:GetTable"
            ],
            "Resource": "*",
            "Condition":{
               "StringEquals":{
                  "aws:SourceVpce":[
                     "<<your vpce id>>"
                  ]
               }
            }
        },
        {
            "Sid": "AllowAthenaWorkgroupActions",
            "Effect": "Allow",
            "Action": [
                "athena:StartQueryExecution",
                "athena:GetQueryResults",
                "athena:DeleteNamedQuery",
                "athena:GetNamedQuery",
                "athena:ListQueryExecutions",
                "athena:StopQueryExecution",
                "athena:GetQueryResultsStream",
                "athena:ListNamedQueries",
                "athena:CreateNamedQuery",
                "athena:GetQueryExecution",
                "athena:BatchGetNamedQuery",
                "athena:BatchGetQueryExecution",
                "athena:GetWorkGroup"
            ],
            "Resource": "*",
            "Condition":{
               "StringEquals":{
                  "aws:SourceVpce":[
                     "<<your vpce id>>"
                  ]
               }
            }
        },
        {
            "Sid": "AllowGlueActionsViaVPCE",
            "Effect": "Allow",
            "Action": [
                "glue:GetDatabase",
                "glue:GetDatabases",
                "glue:CreateDatabase",
                "glue:GetTables",
                "glue:GetTable"
            ],
            "Resource": "*",
            "Condition":{
               "StringEquals":{
                  "aws:SourceVpce":[
                     "<<your vpce id>>"
                  ]
               }
            }
        },
        {
            "Sid": "AllowGlueActionsViaAthena",
            "Effect": "Allow",
            "Action": [
                "glue:GetDatabase",
                "glue:GetDatabases",
                "glue:CreateDatabase",
                "glue:GetTables",
                "glue:GetTable"
            ],
            "Resource": "*",
            "Condition":{
               "ForAnyValue:StringEquals":{
                  "aws:CalledVia":[
                     "athena.amazonaws.com"
                  ]
               }
            }
        },
        {
            "Sid": "AllowS3ActionsViaAthena",
            "Effect": "Allow",
            "Action": [
                "s3:GetBucketLocation",
                "s3:GetObject",
                "s3:ListBucket",
                "s3:ListBucketMultipartUploads",
                "s3:ListMultipartUploadParts",
                "s3:AbortMultipartUpload",
                "s3:CreateBucket",
                "s3:PutObject"
            ],
            "Resource": [
                "arn:aws:s3:::athena-*"
            ],
            "Condition":{
               "ForAnyValue:StringEquals":{
                  "aws:CalledVia":[
                     "athena.amazonaws.com"
                  ]
               }
            }
        }
    ]
}

Once you applied the changes, try to reconnect using both the Athena VPC endpoint as well Athena public endpoint connections. The Athena VPC endpoint connection should work but the public endpoint connection will time out. Also try the same Amazon S3 and Athena AWS CLI commands. You should get access denied for both the operations.

Clean Up

To avoid incurring costs, remember to delete the resources that you created.

For AWS AccountA:

  • Delete the S3 buckets
  • Delete the database you created in AWS Glue
  • Delete the Amazon VPC endpoint you created for Amazon Athena

For AccountB:

  • Delete the Amazon Workspace you created along with the Simple AD directory. You can review more information on how to delete your Workspaces.

Conclusion

In this blog post, I showed how to leverage Amazon VPC endpoints and IAM policies to privately connect to Amazon Athena from Amazon Workspaces that don’t have internet connectivity.

Give this solution a try and share your feedback in the comments!

Field Notes provides hands-on technical guidance from AWS Solutions Architects, consultants, and technical account managers, based on their experiences in the field solving real-world business problems for customers.

Architecture Monthly Magazine: Open Source

Post Syndicated from Annik Stahl original https://aws.amazon.com/blogs/architecture/aws-architecture-monthly-magazine-open-source/

Architecture Monthly Magazine - Open SourceAccording to the Open Source Initiative, the term “open source” was created at a strategy session held in 1998 in Palo Alto, California, shortly after the announcement of the release of the Netscape source code. Stakeholders at that session realized that this announcement created an opportunity to educate and advocate for the superiority of an open development process.

We’ve witnessed big changes in open source in the past 22 years and this year-end issue of Architecture Monthly looks at a few trends, including the shift from businesses only consuming open source to contributing to it. You’ll also going to learn how AWS open source projects are one of the ways we’re making technology less cost-prohibitive and more accessible to everyone.

In this month’s Open Source issue

  • Ask an Expert: Ricardo Sueiras, Principal Advocate for Open Source at AWS
  • Blog: How Amazon Retail Systems Run Machine Learning Predictions with Apache Spark using Deep Java Library
  • Case Study: Absa Transforms IT and Fosters Tech Talent Using AWS
  • Reference Architecture: Running WordPress on AWS
  • Blog: Simplifying Serverless Best Practices with Lambda Powertools
  • Whitepaper: Modernizing the Amazon Database Infrastructure: Migrating from Oracle to AWS
  • Quick Start: Magento on AWS
  • Related Videos: Wix, Viber, UC Santa Cruz, & Redfin

Download the magazine

How to access the magazine

We hope you’re enjoying Architecture Monthly, and we’d like to hear from you—leave us star rating and comment on the Amazon Kindle Newsstand page or contact us anytime at [email protected].

Snowflake: Running Millions of Simulation Tests with Amazon EKS

Post Syndicated from Keith Joelner original https://aws.amazon.com/blogs/architecture/snowflake-running-millions-of-simulation-tests-with-amazon-eks/

This post was co-written with Brian Nutt, Senior Software Engineer and Kao Makino, Principal Performance Engineer, both at Snowflake.

Transactional databases are a key component of any production system. Maintaining data integrity while rows are read and written at a massive scale is a major technical challenge for these types of databases. To ensure their stability, it’s necessary to test many different scenarios and configurations. Simulating as many of these as possible allows engineers to quickly catch defects and build resilience. But the Holy Grail is to accomplish this at scale and within a timeframe that allows your developers to iterate quickly.

Snowflake has been using and advancing FoundationDB (FDB), an open-source, ACID-compliant, distributed key-value store since 2014. FDB, running on Amazon Elastic Cloud Compute (EC2) and Amazon Elastic Block Storage (EBS), has proven to be extremely reliable and is a key part of Snowflake’s cloud services layer architecture. To support its development process of creating high quality and stable software, Snowflake developed Project Joshua, an internal system that leverages Amazon Elastic Kubernetes Service (EKS), Amazon Elastic Container Registry (ECR), Amazon EC2 Spot Instances, and AWS PrivateLink to run over one hundred thousand of validation and regression tests an hour.

About Snowflake

Snowflake is a single, integrated data platform delivered as a service. Built from the ground up for the cloud, Snowflake’s unique multi-cluster shared data architecture delivers the performance, scale, elasticity, and concurrency that today’s organizations require. It features storage, compute, and global services layers that are physically separated but logically integrated. Data workloads scale independently from one another, making it an ideal platform for data warehousing, data lakes, data engineering, data science, modern data sharing, and developing data applications.

Snowflake architecture

Developing a simulation-based testing and validation framework

Snowflake’s cloud services layer is composed of a collection of services that manage virtual warehouses, query optimization, and transactions. This layer relies on rich metadata stored in FDB.

Prior to the creation of the simulation framework, Project Joshua, FDB developers ran tests on their laptops and were limited by the number they could run. Additionally, there was a scheduled nightly job for running further tests.

Joshua at Snowflake

Amazon EKS as the foundation

Snowflake’s platform team decided to use Kubernetes to build Project Joshua. Their focus was on helping engineers run their workloads instead of spending cycles on the management of the control plane. They turned to Amazon EKS to achieve their scalability needs. This was a crucial success criterion for Project Joshua since at any point in time there could be hundreds of nodes running in the cluster. Snowflake utilizes the Kubernetes Cluster Autoscaler to dynamically scale worker nodes in minutes to support a tests-based queue of Joshua’s requests.

With the integration of Amazon EKS and Amazon Virtual Private Cloud (Amazon VPC), Snowflake is able to control access to the required resources. For example: the database that serves Joshua’s test queues is external to the EKS cluster. By using the Amazon VPC CNI plugin, each pod receives an IP address in the VPC and Snowflake can control access to the test queue via security groups.

To achieve its desired performance, Snowflake created its own custom pod scaler, which responds quicker to changes than using a custom metric for pod scheduling.
  • The agent scaler is responsible for monitoring a test queue in the coordination database (which, coincidentally, is also FDB) to schedule Joshua agents. The agent scaler communicates directly with Amazon EKS using the Kubernetes API to schedule tests in parallel.
  • Joshua agents (one agent per pod) are responsible for pulling tests from the test queue, executing, and reporting results. Tests are run one at a time within the EKS Cluster until the test queue is drained.

Achieving scale and cost savings with Amazon EC2 Spot

A Spot Fleet is a collection—or fleet—of Amazon EC2 Spot instances that Joshua uses to make the infrastructure more reliable and cost effective. ​ Spot Fleet is used to reduce the cost of worker nodes by running a variety of instance types.

With Spot Fleet, Snowflake requests a combination of different instance types to help ensure that demand gets fulfilled. These options make Fleet more tolerant of surges in demand for instance types. If a surge occurs it will not significantly affect tasks since Joshua is agnostic to the type of instance and can fall back to a different instance type and still be available.

For reservations, Snowflake uses the capacity-optimized allocation strategy to automatically launch Spot Instances into the most available pools by looking at real-time capacity data and predicting which are the most available. This helps Snowflake quickly switch instances reserved to what is most available in the Spot market, instead of spending time contending for the cheapest instances, at the cost of a potentially higher price.

Overcoming hurdles

Snowflake’s usage of a public container registry posed a scalability challenge. When starting hundreds of worker nodes, each node needs to pull images from the public registry. This can lead to a potential rate limiting issue when all outbound traffic goes through a NAT gateway.

For example, consider 1,000 nodes pulling a 10 GB image. Each pull request requires each node to download the image across the public internet. Some issues that need to be addressed are latency, reliability, and increased costs due to the additional time to download an image for each test. Also, container registries can become unavailable or may rate-limit download requests. Lastly, images are pulled through public internet and other services in the cluster can experience pulling issues.

​For anything more than a minimal workload, a local container registry is needed. If an image is first pulled from the public registry and then pushed to a local registry (cache), it only needs to pull once from the public registry, then all worker nodes benefit from a local pull. That’s why Snowflake decided to replicate images to ECR, a fully managed docker container registry, providing a reliable local registry to store images. Additional benefits for the local registry are that it’s not exclusive to Joshua; all platform components required for Snowflake clusters can be cached in the local ECR Registry. For additional security and performance Snowflake uses AWS PrivateLink to keep all network traffic from ECR to the workers nodes within the AWS network. It also resolved rate-limiting issues from pulling images from a public registry with unauthenticated requests, unblocking other cluster nodes from pulling critical images for operation.

Conclusion

Project Joshua allows Snowflake to enable developers to test more scenarios without having to worry about the management of the infrastructure. ​ Snowflake’s engineers can schedule thousands of test simulations and configurations to catch bugs faster. FDB is a key component of ​the Snowflake stack and Project Joshua helps make FDB more stable and resilient. Additionally, Amazon EC2 Spot has provided non-trivial cost savings to Snowflake vs. running on-demand or buying reserved instances.

If you want to know more about how Snowflake built its high performance data warehouse as a Service on AWS, watch the This is My Architecture video below.

Field Notes: Optimize your Java application for Amazon ECS with Quarkus

Post Syndicated from Sascha Moellering original https://aws.amazon.com/blogs/architecture/field-notes-optimize-your-java-application-for-amazon-ecs-with-quarkus/

In this blog post, I show you an interesting approach to implement a Java-based application and compile it to a native image using Quarkus. This native image is the main application, which is containerized, and runs in an Amazon Elastic Container Service and Amazon Elastic Kubernetes Service cluster on AWS Fargate.

Amazon ECS is a fully managed container orchestration service, Amazon EKS is a fully managed Kubernetes service, both services support Fargate to provide serverless compute for containers. Fargate removes the need to provision and manage servers, lets you specify and pay for resources per application, and improves security through application isolation by design. AWS Lambda is a serverless compute service that runs your code in response to events and automatically manages the underlying compute resources for you.

Quarkus is a Supersonic Subatomic Java framework that uses OpenJDK HotSpot as well as GraalVM and over fifty different libraries like RESTEasy, Vertx, Hibernate, and Netty. In a previous blog post, I demonstrated how GraalVM can be used to optimize the size of Docker images. GraalVM is an open source, high-performance polyglot virtual machine from Oracle. I use it to compile native images ahead of time to improve startup performance, and reduce the memory consumption and file size of Java Virtual Machine (JVM)-based applications. The framework that allows ahead-of-time-compilation (AOT) is called Substrate.

Application Architecture

First, review the GitHub repository containing the demo application.

Our application is a simple REST-based Create Read Update Delete (CRUD) service that implements basic user management functionalities. All data is persisted in an Amazon DynamoDB table. Quarkus offers an extension for Amazon DynamoDB that is based on AWS SDK for Java V2. This Quarkus extension supports two different programming models: blocking access and asynchronous programming. For local development, DynamoDB Local is also supported. DynamoDB Local is the downloadable version of DynamoDB that lets you write and test applications without accessing the DynamoDB service. Instead, the database is self-contained on your computer. When you are ready to deploy your application in production, you can make a few minor changes to the code so that it uses the DynamoDB service.

The REST-functionality is located in the class UserResource which uses the JAX-RS implementation RESTEasy. This class invokes the UserService that implements the functionalities to access a DynamoDB table with the AWS SDK for Java. All user-related information is stored in a Plain Old Java Object (POJO) called User.

Building the application

To create a Docker container image that can be used in the task definition of my ECS cluster, follow these three steps: build the application, create the Docker Container Image, and push the created image to my Docker image registry.

To build the application, I used Maven with different profiles. The first profile (default profile) uses a standard build to create an uber JAR – a self-contained application with all dependencies. This is very useful if you want to run local tests with your application, because the build time is much shorter compared to the native-image build. When you run the package command, it also execute all tests, which means you need DynamoDB Local running on your workstation.

$ docker run -p 8000:8000 amazon/dynamodb-local -jar DynamoDBLocal.jar -inMemory -sharedDb

$ mvn package

The second profile uses GraalVM to compile the application into a native image. In this case, you use the native image as base for a Docker container. The Dockerfile can be found under src/main/docker/Dockerfile.native and uses a build-pattern called multi-stage build.

$ mvn package -Pnative -Dquarkus.native.container-build=true

An interesting aspect of multi-stage builds is that you can use multiple FROM statements in your Dockerfile. Each FROM instruction can use a different base image, and begins a new stage of the build. You can pick the necessary files and copy them from one stage to another, thereby limiting the number of files you have to copy. Use this feature to build your application in one stage and copy your compiled artifact and additional files to your target image. In this case, you use ubi-quarkus-native-image:20.1.0-java11 as base image and copy the necessary TLS-files (SunEC library and the certificates) and point your application to the necessary files with JVM properties.

FROM quay.io/quarkus/ubi-quarkus-native-image:20.1.0-java11 as nativebuilder
RUN mkdir -p /tmp/ssl-libs/lib \
  && cp /opt/graalvm/lib/security/cacerts /tmp/ssl-libs \
  && cp /opt/graalvm/lib/libsunec.so /tmp/ssl-libs/lib/

FROM registry.access.redhat.com/ubi8/ubi-minimal
WORKDIR /work/
COPY target/*-runner /work/application
COPY --from=nativebuilder /tmp/ssl-libs/ /work/
RUN chmod 775 /work
EXPOSE 8080
CMD ["./application", "-Dquarkus.http.host=0.0.0.0", "-Djava.library.path=/work/lib", "-Djavax.net.ssl.trustStore=/work/cacerts"]

In the second and third steps, I have to build and push the Docker image to a Docker registry of my choice which is straight forward:

$ docker build -f src/main/docker/Dockerfile.native -t

$ docker push <repo/image:tag>

Setting up the infrastructure

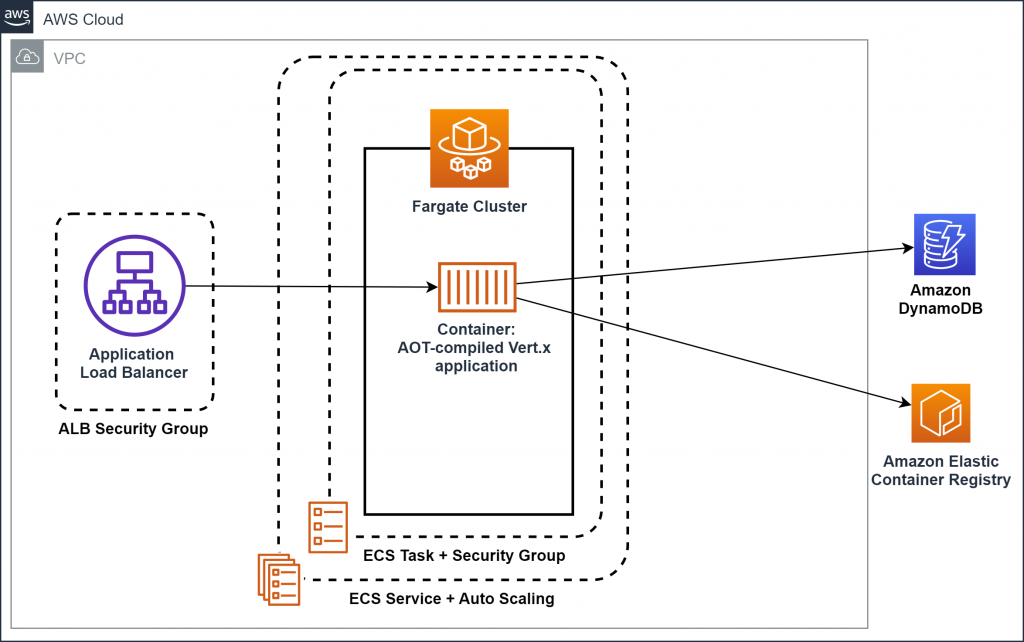
You’ve compiled the application to a native-image and have built a Docker image. Now, you set up the basic infrastructure consisting of an Amazon Virtual Private Cloud (VPC), an Amazon ECS or Amazon EKS cluster with on AWS Fargate launch type, an Amazon DynamoDB table, and an Application Load Balancer.

Figure 1: Architecture of the infrastructure (for Amazon ECS)

Figure 1: Architecture of the infrastructure (for Amazon ECS)

Codifying your infrastructure allows you to treat your infrastructure just as code. In this case, you use the AWS Cloud Development Kit (AWS CDK), an open source software development framework, to model and provision your cloud application resources using familiar programming languages. The code for the CDK application can be found in the demo application’s code repository under eks_cdk/lib/ecs_cdk-stack.ts or ecs_cdk/lib/ecs_cdk-stack.ts. Set up the infrastructure in the AWS Region us-east-1:

$ npm install -g aws-cdk // Install the CDK
$ cd ecs_cdk
$ npm install // retrieves dependencies for the CDK stack
$ npm run build // compiles the TypeScript files to JavaScript
$ cdk deploy  // Deploys the CloudFormation stack

The output of the AWS CloudFormation stack is the load balancer’s DNS record. The heart of our infrastructure is an Amazon ECS or Amazon EKS cluster with AWS Fargate launch type. The Amazon ECS cluster is set up as follows:

const cluster = new ecs.Cluster(this, "quarkus-demo-cluster", {
      vpc: vpc
    });
    
    const logging = new ecs.AwsLogDriver({
      streamPrefix: "quarkus-demo"
    })

    const taskRole = new iam.Role(this, 'quarkus-demo-taskRole', {
      roleName: 'quarkus-demo-taskRole',
      assumedBy: new iam.ServicePrincipal('ecs-tasks.amazonaws.com')
    });
    
    const taskDef = new ecs.FargateTaskDefinition(this, "quarkus-demo-taskdef", {
      taskRole: taskRole
    });
    
    const container = taskDef.addContainer('quarkus-demo-web', {
      image: ecs.ContainerImage.fromRegistry("<repo/image:tag>"),
      memoryLimitMiB: 256,
      cpu: 256,
      logging
    });
    
    container.addPortMappings({
      containerPort: 8080,
      hostPort: 8080,
      protocol: ecs.Protocol.TCP
    });

    const fargateService = new ecs_patterns.ApplicationLoadBalancedFargateService(this, "quarkus-demo-service", {
      cluster: cluster,
      taskDefinition: taskDef,
      publicLoadBalancer: true,
      desiredCount: 3,
      listenerPort: 8080
    });

Cleaning up

After you are finished, you can easily destroy all of these resources with a single command to save costs.

$ cdk destroy

Conclusion

In this post, I described how Java applications can be implemented using Quarkus, compiled to a native-image, and ran using Amazon ECS or Amazon EKS on AWS Fargate. I also showed how AWS CDK can be used to set up the basic infrastructure. I hope I’ve given you some ideas on how you can optimize your existing Java application to reduce startup time and memory consumption. Feel free to submit enhancements to the sample template in the source repository or provide feedback in the comments.

We also encourage you to explore how you to optimize your Java application for AWS Lambda with Quarkus.

Field Notes provides hands-on technical guidance from AWS Solutions Architects, consultants, and technical account managers, based on their experiences in the field solving real-world business problems for customers.

The Satellite Ear Tag that is Changing Cattle Management

Post Syndicated from Karen Hildebrand original https://aws.amazon.com/blogs/architecture/the-satellite-ear-tag-that-is-changing-cattle-management/

Most cattle are not raised in cities—they live on cattle stations, large open plains, and tracts of land largely unpopulated by humans. It’s hard to keep connected with the herd. Cattle don’t often carry their own mobile phones, and they don’t pay a mobile phone bill. Naturally, the areas in which cattle live, often do not have cellular connectivity or reception. But they now have one way to stay connected: a world-first satellite ear tag.

Ceres Tag co-founders Melita Smith and David Smith recognized the problem given their own farming background. David explained that they needed to know simple things to begin with, such as:

  • Where are they?
  • How many are out there?
  • What are they doing?
  • What condition are they in?
  • Are they OK?

Later, the questions advanced to:

  • Which are the higher performing animals that I want to keep?
  • Where do I start when rounding them up?
  • As assets, can I get better financing and insurance if I can prove their location, existence, and condition?

To answer these questions, Ceres Tag first had to solve the biggest challenge, and it was not to get cattle to carry their mobile phones and pay mobile phone bills to generate the revenue needed to get greater coverage. David and Melita knew they needed help developing a new method of tracking, but in a way that aligned with current livestock practices. Their idea of a satellite connected ear tag came to life through close partnership and collaboration with CSIRO, Australia’s national science agency. They brought expertise to the problem, and rallied together teams of experts across public and private partnerships, never accepting “that’s not been done before” as a reason to curtail their innovation.


Figure 1: How Ceres Tag works in practice

Thinking Big: Ceres Tag Protocol

Melita and David constructed their idea and brought the physical hardware to reality. This meant finding strategic partners to build hardware, connectivity partners that provided global coverage at a cost that was tenable to cattle operators, integrations with existing herd management platforms and a global infrastructure backbone that allowed their solution to scale. They showed resilience, tenacity and persistence that are often traits attributed to startup founders and lifelong agricultural advocates. Explaining the purpose of the product often requires some unique approaches to defining the value proposition while fundamentally breaking down existing ways of thinking about things. As David explained, “We have an internal saying, ‘As per Ceres Tag protocol …..’ to help people to see the problem through a new lens.” This persistence led to the creation of an easy to use ear tagging applicator and a two-prong smart ear tag. The ear tag connects via satellite for data transmission, providing connectivity to more than 120 countries in the world and 80% of the earth’s surface.

The Ceres Tag applicator, smart tag, and global satellite connectivity

Figure 2: The Ceres Tag applicator, smart tag, and global satellite connectivity

Unlocking the blocker: data-driven insights

With the hardware and connectivity challenges solved, Ceres Tag turned to how the data driven insights would be delivered. The company needed to select a technology partner that understood their global customer base, and what it means to deliver a low latency solution for web, mobile and API-driven solutions. David, once again knew the power in leveraging the team around him to find the best solution. The evaluation of cloud providers was led by Lewis Frost, COO, and Heidi Perrett, Data Platform Manager. Ceres Tag ultimately chose to partner with AWS and use the AWS Cloud as the backbone for the Ceres Tag Management System.

Ceres Tag conceptual diagram

Figure 3: Ceres Tag conceptual diagram

The Ceres Tag Management System houses the data and metadata about each tag, enabling the traceability of that tag throughout each animal’s life cycle. This includes verification as to whom should have access to their health records and history. Based on the nature of the data being stored and transmitted, security of the application is critical. As a startup, it was important for Ceres Tag to keep costs low, but to also to be able to scale based on growth and usage as it expands globally.

Ceres Tag is able to quickly respond to customers regardless of geography, routing traffic to the appropriate end point. They accomplish this by leveraging Amazon CloudFront as the Content Delivery Network (CDN) for traffic distribution of front-end requests and Amazon Route 53 for DNS routing. A multi-Availability Zone deployment and AWS Application Load Balancer distribute incoming traffic across multiple targets, increasing the availability of your application.

Ceres Tag is using AWS Fargate to provide a serverless compute environment that matches the pay-as-you-go usage-based model. AWS also provides many advanced security features and architecture guidance that has helped to implement and evaluate best practice security posture across all of the environments. Authentication is handled by Amazon Cognito, which allows Ceres Tag to scale easily by supporting millions of users. It leverages easy-to-use features like sign-in with social identity providers, such as Facebook, Google, and Amazon, and enterprise identity providers via SAML 2.0.

The data captured from the ear tag on the cattle is will be ingested via AWS PrivateLink. By providing a private endpoint to access your services, AWS PrivateLink ensures your traffic is not exposed to the public internet. It also makes it easy to connect services across different accounts and VPCs to significantly simplify your network architecture. In leveraging a satellite connectivity provider running on AWS, Ceres Tag will benefit from the AWS Ground Station infrastructure leveraged by the provider in addition to the streaming IoT database.


How Netflix Scales its API with GraphQL Federation (Part 1)

Post Syndicated from Netflix Technology Blog original https://netflixtechblog.com/how-netflix-scales-its-api-with-graphql-federation-part-1-ae3557c187e2

Netflix is known for its loosely coupled and highly scalable microservice architecture. Independent services allow for evolving at different paces and scaling independently. Yet they add complexity for use cases that span multiple services. Rather than exposing 100s of microservices to UI developers, Netflix offers a unified API aggregation layer at the edge.

UI developers love the simplicity of working with one conceptual API for a large domain. Back-end developers love the decoupling and resilience offered by the API layer. But as our business has scaled, our ability to innovate rapidly has approached an invisible asymptote. As we’ve grown the number of developers and increased our domain complexity, developing the API aggregation layer has become increasingly harder.

In order to address this rising problem, we’ve developed a federated GraphQL platform to power the API layer. This solves many of the consistency and development velocity challenges with minimal tradeoffs on dimensions like scalability and operability. We’ve successfully deployed this approach for Netflix’s studio ecosystem and are exploring patterns and adaptations that could work in other domains. We’re sharing our story to inspire others and encourage conversations around applicability elsewhere.

Case Study: Studio Edge

Intro to Studio Ecosystem

Netflix is producing original content at an accelerated pace. From the time a TV show or a movie is pitched to when it’s available on Netflix, a lot happens behind the scenes. This includes but is not limited to talent scouting and casting, deal and contract negotiations, production and post-production, visual effects and animations, subtitling and dubbing, and much more. Studio Engineering is building hundreds of applications and tools that power these workflows.

Netflix Studio Content Lifecycle
Content Lifecycle

Studio API

Looking back to a few years ago, one of the pains in the studio space was the growing complexity of the data and its relationships. The workflows depicted above are inherently connected but the data and its relationships were disparate and existed in myriads of microservices. The product teams solved for this with two architectural patterns.

1) Single-use aggregation layers — Due to the loose coupling, we observed that many teams spent considerable effort building duplicative data-fetching code and aggregation layers to support their product needs. This was either done by UI teams via BFF (Backend For Frontend) or by a backend team in a mid-tier service.

2) Materialized views for data from other teams — some teams used a pattern of building a materialized view of another service’s data for their specific system needs. Materialized views had performance benefits, but data consistency lagged by varying degrees. This was not acceptable for the most important workflows in the Studio. Inconsistent data across different Studio applications was the top support issue in Studio Engineering in 2018.

Graph API: To better address the underlying needs, our team started building a curated graph API called “Studio API”. Its goal was to provide an unified abstraction on top of data and relationships. Studio API used GraphQL as its underlying API technology and created significant leverage for accessing core shared data. Consumers of Studio API were able to explore the graph and build new features more quickly. We also observed fewer instances of data inconsistency across different UI applications, as every field in GraphQL resolves to a single piece of data-fetching code.

Studio API Graph
Studio API Graph
Studio API Architecture Diagram
Studio API Architecture

Bottlenecks of Studio API

The One Graph exposed by Studio API was a runaway success; product teams loved the reusability and easy, consistent data access. But new bottlenecks emerged as the number of consumers and amount of data in the graph increased.

First, the Studio API team was disconnected from the domain expertise and the product needs, which negatively impacted the schema’s health. Second, connecting new elements from a back-end into the graph API was manual and ran counter to the rapid evolution promised by a microservice architecture. Finally, it was hard for one small team to handle the increasing operational and support burden for the expanding graph.

We knew that there had to be a better way — unified but decoupled, curated but fast moving.

Returning to Core Principles

To address these bottlenecks, we leaned into our rich history of microservices and breaking monoliths apart. We still wanted to keep the unified GraphQL schema of Studio API but decentralize the implementation of the resolvers to their respective domain teams.

As we were brainstorming the new architecture back in early 2019, Apollo released the GraphQL Federation Specification. This promised the benefits of a unified schema with distributed ownership and implementation. We ran a test implementation of the spec with promising results, and reached out to collaborate with Apollo on the future of GraphQL Federation. Our next generation architecture, “Studio Edge”, emerged with federation as a critical element.

GraphQL Federation Primer

The goal of GraphQL Federation is two-fold: provide a unified API for consumers while also giving backend developers flexibility and service isolation. To achieve this, schemas need to be created and annotated to indicate how ownership is distributed. Let’s look at an example with three core entities:

  1. Movie: At Netflix, we make titles (shows, films, shorts etc.). For simplicity, let’s assume each title is a Movie object.
  2. Production: Each Movie is associated with a Studio Production. A Production object tracks everything needed to make a Movie including shooting location, vendors, and more.
  3. Talent: the people working on a Movie are the Talent, including actors, directors, and so on.

These three domains are owned by three separate engineering teams responsible for their own data sources, business logic, and corresponding microservices. In an unfederated implementation, we would have this simple Schema and Resolvers owned and implemented by the Studio API team. The GraphQL Framework would take in queries from clients and orchestrate the calls to the resolvers in a breadth-first traversal.

Schemas & Resolvers for Studio API
Schema & Resolvers for Studio API

To transition to a federated architecture, we need to transfer ownership of these resolvers to their respective domains without sacrificing the unified schema. To achieve this, we need to extend the Movie type across GraphQL service boundaries:

Federating the movie type
Federating Movie

This ability to extend a Movie type across GraphQL service boundaries makes Movie a Federated Type. Resolving a given field requires delegation by a gateway layer down to the owning domain services.

Studio Edge Architecture

Using the ability to federate a type, we envisioned the following architecture:

Studio Edge Architecture Diagram
Studio Edge Architecture

Key Architectural Components

Domain Graph Service (DGS) is a standalone spec-compliant GraphQL service. Developers define their own federated GraphQL schema in a DGS. A DGS is owned and operated by a domain team responsible for that subsection of the API. A DGS developer has the freedom to decide if they want to convert their existing microservice to a DGS or spin up a brand new service.

Schema Registry is a stateful component that stores all the schemas and schema changes for every DGS. It exposes CRUD APIs for schemas, which are used by developer tools and CI/CD pipelines. It is responsible for schema validation, both for the individual DGS schemas and for the combined schema. Last, the registry composes together the unified schema and provides it to the gateway.

GraphQL Gateway is primarily responsible for serving GraphQL queries to the consumers. It takes a query from a client, breaks it into smaller sub-queries (a query plan), and executes that plan by proxying calls to the appropriate downstream DGSs.

Implementation Details

There are 3 main business logic components that power GraphQL Federation.

Schema Composition

Composition is the phase that takes all of the federated DGS schemas and aggregates them into a single unified schema. This composed schema is exposed by the Gateway to the consumers of the graph.

Schema Composition Phases

Whenever a new schema is pushed by a DGS, the Schema Registry validates that:

  1. New schema is a valid GraphQL schema
  2. New schema composes seamlessly with the rest of the DGSs schemas to create a valid composed schema
  3. New schema is backwards compatible

If all of the above conditions are met, then the schema is checked into the Schema Registry.

Query Planning and Execution

The federation config consists of all the individual DGS schemas and the composed schema. The Gateway uses the federation config and the client query to generate a query plan. The query plan breaks down the client query into smaller sub-queries that are then sent to the downstream DGSs for execution, along with an execution ordering that includes what needs to be done in sequence versus run in parallel.

Query Plan Inputs
Query Plan Inputs

Let’s build a simple query from the schema referenced above and see what the query plan might look like.

Simplified Query Plan
Simplified Query Plan

For this query, the gateway knows which fields are owned by which DGS based on the federation config. Using that information, it breaks the client query into three separate queries to three DGSs. The first query is sent to Movie DGS since the root field movies is owned by that DGS. This results in retrieving the movieId and title fields for the first 10 movies in the dataset. Then using the movieIds it got from the previous request, the gateway executes two parallel requests to Production DGS and Talent DGS to fetch the production and actors fields for those 10 movies. Upon completion, the sub-query responses are merged together and the combined data response is returned to the caller.

A note on performance: Query Planning and Execution adds a ~10ms overhead in the worst case. This includes the compute for building the query plan, as well as the deserialization of DGS responses and the serialization of merged gateway response.

Entity Resolver

Now you might be wondering, how do the parallel sub-queries to Production and Talent DGS actually work? That’s not something that the DGS supports. This is the final piece of the puzzle.

Let’s go back to our federated type Movie. In order for the gateway to join Movie seamlessly across DGSs, all the DGSs that define and extend the Movie need to agree on one or more fields that define the primary key (e.g. movieId). To make this work, Apollo introduced the @key directive in the Federation Spec. Second, DGSs have to implement a resolver for a generic Query field, _entities. The _entities query returns a union type of all the federated types in that DGS. The gateway uses the _entities query to look up Movie by movieId.

Let’s take a look at how the query plan actually looks like

Detailed federated query plan
Detailed Federated Query Plan

The representation object consists of the movieId and is generated from the response of the first request to Movie DGS. Since we requested for the first 10 movies, we would have 10 representation objects to send to Production and Talent DGS.

This is similar to Relay’s Object Identification with a few differences. _Entity is a union type, while Relay’s Node is an interface. Also, with @key, there is support for variable key names and types as well as composite keys while in Relay, the id is a single opaque ID field.

Combined together, these are the ingredients that power the core of a federated API architecture.

The Journey, Summarized

Our Studio Ecosystem architecture has evolved in distinct phases, all motivated by reducing the time between idea and implementation, improving the developer experience, and streamlining operations. The architectural phases look like:

Evolution of an API Architecture

Stay Tuned

Over the past year we’ve implemented the federated API architecture components in our Studio Edge. Getting here required rapid iteration, lots of cross-functional collaborations, a few pivots, and ongoing investment. We’re live with 70 DGSes and hundreds of developers contributing to and using the Studio Edge architecture. In our next Netflix Tech Blog post, we’ll share what we learned along the way, including the cross-cutting concerns necessary to build a holistic solution.

We want to thank the entire GraphQL open-source community for all the generous contributions and paving the path towards the promise of GraphQL. If you’d like to be a part of solving complex and interesting problems like this at Netflix scale, check out our jobs page or reach out to us directly.

By Tejas Shikhare

Additional Credits: Stephen Spalding, Jennifer Shin, Philip Fisher-Ogden, Robert Reta, Antoine Boyer, Bruce Wang, David Simmer


How Netflix Scales its API with GraphQL Federation (Part 1) was originally published in Netflix TechBlog on Medium, where people are continuing the conversation by highlighting and responding to this story.

Field Notes: How to Identify and Block Fake Crawler Bots Using AWS WAF

Post Syndicated from Vijay Menon original https://aws.amazon.com/blogs/architecture/field-notes-how-to-identify-and-block-fake-crawler-bots-using-aws-waf/

In this blog post, we focus on how to identify fake bots using these AWS services: AWS WAF, Amazon Kinesis Data Firehose, Amazon S3 and AWS Lambda. We use fake Google/Bing bots to demonstrate, but the principles can be applied to other popular crawlers like Slurp Bot from Yahoo, DuckDuckBot from DuckDuckGo, Alexa crawler from Alexa internet ranking service.

For industries like media, online retailors, news or social websites, content is critical and often sets them apart from other competitors. These companies put in a significant amount of effort to make the content as visible and accessible as possible. To do that these companies rely on crawler bots, so that legitimate users searching for content can find the content easily. Crawler bots are useful for indexing the site pages and helping make the content more searchable and improve rankings.

However, this capability can be misused. So it is important to distinguish between genuine crawler bots and fake ones that are doing more than just indexing your site. It’s important to properly identify good and bad actors so that you can stop the bad ones without impacting the ability of good ones, and at scale. This helps in driving more traffic, visitors, and more revenue from your websites.

Identifying bots

There are two primary sources of information required to identify a fake bot:

  • HTTP Header User-Agent: Fake bots try to present themselves as real bots, for example as Google or Bing, by using the same user agent string used by Google or Bing.
  • IP Address: You can look at the source IP address of the incoming request and determine if it belongs to the search engine provider network like Google or Bing. You can do this by performing a forward and reverse look up and comparing the results. These methods are well documented by the search engine providers Google and Bing.

Solution Overview

The solution leverages the capabilities of AWS WAF. Our demonstration application is a static website hosted on Amazon S3 fronted by Amazon CloudFront. This means that we can provide permission of access to the S3 bucket only to CloudFront using origin access identity.

The logs are streamed in near real time using Amazon Kinesis Data Firehose, inspected using a Lambda function to help identify fake bots before storing the logs on Amazon S3. The Lambda function does two things:

  1. Inspect the traffic using the rules to identify bad or fake bots. In this case it uses forward and reverse DNS lookup results of the Client IP address of packets with User-Agent string resembling GoogleBot or BingBot.
  2. Once identified as a fake bot, the Lambda function updates AWS WAF IP-Set to permanently block the requests coming from IP addresses of fake bots.

Note: For the sake of this demonstration, we are using a static website hosted on Amazon S3 with CloudFront. This requires the AWS WAF and IP-Set used by AWS WAF to be of scope ‘CLOUDFRONT’. You can modify it to use scope ‘REGIONAL’ if you chose to protect your web properties behind Application Load Balancer or API Gateway.

Solution Architecture

WAF Solution Architecture

Prerequisites

Readers of this blog post should be familiar with HTTP and the following AWS services:

For this walkthrough, you should have the following:

  • AWS Account
  • AWS Command Line Interface (AWS CLI): You need AWS CLI installed and configured on the workstation from where you are going to try the steps mentioned below.
  • Credentials configured in AWS CLI should have the required IAM permissions to spin up and modify the resources mentioned in this post.
  • Make sure that you deploy the solution to us-east-1 Region and your AWS CLI default Region is us-east-1. If us-east-1 is not the default Region, reference the Regions explicitly while executing AWS CLI commands using --region us-east-1 switch.
  • Amazon S3 bucket in us-east-1 region

Walkthrough

1.     Create an Amazon S3 static Website and put it behind an Amazon CloudFront distribution. You can follow these steps. Note down the CloudFront distribution ID. We will use it in subsequent steps.

2.     Download and unzip the file containing CloudFormation template and lambda function code from here to a folder in your local workstation. You will need to run all of the subsequent commands from this folder.

3.     Zip the lambda function lambda_function.py and upload it to an Amazon S3 bucket of your choice in us-east-1. Note the bucket name as it will be used in the subsequent steps. The blog uses waf-logs-fake-bots-us-east-1 for reference as the S3 bucket name.

$ zip lambda_function.py lambda_function.py.zip
$ aws s3 cp lambda_function.py.zip s3://waf-logs-fake-bots-us-east-1/

4.     Create the resources required for this blog post by deploying the AWS CloudFormation template and running the below command:

aws cloudformation create-stack \
--stack-name FakeBotBlockBlog \
--template-body file://BotBlog.yml \
--parameters ParameterKey=KinesisBufferIntervalSeconds,ParameterValue=900 ParameterKey=KinesisBufferSizeMB,ParameterValue=3 ParameterKey=IPSetName,ParameterValue=BlockFakeBotIPSet ParameterKey=IPSetScope,ParameterValue=CLOUDFRONT ParameterKey=S3BucketWithDeploymentPackage,ParameterValue=waf-logs-fake-bots-us-east-1 ParameterKey=DeploymentPackageZippedFilename,ParameterValue=lambda_function.py.zip \
--capabilities CAPABILITY_IAM \
--region us-east-1

You need to provide the following information, and you can change the parameters based on your specific needs:

a.     KinesisBufferIntervalSeconds and KinesisBufferSizeMB. These will define the interval at which Kinesis Firehose ships the logs to Amazon S3, the Default is 900 seconds and 3MB respectively, whichever is met first.

b.     IPSetName. Name of the IP Set which will be used to record the client IP address of fake bots. Default value is BlockFakeBotIPSet.

c.     IPSetScope. Scope of the IP Set. I am using CLOUDFRONT and associate it with the CloudFront distribution created in step 1. You can choose to make it REGIONAL in which case WebACLassociation will need to be with an ALB or an API Gateway.

d.     S3BucketWithDeploymentPackage. Name of S3 bucket used in step 3. The blog assumes waf-logs-fake-bots-us-east-1.

e.     DeploymentPackageZipedFilename. Lambda function filename without the file extension. For example, the blog assumes lambda_function.py.zip is available on the Amazon S3 bucket and uses this value for this parameter.

Some stack templates might include resources that can affect permissions in your AWS account, for example, by creating new AWS Identity and Access Management (IAM) role. For those stacks, you must explicitly acknowledge this by specifying CAPABILITY_IAM or CAPABILITY_NAMED_IAM value for the –capabilities parameter.

Stack creation will take you approximately 5-7 minutes. Check the status of the stack by executing the below command every few minutes. You should see StackStatus value as CREATE_COMPLETE.

Example:

aws cloudformation describe-stacks --stack-name FakeBotBlockBlog | grep StackStatus

The CloudFormation template will create the following resources:

  • IP Set for AWS WAF
  • WebACL with rules to block the client IP addresses of fake bots, and an AWS-managed common rule set.
  • Lambda function to help detect fake bots and modify the AWS WAF IP Set to block them
  • Kinesis Firehose delivery stream, which will use the above Lambda function for processing
  • IAM roles with required permissions for the Lambda function and Kinesis Firehose
  • S3 bucket for AWS WAF logs

5.     Enable logging for the WebACL using AWS CLI. For this you need the ARN of the WebACL and Kinesis Firehose. You can find that information from the output of the CloudFormation stack created in step 4 using the below AWS CLI command

aws cloudformation describe-stacks --stack-name FakeBotBlockBlog

Please note the 2 ARNs and run the following commands by replacing (1) ResourceArn value with WebACL ARN and (2) LogDestinationConfigs value with Kinesis Firehose delivery stream ARN.

Example:

aws wafv2 put-logging-configuration –-logging-configuration ResourceArn=arn:aws:wafv2:us-east-1:123456789012:global/webacl/FakeBotWebACL/259ea98f-24ba-4acd-8803-3e7d02e8d482,LogDestinationConfigs=arn:aws:firehose:us-east-1:123456789012:deliverystream/aws-waf-logs-FakeBotBlockBlog --region us-east-1

6.     Associate CloudFront distribution with this WebACL: Sign in to the AWS Management Console and open the AWS WAF and Shield console at https://console.aws.amazon.com/wafv2/homev2/web-acls?region=global .

  • Click on the WebACL created earlier in this procedure
  • Navigate to ‘Associated AWS resources’ tab and select Add AWS resources
  • In the subsequent screen, select the CloudFront distribution created in step 1
  • Select Add

Note: If you are using an ALB or API Gateway for your web property, then you need to use REGIONAL WebACL and IP Set.  Review the procedure to associate an ALB or API Gateway to the WebACL.

You can monitor WebACL performance from the Overview section of WebACL from the AWS WAF and Shield console.

Testing

To test, you will need to generate some traffic which will trigger the lambda function to detect and block the fake bots created earlier in this blog. The web traffic can be generated from the local machine or from an EC2 instance with access to the internet using curl. Manually set the user agent to resemble Googlebot by running the following command from shell:

Replace http://www.awsdemodesign.com/ with the URL of your CloudFront distribution you created in step 1 of the walkthrough.

for i in {1..1000}; do curl -I -A "Mozilla/5.0 (compatible; Googlebot/2.1; +http://www.google.com/bot.html)" http://www.awsdemodesign.com/; done

Initially you will see HTTP1.1/ 200 OK response. This will trigger Lambda and modify the IP Set to include your public IP address to be blocked. You can verify that by inspecting the IP set from AWS WAF and Shield console.

  • Sign in to the AWS Management Console and open the AWS WAF and Shield console
  • Click on IP Set created earlier in this blog. In the subsequent screen you can see your public IP address in the list of IP addresses.

If you run the curl command again, you will see that the response now is HTTP/1.1 403 Forbidden.

Clean Up

  • Disassociate the CloudFront Distribution from WebACL
  • Delete the S3 bucket and CloudFront Distribution created in Step 1
  • Empty and delete the S3 bucket created by the CloudFormation stack for AWS WAF logs.
  • Delete CloudFormation stack created in Step 4.

Conclusion

In this blog post, we demonstrated how you can set up and inspect incoming web traffic using AWS Lambda, AWS WAF native logging capabilities, and Kinesis Firehose to help detect and block bad or fake bots at scale. Furthermore, the solution outlined in this post provides a framework which can be extended to identify similar unwanted traffic impersonating as other good bots.

Field Notes provides hands-on technical guidance from AWS Solutions Architects, consultants, and technical account managers, based on their experiences in the field solving real-world business problems for customers.


Architecting for Reliable Scalability

Post Syndicated from Marwan Al Shawi original https://aws.amazon.com/blogs/architecture/architecting-for-reliable-scalability/

Cloud solutions architects should ideally “build today with tomorrow in mind,” meaning their solutions need to cater to current scale requirements as well as the anticipated growth of the solution. This growth can be either the organic growth of a solution or it could be related to a merger and acquisition type of scenario, where its size is increased dramatically within a short period of time.

Still, when a solution scales, many architects experience added complexity to the overall architecture in terms of its manageability, performance, security, etc. By architecting your solution or application to scale reliably, you can avoid the introduction of additional complexity, degraded performance, or reduced security as a result of scaling.

Generally, a solution or service’s reliability is influenced by its up time, performance, security, manageability, etc. In order to achieve reliability in the context of scale, take into consideration the following primary design principals.

Modularity

Modularity aims to break a complex component or solution into smaller parts that are less complicated and easier to scale, secure, and manage.

Monolithic architecture vs. modular architecture

Figure 1: Monolithic architecture vs. modular architecture

Modular design is commonly used in modern application developments. where an application’s software is constructed of multiple and loosely coupled building blocks (functions). These functions collectively integrate through pre-defined common interfaces or APIs to form the desired application functionality (commonly referred to as microservices architecture).


Scalable modular applications

Figure 2: Scalable modular applications

For more details about building highly scalable and reliable workloads using a microservices architecture, refer to Design Your Workload Service Architecture.

This design principle can also be applied to different components of the solution’s architecture. For example, when building a cloud solution on a single Amazon VPC, it may reach certain scaling limits and make it harder to introduce changes at scale due to the higher level of dependencies. This single complex VPC can be divided into multiple smaller and simpler VPCs. The architecture based on multiple VPCs can vary. For example, the VPCs can be divided based on a service or application building block, a specific function of the application, or on organizational functions like a VPC for various departments. This principle can also be leveraged at a regional level for very high scale global architectures. You can make the architecture modular at a global level by distributing the multiple VPCs across different AWS Regions to achieve global scale (facilitated by AWS Global Infrastructure).

In addition, modularity promotes separation of concerns by having well-defined boundaries among the different components of the architecture. As a result, each component can be managed, secured, and scaled independently. Also, it helps you avoid what is commonly known as “fate sharing,” where a vertically scaled server hosts a monolithic application, and any failure to this server will impact the entire application.

Horizontal scaling

Horizontal scaling, commonly referred to as scale-out, is the capability to automatically add systems/instances in a distributed manner in order to handle an increase in load. Examples of this increase in load could be the increase of number of sessions to a web application. With horizontal scaling, the load is distributed across multiple instances. By distributing these instances across Availability Zones, horizontal scaling not only increases performance, but also improves the overall reliability.

In order for the application to work seamlessly in a scale-out distributed manner, the application needs to be designed to support a stateless scaling model, where the application’s state information is stored and requested independently from the application’s instances. This makes the on-demand horizontal scaling easier to achieve and manage.

This principle can be complemented with a modularity design principle, in which the scaling model can be applied to certain component(s) or microservice(s) of the application stack. For example, only scale-out Amazon Elastic Cloud Compute (EC2) front-end web instances that reside behind an Elastic Load Balancing (ELB) layer with auto-scaling groups. In contrast, this elastic horizontal scalability might be very difficult to achieve for a monolithic type of application.

Leverage the content delivery network

Leveraging Amazon CloudFront and its edge locations as part of the solution architecture can enable your application or service to scale rapidly and reliably at a global level, without adding any complexity to the solution. The integration of a CDN can take different forms depending on the solution use case.

For example, CloudFront played an important role to enable the scale required throughout Amazon Prime Day 2020 by serving up web and streamed content to a worldwide audience, which handled over 280 million HTTP requests per minute.

Go serverless where possible

As discussed earlier in this post, modular architectures based on microservices reduce the complexity of the individual component or microservice. At scale it may introduce a different type of complexity related to the number of these independent components (microservices). This is where serverless services can help to reduce such complexity reliably and at scale. With this design model you no longer have to provision, manually scale, maintain servers, operating systems, or runtimes to run your applications.

For example, you may consider using a microservices architecture to modernize an application at the same time to simplify the architecture at scale using Amazon Elastic Kubernetes Service (EKS) with AWS Fargate.

Example of a serverless microservices architecture

Figure 3: Example of a serverless microservices architecture

In addition, an event-driven serverless capability like AWS Lambda is key in today’s modern scalable cloud solutions, as it handles running and scaling your code reliably and efficiently. See How to Design Your Serverless Apps for Massive Scale and 10 Things Serverless Architects Should Know for more information.

Secure by design

To avoid any major changes at a later stage to accommodate security requirements, it’s essential that security is taken into consideration as part of the initial solution design. For example, if the cloud project is new or small, and you don’t consider security properly at the initial stages, once the solution starts to scale, redesigning the entire cloud project from scratch to accommodate security best practices is usually not a simple option, which may lead to consider suboptimal security solutions that may impact the desired scale to be achieved. By leveraging CDN as part of the solution architecture (as discussed above), using Amazon CloudFront, you can minimize the impact of distributed denial of service (DDoS) attacks as well as perform application layer filtering at the edge. Also, when considering serverless services and the Shared Responsibility Model, from a security lens you can delegate a considerable part of the application stack to AWS so that you can focus on building applications. See The Shared Responsibility Model for AWS Lambda.

Design with security in mind by incorporating the necessary security services as part of the initial cloud solution. This will allow you to add more security capabilities and features as the solution grows, without the need to make major changes to the design.

Design for failure

The reliability of a service or solution in the cloud depends on multiple factors, the primary of which is resiliency. This design principle becomes even more critical at scale because the failure impact magnitude typically will be higher. Therefore, to achieve a reliable scalability, it is essential to design a resilient solution, capable of recovering from infrastructure or service disruptions. This principle involves designing the overall solution in such a way that even if one or more of its components fail, the solution is still be capable of providing an acceptable level of its expected function(s). See AWS Well-Architected Framework – Reliability Pillar for more information.

Conclusion

Designing for scale alone is not enough. Reliable scalability should be always the targeted architectural attribute. The design principles discussed in this blog act as the foundational pillars to support it, and ideally should be combined with adopting a DevOps model.

Field Notes: Integrating IoT and ITSM using AWS IoT Greengrass and AWS Secrets Manager – Part 2

Post Syndicated from Gary Emmerton original https://aws.amazon.com/blogs/architecture/field-notes-integrating-iot-and-itsm-using-aws-iot-greengrass-and-aws-secrets-manager-part-2/

In part 1 of this blog I introduced the need for organizations to securely connect thousands of IoT devices with many different systems in the hyperconnected world that exists today, and how that can be addressed using AWS IoT Greengrass and AWS Secrets Manager.  We walked through the creation of ServiceNow credentials in AWS Secrets Manager, the creation of IAM roles and the Lambda functions that will run on our edge device (a Raspberry Pi).

In this second part of the blog, we will setup AWS IoT Greengrass, on our Raspberry Pi, and AWS IoT Core so that we can run the AWS Lambda functions and access our ServiceNow credentials, retrieved securely from AWS Secrets Manager.

Setting up AWS IoT Core and AWS IoT Greengrass

The overall sequence for configuring AWS IoT Core and AWS IoT Greengrass is:

  • Create a certificate, and IoT Thing and link them
  • Create AWS IoT Greengrass group
  • Associate IAM role to the AWS IoT Greengrass group
  • Create and attach a policy to the certificate
  • Create an AWS IoT Greengrass Resource Definition for our ‘Secret’
  • Create an AWS IoT Greengrass Function Definition for our Lambda functions
  • Create an AWS IoT Greengrass Subscription Definition for IoT Topics to be used
  • Finally associate our Resource, Function and Subscription Definitions with our AWS IoT Greengrass Core

Steps

For this walkthrough, I have selected the AWS region “eu-west-1”, however, feel free to use other Regions where AWS IoT Core and AWS IoT Greengrass are available.

First, let’s install Greengrass on the Raspberry Pi:

  • Follow the instructions to configure the pre-requisites on the Raspberry Pi
  • Then we download the AWS IoT Greengrass software
  • And then we unzip the AWS IoT Greengrass software using the following command (note, this command is for version 1.10.0 of Greengrass and will change as later versions are released):

sudo tar -xzvf greengrass-linux-armv6l-1.10.0.tar.gz -C /

Note that AWS IoT Greengrass must be compatible with the version of the AWS Greengrass SDK installed to identify what versions are compatible and use sudo pip3 install greengrasssdk==<version_number> to install the SDK compatible with the version of AWS IoT Greengrass that we installed.

Our AWS IoT Greengrass core will authenticate with AWS IoT Core in AWS using certificates, so we need to generate these first using the following command:

aws iot create-keys-and-certificate --set-as-active --certificate-pem-outfile "iot-ge.cert.pem" --public-key-outfile "iot-ge.public.key" --private-key-outfile "iot-ge.private.key"

This command will generate three files containing the private key, public key and certificate.  All of these files need to be copied to the /greengrass/certs folder on the Raspberry Pi.  Also, the output of the preceding command will give the ARN of the certificate – we need to make a note of this ARN as we will use it in the next steps.

We also need to download a copy of the Amazon Root CA into the /greegrass/certs folder using the command below:

sudo wget -O root.ca.pem https://www.amazontrust.com/repository/AmazonRootCA1.pem

For the next step we need our AWS account number and IoT Host address unique to our account – we get the IoT Host address using the command:

aws iot describe-endpoint --endpoint-type iot:Data-ATS

Now we need to create a config.json file on the Raspberry Pi in the /greengrass/config folder, with the account number and IoT Host address obtained in the previous step;

{
  "coreThing" : {
    "caPath" : "root.ca.pem",
    "certPath" : "iot-ge.cert.pem",
    "keyPath" : "iot-ge.private.key",
    "thingArn" : "arn:aws:iot:eu-west-1:<aws_account_number>:thing/IoT-blog_Core",
    "iotHost" : "<endpoint_address>",
    "ggHost" : "greengrass-ats.iot.eu-west-1.amazonaws.com",
    "keepAlive" : 600
  },
  "runtime" : {
    "cgroup" : {
      "useSystemd" : "yes"
    },
    "allowFunctionsToRunAsRoot" : "yes"
  },
  "managedRespawn" : false,
  "crypto" : {
    "principals" : {
      "SecretsManager" : {
        "privateKeyPath" : "file:///greengrass/certs/iot-ge.private.key"
      },
      "IoTCertificate" : {
        "privateKeyPath" : "file:///greengrass/certs/iot-ge.private.key",
        "certificatePath" : "file:///greengrass/certs/iot-ge.cert.pem"
      }
    },
    "caPath" : "file:///greengrass/certs/root.ca.pem"
  }
}

Note that the line "allowFunctionsToRunAsRoot" : "yes" allows the Lambda functions to easily access the SenseHat on the Raspberry Pi. This configuration should normally be avoided in Production environments for security reasons but has been used here for simplicity.

Next we create the IoT Thing to represent our Raspberry Pi to match the entry we added into the config.json file previously:

aws iot create-thing --thing-name IoT-blog_Core

Now that our config.json file is in place and our IoT ‘thing’ created we can start the AWS IoT Greengrass software using the following commands:

cd /greengrass/ggc/core/
sudo ./greengrassd start

Then we attach the certificate to our new Thing – we need the ARN of the certificate that was noted in the earlier steps when we created the certificates:

aws iot attach-thing-principal --thing-name "IoT-blog_Core" --principal "<certificate_arn>"

Now we create the AWS IoT Greengrass group – make a note of the Group ID in the output of this command as we use it later:

aws greengrass create-group --name IoT-blog-group

Next we create the AWS IoT Greengrass Core definition file – create this using a text editor and save as core-def.json

{
  "Cores": [
    {
      "CertificateArn": "<certificate_arn>",
      "Id": "<IoT Thing Name>",
      "SyncShadow": true,
      "ThingArn": "<thing_arn>"
    }
  ]
}

Then, using the preceding file we just created, we create the core definition using the following command:

aws greengrass create-core-definition --name "IoT-blog_Core" --initial-version file://core-def.json

Now we associate the AWS IoT Greengrass core with the AWS IoT Greengrass group – we need the LatestVersionARN from the output of the command above and the group ID of your existing AWS IoT Greengrass group (in the output from the command for creation of the group in previous steps):

aws greengrass create-group-version --group-id "<greengrass_group_id>" --core-definition-version-arn "<core_definition_version_arn>"

Then we associate the IAM role (created earlier) to the AWS IoT Greengrass group;

aws greengrass associate-role-to-group --group-id "<greengrass_group_id>" --role-arn "arn:aws:iam::<aws_account_number>:role/IoTGGRole"

We need to create a policy to associate with the certificate so that our AWS IoT Greengrass Core (authenticated/authorized by our certificates) has rights to interact with AWS IoT Core.  To do this we create the policy.json file:

{
  "Version": "2012-10-17",
  "Statement": [
    {
      "Effect": "Allow",
      "Action": [
        "iot:Publish",
        "iot:Subscribe",
        "iot:Connect",
        "iot:Receive"
      ],
      "Resource": [
        "*"
      ]
    },
    {
      "Effect": "Allow",
      "Action": [
        "iot:GetThingShadow",
        "iot:UpdateThingShadow",
        "iot:DeleteThingShadow"
      ],
      "Resource": [
        "*"
      ]
    },
    {
      "Effect": "Allow",
      "Action": [
        "greengrass:*"
      ],
      "Resource": [
        "*"
      ]
    }
  ]
}

Then create the policy using the policy file using the command below:

aws iot create-policy --policy-name myGGPolicy --policy-document file://policy.json

And finally attach our new policy to the certificate – as the certificate is attached to our AWS IoT Greengrass Core, this gives the rights defined in the policy to our AWS IoT Greengrass Core;

aws iot attach-policy --target "<certificate_arn>" --policy-name "myGGPolicy"

Now we have the AWS IoT Greengrass Core and permissions in place, it’s time to add our Secret as a resource for AWS IoT Greengrass.

First, we need to create a resource definition that refers to the ARN of the secret we created earlier.  Get the ARN of the secret using the following command:

aws secretsmanager describe-secret --secret-id "greengrass-snow-creds"

And then we create a text file containing the following and save it as resource.json:

{
"Resources": [
    {
      "Id": "SNOW-Credentials",
      "Name": "SNOW-Credentials",
      "ResourceDataContainer": {
        "SecretsManagerSecretResourceData": {
          "ARN": "<secret_arn>"
        }
      }
    }
  ]
}

Now we command to create the resource reference in IoT to the Secret:

aws greengrass create-resource-definition --name "MySNOWSecret" --initial-version file://resource.json

Note the Resource ID from the output as it is needed as it has to be added to the Lambda definition json file in the next steps.  The function definition file contains the details of the Lambda function(s) that we will attach to our AWS IoT Greengrass group.  We create a text file with the content below and save as lambda-def.json.

We also specify a couple of variables in the definition file; these are the same as the environment variables that can be specified for Lambda, but they make the variables available in AWS IoT Greengrass.

Note, if we specify environment variables for the functions in the Lambda console then these will NOT be available when the function is running under AWS IoT Greengrass.  We will need our ServiceNow API URL to add to the configuration below, and this will be in the form of https://devXXXXX.service-now.com/api/now/table/incident, where XXXXX is the developer instance number assigned by ServiceNow when our instance is created.

We need the ARNs of the Lambda functions that we created in part 1 of the blog – these appear in the output after successfully creating the functions from the command line, or can be obtained using the aws lambda list-functions command – we need to have the ‘:1’ at the end of the ARN as AWS IoT Greengrass needs to reference published function versions.

{
  "DefaultConfig": {
    "Execution": {
      "IsolationMode": "NoContainer",
      "RunAs": {
        "Gid": 0,
        "Uid": 0
      }
    }
  },
  "Functions": [
    {
      "FunctionArn": "<lambda_function1_arn>:1",
      "FunctionConfiguration": {
        "EncodingType": "json",
        "Environment": {
          "Execution": {
            "IsolationMode": "NoContainer"
          },
          "Variables": { 
            "tempLimit": "30",
            "humidLimit": "50"
          }
        },
        "ExecArgs": "string",
        "Executable": "lambda_function.lambda_handler",
        "Pinned": true,
        "Timeout": 10
      },
    "Id": "sensorLambda"
    },
    {
      "FunctionArn": "<lambda_function2_arn>:1",
      "FunctionConfiguration": {
        "EncodingType": "json",
        "Environment": {
          "Execution": {
            "IsolationMode": "NoContainer"
          },
          "ResourceAccessPolicies": [
            {
              "Permission": "ro",
              "ResourceId": "SNOW-Credentials"
            }
          ],
          "Variables": { 
            "snowUrl": "<service_now_api_url>"
          }
        },
        "ExecArgs": "string",
        "Executable": "lambda_function.lambda_handler",
        "Pinned": false,
        "Timeout": 10
      },
    "Id": "anomalyLambda"
    }
  ]
}

The Lambda function now needs to be registered within our AWS IoT Greengrass core using the definition file just created, using the following command:

aws greengrass create-function-definition --name "IoT-blog-lambda" --initial-version file://lambda-def.json

Create Subscriptions

We now need to create some IoT Topics to pass data between the two Lambda functions and also to submit all sensor data to AWS IoT Core, which gives us visibility of the successful collection of sensor data.cd.

First, let’s create a subscription configuration file (subscriptions.json) for sensor data and anomaly data:

{
  "Subscriptions": [
    {
      "Id": "SensorData",
      "Source": "<lambda_function1_arn>:1",
      "Subject": "IoTBlog/sensorData",
      "Target": "cloud"
    },
    {
      "Id": "AnomalyData",
      "Source": "<lambda_function1_arn>:1",
      "Subject": "IoTBlog/anomaly",
      "Target": "<lambda_function2_arn>:1"
    },
    {
      "Id": "AnomalyDataB",
      "Source": "<lambda_function1_arn>:1",
      "Subject": "IoTBlog/anomaly",
      "Target": "cloud"
    }
  ]
}

And next, we run the command to create the subscription from this configuration:

aws greengrass create-subscription-definition --name "IoT-sensor-subs" --initial-version file://subscriptions.json

Update AWS IoT Greengrass Group Associations and Deploy

Now that the functions, subscriptions and resources have been defined, we run the following command to update our AWS IoT Greengrass group to the new version with those components included:

aws greengrass create-group-version --group-id <gg_group_id> --core-definition-version-arn "<core_def_version_arn>" --function-definition-version-arn "<function_def_version_arn>" --resource-definition-version-arn "<resource_def_version_arn>" --subscription-definition-version-arn "<subscription_def_version_arn>"

And finally, we can deploy our configuration.  Use the following command to deploy the Greengrass group to our device, using the group-version-id from the output of the previous command and also the group-id:

aws greengrass create-deployment --deployment-type NewDeployment --group-id <gg_group_id> --group-version-id <gg_group_version_id>

Summarized below is the integration between the different functions and components that we have now deployed to get from our sensor data through to an incident being raised in ServiceNow:

Raspberry PI

Create an Incident

Everything is setup now from an IoT perspective, so we can attempt to trigger a threshold breach on the sensors to trigger the creation of an incident in ServiceNow.  In order to trigger the incident creation, let’s raise the humidity around the sensor so that it breaches the threshold defined in the environment variables of the Lambda function.

Under normal conditions we will just see the data published by the first Lambda function in the IoTBlog/sensorData topic:

IoTblog sensordata

However, when a threshold is breached (in our example, humidity above 50%), the data is published to the IoTBlog/anomaly topic as shown below:

ioTblog Anomaly

Via the AWS IoT Greengrass subscriptions created earlier, this message arriving in the anomaly topic also triggers the second Lambda function to create the ticket in ServiceNow.

The log for the second Lambda function on AWS IoT Greengrass (stored in /greengrass/ggc/var/log/user/<region>/<aws_account_number>/ on the Raspberry Pi) will show a ‘201’ return code if the incident is successfully created in ServiceNow.

201 response

Now let’s log on to ServiceNow and check out our new incident.  Good news, our new incident appears correctly:

And when we click on our incident we can see the detail, including the full data from the IoT topic in the Activities section;

This is only a basic use of the ServiceNow API and there are many other parameters that you can use to increase the richness of the incident, refer to the ServiceNow API documentation for more details.

Cleaning up

To avoid incurring future charges, delete the resources that you created in the walkthrough.

Conclusion

We have built an IoT device (Raspberry Pi), running AWS IoT Greengrass, AWS Lambda, and using ServiceNow credentials managed in AWS Secrets Manager.  Using this we have triggered an anomaly event that has created an incident automatically in ServiceNow, directly from the Lambda function running on our Pi.  You can use this architecture as the foundation to integrate your edge devices and ITSM solution to automate ticket generation in your organization.

Look out for follow-up blogs that will extend this solution to provide a real-time dashboard for the sensor data and store the sensor data in a Data Lake for historical visualization.

Find out more about deploying Secrets to AWS IoT Greengrass Core.

Check out the AWS IoT Blog for more examples of how to use AWS to integrate your edge devices with the AWS Cloud.

Field Notes provides hands-on technical guidance from AWS Solutions Architects, consultants, and technical account managers, based on their experiences in the field solving real-world business problems for customers.


Field Notes: Integrating IoT and ITSM using AWS IoT Greengrass and AWS Secrets Manager – Part 1

Post Syndicated from Gary Emmerton original https://aws.amazon.com/blogs/architecture/field-notes-integrating-iot-and-itsm-using-aws-iot-greengrass-and-aws-secrets-manager-part-1/

IT Security is a hot topic in every organization, and in a hyper connected world the need to integrate thousands of IoT devices securely with many different systems at scale is critical.

AWS Secrets Manager helps customers manage their system credentials securely in the AWS Cloud, and with its integration with AWS IoT Greengrass, that capability now extends out to your edge-connected IoT devices.

In this two part blog post, I will walk through the steps to use this integration to give edge devices the capability to connect to and log incidents directly into ServiceNow. The credentials for connecting to ServiceNow are created in AWS Secrets Manager, and deployed locally (encrypted) to the edge device via AWS IoT Greengrass.

Part 1 (this post) gives an overview of the whole solution and the steps for setting up AWS Secrets Manager, creating the required IAM roles and AWS Lambda functions.  In part 2 of the blog we will then set up AWS IoT Greengrass and AWS IoT Core so that we can run the functions and access the secret on our edge device (Raspberry Pi).

Enabling edge devices to automatically raise incidents in your organization’s ITSM toolset ensures that you can use existing workflows and incident escalation paths for your edge devices.  Previously this would have been challenging to integrate. Additionally, by running this capability at the edge, it enables quicker responses and reduces the need to make calls back to the AWS Cloud.

Overview of solution

The solution makes use of a Raspberry Pi, running AWS IoT Greengrass. AWS Lambda functions on AWS IoT Greengrass capture temperature and humidity sensor data and make calls directly to ServiceNow when thresholds are breached.  The integration of AWS Secrets Manager with AWS IoT Core enables the credentials required for the ServiceNow API calls to be available locally. These calls are encrypted and available on the Pi for the Lambda function to use.

The sensors for temperature and humidity in this example are on a Raspberry Pi Sense Hat, which illustrates sensors that could be used in an industrial or manufacturing use case.  You can use any type of sensor such as vibration, strain gauges, or other electro-mechanical sensors.

One of the Lambda functions running on AWS IoT Greengrass on the RPi captures the sensor readings, and should a threshold on either be exceeded then it triggers a second Lambda function (again running on AWS IoT Greengrass). This then makes a ‘create incident’ API call to ServiceNow, using the credentials stored in AWS Secrets Manager.

In order to have visibility of the sensor data, and to manage communications between the first and second Lambda functions, all data from the sensors is published to one IoT Topic Data related to any threshold breaches is published to another IoT Topic.

Following is a high-level diagram for the architecture used in this blog.

ServiceNow RA

Prerequisites

To complete the steps in this blog, you need:

  • An AWS Account
  • A ServiceNow developer instance or other test ServiceNow instance that you can access – You can sign-up for a free ServiceNow developer account 
  • A Raspberry Pi (I used a Pi 3B with Raspbian Buster)
  • A Raspberry Pi SenseHat
  • A workstation with the latest AWS Command Line Interface (CLI) installed

Additionally, ensure that you have Python 3.7.x installed with the following Python modules on the Raspberry Pi (Raspian Buster includes Python 3.7 by default). Install the following packages as the root user (sudo pip):

  • greengrasssdk
  • boto3
  • requests
  • sense_hat
  • datetime

I have taken the approach of having these modules installed on the Pi in order to simplify the creation of the Lambda function.  This ensures the function will run locally on the Pi rather than having to build all of the Python modules on the Pi and then zip them to run the Lambda in an AWS IoT Greengrass container.

Walkthrough

The steps in the walkthrough can be achieved from the AWS console. I have focused on the command line approach, using the AWS CLI, as this will give a more detailed view of what is happening and the dependencies between the different components.  The overall sequence for the steps is:

  • Create secret in AWS Secrets Manager – this will contain the credentials required to access ServiceNow for Lambda running on AWS IoT Greengrass
  • Create IAM role – provides permissions for AWS IoT Greengrass to other AWS services, including AWS Secrets Manager
  • Create Lambda functions – the functions that will capture sensor data and create the Service Now ticket
  • Configure and Deploy IoT Core – deploy our configuration to the Raspberry Pi, covered in Part 2 of this blog

I’ve structured the order of the steps in a logical sequence so that any dependencies of later steps are created first.  There are a number of places where a value in the output of one command (such as an ARN) needs to be noted as required for subsequent commands. At times the steps may seem counter-intuitive, but whilst developing this blog, I found this sequence has proven to be the most effective.

Create Secret

First, we create our ‘Secret’ in AWS Secrets Manager.  This consists of a secret string containing a JSON object for the username and password required for authentication to the API of my ServiceNow developer instance.  For the purposes of this example, we will use the default encryption key for the AWS Secrets Manager service.

The following command, from the AWS CLI, is used to create the new secret, entering the relevant username and password for the ServiceNow instance.

IMPORTANT: the name of the secret must start with “greengrass-“(specified in the command after the “–name” parameter) because the IAM Greengrass managed service role (which we will use later) has permission by default to access secrets that start with this text.

aws secretsmanager create-secret --name "greengrass-snow-creds" --description "Credentials for ServiceNow API access" --secret-string '{"username":"&lt;username&gt;","password":"&lt;password&gt;"}'

The successful completion of the *preceding command results in an output on your terminal screen, containing the ARN (Amazon Resource Name) for the new secret.

Create IAM roles

In order for AWS IoT Greengrass to access our new secret and download it securely to AWS IoT Greengrass running on the Pi, we need to give it an IAM role. If we do not set this up correctly then there will be an error when trying to deploy the AWS IoT Greengrass group later in the walkthrough.

Our new IAM role needs a policy document that describes the permissions that we will give the role.  The first step is to create the IAM policy document, containing only the permissions for the Greengrass service this new role – to do this we create a text file called assume-role.json containing the following:

{
  "Version": "2012-10-17",
  "Statement": [
    {
      "Effect": "Allow",
      "Principal": {
        "Service": "greengrass.amazonaws.com"
      },
      "Action": "sts:AssumeRole"
    }
  ]
}

Then we run the following command, referencing the file just created:

aws iam create-role --role-name "IoTGGRole" --assume-role-policy-document file://assume-role.json

And finally we need to attach the IAM managed AWS IoT Greengrass service role to our new custom role:

aws iam attach-role-policy --role-name "IoTGGRole" --policy-arn arn:aws:iam::aws:policy/service-role/AWSGreengrassResourceAccessRolePolicy

We also need a role for our Lambda functions with basic execution permissions; create a text file called lambda-role.json containing the following:

{
  "Version": "2012-10-17",
  "Statement": [
    {
      "Effect": "Allow",
      "Principal": {
        "Service": "lambda.amazonaws.com"
      },
      "Action": "sts:AssumeRole"
    }
  ]
}

Then we run the following command, referencing the file just created:

aws iam create-role --role-name "IoTLambdaRole" --assume-role-policy-document file://lambda-role.json

And finally we need to attach the IAM managed Lambda basic execution role to our new custom role:

aws iam attach-role-policy --role-name "IoTLambdaRole" --policy-arn arn:aws:iam::aws:policy/service-role/AWSLambdaBasicExecutionRole

Create Lambda Functions

We now create the Lambda functions that will be deployed to Greengrass – these functions manage the interactions between the sensors and ServiceNow.

Lambda Function 1 – Get/Publish Sensor Data

The first Lambda function reads the sensor data and publishes the data to an IoT Topic (IoTBlog/sensorData), every 5 seconds, which can then be used by downstream services for analytics.  This function also determines whether a threshold has been breached and if so, it publishes the data to a separate IoT Topic (IotBlog/anomaly) to which our second Lambda function is subscribed.

import os
import json
from datetime import datetime
import time
import sys
from sense_hat import SenseHat
import greengrasssdk
import boto3

client = greengrasssdk.client('iot-data')
secClient = greengrasssdk.client('secretsmanager')
sense = SenseHat()
sense.clear()

t_threshold = int(os.environ['tempLimit'])
h_threshold = int(os.environ['humidLimit'])

def lambda_handler(event, context):
    return
 
# Get sensor data and check against thresholds
def getSensorData():
    while True:
        eventTitle = "no event"
        anomaly = False
        ts = time.time()
        dt = datetime.fromtimestamp(ts).strftime('%Y-%m-%d %H:%M:%S')
        
        temp     = round(sense.get_temperature(),2)
        humidity = round(sense.get_humidity(),2)
        
        time.sleep(5)

        if (temp > int(t_threshold)):
            anomaly = True
            eventTitle = "Temperature breach"
            
        if (humidity > int(h_threshold)):
            anomaly = True
            eventTitle = "Humidity breach"

        sensorData = { 'title': eventTitle,'dt':dt,'ts':ts,'t':temp,'h':humidity }
        publishData(anomaly,sensorData)

# Publish sensor data to IoT topic(s)
def publishData(anomaly,myData):
    response = client.publish(
        topic = 'IoTBlog/sensorData',
        payload = json.dumps(myData) )
    

We create a text file lambda_function.py containing the code above and then compress into a zip file named lambda_function_1.zip.  Once this is done we can then create the function in AWS using the following command:

aws lambda create-function --function-name "1-IoT-GetSensorData" --runtime python3.7 --zip-file fileb://lambda_function_1.zip --handler lambda_function.lambda_handler –role arn:aws:iam::&lt;aws_account_number&gt;:role/IoTLambdaRole
In order to make use of Lambda functions in AWS IoT Greengrass we then need to publish a version of the function using the following command:
aws lambda publish-version --function-name "1-IoT-GetSensorData"

Lambda Function 2 – Create Anomaly Ticket

The second Lambda function is triggered through its subscription to the anomaly data published to the anomaly IoT Topic by the first Lambda function. This then makes a call to the ServiceNow API to create an incident.  Prior to making the API call, the function obtains the ServiceNow credentials from the secret that has been made available to AWS IoT Greengrass.

As this is a Resource within the AWS IoT Greengrass Core, it is automatically downloaded to the Raspberry Pi as part of the deployment of the AWS IoT Greengrass Core.

import os
import json
import sys
import greengrasssdk
import requests

client = greengrasssdk.client('iot-data')
secClient = greengrasssdk.client('secretsmanager')
secret_name = "greengrass-snow-creds"
snow_instance = os.environ['snowUrl']
msg = ""

def publishAnomaly(msg,title):
    auth = getLocalSecret()
    createTicket(auth,msg,title)

# Get secret from GG
def getLocalSecret():
    secret = secClient.get_secret_value(SecretId=secret_name)
    rawSecret = secret.get('SecretString')
    return json.loads(str(rawSecret))

# Create ticket in ServiceNow            
def createTicket(auth,eventData,title):
    API_ENDPOINT = snow_instance
    HEADERS = {"Content-Type":"application/json","Accept":"application/json"}
    PARAMS = { 
        "short_description":title,
        "assignment_group":"sensor_team",
        "urgency":"2",
        "impact":"2",
        "comments":eventData
    } 

    request = requests.post(url = API_ENDPOINT, auth=(str(auth["username"]),str(auth["password"])), headers=HEADERS, data = json.dumps(PARAMS))
    print("Response:",request)

def lambda_handler(event, context):
    msg = json.dumps(event)
    msg = json.loads(msg)
    title = "Sensor Threshold - " + msg["title"]
    
    publishAnomaly(msg,title)
    return

We create another text file, lambda_function.py containing the code above and then compress into a zip file named lambda_function_2.zip.  Once this is done we can then create the function in AWS using the following command:

aws lambda create-function --function-name "2-IoT-ServiceNow" --runtime python3.7 --zip-file fileb://lambda_function_2.zip --handler lambda_function.lambda_handler –role arn:aws:iam::&lt;account_number&gt;:role/IoTLambdaRole

In order to make use of Lambda functions in Greengrass we then need to publish a version of the function using the following command:

aws lambda publish-version --function-name "2-IoT-ServiceNow"

Conclusion

In this post, I showed you the steps for integrating IoT and ITSM by setting up AWS Secrets Manager, creating the required IAM roles and AWS Lambda functions.  Now you can proceed to part 2 of the blog to set up AWS IoT-Core and AWS IoT Greengrass to make use of the secret and functions that you created in this post.

Field Notes provides hands-on technical guidance from AWS Solutions Architects, consultants, and technical account managers, based on their experiences in the field solving real-world business problems for customers.

Mercado Libre: How to Block Malicious Traffic in a Dynamic Environment

Post Syndicated from Gaston Ansaldo original https://aws.amazon.com/blogs/architecture/mercado-libre-how-to-block-malicious-traffic-in-a-dynamic-environment/

Blog post contributors: Pablo Garbossa and Federico Alliani of Mercado Libre

Introduction

Mercado Libre (MELI) is the leading e-commerce and FinTech company in Latin America. We have a presence in 18 countries across Latin America, and our mission is to democratize commerce and payments to impact the development of the region.

We manage an ecosystem of more than 8,000 custom-built applications that process an average of 2.2 million requests per second. To support the demand, we run between 50,000 to 80,000 Amazon Elastic Cloud Compute (EC2) instances, and our infrastructure scales in and out according to the time of the day, thanks to the elasticity of the AWS cloud and its auto scaling features.

Mercado Libre

As a company, we expect our developers to devote their time and energy building the apps and features that our customers demand, without having to worry about the underlying infrastructure that the apps are built upon. To achieve this separation of concerns, we built Fury, our platform as a service (PaaS) that provides an abstraction layer between our developers and the infrastructure. Each time a developer deploys a brand new application or a new version of an existing one, Fury takes care of creating all the required components such as Amazon Virtual Private Cloud (VPC), Amazon Elastic Load Balancing (ELB), Amazon EC2 Auto Scaling group (ASG), and EC2) instances. Fury also manages a per-application Git repository, CI/CD pipeline with different deployment strategies, such like blue-green and rolling upgrades, and transparent application logs and metrics collection.

Fury- MELI PaaS

For those of us on the Cloud Security team, Fury represents an opportunity to enforce critical security controls across our stack in a way that’s transparent to our developers. For instance, we can dictate what Amazon Machine Images (AMIs) are vetted for use in production (such as those that align with the Center for Internet Security benchmarks). If needed, we can apply security patches across all of our fleet from a centralized location in a very scalable fashion.

But there are also other attack vectors that every organization that has a presence on the public internet is exposed to. The AWS recent Threat Landscape Report shows a 23% YoY increase in the total number of Denial of Service (DoS) events. It’s evident that organizations need to be prepared to quickly react under these circumstances.

The variety and the number of attacks are increasing, testing the resilience of all types of organizations. This is why we started working on a solution that allows us to contain application DoS attacks, and complements our perimeter security strategy, which is based on services such as AWS Shield and AWS Web Application Firewall (WAF). In this article, we will walk you through the solution we built to automatically detect and block these events.

The strategy we implemented for our solution, Network Behavior Anomaly Detection (NBAD), consists of four stages that we repeatedly execute:

  1. Analyze the execution context of our applications, like CPU and memory usage
  2. Learn their behavior
  3. Detect anomalies, gather relevant information and process it
  4. Respond automatically

Step 1: Establish a baseline for each application

End user traffic enters through different AWS CloudFront distributions that route to multiple Elastic Load Balancers (ELBs). Behind the ELBs, we operate a fleet of NGINX servers from where we connect back to the myriad of applications that our developers create via Fury.

MELI Architecture - nomaly detection project-step 1

Step 1: MELI Architecture – Anomaly detection project

We collect logs and metrics for each application that we ship to Amazon Simple Storage Service (S3) and Datadog. We then partition these logs using AWS Glue to make them available for consumption via Amazon Athena. On average, we send 3 terabytes (TB) of log files in parquet format to S3.

Based on this information, we developed processes that we complement with commercial solutions, such as Datadog’s Anomaly Detection, which allows us to learn the normal behavior or baseline of our applications and project expected adaptive growth thresholds for each one of them.

Anomaly detection

Step 2: Anomaly detection

When any of our apps receives a number of requests that fall outside the limits set by our anomaly detection algorithms, an Amazon Simple Notification Service (SNS) event is emitted, which triggers a workflow in the Anomaly Analyzer, a custom-built component of this solution.

Upon receiving such an event, the Anomaly Analyzer starts composing the so-called event context. In parallel, the Data Extractor retrieves vital insights via Athena from the log files stored in S3.

The output of this process is used as the input for the data enrichment process. This is responsible for consulting different threat intelligence sources that are used to further augment the analysis and determine if the event is an actual incident or not.

At this point, we build the context that will allow us not only to have greater certainty in calculating the score, but it will also help us validate and act quicker. This context includes:

  • Application’s owner
  • Affected business metrics
  • Error handling statistics of our applications
  • Reputation of IP addresses and associated users
  • Use of unexpected URL parameters
  • Distribution by origin of the traffic that generated the event (cloud providers, geolocation, etc.)
  • Known behavior patterns of vulnerability discovery or exploitation
Step 2: MELI Architecture - Anomaly detection project

Step 2: MELI Architecture – Anomaly detection project

Step 3: Incident response

Once we reconstruct the context of the event, we calculate a score for each “suspicious actor” involved.

Step 3: MELI Architecture - Anomaly detection project

Step 3: MELI Architecture – Anomaly detection project

Based on these analysis results we carry out a series of verifications in order to rule out false positives. Finally, we execute different actions based on the following criteria:

Manual review

If the outcome of the automatic analysis results in a medium risk scoring, we activate a manual review process:

  1. We send a report to the application’s owners with a summary of the context. Based on their understanding of the business, they can activate the Incident Response Team (IRT) on-call and/or provide feedback that allows us to improve our automatic rules.
  2. In parallel, our threat analysis team receives and processes the event. They are equipped with tools that allow them to add IP addresses, user-agents, referrers, or regular expressions into Amazon WAF to carry out temporary blocking of “bad actors” in situations where the attack is in progress.

Automatic response

If the analysis results in a high risk score, an automatic containment process is triggered. The event is sent to our block API, which is responsible for adding a temporary rule designed to mitigate the attack in progress. Behind the scenes, our block API leverages AWS WAF to create IPSets. We reference these IPsets from our custom rule groups in our web ACLs, in order to block IPs that source the malicious traffic. We found many benefits in the new release of AWS WAF, like support for Amazon Managed Rules, larger capacity units per web ACL as well as an easier to use API.

Conclusion

By leveraging the AWS platform and its powerful APIs, and together with the AWS WAF service team and solutions architects, we were able to build an automated incident response solution that is able to identify and block malicious actors with minimal operator intervention. Since launching the solution, we have reduced YoY application downtime over 92% even when the time under attack increased over 10x. This has had a positive impact on our users and therefore, on our business.

Not only was our downtime drastically reduced, but we also cut the number of manual interventions during this type of incident by 65%.

We plan to iterate over this solution to further reduce false positives in our detection mechanisms as well as the time to respond to external threats.

About the authors

Pablo Garbossa is an Information Security Manager at Mercado Libre. His main duties include ensuring security in the software development life cycle and managing security in MELI’s cloud environment. Pablo is also an active member of the Open Web Application Security Project® (OWASP) Buenos Aires chapter, a nonprofit foundation that works to improve the security of software.

Federico Alliani is a Security Engineer on the Mercado Libre Monitoring team. Federico and his team are in charge of protecting the site against different types of attacks. He loves to dive deep into big architectures to drive performance, scale operational efficiency, and increase the speed of detection and response to security events.

Field Notes: Customizing the AWS Control Tower Account Factory with AWS Service Catalog

Post Syndicated from Remek Hetman original https://aws.amazon.com/blogs/architecture/field-notes-customizing-the-aws-control-tower-account-factory-with-aws-service-catalog/

Many AWS customers who are managing hundreds or thousands of accounts know how complex and time consuming this process can be. To reduce the burden and simplify the process of creating new accounts, last year AWS released a new service, AWS Control Tower.

AWS Control Tower helps you automate the process of setting up a multi-account AWS environment (AWS Landing Zone) that is secure, well-architected, and ready to use. This Landing Zone is created following best practices established through AWS’ experience working with thousands of enterprises as they move to the cloud. This includes the configuration of AWS Organizations, centralized logging, federated access, mandatory guardrails, and networking.

Those elements are a good starting point to cover the initial configuration of the new account. For some organizations, the next step is to baseline a newly vended account to align it with the company policies and compliance requirements. This means create or deploy necessary roles, policies, governance controls, security groups and so on.

In this blog post, I describe a solution that helps achieve consistent governance and compliance requirements across accounts created by AWS Control Tower. The solution uses the AWS Service Catalog as the repository of products that will be deployed into the new accounts.

Prerequisites and assumptions

Before I get into how it works, let’s first review a few key AWS Service Catalog concepts:

  • An AWS Service Catalog product is a blueprint for building your AWS resources that you want to make available for deployment on AWS along with the configuration information.
  • A portfolio is a collection of products, together with the configuration information.
  • A provisioned product is an AWS CloudFormation stack.
  • Constraints control the way users can deploy a product. With launch constraints, you can specify a role that the AWS Service Catalog can assume to launch a product.
  • Review AWS Service Catalog reference blueprints for a quick way to set up and configure AWS Service Catalog portfolios and products.

You need an AWS Service Catalog portfolio with products that you plan to deploy to the accounts. The portfolio has to be created in the AWS Control Tower primary account. If you don’t have a portfolio, the starting point would be to review these resources:

Solution Overview

This solution supports the following scenarios:

  • Deployment of products to the newly vended AWS Control Tower account (Figure 1)
  • Update and deployment of products to existing accounts (Figure 2)
Figure 1 Deployment to new account

Figure 1 – Deployment to new account

The architecture diagram in figure 1 shows the process of deploying products to the new account.

  1. AWS Control Tower creates a new account
  2. Once an account is created successfully, Amazon CloudWatch Events trigger an AWS Lambda function
  3. The Lambda function pulls the configuration from an Amazon S3 bucket and:
    • Validates configuration
    • Grants Lambda role access to portfolio(s)
    • Creates StackSet constrains for products
  4. Lambda calls the AWS Step Function
  5. The AWS Step Function orchestrates deployment of the AWS Service Catalog products and monitors progress
Figure 2 Update or deployment to an existing account

Figure 2 – Update or deployment to an existing account

The architecture diagram in figure 2 shows process of updating product or deploying product to the existing account.

  1. User uploads update configuration to an Amazon S3 Bucket
  2. Update triggers AWS Lambda Function
  3. Lambda function reads uploaded configuration and:
    • Validates configuration
    • Grants Lambda role access to portfolio(s)
    • Creates StackSet constrains for products
  4. Calls AWS Step Function
  5. AWS Step Function orchestrate update/deployment of AWS Service Catalog products and monitoring progress

Deployment and configuration

Before proceeding with the deployment, you must install Python3.

Then, follow these steps:

  1. Download the solution from GitHub
  2. Go to folder src and run the following command:                                                                                    “pip3 install –r requirements.txt –t .”
  3.  Zip content of the src folder to “control-tower-account-factory-solution.zip” file
  4. Upload zip file to your Amazon S3 bucket created in the AWS Region where you want to deploy the solution
  5. Launch the AWS CloudFormation template

AWS CloudFormation Template Parameters:

  • ConfigurationBucketName – name of the Amazon S3 bucket from where AWS Lambda function should pull the configuration file. You can provide the name of an existing bucket.
  • CreateConfigurationBucket – set to true if you want to create a bucket specified in previous parameter. If a bucket exists, set value to false
  • ConfigurationFileName – name of the configuration file for a new account. Default value: config.yml
  • UpdateFileName – name of the configuration file for updates. Default value: update.yml
  • SourceCodeBucketName – name of the bucket where you uploaded the zipped Lambda code
  • SourceCodePackageName – name of the zipped file contain Lambda. If the file was uploaded to folder, include the name of folder(s) as well. Example: my_folder/control-tower-account-factory-solution.zip
  • BaselineFunctionName –name of the AWS Lambda function. Default value: control-tower- account-factory-lambda
  • BaselinetLambdaRoleName –name of the AWS Lambda function IAM role. Default value: control-tower- account-factory-lambda-role
  • StateMachineName  – name of the AWS Step Function. Default value: control-tower- account-factory-state-machine
  • StateMachineRoleName – name of the AWS Step Function IAM role. Default value: control-tower- account-factory-state-machine-role
  • TrackingTableName – name of the DynamoDB table to track all deployment and updates. Default value: control-tower-account-factory-tracking-table
  • MaxIterations –maximum iteration of the AWS Step Function before the reports time out. Default value: 30. It can be overwrite in configuration file. For more information see Configuration section.
  • TopicName – (optional) name of the SNS Topic that will be used for sending notification. Default value: control-tower- account-factory-account-notification
  • NotificationEmail – (optional) the email address where to send the notification. If this isn’t provided, the SNS topic won’t be created.

Configuration Files

The configuration files have to be in the YAML format, you can use the following schemas for new or existing accounts:

Configuration schema for new account:

The configuration can apply to all new accounts or can be divided based on the organization unit associated with the new account. Also, you can mix deployments where some products are always deployed and some only to specific organization units.

Example configuration file

Configuration schema for existing accounts

This configuration can be used to update provisioned products or deploy products into existing accounts. You can specify a target location either as account(s), organization unit(s) or both. If you specified an organization unit as a target, the product(s) will be updated/deployed to all accounts associated with organization unit.

If the product doesn’t exist in the account, the Lambda function attempts to deploy it. You can manage this by setting the parameter ‘deployifnotexist’ to true. If omitted or set to false, Lambda won’t provision the product to an existing account.

Example configuration file

All products deployed by the AWS Service Catalog are provisioned under their own name that has to be unique across all provisioned products. In this example, products are provisioned under the following naming convention:

<account id where product is provision>-<”provision_name” from configuration file>

Example:  123456789-my-product

In the configuration file you can specify dependencies between products. Dependencies need to be provided as the list of provisioned product name not a product name. If provided, deployment of the product will be suspended until all dependencies successfully deployed.

The Step Function is running in the loop with interval of 1 minute and checking if dependencies were deployed. In the event of an error in the dependency naming or configuration, the step function iterates only until it reaches the maximum iterations defined in the configuration file. If the maximum iterations are reached, the step function reports time out and interrupts the products’ deployment.

Important: if you updating a product by adding a new AWS Region, you cannot specify the dependency or run updates in existing regions the same time. In this scenario you should break the update as follows:

  • Upload configuration to create dependencies in the new region
  • Upload configuration to create products only in the new region

You can find different examples of configuration files in GitHub.

Note: The name of the configuration file and Amazon S3 location must match the values provided in the AWS CloudFormation template during solution deployment.

AWS Lambda functions deployment considerations

When deploying product is a Lambda function, you need to consider two requirements:

  1. The source code of the Lambda function needs to be in the Amazon S3 bucket created in the same AWS region where you are planning to deploy a Lambda function
  2. The destination account needs to have permission to the source Amazon S3 bucket

To accommodate both requirements, the approach is to create an Amazon S3 bucket under the AWS Control Tower primary account. There is one Amazon S3 bucket in each Region where the functions will be deployed.

Each deployment bucket should have attached the following policy:

{
    "Version": "2008-10-17",
    "Statement": [
        {
            "Effect": "Allow",
            "Principal": {
                "AWS": "*"
            },
            "Action": "s3:GetObject",
            "Resource": "arn:aws:s3:::<S3 bucket name>/*",
            "Condition": {
                "StringEquals": {
                    "aws:PrincipalOrgID": "<AWS Organizations Id>"
                },
                "StringLike": {
                    "aws:PrincipalArn": [
                        "arn:aws:iam::*:role/AWSControlTowerExecution",
        "arn:aws:iam::*:role/< name of the Lambda IAM role – default: control-tower-account-factory-lambda-role>"
                    ]
                }
            }
        }
    ]
}

This allows the deployment role to access Lambda’s source code from any account in your AWS Organizations.

Conclusion

In this blog post, I’ve outlined a solution to help you drive consistent governance and compliance requirements across accounts vended though AWS Control Tower. This solution provides enterprises with mechanisms to manage all deployments from a centralized account. Also, this reduces the need for maintaining multiple separate CI/CD pipelines.  Therefore you can simplify and reduce deployment time in a multi-account environment.

This solution allows you keep provisioned products up to date by updating existing products or bringing old accounts to the same compliance level as the new accounts.

Since this solution supports deployment to existing accounts and can be run without AWS Control Tower, it can be used for deployment of any AWS Service Catalog product either in single or multiple account environments. This solution then becomes an integral part of CI/CD pipeline.

For more information, review the AWS Control Tower documentation and AWS Service Catalog documentation. Also, review the links listed in the “Prerequisites and assumptions” section of this post.

Field Notes provides hands-on technical guidance from AWS Solutions Architects, consultants, and technical account managers, based on their experiences in the field solving real-world business problems for customers.

Architecting a Data Lake for Higher Education Student Analytics

Post Syndicated from Craig Jordan original https://aws.amazon.com/blogs/architecture/architecting-data-lake-for-higher-education-student-analytics/

One of the keys to identifying timely and impactful actions is having enough raw material to work with. However, this up-to-date information typically lives in the databases that sit behind several different applications. One of the first steps to finding data-driven insights is gathering that information into a single store that an analyst can use without interfering with those applications.

For years, reporting environments have relied on a data warehouse stored in a single, separate relational database management system (RDBMS). But now, due to the growing use of Software as a service (SaaS) applications and NoSQL database options, data may be stored outside the data center and in formats other than tables of rows and columns. It’s increasingly difficult to access the data these applications maintain, and a data warehouse may not be flexible enough to house the gathered information.

For these reasons, reporting teams are building data lakes, and those responsible for using data analytics at universities and colleges are no different. However, it can be challenging to know exactly how to start building this expanded data repository so it can be ready to use quickly and still expandable as future requirements are uncovered. Helping higher education institutions address these challenges is the topic of this post.

About Maryville University

Maryville University is a nationally recognized private institution located in St. Louis, Missouri, and was recently named the second fastest growing private university by The Chronicle of Higher Education. Even with its enrollment growth, the university is committed to a highly personalized education for each student, which requires reliable data that is readily available to multiple departments. University leaders want to offer the right help at the right time to students who may be having difficulty completing the first semester of their course of study. To get started, the data experts in the Office of Strategic Information and members of the IT Department needed to create a data environment to identify students needing assistance.

Critical data sources

Like most universities, Maryville’s student-related data centers around two significant sources: the student information system (SIS), which houses student profiles, course completion, and financial aid information; and the learning management system (LMS) in which students review course materials, complete assignments, and engage in online discussions with faculty and fellow students.

The first of these, the SIS, stores its data in an on-premises relational database, and for several years, a significant subset of its contents had been incorporated into the university’s data warehouse. The LMS, however, contains data that the team had not tried to bring into their data warehouse. Moreover, that data is managed by a SaaS application from Instructure, called “Canvas,” and is not directly accessible for traditional extract, transform, and load (ETL) processing. The team recognized they needed a new approach and began down the path of creating a data lake in AWS to support their analysis goals.

Getting started on the data lake

The first step the team took in building their data lake made use of an open source solution that Harvard’s IT department developed. The solution, comprised of AWS Lambda functions and Amazon Simple Storage Service (S3) buckets, is deployed using AWS CloudFormation. It enables any university that uses Canvas for their LMS to implement a solution that moves LMS data into an S3 data lake on a daily basis. The following diagram illustrates this portion of Maryville’s data lake architecture:

The data lake for the Learning Management System data

Diagram 1: The data lake for the Learning Management System data

The AWS Lambda functions invoke the LMS REST API on a daily schedule resulting in Maryville’s data, which has been previously unloaded and compressed by Canvas, to be securely stored into S3 objects. AWS Glue tables are defined to provide access to these S3 objects. Amazon Simple Notification Service (SNS) informs stakeholders the status of the data loads.

Expanding the data lake

The next step was deciding how to copy the SIS data into S3. The team decided to use the AWS Database Migration Service (DMS) to create daily snapshots of more than 2,500 tables from this database. DMS uses a source endpoint for secure access to the on-premises database instance over VPN. A target endpoint determines the specific S3 bucket into which the data should be written. A migration task defines which tables to copy from the source database along with other migration options. Finally, a replication instance, a fully managed virtual machine, runs the migration task to copy the data. With this configuration in place, the data lake architecture for SIS data looks like this:

Diagram 2: Migrating data from the Student Information System

Diagram 2: Migrating data from the Student Information System

Handling sensitive data

In building a data lake you have several options for handling sensitive data including:

  • Leaving it behind in the source system and avoid copying it through the data replication process
  • Copying it into the data lake, but taking precautions to ensure that access to it is limited to authorized staff
  • Copying it into the data lake, but applying processes to eliminate, mask, or otherwise obfuscate the data before it is made accessible to analysts and data scientists

The Maryville team decided to take the first of these approaches. Building the data lake gave them a natural opportunity to assess where this data was stored in the source system and then make changes to the source database itself to limit the number of highly sensitive data fields.

Validating the data lake

With these steps completed, the team turned to the final task, which was to validate the data lake. For this process they chose to make use of Amazon Athena, AWS Glue, and Amazon Redshift. AWS Glue provided multiple capabilities including metadata extraction, ETL, and data orchestration. Metadata extraction, completed by Glue crawlers, quickly converted the information that DMS wrote to S3 into metadata defined in the Glue data catalog. This enabled the data in S3 to be accessed using standard SQL statements interactively in Athena. Without the added cost and complexity of a database, Maryville’s data analyst was able to confirm that the data loads were completing successfully. He was also able to resolve specific issues encountered on particular tables. The SQL queries, written in Athena, could later be converted to ETL jobs in AWS Glue, where they could be triggered on a schedule to create additional data in S3. Athena and Glue enabled the ETL that was needed to transform the raw data delivered to S3 into prepared datasets necessary for existing dashboards.

Once curated datasets were created and stored in S3, the data was loaded into an AWS Redshift data warehouse, which supported direct access by tools outside of AWS using ODBC/JDBC drivers. This capability enabled Maryville’s team to further validate the data by attaching the data in Redshift to existing dashboards that were running in Maryville’s own data center. Redshift’s stored procedure language allowed the team to port some key ETL logic so that the engineering of these datasets could follow a process similar to approaches used in Maryville’s on-premises data warehouse environment.

Conclusion

The overall data lake/data warehouse architecture that the Maryville team constructed currently looks like this:

The complete architecture

Diagram 3: The complete architecture

Through this approach, Maryville’s two-person team has moved key data into position for use in a variety of workloads. The data in S3 is now readily accessible for ad hoc interactive SQL workloads in Athena, ETL jobs in Glue, and ultimately for machine learning workloads running in EC2, Lambda or Amazon Sagemaker. In addition, the S3 storage layer is easy to expand without interrupting prior workloads. At the time of this writing, the Maryville team is both beginning to use this environment for machine learning models described earlier as well as adding other data sources into the S3 layer.

Acknowledgements

The solution described in this post resulted from the collaborative effort of Christine McQuie, Data Engineer, and Josh Tepen, Cloud Engineer, at Maryville University, with guidance from Travis Berkley and Craig Jordan, AWS Solutions Architects.

Field Notes: Migrating a Self-managed Kubernetes Cluster on Amazon EC2 to Amazon EKS

Post Syndicated from Ahmed Bham original https://aws.amazon.com/blogs/architecture/field-notes-migrating-a-self-managed-kubernetes-cluster-on-ec2-to-amazon-eks/

AWS customers from startups to enterprises have been successfully running Kubernetes clusters on Amazon EC2 instances since 2015, well before Amazon Elastic Kubernetes Service (Amazon EKS), was launched in 2018. As a fully managed Kubernetes service, Amazon EKS customers can run Kubernetes on AWS without needing to install, operate, and maintain their own Kubernetes control plane. Since its launch, many existing and new customers are building and running their Kubernetes clusters on Amazon EKS.

At re:Invent 2019, AWS announced AWS Fargate for Amazon EKS, which is serverless compute for containers. Then, in January 2020, AWS announced a price reduction of Amazon EKS  by 50% to $0.10 per hour, per cluster. These developments, coupled with realization of management and cost overhead of Kubernetes control plane operations at scale, made more customers look into migrating their self-managed Kubernetes clusters to Amazon EKS.

The “how” of this migration is the focus of this blog.

Overview of Solution

For most customers migrating from self-managed Kubernetes clusters on Amazon EC2 to Amazon EKS can usually be accomplished with minimal or no downtime. However, for large clusters involving hundreds of nodes and thousands of pods, this requires more planning and testing, and it is recommended to engage AWS Support for guidance.

Kubernetes control plane

Considerations

There are certain considerations to ensure a successful Amazon EKS migration and operational excellence.

Security

  • Access Control
    • Amazon EKS uses AWS Identity and Access Management (IAM) to provide authentication to your Kubernetes cluster, but it still relies on native Kubernetes Role Based Access Control (RBAC) for authorization. It’s important to plan for the creation and governance of IAM users, roles, or groups, for Kubernetes cluster administration.
    • You can enable private access to the Kubernetes API server so that all communication between your nodes and the API server stays within your VPC. You can limit the IP addresses that can access your API server from the internet, or completely disable internet access to the API server.
  • IAM Role for Service Account
    • With IAM roles for service accounts on Amazon EKS clusters, you can associate an IAM role with a Kubernetes service account. This service account can then provide AWS permissions to the containers in any pod that uses that service account. With this feature, you no longer need to provide extended permissions to the node IAM role so that pods on that node can call AWS APIs.
  • Security groups for pods
    • Security groups for pods integrate Amazon EC2 security groups with Kubernetes pods. You can use Amazon EC2 security groups to define rules that allow inbound and outbound network traffic to and from pods. These pods are deployed to nodes running on many Amazon EC2 instance types.

Networking

  • Amazon EKS supports native VPC networking with the Amazon VPC Container Network Interface (CNI) plugin for Kubernetes. Using this plugin allows Kubernetes pods to have the same IP address inside the pod as they do on the VPC network.
  •  VPC CNI plugin uses IP addresses for the pods from the VPC CIDR ranges, and specifically from the subnet where the worker node is hosted. Therefore, customers must ensure the VPC and subnets that will host their Amazon EKS cluster have sufficient IP addresses available for the expected number of pods running at a time. Additionally, IP addresses are allocated to the Elastic Network Interface (ENI) attached to the EC2 instances.  The EC2 instance selection for the worker nodes should take into account the number of ENI attachments supported by the instance type.

Compute Options

Kubernetes Versions

  • Amazon EKS supports four major Kubernetes versions at a time,  which you can review in the available AWS documentation, along with a calendar for future Amazon EKS releases.
  • If you are currently running a non-supported Kubernetes cluster, or would like to migrate to a newer version on Amazon EKS, consider the following:
    1. Review release notes for specific Kubernetes version you want to migrate to, and make necessary updates to Kubernetes manifest files.
    2. Update your Kubernetes add-ons (CNI plugin, CoreDNS, Kube-Proxy) to compatible versions, as listed in the Updating an Amazon EKS Cluster guide.

Prerequisites

  1. Create an IAM Role for the creator and/or administrator of the Amazon EKS cluster. Specify this role when creating the Amazon EKS cluster.
  2. If using an existing VPC and subnets to host Amazon EKS cluster:
    • You will need subnets in at least two Availability Zones
    • All public subnets should have the property MapPublicIpOnLaunch enabled (that is, Auto-assign public IPv4 address in the AWS Management Console) to host self-managed and managed node groups.

3. If your pods are currently accessing AWS resources, and if you would like to use IAM roles for service accounts, then:

    • Create service accounts in Kubernetes to be used by your pods.
    • Follow these steps to create IAM roles, and assign to service account created.
    • Update your pod manifest files to specify the newly created service account and role ARN annotation. Remove any existing code for storing or passing IAM credentials.

4. If you are planning to use AWS Fargate to run your pods, you need to create the appropriate Fargate Profile and pod execution role.

Application and Data Migration

  • For stateless workloads, apply your resource definitions (YAML or Helm) to the new cluster, and make sure everything works as expected. This includes the connection to resources external to the cluster.
  • For stateful workloads:
    1. You will need to carefully plan your migration to avoid data loss or unexpected downtime.
    2. If you are currently using shared persistent file storage based on Amazon EFS or Amazon FSx for Lustre, they can be mounted to Amazon EKS pods concurrently. Just make sure that pods don’t write to the same files concurrently.
    3. For pods using EBS volumes, and for other persistent storage types, you can use a Kubernetes backup and restore tool, Velero.

Traffic Migration

If you have an entire domain migration that you would like to smoothly migrate, you can take advantage of Amazon Route 53’s Weighted Routing (as shown in the following diagram). With Weighted Routing, you are able to have a progressive transition from your existing cluster to the new one with zero downtime by splitting the traffic at the DNS level.

Your customers are slowly being transferred to your new cluster as their cached TTL expires. The split could start with a small share of your customers, for example, 10% being pointed to the new Amazon EKS cluster and 90% still on the old one. As soon as traffic is confirmed to be working as expected on the new cluster, that percentage of clients pointed to the new one can be increased.

mydomain.com


This implementation is flexible, it can be tied to Load Balancers, EC2 Instances, and even to external on-premises infrastructure.

Conclusion

In this blog post, we showed how to migrate your live-traffic serving self-hosted Kubernetes Cluster to Amazon EKS. Amazon EKS offers a cost-effective and highly available option for running Kubernetes clusters in the cloud. Since Amazon EKS is upstream Kubernetes compliant, you can migrate existing self-managed Kubernetes workloads to Amazon EKS, with multiple options to minimize or avoid service disruption. To create your first Amazon EKS cluster, visit Getting started with Amazon EKS.

Field Notes provides hands-on technical guidance from AWS Solutions Architects, consultants, and technical account managers, based on their experiences in the field solving real-world business problems for customers.