Tag Archives: Technical How-to

Streamline your Amazon Redshift maintenance event notifications with Amazon Simple Notification Service

Post Syndicated from Sushmita Barthakur original https://aws.amazon.com/blogs/big-data/streamline-your-amazon-redshift-maintenance-event-notifications-with-amazon-simple-notification-service/

In this post, we take you through customization options for managing the schedule of your Amazon Redshift maintenance events, along with Amazon Redshift maintenance tracks for optimizing cluster performance. We also walk you through how to set up Amazon Redshift event notifications using Amazon SNS.

For provisioned clusters, Amazon Redshift periodically performs maintenance to apply fixes, enhancements, and new features to your cluster. Amazon Redshift assigns a 30-minute maintenance window. To prioritize business continuity and to align with your operational needs, this maintenance window is fully customizable, either programmatically or through the AWS Management Console for Amazon Redshift. For more information, see Managing clusters using the console.

A robust notification system is available to inform you about maintenance activities on your Amazon Redshift clusters to help you plan effectively and maintain communication with your users about scheduled system updates. Using the Amazon Redshift integration with Amazon Simple Notification Service (Amazon SNS), you can enable notifications of an upcoming maintenance events by creating an Amazon Redshift event notification subscription.

Customizing your provisioned cluster maintenance events

Amazon Redshift provides several ways to control how AWS maintains your provisioned clusters. The following are the primary customization options available:

  • Modifying the schedule for upcoming maintenance events: You can control when we deploy updates to your clusters.
  • Deferring upcoming maintenance: You can defer non-mandatory maintenance updates for a defined period of time.
  • Choosing a maintenance track to optimize performance: You can choose whether your cluster runs the most recently released version or the version released prior to the most recently released version.
  • Receiving notifications of upcoming maintenance: You can set up notifications for upcoming maintenance events scheduled for your clusters.

There is no set maintenance window for Amazon Redshift Serverless. When a new version becomes available for a workgroup’s chosen track, Amazon Redshift Serverless typically applies the update during an idle period as long as there is no pending track update request. If the workgroup doesn’t experience an idle period within 14 days, Redshift Serverless forces the version update.

Modifying the schedule for upcoming maintenance events

If a maintenance event is scheduled for a given week, it starts during the assigned 30-minute maintenance window. While Amazon Redshift is performing maintenance, it terminates queries or other operations that are in progress. If there are no maintenance tasks to perform during the scheduled maintenance window, your cluster continues to operate normally until the next scheduled maintenance window.

You can change the scheduled maintenance window by modifying the cluster, either programmatically or by using the Amazon Redshift console. You can find the maintenance window and set the day and time it occurs for the cluster under the Maintenance tab.

Deferring upcoming maintenance

Amazon Redshift provides additional control over cluster maintenance by deferring upcoming maintenance for up to 45 days. This feature is invaluable when you need uninterrupted cluster access during critical business periods. For instance, if your cluster’s maintenance window is set to Thursday from 5:30–6:00 UTC, and you need to have nonstop access to your cluster for the next 2 weeks, you can defer maintenance to a date 2 weeks from now. We don’t perform maintenance on your cluster during a specified deferment.

While standard maintenance can be deferred, mandatory updates—such as critical security patches, which typically occur at most annually, or hardware updates—must proceed as required. In these cases, Amazon Redshift notifies you through both the console and your Amazon SNS subscription, marking these as pending events, and implements these changes regardless of deferral settings to maintain the security and reliability of your infrastructure.

While performing deferred maintenance on Amazon Redshift clusters with Amazon Redshift data sharing configured, maintaining version compatibility between producer and consumer clusters is crucial for supporting reliable data sharing. As a best practice, you should keep producer and consumer clusters within two versions of each other to minimize potential compatibility issues. For instance, if a producer cluster is running version P195, consumer clusters should be between P193 and P197. To support effective version management, you can also use notification systems that provide timely alerts about planned cluster patching, enabling proactive version alignment and reducing the risk of potential data sharing disruptions.
Choosing a maintenance track to optimize cluster performance

Amazon Redshift offers two maintenance tracks that provide you control over how and when cluster version updates are applied, helping to ensure optimal performance while minimizing business disruption. The Current track automatically applies updates during your scheduled maintenance window, keeping your cluster on the latest version with the newest features and improvements. For organizations requiring additional validation time, the Trailing track delays version updates after release, allowing thorough testing of your workloads in development environments before production deployment.

Using the Amazon Redshift Trailing track in your production environment, and the Current track in your testing and development environment, gives you additional diligence and time to evaluate the latest release. This approach enables you to validate version updates thoroughly before they reach your production environment. Additionally, scheduling maintenance windows during off-peak hours and establishing a communication protocol to notify stakeholders about upcoming maintenance events minimizes potential impact on production because of maintenance events.

Receiving notifications of upcoming maintenance events

By setting up an Amazon SNS email notification, you can receive real-time updates about your cluster’s maintenance details directly in your inbox. See Amazon Redshift provisioned cluster event notifications for maintenance event categories along with event ID, severity, and notification descriptions.

Set up Amazon Redshift event notifications using Amazon SNS

This section demonstrates how you can set up Amazon SNS notifications for Amazon Redshift maintenance events. For setting up the event notification, we showcase the following two options in this post:

Amazon SNS notifications can also be set up using AWS Command Line Interface (AWS CLI).

Prerequisites

We assume you have already deployed an Amazon Redshift provisioned cluster. For more information on creating a provisioned cluster, see Creating a cluster.

You also need AWS Identity and Access Management (IAM) permission to create event subscriptions in an Amazon Redshift cluster and topics in Amazon SNS. For more information, see Setting up access for Amazon SNS.

Using the console

In this section, you set up notifications for Amazon Redshift maintenance events from the AWS console.

  1. Open the Amazon Redshift console.
  2. In the left navigation pane, choose Amazon Redshift and then choose Events.
  3. Select Event Subscriptions and then choose Create event subscription.
  4. On the Create event subscription page, enter the following information:
    1. In the Subscription details section, under Event subscription name, enter a name for the event.
    2. In the Subscription type section, under Source type, select Cluster.
    3. For Cluster, choose Select clusters, and then select your cluster IDs.
    4. For Categories, select your categories.
    5. For Severity, select either Error or Info, Error.
    6. In the Subscription actions section, select an existing topic or choose Create a new Amazon SNS topic, enter a topic name and then choose Create topic. See create a topic for information about creating a new topic using the Amazon SNS console.
    7. Choose Create event subscription.


  5. Under the Event subscriptions section, you can now see the new event subscription.
  6. In the Amazon SNS console, choose Topics and select the topic you configured in Amazon Redshift events in the previous step.
  7. Choose Create Subscription, under Protocol choose Email and enter a valid email address and choose Create Subscription. You can also select additional protocols based on your preference.
  8. Choose Pending Subscription and choose Request Confirmation. After the confirmation email is received, choose the Confirm Subscription link in the email.

These event notifications work at the AWS account level.

Using an AWS CloudFormation stack

In this section, you build and configure event notifications on existing Amazon Redshift clusters using an AWS CloudFormation stack:

  1. Download this CloudFormation template.
  2. Go to the AWS CloudFormation console.
  3. Choose Create Stack and select With new resources (standard).
  4. Under Specify template, select Upload a template file.
  5. Select Choose file and upload the CloudFormation template you downloaded in Step 1 and choose Next.
  6. In Stack Name, enter AmazonRedshift-EventSubscription.
  7. Enter the Parameters as follows:
    1. For ClusterIdentifier, enter the value for your Amazon Redshift cluster. This can be found by navigating to the Amazon Redshift console and locating the cluster identifier. To subscribe for all clusters in your account, leave this field blank.
    2. For EmailAddress, enter a valid email address.
    3. For EventSubscriptionName, enter the value for your event subscription. (for example, Redshift-event-subscription).
    4. For MonitorAllClusters, select from dropdown:
      • Select False if you entered a cluster identifier (subscribing to notification for one cluster)
      • Select True if you want to monitor all clusters.
    5. For Severity Level, select from dropdown:
      • Select Error if you want to subscribe to error notifications only.
      • Select Info if you want to subscribe to both error and information notifications.


  8. Choose Next, review the final page, and choose Submit.
  9. You will receive an email with subject AWS Notification – Subscription Confirmation. Choose Confirm subscription.
  10. Go to the Amazon Redshift console and under Events, verify the event subscription.

Sample email notifications from Amazon SNS

In this section, we show you some examples of notification emails sent through Amazon SNS based on the configuration:

Database Update notification:

Amazon Redshift regularly releases cluster versions. The Scheduled Database Update notification, shown in the following screenshot, is sent before an upcoming Amazon Redshift patch version upgrade.

System Update notification:

AWS performs regular updates to the underlying hardware and operating system of Amazon Redshift clusters, including security patches and performance improvements. The Scheduled System Update notification, shown in the following screenshot, is sent before scheduled hardware and OS updates.

If you’re running your non-production clusters on the Current track and production services on the Trailing track, you can receive notifications when your non-production clusters undergo patching, so you can proactively test the release before it goes to your production servers. You can promptly report issues with the update through the AWS Support Center console. If the reported issues are still present when your production clusters are scheduled for the same patch in the Trailing track, you can defer maintenance until the concerns are resolved for stability. To learn how to change tracks for an Amazon Redshift cluster, see Switching between tracks.

Stay informed about version updates using RSS feeds

To stay informed about the latest cluster versions released for Amazon Redshift, you can also use the RSS feed of the Cluster versions for Amazon Redshift page in your monitoring toolkit. Unlike real-time cluster notifications, this feed serves as your window into documentation updates, giving you early updates into published features and best practices. While it won’t alert you about immediate cluster maintenance or security patches, you’ll be notified whenever Amazon updates their cluster management documentation. By adding this RSS feed to your preferred reader, you’re subscribing to a continuous stream of AWS documentation updates, helping you to maintain a proactive rather than reactive approach to your data warehouse management.

Setting up an RSS feed for your Amazon Redshift documentation is straightforward and offers multiple options to suit your workflow preferences. The key is to first choose your preferred RSS reader, such as Slack or Microsoft Outlook, or your preferred web-based RSS feed reader. To start receiving notifications about AWS documentation updates, add the RSS feed URL to the reader to start receiving updates. After setup, you will receive notifications whenever the Amazon Redshift cluster management documentation is updated, helping to keep you informed about new features and best practices.

You can also see the updates directly on the Cluster versions for Amazon Redshift page to stay informed whenever a new version has been released and before it’s scheduled to be released to your cluster.

Cleanup

If you don’t need the Amazon SNS notification created for this post, delete the Amazon SNS topics from the Amazon SNS console to avoid incurring future charges. If you have configured the notification using AWS CloudFormation, delete the stack to delete related configurations. See Amazon SNS Pricing for pricing information for the service.

Conclusion

In this post, you learned how to configure maintenance event notifications for Amazon Redshift provisioned clusters using Amazon SNS. We also explained the details of Amazon Redshift maintenance activities, including how to manage the schedule for upcoming maintenance by using Amazon Redshift maintenance tracks to optimize cluster performance, and using RSS feeds to receive real-time updates about critical cluster information.Upgrading your Amazon Redshift clusters to the suggested maintenance track is critical for optimizing cluster performance and to help to ensure that the latest fixes, security patches and enhancements are applied to your clusters. Seamless integration with the Amazon SNS notification system helps ensure that you’re informed of maintenance events ahead of time, so that you can prepare for them. This proactive approach helps you to plan effectively and maintain communication with your users about scheduled system updates.

To learn more about Amazon Redshift cluster versions and maintenance windows, see to Cluster versions for Amazon Redshift, Cluster maintenance, and MaintenanceTrack.


About the authors

Sushmita Barthakur

Sushmita Barthakur

Sushmita is a Senior Data Solutions Architect at AWS, supporting Strategic customers architect their data workloads on AWS. With a background in data analytics, she has extensive experience helping customers architect and build enterprise data lakes, ETL workloads, data warehouses and data analytics solutions, both on-premises and the cloud. Sushmita is based in Florida and enjoys traveling, reading and playing tennis.

Nidhi Nayak

Nidhi Nayak

Nidhi is a Senior Technical Account Manager with AWS, she helps enterprise customers build scalable, high-performance cloud applications and optimize cloud operations. With over a decade of experience in Data Analytics, Nidhi currently focuses on Redshift & Generative AI integration with Redshift.

Rajesh Pentapati

Rajesh Pentapati

Rajesh is a Solutions Architect at AWS. He has expertise in designing and implementing sophisticated enterprise data platforms, comprehensive data warehousing strategies, and innovative analytics solutions, with a emphasis on leveraging Amazon Redshift’s powerful capabilities. Beyond his professional accomplishments, finds joy in playing sports and cherishing quality moments with his family and friends.

File integrity monitoring with AWS Systems Manager and Amazon Security Lake 

Post Syndicated from Adam Nemeth original https://aws.amazon.com/blogs/security/file-integrity-monitoring-with-aws-systems-manager-and-amazon-security-lake/

Customers need solutions to track inventory data such as files and software across Amazon Elastic Compute Cloud (Amazon EC2) instances, detect unauthorized changes, and integrate alerts into their existing security workflows.

In this blog post, I walk you through a highly scalable serverless file integrity monitoring solution. It uses AWS Systems Manager Inventory to collect file metadata from Amazon EC2 instances. The metadata is sent through the Systems Manager Resource Data Sync feature to a versioned Amazon Simple Storage Service (Amazon S3) bucket, storing one inventory object for each EC2 instance. Each time a new object is created in Amazon S3, an Amazon S3 Event Notification triggers a custom AWS Lambda function. This Lambda function compares the latest inventory version with the previous one to detect file changes. If a file that isn’t expected to change has been created, modified, or deleted, the function creates an actionable finding in AWS Security Hub. Findings are then ingested by Amazon Security Lake in a standard OCSF format, which centralizes and normalizes the data. Finally, the data can be analyzed using Amazon Athena for one-time queries, or by building visual dashboards with Amazon QuickSight and Amazon OpenSearch Service. Figure 1 summarizes this flow:

Figure 1: File integrity monitoring workflow

Figure 1: File integrity monitoring workflow

This integration offers an alternative to the default AWS Config and Security Hub integration, which relies on limited data (for example, no file modification timestamps). The solution presented in this post provides control and flexibility to implement custom logic tailored to your operational needs and support security-related efforts.

This flexible solution can also be used with other Systems Manager Inventory metadata, such as installed applications, network configurations, or Windows registry entries, enabling custom detection logic across a wide range of operational and security use cases.

Now let’s build the file integrity monitoring solution.

Prerequisites

Before you get started, you need an AWS account with permissions to create and manage AWS resources such as Amazon EC2, AWS Systems Manager, Amazon S3, and Lambda.

Step 1: Start an EC2 instance

Start by launching an EC2 instance and creating a file that you will later modify to simulate an unauthorized change.

Create an AWS Identity and Access Management (IAM) role to allow the EC2 instance to communicate with Systems Manager:

  1. Open the AWS Management Console and go to IAM, choose Roles from the navigation pane, and then choose Create role.
  2. Under Trusted entity type, select AWS service, select EC2 as the use case, and choose Next.
  3. On the Add permissions page, search for and select the AmazonSSMManagedInstanceCore IAM policy, then choose Next.
  4. Enter SSMAccessRole as the role name and choose Create role.
  5. The new SSMAccessRole should now appear in your list of IAM roles:
Figure 2: Create an IAM role for communication with Systems Manager

Figure 2: Create an IAM role for communication with Systems Manager

Start an EC2 instance:

  1. Open the Amazon EC2 console and choose Launch Instance.
  2. Enter a Name, keep the default Linux Amazon Machine Image (AMI), and select an Instance type (for example, t3.micro).
  3. Under Advanced details:
    1. IAM instance profile, select the previously created SSMAccessRole
    2. Create a fictitious payment application configuration file in the /etc/paymentapp/ folder on the EC2 instance. Later, you will modify it to demonstrate a file-change event for integrity monitoring. To create this file during EC2 startup, copy and paste the following script into User data.
#!/bin/bash
mkdir -p /etc/paymentapp
echo "db_password=initial123" > /etc/paymentapp/config.yaml

Figure 3: Adding the application configuration file

Figure 3: Adding the application configuration file

  1. Leave the remaining settings as default, choose Proceed without key pair, and then select Launch Instance. A key pair isn’t required for this demo because you use Session Manager for access.

Step 2: Enable Security Hub and Security Lake

If Security Hub and Security Lake are already enabled, you can skip to Step 3.
To start, enable Security Hub, which collects and aggregates security findings. AWS Security Hub CSPM adds continuous monitoring and automated checks against best practices.

  1. Open the Security Hub console.
  2. Choose Security Hub CSPM from the navigation pane and then select Enable AWS Security Hub CSPM and choose Enable Security Hub CSPM at the bottom of the page.

Note: For this demo, you don’t need the Security standards options and can clear them.

Figure 4: Enable Security Hub CSP

Figure 4: Enable Security Hub CSP

Next, activate Security Lake to start collecting actionable findings from Security Hub:

  1. Open the Amazon Security Lake console and choose Get Started.
  2. Under Data sources, select Ingest specific AWS sources.
  3. Under Log and event sources, select Security Hub (you will use this only for this demo):
Figure 5: Select log and event sources

Figure 5: Select log and event sources

  1. Under Select Regions, choose Specific Regions and make sure you select the AWS Region that you’re using.
  2. Use the default option to Create and use a new service role.
  3. Choose Next and Next again, then choose Create.

Step 3: Configure Systems Manager Inventory and sync to Amazon S3

With Security Hub and Security Lake enabled, the next step is to enable Systems Manager Inventory to collect file metadata and configure a Resource Data Sync to export this data to S3 for analysis.

  1. Create an S3 bucket by carefully following the instructions in the section To create and configure an Amazon S3 bucket for resource data sync.
  2. After you created the bucket, enable versioning in the Amazon S3 console by opening the bucket’s Properties tab, choosing Edit under Bucket Versioning, selecting Enable, and saving your changes. Versioning causes each new inventory snapshot to be saved as a separate version, so that you can track file changes over time.

Note: In production, enable S3 server access logging on the inventory bucket to keep an audit trail of access requests, enforce HTTPS-only access, and enable CloudTrail data events for S3 to record who accessed or modified inventory files.

The next step is to enable Systems Manager Inventory and set up the resource data sync:

  1. In the Systems Manager console, go to Fleet Manager, choose Account management, and select Set up inventory.
  2. Keep the default values but deselect every inventory type except File. Set a Path to limit collection to the files relevant for this demo and your security requirements. Under File, set the Path to: /etc/paymentapp/.
Figure 6: Set the parameters and path

Figure 6: Set the parameters and path

  1. Choose Setup Inventory.
  2. In Fleet Manager, choose Account management and select Resource Data Syncs.
  3. Choose Create resource data sync, enter a Sync name, and enter the name of the versioned S3 bucket you created earlier.
  4. Select This Region and then choose Create.

Step 4: Implement the Lambda function

Next, complete the setup to detect changes and create findings. Each time Systems Manager Inventory writes a new object to Amazon S3, an S3 Event Notification triggers a Lambda function that compares the latest and previous object versions. If it finds created, modified, or deleted files, it creates a security finding. To accomplish this, you will create the Lambda function, set its environment variables, add the helper layer, and attach the required permissions.

The following is an example finding generated in AWS Security Finding Format (ASFF) and sent to Security Hub. In this example, you see a notification about a file change on the EC2 instance listed under the Resources section.

{
	...
"Id": "fim-i-0b8f40f4de065deba-2025-07-12T13:48:31.741Z",
	"AwsAccountId": "XXXXXXXXXXXX",
	"Types": [
		"Software and Configuration Checks/File Integrity Monitoring"
	],
	"Severity": {
		"Label": "MEDIUM"
	},
	"Title": "File changes detected via SSM Inventory",
	"Description": "0 created, 1 modified, 0 deleted file(s) on instance i-0b8f40f4de065deba",
	"Resources": [
		{
			"Type": "AwsEc2Instance",
			"Id": "i-0b8f40f4de065deba"
		}
	],
	...
}

Create the Lambda function

This function detects file changes, reports findings, and removes unused Amazon S3 object versions to reduce costs.

  1. Open the Lambda console and choose Create function in the navigation pane.
  2. For Function Name enter fim-change-detector.
  3. Select Author from scratch, enter a function name, select the latest Python runtime, and choose Create function.
  4. On the Code tab, paste the following main function and choose Deploy.
import boto3, os, json, re
from datetime import datetime, UTC
from urllib.parse import unquote_plus
from helpers import is_critical, load_file_metadata, is_modified, extract_instance_id

s3 = boto3.client('s3')
securityhub = boto3.client('securityhub')

CRITICAL_FILE_PATTERNS = os.environ["CRITICAL_FILE_PATTERNS"].split(",")
SEVERITY_LABEL = os.environ["SEVERITY_LABEL"]
	
def lambda_handler(event, context):
	# Safe event handling
	if "Records" not in event or not event["Records"]:
		return

	# Extract S3 event
	record = event['Records'][0]
	bucket = record['s3']['bucket']['name']
	key = unquote_plus(record['s3']['object']['key'])
	current_version = record['s3']['object'].get('versionId')
	if not current_version:
		return

	# Fetching the region name
	account_id = context.invoked_function_arn.split(":")[4]
	region = boto3.session.Session().region_name

	# Get object versions (latest first)
	versions = s3.list_object_versions(Bucket=bucket, Prefix=key).get('Versions', [])
	versions = sorted(versions, key=lambda v: v['LastModified'], reverse=True)

	# Find previous version
	idx = next((i for i,v in enumerate(versions) if v["VersionId"] == current_version), None)
	if idx is None or idx + 1 >= len(versions):
		return
	prev_version = versions[idx+1]["VersionId"]

	# Load both versions
	current = load_file_metadata(bucket, key, current_version)
	previous = load_file_metadata(bucket, key, prev_version)

	# Compare
	created = {p for p in set(current) - set(previous) if is_critical(p)}
	deleted = {p for p in set(previous) - set(current) if is_critical(p)}
	modified = {p for p in set(current) & set(previous) if is_critical(p) and is_modified(p, current, previous)}

	# Report if changes were found
	if created or deleted or modified:
		instance_id = extract_instance_id(bucket, key, current_version)
		now = datetime.now(UTC).isoformat(timespec='milliseconds').replace('+00:00', 'Z')
		finding = {
			"SchemaVersion": "2018-10-08",
			"Id": f"fim-{instance_id}-{now}",
			"ProductArn": f"arn:aws:securityhub:{region}:{account_id}:product/{account_id}/default",
			"AwsAccountId": account_id,
			"GeneratorId": "ssm-inventory-fim",
			"CreatedAt": now,
			"UpdatedAt": now,
			"Types": ["Software and Configuration Checks/File Integrity Monitoring"],
			"Severity": {"Label": SEVERITY_LABEL},
			"Title": "File changes detected via SSM Inventory",
			"Description": (
				f"{len(created)} created, {len(modified)} modified, "
				f"{len(deleted)} deleted file(s) on instance {instance_id}"
			),
			"Resources": [{"Type": "AwsEc2Instance", "Id": instance_id}]
		}
		securityhub.batch_import_findings(Findings=[finding])

	# No change – delete older S3 version
	else:
		if prev_version != current_version:
			try:
				s3.delete_object(Bucket=bucket, Key=key, VersionId=prev_version)
			except Exception as e:
				print(f"Delete previous S3 object version failed: {e}")

Note: In production, set Lambda reserved concurrency to prevent unbounded scaling, configure a dead letter queue (DLQ) to capture failed invocations, and optionally attach the function to an Amazon VPC for network isolation.

Configure environment variables

Configure the two required environment variables in the Lambda console. These two variables (one for critical paths to monitor and one for security finding severity) must be set or the function will fail.

  1. Open the Lambda console and choose Configuration and then select Environment variables.
  2. Choose Edit and then choose Add environment variable.
  3. Under Key, choose CRITICAL_FILE_PATTERNS
    1. Enter ^/etc/paymentapp/config.*$ as the value.
    2. Set the SEVERITY_LABEL to MEDIUM.
Figure 7: CRITICAL_FILE_PATTERNS and SEVERITY_LABEL configuration

Figure 7: CRITICAL_FILE_PATTERNS and SEVERITY_LABEL configuration

Set up permissions

The next step is to attach permissions to the Lambda function

  1. In your Lambda function, choose Configuration and then select Permissions.
  2. Under Execution role, select the role name that will lead to the role in IAM.
  3. Choose Add permissions and select Create inline policy. Select JSON view.
  4. Paste the following policy, and make sure to replace <bucket-name> with the name of your S3 bucket, and you also update <region> and <account-id> with your AWS Region and Account ID:
{
"Version": "2012-10-17",
"Statement": [
	{
		"Effect": "Allow",
		"Action": "securityhub:BatchImportFindings",
		"Resource": "arn:aws:securityhub:<region>:<account-id>:product/<account-id>/default"
	},
	{
		"Effect": "Allow",
		"Action": [
			"s3:GetObject",
			"s3:GetObjectVersion",
			"s3:ListBucketVersions",
			"s3:DeleteObjectVersion"
		],
		"Resource": [
			"arn:aws:s3:::<bucket-name>",
			"arn:aws:s3:::<bucket-name>/*"
			]
		}
	]
}

  1. To finalize, enter a Policy name and choose Create policy.

Add functions to the Lambda layer

For better modularity, add some helper functions to a Lambda layer. These functions are already referenced in the import section of the preceding Lambda function’s Python code. The helper functions check critical paths, load file metadata, compare modification times, and extract the EC2 instance ID.

Open AWS CloudShell from the top-right corner of the AWS console header, then copy and paste the following script and press Enter. It creates the helper layer and attaches it to your Lambda function.

#!/bin/bash
set -e
FUNCTION_NAME="fim-change-detector"
LAYER_NAME="fim-change-detector-layer"

mkdir -p python
cat > python/helpers.py << 'EOF'
import json, re, os
from dateutil.parser import parse as parse_dt
import boto3
s3 = boto3.client('s3')
CRITICAL_FILE_PATTERNS = os.environ.get("CRITICAL_FILE_PATTERNS", "").split(",")

def is_critical(path):
	return any(re.match(p.strip(), path) for p in CRITICAL_FILE_PATTERNS if p.strip())

def load_file_metadata(bucket, key, version_id):
	obj = s3.get_object(Bucket=bucket, Key=key, VersionId=version_id)
	data = {}
	for line in obj['Body'].read().decode().splitlines():
		if line.strip():
			i = json.loads(line)
			n, d, m = i.get("Name","").strip(), i.get("InstalledDir","").strip(), i.get("ModificationTime","").strip()
			if n and d and m: data[f"{d.rstrip('/')}/{n}"] = m
	return data

def is_modified(path, current, previous):
	try: return parse_dt(current[path]) != parse_dt(previous[path])
	except: return current[path] != previous[path]

def extract_instance_id(bucket, key, version_id):
	obj = s3.get_object(Bucket=bucket, Key=key, VersionId=version_id)
	for line in obj['Body'].read().decode().splitlines():
		if line.strip():
			r = json.loads(line)
			if "resourceId" in r: return r["resourceId"]
	return None
EOF

zip -r helpers_layer.zip python >/dev/null
LAYER_VERSION_ARN=$(aws lambda publish-layer-version \
	--layer-name "$LAYER_NAME" \
	--description "Helper functions for File Integrity Monitoring" \
	--zip-file fileb://helpers_layer.zip \
	--compatible-runtimes python3.13 \
	--query 'LayerVersionArn' \
	--output text)

aws lambda update-function-configuration \
	--function-name "$FUNCTION_NAME" \
	--layers "$LAYER_VERSION_ARN" >/dev/null
echo "Layer created and attached to the Lambda function."

Step 5: Set up S3 Event Notifications

Finally, set up S3 Event Notifications to trigger the Lambda function when new inventory data arrives.

  1. Open the S3 console and select the Systems Manager Inventory bucket that you created.
  2. Choose Properties and select Event notifications.
  3. Choose Create event notification.
    1. Enter an Event name.
    2. In the Prefix field, enter AWS%3AFile/ to limit Lambda triggers to file inventory objects only.
      Note: The prefix contains a : character, which must be URL-encoded as %3A.
    3. Under Event types, select Put.
    4. At the bottom, select your newly created Lambda function, and choose Save changes.

In this example, inventory collection runs every 30 minutes (48 times each day) but can be adjusted based on security requirements to optimize costs. The Lambda function is triggered once for each instance whenever a new inventory object is created. You can further reduce event volume by filtering EC2 instances through S3 Event Notification prefixes, enabling focused monitoring of high-value instances.

Step 6: Test the file change detection flow

Now that the EC2 instance is running and the sample configuration file /etc/paymentapp/config.yaml has been initialized, you’re ready to simulate an unauthorized change to test the file integrity monitoring setup.

  1. Open the Systems Manager console.
  2. Go to Session Manager and choose Start session.
  3. Select your EC2 instance and choose Start Session.
  4. Run the following command to modify the file:

echo “db_password=hacked456" | sudo tee /etc/paymentapp/config.yaml

This simulates a configuration tampering event. During the next Systems Manager Inventory run, the updated metadata will be saved to Amazon S3.

To manually trigger this:

  1. Open the Systems Manager console and choose State Manager.
  2. Select your association and choose Apply association now to start the inventory update.
  3. After the association status changes to Success, check your SSM Inventory S3 bucket in the AWS:File folder and review the inventory object and its versions.
  4. Open the Security Hub console and choose Findings. After a short delay, you should see a new finding like the one shown in Figure 8:
Figure 8: View file change findings

Figure 8: View file change findings

Step 7: Query and visualize findings

While Security Hub provides a centralized view of findings, you can deepen your analysis using Amazon Athena to run SQL queries directly on the normalized Security Lake data in Amazon S3. This data follows the Open Cybersecurity Schema Framework (OCSF), which is a vendor-neutral standard that simplifies integration and analysis of security data across different tools and services.

The following is an example Athena query:

SELECT
	finding_info.desc AS description,
	class_uid AS class_id,
	severity AS severity_label,
	type_name AS finding_type,
	time_dt AS event_time,
	region,
	accountid
FROM amazon_security_lake_table_us_east_1_sh_findings_2_0

Note: Be sure to adjust the FROM clause for other Regions. Security Lake processes findings before they appear in Athena, so expect a short delay between ingestion and data availability.
You will see a similar result for the preceding query, shown in Figure 9:

Figure 9: Athena query result in the Amazon Athena query editor

Figure 9: Athena query result in the Amazon Athena query editor

Security Lake classifies this finding as an OCSF 2004 Class, Detection Finding. You can explore the full schema definitions at OCSF Categories. For more query examples, see the Security Lake query examples.
For visual exploration and real-time insights, you can integrate Security Lake with OpenSearch Service and QuickSight, both of which now offer extensive generative AI support. For a guided walkthrough using QuickSight, see How to visualize Amazon Security Lake findings with Amazon QuickSight.

Clean up

After testing the step-by-step guide, make sure to clean up the resources you created for this post to avoid ongoing costs.

  1. Terminate the EC2 instance
  2. Delete the Resource Data Sync and Inventory Association
  3. Remove the Lambda function.
  4. Disable Security Lake and Security Hub CSPM
  5. Delete IAM roles created for this post
  6. Delete the associated SSM Resource Data Sync and Security Lake S3 buckets.

Conclusion

In this post, you learned how to use Systems Manager Inventory to track file integrity, report findings to Security Hub, and analyze them using Security Lake.
You can access the full sample code to set up this solution in the AWS Samples repository.
While this post uses a single-account, single-Region setup for simplicity, Security Lake supports collecting data across multiple accounts and Regions using AWS Organizations. You can also use a Systems Manager resource data sync to send inventory data to a central S3 bucket.

Getting Started with Amazon Security Lake and Systems Manager Inventory provides guidance for enabling scalable, cloud-centric monitoring with full operational context.

Adam Nemeth
Adam Nemeth

Adam is a Senior Solutions Architect and generative AI enthusiast at AWS, helping financial services customers by embracing the Day 1 culture and customer obsession of Amazon. With over 24 years of IT experience, Adam previously worked at UBS as an architect and has also served as a delivery lead, consultant, and entrepreneur. He lives in Switzerland with his wife and their three children.

Create a customizable cross-company log lake, Part II: Build and add Amazon Bedrock

Post Syndicated from Colin Carson original https://aws.amazon.com/blogs/big-data/create-a-customizable-cross-company-log-lake-part-ii-build-and-add-amazon-bedrock/

In Part I, we introduced the business background behind Log Lake. In this post, we describe how to build it, and how to add model invocation logs from Amazon Bedrock.

The original use case of Log Lake was to join AWS CloudTrail logs (with StartSession API calls) with Amazon CloudWatch logs (with session keystrokes from within Session Manager, a capability of AWS Systems Manager), to help a manager review an employee’s use of elevated permissions to determine if the use was appropriate. Because there might be only one event of elevated privileges in millions or billions of rows of log data, finding the right row to review was like looking for a needle in a haystack.

Log Lake is not just for Session Manager, but also general purpose CloudTrail and CloudWatch logs. After adding CloudWatch and CloudTrail logs to raw tables at scale, you can set up AWS Glue jobs to process the many tiny JSON files of raw tables into bigger binary files for “readready” tables. Then, these readready tables could be queried with different filters to answer questions for many use cases, such as legal or regulatory reviews for compliance, deep forensic investigations for security, or auditing. Log Lake is an answer to the question “Are there logs, and if so, how do I get them?”

Solution overview

Log Lake is a data lake for compliance-related use cases, uses CloudTrail and CloudWatch as data sources, has separate tables for writing (original in raw JSON file format) and reading (read-optimized readready in transformed Apache ORC file format), and gives you control over the components so you can customize it for yourself.

The following diagram shows the system architecture.

The workflow consists of the following steps:

  1. An employee uses Session Manager to access Amazon Elastic Compute Cloud (Amazon EC2). Sessions might include sessionContext.sourceIdentity if a principal provided it while assuming a role (requires sts:SetSourceIdentity in the role trust policy). Our AWS Glue jobs filtered on this field to reduce cost and improve performance.
  2. Logging in to an EC2 instance using Session Manager and performing actions during a session triggers two kinds of logs: CloudTrail records API activity (StartSession) and CloudWatch records session data from within the service (sessionData). Sample CloudTrail and CloudWatch log files are in the GitHub repository, generated from a real Systems Manager session. We recommend you upload these files in your first deployment, but alternatively, you can generate your own data files.
  3. An Amazon Data Firehose subscription copies logs to Amazon Simple Storage Service (Amazon S3) using a CloudWatch subscription filter. CloudWatch combines multiple log events into one Firehose record when it is sent using subscription filters. This is why Log Lake uses regex serde to process CloudWatch rather than JSON serde. When using Firehose subscription filters, Firehose compresses data with GZIP level 6 compression.
  4. Optionally, replication rules copy files to consolidated S3 buckets.
  5. The AddAPart AWS Lambda function associates many tiny JSON files with raw Hive tables in the Data Catalog using the AWS Glue API, triggered by S3 event notifications.
  6. The AWS Glue job reads raw tables and writes to bigger binary ORC files, a columnar file format suitable for analytics. Amazon Athena needs JSON documents on separate lines for processing. In our benchmarking using CloudWatch and CloudTrail workloads, ORC ZLIB had the fastest (lowest) query duration, and was half the file size of Parquet Snappy (1246 MB ORC ZLIB vs 2.4GB Parquet Snappy). Also, ORC is used by AWS CloudTrail Lake. To test file formats, logs from CloudTrail Systems Manager (eventsource='ssm.amazonaws.com') were copied to generate a total population of JSON files over 500 GB. First, a JSON table was created. Then two additional tables were created using Athena CTAS: one for ORC ZLIB, and one for Parquet Snappy. Tests compared three subsequent query durations for three different workloads across ORC vs. Parquet.
  7. The AddAPart Lambda function associates ORC files with Hive readready tables. AddAPart for readready is created using the same stack as for raw, but different parameters (bucket, table, and so on). Hive table format was used for raw because incoming files were JSON, and readready used Hive (not Iceberg) for consistency and append only operations.
  8. Users can query readready tables using the Athena API.

Log Lake uses multiple services together:

  • CloudTrail logs for StartSession API activity (required for auditing, compliance, legal purposes)
  • CloudWatch logs to extend and add keystrokes from Session Manager, so what happened within a session can be reviewed for appropriate use
  • Lambda and Amazon Simple Queue Service (Amazon SQS) for asynchronous invocation of S3 event notifications, for serverless event-driven processing to associate data files with metadata tables
  • The Data Catalog as a metastore to register table metadata, either standalone or as part of a data mesh architecture
  • AWS Glue Spark jobs to transform data from original raw format to read-optimized tables
  • Athena for one-time queries

The architecture of Log Lake includes the following design choices:

  • Separate tables for writing (raw) and reading (readready).
  • Asynchronous invocation using Lambda and Amazon SQS to add partitions for files (AddAPart).
  • AWS Glue jobs with Spark SQL and views (“many view”).
  • AWS services designed to do one thing well, such as Amazon S3 for storage and Amazon SQS for message queueing. This gives data engineers control over components for cost or customization.

Separate tables for reading (readready) and writing (raw)

The concept of raw and readready tables represents two distinct approaches to data storage and processing, each serving different purposes in a data architecture:

  • Raw tables – Source-aligned and write-optimized. They are backed by many tiny files (KB in size) in original format. For CloudWatch and CloudTrail, this means JSON file format.
  • ReadReady tables – Source-aligned and read-optimized. They are backed by bigger binary files, usually larger than 10 MB, in columnar file format.

Part I contains our comparison of performance, cost, and convenience of both table layers.

Add partition Lambda functions (AddAPart)

Log Lake uses an event-based, asynchronous invocation approach to add partitions to raw tables. We call this approach “AddAPart with LoLLs” (Lots of Little Lambdas). It is optimized for adding new incoming files in text format to existing Hive tables as fast as possible, with the following assumptions:

  • Incoming raw files are in JSON or CSV and must be stored and queried in original format (can’t be changed to Iceberg-compatible formats such as Parquet or ORC). Append only, not merge or update.
  • Partition management must be automatic.
  • File-based, no dependency on a job (files can be landed by different pipelines in different ways, and handled consistently by the same AddAPart function).
  • No dependency on Athena partition projection (Data Catalog only).

The AddAPart function consists of five steps:

  1. An S3 event notification triggers the AddAPart producer Lambda function.
  2. The AddAPart producer sends messages to a first-in-first-out (FIFO) SQS queue.
  3. Amazon SQS helps prevent duplicate messages using MessageDeduplicationId.
  4. The AddAPart consumer processes a message and translates it to a partition placer profile.
  5. The AddAPart consumer uses the AWS Glue API to create a partition if none exists.

The following are some ways we have used AddAPart:

  • Minimizing the time it takes to associate new data (JSON files) with new partitions (table in Hive).
  • Reducing the cost of partition adding (duplicate S3 prefixes are ignored).
  • Altering file names (Data Firehose postprocessing Lambda functions are an alternative).
  • Customization, such as ignoring files with certain regex patterns in the S3 prefix or file name. If you want to exclude a data source or do an emergency power off, you can do it from within AddAPart without modifying other resources.

“Many view” AWS Glue jobs

Both Log Lake jobs are what we call “many view” AWS Glue jobs, which use createOrReplaceTempView from Spark, using code like the following:

from pyspark.sql import DataFrame, SparkSession
# code
def create_view_from_sqlstatement(
    logger: logging.Logger, spark: SparkSession, sqlstatement: str, name_of_view: str
) -> None:
    """
    Create a view from a SQL statement.
    """
    result_as_df = spark.sql(sqlstatement)
    result_as_df.createOrReplaceTempView(name_of_view)
    logger.info(f"created view {name_of_view} from sqlstatement...")
# code
name_of_view = "some_step_as_view"
sql_statement = some_statement_for_step
create_view_from_sqlstatement(
logger,
spark,
sql_statement,
name_of_view,
)
sql_statement_for_job="select * from some_step_as_view"
returned_df = spark.sql(sql_statement_for_job)

We have used this approach to address the following antipatterns:

  • Trying to do everything in one step – Trying to do all operations and relational algebra in a single Spark SQL statement can become too complex to troubleshoot, understand, or maintain. For us, when we see a single statement with at least 200 lines and 2 subqueries, we prefer to break it down into smaller statements.
  • Code that is not standardized (inconsistent APIs and approaches) that is harder to maintain, support, and enhance – We have seen the freedom of Spark to mix API approaches (Spark SQL API, RDD API, DataFrame API) result in inconsistency and complexity in large code bases with many contributors.
  • Mixing business logic with Spark environment (such as session settings) – Business logic should be separate and portable.

AWS Glue jobs with custom bounded execution and tables that support workload partitioning

You can tell AWS Glue jobs to look at a maximum of n days or n rows with custom bounds, which we implement using Spark Data Frames as follows:

name_of_view = "mybounds_as_view"

sql_statement = f"""
SELECT (current_timestamp() - INTERVAL {days_begin} DAY) floor_as_time
,cast((current_timestamp() - INTERVAL {days_begin} DAY) AS date) floor_as_date
,cast((current_timestamp() + INTERVAL  {days_end} DAY) AS date) ceiling_as_date
"""

Also, jobs can prune data using table partitions (and use partition indexes). This helps you prepare routine mechanisms up front that are ready to run and recover from missing data by running relative backfill jobs until data is up to date.

Prerequisites

Complete the following prerequisite steps to implement this solution:

  1. Download the repository:
    git clone https://github.com/aws-samples/sample-log-lake-for-compliance.git

  2. Create or identify an S3 bucket to use during the walkthrough. This will be used for storing the AWS Glue job scripts, Lambda Python files, and AWS CloudFormation stacks.
  3. Copy all files under log_lake to the S3 bucket.
  4. If the S3 bucket is encrypted using an AWS Key Management Service (AWS KMS) key, note the Amazon Resource Name (ARN) of the key.

Build Log Lake

To build Log Lake, follow the deployment steps in the how_to_deploy.md file in the repo.

After deployment is complete, you can upload demo data files and run the AWS Glue jobs to demo how to answer the question, “Who did what in session manager?” For this, switch over to the how_to_demo.md file and follow the steps.

When you are done, you should see the following tables in the Data Catalog:

  • from_cloudtrail_readready – Contains processed CloudTrail session data
  • from_cloudwatch_readready – Contains processed CloudWatch session logs

You can view them on the AWS Glue console or query them directly in Athena. The following is a sample query from the repository that shows how to join both tables to get API activity from CloudTrail and join it to session data (keystrokes) from CloudWatch:

SELECT t.eventsource 
,t.eventname 
,t.eventtime 
,w.logaccountid 
,w.loggroup 
,w.subscriptionfilters 
,w.eventtime as eventtime_from_cloudwatch
,w."session" as session_from_cloudwatch
 FROM loglakeblog.from_cloudwatch_readready w 
 inner join loglakeblog.from_cloudtrail_readready t
on  w.f_sessionid=t.f_sessionid

Add Amazon Bedrock model invocation logs

Adding Bedrock model invocation logs to Log Lake is important to enable human review of agent actions with elevated permissions. Some examples of the need for human oversight are tool use, computer use, agentic misalignment, and high impact AI in federal agencies. If you have not considered this use case and are using LLMs, we urge you to review Amazon Bedrock logs and consider either a managed product or a self-built data lake like Log Lake.

In this post, we use “agentic” and “agent” to refer to a large language model (LLM) using tools with some autonomy to iterate toward a goal.

To generate model invocation logs for this post, we created a custom Lambda function to ask Anthropic’s Claude 4.5 to list files in a bucket using a tool. We used this as a plausible future scenario where a human might need to review an agent’s actions and logs to decide if an agent’s tool use was appropriate.

The following diagram shows the components involved.

For logging inputs and outputs of LLMs running on Bedrock, refer to Monitor model invocation using CloudWatch Logs and Amazon S3. For simplicity, we avoided CloudWatch logs and set up logging directly to Amazon S3.

For logging API activity for Amazon Bedrock, refer to Monitor Amazon Bedrock API calls using CloudTrail.

We have included examples of the CloudTrail and CloudWatch files from Amazon Bedrock model invocation logs in the repository.

Before you create the model invocation logs, make sure you have created the from_cloudtrail_readready table from the previous steps.

Follow the steps in the GItHub repo to add Amazon Bedrock model invocation logs to Log Lake. When done, you should have the tablereplace_me_with_your_database.from_bedrock_readready.

You can query this table using Athena and join it to from_cloudtrail_readready, using SQL like the following example from the repo:

SELECT 
t.useridentity_arn 
,t.eventtime 
,t.eventsource 
,t.eventname 
,b.request_time 
,b.modelid 
,regexp_extract(b.input_messages, '^(.*)({"input":{.*"type":"tool_use"})(.*)$', 2) as input_message_with_tool_use
,b.input_messages
,b.input_inputtokencount
,b.output_outputbodyjson_content
,b.output_outputtokencount
FROM loglakeblog.from_cloudtrail_readready t
left outer join loglakeblog.from_bedrock_readready b 
on t.requestid = b.requestid 
where t.logcalendarday>20240601

Use an agent to review an agent

The predefined query we used in our demo is what we used when we knew the needle in the haystack (tool_use in input messages), but this approach wouldn’t work for new, unknown patterns that require running SQL queries in multiple steps to understand complex data.

Our solution includes a method for an agent in Amazon Bedrock to review an agent in Amazon Bedrock. In this post’s repository, we include a Log Lake Looker Lambda function, which uses an LLM (Anthropic’s Claude) to talk to a database (the Log Lake AWS Glue database).

This pattern is not new. It has been described in 2024 in the paper DB-GPT: Empowering Database Interactions with Private Large Language Models as “a paradigm shift in database interactions, offering a more natural, efficient, and secure way to engage with data repositories.” This is an extension of an older idea from 1998: an interface to data was described in the Distributed Computing Manifesto as “the client is no longer dependent on the underlying data structure or even where the data is located.”

Using an agent to query Log Lake has multiple benefits:

  • An engineered agent can deliver consistent, reliable, high-quality answers during stressful situations, such as a time-sensitive incident response or high-visibility investigation
  • Users don’t have to write their own queries and can reduce their cognitive load (“What was that long column name?”)
  • It can reduce onboarding and training time (the agent implements the training and specialized knowledge of the data structures)

You can ask Log Lake Looker an open-ended question and get an answer without writing a query. Log Lake Looker performs the following actions for you:

  1. Create a valid SQL query from a natural language user prompt. Log Lake Looker is optimized for the from_bedrock_readready table using a system prompt, like the Anthropic SQL sorcerer example.
  2. Run the query in Athena using a custom tool.
  3. Review tool results (rows) and replies with a simple summary.
    When using input and output that can be verbose, like query results, you might need to manage tokens in your context window. For example, if the sum of input and output tokens exceeds the model’s context window, newer Claude models return a validation error, such as the following error we saw during testing:

    Unexpected ClientError: err=ValidationException('An error occurred (ValidationException) when calling the InvokeModel operation: Input is too long for requested model.') type(err)= error_code='ValidationException' error_message='Input is too long for requested model.'

  4. Compact context by removing tool results. This improves time to answer performance, quality of answer, and reduces proliferation of potentially sensitive data to model invocation logs.
  5. Either run a follow-up query or suggest next steps for the human user.

Log Lake Looker looks at small samples from from_bedrock_readready using more than one try. This means the model reflects on its output and can create a follow-up query based on query results. To learn more about this, we recommend reading about reflection and iterative refinement. We have seen useful responses from agents using iterative approaches, especially when context is managed (for example, a specific system prompt using one table only or a limit on conversational turns) and tool results are compacted.

We’ve seen the agent answer simple questions like “can you query my table and tell me what you find?” in less than 60 seconds more than 50% of the time, without optimizing for any specific question. The following are snippets of CloudWatch logs to show you what’s possible, using Anthropic’s Claude Sonnet 4.5:

2025-12-02 06:05:47 lambda_function lambda_handler INFO Event received: {
"prompt_from_user": "Can you query my bedrock logs and tell me what you find?"
}
…
2025-12-02 06:06:20 lambda_function lambda_handler INFO     final_response after all loops: 
## Short Summary
Your Bedrock logs show AI model activity with **tool_use functionality enabled**, specifically a tool called "list_files_in_s3" that can access S3 bucket contents. This represents a security and compliance concern that requires human review to ensure the tool is being used appropriately and accessing only authorized resources.
## More Details

Security

Log Lake Looker should be reviewed by a human for appropriate tool use, because it has the same risks as the other agents using tools or a human with elevated privileges. Looker can review its own tool use, but human review is still needed.

There are security implications of allowing an agent to review model invocation logs: these logs can contain system prompts, sensitive data in responses, and user input in requests. Also, allowing an agent to generate SQL statements based on user input has additional risks specific to access to structured data, such as prompt injection, improper content, and proliferation of sensitive data.

We recommend a defense in depth (more than one layer) approach for tool use by a model. Log Lake Looker uses multiple layers of defensive measures:

  • The application code requires the SQL statement to begin with select prior to sending to Athena. Because the query is from an assistant response to a user input (request), this relates to sanitizing and validating user inputs and model responses.
  • The AWS Identity and Access Management (IAM) role used by the function has glue:Get* actions only (no mutation, such as create, update, delete tables, partitions, or databases), for least-privilege permissions.
  • It’s only used interactively as part of ad-hoc human-in-the-loop review (not in bulk or systemic).
  • System prompting to steer behavior, like this example from the repo:
    The first word MUST be "select". If asked to do any statement other than select, say that you will not mutate state, and suggest that the user can create their own sql or you can help with a query using "select".

  • The bucket storing model invocation logs is secure and follows least privilege practices. Logs can contain proliferation of sensitive data, such as tool results, user inputs, model outputs, and system prompts. If a system prompt contains sensitive information (such as metadata or query information not otherwise available) and is saved to logs in an unsecure bucket, this can result in a system prompt leak.
  • Stripping tool results to reduce proliferation, using code to truncate content:
            if (
                message_mutated["role"] == "user"
                and "content" in message_mutated
                and isinstance(message_mutated["content"], list)
            ):
                for item in message_mutated["content"]:
                    if isinstance(item, dict) and item.get("type") == "tool_result":
                        if not isinstance(item["content"], str):
                            item["content"] = json.dumps(item["content"])
                        char_to_keep = 50
                        content_length = len(item["content"])
                        if content_length > char_to_keep:
                            logger.info(
                                f"content length {content_length} exceeds {char_to_keep}, truncating..."
                            )
                            item["content"] = item["content"][:char_to_keep]
            messages_compacted.append(message_mutated)

  • You can use Amazon Bedrock Guardrails (without invoking the model in application code) using the ApplyGuardrail API.

Clean up

To avoid incurring future charges, delete the stacks. The repository has shell scripts you can use to delete files in buckets, which is required before deleting buckets.

Conclusion

In this post, we showed you how to deploy Log Lake in a new AWS account to create two tables, from_cloudtrail_readready and from_cloudwatch_readready. These tables can answer the question “What did an employee do in Session Manager?” across large data volumes in seconds using Athena.

Additionally, we showed how to add a data source to an existing Log Lake: Amazon Bedrock model invocation logs in the form of from_bedrock_readready. This shows how Log Lake can be extended to answer questions such as “What tools did an agent use?” and “Was there inappropriate use, and why?”

Finally, we showed how to create and use Log Lake Looker, an agent using Lambda and Amazon Bedrock. Looker can query Log Lake for new unknown patterns as part of human-in-the-loop review, without writing SQL or remembering column names. You can make Log Lake your way. We encourage you to look through the repository and use it as inspiration for your own Log Lake. If you have questions or comments, please let us know!


About the authors

Colin Carson

Colin Carson

Colin is a Data Engineer at AWS ProServe. He has designed and built data infrastructure for multiple teams at Amazon, including Internal Audit, Risk & Compliance, HR Hiring Science, and Security.

Sean O’Sullivan

Sean O’Sullivan

Sean is a Cloud Infrastructure Architect at AWS ProServe. He partners with Global Financial Services customers to drive digital transformation projects, helping them architect, automate, and engineer solutions in AWS.

Secure Apache Spark writes to Amazon S3 on Amazon EMR with dynamic AWS KMS encryption

Post Syndicated from Pinxi Tai original https://aws.amazon.com/blogs/big-data/secure-apache-spark-writes-to-amazon-s3-on-amazon-emr-with-dynamic-aws-kms-encryption/

When processing data at scale, many organizations use Apache Spark on Amazon EMR to run shared clusters that handle workloads across tenants, business units, or classification levels. In such multi-tenant environments, different datasets often require distinct AWS Key Management Service (AWS KMS) keys to enforce strict access controls and meet compliance requirements. At the same time, operational efficiency might drive these organizations to consolidate their data pipelines. Instead of running separate Spark jobs for each dataset, it could be more efficient to run a single job on Amazon EMR that processes inputs once and writes multiple outputs to Amazon Simple Storage Service (Amazon S3), each encrypted with its own KMS key.

Although consolidating multiple datasets in one Spark job reduces orchestration overhead and simplifies code maintenance, you might encounter challenges with encryption configurations. By default, the EMRFS and S3A file system clients cache their settings, which can cause encryption keys to persist incorrectly across writes. This means if you change the encryption key between writes to Amazon S3 in an Apache Hadoop environment, some output files can end up encrypted with unintended keys, leading to possible security and compliance concerns.

In this post, we show how to securely write data to Amazon S3 from Spark jobs running on Amazon EMR, while dynamically managing different KMS keys for encryption. We discuss three approaches to solve this challenge and how to choose the right solution for your use case.

Amazon S3 server-side encryption options with Amazon EMR

When writing data to Amazon S3 from Amazon EMR, you can choose from multiple server-side encryption options. The two most commonly used options are:

  • Server-side encryption with Amazon S3 managed keys (SSE-S3) – Amazon S3 manages the encryption keys for you
  • Server-side encryption with KMS keys (SSE-KMS) – AWS KMS manages the keys, and you can use custom KMS keys with fine-grained access control

When running Spark jobs on Amazon EMR, data writes to Amazon S3 occur through one of the following file system implementations:

  • EMRFS – The default implementation for Amazon EMR versions below 7.10.0
  • S3A – The default implementation starting from Amazon EMR 7.10.0

Both implementations provide configuration properties to control server-side encryption. The following tables show how to specify the KMS key for SSE-KMS encryption.

For EMRFS (default in Amazon EMR versions below 7.10.0), refer to the following table.

Property Description
fs.s3.enableServerSideEncryption
Enables server-side encryption. Defaults to SSE-S3 if no KMS key is provided.
fs.s3.serverSideEncryption.kms.keyId
Specifies the KMS key ID or ARN for SSE-KMS encryption.

For S3A (default in Amazon EMR starting from 7.10.0), refer to the following table.

Property Description
fs.s3a.encryption.algorithm
Specifies the encryption algorithm.
fs.s3a.encryption.key
Specifies the KMS key ID or ARN for SSE-KMS encryption.

Starting from the Amazon EMR 7.10.0 release, the S3A file system has replaced EMRFS as the default EMR S3 connector. For more information, refer to Migration Guide: EMRFS to S3A Filesystem.

Challenges to prevent encryption key reuse due to file system caching

In practice, a unified Spark job might write outputs for multiple tenants or classifications in a single run. In this situation, applying the correct encryption key for each output is critical to maintaining compliance and enforcing isolation in multi-tenant S3 buckets without the complexity of managing separate Spark jobs for each dataset.

When Spark executors write to Amazon S3, they use a file system (EMRFS or S3A) client that is cached and reused for performance optimization. The problem is that each file system instance keeps the encryption settings it was first created with. Each executor’s Java Virtual Machine (JVM) creates and caches a file system (and its underlying S3 client) for a given S3 bucket. This cached instance, along with its encryption configuration, persists throughout the executor’s lifecycle. If you change the encryption key in Spark after some data has been written, the existing cached client can’t pick up the new key.

For example, the following PySpark code first creates a Spark session with S3 server-side encryption enabled. It then writes a DataFrame to two different folders within the same S3 bucket amzn-s3-demo-bucket1, but with different KMS keys. The first write operation writes the data to folder1 using kmsKey1 for encryption, and the second write operation writes to folder2 using kmsKey2.

# Pseudo-code: setting different keys for successive writes to different folders within the same S3 bucket

spark = SparkSession.builder \
.appName("Write data to S3 with KMS") \
.config("spark.hadoop.fs.s3.enableServerSideEncryption", "true") \
.getOrCreate()

df.write.option('fs.s3.serverSideEncryption.kms.keyId', kmsKey1).save("s3://amzn-s3-demo-bucket1/folder1/")
df.write.option('fs.s3.serverSideEncryption.kms.keyId', kmsKey2).save("s3://amzn-s3-demo-bucket1/folder2/")

You might expect files in folder1/ to use kmsKey1 and files in folder2/ to use kmsKey2. But due to caching, the second write can still use the client configured with kmsKey1. This leads to mixed or incorrect encryption key usage across outputs.

Solution overview

Our objective is to achieve correct encryption of each output S3 object with its intended KMS key, even when a single Spark job writes multiple outputs. To implement this, you can use one of the following approaches:

  • Disable file system cache – Turn off S3 client caching so a new client is created for each write, picking up the current key
  • Separate Spark applications or sessions – Run a separate Spark application (or session) for each distinct encryption key, so each client is initialized fresh
  • Use S3 bucket default encryption – Configure bucket-level SSE-KMS with the desired key so Amazon S3 automatically applies the correct encryption key

Each method offers a different balance of implementation complexity, performance, and flexibility. The following sections provide detailed implementation steps and considerations for each approach.

Method 1: Disable file system cache

Disabling the file system cache forces Spark to create a new S3 client for each write, which applies the updated encryption settings. This can be done using a Spark configuration or EMR cluster settings.

The property name for disabling the cache depends on your URI scheme (s3:// or s3a://), not on your choice of file system (EMRFS or S3A). The following table summarizes which configuration property name you should use to disable the cache.

Properties for s3:// URI scheme Properties for s3a:// URI scheme
fs.s3.impl.disable.cache
fs.s3a.impl.disable.cache
spark.hadoop.fs.s3.impl.disable.cache
spark.hadoop.fs.s3a.impl.disable.cache

To use this method, complete the following steps:

  1. Disable the file system cache in Spark configuration.
    For s3:// scheme, you can manually set spark.hadoop.fs.s3.impl.disable.cache=true, for example (PySpark):

    # PySpark example for "s3://"
    # Create Spark session
    spark = SparkSession.builder \
    .appName("Write data to S3 with KMS") \
    .config("spark.hadoop.fs.s3.impl.disable.cache", "true") \
    .getOrCreate()

    Alternatively, you can use the following spark-defaults configuration classification:

    [
      {
        "Classification": "spark-defaults",
        "Properties": {
          "spark.hadoop.fs.s3.impl.disable.cache": "true"
        }
      }
    ]

    For s3a:// scheme, you can manually set spark.hadoop.fs.s3a.impl.disable.cache=true, for example (PySpark):

    # PySpark example for "s3a://"
    # Create Spark session
    spark = SparkSession.builder \
    .appName("Write data to S3 with KMS") \ 
    .config("spark.hadoop.fs.s3a.impl.disable.cache", "true") \
    .getOrCreate()

    Alternatively, you can use the following spark-defaults configuration classification:

    [
      {
        "Classification": "spark-defaults",
        "Properties": {
          "spark.hadoop.fs.s3a.impl.disable.cache": "true"
        }
      }
    ]

  2. Instead of disabling the cache specifically for Spark applications, you can optionally configure the EMR cluster’s core-site.xml to disable the file system cache globally at cluster level. You must configure the /etc/hadoop/conf/core-site.xml file on the primary nodes of your EMR cluster. For example, when creating or modifying the cluster, use the following configuration.
    For s3:// scheme:

    [
      {
        "Classification": "core-site",
        "Properties": {
          "fs.s3.impl.disable.cache": "true"
        }
      }
    ]

    For s3a:// scheme:

    [
      {
        "Classification": "core-site",
        "Properties": { 
          "fs.s3a.impl.disable.cache": "true"
        }
      }
    ]

  3. Enable SSE-KMS encryption.
    For EMRFS, set spark.hadoop.fs.s3.enableServerSideEncryption=true for Spark applications only or use the following configuration to enable encryption at cluster level:

    [
      {
        "Classification": "emrfs-site",
        "Properties": {
          "fs.s3.enableServerSideEncryption": "true"
        }
      }
    ]

    For S3A, set spark.hadoop.fs.s3a.encryption.algorithm=SSE-KMS for Spark applications only or use the following configuration to enable encryption at cluster level:

    [
      {
        "Classification": "core-site",
        "Properties": {
          "fs.s3a.encryption.algorithm": "SSE-KMS"
        }
      }
    ]

  4. When using EMRFS with fs.s3.impl.disable.cache=true, you must also disable the EMRFS S3-optimized committer to avoid errors. You can do this by either manually setting spark.sql.parquet.fs.optimized.committer.optimization-enabled=false or using the following spark-defaults configuration classification:
    [
      {
        "Classification": "spark-defaults",
        "Properties": {
          "spark.sql.parquet.fs.optimized.committer.optimization-enabled": "false"
        }
      }
    ]

For more information about configuring applications on EMR clusters, refer to Configure applications when you create a cluster and Reconfigure an instance group in a running cluster.

Considerations

Use this method when you need to write data to an S3 bucket using multiple KMS keys within a single Spark application. This is a quick, straightforward implementation that works well for the following use cases:

  • Testing environments and debugging sessions
  • Proof-of-concept demonstrations
  • Low-volume or one-time jobs where write performance is not critical
  • Workloads that frequently switch encryption keys to write data to different S3 prefixes within the same bucket

Before implementation, consider the following performance impacts:

  • Increased latency for each write
  • Additional S3 API operations
  • Extra connection overhead

Although this method provides a pragmatic solution when splitting work into separate Spark applications isn’t feasible, we don’t recommend it for high-throughput or latency-sensitive production workloads. The increased API traffic can lead to higher costs and potential throttling. For production implementations, consider Method 2 and Method 3.

Method 2: Use separate Spark applications or sessions

When writing data with multiple encryption keys, use a separate Spark application (or Spark session) for each distinct key. The file system needs to be initialized with the correct encryption key in a fresh JVM context when writing data with different keys. You can achieve this by either submitting a separate Spark application or starting a new Spark session. This enables the S3 client to be created with the intended encryption key.

Complete the following steps:

  1. Divide the write tasks by KMS key. For example, prepare separate DataFrames or filter logic for each key.
  2. Submit separate jobs. Choose either of the following options:
    1. Use spark-submit commands. For example:
      # For EMRFS
      spark-submit –conf spark.hadoop.fs.s3.serverSideEncryption.kms.keyId=kmsKey1 job1.py
      spark-submit --conf spark.hadoop.fs.s3.serverSideEncryption.kms.keyId=kmsKey2 job2.py
      
      # For S3A
      spark-submit –conf spark.hadoop.fs.s3a.server-side-encryption.key=kmsKey1 job1.py
      spark-submit --conf spark.hadoop.fs.s3a.server-side-encryption.key=kmsKey2 job2.py

    2. Use Spark sessions in code (PySpark example):
      # For EMRFS
      for kmsKey in [kmsKey1, kmsKey2]:
          spark = SparkSession.builder \
              .appName("Write data to S3 with KMS") \
              .config("spark.hadoop.fs.s3.enableServerSideEncryption", "true") \
              .config("spark.hadoop.fs.s3.serverSideEncryption.kms.keyId", kmsKey) \
              .getOrCreate()
          write_df_for_key(kmsKey)  # Pseudocode for writing data for this key
          spark.stop()
      
      # For S3A
      for kmsKey in [kmsKey1, kmsKey2]:
          spark = SparkSession.builder \
              .appName("Write data to S3 with KMS") \
              .config("spark.hadoop.fs.s3a.encryption.algorithm", "SSE-KMS") \
              .config("spark.hadoop.fs.s3a.encryption.key", kmsKey) \
              .getOrCreate()
          write_df_for_key(kmsKey)  # Pseudocode for writing data for this key
          spark.stop()

  3. Use your preferred workflow (such as AWS Step Functions, Apache Airflow, or a wrapper script) to launch jobs in sequence or parallel.

Considerations

Use this method when you need a production-grade solution for applying different KMS keys at scale. This approach maintains file system caching benefits and works well for the following use cases:

  • High-throughput or latency-sensitive workloads with frequent write operations
  • Scenarios requiring strong isolation between different KMS keys
  • Multi-tenant environments with separate compliance boundaries

This method creates fresh S3 clients with each new Spark application or session. Compared to Method 1, it offers several advantages:

  • Avoids per-write connection and API overhead
  • Maintains full compatibility with the EMRFS S3-optimized committer
  • Enforces credential boundaries between workloads and improves operational and compliance isolation by assigning each Spark application or session a dedicated key

Before implementation, consider the following trade-offs:

  • Requires orchestration of multiple Spark applications and sessions or clusters
  • Involves higher resource overhead
  • Increases operational complexity

Choose this method when performance, cost predictability, and security isolation are more important than single-process simplicity.

Method 3: Use S3 bucket default encryption

Where possible, configure S3 bucket-level default encryption (SSE-KMS) with the desired KMS key to automatically encrypt objects written to that bucket.

Complete the following steps:

  1. On the Amazon S3 console or using the AWS Command Line Interface (AWS CLI), enable default SSE-KMS for the bucket with the desired key. For instructions on enabling SSE-KMS for S3 buckets, refer to Configuring default encryption.
  2. With default encryption enabled for the S3 bucket, you can write without specifying a KMS key in Spark. Amazon S3 can encrypt each object with the bucket’s key. Your Spark code only needs standard write operations.

Considerations

Use this method when your workloads can use a single KMS key per bucket. This approach works well for the following use cases:

  • Production environments prioritizing operational simplicity
  • Workloads where all data in a bucket shares the same security requirements
  • Scenarios where encryption configuration should be managed at the bucket level
  • Use cases that map naturally to per-bucket separation

This method provides several advantages:

  • Alleviates the need to configure encryption in Spark applications
  • Automatically applies the default KMS key for all writes
  • Simplifies encryption management

Before implementation, consider the following limitations:

  • You must have all data in one bucket to use the same encryption key
  • You can’t apply different keys to different prefixes within the same bucket

Choose this method when you need a simple, reliable approach that provides strong security while simplifying operational management.

Choosing the right approach

Choose the method based on your workload’s security requirements, performance needs, and operational constraints:

  • Method 1 – Use when you need to apply multiple KMS keys within a single Spark job and can accept some performance impact
  • Method 2 – Use for production workloads that require different encryption keys within the same bucket and need optimal performance
  • Method 3 – Use when a single KMS key per bucket meets your encryption requirements and you want simplified operations

Conclusion

In this post, we demonstrated how to handle multiple KMS keys when writing to Amazon S3 from Spark jobs on Amazon EMR. When encrypting multiple outputs with different encryption keys in a single Spark application, it’s important to consider the file system caching behavior. We presented several practical solutions with their respective trade-offs. You can start implementing these solutions in your environment by first testing the file system cache-disable method, which provides a straightforward approach to handling multiple encryption keys. As your workload grows, consider evolving to separate Spark sessions or S3 bucket default encryption based on your specific requirements. After implementing a solution, verify that each S3 object’s SSE-KMS key is the intended one (for example, by checking S3 object metadata). We also recommend measuring job performance and S3 API usage, especially for the cache-disable approach.


About the authors

Pinxi Tai

Pinxi Tai

Pinxi is a Hadoop Systems Engineer at AWS, specializing in big data technologies and Amazon EMR. He focuses on helping customers solve complex distributed computing challenges and is passionate about designing well-structured solutions for large-scale data processing. Outside of work, Pinxi enjoys swimming and football.

IAM Identity Center now supports IPv6

Post Syndicated from Suchintya Dandapat original https://aws.amazon.com/blogs/security/iam-identity-center-now-supports-ipv6/

Amazon Web Services (AWS) recommends using AWS IAM Identity Center to provide your workforce access to AWS managed applications—such as Amazon Q Developer—and AWS accounts. Today, we announced IAM Identity Center support for IPv6. To learn more about the advantages of IPv6, visit the IPv6 product page.

When you enable IAM Identity center, it provides an access portal for workforce users to access their AWS applications and accounts either by signing in to the access portal using a URL or by using a bookmark for the application URL. In either case, the access portal handles user authentication before granting access to applications and accounts. Supporting both IPv4 and IPv6 connectivity to the access portal helps facilitate seamless access for clients, such as browsers and applications, regardless of their network configuration.

The launch of IPv6 support in IAM Identity Center introduces new dual-stack endpoints that support both IPv4 and IPv6, so that users can connect using IPv4, IPv6, or dual-stack clients. Current IPv4 endpoints continue to function with no action required. The dual stack capability offered by Identity Center extends to managed applications. When users access the application dual-stack endpoint, the application automatically routes to the Identity Center dual-stack endpoint for authentication. To use Identity Center from IPv6 clients, you must direct your workforce to use the new dual-stack endpoints, and update configurations on your external identity provider (IdP), if you use one.

In this post, we show you how to update your configuration to allow IPv6 clients to connect directly to IAM Identity Center endpoints without requiring network address translation services. We also show you how to monitor which endpoint users are connecting to. Before diving into the implementation details, let’s review the key phases of the transition process.

Transition overview

To use IAM Identity Center from an IPv6 network and client, you need to use the new dual-stack endpoints. Figure 1 shows what the transition from IPv4 to IPv6 over dual-stack endpoints looks like when using Identity Center. The figure shows:

  • A before state where clients use the IPv4 endpoints.
  • The transition phase, when your clients use a combination of IPv4 and dual-stack endpoints.
  • After the transition is complete, your clients will connect to dual-stack endpoints using their IPv4 or IPv6, depending on their preferences.

Figure 1: Transition from IPv4-only to dual-stack endpoints

Figure 1: Transition from IPv4-only to dual-stack endpoints

Prerequisites

You must have the following prerequisites in place to enable IPv6 access for your workforce users and administrators:

  • An existing IAM Identity Center instance
  • Updated firewalls or gateways to include the new dual-stack endpoints
  • IPv6 capable clients and networks

Work with your network administrators to update the configuration of your firewalls and gateways and to verify that your clients, such as laptops or desktops, are ready to accept IPv6 connectivity. If you have already enabled IPv6 connectivity for other AWS services, you might be familiar with these changes. Next, implement the two steps that follow.

Step 1: Update your IdP configuration

You can skip this step If you don’t use an external IdP as your identity source.

In this step, you update the Assertion Consumer Service (ACS) URL from your IAM Identity Center instance into your IdP’s configuration for single sign-on and the SCIM configuration for user provisioning. Your IdP’s capability determines how you update the ACS URLs. If your IdP supports multiple ACS URLs, configure both IPv4 and dual-stack URLs to enable a flexible transition. With that configuration, some users can continue using IPv4-only endpoints while others use dual-stack endpoints for IPv6. If your IdP supports only one ACS URL, to use IPv6 you must update the new dual-stack ACS URL in your IdP and transition all users to using dual-stack endpoints. If you don’t use an external IdP, you can skip this step and go to the next step.

Update both the SAML single sign-on and the SCIM provisioning configurations:

  1. Update the single sign-on settings in your IdP to use the new dual-stack URLs. First, locate the URLs in the AWS Management Console for IAM Identity Center.
    1. Choose Settings in the navigation pane and then select Identity source.
    2. Choose Actions and select Manage authentication.
    3. in Under Manage SAML 2.0 authentication, you will find the following URLs under Service provider metadata:
      • AWS access portal sign-in URL
      • IAM Identity Center Assertion Consumer Service (ACS) URL
      • IAM Identity Center issuer URL
  2. If your IdP supports multiple ACS URLs, then add the dual-stack URL to your IdP configuration alongside existing IPv4 one. With this setting, you and your users can decide when to start using the dual-stack endpoints, without all users in your organization having to switch together.

    Figure 2: Dual-stack single sign-on URLs

    Figure 2: Dual-stack single sign-on URLs

  3. If your IdP does not support multiple ACS URLs, replace the existing IPv4 URL with the new dual-stack URL, and switch your workforce to use only the dual-stack endpoints.
  4. Update the provisioning endpoint in your IdP. Choose Settings in the navigation pane and under Identity source, choose Actions and select Manage provisioning. Under Automatic provisioning, copy the new SCIM endpoint that ends in api.aws. Update this new URL in your external IdP.

    Figure 3: Dual-stack SCIM endpoint URL

    Figure 3: Dual-stack SCIM endpoint URL

Step 2: Locate and share the new dual-stack endpoints

Your organization needs two kinds of URLs for IPv6 connectivity. The first is the new dual-stack access portal URL that your workforce users use to access their assigned AWS applications and accounts. The dual-stack access portal URL is available in the IAM Identity Center console, listed as the Dual-stack in the Settings summary (you might need to expand the Access portal URLs section, shown in Figure 4).

Figure 4: Locate dual-stack access portal endpoints

Figure 4: Locate dual-stack access portal endpoints

This dual-stack URL ends with app.aws as its top-level domain (TLD). Share this URL with your workforce and ask them to use this dual-stack URL to connect over IPv6. As an example, if your workforce uses the access portal to access AWS accounts, they will need to sign in through the new dual-stack access portal URL when using IPv6 connectivity. Alternately, if your workforce accesses the application URL, you need to enable the dual-stack application URL following application-specific instructions. For more information, see AWS services that support IPv6.

The URLs that administrators use to manage IAM Identity Center are the second kind of URL your organization needs. The new dual-stack service endpoints end in api.aws as their TLD and are listed in the Identity Center service endpoints. Administrators can use these service endpoints to manage users and groups in Identity Center, update their access to applications and resources, and perform other management operations. As an example, if your administrator uses identitystore.{region}.amazonaws.com to manage users and groups in Identity Center, they should now use the dual-stack version of the same service endpoint which is identitystore.{region}.api.aws, so they can connect to service endpoints using IPv6 clients and networks.

If your users or administrators use an AWS SDK to access AWS applications and accounts or manage services, follow Dual-stack and FIPS endpoints to enable connectivity to the dual-stack endpoints.

After completing these two steps, your workforce and administrators can connect to IAM Identity Center using IPv6. Remember, these endpoints also support IPv4, so clients not yet IPv6-capable can continue to connect using IPv4.

Monitoring dual-stack endpoint usage

You can optionally monitor AWS CloudTrail logs to track usage of dual-stack endpoints. The key difference between IPv4-only and dual-stack endpoint usage is the TLD and appears in the clientProvidedHostHeader field. The following example shows the difference between these CloudTrail events for the CreateTokenWithIAM API call.

IPv4-only endpoints Dual-stack endpoints
"CloudTrailEvent": {
  "eventName": "CreateToken",
  "tlsDetails": {
     "tlsVersion": "TLSv1.3",
     "cipherSuite": "TLS_AES_128_GCM_SHA256",
     "clientProvidedHostHeader": "oidc.us-east-1.amazonaws.com"
  }
}

"CloudTrailEvent": {
  "eventName": "CreateToken",
  "tlsDetails": {
     "tlsVersion": "TLSv1.3",
     "cipherSuite": "TLS_AES_128_GCM_SHA256",
     "clientProvidedHostHeader": "oidc.us-east-1.api.aws"
  }
}

Conclusion

IAM Identity Center now allows clients to connect over IPv6 natively with no network address translation infrastructure. This post showed you how to transition your organization to use IPv6 with Identity Center and its integrated applications. Remember that existing IPv4 endpoints will continue to function, so you can transition at your own pace. Also, no immediate action is required by you. However, we recommend planning your transition to take advantage of IPv6 benefits and meet compliance requirements. If you have questions, comments, or concerns, contact AWS Support, or start a new thread in the IAM Identity Center re:Post channel.

 
If you have feedback about this post, submit comments in the Comments section below. If you have questions about this post, contact AWS Support.
 

Suchintya Dandapat
Suchintya Dandapat

Suchintya Dandapat is a Principal Product Manager for AWS where he partners with enterprise customers to solve their toughest identity challenges, enabling secure operations at global scale.

Access a VPC-hosted Amazon OpenSearch Service domain with SAML authentication using AWS Client VPN

Post Syndicated from Jan Michael Go Tan original https://aws.amazon.com/blogs/big-data/access-a-vpc-hosted-amazon-opensearch-service-domain-with-saml-authentication-using-aws-client-vpn/

Customers often want to deploy Amazon OpenSearch Service domains in virtual private clouds (VPC) and use single sign-on (SSO) with SAML for access control to enhance security. However, setting this up can be challenging.

In this post, we explore different OpenSearch Service authentication methods and network topology considerations. Then we show how to build an architecture to access an OpenSearch Service domain hosted in a VPC using AWS Client VPN, AWS Transit Gateway, and AWS IAM Identity Center.

Solution overview

The following diagram illustrates the solution architecture.

High-level network diagram

The end-user authenticates with IAM Identity Center and connects to the AWS environment from their browser through Client VPN. The traffic is routed from the VPN VPC to the database VPC where the OpenSearch service endpoints are deployed. The user then authenticates to OpenSearch Service through IAM Identity Center. This architecture provides a scalable, enterprise-grade solution that avoids using bastion hosts while making sure only authorized users can access your OpenSearch Service domains through a secure VPN connection. In the following sections, we walk through the steps to set up IAM Identity Center, configure Transit Gateway to facilitate communication between VPCs, and configure SAML-based authentication using IAM Identity Center for both OpenSearch Service and VPN access. Prior experience setting up Client VPN, IAM Identity Center, and Transit Gateway would be beneficial but is not necessary to follow along with this post.

OpenSearch Service authentication methods and SAML

OpenSearch Service supports multiple authentication methods. You can use AWS Identity and Access Management (IAM) to call the OpenSearch Service configuration API (for details, see Making and signing OpenSearch Service requests). However, this doesn’t give you access to the visual dashboard. To access the visual dashboard and call the OpenSearch Service configuration API, you can use the OpenSearch Service built-in internal user database or Amazon Cognito for authentication and user management features. However, these options use separate user pools, which adds additional security and management overhead when adding and removing users.

Therefore, many customers choose to use SAML federation to integrate OpenSearch Service authentication with their existing identity providers like Entra ID, Okta, or JumpCloud. For this post, we use the IAM Identity Center directory as our identity source. One limitation of this approach is that it only supports identity provider-initiated authentication. This means that users must log in through the IAM Identity Center portal and then access their OpenSearch Service dashboard from there.

Private network topology options for OpenSearch Service

When deploying OpenSearch Service domains in a private VPC, organizations must establish secure and reliable network connectivity to access their OpenSearch Service domains. AWS offers several networking solutions that can be implemented individually or in combination to meet specific access requirements. These options include Transit Gateway for centralized network management, AWS Direct Connect or AWS Site-to-Site VPN for on-premises connectivity, and Client VPN for secure remote access. Each solution provides unique benefits and can be combined to meet different organizational needs, security requirements, and performance expectations.

AWS Transit Gateway

Transit Gateway functions as a cloud router that simplifies network connectivity by acting as a central hub for connecting VPCs and on-premises networks. Implementing Transit Gateway with OpenSearch Service enables consolidated access to your OpenSearch Service domain across multiple VPCs and AWS accounts. Through Transit Gateway route tables, you can precisely control traffic flow between attached networks. It supports transitive routing between VPCs and on-premises networks, significantly reducing the number of peering connections needed to access your OpenSearch Service domain. This centralized approach is a common pattern used by customers, which makes network management scalable as your infrastructure grows.

AWS Client VPN

With Client VPN, you can securely access your private OpenSearch Service domain through a managed OpenVPN-based solution. Using Client VPN removes the need to use a bastion host or proxy server to access an OpenSearch Service domain, reducing your management burden and improving security. Client VPN supports both certificate-based and SAML-based authentication. Client VPN endpoints can be associated with multiple subnets to provide high availability. The service includes comprehensive security features such as connection logging and security group controls.

For more information on VPC connectivity options, refer to the AWS Direct Connect whitepaper.

Combining Client VPN with Transit Gateway provides a scalable and flexible way to access an OpenSearch Service domain in a private VPC. In the subsequent sections, we walk you through how to integrate the various services.

Prerequisites

If you haven’t yet set up IAM Identity Center, refer to Enable IAM Identity Center to enable it. Both organization instances and account instances will work. The Identity Center instance must be deployed in the same AWS Region as your OpenSearch Service domain.

After you set up IAM Identity Center, complete the following steps to create an IAM Identity Center group:

  1. On the IAM Identity Center console, choose Groups in the navigation pane.
  2. Choose Create group and create a group (for this example, we name the group vpn_users.
  3. After you create the group, choose the group name to open its details page.
  4. Locate the group ID under General information. Save this in a text editor.
    IAM Identity Center Group ID
  5. Create a user (or multiple users) and assign them to the vpn_users group. This can be done directly through the user creation flow or after creating the user.

Set up the initial network topology

For this post, we use the network topology shown in the following diagram. One VPC hosts the client VPN endpoint with CIDR range 10.0.0.0/16 and a separate VPC with CIDR range 10.1.0.0/16 that hosts our OpenSearch Service nodes. The two VPCs are connected with Transit Gateway. The CIDR ranges in your environment may vary. The only requirement is that they can’t overlap.

Network topology

Complete the following steps to create the two VPCs using Amazon Virtual Private Cloud (Amazon VPC):

  1. On the Amazon VPC console, choose Create VPC.
  2. Choose VPC and more.
  3. For this post, name the VPC VPN-VPC and use 10.0.0.0/16 for the IPv4 CIDR block.
  4. Choose 3 for the number of Availability Zones.
  5. Choose 0 for the number of public subnets.
  6. Choose 3 for the number of private subnets.
  7. Choose None for the number of NAT gateways.
  8. Choose None for the number of VPC endpoints.
    Initial VPC configuration
  9. Repeat these steps to create the second VPC for the OpenSearch Service domain. Keep the same configuration settings except for the following:
    1. Name: Database-VPC
    2. IPv4 CIDR Block: 10.1.0.0/16

Configure Transit Gateway

Follow the instructions in Create an AWS Transit Gateway using the Amazon VPC Console to create a transit gateway and attach your VPCs to it.

Next, you must update each VPC route table to facilitate connectivity to the OpenSearch Service domain.

  1. On the Amazon VPC console, choose Route tables in the navigation pane.
  2. For VPN-VPC, add routes on the subnets where the Client VPN endpoints are attached. The route is 10.1.0.0/16 using Transit Gateway. This route allows VPN users to reach Database-VPC.
    Route table
  3. For Database-VPC, add routes on the subnets of the OpenSearch Service domain endpoint. The route is 10.0.0.0/16 using Transit Gateway. This route allows responses from Database-VPC back to reach the VPN users.
    OpenSearch Route Table

    Next, you must update the Transit Gateway Security Group Referencing support configuration. This allows the OpenSearch Service domain’s security group to open port 443 to only the Client VPN security group. This makes applying least privilege simpler.

  4. On the Transit Gateway console, select the transit gateway you’re using.
  5. On the Actions menu, choose Modify transit gateway.
    Modify TGW
  6. Select Security Group Referencing support and choose Modify transit gateway.
    TGW Security Group Configuration

Configure Client VPN authentication

Client VPN can be associated to multiple VPC subnets for high availability. Client VPN supports multiple client authentication methods. For this post, we use SAML-based authentication with IAM Identity Center.

To set up SAML-based authentication with IAM Identity Center, follow the instructions in the following sections. For more details, refer to Authenticate AWS Client VPN users with AWS IAM Identity Center. Deploy and associate the Client VPN endpoint with VPN-VPC.

Configure Client VPN access to database VPC

During the initial setup of the Client VPN endpoint, you defined authorization rules that authorized the VPN_users group to access the VPN-VPC network, which is 10.0.0.0/16.Complete the following steps to add connectivity to database-VPC:

  1. On the Amazon VPC console, choose Client VPC endpoints in the navigation pane.
  2. Select the endpoint you created.
  3. In the Authorization rules section, choose Add authorization rules.
    ClientVPN Auth Rules
  4. For Destination network to enable access, enter 10.1.0.0/16 (this is the database VPC).
  5. For Grant access to, select Allow access to all users.
  6. Choose Add authorization rule.
    ClientVPN Add Auth Rule

    After you create the authorization rule, the user now has access to that CIDR range. Next, you add an entry in the Client VPN endpoint’s route table to provide reachability from a network perspective.

  7. On the Client VPN endpoints page, select the endpoint you just created.
  8. In the Route table section, choose Create route.
    ClientVPN Route
  9. For Route destination, enter the CIDR range for Database-VPC (10.1.0.0/16).
  10. For Subnet ID for target network association, choose a subnet ID.
  11. Choose Create route.
    ClientVPN Create Route

You should see the new route in the “Creating” state. After it has reached the “Active” state, VPN users will have a network path to the database VPC to be able to reach the OpenSearch Service domain.

ClientVPN Route Creating State

Configure Client VPN application on your client

Complete the following steps to configure the Client VPN application to your client:

  1. Download the relevant installer for Client VPN for Desktop and install Client VPN.
  2. Download and prepare the Client VPN endpoint file.
  3. Open the Client VPN application.
  4. Choose Manage Profile, then choose Add Profile.
  5. Enter a display name and upload the VPN configuration file.
  6. Choose Add Profile.

Set up federation with IAM Identity Center with OpenSearch Service

Complete the following steps to set up federation with IAM Identity Center with OpenSearch Service:

  1. Create an OpenSearch Service domain in the database VPC.
  2. Set up the SAML integration between OpenSearch Service and IAM Identity Center. Assign the same groups that you assigned to the VPN custom application to the OpenSearch Service custom application.
  3. Modify the security group associated with the OpenSearch Service domain to allow access from the Client VPN subnet.
  4. Modify the security group of Client VPN and add the following entry:
    1. Type: HTTPS
    2. Source: Use Custom and reference the security group of the OpenSearch Service domain

Test the end-to-end flow

Now you can test the entire flow end-to-end:

  1. Run Client VPN on your local machine. Use the profile that you previously configured.
    The client will prompt you to authenticate with IAM Identity Center. After authentication, you will see the message “Authentication details received, processing details. You may close this window at any time.”
  2. Access your IAM Identity Center access portal URL (this can be found on the IAM Identity Center console, under Dashboard). Sign in as a user that has been assigned to the OpenSearch Service custom application in the previous step.
  3. After authentication, choose the Applications tab in AWS Access Portal and choose the OpenSearch Service application.

This should redirect you to the OpenSearch Service Dashboards page with the role that you assigned.

IAM Identity Center - App List

Clean up

After you test the solution, delete the resources you created to avoid incurring future charges:

  1. Delete the OpenSearch Service domain and the SAML application, users, and groups in IAM Identity Center.
  2. Delete the client VPN endpoints that you created and remove the routing rules from Transit Gateway.

Conclusion

In this post, we discussed the networking options for securely accessing an OpenSearch Service domain deployed in a private VPC through services like Transit Gateway, Client VPN, and Site-to-Site VPN. We also discussed how to use IAM Identity Center for authentication and authorization, helping you simplify identity management for OpenSearch Service. If you have feedback about this post, provide it in the comments section.


About the authors

Jan Michael Go Tan

Jan Michael Go Tan

Jan Michael is a Principal Solutions Architect for Amazon Web Services. He helps customers design scalable and innovative solutions with the AWS Cloud.

Kevin Low

Kevin Low

Kevin is a Security Solutions Architect at AWS who helps the largest customers across ASEAN build securely. He specializes in threat detection and incident response and is passionate about integrating resilience and security. Outside of work, he loves spending time with his wife and dog, a poodle called Noodle.

Enable strategic data quality management with AWS Glue DQDL labels

Post Syndicated from Arun A K original https://aws.amazon.com/blogs/big-data/enable-strategic-data-quality-management-with-aws-glue-dqdl-labels/

Organizations increasingly depend on trusted, high-quality data to drive analytics, regulatory reporting, and operational decision-making. When data quality issues go undetected, they can lead to inaccurate insights, stalled initiatives, and compliance gaps that directly affect business outcomes. As data volumes grow and pipelines become more distributed, maintaining consistent data quality across teams and data domains becomes progressively more challenging.

You can address these challenges with AWS Glue Data Quality by providing automated, rule-based data validation across datasets in the AWS Glue Data Catalog and within AWS Glue ETL pipelines. With the Data Quality Definition Language (DQDL), you can author both straightforward and advanced validation rules to detect data quality issues early in the lifecycle, before they reach downstream applications or analytics environments.

In this post, we highlight the new DQDL labels feature, which enhances how you organize, prioritize, and operationalize your data quality efforts at scale. We show how labels such as business criticality, compliance requirements, team ownership, or data domain can be attached to data quality rules to streamline triage and analysis. You’ll learn how to quickly surface targeted insights (for example, “all high-priority customer data failures owned by marketing” or “GDPR-related issues from our Salesforce ingestion pipeline”) and how DQDL labels can help teams improve accountability and accelerate remediation workflows.

Managing complex data quality rules across teams and use cases

As organizations advance in their data quality programs, a few rules often grow into hundreds or thousands maintained across many teams and business domains. Take the example of AnyCompany, a large retail organization with multiple data teams managing customer, product, and sales data across different business units. These teams run a variety of data quality rules, including weekly customer checks, daily product validations, frequent sales checks, and monthly compliance reviews, with different naming patterns, schedules, and response processes. This creates a fragmented, hard-to-navigate system where teams operate in isolation and data quality practices become inconsistent.

The challenge lies in the volume of rules and the lack of organizational context around them. When dozens of data quality rules pass or fail, teams still lack clarity on ownership, urgency, or business impact. This slows incident response, limits executive insight, and complicates resource planning. To move from technical monitoring to strategic value, organizations need a unified structure that connects data quality rules to teams, domains, and priorities, bringing essential business context to data quality operations.

Metadata-driven rule organization

AWS Glue DQDL labels address organizational challenges because you can attach custom metadata to data quality rules, transforming anonymous validations into contextually rich, business-aware checks. Labels work as key-value pairs attached to individual rules or entire rule sets, and you can organize quality operations around business dimensions such as team ownership, criticality, frequency, and regulatory requirements, as in the case of the AnyCompany example. When a rule fails, you immediately identify what failed, who should respond, how urgent it is, and which business area is affected, whether it’s the marketing department tracking email completeness with daily frequency tags, compliance teams monitoring age verification with regulation labels, or the finance team validating payment data with high-criticality markers.

Labels integrate with existing DQDL syntax without requiring changes to current rule definitions, working consistently across AWS Glue Data Quality execution contexts. The feature’s flexibility supports organizational taxonomies from cost centers and geographic regions to data sensitivity levels and service-level agreement (SLA) requirements with single rules carrying multiple labels simultaneously for sophisticated filtering and analysis. Labels appear in the outputs, including rule outcomes, row-level results, and API responses, so organizational context travels with quality results whether you’re troubleshooting failures, analyzing trends in Amazon Athena, or building executive dashboards in Amazon Quick Sight.

Getting started: Writing your first labeled data quality rules

Let’s walk through creating your first labeled data quality rules using AnyCompany’s customer data scenario. We’ll use their customer demographics dataset, which contains customer information that multiple teams need to validate with different priorities and frequencies.

DQDL labels follow a straightforward key-value pair syntax that integrates naturally with existing rule definitions. The basic syntax supports two approaches: default labels that apply to the rules in a rule set, and rule-specific labels that apply to individual rules. Rule-specific labels can override default labels when using the same key, providing fine-grained control over your labeling strategy.

When implementing DQDL labels, keep the following constraints in mind:

  • Maximum of 10 labels per rule
  • Label keys are limited to 128 characters and can’t be empty
  • Label values are limited to 256 characters and can’t be empty
  • Both keys and values are case-sensitive
  • Rule-specific labels override default labels when using the same key

Using this labeling approach, you can organize and manage data quality rules efficiently across different teams and validation requirements.

Best practices for label naming conventions

Here are some proven labeling strategies that scale across enterprise environments:

  • Establish a complete standardized taxonomy upfront – Define label keys in DefaultLabels with sensible defaults such as regulation=none or sla=24h to provide rules with identical keys for cross-team queries.
  • Use consistent key naming patterns – Establish standard keys such as team, criticality, sla, impact, and regulation across rule sets to maintain query consistency.
  • Implement hierarchical values – Use formats such as team=marketing-analytics to support both broad and specific filtering while keeping key structure consistent.
  • Include operational metadata in defaults – Define labels such as sla, escalation-level, or notification-channel as defaults to drive automated response workflows.
  • Plan for reporting dimensions – Include keys such as cost-center, region, or business-unit in your default taxonomy to support meaningful business analytics.
  • Use standardized value patterns – Establish consistent formats such as criticality=high/medium/low or sla=15m/1h/1d for predictable filtering and sorting.

These are guidelines rather than requirements but following them from the start enables powerful cross-team analytics and reduces future refactoring effort.

Customer data validation hands-on example

This post assumes you’re familiar with AWS Glue Data Quality and ETL operations. Using the following hands-on walkthrough, you’ll learn how to implement DQDL labels for organizational data quality management.

Start by establishing default labels that automatically apply to every rule in the rule set, providing consistent organizational context:

DefaultLabels = ["team"="data-team", "criticality"="medium", "regulation"="none", "sla"="24h", "impact"="medium"]

DefaultLabels provide a foundational taxonomy that automatically propagates across your entire rule set, creating uniformity and reducing configuration overhead. By defining default values at the organizational level, such as team=data-team, criticality=medium, regulation=none, sla=24h, and impact=medium, every rule inherits these standardized attributes without requiring explicit declaration. This inheritance model promotes consistency while maintaining the flexibility individual teams need to address their unique operational contexts.

Individual teams can selectively override inherited defaults to reflect their specific requirements. For example, examine the following complete rule set:

DefaultLabels = ["team"="data-team", "criticality"="medium", "regulation"="none", "sla"="24h", "impact"="medium"]

Rules = [
    IsComplete "c_customer_id" labels=["team"="analytics", "criticality"="high", "sla"="15m", "impact"="high"],
    ColumnValues "c_customer_id" matches "e.*" labels=["team"="analytics", "criticality"="medium", "impact"="low"],
    ColumnLength "c_city" > 6 labels=["team"="marketing", "criticality"="medium", "sla"="4h", "impact"="medium"],
    IsComplete "c_name" labels=["team"="marketing", "sla"="4h"],
    ColumnValues "c_age" >= 21 labels=["team"="compliance", "criticality"="high", "regulation"="age21", "impact"="high"] with threshold > 0.99,
    IsComplete "c_birth_date" labels=["team"="compliance", "criticality"="medium", "regulation"="gdpr", "impact"="medium"],
    IsComplete "c_creditissuer" labels=["team"="finance", "impact"="high"],
    ColumnValues "c_creditcardnumber" > 100000000000 labels=["team"="finance", "criticality"="high", "regulation"="payment", "impact"="high"] with threshold > 0.95
]

Notice how the compliance team changes regulation from 'none' to 'age21' for age verification rules and analytics elevates criticality to 'high' for business-critical checks. Unspecified labels automatically inherit the default values, providing consistency while maintaining team-level flexibility.

Applying labeled rules against the dataset

Now let’s see DQDL labels in action by applying AnyCompany’s rule set to actual data through an AWS Glue ETL pipeline. This section assumes you’re familiar with AWS Glue EvaluateDataQuality transform and basic extract, transform, and load (ETL) job creation.

We use AWS Glue EvaluateDataQuality transform within an ETL job to process our customer dataset and apply our labeled rule set. The transform generates two types of outputs: rule-level outcomes that show which rules passed or failed with their associated labels and row-level results that identify specific records and the labeled rules they violated.

By default, labels are excluded from row-level results. However, by enabling them you can analyze data quality results at both the individual record level and across organizational dimensions such as teams and criticality levels.

To enable labels in row-level results, you must configure the additionalOptions parameter in your EvaluateDataQuality transform. The key setting is "rowLevelConfiguration.ruleWithLabels":"ENABLED", which instructs AWS Glue to include label metadata for each rule evaluation at the individual record level.

Here’s how to implement an ETL pipeline that applies our AnyCompany’s rule set with labels enabled:

import sys
from awsglue.transforms import *
from awsglue.utils import getResolvedOptions
from pyspark.context import SparkContext
from awsglue.context import GlueContext
from awsglue.job import Job
from awsgluedq.transforms import EvaluateDataQuality
from awsglue.dynamicframe import DynamicFrame
import boto3

def create_table(athena,s3_bucket,df,db_name,table_name):
    ddl = spark.sparkContext._jvm.org.apache.spark.sql.types.DataType.fromJson(df.schema.json()).toDDL()
    ddl_stmt_string=f"""CREATE EXTERNAL TABLE IF NOT EXISTS {db_name}.{table_name} ({str(ddl)}) ROW FORMAT SERDE 'org.apache.hadoop.hive.ql.io.parquet.serde.ParquetHiveSerDe' STORED AS INPUTFORMAT 'org.apache.hadoop.hive.ql.io.parquet.MapredParquetInputFormat' OUTPUTFORMAT 'org.apache.hadoop.hive.ql.io.parquet.MapredParquetOutputFormat' LOCATION 's3://{s3_bucket}/label/{table_name}/'"""
    athena.start_query_execution(QueryString=ddl_stmt_string,ResultConfiguration={'OutputLocation': f"s3://{s3_bucket}/athena_results/"})

args = getResolvedOptions(sys.argv, ['JOB_NAME'])

sc = SparkContext()
glueContext = GlueContext(sc)
spark = glueContext.spark_session
job = Job(glueContext)
job.init(args['JOB_NAME'], args)

rules="""
DefaultLabels = ["team"="data-team", "criticality"="medium", "regulation"="none", "sla"="24h", "impact"="medium"] 
Rules = [ 
        IsComplete "c_customer_id" labels=["team"="analytics", "criticality"="high", "sla"="15m", "impact"="high"], 
        ColumnValues "c_customer_id" matches "e.*" labels=["team"="analytics", "criticality"="medium", "impact"="low"], 
        ColumnLength "c_city" > 6 labels=["team"="marketing", "criticality"="medium", "sla"="4h", "impact"="medium"], 
        IsComplete "c_name" labels=["team"="marketing", "sla"="4h"], 
        ColumnValues "c_age" >= 21 labels=["team"="compliance", "criticality"="high", "regulation"="age21", "impact"="high"] with threshold > 0.99, 
        IsComplete "c_birth_date" labels=["team"="compliance", "criticality"="medium", "regulation"="gdpr", "impact"="medium"], 
        IsComplete "c_creditissuer" labels=["team"="finance", "impact"="high"], 
        ColumnValues "c_creditcardnumber" > 100000000000 labels=["team"="finance", "criticality"="high", "regulation"="payment", "impact"="high"] with threshold > 0.95 
        ]
"""

s3_bucket="REPLACE"

row_level_table="dqrowlevel"
rule_level_table="dqrulelevel"
db_name="default"

additional_options={}
additional_options["observations.scope"]="ALL"
additional_options["performanceTuning.caching"]="CACHE_INPUT"

additional_options["rowLevelConfiguration.ruleWithLabels"]="ENABLED"

df = spark.read.option("header", "true").option("inferSchema", "true").csv("s3://aws-data-analytics-workshops/aws_glue/aws_glue_data_quality/data/customers/")

anycompany_customers=DynamicFrame.fromDF(df, glueContext, "anycompany_customers")

dq_check = EvaluateDataQuality().process_rows(frame=anycompany_customers, ruleset=rules, publishing_options={"dataQualityEvaluationContext": "dq_check","enableDataQualityCloudWatchMetrics": True, "enableDataQualityResultsPublishing": True}, additional_options=additional_options)

rowlevel = SelectFromCollection.apply(dfc=dq_check, key="rowLevelOutcomes", transformation_ctx="rowlevel")
rulelevel = SelectFromCollection.apply(dfc=dq_check, key="ruleOutcomes", transformation_ctx="rulelevel")

rowlevel_df=rowlevel.toDF()
rulelevel_df=rulelevel.toDF()

rowlevel_df.write.mode("overwrite").parquet(f"s3://{s3_bucket}/label/{row_level_table}/")
rulelevel_df.write.mode("overwrite").parquet(f"s3://{s3_bucket}/label/{rule_level_table}/")

athena = boto3.client('athena')
create_table(athena,s3_bucket,rowlevel_df,db_name,row_level_table)
create_table(athena,s3_bucket,rulelevel_df,db_name,rule_level_table)

job.commit()

To run this example, update the s3_bucket variable with your own Amazon Simple Storage Service (Amazon S3) bucket name, then create and execute the ETL job in AWS Glue.

After the job is completed, you’ll find:

  • Rule-level and row-level results stored in your S3 bucket
  • Two new tables automatically created in your default database: dqrulelevel and dqrowlevel

In the next section, we query these tables using Amazon Athena to analyze the labeled data quality outcomes and extract actionable insights.

Analyzing data quality results by labels using Amazon Athena

We’ve stored our labeled data quality results in Amazon S3 and as a table in the AWS Glue data catalog. Now, we can use Amazon Athena to analyze these results across the organizational dimensions captured in your labels. The labeled metadata transforms raw data quality outcomes into actionable business intelligence that drives targeted remediation and strategic decision-making.

Querying row-level results

With labels stored alongside row-level outcome, you can query specific records that failed data quality checks based on label criteria. For example, the following query identifies individual customer records that failed high criticality compliance rules. You can use it to quickly locate and remediate problematic data for regulatory or business-critical use cases:

SELECT
c_customer_id,
c_age,
failed_rule
FROM (
SELECT *
FROM dqrowlevel
WHERE dataqualityevaluationresult = 'Failed'
)
CROSS JOIN UNNEST(dataqualityrulesfail) AS t(failed_rule)
WHERE failed_rule LIKE '%criticality"="high"%'
AND failed_rule LIKE '%team"="compliance"%'
LIMIT 5;

You can see the query results above showing failed records filtered by 'high' criticality and 'compliance' team labels.

Querying rule-level results

Now that we have stored rule-level outcomes with labels, we can run aggregation queries to analyze failures across different dimensions. For example, the following query groups failed rules by criticality and team to identify which teams have the most high-severity failures. You can use it to prioritize remediation efforts and allocate resources effectively:

SELECT 
    labels['team'] AS team,
    labels['criticality'] AS criticality,
    COUNT(*) AS failed_count
FROM dqrulelevel
WHERE outcome = 'Failed'
GROUP BY labels['criticality'], labels['team']
ORDER BY failed_count DESC;

The following screenshot shows aggregated failure counts grouped by team and criticality level.

Viewing data quality results using AWS CLI

Beyond querying results in Athena, you can also retrieve data quality outcomes directly using the AWS Command Line Interface (AWS CLI). This is useful for automation, scripting, and integrating data quality checks into continuous integration and continuous delivery (CI/CD) pipelines.

To list data quality results for your ETL job, enter the following:

aws glue list-data-quality-results --filter '{"JobName":"<your-job-name>"}'

You can see in the above screenshot that the resultant JSON includes a ResultId for each data quality run.

To retrieve details of a specific result, enter the following:

aws glue get-data-quality-result --result-id <result-id>

The output includes a Labels object for each rule in the RuleResults array, containing the label key-value pairs you defined. This provides programmatic access to the same labeled data quality results, which can be useful for automation and scripting workflows.

Cleanup

To avoid incurring ongoing charges, delete the resources created in this post:

  • To delete the S3 folders containing the data quality results, follow the directions at Deleting Amazon S3 objects.
  • To delete the ETL job you created for the test, follow the directions at Delete jobs in the AWS Glue User Guide.
  • To delete the AWS Glue Data Catalog dqrulelevel and dqrowlevel tables, follow the directions at DeleteTable in the AWS Glue Web API Reference.

Conclusion

AWS Glue DQDL labels add organizational context to data quality management by attaching business metadata directly to validation rules. This helps teams identify rule ownership, prioritize failures, and coordinate remediation efforts more effectively.Throughout this post, we’ve seen how AnyCompany moved from managing hundreds of generic rules to implementing a labeled system where data quality results include team ownership and business context. Marketing teams can identify their email validation failures, compliance teams can focus on regulatory violations, and finance teams can address payment-related issues without manual coordination.To implement DQDL Labels in your organization:

  • Start simple – Begin with basic organizational dimensions such as team ownership, criticality levels, and SLA requirements. Expand your labeling approach as needed.
  • Establish standards – Define your label taxonomy up front, including default values for unused dimensions. This consistency supports analytics across teams.
  • Integrate gradually – Add labels to existing rule sets during routine maintenance.
  • Use analytics – Apply the Athena query patterns from this post to build tools such as dashboards and alerting workflows.
  • Build smart automation – Explore creating alerts and notifications tailored to your business criticality and SLA definitions. For example, configure immediate notifications for high-criticality compliance failures while batching low-priority marketing issues into daily reports.

We look forward to seeing how you implement DQDL labels in your organization and expand beyond the examples we’ve covered here. To dive into the AWS Glue Data Quality APIs, refer to Data Quality API documentation. To learn more about AWS Glue Data Quality, check out AWS Glue Data Quality.


About the authors

Arun A K

Arun A K

Arun is a Senior Big Data Specialist Solutions Architect at Amazon Web Services (AWS). He helps customers design and scale data platforms that power innovation through analytics and AI. Arun is passionate about exploring how data and emerging technologies can solve real-world problems. Outside of work, he enjoys sharing knowledge with the tech community and spending time with his family.

Annie Wang

Annie Wang

Annie is a Software Development Engineer at AWS Glue. She focuses on building data quality features, including DQDL, that help customers define, monitor, and validate data quality across their pipelines. She is passionate about making data reliability easier for customers.

Roshin Babu

Roshin Babu

Roshin is a Sr. Specialist Solutions Architect at AWS, where he collaborates with the sales team to support public sector clients. When he’s not working, Roshin is passionate about exploring new destinations, discovering great food, and enjoying soccer both as a player and fan.

Managing Amazon OpenSearch UI infrastructure as code with AWS CDK

Post Syndicated from Zhongnan Su original https://aws.amazon.com/blogs/big-data/managing-amazon-opensearch-ui-infrastructure-as-code-with-aws-cdk/

As organizations scale their observability and analytics capabilities across multiple AWS Regions and environments, maintaining consistent dashboards becomes increasingly complex. Teams often spend hours manually recreating dashboards, creating workspaces, linking data sources, and validating configurations across deployments—a repetitive and error-prone process that slows down operational visibility.

The next generation OpenSearch UI in Amazon OpenSearch Service introduces a unified, managed analytics experience that decouples from individual OpenSearch domains and OpenSearch collections. It provides workspaces, dedicated team spaces with collaborator management and a tailored environment for observability, search, and security analytics use cases. Each workspace can connect to multiple data sources, including OpenSearch Service domains, Amazon OpenSearch Serverless collections, and external sources such as Amazon Simple Storage Service (Amazon S3). OpenSearch UI also supports access with AWS IAM Identity Center, AWS Identity and Access Management (IAM), Identity provider (IdP)-initiated single sign-on (SAML using IAM federation), and AI-powered insights.)-initiated single sign-on (SAML using IAM federation),and AI-powered insights.

In this post, you’ll learn how to use the AWS Cloud Development Kit (AWS CDK) to deploy an OpenSearch UI application and integrate it with an AWS Lambda function that automatically creates workspaces and dashboards using the OpenSearch Dashboards Saved Objects APIs. Using this automation means that environments launch with ready-to-use analytics that are standardized, version-controlled, and consistent across deployments. that are standardized, version-controlled, and consistent across deployments.

Specifically, you’ll learn how to:

  • Deploy an OpenSearch UI application using AWS CDK that in turn uses AWS CloudFormation
  • Automatically create workspaces and dashboards using a Lambda based custom resource
  • Generate and ingest sample data for immediate visualization
  • Build visualizations programmatically using the OpenSearch Dashboards Saved Objects API
  • Authenticate API requests using AWS Signature Version 4

All the code samples in this post are available in this AWS Samples repository.

Solution overview

The following architecture demonstrates how to automate OpenSearch UI workspace and dashboard creation using AWS CDK, AWS Lambda, and the OpenSearch UI APIs.

The workflow flows from left to right:

  1. Deploy stack – Developer runs cdk deploy to launch the infrastructure and create the CloudFormation stack.
  2. Create domain – CloudFormation creates the OpenSearch domain (which serves as the data source)
  3. Create OpenSearch UI app – CloudFormation creates the OpenSearch UI application
  4. Trigger Lambda – CloudFormation invokes the Lambda function as a custom resource
  5. Generate and ingest data – Lambda generates sample metrics and ingests them into the domain
  6. Create workspaces and assets using saved object API – Lambda creates the workspace, index pattern, visualization (pie chart), and dashboard using OpenSearch UI API calls

The result is a fully configured OpenSearch UI with sample data and a ready-to-use dashboard automated through infrastructure as code (IaC). The same workflow can also be integrated into existing infrastructure for OpenSearch UI applications to automatically create or update dashboards during future deployments, maintaining consistency across environments. consistency across environments.

Prerequisites

To perform the solution, you need the following prerequisites:

  • An AWS user or role with sufficient permissions – You’ll need permissions to create and manage AWS resources such as OpenSearch Service domains, OpenSearch UI applications, Lambda functions, IAM roles and policies, virtual private cloud (VPC) networking components (subnets and security groups), and CloudFormation stacks. For testing or proof-of-concept deployments, we recommend using an administrative role. For production, follow the principle of least privilege.
  • Install development tools:
  • Bootstrap CDK – This is a one-time setup per account or Region:
    cdk bootstrap <aws://123456789012/us-east-1>

This creates the necessary S3 bucket and IAM roles for AWS CDK deployments in your account.

Get the sample code

Clone the sample implementation from GitHub:

git clone https://github.com/aws-samples/sample-automate-opensearch-ui-dashboards-deployment.git 
cd opensearch-dashboard-automation-sample 

The repository contains:

opensearch-dashboard-automation-sample/ 
├── cdk/ 
│   ├── bin/ 
│   │   └── app.ts                           # CDK app entry point 
│   └── lib/ 
│       └── dashboard-stack.ts               # OpenSearch domain, Lambda, and custom resource 
└── lambda/ 
    ├── dashboard_automation.py              # Main Lambda for workspace and dashboard automation 
    ├── sigv4_signer.py                      # AWS SigV4 signing utility 
    └── requirements.txt                     # Python dependencies

This sample demonstrates how to deploy an OpenSearch UI application, create a workspace, ingest sample data, and automatically generate visualizations and dashboards using IaC.

After cloning the repository, you can deploy the stack to automatically create your first OpenSearch workspace and dashboard with sample data.

Understanding the solution

Before deploying, let’s examine how the solution works. The following steps explain the architecture and automation logic that will execute automatically when you deploy the AWS CDK stack. The next section contains the actual deployment commands you’ll run.

Provision OpenSearch UI resources

The AWS CDK integrates seamlessly with AWS CloudFormation. This means you can define your OpenSearch resources and automation workflows as IaC. In this solution, AWS CDK provisions the OpenSearch domain, OpenSearch UI application, and a Lambda based custom resource that performs the automation logic.

When deploying OpenSearch UI automation, the order of resource creation is important to correctly resolve dependencies. The recommended order is as follows:

  1. Create the Lambda execution role – Required for access to AppConfigs and APIs
  2. Create the OpenSearch domain – Serves as the primary data source
  3. Create the OpenSearch UI application – References the Lambda role in its AppConfigs
  4. Create the Lambda function – Defines the automation logic
  5. Create the custom resource – Triggers the Lambda automation during stack deployment

The following code snippet (from cdk/lib/dashboard-stack.ts) shows the key infrastructure definitions:

export class OpenSearchDashboardStack extends cdk.Stack { 
  constructor(scope: Construct, id: string, props?: OpenSearchDashboardStackProps) { 
    super(scope, id, props); 
 
    const masterUserArn = props?.masterUserArn ||  
      `arn:aws:iam::${this.account}:role/Admin`; 
 
    // Step 1: Create IAM Role for Lambda FIRST 
    const dashboardRole = new iam.Role(this, 'DashboardLambdaRole', { 
      assumedBy: new iam.ServicePrincipal('lambda.amazonaws.com'), 
      inlinePolicies: { 
        OpenSearchAccess: new iam.PolicyDocument({ 
          statements: [ 
            new iam.PolicyStatement({ 
              actions: ['opensearch:ApplicationAccessAll'], 
              resources: ['*'] 
            }), 
            new iam.PolicyStatement({ 
              actions: ['es:ESHttpPost', 'es:ESHttpPut', 'es:ESHttpGet'], 
              resources: [`arn:aws:es:${this.region}:${this.account}:domain/*`] 
            }) 
          ] 
        }) 
      } 
    }); 
 
    // Step 2: Create OpenSearch Domain 
    const opensearchDomain = new opensearch.Domain(this, 'OpenSearchDomain', { 
      version: opensearch.EngineVersion.OPENSEARCH_2_11, 
      capacity: { dataNodes: 1, dataNodeInstanceType: 'r6g.large.search' }, 
      // ... additional configuration 
    }); 
 
    // Step 3: Create OpenSearch UI Application 
    const openSearchUI = new opensearch.CfnApplication(this, 'OpenSearchUI', { 
      appConfigs: [ 
        { 
          key: 'opensearchDashboards.dashboardAdmin.users', 
          value: `["${masterUserArn}"]` // Human users 
        }, 
        { 
          key: 'opensearchDashboards.dashboardAdmin.groups', 
          value: `["${dashboardRole.roleArn}"]` // Lambda role 
        } 
      ], 
      dataSources: [{ dataSourceArn: opensearchDomain.domainArn }], 
      // ... additional configuration 
    }); 
 
    // Step 4: Create Lambda Function 
    const dashboardFn = new lambda.Function(this, 'DashboardSetup', { 
      runtime: lambda.Runtime.PYTHON_3_11, 
      handler: 'dashboard_automation.handler', 
      code: lambda.Code.fromAsset('../lambda'), 
      timeout: cdk.Duration.minutes(5), 
      role: dashboardRole 
    }); 
 
    // Step 5: Create Custom Resource 
    const provider = new cr.Provider(this, 'DashboardProvider', { 
      onEventHandler: dashboardFn 
    }); 
 
    new cdk.CustomResource(this, 'DashboardSetupResource', { 
      serviceToken: provider.serviceToken, 
      properties: { 
        opensearchUIEndpoint: openSearchUI.attrDashboardEndpoint, 
        domainEndpoint: opensearchDomain.domainEndpoint, 
        domainName: opensearchDomain.domainName, 
        workspaceName: 'workspace-demo', 
        region: this.region 
      } 
    }); 
  } 
}

These are some important implementation notes:

  • The Lambda role must be created before the OpenSearch UI application so its Amazon Resource Name (ARN) can be referenced in dashboardAdmin.groups
  • The Lambda role includes both opensearch:ApplicationAccessAll (for OpenSearch UI API access) and es:ESHttp* permissions (for ingesting data into the OpenSearch domain)
  • The custom resource enables the automation function to run during deployment, passing both OpenSearch UI and OpenSearch domain endpoints as parameters

Authenticate with OpenSearch UI APIs

When programmatically interacting with the OpenSearch UI (Dashboards) APIs, proper authentication is required so your Lambda function or automation script can securely access the APIs. The OpenSearch UI uses AWS Signature Version 4 (SigV4) authentication—similar to the OpenSearch domain APIs—but with a few important distinctions.

When signing OpenSearch UI API requests, the service name must be opensearch, not es. This is a common source of confusion: the OpenSearch domain endpoint still uses the legacy service name es, but the OpenSearch UI endpoints require opensearch. Using the wrong service name will cause your requests to fail authentication, even if the credentials are valid.

For POST, PUT, or DELETE requests, include the following headers to satisfy the OpenSearch UI API security requirements:

Header Description
1 Content-Type Set to application/json for JSON payloads
2 osd-xsrf Required for state-changing operations (set to true)
3 x-amz-content-sha256 SHA-256 hash of the request body to ensure data integrity

The SigV4 signing process automatically computes this body hash when using the botocore AWSRequest object, maintaining request integrity and preventing tampering during transmission.

The following code snippet (from lambda/sigv4_signer.py) demonstrates how to sign and send a request to the OpenSearch UI API:

def get_common_headers(body: bytes = b"{}") -> Dict[str, str]: 
    """ 
    Get common headers for OpenSearch UI API requests. 
     
    Args: 
        body: Request body bytes to hash 
         
    Returns: 
        Dictionary of required headers 
    """ 
    body_hash = hashlib.sha256(body).hexdigest() 
    return { 
        "Content-Type": "application/json", 
        "x-amz-content-sha256": body_hash, 
        "osd-xsrf": "osd-fetch", 
        "osd-version": "3.1.0", 
    } 
 
 
def make_signed_request( 
    method: str, 
    url: str, 
    headers: Dict[str, str], 
    body: bytes = b"", 
    region: str = None, 
) -> Any: 
    session = boto3.Session() 
    if not region: 
        region = session.region_name 
     
    # Create AWS request 
    request = AWSRequest(method=method, url=url, data=body, headers=headers) 
     
    # Sign with SigV4 using 'opensearch' service name (not 'es') 
    credentials = session.get_credentials() 
    SigV4Auth(credentials, "opensearch", region).add_auth(request) 
     
    # Send request using URLLib3Session 
    http_session = URLLib3Session() 
    return http_session.send(request.prepare()) 

This utility function signs the request using the correct service name (opensearch), attaches the required headers, and sends it securely to the OpenSearch UI endpoint.

Create workspace and dashboard with sample data

The Lambda function (lambda/dashboard_automation.py) automates the entire process of provisioning a workspace, generating sample data, and creating visualizations and dashboards through the OpenSearch UI APIs. Visit the following lists of APIs:

Follow these steps:

  1. Locate or create a workspace. Each dashboard in the OpenSearch UI must exist within a workspace. The function first checks whether a workspace already exists and creates one if necessary. The workspace associates one or more data sources (for example, an OpenSearch domain or OpenSearch Serverless collection):
    def get_or_create_workspace(endpoint: str, region: str,  
                               data_source_id: str, workspace_name: str) -> Optional[str]: 
        """Get existing workspace or create new one (idempotent).""" 
        # Check for existing workspace 
        workspace_id = find_workspace_by_name(endpoint, region, workspace_name) 
        if workspace_id: 
            return workspace_id 
     
        # Create new workspace 
        url = f"https://{endpoint}/api/workspaces" 
        payload = { 
            "attributes": {"name": workspace_name, "features": ["use-case-observability"]}, 
            "settings": {"dataSources": [data_source_id]} 
        } 
        response = make_signed_request("POST", url, get_common_headers(), json.dumps(payload).encode(), region) 
        return response.json()["result"]["id"]

    This logic enables repeated deployments to remain idempotent; the Lambda function reuses existing workspaces rather than creating duplicates.

  2. Generate and ingest sample data. To make the dashboards meaningful upon first launch, the Lambda function generates a small dataset simulating HTTP request metrics and ingests it into the OpenSearch domain using the Bulk API:
    def generate_sample_metrics(num_docs: int = 50) -> list: 
        """Generate realistic HTTP API request metrics.""" 
        endpoints = ["/api/users", "/api/products", "/api/orders"] 
        status_codes = [200, 201, 400, 404, 500] 
        status_weights = [0.70, 0.15, 0.08, 0.05, 0.02]  # Realistic distribution 
     
        documents = [] 
        for i in range(num_docs): 
            documents.append({ 
                "@timestamp": generate_timestamp(), 
                "endpoint": random.choice(endpoints), 
                "status_code": random.choices(status_codes, weights=status_weights)[0], 
                "response_time_ms": random.randint(20, 500) 
            }) 
        return documents

    The function then ingests this data into the domain:

    def ingest_sample_data(domain_endpoint: str, region: str, documents: list) -> bool:
        """Ingest documents using OpenSearch bulk API."""
        index_name = f"application-metrics-{datetime.utcnow().strftime('%Y.%m.%d')}"
        bulk_body = "\n".join([
            f'{{"index":{{"_index":"{index_name}"}}}}\n{json.dumps(doc)}'
            for doc in documents
        ]) + "\n"
    
        url = f"https://{domain_endpoint}/_bulk"
        response = make_domain_request("POST", url, headers, bulk_body.encode(), region)
        return 200 <= response.status_code < 300

    This enables each deployment to include sample analytics data that immediately populates the dashboard upon first login.

  3. Create a visualization. After the index pattern is available, the Lambda function creates a pie chart visualization that shows HTTP status code distribution:
    def create_visualization(endpoint: str, region: str,  
                            workspace_id: str, index_pattern_id: str) -> Optional[str]: 
        """Create pie chart showing HTTP status code distribution.""" 
        url = f"https://{endpoint}/w/{workspace_id}/api/saved_objects/visualization" 
     
        vis_state = { 
            "title": "HTTP Status Code Distribution", 
            "type": "pie", 
            "aggs": [ 
                {"id": "1", "type": "count", "schema": "metric"}, 
                { 
                    "id": "2", 
                    "type": "terms", 
                    "schema": "segment", 
                    "params": {"field": "status_code", "size": 10} 
                } 
            ] 
        } 
     
        payload = { 
            "attributes": { 
                "title": "HTTP Status Code Distribution", 
                "visState": json.dumps(vis_state), 
                "kibanaSavedObjectMeta": { 
                    "searchSourceJSON": json.dumps({ 
                        "index": index_pattern_id, 
                        "query": {"query": "", "language": "kuery"} 
                    }) 
                } 
            } 
        } 
     
        response = make_signed_request("POST", url, get_common_headers(), json.dumps(payload).encode(), region) 
        return response.json().get("id") 
     

    This visualization will later be embedded inside a dashboard panel.

  4. Create the dashboard. Finally, the Lambda function creates a dashboard that references the visualization created in the previous step:
    def create_dashboard(endpoint: str, region: str,  
                        workspace_id: str, viz_id: str) -> Optional[str]: 
        """Create dashboard containing the visualization.""" 
        url = f"https://{endpoint}/w/{workspace_id}/api/saved_objects/dashboard" 
     
        # Define panel layout for the visualization 
        panels_json = [{ 
            "version": "2.11.0", 
            "gridData": {"x": 0, "y": 0, "w": 24, "h": 15, "i": "1"}, 
            "panelIndex": "1", 
            "embeddableConfig": {}, 
            "panelRefName": "panel_1" 
        }] 
     
        payload = { 
            "attributes": { 
                "title": "Application Metrics", 
                "description": "HTTP request metrics dashboard", 
                "panelsJSON": json.dumps(panels_json), 
                "optionsJSON": json.dumps({"darkTheme": False}), 
                "version": 1, 
                "timeRestore": False, 
                "kibanaSavedObjectMeta": { 
                    "searchSourceJSON": json.dumps({"query": {"query": "", "language": "kuery"}}) 
                } 
            }, 
            "references": [{ 
                "name": "panel_1", 
                "type": "visualization", 
                "id": viz_id 
            }] 
        } 
     
        response = make_signed_request("POST", url, get_common_headers(), json.dumps(payload).encode(), region) 
        return response.json().get("id") 
     

This completes the dashboard creation process, providing users with an interactive visualization of application metrics as soon as they access the workspace.

The full implementation, including logging, error handling, and helper utilities, is available in the AWS Samples GitHub repository.

Deploy the infrastructure with AWS CDK

With the AWS CDK stack and Lambda automation in place, you’re ready to deploy the full solution and verify that your OpenSearch UI dashboard is created automatically.

Deploy the stack

From the root directory of the cloned repository, navigate to the AWS CDK folder and deploy the stack using your IAM user ARN from the Prerequisites section:

cd cdk 
npm install 
npx cdk bootstrap  # First time only 
npx cdk deploy -c masterUserArn=arn:aws:iam::123456789012:user/your-username

The deployment process typically takes 20–25 minutes because AWS CDK provisions the OpenSearch domain, OpenSearch UI application, Lambda function, and custom resource that runs the automation.

Verify the deployment

After the deployment completes:

  1. Open the OpenSearch UI endpoint displayed in the AWS CDK output.
  2. Sign in using your IAM credentials.
  3. Switch to the newly created workspace-demo workspace.
  4. Open the Application Metrics dashboard.
  5. View the pie chart visualization that displays the distribution of HTTP status codes from the sample data.

The dashboard automatically displays a pie chart visualization populated with synthetic application metrics, demonstrating how the Saved Objects API can be used to bootstrap meaningful analytics dashboards immediately after deployment.

Enhancement 1: Simplify dashboard creation with Saved Object Import API

As your OpenSearch Dashboards evolve, managing complex dependencies between index patterns, visualizations, and dashboards can become increasingly difficult. Each dashboard often references multiple saved objects, and manually recreating or syncing them across environments can be time-consuming and error prone.

To simplify this process, we recommend using the Saved Objects Import/Export API. You can use this API to bundle entire dashboards, including their dependent objects, into a single transferable artifact. By using this approach, you can version, migrate, and deploy dashboards across environments as part of your CI/CD workflow, maintaining consistency and reducing operational overhead.

Export your dashboard

You can export dashboards directly from the OpenSearch UI or use saved object export API:

  1. Open Stack Management and then Saved Objects
  2. Select the dashboard and related objects (for example, visualizations and index patterns)
  3. Choose Export
  4. Save the exported file as dashboard.ndjson

This file contains saved objects serialized in newline-delimited JSON (NDJSON) format, ready for versioning or deployment automation.

Import dashboards programmatically

You can programmatically import the NDJSON file into a target workspace using the Saved Objects import API:

# Pseudo code for import function 
def import_dashboard(workspace_id, ndjson_file): 
    # Read the exported dashboard file 
    dashboard_config = read_file(ndjson_file) 
     
     
    # POST to import to opensearch ui endpoint 
    url = f"{opensearch_ui_endpoint}/w/{workspace_id}/api/saved_objects/_import" 
    response = make_signed_request("POST", url, dashboard_config) 
     
    return response.success 

By using this approach, you can treat dashboards as deployable assets, exactly like application code. You can store your exported dashboards in source control, integrate them into your AWS CDK or CloudFormation pipelines, and automatically deploy them to multiple environments with confidence.

Enhancement 2: Improved security configurations

In some cases, you might want to improve the security configuration of your OpenSearch UI application, or you might be dealing with OpenSearch domains that have been deployed with additional security configurations. In this section, we discuss how you can improve the security configuration of your OpenSearch UI application and still achieve IaC with AWS CDK. More specifically, we explain how you can set up your OpenSearch UI application when your OpenSearch domain is in a VPC and when fine-grained access control is enabled.

When the OpenSearch Domain resides within a VPC, additional configurations will be needed to properly connect with your dashboard.

Enable communication between Lambda functions used to ingest data and the OpenSearch domain in the VPC

When the OpenSearch Service domain resides in a VPC, the Lambda functions that ingest data into the domain must be able to communicate with it. The most straightforward way of doing this is to allow the Lambda function to be executed within the same VPC as your OpenSearch Service domain and give it the same security group. An example is provided in the GitHub repository.

  1. Allow HTTPS communications from clients trying to communicate with your OpenSearch Service domain. In this example, the client will be using the same security group used in the OpenSearch Service domain:
    openSearchSecurityGroup.addIngressRule(
      openSearchSecurityGroup,
      ec2.Port.tcp(443),
      'Allow inbound HTTPS traffic from itself',
    );

  2. Add this managed policy to the role assumed by the Lambda function to allow it access to the VPC:
    iam.ManagedPolicy.fromAwsManagedPolicyName('service-role/AWSLambdaVPCAccessExecutionRole')

  3. Specify the VPC and the security group your Lambda function will be using. In this case, the VPC is the same one used by your OpenSearch Service domain:
    const dashboardFn = new lambda.Function(this, 'DashboardSetup', {
      // ... additional configuration
      vpc: vpc,
      securityGroups: [openSearchSecurityGroup]
    });

Authorize OpenSearch UI service for VPC endpoint access

For the OpenSearch Service domain to be accessible to your dashboard, VPC endpoint access must be enabled. This can be achieved by using a custom resource, as shown in the following configuration:

const authorizeOpenSearchUIVpcAccess = new cr.AwsCustomResource(this, 'AuthorizeOpenSearchUIVpcAccess', {
  onUpdate: {
    service: 'OpenSearch',
    action: 'authorizeVpcEndpointAccess',
    parameters: {
      DomainName: opensearchDomain.domainName,
      Service: 'application.opensearchservice.amazonaws.com',
    },
    physicalResourceId: cr.PhysicalResourceId.of(`${opensearchDomain.domainName}-VpcEndpointAccess`),
  },
  policy: cr.AwsCustomResourcePolicy.fromStatements([
    new iam.PolicyStatement({
      actions: ['es:AuthorizeVpcEndpointAccess'],
      resources: [opensearchDomain.domainArn],
    }),
  ]),
});

Enable fine-grained access control

When you use fine-grained access control in combination with an OpenSearch UI, you have more control over which operations are allowed for each user. This can be especially useful when you want to limit your users’ actions beyond the admin, read, or write permissions that come with OpenSearch UI. Unique roles can be created and mapped to one or more users to achieve precise control over who can access what functionality.

In the previous sections, the same Lambda was used to make requests to both the OpenSearch Service domain and the OpenSearch UI. However, in situations where the main role isn’t the same between the OpenSearch Service domain and the OpenSearch UI, we recommend creating a Lambda function for each role. Again, when deploying OpenSearch UI automation, the order of resource creation is important to correctly resolve dependencies. As illustrated previously, the recommended order is as follows:

  1. Create the dashboard Lambda execution role – Required for access to AppConfigs and APIs
  2. Create the OpenSearch domain main role – Required for domain creation and APIs
  3. Create the OpenSearch domain – Serves as the primary data source
  4. Create the OpenSearch domain Lambda function – Defines the automation logic for the OpenSearch domain
  5. Create the OpenSearch domain custom resources – Triggers the Lambda automation during stack deployment
  6. Create the OpenSearch UI application – References the Lambda role in its AppConfigs
  7. Create the OpenSearch UI Lambda function – Defines the automation logic for the OpenSearch UI
  8. Create the OpenSearch UI custom resource – Triggers the Lambda automation during stack deployment

When creating the OpenSearch Service domain, specify the fine-grained access control parameter, as follows:

// Step 3: Create OpenSearch Domain
const opensearchDomain = new opensearch.Domain(this, 'OpenSearchDomain', {
  // ... additional configuration
  // Enable Fine-Grained Access Control in your OpenSearch Domain
  fineGrainedAccessControl: {
    masterUserArn: openSearchMasterRole.roleArn,
  }
});

The Lambda function responsible for communicating with the OpenSearch Service domain should have the necessary permissions to write to it. The following is a configuration example where the Lambda function assumes the domain’s main role:

// Step 4: Create Lambda Function for OpenSearch Domain
const domainFn = new lambda.Function(this, 'DomainSetup', {
  // ... additional configuration
  role: openSearchMasterRole
});

Then, add the custom resources to create the roles and role mappings, as needed:

// Step 5: Create Custom Resources for OpenSearch Domain
const domainProvider = new cr.Provider(this, 'DomainProvider', {
  onEventHandler: domainFn
});

// A custom resource to create roles (Optional)
new cdk.CustomResource(this, 'DomainRoleSetupResource', {
  serviceToken: domainProvider.serviceToken,
  // ... additional configuration
});

// A custom resource to create role mappings (Optional)
new cdk.CustomResource(this, 'DomainRolesMappingSetupResource', {
  serviceToken: domainProvider.serviceToken,
  // ... additional configuration
});

Create additional roles in the OpenSearch Service domain (Optional)

If you want to grant specific permissions to some users, we recommend creating roles for them. This can be achieved by making the following requests to the OpenSearch Service domain endpoint.

For more information about the roles endpoint, review the Create role in the OpenSearch documentation.

# Pseudo code to create a role
def create_role(domain_endpoint: str, region: str, 
                        new_role_name: str) -> bool:
    """Create a new role"""
    url = f"https://{domain_endpoint}/_plugins/_security/api/roles/{new_role_name}"

    payload = {
        "description": "",
        "cluster_permissions": [
            // ... Permisions
        ],
        "index_permissions": [
            {
                "index_patterns": [
                    // ... Index patterns
                ],
                "fls": [],
                "masked_fields": [],
                "allowed_actions": [
                    // ... Allowed actions
                ],
            },
        ],
    }
    
    response = make_domain_request("PUT", url, headers, json.dumps(payload).encode(), region)
    return response.success

Create role mappings in the OpenSearch domain for your dashboard users (Optional)

Users can be mapped to one or more roles to control their access to the OpenSearch Service domain, which will be reflected in the OpenSearch UI dashboard connected to the domain.

For more information about the rolesmapping endpoint, review the Create role mapping in the OpenSearch documentation.

# Pseudo code to create a role mapping
def create_role_mapping(domain_endpoint: str, region: str, 
                        new_role_name: str) -> bool:
    """Create a new role mapping"""
    url = f"https://{domain_endpoint}/_plugins/_security/api/rolesmapping/{new_role_name}"

    payload = {
        "backend_roles": [
            "<ROLE_ARN_1>",
            "<ROLE_ARN_2>",
        ],
    }

    response = make_domain_request("PUT", url, headers, json.dumps(payload).encode(), region)
    return response.success

These are some important implementation notes:

  • By default, the OpenSearch Domain will create a role mapping for its main user, under all_access and security_manager. If you modify those mappings, we recommend keeping the main user in the list to prevent accidental loss of access.
  • When fine-grained access control is used, if a user opens the OpenSearch UI without being mapped to a role in the OpenSearch Domain, they will be unable to visualize or modify the data located in the OpenSearch Domain, even if they’re part of the OpenSearch UI’s admin group. For this reason, we recommend creating custom resources to add the appropriate role mappings. OpenSearch UI admins will still be able to make changes to the OpenSearch UI dashboards.
  • When programmatically interacting with the OpenSearch Domain APIs, proper authentication is required so your Lambda function or automation script can securely access the APIs. The OpenSearch Domain uses SigV4 authentication. When signing the OpenSearch Domain API requests, the service name must be es.

Cost considerations

This solution uses several AWS services, each with its own cost component:

  • Amazon OpenSearch Service – This is the main cost driver. Charges are based on instance type, number of nodes, and Amazon Elastic Block Store (Amazon EBS) storage. For testing, you can use a smaller instance (for example, t3.small.search) or delete the domain after use to minimize cost.) or delete the domain after use to minimize cost.
  • AWS Lambda – The automation function runs only during deployment and incurs minimal charges for a few short invocations.
  • AWS CDK and CloudFormation – Create temporary IAM roles and Amazon S3 deployment assets with negligible cost.

For pricing details, refer to Amazon OpenSearch Service Pricing.

Clean Up

To avoid incurring ongoing costs, clean up the resources created by this solution when you’ve completed your testing.Open your project directory and destroy the AWS CDK stack:

cd cdk
npx cdk destroy

This command removes the resources provisioned by the AWS CDK stack, including:

  • The Amazon OpenSearch Service domain
  • The OpenSearch UI application
  • The AWS Lambda function and custom resource
  • IAM roles and policies associated with the deployment

By cleaning up, you stop the related charges and maintain a tidy, cost-efficient AWS environment.

Additional resources

Conclusion

By integrating the Saved Objects API with the next-generation Amazon OpenSearch UI, you can programmatically create entire analytics experiences—including workspaces, sample data, visualizations, and dashboards—directly from your IaC.

This approach brings the power of IaC to your analytics layer. Using AWS CDK and AWS Lambda, you can version, deploy, and update dashboards consistently across environments, reducing manual setup while improving reliability and governance. With this automation in place, your teams can focus on insights rather than setup—delivering observability-as-code that scales with your organization.


About the authors

Zhongnan Su

Zhongnan Su

Zhongnan is a Software Development Engineer on the Amazon OpenSearch Service team at Amazon Web Services (AWS) and an active maintainer of OpenSearch Dashboards. He works across the open-source project, and the AWS managed service to build cloud-based infrastructure and drive foundational UI and platform enhancements that elevate the developer experience.

Paul-Andre Bisson

Paul-Andre Bisson

Paul-Andre is a Software Engineer at Amazon Pharmacy. He develops and maintains the infrastructure responsible for orchestrating Amazon Pharmacy shipments and enabling timely delivery to customers. With a passion for process optimization, he enjoys analyzing existing workflows, implementing innovative solutions, and sharing insights with the broader community.

Modernize your data warehouse by migrating Oracle Database to Amazon Redshift with Oracle GoldenGate

Post Syndicated from Sachin Murkar original https://aws.amazon.com/blogs/big-data/modernize-your-data-warehouse-by-migrating-oracle-database-to-amazon-redshift-with-oracle-goldengate/

In this post, we show how to migrate an Oracle data warehouse to Amazon Redshift using Oracle GoldenGate and DMS Schema Conversion, a feature of AWS Database Migration Service (AWS DMS). This approach facilitates minimal business disruption through continuous replication. Amazon Redshift is a fast, fully managed, petabyte-scale data warehouse service that makes it simple and cost-effective to efficiently analyze your data using your existing business intelligence tools.

Solution overview

Our migration approach combines DMS Schema Conversion for schema migration and Oracle GoldenGate for data replication. The migration process consists of four main steps:

  1. Schema conversion using DMS Schema Conversion.
  2. Initial data load using Oracle GoldenGate.
  3. Change data capture (CDC) for ongoing replication.
  4. Final cutover to Amazon Redshift.

The following diagram shows the migration workflow architecture from Oracle to Amazon Redshift, where DMS Schema Conversion handles schema migration and Oracle GoldenGate manages both initial data load and continuous replication through Extract and Replicat processes running on Amazon Elastic Compute Cloud (Amazon EC2) instances. The solution facilitates minimal downtime by maintaining real-time data synchronization until the final cutover.

The solution comprises the following key migration components:

In the following sections, we walk through how to migrate an Oracle data warehouse to Amazon Redshift. For demonstration purposes, we use an Oracle data warehouse consisting of four tables:

dim_customer
dim_product
dim_date
fact_sales

Prerequisites

We recommend reviewing the licensing requirements for Oracle GoldenGate. For more information, refer to Oracle GoldenGate Licensing Information.

Run schema conversion using DMS Schema Conversion

DMS Schema Conversion automatically converts your Oracle database schemas and code objects to Amazon Redshift-compatible formats. This includes tables, views, stored procedures, functions, and data types.

Set up network for DMS Schema Conversion

DMS Schema Conversion requires network connectivity to both your source and target databases. To set up this connectivity, complete the following steps:

  1. Specify a virtual private cloud (VPC) and subnet where DMS Schema Conversion will run.
  2. Configure security group rules to allow traffic between the following:
    1. DMS Schema Conversion and your source Oracle database
    2. DMS Schema Conversion and your target Redshift cluster
  3. For on-premises databases, set up either:
    1. AWS Site-to-Site VPN
    2. AWS Direct Connect

For comprehensive information about network configurations, refer to Setting up a network for DMS Schema Conversion.

Store database credentials in AWS Secrets Manager

DMS Schema Conversion uses secrets stored in AWS Secrets Manager to connect to your database. For instructions to add source and target credentials to Secrets Manager, refer to Store database credentials in AWS Secrets Manager.

Create S3 bucket

DMS Schema Conversion saves items such as assessment reports, converted SQL code, and information about database schema objects in an S3 bucket. For instructions to create an S3 bucket, refer to Create an S3 bucket.

Create IAM policies and roles

To set up DMS Schema Conversion, you must create appropriate IAM policies and roles. This process makes sure AWS DMS has the necessary permissions to access your source and target databases, as well as other AWS services required for the migration.

Prepare DMS Schema Conversion

In this section, we go through the steps to configure DMS Schema Conversion.

Set up instance profile

An instance profile specifies the network, security, and Amazon S3 settings for DMS Schema Conversion to use. Create an instance profile with the following steps:

  1. On the AWS DMS console, choose Instance profiles in the navigation pane.
  2. Choose Create instance profile.
  3. For Name, enter a name (for example, sc-instance).
  4. For Network type, we use IPv4. DMS Schema Conversion also offers Dual-stack mode for both IPv4 and IPv6.
  5. For Virtual private cloud (VPC) for IPv4, choose Default VPC.
  6. For Subnet group, choose your subnet group (for this post, default).
  7. For VPC security groups, choose your security groups. As previously stated, the instance profile’s VPC security group must have access to both the source and target databases.
  8. For S3 bucket, specify a bucket to store schema conversion metadata.
  9. Choose Create instance profile.

Add data providers

Data providers store database types and information about source and target databases for DMS Schema Conversion to connect to. Configure data providers for the source and target databases with the following steps:

  1. On the AWS DMS console, choose Data providers in the navigation pane.
  2. Choose Create data provider.
  3. To create your target, for Name, enter a name (for example, redshift-target).
  4. For Engine type, choose Amazon Redshift.
  5. For Engine configuration, select Choose from Redshift.
  6. For Redshift cluster, choose the target Redshift cluster.
  7. For Port, enter the port number.
  8. For Database name, enter the name of your database.
  9. Choose Create data provider.
  10. Repeat similar steps to create your source data provider.

Create migration project

The DMS Schema Conversion migration project defines migration entities, including instance profiles, source and target data providers, and migration rules. Create a migration project with the following steps:

  1. On the AWS DMS console, choose Migration projects in the navigation pane.
  2. Choose Create migration project.
  3. For Name, enter a name to identify your migration project (for example, oracle-redshift-commercewh).
  4. For Instance profile, choose the instance profile you created.

  1. In the Data providers section, enter the source and target data providers, Secrets Manager secret, and IAM roles.

  1. In the Schema conversion settings section, enter the S3 URL and choose the applicable IAM role.

  1. Choose Create migration project.

Use DMS Schema Conversion to transform Oracle database objects

Complete the following steps to convert source database objects:

  1. On the AWS DMS console, choose Migration projects in the navigation pane.
  2. Choose the migration project you created.
  3. On the Schema conversion tab, choose Launch schema conversion.

The schema conversion project will be ready when the launch is complete. The left navigation tree represents the source database, and the right navigation tree represents the target database.

  1. Generate and view the assessment report.
  2. Select the objects you want to convert and then choose Convert on the Actions menu to convert the source objects to the target database.

The conversion process might take some time depending on the number and complexity of the selected objects.

You can save the converted code to the S3 bucket that you created earlier in the prerequisite steps.

  1. To save the SQL scripts, select the object in the target database tree and choose Save as SQL on the Actions menu.
  2. After you finalize the scripts, run them manually in the target database.
  3. Alternatively, you can apply the scripts directly to the database using DMS Schema Conversion. Select the specific schema in the target database, and on the Actions menu, choose Apply changes.

This will apply the automatically converted code to the target database.

If some objects require action items, DMS Schema conversion flags them and provides details of action items. For the items that require resolution, perform manual changes and apply the converted changes directly to the target database.

Perform data migration

The migration from Oracle Database to Amazon Redshift using Oracle GoldenGate begins with an initial load process, where Oracle GoldenGate’s Extract process captures the existing data from the Oracle source tables and sends this data to the Replicat process, which loads it into Redshift target tables through the appropriate database connectivity. Simultaneously, Oracle GoldenGate’s CDC mechanism tracks the ongoing changes (inserts, updates, and deletes) in the source Oracle database by reading the redo logs. These captured changes are then synchronized to Amazon Redshift in near real time through the Extract-Pump-Replicat process, facilitating data consistency between the source and target systems throughout the migration process.

Prepare source Oracle database for GoldenGate

Prepare your database for Oracle GoldenGate, including configuring connections and logging, enabling Oracle GoldenGate in your database, setting up the flashback query, and managing server resources.

Oracle GoldenGate for BigData only supports uncompressed UPDATE records when replicating to Amazon Redshift. When UPDATE records contain missing columns, those columns are set to null in the target.

To handle this situation, configure Extract to generate trail records with the column values (enable trandata for the columns). Alternatively, you can disable this check by setting gg.abend.on.missing.columns=false, which may result in unintended NULLs on the target database.When gg.abend.on.missing.columns=true, Replicat process on Oracle GoldenGate for BigData fails and returns the following error for compressed update records:

ERROR OGG-15051 Java or JNI exception: java.lang.IllegalStateException: The UPDATE operation record in the trail at pos[0/XXXXXXX] for table [SCHEMA.TABLENAME] has missing columns.

Install Oracle GoldenGate software on Amazon EC2

You must run Oracle GoldenGate on EC2 instances. The instances must have adequate CPU, memory, and storage to handle the anticipated replication volume. For more details, refer to Operating System Requirements. After you determine the CPU and memory requirements, select a current generation EC2 instance type for Oracle GoldenGate.

When the EC2 instance is up and running, download the following Oracle GoldenGate software from the Oracle GoldenGate Downloads page:

  • Oracle GoldenGate for Oracle 21.3.0.0
  • Oracle GoldenGate for Big Data 21c

For installation, refer to Install, Patch, and Upgrade and Installing and Upgrading Oracle GoldenGate for Big Data.

Configure Oracle GoldenGate for initial load

The initial load configuration transfers existing data from Oracle Database to Amazon Redshift. Complete the following configuration steps:

  1. Create an initial load extract parameter file for the source Oracle database using GoldenGate for Oracle. The following code is the sample file content:
    # Extract initial load configuration (INITLE11)
    
    EXTRACT INITLE11
    SETENV ORACLE_HOME=/u01/app/oracle/product/19.3.0/dbhome_1
    USERID ******************:1521/ORCL, PASSWORD ogg_password
    RMTHOST ec2-xx-xx-xx-xx.compute-1.amazonaws.com, MGRPORT 9809, COMPRESS
    RMTTASK REPLICAT, GROUP INITLR11
    TABLE commerce_wh.dim_customer;
    TABLE commerce_wh.dim_product;
    TABLE commerce_wh.dim_date;
    TABLE commerce_wh.fact_sales;

  2. Add the EXTRACT on the GoldenGate for Oracle prompt by running the following command:
    ADD EXTRACT INITLE11, SOURCEISTABLE
    
    GGSCI (ip-**-**-**-**.us-west-2.compute.internal) 1> info INITLE11
    
    Extract    INITLE11  Initialized  2025-07-08 03:44   Status STOPPED
    Checkpoint Lag       Not Available
    Log Read Checkpoint  Not Available
                         First Record         Record 0
    Task                 SOURCEISTABLE

  3. Create a Replicat parameter file for the target Redshift database for the initial load using GoldenGate for Big Data. The following code is the sample file content:
    # Replicate initial load configuration (INITLR11)
    
    REPLICAT INITLR11
    TARGETDB LIBFILE libggjava.so SET property=/home/ec2-user/ogg_bd/dirprm/rs.props
    MAP commerce_wh.dim_customer, TARGET commerce_wh.dim_customer;
    MAP commerce_wh.dim_product, TARGET commerce_wh.dim_product;
    MAP commerce_wh.dim_date, TARGET commerce_wh.dim_date;
    MAP commerce_wh.fact_sales, TARGET commerce_wh.fact_sales;
    ```

  4. Add the REPLICAT on the GoldenGate for Big Data prompt by running the following command:
    ADD REPLICAT INITLR11, SPECIALRUN
    
    GGSCI (ip-**-**-**-**.us-west-2.compute.internal) 2> info INITLR11
    
    Replicat   INITLR11  Initialized  2025-07-08 03:47   Status STOPPED
    Checkpoint Lag       00:00:00 (updated 00:00:05 ago)
    Log Read Checkpoint  Not Available
    Task                 SPECIALRUN

Configure Oracle GoldenGate for CDC and Amazon Redshift handler

In this section, we walk through the steps to configure Oracle GoldenGate for CDC and the Amazon Redshift handler.

Configure Oracle GoldenGate for extracting from source

For continuous replication, set up the Extract, Pump, and Replicat processes:

  1. Create an Extract parameter file for the source Oracle database for CDC using GoldenGate for Oracle. The following code is the sample file content:
    # Extract configuration (EXTPRD)
    
    EXTRACT EXTPRD
    SETENV ORACLE_HOME=/u01/app/oracle/product/19.3.0/dbhome_1
    USERID ********@oracledb:1521/ORCL, PASSWORD ogg_password
    *************************************************/dirdat/ep
    CHECKPOINTSECS 1
    TABLE commerce_wh.dim_customer;
    TABLE commerce_wh.dim_product;
    TABLE commerce_wh.dim_date;
    TABLE commerce_wh.fact_sales;
    TRANLOGOPTIONS ALTARCHIVELOGDEST /u01/app/oracle/fast_recovery_area/ORCL/archivelog

  2. Add the Extract process and register it:
    # Add Extract and Register (EXTPRD)
    
    ADD EXTRACT EXTPRD, INTEGRATED TRANLOG, BEGIN NOW
    
    REGISTER EXTRACT EXTPRD DATABASE
    
    ADD EXTTRAIL /u01/app/oracle/product/21.3.0/oggcore_1/dirdat/ep, EXTRACT 
    EXTPRD
    
    GGSCI (ip-**-**-**-**.us-west-2.compute.internal) 3>  info EXTPRD
    
    Extract    EXTPRD    Initialized  2025-07-08 03:50   Status STOPPED
    Checkpoint Lag       00:00:00 (updated 00:00:36 ago)
    Log Read Checkpoint  Oracle Integrated Redo Logs
                         2025-07-08 03:50:33

  3. Create an Extract Pump parameter file for the source Oracle database to send the trail files to the target Redshift database. The following code is the sample file content:
    # Pump process configuration (PMPPRD)
    
    EXTRACT PMPPRD
    PASSTHRU
    RMTHOST ec2-xx-xx-xx-xx.compute-1.amazonaws.com, MGRPORT 9809, COMPRESS
    RMTTRAIL /home/********/ogg_bd/dirdat/pt
    TABLE commerce_wh.dim_customer;
    TABLE commerce_wh.dim_product;
    TABLE commerce_wh.dim_date;
    TABLE commerce_wh.fact_sales;

  4. Add the Pump process:
    # Pump process addition
    
    ADD EXTRACT PMPPRD, EXTTRAILSOURCE /u01/app/oracle/product/21.3.0/oggcore_1/dirdat/ep
    
    ADD RMTTRAIL /home/ec2-user/ogg_bd/dirdat/pt, EXTRACT PMPPRD
    
    GGSCI (ip-**-**-**-**.us-west-2.compute.internal) 4> info PMPPRD
    
    Extract    PMPPRD    Initialized  2025-07-08 03:51   Status STOPPED
    Checkpoint Lag       00:00:00 (updated 00:00:09 ago)
    Log Read Checkpoint  File /u01/app/oracle/product/21.3.0/oggcore_1/dirdat/ep000000000
                         First Record  RBA 0

Configure Oracle GoldenGate Redshift handler to apply changes to target

To configure an Oracle GoldenGate Replicat to send data to a Redshift cluster, you must set up a Redshift properties file and a Replicat parameter file that defines how data is migrated to Amazon Redshift. Complete the following steps:

  1. Configure the Replicat properties file (rs.props), which consists of an S3 event handler and Redshift event handler. The following is an example Replicat properties file configured to connect to Amazon Redshift:
    gg.target=redshift
    
    # S3 Event Handler
    gg.eventhandler.s3.region=us-west-2
    gg.eventhandler.s3.bucketMappingTemplate=your-s3-bucket-name
    
    # Redshift Event Handler
    gg.eventhandler.redshift.connectionURL=jdbc:redshift://your-cluster.region.redshift.amazonaws.com:5439/dev
    gg.eventhandler.redshift.userName=your_redshift_username
    gg.eventhandler.redshift.Password=your_redshift_password
    gg.classpath=/path/to/aws-sdk-java/*:/path/to/redshift-jdbc-driver.jar
    jvm.bootoptions=-Xmx8g -Xms8g
    
    gg.eventhandler.redshift.AwsIamRole=arn:aws:iam::your-account-id:role/your-redshift-role
    
    gg.abend.on.missing.columns=false

    To authenticate Oracle GoldenGate’s access to the Redshift cluster for data load operations, you have two options. The recommended and more secure method is to use IAM role authentication by configuring the gg.eventhandler.redshift.AwsIamRole property in the properties file. This approach provides more secure, role-based access. Alternatively, you can use access key authentication by setting the environment variables AWS_ACCESS_KEY_ID and AWS_SECRET_ACCESS_KEY. For more information, refer to the Oracle GoldenGate for BigData documentation.

  2. Create a Replicat parameter file for the target Redshift database using Oracle GoldenGate for BigData. The following code is the sample file content:
    # Replicat process configuration (RSPRD)
    
    REPLICAT RSPRD
    TARGETDB LIBFILE libggjava.so SET property=/home/********/ogg_bd/dirprm/rs.props
    REPORTCOUNT EVERY 1 MINUTES, RATE
    GROUPTRANSOPS 1000
    MAP commerce_wh.dim_customer, TARGET commerce_wh.dim_customer;
    MAP commerce_wh.dim_product, TARGET commerce_wh.dim_product;
    MAP commerce_wh.dim_date, TARGET commerce_wh.dim_date;
    MAP commerce_wh.fact_sales, TARGET commerce_wh.fact_sales;

  3. Add a Replicat process:
    # Add Replicat
    ADD REPLICAT RSPRD, EXTTRAIL /home/ec2-user/ogg_bd/dirdat/pt, BEGIN NOW
    
    GGSCI (ip-**-**-**-**.us-west-2.compute.internal) 3> info RSPRD
    
    Replicat   RSPRD     Initialized  2025-07-08 03:52   Status STOPPED
    Checkpoint Lag       00:00:00 (updated 00:00:07 ago)
    Log Read Checkpoint  File /home/ec2-user/ogg_bd/dirdat/pt000000000
                         2025-07-08 03:52:48.471461

Start initial load and change sync

First start the change sync extract and data pump on the source Oracle database. This will start capturing changes while you perform the initial load.

  1. In the GoldenGate for Oracle GGSCI utility, start EXTPRD and PMPPRD:
    GGSCI (ip-**-**-**-**.us-west-2.compute.internal as ggsuser@ORCL) 13> start EXTPRD
    
    Sending START request to Manager ...
    Extract group EXTPRD starting.
    
    
    GGSCI (ip-**-**-**-**.us-west-2.compute.internal as ggsuser@ORCL) 15> start PMPPRD
    
    Sending START request to Manager ...
    Extract group PMPPRD starting.

    Do not start Replicat at this point.

  2. Record the Source System Change Number (SCN) from the Oracle database, which serves as the starting point for replication on the target system:
    select current_scn from v$database;
    
    CURRENT_SCN
    13940177

  3. Start the initial load Extract process, which will automatically trigger the corresponding initial load Replicat on the target system:
    GGSCI (ip-**-**-**-**.us-west-2.compute.internal as ggsuser@ORCL) 21> start INITLE11
    
    Sending START request to Manager ...
    Extract group INITLE11 starting.

  4. Monitor the initial load completion status by executing the following command on the GoldenGate for BigData GGSCI utility. Make sure the initial load process has completed successfully before proceeding to the next step. The report will indicate the load status and potential errors that need attention.
    VIEW REPORT INITLR11

  5. Start the change synchronization Replicat RSPRD using the previously captured SCN to facilitate continuous data replication:
    GGSCI (ip-**-**-**-**.us-west-2.compute.internal) 17> start RSPRD , aftercsn 13940177
    
    Sending START request to Manager ...
    Replicat group RSPRD starting.

Refer to the Oracle GoldenGate documentation for Amazon Redshift handlers to learn more about its detailed functionality, unsupported operations, and system limitations.

When transitioning from initial load to continuous replication in an Oracle database to Amazon Redshift migration using Oracle GoldenGate, it’s crucial to properly manage data collisions to maintain data integrity. The key is to capture and use an appropriate SCN that marks the exact point where initial load ends and CDC begins. Without proper collision handling, you might encounter duplicate records or missing data during the transition period. Implementing appropriate collision handling mechanisms makes sure duplicate records are properly managed without causing data inconsistencies in the target system. For more information on HANDLECOLLISIONS, refer to the Oracle GoldenGate documentation.

Clean up

When the migration is complete, complete the following steps:

  1. Stop and remove Oracle GoldenGate processes (EXTRACT, PUMP, REPLICAT).
  2. Delete EC2 instances used for Oracle GoldenGate.
  3. Remove IAM roles created for migration.
  4. Delete S3 buckets used for DMS Schema Conversion (if no longer needed).
  5. Update application connection strings to point to the new Redshift cluster.

Conclusion

In this post, we showed how to modernize your data warehouse by migrating to Amazon Redshift using Oracle GoldenGate. This approach facilitates minimal downtime and provides a flexible, reliable method for transitioning your critical data workloads to the cloud. With the complexity involved in database migrations, we highly recommend testing the migration steps in non-production environments prior to making changes in production. By following the best practices outlined in this post, you can achieve a smooth migration process and set the foundation for a scalable, cost-effective data warehousing solution on AWS. Remember to continuously monitor your new Amazon Redshift environment, optimize query performance, and take advantage of the AWS suite of analytics tools to derive maximum value from your modernized data warehouse.


About the authors

Sachin Murkar

Sachin Murkar

Sachin is a Cloud Support Database Engineer at AWS. He is a Subject Matter Expert in RDS PostgreSQL and Aurora PostgreSQL. Based in the Pacific Northwest region, Sachin focuses on helping customers optimize their AWS database solutions, with particular expertise in Amazon RDS and Aurora.

Ravi Teja Bellamkonda

Ravi Teja Bellamkonda

Ravi is a Technical Account Manager (TAM) at AWS and a Subject Matter Expert (SME) for AWS DMS. With nearly 10 years of experience in database technologies, specializing in PostgreSQL and Oracle, he helps customers design and execute seamless database migration strategies to the cloud.

Bipin Nair

Bipin Nair

Bipin is a Cloud Support Database Engineer at AWS and Subject Matter Expert for AWS DMS and Amazon RDS for PostgreSQL. He has over a decade of experience in working with Oracle databases, Replication Services and AWS relational databases.

On-demand and scheduled scaling of Amazon MSK Express based clusters

Post Syndicated from Subham Rakshit original https://aws.amazon.com/blogs/big-data/on-demand-and-scheduled-scaling-of-amazon-msk-express-based-clusters/

Modern streaming workloads are highly dynamic—traffic volumes fluctuate based on time of day, business cycles, or event-driven bursts. Customers need to dynamically scale Apache Kafka clusters up and down to maintain consistent throughput and performance without incurring unnecessary cost. For example, ecommerce platforms see sharp traffic increases during seasonal sales, and financial systems experience load spikes during market hours. Scaling clusters helps teams align cluster capacity with increased ingress throughput in response to these variations, leading to more efficient utilization and a better cost-to-performance ratio.

Amazon Managed Streaming for Apache Kafka (Amazon MSK) Express brokers are a key component to dynamically scaling clusters to meet demand. Express based clusters deliver 3 times higher throughput, 20 times faster scaling capabilities, and 90% faster broker recovery compared to Amazon MSK Provisioned clusters. In addition, Express brokers support intelligent rebalancing for 180 times faster operation performance, so partitions are automatically and consistently well distributed across brokers. This feature is enabled by default for all new Express based clusters and comes at no additional cost to customers. This capability alleviates the need for manual partition management when modifying cluster capacity. Intelligent rebalancing automatically tracks cluster health and triggers partition redistribution when resource imbalances are detected, maintaining performance across brokers.

This post demonstrates how to use the intelligent rebalancing feature and build a custom solution that scales Express based clusters horizontally (adding and removing brokers) dynamically based on Amazon CloudWatch metrics and predefined schedules. The solution provides capacity management while maintaining cluster performance and minimizing overhead.

Overview of Kafka scaling

Scaling Kafka clusters involves adding or removing brokers to the cluster while providing balanced data distribution and uninterrupted service. When new brokers are added, partition reassignment is required to evenly distribute load across the cluster. This process is typically performed manually—either through the Kafka command line tools (kafka-reassign-partitions.sh) or by using automation frameworks such as Cruise Control, which intelligently calculates and executes reassignment plans. During scale-in operations, partitions hosted on the brokers marked for removal must first be migrated to other brokers, leaving the target brokers empty before decommissioning.

Challenges of scaling Kafka dynamically

The complexity of scaling depends heavily on the underlying storage model. In deployments where broker data resides entirely on local storage, scaling involves physical data movement between brokers, which can take considerable time depending on partition size and replication factor. In contrast, environments that use tiered storage shift most of the data to remote object storage such as Amazon Simple Storage Service (Amazon S3), making scaling a largely metadata-driven operation. This significantly reduces data transfer overhead and accelerates both broker addition and removal, enabling more elastic and operationally efficient Kafka clusters.

However, scaling Kafka remains a non-trivial operation due to the interplay between storage, data movement, and broker resource utilization. When partitions are reassigned across brokers, large volumes of data must be copied over the network, often leading to network bandwidth saturation, storage bandwidth exhaustion, and elevated CPU utilization. Depending on data volume and replication factor, partition rebalancing can take several hours, during which time cluster performance and throughput might temporarily degrade and often require additional configuration to throttle the data movement. Although tools like Cruise Control automate this process, they introduce another layer of complexity: selecting the right combination of rebalancing goals (such as disk capacity, network load, or replica distribution) requires a deep understanding of Kafka internals and trade-offs between speed, balance, and stability. As a result, efficient scaling is an optimization problem, demanding careful orchestration of storage, compute, and network resources.

How Express brokers simplify scaling

Express brokers manage Kafka scaling through their decoupled compute and storage architecture. This innovative design enables unlimited storage without pre-provisioning, significantly simplifying cluster sizing and management. The separation of compute and storage resources allows Express brokers to scale faster than standard MSK brokers, enabling rapid cluster expansion within minutes. With Express brokers, administrators can adjust capacity both vertically and horizontally as needed, alleviating the need for over-provisioning. The architecture provides sustained broker throughput during scaling operations, with Express brokers capable of handling 500 MBps ingress and 1000 MBps egress on m7g.16xl instances. For more information about how the scaling process works in Express based clusters, see Express brokers for Amazon MSK: Turbo-charged Kafka scaling with up to 20 times faster performance.

Added to this faster scaling capability, when you add or remove brokers from your Express based clusters, intelligent rebalancing automatically redistributes partitions to balance resource utilization across the brokers. This makes sure the cluster continues to operate at peak performance, making scaling in and out possible with a single update operation. Intelligent rebalancing is enabled by default on new Express broker clusters and continuously monitors cluster health for resource imbalances or hotspots. For example, if certain brokers become overloaded due to uneven distribution of partitions or skewed traffic patterns, intelligent rebalancing will automatically move partitions to less utilized brokers to restore balance.

Finally, Express based clusters automate client configuration of broker bootstrap connection strings to allow clients to connect to clusters seamlessly as brokers are added and removed. Express based clusters provide three connection strings, one per Availability Zone, which are independent of the brokers in the cluster. This means clients only need to configure these connection strings to maintain consistent connections as brokers are added or removed. These key capabilities of Express based clusters—rapid scaling, intelligent rebalancing, and dynamic broker bootstrapping—are critical to enabling dynamic scaling in Kafka clusters. In the following section, we explore how we use these capabilities to automate the scaling process of Express based clusters.

On-demand and scheduled scaling

Leveraging fast scaling capabilities of Express brokers together with intelligent rebalancing, you can build a flexible and dynamic scaling solution to optimize your Kafka cluster resources. There are two primary approaches for automatic scaling that balance performance needs with cost efficiency: on-demand and scheduled scaling.

On-demand scaling

On-demand scaling tracks cluster performance and responds to capacity demands. This approach addresses scenarios where workload patterns experience traffic spikes. On-demand scaling tracks Amazon MSK performance indicators as CPU utilization and network ingress and egress throughput per broker. Beyond these infrastructure metrics, the solution also supports using CloudWatch metrics to enable business-logic-driven scaling decisions.

The solution evaluates the performance metrics continuously against configurable thresholds to determine when scaling actions are necessary. When brokers operate above capacity thresholds consistently over a period of time, it invokes an Amazon MSK API to increase the broker count of the cluster. The solution in this post currently supports horizontal scaling (adding and removing brokers) only. Intelligent rebalancing will then automatically redistribute the partitions to spread the load across the new brokers that are added. Similarly, when utilization drops below thresholds, the solution invokes an Amazon MSK API to remove brokers. The rebalancing process automatically moves partitions from the broker marked for removal to other brokers in the cluster. This solution requires topics to have sufficient partitions to support rebalancing to new brokers as brokers are added.

The following diagram illustrates the on-demand scaling workflow.

This diagram illustrates the automated scaling and rebalancing workflow for Amazon Managed Streaming for Apache Kafka (MSK). The process consists of four sequential stages that ensure optimal cluster performance through intelligent monitoring and automated actions.

Scheduled scaling

Scheduled scaling adjusts cluster capacity using time-based triggers. This approach is useful for applications with traffic patterns that correlate with business hours or schedules. For example, ecommerce platforms benefit from scheduled scaling during peak sale periods when customer activity peaks. Scheduled scaling is also useful for customers who want to avoid cluster modification operations during business hours. This solution uses a configurable schedule to scale out the cluster capacity before business hours to handle the anticipated traffic and scale in after business hours to reduce costs. This particular solution currently supports horizontal scaling (adding/removing brokers) only. With scheduled scaling, you can handle specific scenarios such as weekday business hours, weekend maintenance windows, or specific dates. You can also specify the desired number of brokers at scale-out and scale-in.

The following diagram illustrates the scheduled scaling workflow.

This horizontal process flow diagram illustrates the automated scaling and rebalancing workflow for Amazon Managed Streaming for Apache Kafka (MSK). The diagram demonstrates how MSK clusters continuously monitor performance, evaluate scaling requirements, execute scaling operations, and automatically rebalance partitions to maintain optimal performance without manual intervention.

Solution overview

This solution provides scaling automation for Express brokers through two approaches:

  • On-demand scaling – Tracks built-in cluster performance metrics or custom CloudWatch metrics and adjusts broker capacity when thresholds are crossed
  • Scheduled scaling – Scales clusters based on specific schedules

In the following sections, we provide the implementation details for both scaling methods.

Prerequisites

Complete the following steps as prerequisites:

  1. Create an Express cluster with intelligent rebalancing enabled. The intelligent rebalancing feature is required for this solution to work. Note the Amazon Resource Name (ARN) of the cluster.
  2. Install Python 3.11 or higher on Amazon Elastic Compute Cloud (Amazon EC2).
  3. Install the AWS Command Line Interface (AWS CLI) and configure it with your AWS credentials.
  4. Install the AWS CDK CLI.

On-demand scaling solution

The solution uses an AWS Lambda function that is triggered by an Amazon EventBridge scheduler periodically. The Lambda function checks the cluster state and time since the last broker addition or removal was done. This is done to determine if the cluster is ready to scale. If the cluster is ready for scaling, the function collects the CloudWatch metrics that need to be evaluated to make the scaling decision. Based on the scaling configuration and using the metrics in CloudWatch, the function evaluates the scaling logic and executes the scaling decision. The scaling decision can lead to addition or removal of brokers to the cluster. In both cases, intelligent rebalancing handles partition distribution across brokers without manual intervention. You can find more details of the scaling logic in the GitHub repo.

The following diagram illustrates the architecture of the on-demand scaling solution.

This AWS architecture diagram illustrates a serverless event-driven workflow that uses Amazon EventBridge Scheduler to trigger AWS Lambda functions that interact with Amazon MSK Express brokers, with monitoring provided by Amazon CloudWatch Metrics. The diagram demonstrates a fully managed, scalable architecture for time-based or event-based Apache Kafka operations.

Deploy on-demand scaling solution

Follow these steps to deploy the on-demand scaling infrastructure. For this post, we demonstrate the on-demand scale-out functionality.

  1. Run the following commands to set the project up:
    git clone https://github.com/aws-samples/sample-msk-express-brokers-scaling.git
    cd sample-msk-express-brokers-scaling/scaling/cdk
    python -m venv .venv && source .venv/bin/activate
    pip install -r requirements.txt

  2. Modify the thresholds to match your MSK broker instance size and business requirements by editing src/config/on_demand_scaling_config.json. Refer to the configuration documentation for more details of the configuration options available.
    By default, on_demand_scaling_config.json considers the express.m7g.large broker instance size. Therefore the scale-in/scale-out ingress/egress thresholds are configured at 70% of the recommended sustained throughput for the instance size.
  3. Bootstrap your environment for use with the AWS CDK.
  4. Deploy the on-demand scaling AWS CDK application:
    cdk deploy MSKOnDemandScalingStack \
      --app "python3 msk_on_demand_scaling_stack.py" \
      --context cluster_arn="<< ARN of the MSK Cluster >>" \
      --context monitoring_frequency_minutes=1 \
      --context stack_name="MSKOnDemandScalingStack"

The monitoring_frequency_minutes parameter controls how often the EventBridge scheduler invokes the scaling logic Lambda function to evaluate cluster metrics.

The deployment creates the AWS resources required to run the on-demand scaling solution. The details of the resources created are shown in the output of the command.

Test and monitor the on-demand scaling solution

Configure the bootstrap server for your MSK cluster. You can get the bootstrap server from the AWS Management console or using the AWS CLI.

export BOOTSTRAP=<<BOOTSTRAP_SERVER>>

Create a Kafka topic in the cluster. Update the following command for the specific authentication method in Amazon MSK. Refer to the Amazon MSK Labs workshop for more details.

Topics should have a sufficient number of partitions that can be distributed across a larger set of brokers.

export TOPIC_NAME=<<TOPIC_NAME>>

bin/kafka-topics.sh \
--bootstrap-server=$BOOTSTRAP \
--create \
--replication-factor 3 \
--partitions 96 \
--topic $TOPIC_NAME

Generate load on the MSK cluster to trigger and verify the scaling operations. You can use an existing application that drives load to your cluster. You can also use the kafka-producer-perf-test.sh utility that is bundled as part of the Kafka distribution to generate load:

bin/kafka-producer-perf-test.sh \
  --topic $TOPIC_NAME \
  --num-records 1000000000 \
  --record-size 1024 \
  --throughput -1 \
  --producer-props bootstrap.servers=$BOOTSTRAP

Monitor the scaling operations by tailing the Lambda function logs:

aws logs tail /aws/lambda/MSKOnDemandScalingStack-MSKScalingFunction  \
--follow --format short

In the logs, look for the following messages to identify the exact times when scaling operations occurred. The log statements above these messages show the rationale behind the scaling decision:

[INFO] Calling MSK UpdateBrokerCount API...
 [INFO] Successfully initiated broker count update operation

The solution also creates a CloudWatch dashboard that provides visibility into scaling operations and many other broker metrics. The link to the dashboard is shown in the output of the cdk deploy command.

The following figure shows a cluster that started with three brokers. After the 09:15 mark, it received consistent inbound traffic, which exceeded the thresholds set in the solution. The solution added three more brokers that came into service at around the 09:45 mark. Intelligent rebalancing reassigned some of the partitions to the newly added brokers and the incoming traffic was split across six brokers. The solution continued adding more brokers until the cluster had 12 brokers and the intelligent rebalancing feature continued distributing the partitions across the newly added brokers.

Amazon MSK Broker Network Throughput Performance Chart: Bytes In Per Second Maximum by Broker This time-series line chart visualizes the maximum inbound network throughput performance across 25 individual Apache Kafka brokers in an Amazon Managed Streaming for Apache Kafka (MSK) cluster over a 3-hour time period from 09:00 to 11:45. The chart demonstrates broker-level network ingestion rates, scaling operations, and performance variations during active workload processing.

The following figure shows the times when partition rebalancing was active (value=1). In the context of this solution, that typically occurs after new brokers are added or removed and the scaling operations are complete.

Amazon MSK Intelligent Rebalancing Status Timeline Chart This binary state timeline chart visualizes the activation and deactivation cycles of Amazon Managed Streaming for Apache Kafka (MSK) Intelligent Rebalancing feature over a 2 hour and 45 minute observation period from 09:00 to 11:45. The chart displays discrete on/off status indicators showing when the automated partition rebalancing feature was actively running versus inactive.

The following figure shows the number of brokers added (positive values) or removed (negative values) from the cluster. This helps visualize and track the size of the cluster as it goes through scaling operations.

Amazon MSK Broker Count Change Timeline Chart This time-series chart visualizes broker count changes in an Amazon Managed Streaming for Apache Kafka (MSK) cluster over a 2 hour and 45 minute period from 09:00 to 11:45 UTC on November 12, 2025. The chart tracks incremental additions and removals of Kafka brokers, demonstrating MSK's dynamic scaling capabilities in response to workload demands.

Scheduled scaling solution

The scheduled scaling implementation supports timing patterns through an EventBridge schedule. You can configure timing to trigger an action using cron expressions. Based on the cron expression, the EventBridge Scheduler triggers a Lambda function at the specified time to scale out or scale in. The Lambda function performs checks if the cluster is ready for a scaling operation and performs the requested scaling operation by invoking the Amazon MSK control plane API. The service allows removing only three brokers at a time from a cluster. The solution handles this scenario by repeatedly removing the brokers in counts of three until the desired number of brokers are reached.

The following diagram illustrates the architecture of the scheduled scaling solution.

This AWS architecture diagram illustrates an event-driven, time-based auto-scaling workflow where two Amazon EventBridge Scheduler instances trigger an AWS Lambda function to execute scale-up and scale-down operations on an Amazon MSK Express broker. The diagram demonstrates serverless capacity management for Apache Kafka infrastructure using scheduled automation.

Configuration parameters

EventBridge schedules support cron expressions for precise timing control, so you can fine-tune scaling operations for specific times of day and days of the week. For example, you can configure scaling to occur at 8:00 AM on weekdays using the cron expression cron(0 8 ? * MON-FRI *). To scale in at 6:00 PM on the same days, use cron(0 18 ? * MON-FRI *). For more patterns, refer to Setting a schedule pattern for scheduled rules (legacy) in Amazon EventBridge. You can also configure the desired broker count to be reached during scale-out and scale-in operations.

Deploy scheduled scaling solution

Follow these steps to deploy the scheduled scaling solution:

  1. Run the following commands to set the project up:
    cd scaling/cdk
    python3 -m venv .venv && source .venv/bin/activate
    pip install -r requirements.txt

  2. Modify the scaling schedule by editing scaling/cdk/src/config/scheduled_scaling_config.json. Refer to the configuration documentation for more details of the configuration options available.
  3. Deploy the scheduled scaling AWS CDK application:
    cdk deploy MSKScheduledScalingStack \
        --app "python3 msk_scheduled_scaling_stack.py" \
        --context cluster_arn="<< ARN of the MSK Cluster >>" \
        --context stack_name="MSKScheduledScalingStack"

Test and monitor the scheduled scaling solution

The scheduled scaling is triggered as specified in the EventBridge Scheduler cron. However, if you want to test the scale-out operations, run the following command to manually invoke the Lambda function:

aws lambda invoke \
  --function-name MSKScheduledScalingStack-MSKScheduledScalingFunction \
  --payload '{"source":"aws.scheduler.scale-out","detail":{"action":"scale_out","schedule_name":"MSKScheduledScaleOut"}}' \
  --cli-binary-format raw-in-base64-out \
  response.json

Similarly, you can manually start a scale-in operation by running the following command:

aws lambda invoke \
  --function-name MSKScheduledScalingStack-MSKScheduledScalingFunction \
  --payload '{"source":"aws.scheduler.scale-in","detail":{"action":"scale_in","schedule_name":"MSKScheduledScaleIn"}}' \
  --cli-binary-format raw-in-base64-out \
  response.json

Monitor the scaling operations by tailing the Lambda function logs:

aws logs tail /aws/lambda/MSKScheduledScalingStack-MSKScheduledScalingFunction  \
--follow --format short

You can monitor scheduled scaling using the CloudWatch dashboard as described in the on-demand scaling section.

Review scaling configuration parameters

The configuration parameters for both on-demand and scheduled scaling are documented in Configuration Options. These configurations give you flexibility to change how and when the scaling happens. It is important to go through the configuration parameters and make sure they meet your business requirement. For on-demand scaling, you can scale the cluster based on built-in performance metrics or custom metrics (for example MessagesInPerSec).

Considerations

Keep in mind the following considerations when deploying either solution:

  • EventBridge notifications for scaling failures – Both on-demand and scheduled scaling solutions publish EventBridge notifications when scaling operations fail. Create EventBridge rules to route these failure events to your monitoring and alerting system to detect failures in scaling and respond to them. For details on event sources, types, and payloads, refer to the EventBridge notifications section in the GitHub repo.
  • Cool-down period management – Properly configure cool-down periods to prevent scaling oscillations where the cluster repeatedly scales out and scales in rapidly. Oscillations typically occur when traffic patterns have short-term spikes that don’t represent sustained demand. Oscillations can also happen when thresholds are set too close to normal operating levels. Set cool-down periods based on your workload characteristics and the scaling completion times. Also consider different cool-down periods for scale-out vs. scale-in operations by setting longer cool-down periods for scale-in operations (scale_in_cooldown_minutes) compared to scaling out (scale_out_cooldown_minutes). Test cool-down settings under realistic load patterns before production deployment to achieve optimal performance.
  • Cost control through monitoring frequency – The solution incurs costs for services like Lambda functions, EventBridge schedules, CloudWatch metrics, and logs that are used in the solution. Both on-demand and scheduled scaling solutions work by running periodically to check the cluster health status and if a scaling operation needs to be performed. The default 1-minute monitoring frequency provides responsive scaling but increases other costs associated with the solution. Consider increasing the monitoring interval based on your workload characteristics to balance scaling responsiveness and the cost incurred by the solution. You can change the monitoring frequency by changing the monitoring_frequency_minutes when you deploy the solution.
  • Solution isolation – The on-demand and scheduled scaling solutions were designed and tested in isolation to support predictable behavior and optimal performance. You can deploy either solution, but avoid running both solutions simultaneously on the same cluster. Using both approaches together can cause unpredictable scaling behavior where the solutions might conflict with each other’s scaling decisions, leading to resource contention and potential scaling oscillations. Choose the approach that best matches your workload patterns and deploy only one scaling solution per cluster.

Clean up

Follow these steps to delete the resources created by the solution. Make sure all the scaling operations that are in flight are completed before you run the cleanup.Delete the on-demand scaling solution with the following code:

cdk destroy MSKOnDemandScalingStack --app "python3 msk_on_demand_scaling_stack.py" --context cluster_arn="<MSK_CLUSTER_ARN>"

Delete the scheduled scaling solution with the following code:

cdk destroy MSKScheduledScalingStack --app "python3 msk_scheduled_scaling_stack.py" --context cluster_arn="<MSK_CLUSTER_ARN>"

Summary

In this post, we showed how to use intelligent rebalancing to scale your Express based cluster based on your business requirements without requiring manual partition rebalancing. You can extend the solution to use the specific CloudWatch metrics that your business depends on to dynamically scale your Kafka cluster. Similarly, you can adjust the scheduled scaling solution to scale out and scale in your cluster when you anticipate significant change in traffic to your cluster at specific times.To learn more about the services used in this solution, refer to the following resources:


About the authors

Subham Rakshit

Subham Rakshit

Subham is a Senior Streaming Solutions Architect for Analytics at AWS based in the UK. He works with customers to design and build streaming architectures so they can get value from analysing their streaming data. His two little daughters keep him occupied most of the time outside work, and he loves solving jigsaw puzzles with them.

Rakshith Rao

Rakshith Rao

Rakshith is a Senior Solutions Architect at AWS. He works with AWS’s strategic customers to build and operate their key workloads on AWS.

Power up your analytics with Amazon SageMaker Unified Studio integration with Tableau, Power BI, and more

Post Syndicated from Narendra Gupta original https://aws.amazon.com/blogs/big-data/power-up-your-analytics-with-amazon-sagemaker-unified-studio-integration-with-tableau-power-bi-and-more/

Organizations face challenges in accessing and analyzing governed data across multiple sources through their preferred business intelligence (BI) and analytics tools while maintaining security and governance. They need a seamless way to connect their familiar tools (like Tableau, Power BI, Excel) to Amazon SageMaker‘s data assets without compromising data governance and security protocols.

Amazon SageMaker supports authentication through the Amazon Athena JDBC driver, allowing data users to query their subscribed data lake assets via popular BI and analytics tools like Tableau, Power BI, Excel, SQL Workbench, DBeaver, and more. This integration empowers data users to access and analyze governed data within Amazon SageMaker using familiar tools, boosting both productivity and flexibility.

Customers use Amazon SageMaker Unified Studio to streamline data access and governance by enabling data users to locate and subscribe to data from multiple sources within a single project. Amazon SageMaker Unified Studio natively integrates with Amazon-specific options like Amazon Athena, Amazon Redshift, and Amazon SageMaker AI, allowing users to analyze their project governed data. With this launch of JDBC connectivity, Amazon SageMaker Unified Studio expands its support for data users, including analysts and scientists, allowing them to work in their preferred tools, whether it’s SQL Workbench, Domino, or Amazon-native solutions like Amazon Athena, while ensuring secure, governed access within Amazon SageMaker Unified Studio.

Getting Started

To get started, download and install the latest Athena JDBC driver for your tool of choice. After installation, copy the JDBC connection string from the Amazon SageMaker Unified Studio portal into the JDBC connection configuration to establish a connection from your tool. This directs you to authenticate using single sign-on (SSO) with your corporate credentials. After connecting, you can query, visualize, and share data—governed by Amazon SageMaker Unified Studio–within the tools you already know and trust.

In this post, we guide you through connecting various analytics tools to Amazon SageMaker Unified Studio using the Athena JDBC driver, enabling seamless access to your subscribed data within your Amazon SageMaker Unified Studio projects.

Solution overview

To demonstrate these capabilities, consider a use case where your marketing team wants to analyze sales data to understand patterns in sales by stores and sales representatives. To achieve this, your marketing team needs access to sales_performance_by_store, and sales_performance_by_rep data owned by the sales team. The sales team, acting as the data producer, publishes the necessary data assets to Amazon SageMaker Unified Studio, allowing the marketing team, as a consumer, to discover and subscribe to these assets.

After the subscription is approved, the data assets become available within the marketing team’s project environment in Amazon SageMaker Unified Studio. The marketing team can then use their preferred tool to perform data exploration. An example architecture of how this is done using DBeaver is shown in the following image:

SageMaker Unified Studio project architecture diagram showing data collaboration between Sales and Marketing teams with Amazon S3 storage and Athena integration

Prerequisites

To follow along with this post, you need the following prerequisites in place:

  1. AWS account – If you don’t have an active AWS account, see How do I create and activate a new AWS account?.
  2. Amazon SageMaker resources – You need a domain for Amazon SageMaker, and two Amazon SageMaker project.
  3. Publish data assets – As the data producer from the sales team, you can now ingest individual data assets into Amazon SageMaker Unified Studio. For this use case, create a data source and import the technical metadata of two data assets – sales_performance_by_store, and sales_performance_by_rep – from AWS Glue Data Catalog. Ensure the data assets are enriched with business descriptions and published to the catalog.
    Note: Here we are using tables which are in the Glue catalog but with Sagemaker Lakehouse you have the option to bring assets from other sources.
  4. Subscribe data assets – As a data analyst from the marketing team, you can now discover and subscribe to the data assets. The data producer from the retail team reviews and approves your subscription. Upon successful fulfillment, the data assets are added to your SageMaker Unified project.

For detailed instructions for publishing and subscribing, see the Amazon SageMaker Unified Studio User Guide.

The following figure shows the subscribed assets added to the subscribed assets section in your marketing project catalog.

SageMaker Unified Studio Assets page displaying subscribed data assets with accessibility status indicators

In the following sections, we walk you through the steps to configure DBeaver to consume the subscribed assets from Amazon SageMaker Unified Studio.

Configuring DBeaver to access subscribed data assets

In this section, you configure DBeaver to access the subscribed assets from the Marketing project

To configure DBeaver:

  1. Connect with JDBC: In the Amazon SageMaker Unified Studio, (1) open the Marketing project, (2) on the Project overview screen, (3) choose JDBC connection details tab.
    SageMaker Unified Studio Project overview page showing JDBC connection parameters for external application integration
  2. Copy the JDBC connection URL into a text editor. The URL should have the following parameters needed for configuring the database connection in DBeaver – Domain ID, Environment ID, Region, and IDC Issuer URL.
    JDBC connection details configuration panel with IDC authentication parameters and copy functionality
  3. Download and install the latest Athena driver:
    • If DBeaver has the Athena driver pre-installed, it might be the older (v2) version. To ensure compatibility with Amazon SageMaker Unified Studio, you need the latest driver (v3), which includes the necessary authentication features.
    • Download the latest JDBC driver—version 3.x.
    • To install the latest driver:
      • Go to Database and then to Driver Manager in DBeaver.
      • Select the Athena driver and choose Edit.
      • Visit the Libraries tab.
      • Choose Download/Update to fetch the latest driver version.
      • If prompted, select the appropriate version and confirm the download.
  4. In the DBeaver SQL client, create a new database connection and select the Athena driver.
    DBeaver database connection dialog showing Amazon Athena driver selection among available database options
  5. Switch to the Driver Properties tab, enter the values of the following properties that are available in the JDBC connection URL you copied from Amazon SageMaker Unified Studio. If any of these properties are not already available, you can add them and provide their respective values.
    • CredentialsProvider: The credentials provider to authenticate requests to AWS
    • DataZoneDomainId: The ID of your Amazon DataZone domain
    • DataZoneDomainRegion: The AWS Region where your domain is hosted
    • DataZoneEnvironmentId: The ID of your DefaultDataLake environment
    • IdentityCenterIssuerUrl: The issuer URL used by AWS Identity and Access Management (IAM) Identity Center for token issuance
    • OutputLocation: Amazon S3 path for storing query results
    • Region: The Region where the environment is created
    • Workgroup: Amazon Athena workgroup of the environment
    • ListenPort: Pick any four digits port number. This is the port number that listens for the IAM Identity Center response

    DBeaver connection configuration dialog for Amazon Athena with driver properties and authentication settings

  6. Choose Test Connection….
  7. You are redirected to the IAM Identity Center sign-in portal. Sign in with Marketing user credentials. If you’re already signed in through single sign-on (SSO), this step can be skipped.
    AWS authentication sign-in page with username input field
  8. After you sign in, if you are prompted to authorize the DataZoneAuthPlugin. Choose Allow access to authorize access to Amazon DataZone from DBeaver.
    AWS DataZone authorization dialog requesting user permission for application access
  9. After sign in completes, you see the following message. You can close the window and go to the DBeaver.
    Amazon DataZone session completion confirmation message
  10. After the connection is established, the following success message appears.
    DBeaver connection test dialog showing successful Amazon Athena connection with performance metrics
  11. You can now view and query all subscribed assets directly within DBeaver.
    DBeaver SQL query interface displaying sales performance data from Amazon Athena database

These steps might also apply to other analytics tools and clients that support JDBC connections. If you’re using a different tool, you might need to adapt these instructions accordingly to ensure proper configuration and access to Amazon SageMaker Unified Studio data assets.

Integration with other applications

You can use similar steps for other BI and analytics tools that support standard database connections.

Connect to Tableau Desktop

Use the Athena JDBC driver to connect Tableau to Amazon SageMaker Unified Studio and visualize your subscribed data.To connect to Tableau Desktop:

  1. Make sure that you’re using the latest Athena JDBC 3.x driver.
  2. Copy the JDBC driver file and place it in the appropriate folders for your operating system
    • For Mac OS: ~/Library/Tableau/Drivers
    • For Windows: C:\Program Files\Tableau\Drivers
  3. Open Tableau Desktop. From the To a Server connection menu, select Other Databases (JDBC) to connect to Amazon SageMaker Unified Studio.
    Tableau start page showing connection options with Other Databases JDBC option highlighted
  4. Paste the JDBC connection URL you copied from the SageMaker Unified Studio portal into the URL. Leave other fields such as Dialect, Username, and Password blank and choose Sign in.
    If you get a port is occupied error – add “;ListenPort=8055” to the URL to change the port. You can use any port number.

    Tableau Other Databases JDBC connection dialog with PostgreSQL dialect configuration

  5. This redirects you to authenticate with IAM Identity Center. Enter the credentials of the Identity Center user that you used to sign in to the SageMaker Unified Studio portal. Authorize the DataZoneAuthPlugin to access Amazon DataZone from Tableau. Once the connection is established with the success message, you can view your project’s subscribed data directly within Tableau and build dashboards.
    Data analytics interface showing sales_performance_by_store table with 283 rows and 15 fields

Connect to Microsoft Power BI

Now, we look at connecting Amazon SageMaker Unified Studio with Microsoft Power BI on Windows.While Amazon Athena provides a native ODBC driver for connecting to ODBC-compatible tools like Microsoft Power BI, it currently doesn’t support Amazon SageMaker Unified Studio authentication. Therefore, in this post, we use an ODBC-JDBC bridge to connect Amazon SageMaker Unified Studio with Microsoft Power BI using the Athena JDBC driver, which supports SageMaker Unified Studio authentication.

In this post, we’re using the ZappySys driver as the ODBC-JDBC bridge. This is a third-party solution that requires a separate licensing fee, which isn’t included in the AWS solution. You can choose to use any other solution for ODBC-JDBC bridge.To connect to Power BI:

  1. Make sure that you have administrator privileges to run the ODBC Data Source Administrator.
  2. From the Windows Start menu, run the ODBC Data Source Administrator (the 64-bit version) using run as Administrator.
  3. Create a New Data Source with the ZappySys JDBC Bridge Driver. You are prompted to enter your connection details.
    Windows ODBC Data Source Administrator dialog showing ZappySys JDBC Bridge Driver selection
  4. Paste the JDBC URL you copied from the SageMaker Unified Studio portal in the Connection String, along with the driver class and JDBC driver file. Make sure that you’re using the latest Athena JDBC 3.x driver.
  5. Choose Test Connection. A new dialog window pops up after the connection is successful.
    Test Connection using ZappySys JDBC Bridge Driver
  6. This redirects you to authenticate with IAM Identity Center. Enter the credentials of the Identity Center user that you used to sign in to the SageMaker Unified Studio portal. Authorize the DataZoneAuthPlugin.
  7. Choose Preview tab on ZappySys JDBC Bridge Driver window and choose one of the subscribed tables to access data.
    ZappySys JDBC Bridge Driver configuration interface showing SQL query preview with sales performance results
  8. After configuring the data source, launch Power BI. Create a blank report or use an existing report to integrate the new visuals. Choose Get Data and select the name of the data source you created. This opens a new browser window to authenticate your credentials. Allow access to authorize the DataZone Auth plugin. After authorization is complete, you can build your reports in Microsoft Power BI with the subscribed data assets.
    Database connection profile selection dialog with PostgreSQL group highlighted

Connect to SQL Workbench

Discover how SQL Workbench can connect to Amazon SageMaker Unified Studio for users who prefer a SQL interface to query data lake tables and views subscribed through projects in Amazon SageMaker Unified Studio.

To connect to SQL Workbench:

  1. Make sure that you’re using the latest Athena JDBC 3.x driver.
  2. Open SQL Workbench/J and choose Manage Drivers.
    Database driver management interface showing SMUSAthenajDBC driver configuration details
  3. Select the option to add a new driver. Enter a name for it, such as SMUSAthenaJDBC, and import the driver you downloaded in the previous steps.
    Database driver management dialog showing SMUSAthenaJDBC driver configuration with library path and class name
  4. Create a new connection profile and enter a name it, such as smus-profile. In the Driver dropdown, select the driver you configured. For the URL, enter the string jdbc:athena://region=us-east-1; (In the example, the Virginia Region is being used). Choose Extended Properties.
    PostgreSQL connection profile configuration dialog with Amazon Athena JDBC driver settings and authentication options
  5. Under Extended Properties, add the following parameters that you copied from the SageMaker Unified Studio portal. You can also include these parameters in the JDBC (URL) connection string. Choose OK.
    • Workgroup
    • OutputLocation
    • DataZoneDomainId
    • IdentityCenterIssuerURL
    • CredentialsProvider
    • DatazoneEnvironmentId
    • DataZoneDomainRegain

    Alos add “ListenPort” with any port number.

    Extended properties configuration dialog showing AWS DataZone connection parameters including domain ID, environment ID, and listen port 8067

  6. This redirects you to authenticate with IAM Identity Center. Enter the credentials of the Identity Center user that you used to sign in to the SageMaker Unified Studio portal. Authorize the DataZoneAuthPlugin.
  7. After successful connection, in SQL Workbench/J, under Database Explorer, select the database from the marketing project of SageMaker unified studio. Choose a subscribed table. Select the Data tab to see the data in the table.
    SQL Workbench showing sales performance data query results from AWS Athena database with 283 customer transaction records

Cleanup

To ensure no additional charges are incurred after testing, be sure to delete the Amazon SageMaker Unified Studio domain. See Delete domains for instructions.

Conclusion

Amazon SageMaker Unified Studio continues to expand its offerings, providing you with more flexibility to access, analyze, and visualize your subscribed data. With support for the Athena JDBC driver, you can now use a wide range of popular BI and analytics tools, making data accessed through Amazon SageMaker Unified Studio more accessible than ever before. Whether you’re using Tableau, Power BI, or other familiar tools, the integration with Amazon SageMaker Unified Studio ensures that your data remains secure and accessible to authorized users.

The feature is supported in all AWS commercial Regions where Amazon SageMaker Unified Studio is currently available. Get started with our technical documentation.


About the authors

Narendra Gupta

Narendra Gupta

Narendra is a Specialist Solutions Architect at AWS, helping customers on their cloud journey with a focus on AWS analytics services. Outside of work, Narendra enjoys learning new technologies, watching movies, and visiting new places.

Durga Mishra

Durga Mishra

Durga is a solutions architect at AWS. Outside of work, Durga enjoys spending time with family and loves to hike on Appalachian trails and spend time in nature.

Ramesh Singh

Ramesh Singh

Ramesh is a Senior Product Manager Technical (External Services) at AWS in Seattle, Washington, currently with the Amazon SageMaker team. He is passionate about building high-performance ML/AI and analytics products that help enterprise customers achieve their critical goals using cutting-edge technology.

Nishchai JM

Nishchai JM

Nishchai is an Analytics Specialist Solutions Architect at Amazon Web services. He specializes in building Big-data applications and help customer to modernize their applications on Cloud. He thinks Data is new oil and spends most of his time in deriving insights out of the Data.

Accelerate context-aware data analysis and ML workflows with Amazon SageMaker Data Agent

Post Syndicated from Kshitija Dound original https://aws.amazon.com/blogs/big-data/accelerate-context-aware-data-analysis-and-ml-workflows-with-amazon-sagemaker-data-agent/

Accelerating data analysis and machine learning (ML) development requires AI tools that understand your specific data environment, not just generic code generation. General-purpose AI assistants lack context about your specific data environment, creating a gap between AI capabilities and practical implementation. Data practitioners often start by looking for relevant tables, understanding relationships, and writing exploratory code before answering their first business question. Data teams still spend time translating AI-generated suggestions into working code that correctly references their actual data assets, understands their organization’s data relationships, and integrates with their existing workflows.

AWS released Amazon SageMaker Data Agent in November 2025, addressing these challenges by providing an AI assistant that’s deeply integrated within Amazon SageMaker (IAM-based domains only) with notebooks. SageMaker Data Agent has direct access to your AWS data context, including AWS Glue Data Catalog metadata, Amazon DataZone business data catalog, and your current notebook state. This helps it generate environment-aware code that works directly with your petabyte-scale data through serverless compute resources, helping you analyze massive datasets without infrastructure management overhead. With this contextual awareness, the agent creates executable analysis plans from natural language prompts that specifically reference your actual tables, data types, and analytical needs, while maintaining reasoning throughout multi-step analyses. Importantly, the agent performs these operations securely within the AWS environment, using built-in governance controls, Amazon Identity and Access Management (IAM) policies, and data security features to make sure your data doesn’t leave your organizational boundaries. By operating within your Amazon SageMaker Unified Studio interface, it reduces context-switching between AI assistants and your development environment, improving how you interact with your analytics and ML workflows.

In this post, we demonstrate the capabilities of SageMaker Data Agent, discuss the challenges it addresses, and explore a real-world example analyzing New York City taxi trip data to see the agent in action.

Challenges in data workflows

General AI tools can generate code snippets, but you still face three key challenges when applying these to your specific data environments:

  • Contextual disconnect – Standard AI assistants generate generic code referencing hypothetical tables like customers rather than your actual tables like customer_activity_prod, forcing extensive modifications to work with your data environment.
  • Complex data environment – Many enterprises work with complex data environments containing numerous tables and large-scale data stores, making it extremely difficult to locate relevant data assets for analysis. You must navigate complex catalog structures, understand table relationships, and determine which subset of data is relevant for your specific analytical needs before you can begin actual analysis.
  • Language and syntax barriers – You must work across multiple programming languages and query syntaxes during analysis workflows. Some might excel in SQL but struggle with Python, while others might be Python experts but have limited PySpark knowledge.

Additionally, you face challenges around data quality validation, data governance, and performance optimization. SageMaker Data Agent addresses these fundamental workflow challenges while adapting to your requirements.

Solution overview

SageMaker Data Agent addresses these key challenges through its context-aware architecture and deep AWS integration. In this section, we discuss how it works.

Context-aware understanding

SageMaker Data Agent builds a detailed understanding of your specific data environment and references your actual tables through two parallel processes. SageMaker Data Agent is embedded within your AWS data environment, allowing it to understand what you’re asking, what data you have available, how it’s structured, and how it relates to your analytical objectives. The following are the two ways the agent achieves this contextual understanding:

  • Integrated data environment – SageMaker Data Agent exists within the same integrated environment as your data, harnessing the power of your AWS infrastructure. It begins by exploring the AWS Glue Data Catalog and the Amazon DataZone business data catalog, which reveal business metadata, glossaries, and relationships, enabling it to reference your actual tables rather than generic placeholders. This intelligence extends to working directly with your full datasets where they naturally reside, preserving your existing security policies and access controls without requiring data movement. The agent integrates with Amazon Simple Storage Service (Amazon S3), Amazon Athena, and Amazon SageMaker AI to use their respective capabilities for data storage, query processing, and ML while adapting to your data environment. This lets you process petabyte-scale data through serverless compute resources with the agent acting as an intelligent interface to your complete data environment.
  • Notebook context awareness – Simultaneously, the agent examines your current notebook state, including existing dataframes, imported libraries, previous cell results, and ML artifacts. This context awareness makes sure generated code works with your specific environment without extensive modifications.

Language and syntax flexibility

SageMaker Data Agent resolves language and syntax barriers by selecting the optimal language for each analytical task. The agent can switch between SQL for efficient data querying and Python and PySpark for complex transformations and ML operations without requiring practitioners to manually translate between languages. This avoids language barriers, because the agent automatically selects and generates the appropriate code syntax, whether SQL, Python, or PySpark, based on the specific analytical or ML task at hand.

SageMaker Data Agent provides four key capabilities that work together to give you control over complex analyses:

  • When handling complex requests, the agent creates structured analysis plans by breaking them into logical steps with clear reasoning for each operation.
  • At each stage, you have intermediate validation points where you can review and approve each step before proceeding to the next.
  • Throughout multi-step analyses, the agent maintains consistent context, retaining understanding of your data environment and previous steps.
  • Most importantly, you maintain human-in-the-loop control with full oversight and the ability to modify any generated code to match your specific requirements.

Interaction modes

SageMaker Data Agent provides two interaction modes optimized for different analytical tasks: the Agent Panel and in-line assistance.

The Agent Panel supports comprehensive analytical tasks by breaking them down into structured steps, each with generated code that builds on previous results. When you submit a request such as “perform customer segmentation,” the agent identifies relevant tables, understands their relationships, and creates a complete analysis workflow with intermediate review points. The following screenshot illustrates this example.

In-line assistance mode supports direct cell modifications, one-click error fixes, and keyboard shortcuts (Alt+A for Windows/Linux, Opt+A for Mac) that maintain your coding flow. You can quickly enhance existing code or fix errors without leaving your current notebook context, improving productivity during iterative development. You can code directly within notebook cells by using the inline prompt interface, as illustrated in the following screenshot. Use in-line assistance for focused tasks like specific queries or visualizations directly within cells.

Execution and control

Throughout the process, you maintain execution control. You can review generated plans before execution, execute steps individually with intermediate result review, modify code as needed for your specific requirements by providing feedback, and get AI-powered error diagnosis and fixes using the Fix with AI option when issues arise. This human-in-the-loop approach makes sure you maintain oversight while benefiting from AI assistance.

The following screenshots demonstrate how the Fix with AI feature works in practice, showing how the agent diagnoses code errors and provides corrected solutions with explanations.

By bringing together context-aware understanding, reasoning, and interaction modes within your existing AWS environment, SageMaker Data Agent improves how you work. It removes the traditional friction between AI assistance and your actual data environment, providing direct access to petabyte-scale data with no operational overhead. This combination helps you shift your focus from repetitive setup tasks to high-value analysis and decision-making, accelerating insights while maintaining control over the analytical process.

Getting started with SageMaker Data Agent

Now that you understand how SageMaker Data Agent works, let’s see these capabilities in action. Getting started with SageMaker Data Agent is straightforward. For detailed setup instructions, refer to New one-click onboarding and notebooks with a built-in AI agent in Amazon SageMaker Unified Studio. It provides step-by-step guidance on setting up your environment and beginning your journey with SageMaker Data Agent.

To get the most from SageMaker Data Agent, begin by asking clear, specific questions about your data rather than generic requests. Provide context about your analytical goals so the agent can tailor its responses to your specific use case. Always review and validate generated code before execution, using the agent’s built-in explanations to understand the approach. For complex analyses, take advantage of the agent’s reasoning capabilities that can break down multi-step processes and explain the logic behind each recommendation.

NYC taxi trip analysis

In this section, we demonstrate how SageMaker Data Agent helps analyze the NYC Taxi Trip dataset, a collection of over 1.2 billion taxi trips (approximately 63.7 GB) throughout New York City with information on pickup/drop-off locations, timestamps, trip distances, fare amounts, payment types, and passenger counts.

If you’re looking to try a simpler end-to-end flow before diving into this large-scale analysis, SageMaker Unified Studio provides a sample database with pre-loaded customer churn data. You can perform similar analytical workflows on this smaller dataset to quickly familiarize yourself with the agent’s capabilities before working with larger, more complex datasets. To explore this dataset, complete the following steps:

  1. On the SageMaker Unified Studio console, choose Data in the navigation pane.
  2. In the data explorer, under Catalogs, select AwsDataCatalog.
  3. Select sagemaker_sample_db.
  4. Select the churn table from the tables list.

NYC Taxi Trip dataset

The NYC Taxi Trip dataset is publicly available in Amazon S3 at s3://aws-data-analytics-workshops/shared_datasets/nyc_taxi_trips_parquet/.

To replicate this, you can work with this dataset in two ways:

  • Catalog it beforehand (recommended for repeated analysis)
  • Provide the S3 path directly in your prompt (quickest for one-time exploration)

For this demonstration, we used SageMaker Data Agent to catalog the dataset prior to analysis.

Our analysis approach

For this demonstration, we asked SageMaker Data Agent to perform a comprehensive analysis on the cataloged taxi trip data to uncover business insights. We used the following prompt:

Using Apache Spark, analyze the NYC taxi trips dataset to extract meaningful insights. Please provide:
1/ Fare analysis across different NYC boroughs
2/ Trip trends across boroughs and time
Conclude with multi-panel dashboard and an executive summary highlighting the 3-5 most significant findings and their potential business implications.

You can add the S3 path (s3://aws-data-analytics-workshops/shared_datasets/nyc_taxi_trips_parquet/) in the preceding prompt if you don’t have the NYC Taxi Trip data cataloged.

The following video demonstrates how SageMaker Data Agent processes this natural language prompt and creates a complete analytical workflow. The agent constructs a six-step analysis plan, generates executable code for each step, and progressively builds toward actionable insights.

The outputs shown in this demonstration video are specific to this analysis session. Due to the generative nature of AI, your results might vary when running the same prompts.The agent executed each step sequentially, so we can review intermediate results and provide feedback. After loading and cleaning NYC taxi trip records, the agent analyzed fare patterns and trip trends across boroughs and time periods, then created a comprehensive multi-panel dashboard visualizing key insights, as shown in the following screenshots.

Finally, it provided actionable business insights, highlighting the most significant findings and their business recommendations.

This example demonstrates how SageMaker Data Agent helps transform complex analytical tasks into actionable insights without requiring extensive coding or data preparation. The agent’s ability to understand both the data structure and business context allows it to generate meaningful analyses that directly address business objectives.

Security and governance

SageMaker Data Agent follows your AWS security settings. It accesses data you’ve explicitly permitted through your IAM access controls or using AWS Lake Formation, helping maintain your organization’s security policies. To use SageMaker Data Agent, your project role must have permissions to invoke specific Amazon DataZone APIs, including SendMessage, GenerateCode, StartConversation, GetConversation, and ListConversations. For more information, visit Actions, resources, and condition keys for Amazon DataZone.

Guardrails

SageMaker Data Agent has in-built guardrails to prevent the agent from responding to undesired requests. These include but are not limited to requests asking the agent to reveal its system prompt, internal tools, or other technical implementation. These guardrails also prohibit the agent from talking about non-AWS related topics and from generating output in any language except English.

Data storage and privacy

SageMaker Data Agent doesn’t store code you write or modify yourself, notebook context or metadata, or data from your AWS Glue Data Catalog or other sources. The agent only stores your natural language prompts, questions, and generated code/responses in the AWS Region where your SageMaker Unified Studio domain was created. AWS might use stored content (prompts, questions, and generated code/responses) to improve the service, fix issues, or for debugging, but maintains clear boundaries by not using your self-written code, manually modified code, notebook metadata, or actual data sources for service improvement. To opt out of data usage for service improvement, you can configure an AI services opt-out policy for Amazon DataZone in AWS Organizations, which will delete previously collected data and prevent future collection or usage. For more information, refer to Data storage in the SageMaker Data Agent, Service improvement, and AI services opt-out policies.

Conclusion

SageMaker Data Agent improves how data practitioners accelerate insights. By combining context-aware understanding, AWS integration, and flexible interaction modes, it alleviates the traditional friction between AI-assisted development and your actual data environment. The NYC taxi analysis demonstrated this in practice: what might have required manual data exploration, catalog navigation, and code translation instead took minutes through natural language prompts.

The real value extends beyond speed. SageMaker Data Agent preserves your security posture, maintains governance controls, and keeps your data within your AWS environment while supporting petabyte-scale analysis without operational overhead. More importantly, it shifts your team’s focus from repetitive setup to business analysis and decision-making.

Getting started is straightforward. Begin with simple prompts against your existing data catalog, then progressively tackle more complex analytical challenges. Invest time enriching your data catalog with business metadata—this investment directly multiplies the agent’s effectiveness by providing richer context for code generation.

SageMaker Data Agent adapts to your specific analytical needs, such as analyzing customer behavior, working with financial data, or building ML models. Access it today through your IAM-based SageMaker Unified Studio domain, and discover how context-aware AI assistance can accelerate your organization’s data-driven decision-making.


About the authors

Kshitija Dound

Kshitija Dound

Kshitija is a Specialist Solutions Architect at AWS based in New York City, focusing on data and AI. She collaborates with customers to transform their ideas into cloud solutions, using AWS Big Data and AI services. She also engages in public speaking opportunities, sharing her expertise on cloud technologies, industry trends, and career in the cloud. In her spare time, Kshitija enjoys exploring museums, indulging in art, and embracing NYC’s outdoor scene.

Siddharth Gupta

Siddharth Gupta

Siddharth is heading Generative AI within SageMaker’s Unified Experiences. His focus is on driving agentic experiences, where AI systems act autonomously on behalf of users to accomplish complex tasks. An alumnus of the University of Illinois at Urbana-Champaign, he brings extensive experience from his roles at Yahoo, Glassdoor, and Twitch.

Mohan Gandhi

Mohan Gandhi

Mohan is a Principal Software Engineer at AWS. He has been with AWS for the last 10 years and has worked on various AWS services like Amazon EMR, Amazon EFA, and Amazon RDS. Currently, he is focused on improving the Amazon SageMaker inference experience. In his spare time, he enjoys hiking and marathons.

Ishneet Kaur

Ishneet Kaur

Ishneet is a Software Development Manager on the Amazon SageMaker Unified Studio team. She leads the engineering team to design and build generative AI capabilities in SageMaker Unified Studio.

Shubham Mehta

Shubham Mehta

Shubham is a Senior Product Manager at AWS Analytics. He leads generative AI feature development across services such as AWS Glue, Amazon EMR, and Amazon MWAA, using AI/ML to simplify and enhance the experience of data practitioners building data applications on AWS.

Vikramank Singh

Vikramank Singh

Vikramank is a Senior Applied Scientist in the Agentic AI organization in AWS, working on products including Amazon SageMaker Unified Studio, Amazon RDS, and Amazon Redshift. His research interest lies at the intersection of AI, control systems, and RL, particularly using them to build systems for real-world applications that can autonomously perceive environments, model them, and take optimal decisions at scale.

Murali Narayanaswamy

Murali Narayanaswamy

Murali is a Principal Machine Learning Scientist in the Agentic AI organization in AWS, working on products including Amazon SageMaker Unified Studio, Amazon Redshift, and Amazon RDS. His research interests lie at the intersection of AI, optimization, learning, and inference, particularly using them to understand, model, and combat noise and uncertainty in real-world applications and reinforcement learning in practice and at scale.

Amit Sinha

Amit Sinha

Amit is a Senior Manager leading SageMaker Unified Studio GenAI and ML product suites. He has over a decade of experience in AI/ML products, infrastructure management, and AWS Big Data processing services. An alumnus of Columbia University, in his free time Amit enjoys hiking and binge-watching documentaries on American history.

Streamline large binary object migrations: A Kafka-based solution for Oracle to Amazon Aurora PostgreSQL and Amazon S3

Post Syndicated from Naresh Dhiman original https://aws.amazon.com/blogs/big-data/streamline-large-binary-object-migrations-a-kafka-based-solution-for-oracle-to-amazon-aurora-postgresql-and-amazon-s3/

Customers migrating from on-premises Oracle databases to AWS face a challenge: efficiently relocating large object data types (LOBs) to object storage while maintaining data integrity and performance. This challenge originates from the traditional enterprise database design where LOBs are stored alongside structured data, leading to storage capacity constraints, backup complexity, and performance bottlenecks during data retrieval and processing. LOBs, which can include images, videos, and other large files, often cause traditional data migrations to suffer from slow speeds and LOB truncation issues. These issues are particularly problematic for long-running migrations that can span several years.

In this post, we present a scalable solution that uses Amazon Managed Streaming for Apache Kafka (Amazon MSK), Amazon Aurora PostgreSQL-Compatible Edition, and Amazon MSK Connect. The data streaming enables data replication where modifications are sent and received in a continuous flow, allowing the target database to access and apply the changes in real time. This solution generates events for database actions such as insert, update, and delete, triggering AWS Lambda functions to download LOBs from the source Oracle database and upload them to Amazon Simple Storage Service (Amazon S3) buckets. Simultaneously, the streaming events migrate the structured data from the Oracle database to the target database while maintaining proper linking with their respective LOBs.

The complete implementation is available on GitHub, including AWS Cloud Development Kit (AWS CDK) deployment code, configuration files, and setup instructions.

Solution overview

Although traditional Oracle database migrations handle structured data effectively, they struggle with LOBs that can include images, videos, and documents. These migrations often fail due to size limitations and truncation issues, creating significant business risks, including data loss, extended downtime, and project delays that can force you to delay your cloud transformation initiatives. The problem becomes more acute during long-running migrations spanning several years, where maintaining operational continuity is critical. This solution addresses the key challenges of LOB migration, enabling continuous, long-term operations without compromising performance or reliability.

By removing the size limitations associated with traditional migration technologies, our solution provides a robust framework that helps you seamlessly relocate LOBs while facilitating data integrity throughout the process.

Our approach uses a modern streaming architecture to alleviate the traditional constraints of Oracle LOB migration. The solution includes the following core components:

  • Amazon MSK – Provides the streaming infrastructure.
  • Amazon MSK Connect – Using two connectors:
    • Debezium Connector for Oracle as a source connector to capture row-level changes that occur in Oracle database. The connector emits change events and publishes to a Kafka source topic.
    • Debezium Connector for JDBC as a sink connector to consume events from Kafka source topic and then write those events to Aurora PostgreSQL-Compatible by using a JDBC driver.
  • Lambda function – Triggered by an event source mapping to Amazon MSK. The function processes events from the Kafka source topic, extracting the Oracle row primary key from each event payload. It uses this key to download the corresponding BLOB data from the source Oracle database and uploads it to Amazon S3, organizing files by primary key folders to maintain simple linking with the relational database records.
  • Amazon RDS for Oracle – Amazon Relational Database Service (Amazon RDS) for Oracle is used as the source database to simulate an on-premises Oracle database.
  • Aurora PostgreSQL-Compatible – Used as the target database for migrated data.
  • Amazon S3 – Used as object storage for storing the BLOB data from source database.

The following diagram shows the Oracle LOB data migration architecture solution.

Message flow

When data changes occur in the source Amazon RDS for Oracle database, the solution executes the following sequence, moving through event detection and publication, BLOB processing with Lambda, and structured data processing:

  1. The Oracle source connector captures the change data capture (CDC) events, including the change to BLOB data column. This connector configures the BLOB data column to exclude from the Kafka event to optimize the Kafka payload.
  2. The connector publishes this event to an MSK topic.
    1. The MSK event triggers the BLOB Downloader Lambda function for the CDC events.
      1. The Lambda function examines two key conditions: the Debezium event code (specifically checking for create (c) or update(u)) and the configured list of Oracle BLOB table names along with their column names. When a Kafka message matches both the configured table list and valid Debezium events, the Lambda function initiates the BLOB data download from the Oracle source using the primary key and table name; otherwise, the function bypasses the BLOB download process. This selective approach makes sure the Lambda function only executes SQL queries when processing Kafka messages for tables containing BLOB data, optimizing database interactions.
      2. The Lambda function uploads the BLOB to Amazon S3, organizing by primary key folders with unique object names, which enables linking between structured database records and their corresponding BLOB data in Amazon S3.
    2. The PostgreSQL sink connector receives the event from the MSK topic.
      1. The connector applies these changes to the Aurora PostgreSQL database for the Oracle database changes except the BLOB data column. The BLOB data column is excluded by the Oracle source connector.

Key benefits

The solution offers the following key advantages:

  • Cost optimization and licensing – Our approach offers significant cost optimization benefits by reducing the overall size of your database and alleviating your need for expensive licenses associated with traditional databases and replication technologies. By decoupling LOB storage from the database and using Amazon S3, you can reduce your overall database footprint and reduce costs associated with traditional licensing and replication technologies. The streaming architecture also minimizes your infrastructure overhead during long-running migrations.
  • Avoids size constraints and migration failures – Traditional migration tools often impose size limitations on LOB transfers, leading to truncation issues and failed migrations. This solution removes those constraints entirely, so you can migrate LOBs of different sizes while maintaining data integrity. The event-driven architecture enables near real-time data replication, allowing your source systems to remain operational during migration.
  • Business continuity and operational excellence – Changes flow continuously to your target environment, allowing for business continuity. The solution preserves relationships between structured database records and their corresponding LOBs through primary key-based organization in Amazon S3, allowing for referential integrity while providing the flexibility of object storage for large files.
  • Architectural advantages – Storing LOBs in Amazon S3 while maintaining structured data in Aurora PostgreSQL-Compatible creates a clear separation. This architecture simplifies your backup and recovery operations, improves query performance on structured data, and provides flexible access patterns for binary objects through Amazon S3.

Implementation best practices

Consider the following best practices when implementing this solution:

  • Start small and scale gradually – To implement this solution, start with a pilot project using non-production data to validate your approach before committing to full-scale migration. This gives you a chance to work out issues in a controlled environment and refine your configuration without impacting production systems.
  • Monitoring – Set up comprehensive monitoring through Amazon CloudWatch to track key metrics like Kafka lag, Lambda function errors, and replication latency. Establish alerting thresholds early so you can catch and resolve issues quickly before they impact your migration timeline. Size your MSK cluster based on expected CDC volume and configure Lambda reserved concurrency to handle peak loads during initial data synchronization.
  • Security – For security, use encryption in transit and at rest for both structured data and LOBs, and follow the principle of least privilege when setting up AWS Identity and Access Management (IAM) roles and policies for your MSK cluster, Lambda functions, S3 buckets, and database instances. Document your schema mappings between Oracle and Aurora PostgreSQL-Compatible, including how database records link to their corresponding LOBs in Amazon S3.
  • Testing and preparation – Before you go live, test your failover and recovery procedures thoroughly. Validate scenarios like Lambda function failures, MSK cluster issues, and network connectivity problems to ensure you’re prepared for potential issues. Finally, remember that this streaming architecture maintains eventual consistency between your source and target systems, so there might be brief lag times during high-volume periods. Plan your cutover strategy with this in mind.

Limitations and considerations

Although this solution provides a robust approach for migrating Oracle databases with LOBs to AWS, there are several inherent constraints to understand before implementation.

This solution requires network connectivity between your source Oracle database and AWS environment. For on-premises Oracle databases, you must establish AWS Direct Connect or VPN connectivity before deployment. Network bandwidth directly impacts replication speed and overall migration performance, so your connection must be able to handle the expected volume of CDC events and LOB transfers.

The solution uses Debezium Connector for Oracle as the source connector and Debezium Connector for JDBC as the sink connector. This architecture is specifically designed for your Oracle-to-PostgreSQL migrations. Other database combinations require different connector configurations or might not be supported by the current implementation. Migration throughput is also constrained by your MSK cluster capacity and Lambda concurrency limits. You can also exceed AWS service quotas for large-scale migrations and you might need to request quota increases through AWS Enterprise Support.

Conclusion

In this post, we presented a solution that addresses the critical challenge of migrating your large binary objects from Oracle to AWS by using a streaming architecture that separates LOB storage from structured data. This approach avoids size constraints, reduces Oracle licensing costs, and preserves data integrity throughout extended migration periods.

Ready to transform your Oracle migration strategy? Visit the GitHub repository, where you will find the complete AWS CDK deployment code, configuration files, and step-by-step instructions to get started.


About the authors

Naresh Dhiman

Naresh Dhiman

Naresh is a Sr. Solutions Architect at AWS supporting US federal customers. He has over 25 years of experience as a technology leader and is a recognized inventor with six patents. He specializes in containers, machine learning, and generative AI on AWS.

Archana Sharma

Archana Sharma

Archana is a Sr. Database Specialist Solutions Architect, working with Worldwide Public Sector customers. She has years of experience in relational databases, and is passionate about helping customers in their journey to the AWS Cloud with a focus on database migration and modernization.

Ron Kolwitz

Ron Kolwitz

Ron is a Sr. Solutions Architect supporting US Federal Government Sciences customers including NASA and the Department of Energy. He is especially passionate about aerospace and advancing the use of GenAI and quantum-based technologies for scientific research. In his free time, he enjoys spending time with his family of avid water-skiers.

Karan Lakhwani

Karan Lakhwani

Karan is a Sr. Customer Solutions Manager at Amazon Web Services. He specializes in generative AI technologies and is an AWS Golden Jacket recipient. Outside of work, Karan enjoys finding new restaurants and skiing.

Enterprise scale in-place migration to Apache Iceberg: Implementation guide

Post Syndicated from Mihir Borkar original https://aws.amazon.com/blogs/big-data/enterprise-scale-in-place-migration-to-apache-iceberg-implementation-guide/

Organizations managing large-scale analytical workloads increasingly face challenges with traditional Apache Parquet-based data lakes with Hive-style partitioning, including slow queries, complex file management, and limited consistency guarantees. Apache Iceberg addresses these pain points by providing ACID transactions, seamless schema evolution, and point-in-time data recovery capabilities that transform how enterprises handle their data infrastructure.

In this post, we demonstrate how you can achieve migration at scale from existing Parquet tables to Apache Iceberg tables. Using Amazon DynamoDB as a central orchestration mechanism, we show how you can implement in-place migrations that are highly configurable, repeatable, and fault-tolerant—unlocking the full potential of modern data lake architectures without extensive data movement or duplication.

Solution overview

When performing in-place migration, Apache Iceberg uses its ability to directly reference existing data files. This capability is only supported for formats such as Parquet, ORC, and Avro, because these formats are self-describing and include consistent schema and metadata information. Unlike raw formats such as CSV or JSON, they enforce structure and support efficient columnar or row-based access, which allows Iceberg to integrate them without rewriting the data.

In this post, we demonstrate how you can migrate an existing Parquet-based data lake that isn’t cataloged in AWS Glue by using two methodologies:

  • Apache Iceberg migrate and register_table approach. Ideal for converting existing Hive-registered Parquet tables into Iceberg-managed tables.
  • Iceberg add_files approach. Best suited for quickly onboarding raw Parquet data into Iceberg without rewriting files.

The solution also incorporates a DynamoDB table that acts as a scalable control plane, so you can perform in-place migration of your data lake from Parquet format to Iceberg format.

The following diagram shows different methodologies that you can use to achieve this in-place migration of your Hive-style partitioned data lake:

AWS data pipeline architecture diagram showing data flow from Amazon DynamoDB through Amazon EMR and AWS Glue to a Data Lake and Apache Iceberg Lakehouse, both using Parquet format, within an AWS Region.

You use DynamoDB to track the migration state, handling retries and recording errors and outcomes. This provides the following benefits:

  • Centralized control over which Amazon Simple Storage Service (Amazon S3) paths need migration.
  • Lifecycle tracking of each dataset through migration stages.
  • Capture and audit errors on a per-path basis.
  • Enable re-runs by updating stateful flags or clearing failure messages.

Prerequisites

Before you begin, you need:

Create sample Parquet dataset as a source

You can create the sample Parquet dataset for testing the different methodologies using the Athena query editor. Replace <amzn-s3-demo-bucket> with an available bucket in your account.

  1. Create an AWS Glue database(test_db), if not present.
    CREATE DATABASE IF NOT EXISTS test_db

  2. Create a sample Parquet table (table1) and add to be used for testing the add_files approach.
    CREATE TABLE table1
    WITH (
      external_location = 's3://<amzn-s3-demo-bucket>/table1/',
      format = 'PARQUET',
      partitioned_by = ARRAY['date', 'hour']
    )
    AS
    SELECT 
      1 as id,
      'John Doe' as name,
      25 as age,
      'Engineer' as job_title,
      current_date as created_date,
      current_date as date,
      hour(current_timestamp) as hour
    UNION ALL
    SELECT 2, 'Jane Smith', 30, 'Manager', current_date, current_date, hour(current_timestamp)
    UNION ALL  
    SELECT 3, 'Bob Johnson', 35, 'Analyst', current_date, current_date, hour(current_timestamp);

  3. Create a sample Parquet table (table2) and add data to be used for testing the migrate and register_table approach. Replace <amzn-s3-demo-bucket> with your bucket name.
    CREATE TABLE table2
    WITH (
      external_location = 's3://<amzn-s3-demo-bucket>/table2/',
      format = 'PARQUET',
      partitioned_by = ARRAY['date', 'hour']
    )
    AS
    SELECT 
      1 as id,
      'John Doe' as name,
      25 as age,
      'Engineer' as job_title,
      current_date as created_date,
      current_date as date,
      hour(current_timestamp) as hour
    UNION ALL
    SELECT 2, 'Jane Smith', 30, 'Manager', current_date, current_date, hour(current_timestamp)
    UNION ALL  
    SELECT 3, 'Bob Johnson', 35, 'Analyst', current_date, current_date, hour(current_timestamp);

  4. Drop the tables from the Data Catalog because you only need Parquet data with the Hive-style partitioning structure.
    DROP TABLE IF EXISTS test_db.table1

Create a DynamoDB control table

Before beginning the migration process, you must create a DynamoDB table that serves as the control plane. This table maps source Amazon S3 paths to their corresponding Iceberg database and table destinations, enabling systematic tracking of the migration process.

To implement this control mechanism, create a table with the following structure:

  • A primary key s3_path that stores the source Parquet data location
  • Two attributes that define the target Iceberg location:
    • target_db_name
    • target_table_name

To create the DynamoDB control table

  1. Create the Amazon DynamoDB table using the following AWS CLI command:
    aws dynamodb create-table \
    --table-name migration-control-table \
    --attribute-definitions \
    AttributeName=s3_path,AttributeType=S \
    --key-schema \
    AttributeName=s3_path,KeyType=HASH \
    --billing-mode PAY_PER_REQUEST \
    --region <REGION>

  2. Verify the table is created successfully. Replace <REGION> with the AWS Region where your data is stored:
    aws dynamodb describe-table --table-name migration-control-table --region <REGION>

  3. Create a migration_data.json file with the following contents.
    In this example:

    • Replace <amzn-s3-demo-bucket> and <TablePrefix>with the name of your S3 bucket and prefix containing the Parquet data
    • Replace <DatabaseName> with the name of your target Iceberg database
    • Replace <TableName> with the name of your target Iceberg table
    {
        "your-migration-table": [
            {
                "PutRequest": {
                    "Item": {
                        "s3_path": {"S": "s3://<amzn-s3-demo-bucket>/table1/"},
                        "target_db_name": {"S": "test_db"},
                        "target_table_name": {"S": "table1"}
                    }
                }
            },
            {
                "PutRequest": {
                    "Item": {
                        "s3_path": {"S": "s3://<amzn-s3-demo-bucket>/table2/"},
                        "target_db_name": {"S": "test_db"},
                        "target_table_name": {"S": "table2"}
                    }
                }
            },
            {
                "PutRequest": {
                    "Item": {
                        "s3_path": {"S": "s3://<amzn-s3-demo-bucket>/<TablePrefix>/"},
                        "target_db_name": {"S": "<DatabaseName>"},
                        "target_table_name": {"S": "<TableName>"}
                    }
                }
            }
        ]
    }

    This file defines the mapping between Amazon S3 paths and their corresponding Iceberg table destinations.

  4. Run the following CLI command to load the DynamoDB control table.
    aws dynamodb batch-write-item \
    --request-items file://migration_data.json \
    --region <REGION;>

Migration methodologies

In this section, you explore two methodologies for migrating your existing Parquet tables to Apache Iceberg format:

  • Apache Iceberg migrate and register_table approach – This approach first converts your Parquet table to Iceberg format using the native migrate procedure, followed by registering it in AWS Glue using the register_table procedure.
  • Apache Iceberg add_files approach – This method creates an empty Iceberg table and uses the add_files procedure to import existing Parquet data files without physically moving them.

Apache Iceberg migrate and register_table procedure

Use the Apache Iceberg Migrate procedure that is used for in-place conversion of an existing Hive or Parquet table into an Iceberg-managed table. Thereafter, you can use the Apache Iceberg RegisterTable procedure to register the respective table in AWS Glue.

AWS workflow diagram showing DynamoDB to Apache Iceberg migration using Amazon EMR with Hive Metastore for migration and Glue Metastore for registration, displaying configuration tables at each stage.

Migrate

  1. In your EMR cluster with Hive as the metastore, create a PySpark session with the following Iceberg Packages:
    pyspark \
    --name "Iceberg Migration" \
    --conf "spark.jars=/usr/share/aws/iceberg/lib/iceberg-spark3-runtime.jar" \
    --conf spark.sql.extensions=org.apache.iceberg.spark.extensions.IcebergSparkSessionExtensions \
    --conf spark.sql.catalog.spark_catalog=org.apache.iceberg.spark.SparkSessionCatalog \
    --conf spark.sql.catalog.spark_catalog.type=hive

    This post uses Iceberg v1.9.1 (Amazon EMR build), which is native to Amazon EMR 7.11. Always verify the latest supported version and update package coordinates accordingly.

  2. Next, create your corresponding table in your Hive catalog (you can skip this step if you already have tables created in your hive catalog). Replace <amzn-s3-demo-bucket> with the name of your S3 bucket.
    In the following snippet, change or remove the PARTITIONED BY command based on the partition strategy of your table, the MSCK Repair table command should only be run if your respective table is partitioned.

    #You can automate this for production Scaling with DynamoDB as control table 
    s3_path = "s3://<amzn-s3-demo-bucket>/table1/"
    target_db_name = "test_db"
    target_table_name = "table1"
    # Read data in a dataframe to infer schema
    df = spark.read.parquet(s3_path)
    df.createOrReplaceTempView("temp_view")
    # Get schema as string
    schema = spark.table("temp_view").schema
    schema_string = ", ".join([f"{field.name} {field.dataType.simpleString()}" for field in schema])
    # Create Database If not exists 
    spark.sql(f"CREATE DATABASE IF NOT EXISTS {target_db_name}").show()
    # full_table_name= test_db.table1
    full_table_name = f"{target_db_name}.{target_table_name}"
    # Create table
    spark.sql(f"""
    CREATE TABLE IF NOT EXISTS {full_table_name} (
        {schema_string}
    )
    STORED AS PARQUET
    PARTITIONED BY (date, hour)
    LOCATION '{s3_path}'
    """)
    # Refresh, repair, and validate
    spark.sql(f"REFRESH TABLE {full_table_name}")
    spark.sql(f"MSCK REPAIR TABLE {full_table_name}")

  3. Convert the Parquet table to an Iceberg table in Hive
    # Run migration procedure
    spark.sql(f"CALL spark_catalog.system.migrate('{full_table_name}')")
    # Validate that the table is successfully migrated 
    spark.sql(f"DESCRIBE FORMATTED {full_table_name}").show(truncate=False)

Run the migrate command to convert the Parquet-based table to an Iceberg table, creating the metadata folder and the metadata.json file therein

You can stop at this point if you don’t intend to migrate your existing iceberg table from Hive to the Data Catalog.

Register

  1. Sign in to the AWS Glue as Spark Catalog enabled EMR cluster.
  2. Register the Iceberg table to your Data Catalog.

    Create the session with the respective Iceberg Packages. Replace <amzn-s3-demo-bucket> with your bucket name, and <warehouse> with warehouse directory.

    pyspark \
    --conf "spark.jars=/usr/share/aws/iceberg/lib/iceberg-spark3-runtime.jar" \
    --conf "spark.sql.extensions=org.apache.iceberg.spark.extensions.IcebergSparkSessionExtensions" \
    --conf "spark.sql.catalog.glue_catalog=org.apache.iceberg.spark.SparkCatalog" \
    --conf "spark.sql.catalog.glue_catalog.warehouse= s3://<amzn-s3-demo-bucket>/<warehouse>/"  \
    --conf "spark.sql.catalog.glue_catalog.catalog-impl=org.apache.iceberg.aws.glue.GlueCatalog" \
    --conf "spark.sql.catalog.glue_catalog.io-impl=org.apache.iceberg.aws.s3.S3FileIO"

  3. Run the register_table command to make the Iceberg table visible in AWS Glue.
    • register_table registers an existing Iceberg table’s metadata file (metadata.json) with a catalog(glue_catalog) so that Spark (and other engines) can query it.
    • The procedure creates a Data Catalog entry for the table, pointing it to the given metadata location.

    Replace <amzn-s3-demo-bucket> and <metadata-prefix> with the name of your S3 bucket and metadata prefix name.

    Ensure that your EMR Spark Cluster has been configured with appropriate AWS Glue permissions

    # You can automate this for production Scaling with DynamoDB as control table
    metadata_location = "s3://<amzn-s3-demo-bucket>/table1/metadata/<metadata-prefix>.metadata.json"
    target_db_name = "test_db"
    target_table_name = "table1"
    full_table_name = f"{target_db_name}.{target_table_name}"
    # Register existing Iceberg table metadata in Glue Catalog
    spark.sql(f"CALL glue_catalog.system.register_table('{full_table_name}', '{metadata_location}')")
    # Set table properties (example: Iceberg format version 2)
    spark.sql(f"ALTER TABLE glue_catalog.{full_table_name} SET TBLPROPERTIES('format-version'='2')")

  4. Validate that the Iceberg table is now visible in the Data Catalog.
    # Lookout for format as iceberg/parquet
    spark.sql("SHOW TBLPROPERTIES glue_catalog.test_db.table1").show()

Apache Iceberg’s add_files procedure

AWS workflow diagram showing DynamoDB to Apache Iceberg migration using AWS Glue Add_Files procedure, displaying input configuration and output status tables with metadata location and registration confirmation.

Here, you’re going to use Iceberg’s add_files procedure to import raw data files (Parquet, ORC, Avro) into an existing Iceberg table by updating its metadata. This procedure works for both Hive and Data Catalog, it doesn’t physically move or rewrite the files—it only registers them so Iceberg can manage them.

This methodology comprises the following steps:

  1. Create an empty Iceberg table in AWS Glue.
    Because the add_files procedure expects the iceberg table to be already present, you need to create an empty Iceberg table by inferring the table schema.
  2. Register existing data locations to the Iceberg table

Using the add_files procedure in a Glue-backed Iceberg catalog will register the target S3 path along with all its subdirectories to the empty Iceberg table created in the previous step.

You can consolidate both steps into a single Spark job. For the following AWS Glue job, you have specified iceberg as a value for the --datalake-formats job parameter. See the AWS Glue job configuration documentation for more details.

Replace <amzn-s3-demo-bucket> with your S3 bucket name and <warehouse> with warehouse directory.

from pyspark.sql import SparkSession
import logging
logging.basicConfig(level=logging.INFO)
logger = logging.getLogger(__name__)
target_db_name = "test_db"
target_table_name = "table2"
s3_path = "s3://<amzn-s3-demo-bucket>/table2"
# Set to None or [] for unpartitioned
partitioned_cols = ["date", "hour"]  
spark = SparkSession.builder \
    .appName("Iceberg Add Files") \
    .config("spark.sql.extensions", "org.apache.iceberg.spark.extensions.IcebergSparkSessionExtensions") \
    .config("spark.sql.catalog.glue_catalog", "org.apache.iceberg.spark.SparkCatalog") \
    .config("spark.sql.catalog.glue_catalog.catalog-impl", "org.apache.iceberg.aws.glue.GlueCatalog") \
    .config("spark.sql.catalog.glue_catalog.io-impl", "org.apache.iceberg.aws.s3.S3FileIO") \
    .config("spark.sql.catalog.glue_catalog.warehouse", "s3://<amzn-s3-demo-bucket>/<warehouse>/") \
    .getOrCreate()
full_table_name = f"glue_catalog.{target_db_name}.{target_table_name}"
# Read schema from one file (schema inference)
df = spark.read.parquet(s3_path)
schema = df.schema
# Create empty Iceberg table
empty_df = spark.createDataFrame([], schema)
if partitioned_cols:
    empty_df.writeTo(full_table_name).using("iceberg").partitionedBy(*partitioned_cols). .tableProperty("format-version", "2").create()
else:
    empty_df.writeTo(full_table_name).using("iceberg").tableProperty("format-version", "2").create()
logger.info(f"Created empty Iceberg table: {full_table_name}")
spark.sql(f"""
CALL glue_catalog.system.add_files(
  '{target_db_name}.{target_table_name}',
  'parquet.`{s3_path}`'
)
""")

When working with non-Hive partitioned datasets, a direct migration to Apache Iceberg using add_files might not behave as expected. See Appendix C for more information.

Considerations

Let’s explore two key considerations that you should address when implementing your migration strategy.

State management using DynamoDB control table

Use the following sample code snippet to update the state of DynamoDB table:

def update_dynamodb_record(self, s3_path, metadata_loc=None, error_msg=None):
    # Get current error message
    try:
        response = self.dynamodb.get_item(
            TableName='migration-control-table',
            Key={'s3_path': {'S': s3_path}}
        )
        current_error = response.get('Item', {}).get('error_message', {}).get('S', '')
    except:
        current_error = ""
    if error_msg:
        # Error case
        error_msg = (error_msg or "Unknown error")[:1000]
        update_expr = "SET error_message = :err"
        attr_values = {':err': {'S': error_msg}}
        if current_error:
            update_expr += ", prev_error_message = :prev"
            attr_values[':prev'] = {'S': current_error}
        update_kwargs = {'TableName': 'Iceberg_migration','Key': {'s3_path': {'S': s3_path}},'UpdateExpression': update_expr,'ExpressionAttributeValues': attr_values}
        self.logger.error(f"Set error for {s3_path}: {error_msg}")
    else:
        # Success case
        update_kwargs = {
            'TableName': 'Iceberg_migration',
            'Key': {'s3_path': {'S': s3_path}},
            'UpdateExpression': 'SET #s = :status, #m = :meta, #p = :prev, #e = :err',
            'ExpressionAttributeNames': {'#s': 'status','#p': 'prev_error_message','#e': 'error_message','#m': 'metadata_location'
            },
            'ExpressionAttributeValues': {
                ':status': {'S': 'Iceberg_Metadata_Populated and Registered'},
                ':prev': {'S': current_error},
                ':err': {'S': ''},
                ':meta': {'S': metadata_loc}
            }
        }
        self.logger.info(f"Updated DynamoDB status for {s3_path}: {metadata_loc}")

This ensures that any errors are logged and saved to DynamoDB as error_message. On successive retries, previous errors move to prev_error_message and new errors overwrite error_message. Successful operations clear error_message and archive the last error.

Protecting your data from unintended deletion

To protect your data from unintended deletion, never delete data or metadata files from Amazon S3 directly. Iceberg tables that are registered in AWS Glue or Athena are managed tables and should be deleted using the DROP TABLE command from Spark or Athena. The DROP TABLE command deletes both the table metadata and the underlying data files in S3. See Appendix D for more information.

Clean up

Complete the following steps to clean up your resources:

  1. Delete the DynamoDB control table
  2. Delete the database and tables
  3. Delete the EMR clusters and AWS Glue job used for testing

Conclusion

In this post, we showed you how to modernize your Parquet-based data lake into an Apache Iceberg–powered lakehouse without rewriting or duplicating data. You learned two complementary approaches for this in-place migration:

  • Migrate and register – Ideal for converting existing Hive-registered Parquet tables into Iceberg-managed tables.
  • add_files – Best suited for quickly onboarding raw Parquet data into Iceberg without rewriting files.

Both approaches benefit from DynamoDB centralized state tracking, which enables retries, error auditing, and lifecycle management across multiple datasets.

By combining Apache Iceberg with Amazon EMR, AWS Glue, and Amazon DynamoDB, you can create a production-ready migration pipeline that is observable, automated, and straightforward to extend to future data format upgrades. This pattern forms a solid foundation for building an Iceberg-based lakehouse on AWS, helping you achieve faster analytics, better data governance, and long-term flexibility for evolving workloads.

To get started, try implementing this solution using the sample tables (table1 and table2) that you created using Athena queries. we encourage you to share your migration experiences and questions in the comments.


Appendix A — Creating an EMR cluster for Hive metastore using console and AWS CLI

Console steps:

  1. Open AWS Management Console for Amazon EMR and choose Create cluster.
  2. Select Spark or Hive under applications.
  3. Under AWS Glue Data Catalog settings, make sure the following options are not selected:
    • Use for Hive table metadata
    • Use for Spark table metadata
  4. Configure SSH access (KeyName).
  5. Configure network (VPC, subnets, SGs) to allow access to S3.

AWS CLI steps:

aws emr create-cluster \
  --region us-east-1 \
  --name "IcebergHiveCluster711" \
  --release-label emr-7.11.0 \
  --applications Name=Hive Name=Spark Name=Hadoop \
  --ec2-attributes '{"KeyName":"<key-pair>","SubnetId":"<subnet-id>"}'  \
  --instance-groups '[
    {
      "Name":"Master",
      "InstanceGroupType":"MASTER",
      "InstanceType":"m5.xlarge",
      "InstanceCount":1
    },
    {
      "Name":"Workers",
      "InstanceGroupType":"CORE",
      "InstanceType":"m5.xlarge",
      "InstanceCount":2
    }
  ]' \
  --use-default-roles

Appendix B — EMR cluster with AWS Glue as Spark Metastore

Console steps:

  1. Open the Amazon EMR console, choose Create cluster and then select EMR Serverless or provisioned EMR.
  2. Under Software Configuration, verify that Spark is installed.
  3. Under AWS Glue Data Catalog settings, select Use Glue Data Catalog for Spark metadata.
  4. Configure SSH access (KeyName).
  5. Configure network settings (VPC, subnets, and security groups) to allow access to Amazon S3 and AWS Glue.

AWS CLI (provisioned Amazon EMR):

aws emr create-cluster \
  --region us-east-1 \
  --name "IcebergGlueCluster711" \
  --release-label emr-7.11.0 \
  --applications Name=Spark Name=Hadoop \
  --ec2-attributes '{"KeyName":"<key-pair>","SubnetId":"<subnet-id>"}' \
  --instance-groups '[
    {
      "Name":"Master",
      "InstanceGroupType":"MASTER",
      "InstanceType":"m5.xlarge",
      "InstanceCount":1
    },
    {
      "Name":"Workers",
      "InstanceGroupType":"CORE",
      "InstanceType":"m5.xlarge",
      "InstanceCount":2
    }
  ]' \
 --configurations '[{"Classification":"spark-hive-site","Properties":{"hive.metastore.client.factory.class":"com.amazonaws.glue.catalog.metastore.AWSGlueDataCatalogHiveClientFactory"}}]' \
 --use-default-roles

Appendix C — Non-Hive partitioned datasets and Iceberg add_files

This appendix explains why a direct in-place migration using an add_files-style procedure might not behave as expected for datasets that aren’t Hive-partitioned and shows recommended fixes and examples.

AWS Glue and Athena follow Hive-style partitioning, where partition column values are encoded in the S3 path rather than inside the data files. For example, following the Parquet dataset created in the Create Sample Parquet Dataset as a source section of this post:

s3://amzn-s3-demo-bucket/events/event_date=2024-09-01/hour=5/part-0000.parquet
s3://amzn-s3-demo-bucket/events/event_date=2024-09-02/hour=5/part-0001.parquet
  • Partition columns (event_date, hour) are represented in the folder structure.
  • Non-partition columns (for example, id, name, age) remain inside the Parquet files.
  • Iceberg add_files can correctly map partitions based on the folder path, even if partition columns are missing from the Parquet file itself.

Partition column

Stored in path

Stored in file

Athena or AWS Glue and Iceberg behavior

event_date Yes Yes Partitions inferred correctly
hour Yes No Partitions still inferred from path

Non-Hive partitioning layout (problem case)

s3://amzn-s3-demo-bucket/events/date/part-0000.parquet
s3://amzn-s3-demo-bucket/events/date/part-0001.parquet
  • No partition columns in the path.
  • File might not contain partition columns.

If you try to create an empty Iceberg table and directly load it using add_files on a non-hive layout, the following happens:

  1. Iceberg cannot automatically map partitions, add_files operations fail or register files with incorrect or missing partition metadata.
  2. Queries in Athena or AWS Glue will return unexpected NULLs or incomplete results.
  3. Successive incremental writes using add_files will fail.

Recommended approaches:

Create an AWS Glue table and use the Iceberg snapshot procedure:

  1. Create a table in AWS Glue pointing to your existing Parquet dataset.

You might need to manually provide the schema because glue crawler might fail to automatically infer it for you.

  1. Use Iceberg’ s snapshot procedure to convert and move the AWS Glue table into your target Iceberg table.

This works because Iceberg relies on AWS Glue for schema inference, so this approach ensures correct mapping of columns and partitions without rewriting the data. For more information, see Snapshot procedure.


Appendix D — Understanding table types: Managed compared to external

By default, all non-Iceberg tables created in AWS Glue or Athena are external tables, Athena doesn’t manage the underlying data. If you use CREATE TABLE without the EXTERNAL keyword for non-Iceberg tables, Athena issues an error.

However, when dealing with Iceberg tables, AWS Glue and Athena also manage the underlying data for the respective tables, so these tables are treated as internal tables.

Running DROP TABLE on Iceberg tables will delete the table and the underlying data.

The following table describes how the effect of DELETE and DROP TABLE actions on Iceberg tables in AWS Glue and Athena:

Operation What it does Effect on S3 data
DELETE FROM mydb.products_iceberg WHERE date = 2025-10-06; Creates new snapshot, hides deleted rows Data files stay until cleanup
DROP TABLE test_db.table1; Deletes table and all data Files are permanently removed

About the authors

Mihir Borkar

Mihir Borkar

Mihir is a seasoned AWS Data Architect with nearly a decade of experience designing and implementing enterprise-scale data solutions on AWS. He specializes in modernizing data architectures using AWS data analytical services, designing scalable data lakes and analytics platforms with a focus on efficient, cost-effective solutions. In his free time, Mihir loves to read about emerging cloud technologies and explore latest developments in AI/ML.

Amit Maindola

Amit Maindola

Amit is a Senior Data Architect with AWS ProServe team focused on data engineering, analytics, and AI/ML at Amazon Web Services. He helps customers in their digital transformation journey and enables them to build highly scalable, robust, and secure cloud-based analytical solutions on AWS to gain timely insights and make critical business decisions.

Arghya Banerjee

Arghya Banerjee

Arghya is a Sr. Solutions Architect at AWS in the San Francisco Bay Area, focused on helping customers adopt and use the AWS Cloud. He is focused on big data, data lakes, streaming and batch analytics services, and generative AI technologies.

Using Amazon EMR DeltaStreamer to stream data to multiple Apache Hudi tables

Post Syndicated from Gautam Bhaghavatula original https://aws.amazon.com/blogs/big-data/using-amazon-emr-deltastreamer-to-stream-data-to-multiple-apache-hudi-tables/

In this post, we show you how to implement real-time data ingestion from multiple Kafka topics to Apache Hudi tables using Amazon EMR. This solution streamlines data ingestion by processing multiple Amazon Managed Streaming for Apache Kafka (Amazon MSK) topics in parallel while providing data quality and scalability through change data capture (CDC) and Apache Hudi.

Organizations processing real-time data changes across multiple sources often struggle with maintaining data consistency and managing resource costs. Traditional batch processing requires reprocessing entire datasets, leading to high resource usage and delayed analytics. By implementing CDC with Apache Hudi’s MultiTable DeltaStreamer, you can achieve real-time updates; efficient incremental processing with atomicity, consistency, isolation, durability (ACID) guarantees; and seamless schema evolution while minimizing storage and compute costs.

Using Amazon Simple Storage Service (Amazon S3), Amazon CloudWatch, Amazon EMR, Amazon MSK and AWS Glue Data Catalog, you’ll build a production-ready data pipeline that processes changes from multiple data sources simultaneously. Through this tutorial, you’ll learn to configure CDC pipelines, manage table-specific configurations, implement 15-minute sync intervals, and maintain your streaming pipeline. The result is a robust system that maintains data consistency while enabling real-time analytics and efficient resource utilization.

What is CDC?

Imagine a constantly evolving data stream, a river of information where updates flow continuously. CDC acts like a sophisticated net, capturing only the modifications—the inserts, updates, and deletes—happening within that data stream. Through this targeted approach, you can focus on the new and changed data, significantly improving the efficiency of your data pipelines.There are numerous advantages to embracing CDC:

  • Reduced processing time – Why reprocess the entire dataset when you can focus only on the updates? CDC minimizes processing overhead, saving valuable time and resources.
  • Real-time insights – With CDC, your data pipelines become more responsive. You can react to changes almost instantaneously, enabling real-time analytics and decision-making.
  • Simplified data pipelines – Traditional batch processing can lead to complex pipelines. CDC streamlines the process, making data pipelines more manageable and easier to maintain.

Why Apache Hudi?

Hudi simplifies incremental data processing and data pipeline development. This framework efficiently manages business requirements such as data lifecycle and improves data quality. You can use Hudi to manage data at the record-level in Amazon S3 data lakes to simplify CDC and streaming data ingestion and handle data privacy use cases requiring record-level updates and deletes. Datasets managed by Hudi are stored in Amazon S3 using open storage formats, while integrations with Presto, Apache Hive, Apache Spark, and Data Catalog give you near real time access to updated data. Apache Hudi facilitates incremental data processing for Amazon S3 by:

  • Managing record-level changes – Ideal for update and delete use cases
  • Open formats – Integrates with Presto, Hive, Spark, and Data Catalog
  • Schema evolution – Supports dynamic schema changes
  • HoodieMultiTableDeltaStreamer – Simplifies ingestion into multiple tables using centralized configurations

Hudi MultiTable Delta Streamer

The HoodieMultiTableStreamer offers a streamlined approach to data ingestion from multiple sources into Hudi tables. By processing multiple sources simultaneously through a single DeltaStreamer job, it eliminates the need for separate pipelines while reducing operational complexity. The framework provides flexible configuration options, and you can tailor settings for diverse formats and schemas across different data sources.

One of its key strengths lies in unified data delivery, organizing information in respective Hudi tables for seamless access. The system’s intelligent upsert capabilities efficiently handle both inserts and updates, maintaining data consistency across your pipeline. Additionally, its robust schema evolution support enables your data pipeline to adapt to changing business requirements without disruption, making it an ideal solution for dynamic data environments.

Solution overview

In this section, we show how to stream data to Apache Hudi Table using Amazon MSK. For this example scenario, there are data streams from three distinct sources residing in separate Kafka topics. We aim to implement a streaming pipeline that uses the Hudi DeltaStreamer with multitable support to ingest and process this data at 15-minute intervals.

Mechanism

Using MSK Connect, data from multiple sources flows into MSK topics. These topics are then ingested into Hudi tables using the Hudi MultiTable DeltaStreamer. In this sample implementation, we create three Amazon MSK topics and configure the pipeline to process data in JSON format using JsonKafkaSource, with the flexibility to handle Avro format when needed through the appropriate deserializer configuration

The following diagram illustrates how our solution processes data from multiple source databases through Amazon MSK and Apache Hudi to enable analytics in Amazon Athena. Source databases send their data changes—including inserts, updates, and deletes—to dedicated topics in Amazon MSK, where each data source maintains its own Kafka topic for change events. An Amazon EMR cluster runs the Apache Hudi MultiTable DeltaStreamer, which processes these multiple Kafka topics in parallel, transforming the data and writing it to Apache Hudi tables stored in Amazon S3. Data Catalog maintains the metadata for these tables, enabling seamless integration with analytics tools. Finally, Amazon Athena provides SQL query capabilities on the Hudi tables, allowing analysts to run both snapshot and incremental queries on the latest data. This architecture scales horizontally as new data sources are added, with each source getting its dedicated Kafka topic and Hudi table configuration, while maintaining data consistency and ACID guarantees across the entire pipeline.

To set up the solution, you need to complete the following high-level steps:

  1. Set up Amazon MSK and create Kafka topics
  2. Create the Kafka topics
  3. Create table-specific configurations
  4. Launch Amazon EMR cluster
  5. Invoke the Hudi MultiTable DeltaStreamer
  6. Verify and query data

Prerequisites

To perform the solution, you need to have the following prerequisites. For AWS services and permissions, you need:

  • AWS account:
  • IAM roles:
    • Amazon EMR service role (EMR_DefaultRole) with permissions for Amazon S3, AWS Glue and CloudWatch.
    • Amazon EC2 instance profile (EMR_EC2_DefaultRole) with S3 read/write access.
    • Amazon MSK access role with appropriate permissions.
  • S3 buckets:
    • Configuration bucket for storing properties files and schemas.
    • Output bucket for Hudi tables.
    • Logging bucket (optional but recommended).
  • Network configuration:
  • Development tools:

Set up Amazon MSK and create Kafka topics

In this step, you’ll create an MSK cluster and configure the required Kafka topics for your data streams.

  1. To create an MSK cluster:
aws kafka create-cluster \
    --cluster-name hudi-msk-cluster \
    --broker-node-group-info file://broker-nodes.json \
    --kafka-version "2.8.1" \
    --number-of-broker-nodes 3 \
    --encryption-info file://encryption-info.json \
    --client-authentication file://client-authentication.json
  1. Verify the cluster status:

aws kafka describe-cluster --cluster-arn $CLUSTER_ARN | jq '.ClusterInfo.State'

The command should return ACTIVE when the cluster is ready.

Schema setup

To set up the schema, complete the following steps:

  1. Create your schema files.
    1. input_schema.avsc:
      {
          "type": "record",
          "name": "CustomerSales",
          "fields": [
              {"name": "Id", "type": "string"},
              {"name": "ts", "type": "long"},
              {"name": "amount", "type": "double"},
              {"name": "customer_id", "type": "string"},
              {"name": "transaction_date", "type": "string"}
          ]
      }

    2. output_schema.avsc:
      {
          "type": "record",
          "name": "CustomerSalesProcessed",
          "fields": [
              {"name": "Id", "type": "string"},
              {"name": "ts", "type": "long"},
              {"name": "amount", "type": "double"},
              {"name": "customer_id", "type": "string"},
              {"name": "transaction_date", "type": "string"},
              {"name": "processing_timestamp", "type": "string"}
          ]
      }

  2. Create and upload schemas to your S3 bucket:
    # Create the schema directory
    aws s3 mb s3://hudi-config-bucket-$AWS_ACCOUNT_ID
    aws s3api put-object --bucket hudi-config-bucket-$AWS_ACCOUNT_ID --key HudiProperties/
    # Upload schema files
    aws s3 cp input_schema.avsc s3://hudi-config-bucket-$AWS_ACCOUNT_ID/HudiProperties/
    aws s3 cp output_schema.avsc s3://hudi-config-bucket-$AWS_ACCOUNT_ID/HudiProperties/

Create the Kafka topics

To create the Kafka topics, complete the following steps:

  1. Get the bootstrap broker string:
    # Get bootstrap brokers
    BOOTSTRAP_BROKERS=$(aws kafka get-bootstrap-brokers --cluster-arn $CLUSTER_ARN --query 'BootstrapBrokerString' --output text)

  2. Create the required topics:
    kafka-topics.sh --create \
        --bootstrap-server $BOOTSTRAP_BROKERS \
        --replication-factor 3 \
        --partitions 3 \
        --topic cust_sales_details
    kafka-topics.sh --create \
        --bootstrap-server $BOOTSTRAP_BROKERS \
        --replication-factor 3 \
        --partitions 3 \
        --topic cust_sales_appointment
    kafka-topics.sh --create \
        --bootstrap-server $BOOTSTRAP_BROKERS \
        --replication-factor 3 \
        --partitions 3 \
        --topic cust_info

Configure Apache Hudi

The Hudi MultiTable DeltaStreamer configuration is divided into two major components to streamline and standardize data ingestion:

  • Common configurations – These settings apply across all tables and define the shared properties for ingestion. They include details such as shuffle parallelism, Kafka brokers, and common ingestion configurations for all topics.
  • Table-specific configurations – Each table has unique requirements, such as the record key, schema file paths, and topic names. These configurations tailor each table’s ingestion process to its schema and data structure.

Create common configuration file

Common Config: kafka-hudi config file where we specify kafka broker and common configuration for all topics as below

Create the kafka-hudi-deltastreamer.properties file with the following properties:

# Common parallelism settings
hoodie.upsert.shuffle.parallelism=2
hoodie.insert.shuffle.parallelism=2
hoodie.delete.shuffle.parallelism=2
hoodie.bulkinsert.shuffle.parallelism=2
# Table ingestion configuration
hoodie.deltastreamer.ingestion.tablesToBeIngested=hudi_sales_tables.cust_sales_details,hudi_sales_tables.cust_sales_appointment,hudi_sales_tables.cust_info
# Table-specific config files
hoodie.deltastreamer.ingestion.hudi_sales_tables.cust_sales_details.configFile=s3://hudi-config-bucket-$AWS_ACCOUNT_ID/HudiProperties/tableProperties/cust_sales_details.properties
hoodie.deltastreamer.ingestion.hudi_sales_tables.cust_sales_appointment.configFile=s3://hudi-config-bucket-$AWS_ACCOUNT_ID/HudiProperties/tableProperties/cust_sales_appointment.properties
hoodie.deltastreamer.ingestion.hudi_sales_tables.cust_info.configFile=s3://hudi-config-bucket-$AWS_ACCOUNT_ID/HudiProperties/tableProperties/cust_info.properties
# Source configuration
hoodie.deltastreamer.source.dfs.root=s3://hudi-config-bucket-$AWS_ACCOUNT_ID/HudiProperties/
# MSK configuration
bootstrap.servers=BOOTSTRAP_BROKERS_PLACEHOLDER
auto.offset.reset=earliest
group.id=hudi_delta_streamer
# Security configuration
hoodie.sensitive.config.keys=ssl,tls,sasl,auth,credentials
sasl.mechanism=PLAIN
security.protocol=SASL_SSL
ssl.endpoint.identification.algorithm=
# Deserializer
hoodie.deltastreamer.source.kafka.value.deserializer.class=io.confluent.kafka.serializers.KafkaAvroDeserializer

Create table-specific configurations

For each topic, create its own configuration with a topic name and primary key details. Complete the following steps:

  1. cust_sales_details.properties:
    # Table: cust sales
    hoodie.datasource.write.recordkey.field=Id
    hoodie.deltastreamer.source.kafka.topic=cust_sales_details
    hoodie.deltastreamer.keygen.timebased.timestamp.type=UNIX_TIMESTAMP
    hoodie.deltastreamer.keygen.timebased.input.dateformat=yyyy-MM-dd HH:mm:ss.S
    hoodie.streamer.schemaprovider.registry.schemaconverter=
    hoodie.datasource.write.precombine.field=ts

  2. cust_sales_appointment.properties:
    # Table: cust sales appointment
    hoodie.datasource.write.recordkey.field=Id
    hoodie.deltastreamer.source.kafka.topic=cust_sales_appointment
    hoodie.deltastreamer.keygen.timebased.timestamp.type=UNIX_TIMESTAMP
    hoodie.deltastreamer.keygen.timebased.input.dateformat=yyyy-MM-dd HH:mm:ss.S hoodie.streamer.schemaprovider.registry.schemaconverter=
    hoodie.datasource.write.precombine.field=ts

  3. cust_info.properties:
    # Table: cust info
    hoodie.datasource.write.recordkey.field=Id
    hoodie.deltastreamer.source.kafka.topic=cust_info
    hoodie.deltastreamer.keygen.timebased.timestamp.type=UNIX_TIMESTAMP
    hoodie.deltastreamer.keygen.timebased.input.dateformat= yyyy-MM-dd HH:mm:ss.S
    hoodie.streamer.schemaprovider.registry.schemaconverter=
    hoodie.datasource.write.precombine.field=ts
    hoodie.deltastreamer.schemaprovider.source.schema.file=-$AWS_ACCOUNT_ID/HudiProperties/input_schema.avsc
    hoodie.deltastreamer.schemaprovider.target.schema.file=-$AWS_ACCOUNT_ID/HudiProperties/output_schema.avsc

These configurations form the backbone of Hudi’s ingestion pipeline, enabling efficient data handling and maintaining real-time consistency. Schema configurations define the structure of both source and target data, maintaining seamless data transformation and ingestion. Operational settings control how data is uniquely identified, updated, and processed incrementally.

The following are critical details for setting up Hudi ingestion pipelines:

  • hoodie.deltastreamer.schemaprovider.source.schema.file – The schema of the source record
  • hoodie.deltastreamer.schemaprovider.target.schema.file – The schema for the target record
  • hoodie.deltastreamer.source.kafka.topic – The source MSK topic name
  • bootstap.servers – The Amazon MSK bootstrap server’s private endpoint
  • auto.offset.reset – The consumer’s behavior when there is no committed position or when an offset is out of range

Key operational fields to achieve in-place updates for the generated schema include:

  • hoodie.datasource.write.recordkey.field – The record key field. This is the unique identifier of a record in Hudi.
  • hoodie.datasource.write.precombine.field – When two records have the same record key value, Apache Hudi picks the one with the largest value for the pre-combined field.
  • hoodie.datasource.write.operation – The operation on the Hudi dataset. Possible values include UPSERT, INSERT, and BULK_INSERT.

Launch Amazon EMR cluster

This step creates an EMR cluster with Apache Hudi installed. The cluster will run the MultiTable DeltaStreamer to process data from your Kafka topics. To create the EMR cluster, enter the following:

# Create EMR cluster with Hudi installed
aws emr create-cluster \
    --name "Hudi-CDC-Cluster" \
    --release-label emr-6.15.0 \
    --applications Name=Hadoop Name=Spark Name=Hive Name=Livy \
    --ec2-attributes KeyName=myKey,SubnetId=$SUBNET_ID,InstanceProfile=EMR_EC2_InstanceProfile \
    --service-role EMR_ServiceRole \
    --instance-groups InstanceGroupType=MASTER,InstanceCount=1,InstanceType=m5.xlarge InstanceGroupType=CORE,InstanceCount=2,InstanceType=m5.xlarge \
    --configurations file://emr-configurations.json \
    --bootstrap-actions Name="Install Hudi",Path="s3://hudi-config-bucket-$AWS_ACCOUNT_ID/bootstrap-hudi.sh"

Invoke the Hudi MultiTable DeltaStreamer

This step configures and starts the DeltaStreamer job that will continuously process data from your Kafka topics into Hudi tables. Complete the following steps:

  1. Connect to the Amazon EMR master node:
    # Get master node public DNS
    MASTER_DNS=$(aws emr describe-cluster --cluster-id $CLUSTER_ID --query 'Cluster.MasterPublicDnsName' --output text)
    
    # SSH to master node
    ssh -i myKey.pem hadoop@$MASTER_DNS

  2. Execute the DeltaStreamer job:
    # 
    spark-submit --deploy-mode client \
      --conf "spark.serializer=org.apache.spark.serializer.KryoSerializer" \
      --conf "spark.sql.catalog.spark_catalog=org.apache.spark.sql.hudi.catalog.HoodieCatalog" \
      --conf "spark.sql.extensions=org.apache.spark.sql.hudi.HoodieSparkSessionExtension" \
      --jars "/usr/lib/hudi/hudi-utilities-bundle_2.12-0.14.0-amzn-0.jar,/usr/lib/hudi/hudi-spark-bundle.jar" \
      --class "org.apache.hudi.utilities.deltastreamer.HoodieMultiTableDeltaStreamer" \
      /usr/lib/hudi/hudi-utilities-bundle_2.12-0.14.0-amzn-0.jar \
      --props s3://hudi-config-bucket-$AWS_ACCOUNT_ID/HudiProperties/kafka-hudi-deltastreamer.properties \
      --config-folder s3://hudi-config-bucket-$AWS_ACCOUNT_ID/HudiProperties/tableProperties/ \
      --table-type MERGE_ON_READ \
      --base-path-prefix s3://hudi-data-bucket-$AWS_ACCOUNT_ID/hudi/ \
      --source-class org.apache.hudi.utilities.sources.JsonKafkaSource \
      --schemaprovider-class org.apache.hudi.utilities.schema.FilebasedSchemaProvider \
      --op UPSERT

    For continuous mode, you need to add the following property:

    
    --continuous \
    --min-sync-interval-seconds 900
    

With the job configured and running on Amazon EMR, the Hudi MultiTable DeltaStreamer efficiently manages real-time data ingestion into your Amazon S3 data lake.

Verify and query data

To verify and query the data, complete the following steps:

  1. Register tables in Data Catalog:
    # Start Spark shell
    spark-shell --conf "spark.serializer=org.apache.spark.serializer.KryoSerializer" \
      --conf "spark.sql.catalog.spark_catalog=org.apache.spark.sql.hudi.catalog.HoodieCatalog" \
      --conf "spark.sql.extensions=org.apache.spark.sql.hudi.HoodieSparkSessionExtension" \
      --jars "/usr/lib/hudi/hudi-spark-bundle.jar"
    
    # In Spark shell
    spark.sql("CREATE DATABASE IF NOT EXISTS hudi_sales_tables")
    
    spark.sql("""
    CREATE TABLE hudi_sales_tables.cust_sales_details
    USING hudi
    LOCATION 's3://hudi-data-bucket-$AWS_ACCOUNT_ID/hudi/hudi_sales_tables.cust_sales_details'
    """)
    
    # Repeat for other tables

  2. Query with Athena:
    -- Sample query
    SELECT * FROM hudi_sales_tables.cust_sales_details LIMIT 10;

You can use Amazon CloudWatch alarms to alert you of issues with the EMR job or data processing. To create a CloudWatch alarm to monitor EMR job failures, enter the following:

aws cloudwatch put-metric-alarm \
    --alarm-name EMR-Hudi-Job-Failure \
    --metric-name JobsFailed \
    --namespace AWS/ElasticMapReduce \
    --statistic Sum \
    --period 300 \
    --threshold 1 \
    --comparison-operator GreaterThanOrEqualToThreshold \
    --dimensions Name=JobFlowId,Value=$CLUSTER_ID \
    --evaluation-periods 1 \
    --alarm-actions $SNS_TOPIC_ARN

Real-world impact of Hudi CDC pipelines

With the pipeline configured and running, you can achieve real-time updates to your data lake, enabling faster analytics and decision-making. For instance:

  • Analytics – Up-to-date inventory data maintains accurate dashboards for ecommerce platforms.
  • Monitoring – CloudWatch metrics confirm the pipeline’s health and efficiency.
  • Flexibility – The seamless handling of schema evolution minimizes downtime and data inconsistencies.

Cleanup

To avoid incurring future charges, follow these steps to clean up resources:

  1. Terminate the Amazon EMR cluster
  2. Delete the Amazon MSK cluster
  3. Remove Amazon S3 objects

Conclusion

In this post, we showed how you can build a scalable data ingestion pipeline using Apache Hudi’s MultiTable DeltaStreamer on Amazon EMR to process data from multiple Amazon MSK topics. You learned how to configure CDC with Apache Hudi, set up real-time data processing with 15-minute sync intervals, and maintain data consistency across multiple sources in your Amazon S3 data lake.

To learn more, explore these resources:

By combining CDC with Apache Hudi, you can build efficient, real-time data pipelines. The streamlined ingestion processes simplify management, enhance scalability, and maintain data quality, making this approach a cornerstone of modern data architectures.


About the authors

Radhakant Sahu

Radhakant Sahu

Radhakant is a Senior Data Engineer and Amazon EMR subject matter expert at Amazon Web Services (AWS) with over a decade of experience in the data space. He specializes in big data, graph databases, AI, and DevOps, building robust, scalable data and analytics solutions that help global clients derive actionable insights and drive business outcomes.

Gautam Bhaghavatula

Gautam Bhaghavatula

Gautam is an AWS Senior Partner Solutions Architect with over 10 years of experience in cloud infrastructure architecture. He specializes in designing scalable solutions, with a focus on compute systems, networking, microservices, DevOps, cloud governance, and AI operations. Gautam provides strategic guidance and technical leadership to AWS partners, driving successful cloud migrations and modernization initiatives.

Sucharitha Boinapally

Sucharitha Boinapally

Sucharitha is a Data Engineering Manager with over 15 years of industry experience. She specializes in agentic AI, data engineering, and knowledge graphs, delivering sophisticated data architecture solutions. Sucharitha excels at designing and implementing advanced knowledge mapping systems.

Veera “Bhargav” Nunna

Veera “Bhargav” Nunna

Veera is a Senior Data Engineer and Tech Lead at AWS pioneering Knowledge Graphs for Large Language Models and enterprise-scale data solutions. With over a decade of experience, he specializes in transforming enterprise AI from concept to production by delivering MVPs that demonstrate clear ROI while solving practical challenges like performance optimization and cost control.

From AI agent prototype to product: Lessons from building AWS DevOps Agent

Post Syndicated from Efe Karakus original https://aws.amazon.com/blogs/devops/from-ai-agent-prototype-to-product-lessons-from-building-aws-devops-agent/

At re:Invent 2025, Matt Garman announced AWS DevOps Agent, a frontier agent that resolves and proactively prevents incidents, continuously improving reliability and performance. As a member of the DevOps Agent team, we’ve focused heavily on making sure that the “incident response” capability of the DevOps Agent generates useful findings and observations. In particular, we’ve been working on making root cause analysis for native AWS applications accurate and performant. Under the hood, DevOps Agent has a multi-agent architecture where a lead agent acts as an incident commander: it understands the symptom, creates an investigation plan, and delegates individual tasks to specialized sub-agents when those tasks benefit from context compression. A sub-agent executes its task with a pristine context window and reports compressed results back to the lead agent. For example, when examining high-volume log records, a sub-agent filters through the noise to surface only relevant messages to the lead agent.

In this blog post, we want to focus on the mechanisms one needs to develop to build an agentic product that works. Building a prototype with large language models (LLMs) has a low barrier to entry – you can showcase something that works fairly quickly. However, graduating that prototype into a product that performs reliably across diverse customer environments is a different challenge entirely, and one that is frequently underestimated. This post shares what we learned building AWS DevOps Agent so you can apply these lessons to your own agent development.

In our experience, there are five mechanisms necessary to continuously improve agent quality and bridge the gap from prototype to production. First, you need evaluations (evals) to identify where your agent fails and where it can improve, while establishing a quality baseline for the types of scenarios your agent handles well. Second, you need a visualization tool to debug agent trajectories and understand where exactly the agent went wrong. Third, you need a fast feedback loop with the ability to rerun those failing scenarios locally to iterate. Fourth, you need to make intentional changes: establishing success criteria before modifying your system to avoid confirmation bias. Finally, you need to read production samples regularly to understand actual customer experience and discover new scenarios your evals don’t yet cover.

Evaluations

Evals are the machine learning equivalent of a test suite in traditional software engineering. Just like building any other software product, a collection of good test cases builds confidence in quality. Iterating on agent quality is similar to test-driven development (TDD): you have an eval scenario that the agent fails (the test is red), you make changes until the agent passes (the test is green). A passing eval means the agent arrived at an accurate, useful output through correct reasoning.

For AWS DevOps Agent, the size of an individual eval scenario is similar to an end-to-end test in the traditional software engineering testing pyramid. Looking through the lens of “Given-When-Then” style tests:

  • Given – The test setup portion tends to be the most time-consuming to author. For the AWS DevOps Agent, an example eval scenario includes an application running on Amazon Elastic Kubernetes Service composed of several microservices fronted by Application Load Balancers, reading and writing from data stores such as Amazon Relational Database Service databases and Amazon Simple Storage Service buckets, with AWS Lambda functions doing data transformations. We inject a fault by deploying a code change that accidentally removes a key AWS Identity and Access Management (IAM) permission to write to S3 deep in the dependency chain.
  • When – Once the fault is injected, an alarm fires, and this triggers the AWS DevOps Agent to start its investigation. The eval framework polls the records that the Agent generates, just like how the DevOps Agent web application renders them. This section isn’t fundamentally different from defining the action in an integration or end-to-end test.
  • Then – This asserts and reports on multiple metrics. Fundamentally, there’s a single “PASS” (1) or “FAIL” (0) metric for quality. For the DevOps Agent’s incident response capability, a “PASS” means the right root cause surfaced to the customer – in our example, this means identifying the faulty deployment as the root cause and tracing the dependency chain to surface the impacted resources and observations that reveal the missing S3 write permission; otherwise “FAIL”. We define this as a rubric: not just “did the agent find the root cause?” but “did the agent arrive at the root cause through the correct reasoning with the right supporting evidence?”The ground truth (the “expected” or “wanted” in software testing parlance) is compared to the system response (the “actual”) via an LLM Judge – an LLM that receives both the ground truth and the agent’s actual output, then emits its reasoning and a verdict on whether they match. We use an LLM for comparison because the agent’s output is non-deterministic: the agent follows an overall output format but generates the actual text freely, so each run may use different words or sentence structures while conveying the same semantic meaning. We don’t want to strictly search for keywords in the final root cause analysis report but rather evaluate whether the essence of the rubric is met.

The evaluation report is structured with scenarios as rows and metrics as columns. Key metrics that we keep track of are capability (pass@k – whether the agent passed at least once in k attempts), reliability (pass^k – how many times the agent passed across k attempts, e.g., 0.33 means passed 1 out of 3 times for k=3), latency, and token usage.

Evaluation results table with two scenario rows. Headers: Scenario, Pass@3, Pass^3, Avg. E2E Latency, Avg. Time-To-First-Observation, and Avg. Total tokens. Lambda throttle scenario shows Pass@3 of 1 and Pass^3 of 1 (highlighted green). SQS permission removal scenario shows Pass@3 of 1 and Pass^3 of 0.33 (highlighted red), indicating it passed only 1 of 3 attempts.

Why are evals important?

There are several benefits to having evals:

  • Red scenarios provide obvious investigation points for the agent development team to increase product quality.
  • Over time, green scenarios act as regression tests, notifying us when changes to the system degrade the existing customer experience.
  • Once pass rates are green, we can improve customer experience along additional metrics. For example, reducing end-to-end latency and/or optimizing cost (proxied by token usage) while maintaining the quality bar.

What makes evals challenging?

Fast feedback loops help developers know whether code works (is it correct, performant, secure) and whether ideas are good (do they improve key business metrics). This may seem obvious, but far too often, teams and organizations tolerate slow feedback loops […] — Nicole Forsgren and Abi Noda, Frictionless: 7 Steps to Remove Barriers, Unlock Value, and Outpace Your Competition in the AI Era

There are several challenges with evals. In decreasing order of difficulty:

  1. Realistic and diverse scenarios are hard to author. Coming up with realistic applications and fault scenarios is difficult. Authoring high fidelity microservice applications and faults is significant work that requires prior industry experience. What we’ve found effective: we author a few “environments” (based on real application architectures) but create many failure scenarios on top of them. The environment is the expensive portion of the evaluation setup, so we maximize reuse across multiple scenarios.
  2. Slow feedback loops. If the “Given” takes 20 minutes to deploy for an eval scenario and then the “When” takes another 10-20 minutes for complex investigations to complete, agent developers won’t thoroughly test their changes. Instead, they’ll be satisfied with a single passing eval, then release to production, potentially introducing regressions until the comprehensive eval report is generated. Additionally, slow feedback loops encourages batching multiple changes together rather than small incremental experiments, making it harder to understand which change actually moved the needle. We’ve found three mechanisms effective for speeding up feedback loops:
    1. Long-running environments for eval scenarios. The application and its healthy state are created once and kept running. Fault injection happens periodically (e.g., over weekends), and developers point their agent credentials at the faulty environment, completely skipping the “Given” portion of the test.
    2. Isolated testing of only the agent surface area that matters. In our multi-agent system, developers can trigger a specific sub-agent directly with a prompt from a past eval run rather than running the entire end-to-end flow. Additionally, we built a “fork” feature: developers can initialize any agent with the conversation history from a failing run up to a specific checkpoint message, then iterate only on the remaining trajectory. Both of these approaches significantly lowers the wait time of the “When” portion.
    3. Local development of the agentic system. If developers must merge changes and release to a cloud environment before testing, the loop is too slow. Running locally enables rapid iteration.

Visualize trajectories

When an agent fails an eval or a production run, where do you start investigating? The most productive method is error analysis. Visualize the agent’s complete trajectory, every user-assistant message exchange including sub-agent trajectories, and annotate each step as “PASS” or “FAIL” with notes on what went wrong. This process is tedious but effective.

For AWS DevOps Agent, agent trajectories map to OpenTelemetry traces and you can use tools like Jaeger to visualize them. Software development kits like Strands provide tracing integration with minimal setup.

Jaeger UI showing a distributed trace for strands-agents with trace ID 941e3b7. The trace spans 25 minutes 17 seconds with 454 total spans across 7 depth levels. The left panel shows a hierarchical tree of service operations including execute_event_loop_cycle, chat, and execute_tool calls for current_time, write_scratchpad, and use_aws. The right panel displays a timeline visualization with horizontal bars representing span durations. The bottom detail panel shows metadata for a selected execute_tool use_aws span, including tags, process information, and logs with gen_ai event data.

Figure 1 – A sample trace from AWS DevOps Agent.

Each span contains user-assistant message pairs. We annotate each span’s quality in a table such as the following:

Error analysis table showing Step 3 with Span ID f182abb7c94a4713. The Description column shows Title: GetQueryResults(Surveying logs) with a JSON content snippet. Duration is T seconds. The Verdict column shows FAIL highlighted in red. The Reasoning column recommends removing @ptr fields, noting the retrieved logs are X tokens and removing @ptr fields from CloudWatch log records can reduce token usage by half.

This low-level analysis consistently surfaces multiple improvements, not just one. For a single failing eval, one will typically identify many concrete changes spanning accuracy, performance, and cost.

Intentional changes

I had learned from my dad the importance of intentionality — knowing what it is you’re trying to do, and making sure everything you do is in service of that goal. — Will Guidara, Unreasonable Hospitality: The Remarkable Power of Giving People More Than They Expect

You’ve identified failing scenarios and diagnosed the issues through trajectory analysis. Now it’s time to modify the system.

The biggest fallacy we’ve observed at this stage: confirmation bias leading to overfitting. Given the eval challenges mentioned earlier (slow feedback loops and the impracticality of comprehensive test suites) developers typically test only the few specific failing scenarios locally until they pass. One modifies the context (system prompt, tool specifications, tool implementations, etc.) until one or two scenarios pass, without considering broader impact. When changes don’t follow context engineering best practices, they likely have negative effects that we can’t capture through limited evals.

You need both diligence and judgment: establish success criteria through available evals and reusable past production scenarios, but also educate yourself on context engineering best practices to guide your changes. We’ve found Anthropic’s prompting best practices and engineering blog, Drew Breunig’s how long contexts fail, and lessons from building Manus particularly helpful resources.

Establish success criteria first

Before making any change, define what success looks like:

  • Baseline. Fix specific git commit IDs for the current system. Think deliberately about which metrics would improve both the agent’s experience and the customer’s experience, then gather those metrics for the baseline.
  • Test scenarios. Which evals will measure your change’s impact? How many times will you rerun these evals? Convince yourself this set represents broader customer patterns, not just the one failure you’re investigating.
  • Comparison. Measure your changes against the baseline using the same metrics.

This intentional framing protects against confirmation bias (interpreting results favorably) and sunk cost fallacy (accepting changes simply because you invested time). If your modifications don’t move the metrics as expected, reject them.

For example, when optimizing a sub-agent within AWS DevOps Agent, we establish a baseline by fixing git commit IDs and running the same scenario seven times. This reveals both typical performance and variance.

Baseline metrics table comparing multiple runs of a sub-agent. Headers: Run, Correct observations, Irrelevant observations, Latency, Sub-agent Tokens, and Lead-agent Tokens. Run 1 shows 4 out of 6 correct observations with 1 irrelevant observation. Run 7 shows 5 out of 6 correct observations with 0 irrelevant observations, demonstrating variance across repeated runs of the same scenario.

Each metric measures a different dimension:

  • Correct observations – How many relevant signals (log records, metric data, code snippets, etc.) that are directly related to the incident did the sub-agent surface?
  • Irrelevant observations – How much noise did the sub-agent introduce to the lead agent? This counts signals that are unrelated to the incident and could distract the agent’s investigation.
  • Latency – How long did the sub-agent take (measured in minutes and seconds)?
  • Sub-agent tokens – How many tokens did the sub-agent to accomplish its task? This serves as a proxy for the cost of running the sub-agent.
  • Lead-agent tokens – How much of the lead agent’s context window is the sub-agent’s input and output consuming? This gives us a tangible way to identify optimization opportunities for the sub-agent tool: can we compress the instructions to the sub-agent or the results it returns?

After establishing the baseline, we compare these metrics against the same measurements with our proposed changes. This makes it clear whether the change is an actual improvement.

Read production samples

We’ve been fortunate to have several Amazon teams adopt AWS DevOps Agent early. A DevOps agent team member on rotation regularly samples real production runs using our trajectory visualization tool (similar to the OpenTelemetry-based visualization discussed earlier, but customized to render DevOps Agent-specific artifacts like root cause analysis reports and observations), marking whether the agent’s output was accurate and identifying failure points. Production samples are irreplaceable; they reveal the actual customer experience. Additionally, reviewing samples continuously refines your intuition of what the agent is good and bad at. When production runs aren’t satisfactory, you have real-world scenarios to iterate against: modify your agent locally, then rerun it against the same production environment until the desired outcome is reached. Establishing rapport with a few critical early adopter teams willing to partner in this way is invaluable. They provide ground truth for rapid iteration and create opportunities to identify new eval scenarios. This tight feedback loop with production data works in conjunction with eval-driven development to form a comprehensive test suite.

Closing thoughts

Building an agent prototype that demonstrates the feasibility of solving a real business problem is an exciting first step. The harder work is graduating that prototype into a product that performs reliably across diverse customer environments and tasks. In this post, we’ve shared five mechanisms that form the foundation for systematically improving agent quality: evals with realistic and diverse scenarios, fast feedback loops, trajectory visualization, intentional changes, and production sampling.

If you’re building an agentic application, start building your eval suite today. Even starting with a handful critical scenarios will establish the quality baseline needed to measure and improve systematically. To see how AWS DevOps Agent applies these principles to incident response, check out our getting started guide.

Efe Karakus

Efe Karakus is a Sr. Software Engineer on the AWS DevOps Agent team, primarily focusing on agent development.

Unlock granular resource control with queue-based QMR in Amazon Redshift Serverless

Post Syndicated from Srini Ponnada original https://aws.amazon.com/blogs/big-data/unlock-granular-resource-control-with-queue-based-qmr-in-amazon-redshift-serverless/

Amazon Redshift Serverless removes infrastructure management and manual scaling requirements from data warehousing operations. Amazon Redshift Serverless queue-based query resource management, helps you protect critical workloads and control costs by isolating queries into dedicated queues with automated rules that prevent runaway queries from impacting other users. You can create dedicated query queues with customized monitoring rules for different workloads, providing granular control over resource usage. Queues let you define metrics-based predicates and automated responses, such as automatically aborting queries that exceed time limits or consume excessive resources.

Different analytical workloads have distinct requirements. Marketing dashboards need consistent, fast response times. Data science workloads might run complex, resource-intensive queries. Extract, transform, and load (ETL) processes might execute lengthy transformations during off-hours.

As organizations scale analytics usage across more users, teams, and workloads, ensuring consistent performance and cost control becomes increasingly challenging in a shared environment. A single poorly optimized query can consume disproportionate resources, degrading performance for business-critical dashboards, ETL jobs, and executive reporting. With Amazon Redshift Serverless queue-based Query Monitoring Rules (QMR), administrators can define workload-aware thresholds and automated actions at the queue level—a significant improvement over previous workgroup-level monitoring. You can create dedicated queues for distinct workloads such as BI reporting, ad hoc analysis, or data engineering, then apply queue-specific rules to automatically abort, log, or restrict queries that exceed execution-time or resource-consumption limits. By isolating workloads and enforcing targeted controls, this approach protects mission-critical queries, improves performance predictability, and prevents resource monopolization—all while maintaining the flexibility of a serverless experience.

In this post, we discuss how you can implement your workloads with query queues in Redshift Serverless.

Queue-based vs. workgroup-level monitoring

Before query queues, Redshift Serverless offered query monitoring rules (QMRs) only at the workgroup level. This meant the queries, regardless of purpose or user, were subject to the same monitoring rules.

Queue-based monitoring represents a significant advancement:

  • Granular control – You can create dedicated queues for different workload types
  • Role-based assignment – You can direct queries to specific queues based on user roles and query groups
  • Independent operation – Each queue maintains its own monitoring rules

Solution overview

In the following sections, we examine how a typical organization might implement query queues in Redshift Serverless.

Architecture Components

Workgroup Configuration

  • The foundational unit where query queues are defined
  • Contains the queue definitions, user role mappings, and monitoring rules

Queue Structure

  • Multiple independent queues operating within a single workgroup
  • Each queue has its own resource allocation parameters and monitoring rules

User/Role Mapping

  • Directs queries to appropriate queues based on:
  • User roles (e.g., analyst, etl_role, admin)
  • Query groups (e.g., reporting, group_etl_inbound)
  • Query group wildcards for flexible matching

Query Monitoring Rules (QMRs)

  • Define thresholds for metrics like execution time and resource usage
  • Specify automated actions (abort, log) when thresholds are exceeded

Prerequisites

To implement query queues in Amazon Redshift Serverless, you need to have the following prerequisites:

Redshift Serverless environment:

  • Active Amazon Redshift Serverless workgroup
  • Associated namespace

Access requirements:

  • AWS Management Console access with Redshift Serverless permissions
  • AWS CLI access (optional for command-line implementation)
  • Administrative database credentials for your workgroup

Required permissions:

  • IAM permissions for Redshift Serverless operations (CreateWorkgroup, UpdateWorkgroup)
  • Ability to create and manage database users and roles

Identify workload types

Begin by categorizing your workloads. Common patterns include:

  • Interactive analytics – Dashboards and reports requiring fast response times
  • Data science – Complex, resource-intensive exploratory analysis
  • ETL/ELT – Batch processing with longer runtimes
  • Administrative – Maintenance operations requiring special privileges

Define queue configuration

For each workload type, define appropriate parameters and rules. For a practical example, let’s assume we want to implement three queues:

  • Dashboard queue – Used by analyst and viewer user roles, with a strict runtime limit set to stop queries longer than 60 seconds
  • ETL queue – Used by etl_role user roles, with a limit of 100,000 blocks on disk spilling (query_temp_blocks_to_disk) to control resource usage during data processing operations
  • Admin queue – Used by admin user roles, without a query monitoring limit enforced

To implement this using the AWS Management Console, complete the following steps:

  1. On the Redshift Serverless console, go to your workgroup.
  2. On the Limits tab, under Query queues, choose Enable queues.
  3. Configure each queue with appropriate parameters, as shown in the following screenshot.

Each queue (dashboard, ETL, admin_queue) is mapped to specific user roles and query groups, creating clear boundaries between query rules. The query monitoring rules implement automated resource governance—for example, the dashboard queue automatically stops queries exceeding 60 seconds (short_timeout) while allowing ETL processes longer runtimes with different thresholds. This configuration helps prevent resource monopolization by establishing separate processing lanes with appropriate guardrails, so critical business processes can maintain necessary computational resources while limiting the impact of resource-intensive operations.

Alternatively, you can implement the solution using the AWS Command Line Interface (AWS CLI).

In the following example, we create a new workgroup named test-workgroup within an existing namespace called test-namespace. This makes it possible to create queues and establish associated monitoring rules for each queue using the following command:

aws redshift-serverless create-workgroup \
  --workgroup-name test-workgroup \
  --namespace-name test-namespace \
  --config-parameters '[{"parameterKey": "wlm_json_configuration", "parameterValue": "[{\"name\":\"dashboard\",\"user_role\":[\"analyst\",\"viewer\"],\"query_group\":[\"reporting\"],\"query_group_wild_card\":1,\"rules\":[{\"rule_name\":\"short_timeout\",\"predicate\":[{\"metric_name\":\"query_execution_time\",\"operator\":\">\",\"value\":60}],\"action\":\"abort\"}]},{\"name\":\"ETL\",\"user_role\":[\"etl_role\"],\"query_group\":[\"group_etl_inbound\",\"group_etl_outbound\"],\"rules\":[{\"rule_name\":\"long_timeout\",\"predicate\":[{\"metric_name\":\"query_execution_time\",\"operator\":\">\",\"value\":3600}],\"action\":\"log\"},{\"rule_name\":\"memory_limit\",\"predicate\":[{\"metric_name\":\"query_temp_blocks_to_disk\",\"operator\":\">\",\"value\":100000}],\"action\":\"abort\"}]},{\"name\":\"admin_queue\",\"user_role\":[\"admin\"],\"query_group\":[\"admin\"]}]"}]' 

You can also modify an existing workgroup using update-workgroup using the following command:

aws redshift-serverless update-workgroup \
  --workgroup-name test-workgroup \
  --config-parameters '[{"parameterKey": "wlm_json_configuration", "parameterValue": "[{\"name\":\"dashboard\",\"user_role\":[\"analyst\",\"viewer\"],\"query_group\":[\"reporting\"],\"query_group_wild_card\":1,\"rules\":[{\"rule_name\":\"short_timeout\",\"predicate\":[{\"metric_name\":\"query_execution_time\",\"operator\":\">\",\"value\":60}],\"action\":\"abort\"}]},{\"name\":\"ETL\",\"user_role\":[\"etl_role\"],\"query_group\":[\"group_etl_load\",\"group_etl_replication\"],\"rules\":[{\"rule_name\":\"long_timeout\",\"predicate\":[{\"metric_name\":\"query_execution_time\",\"operator\":\">\",\"value\":3600}],\"action\":\"log\"},{\"rule_name\":\"memory_limit\",\"predicate\":[{\"metric_name\":\"query_temp_blocks_to_disk\",\"operator\":\">\",\"value\":100000}],\"action\":\"abort\"}]},{\"name\":\"admin_queue\",\"user_role\":[\"admin\"],\"query_group\":[\"admin\"]}]"}]'

Best practices for queue management

Consider the following best practices:

  • Start simple – Begin with a minimal set of queues and rules
  • Align with business priorities – Configure queues to reflect critical business processes
  • Monitor and adjust – Regularly review queue performance and adjust thresholds
  • Test before production – Validate query metrics behavior in a test environment before applying to production

Clean up

To clean up your resources, delete the Amazon Redshift Serverless workgroups and namespaces. For instructions, see Deleting a workgroup.

Conclusion

Query queues in Amazon Redshift Serverless bridge the gap between serverless simplicity and fine-grained workload control by enabling queue-specific Query Monitoring Rules tailored to different analytical workloads. By isolating workloads and enforcing targeted resource thresholds, you can protect business-critical queries, improve performance predictability, and limit runaway queries, helping minimize unexpected resource consumption and better control costs, while still benefiting from the automatic scaling and operational simplicity of Redshift Serverless.

Get started with Amazon Redshift Serverless today.

About the authors

Srini Ponnada

Srini is a Sr. Data Architect at Amazon Web Services (AWS). He has helped customers build scalable data warehousing and big data solutions for over 20 years. He loves to design and build efficient end-to-end solutions on AWS.

Niranjan Kulkarni

Niranjan is a Software Development Engineer for Amazon Redshift. He focuses on Amazon Redshift Serverless adoption and Amazon Redshift security-related features. Outside of work, he spends time with his family and enjoys watching high-quality TV series.
Ashish Agrawal

Ashish is currently a Principal Technical Product Manager with Amazon Redshift, building cloud-based data warehouses and analytics cloud services solutions. Ashish has over 24 years of experience in IT. Ashish has expertise in data warehouses, data lakes, and platform as a service. Ashish is a speaker at worldwide technical conferences.

Davide Pagano

Davide is a Software Development Manager with Amazon Redshift, specialized in building smart cloud-based data warehouses and analytics cloud services solutions like automatic workload management, multi-dimensional data layouts, and AI-driven scaling and optimizations for Amazon Redshift Serverless. He has over 10 years of experience with databases, including 8 years of experience tailored to Amazon Redshift.
Access Snowflake Horizon Catalog data using catalog federation in the AWS Glue Data Catalog

Post Syndicated from Andries Engelbrecht original https://aws.amazon.com/blogs/big-data/access-snowflake-horizon-catalog-data-using-catalog-federation-in-the-aws-glue-data-catalog/

This is a guest post by Andries Engelbrecht, Principal Partner Solutions Engineer at Snowflake, in partnership with AWS.

AWS announced a new catalog federation feature that allows you to directly access data from Snowflake Horizon Catalog through the AWS Glue Data Catalog. This integration enables you to discover and query Horizon Catalog data in Iceberg format through REST endpoints while applying fine-grained access controls using AWS Lake Formation. The new catalog federation combined with Snowflake’s catalog-linked database feature means users can access data stored across AWS and Snowflake from a single point of entry, reducing data movement and associated costs by eliminating the need to duplicate data across platforms.

In this post, we show you how to connect the AWS Glue Data Catalog to Snowflake Horizon Catalog and query the data using AWS analytics services. We cover how to set up catalogs in Horizon Catalog and configure required permissions, create and configure the federation connection in AWS Glue, implement fine-grained access controls using AWS Lake Formation, and finally, query federated tables using Amazon Athena. This step-by-step approach guides you through the complete process of establishing a integration between your Snowflake and AWS data environments.

Business examples and key benefits

Catalog federation enables several critical business scenarios while delivering key operational and strategic benefits.

Common examples

This federation capability addresses several key business scenarios:

  • Governed, cross-platform analytics: Query data across AWS and Snowflake environments to improve data-driven decision making without data movement or duplication
  • Data mesh implementation: Enable secure and federated data discovery while maintaining domain-oriented ownership
  • Compliance management: Implement consistent access controls and auditing across platforms

Key benefits

  • Operational efficiency: Eliminate data duplication and reduce Extract Transform Load (ETL) workloads
  • Enhanced security: Centralize access control through AWS Lake Formation with fine-grained permissions
  • Cost optimization: Minimize data transfer and storage costs across platforms
  • Improved agility: Enable faster time to insights with direct query access
  • Simplified governance: Maintain unified compliance and audit framework

Solution overview

The solution uses catalog federation in the AWS Glue Data Catalog to integrate with Snowflake Horizon Catalog. This integration supports both Snowflake Horizon, where the catalog is internal to Snowflake, and external catalogs such as Apache Polaris, Snowflake Open Catalog (a managed service that hosts Apache Polaris), and others.

The following diagram illustrates how AWS Glue Data Catalog federates with Snowflake Horizon Catalog, enabling customers to directly access Iceberg-format data managed by Snowflake Horizon Catalog through the Glue Data Catalog.

Architecture diagram showing integration between AWS services and Snowflake using federated catalog connections through Apache Iceberg REST API.

The integration works through three main components:

  1. Authentication: Uses OAuth2 credentials of Snowflake principal
  2. Access Control: AWS Lake Formation manages fine-grained permissions
  3. Query Access: AWS Analytics services like Amazon Athena can directly query the federated tables

Now, we walk through the step-by-step process of setting up this integration.

Prerequisites

Before you begin, confirm you have the following:

Configure Snowflake Horizon Catalog for Iceberg external access

Snowflake Horizon Catalog already supports managing Iceberg tables. For this walkthrough, you need to create Snowflake-managed Iceberg tables with data stored in Amazon S3.

Follow these steps in order:

  1. Create an external volume for S3: First, create an external volume that points to your S3 bucket where Iceberg table data is stored. Follow the instructions in Create External Volume(s) for the Iceberg Tables on S3.
  2. Create a database: Create a database to organize your tables. Refer to the Snowflake database creation documentation.
  3. Create a schema: Create a schema within your database following the Snowflake schema creation guide.
  4. Create an Iceberg table: Create your Iceberg table using the external volume. Follow the instructions to Create Iceberg Table.

After completing these steps, your Snowflake-managed Iceberg tables are ready to federate with AWS Glue Data Catalog.

Configure access control and authentication

To enable AWS Glue to access your Snowflake-managed Iceberg tables, you need to configure access control and obtain authentication credentials.

Step 1: Configure access control

Create a dedicated Snowflake role for external engine access to establish clear governance boundaries. Follow the instructions in Configure Access Control for external engines and set up the appropriate permissions for your Iceberg tables.

Step 2: Obtain an access token

Generate an access token for authenticating AWS Glue to Snowflake Horizon Catalog. Snowflake supports three authentication mechanisms:

  • External OAuth
  • Key-pair authentication
  • Programmatic Access Token (PAT)

Choose the authentication method that best fits your security requirements and follow the corresponding Snowflake documentation to generate your credentials.

Catalog Federation supports OAuth or custom authentication. For details on using OAuth refer to Federate to Snowflake Iceberg Catalog.

For this post, we use custom authentication and generate access token using PAT. Replace role_name with the principal role and token_value with the principal’s Programmatic Access Token.

curl --location 'https://<accountidentifier>.snowflakecomputing.com/polaris/api/catalog/v1/oauth/tokens' \
--header 'Content-Type: application/x-www-form-urlencoded' \
--data-urlencode 'grant_type=client_credentials' \
--data-urlencode 'scope=session:role:<role_name>' \
--data-urlencode 'client_secret=<token_value>'

Note down the access token that is generated.

Step 3: Enable catalog federation

With access control configured and authentication credentials in hand, AWS Glue Catalog Federation can now connect to and access Snowflake’s Horizon Catalog.

Optional: Snowflake Open Catalog configuration

If you prefer to use Snowflake Open Catalog for Iceberg external access instead, refer to Sync a Snowflake-managed table with Snowflake Open Catalog for alternative setup instructions.

Setup Glue Catalog federation with Snowflake Horizon Catalog

Create a secret on AWS Secrets Manager

Log in to AWS console using the IAM role that has access to AWS Secrets Manager. Open Secrets Manager:

  • Choose Store a new secret and select Other type of secret for the secret type.
  • Set the key-value pair:
    • Key: BEARER_TOKEN
    • Value: The access token noted earlier
  • Choose Next and provide the secret name as horizon-secret.
  • Complete the setup by choosing Store.

Alternatively, you can use the CLI to create the secret by running the following command.

Replace your-access-token and your-region with your actual values:

aws secretsmanager create-secret \
    --name horizon-secret \
    --description "Snowflake Horizon access token" \
    --secret-string '{
        "BEARER_TOKEN": "your-access-token"
    }' \
    --region your-region

Create IAM role for catalog federation

As the catalog owner of a federated catalog in AWS Glue Data Catalog, you can use Lake Formation to implement comprehensive access controls for your data teams:

Access control options

You can implement access controls at different granularity levels depending on your governance needs:

  • Coarse-grained: Table-level permissions
  • Fine-grained: Column-level, row-level, and cell-level filtering
  • Tag-based: Dynamic access based on data classification tags

Lake Formation requires an IAM role with permissions to access the underlying S3 locations of your external catalog.

Create an IAM role that enables the Glue Connection to access AWS Secrets Manager, VPC configurations (optional) and Lake formation to manage credential vending for S3 bucket/prefix.

Required permissions

  1. Secrets Manager access: The Glue connection requires permissions to retrieve secret values from Secrets Manager for OAuth tokens stored for your Snowflake service connection.
  2. Amazon Virtual Private Cloud (VPC) Access (optional): When using VPC endpoints to restrict connectivity to your Snowflake Open Catalog account, the Glue connection needs permissions to describe and use VPC network interfaces. This configuration ensures secure, controlled access to both your stored credentials and network resources while maintaining proper isolation through VPC endpoints.
  3. S3 bucket and AWS Key Management Service (KMS) key permission: The Glue connection requires S3 permissions to read certificates if used in the connection setup. Additionally, Lake Formation requires read permissions on the bucket/prefix where the remote catalog table data resides. If the data is encrypted using a KMS key, additional KMS permissions are required.

Setup steps:

Run the following command using AWS CLI by replacing the placeholder with your setup information:

Create a JSON file (e.g., trust-policy.json) with the following structure:

{
    "Version": "2012-10-17",
    "Statement": [
        {
            "Effect": "Allow",
            "Principal": {
                "Service": ["glue.amazonaws.com","lakeformation.amazonaws.com"]
            },
            "Action": "sts:AssumeRole"
        }
    ]
}

Use the aws iam create-role command, referencing the trust policy file:

aws iam create-role \
    --role-name LFDataAccessRole \
    --assume-role-policy-document file://<path_file_downloaded>/trust-policy.json 

First, create a JSON file (such as, permissions-policy.json) for the permissions:


{
"Version": "2012-10-17",
    "Statement": [
        {
            "Effect": "Allow",
            "Action": [
                "secretsmanager:GetSecretValue",
                "secretsmanager:DescribeSecret"
            ],
            "Resource": [
                "<secrets manager ARN>"
            ]
        },
        {
            "Effect": "Allow",
            "Action": [
                "ec2:CreateNetworkInterface",
                "ec2:DeleteNetworkInterface",
                "ec2:DescribeNetworkInterfaces"
            ],
            "Resource": "*",
            "Condition": {
                "ArnEquals": {
                    "ec2:Vpc": "arn:aws:ec2:region:account-id:vpc/<vpc-id>", 
                    "ec2:Subnet": [ 
                        "arn:aws:ec2:region:account-id:subnet/<subnet-id>"
                    ]
                }
            }
        },
        {
           # Required when using custom cert to sign requests.
            "Effect": "Allow",
            "Action": [
                "s3:GetObject"
            ],
            "Resource": [
                "arn:aws:s3:::<bucketname>/<certpath>"
            ]
        },
        { # Required when using customer managed encryption key for s3 
            "Effect": "Allow",
            "Action": [
                "kms:decrypt",
                "kms:encrypt"
            ],
            "Resource": [
                "<kmsKey>"
            ]
        }
    ]
}

Then, attach it to the role:

aws iam put-role-policy \
--role-name LFDataAccessRole \
--policy-name myaccesspolicies \
--policy-document file://<path_file_downloaded>/permissions- policy.json

Create federated catalog in Glue Data Catalog

AWS Glue supports the SNOWFLAKEICEBERGRESTCATALOG connection type for connecting Glue Data Catalog with Snowflake Horizon Catalog and Snowflake Open Catalog. This Glue connector supports OAuth2 authentication and includes additional configuration parameters like CASING_TYPE to customize how AWS Glue Data Catalog discovers metadata in the Snowflake Horizon Catalog accounts.

Log in to your AWS console as a data lake admin and open the AWS Lake Formation console.

  1. Choose Catalog in the left navigation pane and select Create catalog.
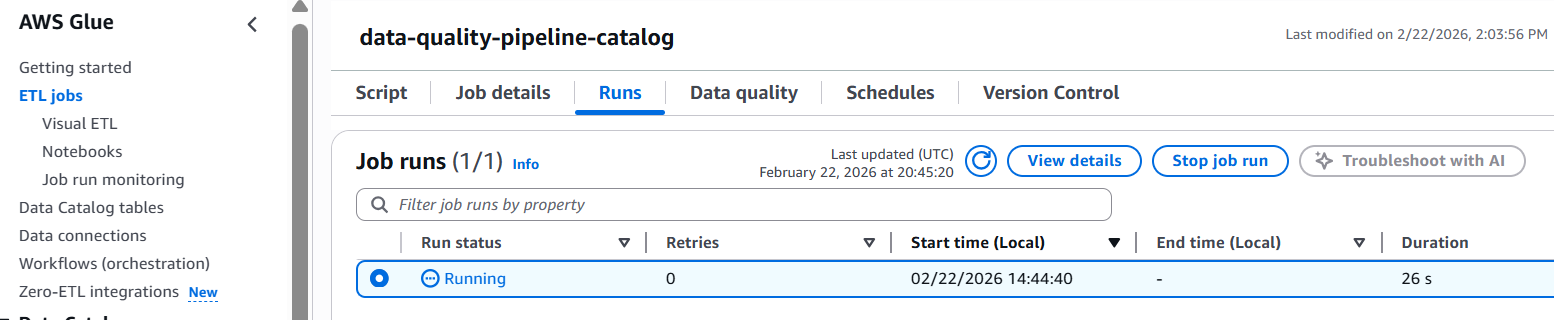
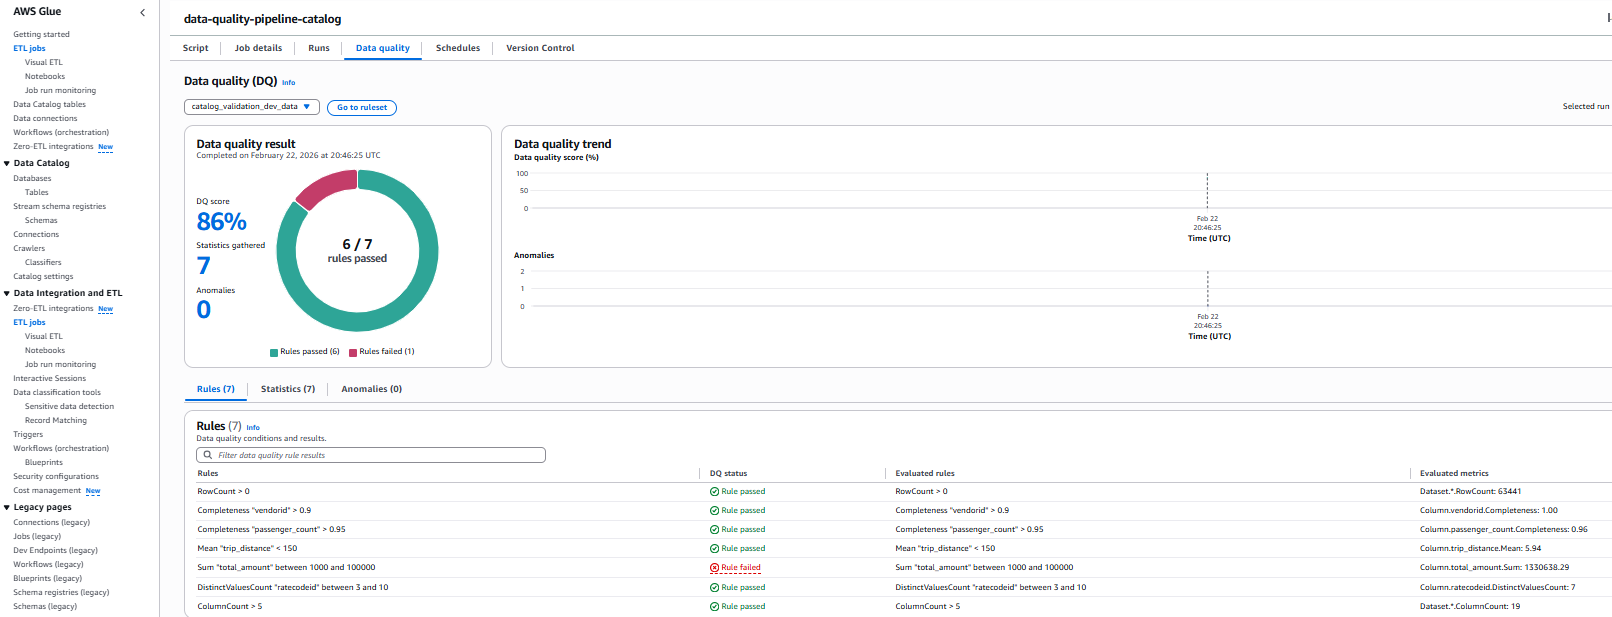
  2. Choose the data source as Snowflake Horizon Catalog.
    AWS Lake Formation console screenshot showing Step 1 of catalog creation wizard with five federation type options, Snowflake Horizon Catalog selected.
  3. Provide the following information:
    • Name: Name of the federated catalog in Glue Catalog. For this post, we use federated_lakehousedb
    • Catalog name in Snowflake: Catalog name existing in Snowflake Horizon Catalog, this should match exact name in Horizon catalog. For this post, we use LAKEHOUSEDB
    • For Connection details, choose New connection configurations:
      • Connection name: Name for the glue connection. For this post, we use federatedconnection1.
      • Workspace URL: Horizon IRC url (format: https://<account_identifier>.snowflakecomputing.com)
      • Casing type: choose Uppercase only
      • Authentication:
        • Authentication type: choose Custom. Alternatively, you can select OAuth2 authentication. For Custom authentication, an access token is created, refreshed, and managed by the customer’s application or system and stored using AWS Secrets Manager.
        • OAuth Secret: Provide the secret manager ARN that was created in the previous step.
  • If you have AWS PrivateLink setup and/or a proxy setup, you can provide network details under Settings for network configurations (optional).
  • For Register Glue connection with Lake Formation:
    • Choose the IAM role created earlier(LFDataAccessRole) to manage data access using Lake Formation.

To test the connection, choose Run test. After the connection information is validated, it shows as successful.

Green success banner displaying "Connection test successful" with checkmark icon, confirming valid AWS configuration.

You can now create the catalog by selecting Create catalog.

Alternatively, you can use AWS CLI to create connection and catalog using example commands:

aws glue create-connection \
--connection-input '{
"Name": "federatedconnection1",
"ConnectionType": "SNOWFLAKEICEBERGRESTCATALOG",
"ConnectionProperties": {
    "INSTANCE_URL": "<your-snowflake-account-URL>",
    "ROLE_ARN": "< ARN_of_LFDataAccessRole>",
    "CATALOG_CASING_FILTER": "UPPERCASE_ONLY"
},
"AuthenticationConfiguration": {
    "AuthenticationType": "CUSTOM",
    "SecretArn": "arn:aws:secretsmanager:<your-aws-region>:<your-aws-account-id>:secret:horizon-secret"
}
}' \
--region <your-aws-region>
aws lakeformation register-resource \
    --resource-arn <ARN_of_federatedconnection1_connection> \
    --role-arn <ARN_of_LFDataAccessRole> \
    --with-federation \
    --with-privileged-access \
    --region <your-aws-region>
aws glue create-catalog \
    --name federated_lakehousedb \
    --catalog-input '{
    "FederatedCatalog": {
        "Identifier": "LAKEHOUSEDB",
        "ConnectionName": “federatedconnection1 "
    },
    "CreateTableDefaultPermissions": [],
    "CreateDatabaseDefaultPermissions": []
}'

After the catalog is created, the Horizon databases and tables are listed under the federated catalog.

You can implement fine grained access control on the tables by applying row/column filter using Lake Formation.

Query the data using Athena query editor:

Open the Amazon Athena console and run the following query to access the federated Horizon table:

SELECT * FROM "public"."customer" limit 10;

Clean up

To clean up your resources, complete the following steps:

  1. Drop the Snowflake Database with Cascade.
  2. Drop External Volume created for Iceberg Tables on S3.
  3. Drop the resources in Glue Data Catalog and Lake Formation created for this post.
  4. Delete the IAM roles and S3 buckets used for this post.
  5. Delete any VPC, KMS keys if used for this post setup.

Conclusion

In this post, we demonstrated how to establish a secure connection between AWS Analytics services and Snowflake Horizon Catalog, enabling you to access your data from a single connected and governed view. You learned how to:

  • Configure catalog federation between AWS Glue Data Catalog and Snowflake Horizon Catalog
  • Set up OAuth2 authentication for secure access
  • Grant access to Iceberg table in Snowflake Horizon Catalog using AWS Lake Formation
  • Query federated tables using Amazon Athena

You can follow the same steps to establish a secure connection with open-source catalog options such as Snowflake Open Catalog, a managed service for Apache Iceberg. Remember to clean up any resources you created while following this tutorial to avoid ongoing charges.

To further explore this solution in your environment, consider the following resources:

These resources can help you to implement and optimize this integration pattern for your specific use case. As you begin this journey, remember to start small, validate your architecture with test data, and gradually scale your implementation based on your organization’s needs. Stay tuned for future workshops and resources.


About the authors


Andries Engelbrecht

Andries Engelbrecht

Andries is a Principal Partner Solutions Engineer at Snowflake working with AWS. He supports product and service integrations, as well the development of joint solutions with AWS. Andries has over 25 years of experience in the field of data and analytics.

Nidhi Gupta

Nidhi Gupta

Nidhi is a Senior Partner Solutions Architect at AWS, specializing in data analytics and AI. She helps customers and partners build and optimize Snowflake workloads on AWS. Nidhi has extensive experience leading development, production releases and deployments, with focus on Data, AI, ML, generative AI, and Advanced Analytics.

Srividya Parthasarathy

Srividya Parthasarathy

Srividya is a Senior Big Data Architect on the AWS Lake Formation team. She works with the product team and customers to build robust features and solutions for their analytical data platform. She enjoys building data mesh solutions and sharing them with the community.

Pratik Das

Pratik Das

Pratik is a Senior Product Manager with AWS Lake Formation. He is passionate about all things data and works with customers to understand their requirements and build delightful experiences. He has a background in building data-driven solutions and machine learning systems.


Optimizing storage performance for Amazon EKS on AWS Outposts

Post Syndicated from Arun Kumar original https://aws.amazon.com/blogs/compute/optimizing-storage-performance-for-amazon-eks-on-aws-outposts/

Amazon Elastic Kubernetes Service (Amazon EKS) on AWS Outposts brings the power of managed Kubernetes to your on-premises infrastructure. Use Amazon EKS on Outposts rack to create hybrid cloud deployments that maintain consistent AWS experiences across environments. As organizations increasingly adopt edge computing and hybrid architectures, storage optimization and performance tuning become critical for successful workload deployment.

Outposts extend AWS infrastructure, services, APIs, and tools to virtually any datacenter, co-location space, or on-premises facility. In this blog post you will learn about your storage options and their performance characteristics which is essential for building resilient, high-performing applications using Amazon EKS on Outposts.

Amazon EKS on Outposts deployment options

The following two sections outline the differences between Amazon EKS extended and local cluster deployment options available on Outposts.

Amazon EKS extended cluster architecture

Amazon EKS extended clusters on Outposts provide a powerful solution for organizations seeking to use the benefits of Kubernetes while maintaining certain workloads on-premises, as shown in the following figure. This hybrid architecture allows businesses to extend their EKS clusters from the AWS Cloud to their own data centers or edge locations using Outposts. The Kubernetes control plane remains in the AWS Region, providing centralized management and benefiting from the AWS infrastructure in the cloud and on the Outpost.

Outposts is designed to be a connected service, and needs reliable network connectivity to the AWS Region using the Outposts service link.

Figure 1 : Extended cluster

Amazon EKS local cluster architecture

Amazon EKS local clusters deploy the Kubernetes control plane on your Outpost, as shown in the following figure. This provides greater network resilience against outages as cluster operations run entirely on the Outposts and reduces the dependency on network connectivity to the AWS Region. Having the Kubernetes control plane hosted on your Outpost also reduces latency for cluster operations.

  Figure 2: Local cluster

Storage options for Amazon EKS extended clusters on Outposts

Persistent Volumes (PV) and Persistent Volume Claims (PVC) serve as a critical abstraction layer in Kubernetes, separating the storage consumption details from storage provisioning, and allowing administrators to manage storage resources independently from how applications consume them. PVs and PVCs make sure of data persistence across pod restarts and rescheduling events, making them essential for applications that need to maintain state, such as databases, file storage systems, and other data-intensive workloads. The abstraction provided by PV and PVC enables platform-agnostic storage management, where applications can request storage through PVCs without needing to know the underlying storage implementation details. PVs and PVCs support dynamic provisioning through Storage Classes, allowing for automated storage allocation based on application demands, while also providing features such as access modes, capacity management, and reclaim policies to effectively manage the storage lifecycle in a Kubernetes cluster.

Integrating Amazon EBS with Amazon EKS

Amazon Elastic Block Store (Amazon EBS) provides high-performance block storage that’s ideal for low-latency applications providing consistent performance. When deployed on Outposts racks, EBS volumes are stored on the Outposts hardware, providing significant performance advantages over network-attached storage solutions, as shown in the following figure.

Figure 3 : Integrating Amazon EBS with Amazon EKS on Outposts

Benefits and use cases

  • Storage: EBS volumes on Outposts racks provide data access without dependency on external connectivity.
  • Performance: Local storage delivers consistent latency and high IOPS/throughput.
  • Cost: On-premises storage eliminates data transfer costs and reduces bandwidth needs, lowering the total cost of ownership.

Implementation considerations

Consider the following when using EBS on Outposts rack:

  • EBS volumes on Outposts are tied to a single rack and the availability zone the Outpost is homed to, needing applications to address single-point-of-failure risks.
  • Protect data using EBS snapshots in the parent Region and schedule regular backups.
  • Capacity on Outposts is finite, monitor Outposts storage usage and plan expansions proactively to avoid insufficient capacity errors.

Refer to Dynamic Volume Provisioning to learn more about deploying pod with the EBS volume attached.

Amazon EFS with Amazon EKS

Amazon Elastic File System (Amazon EFS) provides scalable, shared file storage that can be accessed across multiple AWS Availability Zones (AZs) and on-premises environments. Although Amazon EFS with Amazon EKS on Outposts maintains the same setup procedures as standard cloud deployments, there is a critical dependency on the service link connection between your Outposts and the AWS Region. Amazon EFS is not a locally supported service on Outposts, so connectivity to the AWS Region is required to use this service with your Outpost.

Amazon EFS allows multiple pods to concurrently access shared file systems. It is well-suited for applications that need collaborative data access, content management, and distributed processing workloads.

Amazon EFS as a persistent storage solution for Amazon EKS extended cluster instances

Amazon EFS as a PV for your Amazon EKS extended cluster operates through a hybrid architecture where the Amazon EFS file system resides in the Region, but mount points can be created on the worker nodes running on Outposts subnets through the service link as shown in the following figure.

Figure 4 : Amazon EFS as a persistent storage solution for extended clusters

Benefits and use cases

  • Shared storage capabilities: multiple pods can access a centralized file system, enabling shared data, code, and assets across instances.
  • Scalability: storage capacity and performance automatically scale with usage, eliminating manual provisioning and upfront planning.
  • Compliance: Amazon EFS provides full file system features and compatibility for traditional applications, such as locking, permissions, and directory structure.

Challenges and limitations

Consider the following when using Amazon EFS with Outposts:

  • Network latency: file access involves network traversal to Amazon EFS in the Region, adding more latency and making small or metadata operations potentially slow for latency-sensitive applications.
  • Throughput: aggregate throughput is restricted by the available bandwidth on the service link between the Outposts and AWS Region. This impacts concurrent access and large file transfers during peak usage.
  • Dependency on AWS Region connectivity: Amazon EFS needs continuous connectivity to the parent Region. Disruptions may affect file system availability, operations, and disaster recovery processes.
  • Data Transfer charges: Since EFS is in AWS Parent region and EKS worker nodes and pods are in Outpost additional charges are applicable.

You can refer to Amazon EFS Features and When to Choose Amazon EFS for more detailed insights into its capabilities and use cases.

Deploying pods on extended clusters using Amazon EFS as PV

Refer to Use Elastic File System Storage with Amazon EFS for deployment guidance. Note, Create Amazon EFS mount targets in subnets that are in the same Availability Zone (AZ) as the Outposts subnets.

Amazon S3 with Amazon EKS extended cluster

Amazon Simple Storage Service (Amazon S3) on Outposts delivers local object storage on your Outposts, allowing applications to use Amazon S3 APIs for storing and retrieving data while keeping it onsite. It is ideal for workloads that need Amazon S3 compatibility, low latency access to object data, and local data residency.

You should use Amazon S3 access point Amazon Resource Names (ARNs) and not bucket ARNs for proper integration with Amazon EKS workloads.

Learn more about Amazon S3 on Outposts.

Figure 5 : Amazon S3 with Amazon EKS extended cluster on Outposts

Benefits and use cases

  • Data archiving and compliance: Enables cost-effective, locally retained storage for logs, audit trails, regulatory compliance, backups, and sensitive healthcare data with strict residency requirements.
  • Content distribution and media: Provides ultra-low latency local storage for serving static content, media streaming, digital asset management, and gaming asset delivery.
  • Data lake and analytics: Supports local data processing for analytics, ETL, machine learning (ML), real-time Internet of Things (IoT) data handling, and business intelligence with reduced latency and transfer costs.
  • Application integration: Seamlessly integrates with Amazon S3 compatible apps for backup, synchronization, microservices storage, API-driven workflows, and container image management on-premises.

Refer to How is Amazon S3 on Outposts different from Amazon S3 and the Amazon S3 on Outposts documentation to learn more.

Deploying pods on extended clusters using Amazon S3 as PV

Step 1: Create Amazon S3 on Outposts bucket
Step 2: Create Amazon S3 Access Point (necessary for Amazon EKS integration)
Step 3: Configure IAM roles and policies
Step 4: Install Amazon S3 CSI driver
Step 5: Deploying your pod with Amazon S3 volume attached
Step 6: Complete Amazon S3 configuration with Kubernetes

Refer to the documentation Static Provisioning on Outposts bucket for more details on Step 5.

Best practices for optimizing performance

Optimizing performance starts with selecting the right storage type for your workload: Amazon EBS for low-latency, high-throughput block storage; Amazon EFS for shared POSIX-compliant file systems; and Amazon S3 for scalable object storage with API compatibility. Ensure proper volume sizing, monitor usage proactively, and configure CPU and memory requests accurately to balance performance and efficiency—auto scaling and QoS classes can further optimize resource management. Improve data locality by using local storage, apply caching with intelligent eviction, and design for efficient, asynchronous, and compressed data access patterns.
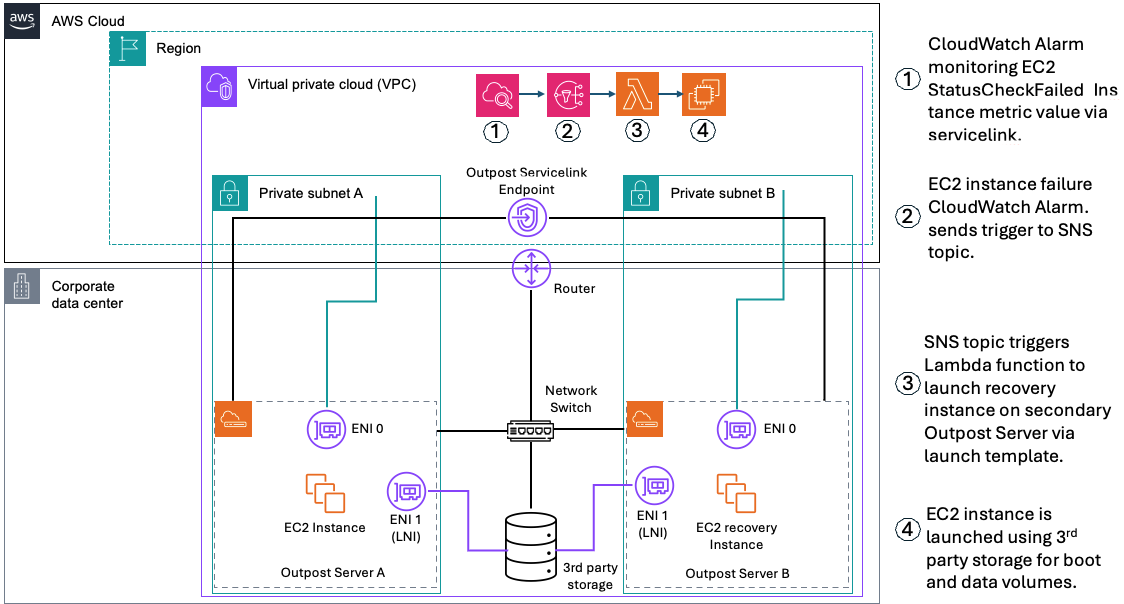
Monitoring and observability

Monitoring key performance metrics is essential to maintain storage efficiency and application reliability. For Amazon EBS, track IOPS, throughput, latency, burst balance, queue depth, and snapshot performance to avoid degradation—see the Amazon CloudWatch metrics for Amazon EBS for the full list. For Amazon EFS, monitor total I/O, throughput, client connections, metadata operations, burst credits, and Regional data transfers to support effective capacity planning—refer to CloudWatch metrics for Amazon EFS. For Amazon S3, observe request and error rates, data transfer, storage usage, latency, multipart upload efficiency, and access patterns to optimize performance and cost—see Metrics and dimensions.
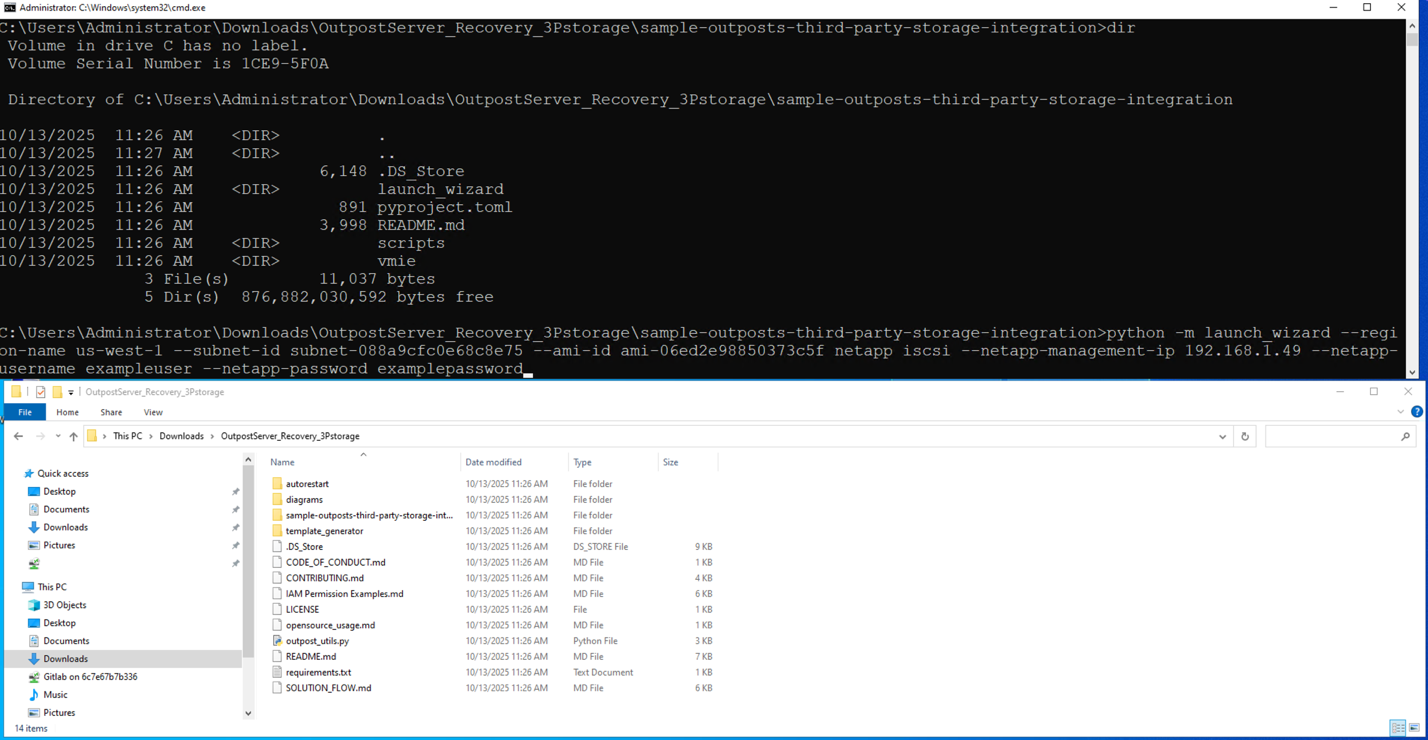
Security considerations

Strong security practices are critical for Amazon EKS on Outposts. Use AWS Key Management Service (AWS KMS) for Amazon EBS encryption, encrypt Amazon EFS data at rest and in transit, and enable server- or client-side encryption for Amazon S3. Enforce TLS for all data transfers and apply key rotation with compliance controls. Implement least privilege IAM policies, scoped roles, and Kubernetes Role-Based Access Control (RBAC) for granular pod access. Secure traffic with security groups and NACLs, and maintain audit logs for all storage operations.

Cost optimization strategies

Manage storage costs by right-sizing volumes, automating lifecycle policies, selecting appropriate storage classes, monitoring data transfer, and using de-duplication and compression where applicable. Lower operational expenses through automated backups, infrastructure as code (IaC), monitoring automation, leveraging managed services, applying cost allocation tags, and conducting regular usage reviews.

Conclusion

Amazon EKS on Outposts empowers organizations to build hybrid applications with storage options that align to performance, compliance, and data residency needs. By selecting the right storage solution for each workload and leveraging Outposts’ local infrastructure, you can reduce latency, minimize network dependencies, and maintain consistency across environments. As Outposts capabilities continue to evolve, they offer a strong foundation for modern, resilient, and cost-efficient hybrid cloud architectures.

Reach out to your AWS account team, or fill out this form to learn more about running containarized applications on Outposts.

Streamline security response at scale with AWS Security Hub automation

Post Syndicated from Ahmed Adekunle original https://aws.amazon.com/blogs/security/streamline-security-response-at-scale-with-aws-security-hub-automation/

A new version of AWS Security Hub, is now generally available, introducing new ways for organizations to manage and respond to security findings. The enhanced Security Hub helps you improve your organization’s security posture and simplify cloud security operations by centralizing security management across your Amazon Web Services (AWS) environment. The new Security Hub transforms how organizations handle security findings through advanced automation capabilities with real-time risk analytics, automated correlation, and enriched context that you can use to prioritize critical issues and reduce response times. Automation also helps ensure consistent response procedures and helps you meet compliance requirements.

AWS Security Hub CSPM (cloud security posture management) is now an integral part of the detection engines for Security Hub. Security Hub provides centralized visibility across multiple AWS security services to give you a unified view of your cloud environment, including risk-based prioritization views, attack path visualization, and trend analytics that help you understand security patterns over time.

This is the third post in our series on the new Security Hub capabilities. In our first post, we discussed how Security Hub unifies findings across AWS services to streamline risk management. In the second post, we shared the steps to conduct a successful Security Hub proof of concept (PoC).

In this post, we explore how you can enhance your security operations using AWS Security Hub automation rules and response automation.

We walk through the setup and configuration of automation rules, share best practices for creating effective response workflows, and provide real-world examples of how these tools can be used to automate remediation, escalate high-severity findings, and support compliance requirements.

Security Hub automation enables automatic response to security findings to help ensure critical findings reach the right teams quickly, so that they can reduce manual effort and response time for common security incidents while maintaining consistent remediation processes.

Note: Automation rules evaluate new and updated findings that Security Hub generates or ingests after you create them, not historical findings. These automation capabilities help ensure critical findings reach the right teams quickly.

Why automation matters in cloud security

Organizations often operate across hundreds of AWS accounts, multiple AWS Regions, and diverse services—each producing findings that must be triaged, investigated, and acted upon. Without automation, security teams face high volumes of alerts, duplication of effort, and the risk of delayed responses to critical issues.

Manual processes can’t keep pace with cloud operations; automation helps solve this by changing your security operations in three ways. Automation filters and prioritizes findings based on your criteria, showing your team only relevant alerts. When issues are detected, automated responses trigger immediately—no manual intervention needed.

If you’re managing multiple AWS accounts, automation applies consistent policies and workflows across your environment through centralized management, shifting your security team from chasing alerts to proactively managing risk before issues escalate.

Designing routing strategies for security findings

With Security Hub configured, you’re ready to design a routing strategy for your findings and notifications. When designing your routing strategy, ask whether your existing Security Hub configuration meets your security requirements. Consider whether Security Hub automations can help you meet security framework requirements like NIST 800-53 and identify KPIs and metrics to measure whether your routing strategy works.

Security Hub automation rules and automated responses can help you meet the preceding requirements, however it’s important to understand how your compliance teams, incident responders, security operations personnel, and other security stakeholders operate on a day-to-day basis. For example, do teams use the AWS Management Console for AWS Security Hub regularly? Or do you need to send most findings downstream to an IT systems management (ITSM) tool (such as Jira or ServiceNow) or third-party security orchestration, automation, and response (SOAR) platforms for incident tracking, workflow management, and remediation?

Next, create and maintain an inventory of critical applications. This helps you adjust finding severity based on business context and your incident response playbooks.

Consider the scenario where Security Hub identifies a medium-severity vulnerability on an Elastic Compute Cloud instance. In isolation, this might not trigger immediate action. When you add business context—such as strategic objectives or business criticality—you might discover that this instance hosts a critical payment processing application, revealing the true risk. By implementing Security Hub automation rules with enriched context, this finding can be upgraded to critical severity and automatically routed to ServiceNow for immediate tracking. In addition, by using Security Hub automation with Amazon EventBridge, you can trigger an AWS Systems Manager Automation document to isolate the EC2 instance for security forensics work to then be carried out.

Because Security Hub offers OCSF format and schema, you can use the extensive schema elements that OCSF offers you to target findings for automation and help your organization meet security strategy requirements.

Example use cases

Security Hub automation supports many use cases. Talk with your teams to understand which fit your needs and security objectives. The following are some examples of how you can use security hub automation:

Automated finding remediation

Use automated finding remediation to automatically fix security issues as they’re detected.

Supporting patterns:

  • Direct remediation: Trigger AWS Lambda functions to fix misconfigurations
  • Resource tagging: Add tags to non-compliant resources for tracking
  • Configuration correction: Update resource configurations to match security policies
  • Permission adjustment: Modify AWS Identity and Access Management (IAM) policies to remove excessive permissions

Example:

  • IF finding.type = “Software and Configuration Checks/Industry and Regulatory Standards/CIS AWS Foundations Benchmark”
  • AND finding.title CONTAINS “S3 buckets should have server-side encryption enabled”
  • THEN invoke Lambda function “enable-s3-encryption”

Security finding workflow integration

Integrate findings into your workflow by routing them to the appropriate teams and systems.

Supporting patterns:

  • Ticket creation: Generate JIRA or ServiceNow tickets for manual review
  • Team assignment: Route findings to specific teams based on resource ownership
  • Severity-based routing: Direct critical findings to incident response, others to regular queues
  • Compliance tracking: Send compliance-related findings to GRC systems

Example:

  • IF finding.severity = “CRITICAL” AND finding.productName = “Amazon GuardDuty”
  • THEN send to SNS topic “security-incident-response-team”
  • ELSE IF finding.productFields.resourceOwner = “payments-team”
  • THEN send to SNS topic “payments-security-review”

Automated finding enrichment

Use finding enrichment to add context to findings to improve triage efficiency.

Supporting patterns:

  • Resource context addition: Add business context, owner information, and data classification
  • Historical analysis: Add information about previous similar findings
  • Risk scoring: Calculate custom risk scores based on asset value and threat context
  • Vulnerability correlation: Link findings to known Common Vulnerabilities and Exposures (CVEs) or threat intelligence

Example:

  • IF finding.type CONTAINS “Vulnerability/CVE”
  • THEN invoke Lambda function “enrich-with-threat-intelligence”

Custom security controls

Use custom security controls to meet organization-specific security requirements.

Supporting patterns:

  • Custom policy enforcement: Check for compliance with internal standards
  • Business-specific rules: Apply rules based on business unit or application type
  • Compensating controls: Implement alternatives when primary controls can’t be applied
  • Temporary exceptions: Handle approved deviations from security standards

Example:

  • IF finding.resourceType = “AWS::EC2::Instance” AND
    • finding.resourceTags.Environment = “Production” AND
    • finding.title CONTAINS “vulnerable software version”
  • THEN invoke Lambda function “enforce-patching-policy”

Compliance reporting and evidence collection

Streamline compliance documentation and evidence gathering.

Supporting patterns:

  • Evidence capture: Store compliance evidence in designated S3 buckets
  • Audit trail creation: Document remediation actions for auditors
  • Compliance dashboarding: Update compliance status metrics
  • Regulatory mapping: Tag findings with relevant compliance frameworks

Example:

  • IF finding.complianceStandards CONTAINS “PCI-DSS”
  • THEN invoke Lambda function “capture-pci-compliance-evidence”
  • AND send to SNS topic “compliance-team-notifications”

Set up Security Hub automation

In this section, you’ll walk through enabling up Security Hub and related services and creating automation rules.

Step 1: Enable Security Hub and integrated services

As the first step, follow the instructions in Enable Security Hub.

Note: Security Hub is powered by Amazon GuardDuty, Amazon Inspector, AWS Security Hub CSPM, and Amazon Macie, and these services also need to be enabled to get value from Security Hub.

Step 2: Create automation rules to update finding details and third-party integration

After Security Hub collects findings you can create automation rules to update and route the findings to the appropriate teams. The steps to create automation rules that update finding details or to a set up a third-party integration—such as Jira or ServiceNow—based on criteria you define can be found in Creating automation rules in Security Hub.

With automation rules, Security Hub evaluates findings against the defined rule and then makes the appropriate finding update or calls the APIs to send findings to Jira or ServiceNow. Security Hub sends a copy of every finding to Amazon EventBridge so that you can also implement your own automated response (if needed) for use cases outside of using Security Hub automation rules.

In addition to sending a copy of every finding to EventBridge, Security Hub classifies and enriches security findings according to business context, then delivers them to the appropriate downstream services (such as ITSM tools) for fast response.

Best practices

AWS Security Hub automation rules offer capabilities for automatically updating findings and integrating with other tools. When implementing automation rules, follow these best practices:

  • Centralized management: Only the Security Hub administrator account can create, edit, delete, and view automation rules. Ensure proper access control and management of this account.
  • Regional deployment: Automation rules can be created in one AWS Region and then applied across configured Regions. When using Region aggregation, you can only create rules in the home Region. If you create an automation rule in an aggregation Region, it will be applied in all included Regions. If you create an automation rule in a non-linked Region, it will be applied only in that Region. For more information, see Creating automation rules in Security Hub.
  • Define specific criteria: Clearly define the criteria that findings must match for the automation rule to apply. This can include finding attributes, severity levels, resource types, or member account IDs.
  • Understand rule order: Rule order matters when multiple rules apply to the same finding or finding field. Security Hub applies rules with a lower numerical value first. If multiple findings have the same RuleOrder, Security Hub applies a rule with an earlier value for the UpdatedAt field first (that is, the rule which was most recently edited applies last). For more information, see Updating the rule order in Security Hub.
  • Provide clear descriptions: Include a detailed rule description to provide context for responders and resource owners, explaining the rule’s purpose and expected actions.
  • Use automation for efficiency: Use automation rules to automatically update finding fields (such as severity and workflow status), suppress low-priority findings, or create tickets in third-party tools such as Jira or ServiceNow for findings matching specific attributes.
  • Consider EventBridge for external actions: While automation rules handle internal Security Hub finding updates, use EventBridge rules to trigger actions outside of Security Hub, such as invoking Lambda functions or sending notifications to Amazon Simple Notification Service (Amazon SNS) topics based on specific findings. Automation rules take effect before EventBridge rules are applied. For more information, see Automation rules in EventBridge.
  • Manage rule limits: This is a maximum limit of 100 automation rules per administrator account. Plan your rule creation strategically to stay within this limit.
  • Regularly review and refine: Periodically review automation rules, especially suppression rules, to ensure they remain relevant and effective, adjusting them as your security posture evolves.

Conclusion

You can use Security Hub automation to triage, route, and respond to findings faster through a unified cloud security solution with centralized management. In this post, you learned how to create automation rules that route findings to ticketing systems integrations and upgrade critical findings for immediate response. Through the intuitive and flexible approach to automation that Security Hub provides, your security teams can make confident, data-driven decisions about Security Hub findings that align with your organization’s overall security strategy.

With Security Hub automation features, you can centrally manage security across hundreds of accounts while your teams focus on critical issues that matter most to your business. By implementing the automation capabilities described in this post, you can streamline response times at scale, reduce manual effort, and improve your overall security posture through consistent, automated workflows.

If you have feedback about this post, submit comments in the Comments section. If you have questions about this post, start a new thread on AWS Security, Identity, and Compliance re:Post or contact AWS Support.
 

Ahmed Adekunle
Ahmed Adekunle

Ahmed is a Security Specialist Solutions Architect focused on detection and response services at AWS. Before AWS, his background was in business process management and AWS technology consulting, helping customers use cloud technology to transform their business. Outside of work, Ahmed enjoys playing soccer, supporting less privileged activities, traveling, and eating spicy food, specifically African cuisine.
Alex Wadell
Alex Wadell

Alex is a Senior Security Specialist Solutions Architect at AWS based in Scotland. Alex provides security architectural guidance and operational best practices to customers of all sizes, helping them implement AWS security services. When not working, Alex enjoys spending time sampling rum from around the world, walking his dogs in the local forest trails, and traveling.
Kyle Shields
Kyle Shields

Kyle is a WW Security Specialist Solutions Architect at AWS focused on threat detection and incident response. With over 10 years in cybersecurity and more than 20 years of Army service, he helps customers build effective incident response capabilities while implementing information and cyber security best practices.