Tag Archives: Amazon Simple Queue Service (SQS)

Implementing AWS Well-Architected best practices for Amazon SQS – Part 1

Post Syndicated from Pascal Vogel original https://aws.amazon.com/blogs/compute/implementing-aws-well-architected-best-practices-for-amazon-sqs-part-1/

This blog is written by Chetan Makvana, Senior Solutions Architect and Hardik Vasa, Senior Solutions Architect.

Amazon Simple Queue Service (Amazon SQS) is a fully managed message queuing service that makes it easy to decouple and scale microservices, distributed systems, and serverless applications. AWS customers have constantly discovered powerful new ways to build more scalable, elastic, and reliable applications using SQS. You can leverage SQS in a variety of use-cases requiring loose coupling and high performance at any level of throughput, while reducing cost by only paying for value and remaining confident that no message is lost. When building applications with Amazon SQS, it is important to follow architectural best practices.

To help you identify and implement these best practices, AWS provides the AWS Well-Architected Framework for designing and operating reliable, secure, efficient, cost-effective, and sustainable systems in the AWS Cloud. Built around six pillars—operational excellence, security, reliability, performance efficiency, cost optimization, and sustainability, AWS Well-Architected provides a consistent approach for customers and partners to evaluate architectures and implement scalable designs.

This three-part blog series covers each pillar of the AWS Well-Architected Framework to implement best practices for SQS. This blog post, part 1 of the series, discusses best practices using the Operational Excellence Pillar of the AWS Well-Architected Framework.

See also the other two parts of the series:

Solution overview

Solution architecture for Inventory Updates Process

This solution architecture shows an example of an inventory management system. The system leverages Amazon Simple Storage Service (Amazon S3), AWS Lambda, Amazon SQS, and Amazon DynamoDB to streamline inventory operations and ensure accurate inventory levels. The system handles frequent updates from multiple sources, such as suppliers, warehouses, and retail stores, which are received as CSV files.

These CSV files are then uploaded to an S3 bucket, consolidating and securing the inventory data for the inventory management system’s access. The system uses a Lambda function to read and parse the CSV file, extracting individual inventory update records. The backend Lambda function transforms each inventory update record into a message and sends it to an SQS queue. Another Lambda function continually polls the SQS queue for new messages. Upon receiving a message, it retrieves the inventory update details and updates the inventory levels in DynamoDB accordingly.

This ensures that the inventory quantities for each product are accurate and reflect the latest changes. This way, the inventory management system provides real-time visibility into inventory levels across different locations and suppliers, enabling the company to monitor product availability with precision. Find the example code for this solution in the GitHub repository.

This example is used throughout this blog series to highlight how SQS best practices can be implemented based on the AWS Well Architected Framework.

Operational Excellence Pillar

The Operational Excellence Pillar includes the ability to support development and run workloads effectively, gain insight into their operation, and continuously improve supporting processes and procedures to deliver business value. To achieve operational excellence, the pillar recommends best practices such as defining workload metrics and implementing transaction traceability. This enables organizations to gain valuable insights into their operations, identify potential issues, and optimize services accordingly to improve customer experience. Furthermore, understanding the health of an application is critical to ensuring that it is functioning as expected.

Best practice: Use infrastructure as code to deploy SQS

Infrastructure as Code (IaC) helps you model, provision, and manage your cloud resources. One of the primary advantages of IaC is that it simplifies infrastructure management. With IaC, you can quickly and easily replicate your environment to multiple AWS Regions with a single turnkey solution. This makes it easy to manage your infrastructure, regardless of where your resources are located. Additionally, IaC enables you to create, deploy, and maintain infrastructure in a programmatic, descriptive, and declarative way repeatably. This reduces errors caused by manual processes, such as creating resources in the AWS Management Console. With IaC, you can easily control and track changes in your infrastructure, which makes it easier to maintain and troubleshoot your systems.

For managing SQS resources, you can use different IaC tools like AWS Serverless Application Model (AWS SAM), AWS CloudFormation, or AWS Could Development Kit (AWS CDK). There are also third-party solutions for creating SQS resources, such as the Serverless Framework. AWS CDK is a popular choice because it allows you to provision AWS resources using familiar programming languages such as Python, Java, TypeScript, Go, JavaScript, and C#/.Net.

This blog series showcases the use of AWS CDK with Python to demonstrate best practices for working with SQS. For example, the following AWS CDK code creates a new SQS queue:

from aws_cdk import (
    Duration,
    Stack,
    aws_sqs as sqs,
)
from constructs import Construct


class SqsCdBlogStack(Stack):
    def __init__(self, scope: Construct, construct_id: str, **kwargs) -> None:
        super().__init__(scope, construct_id, **kwargs)

        # The code that defines your stack goes here

        # example resource
        queue = sqs.Queue(
            self,
            "InventoryUpdatesQueue",
            visibility_timeout=Duration.seconds(300),
        )

Best practice: Configure CloudWatch alarms for ApproximateAgeofOldestMessage

It is important to understand Amazon CloudWatch metrics and dimensions for SQS, to have a plan in place to assess its behavior, and to add custom metrics where necessary. Once you have a good understanding of the metrics, it is essential to identify the key metrics that are most relevant to your use case and set up appropriate alerts to monitor them.

One of the key metrics that SQS provides is the ApproximateAgeOfOldestMessage metric. By monitoring this metric, you can determine the age of the oldest message in the queue, and take appropriate action to ensure that messages are processed in a timely manner. To set up alerts for the ApproximateAgeOfOldestMessage metric, you can use CloudWatch alarms. You configure these alarms to issue alerts when messages remain in the queue for extended periods of time. You can use these alerts to act, for instance by scaling up consumers to process messages more quickly or investigating potential issues with message processing.

In the inventory management example, leveraging the ApproximateAgeOfOldestMessage metric provides valuable insights into the health and performance of the SQS queue. By monitoring this metric, you can detect processing delays, optimize performance, and ensure that inventory updates are processed within the desired timeframe. This ensures that your inventory levels remain accurate and up-to-date. The following code creates an alarm which is triggered if the oldest inventory updates request is in the queue for more than 30 seconds.

# Create a CloudWatch alarm for ApproximateAgeOfOldestMessage metric
alarm = cloudwatch.Alarm(
	self,
	"OldInventoryUpdatesAlarm",
	alarm_name="OldInventoryUpdatesAlarm",
	metric=queue.metric_approximate_age_of_oldest_message(),
	threshold=600,  # Specify your desired threshold value in seconds
	evaluation_periods=1,
	comparison_operator=cloudwatch.ComparisonOperator.GREATER_THAN_OR_EQUAL_TO_THRESHOLD,
)

Best practice: Add a tracing header while sending a message to the queue to provide distributed tracing capabilities for faster troubleshooting

By implementing distributed tracing, you can gain a clear understanding of the flow of messages in SQS queues, identify any bottlenecks or potential issues, and proactively react to any signals that indicate an unhealthy state. Tracing provides a wider continuous view of an application and helps to follow a user journey or transaction through the application.

AWS X-Ray is an example of a distributed tracing solution that integrates with Amazon SQS to trace messages that are passed through an SQS queue. When using the X-Ray SDK, SQS can propagate tracing headers to maintain trace continuity and enable tracking, analysis, and debugging throughout downstream services. SQS supports tracing headers through the Default HTTP header and the AWSTraceHeader System Attribute. AWSTraceHeader is available for use even when auto-instrumentation through the X-Ray SDK is not, for example, when building a tracing SDK for a new language. If you are using a Lambda downstream consumer, trace context propagation is automatic.

In the inventory management example, by utilizing distributed tracing with X-Ray for SQS, you can gain deep insights into the performance, behavior, and dependencies of the inventory management system. This visibility enables you to optimize performance, troubleshoot issues more effectively, and ensure the smooth and efficient operation of the system. The following code sets up a CSV processing Lambda function and a backend processing Lambda function with active tracing enabled. The Lambda function automatically receives the X-Ray TraceId from SQS.

# Create pre-processing Lambda function
csv_processing_to_sqs_function = _lambda.Function(
    self,
    "CSVProcessingToSQSFunction",
    runtime=_lambda.Runtime.PYTHON_3_8,
    code=_lambda.Code.from_asset("sqs_blog/lambda"),
    handler="CSVProcessingToSQSFunction.lambda_handler",
    role=role,
    tracing=Tracing.ACTIVE,  # Enable active tracing with X-Ray
)

# Create a post-processing Lambda function with the specified role
sqs_to_dynamodb_function = _lambda.Function(
    self,
    "SQSToDynamoDBFunction",
    runtime=_lambda.Runtime.PYTHON_3_8,
    code=_lambda.Code.from_asset("sqs_blog/lambda"),
    handler="SQSToDynamoDBFunction.lambda_handler",
    role=role,
    tracing=Tracing.ACTIVE,  # Enable active tracing with X-Ray
)

Conclusion

This blog post explores best practices for SQS with a focus on the Operational Excellence Pillar of the AWS Well-Architected Framework. We explore key considerations for ensuring the smooth operation and optimal performance of applications using SQS. Additionally, we explore the advantages of infrastructure as code in simplifying infrastructure management and showcase how AWS CDK can be used to provision and manage SQS resources.

The next part of this blog post series addresses the Security Pillar and Reliability Pillar of the AWS Well-Architected Framework and explores best practices for SQS.

For more serverless learning resources, visit Serverless Land.

AWS Week in Review – Automate DLQ Redrive for SQS, Lambda Supports Ruby 3.2, and More – June 12, 2023

Post Syndicated from Marcia Villalba original https://aws.amazon.com/blogs/aws/aws-week-in-review-automate-dlq-redrive-for-sqs-lambda-supports-ruby-3-2-and-more-june-12-2023/

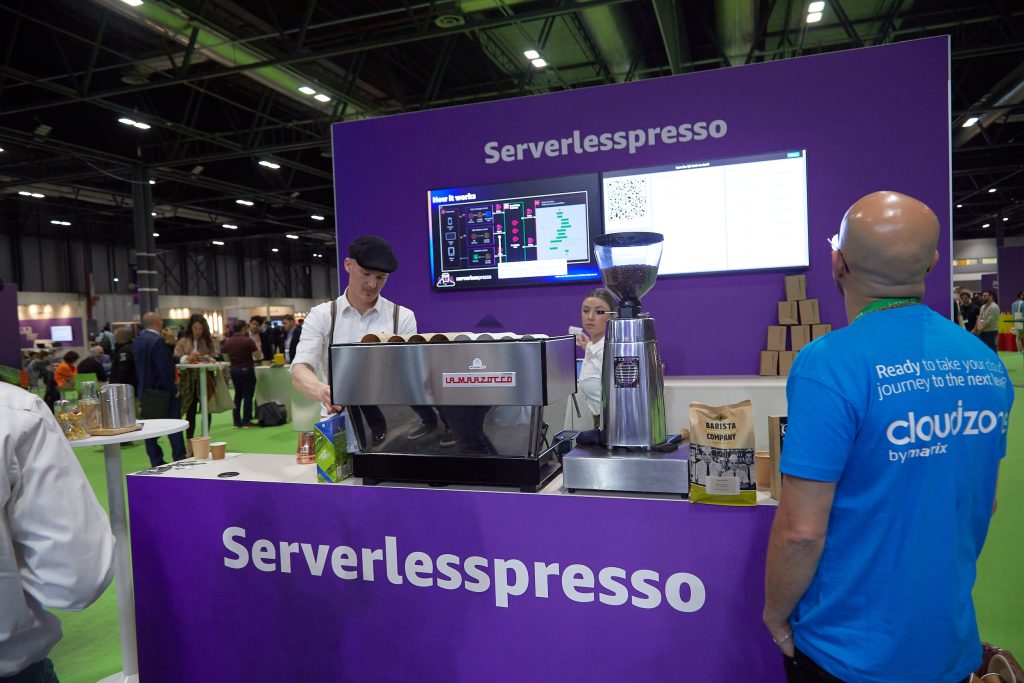
Today I’m boarding a plane for Madrid. I will attend the AWS Summit Madrid this Thursday, and I will take Serverlesspresso with me. Serverlesspresso is a demo that we take to events, in where you can learn how to build event-driven architectures with serverless. If you are visiting an AWS Summit, most probably you will find one of our booths.

Serverlesspresso at Madrid

Last Week’s Launches
Here are some launches that got my attention during the previous week.

Amazon SQS – Customers were very excited when we announced the DLQ redrive for Amazon SQS as that feature helped them to easily redirect the failed messages. This week we added support for AWS SDK and CLI for this feature, allowing you to redrive the messages on the DLQ automatically, making it even easier to use this feature. You can read Seb’s blog post about this new feature to learn how to get started.

AWS Lambda – AWS Lambda now supports Ruby 3.2. Ruby 3.2 has many new improvements, for example, passing anonymous arguments to functions or having endless methods. Check out this blog post that goes in depth into each of the new features.

Amazon Fraud DetectorAmazon Fraud Detector supports event orchestration with Amazon EventBridge. This is a very important feature because now you can act on the different events that Fraud Detector emits, for example, send notifications to different stakeholders.

AWS Glue – This week, AWS Glue made two important announcements. First, it announced the general availability of AWS Glue for Ray, a new data integration engine option for AWS Glue. Ray is a popular new open-source compute framework that helps developers to scale their Python workloads. In addition, AWS Glue announced AWS Glue Data Quality, a new capability that automatically measures and monitors data lake and data pipeline quality.

Amazon Elastic Container Registry (Amazon ECR)AWS Signer and Amazon ECR announced a new feature that allows you to sign and verify container images. You can use Signer to validate that only container images you have approved are deployed in your Amazon Elastic Kubernetes Service (Amazon EKS) clusters.

Amazon QuickSightAmazon QuickSight now supports APIs to automate asset deployment, so you can replicate the same QuickSight assets in multiple Regions and account easily. You can read more on how to use those APIs in this blog post.

For a full list of AWS announcements, be sure to keep an eye on the What’s New at AWS page.

Other AWS News
Some other updates and news that you may have missed:

Upcoming AWS Events
Check your calendars and sign up for these AWS events:

  • AWS Silicon Innovation Day (June 21) – A one-day virtual event that focuses on AWS Silicon and how you can take advantage of AWS’s unique offerings. Learn more and register here.
  • AWS Global Summits – There are many summits going on right now around the world: Toronto (June 14), Madrid (June 15), and Milano (June 22).
  • AWS Community Day – Join a community-led conference run by AWS user group leaders in your region: Chicago (June 15), Manila (June 29–30), Chile (July 1), and Munich (September 14).
  • CDK Day CDK Day is happening again this year on September 29. The call for papers for this event is open, and this year we are also accepting talks in Spanish. Submit your talk here.

That’s all for this week. Check back next Monday for another Week in Review!

This post is part of our Week in Review series. Check back each week for a quick roundup of interesting news and announcements from AWS!

— Marcia

A New Set of APIs for Amazon SQS Dead-Letter Queue Redrive

Post Syndicated from Sébastien Stormacq original https://aws.amazon.com/blogs/aws/a-new-set-of-apis-for-amazon-sqs-dead-letter-queue-redrive/

Today, we launch a new set of APIs for Amazon Simple Queue Service (Amazon SQS). These new APIs allow you to manage dead-letter queue (DLQ) redrive programmatically. You can now use the AWS SDKs or the AWS Command Line Interface (AWS CLI) to programmatically move messages from the DLQ to their original queue, or to a custom queue destination, to attempt to process them again. A DLQ is a queue where Amazon SQS automatically moves messages that are not correctly processed by your consumer application.

To fully appreciate how this new API might help you, let’s have a quick look back at history.

Message queues are an integral part of modern application architectures. They allow developers to decouple services by allowing asynchronous and message-based communications between message producers and consumers. In most systems, messages are persisted in shared storage (the queue) until the consumer processes them. Message queues allow developers to build applications that are resilient to temporary service failure. They help prioritize message processing and scale their fleet of worker nodes that process the messages. Message queues are also popular in event-driven architectures.

Asynchronous message exchange is not new in application architectures. The concept of exchanging messages asynchronously between applications appeared in the 1960s and was first made popular when IBM launched TCAM for OS/360 in 1972. The general adoption came 20 years later with IBM MQ Series in 1993 (now IBM MQ) and when Sun Microsystems released Java Messaging Service (JMS) in 1998, a standard API for Java applications to interact with message queues.

AWS launched Amazon SQS on July 12, 2006. Amazon SQS is a highly scalable, reliable, and elastic queuing service that “just works.” As Werner wrote at the time: “We have chosen a concurrency model where the process working on a message automatically acquires a leased lock on that message; if the message is not deleted before the lease expires, it becomes available for processing again. Makes failure handling very simple.

On January 29, 2014, we introduced dead-letter queues (DLQ). DLQs help you avoid a message that failed to be processed from staying forever on top of the queue, possibly preventing other messages in the queue from processing. With DLQs, each queue has an associated property telling Amazon SQS how many times a message may be presented for processing (maxReceiveCount). Each message also has an associated receive counter (ReceiveCount). Each time a consumer application picks up a message for processing, the message receive count is incremented by 1. When ReceiveCount > maxReceiveCount, Amazon SQS moves the message to your designated DLQ for human analysis and debugging. You generally associate alarms with the DLQ to send notifications when such events happen. Typical reasons to move a message to the DLQ are because they are incorrectly formatted, there are bugs in the consumer application, or it takes too long to process the message.

At AWS re:Invent 2021, AWS announced dead-letter queue redrive on the Amazon SQS console. The redrive addresses the second part of the failed message lifecycle. It allows you to reinject the message in its original queue to attempt processing it again. After the consumer application is fixed and ready to consume the failed messages, you can redrive the messages from the DLQ back in the source queue or a customized queue destination. It just requires a couple of clicks on the console.

Today, we are adding APIs allowing you to write applications and scripts that handle the redrive programmatically. There is no longer a need to have a human clicking on the console. Using the API increases the scalability of your processes and reduces the risk of human error.

Let’s See It in Action
To try out this new API, I open a terminal for a command-line only demo. Before I get started, I make sure I have the latest version of the AWS CLI. On macOS I enter brew upgrade awscli.

I first create two queues. One is the dead-letter queue, and the other is my application queue:

# First, I create the dead-letter queue (notice the -dlq I choose to add at the end of the queue name)
➜ ~ aws sqs create-queue \
            --queue-name awsnewsblog-dlq                                            
{
    "QueueUrl": "https://sqs.us-east-2.amazonaws.com/012345678900/awsnewsblog-dlq"
}

# second, I retrieve the Arn of the queue I just created
➜  ~ aws sqs get-queue-attributes \
             --queue-url https://sqs.us-east-2.amazonaws.com/012345678900/awsnewsblog-dlq \
             --attribute-names QueueArn
{
    "Attributes": {
        "QueueArn": "arn:aws:sqs:us-east-2:012345678900:awsnewsblog-dlq"
    }
}

# Third, I create the application queue. I enter a redrive policy: post messages in the DLQ after three delivery attempts
➜  ~ aws sqs create-queue \
             --queue-name awsnewsblog \
             --attributes '{"RedrivePolicy": "{\"deadLetterTargetArn\":\"arn:aws:sqs:us-east-2:012345678900:awsnewsblog-dlq\",\"maxReceiveCount\":\"3\"}"}' 
{
    "QueueUrl": "https://sqs.us-east-2.amazonaws.com/012345678900/awsnewsblog"
}

Now that the two queues are ready, I post a message to the application queue:

➜ ~ aws sqs send-message \
            --queue-url https://sqs.us-east-2.amazonaws.com/012345678900/awsnewsblog \
            --message-body "Hello World"
{
"MD5OfMessageBody": "b10a8db164e0754105b7a99be72e3fe5",
"MessageId": "fdc26778-ce9a-4782-9e33-ae73877cfcb2"
}

Next, I consume the message, but I don’t delete it from the queue. This simulates a crash in the message consumer application. Message consumers are supposed to delete the message after successful processing. I set the maxReceivedCount property to 3 when I entered the redrivePolicy. I therefore repeat this operation three times to force Amazon SQS to move the message to the dead-letter queue after three delivery attempts. The default visibility timeout is 30 seconds, so I have to wait 30 seconds or more between the retries.

➜ ~ aws sqs receive-message \
            --queue-url https://sqs.us-east-2.amazonaws.com/012345678900/awsnewsblog
{
"Messages": [
{
"MessageId": "fdc26778-ce9a-4782-9e33-ae73877cfcb2",
"ReceiptHandle": "AQEBP8yOfgBlnjlkGXjyeLROiY7xg7cZ6Znq8Aoa0d3Ar4uvTLPrHZptNotNfKRK25xm+IU8ebD3kDwZ9lja6JYs/t1kBlwiNO6TBACN5srAb/WggQiAAkYl045Tx3CvsOypbJA3y8U+MyEOQRwIz6G85i7MnR8RgKTlhOzOZOVACXC4W8J9GADaQquFaS1wVeM9VDsOxds1hDZLL0j33PIAkIrG016LOQ4sAntH0DOlEKIWZjvZIQGdlRJS65PJu+I/Ka1UPHGiFt9f8m3SR+Y34/ttRWpQANlXQi5ByA47N8UfcpFXXB5L30cUmoDtKucPewsJNG2zRCteR0bQczMMAmOPujsKq70UGOT8X2gEv2LfhlY7+5n8z3yew8sdBjWhVSegrgj6Yzwoc4kXiMddMg==",
"MD5OfBody": "b10a8db164e0754105b7a99be72e3fe5",
"Body": "Hello World"
}
]
}

# wait 30 seconds,
# then repeat two times (for a total of three receive-message API calls)

After three processing attempts, the message is not in the queue anymore:

➜  ~ aws sqs receive-message \
             --queue-url  https://sqs.us-east-2.amazonaws.com/012345678900/awsnewsblog
{
    "Messages": []
}

The message has been moved to the dead-letter queue. I check the DLQ to confirm (notice the queue URL ending with -dlq):

➜  ~ aws sqs receive-message \
             --queue-url  https://sqs.us-east-2.amazonaws.com/012345678900/awsnewsblog-dlq
{
    "Messages": [
        {
            "MessageId": "fdc26778-ce9a-4782-9e33-ae73877cfcb2",
            "ReceiptHandle": "AQEBCLtBMoZYVMMq7fUGNHeCliqE3mFXnkuJ+nOXLK1++uoXWBG31nDejCpxElmiBZWfbcfGJrEdKj4P9HJdrQMYDbeSqB+u1ZlB7CYzQBiQps4SEG0biEoubwqjQbmDZlPrmkFsnYgLD98D1XYWk/Ik6Z2n/wxDo9ko9rbZ15izK5RFnbwveNy8dfc6ireqVB1EGbeGkHcweHGuoeKWXEab1ynZWhNqZsQgCR6pWRkgtn59lJcLv4cJ4UMewNzvt7tMHH69GvVjXdYDYvJJI2vj+6RHvcvSHWWhTNT+CuPEXguVNuNrSya8gho1fCnKpVwQre6HhMlLPjY4wvn/tXY7+5rmte9eXagCqLQXaENB2R7qWNVPiWRIJy8/cTf37NLYVzBom030DNJlH9EeceRhCQ==",
            "MD5OfBody": "b10a8db164e0754105b7a99be72e3fe5",
            "Body": "Hello World"
        }
    ]
}

Now that the setup is ready, let’s programmatically redrive the message to its original queue. Let’s assume I understand why the consumer didn’t correctly process the message and that I fixed the consumer application code. I use start-message-move-task on the DLQ to start the asynchronous redrive. There is an optional attribute (MaxNumberOfMessagesPerSecond) to control the velocity of the redrive:

➜ ~ aws sqs start-message-move-task \
            --source-arn arn:aws:sqs:us-east-2:012345678900:awsnewsblog-dlq
{
    "TaskHandle": "eyJ0YXNrSWQiOiI4ZGJmNjBiMy00MmUwLTQzYTYtYjg4Zi1iMTZjYWRjY2FkNmEiLCJzb3VyY2VBcm4iOiJhcm46YXdzOnNxczp1cy1lYXN0LTI6NDg2NjUyMDY2NjkzOmF3c25ld3NibG9nLWRscSJ9"
}

I can list and check status the of the move tasks I initiated with list-message-move-tasks or cancel a running task by calling the cancel-message-move-task API:

➜ ~ aws sqs list-message-move-tasks \
            --source-arn arn:aws:sqs:us-east-2:012345678900:awsnewsblog-dlq
{
    "Results": [
        {
            "Status": "COMPLETED",
            "SourceArn": "arn:aws:sqs:us-east-2:012345678900:awsnewsblog-dlq",
            "ApproximateNumberOfMessagesMoved": 1,
            "ApproximateNumberOfMessagesToMove": 1,
            "StartedTimestamp": 1684135792239
        }
    ]
}

Now my application can consume the message again from the application queue:

➜  ~ aws sqs receive-message \
             --queue-url  https://sqs.us-east-2.amazonaws.com/012345678900/awsnewsblog                                   
{
    "Messages": [
        {
            "MessageId": "a7ae83ca-cde4-48bf-b822-3d4bc1f4dcae",
            "ReceiptHandle": "AQEB9a+Dm2nvb3VUn9+46j9UsDidU/W6qFwJtXtNWTyfoSDOKT7h73e6ctT9RVZysEw3qqzJOx1cxblTTOSrYwwwoBA2qoJMGsqsrsRGGYojBvf9X8hqi8B8MHn9rTm8diJ2wT2b7WC+TDrx3zIvUeiSEkP+EhqyYOvOs7Q9aETR+Uz02kQxZ/cUJWsN4MMSXBejwW+c5ivv5uQtpfUrfZuCWa9B9O67Kj/q52clriPHpcqCCfJwFBSZkGTXYwTpnjxD4QM7DPS+xVeVfTyM7DsKCAOtpvFBmX5m4UNKT6TROgCnGxTRglUSMWQp8ufVxXiaUyM1dwqxYekM9uX/RCb01gEyCZHas4jeNRV5nUJlhBkkqPlw3i6w9Uuc2y9nH0Df8nH3g7KTXo4lv5Bl3ayh9w==",
            "MD5OfBody": "b10a8db164e0754105b7a99be72e3fe5",
            "Body": "Hello World"
        }
    ]
}

Availability
DLQ redrive APIs are available today in all commercial Regions where Amazon SQS is available.

Redriving the messages from the dead-letter queue to the source queue or a custom destination queue generates additional API calls billed based on existing pricing (starting at $0.40 per million API calls, after the first million, which is free every month). Amazon SQS batches the messages while redriving them from one queue to another. This makes moving messages from one queue to another a simple and low-cost option.

To learn more about DLQ and DLQ redrive, check our documentation.

Remember that we live in an asynchronous world—so should your applications. Get started today and write your first redrive application.

— seb

Extending a serverless, event-driven architecture to existing container workloads

Post Syndicated from James Beswick original https://aws.amazon.com/blogs/compute/extending-a-serverless-event-driven-architecture-to-existing-container-workloads/

This post is written by Dhiraj Mahapatro, Principal Specialist SA, and Sascha Moellering, Principal Specialist SA, and Emily Shea, WW Lead, Integration Services.

Many serverless services are a natural fit for event-driven architectures (EDA), as events invoke them and only run when there is an event to process. When building in the cloud, many services emit events by default and have built-in features for managing events. This combination allows customers to build event-driven architectures easier and faster than ever before.

The insurance claims processing sample application in this blog series uses event-driven architecture principles and serverless services like AWS LambdaAWS Step FunctionsAmazon API GatewayAmazon EventBridge, and Amazon SQS.

When building an event-driven architecture, it’s likely that you have existing services to integrate with the new architecture, ideally without needing to make significant refactoring changes to those services. As services communicate via events, extending applications to new and existing microservices is a key benefit of building with EDA. You can write those microservices in different programming languages or running on different compute options.

This blog post walks through a scenario of integrating an existing, containerized service (a settlement service) to the serverless, event-driven insurance claims processing application described in this blog post.

Overview of sample event-driven architecture

The sample application uses a front-end to sign up a new user and allow the user to upload images of their car and driver’s license. Once signed up, they can file a claim and upload images of their damaged car. Previously, it did not yet integrate with a settlement service for completing the claims and settlement process.

In this scenario, the settlement service is a brownfield application that runs Spring Boot 3 on Amazon ECS with AWS Fargate. AWS Fargate is a serverless, pay-as-you-go compute engine that lets you focus on building container applications without managing servers.

The Spring Boot application exposes a REST endpoint, which accepts a POST request. It applies settlement business logic and creates a settlement record in the database for a car insurance claim. Your goal is to make settlement work with the new EDA application that is designed for claims processing without re-architecting or rewriting. Customer, claims, fraud, document, and notification are the other domains that are shown as blue-colored boxes in the following diagram:

Reference architecture

Project structure

The application uses AWS Cloud Development Kit (CDK) to build the stack. With CDK, you get the flexibility to create modular and reusable constructs imperatively using your language of choice. The sample application uses TypeScript for CDK.

The following project structure enables you to build different bounded contexts. Event-driven architecture relies on the choreography of events between domains. The object oriented programming (OOP) concept of CDK helps provision the infrastructure to separate the domain concerns while loosely coupling them via events.

You break the higher level CDK constructs down to these corresponding domains:

Comparing domains

Application and infrastructure code are present in each domain. This project structure creates a seamless way to add new domains like settlement with its application and infrastructure code without affecting other areas of the business.

With the preceding structure, you can use the settlement-service.ts CDK construct inside claims-processing-stack.ts:

const settlementService = new SettlementService(this, "SettlementService", {
  bus,
});

The only information the SettlementService construct needs to work is the EventBridge custom event bus resource that is created in the claims-processing-stack.ts.

To run the sample application, follow the setup steps in the sample application’s README file.

Existing container workload

The settlement domain provides a REST service to the rest of the organization. A Docker containerized Spring Boot application runs on Amazon ECS with AWS Fargate. The following sequence diagram shows the synchronous request-response flow from an external REST client to the service:

Settlement service

  1. External REST client makes POST /settlement call via an HTTP API present in front of an internal Application Load Balancer (ALB).
  2. SettlementController.java delegates to SettlementService.java.
  3. SettlementService applies business logic and calls SettlementRepository for data persistence.
  4. SettlementRepository persists the item in the Settlement DynamoDB table.

A request to the HTTP API endpoint looks like:

curl --location <settlement-api-endpoint-from-cloudformation-output> \
--header 'Content-Type: application/json' \
--data '{
  "customerId": "06987bc1-1234-1234-1234-2637edab1e57",
  "claimId": "60ccfe05-1234-1234-1234-a4c1ee6fcc29",
  "color": "green",
  "damage": "bumper_dent"
}'

The response from the API call is:

API response

You can learn more here about optimizing Spring Boot applications on AWS Fargate.

Extending container workload for events

To integrate the settlement service, you must update the service to receive and emit events asynchronously. The core logic of the settlement service remains the same. When you file a claim, upload damaged car images, and the application detects no document fraud, the settlement domain subscribes to Fraud.Not.Detected event and applies its business logic. The settlement service emits an event back upon applying the business logic.

The following sequence diagram shows a new interface in settlement to work with EDA. The settlement service subscribes to events that a producer emits. Here, the event producer is the fraud service that puts an event in an EventBridge custom event bus.

Sequence diagram

  1. Producer emits Fraud.Not.Detected event to EventBridge custom event bus.
  2. EventBridge evaluates the rules provided by the settlement domain and sends the event payload to the target SQS queue.
  3. SubscriberService.java polls for new messages in the SQS queue.
  4. On message, it transforms the message body to an input object that is accepted by SettlementService.
  5. It then delegates the call to SettlementService, similar to how SettlementController works in the REST implementation.
  6. SettlementService applies business logic. The flow is like the REST use case from 7 to 10.
  7. On receiving the response from the SettlementService, the SubscriberService transforms the response to publish an event back to the event bus with the event type as Settlement.Finalized.

The rest of the architecture consumes this Settlement.Finalized event.

Using EventBridge schema registry and discovery

Schema enforces a contract between a producer and a consumer. A consumer expects the exact structure of the event payload every time an event arrives. EventBridge provides schema registry and discovery to maintain this contract. The consumer (the settlement service) can download the code bindings and use them in the source code.

Enable schema discovery in EventBridge before downloading the code bindings and using them in your repository. The code bindings provide a marshaller that unmarshals the incoming event from SQS queue to a plain old Java object (POJO) FraudNotDetected.java. You download the code bindings using the choice of your IDE. AWS Toolkit for IntelliJ makes it convenient to download and use them.

Download code bindings

The final architecture for the settlement service with REST and event-driven architecture looks like:

Final architecture

Transition to become fully event-driven

With the new capability to handle events, the Spring Boot application now supports both the REST endpoint and the event-driven architecture by running the same business logic through different interfaces. In this example scenario, as the event-driven architecture matures and the rest of the organization adopts it, the need for the POST endpoint to save a settlement may diminish. In the future, you can deprecate the endpoint and fully rely on polling messages from the SQS queue.

You start with using an ALB and Fargate service CDK ECS pattern:

const loadBalancedFargateService = new ecs_patterns.ApplicationLoadBalancedFargateService(
  this,
  "settlement-service",
  {
    cluster: cluster,
    taskImageOptions: {
      image: ecs.ContainerImage.fromDockerImageAsset(asset),
      environment: {
        "DYNAMODB_TABLE_NAME": this.table.tableName
      },
      containerPort: 8080,
      logDriver: new ecs.AwsLogDriver({
        streamPrefix: "settlement-service",
        mode: ecs.AwsLogDriverMode.NON_BLOCKING,
        logRetention: RetentionDays.FIVE_DAYS,
      })
    },
    memoryLimitMiB: 2048,
    cpu: 1024,
    publicLoadBalancer: true,
    desiredCount: 2,
    listenerPort: 8080
  });

To adapt to EDA, you update the resources to retrofit the SQS queue to receive messages and EventBridge to put events. Add new environment variables to the ApplicationLoadBalancerFargateService resource:

environment: {
  "SQS_ENDPOINT_URL": queue.queueUrl,
  "EVENTBUS_NAME": props.bus.eventBusName,
  "DYNAMODB_TABLE_NAME": this.table.tableName
}

Grant the Fargate task permission to put events in the custom event bus and consume messages from the SQS queue:

props.bus.grantPutEventsTo(loadBalancedFargateService.taskDefinition.taskRole);
queue.grantConsumeMessages(loadBalancedFargateService.taskDefinition.taskRole);

When you transition the settlement service to become fully event-driven, you do not need the HTTP API endpoint and ALB anymore, as SQS is the source of events.

A better alternative is to use QueueProcessingFargateService ECS pattern for the Fargate service. The pattern provides auto scaling based on the number of visible messages in the SQS queue, besides CPU utilization. In the following example, you can also add two capacity provider strategies while setting up the Fargate service: FARGATE_SPOT and FARGATE. This means, for every one task that is run using FARGATE, there are two tasks that use FARGATE_SPOT. This can help optimize cost.

const queueProcessingFargateService = new ecs_patterns.QueueProcessingFargateService(this, 'Service', {
  cluster,
  memoryLimitMiB: 1024,
  cpu: 512,
  queue: queue,
  image: ecs.ContainerImage.fromDockerImageAsset(asset),
  desiredTaskCount: 2,
  minScalingCapacity: 1,
  maxScalingCapacity: 5,
  maxHealthyPercent: 200,
  minHealthyPercent: 66,
  environment: {
    "SQS_ENDPOINT_URL": queueUrl,
    "EVENTBUS_NAME": props?.bus.eventBusName,
    "DYNAMODB_TABLE_NAME": tableName
  },
  capacityProviderStrategies: [
    {
      capacityProvider: 'FARGATE_SPOT',
      weight: 2,
    },
    {
      capacityProvider: 'FARGATE',
      weight: 1,
    },
  ],
});

This pattern abstracts the automatic scaling behavior of the Fargate service based on the queue depth.

Running the application

To test the application, follow How to use the Application after the initial setup. Once complete, you see that the browser receives a Settlement.Finalized event:

{
  "version": "0",
  "id": "e2a9c866-cb5b-728c-ce18-3b17477fa5ff",
  "detail-type": "Settlement.Finalized",
  "source": "settlement.service",
  "account": "123456789",
  "time": "2023-04-09T23:20:44Z",
  "region": "us-east-2",
  "resources": [],
  "detail": {
    "settlementId": "377d788b-9922-402a-a56c-c8460e34e36d",
    "customerId": "67cac76c-40b1-4d63-a8b5-ad20f6e2e6b9",
    "claimId": "b1192ba0-de7e-450f-ac13-991613c48041",
    "settlementMessage": "Based on our analysis on the damage of your car per claim id b1192ba0-de7e-450f-ac13-991613c48041, your out-of-pocket expense will be $100.00."
  }
}

Cleaning up

The stack creates a custom VPC and other related resources. Be sure to clean up resources after usage to avoid the ongoing cost of running these services. To clean up the infrastructure, follow the clean-up steps shown in the sample application.

Conclusion

The blog explains a way to integrate existing container workload running on AWS Fargate with a new event-driven architecture. You use EventBridge to decouple different services from each other that are built using different compute technologies, languages, and frameworks. Using AWS CDK, you gain the modularity of building services decoupled from each other.

This blog shows an evolutionary architecture that allows you to modernize existing container workloads with minimal changes that still give you the additional benefits of building with serverless and EDA on AWS.

The major difference between the event-driven approach and the REST approach is that you unblock the producer once it emits an event. The event producer from the settlement domain that subscribes to that event is loosely coupled. The business functionality remains intact, and no significant refactoring or re-architecting effort is required. With these agility gains, you may get to the market faster

The sample application shows the implementation details and steps to set up, run, and clean up the application. The app uses ECS Fargate for a domain service, but you do not limit it to just Fargate. You can also bring container-based applications running on Amazon EKS similarly to event-driven architecture.

Learn more about event-driven architecture on Serverless Land.

Serverless ICYMI Q1 2023

Post Syndicated from Julian Wood original https://aws.amazon.com/blogs/compute/serverless-icymi-q1-2023/

Welcome to the 21st edition of the AWS Serverless ICYMI (in case you missed it) quarterly recap. Every quarter, we share all the most recent product launches, feature enhancements, blog posts, webinars, live streams, and other interesting things that you might have missed!

ICYMI2023Q1

In case you missed our last ICYMI, check out what happened last quarter here.

Artificial intelligence (AI) technologies, ChatGPT, and DALL-E are creating significant interest in the industry at the moment. Find out how to integrate serverless services with ChatGPT and DALL-E to generate unique bedtime stories for children.

Example notification of a story hosted with Next.js and App Runner

Example notification of a story hosted with Next.js and App Runner

Serverless Land is a website maintained by the Serverless Developer Advocate team to help you build serverless applications and includes workshops, code examples, blogs, and videos. There is now enhanced search functionality so you can search across resources, patterns, and video content.

SLand-search

ServerlessLand search

AWS Lambda

AWS Lambda has improved how concurrency works with Amazon SQS. You can now control the maximum number of concurrent Lambda functions invoked.

The launch blog post explains the scaling behavior of Lambda using this architectural pattern, challenges this feature helps address, and a demo of maximum concurrency in action.

Maximum concurrency is set to 10 for the SQS queue.

Maximum concurrency is set to 10 for the SQS queue.

AWS Lambda Powertools is an open-source library to help you discover and incorporate serverless best practices more easily. Lambda Powertools for .NET is now generally available and currently focused on three observability features: distributed tracing (Tracer), structured logging (Logger), and asynchronous business and application metrics (Metrics). Powertools is also available for Python, Java, and Typescript/Node.js programming languages.

To learn more:

Lambda announced a new feature, runtime management controls, which provide more visibility and control over when Lambda applies runtime updates to your functions. The runtime controls are optional capabilities for advanced customers that require more control over their runtime changes. You can now specify a runtime management configuration for each function with three settings, Automatic (default), Function update, or manual.

There are three new Amazon CloudWatch metrics for asynchronous Lambda function invocations: AsyncEventsReceived, AsyncEventAge, and AsyncEventsDropped. You can track the asynchronous invocation requests sent to Lambda functions to monitor any delays in processing and take corrective actions if required. The launch blog post explains the new metrics and how to use them to troubleshoot issues.

Lambda now supports Amazon DocumentDB change streams as an event source. You can use Lambda functions to process new documents, track updates to existing documents, or log deleted documents. You can use any programming language that is supported by Lambda to write your functions.

There is a helpful blog post suggesting best practices for developing portable Lambda functions that allow you to port your code to containers if you later choose to.

AWS Step Functions

AWS Step Functions has expanded its AWS SDK integrations with support for 35 additional AWS services including Amazon EMR Serverless, AWS Clean Rooms, AWS IoT FleetWise, AWS IoT RoboRunner and 31 other AWS services. In addition, Step Functions also added support for 1000+ new API actions from new and existing AWS services such as Amazon DynamoDB and Amazon Athena. For the full list of added services, visit AWS SDK service integrations.

Amazon EventBridge

Amazon EventBridge has launched the AWS Controllers for Kubernetes (ACK) for EventBridge and Pipes . This allows you to manage EventBridge resources, such as event buses, rules, and pipes, using the Kubernetes API and resource model (custom resource definitions).

EventBridge event buses now also support enhanced integration with Service Quotas. Your quota increase requests for limits such as PutEvents transactions-per-second, number of rules, and invocations per second among others will be processed within one business day or faster, enabling you to respond quickly to changes in usage.

AWS SAM

The AWS Serverless Application Model (SAM) Command Line Interface (CLI) has added the sam list command. You can now show resources defined in your application, including the endpoints, methods, and stack outputs required to test your deployed application.

AWS SAM has a preview of sam build support for building and packaging serverless applications developed in Rust. You can use cargo-lambda in the AWS SAM CLI build workflow and AWS SAM Accelerate to iterate on your code changes rapidly in the cloud.

You can now use AWS SAM connectors as a source resource parameter. Previously, you could only define AWS SAM connectors as a AWS::Serverless::Connector resource. Now you can add the resource attribute on a connector’s source resource, which makes templates more readable and easier to update over time.

AWS SAM connectors now also support multiple destinations to simplify your permissions. You can now use a single connector between a single source resource and multiple destination resources.

In October 2022, AWS released OpenID Connect (OIDC) support for AWS SAM Pipelines. This improves your security posture by creating integrations that use short-lived credentials from your CI/CD provider. There is a new blog post on how to implement it.

Find out how best to build serverless Java applications with the AWS SAM CLI.

AWS App Runner

AWS App Runner now supports retrieving secrets and configuration data stored in AWS Secrets Manager and AWS Systems Manager (SSM) Parameter Store in an App Runner service as runtime environment variables.

AppRunner also now supports incoming requests based on HTTP 1.0 protocol, and has added service level concurrency, CPU and Memory utilization metrics.

Amazon S3

Amazon S3 now automatically applies default encryption to all new objects added to S3, at no additional cost and with no impact on performance.

You can now use an S3 Object Lambda Access Point alias as an origin for your Amazon CloudFront distribution to tailor or customize data to end users. For example, you can resize an image depending on the device that an end user is visiting from.

S3 has introduced Mountpoint for S3, a high performance open source file client that translates local file system API calls to S3 object API calls like GET and LIST.

S3 Multi-Region Access Points now support datasets that are replicated across multiple AWS accounts. They provide a single global endpoint for your multi-region applications, and dynamically route S3 requests based on policies that you define. This helps you to more easily implement multi-Region resilience, latency-based routing, and active-passive failover, even when data is stored in multiple accounts.

Amazon Kinesis

Amazon Kinesis Data Firehose now supports streaming data delivery to Elastic. This is an easier way to ingest streaming data to Elastic and consume the Elastic Stack (ELK Stack) solutions for enterprise search, observability, and security without having to manage applications or write code.

Amazon DynamoDB

Amazon DynamoDB now supports table deletion protection to protect your tables from accidental deletion when performing regular table management operations. You can set the deletion protection property for each table, which is set to disabled by default.

Amazon SNS

Amazon SNS now supports AWS X-Ray active tracing to visualize, analyze, and debug application performance. You can now view traces that flow through Amazon SNS topics to destination services, such as Amazon Simple Queue Service, Lambda, and Kinesis Data Firehose, in addition to traversing the application topology in Amazon CloudWatch ServiceLens.

SNS also now supports setting content-type request headers for HTTPS notifications so applications can receive their notifications in a more predictable format. Topic subscribers can create a DeliveryPolicy that specifies the content-type value that SNS assigns to their HTTPS notifications, such as application/json, application/xml, or text/plain.

EDA Visuals collection added to Serverless Land

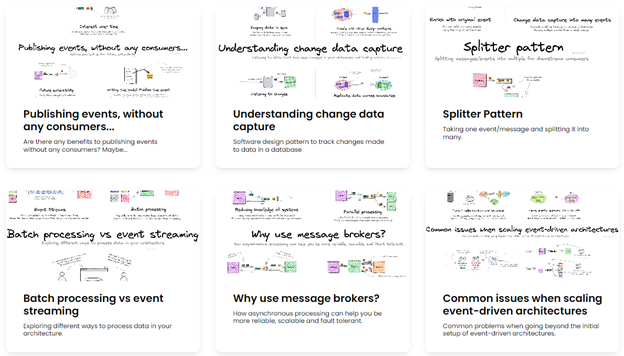
The Serverless Developer Advocate team has extended Serverless Land and introduced EDA visuals. These are small bite sized visuals to help you understand concept and patterns about event-driven architectures. Find out about batch processing vs. event streaming, commands vs. events, message queues vs. event brokers, and point-to-point messaging. Discover bounded contexts, migrations, idempotency, claims, enrichment and more!

EDA-visuals

EDA Visuals

To learn more:

Serverless Repos Collection on Serverless Land

There is also a new section on Serverless Land containing helpful code repositories. You can search for code repos to use for examples, learning or building serverless applications. You can also filter by use-case, runtime, and level.

Serverless Repos Collection

Serverless Repos Collection

Serverless Blog Posts

January

Jan 12 – Introducing maximum concurrency of AWS Lambda functions when using Amazon SQS as an event source

Jan 20 – Processing geospatial IoT data with AWS IoT Core and the Amazon Location Service

Jan 23 – AWS Lambda: Resilience under-the-hood

Jan 24 – Introducing AWS Lambda runtime management controls

Jan 24 – Best practices for working with the Apache Velocity Template Language in Amazon API Gateway

February

Feb 6 – Previewing environments using containerized AWS Lambda functions

Feb 7 – Building ad-hoc consumers for event-driven architectures

Feb 9 – Implementing architectural patterns with Amazon EventBridge Pipes

Feb 9 – Securing CI/CD pipelines with AWS SAM Pipelines and OIDC

Feb 9 – Introducing new asynchronous invocation metrics for AWS Lambda

Feb 14 – Migrating to token-based authentication for iOS applications with Amazon SNS

Feb 15 – Implementing reactive progress tracking for AWS Step Functions

Feb 23 – Developing portable AWS Lambda functions

Feb 23 – Uploading large objects to Amazon S3 using multipart upload and transfer acceleration

Feb 28 – Introducing AWS Lambda Powertools for .NET

March

Mar 9 – Server-side rendering micro-frontends – UI composer and service discovery

Mar 9 – Building serverless Java applications with the AWS SAM CLI

Mar 10 – Managing sessions of anonymous users in WebSocket API-based applications

Mar 14 –
Implementing an event-driven serverless story generation application with ChatGPT and DALL-E

Videos

Serverless Office Hours – Tues 10AM PT

Weekly office hours live stream. In each session we talk about a specific topic or technology related to serverless and open it up to helping you with your real serverless challenges and issues. Ask us anything you want about serverless technologies and applications.

January

Jan 10 – Building .NET 7 high performance Lambda functions

Jan 17 – Amazon Managed Workflows for Apache Airflow at Scale

Jan 24 – Using Terraform with AWS SAM

Jan 31 – Preparing your serverless architectures for the big day

February

Feb 07- Visually design and build serverless applications

Feb 14 – Multi-tenant serverless SaaS

Feb 21 – Refactoring to Serverless

Feb 28 – EDA visually explained

March

Mar 07 – Lambda cookbook with Python

Mar 14 – Succeeding with serverless

Mar 21 – Lambda Powertools .NET

Mar 28 – Server-side rendering micro-frontends

FooBar Serverless YouTube channel

Marcia Villalba frequently publishes new videos on her popular serverless YouTube channel. You can view all of Marcia’s videos at https://www.youtube.com/c/FooBar_codes.

January

Jan 12 – Serverless Badge – A new certification to validate your Serverless Knowledge

Jan 19 – Step functions Distributed map – Run 10k parallel serverless executions!

Jan 26 – Step Functions Intrinsic Functions – Do simple data processing directly from the state machines!

February

Feb 02 – Unlock the Power of EventBridge Pipes: Integrate Across Platforms with Ease!

Feb 09 – Amazon EventBridge Pipes: Enrichment and filter of events Demo with AWS SAM

Feb 16 – AWS App Runner – Deploy your apps from GitHub to Cloud in Record Time

Feb 23 – AWS App Runner – Demo hosting a Node.js app in the cloud directly from GitHub (AWS CDK)

March

Mar 02 – What is Amazon DynamoDB? What are the most important concepts? What are the indexes?

Mar 09 – Choreography vs Orchestration: Which is Best for Your Distributed Application?

Mar 16 – DynamoDB Single Table Design: Simplify Your Code and Boost Performance with Table Design Strategies

Mar 23 – 8 Reasons You Should Choose DynamoDB for Your Next Project and How to Get Started

Sessions with SAM & Friends

SAMFiends

AWS SAM & Friends

Eric Johnson is exploring how developers are building serverless applications. We spend time talking about AWS SAM as well as others like AWS CDK, Terraform, Wing, and AMPT.

Feb 16 – What’s new with AWS SAM

Feb 23 – AWS SAM with AWS CDK

Mar 02 – AWS SAM and Terraform

Mar 10 – Live from ServerlessDays ANZ

Mar 16 – All about AMPT

Mar 23 – All about Wing

Mar 30 – SAM Accelerate deep dive

Still looking for more?

The Serverless landing page has more information. The Lambda resources page contains case studies, webinars, whitepapers, customer stories, reference architectures, and even more Getting Started tutorials.

You can also follow the Serverless Developer Advocacy team on Twitter to see the latest news, follow conversations, and interact with the team.

Invoking asynchronous external APIs with AWS Step Functions

Post Syndicated from Jorge Fonseca original https://aws.amazon.com/blogs/architecture/invoking-asynchronous-external-apis-with-aws-step-functions/

External vendor APIs can help organizations streamline operations, reduce costs, and provide better services to their customers. But many challenges exist in integrating with third-party services such as security, reliability, and cost.

Organizations must ensure their systems can handle performance issues or downtime. In some cases, calling an external API may have associated costs such as licensing fees. If a contract exists with the external API vendor to adhere to maximum Requests Per Second (RPS), the system needs to adapt accordingly.

In this blog post, we show you how to build an architecture to invoke an external vendor API using AWS Step Functions, with specific guidance on reliability.

This orchestration is applicable to any industry that relies on technology and data benefitting from external vendor API integration. Examples include e-commerce applications for online retailers integrating with third-party payment gateways, shipping carriers, or applications in the healthcare and banking sectors.

Invoking asynchronous external APIs overview

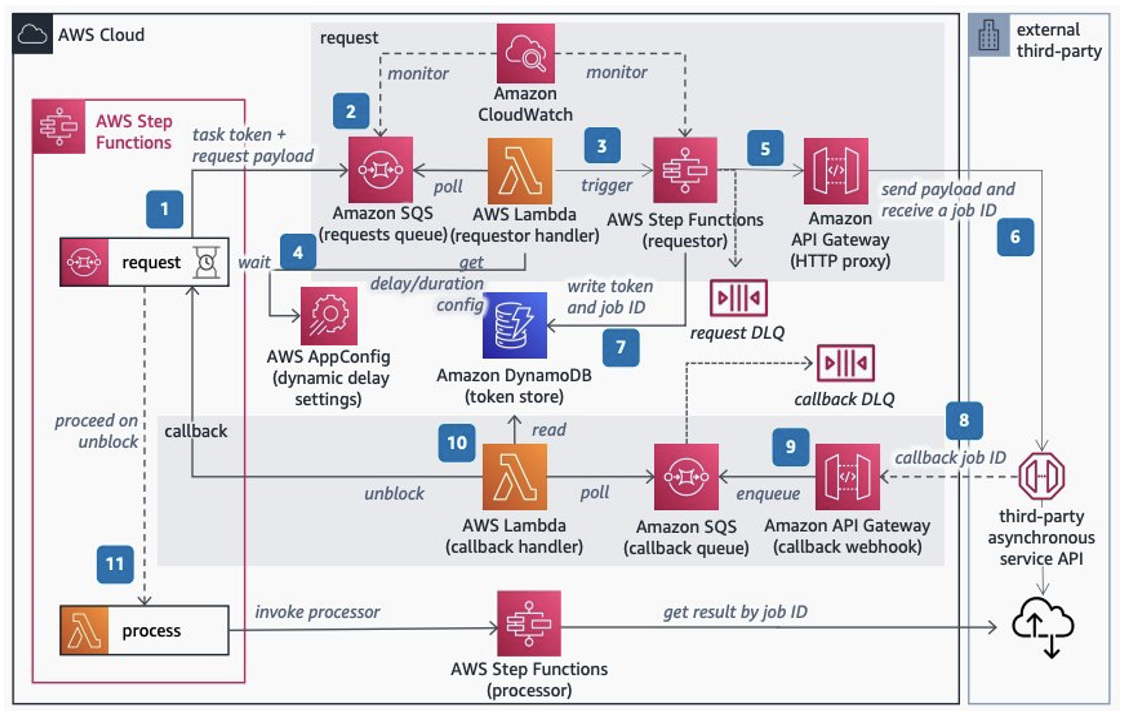
This solution outlines the use of AWS services to build an orchestrator controlling the invocation rate of third-party services that implement the service callback pattern to process long-running jobs. This architecture is also available in the AWS Reference Architecture Diagrams section of the AWS Architecture Center.

As in Figure 1, the architecture gives you the control to feed your calls to an external service according to its maximum RPS contract using Step Functions capabilities. Step Functions pauses main request workflows until you receive a callback from the external system indicating job completion.

Invoking Asynchronous External APIs architecture

Figure 1. Invoking Asynchronous External APIs architecture

Let’s explore each step.

  1. Set up Step Functions to handle the lifecycle of long-running requests to the third party. Inside the workflow, add a request step that pauses it using waitForTaskToken as a callback to continue. Set a timeout to throw a timeout error if a callback isn’t received.
  2. Send the task token and request payload to an Amazon Simple Queue Service (Amazon SQS) queue. Use Amazon CloudWatch to monitor its length. Consider adjusting the contract with the third-party service if the queue length grows beyond a soft limit determined on the maximum RPS with the third party.
  3. Use AWS Lambda to poll Amazon SQS and trigger an express Step Functions workflow. Control the invocation rate of Lambda using polling batch size, reserved concurrency, and maximum concurrency, discussed in more detail later in the blog.
  4. Optionally, add dynamic delay inside Lambda controlled by AWS AppConfig if the system still needs a lower invocation rate to comply with the contracted RPS.
  5. Step Functions invokes an Amazon API Gateway HTTP proxy API configured with rate limit to comply with the contracted RPS. API Gateway is a safeguard proxy to make sure your system is not breaking the RPS contract while dynamically adjusting the invocation rate parameters.
  6. Invoke the external third-party asynchronous service API sending the payload consumed from the requests queue and receiving the jobID from the service. Send failed requests to the Dead Letter Queue (DLQ) using Amazon SQS.
  7. Store the main workflow’s task token and jobID from the third-party service in an Amazon DynamoDB table. This is used as a mapping to correlate the jobID with the task token.
  8. When the external service completes, receive the completed jobID in a callback webhook endpoint implemented with API Gateway.
  9. Transform the external callbacks with API Gateway mapping templates, add the payload and jobID to an Amazon SQS queue, and respond immediately to the caller.
  10. Use Lambda to poll the callback Amazon SQS queue, then query the token stored. Use the token to unblock the waiting workflow by calling SendTaskSuccess and the callback DLQ to store failed messages.
  11. On the main workflow, pass the jobID to the next step and invoke a Step Functions processor to fetch the third-party results. Finally, process the external service’s results.

Controlling external API invocation rates

To comply with third-party RPS contracts, adopt a mechanism to control your system’s invocation rate. The rate of polling the messages from the request Amazon SQS (or step 3 in the architecture) directly impacts your invocation rate.

Different parameters can be used to control the invocation rate for Lambda with Amazon SQS as its trigger “event source,” such as:

  1. Batch size: The number of records to send to the function in each batch. For a standard queue, this can be up to 10,000 records. For a first-in, first-out (FIFO) queue, the maximum is 10. Using batch size on its own will not limit the invocation rate. It should be used in conjunction with other parameters such as reserved concurrency or maximum concurrency.
  2. Batch window: The maximum amount of time to gather records before invoking the function, in seconds. This applies only to standard queues.
  3. Maximum concurrency: Sets limits on the number of concurrent instances of the function that an Amazon SQS event source can invoke. Maximum concurrency is an event source-level setting.

Trigger configuration is shown in Figure 2.

Configuration parameters for triggering Lambda

Figure 2. Configuration parameters for triggering Lambda

Other Lambda configuration parameters can also be used to control the invocation rate, such as:

  1. Reserved concurrency: Guarantees the maximum number of concurrent instances for the function. When a function has reserved concurrency, no other function can use that concurrency. This can be used to limit and reduce the invocation rate.
  2. Provisioned concurrency: Initializes a requested number of execution environments so that they are prepared to respond immediately to your function’s invocations. Note that configuring provisioned concurrency incurs charges to your AWS account.

These additional Lambda configuration parameters are shown here in Figure 3.

Lambda concurrency configuration options - Reserved and Provisioned

Figure 3. Lambda concurrency configuration options – Reserved and Provisioned

Maximizing your external API architecture

During this architecture implementation, consider some use cases to ensure that you are building a mature orchestrator.

Let’s explore some examples:

  • If the external system fails to respond to the API request in step 8, a timeout exception will occur at step 1. A sensible timeout should be configured in the main state machine in step 1. The timeout value should consider the maximum response time of the external system.

The Error handling capabilities in Step Functions section of the AWS Step Functions Developer Guide provides the ability to implement your own logic for different error types. Configure timeout errors using the States.Timeout error state.

  • Dynamic delay inside the Lambda function—as mentioned in step 4—should only be used temporarily for burst traffic. If the external party has a very low RPS contract, consider other alternatives to introduce delay.

For example, Amazon EventBridge Scheduler can be used to trigger the Lambda function at regular intervals to consume the messages from Amazon SQS. This avoids costs for the idle/waiting state of your Lambda functions.

Conclusion

This blog post discusses how to build end-to-end orchestration to manage a request’s lifecycle, five different parameters to control invocation rate of third-party services, and throttle calls to external service API per maximum RPS contract.

We also consider use cases on using error handling capabilities in Step Functions and monitor systems with CloudWatch. In addition, this architecture adopts fully managed AWS Serverless services, removing the undifferentiated heavy lifting in building highly available, reliable, secure, and cost-effective systems in AWS.

Implementing architectural patterns with Amazon EventBridge Pipes

Post Syndicated from David Boyne original https://aws.amazon.com/blogs/compute/implementing-architectural-patterns-with-amazon-eventbridge-pipes/

This post is written by Dominik Richter (Solutions Architect)

Architectural patterns help you solve recurring challenges in software design. They are blueprints that have been used and tested many times. When you design distributed applications, enterprise integration patterns (EIP) help you integrate distributed components. For example, they describe how to integrate third-party services into your existing applications. But patterns are technology agnostic. They do not provide any guidance on how to implement them.

This post shows you how to use Amazon EventBridge Pipes to implement four common enterprise integration patterns (EIP) on AWS. This helps you to simplify your architectures. Pipes is a feature of Amazon EventBridge to connect your AWS resources. Using Pipes can reduce the complexity of your integrations. It can also reduce the amount of code you have to write and maintain.

Content filter pattern

The content filter pattern removes unwanted content from a message before forwarding it to a downstream system. Use cases for this pattern include reducing storage costs by removing unnecessary data or removing personally identifiable information (PII) for compliance purposes.

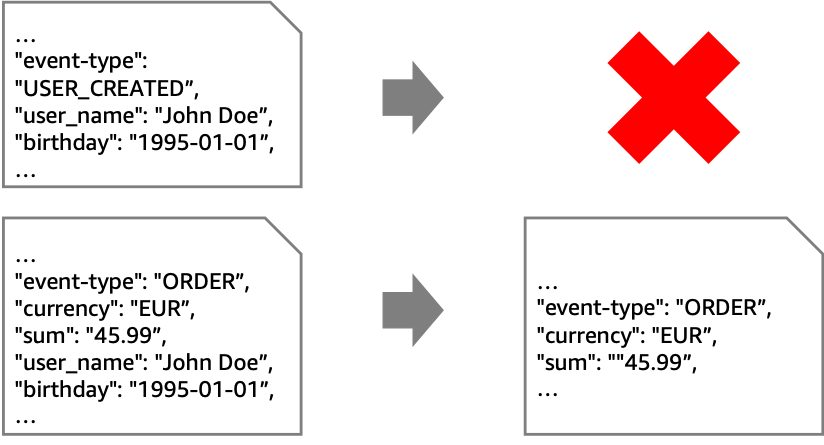
In the following example, the goal is to retain only non-PII data from “ORDER”-events. To achieve this, you must remove all events that aren’t “ORDER” events. In addition, you must remove any field in the “ORDER” events that contain PII.

While you can use this pattern with various sources and targets, the following architecture shows this pattern with Amazon Kinesis. EventBridge Pipes filtering discards unwanted events. EventBridge Pipes input transformers remove PII data from events that are forwarded to the second stream with longer retention.

Instead of using Pipes, you could connect the streams using an AWS Lambda function. This requires you to write and maintain code to read from and write to Kinesis. However, Pipes may be more cost effective than using a Lambda function.

Some situations require an enrichment function. For example, if your goal is to mask an attribute without removing it entirely. For example, you could replace the attribute “birthday” with an “age_group”-attribute.

In this case, if you use Pipes for integration, the Lambda function contains only your business logic. On the other hand, if you use Lambda for both integration and business logic, you do not pay for Pipes. At the same time, you add complexity to your Lambda function, which now contains integration code. This can increase its execution time and cost. Therefore, your priorities determine the best option and you should compare both approaches to make a decision.

To implement Pipes using the AWS Cloud Development Kit (AWS CDK), use the following source code. The full source code for all of the patterns that are described in this blog post can be found in the AWS samples GitHub repo.

const filterPipe = new pipes.CfnPipe(this, 'FilterPipe', {
  roleArn: pipeRole.roleArn,
  source: sourceStream.streamArn,
  target: targetStream.streamArn,
  sourceParameters: { filterCriteria: { filters: [{ pattern: '{"data" : {"event_type" : ["ORDER"] }}' }] }, kinesisStreamParameters: { startingPosition: 'LATEST' } },
  targetParameters: { inputTemplate: '{"event_type": <$.data.event_type>, "currency": <$.data.currency>, "sum": <$.data.sum>}', kinesisStreamParameters: { partitionKey: 'event_type' } },
});

To allow access to source and target, you must assign the correct permissions:

const pipeRole = new iam.Role(this, 'FilterPipeRole', { assumedBy: new iam.ServicePrincipal('pipes.amazonaws.com') });

sourceStream.grantRead(pipeRole);
targetStream.grantWrite(pipeRole);

Message translator pattern

In an event-driven architecture, event producers and consumers are independent of each other. Therefore, they may exchange events of different formats. To enable communication, the events must be translated. This is known as the message translator pattern. For example, an event may contain an address, but the consumer expects coordinates.

If a computation is required to translate messages, use the enrichment step. The following architecture diagram shows how to accomplish this enrichment via API destinations. In the example, you can call an existing geocoding service to resolve addresses to coordinates.

There may be cases where the translation is purely syntactical. For example, a field may have a different name or structure.

You can achieve these translations without enrichment by using input transformers.

Here is the source code for the pipe, including the role with the correct permissions:

const pipeRole = new iam.Role(this, 'MessageTranslatorRole', { assumedBy: new iam.ServicePrincipal('pipes.amazonaws.com'), inlinePolicies: { invokeApiDestinationPolicy } });

sourceQueue.grantConsumeMessages(pipeRole);
targetStepFunctionsWorkflow.grantStartExecution(pipeRole);

const messageTranslatorPipe = new pipes.CfnPipe(this, 'MessageTranslatorPipe', {
  roleArn: pipeRole.roleArn,
  source: sourceQueue.queueArn,
  target: targetStepFunctionsWorkflow.stateMachineArn,
  enrichment: enrichmentDestination.apiDestinationArn,
  sourceParameters: { sqsQueueParameters: { batchSize: 1 } },
});

Normalizer pattern

The normalizer pattern is similar to the message translator but there are different source components with different formats for events. The normalizer pattern routes each event type through its specific message translator so that downstream systems process messages with a consistent structure.

The example shows a system where different source systems store the name property differently. To process the messages differently based on their source, use an AWS Step Functions workflow. You can separate by event type and then have individual paths perform the unifying process. This diagram visualizes that you can call a Lambda function if needed. However, in basic cases like the preceding “name” example, you can modify the events using Amazon States Language (ASL).

In the example, you unify the events using Step Functions before putting them on your event bus. As is often the case with architectural choices, there are alternatives. Another approach is to introduce separate queues for each source system, connected by its own pipe containing only its unification actions.

This is the source code for the normalizer pattern using a Step Functions workflow as enrichment:

const pipeRole = new iam.Role(this, 'NormalizerRole', { assumedBy: new iam.ServicePrincipal('pipes.amazonaws.com') });

sourceQueue.grantConsumeMessages(pipeRole);
enrichmentWorkflow.grantStartSyncExecution(pipeRole);
normalizerTargetBus.grantPutEventsTo(pipeRole);

const normalizerPipe = new pipes.CfnPipe(this, 'NormalizerPipe', {
  roleArn: pipeRole.roleArn,
  source: sourceQueue.queueArn,
  target: normalizerTargetBus.eventBusArn,
  enrichment: enrichmentWorkflow.stateMachineArn,
  sourceParameters: { sqsQueueParameters: { batchSize: 1 } },
});

Claim check pattern

To reduce the size of the events in your event-driven application, you can temporarily remove attributes. This approach is known as the claim check pattern. You split a message into a reference (“claim check”) and the associated payload. Then, you store the payload in external storage and add only the claim check to events. When you process events, you retrieve relevant parts of the payload using the claim check. For example, you can retrieve a user’s name and birthday based on their userID.

The claim check pattern has two parts. First, when an event is received, you split it and store the payload elsewhere. Second, when the event is processed, you retrieve the relevant information. You can implement both aspects with a pipe.

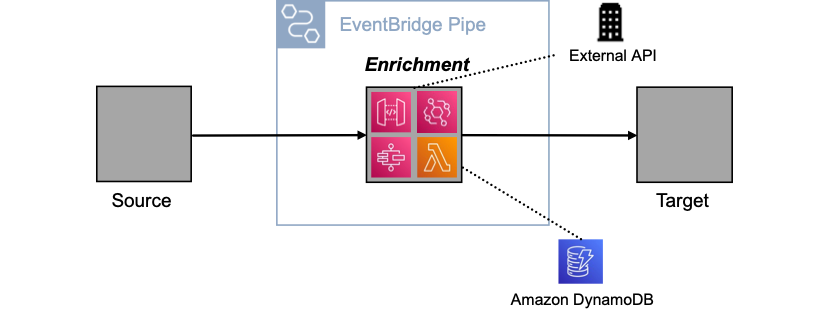
In the first pipe, you use the enrichment to split the event, in the second to retrieve the payload. Below are several enrichment options, such as using an external API via API Destinations, or using Amazon DynamoDB via Lambda. Other enrichment options are Amazon API Gateway and Step Functions.

Using a pipe to split and retrieve messages has three advantages. First, you keep events concise as they move through the system. Second, you ensure that the event contains all relevant information when it is processed. Third, you encapsulate the complexity of splitting and retrieving within the pipe.

The following code implements a pipe for the claim check pattern using the CDK:

const pipeRole = new iam.Role(this, 'ClaimCheckRole', { assumedBy: new iam.ServicePrincipal('pipes.amazonaws.com') });

claimCheckLambda.grantInvoke(pipeRole);
sourceQueue.grantConsumeMessages(pipeRole);
targetWorkflow.grantStartExecution(pipeRole);

const claimCheckPipe = new pipes.CfnPipe(this, 'ClaimCheckPipe', {
  roleArn: pipeRole.roleArn,
  source: sourceQueue.queueArn,
  target: targetWorkflow.stateMachineArn,
  enrichment: claimCheckLambda.functionArn,
  sourceParameters: { sqsQueueParameters: { batchSize: 1 } },
  targetParameters: { stepFunctionStateMachineParameters: { invocationType: 'FIRE_AND_FORGET' } },
});

Conclusion

This blog post shows how you can implement four enterprise integration patterns with Amazon EventBridge Pipes. In many cases, this reduces the amount of code you have to write and maintain. It can also simplify your architectures and, in some scenarios, reduce costs.

You can find the source code for all the patterns on the AWS samples GitHub repo.

For more serverless learning resources, visit Serverless Land. To find more patterns, go directly to the Serverless Patterns Collection.
Adopt Recommendations and Monitor Predictive Scaling for Optimal Compute Capacity

Post Syndicated from Sheila Busser original https://aws.amazon.com/blogs/compute/evaluating-predictive-scaling-for-amazon-ec2-capacity-optimization/

This post is written by Ankur Sethi, Sr. Product Manager, EC2, and Kinnar Sen, Sr. Specialist Solution Architect, AWS Compute.

Amazon EC2 Auto Scaling helps customers optimize their Amazon EC2 capacity by dynamically responding to varying demand. Based on customer feedback, we enhanced the scaling experience with the launch of predictive scaling policies. Predictive scaling proactively adds EC2 instances to your Auto Scaling group in anticipation of demand spikes. This results in better availability and performance for your applications that have predictable demand patterns and long initialization times. We recently launched a couple of features designed to help you assess the value of predictive scaling – prescriptive recommendations on whether to use predictive scaling based on its potential availability and cost impact, and integration with Amazon CloudWatch to continuously monitor the accuracy of predictions. In this post, we discuss the features in detail and the steps that you can easily adopt to enjoy the benefits of predictive scaling.

Recap: Predictive Scaling

EC2 Auto Scaling helps customers maintain application availability by managing the capacity and health of the underlying cluster. Prior to predictive scaling, EC2 Auto Scaling offered dynamic scaling policies such as target tracking and step scaling. These dynamic scaling policies are configured with an Amazon CloudWatch metric that represents an application’s load. EC2 Auto Scaling constantly monitors this metric and responds according to your policies, thereby triggering the launch or termination of instances. Although it’s extremely effective and widely used, this model is reactive in nature, and for larger spikes, may lead to unfulfilled capacity momentarily as the cluster is scaling out. Customers mitigate this by adopting aggressive scale out and conservative scale in to manage the additional buffer of instances. However, sometimes applications take a long time to initialize or have a recurring pattern with a sudden spike of high demand. These can have an impact on the initial response of the system when it is scaling out. Customers asked for a proactive scaling mechanism that can scale capacity ahead of predictable spikes, and so we delivered predictive scaling.

Predictive scaling was launched to make the scaling action proactive as it anticipates the changes required in the compute demand and scales accordingly. The scaling action is determined by ensemble machine learning (ML) built with data from your Auto Scaling group’s scaling patterns, as well as billions of data points from our observations. Predictive scaling should be used for applications where demand changes rapidly but with a recurring pattern, instances require a long time to initialize, or where you’re manually invoking scheduled scaling for routine demand patterns. Predictive scaling not only forecasts capacity requirements based on historical usage, but also learns continuously, thereby making forecasts more accurate with time. Furthermore, predictive scaling policy is designed to only scale out and not scale in your Auto Scaling groups, eliminating the risk of ending with lesser capacity because of inexact predictions. You must use dynamic scaling policy, scheduled scaling, or your own custom mechanism for scale-ins. In case of exceptional demand spikes, this addition of dynamic scaling policy can also improve your application performance by bridging the gap between demand and predicted capacity.

What’s new with predictive scaling

Predictive scaling policies can be configured in a non-mutative ‘Forecast Only’ mode to evaluate the accuracy of forecasts. When you’re ready to start scaling, you can switch to the ‘Forecast and Scale’ mode. Now we prescriptively recommend whether your policy should be switched to ‘Forecast and Scale’ mode if it can potentially lead to better availability and lower costs, saving you the time and effort of doing such an evaluation manually. You can test different configurations by creating multiple predictive scaling policies in ‘Forecast Only’ mode, and choose the one that performs best in terms of availability and cost improvements.

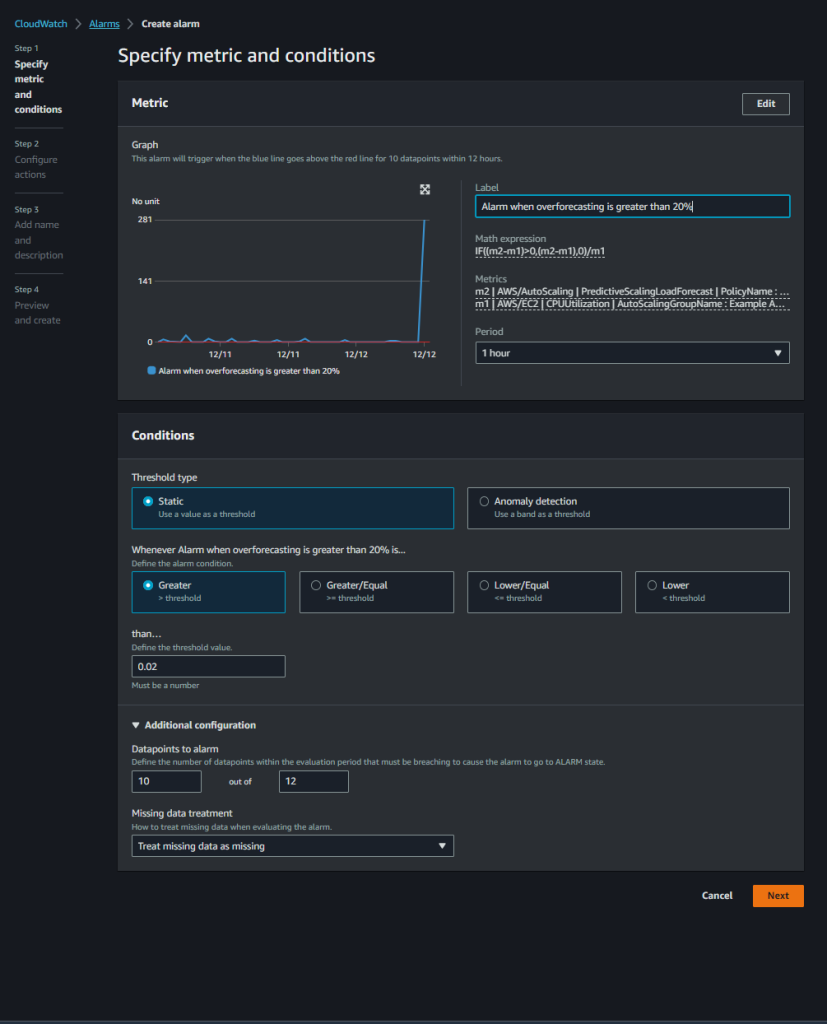
Monitoring and observability are key elements of AWS Well Architected Framework. Now we also offer CloudWatch metrics for your predictive scaling policies so that that you can programmatically monitor your predictive scaling policy for demand pattern changes or prolonged periods of inaccurate predictions. This will enable you to monitor the key performance metrics and make it easier to adopt AWS Well-Architected best practices.

In the following sections, we deep dive into the details of these two features.

Recommendations for predictive scaling

Once you set up an Auto Scaling group with predictive scaling policy in Forecast Only mode as explained in this introduction to predictive scaling blog post , you can review the results of the forecast visually and adjust any parameters to more accurately reflect the behavior that you desire. Evaluating simply on the basis of visualization may not be very intuitive if the scaling patterns are erratic. Moreover, if you keep higher minimum capacities, then the graph may show a flat line for the actual capacity as your Auto Scaling group capacity is an outcome of existing scaling policy configurations and the minimum capacity that you configured. This makes it difficult to contemplate whether the lower capacity predicted by predictive scaling wouldn’t leave your Auto Scaling group under-scaled.

This new feature provides a prescriptive guidance to switch on predictive scaling in Forecast and Scale mode based on the factors of availability and cost savings. To determine the availability and cost savings, we compare the predictions against the actual capacity and the optimal, required capacity. This required capacity is inferred based on whether your instances were running at a higher or lower value than the target value for scaling metric that you defined as part of the predictive scaling policy configuration. For example, if an Auto Scaling group is running 10 instances at 20% CPU Utilization while the target defined in predictive scaling policy is 40%, then the instances are running under-utilized by 50% and the required capacity is assumed to be 5 instances (half of your current capacity). For an Auto Scaling group, based on the time range in which you’re interested (two weeks as default), we aggregate the cost saving and availability impact of predictive scaling. The availability impact measures for the amount of time that the actual metric value was higher than the target value that you defined to be optimal for each policy. Similarly, cost savings measures the aggregated savings based on the capacity utilization of the underlying Auto Scaling group for each defined policy. The final cost and availability will lead us to a recommendation based on:

  • If availability increases (or remains same) and cost reduces (or remains same), then switch on Forecast and Scale
  • If availability reduces, then disable predictive scaling
  • If availability increase comes at an increased cost, then the customer should take the call based on their cost-availability tradeoff threshold

This figure shows the console view of how the recommendations look like on the Auto Scaling console. For each policy we make prescriptive recommendation of whether to switch to Forecast And Scale mode along with whether doing so can lead to better availability and lower costFigure 1: Predictive Scaling Recommendations on EC2 Auto Scaling console

The preceding figure shows how the console reflects the recommendation for a predictive scaling policy. You get information on whether the policy can lead to higher availability and lower cost, which leads to a recommendation to switch to Forecast and Scale. To achieve this cost saving, you might have to lower your minimum capacity and aim for higher utilization in dynamic scaling policies.

To get the most value from this feature, we recommend that you create multiple predictive scaling policies in Forecast Only mode with different configurations, choosing different metrics and/or different target values. Target value is an important lever that changes how aggressive the capacity forecasts must be. A lower target value increases your capacity forecast resulting in better availability for your application. However, this also means more dollars to be spent on the Amazon EC2 cost. Similarly, a higher target value can leave you under-scaled while reactive scaling bridges the gap in just a few minutes. Separate estimates of cost and availability impact are provided for each of the predictive scaling policies. We recommend using a policy if either availability or cost are improved and the other variable improves or stays the same. As long as there is a predictable pattern, Auto Scaling enhanced with predictive scaling maintains high availability for your applications.

Continuous Monitoring of predictive scaling

Once you’re using a predictive scaling policy in Forecast and Scale mode based on the recommendation, you must monitor the predictive scaling policy for demand pattern changes or inaccurate predictions. We introduced two new CloudWatch Metrics for predictive scaling called ‘PredictiveScalingLoadForecast’ and ‘PredictiveScalingCapacityForecast’. Using CloudWatch mertic math feature, you can create a customized metric that measures the accuracy of predictions. For example, to monitor whether your policy is over or under-forecasting, you can publish separate metrics to measure the respective errors. In the following graphic, we show how the metric math expressions can be used to create a Mean Absolute Error for over-forecasting on the load forecasts. Because predictive scaling can only increase capacity, it is useful to alert when the policy is excessively over-forecasting to prevent unnecessary cost.This figure shows the CloudWatch graph of three metrics – the total CPU Utilization of the Auto Scaling group, the load forecast generated by predictive scaling, and the derived metric using metric math that measures error for over-forecastingFigure 2: Graphing an accuracy metric using metric math on CloudWatch

In the previous graph, the total CPU Utilization of the Auto Scaling group is represented by m1 metric in orange color while the predicted load by the policy is represented by m2 metric in green color. We used the following expression to get the ratio of over-forecasting error with respect to the actual value.

IF((m2-m1)>0, (m2-m1),0))/m1

Next, we will setup an alarm to automatically send notifications using Amazon Simple Notification Service (Amazon SNS). You can create similar accuracy monitoring for capacity forecasts, but remember that once the policy is in Forecast and Scale mode, it already starts influencing the actual capacity. Hence, putting alarms on load forecast accuracy might be more intuitive as load is generally independent of the capacity of an Auto Scaling group.

This figure shows creation of alarm when 10 out of 12 data points breach 0.02 threshold for the accuracy metricFigure 3: Creating a CloudWatch Alarm on the accuracy metric

In the above screenshot, we have set an alarm that triggers when our custom accuracy metric goes above 0.02 (20%) for 10 out of last 12 data points which translates to 10 hours of the last 12 hours. We prefer to alarm on a greater number of data points so that we get notified only when predictive scaling is consistently giving inaccurate results.

Conclusion

With these new features, you can make a more informed decision about whether predictive scaling is right for you and which configuration makes the most sense. We recommend that you start off with Forecast Only mode and switch over to Forecast and Scale based on the recommendations. Once in Forecast and Scale mode, predictive scaling starts taking proactive scaling actions so that your instances are launched and ready to contribute to the workload in advance of the predicted demand. Then continuously monitor the forecast to maintain high availability and cost optimization of your applications. You can also use the new predictive scaling metrics and CloudWatch features, such as metric math, alarms, and notifications, to monitor and take actions when predictions are off by a set threshold for prolonged periods.

Processing geospatial IoT data with AWS IoT Core and the Amazon Location Service

Post Syndicated from Marcia Villalba original https://aws.amazon.com/blogs/compute/processing-geospatial-iot-data-with-aws-iot-core-and-the-amazon-location-service/

This post is written by Swarna Kunnath (Cloud Application Architect), and Anand Komandooru (Sr. Cloud Application Architect).

This blog post shows how to republish messages that arrive from Internet of Things (IoT) devices across AWS accounts using a replatforming approach. A replatforming approach minimizes changes to the core application architecture, allowing an organization to reduce risk and meet business needs more quickly. In this post, you also learn how to track an IoT device’s location using the Amazon Location Service.

The example used in this post relates to an aviation company that has airplanes with line replacement unit devices or transponders. Transponders are IoT devices that send airplane geospatial data (location and altitude) to the AWS IoT Core service. The company’s airplane transponders send location data to the AWS IoT Core service provisioned in an existing AWS account (source account). The solution required manual intervention to track airplane location sent by the transponders.

They must rearchitect their application due to an internal reorganization event. As part of the rearchitecture approach, the business decides to enhance the application to process the transponder messages in another AWS account (destination account). In addition, the business needs full automation of the airplane’s location tracking process, to minimize the risk of the application changes, and to deliver the changes quickly.

Solution overview

The high-level solution republishes the IoT messages from the source account to the destination account using AWS IoT Core, Amazon SQS, AWS Lambda, and integrates the application with Amazon Location Service. IoT messages are replicated to an IoT topic in the destination account for downstream processing, minimizing changes to the original application architecture. Integration with Amazon Location Service automates the process of device location tracking and alert generation.

The AWS IoT platform allows you to connect your internet-enabled devices to the AWS Cloud via MQTT, HTTP, or WebSocket protocol. Once connected, the devices send data to the MQTT topics. Data ingested on MQTT topics is routed into AWS services (Amazon S3, SQS, Amazon DynamoDB, and Lambda) by configuring rules in the AWS IoT Rules Engine. The AWS IoT Rules Engine offers ways to define queries to format and filter messages published by these devices, and supports integration with several other AWS services as targets.

The Amazon Location Service lets you add geospatial data including capabilities such as maps, points of interest, geocoding, routing, geofences, and tracking. The tracker with geofence tracks the location of the device based on the geospatial data in the published IoT messages. Amazon Location Service generates enter and exit events and integrates with Amazon EventBridge and Amazon Simple Notification Service (Amazon SNS) to generate alerts based on defined filters in EventBridge rules.

The solution in this post delivers high availability, scalability, and cost efficiency by using serverless and managed services. The serverless services used by this solution also provide automatic scaling and built-in high availability. Integrating Amazon Location Service with AWS IoT and EventBridge helps to automate the auditing and processing of geospatial messages.

Solution architecture

These steps describe an end-to-end sequence of events:

  1. An IoT device (a transponder in an airplane) publishes a message to the AWS IoT Core service in the source account.
  2. The message arrives at an AWS IoT Core topic in the source account.
  3. AWS IoT Rules Engine receives the message and processes it, using IoT rules attached to the corresponding topic in the source account.
  4. An AWS IoT rule replicates the message to an SQS queue in the destination account.
  5. A Lambda function in the destination account polls the SQS queue and publishes received messages in batches to the destination account IoT topic.
  6. The Location action configured to the IoT rule sends the messages to Amazon Location Service tracker from the IoT topic.
  7. An Amazon Location tracker sends events when an IoT device enters or exits a linked geofence.
  8. EventBridge receives these events and, via the configured event rule, sends out SNS notifications for the configured devices.

Pre-requisites

This example has the following prerequisites:

  1. Access to the AWS services mentioned in this blog post within two AWS Accounts.
  2. A local install of AWS SAM CLI to build and deploy the sample code.

Solution walkthrough

To deploy this solution, first deploy IoT components via the AWS Serverless Application Model (AWS SAM), in the source and destination accounts. After, configure Amazon Location Service resources in the destination account. To learn more, visit the AWS SAM deployment documentation.

Deploying the code

Deploy the following AWS SAM templates in order:

To build and deploy the code, run:

sam build --template <TemplateName>.yaml
sam deploy --guided

Configuring a tracker

Amazon Location Trackers send device location updates that provide data to retrieve current and historical locations for devices.

Using Amazon Location Trackers and Amazon Location Geofences together, you can automatically evaluate the location updates from your IoT devices against your geofences to generate the geofence events. Actions could be taken to generate the alerts based on the areas of interest.

  1. Follow the instructions in the documentation to create the tracker resource from the AWS Management Console. Use this information for the new tracker:
    • Name: Enter a unique name that has a maximum of 100 characters. For example, FlightTracker.
    • Description: Enter an optional description. For example, Tracker for storing device positions.
  2. Configure a Location action to the destination IoT rule that receives messages from the destination IoT topic and publishes them in batches to the configured Tracker device (for example, FlightTracker). The parameters in the JSON data that is returned to the Location action can also be configured via substitution templates.

Geofence collection

Geofences contain points and vertices that form a closed boundary, which defines an area of interest. For example, flight origin and destination details. You can use tools, such as GeoJSON.io, to draw geofences and save the output as a GeoJSON file. Follow the instructions in the documentation to create the GeoJSON file and link it to the geofence collection.

  1. Create the geofence collection with a GeoJSON file and link it to the tracker you just created.
  2. Link the tracker to the geofence by following these instructions and start tracking the device’s location updates. You can link them together so that you automatically evaluate location updates against all your geofences. You can evaluate device positions against geofences on demand as well.

When device positions are evaluated against geofences, they generate events. For example, when a plane enters or exits a location specified in the geofence.

You can configure EventBridge with rules to react to these events. You can set up SNS to notify your clients when a specific tracker device location changes. Follow the instructions in the documentation on how to set up EventBridge rules to integrate with Amazon Location Service events.

Testing the solution

You can test the first part of the solution by sending an IoT message with location details in the JSON format from the source account and verify that the message arrives at the destination account SQS queue. Detailed instructions to publish a test message from the source account that includes location information (latitude and longitude) can be found here.

Messages from the destination account SQS queue are published to the Amazon Location Service Tracker. When the location in the test message matches the criteria provided in the geofence, Amazon Location Service generates an event. EventBridge has a rule configured that gets matched when an Amazon Location tracker event arrives, and the rule target is an SNS topic that sends an email or text message to the client.

Cleaning up

To avoid incurring future charges, delete the CloudFormation stacks, location tracker, and geofence collection created as part of the solution walk-through. Replace the resource identifiers in the following commands with the ID/name of the resources.

  1. Delete the SAM application stack:
    aws cloudformation delete-stack --stack-name <StackName>
    

    Refer to this documentation for further information.

  2. Delete the location tracker:
    aws location delete-tracker --tracker-name <TrackerName>
  3. Delete the geofence collection:
    aws location delete-geofence-collection --collection-name <GeoCollectionName>

Conclusion

This blog post shows how to create a serverless solution for cross account IoT message publishing and tracking device location updates using Amazon Location Service.

It describes the process of how to publish AWS IoT messages across multiple accounts. Integration with the Amazon Location Service shows how to track IoT device location updates and generate alerts, alleviating the need for manual device location tracking.

For more serverless learning resources, visit Serverless Land.

Introducing maximum concurrency of AWS Lambda functions when using Amazon SQS as an event source

Post Syndicated from Julian Wood original https://aws.amazon.com/blogs/compute/introducing-maximum-concurrency-of-aws-lambda-functions-when-using-amazon-sqs-as-an-event-source/

This blog post is written by Solutions Architects John Lee and Jeetendra Vaidya.

AWS Lambda now provides a way to control the maximum number of concurrent functions invoked by Amazon SQS as an event source. You can use this feature to control the concurrency of Lambda functions processing messages in individual SQS queues.

This post describes how to set the maximum concurrency of SQS triggers when using SQS as an event source with Lambda. It also provides an overview of the scaling behavior of Lambda using this architectural pattern, challenges this feature helps address, and a demo of the maximum concurrency feature.

Overview

Lambda uses an event source mapping to process items from a stream or queue. The event source mapping reads from an event source, such as an SQS queue, optionally filters the messages, batches them, and invokes the mapped Lambda function.

The scaling behavior for Lambda integration with SQS FIFO queues is simple. A single Lambda function processes batches of messages within a single message group to ensure that messages are processed in order.

For SQS standard queues, the event source mapping polls the queue to consume incoming messages, starting at five concurrent batches with five functions at a time. As messages are added to the SQS queue, Lambda continues to scale out to meet demand, adding up to 60 functions per minute, up to 1,000 functions, to consume those messages. To learn more about Lambda scaling behavior, read ”Understanding how AWS Lambda scales with Amazon SQS standard queues.”

Lambda processing standard SQS queues

Lambda processing standard SQS queues

Challenges

When a large number of messages are in the SQS queue, Lambda scales out, adding additional functions to process the messages. The scale out can consume the concurrency quota in the account. To prevent this from happening, you can set reserved concurrency for individual Lambda functions. This ensures that the specified Lambda function can always scale to that much concurrency, but it also cannot exceed this number.

When the Lambda function concurrency reaches the reserved concurrency limit, the queue configuration specifies the subsequent behavior. The message is returned to the queue and retried based on the redrive policy, expired based on its retention policy, or sent to another SQS dead-letter queue (DLQ). While sending unprocessed messages to a DLQ is a good option to preserve messages, it requires a separate mechanism to inspect and process messages from the DLQ.

The following example shows a Lambda function reaching its reserved concurrency quota of 10.

Lambda reaching reserved concurrency of 10.

Lambda reaching reserved concurrency of 10.

Maximum Lambda concurrency with SQS as an event source

The launch of maximum concurrency for SQS as an event source allows you to control Lambda function concurrency per source. You set the maximum concurrency on the event source mapping, not on the Lambda function.

This event source mapping setting does not change the scaling or batching behavior of Lambda with SQS. You can continue to batch messages with a customized batch size and window. It rather sets a limit on the maximum number of concurrent function invocations per SQS event source. Once Lambda scales and reaches the maximum concurrency configured on the event source, Lambda stops reading more messages from the queue. This feature also provides you with the flexibility to define the maximum concurrency for individual event sources when the Lambda function has multiple event sources.

Maximum concurrency is set to 10 for the SQS queue.

Maximum concurrency is set to 10 for the SQS queue.

This feature can help prevent a Lambda function from consuming all available Lambda concurrency of the account and avoids messages returning to the queue unnecessarily because of Lambda functions being throttled. It provides an easier way to control and consume messages at a desired pace, controlled by the maximum number of concurrent Lambda functions.

The maximum concurrency setting does not replace the existing reserved concurrency feature. Both serve distinct purposes and the two features can be used together. Maximum concurrency can help prevent overwhelming downstream systems and unnecessary throttled invocations. Reserved concurrency guarantees a maximum number of concurrent instances for the function.

When used together, the Lambda function can have its own allocated capacity (reserved concurrency), while being able to control the throughput for each event source (maximum concurrency). When using the two features together, you must set the function reserved concurrency higher than the maximum concurrency on the SQS event source mapping to prevent throttling.

Setting maximum concurrency for SQS as an event source

You can configure the maximum concurrency for an SQS event source through the AWS Management Console, AWS Command Line Interface (CLI), or infrastructure as code tools such as AWS Serverless Application Model (AWS SAM). The minimum supported value is 2 and the maximum value is 1000. Refer to the Lambda quotas documentation for the latest limits.

Configuring the maximum concurrency for an SQS trigger in the console

Configuring the maximum concurrency for an SQS trigger in the console

You can set the maximum concurrency through the create-event-source-mapping AWS CLI command.

aws lambda create-event-source-mapping --function-name my-function --ScalingConfig {MaxConcurrency=2} --event-source-arn arn:aws:sqs:us-east-2:123456789012:my-queue

Seeing the maximum concurrency setting in action

The following demo compares Lambda receiving and processes messages differently when using maximum concurrency compared to reserved concurrency.

This GitHub repository contains an AWS SAM template that deploys the following resources:

  • ReservedConcurrencyQueue (SQS queue)
  • ReservedConcurrencyDeadLetterQueue (SQS queue)
  • ReservedConcurrencyFunction (Lambda function)
  • MaxConcurrencyQueue (SQS queue)
  • MaxConcurrencyDeadLetterQueue (SQS queue)
  • MaxConcurrencyFunction (Lambda function)
  • CloudWatchDashboard (CloudWatch dashboard)

The AWS SAM template provisions two sets of identical architectures and an Amazon CloudWatch dashboard to monitor the resources. Each architecture comprises a Lambda function receiving messages from an SQS queue, and a DLQ for the SQS queue.

The maxReceiveCount is set as 1 for the SQS queues, which sends any returned messages directly to the DLQ. The ReservedConcurrencyFunction has its reserved concurrency set to 5, and the MaxConcurrencyFunction has the maximum concurrency for the SQS event source set to 5.

Pre-requisites

Running this demo requires the AWS CLI and the AWS SAM CLI. After installing both CLIs, clone this GitHub repository and navigate to the root of the directory:

git clone https://github.com/aws-samples/aws-lambda-amazon-sqs-max-concurrency
cd aws-lambda-amazon-sqs-max-concurrency

Deploying the AWS SAM template

  1. Build the AWS SAM template with the build command to prepare for deployment to your AWS environment.
  2. sam build
  3. Use the guided deploy command to deploy the resources in your account.
  4. sam deploy --guided
  5. Give the stack a name and accept the remaining default values. Once deployed, you can track the progress through the CLI or by navigating to the AWS CloudFormation page in the AWS Management Console.
  6. Note the queue URLs from the Outputs tab in the AWS SAM CLI, CloudFormation console, or navigate to the SQS console to find the queue URLs.
The Outputs tab of the launched AWS SAM template provides URLs to CloudWatch dashboard and SQS queues.

The Outputs tab of the launched AWS SAM template provides URLs to CloudWatch dashboard and SQS queues.

Running the demo

The deployed Lambda function code simulates processing by sleeping for 10 seconds before returning a 200 response. This allows the function to reach a high function concurrency number with only a small number of messages.

To add 25 messages to the Reserved Concurrency queue, run the following commands. Replace <ReservedConcurrencyQueueURL> with your queue URL from the AWS SAM Outputs.

for i in {1..25}; do aws sqs send-message --queue-url <ReservedConcurrencyQueueURL> --message-body testing; done 

To add 25 messages to the Maximum Concurrency queue, run the following commands. Replace <MaxConcurrencyQueueURL> with your queue URL from the AWS SAM Outputs.

for i in {1..25}; do aws sqs send-message --queue-url <MaxConcurrencyQueueURL> --message-body testing; done 

After sending messages to both queues, navigate to the dashboard URL available in the Outputs tab to view the CloudWatch dashboard.

Validating results

Both Lambda functions have the same number of invocations and the same concurrent invocations fixed at 5. The CloudWatch dashboard shows the ReservedConcurrencyFunction experienced throttling and 9 messages, as seen in the top-right metric, were sent to the corresponding DLQ. The MaxConcurrencyFunction did not experience any throttling and messages were not delivered to the DLQ.

CloudWatch dashboard showing throttling and DLQs.

CloudWatch dashboard showing throttling and DLQs.

Clean up

To remove all the resources created in this demo, use the delete command and follow the prompts:

sam delete

Conclusion

You can now control the maximum number of concurrent functions invoked by SQS as a Lambda event source. This post explains the scaling behavior of Lambda using this architectural pattern, challenges this feature helps address, and a demo of maximum concurrency in action.

There are no additional charges to use this feature besides the standard SQS and Lambda charges. You can start using maximum concurrency for SQS as an event source with new or existing event source mappings by connecting it with SQS. This feature is available in all Regions where Lambda and SQS are available.

For more serverless learning resources, visit Serverless Land.
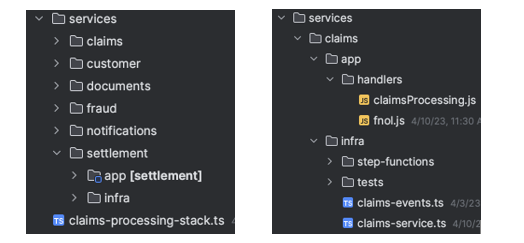
Genomics workflows, Part 4: processing archival data

Post Syndicated from Rostislav Markov original https://aws.amazon.com/blogs/architecture/genomics-workflows-part-4-processing-archival-data/

Genomics workflows analyze data at petabyte scale. After processing is complete, data is often archived in cold storage classes. In some cases, like studies on the association of DNA variants against larger datasets, archived data is needed for further processing. This means manually initiating the restoration of each archived object and monitoring the progress. Scientists require a reliable process for on-demand archival data restoration so their workflows do not fail.

In Part 4 of this series, we look into genomics workloads processing data that is archived with Amazon Simple Storage Service (Amazon S3). We design a reliable data restoration process that informs the workflow when data is available so it can proceed. We build on top of the design pattern laid out in Parts 1-3 of this series. We use event-driven and serverless principles to provide the most cost-effective solution.

Use case

Our use case focuses on data in Amazon Simple Storage Service Glacier (Amazon S3 Glacier) storage classes. The S3 Glacier Instant Retrieval storage class provides the lowest-cost storage for long-lived data that is rarely accessed but requires retrieval in milliseconds.

The S3 Glacier Flexible Retrieval and S3 Glacier Deep Archive provide further cost savings, with retrieval times ranging from minutes to hours. We focus on the latter in order to provide the most cost-effective solution.

You must first restore the objects before accessing them. Our genomics workflow will pause until the data restore completes. The requirements for this workflow are:

  • Reliable launch of the restore so our workflow doesn’t fail (due to S3 Glacier service quotas, or because not all objects were restored)
  • Event-driven design to mirror the event-driven nature of genomics workflows and perform the retrieval upon request
  • Cost-effective and easy-to-manage by using serverless services
  • Upfront detection of archived data when formulating the genomics workflow task, avoiding idle computational tasks that incur cost
  • Scalable and elastic to meet the restore needs of large, archived datasets

Solution overview

Genomics workflows take multiple input parameters to prepare the initiation, such as launch ID, data path, workflow endpoint, and workflow steps. We store this data, including workflow configurations, in an S3 bucket. An AWS Fargate task reads from the S3 bucket and prepares the workflow. It detects if the input parameters include S3 Glacier URLs.

We use Amazon Simple Queue Service (Amazon SQS) to decouple S3 Glacier index creation from object restore actions (Figure 1). This increases the reliability of our process.

Solution architecture for S3 Glacier object restore

Figure 1. Solution architecture for S3 Glacier object restore

An AWS Lambda function creates the index of all objects in the specified S3 bucket URLs and submits them as an SQS message.

Another Lambda function polls the SQS queue and submits the request(s) to restore the S3 Glacier objects to S3 Standard storage class.

The function writes the job ID of each S3 Glacier restore request to Amazon DynamoDB. After the restore is complete, Lambda sets the status of the workflow to READY. Only then can any computing jobs start, such as with AWS Batch.

Implementation considerations

We consider the use case of Snakemake with Tibanna, which we detailed in Part 2 of this series. This allows us to dive deeper on launch details.

Snakemake is an open-source utility for whole-genome-sequence mapping in directed acyclic graph format. Snakemake uses Snakefiles to declare workflow steps and commands. Tibanna is an open-source, AWS-native software that runs bioinformatics data pipelines. It supports Snakefile syntax, plus other workflow languages, including Common Workflow Language and Workflow Description Language (WDL).

We recommend using Amazon Genomics CLI if Tibanna is not needed for your use case, or Amazon Omics if your workflow definitions are compliant with the supported WDL and Nextflow specifications.

Formulate the restore request

The Snakemake Fargate launch container detects if the S3 objects under the requested S3 bucket URLs are stored in S3 Glacier. The Fargate launch container generates and puts a JSON binary base call (BCL) configuration file into an S3 bucket and exits successfully. This file includes the launch ID of the workflow, corresponding with the DynamoDB item key, plus the S3 URLs to restore.

Query the S3 URLs

Once the JSON BCL configuration file lands in this S3 bucket, the S3 Event Notification PutObject event invokes a Lambda function. This function parses the configuration file and recursively queries for all S3 object URLs to restore.

Initiate the restore

The main Lambda function then submits messages to the SQS queue that contains the full list of S3 URLs that need to be restored. SQS messages also include the launch ID of the workflow. This is to ensure we can bind specific restoration jobs to specific workflow launches. If all S3 Glacier objects belong to Flexible Retrieval storage class, the Lambda function puts the URLs in a single SQS message, enabling restoration with Bulk Glacier Job Tier. The Lambda function also sets the status of the workflow to WAITING in the corresponding DynamoDB item. The WAITING state is used to notify the end user that the job is waiting on the data-restoration process and will continue once the data restoration is complete.

A secondary Lambda function polls for new messages landing in the SQS queue. This Lambda function submits the restoration request(s)—for example, as a free-of-charge Bulk retrieval—using the RestoreObject API. The function subsequently writes the S3 Glacier Job ID of each request in our DynamoDB table. This allows the main Lambda function to check if all Job IDs associated with a workflow launch ID are complete.

Update status

The status of our workflow launch will remain WAITING as long as the Glacier object restore is incomplete. The AWS CloudTrail logs of completed S3 Glacier Job IDs invoke our main Lambda function (via an Amazon EventBridge rule) to update the status of the restoration job in our DynamoDB table. With each invocation, the function checks if all Job IDs associated with a workflow launch ID are complete.

After all objects have been restored, the function updates the workflow launch with status READY. This launches the workflow with the same launch ID prior to the restore.

Conclusion

In this blog post, we demonstrated how life-science research teams can make use of their archival data for genomic studies. We designed an event-driven S3 Glacier restore process, which retrieves data upon request. We discussed how to reliably launch the restore so our workflow doesn’t fail. Also, we determined upfront if an S3 Glacier restore is needed and used the WAITING state to prevent our workflow from failing.

With this solution, life-science research teams can save money using Amazon S3 Glacier without worrying about their day-to-day work or manually administering S3 Glacier object restores.

Related information

AWS Week in Review – November 21, 2022

Post Syndicated from Danilo Poccia original https://aws.amazon.com/blogs/aws/aws-week-in-review-november-21-2022/

This post is part of our Week in Review series. Check back each week for a quick roundup of interesting news and announcements from AWS!

A new week starts, and the News Blog team is getting ready for AWS re:Invent! Many of us will be there next week and it would be great to meet in person. If you’re coming, do you know about PeerTalk? It’s an onsite networking program for re:Invent attendees available through the AWS Events mobile app (which you can get on Google Play or Apple App Store) to help facilitate connections among the re:Invent community.

If you’re not coming to re:Invent, no worries, you can get a free online pass to watch keynotes and leadership sessions.

Last Week’s Launches
It was a busy week for our service teams! Here are the launches that got my attention:

AWS Region in Spain – The AWS Region in Aragón, Spain, is now open. The official name is Europe (Spain), and the API name is eu-south-2.

Amazon Athena – You can now apply AWS Lake Formation fine-grained access control policies with all table and file format supported by Amazon Athena to centrally manage permissions and access data catalog resources in your Amazon Simple Storage Service (Amazon S3) data lake. With fine-grained access control, you can restrict access to data in query results using data filters to achieve column-level, row-level, and cell-level security.

Amazon EventBridge – With these additional filtering capabilities, you can now filter events by suffix, ignore case, and match if at least one condition is true. This makes it easier to write complex rules when building event-driven applications.

AWS Controllers for Kubernetes (ACK) – The ACK for Amazon Elastic Compute Cloud (Amazon EC2) is now generally available and lets you provision and manage EC2 networking resources, such as VPCs, security groups and internet gateways using the Kubernetes API. Also, the ACK for Amazon EMR on EKS is now generally available to allow you to declaratively define and manage EMR on EKS resources such as virtual clusters and job runs as Kubernetes custom resources. Learn more about ACK for Amazon EMR on EKS in this blog post.

Amazon HealthLake – New analytics capabilities make it easier to query, visualize, and build machine learning (ML) models. Now HealthLake transforms customer data into an analytics-ready format in near real-time so that you can query, and use the resulting data to build visualizations or ML models. Also new is Amazon HealthLake Imaging (preview), a new HIPAA-eligible capability that enables you to easily store, access, and analyze medical images at any scale. More on HealthLake Imaging can be found in this blog post.

Amazon RDS – You can now transfer files between Amazon Relational Database Service (RDS) for Oracle and an Amazon Elastic File System (Amazon EFS) file system. You can use this integration to stage files like Oracle Data Pump export files when you import them. You can also use EFS to share a file system between an application and one or more RDS Oracle DB instances to address specific application needs.

Amazon ECS and Amazon EKS – We added centralized logging support for Windows containers to help you easily process and forward container logs to various AWS and third-party destinations such as Amazon CloudWatch, S3, Amazon Kinesis Data Firehose, Datadog, and Splunk. See these blog posts for how to use this new capability with ECS and with EKS.

AWS SAM CLI – You can now use the Serverless Application Model CLI to locally test and debug an AWS Lambda function defined in a Terraform application. You can see a walkthrough in this blog post.

AWS Lambda – Now supports Node.js 18 as both a managed runtime and a container base image, which you can learn more about in this blog post. Also check out this interesting article on why and how you should use AWS SDK for JavaScript V3 with Node.js 18. And last but not least, there is new tooling support to build and deploy native AOT compiled .NET 7 applications to AWS Lambda. With this tooling, you can enable faster application starts and benefit from reduced costs through the faster initialization times and lower memory consumption of native AOT applications. Learn more in this blog post.

AWS Step Functions – Now supports cross-account access for more than 220 AWS services to process data, automate IT and business processes, and build applications across multiple accounts. Learn more in this blog post.

AWS Fargate – Adds the ability to monitor the utilization of the ephemeral storage attached to an Amazon ECS task. You can track the storage utilization with Amazon CloudWatch Container Insights and ECS Task Metadata endpoint.

AWS Proton – Now has a centralized dashboard for all resources deployed and managed by AWS Proton, which you can learn more about in this blog post. You can now also specify custom commands to provision infrastructure from templates. In this way, you can manage templates defined using the AWS Cloud Development Kit (AWS CDK) and other templating and provisioning tools. More on CDK support and AWS CodeBuild provisioning can be found in this blog post.

AWS IAM – You can now use more than one multi-factor authentication (MFA) device for root account users and IAM users in your AWS accounts. More information is available in this post.

Amazon ElastiCache – You can now use IAM authentication to access Redis clusters. With this new capability, IAM users and roles can be associated with ElastiCache for Redis users to manage their cluster access.

Amazon WorkSpaces – You can now use version 2.0 of the WorkSpaces Streaming Protocol (WSP) host agent that offers significant streaming quality and performance improvements, and you can learn more in this blog post. Also, with Amazon WorkSpaces Multi-Region Resilience, you can implement business continuity solutions that keep users online and productive with less than 30-minute recovery time objective (RTO) in another AWS Region during disruptive events. More on multi-region resilience is available in this post.

Amazon CloudWatch RUM – You can now send custom events (in addition to predefined events) for better troubleshooting and application specific monitoring. In this way, you can monitor specific functions of your application and troubleshoot end user impacting issues unique to the application components.

AWS AppSync – You can now define GraphQL API resolvers using JavaScript. You can also mix functions written in JavaScript and Velocity Template Language (VTL) inside a single pipeline resolver. To simplify local development of resolvers, AppSync released two new NPM libraries and a new API command. More info can be found in this blog post.

AWS SDK for SAP ABAP – This new SDK makes it easier for ABAP developers to modernize and transform SAP-based business processes and connect to AWS services natively using the SAP ABAP language. Learn more in this blog post.

AWS CloudFormation – CloudFormation can now send event notifications via Amazon EventBridge when you create, update, or delete a stack set.

AWS Console – With the new Applications widget on the Console home, you have one-click access to applications in AWS Systems Manager Application Manager and their resources, code, and related data. From Application Manager, you can view the resources that power your application and your costs using AWS Cost Explorer.

AWS Amplify – Expands Flutter support (developer preview) to Web and Desktop for the API, Analytics, and Storage use cases. You can now build cross-platform Flutter apps with Amplify that target iOS, Android, Web, and Desktop (macOS, Windows, Linux) using a single codebase. Learn more on Flutter Web and Desktop support for AWS Amplify in this post. Amplify Hosting now supports fully managed CI/CD deployments and hosting for server-side rendered (SSR) apps built using Next.js 12 and 13. Learn more in this blog post and see how to deploy a NextJS 13 app with the AWS CDK here.

Amazon SQS – With attribute-based access control (ABAC), you can define permissions based on tags attached to users and AWS resources. With this release, you can now use tags to configure access permissions and policies for SQS queues. More details can be found in this blog.

AWS Well-Architected Framework – The latest version of the Data Analytics Lens is now available. The Data Analytics Lens is a collection of design principles, best practices, and prescriptive guidance to help you running analytics on AWS.

AWS Organizations – You can now manage accounts, organizational units (OUs), and policies within your organization using CloudFormation templates.

For a full list of AWS announcements, be sure to keep an eye on the What’s New at AWS page.

Other AWS News
A few more stuff you might have missed:

Introducing our final AWS Heroes of the year – As the end of 2022 approaches, we are recognizing individuals whose enthusiasm for knowledge-sharing has a real impact with the AWS community. Please meet them here!

The Distributed Computing ManifestoWerner Vogles, VP & CTO at Amazon.com, shared the Distributed Computing Manifesto, a canonical document from the early days of Amazon that transformed the way we built architectures and highlights the challenges faced at the end of the 20th century.

AWS re:Post – To make this community more accessible globally, we expanded the user experience to support five additional languages. You can now interact with AWS re:Post also using Traditional Chinese, Simplified Chinese, French, Japanese, and Korean.

For AWS open-source news and updates, here’s the latest newsletter curated by Ricardo to bring you the most recent updates on open-source projects, posts, events, and more.

Upcoming AWS Events
As usual, there are many opportunities to meet:

AWS re:Invent – Our yearly event is next week from November 28 to December 2. If you can’t be there in person, get your free online pass to watch live the keynotes and the leadership sessions.

AWS Community DaysAWS Community Day events are community-led conferences to share and learn together. Join us in Sri Lanka (on December 6-7), Dubai, UAE (December 10), Pune, India (December 10), and Ahmedabad, India (December 17).

That’s all from me for this week. Next week we’ll focus on re:Invent, and then we’ll take a short break. We’ll be back with the next Week in Review on December 12!

Danilo

Introducing attribute-based access controls (ABAC) for Amazon SQS

Post Syndicated from James Beswick original https://aws.amazon.com/blogs/compute/introducing-attribute-based-access-controls-abac-for-amazon-sqs/

This post is written by Vikas Panghal (Principal Product Manager), and Hardik Vasa (Senior Solutions Architect).

Amazon Simple Queue Service (SQS) is a fully managed message queuing service that makes it easier to decouple and scale microservices, distributed systems, and serverless applications. SQS queues enable asynchronous communication between different application components and ensure that each of these components can keep functioning independently without losing data.

Today we’re announcing support for attribute-based access control (ABAC) using queue tags with the SQS service. As an AWS customer, if you use multiple SQS queues to achieve better application decoupling, it is often challenging to manage access to individual queues. In such cases, using tags can enable you to classify these resources in different ways, such as by owner, category, or environment.

This blog post demonstrates how to use tags to allow conditional access to SQS queues. You can use attribute-based access control (ABAC) policies to grant access rights to users through policies that combine attributes together. ABAC can be helpful in rapidly growing environments, where policy management for each individual resource can become cumbersome.

ABAC for SQS is supported in all Regions where SQS is currently available.

Overview

SQS supports tagging of queues. Each tag is a label comprising a customer-defined key and an optional value that can make it easier to manage, search for, and filter resources. Tags allows you to assign metadata to your SQS resources. This can help you track and manage the costs associated with your queues, provide enhanced security in your AWS Identity and Access Management (IAM) policies, and lets you easily filter through thousands of queues.

SQS queue options in the console

The preceding image shows SQS queue in AWS Management Console with two tags – ‘auto-delete’ with value of ‘no’ and ‘environment’ with value of ‘prod’.

Attribute-based access controls (ABAC) is an authorization strategy that defines permissions based on tags attached to users and AWS resources. With ABAC, you can use tags to configure IAM access permissions and policies for your queues. ABAC hence enables you to scale your permissions management easily. You can author a single permissions policy in IAM using tags that you create per business role, and you no longer need to update the policy while adding each new resource.

You can also attach tags to AWS Identity and Access Management (IAM) principals to create an ABAC policy. These ABAC policies can be designed to allow SQS operations when the tag on the IAM user or role making the call matches the SQS queue tag.

ABAC provides granular and flexible access control based on attributes and values, reduces security risk because of misconfigured role-based policy, and easily centralizes auditing and access policy management.

ABAC enables two key use cases:

  1. Tag-based Access Control: You can use tags to control access to your SQS queues, including control plane and data plane API calls.
  2. Tag-on-Create: You can enforce tags during the creation of SQS queues and deny the creation of SQS resources without tags.

Tagging for access control

Let’s take a look at a couple of examples on using tags for access control.

Let’s say that you would want to restrict IAM user to all SQS actions for all queues that include a resource tag with the key environment and the value production. The following IAM policy helps to fulfill the requirement.

{
    "Version": "2012-10-17",
    "Statement": [
        {
            "Sid": "DenyAccessForProd",
            "Effect": "Deny",
            "Action": "sqs:*",
            "Resource": "*",
            "Condition": {
                "StringEquals": {
                    "aws:ResourceTag/environment": "prod"
                }
            }
        }
    ]
}

Now, for instance you need to restrict IAM policy for any operation on resources with a given tag with key environment and value production as an argument within the API call, the following IAM policy helps fulfill the requirements.

{
    "Version": "2012-10-17",
    "Statement": [
        {
            "Sid": "DenyAccessForStageProduction",
            "Effect": "Deny",
            "Action": "sqs:*",
            "Resource": "*",
            "Condition": {
                "StringEquals": {
                    "aws:RequestTag/environment": "production"
                }
            }
        }
    ]
}

Creating IAM user and SQS queue using AWS Management Console

Configuration of the ABAC on SQS resources is a two-step process. The first step is to tag your SQS resources with tags. You can use the AWS API, the AWS CLI, or the AWS Management Console to tag your resources. Once you have tagged the resources, create an IAM policy that allows or denies access to SQS resources based on their tags.

This post reviews the step-by-step process of creating ABAC policies for controlling access to SQS queues.

Create an IAM user

  1. Navigate to the AWS IAM console and choose User from the left navigation pane.
  2. Choose Add Users and provide a name in the User name text box.
  3. Check the Access key – Programmatic access box and choose Next:Permissions.
  4. Choose Next:Tags.
  5. Add tag key as environment and tag value as beta
  6. Select Next:Review and then choose Create user
  7. Copy the access key ID and secret access key and store in a secure location.

IAM configuration

Add IAM user permissions

  1. Select the IAM user you created.
  2. Choose Add inline policy.
  3. In the JSON tab, paste the following policy:
    {
        "Version": "2012-10-17",
        "Statement": [
            {
                "Sid": "AllowAccessForSameResTag",
                "Effect": "Allow",
                "Action": [
                    "sqs:SendMessage",
                    "sqs:ReceiveMessage",
                    "sqs:DeleteMessage"
                ],
                "Resource": "*",
                "Condition": {
                    "StringEquals": {
                        "aws:ResourceTag/environment": "${aws:PrincipalTag/environment}"
                    }
                }
            },
            {
                "Sid": "AllowAccessForSameReqTag",
                "Effect": "Allow",
                "Action": [
                    "sqs:CreateQueue",
                    "sqs:DeleteQueue",
                    "sqs:SetQueueAttributes",
                    "sqs:tagqueue"
                ],
                "Resource": "*",
                "Condition": {
                    "StringEquals": {
                        "aws:RequestTag/environment": "${aws:PrincipalTag/environment}"
                    }
                }
            },
            {
                "Sid": "DenyAccessForProd",
                "Effect": "Deny",
                "Action": "sqs:*",
                "Resource": "*",
                "Condition": {
                    "StringEquals": {
                        "aws:ResourceTag/stage": "prod"
                    }
                }
            }
        ]
    }
    
  4. Choose Review policy.
  5. Choose Create policy.
    Create policy

The preceding permissions policy ensures that the IAM user can call SQS APIs only if the value of the request tag within the API call matches the value of the environment tag on the IAM principal. It also makes sure that the resource tag applied to the SQS queue matches the IAM tag applied on the user.

Creating IAM user and SQS queue using AWS CloudFormation

Here is the sample CloudFormation template to create an IAM user with an inline policy attached and an SQS queue.

AWSTemplateFormatVersion: "2010-09-09"
Description: "CloudFormation template to create IAM user with custom in-line policy"
Resources:
    IAMPolicy:
        Type: "AWS::IAM::Policy"
        Properties:
            PolicyDocument: |
                {
                    "Version": "2012-10-17",
                    "Statement": [
                        {
                            "Sid": "AllowAccessForSameResTag",
                            "Effect": "Allow",
                            "Action": [
                                "sqs:SendMessage",
                                "sqs:ReceiveMessage",
                                "sqs:DeleteMessage"
                            ],
                            "Resource": "*",
                            "Condition": {
                                "StringEquals": {
                                    "aws:ResourceTag/environment": "${aws:PrincipalTag/environment}"
                                }
                            }
                        },
                        {
                            "Sid": "AllowAccessForSameReqTag",
                            "Effect": "Allow",
                            "Action": [
                                "sqs:CreateQueue",
                                "sqs:DeleteQueue",
                                "sqs:SetQueueAttributes",
                                "sqs:tagqueue"
                            ],
                            "Resource": "*",
                            "Condition": {
                                "StringEquals": {
                                    "aws:RequestTag/environment": "${aws:PrincipalTag/environment}"
                                }
                            }
                        },
                        {
                            "Sid": "DenyAccessForProd",
                            "Effect": "Deny",
                            "Action": "sqs:*",
                            "Resource": "*",
                            "Condition": {
                                "StringEquals": {
                                    "aws:ResourceTag/stage": "prod"
                                }
                            }
                        }
                    ]
                }
                
            Users: 
              - "testUser"
            PolicyName: tagQueuePolicy

    IAMUser:
        Type: "AWS::IAM::User"
        Properties:
            Path: "/"
            UserName: "testUser"
            Tags: 
              - 
                Key: "environment"
                Value: "beta"

Testing tag-based access control

Create queue with tag key as environment and tag value as prod

We will use AWS CLI to demonstrate the permission model. If you do not have AWS CLI, you can download and configure it for your machine.

Run this AWS CLI command to create the queue:

aws sqs create-queue --queue-name prodQueue —region us-east-1 —tags "environment=prod"

You receive an AccessDenied error from the SQS endpoint:

An error occurred (AccessDenied) when calling the CreateQueue operation: Access to the resource <queueUrl> is denied.

This is because the tag value on the IAM user does not match the tag passed in the CreateQueue API call. Remember that we applied a tag to the IAM user with key as ‘environment’ and value as ‘beta’.

Create queue with tag key as environment and tag value as beta

aws sqs create-queue --queue-name betaQueue —region us-east-1 —tags "environment=beta"

You see a response similar to the following, which shows the successful creation of the queue.

{
"QueueUrl": "<queueUrl>“
}

Sending message to the queue

aws sqs send-message --queue-url <queueUrl> —message-body testMessage

You will get a successful response from the SQS endpoint. The response will include MD5OfMessageBody and MessageId of the message.

{
"MD5OfMessageBody": "<MD5OfMessageBody>",
"MessageId": "<MessageId>"
}

The response shows successful message delivery to the SQS queue since the IAM user permission allows sending message with queue with tag ‘beta’.

Benefits of attribute-based access controls

The following are benefits of using attribute-based access controls (ABAC) in Amazon SQS:

  • ABAC for SQS requires fewer permissions policies – You do not have to create different policies for different job functions. You can use the resource and request tags that apply to more than one queue. This reduces the operational overhead.
  • Using ABAC, teams can scale quickly – Permissions for new resources are automatically granted based on tags when resources are appropriately tagged upon creation.
  • Use permissions on the IAM principal to restrict resource access – You can create tags for the IAM principal and restrict access to specific action only if it matches the tag on the IAM principal. This helps automate granting of request permissions.
  • Track who is accessing resources – Easily determine the identity of a session by looking at the user attributes in AWS CloudTrail to track user activity in AWS.

Conclusion

In this post, we have seen how Attribute-based access control (ABAC) policies allow you to grant access rights to users through IAM policies based on tags defined on the SQS queues.

ABAC for SQS supports all SQS API actions. Managing the access permissions via tags can save you engineering time creating complex access permissions as your applications and resources grow. With the flexibility of using multiple resource tags in the security policies, the data and compliance teams can now easily set more granular access permissions based on resource attributes.

For additional details on pricing, see Amazon SQS pricing. For additional details on programmatic access to the SQS data protection, see Actions in the Amazon SQS API Reference. For more information on SQS security, see the SQS security public documentation page. To get started with the attribute-based access control for SQS, navigate to the SQS console.

For more serverless learning resources, visit Serverless Land.

How to Automatically Prevent Email Throttling when Reaching Concurrency Limit

Post Syndicated from Mark Richman original https://aws.amazon.com/blogs/messaging-and-targeting/prevent-email-throttling-concurrency-limit/

Introduction

Many users of Amazon Simple Email Service (Amazon SES) send large email campaigns that target tens of thousands of recipients. Regulating the flow of Amazon SES requests can prevent throttling due to exceeding the AWS service limit on the account.

Amazon SES service quotas include a soft limit on the number of emails sent per second (also known as the “sending rate”). This quota is intended to protect users from accidentally sending unintended volumes of email, or from spending more money than intended. Most Amazon SES customers have this quota increased, but very large campaigns may still exceed that limit. As a result, Amazon SES will throttle email requests. When this happens, your messages will fail to reach their destination.

This blog provides users of Amazon SES a mechanism for regulating the flow of messages that are sent to Amazon SES. Cloud Architects, Engineers, and DevOps Engineers designing new, or improving an existing Amazon SES solution would benefit from reading this post.

Overview

A common solution for regulating the flow of API requests to Amazon SES is achieved using Amazon Simple Queue Service (Amazon SQS). Amazon SQS can send, store, and receive messages at virtually any volume and can serve as part of a solution to buffer and throttle the rate of API calls. It achieves this without the need for other services to be available to process the messages. In this solution, Amazon SQS prevents messages from being lost while waiting for them to be sent as emails.

Fig 1 — High level architecture diagram

But this common solution introduces a new challenge. The mechanism used by the Amazon SQS event source mapping for AWS Lambda invokes a function as soon as messages are visible. Our challenge is to regulate the flow of messages, rather than invoke Amazon SES as messages arrive to the queue.

Fig 2 — Leaky bucket

Developers typically limit the flow of messages in a distributed system by implementing the “leaky bucket” algorithm. This algorithm is an analogy to a bucket which has a hole in the bottom from which water leaks out at a constant rate. Water can be added to the bucket intermittently. If too much water is added at once or at too high a rate, the bucket overflows.

In this solution, we prevent this overflow by using throttling. Throttling can be handled in two ways: either before messages reach Amazon SQS, or after messages are removed from the queue (“dequeued”). Both of these methods pose challenges in handling the throttled messages and reprocessing them. These challenges introduce complexity and lead to the excessive use of resources that may cause a snowball effect and make the throttling worse.

Developers often use the following techniques to help improve the successful processing of feeds and submissions:

  • Submit requests at times other than on the hour or on the half hour. For example, submit requests at 11 minutes after the hour or at 41 minutes after the hour. This can have the effect of limiting competition for system resources with other periodic services.
  • Take advantage of times during the day when traffic is likely to be low, such as early evening or early morning hours.

However, these techniques assume that you have control over the rate of requests, which is usually not the case.

Amazon SQS, acting as a highly scalable buffer, allows you to disregard the incoming message rate and store messages at virtually any volume. Therefore, there is no need to throttle messages before adding them to the queue. As long as you eventually process messages faster than you receive new ones, you will be fine with the inflow that will get processed later on.

Regulating flow of messages from Amazon SQS

The proposed solution in this post regulates the dequeue of messages from one or more SQS queues. This approach can help prevent you from exceeding the per-second quota of Amazon SES, thereby preventing Amazon SES from throttling your API calls.

Available configuration controls

When it comes to regulating outflow from Amazon SQS you have a few options. MaxNumberOfMessages controls the maximum number of messages you can dequeue in a single read request. WaitTimeSeconds defines whether Amazon SQS uses short polling (0 seconds wait) or long polling (more than 0 seconds) while waiting to read messages from a queue. Though these capabilities are helpful in many use cases, they don’t provide full control over outflow rates.

Amazon SQS Event source mapping for Lambda is a built-in mechanism that uses a poller within the Lambda service. The poller polls for visible messages in the queue. Once messages are read, they immediately invoke the configured Lambda function. In order to prevent downstream throttling, this solution implements a custom poller to regulate the rate of messages polled instead of the Amazon SQS Event source mechanism.

Custom poller Lambda

Let’s look at the process of implementing a custom poller Lambda function. Your function should actively regulate the outflow rate without throttling or losing any messages.

First, you have to consider how to invoke the poller Lambda function once every second. Using Amazon EventBridge rules you can schedule Lambda invocations at a rate of once per minute. You also have to consider how to complete processing of Amazon SES invocations as soon as possible. And finally, you have to consider how to send requests to Amazon SES at a rate as close as possible to your per-second quota, without exceeding it.

You can use long polling to meet all of these requirements. Using long polling (by setting the WaitTimeSeconds value to a number greater than zero) means the request queries all of the Amazon SQS servers, or waits until the maximum number of messages you can handle per second (the MaxNumberOfMessages value) are read. By setting the MaxNumberOfMessages equal to your Amazon SES request per-second quota, you prevent your requests from exceeding that limit.

By splitting the looping logic from the poll logic (by using two Lambda functions) the code loops every second (60 times per minute) and asynchronously runs the polling logic.

Fig 3 — Custom poller diagram

You can use the following Python code to create the scheduler loop function:

import os
from time import sleep, time_ns

import boto3

SENDER_FUNCTION_NAME = os.getenv("SENDER_FUNCTION_NAME")
lambda_client = boto3.client("lambda")

def lambda_handler(event, context):
    print(event)

    for _ in range(60):
        prev_ns = time_ns()

        response = lambda_client.invoke_async( 
            FunctionName=SENDER_FUNCTION_NAME, InvokeArgs="{}" 
        ) 
        print(response)

        delta_ns = time_ns() - prev_ns

        if delta_ns < 1_000_000_000: 
            secs = (1_000_000_000.0 - delta_ns) / 1_000_000_000 
            sleep(secs)

This Python code creates a poller function:

import json 
import os

import boto3

UNREGULATED_QUEUE_URL = os.getenv("UNREGULATED_QUEUE_URL") 
MAX_NUMBER_OF_MESSAGES = 3 
WAIT_TIME_SECONDS = 1 
CHARSET = "UTF-8"

ses_client = boto3.client("ses") 
sqs_client = boto3.client("sqs")

def lambda_handler(event, context): 
    response = sqs_client.receive_message( 
        QueueUrl=UNREGULATED_QUEUE_URL, 
        MaxNumberOfMessages=MAX_NUMBER_OF_MESSAGES, 
        WaitTimeSeconds=WAIT_TIME_SECONDS, 
    )

    try: 
        messages = response["Messages"] 
    except KeyError: 
        print("No messages in queue") 
        return

    for message in messages: 
        message_body = json.loads(message["Body"]) 
        to_address = message_body["to_address"] 
        from_address = message_body["from_address"] 
        subject = message_body["subject"] 
        body = message_body["body"]

        print(f"Sending email to {to_address}")

        ses_client.send_email( 
            Destination={ 
                "ToAddresses": [ 
                    to_address, 
                ], 
            }, 
            Message={ 
                "Body": { 
                    "Text": { 
                        "Charset": CHARSET, 
                        "Data": body, 
                    } 
                }, 
                "Subject": { 
                    "Charset": CHARSET, 
                    "Data": subject, 
                }, 
            }, 
            Source=from_address, 
        )

        sqs_client.delete_message( 
            QueueUrl=UNREGULATED_QUEUE_URL, ReceiptHandle=message["ReceiptHandle"] 
        )

Regulating flow of prioritized messages from Amazon SQS

In the use case above, you may be serving a very large marketing campaign (“campaign1”) that takes hours to process. At the same time, you may want to process another, much smaller campaign (“campaign2″), which won’t be able to run until campaign1 is complete.

Obvious solution is to prioritize the campaigns by processing both campaigns in parallel. For example, allocate 90% of the Amazon SES per-second capacity limit to process the larger campaign1, while allowing the smaller campaign2 to take 10% of the available capacity under the limit. Amazon SQS does not provide message priority functionalities out-of-the-box. Instead, create two separate queues and poll each queue according to your desired frequency.

Fig 4 — Prioritize campaigns by queue diagram

This solution works fine if you have consistent flow of incoming messages to both queues. Unfortunately, once you finish processing campaign2 you will keep processing campaign1, using only 90% of the limit capacity per second.

Handling unbalanced flow

For handling unbalanced flow of messages merge both of your poller Lambdas. Implement one Lambda that polls both queues for MaxNumberOfMessages (that equals 100% of the limits of both). In this implementation send from your poller Lambda 90% of campaign1 messages and 10% of campaign2 messages. When campaign2 no longer has messages to process, keep processing 100% of the capacity from campaign1’s queue.

Do not delete unsent messages from the queues. These messages will become visible after their queue’s visibility timeout is reached.

To further improve on the previous implementations, introduce a third FIFO Queue to aggregate all messages from both queues and regulate dequeuing from that third FIFO queue. This will allow you to use all available capacity under your SES limit, while interweaving messages from both campaigns at a 1:10 ratio.

Fig 5 — Adding FIFO merge queue diagram

Processing 100% of the available capacity limit of the large campaign1 and 10% of the capacity limit of the small campaign2 allows you to make sure campign2 messages will not wait until campaign1 messages were all processed. Once campain2 messages are all processed, campign1 messages will continue to be processed using 100% of the capacity limit.

You can find here instructions for Configuring Amazon SQS queues.

Conclusion

In this blog post, we have shown you how to regulate the dequeue of Amazon SQS queue messages. This will prevent you from exceeding your Amazon SES per second limit. This will also remove the need to deal with throttled requests. We explained how to combine Amazon SQS, AWS Lambda, Amazon EventBridge to create a custom serverless regulating queue poller. Finally, we described how to regulate the flow of Amazon SES requests when using multiple priority queues. These technics can reduce implementation time for reprocessing throttled requests, optimize utilization of SES request limit, and reduce costs.

About the Authors

This blog post was written by Guy Loewy and Mark Richman, AWS Senior Solutions Architects for SMB.

How USAA built an Amazon S3 malware scanning solution

Post Syndicated from Jonathan Nguyen original https://aws.amazon.com/blogs/architecture/how-usaa-built-an-amazon-s3-malware-scanning-solution/

United Services Automobile Association (USAA) is a San Antonio-based insurance, financial services, banking, and FinTech company supporting millions of military members and their families. USAA has partnered with Amazon Web Services (AWS) to digitally transform and build multiple USAA solutions that help keep members safe and save members money and time.

Why build a S3 malware scanning solution?

As complex companies’ businesses continue to grow, there may be an increased need for collaboration and interactions with outside vendors. Prior to developing an Amazon Simple Storage Solution (Amazon S3) scanning solution, a security review and approval process for application teams to ingest data into an AWS Organization from external vendors’ AWS accounts may be warranted, to ensure additional threats are not being introduced. This could result in a lengthy review and exception process, and subsequently, could hinder the velocity of application teams’ collaboration with external vendors.

USAA security standards, like those of most companies, require all data from external vendors to be treated as untrusted, and therefore must be scanned by an antivirus or antimalware solution prior to being ingested by downstream processes within the AWS environment. Companies looking to automate the scanning process may want to consider a solution where all incoming external data flow through a demilitarized drop zone to be scanned, and subsequently released to downstream processes if malware and viruses are not detected.

S3 malware scanning solution overview

Dedicated AWS accounts should be provisioned for specific data classifications and used as a demilitarized zone (DMZ) for an untrusted staging area. The solution discussed in this blog uses a dedicated staging AWS account that controls the release of Amazon S3 objects to other AWS accounts within an AWS Organization. AWS accounts within an AWS Organization should follow security best practices in terms of infrastructure, networking, logging, and security. External vendors should explicitly be given limited permissions to appropriate resources in their respective staging S3 bucket.

A staging S3 bucket should have specific resource policies restricting which applications and identity and access management (IAM) principals can interact with S3 objects using object attributes, such as object tags, to determine whether an object has been scanned, and what the results of that scan are. Additional guardrails are implemented using Service Control Policies (SCP) to restrict authorized IAM principals to create or modify S3 object attributes (Figure 1).

Amazon S3 antivirus and antimalware scanning architecture workflow

Figure 1. Amazon S3 antivirus and antimalware scanning architecture workflow

  1. The external vendor copies an object to the staging S3 bucket.
  2. The staging S3 bucket has event notifications configured and generates an event.
  3. The S3 PutObject event is sent to an Object Created Amazon Simple Queue Service (Amazon SQS) queue topic.
  4. An Amazon Elastic Compute Cloud (Amazon EC2) Auto Scaling group is configured to scale based on messages in the Object Created SQS queue.
  5. An antivirus and antimalware scanning service application on the Amazon EC2 instances takes the following actions on objects within the Object Created Amazon SQS queue:
    a. Tag the S3 object with an “In Progress” status.
    b. Get the object from the Staging S3 bucket and stores it in a local ephemeral file system.
    c. Scan the copied object using antivirus or antimalware tool.
    d. Based on the antivirus or antimalware scan results, tag the S3 object with the scan results (for example, No_Malware_Detected vs. Malware_Detected).
    e. Create and publish a payload to the Object Scanned Amazon Simple Notification Service (Amazon SNS) topic, allowing application team filtering.
    f. Delete the message from the Object Created SQS queue.
  6. Application teams are subscribed to the Object Scanned SNS topic with a filter for their application.
  7. For any objects where a virus or malware is detected, a company can use its cyber threat response team to conduct a thorough analysis and take appropriate actions.

USAA built a custom anti-virus and anti-malware scanning application using EC2 instances, using a private, hardened Amazon Machine Image (AMI). For cost-efficacy purposes, the EC2 automatic scaling event can be configured based on Object Created SQS queue depth and Service Level Objective (SLO). A serverless version of an anti-virus and anti-malware solution can be used instead of an EC2 application, depending on your specific use-case and other factors. Some important factors include antivirus and antimalware tool serverless support, resource tuning and configuration requirements, and additional AWS services to manage that could possibly result in a bottleneck. If your enterprise is going with a serverless approach, you can use open-source tools such as ClamAV using Lambda functions.

In the event of an infected object, proper guardrails and response mechanisms need to be in place. USAA teams have developed playbooks to monitor the health and performance of S3 scanning solution, as well as responding to detected virus or malware.

This cloud native, event-driven solution has benefited multiple USAA application teams who have previously requested the ability to ingest data into AWS workloads from teams outside of USAA’s AWS Organization, and allowed additional capabilities and functionality to better serve their members. To enhance this solution even further, USAA’s security team plans to incorporate additional mechanisms to find specific objects that either failed or required additional processing, without having to scan all objects in the buckets. This can be accomplished by including an additional AWS Lambda function and Amazon DynamoDB table to track object metadata as objects get added to the Object Created SQS queue for processing. The metadata could possibly include information such as S3 bucket origin, S3 object key, version ID, scan status, and the original S3 event payload to replay the event into the Object Created SQS queue. The Lambda function primarily ensures the DynamoDB table is kept up to date as objects are processed, as well as handling issues for objects that may need to be reprocessed. The DynamoDB table also has time-to-live (TTL) configured to clear records as they expire from the Staging S3 bucket.

Conclusion

In this post, we reviewed how USAA’s Public Cloud Security team facilitated collaboration and interactions with external vendors and AWS workloads securely by creating a scalable solution to scan S3 objects for virus and malware prior to releasing objects downstream. The solution uses native AWS services and can be utilized for any use-cases requiring antivirus or antimalware capabilities. Because the S3 object scanning solution uses EC2 instances, you can use your existing antivirus or antimalware enterprise tool.

AWS Week in Review – October 24, 2022

Post Syndicated from Channy Yun original https://aws.amazon.com/blogs/aws/aws-week-in-review-october-24-2022/

Last week, we announced plans to launch the AWS Asia Pacific (Bangkok) Region, which will become our third AWS Region in Southeast Asia. This Region will have three Availability Zones and will give AWS customers in Thailand the ability to run workloads and store data that must remain in-country.

In the Works – AWS Region in Thailand
With this big news, AWS announced a 190 billion baht (US 5 billion dollars) investment to drive Thailand’s digital future over the next 15 years. It includes capital expenditures on the construction of data centers, operational expenses related to ongoing utilities and facility costs, and the purchase of goods and services from Regional businesses.

Since we first opened an office in Bangkok in 2015, AWS has launched 10 Amazon CloudFront edge locations, a highly secure and programmable content delivery network (CDN) in Bangkok. In 2020, we launched AWS Outposts, a family of fully managed solutions delivering AWS infrastructure and services to virtually any on-premises or edge location for a truly consistent hybrid experience in Thailand. This year, we also plan the upcoming launch of an AWS Local Zone in Bangkok, which will enable customers to deliver applications that require single-digit millisecond latency to end users in Thailand.

Photo courtesy of Conor McNamara, Managing Director, ASEAN at AWS

The new AWS Region in Thailand is also part of our broader, multifaceted investment in the country, covering our local team, partners, skills, and the localization of services, including Amazon Transcribe, Amazon Translate, and Amazon Connect.

Many Thailand customers have chosen AWS to run their workloads to accelerate innovation, increase agility, and drive cost savings, such as 2C2P, CP All Plc., Digital Economy Promotion Agency, Energy Response Co. Ltd. (ENRES), PTT Global Public Company Limited (PTT), Siam Cement Group (SCG), Sukhothai Thammathirat Open University, The Stock Exchange of Thailand, Papyrus Studio, and more.

For example, Dr. Werner Vogels, CTO of Amazon.com, introduced the story of Papyrus Studio, a large film studio and one of the first customers in Thailand.

“Customer stories like Papyrus Studio inspire us at AWS. The cloud can allow a small company to rapidly scale and compete globally. It also provides new opportunities to create, innovate, and identify business opportunities that just aren’t possible with conventional infrastructure.”

For more information on how to enable AWS and get support in Thailand, contact our AWS Thailand team.

Last Week’s Launches
My favorite news of last week was to launch dark mode as a beta feature in the AWS Management Console. In Unified Settings, you can choose between three settings for visual mode: Browser default, Light, and Dark. Browser default applies the default dark or light setting of the browser, dark applies the new built-in dark mode, and light maintains the current look and feel of the AWS console. Choose your favorite!

Here are some launches that caught my eye for web, mobile, and IoT application developers:

New AWS Amplify Library for Swift – We announce the general availability of Amplify Library for Swift (previously Amplify iOS). Developers can use Amplify Library for Swift via the Swift Package Manager to build apps for iOS and macOS (currently in beta) platforms with Auth, Storage, Geo, and more features.

The Amplify Library for Swift is open source on GitHub, and we deeply appreciate the feedback we have gotten from the community. To learn more, see Introducing the AWS Amplify Library for Swift in the AWS Front-End Web & Mobile Blog or Amplify Library for Swift documentation.

New Amazon IVS Chat SDKs – Amazon Interactive Video Service (Amazon IVS) now provides SDKs for stream chat with support for web, Android, and iOS. The Amazon IVS stream chat SDKs support common functions for chat room resource management, sending and receiving messages, and managing chat room participants.

Amazon IVS is a managed, live-video streaming service using the broadcast SDKs or standard streaming software such as Open Broadcaster Software (OBS). The service provides cross-platform player SDKs for playback of Amazon IVS streams you need to make low-latency live video available to any viewer around the world. Also, it offers Chat Client Messaging SDK. For more information, see Getting Started with Amazon IVS Chat in the AWS documentation.

New AWS Parameters and Secrets Lambda Extension – This is new extension for AWS Lambda developers to retrieve parameters from AWS Systems Manager Parameter Store and secrets from AWS Secrets Manager. Lambda function developers can leverage this extension to improve their application performance as it decreases the latency and the cost of retrieving parameters and secrets.

Previously, you had to initialize either the core library of a service or the entire service SDK inside a Lambda function for retrieving secrets and parameters. Now you can simply use the extension. To learn more, see AWS Systems Manager Parameter Store documentation and AWS Secrets Manager documentation.

New FreeRTOS Long Term Support Version – We announce the second release of FreeRTOS Long Term Support (LTS) – FreeRTOS 202210.00 LTS. FreeRTOS LTS offers a more stable foundation than standard releases as manufacturers deploy and later update devices in the field. This release includes new and upgraded libraries such as AWS IoT Fleet Provisioning, Cellular LTE-M Interface, coreMQTT, and FreeRTOS-Plus-TCP.

All libraries included in this FreeRTOS LTS version will receive security and critical bug fixes until October 2024. With an LTS release, you can continue to maintain your existing FreeRTOS code base and avoid any potential disruptions resulting from FreeRTOS version upgrades. To learn more, see the FreeRTOS announcement.

Here is some news on performance improvement and increasing capacity:

Up to 10X Improving Amazon Aurora Snapshot Exporting Speed – Amazon Aurora MySQL-Compatible Edition for MySQL 5.7 and 8.0 now speed up to 10x faster snapshot exports to Amazon S3. The performance improvement is automatically applied to all types of database snapshot exports, including manual snapshots, automated system snapshots, and snapshots created by the AWS Backup service. For more information, see Exporting DB cluster snapshot data to Amazon S3 in the Amazon Aurora documentation.

3X Increasing Amazon RDS Read Capacity – Amazon Relational Database Service (RDS) for MySQL, MariaDB, and PostgreSQL now supports 15 read replicas per instance, including up to 5 cross-Region read replicas, delivering up to 3x the previous read capacity. For more information, see Working with read replicas in the Amazon RDS documentation.

2X Increasing AWS Snowball Edge Compute Capacity – The AWS Snowball Edge Compute Optimized device doubled the compute capacity up to 104 vCPUs, doubled the memory capacity up to 416GB RAM, and is now fully SSD with 28TB NVMe storage. The updated device is ideal when you need dense compute resources to run complex workloads such as machine learning inference or video analytics at the rugged, mobile edge such as trucks, aircraft or ships.  You can get started by ordering a Snowball Edge device on the AWS Snow Family console.

2X Increasing Amazon SQS FIFO Default Quota – Amazon Simple Queue Service (SQS) announces the increase of default quota up to 6,000 transactions per second per API action. It is double the previous 3,000 throughput quota for a high throughput mode for FIFO (first in, first out) queues in all AWS Regions where Amazon SQS FIFO queue is available. For a detailed breakdown of default throughput quotas per Region, see Quotas related to messages in the Amazon SQS documentation.

For a full list of AWS announcements, be sure to keep an eye on the What’s New at AWS page.

Other AWS News
Here are some other news items that you may find interesting:

22 New or Updated Open Datasets on AWS – We released 22 new or updated datasets, including Amazonia-1 imagery, Bitcoin and Ethereum data, and elevation data over the Arctic and Antarctica. The full list of publicly available datasets is on the Registry of Open Data on AWS and is now also discoverable on AWS Data Exchange.

Sustainability with AWS Partners (ft. AWS On Air) – This episode covers a broad discipline of environmental, social, and governance (ESG) issues across all regions, organization types, and industries. AWS Sustainability & Climate Tech provides a comprehensive portfolio of AWS Partner solutions built on AWS that address climate change events and the United Nation’s Sustainable Development Goals (SDG).

AWS Open Source News and Updates #131 – This newsletter covers latest open-source projects such as Amazon EMR Toolkit for VS Code, a VS Code Extension to make it easier to develop Spark jobs on EMR and AWS CDK For Discourse, sample codes that demonstrates how to create a full environment for Discourse, etc. Remember to check out the Open source at AWS keep up to date with all our activity in open source by following us on @AWSOpen.

Upcoming AWS Events
Check your calendars and sign up for these AWS events:

AWS re:Invent 2022 Attendee Guide – Browse re:Invent 2022 attendee guides, curated by AWS Heroes, AWS industry teams, and AWS Partners. Each guide contains recommended sessions, tips and tricks for building your agenda, and other useful resources. Also, seat reservations for all sessions are now open for all re:Invent attendees. You can still register for AWS re:Invent either offline or online.

AWS AI/ML Innovation Day on October 25 – Join us for this year’s AWS AI/ML Innovation Day, where you’ll hear from Bratin Saha and other leaders in the field about the great strides AI/ML has made in the past and the promises awaiting us in the future.

AWS Container Day at Kubecon 2022 on October 25–28 – Come join us at KubeCon + CloudNativeCon North America 2022, where we’ll be hosting AWS Container Day Featuring Kubernetes on October 25 and educational sessions at our booth on October 26–28. Throughout the event, our sessions focus on security, cost optimization, GitOps/multi-cluster management, hybrid and edge compute, and more.

You can browse all upcoming in-person, and virtual events.

That’s all for this week. Check back next Monday for another Week in Review!

— Channy

This post is part of our Week in Review series. Check back each week for a quick roundup of interesting news and announcements from AWS!

Announcing server-side encryption with Amazon Simple Queue Service -managed encryption keys (SSE-SQS) by default

Post Syndicated from James Beswick original https://aws.amazon.com/blogs/compute/announcing-server-side-encryption-with-amazon-simple-queue-service-managed-encryption-keys-sse-sqs-by-default/

This post is written by Sofiya Muzychko (Sr Product Manager), Nipun Chagari (Principal Solutions Architect), and Hardik Vasa (Senior Solutions Architect).

Amazon Simple Queue Service (SQS) now provides server-side encryption (SSE) using SQS-owned encryption (SSE-SQS) by default. This feature further simplifies the security posture to encrypt the message body in SQS queues.

SQS is a fully managed message queuing service that enables you to decouple and scale microservices, distributed systems, and serverless applications. Customers are increasingly decoupling their monolithic applications to microservices and moving sensitive workloads to SQS, such as financial and healthcare applications, whose compliance regulations mandate data encryption.

SQS already supports server-side encryption with customer-provided encryption keys using the AWS Key Management Service (SSE-KMS) or using SQS-owned encryption keys (SSE-SQS). Both encryption options greatly reduce the operational burden and complexity involved in protecting data. Additionally, with the SSE-SQS encryption type, you do not need to create, manage, or pay for SQS-managed encryption keys.

Using the default encryption

With this feature, all newly created queues using HTTPS (TLS) and Signature Version 4 endpoints are encrypted using SQS-owned encryption (SSE-SQS) by default, enhancing the protection of your data against unauthorized access. Any new queue created using the non-TLS endpoint will not enable SSE-SQS encryption by default. We hence encourage you to create SQS queues using HTTPS endpoints as a security best practice.

The SSE-SQS default encryption is available for both standard and FIFO. You do not need to make any code or application changes to encrypt new queues. This does not affect existing queues. You can however change the encryption option for existing queues at any time using the SQS console, AWS Command Line Interface, or API.

Create queue

The preceding image shows the SQS queue creation console wizard with configuration options for encryption. As you can see, server-side encryption is enabled by default with encryption key type SSE-SQS option selected.

Creating a new SQS queue with SSE-SQS encryption using AWS CloudFormation

Default SSE-SQS encryption is also supported in AWS CloudFormation. To learn more, see this documentation page.

Here is the sample CloudFormation template to create an SQS standard queue with SQS owned Server Side Encryption (SSE-SQS) explicitly enabled.

AWSTemplateFormatVersion: "2010-09-09"
Description: SSE-SQS Cloudformation template
Resources:
  SQSEncryptionQueue:
    Type: AWS::SQS::Queue
    Properties: 
      MaximumMessageSize: 262144
      MessageRetentionPeriod: 86400
      QueueName: SSESQSQueue
      SqsManagedSseEnabled: true
      KmsDataKeyReusePeriodSeconds: 900
      VisibilityTimeout: 30

Note that if the SqsManagedSseEnabled: true property is not specified, SSE-SQS is enabled by default.

Configuring SSE-SQS encryption for existing queues vis AWS Management Console

To configure SSE-SQS encryption for an existing queue using the SQS console:

  1. Navigate to the SQS console at https://console.aws.amazon.com/sqs/.
  2. In the navigation pane, choose Queues.
  3. Select a queue, and then choose Edit.
  4. Under the Encryption dialog box, for Server-side encryption, choose Enabled.
  5. Select Amazon SQS key (SSE-SQS).
  6. Choose Save.

Edit standard queue

To configure SSE-SQS encryption for an existing queue using the AWS CLI

To enable SSE-SQS to an existing queue with no encryption, use the following AWS CLI command

aws sqs set-queue-attributes --queue-url <queueURL> --attributes SqsManagedSseEnabled=true

Replace <queueURL> with the URL of your SQS queue.

To disable SSE-SQS for an existing queue using the AWS CLI, run:

aws sqs set-queue-attributes --queue-url <queueURL> --attributes SqsManagedSseEnabled=false

Testing the queue with the SSE-SQS encryption enabled

To test sending message to the SQS queue with SSE-SQS enabled, run:

aws sqs send-message --queue-url <queueURL> --message-body test-message

Replace <queueURL> with the URL of your SQS queue. You see the following response, which means the message is successfully sent to the queue:

{
    "MD5OfMessageBody": "beaa0032306f083e847cbf86a09ba9b2",
    "MessageId": "6e53de76-7865-4c45-a640-f058c24a619b"
}

Default SSE-SQS encryption key rotation

You can choose how often the keys will be rotated by configuring the KmsDataKeyReusePeriodSeconds queue attribute. The value must be an integer between 60 (1 minute) and 86,400 (24 hours). The default is 300 (5 minutes).

To update the KMS data key reuse period for an existing SQS queue, run:

aws sqs set-queue-attributes --queue-url <queueURL> --attributes KmsDataKeyReusePeriodSeconds=900

This configures the queue with KMS key rotation to every 900 seconds (15 minutes).

Default SSE-SQS and encrypted messages

Encrypting a message makes its contents unavailable to unauthorized or anonymous users. Anonymous requests are requests made to a queue that is open to a public network without any authentication. Note, if you are using anonymous SendMessage and ReceiveMessage requests to the newly created queues, the requests will now be rejected with SSE-SQS enabled by default.

Making anonymous requests to SQS queues does not follow SQS security best practices. We strongly recommend updating your policy to make signed requests to SQS queues using AWS SDK or AWS CLI and to continue using SSE-SQS enabled by default.

Look at the SQS service response for anonymous messages when SSE-SQS encryption is enabled. For an existing queue, you can change the queue policy to grant all users (anonymous users) SendMessage permission for a queue named EncryptionQueue:

{
  "Version": "2012-10-17",
  "Id": "Queue1_Policy_UUID",
  "Statement": [
    {
      "Sid": "Queue1_SendMessage",
      "Effect": "Allow",
      "Principal": "*",
      "Action": "sqs:SendMessage",
      "Resource": "<queueARN>"
    }
  ]
}

You can then make an anonymous request against the queue:

curl <queueURL> -d 'Action=SendMessage&MessageBody=Hello'

You get an error message similar to the following:

<?xml version="1.0"?>
<ErrorResponse
	xmlns="http://queue.amazonaws.com/doc/2012-11-05/">
	<Error>
		<Type>Sender</Type>
		<Code>AccessDenied</Code>
		<Message>Access to the resource The specified queue does not exist or you do not have access to it. is denied.</Message>
		<Detail/>
	</Error>
	<RequestId> RequestID </RequestId>
</ErrorResponse>

However, for any reason if you want to continue using anonymous requests to the newly created queues in the future, you must create or update the queue with SSE-SQS encryption disabled.

SqsManagedSseEnabled=false

You can also disable the SSE-SQS using the Amazon SQS console.

Encrypting SQS queues with your own encryption keys

You can always change the default of SSE-SQS queues encryption and use your own keys. To encrypt SQS queues with your own encryption keys using the AWS Key Management Service (SSE-KMS), the default encryption with SSE-SQS can be overwritten to SSE-KMS during the queue creation process or afterwards.

You can update the SQS queue Server-side encryption key type using the Amazon SQS console, AWS Command Line Interface, or API.

Benefits of SQS owned encryption (SSE-SQS)

There are a number of significant benefits to encrypting your data with SQS owned encryption (SSE-SQS):

  • SSE-SQS lets you transmit data more securely and improve your security posture commonly required for compliance and regulations with no additional overhead, as you do not need to create and manage encryption keys.
  • Encryption at rest using the default SSE-SQS is provided at no additional charge.
  • The encryption and decryption of your data are handled transparently and continue to deliver the same performance you expect.
  • Data is encrypted using the 256-bit Advanced Encryption Standard (AES-256 GCM algorithm), so that only authorized roles and services can access data.

In addition, customers can enable CloudWatch Alarms to alarm on activities such as authorization failures, AWS Identity and Access Management (IAM) policy changes, or tampering with CloudTrail logs to help detect and stay on top of security incidents in the customer application (to learn more, see Amazon CloudWatch User Guide).

Conclusion

SQS now provides server-side encryption (SSE) using SQS-owned encryption (SSE-SQS) by default. This enhancement makes it easier to create SQS queues, while greatly reducing the operational burden and complexity involved in protecting data.

Encryption at rest using the default SSE-SQS is provided at no additional charge and is supported for both Standard and FIFO SQS queues using HTTPS endpoints. The default SSE-SQS encryption is available now.

To learn more about Amazon Simple Queue Service (SQS), see Getting Started with Amazon SQS and Amazon Simple Queue Service Developer Guide.

For more serverless learning resources, visit Serverless Land.

How Launchmetrics improves fashion brands performance using Amazon EC2 Spot Instances

Post Syndicated from Ivo Pinto original https://aws.amazon.com/blogs/architecture/how-launchmetrics-improves-fashion-brands-performance-using-amazon-ec2-spot-instances/

Launchmetrics offers its Brand Performance Cloud tools and intelligence to help fashion, luxury, and beauty retail executives optimize their global strategy. Launchmetrics initially operated their whole infrastructure on-premises; however, they wanted to scale their data ingestion while simultaneously providing improved and faster insights for their clients. These business needs led them to build their architecture in AWS cloud.

In this blog post, we explain how Launchmetrics’ uses Amazon Web Services (AWS) to crawl the web for online social and print media. Using the data gathered, Launchmetrics is able to provide prescriptive analytics and insights to their clients. As a result, clients can understand their brand’s momentum and interact with their audience, successfully launching their products.

Architecture overview

Launchmetrics’ platform architecture is represented in Figure 1 and composed of three tiers:

  1. Crawl
  2. Data Persistence
  3. Processing
Launchmetrics backend architecture

Figure 1. Launchmetrics backend architecture

The Crawl tier is composed of several Amazon Elastic Compute Cloud (Amazon EC2) Spot Instances launched via Auto Scaling groups. Spot Instances take advantage of unused Amazon EC2 capacity at a discounted rate compared with On-Demand Instances, which are compute instances that are billed per-hour or -second with no long-term commitments. Launchmetrics heavily leverages Spot Instances. The Crawl tier is responsible for retrieving, processing, and storing data from several media sources (represented in Figure 1 with the number 1).

The Data Persistence tier consists of two components: Amazon Kinesis Data Streams and Amazon Simple Queue Service (Amazon SQS). Kinesis Data Streams stores data that the Crawl tier collects, while Amazon SQS stores the metadata of the whole process. In this context, metadata helps Launchmetrics gain insight into when the data is collected and if it has started processing. This is key information if a Spot Instance is interrupted, which we will dive deeper into later.

The third tier, Processing, also makes use of Spot Instances and is responsible for pulling data from the Data Persistence tier (represented in Figure 1 with the number 2). It then applies proprietary algorithms, both analytics and machine learning models, to create consumer insights. These insights are stored in a data layer (not depicted) that consists of an Amazon Aurora cluster and an Amazon OpenSearch Service cluster.

By having this separation of tiers, Launchmetrics is able to use a decoupled architecture, where each component can scale independently and is more reliable. Both the Crawl and the Data Processing tiers use Spot Instances for up to 90% of their capacity.

Data processing using EC2 Spot Instances

When Launchmetrics decided to migrate their workloads to the AWS cloud, Spot Instances were one of the main drivers. As Spot Instances offer large discounts without commitment, Launchmetrics was able to track more than 1200 brands, translating to 1+ billion end users. Daily, this represents tracking upwards of 500k influencer profiles, 8 million documents, and around 70 million social media comments.

Aside from the cost-savings with Spot Instances, Launchmetrics incurred collateral benefits in terms of architecture design: building stateless, decoupled, elastic, and fault-tolerant applications. In turn, their stack architecture became more loosely coupled, as well.

All Launchmetrics Auto Scaling groups have the following configuration:

  • Spot allocation strategy: cost-optimized
  • Capacity rebalance: true
  • Three availability zones
  • A diversified list of instance types

By using Auto Scaling groups, Launchmetrics is able to scale worker instances depending on how many items they have in the SQS queue, increasing the instance efficiency. Data processing workloads like the ones Launchmetrics’ platform have, are an exemplary use of multiple instance types, such as M5, M5a, C5, and C5a. When adopting Spot Instances, Launchmetrics considered other instance types to have access to spare capacity. As a result, Launchmetrics found out that workload’s performance improved, as they use instances with more resources at a lower cost.

By decoupling their data processing workload using SQS queues, processes are stopped when an interruption arrives. As the Auto Scaling group launches a replacement Spot Instance, clients are not impacted and data is not lost. All processes go through a data checkpoint, where a new Spot Instance resumes processing any pending data. Spot Instances have resulted in a reduction of up to 75% of related operational costs.

To increase confidence in their ability to deal with Spot interruptions and service disruptions, Launchmetrics is exploring using AWS Fault Injection Simulator to simulate faults on their architecture, like a Spot interruption. Learn more about how this service works on the AWS Fault Injection Simulator now supports Spot Interruptions launch page.

Reporting data insights

After processing data from different media sources, AWS aided Launchmetrics in producing higher quality data insights, faster: the previous on-premises architecture had a time range of 5-6 minutes to run, whereas the AWS-driven architecture takes less than 1 minute.

This is made possible by elasticity and availability compute capacity that Amazon EC2 provides compared with an on-premises static fleet. Furthermore, offloading some management and operational tasks to AWS by using AWS managed services, such as Amazon Aurora or Amazon OpenSearch Service, Launchmetrics can focus on their core business and improve proprietary solutions rather than use that time in undifferentiated activities.

Building continuous delivery pipelines

Let’s discuss how Launchmetrics makes changes to their software with so many components.

Both of their computing tiers, Crawl and Processing, consist of standalone EC2 instances launched via Auto Scaling groups and EC2 instances that are part of an Amazon Elastic Container Service (Amazon ECS) cluster. Currently, 70% of Launchmetrics workloads are still running with Auto Scaling groups, while 30% are containerized and run on Amazon ECS. This is important because for each of these workload groups, the deployment process is different.

For workloads that run on Auto Scaling groups, they use an AWS CodePipeline to orchestrate the whole process, which includes:

I.  Creating a new Amazon Machine Image (AMI) using AWS CodeBuild
II. Deploying the newly built AMI using Terraform in CodeBuild

For containerized workloads that run on Amazon ECS, Launchmetrics also uses a CodePipeline to orchestrate the process by:

III. Creating a new container image, and storing it in Amazon Elastic Container Registry
IV. Changing the container image in the task definition, and updating the Amazon ECS service using CodeBuild

Conclusion

In this blog post, we explored how Launchmetrics is using EC2 Spot Instances to reduce costs while producing high-quality data insights for their clients. We also demonstrated how decoupling an architecture is important for handling interruptions and why following Spot Instance best practices can grant access to more spare capacity.

Using this architecture, Launchmetrics produced faster, data-driven insights for their clients and increased their capacity to innovate. They are continuing to containerize their applications and are projected to have 100% of their workloads running on Amazon ECS with Spot Instances by the end of 2023.

To learn more about handling EC2 Spot Instance interruptions, visit the AWS Best practices for handling EC2 Spot Instance interruptions blog post. Likewise, if you are interested in learning more about AWS Fault Injection Simulator and how it can benefit your architecture, read Increase your e-commerce website reliability using chaos engineering and AWS Fault Injection Simulator.

A multi-dimensional approach helps you proactively prepare for failures, Part 2: Infrastructure layer

Post Syndicated from Piyali Kamra original https://aws.amazon.com/blogs/architecture/a-multi-dimensional-approach-helps-you-proactively-prepare-for-failures-part-2-infrastructure-layer/

Distributed applications resiliency is a cumulative resiliency of applications, infrastructure, and operational processes. Part 1 of this series explored application layer resiliency. In Part 2, we discuss how using Amazon Web Services (AWS) managed services, redundancy, high availability, and infrastructure failover patterns based on recovery time and point objectives (RTO and RPO, respectively) can help in building more resilient infrastructures.

Pattern 1: Recognize high impact/likelihood infrastructure failures

To ensure cloud infrastructure resilience, we need to understand the likelihood and impact of various infrastructure failures, so we can mitigate them. Figure 1 illustrates that most of the failures with high likelihood happen because of operator error or poor deployments.

Automated testing, automated deployments, and solid design patterns can mitigate these failures. There could be datacenter failures—like whole rack failures—but deploying applications using auto scaling and multi-availability zone (multi-AZ) deployment, plus resilient AWS cloud native services, can mitigate the impact.

Likelihood and impact of failure events

Figure 1. Likelihood and impact of failure events

As demonstrated in the Figure 1, infrastructure resiliency is a combination of high availability (HA) and disaster recovery (DR). HA involves increasing the availability of the system by implementing redundancy among the application components and removing single points of failure.

Application layer decisions, like creating stateless applications, make it simpler to implement HA at the infrastructure layer by allowing it to scale using Auto Scaling groups and distributing the redundant applications across multiple AZs.

Pattern 2: Understanding and controlling infrastructure failures

Building a resilient infrastructure requires understanding which infrastructure failures are under control and which ones are not, as demonstrated in Figure 2.

These insights allow us to automate the detection of failures, control them, and employ pro-active patterns, such as static stability, to mitigate the need to scale up the infrastructure by over-provisioning it in advance.

Proactively designing systems in the event of failure

Figure 2. Proactively designing systems in the event of failure

The infrastructure decisions under our control that can increase the infrastructure resiliency of our system, include:

  • AWS services have control and data planes designed for minimum blast radius. Data planes typically have higher availability design goals than control planes and are usually less complex. When implementing recovery or mitigation responses to events that can affect resiliency, using control plane operations can lower the overall resiliency of your architectures. For example, Amazon Route 53 (Route 53) has a data plane designed for a 100% availability SLA. A good fail-over mechanism should rely on the data plane and not the control plane, as explained in Creating Disaster Recovery Mechanisms Using Amazon Route 53.
  • Understanding networking design and routes implemented in a virtual private cloud (VPC) are critical when testing the flow of traffic in our application. Understanding the flow of traffic helps us design better applications and see how one component failure can affect overall ingress/egress traffic. To achieve better network resiliency, it’s important to implement a good subnet strategy and manage our IP addresses to avoid fail-over issues and asymmetric routing in hybrid architectures. Use IP address management tools for established subnet strategies and routing decisions.
  • When designing VPCs and AZs, understanding the service limits, deploying independent routing tables and components in each zone increases availability. For example, highly available NAT gateways are preferred over NAT instances, as noted in the comparison provided in the Amazon VPC documentation.

Pattern 3: Considering different ways of increasing HA at the infrastructure layer

As already detailed, infrastructure resiliency = HA + DR.

Different ways by which system availability can be increased include:

  • Building for redundancy: Redundancy is the duplication of application components to increase the overall availability of the distributed system. After following application layer best practices, we can build auto healing mechanisms at the infrastructure layer.

We can take advantage of auto scaling features and use Amazon CloudWatch metrics and alarms to set up auto scaling triggers and deploy redundant copies of our applications across multiple AZs. This protects workloads from AZ failures, as shown in Figure 3.

Redundancy increases availability

Figure 3. Redundancy increases availability

  • Auto scale your infrastructure: When there are AZ failures, infrastructure auto scaling maintains the desired number of redundant components, which helps maintain the base level application throughput. This way, HA system and manage costs are maintained. Auto scaling uses metrics to scale in and out, appropriately, as shown in Figure 4.
How auto scaling improves availability

Figure 4. How auto scaling improves availability

  • Implement resilient network connectivity patterns: While building highly resilient distributed systems, network access to AWS infrastructure also needs to be highly resilient. While deploying hybrid applications, the capacity needed for hybrid applications to communicate with their cloud native application counterparts is an important consideration in designing the network access using AWS Direct Connect or VPNs.

Testing failover and fallback scenarios helps validate that network paths operate as expected and routes fail over as expected to meet RTO objectives. As the number of connection points between the data center and AWS VPCs increases, a hub and spoke configuration provided by the Direct Connect gateway and transit gateways simplify network topology, testing, and fail over. For more information, visit the AWS Direct Connect Resiliency Recommendations.

  • Whenever possible, use the AWS networking backbone to increase security, resiliency, and lower cost. AWS PrivateLink provides secure access to AWS services and exposes the application’s functionalities and APIs to other business units or partner accounts hosted on AWS.
  • Security appliances need to be set up in HA configuration, so that even if one AZ is unavailable, security inspection can be taken over by the redundant appliances in the other AZs.
  • Think ahead about DNS resolution: DNS is a critical infrastructure component; hybrid DNS resolution should be designed carefully with Route 53 HA inbound and outbound resolver endpoints instead of using self-managed proxies.

Implement a good strategy to share DNS resolver rules across AWS accounts and VPC’s with Resource Access Manager. Network failover tests are an important part of Disaster Recovery and Business Continuity Plans. To learn more, visit Set up integrated DNS resolution for hybrid networks in Amazon Route 53.

Additionally, ELB uses health checks to make sure that requests will route to another component if the underlying traffic application component fails. This improves the distributed system’s availability, as it is the cumulative availability of all different layers in our system. Figure 5 details advantages of some AWS managed services.

AWS managed services help in building resilient infrastructures (click the image to enlarge)

Figure 5. AWS managed services help in building resilient infrastructures (click the image to enlarge)

Pattern 4: Use RTO and RPO requirements to determine the correct failover strategy for your application

Capture RTO and RPO requirements early on to determine solid failover strategies (Figure 6). Disaster recovery strategies within AWS range from low cost and complexity (like backup and restore), to more complex strategies when lower values of RTO and RPO are required.

In pilot light and warm standby, only the primary region receives traffic. Pilot light only critical infrastructure components run in the backup region. Automation is used to check failures in the primary region using health checks and other metrics.

When health checks fail, use a combination of auto scaling groups, automation, and Infrastructure as Code (IaC) for quick deployment of other infrastructure components.

Note: This strategy depends on control plane availability in the secondary region for deploying the resources; keep this point in mind if you don’t have compute pre-provisioned in the secondary region. Carefully consider the business requirements and a distributed system’s application-level characteristics before deciding on a failover strategy. To understand all the factors and complexities involved in each of these disaster recovery strategies refer to disaster recovery options in the cloud.

Relationship between RTO, RPO, cost, data loss, and length of service interruption

Figure 6. Relationship between RTO, RPO, cost, data loss, and length of service interruption

Conclusion

In Part 2 of this series, we discovered that infrastructure resiliency is a combination of HA and DR. It is important to consider likelihood and impact of different failure events on availability requirements. Building in application layer resiliency patterns (Part 1 of this series), along with early discovery of the RTO/RPO requirements, as well as operational and process resiliency of an organization helps in choosing the right managed services and putting in place the appropriate failover strategies for distributed systems.

It’s important to differentiate between normal and abnormal load threshold for applications in order to put automation, alerts, and alarms in place. This allows us to auto scale our infrastructure for normal expected load, plus implement corrective action and automation to root out issues in case of abnormal load. Use IaC for quick failover and test failover processes.

Stay tuned for Part 3, in which we discuss operational resiliency!

Estimating cost for Amazon SQS message processing using AWS Lambda

Post Syndicated from James Beswick original https://aws.amazon.com/blogs/compute/estimating-cost-for-amazon-sqs-message-processing-using-aws-lambda/

This post was written by Sabha Parameswaran, Senior Solutions Architect.

AWS Lambda enables fully managed asynchronous messaging processing through integration with Amazon SQS. This blog post helps estimate the cost and performance benefits when using Lambda to handle millions of messages per day by using a simulated setup.

Overview

Lambda supports asynchronous handling of messages using SQS integration as an event source and can scale for handling millions of messages per day. Customers often ask about the cost of implementing a Lambda-based messaging solution.

There are multiple variables like Lambda function runtime, individual message size, batch size for consuming from SQS, processing latency per message (depending on the backend services invoked), and function memory size settings. These can determine the overall performance and associated cost of a Lambda-based messaging solution.

This post provides cost estimation using these variables, along with guidance around optimization. The estimates focus on consuming from standard queues and not FIFO queues.

SQS event source

The Lambda event source mapping supports integration for SQS. Lambda users specify the SQS queue to consume messages. Lambda internally polls the queue and invokes the function synchronously with an event containing the queue messages.

The configuration controls in Lambda for consuming messages from an SQS queue are:

  • Batch size: The maximum number of records that can be batched as one event delivered to the consuming Lambda function. The maximum batch size is 10,000 records.
  • Batch window: The maximum time (in seconds) to gather records as a single batch. A larger batch window size means waiting longer for a larger SQS batch of messages before passing to the Lambda function.
  • SQS content filtering: Selecting only the messages that match a defined content criteria. This can reduce cost by removing unwanted or irrelevant messages. Lambda now supports content filtering (for SQS, Kinesis, and DynamoDB) and developers can use the filtering capabilities to avoid processing SQS messages, reducing unnecessary invocations and associated cost.

Lambda sends as many records in a single batch as allowed by the batch size, as long as it’s earlier than the batch window value, and smaller than the maximum payload size of 6 MB. Having large batch sizes means that a single Lambda invocation can handle more messages rather than multiple Lambda invocations to handle smaller batches (which translates to setting higher concurrency limits).

The cost and time to process might vary based on the actual number of messages in the batch. A larger batch size can imply longer processing but requires lower concurrency (number of concurrent Lambda invocations).

Lambda configurations

Lambda function costs are calculated based on memory used and time spent (in GB-second) in execution of a function. Aside from the event source configuration, there are several other Lambda function configurations that impact cost and performance:

  • Processor type: Lambda functions provide options to choose between x86 and Arm/Graviton processors. The newer Arm/Graviton processors can yield a higher performance and lower cost compared to x86 based on the workload. Compare the options and run tests before selecting.
  • Memory allotted: This is directly proportional to the CPU allotted to the function and translates to price for each invocation. Higher memory can lead to faster execution but also higher cost. The optimal memory required for a small batch versus large batch can vary based on the workload, size of incoming messages, transformations, requirements to store intermediate, or final results. Optimal tuning of the memory configurations is key to ensuring right cost versus performance. See the AWS Lambda Power Tuning documentation for more details on identifying the optimal memory versus performance for a fixed batch size and then extrapolate the memory settings for larger batch sizes.
  • Lambda function runtime: Some runtimes have a smaller memory footprint and may be more cost effective than others that are memory intensive. Choosing the runtime affects the memory allocation.
  • Function performance: This can be considered as TPS – total number of requests completed per second. Or conversely measured as time to complete one request. The performance – time to finish a function execution can be dependent on the event containing the batch of messages; bigger batches mean more time to complete an event and complexity and dependencies (performance of the backend that needs to be invoked) of the message processing. The calculations are based on the assumption that the Lambda function and related dependencies have been optimized and tuned to scale linearly with various batch sizes and number of invocations.
  • Concurrency: Number of concurrent Lambda function executions. Concurrency is important for scaling of Lambda functions, allowing users to delegate the capacity planning and scaling to thee Lambda service.

The higher the concurrency, the more workloads it can process in a shorter time, allowing better performance, but this does not change the overall cost. Concurrency is not equivalent to TPS: it is more of a scaling factor in overall TPS. For example, a workload comprised of a set of messages takes 20 seconds to complete. 100 workloads would mean 2000 seconds to complete. With a concurrency of 10, it takes 200 seconds. With a concurrency of 100, the time drops to 20 seconds as each of the 100 workloads are handled concurrently. But each function essentially runs for the same duration and memory, regardless of concurrency. So the cost remains the same, as it is measured in GB-hours (memory multiplied by time). But the performance view differs. So, the cost estimations do not consider the concurrency settings of Lambda functions as the workloads have to be processed either sequential or concurrently.

Assumptions

The cost estimation tool presented helps users estimate monthly Lambda function costs for processing SQS standard queue messages based on the following assumptions:

  • The system has reached steady state and has millions of messages available to be consumed per day in standard queues. The number of messages per day remains constant throughout the entire month.
  • Since it’s a steady state, there are no associated Lambda function cold start delays.
  • All SQS messages that need to be processed successfully have already met the filter criteria. Also, no poison messages that have to be re-tried repeatedly. Messages are not going to be rejected, unacknowledged, or reprocessed.
  • The workload scales linearly in performance versus batch size. All the associated dependencies can scale linearly and a batch of N messages should take the same time as N x a single message with a fixed overhead per function invocation irrespective of the batch size. For example, a function’s overhead is 50 ms irrespective of the batch size. Processing a single message takes 20 ms. So a batch of 20 messages should take 490 ms (50 + 20*20) versus a batch of 5 messages takes 150 ms (50 + 5*20).
  • Function memory increases in steps, based on increasing the batch size. For example, 100 messages uses a 256 MB of baseline memory. Every additional 500 messages require additional 128 MB of memory. A sliding window of memory to batch size:
Batch size Memory
1–100 256 MB
100–600 384 MB
600–1100 512 MB
1100–1600 640 MB

Lambda uses SQS APIs internally to poll and dequeue the messages. The costs for the polling and dequeue operations using SQS APIs are not included as part of the estimations. The internal SQS dequeue portion is outside the control of the Lambda developer and the cost estimates only cover the message processing using Lambda. Also, the tool does not consider any reprocessing or duplicate processing of messages due to exceptions or errors that can vary the cost.

Using the cost estimation tool

The estimator tool is a Python-based command line program that takes in an input properties file that specifies the various input parameters to come up with Lambda function cost versus performance estimations for various batch sizes, messages per day, etc. The tool does take into account the eligible monthly free tier for Lambda function executions.

Pre-requisites: Running the tool requires Python 3.9 and installation of Plotly package (5.7.+) or creating and using Docker images.

To run the tool:

  1. Clone the repo:
    git clone https://github.com/aws-samples/aws-lambda-sqs-cost-estimator
  2. Install the tool:
    cd aws-lambda-sqs-cost-estimator/code
    pip3 install -r requirements.txt
  3. Edit the input.prop file and run the tool to generate cost estimations:
    python3 LambdaPlotly.py

This shows the cost estimates on a local browser instance. Running the code as a Docker image is also supported. Refer to the GitHub repo for additional instructions.

  1. Clone the repo and build the Docker container:
    git clone https://github.com/aws-samples/aws-lambda-sqs-cost-estimator
    cd aws-lambda-sqs-cost-estimator/code
    docker build -t lambda-dash .
  2. Edit the input.prop file and run the tool to generate cost estimations:
    docker run -it -v `pwd`:/app -p 8080:8080 lambda-dash
  3. Navigate to http://0.0.0.0:8080/app in a browser to view the generated cost estimate plot.

There are various input parameters for the cost estimations specified inside the input.prop file. Tune the input parameters as needed:

Parameter Description Sample value (units not included)
base_lambda_memory_mb Baseline memory for the Lambda function (in MB) 128
warm_latency_ms Invocation time for Lambda handler method (going with warm start) irrespective of batch size in the incoming event payload in ms 20
process_per_message_ms Time to process a single message (linearly scales with number of messages per batch in event payload) in ms 10
max_batch_size Maximum batch size per event payload processed by a single Lambda instance 1000 (max is 10000)
batch_memory_overhead_mb Additional memory for processing increments in batch size (in MB) 128
batch_increment Increments of batch size for increased memory 300

The following is sample input.prop file content:

base_lambda_memory_mb=128

# Total process time for N messages in batch = warm_latency_ms + (process_per_message_ms * N)

# Time spent in function initialization/warm-up

warm_latency_ms=20

# Time spent for processing each message in milliseconds

process_per_message_ms=10

# Max batch size

max_batch_size=1000

# Additional lambda memory X mb required for managing/parsing/processing N additional messages processed when using variable batch sizes

#batch_memory_overhead_mb=X

#batch_increment=N

batch_memory_overhead_mb=128

batch_increment=300

The tool generates a page with plot graphs and tables with 3 sections:

Cost example

There is an accompanying interactive legend showing cost and batch size. The top section shows a graph of cost versus message volumes versus batch size:

cost versus message volumes vs Batch size

The second section shows the actual cost variation for different batch sizes for 10 million messages:

actual cost variation for different batch sizes for 10 million messages.

The third section shows the memory and time required to process with different batch sizes:

memory and time required to process with different batch sizes

The various control input parameters used for graph generation are shown at the bottom of the page.

Double-clicking on a specific batch size or line on the right-hand legend displays that specific plot with its pricing details.

specific plot to be displayed with its pricing details

You can modify the input parameters with different settings for memory, batch sizes, memory for increased batches and rerun the program to create different cost estimations. You can also export the generated graphs as PNG image files for reference.

Conclusion

You can use Lambda functions to handle fully managed asynchronous processing of SQS messages. Estimating the cost and optimal setup depends on leveraging the various configurations of SQS and Lambda functions. The cost estimator tool presented in this blog should help you understand these configurations and their impact on the overall cost and performance of the Lambda function-based messaging solutions.

For more serverless learning resources, visit Serverless Land.