Post Syndicated from Emina Torlak original https://aws.amazon.com/blogs/security/how-we-designed-cedar-to-be-intuitive-to-use-fast-and-safe/
This post is a deep dive into the design of Cedar, an open source language for writing and evaluating authorization policies. Using Cedar, you can control access to your application’s resources in a modular and reusable way. You write Cedar policies that express your application’s permissions, and the application uses Cedar’s authorization engine to decide which access requests to allow. This decouples access control from the application logic, letting you write, update, audit, and reuse authorization policies independently of application code.
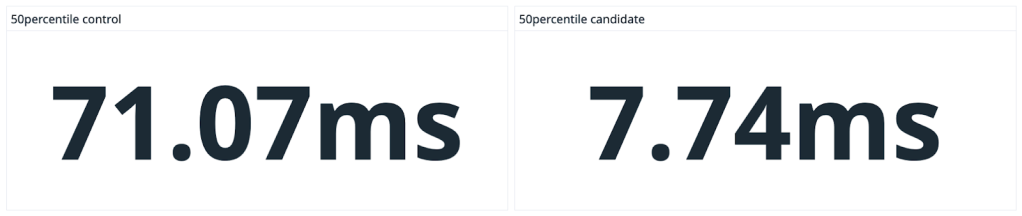
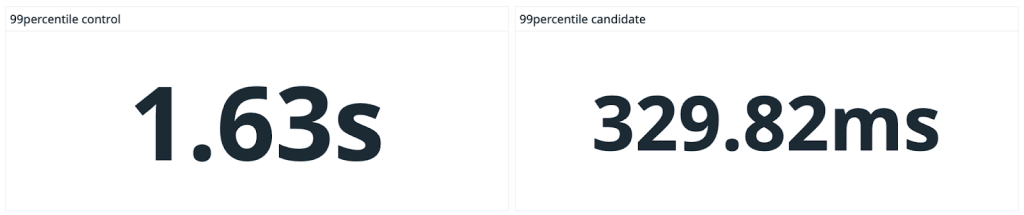
Cedar’s authorization engine is built to a high standard of performance and correctness. Application developers report typical authorization latencies of less than 1 ms, even with hundreds of policies. The resulting authorization decision — Allow or Deny — is provably correct, thanks to the use of verification-guided development. This high standard means your application can use Cedar with confidence, just like Amazon Web Services (AWS) does as part of the Amazon Verified Permissions and AWS Verified Access services.
Cedar’s design is based on three core tenets: usability, speed, and safety. Cedar policies are intuitive to read because they’re defined using your application’s vocabulary—for example, photos organized into albums for a photo-sharing application. Cedar’s policy structure reflects common authorization use cases and enables fast evaluation. Cedar’s semantics are intuitive and safer by default: policies combine to allow or deny access according to rules you already know from AWS Identity and Access Management (IAM).
This post shows how Cedar’s authorization semantics, data model, and policy syntax work together to make the Cedar language intuitive to use, fast, and safe. We cover each of these in turn and highlight how their design reflects our tenets.
The Cedar authorization semantics: Default deny, forbid wins, no ordering
We show how Cedar works on an example application for sharing photos, called PhotoFlash, illustrated in Figure 1.

Figure 1: An example PhotoFlash account. User Jane has two photos, four albums, and three user groups
PhotoFlash lets users like Jane upload photos to the cloud, tag them, and organize them into albums. Jane can also share photos with others, for example, letting her friends view photos in her trips album. PhotoFlash provides a point-and-click interface for users to share access, and then stores the resulting permissions as Cedar policies.
When a user attempts to perform an action on a resource (for example, view a photo), PhotoFlash calls the Cedar authorization engine to determine whether access is allowed. The authorizer evaluates the stored policies against the request and application-specific data (such as a photo’s tags) and returns Allow or Deny. If it returns Allow, PhotoFlash proceeds with the action. If it returns Deny, PhotoFlash reports that the action is not permitted.
Let’s look at some policies and see how Cedar evaluates them to authorize requests safely and simply.
Default deny
To let Jane’s friends view photos in her trips album, PhotoFlash generates and stores the following Cedar permit policy:
Cedar policies define who (the principal) can do what (the action) on what asset (the resource). This policy allows the principal (a PhotoFlash User) in Jane’s friends group to view the resources (a Photo) in Jane’s trips album.
Cedar’s authorizer grants access only if a request satisfies a specific permit policy. This semantics is default deny: Requests that don’t satisfy any permit policy are denied.
Given only our example Policy A, the authorizer will allow Alice to view Jane’s flower.jpg photo. Alice’s request satisfies Policy A because Alice is one of Jane’s friends (see Figure 1). But the authorizer will deny John’s request to view this photo. That’s because John isn’t one of Jane’s friends, and there is no other permit that grants John access to Jane’s photos.
Forbid wins
While PhotoFlash allows individual users to choose their own permissions, it also enforces system-wide security rules.
For example, PhotoFlash wants to prevent users from performing actions on resources that are owned by someone else and tagged as private. If a user (Jane) accidentally permits someone else (Alice) to view a private photo (receipt.jpg), PhotoFlash wants to override the user-defined permission and deny the request.
In Cedar, such guardrails are expressed as forbid policies:
This PhotoFlash policy says that a principal is forbidden from taking an action on a resource when the resource is tagged as private and isn’t contained in the principal’s account.
Cedar’s authorizer makes sure that forbids override permits. If a request satisfies a forbid policy, it’s denied regardless of what permissions are satisfied.
For example, the authorizer will deny Alice’s request to view Jane’s receipt.jpg photo. This request satisfies Policy A because Alice is one of Jane’s friends. But it also satisfies the guardrail in Policy B because the photo is tagged as private. The guardrail wins, and the request is denied.
No ordering
Cedar’s authorization decisions are independent of the order the policies are evaluated in. Whether the authorizer evaluates Policy A first and then Policy B, or the other way around, doesn’t matter. As you’ll see later, the Cedar language design ensures that policies can be evaluated in any order to reach the same authorization decision. To understand the combined meaning of multiple Cedar policies, you need only remember that access is allowed if the request satisfies a permit policy and there are no applicable forbid policies.
Safe by default and intuitive
We’ve proved (using automated reasoning) that Cedar’s authorizer satisfies the default deny, forbids override permits, and order independence properties. These properties help make Cedar’s behavior safe by default and intuitive. Amazon IAM has the same properties. Cedar builds on more than a decade of IAM experience by formalizing and enforcing these properties as parts of its design.
Now that we’ve seen how Cedar authorizes requests, let’s look at how its data model and syntax support writing policies that are quick to read and evaluate.
The Cedar data model: entities with attributes, arranged in a hierarchy
Cedar policies are defined in terms of a vocabulary specific to your application. For example, PhotoFlash organizes photos into albums and users into groups while a task management application organizes tasks into lists. You reflect this vocabulary into Cedar’s data model, which organizes entities into a hierarchy. Entities correspond to objects within your application, such as photos and users. The hierarchy reflects grouping of entities, such as nesting of photos into albums. Think of it as a directed-acyclic graph. Figure 2 shows the entity hierarchy for PhotoFlash that matches Figure 1.

Figure 2: An example hierarchy for PhotoFlash, matching the illustration in Figure 1
Entities are stored objects that serve as principals, resources, and actions in Cedar policies. Policies refer to these objects using entity references, such as Album::”jane/art”.
Policies use the in operator to check if the hierarchy relates two entities. For example, Photo::”flower.jpg” in Account::”jane” is true for the hierarchy in Figure 2, but Photo::”flower.jpg” in Album::”jane/conference” is not. PhotoFlash can persist the entity hierarchy in a dedicated entity store, or compute the relevant parts as needed for an authorization request.
Each entity also has a record that maps named attributes to values. An attribute stores a Cedar value: an entity reference, record, string, 64-bit integer, boolean, or a set of values. For example, Photo::”flower.jpg” has attributes describing the photo’s metadata, such as tags, which is a set of strings, and raw, which is an entity reference to another Photo. Cedar supports a small collection of operators that can be applied to values; these operators are carefully chosen to enable efficient evaluation.
Built-in support for role and attribute-based access control
If the concepts you’ve seen so far seem familiar, that’s not surprising. Cedar’s data model is designed to allow you to implement time-tested access control models, including role-based and attribute-based access control (RBAC and ABAC). The entity hierarchy and the in operator support RBAC-style roles as groups, while entity records and the . operator let you express ABAC-style permissions using per-object attributes.
The Cedar syntax: Structured, loop-free, and stateless
Cedar uses a simple, structured syntax for writing policies. This structure makes Cedar policies simple to understand and fast to authorize at scale. Let’s see how by taking a closer look at Cedar’s syntax.
Structure for readability and scalable authorization
Figure 3 illustrates the structure of Cedar policies: an effect and scope, optionally followed by one or more conditions.
The effect of a policy is to either permit or forbid access. The scope can use equality (==) or membership (in) constraints to restrict the principals, actions, and resources to which the policy applies. Policy conditions are expressions that further restrict when the policy applies.
This structure makes policies straightforward to read and understand: The scope expresses an RBAC rule, and the conditions express ABAC rules. For example, PhotoFlash Policy A has no conditions and expresses a single RBAC rule. Policy B has an open (unconstrained) scope and expresses a single ABAC rule. A quick glance is enough to see if a policy is just an RBAC rule, just an ABAC rule, or a mix of both.

Figure 3: Cedar policy structure, illustrated on PhotoFlash Policy A and B
Scopes also enable scalable authorization for large policy stores through policy slicing. This is a property of Cedar that lets applications authorize a request against a subset of stored policies, supporting real-time decisions even for stores with thousands of policies. With slicing, an application needs to pass a policy to the authorizer only when the request’s principal and resource are descendants of the principal and resource entities specified in the policy’s scope. For example, PhotoFlash needs to include Policy A only for requests that involve the descendants of Group::”jane/friends” and Album::”jane/trips”. But Policy B must be included for all requests because of its open scope.
No loops or state for fast evaluation and intuitive decisions
Policy conditions are Boolean-valued expressions. The Cedar expression language has a familiar syntax that includes if-then-else expressions, short-circuiting Boolean operators (!, &&, ||), and basic operations on Cedar values. Notably, there is no way to express looping or to change the application state (for example, mutate an attribute).
Cedar excludes loops to bound authorization latency. With no loops or costly built-in operators, Cedar policies terminate in O(n2) steps in the worst case (when conditions contain certain set operations), or O(n) in the common case.
Cedar also excludes stateful operations for performance and understandability. Since policies can’t change the application state, their evaluation can be parallelized for better performance, and you can reason about them in any order to see what accesses are allowed.
Learn more
In this post, we explored how Cedar’s design supports intuitive, fast, and safe authorization. With Cedar, your application’s access control rules become standalone policies that are clear, auditable, and reusable. You enforce these policies by calling Cedar’s authorizer to decide quickly and safely which requests are allowed. To learn more, see how to use Cedar to secure your app, and how we built Cedar to a high standard of assurance. You can also visit the Cedar website and blog, try it out in the Cedar playground, and join us on Cedar’s Slack channel.
If you have feedback about this post, submit comments in the Comments section below. If you have questions about this post, contact AWS Support.
Want more AWS Security news? Follow us on Twitter.


 AWS Global Summits – The 2023 AWS Summits season is almost coming to an end with the last two in-person events in


 Shana Schipers is an Analytics Specialist Solutions Architect at AWS, focusing on big data. She supports customers worldwide in building transactional data lakes using open table formats like Apache Hudi, Apache Iceberg and Delta Lake on AWS.
 Ian Meyers is a Director of Product Management for AWS Analytics Services. He works with many of AWS largest customers on emerging technology needs, and leads several data and analytics initiatives within AWS including support for Data Mesh.