Tag Archives: Technical How-to

Choose the k-NN algorithm for your billion-scale use case with OpenSearch

Post Syndicated from Jack Mazanec original https://aws.amazon.com/blogs/big-data/choose-the-k-nn-algorithm-for-your-billion-scale-use-case-with-opensearch/

When organizations set out to build machine learning (ML) applications such as natural language processing (NLP) systems, recommendation engines, or search-based systems, often times k-Nearest Neighbor (k-NN) search will be used at some point in the workflow. As the number of data points reaches the hundreds of millions or even billions, scaling a k-NN search system can be a major challenge. Applying Approximate Nearest Neighbor (ANN) search is a great way to overcome this challenge.

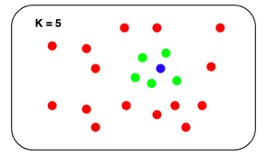
The k-NN problem is relatively simple compared to other ML techniques: given a set of points and a query, find the k nearest points in the set to the query. The naive solution is equally understandable: for each point in the set, compute its distance from the query and keep track of the top k along the way.

K-NN concept

The problem with this naive approach is that it doesn’t scale particularly well. The runtime search complexity is O(Nlogk), where N is the number of vectors and k is the number of nearest neighbors. Although this may not be noticeable when the set contains thousands of points, it becomes noticeable when the size gets into the millions. Although some exact k-NN algorithms can speed search up, they tend to perform similarly to the naive approach in higher dimensions.

Enter ANN search. We can reduce the runtime search latency if we loosen a few constraints on the k-NN problem:

  • Allow indexing to take longer
  • Allow more space to be used at query time
  • Allow the search to return an approximation of the k-NN in the set

Several different algorithms have been discovered to do just that.

OpenSearch is a community-driven, Apache 2.0-licensed, open-source search and analytics suite that makes it easy to ingest, search, visualize, and analyze data. The OpenSearch k-NN plugin provides the ability to use some of these algorithms within an OpenSearch cluster. In this post, we discuss the different algorithms that are supported and run experiments to see some of the trade-offs between them.

Hierarchical Navigable Small Worlds algorithm

The Hierarchical Navigable Small Worlds algorithm (HNSW) is one of the most popular algorithms out there for ANN search. It was the first algorithm that the k-NN plugin supported, using a very efficient implementation from the nmslib similarity search library. It has one of the best query latency vs. recall trade-offs and doesn’t require any training. The core idea of the algorithm is to build a graph with edges connecting index vectors that are close to each other. Then, on search, this graph is partially traversed to find the approximate nearest neighbors to the query vector. To steer the traversal towards the query’s nearest neighbors, the algorithm always visits the closest candidate to the query vector next.

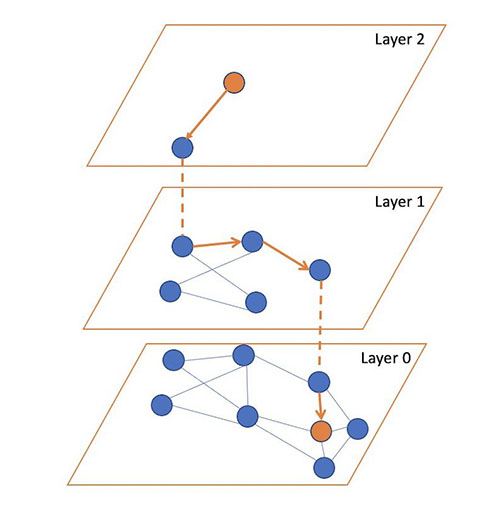
But which vector should the traversal start from? It could just pick a random vector, but for a large index, this might be very far from the query’s actual nearest neighbors, leading to poor results. To pick a vector that is generally close to the query vector to start from, the algorithm builds not just one graph, but a hierarchy of graphs. All vectors are added to the bottom layer, and then a random subset of those are added to the layer above, and then a subset of those are added to the layer above that, and so on.

During search, we start from a random vector in the top layer, partially traverse the graph to find (approximately) the nearest point to the query vector in that layer, and then use this vector as the starting point for our traversal of the layer below. We repeat this until we get to the bottom layer. At the bottom layer, we perform the traversal, but this time, instead of just searching for the nearest neighbor, we keep track of the k-nearest neighbors that are visited along the way.

The following figure illustrates this process (inspired from the image in original paper Efficient and robust approximate nearest neighbor search using Hierarchical Navigable Small World graphs).

You can tune three parameters for HNSW:

  • m – The maximum number of edges a vector will get in a graph. The higher this number is, the more memory the graph will consume, but the better the search approximation may be.
  • ef_search – The size of the queue of the candidate nodes to visit during traversal. When a node is visited, its neighbors are added to the queue to be visited in the future. When this queue is empty, the traversal will end. A larger value will increase search latency, but may provide better search approximation.
  • ef_construction – Very similar to ef_search. When a node is to be inserted into the graph, the algorithm will find its m edges by querying the graph with the new node as the query vector. This parameter controls the candidate queue size for this traversal. A larger value will increase index latency, but may provide a better search approximation.

For more information on HNSW, you can read through the paper Efficient and robust approximate nearest neighbor search using Hierarchical Navigable Small World graphs.

Memory consumption

Although HNSW provides very good approximate nearest neighbor search at low latencies, it can consume a large amount of memory. Each HNSW graph uses roughly 1.1 * (4 * d + 8 * m) * num_vectors bytes of memory:

  • d is the dimension of the vectors
  • m is the algorithm parameter that controls the number of connections each node will have in a layer
  • num_vectors is the number of vectors in the index

To ensure durability and availability, especially when running production workloads, OpenSearch indexes are recommended to have at least one replica shard. Therefore, the memory requirement is multiplied by (1 + number of replicas). For use cases where the data size is 1 billion vectors of 128 dimensions each and m is set to the default value of 16, the estimated amount of memory required would be:

1.1 * (4 * 128 + 8 * 16) * 1,000,000,000 * 2 = 1,408 GB.

If we increase the size of vectors to 512, for example, and the m to 100, which is recommended for vectors with high intrinsic dimensionality, some use cases can require a total memory of approximately 4 TB.

With OpenSearch, we can always horizontally scale the cluster to handle this memory requirement. However, this comes at the expense of raising infrastructure costs. For cases where scaling doesn’t make sense, options to reduce the memory footprint of the k-NN system need to be explored. Fortunately, there are algorithms that we can use to do this.

Inverted File System algorithm

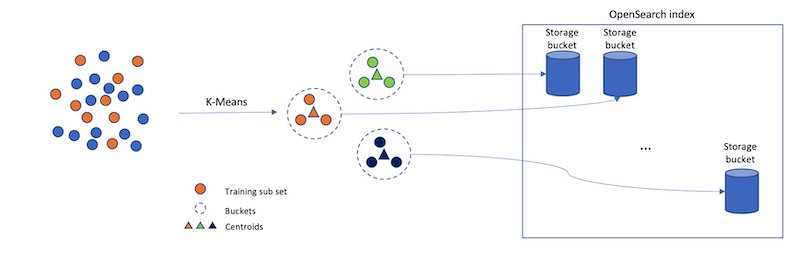
Consider a different approach for approximating a nearest neighbor search: separate your index vectors into a set of buckets, then, to reduce your search time, only search through a subset of these buckets. From a high level, this is what the Inverted File System (IVF) ANN algorithm does. In OpenSearch 1.2, the k-NN plugin introduced support for the implementation of IVF by Faiss. Faiss is an open-sourced library from Meta for efficient similarity search and clustering of dense vectors.

However, if we just randomly split up our vectors into different buckets, and only search a subset of them, this will be a poor approximation. The IVF algorithm uses a more elegant approach. First, before indexing begins, it assigns each bucket a representative vector. When a vector is indexed, it gets added to the bucket that has the closest representative vector. This way, vectors that are closer to each other are placed roughly in the same or nearby buckets.

To determine what the representative vectors for the buckets are, the IVF algorithm requires a training step. In this step, k-Means clustering is run on a set of training data, and the centroids it produces become the representative vectors. The following diagram illustrates this process.

Inverted file system indexing concept

IVF has two parameters:

  • nlist – The number of buckets to create. More buckets will result in longer training times, but may improve the granularity of the search.
  • nprobes – The number of buckets to search. This parameter is fairly straightforward. The more buckets that are searched, the longer the search will take, but the better the approximation.

Memory consumption

In general, IVF requires less memory than HNSW because IVF doesn’t need to store a set of edges for each indexed vector.

We estimate that IVF will roughly require the following amount of memory:

1.1 * (((4 * dimension) * num_vectors) + (4 * nlist * dimension)) bytes

For the case explored for HNSW where there are 1,000,000,000 128-dimensional vectors with one layer of replication, an IVF algorithm with an nlist of 4096 would take roughly 1.1 * (((4 * 128) * 2,000,000,000) + (4 * 4096 * 128)) bytes = 1126 GB.

This savings does come at a cost, however, because HNSW offers a better query latency versus approximation accuracy tradeoff.

Product quantization vector compression

Although you can use HNSW and IVF to speed up nearest neighbor search, they can consume a considerable amount of memory. When we get into the billion-vector scale, we start to require thousands of GBs of memory to support their index structures. As we scale up the number of vectors or the dimension of vectors, this requirement continues to grow. Is there a way to use noticeably less space for our k-NN index?

The answer is yes! In fact, there are a lot of different ways to reduce the amount of memory vectors require. You can change your embedding model to produce smaller vectors, or you can apply techniques like Principle Component Analysis (PCA) to reduce the vector’s dimensionality. Another approach is to use quantization. The general idea of vector quantization is to map a large vector space with continuous values into a smaller space with discrete values. When a vector is mapped into a smaller space, it requires fewer bits to represent. However, this comes at a cost—when mapping to a smaller input space, some information about the vector is lost.

Product quantization (PQ) is a very popular quantization technique in the field of nearest neighbor search. It can be used together with ANN algorithms for nearest neighbor search. Along with IVF, the k-NN plugin added support for Faiss’s PQ implementation in OpenSearch 1.2.

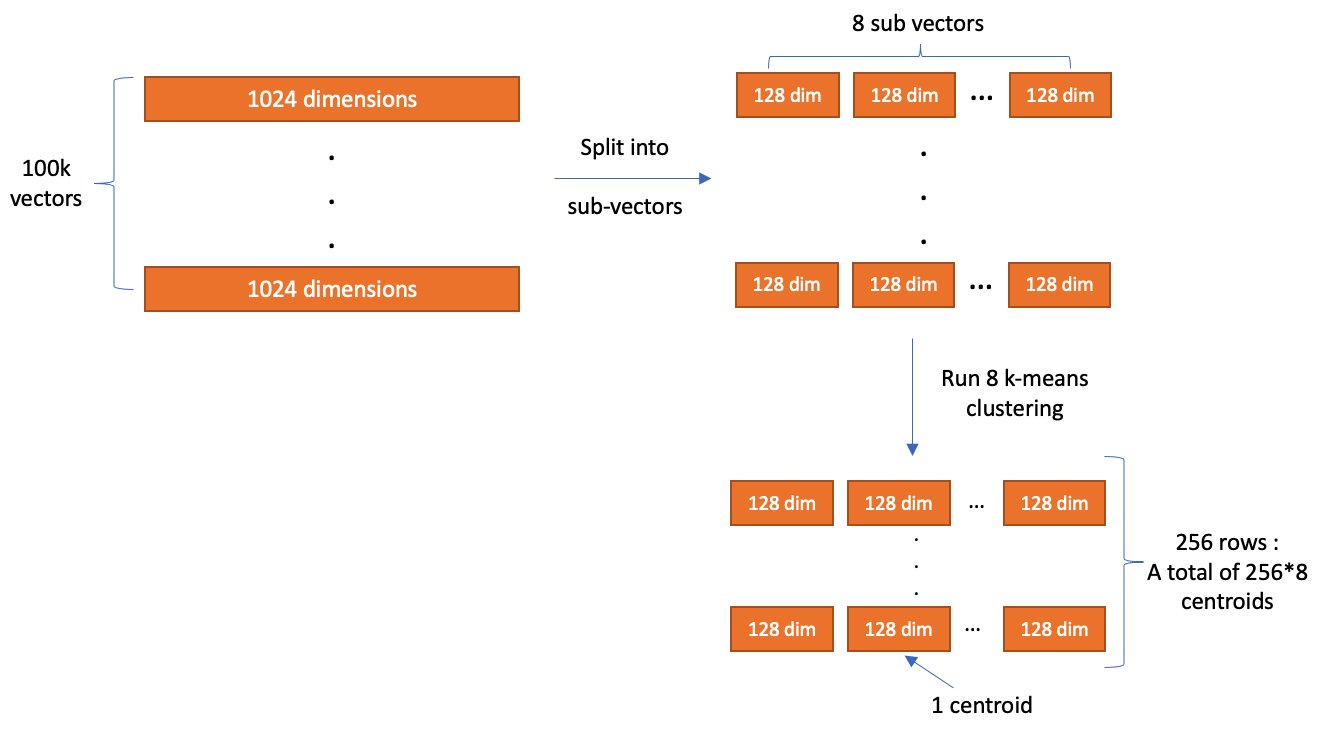
The main idea of PQ is to break up a vector into several sub-vectors and encode the sub-vectors independently with a fixed number of bits. The number of sub-vectors that the original vector is broken up into is controlled by a parameter, m, and the number of bits to encode each sub-vector with is controlled by a parameter, code_size. After encoding finishes, a vector is compressed into roughly m * code_size bits. So, assume we have a set of 100,000 1024-dimensional vectors. With m = 8 and code_size = 8, PQ breaks each vector into 8 128-dimensional sub-vectors and encode each sub-vector with 8 bits.

The values used for encoding are produced during a training step. During training, tables are created with 2code_size entries for each sub-vector partition. Next, k-Means clustering, with a k value of 2code_size, is run on the corresponding partition of sub-vectors from the training data. The centroids produced here are added as the entries to the partition’s table.

After all the tables are created, we encode a vector by replacing each sub-vector with the ID of the closest vector in the partition’s table. In the example where code_size = 8, we only need 8 bits to store an ID because there are 28 elements in the table. So, with dimension = 1024 and m = 8, the total size of one vector (assuming it uses a 32-bit floating point data type) is reduced from 4,096 bytes to roughly 8 bytes!

Product quantization encoding step

When we want to decode a vector, we can reconstruct an approximated version of it by using the stored IDs to retrieve the vectors from each partition’s table. The distance from the query vector to the reconstructed vector can then be computed and used in a nearest neighbor search. (It’s worth noting that, in practice, further optimization techniques like ADC are used to speed up this process for k-NN search).

Product quantization decoding step

Memory consumption

As we mentioned earlier, PQ will encode each vector into roughly m * code_size bits plus some overhead for each vector.

When combining it with IVF, we can estimate the index size as follows:

1.1 * ((((code_size/8) * m + overhead_per_vector) * num_vectors) + (4 * nlist * dimension) + (2 code_size * 4 * dimension) bytes

Using 1 billion vectors, dimension = 128, m = 8, code_size = 8, and nlist = 4096, we get an estimated total memory consumption of 70GB: 1.1 * ((((8 / 8) * 8 + 24) * 1,000,000,000) + (4 * 4096 * 128) + (2^8 * 4 * 128)) * 2 = 70 GB.

Running k-NN with OpenSearch

First make sure you have an OpenSearch cluster up and running. For instructions, refer to Cluster formation. For a more managed solution, you can use Amazon OpenSearch Service.

Before getting into the experiments, let’s go over how to run k-NN workloads in OpenSearch. First, we need to create an index. An index stores a set of documents in a way that they can be easily searched. For k-NN, the index’s mapping tells OpenSearch what algorithms to use and what parameters to use with them. We start by creating an index that uses HNSW as its search algorithm:

PUT my-hnsw-index
{
  "settings": {
    "index": {
      "knn": true,
      "number_of_shards": 10,
      "number_of_replicas" 1,
    }
  },
  "mappings": {
    "properties": {
      "my_vector": {
        "type": "knn_vector",
        "dimension": 4,
        "method": {
          "name": "hnsw",
          "space_type": "l2",
          "engine": "nmslib",
          "parameters": {
            "ef_construction": 128,
            "m": 24
          }
        }
      }
    }
  }
}

In the settings, we need to enable knn so that the index can be searched with the knn query type (more on this later). We also set the number of shards, and the number of replicas each shard will have. An index is made up of a collection of shards. Sharding is how OpenSearch distributes an index across multiple nodes in a cluster. For more information about shards, refer to Sizing Amazon OpenSearch Service domains.

In the mappings, we configure a field called my_vector of type knn_vector to store the vector data. We also pass nmslib as the engine to let OpenSearch know it should use nmslib’s implementation of HNSW. Additionally, we pass l2 as the space_type. The space_type determines the function used to compute the distance between two vectors. l2 refers to the Euclidean distance. OpenSearch also supports cosine similarity and the inner product distance functions.

After the index is created, we can ingest some fake data:

POST _bulk
{ "index": { "_index": "my-hnsw-index", "_id": "1" } }
{ "my_vector": [1.5, 2.5], "price": 12.2 }
{ "index": { "_index": "my-hnsw-index", "_id": "2" } }
{ "my_vector": [2.5, 3.5], "price": 7.1 }
{ "index": { "_index": "my-hnsw-index", "_id": "3" } }
{ "my_vector": [3.5, 4.5], "price": 12.9 }
{ "index": { "_index": "my-hnsw-index", "_id": "4" } }
{ "my_vector": [5.5, 6.5], "price": 1.2 }
{ "index": { "_index": "my-hnsw-index", "_id": "5" } }
{ "my_vector": [4.5, 5.5], "price": 3.7 }
{ "index": { "_index": "my-hnsw-index", "_id": "6" } }
{ "my_vector": [1.5, 5.5, 4.5, 6.4], "price": 10.3 }
{ "index": { "_index": "my-hnsw-index", "_id": "7" } }
{ "my_vector": [2.5, 3.5, 5.6, 6.7], "price": 5.5 }
{ "index": { "_index": "my-hnsw-index", "_id": "8" } }
{ "my_vector": [4.5, 5.5, 6.7, 3.7], "price": 4.4 }
{ "index": { "_index": "my-hnsw-index", "_id": "9" } }
{ "my_vector": [1.5, 5.5, 4.5, 6.4], "price": 8.9 }

After adding some documents to the index, we can search it:

GET my-hnsw-index/_search
{
  "size": 2,
  "query": {
    "knn": {
      "my_vector": {
        "vector": [2, 3, 5, 6],
        "k": 2
      }
    }
  }
}

Creating an index that uses IVF or PQ is a little bit different because these algorithms require training. Before creating the index, we need to create a model using the training API:

POST /_plugins/_knn/models/my_ivfpq_model/_train
{
  "training_index": "train-index",
  "training_field": "train-field",
  "dimension": 128,
  "description": "My model description",
  "method": {
      "name":"ivf",
      "engine":"faiss",
      "parameters":{
        "encoder":{
            "name":"pq",
            "parameters":{
                "code_size": 8,
                "m": 8
            }
        }
      }
  }
}

The training_index and training_field specify where the training data is stored. The only requirement for the training data index is that it has a knn_vector field that has the same dimension as you want your model to have. The method defines the algorithm that should be used for search.

After the training request is submitted, it will run in the background. To check if the training is complete, you can use the GET model API:

GET /_plugins/_knn/models/my_ivfpq_model/filter_path=model_id,state
{
  "model_id" : "my_ivfpq_model",
  "state" : "created"
}

After the model is created, you can create an index that uses this model:

PUT /my-hnsw-index
{
  "settings" : {
    "index.knn": true
    "number_of_shards" : 10,
    "number_of_replicas" : 1,
  },
  "mappings": {
    "properties": {
      "my_vector": {
        "type": "knn_vector",
        "model_id": "my_ivfpq_model"
      }
    }
  }
}

After the index is created, we can add documents to it and search it just like we did for HNSW.

Experiments

Let’s run a few experiments to see how these algorithms perform in practice and what tradeoffs are made. We look at an HNSW versus an IVF index using PQ. For these experiments, we’re interested in search accuracy, query latency, and memory consumption. Because these trade-offs are mainly observed at scale, we use the BIGANN dataset containing 1 billion vectors of 128 dimensions. The dataset also contains 10,000 queries of test data mapping a query to the ground truth closest 100 vectors based on the Euclidean distance.

Specifically, we compute the following search metrics:

  • Latency p99 (ms), Latency p90 (ms), Latency p50 (ms) – Query latency at various quantiles in milliseconds
  • recall@10 – The fraction of the top 10 ground truth neighbors found in the 10 results returned by the plugin
  • Native memory consumption (GB) – The amount of memory used by the plugin during querying

One thing to note is that the BIGANN dataset uses an unsigned integer as the data type. Because the knn_vector field doesn’t support unsigned integers, the data is automatically converted to floats.

To run the experiments, we complete the following steps:

  1. Ingest the dataset into the cluster using the OpenSearch Benchmarks framework (the code can be found on GitHub).
  2. When ingestion is complete, we use the warmup API to prepare the cluster for the search workload.
  3. We run the 10,000 test queries against the cluster 10 times and collect the aggregated results.

The queries return the document ID only, and not the vector, to improve performance (code for this can be found on GitHub).

Parameter selection

One tricky aspect of running experiments is selecting the parameters. There are too many different combinations of parameters to test them all. That being said, we decided to create three configurations for HNSW and IVFPQ:

  • Optimize for search latency and memory
  • Optimize for recall
  • Fall somewhere in the middle

For each optimization strategy, we chose two configurations.

For HNSW, we can tune the m, ef_construction, and ef_search parameters to achieve our desired trade-off:

  • m – Controls the maximum number of edges a node in a graph can have. Because each node has to store all of its edges, increasing this value will increase the memory footprint, but also increase the connectivity of the graph, which will improve recall.
  • ef_construction – Controls the size of the candidate queue for edges when adding a node to the graph. Increasing this value will increase the number of candidates to consider, which will increase the index latency. However, because more candidates will be considered, the quality of the graph will be better, leading to better recall during search.
  • ef_search – Similar to ef_construction, it controls the size of the candidate queue for graph traversal during search. Increasing this value will increase the search latency, but will also improve the recall.

In general, we chose configurations that gradually increased the parameters, as detailed in the following table.

Config ID Optimization Strategy m ef_construction ef_search
hnsw1 Optimize for memory and search latency 8 32 32
hnsw2 Optimize for memory and search latency 16 32 32
hnsw3 Balance between latency, memory, and recall 16 128 128
hnsw4 Balance between latency, memory, and recall 32 256 256
hnsw5 Optimize for recall 32 512 512
hnsw6 Optimize for recall 64 512 512

For IVF, we can tune two parameters:

  • nlist – Controls the granularity of the partitioning. The recommended value for this parameter is a function of the number of vectors in the index. One thing to keep in mind is that there are Faiss indexes that map to Lucene segments. There are several Lucene segments per shard and several shards per OpenSearch index. For our estimates, we assumed that there would be 100 segments per shard and 24 shards, so about 420,000 vectors per Faiss index. With this value, we estimated a good value to be 4096 and kept this constant for the experiments.
  • nprobes – Controls the number of nlist buckets we search. Higher values generally lead to improved recalls at the expense of increased search latencies.

For PQ, we can tune two parameters:

  • mControls the number of partitions to break the vector into. The larger this value is, the better the encoding will approximate the original, at the expense of raising memory consumption.
  • code_sizeControls the number of bits to encode a sub-vector with. The larger this value is, the better the encoding approximates the original, at the expense of raising memory consumption. The max value is 8, so we kept it constant at 8 for all experiments.

The following table summarizes our strategies.

Config ID Optimization Strategy nprobes m (num_sub_vectors)
ivfpq1 Optimize for memory and search latency 8 8
ivfpq2 Optimize for memory and search latency 16 8
ivfpq3 Balance between latency, memory, and recall 32 16
ivfpq4 Balance between latency, memory, and recall 64 32
ivfpq5 Optimize for recall 128 16
ivfpq6 Optimize for recall 128 32

Additionally, we need to figure out how much training data to use for IVFPQ. In general, Faiss recommends between 30,000 and 256,000 training vectors for components involving k-Means training. For our configurations, the maximum k for k-Means is 4096 from the nlist parameter. With this formula, the recommended training set size is between 122,880 and 1,048,576 vectors, so we settled on 1 million vectors. The training data comes from the index vector dataset.

Lastly, for the index configurations, we need to select the shard count. It is recommended to keep the shard size between 10–50 GBs for OpenSearch. Experimentally, we determined that for HNSW, a good number would be 64 shards and for IVFPQ, 42. Both index configurations were configured with one replica.

Cluster configuration

To run these experiments, we used Amazon OpenSearch Service using version 1.3 of OpenSearch to create the clusters. We decided to use the r5 instance family, which provides a good trade-off between memory size and cost.

The number of nodes will depend on the amount of memory that can be used for the algorithm per node and the total amount of memory required by the algorithm. Having more nodes and more memory will generally improve performance, but for these experiments, we want to minimize cost. The amount of memory available per node is computed as memory_available = (node_memory - jvm_size) * circuit_breaker_limit, with the following parameters:

  • node_memory – The total memory of the instance.
  • jvm_size – The OpenSearch JVM heap size. Set to 32 GB.
  • circuit_breaker_limit – The native memory usage threshold for the circuit breaker. Set to 0.5.

Because HNSW and IVFPQ have different memory requirements, we estimate how much memory is needed for each algorithm and determine the required number of nodes accordingly.

For HNSW, with m = 64, the total memory required using the formula from the previous sections is approximately 2,252 GB. Therefore, with r5.12xlarge (384 GB of memory), memory_available is 176 GB and the total number of nodes required is about 12, which we round up to 16 for stability purposes.

Because the IVFPQ algorithm requires less memory, we can use a smaller instance type, the r5.4xlarge instance, which has 128 GB of memory. Therefore, the memory_available for the algorithm is 48 GB. The estimated algorithm memory consumption where m = 64 is a total of 193 GB and the total number of nodes required is four, which we round up to six for stability purposes.

For both clusters, we use c5.2xlarge instance types as dedicated leader nodes. This will provide more stability for the cluster.

According to the AWS Pricing Calculator, for this particular use case, the cost per hour of the HNSW cluster is around $75 an hour, and the IVFPQ cluster costs around $11 an hour. This is important to remember when comparing the results.

Also, keep in mind that these benchmarks can be run using your custom infrastructure, using Amazon Elastic Compute Cloud (Amazon EC2), as long as the instance types and their memory size is equivalent.

Results

The following tables summarize the results from the experiments.

Test ID p50 Query latency (ms) p90 Query latency (ms) p99 Query latency (ms) Recall@10 Native memory consumption (GB)
hnsw1 9.1 11 16.9 0.84 1182
hnsw2 11 12.1 17.8 0.93 1305
hnsw3 23.1 27.1 32.2 0.99 1306
hnsw4 54.1 68.3 80.2 0.99 1555
hnsw5 83.4 100.6 114.7 0.99 1555
hnsw6 103.7 131.8 151.7 0.99 2055
Test ID p50 Query latency (ms) p90 Query latency (ms) p99 Query latency (ms) Recall@10 Native memory consumption (GB)
ivfpq1 74.9 100.5 106.4 0.17 68
ivfpq2 78.5 104.6 110.2 0.18 68
ivfpq3 87.8 107 122 0.39 83
ivfpq4 117.2 131.1 151.8 0.61 114
ivfpq5 128.3 174.1 195.7 0.40 83
ivfpq6 163 196.5 228.9 0.61 114

As you might expect, given how many more resources it uses, the HNSW cluster has lower query latencies and better recall. However, the IVFPQ indexes use significantly less memory.

For HNSW, increasing the parameters does in fact lead to better recall at the expense of latency. For IVFPQ, increasing m has the most significant impact on improving recall. Increasing nprobes improves the recall marginally, but at the expense of significant increases in latencies.

Conclusion

In this post, we covered different algorithms and techniques used to perform approximate k-NN search at scale (over 1 billion data points) within OpenSearch. As we saw in the previous benchmarks section, there isn’t one algorithm or approach that optimises for all the metrics at once. HNSW, IVF, and PQ each allow you to optimize for different metrics in your k-NN workload. When choosing the k-NN algorithm to use, first understand the requirements of your use case (How accurate does my approximate nearest neighbor search need to be? How fast should it be? What’s my budget?) and then tailor the algorithm configuration to meet them.

You can take a look at the benchmarking code base we used on GitHub. You can also get started with approximate k-NN search today following the instructions in Approximate k-NN search. If you’re looking for a managed solution for your OpenSearch cluster, check out Amazon OpenSearch Service.


About the Authors

Jack Mazanec is a software engineer working on OpenSearch plugins. His primary interests include machine learning and search engines. Outside of work, he enjoys skiing and watching sports.

Othmane Hamzaoui is a Data Scientist working at AWS. He is passionate about solving customer challenges using Machine Learning, with a focus on bridging the gap between research and business to achieve impactful outcomes. In his spare time, he enjoys running and discovering new coffee shops in the beautiful city of Paris.

DevOps with serverless Jenkins and AWS Cloud Development Kit (AWS CDK)

Post Syndicated from sangusah original https://aws.amazon.com/blogs/devops/devops-with-serverless-jenkins-and-aws-cloud-development-kit-aws-cdk/

The objective of this post is to walk you through how to set up a completely serverless Jenkins environment on AWS Fargate using AWS Cloud Development Kit (AWS CDK).

Jenkins is a popular open-source automation server that provides hundreds of plugins to support building, testing, deploying, and automation. Jenkins uses a controller-agent architecture in which the controller is responsible for serving the web UI, stores the configurations and related data on disk, and delegates the jobs to the worker agents that run these jobs as their primary responsibility.

Amazon Elastic Container Service (Amazon ECS)  using Fargate is a fully-managed container orchestration service that helps you easily deploy, manage, and scale containerized applications. It deeply integrates with the rest of the AWS platform to provide a secure and easy-to-use solution for running container workloads in the cloud and now on your infrastructure. Fargate is a serverless, pay-as-you-go compute engine that lets you focus on building applications without managing servers. Fargate is compatible with both Amazon ECS and Amazon Elastic Kubernetes Service (Amazon EKS).

Solution overview

The following diagram illustrates the solution architecture. The dashed lines indicate the AWS CDK deployment.

Figure 1 This diagram shows AWS CDK and how it deploys using AWS CloudFormation to create the Elastic Load Balancer, AWS Fargate, and Amazon EFS

Figure 1 This diagram shows AWS CDK and how it deploys using AWS CloudFormation to create the Elastic Load Balancer, AWS Fargate, and Amazon EFS

You’ll be using the following:

  1. The Jenkins controller URL backed by an Application Load Balancer (ALB).
  2. You’ll be using your default Amazon Virtual Private Cloud (Amazon VPC) for this example.
  3. The Jenkins controller runs as a service in Amazon ECS using Fargate as the launch type. You’ll use Amazon Elastic File System (Amazon EFS) as the persistent backing store for the Jenkins controller task. The Jenkins controller and Amazon EFS are launched in private subnets.

Prerequisites

For this post, you’ll utilize AWS CDK using TypeScript.

Follow the guide on Getting Started for AWS CDK to:

  • Get your local environment setup
  • Bootstrap your development account

Code

Let’s review the code used to define the Jenkins environment in AWS using the AWS CDK.

Setup your imports

import { Duration, IResource, RemovalPolicy, Stack, Tags } from 'aws-cdk-lib';
import { Construct } from 'constructs';

import * as cdk from 'aws-cdk-lib';

import * as ecs from 'aws-cdk-lib/aws-ecs';
import * as efs from 'aws-cdk-lib/aws-efs';
import { Port } from 'aws-cdk-lib/aws-ec2';
import * as elbv2 from 'aws-cdk-lib/aws-elasticloadbalancingv2';

Setup your Amazon ECS, which is a logical grouping of tasks or services and set vpc

export class AppStack extends Stack {
  constructor(scope: Construct, id: string, props?: cdk.StackProps) {
    super(scope, id, props);

    const jenkinsHomeDir: string = 'jenkins-home';
    const appName: string = 'jenkins-cdk';

    const cluster = new ecs.Cluster(this, `${appName}-cluster`, {
      clusterName: appName,
    });

    const vpc = cluster.vpc;

Setup Amazon EFS to store the data

    const fileSystem = new efs.FileSystem(this, `${appName}-efs`, {
      vpc: vpc,
      fileSystemName: appName,
      removalPolicy: RemovalPolicy.DESTROY,
    });

Setup Access Point, which are application-specific entry points into an Amazon EFS file system that makes it easier to manage application access to shared datasets

const accessPoint = fileSystem.addAccessPoint(`${appName}-ap`, {
      path: `/${jenkinsHomeDir}`,
      posixUser: {
        uid: '1000',
        gid: '1000',
      },
      createAcl: {
        ownerGid: '1000',
        ownerUid: '1000',
        permissions: '755',
      },
    });

Setup Task Definition to run Docker containers in Amazon ECS

const taskDefinition = new ecs.FargateTaskDefinition(
      this,
      `${appName}-task`,
      {
        family: appName,
        cpu: 1024,
        memoryLimitMiB: 2048,
      }
    );

Setup a Volume mapping the Amazon EFS from above to the Task Definition

taskDefinition.addVolume({
      name: jenkinsHomeDir,
      efsVolumeConfiguration: {
        fileSystemId: fileSystem.fileSystemId,
        transitEncryption: 'ENABLED',
        authorizationConfig: {
          accessPointId: accessPoint.accessPointId,
          iam: 'ENABLED',
        },
      },
    });

Setup the Container using the Task Definition and the Jenkins image from the registry

const containerDefinition = taskDefinition.addContainer(appName, {
      image: ecs.ContainerImage.fromRegistry('jenkins/jenkins:lts'),
      logging: ecs.LogDrivers.awsLogs({ streamPrefix: 'jenkins' }),
      portMappings: [{ containerPort: 8080 }],
    });

Setup Mount Points to bind ephemeral storage to the container

containerDefinition.addMountPoints({
      containerPath: '/var/jenkins_home',
      sourceVolume: jenkinsHomeDir,
      readOnly: false,
    });

Setup Fargate Service to run the container serverless

    const fargateService = new ecs.FargateService(this, `${appName}-service`, {
      serviceName: appName,
      cluster: cluster,
      taskDefinition: taskDefinition,
      desiredCount: 1,
      maxHealthyPercent: 100,
      minHealthyPercent: 0,
      healthCheckGracePeriod: Duration.minutes(5),
    });
    fargateService.connections.allowTo(fileSystem, Port.tcp(2049));

Setup ALB and add listener to checks for connection requests, using the protocol and port that you configure.

    const loadBalancer = new elbv2.ApplicationLoadBalancer(
      this,
      `${appName}-elb`,
      {
        loadBalancerName: appName,
        vpc: vpc,
        internetFacing: true,
      }
    );
    const lbListener = loadBalancer.addListener(`${appName}-listener`, {
      port: 80,
    });

Setup Target to route requests to Jenkins running on Amazon ECS using Fargate

const loadBalancerTarget = lbListener.addTargets(`${appName}-target`, {
      port: 8080,
      targets: [fargateService],
      deregistrationDelay: Duration.seconds(10),
      healthCheck: { path: '/login' },
    });
  }
}

Jenkins Deployment

Now that you have all the code, let’s deploy the AWS CDK definition:

  1. Make sure that you have done the Prerequisite steps from earlier.
  2. Install packages by running the following command in your IDE CLI:
npm i
  1. Now you’ll deploy your AWS CDK definition to your dev account:
cdk deploy

Let’s now login to Jenkins

  1. In your browser, use the DNS Name from the deployed Load Balancer
  2. In Amazon CloudWatch, there will be a Log group that will be created that is associated to Cluster Service.
    1. Go into that log and you’ll see it output the Password to login to Jenkins
  1. In Jenkins, follow the wizard to continue the setup

Cleaning up

To avoid incurring future charges, delete the resources.

Let’s destroy our deploy solution

  1. In your IDE CLI:
cdk destroy

Conclusion

With this overview we were able to cover the following:

  • Build an Elastic Load Balancer
  • Use AWS Fargate with a Jenkins AMI
  • All resources running serverlessly
  • All build using the AWS CDK

About the author:

Josh Thornes

Josh Thornes is a Sr. Technical Account Manager at AWS. He works with AWS Partners at any stage of their software-as-a-service (SaaS) journey in order to help build new products, migrate existing applications, or optimize SaaS solutions on AWS. His areas of interest include builder experience (e.g., developer tools, DevOps culture, CI/CD, Front-end, Mobile, Microservices), security, IoT, analytics.

Use AWS Network Firewall to filter outbound HTTPS traffic from applications hosted on Amazon EKS and collect hostnames provided by SNI

Post Syndicated from Kirankumar Chandrashekar original https://aws.amazon.com/blogs/security/use-aws-network-firewall-to-filter-outbound-https-traffic-from-applications-hosted-on-amazon-eks/

This blog post shows how to set up an Amazon Elastic Kubernetes Service (Amazon EKS) cluster such that the applications hosted on the cluster can have their outbound internet access restricted to a set of hostnames provided by the Server Name Indication (SNI) in the allow list in the AWS Network Firewall rules. For encrypted web traffic, SNI can be used for blocking access to specific sites in the network firewall. SNI is an extension to TLS that remains unencrypted in the traffic flow and indicates the destination hostname a client is attempting to access over HTTPS.

This post also shows you how to use Network Firewall to collect hostnames of the specific sites that are being accessed by your application. Securing outbound traffic to specific hostnames is called egress filtering. In computer networking, egress filtering is the practice of monitoring and potentially restricting the flow of information outbound from one network to another. Securing outbound traffic is usually done by means of a firewall that blocks packets that fail to meet certain security requirements. One such firewall is AWS Network Firewall, a managed service that you can use to deploy essential network protections for all of your VPCs that you create with Amazon Virtual Private Cloud (Amazon VPC).

Example scenario

You have the option to scan your application traffic by the identifier of the requested SSL certificate, which makes you independent from the relationship of the IP address to the certificate. The certificate could be served from any IP address. Traditional stateful packet filters are not able to follow the changing IP address of the endpoints. Therefore, the host name information that you get from the SNI becomes important in making security decisions. Amazon EKS has gained popularity for running containerized workloads in the AWS Cloud, and you can restrict outbound traffic to only the known hostnames provided by SNI. This post will walk you through the process of setting up the EKS cluster in two different subnets so that your software can use the additional traffic routing in the VPC and traffic filtering through Network Firewall.

Solution architecture

The architecture illustrated in Figure 1 shows a VPC with three subnets in Availability Zone A, and three subnets in Availability Zone B. There are two public subnets where Network Firewall endpoints are deployed, two private subnets where the worker nodes for the EKS cluster are deployed, and two protected subnets where NAT gateways are deployed.

Figure 1: Outbound internet access through Network Firewall from Amazon EKS worker nodes

Figure 1: Outbound internet access through Network Firewall from Amazon EKS worker nodes

The workflow in the architecture for outbound access to a third-party service is as follows:

  1. The outbound request originates from the application running in the private subnet (for example, to https://aws.amazon.com) and is passed to the NAT gateway in the protected subnet.
  2. The HTTPS traffic received in the protected subnet is routed to the AWS Network Firewall endpoint in the public subnet.
  3. The network firewall computes the rules, and either accepts or declines the request to pass to the internet gateway.
  4. If the request is passed, the application-requested URL (provided by SNI in the non-encrypted HTTPS header) is allowed in the network firewall, and successfully reaches the third-party server for access.

The VPC settings for this blog post follow the recommendation for using public and private subnets described in Creating a VPC for your Amazon EKS cluster in the Amazon EKS User Guide, but with additional subnets called protected subnets. Instead of placing the NAT gateway in a public subnet, it will be placed in the protected subnet, and the Network Firewall endpoints in the public subnet will filter the egress traffic that flows through the NAT gateway. This design pattern adds further checks and could be a recommendation for your VPC setup.

As suggested in Creating a VPC for your Amazon EKS cluster, using the Public and private subnets option allows you to deploy your worker nodes to private subnets, and allows Kubernetes to deploy load balancers to the public subnets. This arrangement can load-balance traffic to pods that are running on nodes in the private subnets. As shown in Figure 1, the solution uses an additional subnet named the protected subnet, apart from the public and private subnets. The protected subnet is a VPC subnet deployed between the public subnet and private subnet. The outbound internet traffic that is routed through the protected subnet is rerouted to the Network Firewall endpoint hosted within the public subnet. You can use the same strategy mentioned in Creating a VPC for your Amazon EKS cluster to place different AWS resources within private subnets and public subnets. The main difference in this solution is that you place the NAT gateway in a separate protected subnet, between private subnets, and place Network Firewall endpoints in the public subnets to filter traffic in the network firewall. The NAT gateway’s IP address is still preserved, and could still be used for adding to the allow list of third-party entities that need connectivity for the applications running on the EKS worker nodes.

To see a practical example of how the outbound traffic is filtered based on the hosted names provided by SNI, follow the steps in the following Deploy a sample section. You will deploy an AWS CloudFormation template that deploys the solution architecture, consisting of the VPC components, EKS cluster components, and the Network Firewall components. When that’s complete, you can deploy a sample app running on Amazon EKS to test egress traffic filtering through AWS Network Firewall.

Deploy a sample to test the network firewall

Follow the steps in this section to perform a sample app deployment to test the use case of securing outbound traffic through AWS Network Firewall.

Prerequisites

The prerequisite actions required for the sample deployment are as follows:

  1. Make sure you have the AWS CLI installed, and configure access to your AWS account.
  2. Install and set up the eksctl tool to create an Amazon EKS cluster.
  3. Copy the necessary CloudFormation templates and the sample eksctl config files from the blog’s Amazon S3 bucket to your local file system. You can do this by using the following AWS CLI S3 cp command.
    aws s3 cp s3://awsiammedia/public/sample/803-network-firewall-to-filter-outbound-traffic/config.yaml .
    aws s3 cp s3://awsiammedia/public/sample/803-network-firewall-to-filter-outbound-traffic/lambda_function.py .
    aws s3 cp s3://awsiammedia/public/sample/803-network-firewall-to-filter-outbound-traffic/network-firewall-eks-collect-all.yaml .
    aws s3 cp s3://awsiammedia/public/sample/803-network-firewall-to-filter-outbound-traffic/network-firewall-eks.yaml .

    Important: This command will download the S3 bucket contents to the current directory on your terminal, so the “.” (dot) in the command is very important.

  4. Once this is complete, you should be able to see the list of files shown in Figure 2. (The list includes config.yaml, lambda_function.py, network-firewall-eks-collect-all.yaml, and network-firewall-eks.yaml.)
    Figure 2: Files downloaded from the S3 bucket

    Figure 2: Files downloaded from the S3 bucket

Deploy the VPC architecture with AWS Network Firewall

In this procedure, you’ll deploy the VPC architecture by using a CloudFormation template.

To deploy the VPC architecture (AWS CLI)

  1. Deploy the CloudFormation template network-firewall-eks.yaml, which you previously downloaded to your local file system from the Amazon S3 bucket.

    You can do this through the AWS CLI by using the create-stack command, as follows.

    aws cloudformation create-stack --stack-name AWS-Network-Firewall-Multi-AZ \
    --template-body file://network-firewall-eks.yaml \
    --parameters ParameterKey=NetworkFirewallAllowedWebsites,ParameterValue=".amazonaws.com\,.docker.io\,.docker.com" \
    --capabilities CAPABILITY_NAMED_IAM

    Note: The initially allowed hostnames for egress filtering are passed to the network firewall by using the parameter key NetworkFirewallAllowedWebsites in the CloudFormation stack. In this example, the allowed hostnames are .amazonaws.com, .docker.io, and docker.com.

  2. Make a note of the subnet IDs from the stack outputs of the CloudFormation stack after the status goes to Create_Complete.
     
    aws cloudformation describe-stacks \
    --stack-name AWS-Network-Firewall-Multi-AZ

    Note: For simplicity, the CloudFormation stack name is AWS-Network-Firewall-Multi-AZ, but you can change this name to according to your needs and follow the same naming throughout this post.

To deploy the VPC architecture (console)

In your account, launch the AWS CloudFormation template by choosing the following Launch Stack button. It will take approximately 10 minutes for the CloudFormation stack to complete.

Select this image to open a link that starts building the CloudFormation stack

Note: The stack will launch in the N. Virginia (us-east-1) Region. To deploy this solution into other AWS Regions, download the solution’s CloudFormation template, modify it, and deploy it to the selected Region.

Deploy and set up access to the EKS cluster

In this step, you’ll use the eksctl CLI tool to create an EKS cluster.

To deploy an EKS cluster by using the eksctl tool

There are two methods for creating an EKS cluster. Method A uses the eksctl create cluster command without a configuration (config) file. Method B uses a config file.

Note: Before you start, make sure you have the VPC subnet details available from the previous procedure.

Method A: No config file

You can create an EKS cluster without a config file by using the eksctl create cluster command.

  1. From the CLI, enter the following commands.
    eksctl create cluster \
    --vpc-private-subnets=<private-subnet-A>,<private-subnet-B> \
    --vpc-public-subnets=<public-subnet-A>,<public-subnet-B>
  2. Make sure that the subnets passed to the --vpc-public-subnets parameter are protected subnets taken from the VPC architecture CloudFormation stack output. You can verify the subnet IDs by looking at step 2 in the To deploy the VPC architecture section.

Method B: With config file

Another way to create an EKS cluster is by using the following config file, with more options with the name (cluster.yaml in this example).

  1. Create a file named cluster.yaml by adding the following contents to it.
    apiVersion: eksctl.io/v1alpha5
    kind: ClusterConfig
    metadata:
      name: filter-egress-traffic-test
      region: us-east-1
      version: "1.19"
    availabilityZones: ["us-east-1a", "us-east-1b"]
    vpc:
      id: 
      subnets:
        public:
          us-east-1a: { id: <public-subnet-A> }
          us-east-1b: { id: <public-subnet-B> }
        private:
          us-east-1a: { id: <private-subnet-A> }
          us-east-1b: { id: <private-subnet-B> }
    
    managedNodeGroups:
    - name: nodegroup
      desiredCapacity: 3
      ssh:
        allow: true
        publicKeyName: main
      iam:
        attachPolicyARNs:
        - arn:aws:iam::aws:policy/AmazonSSMManagedInstanceCore
        - arn:aws:iam::aws:policy/AmazonEKSWorkerNodePolicy
        - arn:aws:iam::aws:policy/AmazonEC2ContainerRegistryReadOnly
        - arn:aws:iam::aws:policy/service-role/AmazonEC2RoleforSSM
        - arn:aws:iam::aws:policy/AmazonEKSServicePolicy
        - arn:aws:iam::aws:policy/AmazonEKSClusterPolicy
        - arn:aws:iam::aws:policy/AmazonEKS_CNI_Policy
      preBootstrapCommands:
        - yum install -y https://s3.amazonaws.com/ec2-downloads-windows/SSMAgent/latest/linux_amd64/amazon-ssm-agent.rpm
        - sudo systemctl enable amazon-ssm-agent
        - sudo systemctl start amazon-ssm-agent

  2. Run the following command to create an EKS cluster using the eksctl tool and the cluster.yaml config file.
    eksctl create cluster -f cluster.yaml

To set up access to the EKS cluster

  1. Before you deploy a sample Kubernetes Pod, make sure you have the kubeconfig file set up for the EKS cluster that you created in step 2 of To deploy an EKS cluster by using the eksctl tool. For more information, see Create a kubeconfig for Amazon EKS. You can use eksctl to do this, as follows.

    eksctl utils write-kubeconfig —cluster filter-egress-traffic-test

  2. Set the kubectl context to the EKS cluster you just created, by using the following command.

    kubectl config get-contexts

    Figure 3 shows an example of the output from this command.

    Figure 3: kubectl config get-contexts command output

    Figure 3: kubectl config get-contexts command output

  3. Copy the context name from the command output and set the context by using the following command.

    kubectl config use-context <NAME-OF-CONTEXT>

To deploy a sample Pod on the EKS cluster

  1. Next, deploy a sample Kubernetes Pod in the  EKS cluster.

    kubectl run -i --tty amazon-linux —image=public.ecr.aws/amazonlinux/amazonlinux:latest sh

    If you already have a Pod, you can use the following command to get a shell to a running container.

    kubectl attach amazon-linux -c alpine -i -t

  2. Now you can test access to a non-allowed website in the AWS Network Firewall stateful rules, using these steps.
    1. First, install the cURL tool on the sample Pod you created previously. cURL is a command-line tool for getting or sending data, including files, using URL syntax. Because cURL uses the libcurl library, it supports every protocol libcurl supports. On the Pod where you have obtained a shell to a running container, run the following command to install cURL.
      apk install curl
    2. Access a website using cURL.
      curl -I https://aws.amazon.com

      This gives a timeout error similar to the following.

      curl -I https://aws.amazon.com
      curl: (28) Operation timed out after 300476 milliseconds with 0 out of 0 bytes received

    3. Navigate to the AWS CloudWatch console and check the alert logs for Network Firewall. You will see a log entry like the following sample, indicating that the access to https://aws.amazon.com was blocked.
      {
          "firewall_name": "AWS-Network-Firewall-Multi-AZ-firewall",
          "availability_zone": "us-east-1a",
          "event_timestamp": "1623651293",
          "event": {
              "timestamp": "2021-06-14T06:14:53.483069+0000",
              "flow_id": 649458981081302,
              "event_type": "alert",
              "src_ip": "xxx.xxx.xxx.xxx",
              "src_port": xxxxx,
              "dest_ip": "xxx.xxx.xxx.xxx",
              "dest_port": 443,
              "proto": "TCP",
              "alert": {
                  "action": "blocked",
                  "signature_id": 4,
                  "rev": 1,
                  "signature": "not matching any TLS allowlisted FQDNs",
                  "category": "",
                  "severity": 1
              },
              "tls": {
                  "sni": "aws.amazon.com",
                  "version": "UNDETERMINED",
                  "ja3": {},
                  "ja3s": {}
              },
              "app_proto": "tls"
          }
      }

      The error shown here occurred because the hostname www.amazon.com was not added to the Network Firewall stateful rules allow list.

      When you deployed the network firewall in step 1 of the To deploy the VPC architecture procedure, the values provided for the CloudFormation parameter NetworkFirewallAllowedWebsites were just .amazonaws.com, .docker.io, .docker.com and not aws.amazon.com.

Update the Network Firewall stateful rules

In this procedure, you’ll update the Network Firewall stateful rules to allow the aws.amazon.com domain name.

To update the Network Firewall stateful rules (console)

  1. In the AWS CloudFormation console, locate the stack you used to create the network firewall earlier in the To deploy the VPC architecture procedure.
  2. Select the stack you want to update, and choose Update. In the Parameters section, update the stack by adding the hostname aws.amazon.com to the parameter NetworkFirewallAllowedWebsites as a comma-separated value. See Updating stacks directly in the AWS CloudFormation User Guide for more information on stack updates.

Re-test from the sample pod

In this step, you’ll test the outbound access once again from the sample Pod you created earlier in the To deploy a sample Pod on the EKS cluster procedure.

To test the outbound access to the aws.amazon.com hostname

  1. Get a shell to a running container in the sample Pod that you deployed earlier, by using the following command.
    kubectl attach amazon-linux -c alpine -i -t
  2. On the terminal where you got a shell to a running container in the sample Pod, run the following cURL command.
    curl -I https://aws.amazon.com
  3. The response should be a success HTTP 200 OK message similar to this one.
    curl -Ik https://aws.amazon.com
    HTTP/2 200
    content-type: text/html;charset=UTF-8
    server: Server

If the VPC subnets are organized according to the architecture suggested in this solution, outbound traffic from the EKS cluster can be sent to the network firewall and then filtered based on hostnames provided by SNI.

Collecting hostnames provided by the SNI

In this step, you’ll see how to configure the network firewall to collect all the hostnames provided by SNI that are accessed by an already running application—without blocking any access—by making use of CloudWatch and alert logs.

To configure the network firewall (console)

  1. In the AWS CloudFormation console, locate the stack that created the network firewall earlier in the To deploy the VPC architecture procedure.
  2. Select the stack to update, and then choose Update.
  3. Choose Replace current template and upload the template network-firewall-eks-collect-all.yaml. (This template should be available from the files that you downloaded earlier from the S3 bucket in the Prerequisites section.) Choose Next. See Updating stacks directly for more information.

To configure the network firewall (AWS CLI)

  1. Update the CloudFormation stack by using the network-firewall-eks-collect-all.yaml template file that you previously downloaded from the S3 bucket in the Prerequisites section, using the update-stack command as follows.
    aws cloudformation update-stack --stack-name AWS-Network-Firewall-Multi-AZ \
    --template-body file://network-firewall-eks-collect-all.yaml \
    --capabilities CAPABILITY_NAMED_IAM

To check the rules in the AWS Management Console

  1. In the AWS Management Console, navigate to the Amazon VPC console and locate the AWS Network Firewall tab.
  2. Select the network firewall that you created earlier, and then select the stateful rule with the name log-all-tls.
  3. The rule group should appear as shown in Figure 4, indicating that the logs are captured and sent to the Alert logs.
    Figure 4: Network Firewall rule groups

    Figure 4: Network Firewall rule groups

To test based on stateful rule

  1. On the terminal, get the shell for the running container in the Pod you created earlier. If this Pod is not available, follow the instructions in the To deploy a sample Pod on the EKS cluster procedure to create a new sample Pod.
  2. Run the cURL command to aws.amazon.com. It should return HTTP 200 OK, as follows.
    curl -Ik https://aws.amazon.com/
    HTTP/2 200
    content-type: text/html;charset=UTF-8
    server: Server
    date:
    ------
    ----------
    --------------
  3. Navigate to the AWS CloudWatch Logs console and look up the Alert logs log group with the name /AWS-Network-Firewall-Multi-AZ/anfw/alert.

    You can see the hostnames provided by SNI within the TLS protocol passing through the network firewall. The CloudWatch Alert logs for allowed hostnames in the SNI looks like the following example.

    {
        "firewall_name": "AWS-Network-Firewall-Multi-AZ-firewall",
        "availability_zone": "us-east-1b",
        "event_timestamp": "1627283521",
        "event": {
            "timestamp": "2021-07-26T07:12:01.304222+0000",
            "flow_id": 1977082435410607,
            "event_type": "alert",
            "src_ip": "xxx.xxx.xxx.xxx",
            "src_port": xxxxx,
            "dest_ip": "xxx.xxx.xxx.xxx",
            "dest_port": 443,
            "proto": "TCP",
            "alert": {
                "action": "allowed",
                "signature_id": 2,
                "rev": 0,
                "signature": "",
                "category": "",
                "severity": 3
            },
            "tls": {
                "subject": "CN=aws.amazon.com",
                "issuerdn": "C=US, O=Amazon, OU=Server CA 1B, CN=Amazon",
                "serial": "08:13:34:34:48:07:64:27:4D:BC:CB:14:4D:AF:F2:11",
                "fingerprint": "f7:53:97:5e:76:1e:fb:f6:70:72:02:95:d5:9f:2f:05:52:79:5d:ae",
                "sni": "aws.amazon.com",
                "version": "TLS 1.2",
                "notbefore": "2020-09-30T00:00:00",
                "notafter": "2021-09-23T12:00:00",
                "ja3": {},
                "ja3s": {}
            },
            "app_proto": "tls"
        }
    }

Optionally, you can also create an AWS Lambda function to collect the hostnames that are passed through the network firewall.

To create a Lambda function to collect hostnames provided by SNI (optional)

Sample Lambda code

The sample Lambda code from Figure 5 is shown following, and is written in Python 3. The sample collects the hostnames that are provided by SNI and captured in Network Firewall. Network Firewall logs the hostnames provided by SNI in the CloudWatch Alert logs. Then, by creating a CloudWatch logs subscription filter, you can send logs to the Lambda function for further processing, for example to invoke SNS notifications.

import json
import gzip
import base64
import boto3
import sys
import traceback
sns_client = boto3.client('sns')
def lambda_handler(event, context):
    try:
        decoded_event = json.loads(gzip.decompress(base64.b64decode(event['awslogs']['data'])))
        body = '''
        {filtermatch}
        '''.format(
            loggroup=decoded_event['logGroup'],
            logstream=decoded_event['logStream'],
            filtermatch=decoded_event['logEvents'][0]['message'],
        )
        # print(body)# uncomment this for debugging
        filterMatch = json.loads(body)
        data = []
        if 'http' in filterMatch['event']:
            data.append(filterMatch['event']['http']['hostname'])
        elif 'tls' in filterMatch['event']:
            data.append(filterMatch['event']['tls']['sni'])
        result = 'Trying to reach ' + 1*' ' + (data[0]) + 1*' ' 'via Network Firewall' + 1*' '  + (filterMatch['firewall_name'])
        # print(result)# uncomment this for debugging
        message = {'HostName': result}
        send_to_sns = sns_client.publish(
            TargetArn='<SNS-topic-ARN>', #Replace with the SNS topic ARN
            Message=json.dumps({'default': json.dumps(message),
                            'sms': json.dumps(message),
                            'email': json.dumps(message)}),
            Subject='Trying to reach the hostname through the Network Firewall',
            MessageStructure='json')
    except Exception as e:
        print('Function failed due to exception.')
        e = sys.exc_info()[0]
        print(e)
        traceback.print_exc()
        Status="Failure"
        Message=("Error occured while executing this. The error is %s" %e)

Clean up

In this step, you’ll clean up the infrastructure that was created as part of this solution.

To delete the Kubernetes workloads

  1. On the terminal, using the kubectl CLI tool, run the following command to delete the sample Pod that you created earlier.
    kubectl delete pods amazon-linux

    Note: Clean up all the Kubernetes workloads running on the EKS cluster. For example, if the Kubernetes service of type LoadBalancer is deployed, and if the EKS cluster where it exists is deleted, the LoadBalancer will not be deleted. The best practice is to clean up all the deployed workloads.

  2. On the terminal, using the eksctl CLI tool, delete the created EKS cluster by using the following command.
    eksctl delete cluster --name filter-egress-traffic-test

To delete the CloudFormation stack and AWS Network Firewall

  1. Navigate to the AWS CloudFormation console and choose the stack with the name AWS-Network-Firewall-Multi-AZ.
  2. Choose Delete, and then at the prompt choose Delete Stack. For more information, see Deleting a stack on the AWS CloudFormation console.

Conclusion

By following the VPC architecture explained in this blog post, you can protect the applications running on an Amazon EKS cluster by filtering the outbound traffic based on the approved hostnames that are provided by SNI in the Network Firewall Allow list.

Additionally, with a simple Lambda function, CloudWatch Logs, and an SNS topic, you can get readable hostnames provided by the SNI. Using these hostnames, you can learn about the traffic pattern for the applications that are running within the EKS cluster, and later create a strict list to allow only the required outbound traffic. To learn more about Network Firewall stateful rules, see Working with stateful rule groups in AWS Network Firewall in the AWS Network Firewall Developer Guide.

 
If you have feedback about this post, submit comments in the Comments section below. If you have questions about this post, contact AWS Support.

Want more AWS Security news? Follow us on Twitter.

Kirankumar Chandrashekar

Kirankumar is a Sr. Solutions Architect for Strategic Accounts at AWS. He focuses on leading customers in architecting DevOps, containers and container technologies to name a few. Kirankumar is passionate about DevOps, Infrastructure as Code, and solving complex customer issues. He enjoys music, as well as cooking and traveling.

Using AWS Shield Advanced protection groups to improve DDoS detection and mitigation

Post Syndicated from Joe Viggiano original https://aws.amazon.com/blogs/security/using-aws-shield-advanced-protection-groups-to-improve-ddos-detection-and-mitigation/

Amazon Web Services (AWS) customers can use AWS Shield Advanced to detect and mitigate distributed denial of service (DDoS) attacks that target their applications running on Amazon Elastic Compute Cloud (Amazon EC2), Elastic Local Balancing (ELB), Amazon CloudFront, AWS Global Accelerator, and Amazon Route 53. By using protection groups for Shield Advanced, you can logically group your collections of Shield Advanced protected resources. In this blog post, you will learn how you can use protection groups to customize the scope of DDoS detection for application layer events, and accelerate mitigation for infrastructure layer events.

What is a protection group?

A protection group is a resource that you create by grouping your Shield Advanced protected resources, so that the service considers them to be a single protected entity. A protection group can contain many different resources that compose your application, and the resources may be part of multiple protection groups spanning different AWS Regions within an AWS account. Common patterns that you might use when designing protection groups include aligning resources to applications, application teams, or environments (such as production and staging), and by product tiers (such as free or paid). For more information about setting up protection groups, see Managing AWS Shield Advanced protection groups.

Why should you consider using a protection group?

The benefits of protection groups differ for infrastructure layer (layer 3 and layer 4) events and application layer (layer 7) events. For layer 3 and layer 4 events, protection groups can reduce the time it takes for Shield Advanced to begin mitigations. For layer 7 events, protection groups add an additional reporting mechanism. There is no change in the mechanism that Shield Advanced uses internally for detection of an event, and you do not lose the functionality of individual resource-level detections. You receive both group-level and individual resource-level Amazon CloudWatch metrics to consume for operational use. Let’s look at the benefits for each layer in more detail.

Layers 3 and 4: Accelerate time to mitigate for DDoS events

For infrastructure layer (layer 3 and layer 4) events, Shield Advanced monitors the traffic volume to your protected resource. An abnormal traffic deviation signals the possibility of a DDoS attack, and Shield Advanced then puts mitigations in place. By default, Shield Advanced observes the elevation of traffic to a resource over multiple consecutive time intervals to establish confidence that a layer 3/layer 4 event is under way. In the absence of a protection group, Shield Advanced follows the default behavior of waiting to establish confidence before it puts mitigation in place for each resource. However, if the resources are part of a protection group, and if the service detects that one resource in a group is targeted, Shield Advanced uses that confidence for other resources in the group. This can accelerate the process of putting mitigations in place for those resources.

Consider a case where you have an application deployed in different AWS Regions, and each stack is fronted with a Network Load Balancer (NLB). When you enable Shield Advanced on the Elastic IP addresses associated with the NLB in each Region, you can optionally add those Elastic IP addresses to a protection group. If an actor targets one of the NLBs in the protection group and a DDoS attack is detected, Shield Advanced will lower the threshold for implementing mitigations on the other NLBs associated with the protection group. If the scope of the attack shifts to target the other NLBs, Shield Advanced can potentially mitigate the attack faster than if the NLB was not in the protection group.

Note: This benefit applies only to Elastic IP addresses and Global Accelerator resource types.

Layer 7: Reduce false positives and improve accuracy of detection for DDoS events

Shield Advanced detects application layer (layer 7) events when you associate a web access control list (web ACL) in AWS WAF with it. Shield Advanced consumes request data for the associated web ACL, analyzes it, and builds a traffic baseline for your application. The service then uses this baseline to detect anomalies in traffic patterns that might indicate a DDoS attack.

When you group resources in a protection group, Shield Advanced aggregates the data from individual resources and creates the baseline for the whole group. It then uses this aggregated baseline to detect layer 7 events for the group resource. It also continues to monitor and report for the resources individually, regardless of whether they are part of protection groups or not.

Shield Advanced provides three types of aggregation to choose from (sum, mean, and max) to aggregate the volume data of individual resources to use as a baseline for the whole group. We’ll look at the three types of aggregation, with a use case for each, in the next section.

Note: Traffic aggregation is applicable only for layer 7 detection.

Case 1: Blue/green deployments

Blue/green is a popular deployment strategy that increases application availability and reduces deployment risk when rolling out changes. The blue environment runs the current application version, and the green environment runs the new application version. When testing is complete, live application traffic is directed to the green environment, and the blue environment is dismantled.

During blue/green deployments, the traffic to your green resources can go from zero load to full load in a short period of time. Shield Advanced layer 7 detection uses traffic baselining for individual resources, so newly created resources like an Application Load Balancer (ALB) that are part of a blue/green operation would have no baseline, and the rapid increase in traffic could cause Shield Advanced to declare a DDoS event. In this scenario, the DDoS event could be a false positive.

Figure 1: A blue/green deployment with ALBs in a protection group. Shield is using the sum of total traffic to the group to baseline layer 7 traffic for the group as a single unit

Figure 1: A blue/green deployment with ALBs in a protection group. Shield is using the sum of total traffic to the group to baseline layer 7 traffic for the group as a single unit

In the example architecture shown in Figure 1, we have configured Shield to include all resources of type ALB in a single protection group with aggregation type sum. Shield Advanced will use the sum of traffic to all resources in the protection group as an additional baseline. We have only one ALB (called blue) to begin with. When you add the green ALB as part of your deployment, you can optionally add it to the protection group. As traffic shifts from blue to green, the total traffic to the protection group remains the same even though the volume of traffic changes for the individual resources that make up the group. After the blue ALB is deleted, the Shield Advanced baseline for that ALB is deleted with it. At this point, the green ALB hasn’t existed for sufficient time to have its own accurate baseline, but the protection group baseline persists. You could still receive a DDoSDetected CloudWatch metric with a value of 1 for individual resources, but with a protection group you have the flexibility to set one or more alarms based on the group-level DDoSDetected metric. Depending on your application’s use case, this can reduce non-actionable event notifications.

Note: You might already have alarms set for individual resources, because the onboarding wizard in Shield Advanced provides you an option to create alarms when you add protection to a resource. So, you should review the alarms you already have configured before you create a protection group. Simply adding a resource to a protection group will not reduce false positives.

Case 2: Resources that have traffic patterns similar to each other

Client applications might interact with multiple services as part of a single transaction or workflow. These services can be behind their own dedicated ALBs or CloudFront distributions and can have traffic patterns similar to each other. In the example architecture shown in Figure 2, we have two services that are always called to satisfy a user request. Consider a case where you add a new service to the mix. Before protection groups existed, setting up such a new protected resource, such as ALB or CloudFront, required Shield Advanced to build a brand-new baseline. You had to wait for a certain minimum period before Shield Advanced could start monitoring the resource, and the service would need to monitor traffic for a few days in order to be accurate.

Figure 2: Deploying a new service and including it in a protection group with an existing baseline. Shield is using the mean aggregation type to baseline traffic for the group.

Figure 2: Deploying a new service and including it in a protection group with an existing baseline. Shield is using the mean aggregation type to baseline traffic for the group.

For improved accuracy of detection of level 7 events, you can cause Shield Advanced to inherit the baseline of existing services that are part of the same transaction or workflow. To do so, you can put your new resource in a protection group along with an existing service or services, and set the aggregation type to mean. Shield Advanced will take some time to build up an accurate baseline for the new service. However, the protection group has an established baseline, so the new service won’t be susceptible to decreased accuracy of detection for that period of time. Note that this setting will not stop Shield Advanced from sending notifications for the new service individually; however, you might prefer to take corrective action based on the detection for the group instead.

Case 3: Resources that share traffic in a non-uniform way

Consider the case of a CloudFront distribution with an ALB as origin. If the content is cached in CloudFront edge locations, the traffic reaching the application will be lower than that received by the edge locations. Similarly, if there are multiple origins of a CloudFront distribution, the traffic volumes of individual origins will not reflect the aggregate traffic for the application. Scenarios like invalidation of cache or an origin failover can result in increased traffic at one of the ALB origins. This could cause Shield Advanced to send “1” as the value for the DDoSDetected CloudWatch metric for that ALB. However, you might not want to initiate an alarm or take corrective action in this case.

Figure 3: CloudFront and ALBs in a protection group with aggregation type max. Shield is using CloudFront’s baseline for the group

Figure 3: CloudFront and ALBs in a protection group with aggregation type max. Shield is using CloudFront’s baseline for the group

You can combine the CloudFront distribution and origin (or origins) in a protection group with the aggregation type set to max. Shield Advanced will consider the CloudFront distribution’s traffic volume as the baseline for the protection group as a whole. In the example architecture in Figure 3, a CloudFront distribution fronts two ALBs and balances the load between the two. We have bundled all three resources (CloudFront and two ALBs) into a protection group. In case one ALB fails, the other ALB will receive all the traffic. This way, although you might receive an event notification for the active ALB at the individual resource level if Shield detects a volumetric event, you might not receive it for the protection group because Shield Advanced will use CloudFront traffic as the baseline for determining the increase in volume. You can set one or more alarms and take corrective action according to your application’s use case.

Conclusion

In this blog post, we showed you how AWS Shield Advanced provides you with the capability to group resources in order to consider them a single logical entity for DDoS detection and mitigation. This can help reduce the number of false positives and accelerate the time to mitigation for your protected applications.

A Shield Advanced subscription provides additional capabilities, beyond those discussed in this post, that supplement your perimeter protection. It provides integration with AWS WAF for level 7 DDoS detection, health-based detection for reducing false positives, enhanced visibility into DDoS events, assistance from the Shield Response team, custom mitigations, and cost-protection safeguards. You can learn more about Shield Advanced capabilities in the AWS Shield Advanced User Guide.

 
If you have feedback about this blog post, submit comments in the Comments section below. You can also start a new thread on AWS Shield re:Post to get answers from the community.

Want more AWS Security news? Follow us on Twitter.

Joe Viggiano

Joe Viggiano

Joe is a Sr. Solutions Architect helping media and entertainment companies accelerate their adoptions of cloud-based solutions.

Deepak Garg

Deepak Garg

Deepak is a Solutions Architect at AWS. He loves diving deep into AWS services and sharing his knowledge with customers. Deepak has background in Content Delivery Networks and Telecommunications.

Implement step-up authentication with Amazon Cognito, Part 2: Deploy and test the solution

Post Syndicated from Salman Moghal original https://aws.amazon.com/blogs/security/implement-step-up-authentication-with-amazon-cognito-part-2-deploy-and-test-the-solution/

This solution consists of two parts. In the previous blog post Implement step-up authentication with Amazon Cognito, Part 1: Solution overview, you learned about the architecture and design of a step-up authentication solution that uses AWS services such as Amazon API Gateway, Amazon Cognito, Amazon DynamoDB, and AWS Lambda to protect privileged API operations. In this post, you will use a reference implementation to deploy and test the step-up authentication solution in your AWS account.

Solution deployment

The step-up authentication solution discussed in Part 1 uses a reference implementation that you can use for demonstration and learning purposes. You can also review the implementation code in the step-up-auth GitHub repository. The reference implementation includes a web application that you can use in the following sections to test the step-up implementation. Additionally, the implementation contains a sample privileged API action /transfer and a non-privileged API action /info, and two step-up authentication solution API operations /initiate-auth, and /respond-to-challenge. The web application invokes these API operations to demonstrate how to perform step-up authentication.

Deployment prerequisites

The following are prerequisites for deployment:

  1. The Node.js runtime and the node package manager (npm) are installed on your machine. You can use a package manager for your platform to install these. Note that the reference implementation code was tested using Node.js v16 LTS.
  2. The AWS Cloud Development Kit (AWS CDK) is installed in your environment.
  3. The AWS Command Line Interface (AWS CLI) is installed in your environment.
  4. You must have AWS credentials files that contain a profile with your account secret key and access key to perform the deployment. Make sure that your account has enough privileges to create, update, or delete the following resources:
  5. A two-factor authentication (2FA) mobile application, such as Google Authenticator, is installed on your mobile device.

Deploy the step-up solution

You can deploy the solution by using the AWS CDK, which will create a working reference implementation of the step-up authentication solution.

To deploy the solution

  1. Build the necessary resources by using the build.sh script in the deployment folder. Run the build script from a terminal window, using the following command:
    cd deployment && ./build.sh
  2. Deploy the solution by using the deploy.sh script that is present in the deployment folder, using the following command. Be sure to replace the required environment variables with your own values.
    export AWS_REGION=<your AWS Region of choice, for example us-east-2>
    export AWS_ACCOUNT=<your account number>
    export AWS_PROFILE=<a valid profile in .aws/credentials that contains the secret/access key to your account>
    export NODE_ENV=development
    export ENV_PREFIX=dev

    The account you specify in the AWS_ACCOUNT environment variable is used to bootstrap the AWS CDK deployment. Set AWS_PROFILE to point to your profile. Make sure that your account has sufficient privileges, as described in the prerequisites.

    The NODE_ENV environment variable can be set to development or production. This variable controls the log output that the Lambda functions generate. The ENV_PREFIX environment variable allows you to prefix all resources with a tag, which enables a multi-tenant deployment of this solution.

  3. Still in the deployment folder, deploy the stack by using the following command:
    ./deploy.sh
  4. Make note of the CloudFront distribution URL that follows Sample Web App URL, as shown in Figure 1. In the next section, you will use this CloudFront distribution URL to load the sample web app in a web browser and test the step-up solution
    Figure 1: The output of the deployment process

    Figure 1: The output of the deployment process

After the deployment script deploy.sh completes successfully, the AWS CDK creates the following resources in your account:

  • An Amazon Cognito user pool that is used as a user registry.
  • An Amazon API Gateway API that contains three resources:
    • A protected resource that requires step-up authentication.
    • An initiate-auth resource to start the step-up challenge response.
    • A respond-to-challenge resource to complete the step-up challenge.
  • An API Gateway Lambda authorizer that is used to protect API actions.
  • The following Amazon DynamoDB tables:
    • A setting table that holds the configuration mapping of the API operations that require elevated privileges.
    • A session table that holds temporary, user-initiated step-up sessions and their current status.
  • A React web UI that demonstrates how to invoke a privileged API action and go through step-up authentication.

Test the step-up solution

In order to test the step-up solution, you’ll use the sample web application that you deployed in the previous section. Here’s an overview of the actions you’ll perform to test the flow:

  1. In the AWS Management Console, create items in the setting DynamoDB table that point to privileged API actions. After the solution deployment, the setting DynamoDB table is called step-up-auth-setting-<ENV_PREFIX>. For more information about ENV_PREFIX variable usage in a multi-tenant environment, see Deploy the step-up solution earlier in this post.

    As discussed, in the Data design section in Part 1 of this series, the Lambda authorizer treats all API invocations as non-privileged (that is, they don’t require step-up authentication) unless there is a matching entry for the API action in the setting table. Additionally, you can switch a privileged API action to a non-privileged API action by simply changing the stepUpState attribute in the setting table. Create an item in the DynamoDB table for the sample /transfer API action and for the sample /info API action. The /transfer API action will require step-up authentication, whereas the /info API action will be a non-privileged invocation that does not require step-up authentication. Note that there is no need to define a non-privileged API action in the table; it is there for illustration purposes only.

  2. If you haven’t already, install Google Authenticator or a similar two-factor authentication (2FA) application on your mobile device.
  3. Using the sample web application, register a new user in Amazon Cognito.
  4. Log in to the sample web application by using the registered new user.
  5. Configure the preferred multi-factor authentication (MFA) settings for the logged in user in the application. This step is necessary so that Amazon Cognito can challenge the user with a one-time password (OTP).
  6. Using the sample web application, invoke the sample /transfer privileged API action that requires step-up authentication.
  7. The Lambda authorizer will intercept the API request and return a 401 Unauthorized response status code that the sample web application will handle. The application will perform step-up authentication by prompting you to provide additional security credentials, specifically the OTP. To complete the step-up authentication, enter the OTP, which is sent through short service message (SMS) or by using an authenticator mobile app.
  8. Invoke the sample /transfer privileged API action again in the sample web application, and verify that the API invocation is successful.

The following instructions assume that you’ve installed a 2FA mobile application, such as Google Authenticator, on your mobile device. You will configure the 2FA application in the following steps and use the OTP from this mobile application when prompted to enter the step-up challenge. You can configure Amazon Cognito to send you an SMS with the OTP. However, you must be aware of the Amazon Cognito throttling limits. See the Additional considerations section in Part 1 of this series. Read these limits carefully, especially if you set the user’s preferred MFA setting to SMS.

To test the step-up authentication solution

  1. Open the Amazon DynamoDB console and log in to your AWS account.
  2. On the left nav pane, under Tables, choose Explore items. In the right pane, choose the table named step-up-auth-setting* and choose Create item, as shown in Figure 2.
    Figure 2: Choose the step-up-auth-setting* table and choose Create item button

    Figure 2: Choose the step-up-auth-setting* table and choose Create item button

  3. In the Edit item screen as shown in Figure 3, ensure that JSON is selected, and the Attributes button for View DynamoDB JSON is off.
    Figure 3: Edit an item in the table - select JSON and turn off View DynamoDB JSON button

    Figure 3: Edit an item in the table – select JSON and turn off View DynamoDB JSON button

  4. To create an entry for the /info API action, copy the following JSON text:
    {
       "id": "/info",
       "lastUpdateTimestamp": "2021-08-23T08:25:29.023Z",
       "stepUpState": "STEP_UP_NOT_REQUIRED",
       "createTimestamp": "2021-08-23T08:25:29.023Z"
    }
  5. Paste the copied JSON text for the /info API action in the Attributes text area, as shown in Figure 4, and choose Create item.
    Figure 4: Create an entry for the /info API action

    Figure 4: Create an entry for the /info API action

  6. To create an entry for the /transfer API action, copy the following JSON text:
    {
       "id": "/transfer",
       "lastUpdateTimestamp": "2021-08-23T08:22:12.436Z",
       "stepUpState": "STEP_UP_REQUIRED",
       "createTimestamp": "2021-08-23T08:22:12.436Z"
    }
  7. Paste the copied JSON text for the /transfer API action in the Attributes text area, as shown in Figure 4, and choose Create item.
    Figure 5: Create an entry for the /transfer API action

    Figure 5: Create an entry for the /transfer API action

  8. Open your web browser and load the CloudFront URL that you made note of in step 4 of the Deploy the step-up solution procedure.
  9. On the login screen of the sample web application, enter the information for a new user. Make sure that the email address and phone numbers are valid. Choose Register. You will be prompted to enter a verification code. Check your email for the verification code, and enter it at the sample web application prompt.
  10. You will be sent back to the login screen. Log in as the user that you just registered. You will see the welcome screen, as shown in Figure 6.
    Figure 6: Welcome screen of the sample web application

    Figure 6: Welcome screen of the sample web application

  11. In the left nav pane choose Setting, choose the Configure button to the right of Software Token, as shown in Figure 7. Use your mobile device camera to capture the QR code on the screen in your 2FA application, for example Google Authenticator.
    Figure 7: Configure Software Token screen with QR code

    Figure 7: Configure Software Token screen with QR code

  12. Enter the temporary code from the 2FA application into the web application and choose Submit. You will see the message Software Token successfully configured!
  13. Still in the Setting menu, next to Select Preferred MFA, choose Software Token. You will see the message User preferred MFA set to Software Token, as shown in Figure 8.
    Figure 8: Completed Software Token setup

    Figure 8: Completed Software Token setup

  14. In the left nav pane choose StepUp Auth. In the right pane, choose Invoke Transfer API. You should see Response: 401 authorization challenge, as shown in Figure 9.
    Figure 9: The step-up API invocation returns an authorization challenge

    Figure 9: The step-up API invocation returns an authorization challenge

  15. On your mobile device, open the 2FA application, copy the OTP code from the 2FA application, and enter the code into the Enter OTP field, as shown in Figure 9. Choose Submit.
  16. This sends the OTP to the respond-to-challenge endpoint. After the OTP is verified, the endpoint will return a success or failure message. Figure 10 shows a successful OTP verification. You are prompted to invoke the /transfer privileged API action again.
    Figure 10: The OTP prompt during step-up API invocation

    Figure 10: The OTP prompt during step-up API invocation

  17. Invoke the transfer API action again by choosing Invoke Transfer API. You should see a success message as shown in Figure 11.
    Figure 11: A successful step-up API invocation

    Figure 11: A successful step-up API invocation

    Congratulations! You’ve successfully performed step-up authentication.

Conclusion

In the previous post in this series, Implement step-up authentication with Amazon Cognito, Part 1: Solution overview, you learned about the architecture and implementation details for the step-up authentication solution. In this blog post, you learned how to deploy and test the step-up authentication solution in your AWS account. You deployed the solution by using scripts from the step-up-auth GitHub repository that use the AWS CDK to create resources in your account for Amazon Cognito, Amazon API Gateway, a Lambda authorizer, and Amazon DynamoDB. Finally, you tested the end-to-end solution on a sample web application by invoking a privileged API action that required step-up authentication. Using the 2FA application, you were able to pass in an OTP to complete the step-up authentication and subsequently successfully invoke the privileged API action.

For more information about AWS Cognito user pools and the new console experience, watch the video Amazon Cognito User Pools New Console Walkthrough on the AWS channel on YouTube. And for more information about how to protect your API actions with fine-grained access controls, see the blog post Building fine-grained authorization using Amazon Cognito, API Gateway, and IAM.

If you have feedback about this post, submit comments in the Comments section below. If you have any questions about this post, start a thread on the Amazon Cognito forum.

Want more AWS Security news? Follow us on Twitter.

Salman Moghal

Salman Moghal

Salman is a Principal Consultant in AWS Professional Services, based in Toronto, Canada. He helps customers in architecting, developing, and reengineering data-driven applications at scale, with a sharp focus on security.

Thomas Ross

Thomas Ross

Thomas is a Software Engineering student at Carleton University. He worked at AWS as a Professional Services Intern and a Software Development Engineer Intern in Amazon Aurora. He has an interest in almost anything related to technology, especially systems at high scale, security, distributed systems, and databases.

Ozair Sheikh

Ozair Sheikh

Ozair is a senior product leader for Sponsored Display in Amazon ads, based in Toronto, Canada. He helps advertisers and Ad Tech API Partners build campaign management solutions to reach customers across the purchase journey. He has over 10 years of experience in API management and security, with an obsession for delivering highly secure API products.

Mahmoud Matouk

Mahmoud Matouk

Mahmoud is a Principal Solutions Architect with the Amazon Cognito team. He helps AWS customers build secure and innovative solutions for various identity and access management scenarios.

Implement step-up authentication with Amazon Cognito, Part 1: Solution overview

Post Syndicated from Salman Moghal original https://aws.amazon.com/blogs/security/implement-step-up-authentication-with-amazon-cognito-part-1-solution-overview/

In this blog post, you’ll learn how to protect privileged business transactions that are exposed as APIs by using multi-factor authentication (MFA) or security challenges. These challenges have two components: what you know (such as passwords), and what you have (such as a one-time password token). By using these multi-factor security controls, you can implement step-up authentication to obtain a higher level of security when you perform critical transactions. In this post, we show you how you can use AWS services such as Amazon API Gateway, Amazon Cognito, Amazon DynamoDB, and AWS Lambda functions to implement step-up authentication by using a simple rule-based security model for your API resources.

Previously, identity and access management solutions have attempted to deliver step-up authentication by retrofitting their runtimes with stateful server-side management, which doesn’t scale in the modern-day stateless cloud-centered application architecture. We’ll show you how to use a pluggable, stateless authentication implementation that integrates into your existing infrastructure without compromising your security or performance. The Amazon API Gateway Lambda authorizer is a pluggable serverless function that acts as an intermediary step before an API action is invoked. This Lambda authorizer, coupled with a small SDK library that runs in the authorizer, will provide step-up authentication.

This solution consists of two blog posts. This is Part 1, where you’ll learn about the step-up authentication solution architecture and design. In the next post, Implement step-up authentication with Amazon Cognito, Part 2: Deploy and test the solution, you’ll learn how to use a reference implementation to test the step-up authentication solution.

Prerequisites

The reference architecture in this post uses a purpose-built step-up authorization workflow engine, which uses a custom SDK. The custom SDK uses the DynamoDB service as a persistent layer. This workflow engine is generic and can be used across any API serving layers, such as API Gateway or Elastic Load Balancing (ELB) Application Load Balancer, as long as the API serving layers can intercept API requests to perform additional actions. The step-up workflow engine also relies on an identity provider that is capable of issuing an OAuth 2.0 access token.

There are three parts to the step-up authentication solution:

  1. An API serving layer with the capability to apply custom logic before applying business logic.
  2. An OAuth 2.0–capable identity provider system.
  3. A purpose-built step-up workflow engine.

The solution in this post uses Amazon Cognito as the identity provider, with an API Gateway Lambda authorizer to invoke the step-up workflow engine, and DynamoDB as a persistent layer used by the step-up workflow engine. You can see a reference implementation of the API Gateway Lambda authorizer in the step-up-auth GitHub repository. Additionally, the purpose-built step-up workflow engine provides two API endpoints (or API actions), /initiate-auth and /respond-to-challenge, which are realized using the API Gateway Lambda authorizer, to drive the API invocation step-up state.

Note: If you decide to use an API serving layer other than API Gateway, or use an OAuth 2.0 identity provider besides Amazon Cognito, you will have to make changes to the accompanying sample code in the step-up-auth GitHub repository.

Solution architecture

Figure 1 shows the high-level reference architecture.

Figure 1: Step-up authentication high-level reference architecture

Figure 1: Step-up authentication high-level reference architecture

First, let’s talk about the core components in the step-up authentication reference architecture in Figure 1.

Identity provider

In order for a client application or user to invoke a protected backend API action, they must first obtain a valid OAuth token or JSON web token (JWT) from an identity provider. The step-up authentication solution uses Amazon Cognito as the identity provider. The step-up authentication solution and the accompanying step-up API operations use the access token to make the step-up authorization decision.

Protected backend

The step-up authentication solution uses API Gateway to protect backend resources. API Gateway supports several different API integration types, and you can use any one of the supported API Gateway integration types. For this solution, the accompanying sample code in the step-up-auth GitHub repository uses Lambda proxy integration to simulate a protected backend resource.

Data design

The step-up authentication solution relies on two DynamoDB tables, a session table and a setting table. The session table contains the user’s step-up session information, and the setting table contains an API step-up configuration. The API Gateway Lambda authorizer (described in the next section) checks the setting table to determine whether the API request requires a step-up session. For more information about table structure and sample values, see the Step-up authentication data design section in the accompanying GitHub repository.

The session table has the DynamoDB Time to Live (TTL) feature enabled. An item stays in the session table until the TTL time expires, when DynamoDB automatically deletes the item. The TTL value can be controlled by using the environment variable SESSION_TABLE_ITEM_TTL. Later in this post, we’ll cover where to define this environment variable in the Step-up solution design details section; and we’ll cover how to set the optimal value for this environment variable in the Additional considerations section.

Authorizer

The step-up authentication solution uses a purpose-built request parameter-based Lambda authorizer (also called a REQUEST authorizer). This REQUEST authorizer helps protect privileged API operations that require a step-up session.

The authorizer verifies that the API request contains a valid access token in the HTTP Authorization header. Using the access token’s JSON web token ID (JTI) claim as a key, the authorizer then attempts to retrieve a step-up session from the session table. If a session exists and its state is set to either STEP_UP_COMPLETED or STEP_UP_NOT_REQUIRED, then the authorizer lets the API call through by generating an allow API Gateway Lambda authorizer policy. If the set-up state is set to STEP_UP_REQUIRED, then the authorizer returns a 401 Unauthorized response status code to the caller.

If a step-up session does not exist in the session table for the incoming API request, then the authorizer attempts to create a session. It first looks up the setting table for the API configuration. If an API configuration is found and the configuration status is set to STEP_UP_REQUIRED, it indicates that the user must provide additional authentication in order to call this API action. In this case, the authorizer will create a new session in the session table by using the access token’s JTI claim as a session key, and it will return a 401 Unauthorized response status code to the caller. If the API configuration in the setting table is set to STEP_UP_DENY, then the authorizer will return a deny API Gateway Lambda authorizer policy, therefore blocking the API invocation. The caller will receive a 403 Forbidden response status code.

The authorizer uses the purpose-built auth-sdk library to interface with both the session and setting DynamoDB tables. The auth-sdk library provides convenient methods to create, update, or delete items in tables. Internally, auth-sdk uses the DynamoDB v3 Client SDK.

Initiate auth endpoint

When you deploy the step-up authentication solution, you will get the following two API endpoints:

  1. The initiate step-up authentication endpoint (described in this section).
  2. The respond to step-up authentication challenge endpoint (described in the next section).

When a client receives a 401 Unauthorized response status code from API Gateway after invoking a privileged API operation, the client can start the step-up authentication flow by invoking the initiate step-up authentication endpoint (/initiate-auth).

The /initiate-auth endpoint does not require any extra parameters, it only requires the Amazon Cognito access_token to be passed in the Authorization header of the request. The /initiate-auth endpoint uses the access token to call the Amazon Cognito API actions GetUser and GetUserAttributeVerificationCode on behalf of the user.

After the /initiate-auth endpoint has determined the proper multi-factor authentication (MFA) method to use, it returns the MFA method to the client. There are three possible values for the MFA methods:

  • MAYBE_SOFTWARE_TOKEN_STEP_UP, which is used when the MFA method cannot be determined.
  • SOFTWARE_TOKEN_STEP_UP, which is used when the user prefers software token MFA.
  • SMS_STEP_UP, which is used when the user prefers short message service (SMS) MFA.

Let’s take a closer look at how /initiate-auth endpoint determines the type of MFA methods to return to the client. The endpoint calls Amazon Cognito GetUser API action to check for user preferences, and it takes the following actions:

  1. Determines what method of MFA the user prefers, either software token or SMS.
  2. If the user’s preferred method is set to software token, the endpoint returns SOFTWARE_TOKEN_STEP_UP code to the client.
  3. If the user’s preferred method is set to SMS, the endpoint sends an SMS message with a code to the user’s mobile device. It uses the Amazon Cognito GetUserAttributeVerificationCode API action to send the SMS message. After the Amazon Cognito API action returns success, the endpoint returns SMS_STEP_UP code to the client.
  4. When the user preferences don’t include either a software token or SMS, the endpoint checks if the response from Amazon Cognito GetUser API action contains UserMFASetting response attribute list with either SOFTWARE_TOKEN_MFA or SMS_MFA keywords. If the UserMFASetting response attribute list contains SOFTWARE_TOKEN_MFA, then the endpoint returns SOFTWARE_TOKEN_STEP_UP code to the client. If it contains SMS_MFA keyword, then the endpoint invokes the Amazon Cognito GetUserAttributeVerificationCode API action to send the SMS message (as in step 3). Upon successful response from the Amazon Cognito API action, the endpoint returns SMS_STEP_UP code to the client.
  5. If the UserMFASetting response attribute list from Amazon Cognito GetUser API action does not contain SOFTWARE_TOKEN_MFA or SMS_MFA keywords, then the endpoint looks for phone_number_verified attribute. If found, then the endpoint sends an SMS message with a code to the user’s mobile device with verified phone number. The endpoint uses the Amazon Cognito GetUserAttributeVerificationCode API action to send the SMS message (as in step 3). Otherwise, when no verified phone is found, the endpoint returns MAYBE_SOFTWARE_TOKEN_STEP_UP code to the client.

The flowchart shown in Figure 2 illustrates the full decision logic.

Figure 2: MFA decision flow chart

Figure 2: MFA decision flow chart

Respond to challenge endpoint

The respond to challenge endpoint (/respond-to-challenge) is called by the client after it receives an appropriate MFA method from the /initiate-auth endpoint. The user must respond to the challenge appropriately by invoking /respond-to-challenge with a code and an MFA method.

The /respond-to-challenge endpoint receives two parameters in the POST body, one indicating the MFA method and the other containing the challenge response. Additionally, this endpoint requires the Amazon Cognito access token to be passed in the Authorization header of the request.

If the MFA method is SMS_STEP_UP, the /respond-to-challenge endpoint invokes the Amazon Cognito API action VerifyUserAttribute to verify the user-provided challenge response, which is the code that was sent by using SMS.

If the MFA method is SOFTWARE_TOKEN_STEP_UP or MAYBE_SOFTWARE_TOKEN_STEP_UP, the /respond-to-challenge endpoint invokes the Amazon Cognito API action VerifySoftwareToken to verify the challenge response that was sent in the endpoint payload.

After the user-provided challenge response is verified, the /respond-to-challenge endpoint updates the session table with the step-up session state STEP_UP_COMPLETED by using the access_token JTI. If the challenge response verification step fails, no changes are made to the session table. As explained earlier in the Data design section, the step-up session stays in the session table until the TTL time expires, when DynamoDB will automatically delete the item.

Deploy and test the step-up authentication solution

If you want to test the step-up authentication solution at this point, go to the second part of this blog, Implement step-up authentication with Amazon Cognito, Part 2: Deploy and test the solution. That post provides instructions you can use to deploy the solution by using the AWS Cloud Development Kit (AWS CDK) in your AWS account, and test it by using a sample web application.

Otherwise, you can continue reading the rest of this post to review the details and code behind the step-up authentication solution.

Step-up solution design details

Now let’s dig deeper into the step-up authentication solution. Figure 3 expands on the high-level solution design in the previous section and highlights the sequence of events that must take place to perform step-up authentication. In this section, we’ll break down these sequences into smaller parts and discuss each by going over a detailed sequence diagram.

Figure 3: Step-up authentication detailed reference architecture

Figure 3: Step-up authentication detailed reference architecture

Let’s group the step-up authentication flow in Figure 3 into three parts:

  1. Create a step-up session (steps 1-6 in Figure 3)
  2. Initiate step-up authentication (steps 7-8 in Figure 3)
  3. Respond to the step-up challenge (steps 9-12 in Figure 3)

In the next sections, you’ll learn how the user’s API requests are handled by the step-up authentication solution, and how the user state is elevated by going through an additional challenge.

Create a step-up session

After the user successfully logs in, they create a step-up session when invoking a privileged API action that is protected with the step-up Lambda authorizer. This authorizer determines whether to start a step-up challenge based on the configuration within the DynamoDB setting table, which might create a step-up session in the DynamoDB session table. Let’s go over steps 1–6, shown in the architecture diagram in Figure 3, in more detail:

  • Step 1 – It’s important to note that the user must authenticate with Amazon Cognito initially. As a result, they must have a valid access token generated by the Amazon Cognito user pool.
  • Step 2 – The user then invokes a privileged API action and passes the access token in the Authorization header.
  • Step 3 – The API action is protected by using a Lambda authorizer. The authorizer first validates the token by invoking the Amazon Cognito user pool public key. If the token is invalid, a 401 Unauthorized response status code can be sent immediately, prompting the client to present a valid token.
  • Step 4 – The authorizer performs a lookup in the DynamoDB setting table to check whether the current request needs elevated privilege (also known as step-up privilege). In the setting table, you can define which API actions require elevated privilege. You can additionally bundle API operations into a group by defining the group attribute. This allows you to further isolate privileged API operations, especially in a large-scale deployment.
  • Step 5 – If an API action requires elevated privilege, the authorizer will check for an existing step-up session for this specific user in the session table. If a step-up session does not exist, the authorizer will create a new entry in the session table. The key for this table will be the JTI claim of the access_token (which can be obtained after token verification).
  • Step 6 – If a valid session exists, then authorization will be given. Otherwise an unauthorized access response (401 HTTP code) will be sent back from the Lambda authorizer, indicating that the user requires elevated privilege.

Figure 4 highlights these steps in a sequence diagram.

Figure 4: Sequence diagram for creating a step-up session

Figure 4: Sequence diagram for creating a step-up session

Initiate step-up authentication

After the user receives a 401 Unauthorized response status code from invoking the privileged API action in the previous step, the user must call the /initiate-auth endpoint to start step-up authentication. The endpoint will return the response to the user or the client application to supply the temporary code. Let’s go over steps 7 and 8, shown in the architecture diagram in Figure 3, in more detail:

  • Step 7 – The client application initiates a step-up action by calling the /initiate-auth endpoint. This action is protected by the API Gateway built-in Amazon Cognito authorizer, and the client needs to pass a valid access_token in the Authorization header.
  • Step 8 – The call is forwarded to a Lambda function that will initiate the step-up action with the end user. The function first calls the Amazon Cognito API action GetUser to find out the user’s MFA settings. Depending on which MFA type is enabled for the user, the function uses different Amazon Cognito API operations to start the MFA challenge. For more details, see the Initiate auth endpoint section earlier in this post.

Figure 5 shows these steps in a sequence diagram.

Figure 5: Sequence diagram for invoking /initiate-auth to start step-up authentication

Figure 5: Sequence diagram for invoking /initiate-auth to start step-up authentication

Respond to the step-up challenge

In the previous step, the user receives a challenge code from the /initiate-auth endpoint. Depending on the type of challenge code, user must respond by sending a one-time password (OTP) to the /respond-to-challenge endpoint. The /respond-to-challenge endpoint invokes an Amazon Cognito API action to verify the OTP. Upon successful verification, the /respond-to-challenge endpoint marks the step-up session in the session table to STEP_UP_COMPLETED, indicating that the user now has elevated privilege. At this point, the user can invoke the privileged API action again to perform the elevated business operation. Let’s go over steps 9–12, shown in the architecture diagram in Figure 3, in more detail:

  • Step 9 – The client application presents an appropriate screen to the user to collect a response to the step-up challenge. The client application calls the /respond-to-challenge endpoint that contains the following:
    1. An access_token in the Authorization header.
    2. A step-up challenge type.
    3. A response provided by the user to the step-up challenge.

    This endpoint is protected by the API Gateway built-in Amazon Cognito authorizer.

  • Step 10 – The call is forwarded to the Lambda function, which verifies the response by calling the Amazon Cognito API action VerifyUserAttribute (in the case of SMS_STEP_UP) or VerifySoftwareToken (in the case of SOFTWARE_TOKEN_STEP_UP), depending on the type of step-up action that was returned from the /initiate-auth API action. The Amazon Cognito response will indicate whether verification was successful.
  • Step 11 – If the Amazon Cognito response in the previous step was successful, the Lambda function associated with the /respond-to-challenge endpoint inserts a record in the session table by using the access_token JTI as key. This record indicates that the user has completed step-up authentication. The record is inserted with a time to live (TTL) equal to the lesser of these values: the remaining period in the access_token timeout, or the default TTL value that is set in the Lambda function as a configurable environment variable, SESSION_TABLE_ITEM_TTL. The /respond-to-challenge endpoint returns a 200 status code after successfully updating the session table. It returns a 401 Unauthorized response status code if the operation failed or if the Amazon Cognito API calls in the previous step failed. For more information about the optimal value for the SESSION_TABLE_ITEM_TTL variable, see the Additional considerations section later in this post.
  • Step 12 – The client application can re-try the original call (using the same access token) to the privileged API operations, and this call should now succeed because an active step-up session exists for the user. Calls to other privileged API operations that require step-up should also succeed, as long as the step-up session hasn’t expired.

Figure 6 shows these steps in a sequence diagram.

Figure 6: Invoke the /respond-to-challenge endpoint to complete step-up authentication

Figure 6: Invoke the /respond-to-challenge endpoint to complete step-up authentication

Additional considerations

This solution uses several Amazon Cognito API operations to provide step-up authentication functionality. Amazon Cognito applies rate limiting on all API operations categories, and rapid calls that exceed the assigned quota will be throttled.

The step-up flow for a single user can include multiple Amazon Cognito API operations such as GetUser, GetUserAttributeVerificationCode, VerifyUserAttribute, and VerifySoftwareToken. These Amazon Cognito API operations have different rate limits. The effective rate, in requests per second (RPS), that your privileged and protected API action can achieve will be equivalent to the lowest category rate limit among these API operations. When you use the default quota, your application can achieve 25 SMS_STEP_UP RPS or up to 50 SOFTWARE_TOKEN_STEP_UP RPS.

Certain Amazon Cognito API operations have additional security rate limits per user per hour. For example, the GetUserAttributeVerificationCode API action has a limit of five calls per user per hour. For that reason, we recommend 15 minutes as the minimum value for SESSION_TABLE_ITEM_TTL, as this will allow a single user to have up to four step-up sessions per hour if needed.

Conclusion

In this blog post, you learned about the architecture of our step-up authentication solution and how to implement this architecture to protect privileged API operations by using AWS services. You learned how to use Amazon Cognito as the identity provider to authenticate users with multi-factor security and API Gateway with an authorizer Lambda function to enforce access to API actions by using a step-up authentication workflow engine. This solution uses DynamoDB as a persistent layer to manage the security rules for the step-up authentication workflow engine, which helps you to efficiently manage your rules.

In the next part of this post, Implement step-up authentication with Amazon Cognito, Part 2: Deploy and test the solution, you’ll deploy a reference implementation of the step-up authentication solution in your AWS account. You’ll use a sample web application to test the step-up authentication solution you learned about in this post.

 
If you have feedback about this post, submit comments in the Comments section below. If you have any questions about this post, start a thread on the Amazon Cognito forum.

Want more AWS Security news? Follow us on Twitter.

Salman Moghal

Salman Moghal

Salman is a Principal Consultant in AWS Professional Services, based in Toronto, Canada. He helps customers in architecting, developing, and reengineering data-driven applications at scale, with a sharp focus on security.

Thomas Ross

Thomas Ross

Thomas is a Software Engineering student at Carleton University. He worked at AWS as a Professional Services Intern and a Software Development Engineer Intern in Amazon Aurora. He has an interest in almost anything related to technology, especially systems at high scale, security, distributed systems, and databases.

Ozair Sheikh

Ozair Sheikh

Ozair is a senior product leader for Sponsored Display in Amazon ads, based in Toronto, Canada. He helps advertisers and Ad Tech API Partners build campaign management solutions to reach customers across the purchase journey. He has over 10 years of experience in API management and security, with an obsession for delivering highly secure API products.

Mahmoud Matouk

Mahmoud Matouk

Mahmoud is a Principal Solutions Architect with the Amazon Cognito team. He helps AWS customers build secure and innovative solutions for various identity and access management scenarios.

Interactively develop your AWS Glue streaming ETL jobs using AWS Glue Studio notebooks

Post Syndicated from Arun A K original https://aws.amazon.com/blogs/big-data/interactively-develop-your-aws-glue-streaming-etl-jobs-using-aws-glue-studio-notebooks/

Enterprise customers are modernizing their data warehouses and data lakes to provide real-time insights, because having the right insights at the right time is crucial for good business outcomes. To enable near-real-time decision-making, data pipelines need to process real-time or near-real-time data. This data is sourced from IoT devices, change data capture (CDC) services like AWS Data Migration Service (AWS DMS), and streaming services such as Amazon Kinesis, Apache Kafka, and others. These data pipelines need to be robust, able to scale, and able to process large data volumes in near-real time. AWS Glue streaming extract, transform, and load (ETL) jobs process data from data streams, including Kinesis and Apache Kafka, apply complex transformations in-flight, and load it into a target data stores for analytics and machine learning (ML).

Hundreds of customers are using AWS Glue streaming ETL for their near-real-time data processing requirements. These customers required an interactive capability to process streaming jobs. Previously, when developing and running a streaming job, you had to wait for the results to be available in the job logs or persisted into a target data warehouse or data lake to be able to view the results. With this approach, debugging and adjusting code is difficult, resulting in a longer development timeline.

Today, we are launching a new AWS Glue streaming ETL feature to interactively develop streaming ETL jobs in AWS Glue Studio notebooks and interactive sessions.

In this post, we provide a use case and step-by-step instructions to develop and debug your AWS Glue streaming ETL job using a notebook.

Solution overview

To demonstrate the streaming interactive sessions capability, we develop, test, and deploy an AWS Glue streaming ETL job to process Apache Webserver logs. The following high-level diagram represents the flow of events in our job.
BDB-2464 High Level Application Architecture
Apache Webserver logs are streamed to Amazon Kinesis Data Streams. An AWS Glue streaming ETL job consumes the data in near-real time and runs an aggregation that computes how many times a webpage has been unavailable (status code 500 and above) due to an internal error. The aggregate information is then published to a downstream Amazon DynamoDB table. As part of this post, we develop this job using AWS Glue Studio notebooks.

You can either work with the instructions provided in the notebook, which you download when instructed later in this post, or follow along with this post to author your first streaming interactive session job.

Prerequisites

To get started, click the Launch Stack button below, to run an AWS CloudFormation template on your AWS environment.

BDB-2063-launch-cloudformation-stack

The template provisions a Kinesis data stream, DynamoDB table, AWS Glue job to generate simulated log data, and the necessary AWS Identity and Access Management (IAM) role and polices. After you deploy your resources, you can review the Resources tab on the AWS CloudFormation console for detailed information.

Set up the AWS Glue streaming interactive session job

To set up your AWS Glue streaming job, complete the following steps:

  1. Download the notebook file and save it to a local directory on your computer.
  2. On the AWS Glue console, choose Jobs in the navigation pane.
  3. Choose Create job.
  4. Select Jupyter Notebook.
  5. Under Options, select Upload and edit an existing notebook.
  6. Choose Choose file and browse to the notebook file you downloaded.
  7. Choose Create.
BDB-2464 Create Job
  1. For Job name¸ enter a name for the job.
  2. For IAM Role, use the role glue-iss-role-0v8glq, which is provisioned as part of the CloudFormation template.
  3. Choose Start notebook job.
BDB-2464 Start Notebook

You can see that the notebook is loaded into the UI. There are markdown cells with instructions as well as code blocks that you can run sequentially. You can either run the instructions on the notebook or follow along with this post to continue with the job development.

BDB-2464 Explore Notebook

Run notebook cells

Let’s run the code block that has the magics. The notebook has notes on what each magic does.

  1. Run the first cell.
BDB-2464 Run First Cell

After running the cell, you can see in the output section that the defaults have been reconfigured.

BDB-2464 Configurations Set

In the context of streaming interactive sessions, an important configuration is job type, which is set to streaming. Additionally, to minimize costs, the number of workers is set to 2 (default 5), which is sufficient for our use case that deals with a low-volume simulated dataset.

Our next step is to initialize an AWS Glue streaming session.

  1. Run the next code cell.
BDB-2464 Initiate Session

After we run this cell, we can see that a session has been initialized and a session ID is created.

A Kinesis data stream and AWS Glue data generator job that feeds into this stream have already been provisioned and triggered by the CloudFormation template. With the next cell, we consume this data as an Apache Spark DataFrame.

  1. Run the next cell.
BDB-2464 Fetch From Kinesis

Because there are no print statements, the cells don’t show any output. You can proceed to run the following cells.

Explore the data stream

To help enhance the interactive experience in AWS Glue interactive sessions, GlueContext provides the method getSampleStreamingDynamicFrame. It provides a snapshot of the stream in a static DynamicFrame. It takes three arguments:

  • The Spark streaming DataFrame
  • An options map
  • A writeStreamFunction to apply a function to every sampled record

Available options are as follows:

  • windowSize – Also known as the micro-batch duration, this parameter determines how long a streaming query will wait after the previous batch was triggered.
  • pollingTimeInMs – This is the total length of time the method will run. It starts at least one micro-batch to obtain sample records from the input stream. The time unit is milliseconds, and the value should be greater than the windowSize.
  • recordPollingLimit – This is defaulted to 100, and helps you set an upper bound on the number of records that is retrieved from the stream.

Run the next code cell and explore the output.

BDB-2464 Sample Data

We see that the sample consists of 100 records (the default record limit), and we have successfully displayed the first 10 records from the sample.

Work with the data

Now that we know what our data looks like, we can write the logic to clean and format it for our analytics.

Run the code cell containing the reformat function.

Note that Python UDFs aren’t the recommended way to handle data transformations in a Spark application. We use reformat() to exemplify troubleshooting. When working with a real-world production application, we recommend using native APIs wherever possible.

BDB-2464 Run The UDF

We see that the code cell failed to run. The failure was on purpose. We deliberately created a division by zero exception in our parser.

BDB-2464 Error Running The Code

Failure and recovery

In case of a regular AWS Glue job, for any error, the whole application exits, and you have to make code changes and resubmit the application. However, in case of interactive sessions, the coding context and definitions are fully preserved and the session is still operational. There is no need to bootstrap a new cluster and rerun all the preceding transformation. This allows you to focus on quickly iterating your batch function implementation to obtain the desired outcome. You can fix the defects and run them in a matter of seconds.

To test this out, go back to the code and comment or delete the erroneous line error_line=1/0 and rerun the cell.

BDB-2464 Error Corrected

Implement business logic

Now that we have successfully tested our parsing logic on the sample stream, let’s implement the actual business logic. The logics are implemented in the processBatch method within the next code cell. In this method, we do the following:

  • Pass the streaming DataFrame in micro-batches
  • Parse the input stream
  • Filter messages with status code >=500
  • Over a 1-minute interval, get the count of failures per webpage
  • Persist the preceding metric to a DynamoDB table (glue-iss-ddbtbl-0v8glq)
  1. Run the next code cell to trigger the stream processing.
BDB-2464 Trigger DDB Write
  1. Wait a few minutes for the cell to complete.
  2. On the DynamoDB console, navigate to the Items page and select the glue-iss-ddbtbl-0v8glq table.
BDB-2464 Explore DDB

The page displays the aggregated results that have been written by our interactive session job.

Deploy the streaming job

So far, we have been developing and testing our application using the streaming interactive sessions. Now that we’re confident of the job, let’s convert this into an AWS Glue job. We have seen that the majority of code cells are doing exploratory analysis and sampling, and aren’t required to be a part of the main job.

A commented code cell that represents the whole application is provided to you. You can uncomment the cell and delete all other cells. Another option would be to not use the commented cell, but delete just the two cells from the notebook that do the sampling or debugging and print statements.

To delete a cell, choose the cell and then choose the delete icon.

BDB-2464 Delete a Cell

Now that you have the final application code ready, save and deploy the AWS Glue job by choosing Save.

BDB-2464 Save Job

A banner message appears when the job is updated.

BDB-2464 Save Job Banner

Explore the AWS Glue job

After you save the notebook, you should be able to access the job like any regular AWS Glue job on the Jobs page of the AWS Glue console.

BDB-2464 Job Page

Additionally, you can look at the Job details tab to confirm the initial configurations, such as number of workers, have taken effect after deploying the job.

BDB-2464 Job Details Page

Run the AWS Glue job

If needed, you can choose Run to run the job as an AWS Glue streaming job.

BDB-2464 Job Run

To track progress, you can access the run details on the Runs tab.

BDB-2464 Job Run Details

Clean up

To avoid incurring additional charges to your account, stop the streaming job that you started as part of the instructions. Also, on the AWS CloudFormation console, select the stack that you provisioned and delete it.

Conclusion

In this post, we demonstrated how to do the following:

  • Author a job using notebooks
  • Preview incoming data streams
  • Code and fix issues without having to publish AWS Glue jobs
  • Review the end-to-end working code, remove any debugging, and print statements or cells from the notebook
  • Publish the code as an AWS Glue job

We did all of this via a notebook interface.

With these improvements in the overall development timelines of AWS Glue jobs, it’s easier to author jobs using the streaming interactive sessions. We encourage you to use the prescribed use case, CloudFormation stack, and notebook to jumpstart your individual use cases to adopt AWS Glue streaming workloads.

The goal of this post was to give you hands-on experience working with AWS Glue streaming and interactive sessions. When onboarding a productionized workload onto your AWS environment, based on the data sensitivity and security requirements, ensure you implement and enforce tighter security controls.


About the authors

Arun A K is a Big Data Solutions Architect with AWS. He works with customers to provide architectural guidance for running analytics solutions on the cloud. In his free time, Arun loves to enjoy quality time with his family.

Linan Zheng is a Software Development Engineer at AWS Glue Streaming Team, helping building the serverless data platform. His works involve large scale optimization engine for transactional data formats and streaming interactive sessions.

Roman Gavrilov is an Engineering Manager at AWS Glue. He has over a decade of experience building scalable Big Data and Event-Driven solutions. His team works on Glue Streaming ETL to allow near real time data preparation and enrichment for machine learning and analytics.

Shiv Narayanan is a Senior Technical Product Manager on the AWS Glue team. He works with AWS customers across the globe to strategize, build, develop, and deploy modern data platforms.

How to automate updates for your domain list in Route 53 Resolver DNS Firewall

Post Syndicated from Guillaume Neau original https://aws.amazon.com/blogs/security/how-to-automate-updates-for-your-domain-list-in-route-53-resolver-dns-firewall/

Note: This post includes links to third-party websites. AWS is not responsible for the content on those websites.


Following the release of Amazon Route 53 Resolver DNS Firewall, Amazon Web Services (AWS) published several blog posts to help you protect your Amazon Virtual Private Cloud (Amazon VPC) DNS resolution, including How to Get Started with Amazon Route 53 Resolver DNS Firewall for Amazon VPC and Secure your Amazon VPC DNS resolution with Amazon Route 53 Resolver DNS Firewall. Route 53 Resolver DNS Firewall provides managed domain lists that are fully maintained and kept up-to-date by AWS and that directly benefit from the threat intelligence that we gather, but you might want to create or import your own list to have full control over the DNS filtering.

In this blog post, you will find a solution to automate the management of your domain list by using AWS Lambda, Amazon EventBridge, and Amazon Simple Storage Service (Amazon S3). The solution in this post uses, as an example, the URLhaus open Response Policy Zone (RPZ) list, which generates a new file every five minutes.

Architecture overview

The solution is made of the following four components, as shown in Figure 1.

  1. An EventBridge scheduled rule to invoke the Lambda function on a schedule.
  2. A Lambda function that uses the AWS SDK to perform the automation logic.
  3. An S3 bucket to temporarily store the list of domains retrieved.
  4. Amazon Route 53 Resolver DNS Firewall.
    Figure 1: Architecture overview

    Figure 1: Architecture overview

After the solution is deployed, it works as follows:

  1. The scheduled rule invokes the Lambda function every 5 minutes to fetch the latest domain list available.
  2. The Lambda function fetches the list from URLhaus, parses the data retrieved, formats the data, uploads the list of domains into the S3 bucket, and invokes the Route 53 Resolver DNS Firewall importFirewallDomains API action.
  3. The domain list is then updated.

Implementation steps

As a first step, create your own domain list on the Route 53 Resolver DNS Firewall. Having your own domain list allows you to have full control of the list of domains to which you want to apply actions, as defined within rule groups.

To create your own domain list

  1. In the Route 53 console, in the left menu, choose Domain lists in the DNS firewall section.
  2. Choose the Add domain list button, enter a name for your owned domain list, and then enter a placeholder domain to initialize the domain list.
  3. Choose Add domain list to finalize the creation of the domain list.
    Figure 2: Expected view of the console

    Figure 2: Expected view of the console

The list from URLhaus contains more than a thousand records. You will use the ImportFirewallDomains endpoint to upload this list to DNS Firewall. The use of the ImportFirewallDomains endpoint requires that you first upload the list of domains and make the list available in an S3 bucket that is located in the same AWS Region as the owned domain list that you just created.

To create the S3 bucket

  1. In the S3 console, choose Create bucket.
  2. Under General configuration, configure the AWS Region option to be the same as the Region in which you created your domain list.
  3. Finalize the configuration of your S3 bucket, and then choose Create bucket.

Because a new file is created every five minutes, we recommend setting a lifecycle rule to automatically expire and delete files after 24 hours to optimize for cost and only save the most recent lists.

To create the Lambda function

  1. Follow the steps in the topic Creating an execution role in the IAM console to create an execution role. After step 4, when you configure permissions, choose Create Policy, and then create and add an IAM policy similar to the following example. This policy needs to:
    • Allow the Lambda function to put logs in Amazon CloudWatch.
    • Allow the Lambda function to have read and write access to objects placed in the created S3 bucket.
    • Allow the Lambda function to update the firewall domain list.
    • {
          "Version": "2012-10-17",
          "Statement": [
              {
                  "Action": [
                      "logs:CreateLogGroup",
                      "logs:CreateLogStream",
                      "logs:PutLogEvents"
                  ],
                  "Resource": "arn:aws:logs:<region>:<accountId>:*",
                  "Effect": "Allow"
              },
              {
                  "Action": [
                      "s3:PutObject",
                      "s3:GetObject"
                  ],
                  "Resource": "arn:aws:s3:::<DNSFW-BUCKET-NAME>/*",
                  "Effect": "Allow"
              },
              {
                  "Action": [
                      "route53resolver:ImportFirewallDomains"
                  ],
                  "Resource": "arn:aws:route53resolver:<region>:<accountId>:firewall-domain-list/<domain-list-id>",
                  "Effect": "Allow"
              }
          ]
      }

  2. (Optional) If you decide to use the example provided by AWS:
    • After cloning the repository: Build the layer following the instruction included in the readme.md and the provided script.
    • Zip the lambda.
    • In the left menu, select Layers then Create Layer. Enter a name for the layer, then select Upload a .zip file. Choose to upload the layer (node-axios-layer.zip).
    • As a compatible runtime, select: Node.js 16.x.
    • Select Create
  3. In the Lambda console, in the same Region as your domain list, choose Create function, and then do the following:
    • Choose your desired runtime and architecture.
    • (Optional) To use the code provided by AWS: Select Node.js 16.x as the runtime.
    • Choose Change the default execution role.
    • Choose Use an existing role, and then pick the role that you just created.
  4. After the Lambda function is created, in the left menu of the Lambda console, choose Functions, and then select the function you created.
    • For Code source, you can either enter the code of the Lambda function or choose the Upload from button and then choose the source for the code. AWS provides an example of functioning code on GitHub under a MIT-0 license.

    (optional) To use the code provided by AWS:

    • Choose the Upload from button and upload the zipped code example.
    • After the code is uploaded, edit the default Runtime settings: Choose the Edit button and set the handler to be equal to: LambdaRpz.handler
    • Edit the default Layers configuration, choose the Add a layer button, select Specify an ARN and enter the ARN of the layer created during the optional step 2.
    • Edit the environment variables of the function: Select the Edit button and define the three following variables:
      1. Key : FirewallDomainListId | Value : <domain-list-id>
      2. Key : region | Value : <region>
      3. Key : s3Prefix | Value : <DNSFW-BUCKET-NAME>

The code that you place in the function will be able to fetch the list from URLhaus, upload the list as a file to S3, and start the import of domains.

For the Lambda function to be invoked every 5 minutes, next you will create a scheduled rule with Amazon EventBridge.

To automate the invoking of the Lambda function

  1. In the EventBridge console, in the same AWS Region as your domain list, choose Create rule.
  2. For Rule type, choose Schedule.
  3. For Schedule pattern, select the option A schedule that runs at a regular rate, such as every 10 minutes, and under Rate expression set a rate of 5 minutes.
    Figure 3: Console view when configuring a schedule

    Figure 3: Console view when configuring a schedule

  4. To select the target, choose AWS service, choose Lambda function, and then select the function that you previously created.

After the solution is deployed, your domain list will be updated every 5 minutes and look like the view in Figure 4.

Figure 4: Console view of the created domain list after it has been updated by the Lambda function

Figure 4: Console view of the created domain list after it has been updated by the Lambda function

Code samples

You can use the samples in the amazon-route-53-resolver-firewall-automation-examples-2 GitHub repository to ease the automation of your domain list, and the associated updates. The repository contains script files to help you with the deployment process of the AWS CloudFormation template. Note that you need to have the AWS Command Line Interface (AWS CLI) installed and properly configured in order to use the files.

To deploy the CloudFormation stack

  1. If you haven’t done so already, create an S3 bucket to store the artifacts in the Region where you wish to deploy. This name of this bucket will then be referenced as ParamS3ArtifactBucket with a value of <DOC-EXAMPLE-BUCKET-ARTIFACT>
  2. Clone the repository locally.
    git clone https://github.com/aws-samples/amazon-route-53-resolver-firewall-automation-examples-2
  3. Build the Lambda function layer. From the /layer folder, use the provided script.
    . ./build-layer.sh
  4. Zip and upload the artifact to the bucket created in step 1. From the root folder, use the provided script.
    . ./zipupload.sh <ParamS3ArtifactBucket>
  5. Deploy the AWS CloudFormation stack by using either the AWS CLI or the CloudFormation console.
    • To deploy by using the AWS CLI, from the root folder, type the following command, making sure to replace <region>, <DOC-EXAMPLE-BUCKET-ARTIFACT>, <DNSFW-BUCKET-NAME>, and <DomainListName>with your own values.
      aws --region <region> cloudformation create-stack --stack-name DNSFWStack --capabilities CAPABILITY_NAMED_IAM --template-body file://./DNSFWStack.cfn.yaml --parameters ParameterKey=ParamS3ArtifactBucket,ParameterValue=<DOC-EXAMPLE-BUCKET-ARTIFACT> ParameterKey=ParamS3RpzBucket,ParameterValue=<DNSFW-BUCKET-NAME> ParameterKey=ParamFirewallDomainListName,ParameterValue=<DomainListName>

    • To deploy by using the console, do the following:
      1. In the CloudFormation console, choose Create stack, and then choose With new resources (standard).
      2. On the creation screen, choose Template is ready, and upload the provided DNSFWStack.cfn.yaml file.
      3. Enter a stack name and configure the requested parameters with your desired configuration and outcomes. These parameters include the following:
        • The name of your firewall domain list.
        • The name of the S3 bucket that contains Lambda artifacts.
        • The name of the S3 bucket that will be created to contain the files with the domain information from URLhaus.
      4. Acknowledge that the template requires IAM permission because it will create the role for the Lambda function and manage its IAM policy, and then choose Create stack.

After a few minutes, all the resources should be created and the CloudFormation stack is now deployed. After 5 minutes, your domain list should be updated, as shown in Figure 5.

Figure 5: Console view of CloudFormation after the stack has been deployed

Figure 5: Console view of CloudFormation after the stack has been deployed

Conclusions and cost

In this blog post, you learned about creating and automating the update of a domain list that you fully control. To go further, you can extend and replicate the architecture pattern to fetch domain names from other sources by editing the source code of the Lambda function.

After the solution is in place, in order for the filtering to be effective, you need to create a rule group referencing the domain list and associate the rule group with some of your VPCs.

For cost information, see the AWS Pricing Calculator. This solution will be invoked 60 (minutes) * 24 (hours) * 30 (days) / 5 (minutes) = 8,640 times per month, invoking the Lambda function that will run for an average of 400 minutes, storing an average of 0.5 GB in Amazon S3, and creating a domain list that averages 1,500 domains. According to our public pricing, and without factoring in the AWS Free Tier, this will incur the estimated total cost of $1.43 per month for the filtering of 1 million DNS requests.

 
If you have feedback about this post, submit comments in the Comments section below. If you have questions about this post, contact AWS Support.

Want more AWS Security news? Follow us on Twitter.

Guillaume Neau

Guillaume Neau

Guillaume is a solutions architect of France with an expertise in information security that focus on building solutions that improve the life of citizens.

Amazon DevOps Guru increases Operational Efficiency for 605

Post Syndicated from Mohit Gadkari original https://aws.amazon.com/blogs/devops/amazon-devops-guru-increases-operational-efficiency-for-605/

605 is an independent TV measurement firm that offers advertising and content measurement, full-funnel attribution, media planning, optimization, and analytical solutions, all on top of their multi-source viewership data set covering over 21 million U.S. households. 605 has built their technology solutions on AWS with dozens of accounts and tens of thousands of resources to monitor.

As 605 continues to innovate and build new solutions, the size and complexity of their AWS deployment has also grown proportionally. Over time, managing their deployment has become an operational challenge for their current team. 605 has deployed different application performance monitoring (APM) tools and notification systems to help their observability staff scale and support their growing cloud environment. However, 605 realized that their continued growth on the cloud would necessitate either increasing their observability staff or assuming some risk of potential application performance issues or even outages.

Amazon DevOps Guru allowed 605 to find a third path forward. Rather than accepting the trade-off of hiring more staff or assuming more risk, 605 discovered that DevOps Guru provides an increase in operational efficiency using their existing staff resources by applying artificial intelligence (AI) to supplement their existing APM and notification platform. Layering DevOps Guru into their DevOps environment , 605 realized a 4-fold decrease in the number of alerts and notifications that proved to be false positives. In fact, 605 went from an environment where 76.2% of their alerts and notifications were false positives, to one with only 18.9% false positives simply by adding Amazon DevOps Guru. In the end, 605 can more effectively and efficiently manage their environment with existing resources and actually freeing-up DevOps brainpower to work on more strategically important initiatives than application management.

“Amazon DevOps Guru has provided insights that help us focus our infrastructure roadmap. Our current SIEM tools require building out alerting ahead of time, while DevOps Guru is constantly evolving, which prevents becoming stagnant in our monitoring. Reducing the risk of false positive alerts has saved countless engineering hours.”

Jared Williams, VP of Infrastructure and Architecture, 605

605 without DevOps Guru had their Amazon CloudWatch and Amazon Elastic Container Service for Kubernetes ( Amazon EKS) configured with different application performance monitoring and notification systems. They saw only 23.8 % legitimate alerts and notifications, where as with the integration with DevOps Guru the legitimate alerts and notifications went up to 81% for a 6-month time period.
605 are monitoring over 13+ AWS Accounts, 20+ Amazon EKS Clusters, 500+ Pods ,15000+ EC2 Instances, 500+ S3 Buckets and 55+ Application Load Balancers with DevOps Guru

605 without DevOps Guru had their Amazon CloudWatch and Amazon Elastic Container Service for Kubernetes ( Amazon EKS) configured with different application performance monitoring and notification systems. They saw only 23.8 % legitimate alerts and notifications, where as with the integration with DevOps Guru the legitimate alerts and notifications went up to 81% for a 6-month time period.

Figure 1. 605 are monitoring over 13+ AWS Accounts, 20+ Amazon EKS Clusters, 500+ Pods ,15000+ EC2 Instances, 500+ S3 Buckets and 55+ Application Load Balancers with DevOps Guru.

Amazon DevOps Guru is a service powered by applying artificial intelligence (AI) that’s designed to make it easy to improve an application’s operational performance and availability. DevOps Guru helps detect behaviors that deviate from normal operating patterns so that you can identify operational issues long before they impact your applications. DevOps Guru utilizes ML models informed by years of Amazon.com and AWS operational excellence to identify anomalous application behavior (for example, increased latency, error rates, resource constraints, and others). Furthermore, it helps surface critical issues that could cause potential outages or service disruptions. When DevOps Guru identifies a critical issue, it automatically sends an alert and provides a summary of related anomalies, the likely root cause, and context for when and where the issue occurred. When possible, DevOps Guru also helps provide recommendations regarding how to remediate the issue. DevOps Guru ingests operational data from your AWS applications and provides a single dashboard to visualize issues in your operational data. DevOps Guru can be enabled for all of the resources in your AWS account, resources in your AWS CloudFormation Stacks, or resources grouped together by AWS Tags, with no manual setup or ML expertise required.

The value of DevOps Guru for 605 goes beyond providing operational efficiency and avoiding the choice of adding DevOps resources or assuming more risk. DevOps Guru also discovered issues with application performance that their existing solutions weren’t trained to inspect.

This new data allowed 605 to avoid a potential problem that they didn’t otherwise know would occur. As DevOps Guru doesn’t require any set-up beyond enabling the service and choosing resources to monitor (it’s a managed service), the service can surface issues without any prior configuration.

In the end, the value of DevOps Guru for 605 surfaces in three ways. First, it increases operational efficiency by allowing their existing DevOps team to more effectively manage its AWS applications and resources, as well as the room to grow along with their business needs. Second, DevOps Guru reduces operational fatigue and allows their DevOps teams to focus on more strategic issues by significantly reducing false positives. Lastly, DevOps Guru can find operational issues to which existing APM tools may not be configured or able to detect.

Start monitoring your AWS applications with AWS DevOps Guru today using this link

About the authors:

Mohit Gadkari

Mohit Gadkari is a Solutions Architect at Amazon Web Services (AWS) supporting SMB customers. He has been professionally using AWS since 2015 specializing in DevOps and Cloud Security and currently he is using this experience to help customers navigate the cloud.

Pauly Longani

Pauly is an Enterprise Support Lead at AWS, USA. He is a customer advocate and supports his customers in their cloud journey. He is passionate about the cloud and how it can be leveraged to overcome challenges across industry verticals.

Jared Williams

Jared, VP of Infrastructure and Architecture at 605, is in his 15th year managing or working on teams with DevOps type focuses. He has been involved with AWS since 2009. He manages the multi-team DevOps department at 605 where he has been for more than three years. Jared also co-founded a 24,000+ person DevOps community.

Learn more about the new allow list feature in Macie

Post Syndicated from Jonathan Nguyen original https://aws.amazon.com/blogs/security/learn-more-about-the-new-allow-list-feature-in-macie/

Amazon Macie is a fully managed data security and data privacy service that uses machine learning and pattern matching to discover and help you protect your sensitive data in Amazon Web Services (AWS). The data that is available within your AWS account can grow rapidly, which increases your need to verify that all sensitive data is identified and protected. Macie provides you with the ability to use both managed data identifiers and custom data identifiers, but enabling these identifiers for every job could result in a large number of security findings that might not take into account how data is used within your AWS account. So that you can tailor the detection and creation of findings within Macie, Macie now has an allow list feature available for use with your scanning jobs.

In this blog post, we show you how to set up an allow list in Macie and run a Macie scan that uses the allow list to ignore the specified values when creating sensitive data findings. The allow list feature can help your sensitive data management team by reducing false positives due to data text or formats in your environment that do not require action. This makes it easier for your team to focus on Macie findings that need to be reviewed and remediated. By increasing the overall confidence in findings presented by Macie, you can improve the performance of automated workflows and solutions.

Prerequisites

To get started, you’ll need the following prerequisites:

  1. An active AWS account
  2. Amazon Macie enabled within your AWS account
  3. (Optional) Member AWS accounts are enabled using AWS Organizations and a delegated Macie administrator account

Create an allow list in Macie

You can configure allow lists with either regular expressions (regex) or predefined text. Use a predefined text allow list if you have a list of specific values you want to exclude, like a list of example fake names or addresses that are used in test data sets. Alternatively, if you don’t have the exact values but know the pattern to exclude, you can use a regex allow list. Some use cases for a regex allow list could be to exclude tracking IDs or public reference numbers that could resemble a Macie managed data identifier or custom data identifier.

It is important to note that allow lists, and S3 objects if using predefined text, must be created in the same AWS account where the Macie job is created.

  1. If Macie jobs are created from the Macie delegated administrator AWS account to scan member AWS accounts, then the allow lists must be centrally configured in the Macie delegated administrator account.
  2. If Macie jobs are created from the member AWS account to scan buckets within the same AWS account, then the allow lists must be configured in the same AWS account where the Macie job is created.

To create an allow list by using the Amazon Macie Console

  1. In the Amazon Macie Console, navigate to Macie.
  2. Under Settings, choose Allow lists.
  3. Choose Create.
  4. Choose a list type.
    1. If you’re creating a regex allow list, choose Regular expression. For List settings, enter the following settings for the allow list.
      1. For Name, enter the name of the list.
      2. For Description, enter a description (optional).
      3. For Regular expression, enter the regular expression. Macie will not create findings for any matches on the allow list regex.
      4. Evaluate with sample data if needed to test your regex. Macie provides an Evaluate option so you can test your regex against sample data sets to make sure it’s working as expected.
    2. If you’re creating a predefined text allow list, choose Predefined text. For this option, you will need to create a plaintext file and upload the file to an Amazon Simple Storage Service (Amazon S3) bucket. Once you upload the file, you can then reference the Amazon S3 object in the allow list.
      1. Enter the name of the list.
      2. Enter a description for the list (optional).
      3. Enter the S3 bucket name.
      4. Enter the S3 object name of the plaintext file.

    Note: The Macie service-linked role must have the ability to read the S3 object for the predefined text. When you run Macie jobs that use allow lists with predefined text, the Macie service-linked role will read the S3 object. If there is any error reading the S3 object, the Macie job will continue to run without using the predefined text allow list. You will need to periodically check your allow lists to make sure they are in an OK status. You can check the status of each allow list in the Amazon Macie console or via the AWS CLI using the get-allow-list API.

    More information and explanation for status of allow list can be found in the Amazon Macie User Guide.

  5. Choose Create to create the allow list.

    Note: An allow list must be stored in an S3 bucket in the same AWS account and AWS Region as your Macie account. Macie cannot access an allow list if it is stored in a different Region or account.

You can also create and manage allow lists by using the Amazon Macie console, AWS Command Line Interface (AWS CLI) or AWS CloudFormation.

To create or manage an allow list by using the AWS CloudFormation

Below is an example enabling Amazon Macie for an account. The session resource configures Macie to publish updated policy findings for the account.

AWSTemplateFormatVersion: 2010-09-09
Description:<insert-template-description>
Resources:
  EnableMacieSession:
Type: AWS::Macie::Session
Properties:
    	    FindingPublishingFrequency: <insert-finding-publishing-frequency>
    Status: ENABLED

Below is an example of creating an allow list that uses a regular expression to specify a text pattern to ignore. Like other Macie resources, the DependsOn attribute is a required dependency for creating a Macie allow list.

AWSTemplateFormatVersion: 2010-09-09
Description:<insert-template-description>
Resources:
  RegularExpressionAllowList:
Type: AWS::Macie::AllowList
DependsOn: Session
Properties:
  Criteria:
    Regex: “<insert-regex-expression>”
  Description: <insert-allow-list-description>
  Name: <insert-allow-list-name>
  Tags:
    - Key: <insert-tag-key-name>
      Value: <insert-tag-key-value>

Below is an example creating an allow list that specifies a list of predefined text to ignore.

AWSTemplateFormatVersion: 2010-09-09
Description:<insert-template-description>
Resources:
PredefinedAllowList:
Type: AWS::Macie::AllowList
DependsOn: Session
Properties:
  Criteria:
    S3WordsList:
      BucketName: <DOC-EXAMPLE-BUCKET>
      ObjectKey: <OBJECT-EXAMPLE-KEY>
  Description: <insert-allow-list-description>
  Name: <insert-allow-list-name>
  Tags:
  - Key: <insert-tag-key-name>
    Value: <insert-tag-key-value>

To create or manage an allow list by using the AWS CLI

  1. In the AWS CLI, run the following commands to create an allow list with a regular expression.
    aws macie2 create-allow-list \
    --criteria '{"regex":"<insert-regex-expression>"}' \
    --name "<insert-allow-list-name>" \
    --description "<insert-allow-list-description>"
  2. In the AWS CLI, run the following commands to create an allow list with predefined text.
    aws macie2 create-allow-list \
    --criteria '{"s3WordsList":{"bucketName":"<DOC-EXAMPLE-BUCKET>","objectKey":"<OBJECT-EXAMPLE-KEY>"}}' \
    --name "<insert-allow-list-name>" \
    --description "<insert-allow-list-description>"
  3. In the AWS CLI, run the following commands to update an existing allow list.
    aws macie2 update-allow-list --id <GUID-for-Macie-allow-list> example --description <insert-new-description>
  4. In the AWS CLI, run the following commands to delete an existing allow list.
    aws macie2 delete-allow-list --id <GUID-for-Macie-allow-list> example --ignoreJobChecks false
  5. In the AWS CLI, run the following commands to get existing allow lists.
    aws macie2 get-allow-list –id <GUID-for-Macie-allow-list>

For a detailed list of available AWS CLI commands, refer to the AWS CLI documentation for Amazon Macie.

Use the allow list in a Macie scan

After you create allow lists, you can create and run sensitive data discovery jobs in Macie. This will enable you to review, analyze, and compare findings about the affected resources in Amazon S3 buckets with or without allow lists.

Option 1: Create a Macie job with the allow list by using the console

  1. Go to the Amazon Macie Console and navigate to Macie.
  2. In the navigation pane, choose Jobs, and then choose Create job.
  3. On the Choose Amazon S3 buckets page, choose Select specific buckets.

    Note: Macie displays a list of all the buckets managed by your AWS account, including members if configured, in the current Region.

    • Under Select Amazon S3 buckets, optionally choose Refresh to retrieve the latest bucket metadata from Amazon S3.
  4. In the table, select each bucket you want the job to analyze, and then choose Next.
  5. Review and optionally adjust the list of S3 buckets that you selected for the job, and then choose Next.
  6. Refine the scope of the job, if needed. Use these settings to specify how often you want the job to run and the depth and scope of the job’s analysis, and then choose Next.
  7. Select any managed data identifiers you want to use, and then choose Next.
  8. Select any custom data identifiers that you want to use, and then choose Next.
  9. Select the allow lists that you created to ignore either predefined text or regular expression patterns for any objects in the job, and then choose Next.

    Figure 1: Selecting allow lists for a Macie job

    Figure 1: Selecting allow lists for a Macie job

  10. In General settings, enter a name for the job. You can also enter a description and assign tags to the job. Choose Next.
  11. Review and create the job, and then choose Submit.

Option 2: Create a Macie job with the allow list by using the AWS CLI

  1. In the AWS CLI, run the following command.
    aws macie2 create-classification-job \
    --generate-cli-skeleton > <insert-macie-job-input-json>
  2. Input the GUID for the Macie allow list as part of the Macie job input in the JSON file.
  3. Run the following command.
    aws macie2 create-classification-job \
    --cli-input-json file://<insert-macie-job-input-json>

Review Macie findings before and after allow lists

It is important to note that for any existing jobs you configured in your AWS account or organization prior to the Macie allow list feature being released, you will need to recreate those Macie jobs and reference the allow lists you want the job to use. This is only required if you want to have existing jobs use allow lists.

Before you run a Macie job that uses predefined text allow lists, verify that existing Amazon Key Management Service (AWS KMS) keys that are used to encrypt buckets and S3 bucket policy grant the Macie service-linked role the necessary permissions to decrypt the S3 objects.

Figure 2 shows an example of predefined text allow lists for sensitive data discovery jobs, that include credit card numbers, Social Security Numbers (SSNs), and first and last names. The values in the S3 object allow lists will not create Macie findings when the sensitive data discovery job inspects S3 objects.

Figure 2: Example list of existing allow lists

Figure 2: Example list of existing allow lists

Figure 3 shows a sensitive data discovery job that does not include the predefined text allow lists.

Figure 3: Macie job example without allow list configured

Figure 3: Macie job example without allow list configured

Since there are no allow lists configured, Macie creates findings for credit card numbers, United States SSNs, and names, as shown in Figure 4.

Figure 4: Macie job scan without allow list results

Figure 4: Macie job scan without allow list results

Figure 5 shows a sensitive data discovery job that does include the use of a predefined text allow lists.

Figure 5: Macie job example with allow list configured

Figure 5: Macie job example with allow list configured

Because we have configured an allow list for this job, Macie creates no findings for credit card numbers, United States SSNs, and names. Figure 6 shows the lack of findings.

Figure 6: Macie job results with allow list configured

Figure 6: Macie job results with allow list configured

Conclusion

In this post, we walked through how to create, manage, and use Macie allow lists with your Macie jobs. Reducing Macie false-positive findings can help your security team to efficiently identify and protect sensitive data within your AWS environment.

Now that we’ve showed you how to create an allow list in Macie, you can use this feature to tailor Macie in your AWS environment, based on your use cases and workloads. After you’ve reduced the false positives in your environment, you can start looking at how to add in automation to respond to Macie findings with allow lists configured.

Try implementing the solution in this blog post for auto-remediation behavior based on finding type and finding severity. Alternatively, since Macie is automatically integrated with AWS Security Hub, you could implement this automated solution to respond to Macie findings by using by Security Hub custom actions.

If you have feedback about this post, submit comments in the Comments section below. If you have questions about this post, contact AWS Support.

Want more AWS Security news? Follow us on Twitter.

Jonathan Nguyen

Jonathan Nguyen

Jonathan is a Shared Delivery Team Senior Security Consultant at AWS. His background is in AWS Security with a focus on threat detection and incident response. Today, he helps enterprise customers develop a comprehensive security strategy and deploy security solutions at scale, and he trains customers on AWS Security best practices.

Ajay Rawat

Ajay Rawat

Ajay is a Security Consultant in a shared delivery team at AWS. He is a technology enthusiast who enjoys working with customers to solve their technical challenges and to improve their security posture in the cloud.

How to subscribe to the new Security Hub Announcements topic for Amazon SNS

Post Syndicated from Mike Saintcross original https://aws.amazon.com/blogs/security/how-to-subscribe-to-the-new-security-hub-announcements-topic-for-amazon-sns/

With AWS Security Hub you are able to manage your security posture in AWS, perform security best practice checks, aggregate alerts, and automate remediation. Now you are able to use Amazon Simple Notification Service (Amazon SNS) to subscribe to the new Security Hub Announcements topic to receive updates about new Security Hub services and features, newly supported standards and controls, and other Security Hub changes.

Introducing the Security Hub Announcements topic

Amazon SNS follows the publish/subscribe (pub/sub) messaging model, in which notifications are delivered to you by using a push mechanism that eliminates the need for you to periodically check or poll for new information and updates. You can now use this push mechanism to receive notifications about Security Hub by subscribing to the dedicated Security Hub Announcements topic.

The Security Hub Announcements topic publishes the following types of notifications:

  • General notifications
  • Upcoming standards and controls
  • New AWS Regions supported
  • New standards and controls
  • Updated standards and controls
  • Retired standards and controls
  • Updates to the AWS Security Finding Format (ASFF)
  • New integrations
  • New features
  • Changes to existing features

How to use the Security Hub Announcements topic

You can subscribe to the SNS topic for Security Hub Announcements to receive notification messages about newly released finding types, updates to the existing finding types, and other functionality changes. By subscribing to the SNS topic, you will receive Security Hub Announcements messages as soon as they are published. The notifications are available in all protocols that Amazon SNS supports, such as email and SMS. For more information about supported protocols in Amazon SNS, see Subscribing to an Amazon SNS topic.

The Security Hub Announcements topic is available in all AWS Regions in the aws and aws-cn partitions, but is not yet available in the AWS GovCloud (US) Regions (the aws-us-gov partition). Later in this post, we’ll show you how to subscribe to the Security Hub Announcements topic in a specific AWS Region by using the topic Amazon Resource Name (ARN) for that Region. The SNS topic messages are the same across Regions in a partition, so you can choose to subscribe to only one Region in a partition to avoid receiving duplicate information.

However, if you want to invoke an AWS Lambda function in reaction to a Security Hub Announcements message, you must subscribe to the topic ARN that is in the same Region as the Lambda function. The Lambda function can receive the SNS topic message payload as an input parameter and manipulate the information in the message, publish the message to other SNS topics, or send the message to other AWS services. For more information, see Subscribing a function to a topic in the Amazon SNS Developer Guide.

The same is true if you want to subscribe an Amazon Simple Queue Service (Amazon SQS) queue to the Security Hub Announcements topic, you must use a topic ARN that is in the same Region as the SQS queue. The SQS queue can be used to persist announcement SNS topic messages in the queue for other applications to process at a later time. For more information, see Subscribing an Amazon SQS queue to an Amazon SNS topic in the Amazon SQS Developer Guide.

IAM permissions

Your user account must have sns::subscribe AWS Identity and Access Management (IAM) permissions to subscribe to an SNS topic. For more information on IAM permissions for Amazon SNS, see Using identity-based policies with Amazon SNS.

Subscribe to the Security Hub Announcements topic

The following is the list of Security Hub Announcements topic ARNs for each currently supported Region. The examples in this post use the US West (Oregon) Region (us-west-2), but you can update the procedures with one of the following ARNs to use a different supported Region.

Security Hub Announcements topic ARNs by Region

arn:aws:sns:us-east-1:088139225913:SecurityHubAnnouncements
arn:aws:sns:us-east-2:291342846459:SecurityHubAnnouncements
arn:aws:sns:us-west-1:137690824926:SecurityHubAnnouncements
arn:aws:sns:us-west-2:393883065485:SecurityHubAnnouncements
arn:aws:sns:eu-central-1:871975303681:SecurityHubAnnouncements
arn:aws:sns:eu-north-1:191971010772:SecurityHubAnnouncements
arn:aws:sns:eu-south-1:151363035580:SecurityHubAnnouncements
arn:aws:sns:eu-west-1:705756202095:SecurityHubAnnouncements
arn:aws:sns:eu-west-2:883600840440:SecurityHubAnnouncements
arn:aws:sns:eu-west-3:313420042571:SecurityHubAnnouncements
arn:aws:sns:ca-central-1:137749997395:SecurityHubAnnouncements
arn:aws:sns:sa-east-1:359811883282:SecurityHubAnnouncements
arn:aws:sns:me-south-1:585146626860:SecurityHubAnnouncements
arn:aws:sns:af-south-1:463142546776:SecurityHubAnnouncements
arn:aws:sns:ap-northeast-1:592469075483:SecurityHubAnnouncements
arn:aws:sns:ap-northeast-2:374299265323:SecurityHubAnnouncements
arn:aws:sns:ap-northeast-3:633550238216:SecurityHubAnnouncements
arn:aws:sns:ap-southeast-1:512267288502:SecurityHubAnnouncements
arn:aws:sns:ap-southeast-2:475730049140:SecurityHubAnnouncements
arn:aws:sns:ap-southeast-3:627843640627:SecurityHubAnnouncements
arn:aws:sns:ap-east-1:464812404305:SecurityHubAnnouncements
arn:aws:sns:ap-south-1:707356269775:SecurityHubAnnouncements
arn:aws-cn:sns:cn-north-1:672341567257:SecurityHubAnnouncements
arn:aws-cn:sns:cn-northwest-1:672534482217:SecurityHubAnnouncements

The two procedures that follow show you how to subscribe an email address to the Security Hub Announcements topic by using the AWS Management Console and the AWS CLI.

To subscribe an email address to the Security Hub Announcements topic (console)

  1. Sign in to the Amazon SNS console.
  2. In the Region list, choose the same Region as the topic ARN to which you want to subscribe. This example uses the us-west-2 Region.
  3. In the left navigation pane, choose Subscriptions, then choose Create subscription.
  4. In the Create subscription dialog box, do the following:
    • For Topic ARN, paste the following topic ARN for the us-west-2 Region, or use one of the ARNs listed above for a different supported Region:

      arn:aws:sns:us-west-2:393883065485:SecurityHubAnnouncements

    • For Protocol, choose Email.
    • For Endpoint, enter an email address that you can use to receive the notification.
  5. Choose Create subscription.
  6. In your email application, open the message from AWS Notifications and open the link to confirm your subscription. Your web browser displays a confirmation response from Amazon SNS, similar to that shown in Figure 1.

    Figure 1: SNS notification subscription confirmation

    Figure 1: SNS notification subscription confirmation

The following steps show you how to subscribe an email address to the Security Hub Announcements topic by using the AWS Command Line Interface (AWS CLI).

To subscribe an email address to the Security Hub Announcements topic (AWS CLI)

  1. Run the following command in the AWS CLI, replacing <[email protected]> with your email address, and optionally replacing the ARN and reference to us-west-2 if you want to use a different Region:
    aws sns --region us-west-2 subscribe --topic-arn arn:aws:sns:us-west-2:393883065485:SecurityHubAnnouncements --protocol email --notification-endpoint <[email protected]>
  2. In your email application, open the message from AWS Notifications and open the link to confirm your subscription.
  3. Your web browser displays a confirmation response from Amazon SNS, similar to that shown in Figure 1.

Example subscription responses

The following sections contain examples of a message announcing new standard controls supported by Security Hub in email and sqs protocol types.

Example message from an email subscription (protocol type: email)

{"AnnouncementType":"NEW_STANDARDS_CONTROLS", “Title”:”[New Controls] 36 new Security Hub controls added to the AWS Foundational Security Best Practices standard”, "Description":"We have added 36 new controls to the AWS Foundational Security Best Practices standard. These include controls for Amazon Auto Scaling (AutoScaling.3, AutoScaling.4, AutoScaling.6), AWS CloudFormation (CloudFormation.1), Amazon CloudFront (CloudFront.10), Amazon Elastic Compute Cloud (Amazon EC2) (EC2.23, EC2.24, EC2.27), Amazon Elastic Container Registry (Amazon ECR) (ECR.1, ECR.2), Amazon Elastic Container Service (Amazon ECS) (ECS.3, ECS.4, ECS.5, ECS.8, ECS.10, ECS.12), Amazon Elastic File System (Amazon EFS) (EFS.3, EFS.4), Amazon Elastic Kubernetes Service (Amazon EKS) (EKS.2), Elastic Load Balancing (ELB.12, ELB.13, ELB.14), Amazon Kinesis (Kinesis.1), AWS Network Firewall (NetworkFirewall.3, NetworkFirewall.4, NetworkFirewall.5), Amazon OpenSearch Service (Opensearch.7), Amazon Redshift (Redshift.9), Amazon Simple Storage Service (Amazon S3) (S3.13), Amazon Simple Notification Service (SNS.2), AWF WAF (WAF.2, WAF.3, WAF.4, WAF.6, WAF.7, WAF.8). If you enabled the AWS Foundational Security Best Practices standard in an account and configured Security Hub to automatically enable new controls, these controls are enabled by default. Availability of controls can vary by Region."}

Example message from an SQS queue subscription (protocol type: sqs)

The following message shows the additional metadata included with an SQS subscription to the Security Hub Announcements topic. For more information about the metadata included in an SNS topic message delivered to an SQS queue, see Fanout to Amazon SQS Queues.

{
  "Type" : "Notification",
  "MessageId" : "c9c03e46-69df-5c3c-84e9-6520708ac394",
  "TopicArn" : "arn:aws:sns:us-west-2:393883065485:SecurityHubAnnouncements",
  "Message" : "{\"AnnouncementType\":\"NEW_STANDARDS_CONTROLS\",\"Title\":\"[New Controls] 36 new Security Hub controls added to the AWS Foundational Security Best Practices standard\",\"Description\":\"We have added 36 new controls to the AWS Foundational Security Best Practices standard. These include controls for Amazon Auto Scaling (AutoScaling.3, AutoScaling.4, AutoScaling.6), AWS CloudFormation (CloudFormation.1), Amazon CloudFront (CloudFront.10), Amazon Elastic Compute Cloud (Amazon EC2) (EC2.23, EC2.24, EC2.27), Amazon Elastic Container Registry (Amazon ECR) (ECR.1, ECR.2), Amazon Elastic Container Service (Amazon ECS) (ECS.3, ECS.4, ECS.5, ECS.8, ECS.10, ECS.12), Amazon Elastic File System (Amazon EFS) (EFS.3, EFS.4), Amazon Elastic Kubernetes Service (Amazon EKS) (EKS.2), Elastic Load Balancing (ELB.12, ELB.13, ELB.14), Amazon Kinesis (Kinesis.1), AWS Network Firewall (NetworkFirewall.3, NetworkFirewall.4, NetworkFirewall.5), Amazon OpenSearch Service (Opensearch.7), Amazon Redshift (Redshift.9), Amazon Simple Storage Service (Amazon S3) (S3.13), Amazon Simple Notification Service (SNS.2), AWF WAF (WAF.2, WAF.3, WAF.4, WAF.6, WAF.7, WAF.8). If you enabled the AWS Foundational Security Best Practices standard in an account and configured Security Hub to automatically enable new controls, these controls are enabled by default. Availability of controls can vary by Region. \"}",
  "Timestamp" : "2022-08-04T18:59:33.319Z",
  "SignatureVersion" : "1",
  "Signature" : "GdKokPEUexpKZn5da5u/p5eZF1cE3JUyL0uPVKmPnDzd3orkk5jJ211VsOflUFi6V9lSXF/V6RBpQN/9f3+JBFBprng7BRQwT9I4jSa1xOn1L3xKXEVGvWI6nl1oDqBl21Pj3owV+NZ+Exd2W0dpgg8B1LG4bYq5T73MjHjWGtelcBa15TpIz/+rynqanXCKCvc/50V/XZLjA5M7gU6Dzs9CULIjkdEpCsw5FvSxbtkEd6Ktx4LH7Zq6FlPKNli3EaEHRKh9uYPo6sR/yvF4RWg3E9O4dVsK7A8uTdR+pwVCU1M601KMRxO1OWF8VIdvyPINJND8Nu/70GRA2L+MRA==",
  "SigningCertURL" : "https://sns.us-west-2.amazonaws.com/SimpleNotificationService-56e67fcb41f6fec09b0196692625d385.pem",
  "UnsubscribeURL" : "https://sns.us-west-2.amazonaws.com/?Action=Unsubscribe&SubscriptionArn=arn:aws:sns:us-west-2:393883065485:SecurityHubAnnouncements:1eb29a83-8726-4366-891c-293ad5e35a53"
}

Note: You need to set up the SQS access policy in order for SNS to push message to the SNS queue. For more information, see Basic examples of Amazon SQS policies.

Available now

The SNS topic for Security Hub Announcements is available today in the Regions described in this post. Subscribe now to stay informed of Security Hub updates. With Amazon SNS, there is no minimum fee, and you pay only for what you use. For more information, see the Amazon SNS pricing page.

If you have feedback about this post, submit comments in the Comments section below. If you have questions about this post, contact AWS Support. You can also start a new thread on AWS Security Hub re:Post to get answers from the community.

Want more AWS Security news? Follow us on Twitter.

Mike Saintcross

Mike Saintcross

Mike Saintcross is a Security Consultant at AWS helping enterprise customers achieve their cloud security goals in an ever-changing threat landscape. His background is in Security Engineering with a focus on deep packet inspection, incident response, security orchestration, and automation.

Neha Joshi

Neha Joshi

Neha Joshi is a Senior Solutions Architect at AWS. She loves to brainstorm and develop solutions to help customers be successful on AWS. Outside of work, she enjoys hiking and audio books.

Enable federation to Amazon QuickSight accounts with Ping One

Post Syndicated from Srikanth Baheti original https://aws.amazon.com/blogs/big-data/enable-federation-to-amazon-quicksight-accounts-with-ping-one/

Amazon QuickSight is a scalable, serverless, embeddable, machine learning (ML)-powered business intelligence (BI) service built for the cloud that supports identity federation in both Standard and Enterprise editions. Organizations are working towards centralizing their identity and access strategy across all of their applications, including on-premises, third-party, and applications on AWS. Many organizations use Ping One to control and manage user authentication and authorization centrally. If your organization uses Ping One for cloud applications, you can enable federation to all of your QuickSight accounts without needing to create and manage users in QuickSight. This authorizes users to access QuickSight assets—analyses, dashboards, folders, and datasets—through centrally managed Ping One.

In this post, we go through the steps to configure federated single sign-on (SSO) between a Ping One instance and a QuickSight account. We demonstrate registering an SSO application in Ping One, creating groups, and mapping to an AWS Identity and Access Management (IAM) role that translates to QuickSight user license types (admin, author, and reader). These QuickSight roles represent three different personas supported in QuickSight. Administrators can publish the QuickSight app in Ping One to enable users to perform SSO to QuickSight using their Ping credentials.

Prerequisites

To complete this walkthrough, you must have the following prerequisites:

  • A Ping One subscription
  • One or more QuickSight account subscriptions

Solution overview

The walkthrough includes the following steps:

  1. Create groups in Ping One for each of the QuickSight user license types.
  2. Register an AWS application in Ping One.
  3. Add Ping One as your SAML identity provider (IdP) in AWS.
  4. Configure an IAM policy.
  5. Configure an IAM role.
  6. Configure your AWS application in Ping One.
  7. Test the application from Ping One.

Create groups in Ping One for each of the QuickSight roles

To create groups in Ping One, complete the following steps:

  1. Sign in to the Ping One portal using an administrator account.
  2. Under Identities, choose Groups.
  3. Choose the plus sign to add a group.
    BDB-2210-Ping-Groups
  4. For Group Name, enter QuickSightReaders.
  5. Choose Save.
    BDB-2210-Ping-Groups-Save
  6. Repeat these steps to create the groups QuickSightAdmins and QuickSightAuthors.

Register an AWS application in Ping One

To configure the integration of an AWS application in Ping One, you need to add AWS to your list of managed software as a service (SaaS) apps.

  1. Sign in to the Ping One portal using an administrator account.
  2. Under Connections, choose Application Catalog.
  3. In the search box, enter amazon web services.
  4. Choose Amazon Web Services – AWS from the results to add the application.  BDB-2210-Ping-AWS-APP
  5. For Name, enter Amazon QuickSight.
  6. Choose Next.
    BDB-2210-Ping-AWS-SAVEUnder Map Attributes, there should be four attributes.
  7. Delete the attribute related to SessionDuration.
  8. Choose Username as the value for all the remaining attributes for now.
    We update these values in later steps.
  9. Choose Next.
    BDB-2210-Ping-AWS-Attributes
  10. In the Select Groups section, add the QuickSightAdmins, QuickSightAuthors, and QuickSightReaders groups you created.
  11. Choose Save.
    BDB-2210-Ping-AWS-Attributes-Save
  12. After the application is created, choose the application again and download the federation metadata XML.

You use this in the next step.
BDB-2210-Ping-AWS-Metadata

Add Ping One as your SAML IdP in AWS

To configure Ping One as your SAML IdP, complete the following steps:

  1. Open a new tab in your browser.
  2. Sign in to the IAM console in your AWS account with admin permissions.
  3. On the IAM console, under Access Management in the navigation pane, choose Identity providers.
  4. Choose Add provider.
    BDB-2210-Ping-AWS-IAM
  5. For Provider name, enter PingOne.
  6. Choose file to upload the metadata document you downloaded earlier.
  7. Choose Add provider.
  8. In the banner message that appears, choose View provider.
  9. Copy the IdP ARN to use in a later step.
    BDB-2210-Ping-AWS-IAM_ARN

Configure an IAM policy

In this step, you create an IAM policy to map three different roles with permissions in QuickSight.

Use the following steps to set up QuickSightUserCreationPolicy. This policy grants privileges in QuickSight to the federated user based on the assigned groups in Ping One.

  1. On the IAM console, choose Policies.
  2. Choose Create policy.
  3. On the JSON tab, replace the existing text with the following code:
    {
       "Version": "2012-10-17",
        "Statement": [ 
             {  
                "Sid": "VisualEditor0", 
                 "Effect": "Allow", 
                 "Action": "quicksight:CreateAdmin", 
                 "Resource": "*", 
                 "Condition": { 
                     "StringEquals": { 
                         "aws:PrincipalTag/user-role": "QuickSightAdmins" 
     
                    } 
                 } 
             }, 
             { 
                 "Sid": "VisualEditor1", 
                 "Effect": "Allow", 
                 "Action": "quicksight:CreateUser", 
                 "Resource": "*", 
                 "Condition": { 
                     "StringEquals": { 
                         "aws:PrincipalTag/user-role": "QuickSightAuthors" 
                     } 
                 } 
             }, 
             { 
                 "Sid": "VisualEditor2", 
                 "Effect": "Allow", 
                 "Action": "quicksight:CreateReader", 
                 "Resource": "*", 
                 "Condition": { 
                     "StringEquals": { 
                         "aws:PrincipalTag/user-role": "QuickSightReaders" 
                     } 
                 } 
             } 
         ] 
     } 
  4. Choose Review policy.
    BDB-2210-AWS-IAM-Policy
  5. For Name, enter QuickSightUserCreationPolicy.
    BDB-2210-AWS-IAM-Policy-Save
  6. Choose Create policy.

Configure an IAM role

Next, create the role that Ping One users assume when federating into QuickSight. Use the following steps to set up the federated role:

  1. On the IAM console, choose Roles.
  2. Choose Create role.
  3. For Trusted entity type, select SAML 2.0 federation.
  4. For SAML 2.0-based provider, choose the provider you created earlier (PingOne).
  5. Select Allow programmatic and AWS Management Console access.
  6. For Attribute, choose SAML:aud.
  7. For Value, enter https://signin.aws.amazon.com/saml.
  8. Choose Next.
    BDB-2210-Ping-IAM-Role
  9. Under Permissions policies, select the QuickSightUserCreationPolicy IAM policy you created in the previous step.
  10. Choose Next.
    BDB-2210-Ping-IAM-Role_Permissions
  11. For Role name, enter QSPingOneFederationRole.
    DBD-2210-PingOne-IAM-Role-Name
  12. Choose Create role.
  13. On the IAM console, in the navigation pane, choose Roles.
  14. Choose the QSPingOneFederationRole role you created to open the role’s properties.
  15. Copy the role ARN to use in later steps.
  16. On the Trust relationships tab, under Trusted entities, verify that the IdP you created is listed.
  17. Under Condition in the policy code, verify that SAML:aud with a value of https://signin.aws.amazon.com/saml is present.
  18. Choose Edit trust policy to add an additional condition.
    DBD-2210-PingOne-IAM-TrustPolicy
  19. Under Condition, add the following code:
    "StringLike": {
    "aws:RequestTag/user-role": "*"
    }

  20. Under Action, add the following code:
      "sts:TagSession"

    BDB-2210-PingOne-Role-Save

  21. Choose Update policy to save changes.

Configure an AWS application in Ping One

To configure your AWS application, complete the following steps:

  1. Sign in to the Ping One portal using a Ping One administrator account.
  2. Under Connections, choose Application.
  3. Choose the Amazon QuickSight application you created earlier.
  4. On the Profile tab, choose Enable Advanced ConfigurationBDB-2210-Ping-AdvancedConfig
  5. Choose Enable in the pop-up window.
    BDB-2210-Ping-AdvancedConfig1
  6. On the Configuration tab, choose the pencil icon to edit the configuration.
    BDB-2210-Ping-AdvancedConfig2
  7. Under SIGNING KEY, select Sign Assertion & Response.
    BDB-2210-Ping-AdvancedConfig4
  8. Under SLO BINDING, for Assertion Validity Duration In Seconds, enter a duration, such as 900.
  9. For Target Application URL, enter https://quicksight.aws.amazon.com/.
  10. Choose Save.
    BDB-2210-Ping-AdvancedConfig5On the Attribute Mappings tab, you now add or update the attributes as in the following table.
Attribute Name Value
saml_subject Username
https://aws.amazon.com/SAML/Attributes/RoleSessionName Username
https://aws.amazon.com/SAML/Attributes/Role ‘arn:aws:iam::xxxxxxxxxx:role/QSPingOneFederationRole,
arn:aws:iam::xxxxxxxxxx:saml-provider/PingOne’
https://aws.amazon.com/SAML/Attributes/PrincipalTag:user-role user.memberOfGroupNames[0]
  1. Enter https://aws.amazon.com/SAML/Attributes/PrincipalTag:user-role for the attribute name and use the corresponding value from the table for the expression.
  2. Choose Save.
  3. If you have more than one QuickSight user role (for this post, QuickSightAdmins, QuicksightAuthors, and QuickSightReaders), you can add all the appropriate role names as follows:
    #data.containsAny(user.memberOfGroupNames,{'QuickSightAdmins'})? 'QuickSightAdmins' : 
    
    #data.containsAny(user.memberOfGroupNames,{'QuickSightAuthorss'}) ? 'QuickSightAuthors' : 
    
    #data.containsAny(user.memberOfGroupNames,{'QuickSightReaders'}) ?'QuickSightReaders' : null

  4. To edit the role attribute, choose the gear icon next to the role.
  5. Populate the corresponding expression from the table and choose Save.

The format of the expression is the role ARN (copied in the role creation step) followed by the IdP ARN (copied in the IdP creation step) separated by a comma.

Test the application

In this section, you test your Ping One SSO configuration by using a Microsoft application.

  1. In the Ping One portal, under Identities, choose Groups.
  2. Choose a group and choose Add Users Individually.
  3. From the list of users, add the appropriate users to the group by choosing the plus sign.
  4. Choose Save.
  5. To test the connectivity, under Environment, choose Properties, then copy the URL under APPLICATION PORTAL URL.
  6. Browse to the URL in a private browsing window.
  7. Enter your user credentials and choose Sign On.
    Upon a successful sign-in, you’re redirected to the All Applications page with a new application called Amazon QuickSight.
  8. Choose the Amazon QuickSight application to be redirected to the QuickSight console.

Note in the following screenshot that the user name at the top of the page shows as the Ping One federated user.

Summary

This post provided step-by-step instructions to configure federated SSO between Ping One and the QuickSight console. We also discussed how to create policies and roles in IAM and map groups in Ping One to IAM roles for secure access to the QuickSight console.

For additional discussions and help getting answers to your questions, check out the QuickSight Community.


About the authors

Srikanth Baheti is a Specialized World Wide Sr. Solution Architect for Amazon QuickSight. He started his career as a consultant and worked for multiple private and government organizations. Later he worked for PerkinElmer Health and Sciences & eResearch Technology Inc, where he was responsible for designing and developing high traffic web applications, highly scalable and maintainable data pipelines for reporting platforms using AWS services and Serverless computing.

Raji Sivasubramaniam is a Sr. Solutions Architect at AWS, focusing on Analytics. Raji is specialized in architecting end-to-end Enterprise Data Management, Business Intelligence and Analytics solutions for Fortune 500 and Fortune 100 companies across the globe. She has in-depth experience in integrated healthcare data and analytics with wide variety of healthcare datasets including managed market, physician targeting and patient analytics.

Raj Jayaraman is a Senior Specialist Solutions Architect for Amazon QuickSight. Raj focuses on helping customers develop sample dashboards, embed analytics and adopt BI design patterns and best practices.

Easily protect your AWS CDK-defined infrastructure with AWS WAFv2

Post Syndicated from Ramon Lopez Narvaez original https://aws.amazon.com/blogs/devops/easily-protect-your-aws-cdk-defined-infrastructure-with-aws-wafv2/

Security is a shared responsibility between AWS and the customer. When we use infrastructure as code (IaC) we want to describe workloads wholistically, and that includes the configuration of firewalls alongside the entrypoints to web applications. As we evolve the infrastructure that our application is built upon, we can adjust firewall rules in the same place.

In this post, you’ll learn how you can easily add a layer of protection to your web application that is defined in AWS Cloud Development Kit (AWS CDK) and built using Amazon CloudFront, Amazon API Gateway, Application Load Balancer, or AWS AppSync.

To accomplish this, we’ll use AWS WAFv2. Although it’s usually complex to write your own firewall rules, we can simply use AWS Managed Rules. No tedious setup required!

What is AWS WAFv2?

AWS WAFv2 is a managed web application firewall. It can be natively enabled on CloudFront, API Gateway, Application Load Balancer, or AWS AppSync and is deployed alongside these services. AWS services terminate the TCP/TLS connection, process incoming HTTP requests, and then pass the request to AWS WAF for inspection and filtering.

For example, you can use AWS WAFv2 to protect against attacks, such as cross-site request forgery (CSRF), cross-site scripting (XSS), and SQL injection (SQLi) among other threats in the OWASP Top 10.

AWS Managed Rules for AWS WAF is a set of AWS WAF rules curated and maintained by the AWS Threat Research Team that provides protection against common application vulnerabilities or other unwanted traffic, without having to write your own rules.

Prerequisites

For this walkthrough, you should have the following prerequisites:

  • An AWS account
  • An application fronted by one or more of the following services: Amazon Cloudfront, Amazon API Gateway, Application Load Balancer or AWS AppSync. From here on these are called ‘entrypoint’.
  • At least the above mentioned ‘entrypoint’ defined in AWS CDK.

Solution overview

When AWS WAF is applied to Amazon CloudFront, Amazon API Gateway, Application Load Balancer, or AWS AppSync, it inspects and filters requests before they’re forwarded to your compute infrastructure.

Figure 1. AWS WAFv2 can protect endpoints built by Amazon CloudFront, Amazon API Gateway, Application Load Balancer and AWS AppSync

Given that you have an existing web application defined in AWS CDK, we want to add a WAFv2 web ACL to its entrypoint. Instead of writing our own firewall rules to inspect and filter requests, we want to leverage an AWS Managed Rules rule group. Simultaneously, we must be able to disable or reconfigure some of the rules in the case that they cause undesirable behavior in the application.

A good first rule group to use is the core rule set (CRS) managed rule group, also named AWSManagedRulesCommonRuleSet. It contains rules that are generally applicable to web applications and provides protection against exploitation of various vulnerabilities, such as the ones described in the OWASP Top 10. You can later add more managed rule groups or write your own rules, which are specific to your application (e.g., for Windows, Linux, or WordPress).

Define the AWS WAFv2 web ACL

First, let’s give the AWS WAF module a nicely readable name:

import { aws_wafv2 as wafv2 } from 'aws-cdk-lib';

Then, we define the AWS WAFv2 web ACL in AWS CDK:

const cfnWebACL = new wafv2.CfnWebACL(this,'MyCDKWebAcl'
      defaultAction: {
        allow: {}
      },
      scope: 'REGIONAL',
      visibilityConfig: {
        cloudWatchMetricsEnabled: true,
        metricName:'MetricForWebACLCDK',
        sampledRequestsEnabled: true,
      },
      name:‘MyCDKWebAcl’,
      rules: [{
        name: 'CRSRule',
        priority: 0,
        statement: {
          managedRuleGroupStatement: {
            name:'AWSManagedRulesCommonRuleSet',
            vendorName:'AWS'
          }
        },
        visibilityConfig: {
          cloudWatchMetricsEnabled: true,
          metricName:'MetricForWebACLCDK-CRS',
          sampledRequestsEnabled: true,
        },
        overrideAction: {
          none: {}
        },
      }]
    });

The highlighted line references the CRS managed rule group as one Rule in the list. You could add more Rule elements, either referencing the managed rule groups or custom rules.

Note the scope attribute. If you want to attach this web ACL to an API Gateway, AWS AppSync API, or Application Load Balancer, then it will be REGIONAL. If you want to attach it to a CloudFront distribution, then make sure that your AWS WAFv2 web ACL is defined in the US East (N. Virginia) Region and the scope is CLOUDFRONT.

Attach the AWS WAFv2 web ACL to an Application Load Balancer, AWS AppSync API, or API Gateway

Now that we have a web ACL defined, we must attach it to a resource. This works exactly the same across API Gateway API’s, an AWS AppSync API, or an Application Load Balancer. We must create a CfnWebACLAssociation and point it to the previously created web ACL and the resource to protect:

const cfnWebACLAssociation = new wafv2.CfnWebACLAssociation(this,'MyCDKWebACLAssociation', {
      resourceArn:<ARN of resource to protect>,
      webAclArn:cfnWebACL.attrArn,
    });

Amazon Resource Names (ARNs) uniquely identify AWS resources. The highlighted line shows how AWS CDK lets you get the ARN of the previously defined CfnWebAcl.

Depending on what type of service you’re using, jump to one of the three following sections to learn how to retrieve the resourceArn of API Gateway, AWS AppSync, or Application Load Balancers.

Retrieving ARN for AWS AppSync API’s

To retrieve the ARN of an AWS AppSync API, call the .arn property:

const api = new appsync.GraphqlApi(…)
const cfnWebACLAssociation = new wafv2.CfnWebACLAssociation(this,'MyCDKWebACLAssociation', {
      resourceArn:api.arn,
      webAclArn: cfnWebACL.attrArn,
    });

Retrieving ARN for Amazon API Gateway REST API’s

In this case, we must specify which stage of the REST API we want to protect with the web ACL. Then, we reference the ARN of the stage:

const api = new apigateway.RestApi(…)
const deployment = new apigateway.Deployment(…)
const stage = apigateway.Stage(…)
const cfnWebACLAssociation = new wafv2.CfnWebACLAssociation(this,'MyCDKWebACLAssociation', {
      resourceArn:stage.stageArn,
      webAclArn: cfnWebACL.attrArn,
    });

Retrieving ARN for Application Load Balancers

If you’re dealing with an Application Load Balancer, then this is how you can retrieve its ARN:

const lb = new elbv2.ApplicationLoadBalancer(…)

const cfnWebACLAssociation = new wafv2.CfnWebACLAssociation(this,'MyCDKWebACLAssociation', {
      resourceArn:lb.loadBalancerArn,
      webAclArn: cfnWebACL.attrArn,
    });

Attach the AWS WAFv2 web ACL to a CloudFront distribution

Attaching a web ACL to CloudFront follows a different approach. Instead of defining a cfnWebACLAssociation, we reference the web ACL inside of the Distribution definition:

const distribution = new cloudfront.Distribution(this,'distro', {
      defaultBehavior: {
        origin: new origins.S3Origin(s3Bucket)
      },
     webAclId:cfnWebACL.attrArn
    });

Note that even though the property is called webAclId, because we’re using AWS WAFv2, we must supply the ARN of the web ACL.

Exclude rules from the web ACL

Lastly, let’s understand how we can customize the web ACL further. If a rule of the managed rule group causes undesired behavior in the application, then we can exclude it from the webACL. Assume that we want to exclude the SizeRestrictions_BODY rule, which limits the request body size to 8 KB.

Go back to the definition of the web ACL, and add the highlighted lines:

const cfnWebACL = new wafv2.CfnWebACL(this, 'MyCDKWebAcl', {
      defaultAction: {
        allow: {}
      },
      scope:'REGIONAL',
      visibilityConfig: {
        cloudWatchMetricsEnabled: true,
        metricName:'MetricForWebACLCDK',
        sampledRequestsEnabled: true,
      },
      name:'MyCDKWebAcl',
      rules: [{
        name:'CRSRule',
        priority: 0,
        statement: {
          managedRuleGroupStatement: {
            name: 'AWSManagedRulesCommonRuleSet',
            vendorName: 'AWS',
            excludedRules: [{
             ‘SizeRestrictions_BODY’ }]
          }
        },
        visibilityConfig: {
          cloudWatchMetricsEnabled: true,
          metricName:'MetricForWebACLCDK-CRS',
          sampledRequestsEnabled: true,
        },
        overrideAction: {
          none: {}
        },
      }]

    });

Other customizations you can do include pinning the version of the rule group and narrowing the scope of the request that the rule evaluates, using Scope-down statements.

Conclusion

In this post, you’ve seen how an AWS WAFv2 web ACL can be added to your existing infrastructure defined in AWS CDK. By using Managed Rules, your application benefits from a layer of protection that is curated and maintained by AWS security experts.

As a next step, you can learn how to include AWS WAFv2 metrics from Amazon CloudWatch into your application dashboards. This will give you perspective on how your web application is performing in conjunction with the AWS WAFv2 web ACL.

To learn more about AWS WAFv2 and how to manage web ACL’s, check out the official developer guide.

About the author:

Ramon Lopez

Ramon is a Senior Solutions Architect at AWS, where he guides, educates, and empowers customers of all sizes and industries to build successful businesses in the AWS cloud. He also built web services for 150+ million Amazon Prime customers and led a team of software engineers in a fast-paced global environment. After being immersed in one of the largest micro-service environments, he is a believer in the DevOps mantra of “You build it, you run it”.

Diving Deep into EC2 Spot Instance Cost and Operational Practices

Post Syndicated from Sheila Busser original https://aws.amazon.com/blogs/compute/diving-deep-into-ec2-spot-instance-cost-and-operational-practices/

This blog post is written by, Sudhi Bhat, Senior Specialist SA, Flexible Compute.

Amazon EC2 Spot Instances are one of the popular choices among customers looking to cost optimize their workload running on AWS. Spot Instances let you take advantage of unused Amazon Elastic Compute Cloud (Amazon EC2) capacity in the AWS cloud and are available at up to a 90% discount compared to On-Demand EC2 instance prices. The key difference between On-Demand Instances and Spot Instances is that Spot Instances can be interrupted by Amazon EC2, with two minutes of notification, when Amazon EC2 needs the capacity back. Spot Instances are recommended for various stateless, fault-tolerant, or flexible applications, such as big data, containerized workloads, continuous integration/continuous development (CI/CD), web servers, high-performance computing (HPC), and test and development workloads.

Customers asked us for fast and easy ways to track and optimize usage for different services. In this post, we’ll focus on tools and techniques that can provide useful insights into the usages and behavior of workloads using Spot Instances, as well as how we can leverage those techniques for troubleshooting and cost tracking purposes.

Operational tools

Instance selection

One of the best practices while using Spot Instances is to be flexible about instance types, Regions, and Availability Zones, as this gives Spot a better cross-section of compute pools to select and allocate your desired capacity. AWS makes it easier to diversify your instance selection in Auto Scaling groups and EC2 Fleet through features like Attribute-Based Instance Type Selection, where you can select the instance requirements as a set of attributes like vCPU, memory, storage, etc. These requirements are translated into matching instance types automatically.

Instance Selection using Attribute Based Instance Selection feature available during Auto Scaling Group creation

Considering that AWS Cloud spans across 25+ Regions and 80+ Availability Zones, finding the optimal location (either a Region or Availability Zone) to fulfil Spot capacity needs without launching a Spot can be very handy. This is especially true when AWS customers have the flexibility to run their workloads across multiple Regions or Availability Zones. This functionality can be achieved with one of the newer features called Amazon EC2 Spot placement score. Spot placement score provides a list of Regions or Availability Zones, each scored from 1 to 10, based on factors such as the requested instance types, target capacity, historical and current Spot usage trends, and the time of the request. The score reflects the likelihood of success when provisioning Spot capacity, with a 10 meaning that the request is highly likely to succeed.

Spot Placement Score feature is available in EC2 Dashboard

If you wish to specifically select and match your instances to your workloads to leverage them, then refer to Spot Instance Advisor to determine Spot Instances that meet your computing requirements with their relative discounts and associated interruption rates. Spot Instance Advisor populates the frequency of interruption and average savings over On-Demand instances based on the last 30 days of historical data. However, note that the past interruption behavior doesn’t predict the future availability of these instances. Therefore, as a part of instance diversity, try to leverage as many instances as possible regardless of whether or not an instance has a high level of interruptions.

Spot Instance pricing history

Understanding the price history for a specific Amazon EC2 Spot Instance can be useful during instance selection. However, tracking these pricing changes can be complex. Since November 2017, AWS launched a new pricing model that simplified the Spot purchasing experience. The new model gives AWS Customers predictable prices that adjust slowly over days and weeks, as Spot Instance prices are now determined based on long-term trends in supply and demand for Spot Instance capacity. The current Spot Instance prices can be viewed on AWS website, and the Spot Instance pricing history can be viewed on the Amazon EC2 console or accessed via AWS Command Line Interface (AWS CLI). Customers can continue to access the Spot price history for the last 90 days, filtering by instance type, operating system, and Availability Zone to understand how the Spot pricing has changed.

Spot Pricing History is available in EC2 DashboardAccessing Pricing history via AWS CLI using describe-spot-price-history or Get-EC2SpotPriceHistory (AWS Tools for Windows PowerShell).

aws ec2 describe-spot-price-history --start-time 2018-05-06T07:08:09 --end-time 2018-05-06T08:08:09 --instance-types c4.2xlarge --availability-zone eu-west-1a --product-description "Linux/UNIX (Amazon VPC)“
{
    "SpotPriceHistory": [
        {
            "Timestamp": "2018-05-06T06:30:30.000Z",
            "AvailabilityZone": "eu-west-1a",
            "InstanceType": "c4.2xlarge",
            "ProductDescription": "Linux/UNIX (Amazon VPC)",
            "SpotPrice": "0.122300"
        }
    ]
}

Spot Instance data feed

EC2 offers a mechanism to describe Spot Instance usage and pricing by providing a data feed that can be subscribed to. Therefore, the data feed is sent to an Amazon Simple Storage Service (Amazon S3) bucket on an hourly basis. Learn more about setting up the Spot Data feed and configuring the S3 bucket options in the documentation. A sample data feed would look like the following:

Sample Spot Instance data feed dataThe above example provides more information about Spot Instance in use, like m4.large Instance being used at the time as specified by Timestamp and MyBidID=sir-11wsgc6k representing the request that generated this instance usage, Charge=0.045 USD indicating the discounted price charged compared to the MyMaxPrice, which was set to On-Demand cost. This information can be useful during troubleshooting, as you can refer to the information about Spot Instances even if that specific instance has been terminated. Moreover, you could choose to extend the use of this data for simple querying and visualization/analytics purposes using Amazon Athena.

Amazon EC2 Spot Instance Interruption dashboard

Spot Instance interruptions are an inherent part of the Spot Instance lifecycle. For example, it’s always possible that your Spot Instance might be interrupted depending on how many unused EC2 instances are available. Therefore, you must make sure that your application is prepared for a Spot Instance interruption.

There are several best practices regarding handling Spot interruptions as described in the blog “Best practices for handling EC2 Spot Instance interruptions. Tracking Spot Instance interruptions can be useful in some scenarios, such as evaluating your workload for the tolerance for interruptions of a specific instance type, or to simply learn more about frequency of interruptions in your test environment so that you can fine-tune your instance selection. In these scenarios, you can use the EC2 Spot interruption dashboard, which is an opensource sample reference solution for logging Spot Instance interruptions. Spot Instance interruptions can fluctuate dynamically based on overall Spot Instance availability and demand for On-Demand Instances. However, it is important to note that tracking interruptions may not always represent the true Spot experience. Therefore, it’s recommended that this solution be used for those situations where Spot Instance interruptions inform a specific outcome, as it doesn’t accurately reflect system health or availability. It’s recommended to use this solution in dev/test environments to provide an educated view of how to use Spot Instances in production systems.

Open Source Solution available in github called Spot Interruption Dashboard for tracking Spot Interruption termination notices.

Cost management tools

AWS Pricing Calculator

AWS Pricing Calculator is a free tool that lets you create cost estimates for workloads that you run on AWS Services, including EC2 and Spot Instances. This calculator can greatly assist in calculating the cost of compute instances and estimating the future costs so that customers can compare the cost savings to be achieved before they even launch a Spot Instance as part of their solution. The AWS Pricing Calculator advanced estimate path offers six pricing strategies for Amazon EC2 instances. The pricing models include On-Demand, Reserved, Savings Plans, and Spot Instances. The estimates generated can also be exported to a CSV or PDF file format for quick sharing and additional analysis of the proposed architecture spend.

AWS Pricing Calculator support different types of workloadsFor Spot Instances, the calculator shows the historical average discount percentage for the instance chosen, and lets you enter a percentage discount for creating forecasts. We recommend choosing an instance type that best represents your target compute, memory, and network requirements for running your workload and generating an approximate estimate.

AWS Pricing Calculator Supports different type of EC2 Purchasing options, including EC2 Spot instances

AWS Cost Management

One of the popular reporting tools offered by AWS is AWS Cost Explorer, which has an easy-to-use interface that lets you visualize, understand, and manage your AWS costs and usage over time, including Spot Instances. You can view data up to the last 12 months, and forecast the next three months. You can use Cost Explorer filtered by “Purchase Options” to see patterns in how much you spend on Spot Instances over time, and see trends that you can use to understand your costs. Furthermore, you can specify time ranges for the data, and view time data by day or by month. Moreover, you can leverage the Amazon EC2 Instance Usage reports to gain insights into your instance usage and patterns, along with information that you need to optimize the overall EC2 use.

AWS Cost Explores shows cost incurred in multiple different compute purchasing options

AWS Billing and Cost Management offers a way to organize your resource costs on your cost allocation report by leveraging cost allocation tags, so that it’s easier to categorize and track your AWS costs using cost allocation reports, which includes all of your AWS costs for each billing period. The report includes both tagged and untagged resources, so that you can clearly organize the charges for resources. For example, if you tag resources with an application name that is deployed on Spot Instances, you can track the total cost of that single application that runs on those resources. The AWS generated tags “createdBy” is a tag that AWS defines and applies to supported AWS resources for cost allocation purposes and if opted, this tag is applied to “Spot-instance-request” resource type whenever the RequestSpotInstances API is invoked. This can be a great way to track the Spot Instance creation activities in your billing reports.

Cost and Usage Reports

AWS Customers have access to raw cost and usage data through the AWS Cost and Usage (AWS CUR) reports. These reports contain the most comprehensive information about your AWS usage and costs. Financial teams need this data so that they have an overview of their monthly, quarterly, and yearly AWS spend. But this data is equally valuable for technical teams who need detailed resource-level granularity to understand which resources are contributing to the spend, and what parts of the system to optimize. If you’re using Spot Instances for your compute needs, then AWS CUR populates the Amazon EC2 Spot usage pricing/* columns and the product/* columns. With this data, you can calculate the past savings achieved with Spot through the AWS CUR. Note that this feature was enabled in July 2021 and the AWS CUR data for Spot Usage is available only since then. The Cloud Intelligence Dashboards provide prebuilt visualizations that can help you get a detailed view of your AWS usage and costs. You can learn more about deploying Cloud Intelligence Dashboards by referring to the detailed blog “Visualize and gain insight into you AWS cost and usage with Cloud Intelligence Dashboard and CUDOS using Amazon QuickSite”Compute summary can be viewed in Cloud Intelligent Dashboards

Conclusion

It’s always recommended to follow Spot Instance best practices while using Amazon EC2 Spot Instances for suitable workloads, so that you can have the best experience. In this post, we explored a few tools and techniques that can further guide you toward much deeper insights into your workloads that are using Spot Instances. This can assist you with understanding cost savings and help you with troubleshooting so that you can use Spot Instances more easily.

Visualize Amazon S3 data using Amazon Athena and Amazon Managed Grafana

Post Syndicated from Pedro Sola Pimentel original https://aws.amazon.com/blogs/big-data/visualize-amazon-s3-data-using-amazon-athena-and-amazon-managed-grafana/

Grafana is a popular open-source analytics platform that you can employ to create, explore, and share your data through flexible dashboards. Its use cases include application and IoT device monitoring, and visualization of operational and business data, among others. You can create your dashboard with your own datasets or publicly available datasets related to your industry.

In November 2021, the AWS team together with Grafana Labs announced the Amazon Athena data source plugin for Grafana. The feature allows you to visualize information on a Grafana dashboard using data stored in Amazon Simple Storage Service (Amazon S3) buckets, with help from Amazon Athena, a serverless interactive query service. In addition, you can provision Grafana dashboards using Amazon Managed Grafana, a fully managed service for open-source Grafana and Enterprise Grafana.

In this post, we show how you can create and configure a dashboard in Amazon Managed Grafana that queries data stored on Amazon S3 using Athena.

Solution overview

The following diagram is the architecture of the solution.

Architecture diagram

The solution is comprised of a Grafana dashboard, created in Amazon Managed Grafana, populated with data queried using Athena. Athena runs queries against data stored in Amazon S3 using standard SQL. Athena integrates with the AWS Glue Data Catalog, a metadata store for data in Amazon S3, which includes information such as the table schema.

To implement this solution, you complete the following high-level steps:

  1. Create and configure an Athena workgroup.
  2. Configure the dataset in Athena.
  3. Create and configure a Grafana workspace.
  4. Create a Grafana dashboard.

Create and configure an Athena workgroup

By default, the AWS Identity and Access Management (IAM) role used by Amazon Managed Grafana has the AmazonGrafanaAthenaAccess IAM policy attached. This policy gives the Grafana workspace access to query all Athena databases and tables. More importantly, it gives the service access to read data written to S3 buckets with the prefix grafana-athena-query-results-. In order for Grafana to be able to read the Athena query results, you have two options:

In this post, we go with the first option. To do that, complete the following steps:

  1. Create an S3 bucket named grafana-athena-query-results-<name>. Replace <name> with a unique name of your choice.
  2. On the Athena console, choose Workgroups in the navigation pane.
  3. Choose Create workgroup.
  4. Under Workgroup name, enter a unique name of your choice.
  5. For Query result configuration, choose Browse S3.
  6. Select the bucket you created and choose Choose.
  7. For Tags, choose Add new tag.
  8. Add a tag with the key GrafanaDataSource and the value true.
  9. Choose Create workgroup.

It’s important that you add the tag described in steps 7–8. If the tag isn’t present, the workgroup won’t be accessible by Amazon Managed Grafana.

For more information about the Athena query results location, refer to Working with query results, recent queries, and output files.

Configure the dataset in Athena

For this post, we use the NOAA Global Historical Climatology Network Daily (GHCN-D) dataset, from the National Oceanic and Atmospheric Administration (NOAA) agency. The dataset is available in the Registry of Open Data on AWS, a registry that exists to help people discover and share datasets.

The GHCN-D dataset contains meteorological elements such as daily maximum and minimum temperatures. It’s a composite of climate records from numerous locations—some locations contain more than 175 years recorded.

The GHCN-D data is in CSV format and is stored in a public S3 bucket (s3://noaa-ghcn-pds/). You access the data through Athena. To start using Athena, you need to create a database:

  1. On the Athena console, choose Query editor in the navigation pane.
  2. Choose the workgroup, created in the previous step, on the top right menu.
  3. To create a database named mydatabase, enter the following statement:
CREATE DATABASE mydatabase
  1. Choose Run.
  2. From the Database list on the left, choose mydatabase to make it your current database.

Now that you have a database, you can create a table in the AWS Glue Data Catalog to start querying the GHCN-D dataset.

  1. In the Athena query editor, run the following query:
CREATE EXTERNAL TABLE `noaa_ghcn_pds`(
  `id` string, 
  `year_date` string, 
  `element` string, 
  `data_value` string, 
  `m_flag` string, 
  `q_flag` string, 
  `s_flag` string, 
  `obs_time` string
)
ROW FORMAT SERDE 
  'org.apache.hadoop.hive.serde2.OpenCSVSerde' 
WITH SERDEPROPERTIES ('separatorChar'=',')
STORED AS INPUTFORMAT 'org.apache.hadoop.mapred.TextInputFormat' 
OUTPUTFORMAT 'org.apache.hadoop.hive.ql.io.HiveIgnoreKeyTextOutputFormat'
LOCATION 's3://noaa-ghcn-pds/csv/'
TBLPROPERTIES ('classification'='csv')

After that, the table noaa_ghcn_pds should appear under the list of tables for your database. In the preceding statement, we define columns based on the GHCN-D data structure. For a full description of the variables and data structure, refer to the dataset’s readme file.

With the database and the table configured, you can start running SQL queries against the entire dataset. For the purpose of this post, you create a second table containing a subset of the data: the maximum temperatures of one weather station located in Retiro Park (or simply El Retiro), one of the largest parks of the city of Madrid, Spain. The identification of the station is SP000003195 and the element of interest is TMAX.

  1. Run the following statement on the Athena console to create the second table:
CREATE TABLE madrid_tmax WITH (format = 'PARQUET') AS
SELECT CAST(data_value AS real) / 10 AS t_max,
  CAST(
    SUBSTR(year_date, 1, 4) || '-' || SUBSTR(year_date, 5, 2) || '-' || SUBSTR(year_date, 7, 2) AS date
  ) AS iso_date
FROM "noaa_ghcn_pds"
WHERE id = 'SP000003195'
  AND element = 'TMAX'

After that, the table madrid_tmax should appear under the list of tables for your database. Note that in the preceding statement, the temperature value is divided by 10. That’s because temperatures are originally recorded in tenths of Celsius degrees. We also adjust the date format. Both adjustments make the consumption of the data easier.

Unlike the noaa_ghcn_pds table, the madrid_tmax table isn’t linked with the original dataset. That means its data won’t reflect updates made to the GHCN-D dataset. Instead, it holds a snapshot of the moment of its creation. That may not be ideal in certain scenarios, but is acceptable here.

Create and configure a Grafana workspace

The next step is to provision and configure a Grafana workspace and assign a user to the workspace.

Create your workspace

In this post, we use the AWS Single Sign-On (AWS SSO) option to set up the users. You can skip this step if you already have a Grafana workspace.

  1. On the Amazon Managed Grafana console, choose Create Workspace.
  2. Give your workspace a name, and optionally a description.
  3. Choose Next.
  4. Select AWS IAM Identity Center (successor to AWS SSO).
  5. For Permission type, choose Service Managed and choose Next.
  6. For Account access, select Current account.
  7. For Data sources, select Amazon Athena and choose Next.
  8. Review the details and choose Create workspace.

This starts the creation of the Grafana workspace.

Create a user and assign it to the workspace

The last step of the configuration is to create a user to access the Grafana dashboard. Complete the following steps:

  1. Create a user for your AWS SSO identity store if you don’t have one already.
  2. On the Amazon Managed Grafana console, choose All workspaces in the navigation pane.
  3. Choose your Grafana workspace to open the workspace details.
  4. On the Authentication tab, choose Assign new user or group.
  5. Select the user you created and choose Assign users and groups.
  6. Change the user type by selecting the user and on the Action menu, choose Make admin.

Create a Grafana dashboard

Now that you have Athena and Amazon Managed Grafana configured, create a Grafana dashboard with data fetched from Amazon S3 using Athena. Complete the following steps:

  1. On the Amazon Managed Grafana console, choose All workspaces in the navigation pane.
  2. Choose the Grafana workspace URL link.
  3. Log in with the user you assigned in the previous step.
  4. In the navigation pane, choose the lower AWS icon (there are two) and then choose Athena on the AWS services tab.
  5. Choose the Region, database, and workgroup used previously, then choose Add 1 data source.
  6. Under Provisioned data sources, choose Go to settings on the newly created data source.
  7. Select Default and then choose Save & test.
  8. In the navigation pane, hover over the plus sign and then choose Dashboard to create a new dashboard.
  9. Choose Add a new panel.
  10. In the query pane, enter the following query:
select iso_date as time, t_max from madrid_tmax where $__dateFilter(iso_date) order by iso_date
  1. Choose Apply.
  2. Change the time range on the top right corner.

For example, if you change to Last 2 years, you should see something similar to the following screenshot.

Temperature visualization

Now that you’re able to populate your Grafana dashboard with data fetched from Amazon S3 using Athena, you can experiment with different visualizations and configurations. Grafana provides lots of options, and you can adjust your dashboard to your preferences, as shown in the following example screenshot of daily maximum temperatures.

Temperature visualization - colorful

As you can see in this visualization, Madrid can get really hot on the summer!

For more information on how to customize Grafana visualizations, refer to Visualization panels.

Clean up

If you followed the instructions in this post in your own AWS account, don’t forget to clean up the created resources to avoid further charges.

Conclusion

In this post, you learned how to use Amazon Managed Grafana in conjunction with Athena to query data stored in an S3 bucket. As an example, we used a subset of the GHCN-D dataset, available in the Registry of Open Data on AWS.

Check out Amazon Managed Grafana and start creating other dashboards using your own data or other publicly available datasets stored in Amazon S3.


About the authors

Pedro Pimentel is a Prototyping Architect working on the AWS Cloud Engineering and Prototyping team, based in Brazil. He works with AWS customers to innovate using new technologies and services. In his spare time, Pedro enjoys traveling and cycling.

Rafael Werneck is a Senior Prototyping Architect at AWS Cloud Engineering and Prototyping, based in Brazil. Previously, he worked as a Software Development Engineer on Amazon.com.br and Amazon RDS Performance Insights.

How to export AWS Security Hub findings to CSV format

Post Syndicated from Andy Robinson original https://aws.amazon.com/blogs/security/how-to-export-aws-security-hub-findings-to-csv-format/

AWS Security Hub is a central dashboard for security, risk management, and compliance findings from AWS Audit Manager, AWS Firewall Manager, Amazon GuardDuty, IAM Access Analyzer, Amazon Inspector, and many other AWS and third-party services. You can use the insights from Security Hub to get an understanding of your compliance posture across multiple AWS accounts. It is not unusual for a single AWS account to have more than a thousand Security Hub findings. Multi-account and multi-Region environments may have tens or hundreds of thousands of findings. With so many findings, it is important for you to get a summary of the most important ones. Navigating through duplicate findings, false positives, and benign positives can take time.

In this post, we demonstrate how to export those findings to comma separated values (CSV) formatted files in an Amazon Simple Storage Service (Amazon S3) bucket. You can analyze those files by using a spreadsheet, database applications, or other tools. You can use the CSV formatted files to change a set of status and workflow values to align with your organizational requirements, and update many or all findings at once in Security Hub.

The solution described in this post, called CSV Manager for Security Hub, uses an AWS Lambda function to export findings to a CSV object in an S3 bucket, and another Lambda function to update Security Hub findings by modifying selected values in the downloaded CSV file from an S3 bucket. You use an Amazon EventBridge scheduled rule to perform periodic exports (for example, once a week). CSV Manager for Security Hub also has an update function that allows you to update the workflow, customer-specific notation, and other customer-updatable values for many or all findings at once. If you’ve set up a Region aggregator in Security Hub, you should configure the primary CSV Manager for Security Hub stack to export findings only from the aggregator Region. However, you may configure other CSV Manager for Security Hub stacks that export findings from specific Regions or from all applicable Regions in specific accounts. This allows application and account owners to view their own Security Hub findings without having access to other findings for the organization.

How it works

CSV Manager for Security Hub has two main features:

  • Export Security Hub findings to a CSV object in an S3 bucket
  • Update Security Hub findings from a CSV object in an S3 bucket

Overview of the export function

The overview of the export function CsvExporter is shown in Figure 1.

Figure 1: Architecture diagram of the export function

Figure 1: Architecture diagram of the export function

Figure 1 shows the following numbered steps:

  1. In the AWS Management Console, you invoke the CsvExporter Lambda function with a test event.
  2. The export function calls the Security Hub GetFindings API action and gets a list of findings to export from Security Hub.
  3. The export function converts the most important fields to identify and sort findings to a 37-column CSV format (which includes 12 updatable columns) and writes to an S3 bucket.

Overview of the update function

To update existing Security Hub findings that you previously exported, you can use the update function CsvUpdater to modify the respective rows and columns of the CSV file you exported, as shown in Figure 2. There are 12 modifiable columns out of 37 (any changes to other columns are ignored), which are described in more detail in Step 3: View or update findings in the CSV file later in this post.

Figure 2: Architecture diagram of the update function

Figure 2 shows the following numbered steps:

Figure 2 shows the following numbered steps:

  1. You download the CSV file that the CsvExporter function generated from the S3 bucket and update as needed.
  2. You upload the CSV file that contains your updates to the S3 bucket.
  3. In the AWS Management Console, you invoke the CsvUpdater Lambda function with a test event containing the URI of the CSV file.
  4. CsvUpdater reads the updated CSV file from the S3 bucket.
  5. CsvUpdater identifies the minimum set of updates and invokes the Security Hub BatchUpdateFindings API action.

Step 1: Use the CloudFormation template to deploy the solution

You can set up and use CSV Manager for Security Hub by using either AWS CloudFormation or the AWS Cloud Development Kit (AWS CDK).

To deploy the solution (AWS CDK)

You can find the latest code in the aws-security-hub-csv-manager GitHub repository, where you can also contribute to the sample code. The following commands show how to deploy the solution by using the AWS CDK. First, the AWS CDK initializes your environment and uploads the AWS Lambda assets to an S3 bucket. Then, you deploy the solution to your account by using the following commands. Replace <INSERT_AWS_ACCOUNT> with your account number, and replace <INSERT_REGION> with the AWS Region that you want the solution deployed to, for example us-east-1.

cdk bootstrap aws://<INSERT_AWS_ACCOUNT>/<INSERT_REGION>
cdk deploy

To deploy the solution (CloudFormation)

  1. Choose the following Launch Stack button to open the AWS CloudFormation console pre-loaded with the template for this solution:

    Launch Stack

  2. In the Parameters section, as shown in Figure 3, enter your values.
    Figure 3: CloudFormation template variables

    Figure 3: CloudFormation template variables

    1. For What folder for CSV Manager for Security Hub Lambda code, leave the default Code. For What folder for CSV Manager for Security Hub exports, leave the default Findings.

      These are the folders within the S3 bucket that the CSV Manager for Security Hub CloudFormation template creates to store the Lambda code, as well as where the findings are exported by the Lambda function.

    2. For Frequency, for this solution you can leave the default value cron(0 8 ? * SUN *). This default causes automatic exports to occur every Sunday at 8:00 AM local time using an EventBridge scheduled rule. For more information about how to update this value to meet your needs, see Schedule Expressions for Rules in the Amazon CloudWatch Events User Guide.
    3. The values you enter for the Regions field depend on whether you have configured an aggregation Region in Security Hub.
      • If you have configured an aggregation Region, enter only that Region code, for example eu-north-1, as shown in Figure 3.
      • If you haven’t configured an aggregation Region, enter a comma-separated list of Regions in which you have enabled Security Hub, for example us-east-1, eu-west-1, eu-west-2.
      • If you would like to export findings from all Regions where Security Hub is enabled, leave the Regions field blank. Regions where Security Hub is not enabled will generate a message and will be skipped.
  3. Choose Next.

The CloudFormation stack deploys the necessary resources, including an EventBridge scheduling rule, AWS System Managers Automation documents, an S3 bucket, and Lambda functions for exporting and updating Security Hub findings.

After you deploy the CloudFormation stack

After you create the CSV Manager for Security Hub stack, you can do the following:

  1. Perform the export function to write some or all Security Hub findings to a CSV file by following the instructions in Step 2: Export Security Hub findings to a CSV file later in this post.
  2. Perform a bulk update of Security Hub findings by following the instructions in Step 3: View or update findings in the CSV file later in this post. You can make changes to one or more of the 12 updatable columns of the CSV file, and perform the update function to update some or all Security Hub findings.

Step 2: Export Security Hub findings to a CSV file

You can export Security Hub findings from the AWS Lambda console. To do this, you create a test event and invoke the CsvExporter Lambda function. CsvExporter exports all Security Hub findings from all applicable Regions to a single CSV file in the S3 bucket for CSV Manager for Security Hub.

To export Security Hub findings to a CSV file

  1. In the AWS Lambda console, find the CsvExporter Lambda function and select it.
  2. On the Code tab, choose the down arrow at the right of the Test button, as shown in Figure 4, and select Configure test event.
    Figure 4: The down arrow at the right of the Test button

    Figure 4: The down arrow at the right of the Test button

  3. To create an empty test event, on the Configure test event page, do the following:
    1. Choose Create a new event.
    2. Enter an event name; in this example we used testEvent.
    3. For Template, leave the default hello-world.
    4. For Event JSON, enter the JSON object {} as shown in Figure 5.
    Figure 5: Creating an empty test event

    Figure 5: Creating an empty test event

  4. Choose Save to save the empty test event.
  5. To invoke the Lambda function, choose the Test button, as shown in Figure 6.
    Figure 6: Test button to invoke the Lambda function

    Figure 6: Test button to invoke the Lambda function

  6. On the Execution Results tab, note the following details, which you will need for the next step.
    {
    "message": "Export succeeded", 
    "bucket": DOC-EXAMPLE-BUCKET,
    "exportKey”: DOC-EXAMPLE-OBJECT,
    "resultCode": 200
    }

  7. Locate the CSV object that matches the value of “exportKey” (in this example, DOC-EXAMPLE-OBJECT) in the S3 bucket that matches the value of “bucket” (in this example, DOC-EXAMPLE-BUCKET).

Now you can view or update the findings in the CSV file, as described in the next section.

Step 3: (Optional) Using filters to limit CSV results

In your test event, you can specify any filter that is accepted by the GetFindings API action. You do this by adding a filter key to your test event. The filter key can either contain the word HighActive (which is a predefined filter configured as a default for selecting active high-severity and critical findings, as shown in Figure 8), or a JSON filter object.

Figure 8 depicts an example JSON filter that performs the same filtering as the HighActive predefined filter.

To use filters to limit CSV results

  1. In the AWS Lambda console, find the CsvExporter Lambda function and select it.
  2. On the Code tab, choose the down arrow at the right of the Test button, as shown in Figure 7, and select Configure test event.
    Figure 7: The down arrow at the right of the Test button

    Figure 7: The down arrow at the right of the Test button

  3. To create a test event containing a filter, on the Configure test event page, do the following:
    1. Choose Create a new event.
    2. Enter an event name; in this example we used filterEvent.
    3. For Template, select testEvent,
    4. For Event JSON, enter the following JSON object, as shown in Figure 8.
      {
         "SeverityLabel":[
            {
               "Value":"CRITICAL",
               "Comparison":"EQUALS"
            },
            {
               "Value":"HIGH",
               "Comparison":"EQUALS"
            }
         ],
         "RecordState":[
            {
               "Comparison":"EQUALS",
               "Value":"ACTIVE"
            }
         ]
      }

      Figure 8: Test button to invoke the Lambda function

      Figure 8: Test button to invoke the Lambda function

    5. Choose Save.
  4. To invoke the Lambda function, choose the Test button as shown in Figure 9.
    Figure 9: Test button to invoke the Lambda function

    Figure 9: Test button to invoke the Lambda function

  5. On the Execution Results tab, note the following details, which you will need for the next step.
    {
    "message": "Export succeeded", 
    "bucket": DOC-EXAMPLE-BUCKET,
    "exportKey": DOC-EXAMPLE-OBJECT,
    "resultCode": 200
    }

  6. Locate the CSV object that matches the value of “exportKey” (in this example, DOC-EXAMPLE-OBJECT) in the S3 bucket that matches the value of “bucket” (in this example, DOC-EXAMPLE-BUCKET).

The results in this CSV file should be a filtered set of Security Hub findings according to the filter you specified above. You can now proceed to step 4 if you want to view or update findings.

Step 4: View or update findings in the CSV file

You can use any program that allows you to view or edit CSV files, such as Microsoft Excel. The first row in the CSV file are the column names. These column names correspond to fields in the JSON objects that are returned by the GetFindings API action.

Warning: Do not modify the first two columns, Id (column A) or ProductArn (column B). If you modify these columns, Security Hub will not be able to locate the finding to update, and any other changes to that finding will be discarded.

You can locally modify any of the columns in the CSV file, but only 12 columns out of 37 columns will actually be updated if you use CsvUpdater to update Security Hub findings. The following are the 12 columns you can update. These correspond to columns C through N in the CSV file.

Column name Spreadsheet column Description
Criticality C An integer value between 0 and 100.
Confidence D An integer value between 0 and 100.
NoteText E Any text you wish
NoteUpdatedBy F Automatically updated with your AWS principal user ID.
CustomerOwner* G Information identifying the owner of this finding (for example, email address).
CustomerIssue* H A Jira issue or another identifier tracking a specific issue.
CustomerTicket* I A ticket number or other trouble/problem tracking identification.
ProductSeverity** J A floating-point number from 0.0 to 99.9.
NormalizedSeverity** K An integer between 0 and 100.
SeverityLabel L One of the following:

  • INFORMATIONAL
  • LOW
  • MEDIUM
  • HIGH
  • HIGH
  • CRITICAL
VerificationState M One of the following:

  • UNKNOWN — Finding has not been verified yet.
  • TRUE_POSITIVE — This is a valid finding and should be treated as a risk.
  • FALSE_POSITIVE — This an incorrect finding and should be ignored or suppressed.
  • BENIGN_POSITIVE — This is a valid finding, but the risk is not applicable or has been accepted, transferred, or mitigated.
Workflow N One of the following:

  • NEW — This is a new finding that has not been reviewed.
  • NOTIFIED — The responsible party or parties have been notified of this finding.
  • RESOLVED — The finding has been resolved.
  • SUPPRESSED — A false or benign finding has been suppressed so that it does not appear as a current finding in Security Hub.

* These columns are stored inside the UserDefinedFields field of the updated findings. The column names imply a certain kind of information, but you can put any information you wish.

** These columns are stored inside the Severity field of the updated findings. These values have a fixed format and will be rejected if they do not meet that format.

Columns with fixed text values (L, M, N) in the previous table can be specified in mixed case and without underscores—they will be converted to all uppercase and underscores added in the CsvUpdater Lambda function. For example, “false positive” will be converted to “FALSE_POSITIVE”.

Step 5: Create a test event and update Security Hub by using the CSV file

If you want to update Security Hub findings, make your changes to columns C through N as described in the previous table. After you make your changes in the CSV file, you can update the findings in Security Hub by using the CSV file and the CsvUpdater Lambda function.

Use the following procedure to create a test event and run the CsvUpdater Lambda function.

To create a test event and run the CsvUpdater Lambda function

  1. In the AWS Lambda console, find the CsvUpdater Lambda function and select it.
  2. On the Code tab, choose the down arrow to the right of the Test button, as shown in Figure 10, and select Configure test event.
    Figure 10: The down arrow to the right of the Test button

    Figure 10: The down arrow to the right of the Test button

  3. To create a test event as shown in Figure 11, on the Configure test event page, do the following:
    1. Choose Create a new event.
    2. Enter an event name; in this example we used testEvent.
    3. For Template, leave the default hello-world.
    4. For Event JSON, enter the following:
      {
      "input": <s3ObjectUri>,
      "primaryRegion": <aggregationRegionName>
      }

      Replace <s3ObjectUri> with the full URI of the S3 object where the updated CSV file is located.

      Replace <aggregationRegionName> with your Security Hub aggregation Region, or the primary Region in which you initially enabled Security Hub.

      Figure 11: Create and save a test event for the CsvUpdater Lambda function

      Figure 11: Create and save a test event for the CsvUpdater Lambda function

  4. Choose Save.
  5. Choose the Test button, as shown in Figure 12, to invoke the Lambda function.
    Figure 12: Test button to invoke the Lambda function

    Figure 12: Test button to invoke the Lambda function

  6. To verify that the Lambda function ran successfully, on the Execution Results tab, review the results for “message”: “Success”, as shown in the following example. Note that the results may be thousands of lines long.
    {
    "message": "Success",
    "details": {
    "processed": [{"Id": arn:aws:securityhub:us-east-1: 111122223333:subscription/cis-aws-foundations-benchmark/v/1.2.0/1.7/finding/6d543b22-6a3d-405c-ae7f-224469bde7d2, "ProductArn": arn:aws:securityhub:us-east-1::product/aws/securityhub}, … ],
    "unprocessed": [],
    "message": "Updated succeeded",
    "success": true
    },
    "input": s3://DOC-EXAMPLE-BUCKET/DOC-EXAMPLE-OBJECT,
    "resultCode": 200
    }

    The processed array lists every successfully updated finding by Id and ProductArn.

    If any of the findings were not successfully updated, their Id and ProductArn appear in the unprocessed array. In the previous example, no findings were unprocessed.

    The value s3://DOC-EXAMPLE-BUCKET/DOC-EXAMPLE-OBJECT is the URI of the S3 object from which your updates were read.

Cleaning up

To avoid incurring future charges, first delete the CloudFormation stack that you deployed in Step 1: Use the CloudFormation template to deploy the solution. Next, you need to manually delete the S3 bucket deployed with the stack. For instructions, see Deleting a bucket in the Amazon Simple Storage Service User Guide.

Conclusion

In this post, we showed you how you can export Security Hub findings to a CSV file in an S3 bucket and update the exported findings by using CSV Manager for Security Hub. We showed you how you can automate this process by using AWS Lambda, Amazon S3, and AWS Systems Manager. Full documentation for CSV Manager for Security Hub is available in the aws-security-hub-csv-manager GitHub repository. You can also investigate other ways to manage Security Hub findings by checking out our blog posts about Security Hub integration with Amazon OpenSearch Service, Amazon QuickSight, Slack, PagerDuty, Jira, or ServiceNow.

If you have feedback about this post, submit comments in the Comments section below. If you have questions about this post, start a new thread on the Security Hub re:Post. To learn more or get started, visit AWS Security Hub.

Want more AWS Security news? Follow us on Twitter.

Andy Robinson

Andy Robinson

Andy wrote CSV Manager for Security Hub in response to requests from several customers. He is an AWS Professional Services Senior Security Consultant with over 30 years of security, software product management, and software design experience. Andy is also a pilot, scuba instructor, martial arts instructor, ham radio enthusiast, and photographer.

Murat Eksi

Murat Eksi

Murat is a full-stack technologist at AWS Professional Services. He has worked with various industries, including finance, sports, media, gaming, manufacturing, and automotive, to accelerate their business outcomes through application development, security, IoT, analytics, devops and infrastructure. Outside of work, he loves traveling around the world, learning new languages while setting up local events for entrepreneurs and business owners in Stockholm, or taking flight lessons.

Shikhar Mishra

Shikhar Mishra

Shikhar is a Senior Solutions Architect at Amazon Web Services. He is a cloud security enthusiast and enjoys helping customers design secure, reliable, and cost-effective solutions on AWS.

Rohan Raizada

Rohan Raizada

Rohan is a Solutions Architect for Amazon Web Services. He works with enterprises of all sizes with their cloud adoption to build scalable and secure solutions using AWS. During his free time, he likes to spend time with family and go cycling outdoors.

Jonathan Nguyen

Jonathan Nguyen

Jonathan is a Shared Delivery Team Senior Security Consultant at AWS. His background is in AWS Security with a focus on threat detection and incident response. Today, he helps enterprise customers develop a comprehensive security strategy and deploy security solutions at scale, and he trains customers on AWS Security best practices.

Deploy and manage OpenAPI/Swagger RESTful APIs with the AWS Cloud Development Kit

Post Syndicated from Luke Popplewell original https://aws.amazon.com/blogs/devops/deploy-and-manage-openapi-swagger-restful-apis-with-the-aws-cloud-development-kit/

This post demonstrates how AWS Cloud Development Kit (AWS CDK) Infrastructure as Code (IaC) constructs and AWS serverless technology can be used to build and deploy a RESTful Application Programming Interface (API) defined in the OpenAPI specification. This post uses an example API that describes  Widget resources and demonstrates how to use an AWS CDK Pipeline to:

  • Deploy a RESTful API stage to Amazon API Gateway from an OpenAPI specification.
  • Build and deploy an AWS Lambda function that contains the API functionality.
  • Auto-generate API documentation and publish it to an Amazon Simple Storage Service (Amazon S3)-hosted website served by the Amazon CloudFront content delivery network (CDN) service. This provides technical and non-technical stakeholders with versioned, current, and accessible API documentation.
  • Auto-generate client libraries for invoking the API and deploy them to AWS CodeArtifact, which is a fully-managed artifact repository service. This allows API client development teams to integrate with different versions of the API in different environments.

The diagram shown in the following figure depicts the architecture of the AWS services and resources described in this post.

 The architecture described in this post consists of an AWS CodePipeline pipeline, provisioned using the AWS CDK, that deploys the Widget API to AWS Lambda and API Gateway. The pipeline then auto-generates the API’s documentation as a website served by CloudFront and deployed to S3. Finally, the pipeline auto-generates a client library for the API and deploys this to CodeArtifact.

Figure 1 – Architecture

The code that accompanies this post, written in Java, is available here.

Background

APIs must be understood by all stakeholders and parties within an enterprise including business areas, management, enterprise architecture, and other teams wishing to consume the API. Unfortunately, API definitions are often hidden in code and lack up-to-date documentation. Therefore, they remain inaccessible for the majority of the API’s stakeholders. Furthermore, it’s often challenging to determine what version of an API is present in different environments at any one time.

This post describes some solutions to these issues by demonstrating how to continuously deliver up-to-date and accessible API documentation, API client libraries, and API deployments.

AWS CDK

The AWS CDK is a software development framework for defining cloud IaC and is available in multiple languages including TypeScript, JavaScript, Python, Java, C#/.Net, and Go. The AWS CDK Developer Guide provides best practices for using the CDK.

This post uses the CDK to define IaC in Java which is synthesized to a cloud assembly. The cloud assembly includes one to many templates and assets that are deployed via an AWS CodePipeline pipeline. A unit of deployment in the CDK is called a Stack.

OpenAPI specification (formerly Swagger specification)

OpenAPI specifications describe the capabilities of an API and are both human and machine-readable. They consist of definitions of API components which include resources, endpoints, operation parameters, authentication methods, and contact information.

Project composition

The API project that accompanies this post consists of three directories:

  • app
  • api
  • cdk

app directory

This directory contains the code for the Lambda function which is invoked when the Widget API is invoked via API Gateway. The code has been developed in Java as an Apache Maven project.

The Quarkus framework has been used to define a WidgetResource class (see src/main/java/aws/sample/blog/cdkopenapi/app/WidgetResources.java ) that contains the methods that align with HTTP Methods of the Widget API.
api directory

The api directory contains the OpenAPI specification file ( openapi.yaml ). This file is used as the source for:

  • Defining the REST API using API Gateway’s support for OpenApi.
  • Auto-generating the API documentation.
  • Auto-generating the API client artifact.

The api directory also contains the following files:

  • openapi-generator-config.yaml : This file contains configuration settings for the OpenAPI Generator framework, which is described in the section CI/CD Pipeline.
  • maven-settings.xml: This file is used support the deployment of the generated SDKs or libraries (Apache Maven artifacts) for the API and is described in the CI/CD Pipeline section of this post.

This directory contains a sub directory called docker . The docker directory contains a Dockerfile which defines the commands for building a Docker image:

FROM ruby:2.6.5-alpine
 
RUN apk update \
 && apk upgrade --no-cache \
 && apk add --no-cache --repository http://dl-cdn.alpinelinux.org/alpine/v3.14/main/ nodejs=14.20.0-r0 npm \
 && apk add git \
 && apk add --no-cache build-base
 
# Install Widdershins node packages and ruby gem bundler 
RUN npm install -g widdershins \
 && gem install bundler 
 
# working directory
WORKDIR /openapi
 
# Clone and install the Slate framework
RUN git clone https://github.com/slatedocs/slate
RUN cd slate \
 && bundle install

The Docker image incorporates two open source projects, the NodeJS Widdershins library and the Ruby Slate-framework. These are used together to auto-generate the documentation for the API from the OpenAPI specification.  This Dockerfile is referenced and built by the  ApiStack class, which is described in the CDK Stacks section of this post.

cdk directory

This directory contains an Apache Maven Project developed in Java for provisioning the CDK stacks for the  Widget API.

Under the  src/main/java  folder, the package  aws.sample.blog.cdkopenapi.cdk  contains the files and classes that define the application’s CDK stacks and also the entry point (main method) for invoking the stacks from the CDK Toolkit CLI:

  • CdkApp.java: This file contains the  CdkApp class which provides the main method that is invoked from the AWS CDK Toolkit to build and deploy the  application stacks.
  • ApiStack.java: This file contains the   ApiStack class which defines the  OpenApiBlogAPI   stack and is described in the CDK Stacks section of this post.
  • PipelineStack.java: This file contains the   PipelineStack class which defines the OpenAPIBlogPipeline  stack and is described in the CDK Stacks section of this post.
  • ApiStackStage.java: This file contains the  ApiStackStage class which defines a CDK stage. As detailed in the CI/CD Pipeline section of this post, a DEV stage, containing the  OpenApiBlogAPI stack resources for a DEV environment, is deployed from the  OpenApiBlogPipeline pipeline.

CDK stacks

ApiStack

Note that the CDK bundling functionality is used at multiple points in the  ApiStack  class to produce CDK Assets. The post, Building, bundling, and deploying applications with the AWS CDK, provides more details regarding using CDK bundling mechanisms.

The  ApiStack  class defines multiple resources including:

  • Widget API Lambda function: This is bundled by the CDK in a Docker container using the Java 11 runtime image.
  • Widget  REST API on API Gateway: The REST API is created from an Inline API Definition which is passed as an S3 CDK Asset. This asset includes a reference to the  Widget API OpenAPI specification located under the  api folder (see  api/openapi.yaml ) and builds upon the SpecRestApi construct and API Gateway’s support for OpenApi.
  • API documentation Docker Image Asset: This is the Docker image that contains the open source frameworks (Widdershins and Slate) that are leveraged to generate the API documentation.
  • CDK Asset bundling functionality that leverages the API documentation Docker image to auto-generate documentation for the API.
  • An S3 Bucket for holding the API documentation website.
  • An origin access identity (OAI) which allows CloudFront to securely serve the S3 Bucket API documentation content.
  • A CloudFront distribution which provides CDN functionality for the S3 Bucket website.

Note that the  ApiStack class features the following code which is executed on the  Widget API Lambda construct:

CfnFunction apiCfnFunction = (CfnFunction)apiLambda.getNode().getDefaultChild();
apiCfnFunction.overrideLogicalId("APILambda");

The CDK, by default, auto-assigns an ID for each defined resource but in this case the generated ID is being overridden with “APILambda”. The reason for this is that inside of the  Widget API OpenAPI specification (see  api/openapi.yaml ), there is a reference to the Lambda function by name (“APILambda”) so that the function can be integrated as a proxy for each listed API path and method combination. The OpenAPI specification includes this name as a variable to derive the Amazon Resource Name (ARN) for the Lambda function:

uri:
	Fn::Sub: "arn:aws:apigateway:${AWS::Region}:lambda:path/2015-03-31/functions/${APILambda.Arn}/invocations"

PipelineStack

The  PipelineStack class defines a CDK CodePipline construct which is a higher level construct and pattern. Therefore, the construct doesn’t just map directly to a single CloudFormation resource, but provisions multiple resources to fulfil the requirements of the pattern. The post, CDK Pipelines: Continuous delivery for AWS CDK applications, provides more detail on creating pipelines with the CDK.

final CodePipeline pipeline = CodePipeline.Builder.create(this, "OpenAPIBlogPipeline")
.pipelineName("OpenAPIBlogPipeline")
.selfMutation(true)
      .dockerEnabledForSynth(true)
      .synth(synthStep)
      .build();

CI/CD pipeline

The diagram in the following figure shows the multiple CodePipeline stages and actions created by the CDK CodePipeline construct that is defined in the PipelineStack class.

The CI/CD pipeline’s stages include the Source stage, the Synth stage, the Update pipeline, the Assets stage, and the DEV stage.

Figure 2 – CI/CD Pipeline

The stages defined include the following:

  • Source stage: The pipeline is passed the source code contents from this stage.
  • Synth stage: This stage consists of a Synth Action that synthesizes the CloudFormation templates for the application’s CDK stacks and compiles and builds the project Lambda API function.
  • Update Pipeline stage: This stage checks the OpenAPIBlogPipeline stack and reinitiates the pipeline when changes to its definition have been deployed.
  • Assets stage: The application’s CDK stacks produce multiple file assets (for example, zipped Lambda code) which are published to Amazon S3. Docker image assets are published to a managed CDK framework Amazon Elastic Container Registry (Amazon ECR) repository.
  • DEV stage: The API’s CDK stack ( OpenApiBlogAPI ) is deployed to a hypothetical development environment in this stage. A post stage deployment action is also defined in this stage. Through the use of a CDK ShellStep construct, a Bash script is executed that deploys a generated client Java Archive (JAR) for the Widget API to CodeArtifact. The script employs the OpenAPI Generator project for this purpose:
CodeBuildStep codeArtifactStep = CodeBuildStep.Builder.create("CodeArtifactDeploy")
    .input(pipelineSource)
    .commands(Arrays.asList(
           	"echo $REPOSITORY_DOMAIN",
           	"echo $REPOSITORY_NAME",
           	"export CODEARTIFACT_TOKEN=`aws codeartifact get-authorization-token --domain $REPOSITORY_DOMAIN --query authorizationToken --output text`",
           	"export REPOSITORY_ENDPOINT=$(aws codeartifact get-repository-endpoint --domain $REPOSITORY_DOMAIN --repository $REPOSITORY_NAME --format maven | jq .repositoryEndpoint | sed 's/\\\"//g')",
           	"echo $REPOSITORY_ENDPOINT",
           	"cd api",
           	"wget -q https://repo1.maven.org/maven2/org/openapitools/openapi-generator-cli/5.4.0/openapi-generator-cli-5.4.0.jar -O openapi-generator-cli.jar",
     	          "cp ./maven-settings.xml /root/.m2/settings.xml",
        	          "java -jar openapi-generator-cli.jar batch openapi-generator-config.yaml",
                    "cd client",
                    "mvn --no-transfer-progress deploy -DaltDeploymentRepository=openapi--prod::default::$REPOSITORY_ENDPOINT"
))
      .rolePolicyStatements(Arrays.asList(codeArtifactStatement, codeArtifactStsStatement))
.env(new HashMap<String, String>() {{
      		put("REPOSITORY_DOMAIN", codeArtifactDomainName);
            	put("REPOSITORY_NAME", codeArtifactRepositoryName);
       }})
      .build();

Running the project

To run this project, you must install the AWS CLI v2, the AWS CDK Toolkit CLI, a Java/JDK 11 runtime, Apache Maven, Docker, and a Git client. Furthermore, the AWS CLI must be configured for a user who has administrator access to an AWS Account. This is required to bootstrap the CDK in your AWS account (if not already completed) and provision the required AWS resources.

To build and run the project, perform the following steps:

  1. Fork the OpenAPI blog project in GitHub.
  2. Open the AWS Console and create a connection to GitHub. Note the connection’s ARN.
  3. In the Console, navigate to AWS CodeArtifact and create a domain and repository.  Note the names used.
  4. From the command line, clone your forked project and change into the project’s directory:
git clone https://github.com/<your-repository-path>
cd <your-repository-path>
  1. Edit the CDK JSON file at  cdk/cdk.json  and enter the details:
"RepositoryString": "<your-github-repository-path>",
"RepositoryBranch": "<your-github-repository-branch-name>",
"CodestarConnectionArn": "<connection-arn>",
"CodeArtifactDomain": "<code-artifact-domain-name>",
"CodeArtifactRepository": "<code-artifact-repository-name>"

Please note that for setting configuration values in CDK applications, it is recommend to use environment variables or AWS Systems Manager parameters.

  1. Commit and push your changes back to your GitHub repository:
git push origin main
  1. Change into the  cdk directory and bootstrap the CDK in your AWS account if you haven’t already done so (enter “Y” when prompted):
cd cdk
cdk bootstrap
  1. Deploy the CDK pipeline stack (enter “Y” when prompted):
cdk deploy OpenAPIBlogPipeline

Once the stack deployment completes successfully, the pipeline  OpenAPIBlogPipeline will start running. This will build and deploy the API and its associated resources. If you open the Console and navigate to AWS CodePipeline, then you’ll see a pipeline in progress for the API.

Once the pipeline has completed executing, navigate to AWS CloudFormation to get the output values for the  DEV-OpenAPIBlog  stack deployment:

  1. Select the  DEV-OpenAPIBlog  stack entry and then select the Outputs column. Record the REST_URL value for the key that begins with   OpenAPIBlogRestAPIEndpoint .
  2. Record the CLOUDFRONT_URL value for the key  OpenAPIBlogCloudFrontURL .

The API ping method at https://<REST_URL>/ping can now be invoked using your browser or an API development tool like Postman. Other API other methods, as defined by the OpenApi specification, are also available for invocation (For example, GET https://<REST_URL>/widgets).

To view the generated API documentation, open a browser at https://< CLOUDFRONT_URL>.

The following figure shows the API documentation website that has been auto-generated from the API’s OpenAPI specification. The documentation includes code snippets for using the API from multiple programming languages.

The API’s auto-generated documentation website provides descriptions of the API’s methods and resources as well as code snippets in multiple languages including JavaScript, Python, and Java.

Figure 3 – Auto-generated API documentation

To view the generated API client code artifact, open the Console and navigate to AWS CodeArtifact. The following figure shows the generated API client artifact that has been published to CodeArtifact.

The CodeArtifact service user interface in the Console shows the different versions of the API’s auto-generated client libraries.

Figure 4 – API client artifact in CodeArtifact

Cleaning up

  1. From the command change to the  cdk directory and remove the API stack in the DEV stage (enter “Y” when prompted):
cd cdk
cdk destroy OpenAPIBlogPipeline/DEV/OpenAPIBlogAPI
  1. Once this has completed, delete the pipeline stack:
cdk destroy OpenAPIBlogPipeline
  1. Delete the S3 bucket created to support pipeline operations. Open the Console and navigate to Amazon S3. Delete buckets with the prefix  openapiblogpipeline .

Conclusion

This post demonstrates the use of the AWS CDK to deploy a RESTful API defined by the OpenAPI/Swagger specification. Furthermore, this post describes how to use the AWS CDK to auto-generate API documentation, publish this documentation to a web site hosted on Amazon S3, auto-generate API client libraries or SDKs, and publish these artifacts to an Apache Maven repository hosted on CodeArtifact.

The solution described in this post can be improved by:

  • Building and pushing the API documentation Docker image to Amazon ECR, and then using this image in CodePipeline API pipelines.
  • Creating stages for different environments such as TEST, PREPROD, and PROD.
  • Adding integration testing actions to make sure that the API Deployment is working correctly.
  • Adding Manual approval actions for that are executed before deploying the API to PROD.
  • Using CodeBuild caching of artifacts including Docker images and libraries.

About the author:

Luke Popplewell

Luke Popplewell works primarily with federal entities in the Australian Government. In his role as an architect, Luke uses his knowledge and experience to help organisations reach their goals on the AWS cloud. Luke has a keen interest in serverless technology, modernization, DevOps and event-driven architectures.

Identifying publicly accessible resources with Amazon VPC Network Access Analyzer

Post Syndicated from Patrick Duffy original https://aws.amazon.com/blogs/security/identifying-publicly-accessible-resources-with-amazon-vpc-network-access-analyzer/

Network and security teams often need to evaluate the internet accessibility of all their resources on AWS and block any non-essential internet access. Validating who has access to what can be complicated—there are several different controls that can prevent or authorize access to resources in your Amazon Virtual Private Cloud (Amazon VPC). The recently launched Amazon VPC Network Access Analyzer helps you understand potential network paths to and from your resources without having to build automation or manually review security groups, network access control lists (network ACLs), route tables, and Elastic Load Balancing (ELB) configurations. You can use this information to add security layers, such as moving instances to a private subnet behind a NAT gateway or moving APIs behind AWS PrivateLink, rather than use public internet connectivity. In this blog post, we show you how to use Network Access Analyzer to identify publicly accessible resources.

What is Network Access Analyzer?

Network Access Analyzer allows you to evaluate your network against your design requirements and network security policy. You can specify your network security policy for resources on AWS through a Network Access Scope. Network Access Analyzer evaluates the configuration of your Amazon VPC resources and controls, such as security groups, elastic network interfaces, Amazon Elastic Compute Cloud (Amazon EC2) instances, load balancers, VPC endpoint services, transit gateways, NAT gateways, internet gateways, VPN gateways, VPC peering connections, and network firewalls.

Network Access Analyzer uses automated reasoning to produce findings of potential network paths that don’t meet your network security policy. Network Access Analyzer reasons about all of your Amazon VPC configurations together rather than in isolation. For example, it produces findings for paths from an EC2 instance to an internet gateway only when the following conditions are met: the security group allows outbound traffic, the network ACL allows outbound traffic, and the instance’s route table has a route to an internet gateway (possibly through a NAT gateway, network firewall, transit gateway, or peering connection). Network Access Analyzer produces actionable findings with more context such as the entire network path from the source to the destination, as compared to the isolated rule-based checks of individual controls, such as security groups or route tables.

Sample environment

Let’s walk through a real-world example of using Network Access Analyzer to detect publicly accessible resources in your environment. Figure 1 shows an environment for this evaluation, which includes the following resources:

  • An EC2 instance in a public subnet allowing inbound public connections on port 80/443 (HTTP/HTTPS).
  • An EC2 instance in a private subnet allowing connections from an Application Load Balancer on port 80/443.
  • An Application Load Balancer in a public subnet with a Target Group connected to the private web server, allowing public connections on port 80/443.
  • An Amazon Aurora database in a public subnet allowing public connections on port 3306 (MySQL).
  • An Aurora database in a private subnet.
  • An EC2 instance in a public subnet allowing public connections on port 9200 (OpenSearch/Elasticsearch).
  • An Amazon EMR cluster allowing public connections on port 8080.
  • A Windows EC2 instance in a public subnet allowing public connections on port 3389 (Remote Desktop Protocol).
Figure 1: Example environment of web servers hosted on EC2 instances, remote desktop servers hosted on EC2, Relational Database Service (RDS) databases, Amazon EMR cluster, and OpenSearch cluster on EC2

Figure 1: Example environment of web servers hosted on EC2 instances, remote desktop servers hosted on EC2, Relational Database Service (RDS) databases, Amazon EMR cluster, and OpenSearch cluster on EC2

Let us assume that your organization’s security policy requires that your databases and analytics clusters not be directly accessible from the internet, whereas certain workload such as instances for web services can have internet access only through an Application Load Balancer over ports 80 and 443. Network Access Analyzer allows you to evaluate network access to resources in your VPCs, including database resources such as Amazon RDS and Amazon Aurora clusters, and analytics resources such as Amazon OpenSearch Service clusters and Amazon EMR clusters. This allows you to govern network access to your resources on AWS, by identifying network access that does not meet your security policies, and creating exclusions for paths that do have the appropriate network controls in place.

Configure Network Access Analyzer

In this section, you will learn how to create network scopes, analyze the environment, and review the findings produced. You can create network access scopes by using the AWS Command Line Interface (AWS CLI) or AWS Management Console. When creating network access scopes using the AWS CLI, you can supply the scope by using a JSON document. This blog post provides several network access scopes as JSON documents that you can deploy to your AWS accounts.

To create a network scope (AWS CLI)

  1. Verify that you have the AWS CLI installed and configured.
  2. Download the network-scopes.zip file, which contains JSON documents that detect the following publicly accessible resources:
    • OpenSearch/Elasticsearch clusters
    • Databases (MySQL, PostgreSQL, MSSQL)
    • EMR clusters
    • Windows Remote Desktop
    • Web servers that can be accessed without going through a load balancer

    Make note of the folder where you save the JSON scopes because you will need it for the next step.

  3. Open a systems shell, such as Bash, Zsh, or cmd.
  4. Navigate to the folder where you saved the preceding JSON scopes.
  5. Run the following commands in the shell window:
    aws ec2 create-network-insights-access-scope 
    --cli-input-json file://detect-public-databases.json 
    --tag-specifications 'ResourceType="network-insights-access-scope",
    Tags=[{Key="Name",Value="detect-public-databases"},{Key="Description",
    		   Value="Detects publicly accessible databases."}]' 
    --region us-east-1
    
    aws ec2 create-network-insights-access-scope 
    --cli-input-json file://detect-public-elastic.json 
    --tag-specifications 'ResourceType="network-insights-access-scope",
    Tags=[{Key="Name",Value="detect-public-opensearch"},{Key="Description",
    		   Value="Detects publicly accessible OpenSearch/Elasticsearch endpoints."}]' 
    --region us-east-1
    
    aws ec2 create-network-insights-access-scope 
    --cli-input-json file://detect-public-emr.json 
    --tag-specifications 'ResourceType="network-insights-access-scope",
    Tags=[{Key="Name",Value="detect-public-emr"},{Key="Description",
    		   Value="Detects publicly accessible Amazon EMR endpoints."}]'
    --region us-east-1
    
    aws ec2 create-network-insights-access-scope 
    --cli-input-json file://detect-public-remotedesktop.json 
    --tag-specifications 'ResourceType="network-insights-access-scope",
    Tags=[{Key="Name",Value="detect-public-remotedesktop"},{Key="Description",
    		   Value="Detects publicly accessible Microsoft Remote Desktop servers."}]' 
    --region us-east-1
    
    aws ec2 create-network-insights-access-scope 
    --cli-input-json file://detect-public-webserver-noloadbalancer.json 
    --tag-specifications 'ResourceType="network-insights-access-scope",
    Tags=[{Key="Name",Value="detect-public-webservers"},{Key="Description",
    		   Value="Detects publicly accessible web servers that can be accessed without using a load balancer."}]' 
    --region us-east-1


Now that you’ve created the scopes, you will analyze them to find resources that match your match conditions.

To analyze your scopes (console)

  1. Open the Amazon VPC console.
  2. In the navigation pane, under Network Analysis, choose Network Access Analyzer.
  3. Under Network Access Scopes, select the checkboxes next to the scopes that you want to analyze, and then choose Analyze, as shown in Figure 2.
    Figure 2: Custom network scopes created for Network Access Analyzer

    Figure 2: Custom network scopes created for Network Access Analyzer

If Network Access Analyzer detects findings, the console indicates the status Findings detected for each scope, as shown in Figure 3.

Figure 3: Network Access Analyzer scope status

Figure 3: Network Access Analyzer scope status

To review findings for a scope (console)

  1. On the Network Access Scopes page, under Network Access Scope ID, select the link for the scope that has the findings that you want to review. This opens the latest analysis, with the option to review past analyses, as shown in Figure 4.
    Figure 4: Finding summary identifying Amazon Aurora instance with public access to port 3306

    Figure 4: Finding summary identifying Amazon Aurora instance with public access to port 3306

  2. To review the path for a specific finding, under Findings, select the radio button to the left of the finding, as shown in Figure 4. Figure 5 shows an example of a path for a finding.
    Figure 5: Finding details showing access to the Amazon Aurora instance from the internet gateway to the elastic network interface, allowed by a network ACL and security group.

    Figure 5: Finding details showing access to the Amazon Aurora instance from the internet gateway to the elastic network interface, allowed by a network ACL and security group.

  3. Choose any resource in the path for detailed information, as shown in Figure 6.
    Figure 6: Resource detail within a finding outlining a specific security group allowing access on port 3306

    Figure 6: Resource detail within a finding outlining a specific security group allowing access on port 3306

How to remediate findings

After deploying network scopes and reviewing findings for publicly accessible resources, you should next limit access to those resources and remove public access. Use cases vary, but the scopes outlined in this post identify resources that you should share publicly in a more secure manner or remove public access entirely. The following techniques will help you align to the Protecting Networks portion of the AWS Well-Architected Framework Security Pillar.

If you have a need to share a database with external entities, consider using AWS PrivateLink, VPC peering, or use AWS Site-to-Site VPN to share access. You can remove public access by modifying the security group attached to the RDS instance or EC2 instance serving the database, but you should migrate the RDS database to a private subnet as well.

When creating web servers in EC2, you should not place web servers directly in a public subnet with security groups allowing HTTP and HTTPS ports from all internet addresses. Instead, you should place your EC2 instances in private subnets and use Application Load Balancers in a public subnet. From there, you can attach a security group that allows HTTP/HTTPS access from public internet addresses to your Application Load Balancer, and attach a security group that allows HTTP/HTTPS from your Load Balancer security group to your web server EC2 instances. You can also associate AWS WAF web ACLs to the load balancer to protect your web applications or APIs against common web exploits and bots that may affect availability, compromise security, or consume excessive resources.

Similarly, if you have OpenSearch/Elasticsearch running on EC2 or Amazon OpenSearch Service, or are using Amazon EMR, you can share these resources using PrivateLink. Use the Amazon EMR block public access configuration to verify that your EMR clusters are not shared publicly.

To connect to Remote Desktop on EC2 instances, you should use AWS Systems Manager to connect using Fleet Manager. Connecting with Fleet Manager only requires your Windows EC2 instances to be a managed node. When connecting using Fleet Manager, the security group requires no inbound ports, and the instance can be in a private subnet. For more information, see the Systems Manager prerequisites.

Conclusion

This blog post demonstrates how you can identify and remediate publicly accessible resources. Amazon VPC Network Access Analyzer helps you identify available network paths by using automated reasoning technology and user-defined access scopes. By using these scopes, you can define non-permitted network paths, identify resources that have those paths, and then take action to increase your security posture. To learn more about building continuous verification of network compliance at scale, see the blog post Continuous verification of network compliance using Amazon VPC Network Access Analyzer and AWS Security Hub. Take action today by deploying the Network Access Analyzer scopes in this post to evaluate your environment and add layers of security to best fit your needs.

 
If you have feedback about this post, submit comments in the Comments section below. If you have questions about this post, contact AWS Support.

Want more AWS Security news? Follow us on Twitter.

Author

Patrick Duffy

Patrick is a Solutions Architect in the Small Medium Business (SMB) segment at AWS. He is passionate about raising awareness and increasing security of AWS workloads. Outside work, he loves to travel and try new cuisines and enjoys a match in Magic Arena or Overwatch.

Peter Ticali

Peter Ticali

Peter is a Solutions Architect focused on helping Media & Entertainment customers transform and innovate. With over three decades of professional experience, he’s had the opportunity to contribute to architecture that stream live video to millions, including two Super Bowls, PPVs, and even a Royal Wedding. Previously he held Director, and CTO roles in the EdTech, advertising & public relations space. Additionally, he is a published photo journalist.

John Backes

John Backes

John is a Senior Applied Scientist in AWS Networking. He is passionate about applying Automated Reasoning to network verification and synthesis problems.

Vaibhav Katkade

Vaibhav Katkade

Vaibhav is a Senior Product Manager in the Amazon VPC team. He is interested in areas of network security and cloud networking operations. Outside of work, he enjoys cooking and the outdoors.

How to detect suspicious activity in your AWS account by using private decoy resources

Post Syndicated from Maitreya Ranganath original https://aws.amazon.com/blogs/security/how-to-detect-suspicious-activity-in-your-aws-account-by-using-private-decoy-resources/

As customers mature their security posture on Amazon Web Services (AWS), they are adopting multiple ways to detect suspicious behavior and notify response teams or workflows to take action. One example is using Amazon GuardDuty to monitor AWS accounts and workloads for malicious activity and deliver detailed security findings for visibility and remediation. Another tactic is to deploy decoys, also called honeypots, as an effective way to detect suspicious behavior.

In this blog post, we’ll show how you can create low-cost private decoy AWS resources in your AWS accounts and configure them to generate alerts when they are accessed. These decoy resources appear legitimate but don’t contain any useful or sensitive data and typically are not accessed in the normal course of business by your users and systems. Any attempt to access them is a clear signal of suspicious activity that should be investigated. You can use data sources like AWS CloudTrail, services like Amazon Detective, and your own security incident and event monitoring (SIEM) systems to investigate the activity further. This post is aimed at experienced AWS users and security professionals.

Detecting suspicious activity

Imagine that an unauthorized user has obtained credentials for your account. This could also be an insider, malicious or careless, using their valid credentials inappropriately. The unauthorized user might use these credentials to invoke AWS API calls to list resources in your account. As the next step, they might try to access resources that are commonly used to store sensitive data—such as objects in Amazon Simple Storage Service (Amazon S3) buckets, secrets in AWS Secrets Manager, or items in Amazon DynamoDB. They might also try to elevate their privileges by assuming other Identity and Access Management (IAM) roles in your account. In your role as a security professional, your task is to detect this suspicious behaviour and take actions in response. One approach is to learn the baseline of activities of the IAM users and roles in your account and flag any deviations from the learned baseline—this is the approach taken by GuardDuty when it generates findings such as Discovery:IAMUser/AnomalousBehavior.

This post focuses on another approach of creating private decoy resources in your account that are intended to look legitimate, but don’t have any useful or sensitive data and are not exposed publicly. These decoys are designed to alert you about suspicious activities that could indicate AWS credentials exposure or account compromise. You can use the decoys in conjunction with other techniques, such as creating deception environments and public and private honeypots to better detect suspicious activity in your accounts and applications.

The Fidelity-Isolation-Cost trilemma

In an ACM Queue article titled Lamboozling Attackers: A New Generation of Deception, Kelly Shortridge and Ryan Petrich introduced the Fidelity-Isolation-Cost (FIC) trilemma that “captures the most important dimensions of designing deception systems: fidelity, isolation, and cost.” Using their definition of the FIC trilemma, we see that decoy AWS resources can be well suited to designing deception systems:

  • Fidelity – Because the decoys are actual AWS resources, they behave like other legitimate resources and have high fidelity. For example, a decoy S3 bucket behaves exactly like any other S3 bucket, with the only exception being that the object data it contains is dummy and not useful. However, the unauthorized user only discovers this fact after downloading the object data and generating an automated alert to your security team.
  • Isolation – You can simply isolate the decoy AWS resources from other resources in the same account. For example, an S3 bucket is inherently isolated from other S3 buckets in the same account. An unauthorized user that can read the decoy S3 bucket does not, by doing so, get the ability to access or impact the availability of other resources in the account. The credentials obtained by the unauthorized user might have permissions to actions on other services, but the presence of the decoy S3 bucket doesn’t add to those permissions in any way.
  • Cost – You can keep the cost of deception low by choosing AWS resources that have no cost or low cost to deploy, are deployed by means of automation, and require no further operation or maintenance effort. For example, an S3 bucket with several files that are a few MB in size costs a fraction of a US cent per month for storage. The API request cost should be zero, because the bucket is designed never to be accessed in the normal course of business. Choosing similar zero or low-cost resources can make it cost-effective and feasible to create such decoy resources in multiple accounts, including in Production accounts, where it’s especially important to detect suspicious activity.

Examples of private decoy AWS resources

The following table shows examples of private decoy AWS resources that are high-fidelity, high-isolation, low-cost and are suitable to be deployed in an account that has sensitive data or applications. The table also lists the CloudTrail event fields that provide the source and name for accesses to each resource. You can use these CloudTrail events to create corresponding Amazon EventBridge rules that will generate alerts and notifications.

Private decoy resource CloudTrail event source CloudTrail event names Considerations
S3 bucket and S3 objects with dummy data s3.amazonaws.com GetObject
HeadObject
Ensure that the S3 objects do not contain any sensitive data.

S3 data events must be enabled in CloudTrail for the decoy S3 bucket

IAM role that should never be assumed sts.amazonaws.com AssumeRole Ensure that the IAM policies attached to this role allow access only to decoy resources and no other data or resources.

Ensure that the IAM role’s trust policy only trusts principals in the same account to assume the role.

Secrets Manager secret (See Note at end of table) kms.amazonaws.com Decrypt Ensure that the secret value does not contain any sensitive data.
AWS Systems Manager Parameter Store parameter (See Note at end of table) kms.amazonaws.com Decrypt Ensure that the parameter value does not contain any sensitive data.
DynamoDB table that contains items with dummy data dynamodb.amazonaws.com BatchExecuteStatement
BatchGetItem
BatchWriteItem
DeleteItem
ExecuteStatement
ExecuteTransaction
GetItem
PutItem
Query
Scan
TransactGetItems
TransactWriteItems
UpdateItem
Ensure that the item does not have any sensitive data.

DynamoDB data events must be enabled in CloudTrail for the decoy DynamoDB table.

Note: When CloudTrail Management API events are sent to EventBridge, read-only events such as Get*, List*, and Describe* are filtered out and not processed. In order to get findings for secrets and Systems Manager parameters that are being accessed, you need to alert on GetSecretValue and GetParameter API calls. Since these are not processed by EventBridge, you can instead use the fact that secrets and secure string parameters are encrypted by using AWS Key Management Service (AWS KMS), and match on the corresponding AWS KMS Decrypt API calls. This means that successful calls from an unauthorized user to GetSecretValue and GetParameter are able to be matched and alerted on.

Notifications from matching EventBridge rules can be sent to an AWS Lambda function that generates custom findings in Security Hub. These findings can then be sent to downstream systems that you might have configured in your environment, such as your SIEM system or an automated response workflow in your Security Orchestration, Automation, and Response system. Figure 1 shows this workflow.

Figure 1: Accesses to decoy resources automatically create custom Security Hub findings

Figure 1: Accesses to decoy resources automatically create custom Security Hub findings

Deploy the private decoy resources

We’ve provided an AWS CloudFormation template that you can use to deploy the solution. The template creates the following private decoy AWS resources in your account:

  • DynamoDB table
  • IAM role
  • S3 bucket with a decoy S3 object
  • Systems Manager SecureString parameter
  • Secrets Manager secret

In addition, the CloudFormation template deploys the following resources in your account to detect accesses to the decoys and send custom findings to Security Hub:

  • A CloudTrail data events trail that includes only data events from the decoy S3 bucket and DynamoDB table
  • Six EventBridge rules to match specific CloudTrail API events
  • Two Lambda functions with corresponding IAM roles:
    • The WriteData Lambda function is a CloudFormation custom resource that is used to create the decoy S3 object and the Systems Manager SecureString parameter
    • The Data Lambda function is a target for the EventBridge rules, and it sends custom findings to Security Hub when the decoy resources are accessed

Prerequisites

The prerequisites to deploying the solution are as follows:

  • Security Hub must be enabled in the AWS Regions where the private decoys will be deployed, in order to receive custom findings.
  • You must have created a CloudTrail trail to log management events for the AWS account in the Region where you deploy the private decoys. This trail can be created locally in the account or can be an organization trail. Ensure that you have enabled both read and write events, and enabled all AWS KMS events in the trail (this is the default configuration).

Deploy the solution

After you have the prerequisites set up, you can launch the CloudFormation template to deploy the private decoys.

To launch the template

  1. Choose the following Launch Stack button to launch a CloudFormation stack in your account.

    Launch Stack

    Note: The stack will launch in the N. Virginia (us-east-1) Region. To deploy this solution into other AWS Regions, download the solution’s CloudFormation template, modify it, and deploy it to the selected Region. In order to get maximum coverage for detecting suspicious activity, we recommend that you deploy the solution into your key production accounts and Regions.

  2. On the Specify stack details page, enter the stack name, then choose Next.

    The CloudFormation template will use the stack name as part of the naming of the resources that are created. We recommend that you use your organization’s existing naming conventions for stack names, and not make reference to decoy resources, because this could alert any unauthorized user to the real purpose of the resources they’re attempting to access.

    Figure 2: Specify stack details

    Figure 2: Specify stack details

  3. Configure any tags or other organization-specific stack options you need, or accept the default settings, and then choose Next.
  4. Review the CloudFormation settings and select the box acknowledging that AWS CloudFormation might create IAM resources with custom names, and then choose Create stack.
  5. After the stack has completed deployment, the CloudFormation stack output will show the Amazon Resource Names (ARNs) of the decoy resources that were created.
    Figure 3: CloudFormation stack outputs

    Figure 3: CloudFormation stack outputs

Estimated costs

This solution has been designed to keep costs as low as possible, by using services that have no associated costs (such as IAM roles or any parameters stored in Systems Manager Parameter Store), and keeping the use of paid for services (such as S3 and DynamoDB) to a minimum.

Deploying the solution as outlined in this blog post should result in a cost of less than $1 per month for a single account deployment, however please refer to the AWS Pricing Calculator where you can create a pricing estimate based on your deployment using the most up-to-date pricing information.

Test the alerts

In normal circumstances, after you configure the decoys, there will be no attempted access to these resources, and no findings will be sent to Security Hub in your account. To test that the configuration is working as expected, you can issue the following commands from a device that has programmatic access to your account where the private decoy resources have been deployed. To run each command, replace the bracketed, italicized text with your own information. You can find the details for each of the resources in the outputs section of the CloudFormation stack after it has been deployed successfully.

S3 object access

  • aws s3 cp s3://<bucket_name/object_name> /tmp
  • aws s3 cp s3://<bucket_name/object_name> s3://<any_existing_bucket>

IAM role assumption

  • aws sts assume-role –role-arn <role_name> –role-session-name BlogTestRole

Secrets Manager access

  • aws secretsmanager get-secret-value –secret-id <secret_name>

Parameter Store access

  • aws ssm get-parameters –names <ssm_parameter> –with-decryption

    DynamoDB table scan

  • aws dynamodb scan –table-name <table_name>

An example of what these test-generated findings looks like is shown in Figure 4.

Figure 4: Security Hub findings

Figure 4: Security Hub findings

Considerations

Consider the following as you deploy decoy AWS resources:

  • You should consider decoy AWS resources as enhancements to your foundational security controls. Your foundational controls should include these measures:
    • Help prevent the compromise of AWS credentials and limit the privileges of credentials by implementing strong identity management and permissions management.
    • Identify and investigate alerts generated by decoy resources by implementing detective controls.
    • Implement incident response mechanisms to respond to and mitigate the potential impact of security incidents, such as a decoy AWS resource being accessed.
  • You should ensure that your monitoring services and tools are configured to query the configuration of resources and not the data stored in resources. Otherwise, you might get a large volume of false positives because every time a resource is accessed, a custom finding is created in Security Hub. For example, consider a service like Security Hub Security Standards checks, or a cloud security posture management (CSPM) tool that monitors your S3 buckets by describing the properties of all buckets in your account. Such tools will find the decoy S3 bucket and will interrogate its configuration by making calls such as GetBucketPolicy and GetBucketLogging. However, as long as these tools don’t try to read data in the bucket through calls such as GetObject, the EventBridge rules that are configured as described in this post won’t generate a finding.
  • As a specific example of the previous point, ensure that you don’t run a sensitive data discovery job in Amazon Macie on the decoy S3 bucket, to avoid false alerts. You can configure Amazon Macie to monitor the metadata of your S3 buckets, because those actions won’t generate alerts.
  • The solution generates custom findings in Security Hub only for successful accesses of Secrets Manager secrets and Systems Manager parameters. However, both successful and unsuccessful accesses of S3 objects and DynamoDB items, and IAM role assumption, will generate custom findings in Security Hub.

Conclusion

In this post, we discussed the advantages of using private decoy AWS resources to detect suspicious activities within your account and how these decoys can complement your existing security solutions. You learned how to create private decoys, set up alerting, and ingest (and test) these alerts as custom findings into Security Hub for central visibility across your AWS environment. The solution deployment included a set of common resources as private decoys; however, the necessary code and templates can be found in our GitHub repository, and you can extend and customize these to add other resources that you want to include in your accounts.

If you would also like to learn about using CloudTrail as another method of detecting unexpected behavior within your accounts, see the blog post Using CloudTrail to identify unexpected behaviors in individual workloads for more information.

If you have feedback about this post, submit comments in the Comments section below. If you have questions about this post, contact AWS Support.

Want more AWS Security news? Follow us on Twitter.

Author

Maitreya Ranganath

Maitreya is an AWS Security Solutions Architect. He enjoys helping customers solve security and compliance challenges and architect scalable and cost-effective solutions on AWS.

Mark Keating

Mark Keating

Mark is an AWS Security Solutions Architect based out of the U.K. who works with Global Healthcare & Life Sciences and Automotive customers to solve their security and compliance challenges and help them reduce risk. He has over 20 years of experience working with technology, within in operations, solution, and enterprise architecture roles.