Post Syndicated from Rich Vorwaller original https://aws.amazon.com/blogs/security/improve-your-security-investigations-with-detective-finding-groups-visualizations/
At AWS, we often hear from customers that they want expanded security coverage for the multiple services that they use on AWS. However, alert fatigue is a common challenge that customers face as we introduce new security protections. The challenge becomes how to operationalize, identify, and prioritize alerts that represent real risk.
In this post, we highlight recent enhancements to Amazon Detective finding groups visualizations. We show you how Detective automatically consolidates multiple security findings into a single security event—called finding groups—and how finding group visualizations help reduce noise and prioritize findings that present true risk. We incorporate additional services like Amazon GuardDuty, Amazon Inspector, and AWS Security Hub to highlight how effective findings groups is at consolidating findings for different AWS security services.
Overview of solution
This post uses several different services. The purpose is twofold: to show how you can enable these services for broader protection, and to show how Detective can help you investigate findings from multiple services without spending a lot of time sifting through logs or querying multiple data sources to find the root cause of a security event. These are the services and their use cases:
- GuardDuty – a threat detection service that continuously monitors your AWS accounts and workloads for malicious activity. If potential malicious activity, such as anomalous behavior, credential exfiltration, or command and control (C2) infrastructure communication is detected, GuardDuty generates detailed security findings that you can use for visibility and remediation. Recently, GuardDuty released the following threat detections for specific services that we’ll show you how to enable for this walkthrough: GuardDuty RDS Protection, EKS Runtime Monitoring, and Lambda Protection.
- Amazon Inspector – an automated vulnerability management service that continually scans your AWS workloads for software vulnerabilities and unintended network exposure. Like GuardDuty, Amazon Inspector sends a finding for alerting and remediation when it detects a software vulnerability or a compute instance that’s publicly available.
- Security Hub – a cloud security posture management service that performs automated, continuous security best practice checks against your AWS resources to help you identify misconfigurations, and aggregates your security findings from integrated AWS security services.
- Detective – a security service that helps you investigate potential security issues. It does this by collecting log data from AWS CloudTrail, Amazon Virtual Private Cloud (Amazon VPC) flow logs, and other services. Detective then uses machine learning, statistical analysis, and graph theory to build a linked set of data called a security behavior graph that you can use to conduct faster and more efficient security investigations.
The following diagram shows how each service delivers findings along with log sources to Detective.
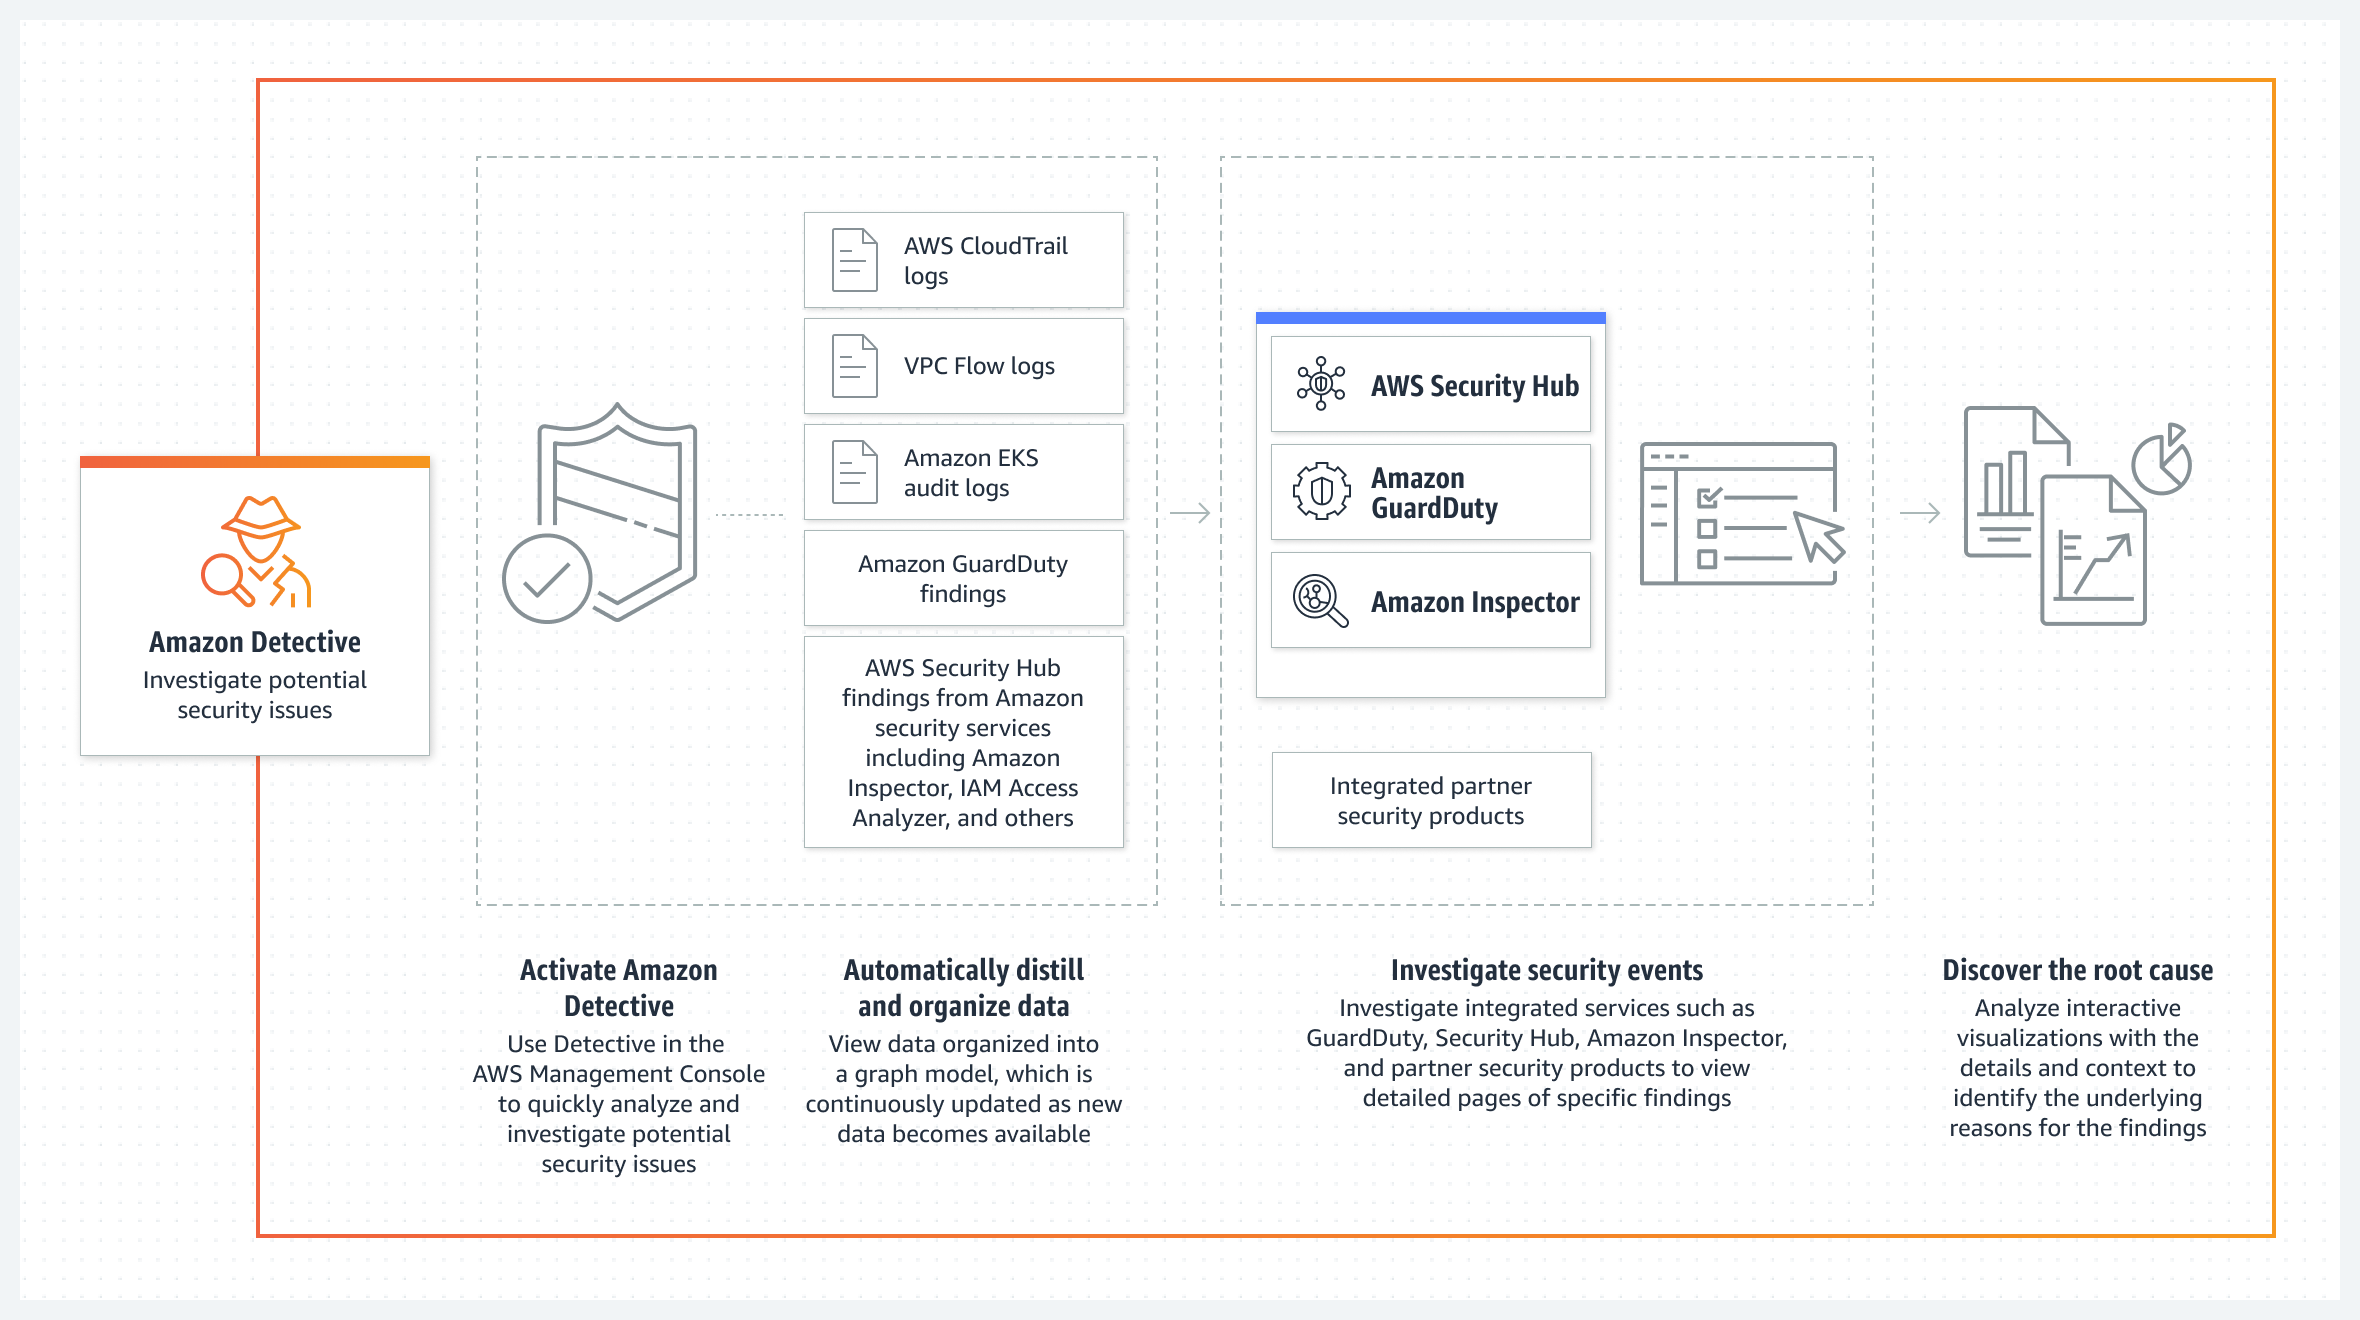
Figure 1: Amazon Detective log source diagram
Enable the required services
If you’ve already enabled the services needed for this post—GuardDuty, Amazon Inspector, Security Hub, and Detective—skip to the next section. For instructions on how to enable these services, see the following resources:
- Getting started with GuardDuty
- Getting started with Amazon Inspector
- Enabling Security Hub manually
- Enabling Amazon Detective
Each of these services offers a free 30-day trial and provides estimates on charges after your trial expires. You can also use the AWS Pricing Calculator to get an estimate.
To enable the services across multiple accounts, consider using a delegated administrator account in AWS Organizations. With a delegated administrator account, you can automatically enable services for multiple accounts and manage settings for each account in your organization. You can view other accounts in the organization and add them as member accounts, making central management simpler. For instructions on how to enable the services with AWS Organizations, see the following resources:
- Managing GuardDuty accounts with AWS Organizations
- AWS Security Hub and AWS Organizations
- Amazon Inspector with AWS Organizations
- Amazon Detective with AWS Organizations
Enable GuardDuty protections
The next step is to enable the latest detections in GuardDuty and learn how Detective can identify multiple threats that are related to a single security event.
If you’ve already enabled the different GuardDuty protection plans, skip to the next section. If you recently enabled GuardDuty, the protections plans are enabled by default, except for EKS Runtime Monitoring, which is a two-step process.
For the next steps, we use the delegated administrator account in GuardDuty to make sure that the protection plans are enabled for each AWS account. When you use GuardDuty (or Security Hub, Detective, and Inspector) with AWS Organizations, you can designate an account to be the delegated administrator. This is helpful so that you can configure these security services for multiple accounts at the same time. For instructions on how to enable a delegated administrator account for GuardDuty, see Managing GuardDuty accounts with AWS Organizations.
To enable EKS Protection
- Sign in to the GuardDuty console using the delegated administrator account, choose Protection plans, and then choose EKS Protection.
- In the Delegated administrator section, choose Edit and then choose Enable for each scope or protection. For this post, select EKS Audit Log Monitoring, EKS Runtime Monitoring, and Manage agent automatically, as shown in Figure 2. For more information on each feature, see the following resources:
- EKS Audit Log Monitoring
- EKS Runtime Monitoring

Figure 2: Enable EKS Runtime Monitoring
- To enable these protections for current accounts, in the Active member accounts section, choose Edit and Enable for each scope of protection.
- To enable these protections for new accounts, in the New account default configuration section, choose Edit and Enable for each scope of protection.

To enable RDS Protection
The next step is to enable RDS Protection. GuardDuty RDS Protection works by analysing RDS login activity for potential threats to your Amazon Aurora databases (MySQL-Compatible Edition and Aurora PostgreSQL-Compatible Editions). Using this feature, you can identify potentially suspicious login behavior and then use Detective to investigate CloudTrail logs, VPC flow logs, and other useful information around those events.
- Navigate to the RDS Protection menu and under Delegated administrator (this account), select Enable and Confirm.
- In the Enabled for section, select Enable all if you want RDS Protection enabled on all of your accounts. If you want to select a specific account, choose Manage Accounts and then select the accounts for which you want to enable RDS Protection. With the accounts selected, choose Edit Protection Plans, RDS Login Activity, and Enable for X selected account.
- (Optional) For new accounts, turn on Auto-enable RDS Login Activity Monitoring for new member accounts as they join your organization.
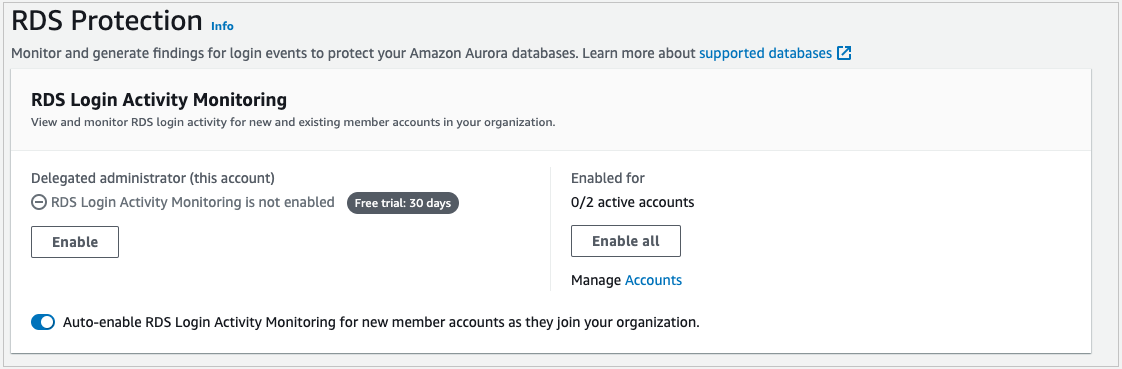
Figure 2: Enable EKS Runtime Monitoring
To enable Lambda Protection
The final step is to enable Lambda Protection. Lambda Protection helps detect potential security threats during the invocation of AWS Lambda functions. By monitoring network activity logs, GuardDuty can generate findings when Lambda functions are involved with malicious activity, such as communicating with command and control servers.
- Navigate to the Lambda Protection menu and under Delegated administrator (this account), select Enable and Confirm.
- In the Enabled for section, select Enable all if you want Lambda Protection enabled on all of your accounts. If you want to select a specific account, choose Manage Accounts and select the accounts for which you want to enable RDS Protection. With the accounts selected, choose Edit Protection Plans, Lambda Network Activity Monitoring, and Enable for X selected account.
- (Optional) For new accounts, turn on Auto-enable Lambda Network Activity Monitoring for new member accounts as they join your organization.
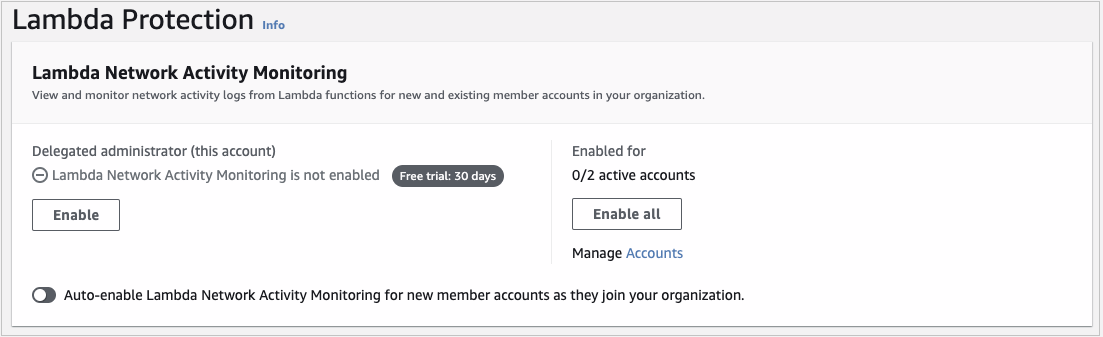
Figure 4: Enable Lambda Network Activity Monitoring
Now that you’ve enabled these new protections, GuardDuty will start monitoring EKS audit logs, EKS runtime activity, RDS login activity, and Lambda network activity. If GuardDuty detects suspicious or malicious activity for these log sources or services, it will generate a finding for the activity, which you can review in the GuardDuty console. In addition, you can automatically forward these findings to Security Hub for consolidation, and to Detective for security investigation.
Detective data sources
If you have Security Hub and other AWS security services such as GuardDuty or Amazon Inspector enabled, findings from these services are forwarded to Security Hub. With the exception of sensitive data findings from Amazon Macie, you’re automatically opted in to other AWS service integrations when you enable Security Hub. For the full list of services that forward findings to Security Hub, see Available AWS service integrations.
With each service enabled and forwarding findings to Security Hub, the next step is to enable the data source in Detective called AWS security findings, which are the findings forwarded to Security Hub. Again, we’re going to use the delegated administrator account for these steps to make sure that AWS security findings are being ingested for your accounts.
To enable AWS security findings
- Sign in to the Detective console using the delegated administrator account and navigate to Settings and then General.
- Choose Optional source packages, Edit, select AWS security findings, and then choose Save.

Figure 5: Enable AWS security findings

When you enable Detective, it immediately starts creating a security behavior graph for AWS security findings to build a linked dataset between findings and entities, such as RDS login activity from Aurora databases, EKS runtime activity, and suspicious network activity for Lambda functions. For GuardDuty to detect potential threats that affect your database instances, it first needs to undertake a learning period of up to two weeks to establish a baseline of normal behavior. For more information, see How RDS Protection uses RDS login activity monitoring. For the other protections, after suspicious activity is detected, you can start to see findings in both GuardDuty and Security Hub consoles. This is where you can start using Detective to better understand which findings are connected and where to prioritize your investigations.
Detective behavior graph
As Detective ingests data from GuardDuty, Amazon Inspector, and Security Hub, as well as CloudTrail logs, VPC flow logs, and Amazon Elastic Kubernetes Service (Amazon EKS) audit logs, it builds a behavior graph database. Graph databases are purpose-built to store and navigate relationships. Relationships are first-class citizens in graph databases, which means that they’re not computed out-of-band or by interfering with relationships through querying foreign keys. Because Detective stores information on relationships in your graph database, you can effectively answer questions such as “are these security findings related?”. In Detective, you can use the search menu and profile panels to view these connections, but a quicker way to see this information is by using finding groups visualizations.
Finding groups visualizations
Finding groups extract additional information out of the behavior graph to highlight findings that are highly connected. Detective does this by running several machine learning algorithms across your behavior graph to identify related findings and then statically weighs the relationships between those findings and entities. The result is a finding group that shows GuardDuty and Amazon Inspector findings that are connected, along with entities like Amazon Elastic Compute Cloud (Amazon EC2) instances, AWS accounts, and AWS Identity and Access Management (IAM) roles and sessions that were impacted by these findings. With finding groups, you can more quickly understand the relationships between multiple findings and their causes because you don’t need to connect the dots on your own. Detective automatically does this and presents a visualization so that you can see the relationships between various entities and findings.
Enhanced visualizations
Recently, we released several enhancements to finding groups visualizations to aid your understanding of security connections and root causes. These enhancements include:
- Dynamic legend – the legend now shows icons for entities that you have in the finding group instead of showing all available entities. This helps reduce noise to only those entities that are relevant to your investigation.
- Aggregated evidence and finding icons – these icons provide a count of similar evidence and findings. Instead of seeing the same finding or evidence repeated multiple times, you’ll see one icon with a counter to help reduce noise.
- More descriptive side panel information – when you choose a finding or entity, the side panel shows additional information, such as the service that identified the finding and the finding title, in addition to the finding type, to help you understand the action that invoked the finding.
- Label titles – you can now turn on or off titles for entities and findings in the visualization so that you don’t have to choose each to get a summary of what the different icons mean.
To use the finding groups visualization
- Open the Detective console, choose Summary, and then choose View all finding groups.
- Choose the title of an available finding group and scroll down to Visualization.
- Under the Select layout menu, choose one of the layouts available, or choose and drag each icon to rearrange the layout according to how you’d like to see connections.
- For a complete list of involved entities and involved findings, scroll down below the visualization.
Figure 6 shows an example of how you can use finding groups visualization to help identify the root cause of findings quickly. In this example, an IAM role was connected to newly observed geolocations, multiple GuardDuty findings detected malicious API calls, and there were newly observed user agents from the IAM session. The visualization can give you high confidence that the IAM role is compromised. It also provides other entities that you can search against, such as the IP address, S3 bucket, or new user agents.
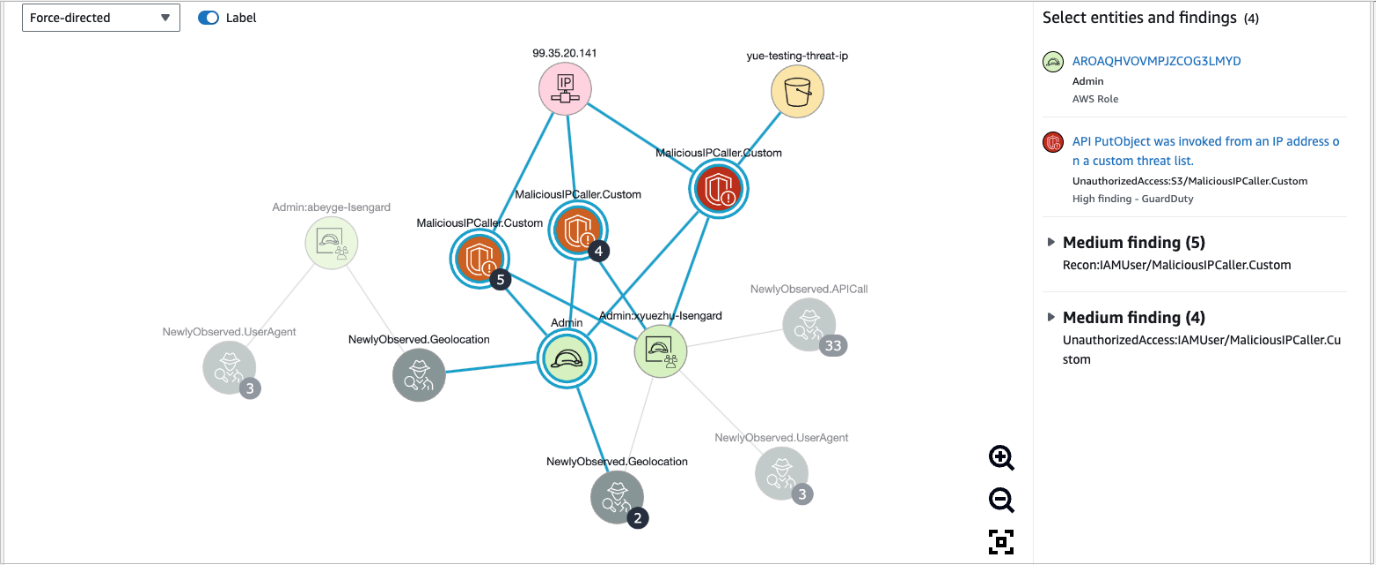
Figure 6: Finding groups visualization
Now that you have the new GuardDuty protections enabled along with the data source of AWS security findings, you can use finding groups to more quickly visualize which IAM sessions have had multiple findings associated with unauthorized access, or which EC2 instances are publicly exposed with a software vulnerability and active GuardDuty finding—these patterns can help you determine if there is an actual risk.
Conclusion
In this blog post, you learned how to enable new GuardDuty protections and use Detective, finding groups, and visualizations to better identify, operationalize, and prioritize AWS security findings that represent real risk. We also highlighted the new enhancements to visualizations that can help reduce noise and provide summaries of detailed information to help reduce the time it takes to triage findings. If you’d like to see an investigation scenario using Detective, watch the video Amazon Detective Security Scenario Investigation.
If you have feedback about this post, submit comments in the Comments section below. You can also start a new thread on Amazon Detective re:Post or contact AWS Support.
Want more AWS Security how-to content, news, and feature announcements? Follow us on Twitter.


 Anand Komandooru is a Senior Cloud Architect at AWS. He joined AWS Professional Services organization in 2021 and helps customers build cloud-native applications on AWS cloud. He has over 20 years of experience building software and his favorite Amazon leadership principle is “
 Li Liu is a Senior Database Specialty Architect with the Professional Services team at Amazon Web Services. She helps customers migrate traditional on-premise databases to the AWS Cloud. She specializes in database design, architecture, and performance tuning.
 Neil Potter is a Senior Cloud Application Architect at AWS. He works with AWS customers to help them migrate their workloads to the AWS Cloud. He specializes in application modernization and cloud-native design and is based in New Jersey.
 Vivek Shrivastava is a Principal Data Architect, Data Lake in AWS Professional Services. He is a big data enthusiast and holds 14 AWS Certifications. He is passionate about helping customers build scalable and high-performance data analytics solutions in the cloud. In his spare time, he loves reading and finds areas for home automation.


 Sandeep Adwankar is a Senior Technical Product Manager at AWS. Based in the California Bay Area, he works with customers around the globe to translate business and technical requirements into products that enable customers to improve how they manage, secure, and access data.
 Srividya Parthasarathy is a Senior Big Data Architect on the AWS Lake Formation team. She enjoys building data mesh solutions and sharing them with the community.
 Mahesh Mishra is a Principal Product Manager with AWS Lake Formation team. He works with many of AWS largest customers on emerging technology needs, and leads several data and analytics initiatives within AWS including strong support for Transactional Data Lakes.


 Hernan Garcia is a Senior Solutions Architect at AWS, based out of Amsterdam, working in the Financial Services Industry since 2018. He specializes in application modernization and supports his customers in the adoption of cloud operating models and serverless technologies.
 Parnab Basak is a Solutions Architect and a Serverless Specialist at AWS. He specializes in creating new solutions that are cloud native using modern software development practices like serverless, DevOps, and analytics. Parnab works closely in the analytics and integration services space helping customers adopt AWS services for their workflow orchestration needs.
 Shubham Mehta is an experienced product manager with over eight years of experience and a proven track record of delivering successful products. In his current role as a Senior Product Manager at AWS, he oversees Amazon Managed Workflows for Apache Airflow (Amazon MWAA) and spearheads the Apache Airflow open-source contributions to further enhance the product’s functionality.


 Virendhar (Viru) Sivaraman is a strategic Senior Big Data & Analytics Architect with Amazon Web Services. He is passionate about building scalable big data and analytics solutions in the cloud. Besides work, he enjoys spending time with family, hiking & mountain biking.
 Vivek Shrivastava is a Principal Data Architect, Data Lake in AWS Professional Services. He is a Bigdata enthusiast and holds 14 AWS Certifications. He is passionate about helping customers build scalable and high-performance data analytics solutions in the cloud. In his spare time, he loves reading and finds areas for home automation.


 Tom Romano is a Sr. Solutions Architect for AWS World Wide Public Sector from Tampa, FL, and assists GovTech and EdTech customers as they create new solutions that are cloud native, event driven, and serverless. He is an enthusiastic Python programmer for both application development and data analytics, and is an Analytics Specialist. In his free time, Tom flies remote control model airplanes and enjoys vacationing with his family around Florida and the Caribbean.
 Shane Thompson is a Sr. Solutions Architect based out of San Luis Obispo, California, working with AWS Startups. He works with customers who use AI/ML in their business model and is passionate about democratizing AI/ML so that all customers can benefit from it. In his free time, Shane loves to spend time with his family and travel around the world.
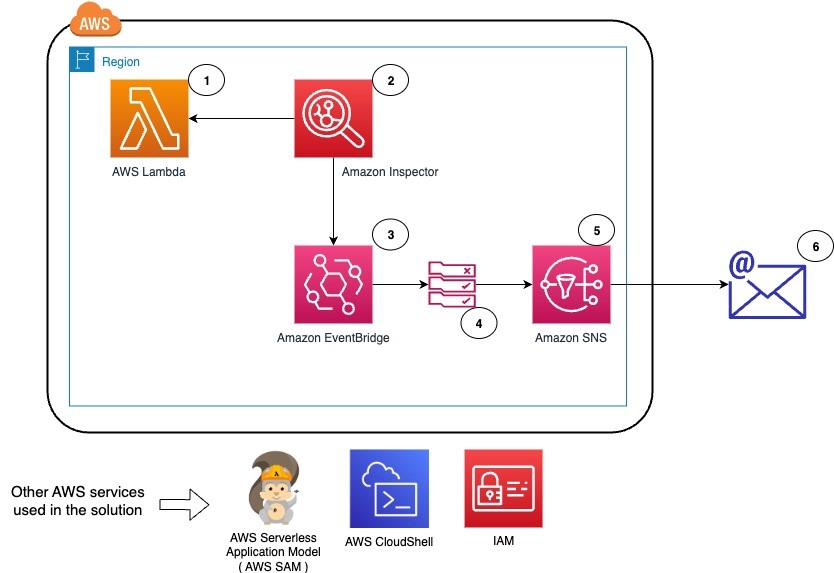


 Deepthi Mohan is a Principal Product Manager on the Amazon Kinesis Data Analytics team.
 Karthi Thyagarajan was a Principal Solutions Architect on the Amazon Kinesis team.


 Rohit Vashishtha is a Senior Analytics Specialist Solutions Architect at AWS based in Dallas, Texas. He has 17 years of experience architecting, building, leading, and maintaining big data platforms. Rohit helps customers modernize their analytic workloads using the breadth of AWS services and ensures that customers get the best price/performance with utmost security and data governance.


 Yadukishore Tatavarthi is a Senior Partner Solutions Architect supporting Healthcare and life science customers at Amazon Web Services. He has been helping the customers over the last 20 years in building the enterprise data strategies, advising customers on cloud implementations, migrations, reference architecture creation, data modeling best practices, data lake/warehouses architecture, and other technical processes.
 Sudhir Gupta is a Principal Partner Solutions Architect, Analytics Specialist at AWS with over 18 years of experience in Databases and Analytics. He helps AWS partners and customers design, implement, and migrate large-scale data & analytics (D&A) workloads. As a trusted advisor to partners, he enables partners globally on AWS D&A services, builds solutions/accelerators, and leads go-to-market initiatives
 Deepak Singh is a Senior Solutions Architect at Amazon Web Services with 20+ years of experience in Data & AIA. He enjoys working with AWS partners and customers on building scalable analytical solutions for their business outcomes. When not at work, he loves spending time with family or exploring new technologies in analytics and AI space.


 Matt Nispel is an Enterprise Solutions Architect at AWS. He has more than 10 years of experience building cloud architectures for large enterprise companies. At AWS, Matt helps customers rearchitect their applications to take full advantage of the cloud. Matt lives in Minneapolis, Minnesota, and in his free time enjoys spending time with friends and family.
 Dan Dressel is a Senior Analytics Specialist Solutions Architect at AWS. He is passionate about databases, analytics, machine learning, and architecting solutions. In his spare time, he enjoys spending time with family, nature walking, and playing foosball.
 Ravi Kumar is a Senior Product Manager for Amazon EMR at Amazon Web Services.
 Kevin Wikant is a Software Development Engineer for Amazon EMR at Amazon Web Services.


 Noritaka Sekiyama is a Principal Big Data Architect on the AWS Glue team. He works based in Tokyo, Japan. He is responsible for building software artifacts to help customers. In his spare time, he enjoys cycling with his road bike.


 Noritaka Sekiyama is a Principal Big Data Architect on the AWS Glue team. He works based in Tokyo, Japan. He is responsible for building software artifacts to help customers. In his spare time, he enjoys cycling with his road bike.
 Gal Heyne is a Product Manager for AWS Glue with a strong focus on AI/ML, data engineering, and BI, and is based in California. She is passionate about developing a deep understanding of customers’ business needs and collaborating with engineers to design easy-to-use data products. In her spare time, she enjoys playing card games.