Today, Cloudflare is announcing the development of Firewall for AI, a protection layer that can be deployed in front of Large Language Models (LLMs) to identify abuses before they reach the models.
While AI models, and specifically LLMs, are surging, customers tell us that they are concerned about the best strategies to secure their own LLMs. Using LLMs as part of Internet-connected applications introduces new vulnerabilities that can be exploited by bad actors.
Some of the vulnerabilities affecting traditional web and API applications apply to the LLM world as well, including injections or data exfiltration. However, there is a new set of threats that are now relevant because of the way LLMs work. For example, researchers have recently discovered a vulnerability in an AI collaboration platform that allows them to hijack models and perform unauthorized actions.
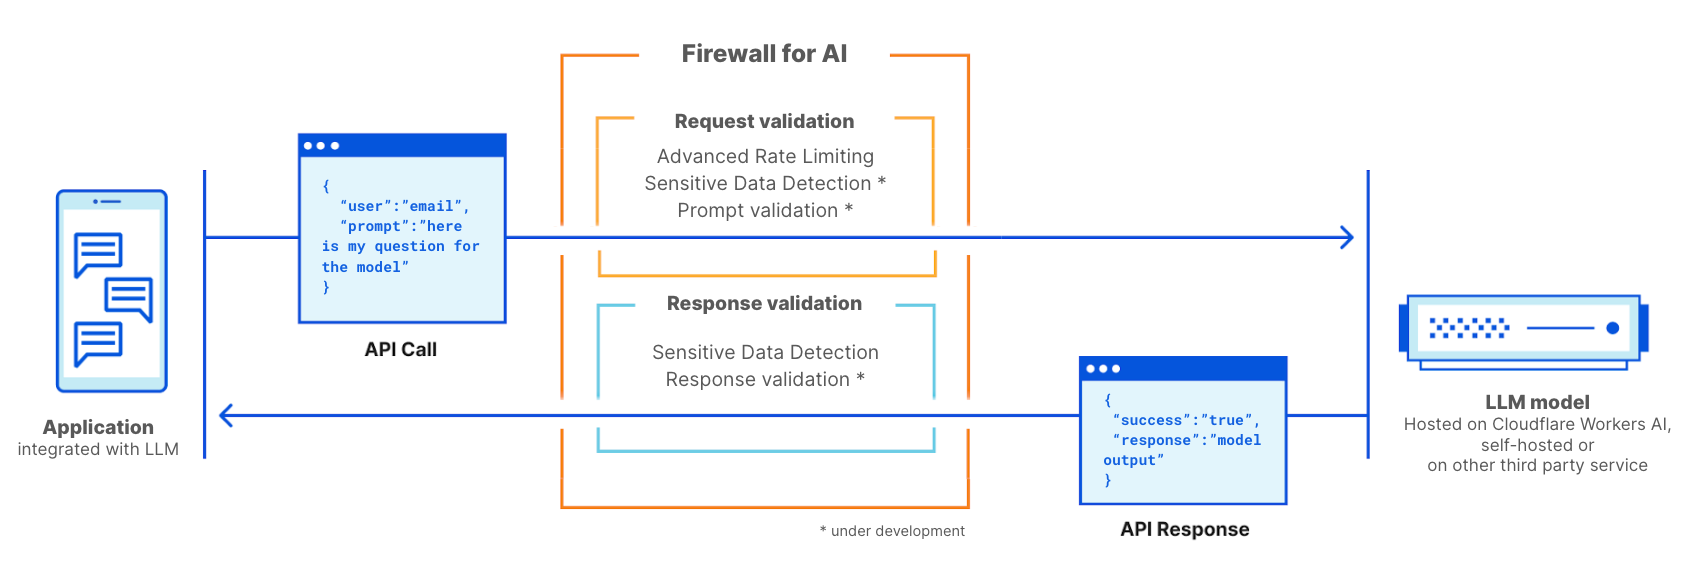
Firewall for AI is an advanced Web Application Firewall (WAF) specifically tailored for applications using LLMs. It will comprise a set of tools that can be deployed in front of applications to detect vulnerabilities and provide visibility to model owners. The tool kit will include products that are already part of WAF, such as Rate Limiting and Sensitive Data Detection, and a new protection layer which is currently under development. This new validation analyzes the prompt submitted by the end user to identify attempts to exploit the model to extract data and other abuse attempts. Leveraging the size of Cloudflare network, Firewall for AI runs as close to the user as possible, allowing us to identify attacks early and protect both end user and models from abuses and attacks.
Before we dig into how Firewall for AI works and its full feature set, let’s first examine what makes LLMs unique, and the attack surfaces they introduce. We’ll use the OWASP Top 10 for LLMs as a reference.
Why are LLMs different from traditional applications?
When considering LLMs as Internet-connected applications, there are two main differences compared with more traditional web apps.
First, the way users interact with the product. Traditional apps are deterministic in nature. Think about a bank application — it’s defined by a set of operations (check my balance, make a transfer, etc.). The security of the business operation (and data) can be obtained by controlling the fine set of operations accepted by these endpoints: “GET /balance” or “POST /transfer”.
LLM operations are non-deterministic by design. To start with, LLM interactions are based on natural language, which makes identifying problematic requests harder than matching attack signatures. Additionally, unless a response is cached, LLMs typically provide a different response every time — even if the same input prompt is repeated. This makes limiting the way a user interacts with the application much more difficult. This poses a threat to the user as well, in terms of being exposed to misinformation that weakens the trust in the model.
Second, a big difference is how the application control plane interacts with the data. In traditional applications, the control plane (code) is well separated from the data plane (database). The defined operations are the only way to interact with the underlying data (e.g. show me the history of my payment transactions). This allows security practitioners to focus on adding checks and guardrails to the control plane and thus protecting the database indirectly.
LLMs are different in that the training data becomes part of the model itself through the training process, making it extremely difficult to control how that data is shared as a result of a user prompt. Some architectural solutions are being explored, such as separating LLMs into different levels and segregating data. However, no silver bullet has yet been found.
From a security perspective, these differences allow attackers to craft new attack vectors that can target LLMs and fly under the radar of existing security tools designed for traditional web applications.
OWASP LLM Vulnerabilities
The OWASP foundation released a list of the top 10 classes of vulnerabilities for LLMs, providing a useful framework for thinking about how to secure language models. Some of the threats are reminiscent of the OWASP top 10 for web applications, while others are specific to language models.
Similar to web applications, some of these vulnerabilities can be best addressed when the LLM application is designed, developed, and trained. For example, Training Data Poisoning can be carried out by introducing vulnerabilities in the training data set used to train new models. Poisoned information is then presented to the user when the model is live. Supply Chain Vulnerabilities and Insecure Plugin Design are vulnerabilities introduced in components added to the model, like third-party software packages.Finally, managing authorization and permissions is crucial when dealing with Excessive Agency,where unconstrained models can perform unauthorized actions within the broader application or infrastructure.
Conversely, Prompt Injection, Model Denial of Service, and Sensitive Information Disclosure can be mitigated by adopting a proxy security solution like Cloudflare Firewall for AI. In the following sections, we will give more details about these vulnerabilities and discuss how Cloudflare is optimally positioned to mitigate them.
LLM deployments
Language model risks also depend on the deployment model. Currently, we see three main deployment approaches: internal, public, and product LLMs. In all three scenarios, you need to protect models from abuses, protect any proprietary data stored in the model, and protect the end user from misinformation or from exposure to inappropriate content.
Internal LLMs: Companies develop LLMs to support the workforce in their daily tasks. These are considered corporate assets and shouldn’t be accessed by non-employees. Examples include an AI co-pilot trained on sales data and customer interactions used to generate tailored proposals, or an LLM trained on an internal knowledge base that can be queried by engineers.
Public LLMs: These are LLMs that can be accessed outside the boundaries of a corporation. Often these solutions have free versions that anyone can use and they are often trained on general or public knowledge. Examples include GPT from OpenAI or Claude from Anthropic.
Product LLM: From a corporate perspective, LLMs can be part of a product or service offered to their customers. These are usually self-hosted, tailored solutions that can be made available as a tool to interact with the company resources. Examples include customer support chatbots or Cloudflare AI Assistant.
From a risk perspective, the difference between Product and Public LLMs is about who carries the impact of successful attacks. Public LLMs are considered a threat to data because data that ends up in the model can be accessed by virtually anyone. This is one of the reasons many corporations advise their employees not to use confidential information in prompts for publicly available services. Product LLMs can be considered a threat to companies and their intellectual property if models had access to proprietary information during training (by design or by accident).
Firewall for AI
Cloudflare Firewall for AI will be deployed like a traditional WAF, where every API request with an LLM prompt is scanned for patterns and signatures of possible attacks.
Firewall for AI can be deployed in front of models hosted on the Cloudflare Workers AI platform or models hosted on any other third party infrastructure. It can also be used alongside Cloudflare AI Gateway, and customers will be able to control and set up Firewall for AI using the WAF control plane.
Firewall for AI works like a traditional web application firewall. It is deployed in front of an LLM application and scans every request to identify attack signatures
Prevent volumetric attacks
One of the threats listed by OWASP is Model Denial of Service. Similar to traditional applications, a DoS attack is carried out by consuming an exceptionally high amount of resources, resulting in reduced service quality or potentially increasing the costs of running the model. Given the amount of resources LLMs require to run, and the unpredictability of user input, this type of attack can be detrimental.
This risk can be mitigated by adopting rate limiting policies that control the rate of requests from individual sessions, therefore limiting the context window. By proxying your model through Cloudflare today, you get DDoS protection out of the box. You can also use Rate Limiting and Advanced Rate Limiting to manage the rate of requests allowed to reach your model by setting a maximum rate of request performed by an individual IP address or API key during a session.
Identify sensitive information with Sensitive Data Detection
There are two use cases for sensitive data, depending on whether you own the model and data, or you want to prevent users from sending data into public LLMs.
As defined by OWASP, Sensitive Information Disclosure happens when LLMs inadvertently reveal confidential data in the responses, leading to unauthorized data access, privacy violations, and security breaches. One way to prevent this is to add strict prompt validations. Another approach is to identify when personally identifiable information (PII) leaves the model. This is relevant, for example, when a model was trained with a company knowledge base that may include sensitive information, such asPII (like social security number), proprietary code, or algorithms.
Customers using LLM models behind Cloudflare WAF can employ the Sensitive Data Detection (SDD) WAF managed ruleset to identify certain PII being returned by the model in the response. Customers can review the SDD matches on WAF Security Events. Today, SDD is offered as a set of managed rules designed to scan for financial information (such as credit card numbers) as well as secrets (API keys). As part of the roadmap, we plan to allow customers to create their own custom fingerprints.
The other use case is intended to prevent users from sharing PII or other sensitive information with external LLM providers, such as OpenAI or Anthropic. To protect from this scenario, we plan to expand SDD to scan the request prompt and integrate its output with AI Gateway where, alongside the prompt’s history, we detect if certain sensitive data has been included in the request. We will start by using the existing SDD rules, and we plan to allow customers to write their own custom signatures. Relatedly, obfuscation is another feature we hear a lot of customers talk about. Once available, the expanded SDD will allow customers to obfuscate certain sensitive data in a prompt before it reaches the model. SDD on the request phase is being developed.
Preventing model abuses
Model abuse is a broader category of abuse. It includes approaches like “prompt injection” or submitting requests that generate hallucinations or lead to responses that are inaccurate, offensive, inappropriate, or simply off-topic.
Prompt Injection is an attempt to manipulate a language model through specially crafted inputs, causing unintended responses by the LLM. The results of an injection can vary, from extracting sensitive information to influencing decision-making by mimicking normal interactions with the model. A classic example of prompt injection is manipulating a CV to affect the output of resume screening tools.
A common use case we hear from customers of our AI Gateway is that they want to avoid their application generating toxic, offensive, or problematic language. The risks of not controlling the outcome of the model include reputational damage and harming the end user by providing an unreliable response.
These types of abuse can be managed by adding an additional layer of protection that sits in front of the model. This layer can be trained to block injection attempts or block prompts that fall into categories that are inappropriate.
Prompt and response validation
Firewall for AI will run a series of detections designed to identify prompt injection attempts and other abuses, such as making sure the topic stays within the boundaries defined by the model owner. Like other existing WAF features, Firewall for AI will automatically look for prompts embedded in HTTP requests or allow customers to create rules based on where in the JSON body of the request the prompt can be found.
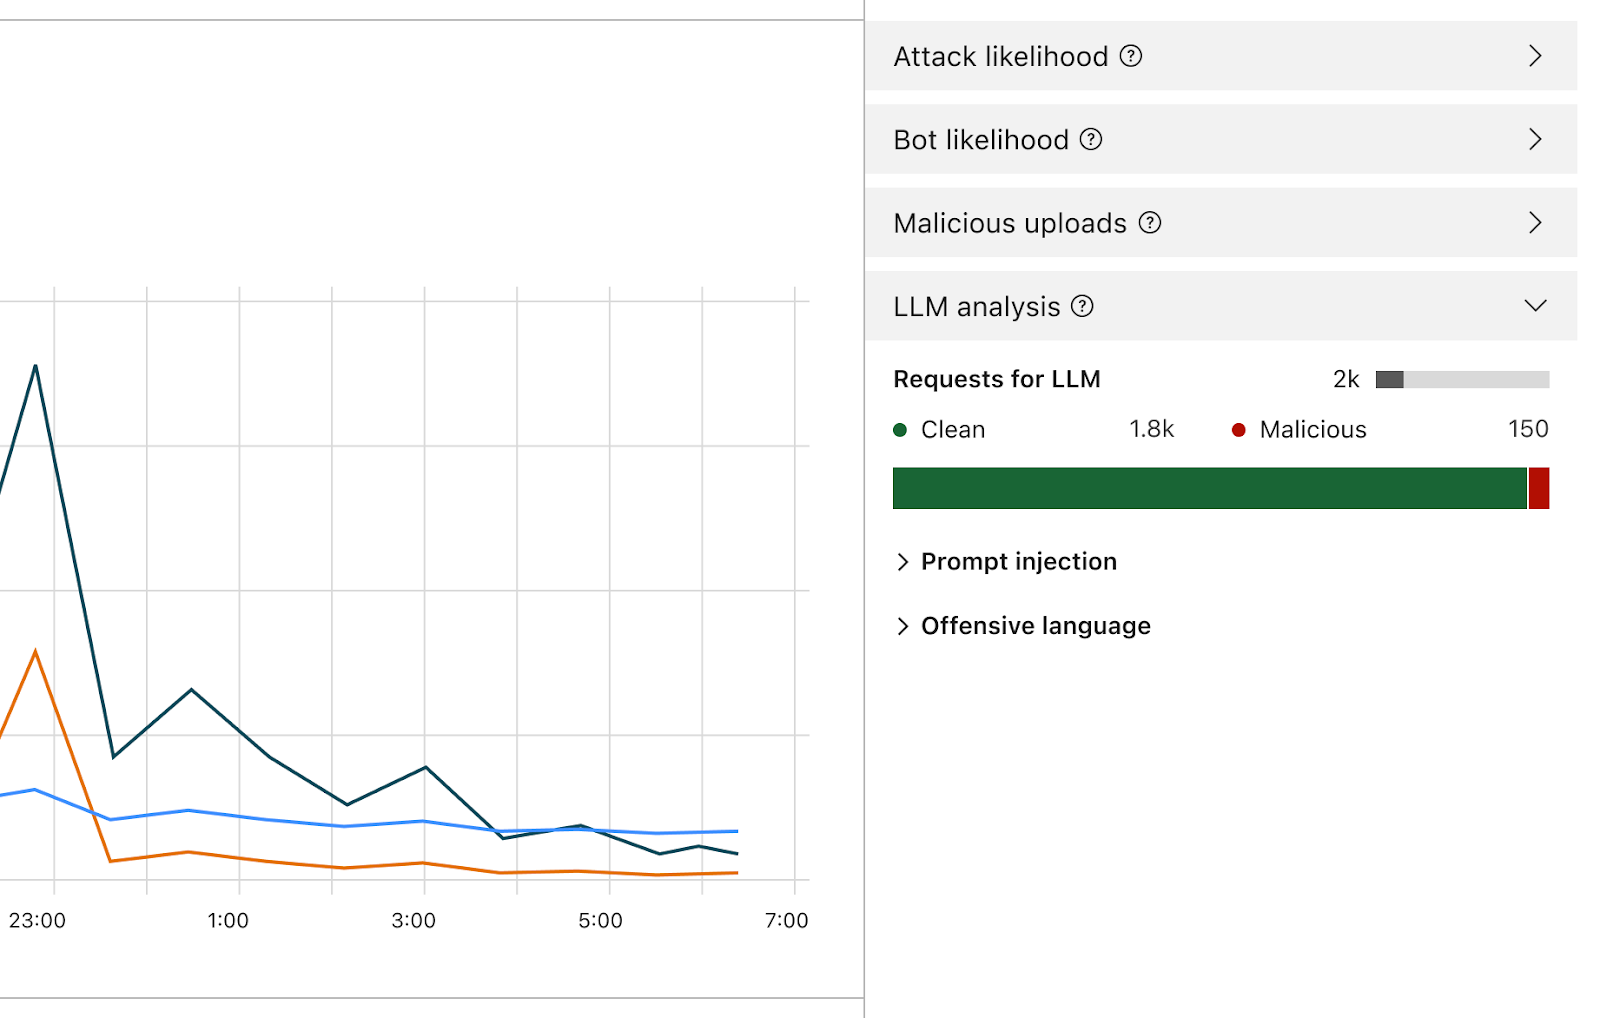
Once enabled, the Firewall will analyze every prompt and provide a score based on the likelihood that it’s malicious. It will also tag the prompt based on predefined categories. The score ranges from 1 to 99 which indicates the likelihood of a prompt injection, with 1 being the most likely.
Customers will be able to create WAF rules to block or handle requests with a particular score in one or both of these dimensions. You’ll be able to combine this score with other existing signals (like bot score or attack score) to determine whether the request should reach the model or should be blocked. For example, it could be combined with a bot score to identify if the request was malicious and generated by an automated source.
Detecting prompt injections and prompt abuse is part of the scope of Firewall for AI. Early iteration of the product design
Besides the score, we will assign tags to each prompt that can be used when creating rules to prevent prompts belonging to any of these categories from reaching their model. For example, customers will be able to create rules to block specific topics. This includes prompts using words categorized as offensive, or linked to religion, sexual content, or politics, for example.
How can I use Firewall for AI? Who gets this?
Enterprise customers on the Application Security Advanced offering can immediately start using Advanced Rate Limiting and Sensitive Data Detection (on the response phase). Both products can be found in the WAF section of the Cloudflare dashboard. Firewall for AI’s prompt validation feature is currently under development and a beta version will be released in the coming months to all Workers AI users. Sign up to join the waiting list and get notified when the feature becomes available.
Conclusion
Cloudflare is one of the first security providers launching a set of tools to secure AI applications. Using Firewall for AI, customers can control what prompts and requests reach their language models, reducing the risk of abuses and data exfiltration. Stay tuned to learn more about how AI application security is evolving.
For many network security operators, protecting application uptime can be a time-consuming challenge of baselining network traffic, investigating suspicious senders, and determining how best to mitigate risks. Simplifying this process and understanding network security posture at all times is the goal of most IT organizations that are trying to scale their applications without also needing to scale their security operations center staff. To help you with this challenge, AWS WAF introduced traffic overview dashboards so that you can make informed decisions about your security posture when your application is protected by AWS WAF.
In this post, we introduce the new dashboards and delve into a few use cases to help you gain better visibility into the overall security of your applications using AWS WAF and make informed decisions based on insights from the dashboards.
Introduction to traffic overview dashboards
The traffic overview dashboard in AWS WAF displays an overview of security-focused metrics so that you can identify and take action on security risks in a few clicks, such as adding rate-based rules during distributed denial of service (DDoS) events. The dashboards include near real-time summaries of the Amazon CloudWatch metrics that AWS WAF collects when it evaluates your application web traffic.
These dashboards are available by default and require no additional setup. They show metrics—total requests, blocked requests, allowed requests, bot compared to non-bot requests, bot categories, CAPTCHA solve rate, top 10 matched rules, and more—for each web access control list (web ACL) that you monitor with AWS WAF.
You can access default metrics such as the total number of requests, blocked requests, and common attacks blocked, or you can customize your dashboard with the metrics and visualizations that are most important to you.
These dashboards provide enhanced visibility and help you answer questions such as these:
What percent of the traffic that AWS WAF inspected is getting blocked?
What are the top originating countries for the traffic that’s getting blocked?
What are common attacks that AWS WAF detects and protects me from?
How do my traffic patterns from this week compare with last week?
The dashboard has native and out-of-the-box integration with CloudWatch. Using this integration, you can navigate back and forth between the dashboard and CloudWatch; for example, you can get a more granular metric overview by viewing the dashboard in CloudWatch. You can also add existing CloudWatch widgets and metrics to the traffic overview dashboard, bringing your tried-and-tested visibility structure into the dashboard.
With the introduction of the traffic overview dashboard, one AWS WAF tool—Sampled requests—is now a standalone tab inside a web ACL. In this tab, you can view a graph of the rule matches for web requests that AWS WAF has inspected. Additionally, if you have enabled request sampling, you can see a table view of a sample of the web requests that AWS WAF has inspected.
The sample of requests contains up to 100 requests that matched the criteria for a rule in the web ACL and another 100 requests for requests that didn’t match rules and thus had the default action for the web ACL applied. The requests in the sample come from the protected resources that have received requests for your content in the previous three hours.
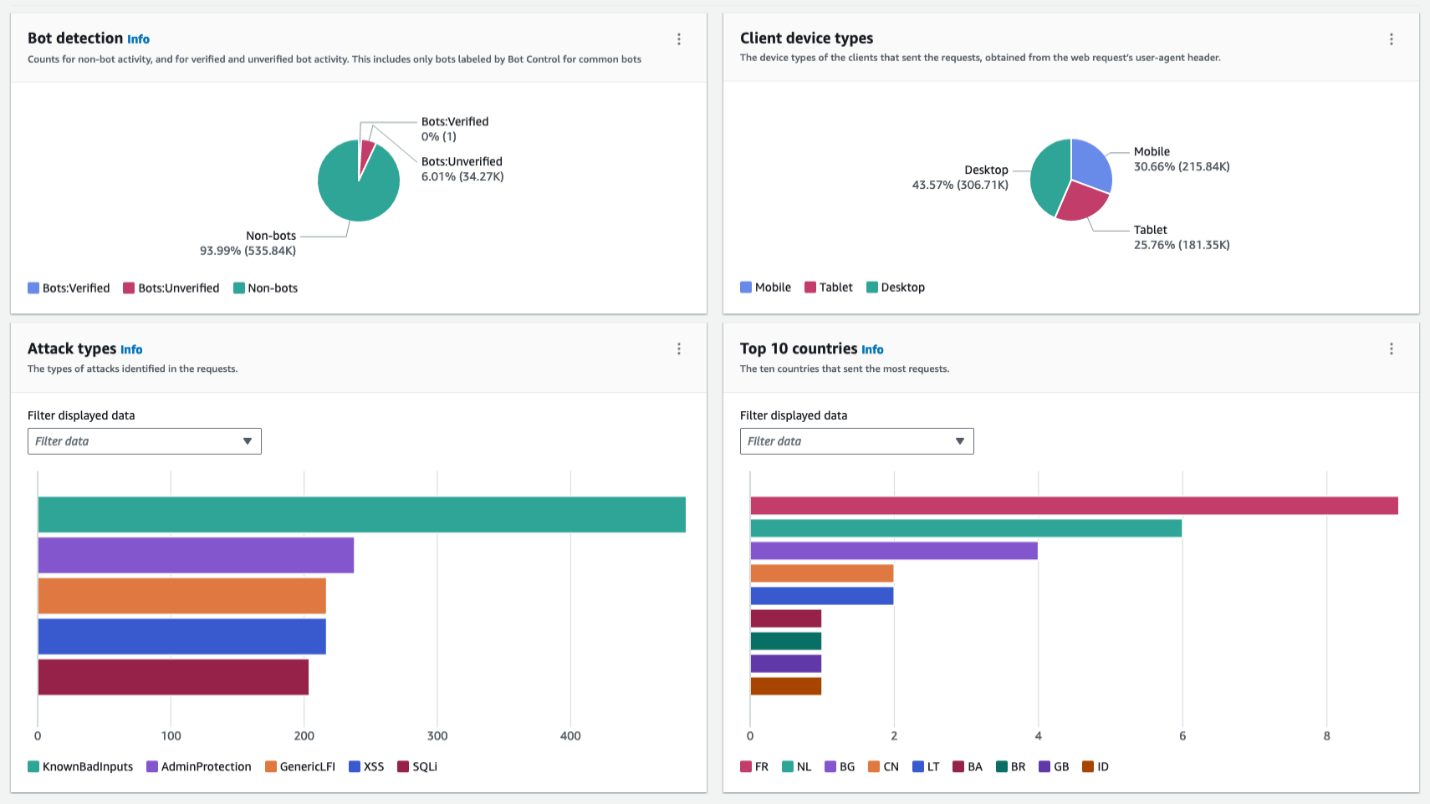
The following figure shows a typical layout for the traffic overview dashboard. It categorizes inspected requests with a breakdown of each of the categories that display actionable insights, such as attack types, client device types, and countries. Using this information and comparing it with your expected traffic profile, you can decide whether to investigate further or block the traffic right away. For the example in Figure 1, you might want to block France-originating requests from mobile devices if your web application isn’t supposed to receive traffic from France and is a desktop-only application.
Figure 1: Dashboard with sections showing multiple categories serves as a single pane of glass
Use case 1: Analyze traffic patterns with the dashboard
In addition to visibility into your web traffic, you can use the new dashboard to analyze patterns that could indicate potential threats or issues. By reviewing the dashboard’s graphs and metrics, you can spot unusual spikes or drops in traffic that deserve further investigation.
The top-level overview shows the high-level traffic volume and patterns. From there, you can drill down into the web ACL metrics to see traffic trends and metrics for specific rules and rule groups. The dashboard displays metrics such as allowed requests, blocked requests, and more.
Notifications or alerts about a deviation from expected traffic patterns provide you a signal to explore the event. During your exploration, you can use the dashboard to understand the broader context and not just the event in isolation. This makes it simpler to detect a trend in anomalies that could signify a security event or misconfigured rules. For example, if you normally get 2,000 requests per minute from a particular country, but suddenly see 10,000 requests per minute from it, you should investigate. Using the dashboard, you can look at the traffic across various dimensions. The spike in requests alone might not be a clear indication of a threat, but if you see an additional indicator, such as an unexpected device type, this could be a strong reason for you to take follow-up action.
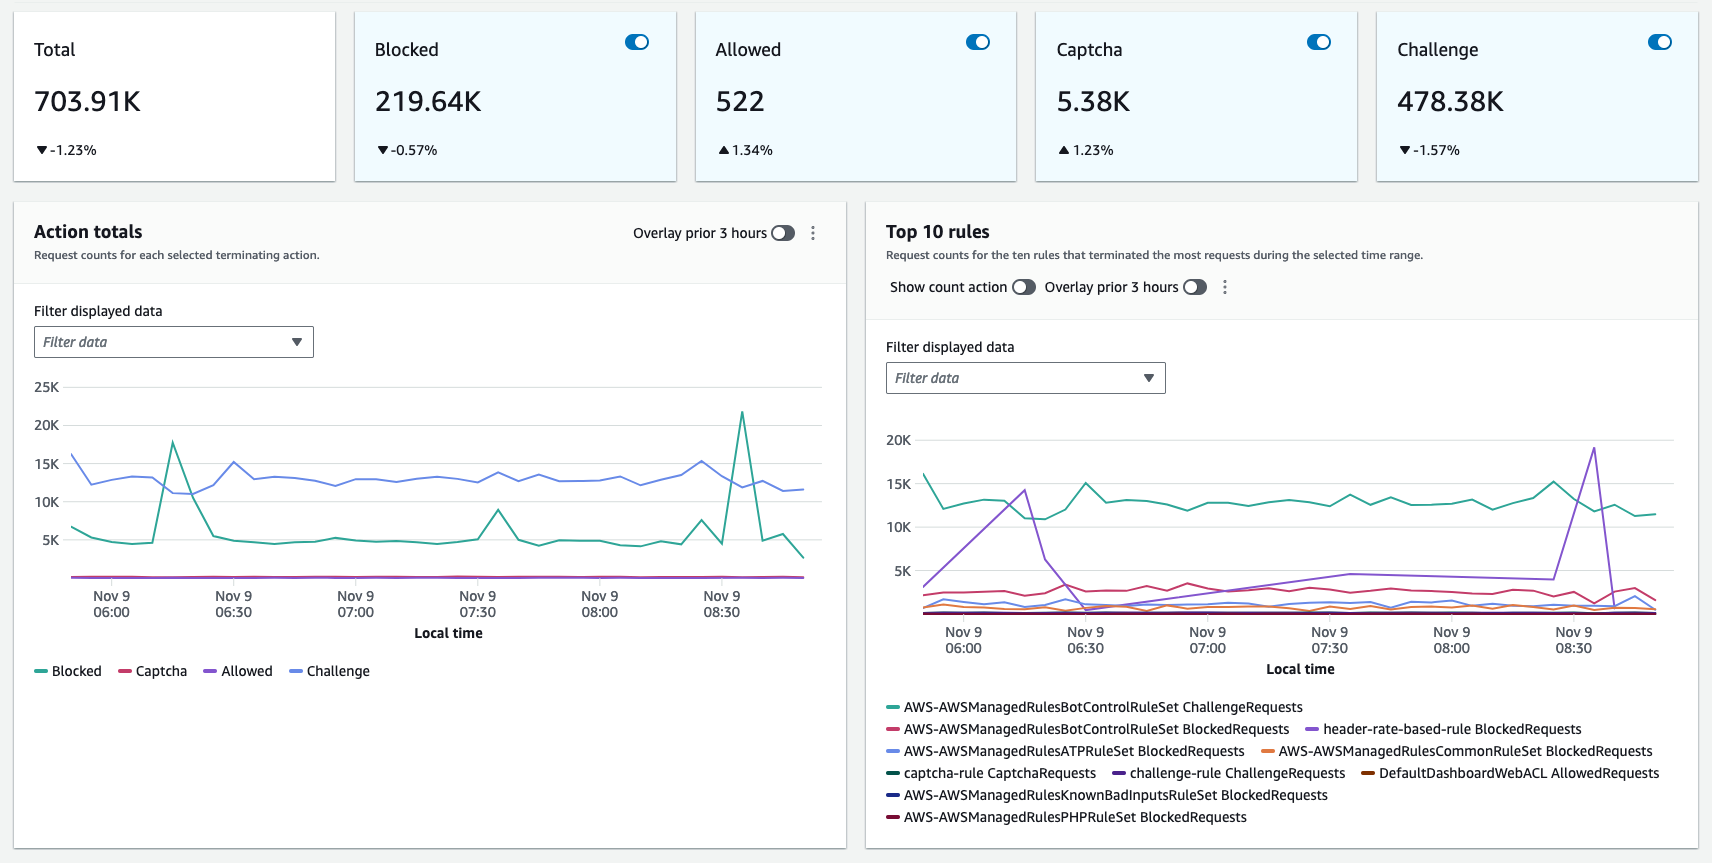
The following figure shows the actions taken by rules in a web ACL and which rule matched the most.
Figure 2: Multidimensional overview of the web requests
The dashboard also shows the top blocked and allowed requests over time. Check whether unusual spikes in blocked requests correspond to spikes in traffic from a particular IP address, country, or user agent. That could indicate attempted malicious activity or bot traffic.
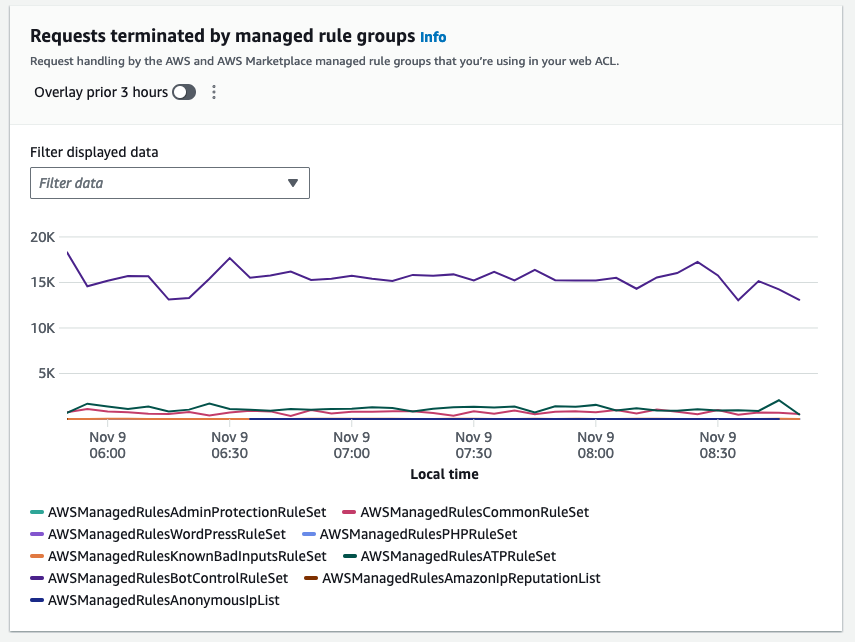
The following figure shows a disproportionately larger number of matches to a rule indicating that a particular vector is used against a protected web application.
Figure 3: The top terminating rule could indicate a particular vector of an attack
Likewise, review the top allowed requests. If you see a spike in traffic to a specific URL, you should investigate whether your application is working properly.
Next steps after you analyze traffic
After you’ve analyzed the traffic patterns, here are some next steps to consider:
Tune your AWS WAF rules to better match legitimate or malicious traffic based on your findings. You might be able to fine-tune rules to reduce false positives or false negatives. Tune rules that are blocking legitimate traffic by adjusting regular expressions or conditions.
Configure AWS WAF logging, and if you have a dedicated security information and event management (SIEM) solution, integrate the logging to enable automated alerting for anomalies.
Set up AWS WAF to automatically block known malicious IPs. You can maintain an IP block list based on identified threat actors. Additionally, you can use the Amazon IP reputation list managed rule group, which the Amazon Threat Research Team regularly updates.
If you see spikes in traffic to specific pages, check that your web applications are functioning properly to rule out application issues driving unusual patterns.
Add new rules to block new attack patterns that you spot in the traffic flows. Then review the metrics to help confirm the impact of the new rules.
Monitor source IPs for DDoS events and other malicious spikes. Use AWS WAF rate-based rules to help mitigate these spikes.
If you experience traffic floods, implement additional layers of protection by using CloudFront with DDoS protection.
The new dashboard gives you valuable insight into the traffic that reaches your applications and takes the guesswork out of traffic analysis. Using the insights that it provides, you can fine-tune your AWS WAF protections and block threats before they affect availability or data. Analyze the data regularly to help detect potential threats and make informed decisions about optimizing.
As an example, if you see an unexpected spike of traffic, which looks conspicuous in the dashboard compared to historical traffic patterns, from a country where you don’t anticipate traffic originating from, you can create a geographic match rule statement in your web ACL to block this traffic and prevent it from reaching your web application.
The dashboard is a great tool to gain insights and to understand how AWS WAF managed rules help protect your traffic.
Use case 2: Understand bot traffic during onboarding and fine-tune your bot control rule group
With AWS WAF Bot Control, you can monitor, block, or rate limit bots such as scrapers, scanners, crawlers, status monitors, and search engines. If you use the targeted inspection level of the rule group, you can also challenge bots that don’t self-identify, making it harder and more expensive for malicious bots to operate against your website.
On the traffic overview dashboard, under the Bot Control overview tab, you can see how much of your current traffic is coming from bots, based on request sampling (if you don’t have Bot Control enabled) and real-time CloudWatch metrics (if you do have Bot Control enabled).
During your onboarding phase, use this dashboard to monitor your traffic and understand how much of it comes from various types of bots. You can use this as a starting point to customize your bot management. For example, you can enable common bot control rule groups in count mode and see if desired traffic is being mislabeled. Then you can add rule exceptions, as described in AWS WAF Bot Control example: Allow a specific blocked bot.
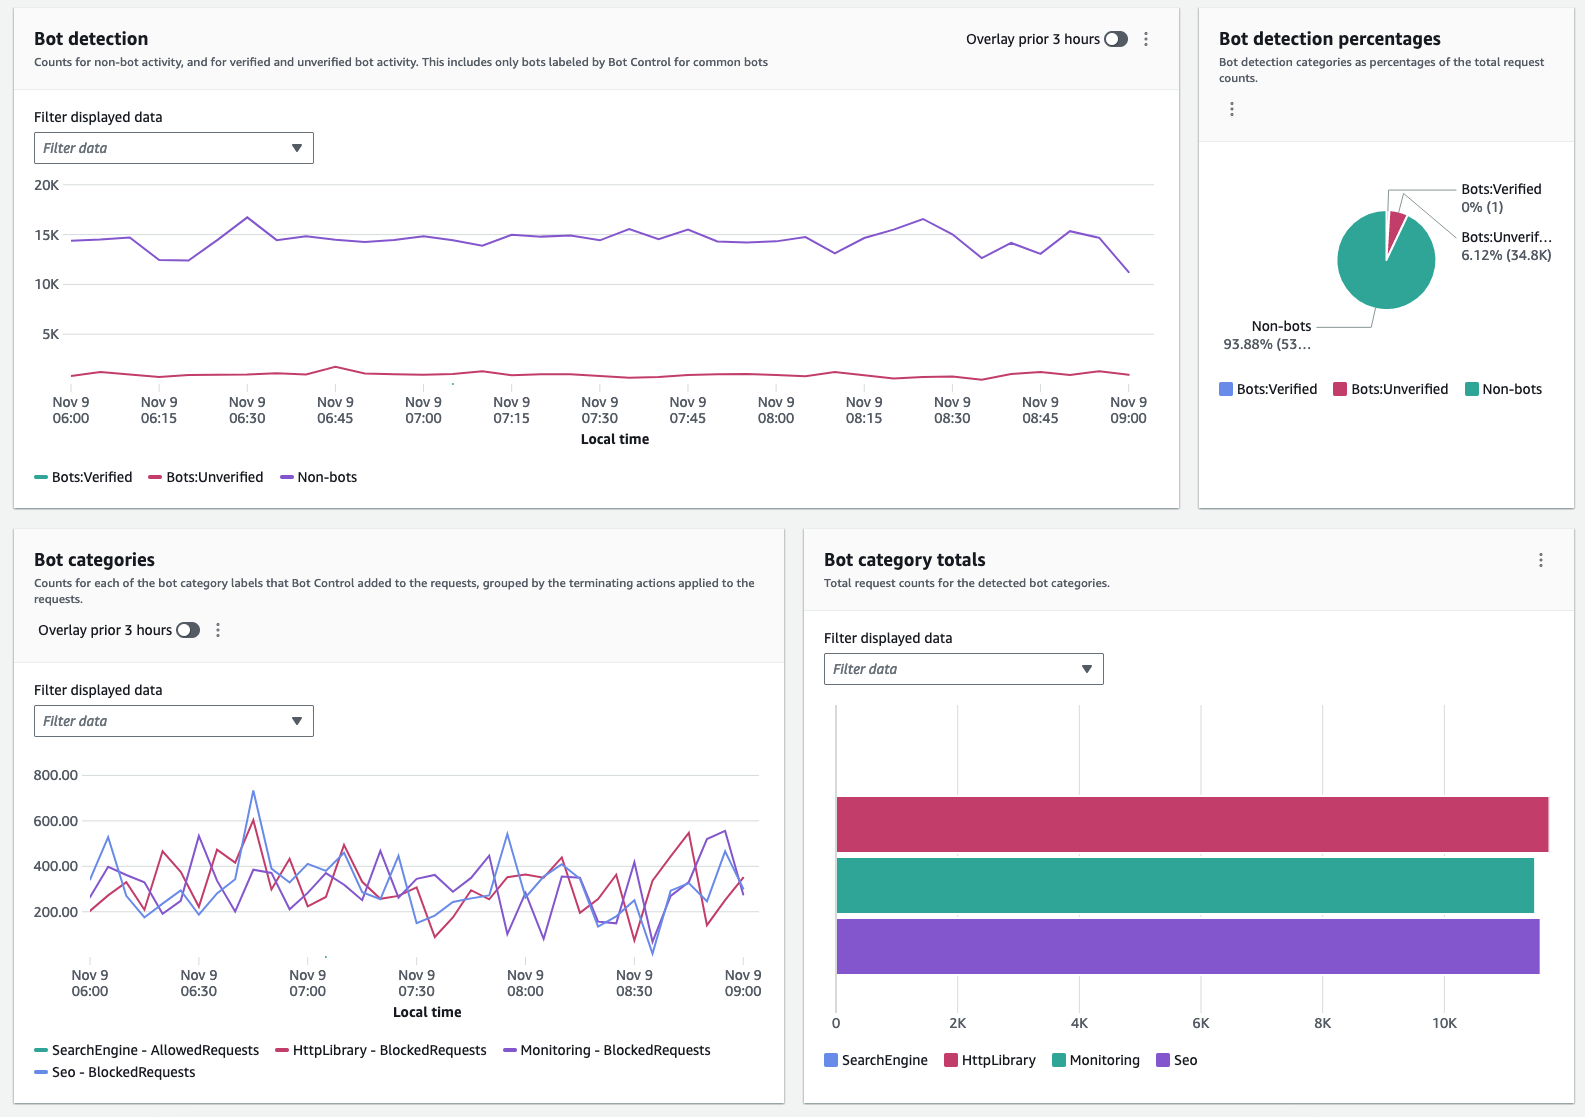
The following figure shows a collection of widgets that visualize various dimensions of requests detected as generated by bots. By understanding categories and volumes, you can make an informed decision to either investigate by further delving into logs or block a specific category if it’s clear that it’s unwanted traffic.
Figure 4: Collection of bot-related metrics on the dashboard
After you get started, you can use the same dashboard to monitor your bot traffic and evaluate adding targeted detection for sophisticated bots that don’t self-identify. Targeted protections use detection techniques such as browser interrogation, fingerprinting, and behavior heuristics to identify bad bot traffic. AWS WAF tokens are an integral part of these enhanced protections.
AWS WAF creates, updates, and encrypts tokens for clients that successfully respond to silent challenges and CAPTCHA puzzles. When a client with a token sends a web request, it includes the encrypted token, and AWS WAF decrypts the token and verifies its contents.
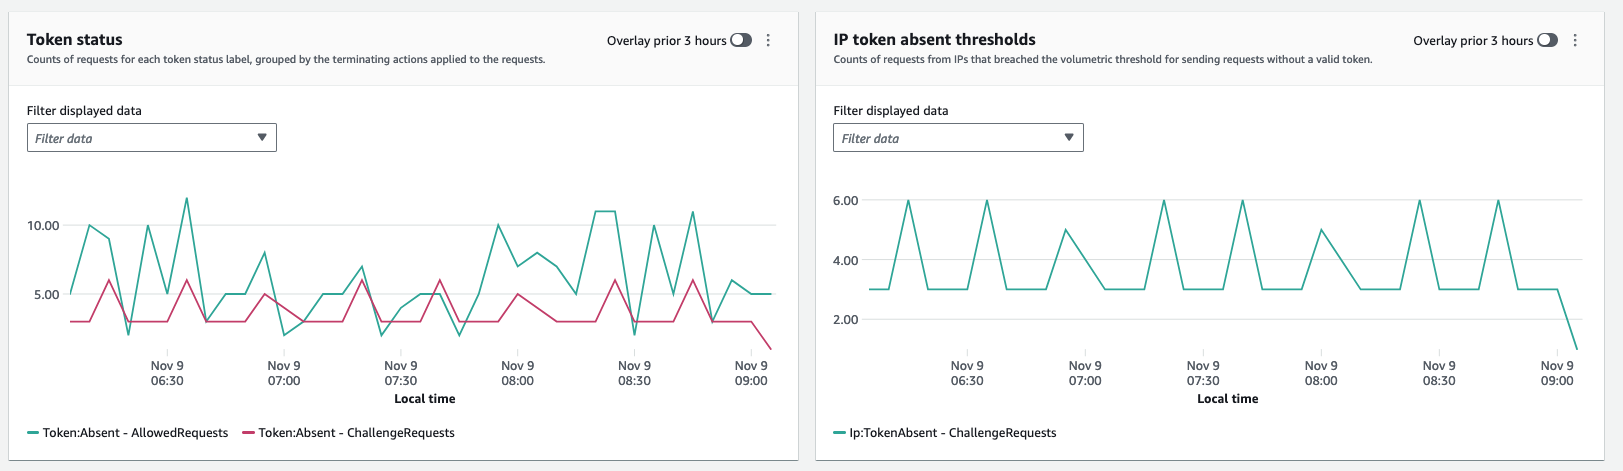
In the Bot Control dashboard, the token status pane shows counts for the various token status labels, paired with the rule action that was applied to the request. The IP token absent thresholds pane shows data for requests from IPs that sent too many requests without a token. You can use this information to fine-tune your AWS WAF configuration.
For example, within a Bot Control rule group, it’s possible for a request without a valid token to exit the rule group evaluation and continue to be evaluated by the web ACL. To block requests that are missing their token or for which the token is rejected, you can add a rule to run immediately after the managed rule group to capture and block requests that the rule group doesn’t handle for you. Using the Token status pane, illustrated in Figure 5, you can also monitor the volume of requests that acquire tokens and decide if you want to rate limit or block such requests.
Figure 5: Token status enables monitoring of the volume of requests that acquire tokens
Comparison with CloudFront security dashboard
The AWS WAF traffic overview dashboard provides enhanced overall visibility into web traffic reaching resources that are protected with AWS WAF. In contrast, the CloudFront security dashboard brings AWS WAF visibility and controls directly to your CloudFront distribution. If you want the detailed visibility and analysis of patterns that could indicate potential threats or issues, then the AWS WAF traffic overview dashboard is the best fit. However, if your goal is to manage application delivery and security in one place without navigating between service consoles and to gain visibility into your application’s top security trends, allowed and blocked traffic, and bot activity, then the CloudFront security dashboard could be a better option.
Availability and pricing
The new dashboards are available in the AWS WAF console, and you can use them to better monitor your traffic. These dashboards are available by default, at no cost, and require no additional setup. CloudWatch logging has a separate pricing model and if you have full logging enabled you will incur CloudWatch charges. See here for more information about CloudWatch charges. You can customize the dashboards if you want to tailor the displayed data to the needs of your environment.
Conclusion
With the AWS WAF traffic overview dashboard, you can get actionable insights on your web security posture and traffic patterns that might need your attention to improve your perimeter protection.
In this post, you learned how to use the dashboard to help secure your web application. You walked through traffic patterns analysis and possible next steps. Additionally, you learned how to observe traffic from bots and follow up with actions related to them according to the needs of your application.
The AWS WAF traffic overview dashboard is designed to meet most use cases and be a go-to default option for security visibility over web traffic. However, if you’d prefer to create a custom solution, see the guidance in the blog post Deploy a dashboard for AWS WAF with minimal effort.
If you have feedback about this post, submit comments in the Comments section below. If you have questions about this post, contact AWS Support.
This whitepaper summarizes OSFI’s expectations with respect to Technology and Cyber Risk Management (OSFI Guideline B-13). It also gives OSFI-regulated institutions information that they can use to commence their due diligence and assess how to implement the appropriate programs for their use of AWS Cloud services. In subsequent versions of the whitepaper, we will provide considerations for other OSFI guidelines as applicable.
In addition to this whitepaper, AWS provides updates on the evolving Canadian regulatory landscape on the AWS Security Blog and the AWS Compliance page. Customers looking for more information on cloud-related regulatory compliance in different countries around the world can refer to the AWS Compliance Center. For additional resources or support, reach out to your AWS account manager or contact us here.
If you have feedback about this post, submit comments in the Comments section below. If you have questions about this post, contact AWS Support.
In this post, I’ll show how you can export software bills of materials (SBOMs) for your containers by using an AWS native service, Amazon Inspector, and visualize the SBOMs through Amazon QuickSight, providing a single-pane-of-glass view of your organization’s software supply chain.
The concept of a bill of materials (BOM) originated in the manufacturing industry in the early 1960s. It was used to keep track of the quantities of each material used to manufacture a completed product. If parts were found to be defective, engineers could then use the BOM to identify products that contained those parts. An SBOM extends this concept to software development, allowing engineers to keep track of vulnerable software packages and quickly remediate the vulnerabilities.
Today, most software includes open source components. A Synopsys study, Walking the Line: GitOps and Shift Left Security, shows that 8 in 10 organizations reported using open source software in their applications. Consider a scenario in which you specify an open source base image in your Dockerfile but don’t know what packages it contains. Although this practice can significantly improve developer productivity and efficiency, the decreased visibility makes it more difficult for your organization to manage risk effectively.
It’s important to track the software components and their versions that you use in your applications, because a single affected component used across multiple organizations could result in a major security impact. According to a Gartner report titled Gartner Report for SBOMs: Key Takeaways You Should know, by 2025, 60 percent of organizations building or procuring critical infrastructure software will mandate and standardize SBOMs in their software engineering practice, up from less than 20 percent in 2022. This will help provide much-needed visibility into software supply chain security.
Integrating SBOM workflows into the software development life cycle is just the first step—visualizing SBOMs and being able to search through them quickly is the next step. This post describes how to process the generated SBOMs and visualize them with Amazon QuickSight. AWS also recently added SBOM export capability in Amazon Inspector, which offers the ability to export SBOMs for Amazon Inspector monitored resources, including container images.
Why is vulnerability scanning not enough?
Scanning and monitoring vulnerable components that pose cybersecurity risks is known as vulnerability scanning, and is fundamental to organizations for ensuring a strong and solid security posture. Scanners usually rely on a database of known vulnerabilities, the most common being the Common Vulnerabilities and Exposures (CVE) database.
Identifying vulnerable components with a scanner can prevent an engineer from deploying affected applications into production. You can embed scanning into your continuous integration and continuous delivery (CI/CD) pipelines so that images with known vulnerabilities don’t get pushed into your image repository. However, what if a new vulnerability is discovered but has not been added to the CVE records yet? A good example of this is the Apache Log4j vulnerability, which was first disclosed on Nov 24, 2021 and only added as a CVE on Dec 1, 2021. This means that for 7 days, scanners that relied on the CVE system weren’t able to identify affected components within their organizations. This issue is known as a zero-day vulnerability. Being able to quickly identify vulnerable software components in your applications in such situations would allow you to assess the risk and come up with a mitigation plan without waiting for a vendor or supplier to provide a patch.
In addition, it’s also good hygiene for your organization to track usage of software packages, which provides visibility into your software supply chain. This can improve collaboration between developers, operations, and security teams, because they’ll have a common view of every software component and can collaborate effectively to address security threats.
In this post, I present a solution that uses the new Amazon Inspector feature to export SBOMs from container images, process them, and visualize the data in QuickSight. This gives you the ability to search through your software inventory on a dashboard and to use natural language queries through QuickSight Q, in order to look for vulnerabilities.
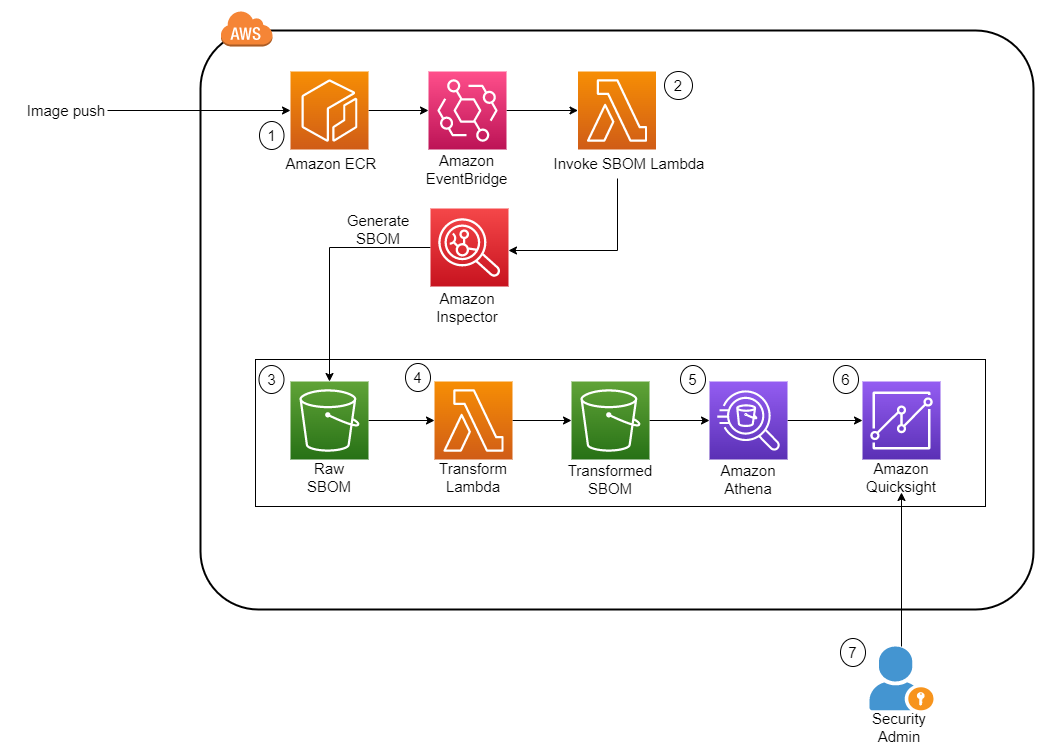
Solution overview
Figure 1 shows the architecture of the solution. It is fully serverless, meaning there is no underlying infrastructure you need to manage. This post uses a newly released feature within Amazon Inspector that provides the ability to export a consolidated SBOM for Amazon Inspector monitored resources across your organization in commonly used formats, including CycloneDx and SPDX.
Another Lambda function is invoked whenever a new JSON file is deposited. The function performs the data transformation steps and uploads the new file into a new S3 bucket.
Amazon Athena is then used to perform preliminary data exploration.
A dashboard on Amazon QuickSight displays SBOM data.
Implement the solution
This section describes how to deploy the solution architecture.
In this post, you’ll perform the following tasks:
Create S3 buckets and AWS KMS keys to store the SBOMs
Create QuickSight dashboards to identify libraries and packages
Use QuickSight Q to identify libraries and packages by using natural language queries
Deploy the CloudFormation stack
The AWS CloudFormation template we’ve provided provisions the S3 buckets that are required for the storage of raw SBOMs and transformed SBOMs, the Lambda functions necessary to initiate and process the SBOMs, and EventBridge rules to run the Lambda functions based on certain events. An empty repository is provisioned as part of the stack, but you can also use your own repository.
Browse to the CloudFormation service in your AWS account and choose Create Stack.
Upload the CloudFormation template you downloaded earlier.
For the next step, Specify stack details, enter a stack name.
You can keep the default value of sbom-inspector for EnvironmentName.
Specify the Amazon Resource Name (ARN) of the user or role to be the admin for the KMS key.
Deploy the stack.
Set up Amazon Inspector
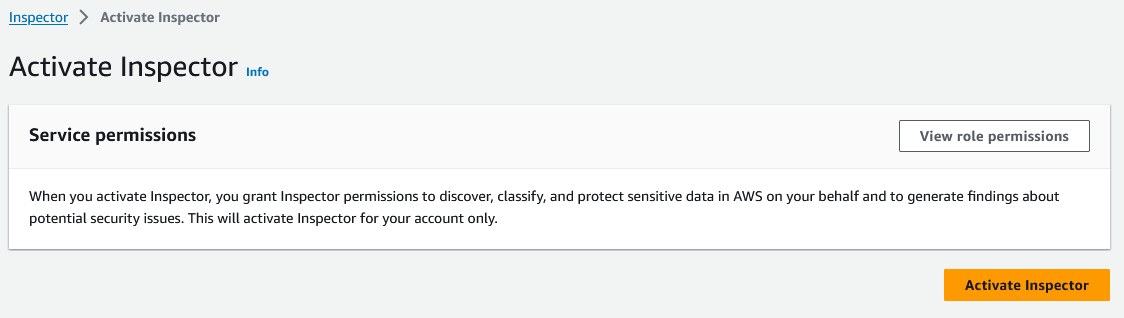
If this is the first time you’re using Amazon Inspector, you need to activate the service. In the Getting started with Amazon Inspector topic in the Amazon Inspector User Guide, follow Step 1 to activate the service. This will take some time to complete.
Figure 2: Activate Amazon Inspector
SBOM invocation and processing Lambda functions
This solution uses two Lambda functions written in Python to perform the invocation task and the transformation task.
Invocation task — This function is run whenever a new image is pushed into Amazon ECR. It takes in the repository name and image tag variables and passes those into the create_sbom_export function in the SPDX format. This prevents duplicated SBOMs, which helps to keep the S3 data size small.
Transformation task — This function is run whenever a new file with the suffix .json is added to the raw S3 bucket. It creates two files, as follows:
It extracts information such as image ARN, account number, package, package version, operating system, and SHA from the SBOM and exports this data to the transformed S3 bucket under a folder named sbom/.
Because each package can have more than one CVE, this function also extracts the CVE from each package and stores it in the same bucket in a directory named cve/. Both files are exported in Apache Parquet so that the file is in a format that is optimized for queries by Amazon Athena.
Populate the AWS Glue Data Catalog
To populate the AWS Glue Data Catalog, you need to generate the SBOM files by using the Lambda functions that were created earlier.
To populate the AWS Glue Data Catalog
You can use an existing image, or you can continue on to create a sample image.
# Pull the nginx image from a public repo
docker pull public.ecr.aws/nginx/nginx:1.19.10-alpine-perl

docker tag public.ecr.aws/nginx/nginx:1.19.10-alpine-perl <ACCOUNT-ID>.dkr.ecr.us-east-1.amazonaws.com/sbom-inspector:nginxperl

# Authenticate to ECR, fill in your account id
aws ecr get-login-password --region us-east-1 | docker login --username AWS --password-stdin <ACCOUNT-ID>.dkr.ecr.us-east-1.amazonaws.com

# Push the image into ECR
docker push <ACCOUNT-ID>.dkr.ecr.us-east-1.amazonaws.com/sbom-inspector:nginxperl
An image is pushed into the Amazon ECR repository in your account. This invokes the Lambda functions that perform the SBOM export by using Amazon Inspector and converts the SBOM file to Parquet.
Verify that the Parquet files are in the transformed S3 bucket:
Browse to the S3 console and choose the bucket named sbom-inspector-<ACCOUNT-ID>-transformed. You can also track the invocation of each Lambda function in the Amazon CloudWatch log console.
After the transformation step is complete, you will see two folders (cve/ and sbom/)in the transformed S3 bucket. Choose the sbom folder. You will see the transformed Parquet file in it. If there are CVEs present, a similar file will appear in the cve folder.
The next step is to run an AWS Glue crawler to determine the format, schema, and associated properties of the raw data. You will need to crawl both folders in the transformed S3 bucket and store the schema in separate tables in the AWS Glue Data Catalog.
On the AWS Glue Service console, on the left navigation menu, choose Crawlers.
On the Crawlers page, choose Create crawler. This starts a series of pages that prompt you for the crawler details.
In the Crawler name field, enter sbom-crawler, and then choose Next.
Under Data sources, select Add a data source.
Now you need to point the crawler to your data. On the Add data source page, choose the Amazon S3 data store. This solution in this post doesn’t use a connection, so leave the Connection field blank if it’s visible.
For the option Location of S3 data, choose In this account. Then, for S3 path, enter the path where the crawler can find the sbom and cve data, which is s3://sbom-inspector-<ACCOUNT-ID>-transformed/sbom/ and s3://sbom-inspector-<ACCOUNT-ID>-transformed/cve/. Leave the rest as default and select Add an S3 data source.
Figure 3: Data source for AWS Glue crawler
The crawler needs permissions to access the data store and create objects in the Data Catalog. To configure these permissions, choose Create an IAM role. The AWS Identity and Access Management (IAM) role name starts with AWSGlueServiceRole-, and in the field, you enter the last part of the role name. Enter sbomcrawler, and then choose Next.
Crawlers create tables in your Data Catalog. Tables are contained in a database in the Data Catalog. To create a database, choose Add database. In the pop-up window, enter sbom-db for the database name, and then choose Create.
Verify the choices you made in the Add crawler wizard. If you see any mistakes, you can choose Back to return to previous pages and make changes. After you’ve reviewed the information, choose Finish to create the crawler.
Figure 4: Creation of the AWS Glue crawler
Select the newly created crawler and choose Run.
After the crawler runs successfully, verify that the table is created and the data schema is populated.
Figure 5: Table populated from the AWS Glue crawler
Set up Amazon Athena
Amazon Athena performs the initial data exploration and validation. Athena is a serverless interactive analytics service built on open source frameworks that supports open-table and file formats. Athena provides a simplified, flexible way to analyze data in sources like Amazon S3 by using standard SQL queries. If you are SQL proficient, you can query the data source directly; however, not everyone is familiar with SQL. In this section, you run a sample query and initialize the service so that it can used in QuickSight later on.
To start using Amazon Athena
In the AWS Management Console, navigate to the Athena console.
For Database, select sbom-db (or select the database you created earlier in the crawler).
Navigate to the Settings tab located at the top right corner of the console. For Query result location, select the Athena S3 bucket created from the CloudFormation template, sbom-inspector-<ACCOUNT-ID>-athena.
Keep the defaults for the rest of the settings. You can now return to the Query Editor and start writing and running your queries on the sbom-db database.
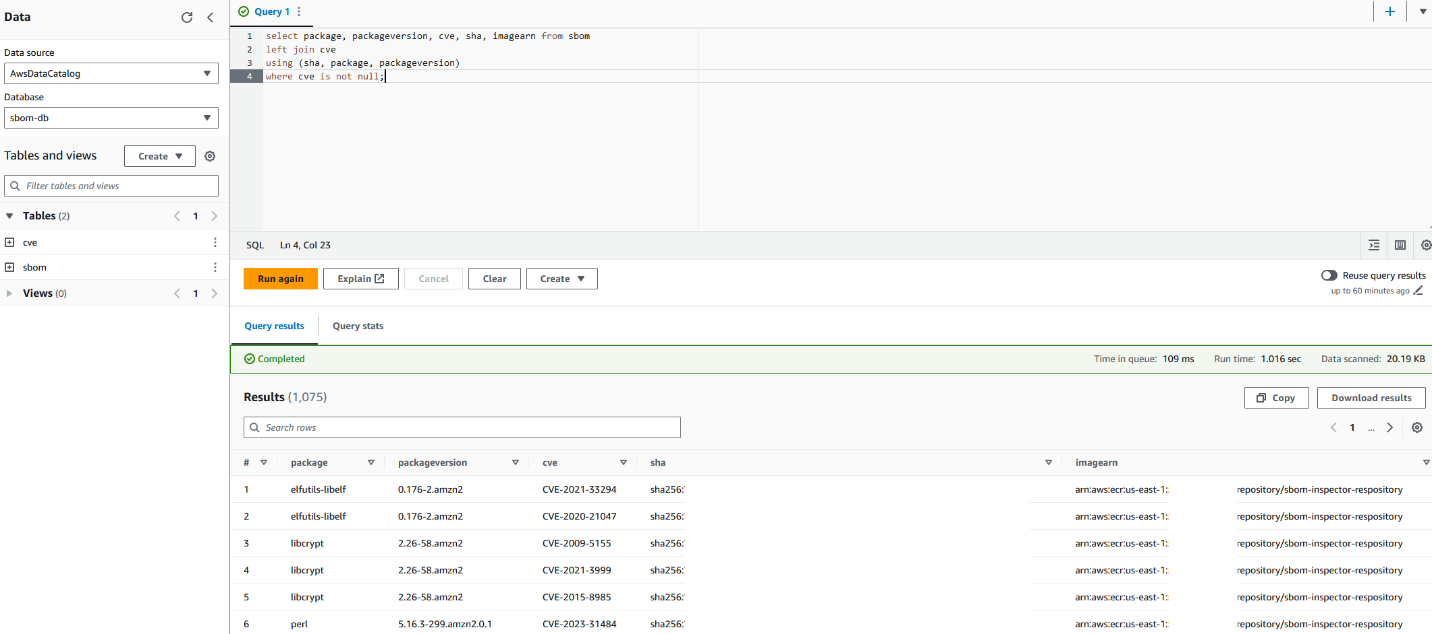
You can use the following sample query.
select package, packageversion, cve, sha, imagearn from sbom
left join cve
using (sha, package, packageversion)
where cve is not null;
Your Athena console should look similar to the screenshot in Figure 6.
Figure 6: Sample query with Amazon Athena
This query joins the two tables and selects only the packages with CVEs identified. Alternatively, you can choose to query for specific packages or identify the most common package used in your organization.
Amazon QuickSight is a serverless business intelligence service that is designed for the cloud. In this post, it serves as a dashboard that allows business users who are unfamiliar with SQL to identify zero-day vulnerabilities. This can also reduce the operational effort and time of having to look through several JSON documents to identify a single package across your image repositories. You can then share the dashboard across teams without having to share the underlying data.
QuickSight SPICE (Super-fast, Parallel, In-memory Calculation Engine) is an in-memory engine that QuickSight uses to perform advanced calculations. In a large organization where you could have millions of SBOM records stored in S3, importing your data into SPICE helps to reduce the time to process and serve the data. You can also use the feature to perform a scheduled refresh to obtain the latest data from S3.
QuickSight also has a feature called QuickSight Q. With QuickSightQ, you can use natural language to interact with your data. If this is the first time you are initializing QuickSight, subscribe to QuickSight and select Enterprise + Q. It will take roughly 20–30 minutes to initialize for the first time. Otherwise, if you are already using QuickSight, you will need to enable QuickSight Q by subscribing to it in the QuickSight console.
Finally, in QuickSight you can select different data sources, such as Amazon S3 and Athena, to create custom visualizations. In this post, we will use the two Athena tables as the data source to create a dashboard to keep track of the packages used in your organization and the resulting CVEs that come with them.
Prerequisites for setting up the QuickSight dashboard
This process will be used to create the QuickSight dashboard from a template already pre-provisioned through the command line interface (CLI). It also grants the necessary permissions for QuickSight to access the data source. You will need the following:
A QuickSight + Q subscription (only if you want to use the Q feature).
QuickSight permissions to Amazon S3 and Athena (enable these through the QuickSight security and permissions interface).
Set the default AWS Region where you want to deploy the QuickSight dashboard. This post assumes that you’re using the us-east-1 Region.
Create datasets
In QuickSight, create two datasets, one for the sbom table and another for the cve table.
In the QuickSight console, select the Dataset tab.
Choose Create dataset, and then select the Athena data source.
Name the data source sbom and choose Create data source.
Select the sbom table.
Choose Visualize to complete the dataset creation. (Delete the analyses automatically created for you because you will create your own analyses afterwards.)
Navigate back to the main QuickSight page and repeat steps 1–4 for the cve dataset.
Merge datasets
Next, merge the two datasets to create the combined dataset that you will use for the dashboard.
On the Datasets tab, edit the sbom dataset and add the cve dataset.
Set three join clauses, as follows:
Sha : Sha
Package : Package
Packageversion : Packageversion
Perform a left merge, which will append the cve ID to the package and package version in the sbom dataset.
Figure 7: Combining the sbom and cve datasets
Next, you will create a dashboard based on the combined sbom dataset.
Prepare configuration files
In your terminal, export the following variables. Substitute <QuickSight username> in the QS_USER_ARN variable with your own username, which can be found in the Amazon QuickSight console.
Validate that the variables are set properly. This is required for you to move on to the next step; otherwise you will run into errors.
echo ACCOUNT_ID is $ACCOUNT_ID || echo ACCOUNT_ID is not set
echo TEMPLATE_ID is $TEMPLATE_ID || echo TEMPLATE_ID is not set
echo QUICKSIGHT USER ARN is $QS_USER_ARN || echo QUICKSIGHT USER ARN is not set
echo QUICKSIGHT DATA ARN is $QS_DATA_ARN || echo QUICKSIGHT DATA ARN is not set
Next, use the following commands to create the dashboard from a predefined template and create the IAM permissions needed for the user to view the QuickSight dashboard.
Note: Run the following describe-dashboard command, and confirm that the response contains a status code of 200. The 200-status code means that the dashboard exists.
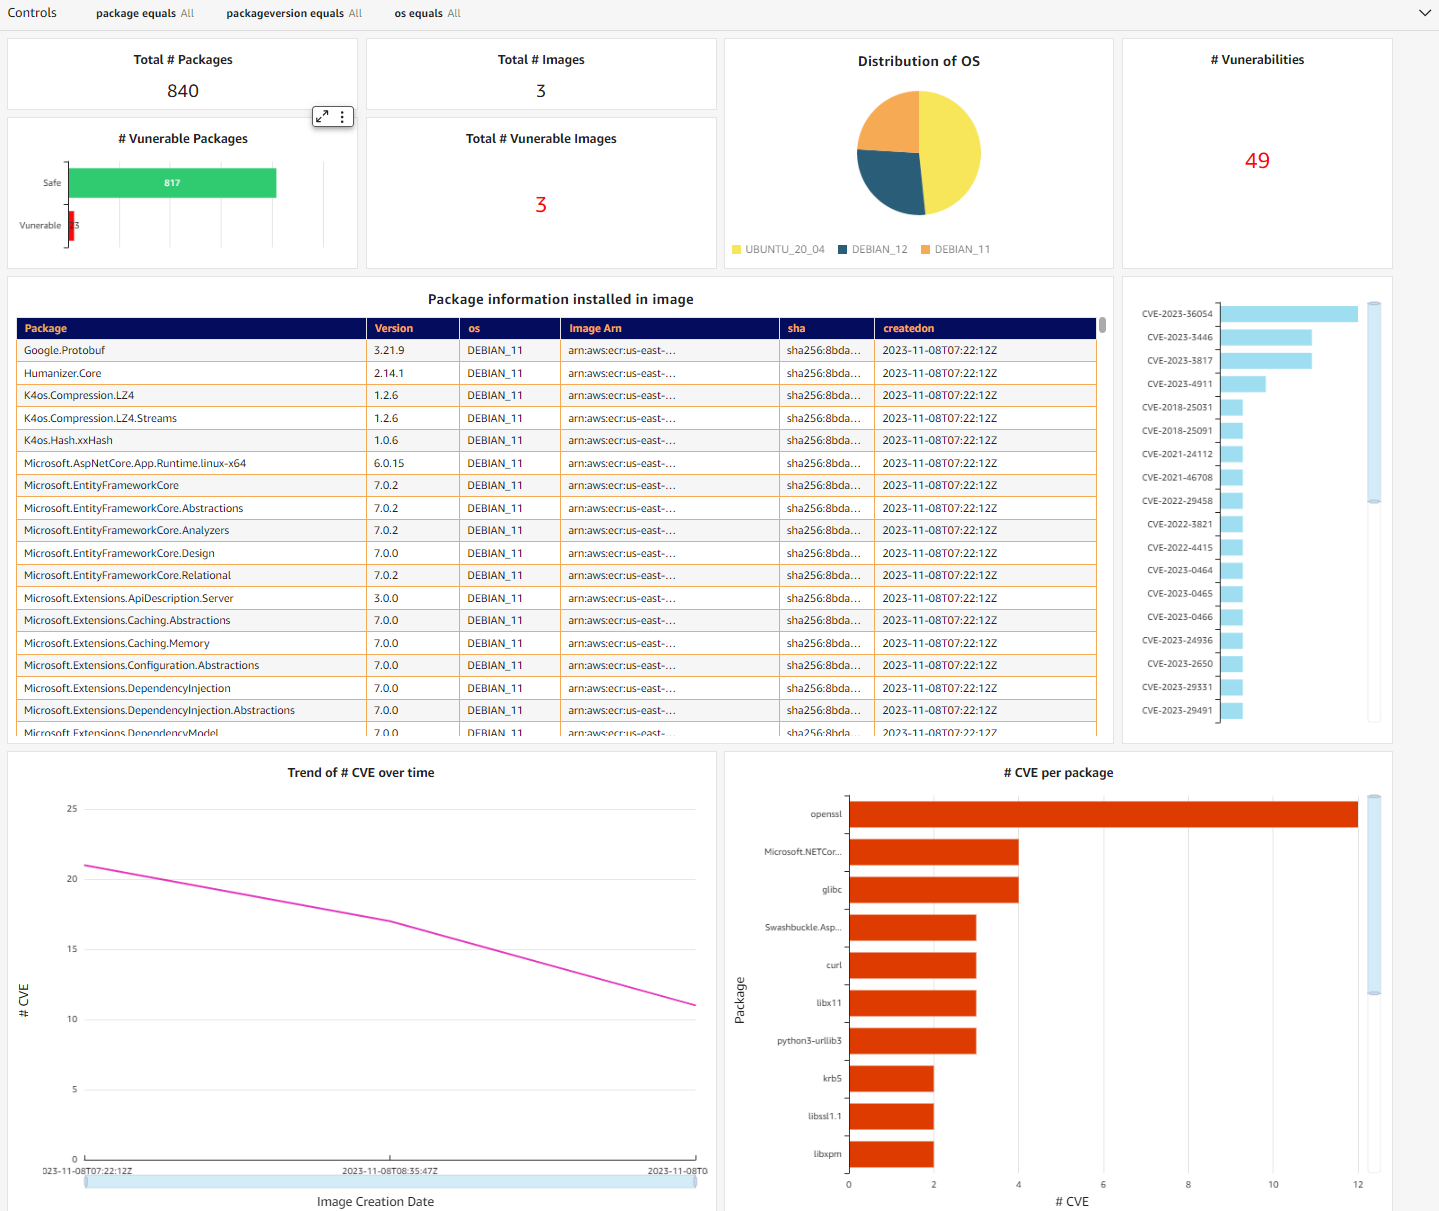
You should now be able to see the dashboard in your QuickSight console, similar to the one in Figure 8. It’s an interactive dashboard that shows you the number of vulnerable packages you have in your repositories and the specific CVEs that come with them. You can navigate to the specific image by selecting the CVE (middle right bar chart) or list images with a specific vulnerable package (bottom right bar chart).
Note: You won’t see the exact same graph as in Figure 8. It will change according to the image you pushed in.
Figure 8: QuickSight dashboard containing SBOM information
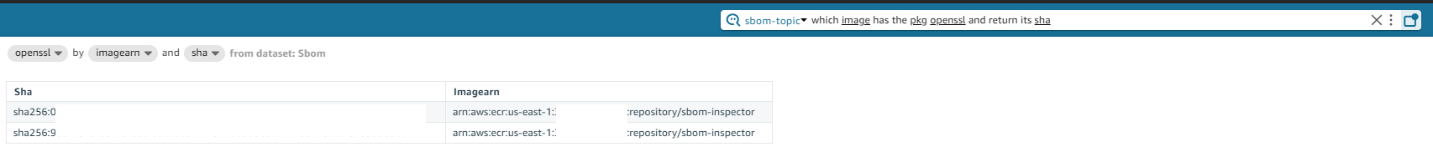
Alternatively, you can use QuickSight Q to extract the same information from your dataset through natural language. You will need to create a topic and add the dataset you added earlier. For detailed information on how to create a topic, see the Amazon QuickSight User Guide. After QuickSight Q has completed indexing the dataset, you can start to ask questions about your data.
Figure 9: Natural language query with QuickSight Q
Conclusion
This post discussed how you can use Amazon Inspector to export SBOMs to improve software supply chain transparency. Container SBOM export should be part of your supply chain mitigation strategy and monitored in an automated manner at scale.
Although it is a good practice to generate SBOMs, it would provide little value if there was no further analysis being done on them. This solution enables you to visualize your SBOM data through a dashboard and natural language, providing better visibility into your security posture. Additionally, this solution is also entirely serverless, meaning there are no agents or sidecars to set up.
You can use Amazon Security Lake to simplify log data collection and retention for Amazon Web Services (AWS) and non-AWS data sources. To make sure that you get the most out of your implementation requires proper planning.
In this post, we will show you how to plan and implement a proof of concept (POC) for Security Lake to help you determine the functionality and value of Security Lake in your environment, so that your team can confidently design and implement in production. We will walk you through the following steps:
Understand the functionality and value of Security Lake
Determine success criteria for the POC
Define your Security Lake configuration
Prepare for deployment
Enable Security Lake
Validate deployment
Understand the functionality of Security Lake
Figure 1 summarizes the main features of Security Lake and the context of how to use it:
Figure 1: Overview of Security Lake functionality
As shown in the figure, Security Lake ingests and normalizes logs from data sources such as AWS services, AWS Partner sources, and custom sources. Security Lake also manages the lifecycle, orchestration, and subscribers. Subscribers can be AWS services, such as Amazon Athena, or AWS Partner subscribers.
There are four primary functions that Security Lake provides:
Centralize visibility to your data from AWS environments, SaaS providers, on-premises, and other cloud data sources — You can collect log sources from AWS services such as AWS CloudTrail management events, Amazon Simple Storage Service (Amazon S3) data events, AWS Lambda data events, Amazon Route 53 Resolver logs, VPC Flow Logs, and AWS Security Hub findings, in addition to log sources from on-premises, other cloud services, SaaS applications, and custom sources. Security Lake automatically aggregates the security data across AWS Regions and accounts.
Normalize your security data to an open standard — Security Lake normalizes log sources in a common schema, the Open Security Schema Framework (OCSF), and stores them in compressed parquet files.
Use your preferred analytics tools to analyze your security data — You can use AWS tools, such as Athena and Amazon OpenSearch Service, or you can utilize external security tools to analyze the data in Security Lake.
Optimize and manage your security data for more efficient storage and query — Security Lake manages the lifecycle of your data with customizable retention settings with automated storage tiering to help provide more cost-effective storage.
Determine success criteria
By establishing success criteria, you can assess whether Security Lake has helped address the challenges that you are facing. Some example success criteria include:
I need to centrally set up and store AWS logs across my organization in AWS Organizations for multiple log sources.
I need to more efficiently collect VPC Flow Logs in my organization and analyze them in my security information and event management (SIEM) solution.
I want to use OpenSearch Service to replace my on-premises SIEM.
I want to collect AWS log sources and custom sources for machine learning with Amazon Sagemaker.
I need to establish a dashboard in Amazon QuickSight to visualize my Security Hub findings and a custom log source data.
Review your success criteria to make sure that your goals are realistic given your timeframe and potential constraints that are specific to your organization. For example, do you have full control over the creation of AWS services that are deployed in an organization? Do you have resources that can dedicate time to implement and test? Is this time convenient for relevant stakeholders to evaluate the service?
The timeframe of your POC will depend on your answers to these questions.
Important: Security Lake has a 15-day free trial per account that you use from the time that you enable Security Lake. This is the best way to estimate the costs for each Region throughout the trial, which is an important consideration when you configure your POC.
Define your Security Lake configuration
After you establish your success criteria, you should define your desired Security Lake configuration. Some important decisions include the following:
Determine AWS log sources — Decide which AWS log sources to collect. For information about the available options, see Collecting data from AWS services.
Determine third-party log sources — Decide if you want to include non-AWS service logs as sources in your POC. For more information about your options, see Third-party integrations with Security Lake; the integrations listed as “Source” can send logs to Security Lake.
Note: You can add third-party integrations after the POC or in a second phase of the POC. Pre-planning will be required to make sure that you can get these set up during the 15-day free trial. Third-party integrations usually take more time to set up than AWS service logs.
Select a delegated administrator – Identify which account will serve as the delegated administrator. Make sure that you have the appropriate permissions from the organization admin account to identify and enable the account that will be your Security Lake delegated administrator. This account will be the location for the S3 buckets with your security data and where you centrally configure Security Lake. The AWS Security Reference Architecture (AWS SRA) recommends that you use the AWS logging account for this purpose. In addition, make sure to review Important considerations for delegated Security Lake administrators.
Select accounts in scope — Define which accounts to collect data from. To get the most realistic estimate of the cost of Security Lake, enable all accounts across your organization during the free trial.
Determine analytics tool — Determine if you want to use native AWS analytics tools, such as Athena and OpenSearch Service, or an existing SIEM, where the SIEM is a subscriber to Security Lake.
Define log retention and Regions — Define your log retention requirements and Regional restrictions or considerations.
Prepare for deployment
After you determine your success criteria and your Security Lake configuration, you should have an idea of your stakeholders, desired state, and timeframe. Now you need to prepare for deployment. In this step, you should complete as much as possible before you deploy Security Lake. The following are some steps to take:
Create a project plan and timeline so that everyone involved understands what success look like and what the scope and timeline is.
Define the relevant stakeholders and consumers of the Security Lake data. Some common stakeholders include security operations center (SOC) analysts, incident responders, security engineers, cloud engineers, finance, and others.
Define who is responsible, accountable, consulted, and informed during the deployment. Make sure that team members understand their roles.
Consider other technical prerequisites that you need to accomplish. For example, if you need roles in addition to what Security Lake creates for custom extract, transform, and load (ETL) pipelines for custom sources, can you work with the team in charge of that process before the POC?
Enable Security Lake
The next step is to enable Security Lake in your environment and configure your sources and subscribers.
Deploy Security Lake across the Regions, accounts, and AWS log sources that you previously defined.
Configure custom sources that are in scope for your POC.
Configure analytics tools in scope for your POC.
Validate deployment
The final step is to confirm that you have configured Security Lake and additional components, validate that everything is working as intended, and evaluate the solution against your success criteria.
Validate log collection — Verify that you are collecting the log sources that you configured. To do this, check the S3 buckets in the delegated administrator account for the logs.
Validate analytics tool — Verify that you can analyze the log sources in your analytics tool of choice. If you don’t want to configure additional analytics tooling, you can use Athena, which is configured when you set up Security Lake. For sample Athena queries, see Amazon Security Lake Example Queries on GitHub and Security Lake queries in the documentation.
Obtain a cost estimate — In the Security Lake console, you can review a usage page to verify that the cost of Security Lake in your environment aligns with your expectations and budgets.
Assess success criteria — Determine if you achieved the success criteria that you defined at the beginning of the project.
Next steps
Next steps will largely depend on whether you decide to move forward with Security Lake.
Determine if you have the approval and budget to use Security Lake.
Expand to other data sources that can help you provide more security outcomes for your business.
Configure S3 lifecycle policies to efficiently store logs long term based on your requirements.
Let other teams know that they can subscribe to Security Lake to use the log data for their own purposes. For example, a development team that gets access to CloudTrail through Security Lake can analyze the logs to understand the permissions needed for an application.
Conclusion
In this blog post, we showed you how to plan and implement a Security Lake POC. You learned how to do so through phases, including defining success criteria, configuring Security Lake, and validating that Security Lake meets your business needs.
As a customer, this guide will help you run a successful proof of value (POV) with Security Lake. It guides you in assessing the value and factors to consider when deciding to implement the current features.
The new IRAP report includes an additional seven AWS services that are now assessed at the PROTECTED level under IRAP. This brings the total number of services assessed at the PROTECTED level to 151.
The following are the seven newly assessed services:
AWS has developed an IRAP documentation pack to assist Australian government agencies and their partners to plan, architect, and assess risk for their workloads when they use AWS Cloud services.
The IRAP pack on AWS Artifact also includes newly updated versions of the AWS Consumer Guide and the whitepaper Reference Architectures for ISM PROTECTED Workloads in the AWS Cloud.
Reach out to your AWS representatives to let us know which additional services you would like to see in scope for upcoming IRAP assessments. We strive to bring more services into scope at the PROTECTED level under IRAP to support your requirements.
If you have feedback about this post, submit comments in the Comments section below. If you have questions about this post, contact AWS Support.
When building API-based web applications in the cloud, there are two main types of communication flow in which identity is an integral consideration:
User-to-Service communication: Authenticate and authorize users to communicate with application services and APIs
Service-to-Service communication: Authenticate and authorize application services to talk to each other
To design an authentication and authorization solution for these flows, you need to add an extra dimension to each flow:
Authentication: What identity you will use and how it’s verified
Authorization: How to determine which identity can perform which task
In each flow, a user or a service must present some kind of credential to the application service so that it can determine whether the flow should be permitted. The credentials are often accompanied with other metadata that can then be used to make further access control decisions.
In this blog post, I show you two ways that you can use Amazon VPC Lattice to implement both communication flows. I also show you how to build a simple and clean architecture for securing your web applications with scalable authentication, providing authentication metadata to make coarse-grained access control decisions.
The example solution is based around a standard API-based application with multiple API components serving HTTP data over TLS. With this solution, I show that VPC Lattice can be used to deliver authentication and authorization features to an application without requiring application builders to create this logic themselves. In this solution, the example application doesn’t implement its own authentication or authorization, so you will use VPC Lattice and some additional proxying with Envoy, an open source, high performance, and highly configurable proxy product, to provide these features with minimal application change. The solution uses Amazon Elastic Container Service (Amazon ECS) as a container environment to run the API endpoints and OAuth proxy, however Amazon ECS and containers aren’t a prerequisite for VPC Lattice integration.
If your application already has client authentication, such as a web application using OpenID Connect (OIDC), you can still use the sample code to see how implementation of secure service-to-service flows can be implemented with VPC Lattice.
VPC Lattice configuration
VPC Lattice is an application networking service that connects, monitors, and secures communications between your services, helping to improve productivity so that your developers can focus on building features that matter to your business. You can define policies for network traffic management, access, and monitoring to connect compute services in a simplified and consistent way across instances, containers, and serverless applications.
For a web application, particularly those that are API based and comprised of multiple components, VPC Lattice is a great fit. With VPC Lattice, you can use native AWS identity features for credential distribution and access control, without the operational overhead that many application security solutions require.
This solution uses a single VPC Lattice service network, with each of the application components represented as individual services. VPC Lattice auth policies are AWS Identity and Access Management (IAM) policy documents that you attach to service networks or services to control whether a specified principal has access to a group of services or specific service. In this solution we use an auth policy on the service network, as well as more granular policies on the services themselves.
User-to-service communication flow
For this example, the web application is constructed from multiple API endpoints. These are typical REST APIs, which provide API connectivity to various application components.
The most common method for securing REST APIs is by using OAuth2. OAuth2 allows a client (on behalf of a user) to interact with an authorization server and retrieve an access token. The access token is intended to be presented to a REST API and contains enough information to determine that the user identified in the access token has given their consent for the REST API to operate on their data on their behalf.
Access tokens use OAuth2 scopes to indicate user consent. Defining how OAuth2 scopes work is outside the scope of this post. You can learn about scopes in Permissions, Privileges, and Scopes in the AuthO blog.
VPC Lattice doesn’t support OAuth2 client or inspection functionality, however it can verify HTTP header contents. This means you can use header matching within a VPC Lattice service policy to grant access to a VPC Lattice service only if the correct header is included. By generating the header based on validation occurring prior to entering the service network, we can use context about the user at the service network or service to make access control decisions.
Figure 1: User-to-service flow
The solution uses Envoy, to terminate the HTTP request from an OAuth 2.0 client. This is shown in Figure 1: User-to-service flow.
Envoy (shown as (1) in Figure 2) can validate access tokens (presented as a JSON Web Token (JWT) embedded in an Authorization: Bearer header). If the access token can be validated, then the scopes from this token are unpacked (2) and placed into X-JWT-Scope-<scopename> headers, using a simple inline Lua script. The Envoy documentation provides examples of how to use inline Lua in Envoy. Figure 2 – JWT Scope to HTTP shows how this process works at a high level.
Figure 2: JWT Scope to HTTP headers
Following this, Envoy uses Signature Version 4 (SigV4) to sign the request (3) and pass it to the VPC Lattice service. SigV4 signing is a native Envoy capability, but it requires the underlying compute that Envoy is running on to have access to AWS credentials. When you use AWS compute, assigning a role to that compute verifies that the instance can provide credentials to processes running on that compute, in this case Envoy.
By adding an authorization policy that permits access only from Envoy (through validating the Envoy SigV4 signature) and only with the correct scopes provided in HTTP headers, you can effectively lock down a VPC Lattice service to specific verified users coming from Envoy who are presenting specific OAuth2 scopes in their bearer token.
To answer the original question of where the identity comes from, the identity is provided by the user when communicating with their identity provider (IdP). In addition to this, Envoy is presenting its own identity from its underlying compute to enter the VPC Lattice service network. From a configuration perspective this means your user-to-service communication flow doesn’t require understanding of the user, or the storage of user or machine credentials.
The sample code provided shows a full Envoy configuration for VPC Lattice, including SigV4 signing, access token validation, and extraction of JWT contents to headers. This reference architecture supports various clients including server-side web applications, thick Java clients, and even command line interface-based clients calling the APIs directly. I don’t cover OAuth clients in detail in this post, however the optional sample code allows you to use an OAuth client and flow to talk to the APIs through Envoy.
Service-to-service communication flow
In the service-to-service flow, you need a way to provide AWS credentials to your applications and configure them to use SigV4 to sign their HTTP requests to the destination VPC Lattice services. Your application components can have their own identities (IAM roles), which allows you to uniquely identify application components and make access control decisions based on the particular flow required. For example, application component 1 might need to communicate with application component 2, but not application component 3.
If you have full control of your application code and have a clean method for locating the destination services, then this might be something you can implement directly in your server code. This is the configuration that’s implemented in the AWS Cloud Development Kit (AWS CDK) solution that accompanies this blog post, the app1, app2, and app3 web servers are capable of making SigV4 signed requests to the VPC Lattice services they need to communicate with. The sample code demonstrates how to perform VPC Lattice SigV4 requests in node.js using the aws-crt node bindings. Figure 3 depicts the use of SigV4 authentication between services and VPC Lattice.
Figure 3: Service-to-service flow
To answer the question of where the identity comes from in this flow, you use the native SigV4 signing support from VPC Lattice to validate the application identity. The credentials come from AWS STS, again through the native underlying compute environment. Providing credentials transparently to your applications is one of the biggest advantages of the VPC Lattice solution when comparing this to other types of application security solutions such as service meshes. This implementation requires no provisioning of credentials, no management of identity stores, and automatically rotates credentials as required. This means low overhead to deploy and maintain the security of this solution and benefits from the reliability and scalability of IAM and the AWS Security Token Service (AWS STS) — a very slick solution to securing service-to-service communication flows!
VPC Lattice policy configuration
VPC Lattice provides two levels of auth policy configuration — at the VPC Lattice service network and on individual VPC Lattice services. This allows your cloud operations and development teams to work independently of each other by removing the dependency on a single team to implement access controls. This model enables both agility and separation of duties. More information about VPC Lattice policy configuration can be found in Control access to services using auth policies.
Service network auth policy
This design uses a service network auth policy that permits access to the service network by specific IAM principals. This can be used as a guardrail to provide overall access control over the service network and underlying services. Removal of an individual service auth policy will still enforce the service network policy first, so you can have confidence that you can identify sources of network traffic into the service network and block traffic that doesn’t come from a previously defined AWS principal.
The preceding auth policy example grants permissions to any authenticated request that uses one of the IAM roles app1TaskRole, app2TaskRole, app3TaskRole or EnvoyFrontendTaskRole to make requests to the services attached to the service network. You will see in the next section how service auth policies can be used in conjunction with service network auth policies.
Service auth policies
Individual VPC Lattice services can have their own policies defined and implemented independently of the service network policy. This design uses a service policy to demonstrate both user-to-service and service-to-service access control.
The preceding auth policy is an example that could be attached to the app1 VPC Lattice service. The policy contains two statements:
The first (labelled “Sid”: “UserToService”) provides user-to-service authorization and requires requiring the caller principal to be EnvoyFrontendTaskRole and the request headers to contain the header x-jwt-scope-test.all: true when calling the app1 VPC Lattice service.
The second (labelled “Sid”: “ServiceToService”) provides service-to-service authorization and requires the caller principal to be app2TaskRole when calling the app1 VPC Lattice service.
As with a standard IAM policy, there is an implicit deny, meaning no other principals will be permitted access.
The caller principals are identified by VPC Lattice through the SigV4 signing process. This means by using the identities provisioned to the underlying compute the network flow can be associated with a service identity, which can then be authorized by VPC Lattice service access policies.
Distributed development
This model of access control supports a distributed development and operational model. Because the service network auth policy is decoupled from the service auth policies, the service auth policies can be iterated upon by a development team without impacting the overall policy controls set by an operations team for the entire service network.
The AWS CDK solution deploys four Amazon ECS services, one for the frontend Envoy server for the client-to-service flow, and the remaining three for the backend application components. Figure 4 shows the solution when deployed with the internal domain parameter application.internal.
Backend application components are a simple node.js express server, which will print the contents of your request in JSON format and perform service-to-service calls.
A number of other infrastructure components are deployed to support the solution:
A VPC with associated subnets, NAT gateways and an internet gateway. Internet access is required for the solution to retrieve JSON Web Key Set (JWKS) details from your OAuth provider.
An Amazon Route53 hosted zone for handling traffic routing to the configured domain and VPC Lattice services.
An Amazon ECS cluster (two container hosts by default) to run the ECS tasks.
All application load balancers are internally facing.
Application component load balancers are configured to only accept traffic from the VPC Lattice managed prefix List.
The frontend Envoy load balancer is configured to accept traffic from any host.
Three VPC Lattice services and one VPC Lattice network.
The code for Envoy and the application components can be found in the lattice_soln/containers directory.
AWS CDK code for all other deployable infrastructure can be found in lattice_soln/lattice_soln_stack.py.
Prerequisites
Before you begin, you must have the following prerequisites in place:
An AWS account to deploy solution resources into. AWS credentials should be available to the AWS CDK in the environment or configuration files for the CDK deploy to function.
Python 3.9.6 or higher
Docker or Finch for building containers. If using Finch, ensure the Finch executable is in your path and instruct the CDK to use it with the command export CDK_DOCKER=finch
Enable elastic network interface (ENI) trunking in your account to allow more containers to run in VPC networking mode:
This solution has been tested using Okta, however any OAuth compatible provider will work if it can issue access tokens and you can retrieve them from the command line.
The following instructions describe the configuration process for Okta using the Okta web UI. This allows you to use the device code flow to retrieve access tokens, which can then be validated by the Envoy frontend deployment.
Create a new app integration
In the Okta web UI, select Applications and then choose Create App Integration.
For Sign-in method, select OpenID Connect.
For Application type, select Native Application.
For Grant Type, select both Refresh Token and Device Authorization.
Note the client ID for use in the device code flow.
Create a new API integration
Still in the Okta web UI, select Security, and then choose API.
Choose Add authorization server.
Enter a name and audience. Note the audience for use during CDK installation, then choose Save.
Select the authorization server you just created. Choose the Metadata URI link to open the metadata contents in a new tab or browser window. Note the jwks_uri and issuer fields for use during CDK installation.
Return to the Okta web UI, select Scopes and then Add scope.
For the scope name, enter test.all. Use the scope name for the display phrase and description. Leave User consent as implicit. Choose Save.
Under Access Policies, choose Add New Access Policy.
For Assign to, select The following clients and select the client you created above.
Choose Add rule.
In Rule name, enter a rule name, such as Allow test.all access
Under If Grant Type Is uncheck all but Device Authorization. Under And Scopes Requested choose The following scopes. Select OIDC default scopes to add the default scopes to the scopes box, then also manually add the test.all scope you created above.
During the API Integration step, you should have collected the audience, JWKS URI, and issuer. These fields are used on the command line when installing the CDK project with OAuth support.
You can then use the process described in configure the smart device to retrieve an access token using the device code flow. Make sure you modify scope to include test.all — scope=openid profile offline_access test.all — so your token matches the policy deployed by the solution.
Installation
You can download the deployable solution from GitHub.
Deploy without OAuth functionality
If you only want to deploy the solution with service-to-service flows, you can deploy with a CDK command similar to the following:
To deploy the solution with OAuth functionality, you must provide the following parameters:
jwt_jwks: The URL for retrieving JWKS details from your OAuth provider. This would look something like https://dev-123456.okta.com/oauth2/ausa1234567/v1/keys
jwt_issuer: The issuer for your OAuth access tokens. This would look something like https://dev-123456.okta.com/oauth2/ausa1234567
jwt_audience: The audience configured for your OAuth protected APIs. This is a text string configured in your OAuth provider.
app_domain: The domain to be configured in Route53 for all URLs provided for this application. This domain is local to the VPC created for the solution. For example application.internal.
The solution can be deployed with a CDK command as follows:
$ cdk deploy -c enable_oauth=True -c jwt_jwks=<URL for retrieving JWKS details> \
-c jwt_issuer=<URL of the issuer for your OAuth access tokens> \
-c jwt_audience=<OAuth audience string> \
-c app_domain=<application domain>
Security model
For this solution, network access to the web application is secured through two main controls:
Entry into the service network requires SigV4 authentication, enforced by the service network policy. No other mechanisms are provided to allow access to the services, either through their load balancers or directly to the containers.
Service policies restrict access to either user- or service-based communication based on the identity of the caller and OAuth subject and scopes.
The Envoy configuration strips any x- headers coming from user clients and replaces them with x-jwt-subject and x-jwt-scope headers based on successful JWT validation. You are then able to match these x-jwt-* headers in VPC Lattice policy conditions.
Solution caveats
This solution implements TLS endpoints on VPC Lattice and Application Load Balancers. The container instances do not implement TLS in order to reduce cost for this example. As such, traffic is in cleartext between the Application Load Balancers and container instances, and can be implemented separately if required.
How to use the solution
Now for the interesting part! As part of solution deployment, you’ve deployed a number of Amazon Elastic Compute Cloud (Amazon EC2) hosts to act as the container environment. You can use these hosts to test some of the flows and you can use the AWS Systems Manager connect function from the AWS Management console to access the command line interface on any of the container hosts.
In these examples, I’ve configured the domain during the CDK installation as application.internal, which will be used for communicating with the application as a client. If you change this, adjust your command lines to match.
[Optional] For examples 3 and 4, you need an access token from your OAuth provider. In each of the examples, I’ve embedded the access token in the AT environment variable for brevity.
Example 1: Service-to-service calls (permitted)
For these first two examples, you must sign in to the container host and run a command in your container. This is because the VPC Lattice policies allow traffic from the containers. I’ve assigned IAM task roles to each container, which are used to uniquely identify them to VPC Lattice when making service-to-service calls.
To set up service-to service calls (permitted):
Sign in to the Amazon ECS console. You should see at least three ECS services running.
Figure 5: Cluster console
Select the app2 service LatticeSolnStack-app2service…, then select the Tasks tab. Under the Container Instances heading select the container instance that’s running the app2 service.
Figure 6: Container instances
You will see the instance ID listed at the top left of the page.
Figure 7: Single container instance
Select the instance ID (this will open a new window) and choose Connect. Select the Session Manager tab and choose Connect again. This will open a shell to your container instance.
The policy statements permit app2 to call app1. By using the path app2/call-to-app1, you can force this call to occur.
Test this with the following commands:
sh-4.2$ sudo bash
# docker ps --filter "label=webserver=app2"
CONTAINER ID   IMAGE                                                                                                                                                                           COMMAND                  CREATED         STATUS         PORTS     NAMES
<containerid>  111122223333.dkr.ecr.ap-southeast-2.amazonaws.com/cdk-hnb659fds-container-assets-111122223333-ap-southeast-2:5b5d138c3abd6cfc4a90aee4474a03af305e2dae6bbbea70bcc30ffd068b8403   "sh /app/launch_expr…"   9 minutes ago   Up 9minutes             ecs-LatticeSolnStackapp2task4A06C2E4-22-app2-container-b68cb2ffd8e4e0819901
# docker exec -it <containerid> curl localhost:80/app2/call-to-app1
The policy statements don’t permit app2 to call app3. You can simulate this in the same way and verify that the access isn’t permitted by VPC Lattice.
To set up service-to-service calls (denied)
You can change the curl command from Example 1 to test app2 calling app3.
# docker exec -it cd8420221dcb curl localhost:80/app2/call-to-app3
{
  "upstreamResponse": "AccessDeniedException: User: arn:aws:sts::111122223333:assumed-role/LatticeSolnStack-app2TaskRoleA1BE533B-3K7AJnCr8kTj/ddaf2e517afb4d818178f9e0fef8f841 is not authorized to perform: vpc-lattice-svcs:Invoke on resource: arn:aws:vpc-lattice:ap-southeast-2:111122223333:service/svc-08873e50553c375cd/ with an explicit deny in a service-based policy"
}
[Optional] Example 3: OAuth – Invalid access token
If you’ve deployed using OAuth functionality, you can test from the shell in Example 1 that you’re unable to access the frontend Envoy server (application.internal) without a valid access token, and that you’re also unable to access the backend VPC Lattice services (app1.application.internal, app2.application.internal, app3.application.internal) directly.
You can also verify that you cannot bypass the VPC Lattice service and connect to the load balancer or web server container directly.
sh-4.2$ curl -v https://application.internal
Jwt is missing

sh-4.2$ curl https://app1.application.internal
AccessDeniedException: User: anonymous is not authorized to perform: vpc-lattice-svcs:Invoke on resource: arn:aws:vpc-lattice:ap-southeast-2:111122223333:service/svc-03edffc09406f7e58/ because no network-based policy allows the vpc-lattice-svcs:Invoke action

sh-4.2$ curl https://internal-Lattic-app1s-C6ovEZzwdTqb-1882558159.ap-southeast-2.elb.amazonaws.com
^C

sh-4.2$ curl https://10.0.209.127
^C
[Optional] Example 4: Client access
If you’ve deployed using OAuth functionality, you can test from the shell in Example 1 to access the application with a valid access token. A client can reach each application component by using application.internal/<componentname>. For example, application.internal/app2. If no component name is specified, it will default to app1.
This will fail when attempting to connect to app3 using Envoy, as we’ve denied user to service calls on the VPC Lattice Service policy
sh-4.2$ https://application.internal/app3 -H "Authorization: Bearer $AT"

AccessDeniedException: User: arn:aws:sts::111122223333:assumed-role/LatticeSolnStack-EnvoyFrontendTaskRoleA297DB4D-OwD8arbEnYoP/827dc1716e3a49ad8da3fd1dd52af34c is not authorized to perform: vpc-lattice-svcs:Invoke on resource: arn:aws:vpc-lattice:ap-southeast-2:111122223333:service/svc-06987d9ab4a1f815f/app3 with an explicit deny in a service-based policy
Summary
You’ve seen how you can use VPC Lattice to provide authentication and authorization to both user-to-service and service-to-service flows. I’ve shown you how to implement some novel and reusable solution components:
JWT authorization and translation of scopes to headers, integrating an external IdP into your solution for user authentication.
SigV4 signing from an Envoy proxy running in a container.
Service-to-service flows using SigV4 signing in node.js and container-based credentials.
Integration of VPC Lattice with ECS containers, using the CDK.
All of this is created almost entirely with managed AWS services, meaning you can focus more on security policy creation and validation and less on managing components such as service identities, service meshes, and other self-managed infrastructure.
Some ways you can extend upon this solution include:
Implementing different service policies taking into consideration different OAuth scopes for your user and client combinations
Implementing multiple issuers on Envoy to allow different OAuth providers to use the same infrastructure
Deploying the VPC Lattice services and ECS tasks independently of the service network, to allow your builders to manage task deployment themselves
I look forward to hearing about how you use this solution and VPC Lattice to secure your own applications!
Today, we are thrilled to announce new Cloudflare Zero Trust dashboards on Elastic. Shared customers using Elastic can now use these pre-built dashboards to store, search, and analyze their Zero Trust logs.
When organizations look to adopt a Zero Trust architecture, there are many components to get right. If products are configured incorrectly, used maliciously, or security is somehow breached during the process, it can open your organization to underlying security risks without the ability to get insight from your data quickly and efficiently.
As a Cloudflare technology partner, Elastic helps Cloudflare customers find what they need faster, while keeping applications running smoothly and protecting against cyber threats. “I’m pleased to share our collaboration with Cloudflare, making it even easier to deploy log and analytics dashboards. This partnership combines Elastic’s open approach with Cloudflare’s practical solutions, offering straightforward tools for enterprise search, observability, and security deployment,” explained Mark Dodds, Chief Revenue Officer at Elastic.
Value of Zero Trust logs in Elastic
With this joint solution, we’ve made it easy for customers to seamlessly forward their Zero Trust logs to Elastic via Logpush jobs. This can be achieved directly via a Restful API or through an intermediary storage solution like AWS S3 or Google Cloud. Additionally, Cloudflare’s integration with Elastic has undergone improvements to encompass all categories of Zero Trust logs generated by Cloudflare.
Here are detailed some highlights of what the integration offers:
Comprehensive Visibility: Integrating Cloudflare Logpush into Elastic provides organizations with a real-time, comprehensive view of events related to Zero Trust. This enables a detailed understanding of who is accessing resources and applications, from where, and at what times. Enhanced visibility helps detect anomalous behavior and potential security threats more effectively, allowing for early response and mitigation.
Field Normalization: By unifying data from Zero Trust logs in Elastic, it’s possible to apply consistent field normalization not only for Zero Trust logs but also for other sources. This simplifies the process of search and analysis, as data is presented in a uniform format. Normalization also facilitates the creation of alerts and the identification of patterns of malicious or unusual activity.
Efficient Search and Analysis: Elastic provides powerful data search and analysis capabilities. Having Zero Trust logs in Elastic enables quick and precise searching for specific information. This is crucial for investigating security incidents, understanding workflows, and making informed decisions.
Correlation and Threat Detection: By combining Zero Trust data with other security events and data, Elastic enables deeper and more effective correlation. This is essential for detecting threats that might go unnoticed when analyzing each data source separately. Correlation aids in pattern identification and the detection of sophisticated attacks.
Prebuilt Dashboards: The integration provides out-of-the-box dashboards offering a quick start to visualizing key metrics and patterns. These dashboards help security teams visualize the security landscape in a clear and concise manner. The integration not only provides the advantage of prebuilt dashboards designed for Zero Trust datasets but also empowers users to curate their own visualizations.
What’s new on the dashboards
One of the main assets of the integration is the out-of-the-box dashboards tailored specifically for each type of Zero Trust log. Let’s explore some of these dashboards in more detail to find out how they can help us in terms of visibility.
Gateway HTTP
This dashboard focuses on HTTP traffic and allows for monitoring and analyzing HTTP requests passing through Cloudflare’s Secure Web Gateway.
Here, patterns of traffic can be identified, potential threats detected, and a better understanding gained of how resources are being used within the network.
Every visualization in the stage is interactive. Therefore, the whole dashboard adapts to enabled filters, and they can be pinned across dashboards for pivoting. For instance, if clicking on one of the sections of the donut showing the different actions, a filter is automatically applied on that value and the whole dashboard is oriented around it.
CASB
Following with a different perspective, the CASB (Cloud Access Security Broker) dashboard provides visibility over cloud applications used by users. Its visualizations are targeted to detect threats effectively, helping in the risk management and regulatory compliance.
These examples illustrate how dashboards in the integration between Cloudflare and Elastic offer practical and effective data visualization for Zero Trust. They enable us to make data-driven decisions, identify behavioral patterns, and proactively respond to threats. By providing relevant information in a visual and accessible manner, these dashboards strengthen security posture and allow for more efficient risk management in the Zero Trust environment.
How to get started
Setup and deployment is simple. Use the Cloudflare dashboard or API to create Logpush jobs with all fields enabled for each dataset you’d like to ingest on Elastic. There are eight account-scoped datasets available to use today (Access Requests, Audit logs, CASB findings, Gateway logs including DNS, Network, HTTP; Zero Trust Session Logs) that can be ingested into Elastic.
Setup Logpush jobs to your Elastic destination via one of the following methods:
HTTP Endpoint mode – Cloudflare pushes logs directly to an HTTP endpoint hosted by your Elastic Agent.
AWS S3 polling mode – Cloudflare writes data to S3 and Elastic Agent polls the S3 bucket by listing its contents and reading new files.
AWS S3 SQS mode – Cloudflare writes data to S3, S3 pushes a new object notification to SQS, Elastic Agent receives the notification from SQS, and then reads the S3 object. Multiple Agents can be used in this mode.
Enabling the integration in Elastic
In Kibana, go to Management > Integrations
In the integrations search bar type Cloudflare Logpush.
Click the Cloudflare Logpush integration from the search results.
Click the Add Cloudflare Logpush button to add Cloudflare Logpush integration.
Enable the Integration with the HTTP Endpoint, AWS S3 input or GCS input.
Under the AWS S3 input, there are two types of inputs: using AWS S3 Bucket or using SQS.
Configure Cloudflare to send logs to the Elastic Agent.
What’s next
As organizations increasingly adopt a Zero Trust architecture, understanding your organization’s security posture is paramount. The dashboards help with necessary tools to build a robust security strategy, centered around visibility, early detection, and effective threat response. By unifying data, normalizing fields, facilitating search, and enabling the creation of custom dashboards, this integration becomes a valuable asset for any cybersecurity team aiming to strengthen their security posture.
We’re looking forward to continuing to connect Cloudflare customers with our community of technology partners, to help in the adoption of a Zero Trust architecture.
As cyberattacks increase exponentially and the cost of maintaining dedicated internal security teams skyrockets, the popularity of the “bug bounty” program (which sees outside hackers paid by organizations to legally expose cybersecurity vulnerabilities) is exploding.
Organizations large and small are running programs to root out the security vulnerabilities in their products. Governments and policymakers are changing laws to make the approach easier to adopt, while private sector tech giants are also offering generous rewards – Apple alone has reportedly paid out more than $20 million via its bounty program, and the vendor offers up to $2 million to any hacker who reports a vulnerability that bypasses the protections of Lockdown Mode on its devices.
It’s an approach that dovetails perfectly with the Zabbix philosophy of “security first,” and it’s why as 2023 dawned we began working with HackerOne, the world leader in attack resistance management (ARM). ARM blends the security expertise of ethical hackers with asset discovery, continuous assessment, and process enhancement to find and close gaps in the digital attack surface.
Table of Contents
Why HackerOne?
We knew from the start that we wanted to create a Zabbix-specific bug bounty program that would challenge the world’s best ethical hackers to find the weak spots in our cybersecurity armor – and let us know about them in time to fix them.
One of the biggest advantages of the HackerOne platform is the broad and diverse community of experts that they can call on. Adding Zabbix to HackerOne’s platform was a golden opportunity to test our security and vulnerabilities on a scale that we’d previously been unable to even imagine.
In contrast to an individual penetration test, which is the “old-school” industry standard security measure and is performed based on a pre-prepared scenario, we knew that HackerOne’s experts could discover vulnerabilities that a run-of-the-mill penetration test would never find.
At the same time, we knew that adding Zabbix to HackerOne was a bold decision that would test our faith in the security of our product. Put simply, teaming up with HackerOne was our way of confirming the quality of Zabbix and our desire to constantly improve it.
Getting started
We’ve known for a long time that HackerOne was the ideal partner for a bug bounty program, given their reputation for innovation and effectiveness. After an initial approach and agreement between HackerOne and Zabbix, it was time to consider what exactly a Zabbix bug bounty program would look like.
It was clear to everyone involved that if the reporting of vulnerabilities was to be meaningful and structured, we needed to develop new workflows that would provide a procedure for processing the received applications and handing them over for development. Another critical step was to register for the Common Vulnerabilities and Exposures (CVE) database, where all vulnerabilities discovered in Zabbix are currently registered.
The results
We’re pleased to report that as with any successful implementation, the numbers speak for themselves:
We were pleasantly surprised at the sheer number of submissions alone – not all 250 submissions were severe or even actionable, but the number shows that our community is taking to the program, spreading the word, and doing their part to help us make sure that Zabbix is as secure as we can possibly make it. The fact that we were able to “squash” several bugs that will now never get a chance to bedevil our users is just the icing on the cake.
The results are impressive, but in keeping with the Zabbix ethos of continuous improvement, we’re confident that with a few refinements we can pay out even more in 2024. After all, any money that goes toward building a better, more secure product is money well spent! We’d like to close by extending a special and heartfelt thank you to everyone who has contributed to our bug bounty program and discovered vulnerabilities – keep up the great work!
In an era dominated by digital landscapes, protecting your brand’s identity has become more challenging than ever. Malicious actors regularly build lookalike websites, complete with official logos and spoofed domains, to try to dupe customers and employees. These kinds of phishing attacks can damage your reputation, erode customer trust, or even result in data breaches.
In March 2023 we introduced Cloudflare’s Brand and Phishing Protection suite, beginning with Brand Domain Name Alerts. This tool recognizes so-called “confusable” domains (which can be nearly indistinguishable from their authentic counterparts) by sifting through the trillions of DNS requests passing through Cloudflare’s DNS resolver, 1.1.1.1. This helps brands and organizations stay ahead of malicious actors by spotting suspicious domains as soon as they appear in the wild.
Today we are excited to expand our Brand Protection toolkit with the addition of Logo Matching. Logo Matching is a powerful tool that allows brands to detect unauthorized logo usage: if Cloudflare detects your logo on an unauthorized site, you receive an immediate notification.
The new Logo Matching feature is a direct result of a frequent request from our users. Phishing websites often use official brand logos as part of their facade. In fact, the appearance of unauthorized logos is a strong signal that a hitherto dormant suspicious domain is being weaponized. Being able to identify these sites before they are widely distributed is a powerful tool in defending against phishing attacks. Organizations can use Cloudflare Gateway to block employees from connecting to sites with a suspicious domain and unauthorized logo use.
Imagine having the power to fortify your brand’s presence and reputation. By detecting instances where your logo is being exploited, you gain the upper hand in protecting your brand from potential fraud and phishing attacks.
Getting started with Logo Matching
For most brands, the first step to leveraging Logo Matching will be to configure Domain Name Alerts. For example, we might decide to set up an alert for example.com, which will use fuzzy matching to detect lookalike, high-risk domain names. All sites that trigger an alert are automatically analyzed by Cloudflare’s phishing scanner, which gathers technical information about each site, including SSL certificate data, HTTP request and response data, page performance data, DNS records, and more — all of which inform a machine-learning based phishing risk analysis.
Logo Matching further extends this scan by looking for matching images. The system leverages image recognition algorithms to crawl through scanned domains, identifying matches even when images have undergone slight modifications or alterations.
Once configured, Domain Name Alerts and the scans they trigger will continue on an ongoing basis. In addition, Logo Matching monitors for images across all domains scanned by Cloudflare’s phishing scanner, including those scanned by other Brand Protection users, as well as scans initiated via the Cloudflare Radar URL scanner, and the Investigate Portal within Cloudflare’s Security Center dashboard.
How we built Logo Matching for Brand Protection
Under the hood of our API Insights
Now, let’s dive deeper into the engine powering this feature – our Brand Protection API. This API serves as the backbone of the entire process. Not only does it enable users to submit logos and brand images for scanning, but it also orchestrates the complex matching process.
When a logo is submitted through the API, the Logo Matching feature not only identifies potential matches but also allows customers to save a query, providing an easy way to refer back to their queries and see the most recent results. If a customer chooses to save a query, the logo is swiftly added to our data storage in R2, Cloudflare’s zero egress fee object storage. This foundational feature enables us to continuously provide updated results without the customer having to create a new query for the same logo.
The API ensures real-time responses for logo submissions, simultaneously kick-starting our internal scanning pipelines. An image look-back ID is generated to facilitate seamless tracking and processing of logo submissions. This identifier allows us to keep a record of the submitted images, ensuring that we can efficiently manage and process them through our system.
Scan result retrieval
As images undergo scanning, the API remains the conduit for result retrieval. Its role here is to constantly monitor and provide the results in real time. During scanning, the API ensures users receive timely updates. If scanning is still in progress, a “still scanning” status is communicated. Upon completion, the API is designed to relay crucial information — details on matches if found, or a simple “no matches” declaration.
Storing and maintaining logo data
In the background, we maintain a vectorized version of all user-uploaded logos when the user query is saved. This system, acting as a logo matching subscriber, is entrusted with the responsibility of ensuring accurate and up-to-date logo matching.
To accomplish this, two strategies come into play. Firstly, the subscriber stays attuned to revisions in the logo set. It saves vectorized logo sets with every revision and regular checks are conducted by the subscriber to ensure alignment between the vectorized logos and those saved in the database.
While monitoring the query, the subscriber employs a diff-based strategy. This recalibrates the vectorized logo set against the current logos stored in the database, ensuring a seamless transition into processing.
Shaping the future of brand protection: our roadmap ahead
With the introduction of the Logo Matching feature, Cloudflare’s Brand Protection suite advances to the next level of brand integrity management. By enabling you to detect and analyze, and act on unauthorized logo usage, we’re helping businesses to take better care of their brand identity.
At Cloudflare, we’re committed to shaping a comprehensive brand protection solution that anticipates and mitigates risks proactively. In the future, we plan to add enhancements to our brand protection solution with features like automated cease and desist letters for swift legal action against unauthorized logo use, proactive domain monitoring upon onboarding, simplified reporting of brand impersonations and more.
Getting started
If you’re an Enterprise customer, sign up for Beta Access for Brand protection now to gain access to private scanning for your domains, logo matching, save queries and set up alerts on matched domains. Learn more about Brand Protection here.
In November 2023, we announced the launch of code scanning autofix, leveraging AI to suggest fixes for security vulnerabilities in users’ codebases. This post describes how autofix works under the hood, as well as the evaluation framework we use for testing and iteration.
What is code scanning autofix?
GitHub code scanning analyzes the code in a repository to find security vulnerabilities and other errors. Scans can be triggered on a schedule or upon specified events, such as pushing to a branch or opening a pull request. When a problem is identified, an alert is presented to the user. Code scanning can be used with first- or third-party alerting tools, including open source and private tools. GitHub provides a first party alerting tool powered by CodeQL, our semantic code analysis engine, which allows querying of a codebase as though it were data. Our in-house security experts have developed a rich set of queries to detect security vulnerabilities across a host of popular languages and frameworks. Building on top of this detection capability, code scanning autofix takes security a step further, by suggesting AI-generated fixes for alerts. In its first iteration, autofix is enabled for CodeQL alerts detected in a pull request, beginning with JavaScript and TypeScript alerts. It explains the problem and its fix strategy in natural language, displays the suggested fix directly in the pull request page, and allows the developer to commit, dismiss, or edit the suggestion.
The basic idea behind autofix is simple: when a code analysis tool such as CodeQL detects a problem, we send the affected code and a description of the problem to a large language model (LLM), asking it to suggest code edits that will fix the problem without changing the functionality of the code. The following sections delve into some of the details and subtleties of constructing the LLM prompt, processing the model’s response, evaluating the quality of the feature, and serving it to our users.
The autofix prompt
At the core of our technology lies a request to an LLM, expressed through an LLM prompt. CodeQL static analysis detects a vulnerability, generating an alert that references the problematic code location as well as any other relevant locations. For example, for a SQL-injection vulnerability, the alert flags the location where tainted data is used to build a database query, and also includes one or more flow paths showing how untrusted data may reach this location without sanitization. We extract information from the alert to construct an LLM prompt consisting of:
General information about this type of vulnerability, typically including a general example of the vulnerability and how to fix it, extracted from the CodeQL query help.
The source-code location and content of the alert message.
Relevant code snippets from the locations all along the flow path and any code locations referenced in the alert message.
Specification of the response we expect.
We then ask the model to show us how to edit the code to fix the vulnerability.
We describe a strict format for the model output, to allow for automated processing. The model outputs Markdown consisting of the following sections:
Detailed natural language instructions for fixing the vulnerability.
A full specification of the needed code edits, following the format defined in the prompt.
A list of dependencies that should be added to the project, if applicable. This is needed, for example, if the fix makes use of a third-party sanitization library on which the project does not already depend.
We surface the natural language explanation to users together with the code scanning alert, followed by a diff patch constructed from the code edits and added dependencies. Users can review the suggested fix, edit and adjust it if necessary, and apply it as a commit in their pull request.
Pre- and post-processing
If our goal were to produce a nice demo, this simple setup would suffice. Supporting real-world complexity and overcoming LLM limitations, however, requires a combination of careful prompt crafting and post-processing heuristics. A full description of our approach is beyond the scope of this post, but we outline some of the more impactful aspects below.
Selecting code to show the model
CodeQL alerts include location information for the alert and sometimes steps along the data flow path from the source to the sink. Sometimes additional source-code locations are referenced in the alert message. Any of these locations may require edits to fix the vulnerability. Further parts of the codebase, such as the test suite, may also need edits, but we focus on the most likely candidates due to prompt length constraints.
For each of these code locations, we use a set of heuristics to select a surrounding region that provides the needed context while minimizing lines of code, eliding less relevant parts as needed to achieve the target length. The region is designed to include the imports and definitions at the top of the file, as these often need to be augmented in the fix suggestion. When multiple locations from the CodeQL alert reside in the same file, we structure a combined code snippet that gives the needed context for all of them.
The result is a set of one or more code snippets, potentially from multiple source-code files, showing the model the parts of the project where edits are most likely to be needed, with line numbers added so as to allow reference to specific lines both in the model prompt and in the model response. To prevent fabrications, we explicitly constrain the model to make edits only to the code included in the prompt.
Adding dependencies
Some fixes require adding a new project dependency, such as a data sanitation library. To do so, we need to find the configuration file(s) that list project dependencies, determine whether the needed packages are already included, and if not make the needed additions. We could use an LLM for all these steps, but this would require showing the LLM the list of files in the codebase as well as the contents of the relevant ones. This would increase both the number of model calls and the number of prompt tokens. Instead, we simply ask the model to list external dependencies used in its fix. We implement language-specific heuristics to locate the relevant configuration file, parse it to determine whether the needed dependencies already exist, and if not add the needed edits to the diff patch we produce.
Specifying a format for code edits
We need a compact format for the model to specify code edits. The most obvious choice would be asking the model to output a standard diff patch directly. Unfortunately, experimentation shows that this approach exacerbates the model’s known difficulties with arithmetic, often yielding incorrect line number computations without enough code context to make heuristic corrections. We experimented with several alternatives, including defining a fixed set of line edit commands the model can use. The approach that yielded the best results in practice involves allowing the model to provide “before” and “after” code blocks, demonstrating the snippets that require changes (including some surrounding context lines) and the edits to be made.
Overcoming model errors
We employ a variety of post-processing heuristics to detect and correct small errors in the model output. For example, “before” code blocks might not exactly match the original source-code, and line numbers may be slightly off. We implement a fuzzy search to match the original code, overcoming and correcting errors in indentation, semicolons, code comments, and the like. We use a parser to check for syntax errors in the edited code. We also implement semantic checks such as name-resolution checks and type checks. If we detect errors we are unable to fix heuristically, we flag the suggested edit as (partially) incorrect. In cases where the model suggests new dependencies to add to the project, we verify that these packages exist in the ecosystem’s package registry and check for known security vulnerabilities or malicious packages.
Evaluation and iteration
To make iterative improvements to our prompts and heuristics while at the same time minimizing LLM compute costs, we need to evaluate fix suggestions at scale. In taking autofix from demo quality to production quality, we relied on an extensive automated test harness to enable fast evaluation and iteration.
The first component of the test harness is a data collection pipeline that processes open source repositories with code scanning alerts, collecting alerts that have test coverage for the alert location. For JavaScript / TypeScript, the first supported languages, we collected over 1,400 alerts with test coverage from 63 CodeQL queries.
The second component of the test harness is a GitHub Actions workflow that runs autofix on each alert in the evaluation set. After committing the generated fix in a fork, the workflow runs both CodeQL and the repository’s test suite to evaluate the validity of the fix. In particular, a fix is considered successful only if:
It removes the CodeQL alert.
It introduces no new CodeQL alerts.
It produces no syntax errors.
It does not change the outcome of any of the repository tests.
As we iterated on the prompt, the code edit format, and various post-processing heuristics, we made use of this test harness to ensure that our changes were improving our success rate. We coupled the automated evaluations with periodic manual triage, to focus our efforts on the most prevalent problems, as well as to validate the accuracy of the automated framework. This rigorous approach to data-driven development allowed us to triple our success rate while at the same time reducing LLM compute requirements by a factor of six.
Architecture, infrastructure, and user experience
Generating useful fixes is a first step, but surfacing them to our users requires further front- and back-end modifications. Designing for simplicity, we’ve built autofix on top of existing functionality wherever possible. The user experience enhances the code scanning pull request experience. Along with a code scanning alert, users can now see a suggested fix, which may include suggested changes in multiple files, optionally outside the scope of the pull request diff. A natural language explanation of the fix is also displayed. Users can commit the suggested fixes directly to the pull request, or edit the suggestions in their local IDE or in a GitHub Codespace.
The backend, too, is built on top of existing code scanning infrastructure, making it seamless for our users. Customers do not need to make any changes to their code scanning workflows to see fix suggestions for supported CodeQL queries.
The user opens a pull request or pushes a commit. Code scanning runs as usual, as part of an actions workflow or workflow in a third-party CI system, uploading the results in the SARIF format to the code scanning API. The code scanning backend service checks whether the results are for a supported language. If so, it runs the fix generator as a CLI tool. The fix generator leverages the SARIF alert data, augmented with relevant pieces of source-code from the repository, to craft a prompt for the LLM. It calls the LLM via an authenticated API call to an internally-deployed API running LLMs on Azure. The LLM response is run through a filtering system which helps prevent certain classes of harmful responses. The fix generator then post-processes the LLM response to produce a fix suggestion. The code scanning backend stores the resulting suggestion, making it available for rendering alongside the alert in pull request views. Suggestions are cached for reuse where possible, reducing LLM compute requirements.
As with all GitHub products, we followed standard and internal security procedures, and put our architectural design through a rigorous security and privacy review process to safeguard our users. We also took precautions against AI-specific risks such as prompt injection attacks. While software security can never be fully guaranteed, we conducted red team testing to stress-test our model response filters and other safety mechanisms, assessing risks related to security, harmful content, and model bias.
Telemetry and monitoring
Before launching autofix, we wanted to ensure that we could monitor performance and measure its impact in the wild. We don’t collect the prompt or the model responses because these may contain private user code. Instead, we collect anonymized, aggregated telemetry on user interactions with suggested fixes, such as the percentage of alerts for which a fix suggestion was generated, the percentage of suggestions that were committed as-is to the branch, the percentage of suggestions that were applied through the GitHub CLI or Codespace, the percentage of suggestions that were dismissed, and the fix rate for alerts with suggestions versus alerts without. As we onboard more users onto the beta program, we’ll look at this telemetry to understand the usefulness of our suggestions.
Additionally, we’re monitoring the service for errors, such as overloading of the Azure model API or triggering of the filters that block harmful content. Before expanding autofix to unlimited public beta and eventually general availability, we want to ensure a consistent, stable user experience.
What’s next?
As we roll out the code scanning autofix beta to an increasing number of users, we’re collecting feedback, fixing papercuts, and monitoring metrics to ensure that our suggestions are in fact useful for security vulnerabilities in the wild. In parallel, we’re expanding autofix to more languages and use cases, and improving the user experience. If you want to join the public beta, sign up here. Keep an eye out for more updates soon!
Access control is essential for multi-tenant software as a service (SaaS) applications. SaaS developers must manage permissions, fine-grained authorization, and isolation.
In this post, we demonstrate how you can use Amazon Verified Permissions for access control in a multi-tenant document management SaaS application using a per-tenant policy store approach. We also describe how to enforce the tenant boundary.
We usually see the following access control needs in multi-tenant SaaS applications:
Application developers need to define policies that apply across all tenants.
Tenant users need to control who can access their resources.
Tenant admins need to manage all resources for a tenant.
Additionally, independent software vendors (ISVs) implement tenant isolation to prevent one tenant from accessing the resources of another tenant. Enforcing tenant boundaries is imperative for SaaS businesses and is one of the foundational topics for SaaS providers.
Verified Permissions is a scalable, fine-grained permissions management and authorization service that helps you build and modernize applications without having to implement authorization logic within the code of your application.
Verified Permissions uses the Cedar language to define policies. A Cedar policy is a statement that declares which principals are explicitly permitted, or explicitly forbidden, to perform an action on a resource. The collection of policies defines the authorization rules for your application. Verified Permissions stores the policies in a policy store. A policy store is a container for policies and templates. You can learn more about Cedar policies from the Using Open Source Cedar to Write and Enforce Custom Authorization Policies blog post.
Before Verified Permissions, you had to implement authorization logic within the code of your application. Now, we’ll show you how Verified Permissions helps remove this undifferentiated heavy lifting in an example application.
Multi-tenant document management SaaS application
The application allows to add, share, access and manage documents. It requires the following access controls:
Application developers who can define policies that apply across all tenants.
Tenant users who can control who can access their documents.
Tenant admins who can manage all documents for a tenant.
Let’s start by describing the application architecture and then dive deeper into the design details.
Application architecture overview
There are two approaches to multi-tenant design in Verified Permissions: a single shared policy store and a per-tenant policy store. You can learn about the considerations, trade-offs and guidance for these approaches in the Verified Permissions user guide.
For the example document management SaaS application, we decided to use the per-tenant policy store approach for the following reasons:
Low-effort tenant policies isolation
The ability to customize templates and schema per tenant
Low-effort tenant off-boarding
Per-tenant policy store resource quotas
We decided to accept the following trade-offs:
High effort to implement global policies management (because the application use case doesn’t require frequent changes to these policies)
Medium effort to implement the authorization flow (because we decided that in this context, the above reasons outweigh implementing a mapping from tenant ID to policy store ID)
Figure 1 shows the document management SaaS application architecture. For simplicity, we omitted the frontend and focused on the backend.
A tenant user signs in to an identity provider such as Amazon Cognito. They get a JSON Web Token (JWT), which they use for API requests. The JWT contains claims such as the user_id, which identifies the tenant user, and the tenant_id, which defines which tenant the user belongs to.
The tenant user makes API requests with the JWT to the application.
Amazon API Gateway verifies the validity of the JWT with the identity provider.
If the JWT is valid, API Gateway forwards the request to the compute provider, in this case an AWS Lambda function, for it to run the business logic.
The Lambda function assumes an AWS Identity and Access Management (IAM) role with an IAM policy that allows access to the Amazon DynamoDB table that provides tenant-to-policy-store mapping. The IAM policy scopes down access such that the Lambda function can only access data for the current tenant_id.
The Lambda function looks up the Verified Permissions policy_store_id for the current request. To do this, it extracts the tenant_id from the JWT. The function then retrieves the policy_store_id from the tenant-to-policy-store mapping table.
The Lambda function assumes another IAM role with an IAM policy that allows access to the Verified Permissions policy store, the document metadata table, and the document store. The IAM policy uses tenant_id and policy_store_id to scope down access.
The Lambda function gets or stores documents metadata in a DynamoDB table. The function uses the metadata for Verified Permissions authorization requests.
Using the information from steps 5 and 6, the Lambda function calls Verified Permissions to make an authorization decision or create Cedar policies.
If authorized, the application can then access or store a document.
Application architecture deep dive
Now that you know the architecture for the use cases, let’s review them in more detail and work backwards from the user experience to the related part of the application architecture. The architecture focuses on permissions management. Accessing and storing the actual document is out of scope.
Define policies that apply across all tenants
The application developer must define global policies that include a basic set of access permissions for all tenants. We use Cedar policies to implement these permissions.
Because we’re using a per-tenant policy store approach, the tenant onboarding process should create these policies for each new tenant. Currently, to update policies, the deployment pipeline should apply changes to all policy stores.
The “Add a document” and “Manage all the documents for a tenant” sections that follow include examples of global policies.
Make sure that a tenant can’t edit the policies of another tenant
The application uses IAM to isolate the resources of one tenant from another. Because we’re using a per-tenant policy store approach we can use IAM to isolate one tenant policy store from another.
Architecture
Figure 2: Tenant isolation
A tenant user calls an API endpoint using a valid JWT.
The Lambda function uses AWS Security Token Service (AWS STS) to assume an IAM role with an IAM policy that allows access to the tenant-to-policy-store mapping DynamoDB table. The IAM policy only allows access to the table and the entries that belong to the requesting tenant. When the function assumes the role, it uses tenant_id to scope access to the items whose partition key matches the tenant_id. See the How to implement SaaS tenant isolation with ABAC and AWS IAM blog post for examples of such policies.
The Lambda function uses the user’s tenant_id to get the Verified Permissions policy_store_id.
The Lambda function uses the same mechanism as in step 2 to assume a different IAM role using tenant_id and policy_store_id which only allows access to the tenant policy store.
The Lambda function accesses the tenant policy store.
Add a document
When a user first accesses the application, they don’t own any documents. To add a document, the frontend calls the POST /documents endpoint and supplies a document_name in the request’s body.
Cedar policy
We need a global policy that allows every tenant user to add a new document. The tenant onboarding process creates this policy in the tenant’s policy store.
This policy allows any principal to add a document. Because we’re using a per-tenant policy store approach, there’s no need to scope the principal to a tenant.
Architecture
Figure 3: Adding a document
A tenant user calls the POST /documents endpoint to add a document.
The Lambda function uses the user’s tenant_id to get the Verified Permissions policy_store_id.
The Lambda function calls the Verified Permissions policy store to check if the tenant user is authorized to add a document.
After successful authorization, the Lambda function adds a new document to the documents metadata database and uploads the document to the documents storage.
The database structure is described in the following table:
tenant_id (Partition key): String
document_id (Sort key): String
document_name: String
document_owner: String
<TENANT_ID>
<DOCUMENT_ID>
<DOCUMENT_NAME>
<USER_ID>
tenant_id: The tenant_id from the JWT claims.
document_id: A random identifier for the document, created by the application.
document_name: The name of the document supplied with the API request.
document_owner: The user who created the document. The value is the user_id from the JWT claims.
Share a document with another user of a tenant
After a tenant user has created one or more documents, they might want to share them with other users of the same tenant. To share a document, the frontend calls the POST /shares endpoint and provides the document_id of the document the user wants to share and the user_id of the receiving user.
Cedar policy
We need a global document owner policy that allows the document owner to manage the document, including sharing. The tenant onboarding process creates this policy in the tenant’s policy store.
permit (
  principal,
  action,
  resource
) when {
  resource.owner == principal &&
  resource.type == "document"
};
The policy allows principals to perform actions on available resources (the document) when the principal is the document owner. This policy allows the shareDocument action, which we describe next, to share a document.
We also need a share policy that allows the receiving user to access the document. The application creates these policies for each successful share action. We recommend that you use policy templates to define the share policy. Policy templates allow a policy to be defined once and then attached to multiple principals and resources. Policies that use a policy template are called template-linked policies. Updates to the policy template are reflected across the principals and resources that use the template. The tenant onboarding process creates the share policy template in the tenant’s policy store.
The policy includes the user_id of the receiving user (principal) and the document_id of the document (resource).
Architecture
Figure 4: Sharing a document
A tenant user calls the POST /shares endpoint to share a document.
The Lambda function uses the user’s tenant_id to get the Verified Permissions policy_store_id and policy template IDs for each action from the DynamoDB table that stores the tenant to policy store mapping. In this case the function needs to use the share_policy_template_id.
The function queries the documents metadata DynamoDB table to retrieve the document_owner attribute for the document the user wants to share.
The Lambda function calls Verified Permissions to check if the user is authorized to share the document. The request context uses the user_id from the JWT claims as the principal, shareDocument as the action, and the document_id as the resource. The document entity includes the document_owner attribute, which came from the documents metadata DynamoDB table.
If the user is authorized to share the resource, the function creates a new template-linked share policy in the tenant’s policy store. This policy includes the user_id of the receiving user as the principal and the document_id as the resource.
Access a shared document
After a document has been shared, the receiving user wants to access the document. To access the document, the frontend calls the GET /documents endpoint and provides the document_id of the document the user wants to access.
Cedar policy
As shown in the previous section, during the sharing process, the application creates a template-linked share policy that allows the receiving user to access the document. Verified Permissions evaluates this policy when the user tries to access the document.
Architecture
Figure 5: Accessing a shared document
A tenant user calls the GET /documents endpoint to access the document.
The Lambda function uses the user’s tenant_id to get the Verified Permissions policy_store_id.
The Lambda function calls Verified Permissions to check if the user is authorized to access the document. The request context uses the user_id from the JWT claims as the principal, accessDocument as the action, and the document_id as the resource.
Manage all the documents for a tenant
When a customer signs up for a SaaS application, the application creates the tenant admin user. The tenant admin must have permissions to perform all actions on all documents for the tenant.
Cedar policy
We need a global policy that allows tenant admins to manage all documents. The tenant onboarding process creates this policy in the tenant’s policy store.
permit (
  principal in DocumentsAPI::Group::"<admin_group_id>”,
  action,
  resource
);
This policy allows every member of the <admin_group_id> group to perform any action on any document.
Architecture
Figure 6: Managing documents
A tenant admin calls the POST /documents endpoint to manage a document.
The Lambda function uses the user’s tenant_id to get the Verified Permissions policy_store_id.
The Lambda function calls Verified Permissions to check if the user is authorized to manage the document.
Conclusion
In this blog post, we showed you how Amazon Verified Permissions helps to implement fine-grained authorization decisions in a multi-tenant SaaS application. You saw how to apply the per-tenant policy store approach to the application architecture. See the Verified Permissions user guide for how to choose between using a per-tenant policy store or one shared policy store. To learn more, visit the Amazon Verified Permissions documentation and workshop.
How do we ensure over 100 million users across the world have uninterrupted access to GitHub’s products and services on a platform that is always available, secure, and accessible? From our beginnings as a platform for open source to now also supporting 90% of the Fortune 100, that is the ongoing challenge we face and hold ourselves accountable for delivering across our engineering organization.
Establishing engineering governance
To meet the needs of our increased number of enterprise customers and our continuing innovation across the GitHub platform, we needed to address tech debt, improve reliability, and enhance observability of our engineering systems. This led to the birth of GitHub’s engineering governance program called the Fundamentals program. Our goal was to work cross-functionally to define, measure, and sustain engineering excellence with a vision to ensure our products and services are built right for all users.
What is the Fundamentals program?
In order for such a large-scale program to be successful, we needed to tackle not only the processes but also influence GitHub’s engineering culture. The Fundamentals program helps the company continue to build trust and lead the industry in engineering excellence, by ensuring that there is clear prioritization of the work needed in order for us to guarantee the success of our platform and the products that you love.
We do this via the lens of three program pillars, which help our organization understand the focus areas that we emphasize today:
Accessibility (A11Y): Truly be the home for all developers
Security: Serve as the most trustworthy platform for developers
Availability: Always be available and on for developers
In order for this to be successful, we’ve relied on both grass-roots support from individual teams and strong and consistent sponsorship from our engineering leadership. In addition, it requires meaningful investment in the tools and processes to make it easy for engineers to measure progress against their goals. No one in this industry loves manual processes and here at GitHub we understand anything that is done more than once must be automated to the best of our ability.
How do we measure progress?
We use Fundamental Scorecards to measure progress against our Availability, Security, and Accessibility goals across the engineering organization. The scorecards are designed to let us know that a particular service or feature in GitHub has reached some expected level of performance against our standards. Scorecards align to the fundamentals pillars. For example, the secret scanning scorecard aligns to the Security pillar, Durable Ownership aligns to Availability, etc. These are iteratively evolved by enhancing or adding requirements to ensure our services are meeting our customer’s changing needs. We expect that some scorecards will eventually become concrete technical controls such that any deviation is treated as an incident and other automated safety and security measures may be taken, such as freezing deployments for a particular service until the issue is resolved.
Each service has a set of attributes that are captured and strictly maintained in a YAML file, such as a service tier (tier 0 to 3 based on criticality to business), quality of service (QoS values include critical, best effort, maintenance and so on based on the service tier), and service type that lives right in the service’s repo. In addition, this file also has the ownership information of the service, such as the sponsor, team name, and contact information. The Fundamental scorecards read the service’s YAML file and start monitoring the applicable services based on their attributes. If the service does not meet the requirements of the applicable Fundamental scorecard, an action item is generated with an SLA for effective resolution. A corresponding issue is automatically generated in the service’s repository to seamlessly tie into the developer’s workflow and meet them where they are to make it easy to find and resolve the unmet fundamental action items.
Through the successful implementation of the Fundamentals program, we have effectively managed several scorecards that align with our Availability, Security, and Accessibility goals, including:
Durable ownership: maintains ownership of software assets and ensures communication channels are defined. Adherence to this fundamental supports GitHub’s Availability and Security.
Code scanning: tracks security vulnerabilities in GitHub software and uses CodeQL to detect vulnerabilities during development. Adherence to this fundamental supports GitHub’s Security.
Secret scanning: tracks secrets in GitHub’s repositories to mitigate risks. Adherence to this fundamental supports GitHub’s Security.
Incident readiness: ensures services are configured to alert owners, determine incident cause, and guide on-call engineers. Adherence to this fundamental supports GitHub’s Availability.
Accessibility: ensures products and services follow our accessibility standards. Adherence to this fundamental enables developers with disabilities to build on GitHub.
Example secret scanning scorecard
A culture of accountability
As much emphasis as we put on Fundamentals, it’s not the only thing we do: we ship products, too!
We call it the Fundamentals program because we also make sure that:
We include Fundamentals in our strategic plans. This means our organization prioritizes this work and allocates resources to accomplish the fundamental goals we each quarter. We track the goals on a weekly basis and address the roadblocks.
We surface and manage risks across all services to the leaders so they can actively address them before they materialize into actual problems.
We provide support to teams as they work to mitigate fundamental action items.
It’s clearly understood that all services, regardless of team, have a consistent set of requirements from Fundamentals.
Planning, managing, and executing fundamentals is a team affair, with a program management umbrella.
Designated Fundamentals champions and delegates help maintain scorecard compliance, and our regular check-ins with engineering leaders help us identify high-risk services and commit to actions that will bring them back into compliance. This includes:
Executive sponsor. The executive sponsor is a senior leader who supports the program by providing resources, guidance, and strategic direction.
Pillar sponsor. The pillar sponsor is an engineering leader who oversees the overarching focus of a given pillar across the organization as in Availability, Security, and Accessibility.
Directly responsible individual (DRI). The DRI is an individual responsible for driving the program by collaborating across the organization to make the right decisions, determine the focus, and set the tempo of the program.
Scorecard champion. The scorecard champion is an individual responsible for the maintenance of the scorecard. They add, update, and deprecate the scorecard requirements to keep the scorecard relevant.
Service sponsors. The sponsor oversees the teams that maintain services and is accountable for the health of the service(s).
Fundamentals delegate. The delegate is responsible for coordinating Fundamentals work with the service owners within their org, supporting the Sponsor to ensure the work is prioritized, and resources committed so that it gets completed.
Results-driven execution
Making the data readily available is a critical part of the puzzle. We created a Fundamentals dashboard that shows all the services with unmet scorecards sorted by service tier and type and filtered by service owners and teams. This makes it easier for our engineering leaders and delegates to monitor and take action towards Fundamental scorecards’ adherence within their orgs.
As a result:
Our services comply with durable ownership requirements. For example, the service must have an executive sponsor, a team, and a communication channel on Slack as part of the requirements.
We resolved active secret scanning alerts in repositories affiliated with the services in the GitHub organization. Some of the repositories were 15 years old and as a part of this effort we ensured that these repos are durably owned.
Business critical services are held to greater incident readiness standards that are constantly evolving to support our customers.
Service tiers are audited and accurately updated so that critical services are held to the highest standards.
Example layout and contents of Fundamentals dashboard
Tier 1 Services Out of Compliance [Count: 2]
Service Name
Service Tier
Unmet Scorecard
Exec Sponsor
Team
service_a
1
incident-readiness
john_doe
github/team_a
service_x
1
code-scanning
jane_doe
github/team_x
Continuous monitoring and iterative enhancement for long-term success
By setting standards for engineering excellence and providing pathways to meet through standards through culture and process, GitHub’s Fundamentals program has delivered business critical improvements within the engineering organization and, as a by-product, to the GitHub platform. This success was possible by setting the right organizational priorities and committing to them. We keep all levels of the organization engaged and involved. Most importantly, we celebrate the wins publicly, however small they may seem. Building the culture of collaboration, support, and true partnership has been key to sustaining the ongoing momentum of an organization-wide engineering governance program, and the scorecards that monitor the availability, security, and accessibility of our platform so you can consistently rely on us to achieve your goals.
We continue to expand the scope of our assurance programs at Amazon Web Services (AWS), and we’re pleased to announce that AWS has successfully completed the 2023 Cloud Computing Compliance Controls Catalogue (C5) attestation cycle with 170 services in scope. This alignment with C5 requirements demonstrates our ongoing commitment to adhere to the heightened expectations for cloud service providers. AWS customers in Germany and across Europe can run their applications on AWS Regions in scope of the C5 report with the assurance that AWS aligns with C5 requirements.
The C5 attestation scheme is backed by the German government and was introduced by the Federal Office for Information Security (BSI) in 2016. AWS has adhered to the C5 requirements since their inception. C5 helps organizations demonstrate operational security against common cybersecurity threats when using cloud services within the context of the German government’s Security Recommendations for Cloud Computing Providers.
Independent third-party auditors evaluated AWS for the period of October 1, 2022, through September 30, 2023. The C5 report illustrates the compliance status of AWS for both the basic and additional criteria of C5. Customers can download the C5 report through AWS Artifact, a self-service portal for on-demand access to AWS compliance reports. Sign in to AWS Artifact in the AWS Management Console, or learn more at Getting Started with AWS Artifact.
AWS has added the following 16 services to the current C5 scope:
With the 2023 C5 attestation, we’re also expanding the scope to two new Regions — Europe (Spain) and Europe (Zurich). In addition, the services offered in the Asia Pacific (Singapore), Europe (Frankfurt), Europe (Ireland), Europe (London), Europe (Milan), Europe (Paris), and Europe (Stockholm) Regions remain in scope of this attestation. For up-to-date information, see the C5 page of our AWS Services in Scope by Compliance Program.
AWS strives to continuously bring services into the scope of its compliance programs to help you meet your architectural and regulatory needs. If you have questions or feedback about C5 compliance, reach out to your AWS account team.
To learn more about our compliance and security programs, see AWS Compliance Programs. As always, we value your feedback and questions; reach out to the AWS Compliance team through the Contact Us page.
If you have feedback about this post, submit comments in the Comments section below.
A Case Study Presented by CodeWhisperer Customizations
Amazon CodeWhisperer is an AI-powered coding assistant that is trained on a wide variety of data, including Amazon and open-source code. With the launch of CodeWhisperer Customizations, customers can create a customization resource. The customization is produced by augmenting CodeWhisperer using a customer’s private code repositories. This enables organization-specific code recommendations tailored to the customer’s own internal APIs, libraries, and frameworks.
When we started designing CodeWhisperer Customizations, we considered what our guiding principles, our tenets, should be. Customer trust was at the top of the list, but that posed new questions. How could we best earn our customer’s trust with a feature that fundamentally relies on a customer’s sensitive information? How could we properly secure this data so that customers could safely leverage the advanced capabilities we launched for them?
When considering these questions, we analyzed several design principles. It was important to ensure that a customer’s data is never combined, or used alongside, another customer’s. In other words, we needed to store each customer’s data in isolation. Additionally, we also wanted to restrict data processing to single-tenant compute. By this, we mean that any access of the data itself should be done on short-lived and non-shared compute, whenever possible. Another principle we considered was how to prevent unauthorized access of customer data. Across AWS, we build our systems to not only ensure that no customer data is intermingled during normal service operation, but also to mitigate any risk of unauthorized users gaining unintended access to customer data.
These design principles pointed to a set of security controls available via native AWS technologies. We needed to provide data and compute isolation as well as mitigate confused deputy risks at each step of the process. In this blog post, we will consider how each of these security considerations is addressed, utilizing AWS best practices. We will first consider the flow of data through the admin’s management of customization resources. Next, we will outline data interactions when developers send runtime requests to a given customization from their integrated development environment (IDE).
In reading this blog post, you will learn how we developed CodeWhisperer Customizations with security at the forefront. We also hope that you are inspired to leverage some of the same AWS technologies in your own applications.
Diagram
The diagram above depicts the flow of data during an administrator’s management of a customization as well as during a developer’s usage of the customization from their IDE.
API Layer: Authenticates and authorizes each request. Passes data references to the downstream dependencies.
Data Ingestion Layer: Ingests and processes customer data into the format required for CodeWhisperer.
Customization Layer: Produces a customization resource based on the internal representation of the customer data. Shares the customization artifacts for inference.
Model Inference Layer: Provides customer-specific recommendations based on the customization.
AWS IAM Identity Center: Provides user-level authentication.
Organization admins are responsible for managing their customizations. To enable CodeWhisperer to produce these resources, the admin provides access to their private code repositories. CodeWhisperer uses AWS Key Management Service (AWS KMS) encryption for all customization data, and admins can optionally configure their own profile-level encryption keys. Based on the role assumed by the admin in the AWS console, CodeWhisperer accesses and ingests the referenced code data on the user’s behalf.
Data Isolation
During customization management, data storage occurs in two forms:
Short-term/transient (e.g. ephemeral disks on service-managed, serverless compute)
When persisting data in any form, the best security control to apply is encryption. By encrypting the data, only entities with access to the encryption key will be able to see, or use, the data. For example, when encrypted data is stored in Amazon S3, users with access to the bucket can see that the data exists, but will be unable to view the content, unless they also have access to the encryption key.
Within CodeWhisperer, long-term customer data storage in Amazon S3 is cryptographically isolated using KMS keys with customer-level encryption context metadata. The encryption context provides a further safeguard which prevents unauthorized users from accessing the content even if they gain access to the key. It also prevents unintentional, cross-customer data access as the context value is tied to a particular customer’s identity. Having access to the KMS key without this context is like having the physical invitation to a private meeting without knowing the spoken passphrase for the event.
CodeWhisperer gives customers the option to configure their own KMS keys for AWS to use when encrypting their data. Additionally, we restrict programmatic access (i.e. service usage) to Amazon S3 data via scoped-down IAM roles assigned to specific internal components. By doing this, AWS ensures that the KMS grants created for each key are strictly limited to the services that need access to the data for service operation.
When data needs to be persisted for short-term processing, we also encrypt it. CodeWhisperer leverages client-side encryption with service-owned keys for such ephemeral disks. Data is only stored on the disk while the process is executing, and any on-disk data storage is explicitly deleted, alarming on any failures, before the process is terminated. To ensure that there is no cross-over of customer data, each instance of the serverless compute is spun up for a specific operation on a specific resource. No two customer resources are processed by the same workflow or serverless function execution.
Compute Isolation
When creating or activating a customization, customer data is handled in a series of serverless environments. Most of this processing is facilitated through AWS Step Functions workflows – comprised of AWS Lambda, AWS Batch (on AWS Fargate), and nested Step Functions tasks. Each of these serverless tasks are instantiated for a given job in the system. In other words, the compute will not be shared, or reused, between two operations.
The general principle that can be observed here is the reuse of existing AWS services. By leveraging these various serverless options, we did not have to spend undifferentiated development effort on securing the compute usage. Instead, we inherited the security controls baked into these services and focused our energy on enabling the unique capabilities of customizing CodeWhisperer.
Confused Deputy Mitigations
When building a multi-tenant service, it is important to be mindful not only of how data is accessed in the expected cases, but also how it might be accessed in accidental as well as malicious scenarios. This is where the concept of confused deputy mitigations comes into picture.
To prevent cross-customer data access during data ingestion, we have two mitigations in place:
We explicitly check that the AWS credentials received in the request correspond to the account that owns the data reference (i.e. AWS CodeStar Connections ARN).
We utilize a secure token, based on the administrator’s role, to gain permissions to download the data from the customer-provided reference.
Once the data is inside the CodeWhisperer service boundaries though, we are not done. Since CodeWhisperer is built on top of a microservice-based architecture, we also need to ensure that only the expected internal components are able to interact with their respective consumers and dependencies. To prevent unauthorized users from invoking these internal services that handle the customer data, we utilize account-based allowlists. Each internal service is restricted to a set of CodeWhisperer-owned service accounts that have a need to invoke the service’s APIs. No external actors are aware of these internal accounts.
As further protection for the data inside these services, we utilize customer-managed key encryption for all Amazon S3 data. When a customer does not explicitly provide their own key, we utilize a CodeWhisperer-owned KMS key for the same encryption.
KMS key usage requires a grant. These grants provide a given entity the ability to use the key to read, or write, data. To mitigate the risk of improper usage of these grants, we installed certain controls. To limit the number of entities with top-level grant permissions, all grants are managed by a single microservice. To restrict the usage of the grants to the expected CodeWhisperer workflows, the grants are created for the minimum lifecycle. They are immediately retired once the CodeWhisperer operation is complete.
Customization Usage
After an admin creates, activates, and grants access to a customization resource, a developer can select the customization within their IDE. Upon invocation, CodeWhisperer captures the user’s IDE code context and sends it to CodeWhisperer. The request also includes their authentication token and a reference to their target customization resource. Given successful authentication and authorization, CodeWhisperer responds with the customized recommendation(s).
Data Isolation
There is no persistent data storage used during invocations of a customization. These invocations are stateless, meaning that any data passed within the request is not persisted beyond the life of the request itself. To mitigate any data risks within the lifetime of the request, we authenticate and authorize users via IAM Identity Center.
Since a customization is tied to proprietary company data and its recommendations can reproduce such data, it is crucial to maintain tight authorization around the resource access. CodeWhisperer authorizes individual users against the customization resource via Amazon Verified Permissions policies. These policies are configured by a customer admin in the AWS Console when they assign users and groups to a given customization. (Note: CodeWhisperer manages these Verified Permissions policies on behalf of our customers, which is why admins will not see the policies themselves listed in the console directly.) The service internally resolves the policy to the corresponding service-owned resources constituting the customization.
Compute Isolation
The primary compute for CodeWhisperer invocations is an instance hosting the generative model. Generative models run multi-tenanted on a physical host, i.e. each model runs on a dedicated compute resource within a host that has multiple such resources. By tying each request to a particular compute resource, inference calls cannot interact or communicate with any other ongoing inference.
All other runtime processing is executed in independent threads on Amazon Elastic Container Service (Amazon ECS) container instances with Fargate technology. No computation on user data spans across more than one of these threads within a given CodeWhisperer service.
Confused Deputy Mitigations
As we discussed for customization management, confused deputy mitigations are applied to reduce the risk of accidental and malicious access to customer data by unauthorized entities. To address this when a customization is used, we restrict customers, via Verified Permissions permissions, to accessing only the internal resources tied to their selected customization. We further protect against confused deputy risks by configuring a session policy for each inference request. This session policy scopes down the permission to a specific resource name, which is internally managed and not exposed publicly.
Conclusion
In the age of generative AI, data is a chief differentiator for the efficacy of end applications. CodeWhisperer’s foundational model has been trained on a wide array of generic data. This enables CodeWhisperer to boost developer productivity from the baseline and utilize open-source packages that are commonly included throughout software development. To further improve developer productivity, customers can leverage CodeWhisperer’s customization capability to ingest their private data and securely provide tailored recommendations to their developers.
CodeWhisperer Customizations was built with security and customer trust at the forefront. We have the following security invariants baked in from day one:
All asynchronous customer data workloads are fully data isolated.
All customer data is KMS key encrypted at rest, and when possible, encrypted with a customer KMS key.
All customer data access is gated by authorization derived from authenticated contexts obtained from trusted authorities (IAM, Identity Center).
All customer data in customization management workflows is stored in cryptographically enforced isolation.
On Thanksgiving Day, November 23, 2023, Cloudflare detected a threat actor on our self-hosted Atlassian server. Our security team immediately began an investigation, cut off the threat actor’s access, and on Sunday, November 26, we brought in CrowdStrike’s Forensic team to perform their own independent analysis.
Yesterday, CrowdStrike completed its investigation, and we are publishing this blog post to talk about the details of this security incident.
We want to emphasize to our customers that no Cloudflare customer data or systems were impacted by this event. Because of our access controls, firewall rules, and use of hard security keys enforced using our own Zero Trust tools, the threat actor’s ability to move laterally was limited. No services were implicated, and no changes were made to our global network systems or configuration. This is the promise of a Zero Trust architecture: it’s like bulkheads in a ship where a compromise in one system is limited from compromising the whole organization.
From November 14 to 17, a threat actor did reconnaissance and then accessed our internal wiki (which uses Atlassian Confluence) and our bug database (Atlassian Jira). On November 20 and 21, we saw additional access indicating they may have come back to test access to ensure they had connectivity.
They then returned on November 22 and established persistent access to our Atlassian server using ScriptRunner for Jira, gained access to our source code management system (which uses Atlassian Bitbucket), and tried, unsuccessfully, to access a console server that had access to the data center that Cloudflare had not yet put into production in São Paulo, Brazil.
They did this by using one access token and three service account credentials that had been taken, and that we failed to rotate, after the Okta compromise of October 2023. All threat actor access and connections were terminated on November 24 and CrowdStrike has confirmed that the last evidence of threat activity was on November 24 at 10:44.
(Throughout this blog post all dates and times are UTC.)
Even though we understand the operational impact of the incident to be extremely limited, we took this incident very seriously because a threat actor had used stolen credentials to get access to our Atlassian server and accessed some documentation and a limited amount of source code. Based on our collaboration with colleagues in the industry and government, we believe that this attack was performed by a nation state attacker with the goal of obtaining persistent and widespread access to Cloudflare’s global network.
“Code Red” Remediation and Hardening Effort
On November 24, after the threat actor was removed from our environment, our security team pulled in all the people they needed across the company to investigate the intrusion and ensure that the threat actor had been completely denied access to our systems, and to ensure we understood the full extent of what they accessed or tried to access.
Then, from November 27, we redirected the efforts of a large part of the Cloudflare technical staff (inside and outside the security team) to work on a single project dubbed “Code Red”. The focus was strengthening, validating, and remediating any control in our environment to ensure we are secure against future intrusion and to validate that the threat actor could not gain access to our environment. Additionally, we continued to investigate every system, account and log to make sure the threat actor did not have persistent access and that we fully understood what systems they had touched and which they had attempted to access.
CrowdStrike performed an independent assessment of the scope and extent of the threat actor’s activity, including a search for any evidence that they still persisted in our systems. CrowdStrike’s investigation provided helpful corroboration and support for our investigation, but did not bring to light any activities that we had missed. This blog post outlines in detail everything we and CrowdStrike uncovered about the activity of the threat actor.
The only production systems the threat actor could access using the stolen credentials was our Atlassian environment. Analyzing the wiki pages they accessed, bug database issues, and source code repositories, it appears they were looking for information about the architecture, security, and management of our global network; no doubt with an eye on gaining a deeper foothold. Because of that, we decided a huge effort was needed to further harden our security protocols to prevent the threat actor from being able to get that foothold had we overlooked something from our log files.
Our aim was to prevent the attacker from using the technical information about the operations of our network as a way to get back in. Even though we believed, and later confirmed, the attacker had limited access, we undertook a comprehensive effort to rotate every production credential (more than 5,000 individual credentials), physically segment test and staging systems, performed forensic triages on 4,893 systems, reimaged and rebooted every machine in our global network including all the systems the threat actor accessed and all Atlassian products (Jira, Confluence, and Bitbucket).
The threat actor also attempted to access a console server in our new, and not yet in production, data center in São Paulo. All attempts to gain access were unsuccessful. To ensure these systems are 100% secure, equipment in the Brazil data center was returned to the manufacturers. The manufacturers’ forensic teams examined all of our systems to ensure that no access or persistence was gained. Nothing was found, but we replaced the hardware anyway.
We also looked for software packages that hadn’t been updated, user accounts that might have been created, and unused active employee accounts; we went searching for secrets that might have been left in Jira tickets or source code, examined and deleted all HAR files uploaded to the wiki in case they contained tokens of any sort. Whenever in doubt, we assumed the worst and made changes to ensure anything the threat actor was able to access would no longer be in use and therefore no longer be valuable to them.
Every member of the team was encouraged to point out areas the threat actor might have touched, so we could examine log files and determine the extent of the threat actor’s access. By including such a large number of people across the company, we aimed to leave no stone unturned looking for evidence of access or changes that needed to be made to improve security.
The immediate “Code Red” effort ended on January 5, but work continues across the company around credential management, software hardening, vulnerability management, additional alerting, and more.
Attack timeline
The attack started in October with the compromise of Okta, but the threat actor only began targeting our systems using those credentials from the Okta compromise in mid-November.
The following timeline shows the major events:
October 18 – Okta compromise
We’ve written about this before but, in summary, we were (for the second time) the victim of a compromise of Okta’s systems which resulted in a threat actor gaining access to a set of credentials. These credentials were meant to all be rotated.
Unfortunately, we failed to rotate one service token and three service accounts (out of thousands) of credentials that were leaked during the Okta compromise.
One was a Moveworks service token that granted remote access into our Atlassian system. The second credential was a service account used by the SaaS-based Smartsheet application that had administrative access to our Atlassian Jira instance, the third account was a Bitbucket service account which was used to access our source code management system, and the fourth was an AWS environment that had no access to the global network and no customer or sensitive data.
The one service token and three accounts were not rotated because mistakenly it was believed they were unused. This was incorrect and was how the threat actor first got into our systems and gained persistence to our Atlassian products. Note that this was in no way an error on the part of AWS, Moveworks or Smartsheet. These were merely credentials which we failed to rotate.
November 14 09:22:49 – threat actor starts probing
Our logs show that the threat actor started probing and performing reconnaissance of our systems beginning on November 14, looking for a way to use the credentials and what systems were accessible. They attempted to log into our Okta instance and were denied access. They attempted access to the Cloudflare Dashboard and were denied access.
Additionally, the threat actor accessed an AWS environment that is used to power the Cloudflare Apps marketplace. This environment was segmented with no access to global network or customer data. The service account to access this environment was revoked, and we validated the integrity of the environment.
November 15 16:28:38 – threat actor gains access to Atlassian services
The threat actor successfully accessed Atlassian Jira and Confluence on November 15 using the Moveworks service token to authenticate through our gateway, and then they used the Smartsheet service account to gain access to the Atlassian suite. The next day they began looking for information about the configuration and management of our global network, and accessed various Jira tickets.
The threat actor searched the wiki for things like remote access, secret, client-secret, openconnect, cloudflared, and token. They accessed 36 Jira tickets (out of a total of 2,059,357 tickets) and 202 wiki pages (out of a total of 194,100 pages).
The threat actor accessed Jira tickets about vulnerability management, secret rotation, MFA bypass, network access, and even our response to the Okta incident itself.
The wiki searches and pages accessed suggest the threat actor was very interested in all aspects of access to our systems: password resets, remote access, configuration, our use of Salt, but they did not target customer data or customer configurations.
November 16 14:36:37 – threat actor creates an Atlassian user account
The threat actor used the Smartsheet credential to create an Atlassian account that looked like a normal Cloudflare user. They added this user to a number of groups within Atlassian so that they’d have persistent access to the Atlassian environment should the Smartsheet service account be removed.
November 17 14:33:52 to November 20 09:26:53 – threat actor takes a break from accessing Cloudflare systems
During this period, the attacker took a break from accessing our systems (apart from apparently briefly testing that they still had access) and returned just before Thanksgiving.
November 22 14:18:22 – threat actor gains persistence
Since the Smartsheet service account had administrative access to Atlassian Jira, the threat actor was able to install the Sliver Adversary Emulation Framework, which is a widely used tool and framework that red teams and attackers use to enable “C2” (command and control), connectivity gaining persistent and stealthy access to a computer on which it is installed. Sliver was installed using the ScriptRunner for Jira plugin.
This allowed them continuous access to the Atlassian server, and they used this to attempt lateral movement. With this access the Threat Actor attempted to gain access to a non-production console server in our São Paulo, Brazil data center due to a non-enforced ACL. The access was denied, and they were not able to access any of the global network.
Over the next day, the threat actor viewed 120 code repositories (out of a total of 11,904 repositories). Of the 120, the threat actor used the Atlassian Bitbucket git archive feature on 76 repositories to download them to the Atlassian server, and even though we were not able to confirm whether or not they had been exfiltrated, we decided to treat them as having been exfiltrated.
The 76 source code repositories were almost all related to how backups work, how the global network is configured and managed, how identity works at Cloudflare, remote access, and our use of Terraform and Kubernetes. A small number of the repositories contained encrypted secrets which were rotated immediately even though they were strongly encrypted themselves.
We focused particularly on these 76 source code repositories to look for embedded secrets, (secrets stored in the code were rotated), vulnerabilities and ways in which an attacker could use them to mount a subsequent attack. This work was done as a priority by engineering teams across the company as part of “Code Red”.
As a SaaS company, we’ve long believed that our source code itself is not as precious as the source code of software companies that distribute software to end users. In fact, we’ve open sourced a large amount of our source code and speak openly through our blog about algorithms and techniques we use. So our focus was not on someone having access to the source code, but whether that source code contained embedded secrets (such as a key or token) and vulnerabilities.
November 23 – Discovery and threat actor access termination begins
Our security team was alerted to the threat actor’s presence at 16:00 and deactivated the Smartsheet service account 35 minutes later. 48 minutes later the user account created by the threat actor was found and deactivated. Here’s the detailed timeline for the major actions taken to block the threat actor once the first alert was raised.
15:58 – The threat actor adds the Smartsheet service account to an administrator group. 16:00 – Automated alert about the change at 15:58 to our security team. 16:12 – Cloudflare SOC starts investigating the alert. 16:35 – Smartsheet service account deactivated by Cloudflare SOC. 17:23 – The threat actor-created Atlassian user account is found and deactivated. 17:43 – Internal Cloudflare incident declared. 21:31 – Firewall rules put in place to block the threat actor’s known IP addresses.
November 24 – Sliver removed; all threat actor access terminated
10:44 – Last known threat actor activity. 11:59 – Sliver removed.
Throughout this timeline, the threat actor tried to access a myriad of other systems at Cloudflare but failed because of our access controls, firewall rules, and use of hard security keys enforced using our own Zero Trust tools.
To be clear, we saw no evidence whatsoever that the threat actor got access to our global network, data centers, SSL keys, customer databases or configuration information, Cloudflare Workers deployed by us or customers, AI models, network infrastructure, or any of our datastores like Workers KV, R2 or Quicksilver. Their access was limited to the Atlassian suite and the server on which our Atlassian runs.
A large part of our “Code Red” effort was understanding what the threat actor got access to and what they tried to access. By looking at logging across systems we were able to track attempted access to our internal metrics, network configuration, build system, alerting systems, and release management system. Based on our review, none of their attempts to access these systems were successful. Independently, CrowdStrike performed an assessment of the scope and extent of the threat actor’s activity, which did not bring to light activities that we had missed and concluded that the last evidence of threat activity was on November 24 at 10:44.
We are confident that between our investigation and CrowdStrike’s, we fully understand the threat actor’s actions and that they were limited to the systems on which we saw their activity.
Conclusion
This was a security incident involving a sophisticated actor, likely a nation-state, who operated in a thoughtful and methodical manner. The efforts we have taken to ensure that the ongoing impact of the incident was limited and that we are well-prepared to fend off any sophisticated attacks in the future. This required the efforts of a significant number of Cloudflare’s engineering staff, and, for over a month, this was the highest priority at Cloudflare. The entire Cloudflare team worked to ensure that our systems were secure, the threat actor’s access was understood, to remediate immediate priorities (such as mass credential rotation), and to build a plan of long-running work to improve our overall security based on areas for improvement discovered during this process.
I am incredibly grateful to everyone at Cloudflare who responded quickly over the Thanksgiving holiday to conduct an initial analysis and lock out of the threat actor and all those who contributed to this effort. It would be impossible to name everyone involved, but their long hours and dedicated work made it possible to undertake an essential review and change of Cloudflare’s security while keeping our global network running and our customers’ service running.
We are grateful to CrowdStrike for having been available immediately to conduct an independent assessment. Now that their final report is complete, we are confident in our internal analysis and remediation of the intrusion and are making this blog post available.
IOCs Below are the Indications of Compromise (IOCs) that we saw from this threat actor. We are publishing them so that other organizations, and especially those that may have been impacted by the Okta breach, can search their logs to confirm the same threat actor did not access their systems.
Indicator
Indicator Type
SHA256
Description
193.142.58[.]126
IPv4
N/A
Primary threat actor Infrastructure, owned by M247 Europe SRL (Bucharest, Romania
198.244.174[.]214
IPv4
N/A
Sliver C2 server, owned by OVH SAS (London, England)
At AWS, security is the highest priority. As customers embrace the scalability and flexibility of AWS, we’re helping them evolve security and compliance into key business enablers. We’re obsessed with earning and maintaining customer trust, and providing our financial services customers and their regulatory bodies with the assurances that AWS has the necessary controls in place to help protect their most sensitive material and regulated workloads.
With the increasing digitalization of the financial industry, and the importance of cloud computing as a key enabling technology for digitalization, the financial services industry is experiencing greater regulatory scrutiny. Our annual audit engagement with CCAG is an example of how AWS supports customers’ risk management and regulatory efforts. For the fifth year, the CCAG pooled audit meticulously assessed the AWS controls that enable us to help protect customers’ data and material workloads, while satisfying strict regulatory obligations.
CCAG represents more than 50 leading European financial services institutions and has grown steadily since its founding in 2017. Based on its mission to provide organizational and logistical support to members so that they can conduct pooled audits with excellence, efficiency, and integrity, the CCAG audit was initiated based on customers’ right to conduct an audit of their service providers under the European Banking Authority (EBA) outsourcing recommendations to cloud service providers (CSPs).
Audit preparations
Using the Cloud Controls Matrix (CCM) of the Cloud Security Alliance (CSA) as the framework of reference for the CCAG audit, auditors scoped in key domains and controls to audit, such as identity and access management, change control and configuration, logging and monitoring, and encryption and key management.
The scope of the audit targeted individual AWS services, such as Amazon Elastic Compute Cloud (Amazon EC2), and specific AWS Regions where financial services institutions run their workloads, such as the Europe (Frankfurt) Region (eu-central-1).
During this phase, to help provide auditors with a common cloud-specific knowledge and language base, AWS gave various educational and alignment sessions. We offered access to our online resources such as Skill Builder, and delivered onsite briefing and orientation sessions in Paris, France; Barcelona, Spain; and London, UK.
Audit fieldwork
This phase started after a joint kick-off in Berlin, Germany, and used a hybrid approach, with work occurring remotely through the use of videoconferencing and a secure audit portal for the inspection of evidence, and onsite at Amazon’s HQ2, in Arlington, Virginia, in the US.
Auditors assessed AWS policies, procedures, and controls, following a risk-based approach and using sampled evidence and access to subject matter experts (SMEs).
Audit results
After a joint closure ceremony onsite in Warsaw, Poland, auditors finalized the audit report, which included the following positive feedback:
“CCAG would like to thank AWS for helping in achieving the audit objectives and to advocate on CCAG’s behalf to obtain the required assurances. In consequence, CCAG was able to execute the audit according to agreed timelines, and exercise audit rights in line with contractual conditions.”
The results of the CCAG pooled audit are available to the participants and their respective regulators only, and provide CCAG members with assurance regarding the AWS controls environment, enabling members to work to remove compliance blockers, accelerate their adoption of AWS services, and obtain confidence and trust in the security controls of AWS.
If you have feedback about this post, submit comments in the Comments section below. If you have questions about this post, contact AWS Support.
Want more AWS Security news? Follow us on Twitter.
In this blog post, we’re excited to present Foundations, our foundational library for Rust services, now released as open source on GitHub. Foundations is a foundational Rust library, designed to help scale programs for distributed, production-grade systems. It enables engineers to concentrate on the core business logic of their services, rather than the intricacies of production operation setups.
Originally developed as part of our Oxy proxy framework, Foundations has evolved to serve a wider range of applications. For those interested in exploring its technical capabilities, we recommend consulting the library’s API documentation. Additionally, this post will cover the motivations behind Foundations’ creation and provide a concise summary of its key features. Stay with us to learn more about how Foundations can support your Rust projects.
What is Foundations?
In software development, seemingly minor tasks can become complex when scaled up. This complexity is particularly evident when comparing the deployment of services on server hardware globally to running a program on a personal laptop.
The key question is: what fundamentally changes when transitioning from a simple laptop-based prototype to a full-fledged service in a production environment? Through our experience in developing numerous services, we’ve identified several critical differences:
Observability: locally, developers have access to various tools for monitoring and debugging. However, these tools are not as accessible or practical when dealing with thousands of software instances running on remote servers.
Configuration: local prototypes often use basic, sometimes hardcoded, configurations. This approach is impractical in production, where changes require a more flexible and dynamic configuration system. Hardcoded settings are cumbersome, and command-line options, while common, don’t always suit complex hierarchical configurations or align with the “Configuration as Code” paradigm.
Security: services in production face a myriad of security challenges, exposed to diverse threats from external sources. Basic security hardening becomes a necessity.
Addressing these distinctions, Foundations emerges as a comprehensive library, offering solutions to these challenges. Derived from our Oxy proxy framework, Foundations brings the tried-and-tested functionality of Oxy to a broader range of Rust-based applications at Cloudflare.
Foundations was developed with these guiding principles:
High modularity: recognizing that many services predate Foundations, we designed it to be modular. Teams can adopt individual components at their own pace, facilitating a smooth transition.
API ergonomics: a top priority for us is user-friendly library interaction. Foundations leverages Rust’s procedural macros to offer an intuitive, well-documented API, aiming for minimal friction in usage.
Simplified setup and configuration: our goal is for engineers to spend minimal time on setup. Foundations is designed to be ‘plug and play’, with essential functions working immediately and adjustable settings for fine-tuning. We understand that this focus on ease of setup over extreme flexibility might be debatable, as it implies a trade-off. Unlike other libraries that cater to a wide range of environments with potentially verbose setup requirements, Foundations is tailored for specific, production-tested environments and workflows. This doesn’t restrict Foundations’ adaptability to other settings, but we approach this with compile-time features to manage setup workflows, rather than a complex setup API.
Next, let’s delve into the components Foundations offers. To better illustrate the functionality that Foundations provides we will refer to the example web server from Foundations’ source code repository.
Telemetry
In any production system, observability, which we refer to as telemetry, plays an essential role. Generally, three primary types of telemetry are adequate for most service needs:
Logging: this involves recording arbitrary textual information, which can be enhanced with tags or structured fields. It’s particularly useful for documenting operational errors that aren’t critical to the service.
Tracing: this method offers a detailed timing breakdown of various service components. It’s invaluable for identifying performance bottlenecks and investigating issues related to timing.
Metrics: these are quantitative data points about the service, crucial for monitoring the overall health and performance of the system.
Foundations integrates an API that encompasses all these telemetry aspects, consolidating them into a unified package for ease of use.
Tracing
Foundations’ tracing API shares similarities with tokio/tracing, employing a comparable approach with implicit context propagation, instrumentation macros, and futures wrapping:
However, Foundations distinguishes itself in a few key ways:
Simplified API: we’ve streamlined the setup process for tracing, aiming for a more minimalistic approach compared to tokio/tracing.
Enhanced trace sampling flexibility: Foundations allows for selective override of the sampling ratio in specific code branches. This feature is particularly useful for detailed performance bug investigations, enabling a balance between global trace sampling for overall performance monitoring and targeted sampling for specific accounts, connections, or requests.
Distributed trace stitching: our API supports the integration of trace data from multiple services, contributing to a comprehensive view of the entire pipeline. This functionality includes fine-tuned control over sampling ratios, allowing upstream services to dictate the sampling of specific traffic flows in downstream services.
Trace forking capability: addressing the challenge of long-lasting connections with numerous multiplexed requests, Foundations introduces trace forking. This feature enables each request within a connection to have its own trace, linked to the parent connection trace. This method significantly simplifies the analysis and improves performance, particularly for connections handling thousands of requests.
We regard telemetry as a vital component of our software, not merely an optional add-on. As such, we believe in rigorous testing of this feature, considering it our primary tool for monitoring software operations. Consequently, Foundations includes an API and user-friendly macros to facilitate the collection and analysis of tracing data within tests, presenting it in a format conducive to assertions.
Logging
Foundations’ logging API shares its foundation with tokio/tracing and slog, but introduces several notable enhancements.
During our work on various services, we recognized the hierarchical nature of logging contextual information. For instance, in a scenario involving a connection, we might want to tag each log record with the connection ID and HTTP protocol version. Additionally, for requests served over this connection, it would be useful to attach the request URL to each log record, while still including connection-specific information.
Typically, achieving this would involve creating a new logger for each request, copying tags from the connection’s logger, and then manually passing this new logger throughout the relevant code. This method, however, is cumbersome, requiring explicit handling and storage of the logger object.
To streamline this process and prevent telemetry from obstructing business logic, we adopted a technique similar to tokio/tracing’s approach for tracing, applying it to logging. This method relies on future instrumentation machinery (tracing-rs documentation has a good explanation of the concept), allowing for implicit passing of the current logger. This enables us to “fork” logs for each request and use this forked log seamlessly within the current code scope, automatically propagating it down the call stack, including through asynchronous function calls:
 let conn_tele_ctx = TelemetryContext::current();

 let on_request = service_fn({
        let endpoint_name = Arc::clone(&endpoint_name);

        move |req| {
            let routes = Arc::clone(&routes);
            let endpoint_name = Arc::clone(&endpoint_name);

            // Each request gets independent log inherited from the connection log and separate
            // trace linked to the connection trace.
            conn_tele_ctx
                .with_forked_log()
                .with_forked_trace("request")
                .apply(async move { respond(endpoint_name, req, routes).await })
        }
});
In an effort to simplify the user experience, we merged all APIs related to context management into a single, implicitly available in each code scope, TelemetryContext object. This integration not only simplifies the process but also lays the groundwork for future advanced features. These features could blend tracing and logging information into a cohesive narrative by cross-referencing each other.
Like tracing, Foundations also offers a user-friendly API for testing service’s logging.
Metrics
Foundations incorporates the official Prometheus Rust client library for its metrics functionality, with a few enhancements for ease of use. One key addition is a procedural macro provided by Foundations, which simplifies the definition of new metrics with typed labels, reducing boilerplate code:
use foundations::telemetry::metrics::{metrics, Counter, Gauge};
use std::sync::Arc;

#[metrics]
pub(crate) mod http_server {
    /// Number of active client connections.
    pub fn active_connections(endpoint_name: &Arc<String>) -> Gauge;

    /// Number of failed client connections.
    pub fn failed_connections_total(endpoint_name: &Arc<String>) -> Counter;

    /// Number of HTTP requests.
    pub fn requests_total(endpoint_name: &Arc<String>) -> Counter;

    /// Number of failed requests.
    pub fn requests_failed_total(endpoint_name: &Arc<String>, status_code: u16) -> Counter;
}
In addition to this, we have refined the approach to metrics collection and structuring. Foundations offers a streamlined, user-friendly API for both these tasks, focusing on simplicity and minimalism.
Memory profiling
Recognizing the efficiency of jemalloc for long-lived services, Foundations includes a feature for enabling jemalloc memory allocation. A notable aspect of jemalloc is its memory profiling capability. Foundations packages this functionality into a straightforward and safe Rust API, making it accessible and easy to integrate.
Telemetry server
Foundations comes equipped with a built-in, customizable telemetry server endpoint. This server automatically handles a range of functions including health checks, metric collection, and memory profiling requests.
Security
A vital component of Foundations is its robust and ergonomic API for seccomp, a Linux kernel feature for syscall sandboxing. This feature enables the setting up of hooks for syscalls used by an application, allowing actions like blocking or logging. Seccomp acts as a formidable line of defense, offering an additional layer of security against threats like arbitrary code execution.
Foundations provides a simple way to define lists of all allowed syscalls, also allowing a composition of multiple lists (in addition, Foundations ships predefined lists for common use cases):
Foundations simplifies the management of service settings and command-line argument parsing. Services built on Foundations typically use YAML files for configuration. We advocate for a design where every service comes with a default configuration that’s functional right off the bat. This philosophy is embedded in Foundations’ settings functionality.
In practice, applications define their settings and defaults using Rust structures and enums. Foundations then transforms Rust documentation comments into configuration annotations. This integration allows the CLI interface to generate a default, fully annotated YAML configuration files. As a result, service users can quickly and easily understand the service settings:
use foundations::settings::collections::Map;
use foundations::settings::net::SocketAddr;
use foundations::settings::settings;
use foundations::telemetry::settings::TelemetrySettings;

#[settings]
pub(crate) struct HttpServerSettings {
    /// Telemetry settings.
    pub(crate) telemetry: TelemetrySettings,
    /// HTTP endpoints configuration.
    #[serde(default = "HttpServerSettings::default_endpoints")]
    pub(crate) endpoints: Map<String, EndpointSettings>,
}

impl HttpServerSettings {
    fn default_endpoints() -> Map<String, EndpointSettings> {
        let mut endpoint = EndpointSettings::default();

        endpoint.routes.insert(
            "/hello".into(),
            ResponseSettings {
                status_code: 200,
                response: "World".into(),
            },
        );

        endpoint.routes.insert(
            "/foo".into(),
            ResponseSettings {
                status_code: 403,
                response: "bar".into(),
            },
        );

        [("Example endpoint".into(), endpoint)]
            .into_iter()
            .collect()
    }
}

#[settings]
pub(crate) struct EndpointSettings {
    /// Address of the endpoint.
    pub(crate) addr: SocketAddr,
    /// Endoint's URL path routes.
    pub(crate) routes: Map<String, ResponseSettings>,
}

#[settings]
pub(crate) struct ResponseSettings {
    /// Status code of the route's response.
    pub(crate) status_code: u16,
    /// Content of the route's response.
    pub(crate) response: String,
}
The settings definition above automatically generates the following default configuration YAML file:
---
# Telemetry settings.
telemetry:
  # Distributed tracing settings
  tracing:
    # Enables tracing.
    enabled: true
    # The address of the Jaeger Thrift (UDP) agent.
    jaeger_tracing_server_addr: "127.0.0.1:6831"
    # Overrides the bind address for the reporter API.
    # By default, the reporter API is only exposed on the loopback
    # interface. This won't work in environments where the
    # Jaeger agent is on another host (for example, Docker).
    # Must have the same address family as `jaeger_tracing_server_addr`.
    jaeger_reporter_bind_addr: ~
    # Sampling ratio.
    #
    # This can be any fractional value between `0.0` and `1.0`.
    # Where `1.0` means "sample everything", and `0.0` means "don't sample anything".
    sampling_ratio: 1.0
  # Logging settings.
  logging:
    # Specifies log output.
    output: terminal
    # The format to use for log messages.
    format: text
    # Set the logging verbosity level.
    verbosity: INFO
    # A list of field keys to redact when emitting logs.
    #
    # This might be useful to hide certain fields in production logs as they may
    # contain sensitive information, but allow them in testing environment.
    redact_keys: []
  # Metrics settings.
  metrics:
    # How the metrics service identifier defined in `ServiceInfo` is used
    # for this service.
    service_name_format: metric_prefix
    # Whether to report optional metrics in the telemetry server.
    report_optional: false
  # Server settings.
  server:
    # Enables telemetry server
    enabled: true
    # Telemetry server address.
    addr: "127.0.0.1:0"
# HTTP endpoints configuration.
endpoints:
  Example endpoint:
    # Address of the endpoint.
    addr: "127.0.0.1:0"
    # Endoint's URL path routes.
    routes:
      /hello:
        # Status code of the route's response.
        status_code: 200
        # Content of the route's response.
        response: World
      /foo:
        # Status code of the route's response.
        status_code: 403
        # Content of the route's response.
        response: bar
Refer to the example web server and documentation for settings and CLI API for more comprehensive examples of how settings can be defined and used with Foundations-provided CLI API.
Wrapping Up
At Cloudflare, we greatly value the contributions of the open source community and are eager to reciprocate by sharing our work. Foundations has been instrumental in reducing our development friction, and we hope it can do the same for others. We welcome external contributions to Foundations, aiming to integrate diverse experiences into the project for the benefit of all.
If you’re interested in working on projects like Foundations, consider joining our team — we’re hiring!
Enterprises often have an identity provider (IdP) for their employees and another for their customers. Using multiple IdPs allows you to apply different access controls and policies for employees and for customers. However, managing multiple identity systems can be complex. A unified authorization layer can ease administration by centralizing access policies for APIs regardless of the user’s IdP. The authorization layer evaluates access tokens from any authorized IdP before allowing API access. This removes authorization logic from the APIs and simplifies specifying organization-wide policies. Potential drawbacks include additional complexity in the authorization layer. However, simplifying the management of policies reduces cost of ownership and the likelihood of errors.
Consider a veterinary clinic that has an IdP for their employees. Their clients, the pet owners, would have a separate IdP. Employees might have different sign-in requirements than the clients. These requirements could include features such as multi-factor authentication (MFA) or additional auditing functionality. Applying identical access controls for clients may not be desirable. The clinic’s scheduling application would manage access from both the clinic employees and pet owners. By implementing a unified authorization layer, the scheduling app doesn’t need to be aware of the different IdPs or tokens. The authorization layer handles evaluating tokens and applying policies, such as allowing the clinic employees full access to appointment data while limiting pet owners to just their pet’s records. In this post, we show you an architecture for this situation that demonstrates how to build a unified authorization layer using multiple Amazon Cognito user pools, Amazon Verified Permissions, and an AWS Lambda authorizer for Amazon API Gateway-backed APIs.
In the architecture, API Gateway exposes APIs to provide access to backend resources. API Gateway is a fully-managed service that allows developers to build APIs that act as an entry point for applications. To integrate API Gateway with multiple IdPs, you can use a Lambda authorizer to control access to the API. The IdP in this architecture is Amazon Cognito, which provides the authentication function for users before they’re authorized by Verified Permissions, which implements fine-grained authorization on resources in an application. Keep in mind that Verified Permissions has limits on policy sizes and requests per second. Large deployments might require a different policy store or a caching layer. The four services work together to combine multiple IdPs into a unified authorization layer. The architecture isn’t limited to the Cognito IdP — third-party IdPs that generate JSON Web Tokens (JWTs) can be used, including combinations of different IdPs.
Architecture overview
This sample architecture relies on user-pool multi-tenancy for user authentication. It uses Cognito user pools to assign authenticated users a set of temporary and least-privilege credentials for application access. Once users are authenticated, they are authorized to access backend functions via a Lambda Authorizer function. This function interfaces with Verified Permissions to apply the appropriate access policy based on user attributes.
This sample architecture is based on the scenario of an application that has two sets of users: an internal set of users, veterinarians, as well as an external set of users, clients, with each group having specific access to the API. Figure 1 shows the user request flow.
Figure 1: User request flow
Let’s go through the request flow to understand what happens at each step, as shown in Figure 1:
There two groups of users — External (Clients) and Internal (Veterinarians). These user groups sign in through a web portal that authenticates against an IdP (Amazon Cognito).
The groups attempt to access the get appointment API through API Gateway, along with their JWT tokens with claims and client ID.
The Lambda authorizer validates the claims.
Note: If Cognito is the IdP, then Verified Permissions can authorize the user from their JWT directly with the IsAuthorizedWithToken API.
After validating the JWT token, the Lambda authorizer makes a query to Verified Permissions with associated policy information to check the request.
API Gateway evaluates the policy that the Lambda authorizer returned, to allow or deny access to the resource.
If allowed, API Gateway accesses the resource. If denied, API Gateway returns a 403 Forbidden error.
Note: To further optimize the Lambda authorizer, the authorization decision can be cached or disabled, depending on your needs. By enabling caching, you can improve the performance, because the authorization policy will be returned from the cache whenever there is a cache key match. To learn more, see Configure a Lambda authorizer using the API Gateway console.
Walkthrough
This walkthrough demonstrates the preceding scenario for an authorization layer supporting veterinarians and clients. Each set of users will have their own distinct Amazon Cognito user pool.
Verified Permissions policies associated with each Cognito pool enforce access controls. In the veterinarian pool, veterinarians are only allowed to access data for their own patients. Similarly, in the client pool, clients are only able to view and access their own data. This keeps data properly segmented and secured between veterinarians and clients.
Internal policy
permit (principal in UserGroup::"AllVeterinarians",
   action == Action::"GET/appointment",
   resource in UserGroup::"AllVeterinarians")
   when {principal == resource.Veterinarian };
External policy
permit (principal in UserGroup::"AllClients",
   action == Action::"GET/appointment",
   resource in UserGroup::"AllClients")
   when {principal == resource.owner};
The example internal and external policies, along with Cognito serving as an IdP, allow the veterinarian users to federate in to the application through one IdP, while the external clients must use another IdP. This, coupled with the associated authorization policies, allows you to create and customize fine-grained access policies for each user group.
To validate the access request with the policy store, the Lambda authorizer execution role also requires the verifiedpermissions:IsAuthorized action.
Although our example Verified Permissions policies are relatively simple, Cedar policy language is extensive and allows you to define custom rules for your business needs. For example, you could develop a policy that allows veterinarians to access client records only during the day of the client’s appointment.
Implement the sample architecture
The architecture is based on a user-pool multi-tenancy for user authentication. It uses Amazon Cognito user pools to assign authenticated users a set of temporary and least privilege credentials for application access. After users are authenticated, they are authorized to access APIs through a Lambda function. This function interfaces with Verified Permissions to apply the appropriate access policy based on user attributes.
An AWS Identity and Access Management (IAM) role or user with enough permissions to create an Amazon Cognito user pool, IAM role, Lambda function, IAM policy, and API Gateway instance.
jq for JSON processing in bash script.
To install on Ubuntu/Debian, use the following command:
sudo apt-get install jq
To install on Mac with Homebrew, using the following command:
brew install jq
The GitHub repository for the sample. You can download it, or you can use the following Git command to download it from your terminal.
Note: This sample code should be used to test the solution and is not intended to be used in a production account.
$ git clone https://github.com/aws-samples/amazon-cognito-avp-apigateway.git
$ cd amazon-cognito-avp-apigateway
To implement this reference architecture, you will use the following services:
Amazon Verified Permissions is a service that helps you implement and enforce fine-grained authorization on resources within the applications that you build and deploy, such as HR systems and banking applications.
Amazon API Gateway is a fully managed service that developers can use to create, publish, maintain, monitor, and secure APIs at any scale.
AWS Lambda is a serverless compute service that lets you run code without provisioning or managing servers, creating workload-aware cluster scaling logic, maintaining event integrations, or managing runtimes.
Amazon Cognito provides an identity store that scales to millions of users, supports social and enterprise identity federation, and offers advanced security features to protect your consumers and business.
Note: We tested this architecture in the us-east-1 AWS Region. Before you select a Region, verify that the necessary services — Amazon Verified Permissions, Amazon Cognito, API Gateway, and Lambda — are available in those Regions.
Deploy the sample architecture
From within the directory where you downloaded the sample code from GitHub, first run the following command to package the Lambda functions. Then run the next command to generate a random Cognito user password and create the resources described in the previous section.
Note: In this case, you’re generating a random user password for demonstration purposes. Follow best practices for user passwords in production implementations.
Run the following commands to open the Cognito UI in your browser and then sign in with your credentials. This validates that the previous commands created Cognito users successfully.
Note: When you run the commands, they return the username and password that you should use to sign in.
For internal user pool domain users
$ bash ./helper.sh open-cognito-internal-domain-ui
 Opening Cognito UI...
 URL: xxxxxxxxx
 Please use following credentials to login:
 Username: cognitouser
 Password: xxxxxxxx
For external user pool domain users
$ bash ./helper.sh open-cognito-external-domain-ui
 Opening Cognito UI...
 URL: xxxxxxxxx
 Please use following credentials to login:
 Username: cognitouser
 Password: xxxxxxxx
Validate Cognito JWT upon sign in
Because you haven’t installed a web application that would respond to the redirect request, Cognito will redirect to localhost, which might look like an error. The key aspect is that after a successful sign-in, there is a URL similar to the following in the navigation bar of your browser.
Before you protect the API with Cognito so that only authorized users can access it, let’s verify that the configuration is correct and API Gateway serves the API. The following command makes a curl request to API Gateway to retrieve data from the API service.
$ bash ./helper.sh curl-api

API to check the appointment details of PI-T123
URL: https://epgst74zff.execute-api.us-east-1.amazonaws.com/dev/appointment/PI-T123
Response:
{"appointment": {"id": "PI-T123", "name": "Dave", "Pet": "Onyx - Dog. 2y 3m", "Phone Number": "+1234567", "Visit History": "Patient History from last visit with primary vet", "Assigned Veterinarian": "Jane"}}

API to check the appointment details of PI-T124
URL: https://epgst74zff.execute-api.us-east-1.amazonaws.com/dev/appointment/PI-T124
Response:
{"appointment": {"id": "PI-T124", "name": "Joy", "Pet": "Jelly - Dog. 6y 2m", "Phone Number": "+1368728", "Visit History": "None", "Assigned Veterinarian": "Jane"}}

API to check the appointment details of PI-T125
URL: https://epgst74zff.execute-api.us-east-1.amazonaws.com/dev/appointment/PI-T125
Response:
{"appointment": {"id": "PI-T125", "name": "Dave", "Pet": "Sassy - Cat. 1y", "Phone Number": "+1398777", "Visit History": "Patient History from last visit with primary vet", "Assigned Veterinarian": "Adam"}}
Protect the API
In the next step, you deploy a Verified Permissions policy store and a Lambda authorizer. The policy store contains the policies for user authorization. The Lambda authorizer verifies users’ access tokens and authorizes the users through Verified Permissions.
Update and create resources
Run the following command to update existing resources and create a Lambda authorizer and Verified Permissions policy store.
Begin your testing with the following request, which doesn’t include an access token.
Note: Wait for a few minutes to allow API Gateway to deploy before you run the following commands.
$ bash ./helper.sh curl-api
API to check the appointment details of PI-T123
URL: https://epgst74zff.execute-api.us-east-1.amazonaws.com/dev/appointment/PI-T123
Response:
{"message":"Unauthorized"}

API to check the appointment details of PI-T124
URL: https://epgst74zff.execute-api.us-east-1.amazonaws.com/dev/appointment/PI-T124
Response:
{"message":"Unauthorized"}

API to check the appointment details of PI-T125
URL: https://epgst74zff.execute-api.us-east-1.amazonaws.com/dev/appointment/PI-T125
Response:
{"message":"Unauthorized"}
The architecture denied the request with the message “Unauthorized.” At this point, API Gateway expects a header named Authorization (case sensitive) in the request. If there’s no authorization header, API Gateway denies the request before it reaches the Lambda authorizer. This is a way to filter out requests that don’t include required information.
Use the following command for the next test. In this test, you pass the required header, but the token is invalid because it wasn’t issued by Cognito and is instead a simple JWT-format token stored in ./helper.sh. To learn more about how to decode and validate a JWT, see Decode and verify a Cognito JSON token.
$ bash ./helper.sh curl-api-invalid-token
 {"Message":"User is not authorized to access this resource"}
This time the message is different. The Lambda authorizer received the request and identified the token as invalid and responded with the message “User is not authorized to access this resource.”
To make a successful request to the protected API, your code must perform the following steps:
Use a user name and password to authenticate against your Cognito user pool.
Acquire the tokens (ID token, access token, and refresh token).
Make an HTTPS (TLS) request to API Gateway and pass the access token in the headers.
To finish testing, programmatically sign in to the Cognito UI, acquire a valid access token, and make a request to API Gateway. Run the following commands to call the protected internal and external APIs.
$ ./helper.sh curl-protected-internal-user-api

Getting API URL, Cognito Usernames, Cognito Users Password and Cognito ClientId...
User: Jane
Password: Pa%%word-2023-04-17-17-11-32
Resource: PI-T123
URL: https://16qyz501mg.execute-api.us-east-1.amazonaws.com/dev/appointment/PI-T123

Authenticating to get access_token...
Access Token: eyJraWQiOiJIaVRvckxxxxxxxxxx6BfCBKASA

Response:
{"appointment": {"id": "PI-T123", "name": "Dave", "Pet": "Onyx - Dog. 2y 3m", "Phone Number": "+1234567", "Visit History": "Patient History from last visit with primary vet", "Assigned Veterinarian": "Jane"}}

User: Adam
Password: Pa%%word-2023-04-17-17-11-32
Resource: PI-T123
URL: https://16qyz501mg.execute-api.us-east-1.amazonaws.com/dev/appointment/PI-T123

Authenticating to get access_token...
Access Token: eyJraWQiOiJIaVRvckxxxxxxxxxx6BfCBKASA

Response:
{"Message":"User is not authorized to access this resource"}

User: Adam
Password: Pa%%word-2023-04-17-17-11-32
Resource: PI-T125
URL: https://16qyz501mg.execute-api.us-east-1.amazonaws.com/dev/appointment/PI-T125

Authenticating to get access_token...
Access Token: eyJraWQiOiJIaVRvckxxxxxxxxxx6BfCBKASA

Response:
{"appointment": {"id": "PI-T125", "name": "Dave", "Pet": "Sassy - Cat. 1y", "Phone Number": "+1398777", "Visit History": "Patient History from last visit with primary vet", "Assigned Veterinarian": "Adam"}}
Now calling external userpool users for accessing request
$ ./helper.sh curl-protected-external-user-api
User: Dave
Password: Pa%%word-2023-04-17-17-11-32
Resource: PI-T123
URL: https://16qyz501mg.execute-api.us-east-1.amazonaws.com/dev/appointment/PI-T123

Authenticating to get access_token...
Access Token: eyJraWQiOiJIaVRvckxxxxxxxxxx6BfCBKASA

Response:
{"appointment": {"id": "PI-T123", "name": "Dave", "Pet": "Onyx - Dog. 2y 3m", "Phone Number": "+1234567", "Visit History": "Patient History from last visit with primary vet", "Assigned Veterinarian": "Jane"}}

User: Joy
Password Pa%%word-2023-04-17-17-11-32
Resource: PI-T123
URL: https://16qyz501mg.execute-api.us-east-1.amazonaws.com/dev/appointment/PI-T123

Authenticating to get access_token...
Access Token: eyJraWQiOiJIaVRvckxxxxxxxxxx6BfCBKASA

Response:
{"Message":"User is not authorized to access this resource"}

User: Joy
Password Pa%%word-2023-04-17-17-11-32
Resource: PI-T124
URL: https://16qyz501mg.execute-api.us-east-1.amazonaws.com/dev/appointment/PI-T124

Authenticating to get access_token...
Access Token: eyJraWQiOiJIaVRvckxxxxxxxxxx6BfCBKASA

Response:
{"appointment": {"id": "PI-T124", "name": "Joy", "Pet": "Jelly - Dog. 6y 2m", "Phone Number": "+1368728", "Visit History": "None", "Assigned Veterinarian": "Jane"}}
This time, you receive a response with data from the API service. Let’s recap the steps that the example code performed:
The Lambda authorizer validates the access token.
The Lambda authorizer uses Verified Permissions to evaluate the user’s requested actions against the policy store.
The Lambda authorizer passes the IAM policy back to API Gateway.
API Gateway evaluates the IAM policy, and the final effect is an allow.
API Gateway forwards the request to Lambda.
Lambda returns the response.
In each of the tests, internal and external, the architecture denied the request because the Verified Permissions policies denied access to the user. In the internal user pool, the policies only allow veterinarians to see their own patients’ data. Similarly, in the external user pool, the policies only allow clients to see their own data.
Clean up resources
Run the following command to delete the deployed resources and clean up.
$ bash ./helper.sh cf-delete-stack
Additional information
Verified Permissions is integrated with AWS CloudTrail, a service that provides a record of actions taken by a user, role, or AWS service in Verified Permissions. CloudTrail captures API calls for Verified Permissions as events. You can choose to capture actions performed on a Verified Permissions policy store by the Lambda authorizer. Verified Permissions logs can also be injected into your security information and event management (SEIM) solution for security analysis and compliance. For information about API call quotas, see Quotas for Amazon Verified Permission.
Conclusion
In this post, we demonstrated how you can use multiple Amazon Cognito user pools alongside Amazon Verified Permissions to build a single access layer to APIs. We used Cognito in this example, but you could implement the solution with another third-party IdP instead. As a next step, explore the Cedar playground to test policies that can be used with Verified Permissions, or expand this solution by integrating a third-party IdP.
If you have feedback about this post, submit comments in the Comments section below. If you have questions about this post, contact AWS Support.
Want more AWS Security news? Follow us on Twitter.
Today’s applications collect a lot of data from customers. The data often includes personally identifiable information (PII), that must be protected in compliance with data privacy laws such as the General Data Protection Regulation (GDPR) and the California Consumer Privacy Act (CCPA). Modern business applications require fast and reliable access to customer data, and Amazon DynamoDB is an ideal choice for high-performance applications at scale. While server-side encryption options exist to safeguard customer data, developers can also add client-side encryption to further enhance the security of their customer’s data.
In this blog post, we show you how the AWS Database Encryption SDK (DB-ESDK) – an upgrade to the DynamoDB Encryption Client – provides client-side encryption to protect sensitive data in transit and at rest. At its core, the DB-ESDK is a record encryptor that encrypts, signs, verifies, and decrypts the records in DynamoDB table. You can also use DB-ESDK to search on encrypted records and retrieve data, thereby alleviating the need to download and decrypt your entire dataset locally. In this blog, we demonstrate how to use DB-ESDK to build application code to perform client-side encryption of sensitive data within your application before transmitting and storing it in DynamoDB and then retrieve data by searching on encrypted fields.
Client-side encryption
For protecting data at rest, many AWS services integrate with AWS Key Management Service (AWS KMS). When you use server-side encryption, your plaintext data is encrypted in transit over an HTTPS connection, decrypted at the service endpoint, and then re-encrypted by the service before being stored. Client-side encryption is the act of encrypting your data locally to help ensure its security in transit and at rest. When using client-side encryption, you encrypt the plaintext data from the source (for example, your application) before you transmit the data to an AWS service. This verifies that only the authorized users with the right permission to the encryption key can decrypt the ciphertext data. Because data is encrypted inside an environment that you control, it is not exposed to a third party, including AWS.
While client-side encryption can be used to improve overall security posture, it introduces additional complexity on the application, including managing keys and securely executing cryptographic tasks. Furthermore, client-side encryption often results in reduced portability of the data. After data is encrypted and written to the database, it’s generally not possible to perform additional tasks such as creating index on the data or search directly on the encrypted records without first decrypting it locally. In the next section, you’ll see how you can address these issues by using the AWS Database Encryption SDK (DB-ESDK)—to implement client-side encryption in your DynamoDB workloads and perform searches.
AWS Database Encryption SDK
DB-ESDK can be used to encrypt sensitive attributes such as those containing PII attributes before storing them in your DynamoDB table. This enables your application to help protect sensitive data in transit and at rest, because data cannot be exposed unless decrypted by your application. You can also use DB-ESDK to find information by searching on encrypted attributes while your data remains securely encrypted within the database.
In regards to key management, DB-ESDK gives you direct control over the data by letting you supply your own encryption key. If you’re using AWS KMS, you can use key policies to enforce clear separation between the authorized users who can access specific encrypted data and those who cannot. If your application requires storing multiple tenant’s data in single table, DB-ESDK supports configuring distinct key for each of those tenants to ensure data protection. Follow this link to view how searchable encryption works for multiple tenant databases.
While DB-ESDK provides many features to help you encrypt data in your database, in this blog post, we focus on demonstrating the ability to search on encrypted data.
How the AWS Database Encryption SDK works with DynamoDB
Figure 1: DB-ESDK overview
As illustrated in Figure 1, there are several steps that you must complete before you can start using the AWS Database Encryption SDK. First, you need to set up your cryptographic material provider library (MPL), which provides you with the lower level abstraction layer for managing cryptographic materials (that is, keyrings and wrapping keys) used for encryption and decryption. The MPL provides integration with AWS KMS as your keyring and allows you to use a symmetric KMS key as your wrapping key. When data needs to be encrypted, DB-ESDK uses envelope encryption and asks the keyring for encryption material. The material consists of a plaintext data key and an encrypted data key, which is encrypted with the wrapping key. DB-ESDK uses the plaintext data key to encrypt the data and stores the ciphertext data key with the encrypted data. This process is reversed for decryption.
The AWS KMS hierarchical keyring goes one step further by introducing a branch key between the wrapping keys and data keys. Because the branch key is cached, it reduces the number of network calls to AWS KMS, providing performance and cost benefits. The hierarchical keyring uses a separate DynamoDB table is referred as the keystore table that must be created in advance. The mapping of wrapping keys to branch keys to data keys is handled automatically by the MPL.
Next, you need to set up the main DynamoDB table for your application. The Java version of DB-ESDK for DynamoDB provides attribute level actions to let you define which attribute should be encrypted. To allow your application to search on encrypted attribute values, you also must configure beacons, which are truncated hashes of plaintext value that create a map between the plaintext and encrypted value and are used to perform the search. These configuration steps are done once for each DynamoDB table. When using beacons, there are tradeoffs between how efficient your queries are and how much information is indirectly revealed about the distribution of your data. You should understand the tradeoff between security and performance before deciding if beacons are right for your use case.
After the MPL and DynamoDB table are set up, you’re ready to use DB-ESDK to perform client-side encryption. To better understand the preceding steps, let’s dive deeper into an example of how this all comes together to insert data and perform searches on a DynamoDB table.
AWS Database Encryption SDK in action
Let’s review the process of setting up DB-ESDK and see it in action. For the purposes of this blog post, let’s build a simple application to add records and performs searches.
The following is a sample plaintext record that’s received by the application:
Prerequisite: For client side encryption to work, set up the integrated development environment (IDE) of your choice or set up AWS Cloud9.
Note: To focus on DB-ESDK capabilities, the following instructions omit basic configuration details for DynamoDB and AWS KMS.
Configure DB-ESDK cryptography
As mentioned previously, you must set up the MPL. For this example, you use an AWS KMS hierarchical keyring.
Create KMS key: Create the wrapping key for your keyring. To do this, create a symmetric KMS key using the AWS Management Console or the API.
Create keystore table: Create a DynamoDB table to serve as a keystore to hold the branch keys. The logical keystore name is cryptographically bound to the data stored in the keystore table. The logical keystore name can be the same as your DynamoDB table name, but it doesn’t have to be.
private static void keyStoreCreateTable(String keyStoreTableName,
                                       String logicalKeyStoreName,
                                       String kmsKeyArn) {

    final KeyStore keystore = KeyStore.builder().KeyStoreConfig(
            KeyStoreConfig.builder()
                    .ddbClient(DynamoDbClient.create())
                    .ddbTableName(keyStoreTableName)
                    .logicalKeyStoreName(logicalKeyStoreName)
                    .kmsClient(KmsClient.create())
                    .kmsConfiguration(KMSConfiguration.builder()
                            .kmsKeyArn(kmsKeyArn)
                            .build())
                    .build()).build();


      keystore.CreateKeyStore(CreateKeyStoreInput.builder().build());
    // It may take a couple minutes for the table to reflect ACTIVE state
}
Create keystore keys: This operation generates the active branch key and beacon key using the KMS key from step 1 and stores it in the keystore table. The branch and beacon keys will be used by DB-ESDK for encrypting attributes and generating beacons.
At this point, the one-time set up to configure the cryptography material is complete.
Set up a DynamoDB table and beacons
The second step is to set up your DynamoDB table for client-side encryption. In this step, define the attributes that you want to encrypt, define beacons to enable search on encrypted data, and set up the index to query the data. For this example, use the Java client-side encryption library for DynamoDB.
Define DynamoDB table: Define the table schema and the attributes to be encrypted. For this blog post, lets define the schema based on the sample record that was shared previously. To do that, create a DynamoDB table called OrderInfo with order_id as the partition key and order_time as the sort key.
ENCRYPT_AND_SIGN: Encrypts and signs the attributes in each record using a unique encryption key. Choose this option for attributes with data you want to encrypt.
SIGN_ONLY: Adds a digital signature to verify the authenticity of your data. Choose this option for attributes that you would like to protect from being altered. The partition and sort key should always be set as SIGN_ONLY.
DO_NOTHING: Does not encrypt or sign the contents of the field and stores the data as-is. Only choose this option if the field doesn’t contain sensitive data and doesn’t need to be authenticated with the rest of your data. In this example, the partition key and sort key will be defined as “Sign_Only” attributes. All additional table attributes will be defined as “Encrypt and Sign”: email, firstname, lastname, last4creditcard and expirydate.
private static DynamoDbClient configDDBTable(String ddbTableName,
                                      IKeyring kmsKeyring,
                                      List<BeaconVersion> beaconVersions){

    // Partition and Sort keys must be SIGN_ONLY

    final Map<String, CryptoAction> attributeActionsOnEncrypt = new HashMap<>();
    attributeActionsOnEncrypt.put("order_id", CryptoAction.SIGN_ONLY);
    attributeActionsOnEncrypt.put("order_time", CryptoAction.SIGN_ONLY);
    attributeActionsOnEncrypt.put("email", CryptoAction.ENCRYPT_AND_SIGN);
    attributeActionsOnEncrypt.put("firstname", CryptoAction.ENCRYPT_AND_SIGN);
    attributeActionsOnEncrypt.put("lastname", CryptoAction.ENCRYPT_AND_SIGN);
    attributeActionsOnEncrypt.put("last4creditcard", CryptoAction.ENCRYPT_AND_SIGN);
    attributeActionsOnEncrypt.put("expirydate", CryptoAction.ENCRYPT_AND_SIGN);


    final Map<String, DynamoDbTableEncryptionConfig> tableConfigs = new HashMap<>();
    final DynamoDbTableEncryptionConfig config = DynamoDbTableEncryptionConfig.builder()
            .logicalTableName(ddbTableName)
            .partitionKeyName("order_id")
            .sortKeyName("order_time")
            .attributeActionsOnEncrypt(attributeActionsOnEncrypt)
            .keyring(kmsKeyring)
            .search(SearchConfig.builder()
                    .writeVersion(1) // MUST be 1
                    .versions(beaconVersions)
                    .build())
            .build();
    tableConfigs.put(ddbTableName, config);

    // Create the DynamoDb Encryption Interceptor
    DynamoDbEncryptionInterceptor encryptionInterceptor = DynamoDbEncryptionInterceptor.builder()
            .config(DynamoDbTablesEncryptionConfig.builder()
                    .tableEncryptionConfigs(tableConfigs)
                    .build())
            .build();

    // Create a new AWS SDK DynamoDb client using the DynamoDb Encryption Interceptor above
    final DynamoDbClient ddb = DynamoDbClient.builder()
            .overrideConfiguration(
                    ClientOverrideConfiguration.builder()
                            .addExecutionInterceptor(encryptionInterceptor)
                            .build())
            .build();
    return ddb;
}
Configure beacons: Beacons allow searches on encrypted fields by creating a mapping between the plaintext value of a field and the encrypted value that’s stored in your database. Beacons are generated by DB-ESDK when the data is being encrypted and written by your application. Beacons are stored in your DynamoDB table along with your encrypted data in fields labelled with the prefix aws_dbe_b_.
It’s important to note that beacons are designed to be implemented in new, unpopulated tables only. If configured on existing tables, beacons will only map to new records that are written and the older records will not have the values populated. There are two types of beacons – standard and compound. The type of beacon you configure determines the type of queries you are able to perform. You should select the type of beacon based on your queries and access patterns:
Standard beacons: This beacon type supports querying a single source field using equality operations such as equals and not-equals. It also allows you to query a virtual (conceptual) field by concatenating one or more source fields.
Compound beacons: This beacon type supports querying a combination of encrypted and signed or signed-only fields and performs complex operations such as begins with, contains, between, and so on. For compound beacons, you must first build standard beacons on individual fields. Next, you need to create an encrypted part list using a unique prefix for each of the standard beacons. The prefix should be a short value and helps differentiate the individual fields, simplifying the querying process. And last, you build the compound beacon by concatenating the standard beacons that will be used for searching using a split character. Verify that the split character is unique and doesn’t appear in any of the source fields’ data that the compound beacon is constructed from.
Along with identifying the right beacon type, each beacon must be configured with additional properties such as a unique name, source field, and beacon length. Continuing the previous example, let’s build beacon configurations for the two scenarios that will be demonstrated in this blog post.
Scenario 1: Identify orders by exact match on the email address.
In this scenario, search needs to be conducted on a singular attribute using equality operation.
Beacon type: Standard beacon.
Beacon name: The name can be the same as the encrypted field name, so let’s set it as email.
Beacon length: For this example, set the beacon length to 15. For your own uses cases, see Choosing a beacon length.
Scenario 2: Identify orders using name (first name and last name) and credit card attributes (last four digits and expiry date).
In this scenario, multiple attributes are required to conduct a search. To satisfy the use case, one option is to create individual compound beacons on name attributes and credit card attributes. However, the name attributes are considered correlated and, as mentioned in the beacon selection guidance, we should avoid building a compound beacon on such correlated fields. Instead in this scenario we will concatenate the attributes and build a virtual field on the name attributes
Beacon type: Compound beacon
Beacon Configuration:
Define a virtual field on firstname and lastname, and label it fullname.
Define standard beacons on each of the individual fields that will be used for searching: fullname, last4creditcard, and expirydate. Follow the guidelines for setting standard beacons as explained in Scenario 1.
For compound beacons, create an encrypted part list to concatenate the standard beacons with a unique prefix for each of the standard beacons. The prefix helps separate the individual fields. For this example, use C- for the last four digits of the credit card and E- for the expiry date.
Build the compound beacons using their respective encrypted part list and a unique split character. For this example, use ~ as the split character.
Beacon length: Set beacon length to 15.
Beacon Name: Set the compound beacon name as CardCompound.
Define index: Following DynamoDB best practices, secondary indexes are often essential to support query patterns. DB-ESDK performs searches on the encrypted fields by doing a look up on the fields with matching beacon values. Therefore, if you need to query an encrypted field, you must create an index on the corresponding beacon fields generated by the DB-ESDK library (attributes with prefix aws_dbe_b_), which will be used by your application for searches.
Scenario 1: Create a GSI with aws_dbe_b_email as the partition key and leave the sort key empty. Set the index name as aws_dbe_b_email-index. This will allow searches using the email address attribute.
Scenario 2: Create a GSI with aws_dbe_b_FullName as the partition key and aws_dbe_b_CardCompound as the sort key. Set the index name as aws_dbe_b_VirtualNameCardCompound-index. This will allow searching based on firstname, lastname, last four digits of the credit card, and the expiry date. At this point the required DynamoDB table setup is complete.
Set up the application to insert and query data
Now that the setup is complete, you can use the DB-ESDK from your application to insert new items into your DynamoDB table. DB-ESDK will automatically fetch the data key from the keyring, perform encryption locally, and then make the put call to DynamoDB. By using beacon fields, the application can perform searches on the encrypted fields.
Keyring initialization: Initialize the AWS KMS hierarchical keyring.
Insert source data: For illustration purpose, lets define a method to load sample data into the OrderInfo table. By using DB-ESDK, the application will encrypt data attributes as defined in the DynamoDB table configuration steps.
Scenario 2: Identify orders that were placed by John Doe using a specific credit card with the last four digits of 4567 and expiry date of 082026. This query should return Order ID ABC-1003 and ABC-1004.
Note: Compound beacons support complex string operation such as begins_with. In Scenario 2, if you had only the name attributes and last four digits of the credit card, you could still use the compound beacon for querying. You can set the values as shown below to query the beacon using the same code:
Now that you have the building blocks, let’s bring this all together and run the following steps to set up the application. For this example, a few of the input parameters have been hard coded. In your application code, replace <KMS key ARN> and <branch-key-id derived from keystore table> from Step 1 and Step 3 mentioned in the Configure DB-ESDK cryptography sections.
You’ve just seen how to build an application that encrypts sensitive data on client side, stores it in a DynamoDB table and performs queries on the encrypted data transparently to the application code without decrypting the entire data set. This allows your applications to realize the full potential of the encrypted data while adhering to security and compliance requirements. The code snippet used in this blog is available for reference on GitHub. You can further read the documentation of the AWS Database Encryption SDK and reference the source code at this repository. We encourage you to explore other examples of searching on encrypted fields referenced in this GitHub repository.
If you have feedback about this post, submit comments in the Comments section below. If you have questions about this post, contact AWS Support.
Want more AWS Security news? Follow us on Twitter.
The collective thoughts of the interwebz
Manage Consent
To provide the best experiences, we use technologies like cookies to store and/or access device information. Consenting to these technologies will allow us to process data such as browsing behavior or unique IDs on this site. Not consenting or withdrawing consent, may adversely affect certain features and functions.
Functional
Always active
The technical storage or access is strictly necessary for the legitimate purpose of enabling the use of a specific service explicitly requested by the subscriber or user, or for the sole purpose of carrying out the transmission of a communication over an electronic communications network.
Preferences
The technical storage or access is necessary for the legitimate purpose of storing preferences that are not requested by the subscriber or user.
Statistics
The technical storage or access that is used exclusively for statistical purposes.The technical storage or access that is used exclusively for anonymous statistical purposes. Without a subpoena, voluntary compliance on the part of your Internet Service Provider, or additional records from a third party, information stored or retrieved for this purpose alone cannot usually be used to identify you.
Marketing
The technical storage or access is required to create user profiles to send advertising, or to track the user on a website or across several websites for similar marketing purposes.