Tag Archives: Amazon Simple Queue Service (SQS)

Building a serverless document chat with AWS Lambda and Amazon Bedrock

Post Syndicated from Pascal Vogel original https://aws.amazon.com/blogs/compute/building-a-serverless-document-chat-with-aws-lambda-and-amazon-bedrock/

This post is written by Pascal Vogel, Solutions Architect, and Martin Sakowski, Senior Solutions Architect.

Large language models (LLMs) are proving to be highly effective at solving general-purpose tasks such as text generation, analysis and summarization, translation, and much more. Because they are trained on large datasets, they can use a broad generalist knowledge base. However, as training takes place offline and uses publicly available data, their ability to access specialized, private, and up-to-date knowledge is limited.

One way to improve LLM knowledge in a specific domain is fine-tuning them on domain-specific datasets. However, this is time and resource intensive, requires specialized knowledge, and may not be appropriate for some tasks. For example, fine-tuning won’t allow an LLM to access information with daily accuracy.

To address these shortcomings, Retrieval Augmented Generation (RAG) is proving to be an effective approach. With RAG, data external to the LLM is used to augment prompts by adding relevant retrieved data in the context. This allows for integrating disparate data sources and the complete separation of data sources from the machine learning model entirely.

Tools such as LangChain or LlamaIndex are gaining popularity because of their ability to flexibly integrate with a variety of data sources such as (vector) databases, search engines, and current public data sources.

In the context of LLMs, semantic search is an effective search approach, as it considers the context and intent of user-provided prompts as opposed to a traditional literal search. Semantic search relies on word embeddings, which represent words, sentences, or documents as vectors. Consequently, documents must be transformed into embeddings using an embedding model as the basis for semantic search. Because this embedding process only needs to happen when a document is first ingested or updated, it’s a great fit for event-driven compute with AWS Lambda.

This blog post presents a solution that allows you to ask natural language questions of any PDF document you upload. It combines the text generation and analysis capabilities of an LLM with a vector search on the document content. The solution uses serverless services such as AWS Lambda to run LangChain and Amazon DynamoDB for conversational memory.

Amazon Bedrock is used to provide serverless access to foundational models such as Amazon Titan and models developed by leading AI startups, such as AI21 Labs, Anthropic, and Cohere. See the GitHub repository for a full list of available LLMs and deployment instructions.

You learn how the solution works, what design choices were made, and how you can use it as a blueprint to build your own custom serverless solutions based on LangChain that go beyond prompting individual documents. The solution code and deployment instructions are available on GitHub.

Solution overview

Let’s look at how the solution works at a high level before diving deeper into specific elements and the AWS services used in the following sections. The following diagram provides a simplified view of the solution architecture and highlights key elements:

The process of interacting with the web application looks like this:

  1. A user uploads a PDF document into an Amazon Simple Storage Service (Amazon S3) bucket through a static web application frontend.
  2. This upload triggers a metadata extraction and document embedding process. The process converts the text in the document into vectors. The vectors are loaded into a vector index and stored in S3 for later use.
  3. When a user chats with a PDF document and sends a prompt to the backend, a Lambda function retrieves the index from S3 and searches for information related to the prompt.
  4. An LLM then uses the results of this vector search, previous messages in the conversation, and its general-purpose capabilities to formulate a response to the user.

As can be seen on the following screenshot, the web application deployed as part of the solution allows you to upload documents and list uploaded documents and their associated metadata, such as number of pages, file size, and upload date. The document status indicates if a document is successfully uploaded, is being processed, or is ready for a conversation.

Web application document list view

By clicking on one of the processed documents, you can access a chat interface, which allows you to send prompts to the backend. It is possible to have multiple independent conversations with each document with separate message history.

Web application chat view

Embedding documents

Solution architecture diagram excerpt: embedding documents

When a new document is uploaded to the S3 bucket, an S3 event notification triggers a Lambda function that extracts metadata, such as file size and number of pages, from the PDF file and stores it in a DynamoDB table. Once the extraction is complete, a message containing the document location is placed on an Amazon Simple Queue Service (Amazon SQS) queue. Another Lambda function polls this queue using Lambda event source mapping. Applying the decouple messaging pattern to the metadata extraction and document embedding functions ensures loose coupling and protects the more compute-intensive downstream embedding function.

The embedding function loads the PDF file from S3 and uses a text embedding model to generate a vector representation of the contained text. LangChain integrates with text embedding models for a variety of LLM providers. The resulting vector representation of the text is loaded into a FAISS index. FAISS is an open source vector store that can run inside the Lambda function memory using the faiss-cpu Python package. Finally, a dump of this FAISS index is stored in the S3 bucket besides the original PDF document.

Generating responses

Solution architecture diagram excerpt: generating responses

When a prompt for a specific document is submitted via the Amazon API Gateway REST API endpoint, it is proxied to a Lambda function that:

  1. Loads the FAISS index dump of the corresponding PDF file from S3 and into function memory.
  2. Performs a similarity search of the FAISS vector store based on the prompt.
  3. If available, retrieves a record of previous messages in the same conversation via the DynamoDBChatMessageHistory integration. This integration can store message history in DynamoDB. Each conversation is identified by a unique ID.
  4. Finally, a LangChain ConversationalRetrievalChain passes the combination of the prompt submitted by the user, the result of the vector search, and the message history to an LLM to generate a response.

Web application and file uploads

Solution architecture diagram excerpt: web application

A static web application serves as the frontend for this solution. It’s built with React, TypeScriptVite, and TailwindCSS and deployed via AWS Amplify Hosting, a fully managed CI/CD and hosting service for fast, secure, and reliable static and server-side rendered applications. To protect the application from unauthorized access, it integrates with an Amazon Cognito user pool. The API Gateway uses an Amazon Cognito authorizer to authenticate requests.

Users upload PDF files directly to the S3 bucket using S3 presigned URLs obtained via the REST API. Several Lambda functions implement API endpoints used to create, read, and update document metadata in a DynamoDB table.

Extending and adapting the solution

The solution provided serves as a blueprint that can be enhanced and extended to develop your own use cases based on LLMs. For example, you can extend the solution so that users can ask questions across multiple PDF documents or other types of data sources. LangChain makes it easy to load different types of data into vector stores, which you can then use for semantic search.

Once your use case involves searching across multiple documents, consider moving from loading vectors into memory with FAISS to a dedicated vector database. There are several options for vector databases on AWS. One serverless option is Amazon Aurora Serverless v2 with the pgvector extension for PostgreSQL. Alternatively, vector databases developed by AWS Partners such as Pinecone or MongoDB Atlas Vector Search can be integrated with LangChain. Besides vector search, LangChain also integrates with traditional external data sources, such as the enterprise search service Amazon Kendra, Amazon OpenSearch, and many other data sources.

The solution presented in this blog post uses similarity search to find information in the vector database that closely matches the user-supplied prompt. While this works well in the presented use case, you can also use other approaches, such as maximal marginal relevance, to find the most relevant information to provide to the LLM. When searching across many documents and receiving many results, techniques such as MapReduce can improve the quality of the LLM responses.

Depending on your use case, you may also want to select a different LLM to achieve an ideal balance between quality of results and cost. Amazon Bedrock is a fully managed service that makes foundational models (FMs) from leading AI startups and Amazon available via an API, so you can choose from a wide range of FMs to find the model that’s best suited for your use case. You can use models such as Amazon Titan, Jurassic-2 from AI21 Labs, or Anthropic Claude.

To further optimize the user experience of your generative AI application, consider streaming LLM responses to your frontend in real-time using Lambda response streaming and implementing real-time data updates using AWS AppSync subscriptions or Amazon API Gateway WebSocket APIs.

Conclusion

AWS serverless services make it easier to focus on building generative AI applications by providing automatic scaling, built-in high availability, and a pay-for-use billing model. Event-driven compute with AWS Lambda is a good fit for compute-intensive, on-demand tasks such as document embedding and flexible LLM orchestration.

The solution in this blog post combines the capabilities of LLMs and semantic search to answer natural language questions directed at PDF documents. It serves as a blueprint that can be extended and adapted to fit further generative AI use cases.

Deploy the solution by following the instructions in the associated GitHub repository.

For more serverless learning resources, visit Serverless Land.

Simplify operational data processing in data lakes using AWS Glue and Apache Hudi

Post Syndicated from Ravi Itha original https://aws.amazon.com/blogs/big-data/simplify-operational-data-processing-in-data-lakes-using-aws-glue-and-apache-hudi/

The Analytics specialty practice of AWS Professional Services (AWS ProServe) helps customers across the globe with modern data architecture implementations on the AWS Cloud. A modern data architecture is an evolutionary architecture pattern designed to integrate a data lake, data warehouse, and purpose-built stores with a unified governance model. It focuses on defining standards and patterns to integrate data producers and consumers and move data between data lakes and purpose-built data stores securely and efficiently. Out of the many data producer systems that feed data to a data lake, operational databases are most prevalent, where operational data is stored, transformed, analyzed, and finally used to enhance business operations of an organization. With the emergence of open storage formats such as Apache Hudi and its native support from AWS Glue for Apache Spark, many AWS customers have started adding transactional and incremental data processing capabilities to their data lakes.

AWS has invested in native service integration with Apache Hudi and published technical contents to enable you to use Apache Hudi with AWS Glue (for example, refer to Introducing native support for Apache Hudi, Delta Lake, and Apache Iceberg on AWS Glue for Apache Spark, Part 1: Getting Started). In AWS ProServe-led customer engagements, the use cases we work on usually come with technical complexity and scalability requirements. In this post, we discuss a common use case in relation to operational data processing and the solution we built using Apache Hudi and AWS Glue.

Use case overview

AnyCompany Travel and Hospitality wanted to build a data processing framework to seamlessly ingest and process data coming from operational databases (used by reservation and booking systems) in a data lake before applying machine learning (ML) techniques to provide a personalized experience to its users. Due to the sheer volume of direct and indirect sales channels the company has, its booking and promotions data are organized in hundreds of operational databases with thousands of tables. Of those tables, some are larger (such as in terms of record volume) than others, and some are updated more frequently than others. In the data lake, the data to be organized in the following storage zones:

  1. Source-aligned datasets – These have an identical structure to their counterparts at the source
  2. Aggregated datasets – These datasets are created based on one or more source-aligned datasets
  3. Consumer-aligned datasets – These are derived from a combination of source-aligned, aggregated, and reference datasets enriched with relevant business and transformation logics, usually fed as inputs to ML pipelines or any consumer applications

The following are the data ingestion and processing requirements:

  1. Replicate data from operational databases to the data lake, including insert, update, and delete operations.
  2. Keep the source-aligned datasets up to date (typically within the range of 10 minutes to a day) in relation to their counterparts in the operational databases, ensuring analytics pipelines refresh consumer-aligned datasets for downstream ML pipelines in a timely fashion. Moreover, the framework should consume compute resources as optimally as possible per the size of the operational tables.
  3. To minimize DevOps and operational overhead, the company wanted to templatize the source code wherever possible. For example, to create source-aligned datasets in the data lake for 3,000 operational tables, the company didn’t want to deploy 3,000 separate data processing jobs. The smaller the number of jobs and scripts, the better.
  4. The company wanted the ability to continue processing operational data in the secondary Region in the rare event of primary Region failure.

As you can guess, the Apache Hudi framework can solve the first requirement. Therefore, we will put our emphasis on the other requirements. We begin with a Data lake reference architecture followed by an overview of operational data processing framework. By showing you our open-source solution on GitHub, we delve into framework components and walk through their design and implementation aspects. Finally, by testing the framework, we summarize how it meets the aforementioned requirements.

Data lake reference architecture

Let’s begin with a big picture: a data lake solves a variety of analytics and ML use cases dealing with internal and external data producers and consumers. The following diagram represents a generic data lake architecture. To ingest data from operational databases to an Amazon Simple Storage Service (Amazon S3) staging bucket of the data lake, either AWS Database Migration Service (AWS DMS) or any AWS partner solution from AWS Marketplace that has support for change data capture (CDC) can fulfill the requirement. AWS Glue is used to create source-aligned and consumer-aligned datasets and separate AWS Glue jobs to do feature engineering part of ML engineering and operations. Amazon Athena is used for interactive querying and AWS Lake Formation is used for access controls.

Data Lake Reference Architecture

Operational data processing framework

The operational data processing (ODP) framework contains three components: File Manager, File Processor, and Configuration Manager. Each component runs independently to solve a portion of the operational data processing use case. We have open-sourced this framework on GitHub—you can clone the code repo and inspect it while we walk you through the design and implementation of the framework components. The source code is organized in three folders, one for each component, and if you customize and adopt this framework for your use case, we recommend promoting these folders as separate code repositories in your version control system. Consider using the following repository names:

  1. aws-glue-hudi-odp-framework-file-manager
  2. aws-glue-hudi-odp-framework-file-processor
  3. aws-glue-hudi-odp-framework-config-manager

With this modular approach, you can independently deploy the components to your data lake environment by following your preferred CI/CD processes. As illustrated in the preceding diagram, these components are deployed in conjunction with a CDC solution.

Component 1: File Manager

File Manager detects files emitted by a CDC process such as AWS DMS and tracks them in an Amazon DynamoDB table. As shown in the following diagram, it consists of an Amazon EventBridge event rule, an Amazon Simple Queue Service (Amazon SQS) queue, an AWS Lambda function, and a DynamoDB table. The EventBridge rule uses Amazon S3 Event Notifications to detect the arrival of CDC files in the S3 bucket. The event rule forwards the object event notifications to the SQS queue as messages. The File Manager Lambda function consumes those messages, parses the metadata, and inserts the metadata to the DynamoDB table odpf_file_tracker. These records will then be processed by File Processor, which we discuss in the next section.

ODPF Component: File Manager

Component 2: File Processor

File Processor is the workhorse of the ODP framework. It processes files from the S3 staging bucket, creates source-aligned datasets in the raw S3 bucket, and adds or updates metadata for the datasets (AWS Glue tables) in the AWS Glue Data Catalog.

We use the following terminology when discussing File Processor:

  1. Refresh cadence – This represents the data ingestion frequency (for example, 10 minutes). It usually goes with AWS Glue worker type (one of G.1X, G.2X, G.4X, G.8X, G.025X, and so on) and batch size.
  2. Table configuration – This includes the Hudi configuration (primary key, partition key, pre-combined key, and table type (Copy on Write or Merge on Read)), table data storage mode (historical or current snapshot), S3 bucket used to store source-aligned datasets, AWS Glue database name, AWS Glue table name, and refresh cadence.
  3. Batch size – This numeric value is used to split tables into smaller batches and process their respective CDC files in parallel. For example, a configuration of 50 tables with a 10-minute refresh cadence and a batch size of 5 results in a total of 10 AWS Glue job runs, each processing CDC files for 5 tables.
  4. Table data storage mode – There are two options:
    • Historical – This table in the data lake stores historical updates to records (always append).
    • Current snapshot – This table in the data lake stores latest versioned records (upserts) with the ability to use Hudi time travel for historical updates.
  5. File processing state machine – It processes CDC files that belong to tables that share a common refresh cadence.
  6. EventBridge rule association with the file processing state machine – We use a dedicated EventBridge rule for each refresh cadence with the file processing state machine as target.
  7. File processing AWS Glue job – This is a configuration-driven AWS Glue extract, transform, and load (ETL) job that processes CDC files for one or more tables.

File Processor is implemented as a state machine using AWS Step Functions. Let’s use an example to understand this. The following diagram illustrates running File Processor state machine with a configuration that includes 18 operational tables, a refresh cadence of 10 minutes, a batch size of 5, and an AWS Glue worker type of G.1X.

ODP framework component: File Processor

The workflow includes the following steps:

  1. The EventBridge rule triggers the File Processor state machine every 10 minutes.
  2. Being the first state in the state machine, the Batch Manager Lambda function reads configurations from DynamoDB tables.
  3. The Lambda function creates four batches: three of them will be mapped to five operational tables each, and the fourth one is mapped to three operational tables. Then it feeds the batches to the Step Functions Map state.
  4. For each item in the Map state, the File Processor Trigger Lambda function will be invoked, which in turn runs the File Processor AWS Glue job.
  5. Each AWS Glue job performs the following actions:
    • Checks the status of an operational table and acquires a lock when it is not processed by any other job. The odpf_file_processing_tracker DynamoDB table is used for this purpose. When a lock is acquired, it inserts a record in the DynamoDB table with the status updating_table for the first time; otherwise, it updates the record.
    • Processes the CDC files for the given operational table from the S3 staging bucket and creates a source-aligned dataset in the S3 raw bucket. It also updates technical metadata in the AWS Glue Data Catalog.
    • Updates the status of the operational table to completed in the odpf_file_processing_tracker table. In case of processing errors, it updates the status to refresh_error and logs the stack trace.
    • It also inserts this record into the odpf_file_processing_tracker_history DynamoDB table along with additional details such as insert, update, and delete row counts.
    • Moves the records that belong to successfully processed CDC files from odpf_file_tracker to the odpf_file_tracker_history table with file_ingestion_status set to raw_file_processed.
    • Moves to the next operational table in the given batch.
    • Note: a failure to process CDC files for one of the operational tables of a given batch does not impact the processing of other operational tables.

Component 3: Configuration Manager

Configuration Manager is used to insert configuration details to the odpf_batch_config and odpf_raw_table_config tables. To keep this post concise, we provide two architecture patterns in the code repo and leave the implementation details to you.

Solution overview

Let’s test the ODP framework by replicating data from 18 operational tables to a data lake and creating source-aligned datasets with 10-minute refresh cadence. We use Amazon Relational Database Service (Amazon RDS) for MySQL to set up an operational database with 18 tables, upload the New York City Taxi – Yellow Trip Data dataset, set up AWS DMS to replicate data to Amazon S3, process the files using the framework, and finally validate the data using Amazon Athena.

Create S3 buckets

For instructions on creating an S3 bucket, refer to Creating a bucket. For this post, we create the following buckets:

  1. odpf-demo-staging-EXAMPLE-BUCKET – You will use this to migrate operational data using AWS DMS
  2. odpf-demo-raw-EXAMPLE-BUCKET – You will use this to store source-aligned datasets
  3. odpf-demo-code-artifacts-EXAMPLE-BUCKET – You will use this to store code artifacts

Deploy File Manager and File Processor

Deploy File Manager and File Processor by following instructions from this README and this README, respectively.

Set up Amazon RDS for MySQL

Complete the following steps to set up Amazon RDS for MySQL as the operational data source:

  1. Provision Amazon RDS for MySQL. For instructions, refer to Create and Connect to a MySQL Database with Amazon RDS.
  2. Connect to the database instance using MySQL Workbench or DBeaver.
  3. Create a database (schema) by running the SQL command CREATE DATABASE taxi_trips;.
  4. Create 18 tables by running the SQL commands in the ops_table_sample_ddl.sql script.

Populate data to the operational data source

Complete the following steps to populate data to the operational data source:

  1. To download the New York City Taxi – Yellow Trip Data dataset for January 2021 (Parquet file), navigate to NYC TLC Trip Record Data, expand 2021, and choose Yellow Taxi Trip records. A file called yellow_tripdata_2021-01.parquet will be downloaded to your computer.
  2. On the Amazon S3 console, open the bucket odpf-demo-staging-EXAMPLE-BUCKET and create a folder called nyc_yellow_trip_data.
  3. Upload the yellow_tripdata_2021-01.parquet file to the folder.
  4. Navigate to the bucket odpf-demo-code-artifacts-EXAMPLE-BUCKET and create a folder called glue_scripts.
  5. Download the file load_nyc_taxi_data_to_rds_mysql.py from the GitHub repo and upload it to the folder.
  6. Create an AWS Identity and Access Management (IAM) policy called load_nyc_taxi_data_to_rds_mysql_s3_policy. For instructions, refer to Creating policies using the JSON editor. Use the odpf_setup_test_data_glue_job_s3_policy.json policy definition.
  7. Create an IAM role called load_nyc_taxi_data_to_rds_mysql_glue_role. Attach the policy created in the previous step.
  8. On the AWS Glue console, create a connection for Amazon RDS for MySQL. For instructions, refer to Adding a JDBC connection using your own JDBC drivers and Setting up a VPC to connect to Amazon RDS data stores over JDBC for AWS Glue. Name the connection as odpf_demo_rds_connection.
  9. In the navigation pane of the AWS Glue console, choose Glue ETL jobs, Python Shell script editor, and Upload and edit an existing script under Options.
  10. Choose the file load_nyc_taxi_data_to_rds_mysql.py and choose Create.
  11. Complete the following steps to create your job:
    • Provide a name for the job, such as load_nyc_taxi_data_to_rds_mysql.
    • For IAM role, choose load_nyc_taxi_data_to_rds_mysql_glue_role.
    • Set Data processing units to 1/16 DPU.
    • Under Advanced properties, Connections, select the connection you created earlier.
    • Under Job parameters, add the following parameters:
      • input_sample_data_path = s3://odpf-demo-staging-EXAMPLE-BUCKET/nyc_yellow_trip_data/yellow_tripdata_2021-01.parquet
      • schema_name = taxi_trips
      • table_name = table_1
      • rds_connection_name = odpf_demo_rds_connection
    • Choose Save.
  12. On the Actions menu, run the job.
  13. Go back to your MySQL Workbench or DBeaver and validate the record count by running the SQL command select count(1) row_count from taxi_trips.table_1. You will get an output of 1369769.
  14. Populate the remaining 17 tables by running the SQL commands from the populate_17_ops_tables_rds_mysql.sql script.
  15. Get the row count from the 18 tables by running the SQL commands from the ops_data_validation_query_rds_mysql.sql script. The following screenshot shows the output.
    Record volumes (for 18 Tables) in Operational Database

Configure DynamoDB tables

Complete the following steps to configure the DynamoDB tables:

  1. Download file load_ops_table_configs_to_ddb.py from the GitHub repo and upload it to the folder glue_scripts in the S3 bucket odpf-demo-code-artifacts-EXAMPLE-BUCKET.
  2. Create an IAM policy called load_ops_table_configs_to_ddb_ddb_policy. Use the odpf_setup_test_data_glue_job_ddb_policy.json policy definition.
  3. Create an IAM role called load_ops_table_configs_to_ddb_glue_role. Attach the policy created in the previous step.
  4. On the AWS Glue console, choose Glue ETL jobs, Python Shell script editor, and Upload and edit an existing script under Options.
  5. Choose the file load_ops_table_configs_to_ddb.py and choose Create.
  6. Complete the following steps to create a job:
    • Provide a name, such as load_ops_table_configs_to_ddb.
    • For IAM role, choose load_ops_table_configs_to_ddb_glue_role.
    • Set Data processing units to 1/16 DPU.
    • Under Job parameters, add the following parameters
      • batch_config_ddb_table_name = odpf_batch_config
      • raw_table_config_ddb_table_name = odpf_demo_taxi_trips_raw
      • aws_region = e.g., us-west-1
    • Choose Save.
  7. On the Actions menu, run the job.
  8. On the DynamoDB console, get the item count from the tables. You will find 1 item in the odpf_batch_config table and 18 items in the odpf_demo_taxi_trips_raw table.

Set up a database in AWS Glue

Complete the following steps to create a database:

  1. On the AWS Glue console, under Data catalog in the navigation pane, choose Databases.
  2. Create a database called odpf_demo_taxi_trips_raw.

Set up AWS DMS for CDC

Complete the following steps to set up AWS DMS for CDC:

  1. Create an AWS DMS replication instance. For Instance class, choose dms.t3.medium.
  2. Create a source endpoint for Amazon RDS for MySQL.
  3. Create target endpoint for Amazon S3. To configure the S3 endpoint settings, use the JSON definition from dms_s3_endpoint_setting.json.
  4. Create an AWS DMS task.
    • Use the source and target endpoints created in the previous steps.
    • To create AWS DMS task mapping rules, use the JSON definition from dms_task_mapping_rules.json.
    • Under Migration task startup configuration, select Automatically on create.
  5. When the AWS DMS task starts running, you will see a task summary similar to the following screenshot.
    DMS Task Summary
  6. In the Table statistics section, you will see an output similar to the following screenshot. Here, the Full load rows and Total rows columns are important metrics whose counts should match with the record volumes of the 18 tables in the operational data source.
    DMS Task Statistics
  7. As a result of successful full load completion, you will find Parquet files in the S3 staging bucket—one Parquet file per table in a dedicated folder, similar to the following screenshot. Similarly, you will find 17 such folders in the bucket.
    DMS Output in S3 Staging Bucket for Table 1

File Manager output

The File Manager Lambda function consumes messages from the SQS queue, extracts metadata for the CDC files, and inserts one item per file to the odpf_file_tracker DynamoDB table. When you check the items, you will find 18 items with file_ingestion_status set to raw_file_landed, as shown in the following screenshot.

CDC Files in File Tracker DynamoDB Table

File Processor output

  1. On the subsequent tenth minute (since the activation of the EventBridge rule), the event rule triggers the File Processor state machine. On the Step Functions console, you will notice that the state machine is invoked, as shown in the following screenshot.
    File Processor State Machine Run Summary
  2. As shown in the following screenshot, the Batch Generator Lambda function creates four batches and constructs a Map state for parallel running of the File Processor Trigger Lambda function.
    File Processor State Machine Run Details
  3. Then, the File Processor Trigger Lambda function runs the File Processor Glue Job, as shown in the following screenshot.
    File Processor Glue Job Parallel Runs
  4. Then, you will notice that the File Processor Glue Job runs create source-aligned datasets in Hudi format in the S3 raw bucket. For Table 1, you will see an output similar to the following screenshot. There will be 17 such folders in the S3 raw bucket.
    Data in S3 raw bucket
  5. Finally, in AWS Glue Data Catalog, you will notice 18 tables created in the odpf_demo_taxi_trips_raw database, similar to the following screenshot.
    Tables in Glue Database

Data validation

Complete the following steps to validate the data:

  1. On the Amazon Athena console, open the query editor, and select a workgroup or create a new workgroup.
  2. Choose AwsDataCatalog for Data source and odpf_demo_taxi_trips_raw for Database.
  3. Run the raw_data_validation_query_athena.sql SQL query. You will get an output similar to the following screenshot.
    Raw Data Validation via Amazon Athena

Validation summary: The counts in Amazon Athena match with the counts of the operational tables and it proves that the ODP framework has processed all the files and records successfully. This concludes the demo. To test additional scenarios, refer to Extended Testing in the code repo.

Outcomes

Let’s review how the ODP framework addressed the aforementioned requirements.

  1. As discussed earlier in this post, by logically grouping tables by refresh cadence and associating them to EventBridge rules, we ensured that the source-aligned tables are refreshed by the File Processor AWS Glue jobs. With the AWS Glue worker type configuration setting, we selected the appropriate compute resources while running the AWS Glue jobs (the instances of the AWS Glue job).
  2. By applying table-specific configurations (from odpf_batch_config and odpf_raw_table_config) dynamically, we were able to use one AWS Glue job to process CDC files for 18 tables.
  3. You can use this framework to support a variety of data migration use cases that require quicker data migration from on-premises storage systems to data lakes or analytics platforms on AWS. You can reuse File Manager as is and customize File Processor to work with other storage frameworks such as Apache Iceberg, Delta Lake, and purpose-built data stores such as Amazon Aurora and Amazon Redshift.
  4. To understand how the ODP framework met the company’s disaster recovery (DR) design criterion, we first need to understand the DR architecture strategy at a high level. The DR architecture strategy has the following aspects:
    • One AWS account and two AWS Regions are used for primary and secondary environments.
    • The data lake infrastructure in the secondary Region is kept in sync with the one in the primary Region.
    • Data is stored in S3 buckets, metadata data is stored in the AWS Glue Data Catalog, and access controls in Lake Formation are replicated from the primary to secondary Region.
    • The data lake source and target systems have their respective DR environments.
    • CI/CD tooling (version control, CI server, and so on) are to be made highly available.
    • The DevOps team needs to be able to deploy CI/CD pipelines of analytics frameworks (such as this ODP framework) to either the primary or secondary Region.
    • As you can imagine, disaster recovery on AWS is a vast subject, so we keep our discussion to the last design aspect.

By designing the ODP framework with three components and externalizing operational table configurations to DynamoDB global tables, the company was able to deploy the framework components to the secondary Region (in the rare event of a single-Region failure) and continue to process CDC files from the point it last processed in the primary Region. Because the CDC file tracking and processing audit data is replicated to the DynamoDB replica tables in the secondary Region, the File Manager microservice and File Processor can seamlessly run.

Clean up

When you’re finished testing this framework, you can delete the provisioned AWS resources to avoid any further charges.

Conclusion

In this post, we took a real-world operational data processing use case and presented you the framework we developed at AWS ProServe. We hope this post and the operational data processing framework using AWS Glue and Apache Hudi will expedite your journey in integrating operational databases into your modern data platforms built on AWS.


About the authors

Ravi-IthaRavi Itha is a Principal Consultant at AWS Professional Services with specialization in data and analytics and generalist background in application development. Ravi helps customers with enterprise data strategy initiatives across insurance, airlines, pharmaceutical, and financial services industries. In his 6-year tenure at Amazon, Ravi has helped the AWS builder community by publishing approximately 15 open-source solutions (accessible via GitHub handle), four blogs, and reference architectures. Outside of work, he is passionate about reading India Knowledge Systems and practicing Yoga Asanas.

srinivas-kandiSrinivas Kandi is a Data Architect at AWS Professional Services. He leads customer engagements related to data lakes, analytics, and data warehouse modernizations. He enjoys reading history and civilizations.

Implementing the transactional outbox pattern with Amazon EventBridge Pipes

Post Syndicated from James Beswick original https://aws.amazon.com/blogs/compute/implementing-the-transactional-outbox-pattern-with-amazon-eventbridge-pipes/

This post is written by Sayan Moitra, Associate Solutions Architect, and Sangram Sonawane, Senior Solutions Architect.

Microservice architecture is an architectural style that structures an application as a collection of loosely coupled and independently deployable services. Services must communicate with each other to exchange messages and perform business operations. Ensuring message reliability while maintaining loose coupling between services is crucial for building robust and scalable systems.

This blog demonstrates how to use Amazon DynamoDB, a fully managed serverless key-value NoSQL database, and Amazon EventBridge, a managed serverless event bus, to implement reliable messaging for microservices using the transactional outbox pattern.

Business operations can span across multiple systems or databases to maintain consistency and synchronization between them. One approach often used in distributed systems or architectures where data must be replicated across multiple locations or components is dual writes. In a dual write scenario, when a write operation is performed on one system or database, the same data or event also triggers another system in real-time or near real-time. This ensures that both systems always have the same data, minimizing data inconsistencies.

Dual writes can also introduce data integrity challenges in distributed systems. Failure to update the database or to send events to other downstream systems after an initial system update can lead to data loss and leave the application in an inconsistent state. One design approach to overcome this challenge is to combine dual writes with the transactional outbox pattern.

Challenges with dual writes

Consider an online food ordering application to illustrate the challenges with dual writes. Once the user submits the order, the order service updates the order status in a persistent data store. The order status update should also be sent to notify_restaurant and order_tracking services using a message bus for asynchronous communication. After successfully updating the order status in the database, the order service writes the event to the message bus. The order_service performs a dual write operation of updating the database and publishing the event details on the message bus for other services to read.

This approach works until there are issues encountered in publishing the event to the message bus. Publishing events can fail for multiple reasons like a network error or a message bus outage. When failure occurs, the notify_restaurant and order_tracking service will not be notified of the order update event, leaving the system in an inconsistent state. Implementing the transactional outbox pattern with dual writes can help ensure reliable messaging between systems after a database update.

This illustration shows a sequence diagram for an online food ordering application and the challenges with dual writes:

Sequence diagram

Overview of the transactional outbox pattern

In the transactional outbox pattern, a second persistent data store is introduced to store the outgoing messages. In the online food order example, updating the database with order details and storing the event information in the outbox table becomes a single atomic transaction.

The transaction is only successful when writing to both the database and the outbox table. Any failures to write to the outbox table rolls back the transaction. A separate process then reads the event from the outbox table and publishes the event on the message bus. Once the message is available on the message bus, it can be read by the notify_restaurant and order_tracking services. Combining transactional outbox pattern with dual writes allows for data consistency across systems and reliable message delivery with the transactional context.

The following illustration shows a sequence diagram for an online food ordering application with transactional outbox pattern for reliable message delivery.

Sequence diagram 2

Implementing the transaction outbox pattern

DynamoDB includes a feature called DynamoDB Streams to capture a time-ordered sequence of item-level modifications in the DynamoDB table and stores this information in a log for up to 24 hours. Applications can access this log and view the data items as they appeared before and after they were modified, in near real time.

Whenever an application creates, updates, or deletes items in the table, DynamoDB Streams writes a stream record with the primary key attributes of the items that were modified. A stream record contains information about a data modification to a single item in a DynamoDB table. DynamoDB Streams writes stream records in near real time and these can be consumed for processing based on the contents. Enabling this feature removes the need to maintain a separate outbox table and lowers the management and operational overhead.

EventBridge Pipes connects event producers to consumers with options to transform, filter, and enrich messages. EventBridge Pipes can integrate with DynamoDB Streams to capture table events without writing any code. There is no need to write and maintain a separate process to read from the stream. EventBridge Pipes also supports retries, and any failed events can be routed to a dead-letter queue (DLQ) for further analysis and reprocessing.

EventBridge polls shards in DynamoDB stream for records and invokes pipes as soon as records are available. You can configure this to read records from DynamoDB only when it has gathered a specified batch size or the batch window expires. Pipes maintains the order of records from the data stream when sending that data to the destination. You can optionally filter or enhance these records before sending them to a target for processing.

Example overview

The following diagram illustrates the implementation of transactional outbox pattern with DynamoDB Streams and EventBridge Pipe. Amazon API Gateway is used to trigger a DynamoDB operation via a POST request. The change in the DynamoDB triggers an EventBridge event bus via Amazon EventBridge Pipes. This event bus invokes the Lambda functions through an SQS Queue, depending on the filters applied.

Architecture overview

  1. In this sample implementation, Amazon API Gateway makes a POST call to the DynamoDB table for database updates. Amazon API Gateway supports CRUD operations for Amazon DynamoDB without the need of a compute layer for database calls.
  2. DynamoDB Streams is enabled on the table, which captures a time-ordered sequence of item-level modifications in the DynamoDB table in near real time.
  3. EventBridge Pipes integrates with DynamoDB Streams to capture the events and can optionally filter and enrich the data before it is sent to a supported target. In this example, events are sent to Amazon EventBridge, which acts as a message bus. This can be replaced with any of the supported targets as detailed in Amazon EventBridge Pipes targets. DLQ can be configured to handle any failed events, which can be analyzed and retried.
  4. Consumers listening to the event bus receive messages. You can optionally fan out and deliver the events to multiple consumers and apply filters. You can configure a DLQ to handle any failures and retries.

Prerequisites

  1. AWS SAM CLI, version 1.85.0 or higher
  2. Python 3.10

Deploying the example application

  1. Clone the repository:
    git clone https://github.com/aws-samples/amazon-eventbridge-pipes-dynamodb-stream-transactional-outbox.git
  2. Change to the root directory of the project and run the following AWS SAM CLI commands:
    cd amazon-eventbridge-pipes-dynamodb-stream-transactional-outbox               
    sam build
    sam deploy --guided
    
  3. Enter the name for your stack during guided deployment. During the deploy process, select the default option for all the additional steps.
    SAM deployment
  4. The resources are deployed.
    Testing the application

Testing the application

Once the deployment is complete, it provides the API Gateway URL in the output. You can test using that URL. To test the application, use Postman to make a POST call to API Gateway prod URL:

Postman

You can also test using the curl command:

curl -s --header "Content-Type: application/json" \
  --request POST \
  --data '{"Status":"Created"}' \
  <API_ENDPOINT>

This produces the following output:

Expected output

To verify if the order details are updated in the DynamoDB table, run this command for performing a scan operation on the table.

aws dynamodb scan \
    --table-name <DynamoDB Table Name>

Handling failures

DynamoDB Streams captures a time-ordered sequence of item-level modifications in the DynamoDB table and stores this information in a log for up to 24 hours. If EventBridge is unavailable to read from DynamoDB Stream due to misconfiguration, for example, the records are available in the log for 24 hours. Once EventBridge is reintegrated, it retrieves all undelivered records from the last 24 hours. For integration issues between EventBridge Pipes and the target application, all failed messages can be sent to the DLQ for reprocessing at a later time.

Cleaning up

To clean up your AWS based resources, run following AWS SAM CLI command, answering “y” to all questions:

sam delete --stack-name <stack_name>

Conclusion

Reliable interservice communication is an important consideration in microservice design, especially when faced with dual writes. Combining the transactional outbox pattern with dual writes provides a robust way of improving message reliability.

This blog demonstrates an architecture pattern to tackle the challenge of dual writes by combining it with the transactional outbox pattern using DynamoDB and EventBridge Pipes. This solution provides a no-code approach with AWS Managed Services, reducing management and operational overhead.

For more serverless learning resources, visit Serverless Land.

Integrating IBM MQ with Amazon SQS and Amazon SNS using Apache Camel

Post Syndicated from Pascal Vogel original https://aws.amazon.com/blogs/compute/integrating-ibm-mq-with-amazon-sqs-and-amazon-sns-using-apache-camel/

This post is written by Joaquin Rinaudo, Principal Security Consultant and Gezim Musliaj, DevOps Consultant.

IBM MQ is a message-oriented middleware (MOM) product used by many enterprise organizations, including global banks, airlines, and healthcare and insurance companies.

Customers often ask us for guidance on how they can integrate their existing on-premises MOM systems with new applications running in the cloud. They’re looking for a cost-effective, scalable and low-effort solution that enables them to send and receive messages from their cloud applications to these messaging systems.

This blog post shows how to set up a bi-directional bridge from on-premises IBM MQ to Amazon MQ, Amazon Simple Queue Service (Amazon SQS), and Amazon Simple Notification Service (Amazon SNS).

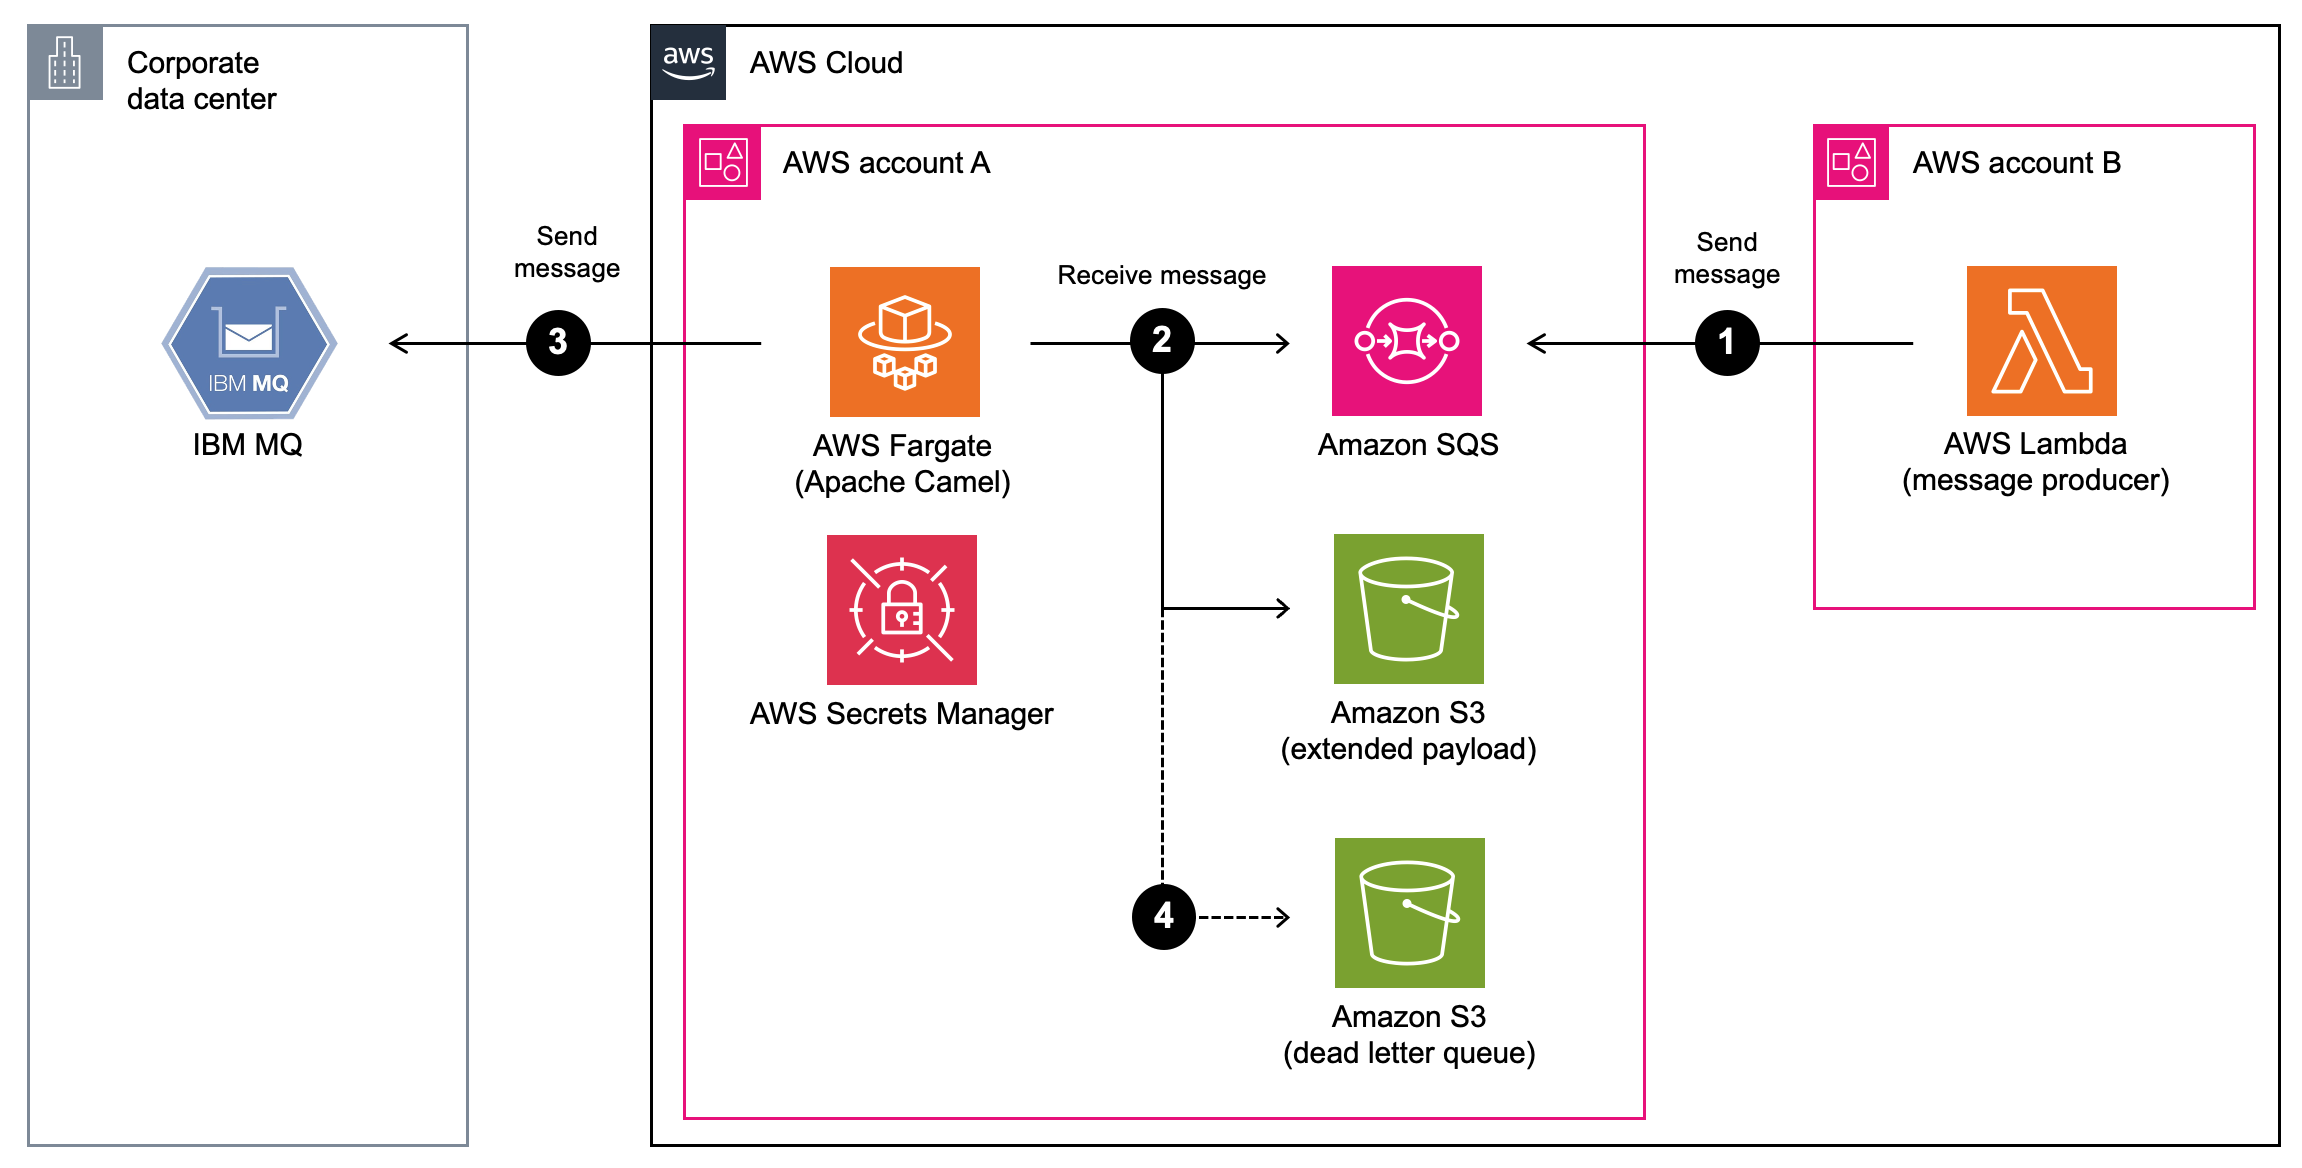
This allows your producer and consumer applications to integrate using fully managed AWS messaging services and Apache Camel. Learn how to deploy such a solution and how to test the running integration using SNS, SQS, and a demo IBM MQ cluster environment running on Amazon Elastic Container Service (ECS) with AWS Fargate.

This solution can also be used as part of a step-by-step migration using the approach described in the blog post Migrating from IBM MQ to Amazon MQ using a phased approach.

Solution overview

The integration consists of an Apache Camel broker cluster that bi-directionally integrates an IBM MQ system and target systems, such as Amazon MQ running ActiveMQ, SNS topics, or SQS queues.

In the following example, AWS services, in this case AWS Lambda and SQS, receive messages published to IBM MQ via an SNS topic:

Solution architecture overview for sending messages

  1. The cloud message consumers (Lambda and SQS) subscribe to the solution’s target SNS topic.
  2. The Apache Camel broker connects to IBM MQ using secrets stored in AWS Secrets Manager and reads new messages from the queue using IBM MQ’s Java library. Only IBM MQ messages are supported as a source.
  3. The Apache Camel broker publishes these new messages to the target SNS topic. It uses the Amazon SNS Extended Client Library for Java to store any messages larger than 256 KB in an Amazon Simple Storage Service (Amazon S3) bucket.
  4. Apache Camel stores any message that cannot be delivered to SNS after two retries in an S3 dead letter queue bucket.

The next diagram demonstrates how the solution sends messages back from an SQS queue to IBM MQ:

Solution architecture overview for sending messages

  1. A sample message producer using Lambda sends messages to an SQS queue. It uses the Amazon SQS Extended Client Library for Java to send messages larger than 256 KB.
  2. The Apache Camel broker receives the messages published to SQS, using the SQS Extended Client Library if needed.
  3. The Apache Camel broker sends the message to the IBM MQ target queue.
  4. As before, the broker stores messages that cannot be delivered to IBM MQ in the S3 dead letter queue bucket.

A phased live migration consists of two steps:

  1. Deploy the broker service to allow reading messages from and writing to existing IBM MQ queues.
  2. Once the consumer or producer is migrated, migrate its counterpart to the newly selected service (SNS or SQS).

Next, you will learn how to set up the solution using the AWS Cloud Development Kit (AWS CDK).

Deploying the solution

Prerequisites

  • AWS CDK
  • TypeScript
  • Java
  • Docker
  • Git
  • Yarn

Step 1: Cloning the repository

Clone the repository using git:

git clone https://github.com/aws-samples/aws-ibm-mq-adapter

Step 2: Setting up test IBM MQ credentials

This demo uses IBM MQ’s mutual TLS authentication. To do this, you must generate X.509 certificates and store them in AWS Secrets Manager by running the following commands in the app folder:

  1. Generate X.509 certificates:
    ./deploy.sh generate_secrets
  2. Set up the secrets required for the Apache Camel broker (replace <integration-name> with, for example, dev):
    ./deploy.sh create_secrets broker <integration-name>
  3. Set up secrets for the mock IBM MQ system:
    ./deploy.sh create_secrets mock
  4. Update the cdk.json file with the secrets ARN output from the previous commands:
    • IBM_MOCK_PUBLIC_CERT_ARN
    • IBM_MOCK_PRIVATE_CERT_ARN
    • IBM_MOCK_CLIENT_PUBLIC_CERT_ARN
    • IBMMQ_TRUSTSTORE_ARN
    • IBMMQ_TRUSTSTORE_PASSWORD_ARN
    • IBMMQ_KEYSTORE_ARN
    • IBMMQ_KEYSTORE_PASSWORD_ARN

If you are using your own IBM MQ system and already have X.509 certificates available, you can use the script to upload those certificates to AWS Secrets Manager after running the script.

Step 3: Configuring the broker

The solution deploys two brokers, one to read messages from the test IBM MQ system and one to send messages back. A separate Apache Camel cluster is used per integration to support better use of Auto Scaling functionality and to avoid issues across different integration operations (consuming and reading messages).

Update the cdk.json file with the following values:

  • accountId: AWS account ID to deploy the solution to.
  • region: name of the AWS Region to deploy the solution to.
  • defaultVPCId: specify a VPC ID for an existing VPC in the AWS account where the broker and mock are deployed.
  • allowedPrincipals: add your account ARN (e.g., arn:aws:iam::123456789012:root) to allow this AWS account to send messages to and receive messages from the broker. You can use this parameter to set up cross-account relationships for both SQS and SNS integrations and support multiple consumers and producers.

Step 4: Bootstrapping and deploying the solution

  1. Make sure you have the correct AWS_PROFILE and AWS_REGION environment variables set for your development account.
  2. Run yarn cdk bootstrap –-qualifier mq <aws://<account-id>/<region> to bootstrap CDK.
  3. Run yarn install to install CDK dependencies.
  4. Finally, execute yarn cdk deploy '*-dev' –-qualifier mq --require-approval never to deploy the solution to the dev environment.

Step 5: Testing the integrations

Use AWS System Manager Session Manager and port forwarding to establish tunnels to the test IBM MQ instance to access the web console and send messages manually. For more information on port forwarding, see Amazon EC2 instance port forwarding with AWS System Manager.

  1. In a command line terminal, make sure you have the correct AWS_PROFILE and AWS_REGION environment variables set for your development account.
  2. In addition, set the following environment variables:
    • IBM_ENDPOINT: endpoint for IBM MQ. Example: network load balancer for IBM mock mqmoc-mqada-1234567890.elb.eu-west-1.amazonaws.com.
    • BASTION_ID: instance ID for the bastion host. You can retrieve this output from Step 4: Bootstrapping and deploying the solution listed after the mqBastionStack deployment.

    Use the following command to set the environment variables:

    export IBM_ENDPOINT=mqmoc-mqada-1234567890.elb.eu-west-1.amazonaws.com
    export BASTION_ID=i-0a1b2c3d4e5f67890
  3. Run the script test/connect.sh.
  4. Log in to the IBM web console via https://127.0.0.1:9443/admin using the default IBM user (admin) and the password stored in AWS Secrets Manager as mqAdapterIbmMockAdminPassword.

Sending data from IBM MQ and receiving it in SNS:

  1. In the IBM MQ console, access the local queue manager QM1 and DEV.QUEUE.1.
  2. Send a message with the content Hello AWS. This message will be processed by AWS Fargate and published to SNS.
  3. Access the SQS console and choose the snsIntegrationStack-dev-2 prefix queue. This is an SQS queue subscribed to the SNS topic for testing.
  4. Select Send and receive message.
  5. Select Poll for messages to see the Hello AWS message previously sent to IBM MQ.

Sending data back from Amazon SQS to IBM MQ:

  1. Access the SQS console and choose the queue with the prefix sqsPublishIntegrationStack-dev-3-dev.
  2. Select Send and receive messages.
  3. For Message Body, add Hello from AWS.
  4. Choose Send message.
  5. In the IBM MQ console, access the local queue manager QM1 and DEV.QUEUE.2 to find your message listed under this queue.

Step 6: Cleaning up

Run cdk destroy '*-dev' to destroy the resources deployed as part of this walkthrough.

Conclusion

In this blog, you learned how you can exchange messages between IBM MQ and your cloud applications using Amazon SQS and Amazon SNS.

If you’re interested in getting started with your own integration, follow the README file in the GitHub repository. If you’re migrating existing applications using industry-standard APIs and protocols such as JMS, NMS, or AMQP 1.0, consider integrating with Amazon MQ using the steps provided in the repository.

If you’re interested in running Apache Camel in Kubernetes, you can also adapt the architecture to use Apache Camel K instead.

For more serverless learning resources, visit Serverless Land.

Prime Day 2023 Powered by AWS – All the Numbers

Post Syndicated from Jeff Barr original https://aws.amazon.com/blogs/aws/prime-day-2023-powered-by-aws-all-the-numbers/

As part of my annual tradition to tell you about how AWS makes Prime Day possible, I am happy to be able to share some chart-topping metrics (check out my 2016, 2017, 2019, 2020, 2021, and 2022 posts for a look back).

This year I bought all kinds of stuff for my hobbies including a small drill press, filament for my 3D printer, and irrigation tools. I also bought some very nice Alphablock books for my grandkids. According to our official release, the first day of Prime Day was the single largest sales day ever on Amazon and for independent sellers, with more than 375 million items purchased.

Prime Day by the Numbers
As always, Prime Day was powered by AWS. Here are some of the most interesting and/or mind-blowing metrics:

Amazon Elastic Block Store (Amazon EBS) – The Amazon Prime Day event resulted in an incremental 163 petabytes of EBS storage capacity allocated – generating a peak of 15.35 trillion requests and 764 petabytes of data transfer per day. Compared to the previous year, Amazon increased the peak usage on EBS by only 7% Year-over-Year yet delivered +35% more traffic per day due to efficiency efforts including workload optimization using Amazon Elastic Compute Cloud (Amazon EC2) AWS Graviton-based instances. Here’s a visual comparison:

AWS CloudTrail – AWS CloudTrail processed over 830 billion events in support of Prime Day 2023.

Amazon DynamoDB – DynamoDB powers multiple high-traffic Amazon properties and systems including Alexa, the Amazon.com sites, and all Amazon fulfillment centers. Over the course of Prime Day, these sources made trillions of calls to the DynamoDB API. DynamoDB maintained high availability while delivering single-digit millisecond responses and peaking at 126 million requests per second.

Amazon Aurora – On Prime Day, 5,835 database instances running the PostgreSQL-compatible and MySQL-compatible editions of Amazon Aurora processed 318 billion transactions, stored 2,140 terabytes of data, and transferred 836 terabytes of data.

Amazon Simple Email Service (SES) – Amazon SES sent 56% more emails for Amazon.com during Prime Day 2023 vs. 2022, delivering 99.8% of those emails to customers.

Amazon CloudFront – Amazon CloudFront handled a peak load of over 500 million HTTP requests per minute, for a total of over 1 trillion HTTP requests during Prime Day.

Amazon SQS – During Prime Day, Amazon SQS set a new traffic record by processing 86 million messages per second at peak. This is 22% increase from Prime Day of 2022, where SQS supported 70.5M messages/sec.

Amazon Elastic Compute Cloud (EC2) – During Prime Day 2023, Amazon used tens of millions of normalized AWS Graviton-based Amazon EC2 instances, 2.7x more than in 2022, to power over 2,600 services. By using more Graviton-based instances, Amazon was able to get the compute capacity needed while using up to 60% less energy.

Amazon Pinpoint – Amazon Pinpoint sent tens of millions of SMS messages to customers during Prime Day 2023 with a delivery success rate of 98.3%.

Prepare to Scale
Every year I reiterate the same message: rigorous preparation is key to the success of Prime Day and our other large-scale events. If you are preparing for a similar chart-topping event of your own, I strongly recommend that you take advantage of AWS Infrastructure Event Management (IEM). As part of an IEM engagement, my colleagues will provide you with architectural and operational guidance that will help you to execute your event with confidence!

Jeff;

Improving medical imaging workflows with AWS HealthImaging and SageMaker

Post Syndicated from Sukhomoy Basak original https://aws.amazon.com/blogs/architecture/improving-medical-imaging-workflows-with-aws-healthimaging-and-sagemaker/

Medical imaging plays a critical role in patient diagnosis and treatment planning in healthcare. However, healthcare providers face several challenges when it comes to managing, storing, and analyzing medical images. The process can be time-consuming, error-prone, and costly.

There’s also a radiologist shortage across regions and healthcare systems, making the demand for this specialty increases due to an aging population, advances in imaging technology, and the growing importance of diagnostic imaging in healthcare.

As the demand for imaging studies continues to rise, the limited number of available radiologists results in delays in available appointments and timely diagnoses. And while technology enables healthcare delivery improvements for clinicians and patients, hospitals seek additional tools to solve their most pressing challenges, including:

  • Professional burnout due to an increasing demand for imaging and diagnostic services
  • Labor-intensive tasks, such as volume measurement or structural segmentation of images
  • Increasing expectations from patients expecting high-quality healthcare experiences that match retail and technology in terms of convenience, ease, and personalization

To improve clinician and patient experiences, run your picture archiving and communication system (PACS) with an artificial intelligence (AI)-enabled diagnostic imaging cloud solution to securely gain critical insights and improve access to care.

AI helps reduce the radiologist burndown rate through automation. For example, AI saves radiologist chest x-ray interpretation time. It is also a powerful tool to identify areas that need closer inspection, and helps capture secondary findings that weren’t initially identified. The advancement of interoperability and analytics gives radiologist a 360-degree, longitudinal view of patient health records to provide better healthcare at potentially lower costs.

AWS offers services to address these challenges. This blog post discusses AWS HealthImaging (AWS AHI) and Amazon SageMaker, and how they are used together to improve healthcare providers’ medical imaging workflows. This ultimately accelerates imaging diagnostics and increases radiology productivity. AWS AHI enables developers to deliver performance, security, and scale to cloud-native medical imaging applications. It allows ingestion of Digital Imaging and Communication in Medicine (DICOM) images. Amazon SageMaker provides end-to-end solution for AI and machine learning.

Let’s explore an example use case involving X-rays after an auto accident. In this diagnostic medical imaging workflow, a patient is in the emergency room. From there:

  • The patient undergoes an X-ray to check for fractures.
  • The scanned acquisition device images flow to the PACS system.
  • The radiologist reviews the information gathered from this procedure and authors the report.
  • The patient workflow continues as the reports are made available to the referring physician.

Next-generation imaging solutions and workflows

Healthcare providers can use AWS AHI and Amazon SageMaker together to enable next-generation imaging solutions and improve medical imaging workflows. The following architecture illustrates this example.

X-ray images are sent to AWS HealthImaging and an Amazon SageMaker endpoint extracts insights.

Figure 1: X-ray images are sent to AWS HealthImaging and an Amazon SageMaker endpoint extracts insights.

Let’s review the architecture and the key components:

1. Imaging Scanner: Captures the images from a patient’s body. Depending on the modality, this can be an X-ray detector; a series of detectors in a CT scanner; a magnetic field and radio frequency coils in an MRI scanner; or an ultrasound transducer. This example uses an X-ray device.

2. Amazon SQS message queue: Consumes event from S3 bucket and triggers an AWS Step Functions workflow orchestration.

3. AWS Step Functions runs the transform and import jobs to further process and import the images into AWS AHI data store instance.

4. The final diagnostic image—along with any relevant patient information and metadata—is stored in the AWS AHI datastore. This allows for efficient imaging date retrieval and management. It also enables medical imaging data access with sub-second image retrieval latencies at scale, powered by cloud-native APIs and applications from AWS partners.

5. Radiologists responsible for ground truth for ML images perform medical image annotations using Amazon SageMaker Ground Truth. They visualize and label DICOM images using a custom data labeling workflow—a fully managed data labeling service that supports built-in or custom data labeling workflows. They also leverage tools like 3D Slicer for interactive medical image annotations.

6. Data scientists build or leverage built-in deep learning models using the annotated images on Amazon SageMaker. SageMaker offers a range of deployment options that vary from low latency and high throughput to long-running inference jobs. These options include considerations for batch, real-time, or near real-time inference.

7. Healthcare providers use AWS AHI and Amazon SageMaker to run AI-assisted detection and interpretation workflow. This workflow is used to identify hard-to-see fractures, dislocations, or soft tissue injuries to allow surgeons and radiologist to be more confident in their treatment choices.

8. Finally, the image stored in AWS AHI is displayed on a monitor or other visual output device where it can be analyzed and interpreted by a radiologist or other medical professional.

  • The Open Health Imaging Foundation (OHIF) Viewer is an open source, web-based, medical imaging platform. It provides a core framework for building complex imaging applications.
  • Radical Imaging or Arterys are AWS partners that provide OHIF-based medical imaging viewer.

Each of these components plays a critical role in the overall performance and accuracy of the medical imaging system as well as ongoing research and development focused on improving diagnostic outcomes and patient care. AWS AHI uses efficient metadata encoding, lossless compression, and progressive resolution data access to provide industry leading performance for loading images. Efficient metadata encoding enables image viewers and AI algorithms to understand the contents of a DICOM study without having to load the image data.

Security

The AWS shared responsibility model applies to data protection in AWS AHI and Amazon SageMaker.

Amazon SageMaker is HIPAA-eligible and can operate with data containing Protected Health Information (PHI). Encryption of data in transit is provided by SSL/TLS and is used when communicating both with the front-end interface of Amazon SageMaker (to the Notebook) and whenever Amazon SageMaker interacts with any other AWS services.

AWS AHI is also HIPAA-eligible service and provides access control at the metadata level, ensuring that each user and application can only see the images and metadata fields that are required based upon their role. This prevents the proliferation of Patient PHI. All access to AWS AHI APIs is logged in detail in AWS CloudTrail.

Both of these services leverage AWS Key Management service (AWS KMS) to satisfy the requirement that PHI data is encrypted at rest.

Conclusion

In this post, we reviewed a common use case for early detection and treatment of conditions, resulting in better patient outcomes. We also covered an architecture that can transform the radiology field by leveraging the power of technology to improve accuracy, efficiency, and accessibility of medical imaging.

Further reading

Best practices for implementing event-driven architectures in your organization

Post Syndicated from Emanuele Levi original https://aws.amazon.com/blogs/architecture/best-practices-for-implementing-event-driven-architectures-in-your-organization/

Event-driven architectures (EDA) are made up of components that detect business actions and changes in state, and encode this information in event notifications. Event-driven patterns are becoming more widespread in modern architectures because:

  • they are the main invocation mechanism in serverless patterns.
  • they are the preferred pattern for decoupling microservices, where asynchronous communications and event persistence are paramount.
  • they are widely adopted as a loose-coupling mechanism between systems in different business domains, such as third-party or on-premises systems.

Event-driven patterns have the advantage of enabling team independence through the decoupling and decentralization of responsibilities. This decentralization trend in turn, permits companies to move with unprecedented agility, enhancing feature development velocity.

In this blog, we’ll explore the crucial components and architectural decisions you should consider when adopting event-driven patterns, and provide some guidance on organizational structures.

Division of responsibilities

The communications flow in EDA (see What is EDA?) is initiated by the occurrence of an event. Most production-grade event-driven implementations have three main components, as shown in Figure 1: producers, message brokers, and consumers.

Three main components of an event-driven architecture

Figure 1. Three main components of an event-driven architecture

Producers, message brokers, and consumers typically assume the following roles:

Producers

Producers are responsible for publishing the events as they happen. They are the owners of the event schema (data structure) and semantics (meaning of the fields, such as the meaning of the value of an enum field). As this is the only contract (coupling) between producers and the downstream components of the system, the schema and its semantics are crucial in EDA. Producers are responsible for implementing a change management process, which involves both non-breaking and breaking changes. With introduction of breaking changes, consumers are able to negotiate the migration process with producers.

Producers are “consumer agnostic”, as their boundary of responsibility ends when an event is published.

Message brokers

Message brokers are responsible for the durability of the events, and will keep an event available for consumption until it is successfully processed. Message brokers ensure that producers are able to publish events for consumers to consume, and they regulate access and permissions to publish and consume messages.

Message brokers are largely “events agnostic”, and do not generally access or interpret the event content. However, some systems provide a routing mechanism based on the event payload or metadata.

Consumers

Consumers are responsible for consuming events, and own the semantics of the effect of events. Consumers are usually bounded to one business context. This means the same event will have different effect semantics for different consumers. Crucial architectural choices when implementing a consumer involve the handling of unsuccessful message deliveries or duplicate messages. Depending on the business interpretation of the event, when recovering from failure a consumer might permit duplicate events, such as with an idempotent consumer pattern.

Crucially, consumers are “producer agnostic”, and their boundary of responsibility begins when an event is ready for consumption. This allows new consumers to onboard into the system without changing the producer contracts.

Team independence

In order to enforce the division of responsibilities, companies should organize their technical teams by ownership of producers, message brokers, and consumers. Although the ownership of producers and consumers is straightforward in an EDA implementation, the ownership of the message broker may not be. Different approaches can be taken to identify message broker ownership depending on your organizational structure.

Decentralized ownership

Ownership of the message broker in a decentralized ownership organizational structure

Figure 2. Ownership of the message broker in a decentralized ownership organizational structure

In a decentralized ownership organizational structure (see Figure 2), the teams producing events are responsible for managing their own message brokers and the durability and availability of the events for consumers.

The adoption of topic fanout patterns based on Amazon Simple Queue Service (SQS) and Amazon Simple Notification Service (SNS) (see Figure 3), can help companies implement a decentralized ownership pattern. A bus-based pattern using Amazon EventBridge can also be similarly utilized (see Figure 4).

Topic fanout pattern based on Amazon SQS and Amazon SNS

Figure 3. Topic fanout pattern based on Amazon SQS and Amazon SNS

Events bus pattern based on Amazon EventBridge

Figure 4. Events bus pattern based on Amazon EventBridge

The decentralized ownership approach has the advantage of promoting team independence, but it is not a fit for every organization. In order to be implemented effectively, a well-established DevOps culture is necessary. In this scenario, the producing teams are responsible for managing the message broker infrastructure and the non-functional requirements standards.

Centralized ownership

Ownership of the message broker in a centralized ownership organizational structure

Figure 5. Ownership of the message broker in a centralized ownership organizational structure

In a centralized ownership organizational structure, a central team (we’ll call it the platform team) is responsible for the management of the message broker (see Figure 5). Having a specialized platform team offers the advantage of standardized implementation of non-functional requirements, such as reliability, availability, and security. One disadvantage is that the platform team is a single point of failure in both the development and deployment lifecycle. This could become a bottleneck and put team independence and operational efficiency at risk.

Streaming pattern based on Amazon MSK and Kinesis Data Streams

Figure 6. Streaming pattern based on Amazon MSK and Kinesis Data Streams

On top of the implementation patterns mentioned in the previous section, the presence of a dedicated team makes it easier to implement streaming patterns. In this case, a deeper understanding on how the data is partitioned and how the system scales is required. Streaming patterns can be implemented using services such as Amazon Managed Streaming for Apache Kafka (MSK) or Amazon Kinesis Data Streams (see Figure 6).

Best practices for implementing event-driven architectures in your organization

The centralized and decentralized ownership organizational structures enhance team independence or standardization of non-functional requirements respectively. However, they introduce possible limits to the growth of the engineering function in a company. Inspired by the two approaches, you can implement a set of best practices which are aimed at minimizing those limitations.

Best practices for implementing event-driven architectures

Figure 7. Best practices for implementing event-driven architectures

  1. Introduce a cloud center of excellence (CCoE). A CCoE standardizes non-functional implementation across engineering teams. In order to promote a strong DevOps culture, the CCoE should not take the form of an external independent team, but rather be a collection of individual members representing the various engineering teams.
  2. Decentralize team ownership. Decentralize ownership and maintenance of the message broker to producing teams. This will maximize team independence and agility. It empowers the team to use the right tool for the right job, as long as they conform to the CCoE guidelines.
  3. Centralize logging standards and observability strategies. Although it is a best practice to decentralize team ownership of the components of an event-driven architecture, logging standards and observability strategies should be centralized and standardized across the engineering function. This centralization provides for end-to-end tracing of requests and events, which are powerful diagnosis tools in case of any failure.

Conclusion

In this post, we have described the main architectural components of an event-driven architecture, and identified the ownership of the message broker as one of the most important architectural choices you can make. We have described a centralized and decentralized organizational approach, presenting the strengths of the two approaches, as well as the limits they impose on the growth of your engineering organization. We have provided some best practices you can implement in your organization to minimize these limitations.

Further reading:
To start your journey building event-driven architectures in AWS, explore the following:

Detecting and stopping recursive loops in AWS Lambda functions

Post Syndicated from Julian Wood original https://aws.amazon.com/blogs/compute/detecting-and-stopping-recursive-loops-in-aws-lambda-functions/

This post is written by Pawan Puthran, Principal Serverless Specialist TAM, Aneel Murari, Senior Serverless Specialist Solution Architect, and Shree Shrikhande, Senior AWS Lambda Product Manager.

AWS Lambda is announcing a recursion control to detect and stop Lambda functions running in a recursive or infinite loop.

At launch, this feature is available for Lambda integrations with Amazon Simple Queue Service (Amazon SQS), Amazon SNS, or when invoking functions directly using the Lambda invoke API. Lambda now detects functions that appear to be running in a recursive loop and drops requests after exceeding 16 invocations.

This can help reduce costs from unexpected Lambda function invocations because of recursion. You receive notifications about this action through the AWS Health Dashboard, email, or by configuring Amazon CloudWatch Alarms.

Overview

You can invoke Lambda functions in multiple ways. AWS services generate events that invoke Lambda functions, and Lambda functions can send messages to other AWS services. In most architectures, the service or resource that invokes a Lambda function should be different from the service or resource that the function outputs to. Because of misconfiguration or coding bugs, a function can send a processed event to the same service or resource that invokes the Lambda function, causing a recursive loop.

Lambda now detects the function running in a recursive loop between supported services, after exceeding 16 invocations. It returns a RecursiveInvocationException to the caller. There is no additional charge for this feature. For asynchronous invokes, Lambda sends the event to a dead-letter queue or on-failure destination, if one is configured.

The following is an example of an order processing system.

Image processing system

Order processing system

  1. A new order information message is sent to the source SQS queue.
  2. Lambda consumes the message from the source queue using an ESM.
  3. The Lambda function processes the message and sends the updated orders message to a destination SQS queue using the SQS SendMessage API.
  4. The source queue has a dead-letter queue(DLQ) configured for handling any failed or unprocessed messages.
  5. Because of a misconfiguration, the Lambda function sends the message to the source SQS queue instead of the destination queue. This causes a recursive loop of Lambda function invocations.

To explore sample code for this example, see the GitHub repo.

In the preceding example, after 16 invocations, Lambda throws a RecursiveInvocationException to the ESM. The ESM stops invoking the Lambda function and, once the maxReceiveCount is exceeded, SQS moves the message to the source queues configured DLQ.

You receive an AWS Health Dashboard notification with steps to troubleshoot the function.

AWS Health Dashboard notification

AWS Health Dashboard notification

You also receive an email notification to the registered email address on the account.

Email notification

Email notification

Lambda emits a RecursiveInvocationsDropped CloudWatch metric, which you can view in the CloudWatch console.

RecursiveInvocationsDropped CloudWatch metric

RecursiveInvocationsDropped CloudWatch metric

How does Lambda detect recursion?

For Lambda to detect recursive loops, your function must use one of the supported AWS SDK versions or higher.

Lambda uses an AWS X-Ray trace header primitive called “Lineage” to track the number of times a function has been invoked with an event. When your function code sends an event using a supported AWS SDK version, Lambda increments the counter in the lineage header. If your function is then invoked with the same triggering event more than 16 times, Lambda stops the next invocation for that event. You do not need to configure active X-Ray tracing for this feature to work.

An example lineage header looks like:

X-Amzn-Trace-Id:Root=1-645f7998-4b1e232810b0bb733dba2eab;Parent=5be88d12eefc1fc0;Sampled=1;Lineage=43e12f0f:5

43e12f0f is the hash of a resource, in this case a Lambda function. 5 is the number of times this function has been invoked with the same event. The logic of hash generation, encoding, and size of the lineage header may change in the future. You should not design any application functionality based on this.

When using an ESM to consume messages from SQS, after the maxReceiveCount value is exceeded, the message is sent to the source queue’s configured DLQ. When Lambda detects a recursive loop and drops subsequent invocations, it returns a RecursiveInvocationException to the ESM. This increments the maxReceiveCount value. When the ESM auto retries to process events, based on the error handling configuration, these retries are not considered recursive invocations.

When using SQS, you can also batch multiple messages into one Lambda event. Where the message batch size is greater than 1, Lambda uses the maximum lineage value within the batch of messages. It drops the entire batch if the value exceeds 16.

Recursion detection in action

You can deploy a sample application example in the GitHub repo to test Lambda recursive loop detection. The application includes a Lambda function that reads from an SQS queue and writes messages back to the same SQS queue.

As prerequisites, you must install:

To deploy the application:

    1. Set your AWS Region:
export REGION=<your AWS region>
    1. Clone the GitHub repository
git clone https://github.com/aws-samples/aws-lambda-recursion-detection-sample.git
cd aws-lambda-recursion-detection-sample
    1. Use AWS SAM to build and deploy the resources to your AWS account. Enter a stack name, such as lambda-recursion, when prompted. Accept the remaining default values.
sam build –-use-container
sam deploy --guided --region $REGION

To test the application:

    1. Save the name of the SQS queue in a local environment variable:
SOURCE_SQS_URL=$(aws cloudformation describe-stacks \ --region $REGION \ --stack-name lambda-recursion \ --query 'Stacks[0].Outputs[?OutputKey==`SourceSQSqueueURL`].OutputValue' --output text)
  1. Publish a message to the source SQS queue:
aws sqs send-message --queue-url $SOURCE_SQS_URL --message-body '{"orderId":"111","productName":"Bolt","orderStatus":"Submitted"}' --region $REGION

This invokes the Lambda function, which writes the message back to the queue.

To verify that Lambda has detected the recursion:

  1. Navigate to the CloudWatch console. Choose All Metrics under Metrics in the left-hand panel and search for RecursiveInvocationsDropped.

    Find RecursiveInvocationsDropped.

    Find RecursiveInvocationsDropped.

  2. Choose Lambda > By Function Name and choose RecursiveInvocationsDropped for the function you created. Under Graphed metrics, change the statistic to sum and Period to 1 minute. You see one record. Refresh if you don’t see the metric after a few seconds.
Metrics sum view

Metrics sum view

Actions to take when Lambda stops a recursive loop

When you receive a notification regarding recursion in your account, the following steps can help address the issue.

  • To stop further invoke attempts while you fix the underlying configuration issue, set the function concurrency to 0. This acts as an off switch for the Lambda function. You can choose the “Throttle” button in the Lambda console or use the PutFunctionConcurrency API to set the function concurrency to 0.
  • You can also disable or delete the event source mapping or trigger for the Lambda function.
  • Check your Lambda function code and configuration for any code defects that create loops. For example, check your environment variables to ensure you are not using the same SQS queue or SNS topic as source and target.
  • If an SQS Queue is the event source for your Lambda function, configure a DLQ on the source queue.
  • If an SNS topic is the event source, configure an On-Failure Destination for the Lambda function.

Disabling recursion detection

You may have valid use-cases where Lambda recursion is intentional as part of your design. In this case, use caution and implement suitable guardrails to prevent unexpected charges to your account. To learn more about best practices for using recursive invocation patterns, see Recursive patterns that cause run-away Lambda functions in the AWS Lambda Operator Guide.

This feature is turned on by default to stop recursive loops. To request turning it off for your account, reach out to AWS Support.

Conclusion

Lambda recursion control for SQS and SNS automatically detects and stops functions running in a recursive or infinite loop. This can be due to misconfiguration or coding errors. Recursion control helps reduce unexpected usage with Lambda and downstream services. The post also explains how Lambda detects and stops recursive loops and notifies you through AWS Health Dashboard to troubleshoot the function.

To learn more about the feature, visit the AWS Lambda Developer Guide.

For more serverless learning resources, visit Serverless Land

Implementing AWS Lambda error handling patterns

Post Syndicated from Julian Wood original https://aws.amazon.com/blogs/compute/implementing-aws-lambda-error-handling-patterns/

This post is written by Jeff Chen, Principal Cloud Application Architect, and Jeff Li, Senior Cloud Application Architect

Event-driven architectures are an architecture style that can help you boost agility and build reliable, scalable applications. Splitting an application into loosely coupled services can help each service scale independently. A distributed, loosely coupled application depends on events to communicate application change states. Each service consumes events from other services and emits events to notify other services of state changes.

Handling errors becomes even more important when designing distributed applications. A service may fail if it cannot handle an invalid payload, dependent resources may be unavailable, or the service may time out. There may be permission errors that can cause failures. AWS services provide many features to handle error conditions, which you can use to improve the resiliency of your applications.

This post explores three use-cases and design patterns for handling failures.

Overview

AWS Lambda, Amazon Simple Queue Service (Amazon SQS), Amazon Simple Notification Service (Amazon SNS), and Amazon EventBridge are core building blocks for building serverless event-driven applications.

The post Understanding the Different Ways to Invoke Lambda Functions lists the three different ways of invoking a Lambda function: synchronous, asynchronous, and poll-based invocation. For a list of services and which invocation method they use, see the documentation.

Lambda’s integration with Amazon API Gateway is an example of a synchronous invocation. A client makes a request to API Gateway, which sends the request to Lambda. API Gateway waits for the function response and returns the response to the client. There are no built-in retries or error handling. If the request fails, the client attempts the request again.

Lambda’s integration with SNS and EventBridge are examples of asynchronous invocations. SNS, for example, sends an event to Lambda for processing. When Lambda receives the event, it places it on an internal event queue and returns an acknowledgment to SNS that it has received the message. Another Lambda process reads events from the internal queue and invokes your Lambda function. If SNS cannot deliver an event to your Lambda function, the service automatically retries the same operation based on a retry policy.

Lambda’s integration with SQS uses poll-based invocations. Lambda runs a fleet of pollers that poll your SQS queue for messages. The pollers read the messages in batches and invoke your Lambda function once per batch.

You can apply this pattern in many scenarios. For example, your operational application can add sales orders to an operational data store. You may then want to load the sales orders to your data warehouse periodically so that the information is available for forecasting and analysis. The operational application can batch completed sales as events and place them on an SQS queue. A Lambda function can then process the events and load the completed sale records into your data warehouse.

If your function processes the batch successfully, the pollers delete the messages from the SQS queue. If the batch is not successfully processed, the pollers do not delete the messages from the queue. Once the visibility timeout expires, the messages are available again to be reprocessed. If the message retention period expires, SQS deletes the message from the queue.

The following table shows the invocation types and retry behavior of the AWS services mentioned.

AWS service example Invocation type Retry behavior
Amazon API Gateway Synchronous No built-in retry, client attempts retries.

Amazon SNS

Amazon EventBridge

Asynchronous Built-in retries with exponential backoff.
Amazon SQS Poll-based Retries after visibility timeout expires until message retention period expires.

There are a number of design patterns to use for poll-based and asynchronous invocation types to retain failed messages for additional processing. These patterns can help you recover from delivery or processing failures.

You can explore the patterns and test the scenarios by deploying the code from this repository which uses the AWS Cloud Development Kit (AWS CDK) using Python.

Lambda poll-based invocation pattern

When using Lambda with SQS, if Lambda isn’t able to process the message and the message retention period expires, SQS drops the message. Failure to process the message can be due to function processing failures, including time-outs or invalid payloads. Processing failures can also occur when the destination function does not exist, or has incorrect permissions.

You can configure a separate dead-letter queue (DLQ) on the source queue for SQS to retain the dropped message. A DLQ preserves the original message and is useful for analyzing root causes, handling error conditions properly, or sending notifications that require manual interventions. In the poll-based invocation scenario, the Lambda function itself does not maintain a DLQ. It relies on the external DLQ configured in SQS. For more information, see Using Lambda with Amazon SQS.

The following shows the design pattern when you configure Lambda to poll events from an SQS queue and invoke a Lambda function.

Lambda synchronously polling catches of messages from SQS

Lambda synchronously polling batches of messages from SQS

To explore this pattern, deploy the code in this repository. Once deployed, you can use this instruction to test the pattern with the happy and unhappy paths.

Lambda asynchronous invocation pattern

With asynchronous invokes, there are two failure aspects to consider when using Lambda. The event source cannot deliver the message to Lambda and the Lambda function errors when processing the event.

Event sources vary in how they handle failures delivering messages to Lambda. If SNS or EventBridge cannot send the event to Lambda after exhausting all their retry attempts, the service drops the event. You can configure a DLQ on an SNS topic or EventBridge event bus to hold the dropped event. This works in the same way as the poll-based invocation pattern with SQS.

Lambda functions may then error due to input payload syntax errors, duration time-outs, or the function throws an exception such as a data resource not available.

For asynchronous invokes, you can configure how long Lambda retains an event in its internal queue, up to 6 hours. You can also configure how many times Lambda retries when the function errors, between 0 and 2. Lambda discards the event when the maximum age passes or all retry attempts fail. To retain a copy of discarded events, you can configure either a DLQ or, preferably, a failed-event destination as part of your Lambda function configuration.

A Lambda destination enables you to specify what to do next if an asynchronous invocation succeeds or fails. You can configure a destination to send invocation records to SQS, SNS, EventBridge, or another Lambda function. Destinations are preferred for failure processing as they support additional targets and include additional information. A DLQ holds the original failed event. With a destination, Lambda also passes details of the function’s response in the invocation record. This includes stack traces, which can be useful for analyzing the root cause.

Using both a DLQ and Lambda destinations

You can apply this pattern in many scenarios. For example, many of your applications may contain customer records. To comply with the California Consumer Privacy Act (CCPA), different organizations may need to delete records for a particular customer. You can set up a consumer delete SNS topic. Each organization creates a Lambda function, which processes the events published by the SNS topic and deletes customer records in its managed applications.

The following shows the design pattern when you configure an SNS topic as the event source for a Lambda function, which uses destination queues for success and failure process.

SNS topic as event source for Lambda

SNS topic as event source for Lambda

You configure a DLQ on the SNS topic to capture messages that SNS cannot deliver to Lambda. When Lambda invokes the function, it sends details of the successfully processed messages to an on-success SQS destination. You can use this pattern to route an event to multiple services for simpler use cases. For orchestrating multiple services, AWS Step Functions is a better design choice.

Lambda can also send details of unsuccessfully processed messages to an on-failure SQS destination.

A variant of this pattern is to replace an SQS destination with an EventBridge destination so that multiple consumers can process an event based on the destination.

To explore how to use an SQS DLQ and Lambda destinations, deploy the code in this repository. Once deployed, you can use this instruction to test the pattern with the happy and unhappy paths.

Using a DLQ

Although destinations is the preferred method to handle function failures, you can explore using DLQs.

The following shows the design pattern when you configure an SNS topic as the event source for a Lambda function, which uses SQS queues for failure process.

Lambda invoked asynchonously

Lambda invoked asynchonously

You configure a DLQ on the SNS topic to capture the messages that SNS cannot deliver to the Lambda function. You also configure a separate DLQ for the Lambda function. Lambda saves an unsuccessful event to this DLQ after Lambda cannot process the event after maximum retry attempts.

To explore how to use a Lambda DLQ, deploy the code in this repository. Once deployed, you can use this instruction to test the pattern with happy and unhappy paths.

Conclusion

This post explains three patterns that you can use to design resilient event-driven serverless applications. Error handling during event processing is an important part of designing serverless cloud applications.

You can deploy the code from the repository to explore how to use poll-based and asynchronous invocations. See how poll-based invocations can send failed messages to a DLQ. See how to use DLQs and Lambda destinations to route and handle unsuccessful events.

Learn more about event-driven architecture on Serverless Land.

Implementing AWS Well-Architected best practices for Amazon SQS – Part 3

Post Syndicated from Pascal Vogel original https://aws.amazon.com/blogs/compute/implementing-aws-well-architected-best-practices-for-amazon-sqs-part-3/

This blog is written by Chetan Makvana, Senior Solutions Architect and Hardik Vasa, Senior Solutions Architect.

This is the third part of a three-part blog post series that demonstrates best practices for Amazon Simple Queue Service (Amazon SQS) using the AWS Well-Architected Framework.

This blog post covers best practices using the Performance Efficiency Pillar, Cost Optimization Pillar, and Sustainability Pillar. The inventory management example introduced in part 1 of the series will continue to serve as an example.

See also the other two parts of the series:

Performance Efficiency Pillar

The Performance Efficiency Pillar includes the ability to use computing resources efficiently to meet system requirements, and to maintain that efficiency as demand changes and technologies evolve. It recommends best practices to use trade-offs to improve performance, such as learning about design patterns and services and identify how tradeoffs impact customers and efficiency.

By adopting these best practices, you can optimize the performance of SQS by employing appropriate configurations and techniques while considering trade-offs for the specific use case.

Best practice: Use action batching or horizontal scaling or both to increase throughput

For achieving high throughput in SQS, optimizing the performance of your message processing is crucial. You can use two techniques: horizontal scaling and action batching.

When dealing with high message volume, consider horizontally scaling the message producers and consumers by increasing the number of threads per client, by adding more clients, or both. By distributing the load across multiple threads or clients, you can handle a high number of messages concurrently.

Action batching distributes the latency of the batch action over the multiple messages in a batch request, rather than accepting the entire latency for a single message. Because each round trip carries more work, batch requests make more efficient use of threads and connections, improving throughput. You can combine batching with horizontal scaling to provide throughput with fewer threads, connections, and requests than individual message requests.

In the inventory management example that we introduced in part 1, this scaling behavior is managed by AWS for the AWS Lambda function responsible for backend processing. When a Lambda function subscribes to an SQS queue, Lambda polls the queue as it waits for the inventory updates requests to arrive. Lambda consumes messages in batches, starting at five concurrent batches with five functions at a time. If there are more messages in the queue, Lambda adds up to 60 functions per minute, up to 1,000 functions, to consume those messages.

This means that Lambda can scale up to 1,000 concurrent Lambda functions processing messages from the SQS queue. Batching enables the inventory management system to handle a high volume of inventory update messages efficiently. This ensures real-time visibility into inventory levels and enhances the accuracy and responsiveness of inventory management operations.

Best practice: Trade-off between SQS standard and First-In-First-Out (FIFO) queues

SQS supports two types of queues: standard queues and FIFO queues. Understanding the trade-offs between SQS standard and FIFO queues allows you to make an informed choice that aligns with your application’s requirements and priorities. While SQS standard queues support a nearly unlimited throughput, it sacrifices strict message ordering and occasionally delivers messages in an order different from the one they were sent in. If maintaining the exact order of events is not critical for your application, utilizing SQS standard queues can provide significant benefits in terms of throughput and scalability.

On the other hand, SQS FIFO queues guarantee message ordering and exactly-once processing. This makes them suitable for applications where maintaining the order of events is crucial, such as financial transactions or event-driven workflows. However, FIFO queues have a lower throughput compared to standard queues. They can handle up to 3,000 transactions per second (TPS) per API method with batching, and 300 TPS without batching. Consider using FIFO queues only when the order of events is important for the application, otherwise use standard queues.

In the inventory management example, since the order of inventory records is not crucial, the potential out-of-order message delivery that can occur with SQS standard queues is unlikely to impact the inventory processing. This allows you to take advantage of the benefits provided by SQS standard queues, including their ability to handle a high number of transactions per second.

Cost Optimization Pillar

The Cost Optimization Pillar includes the ability to run systems to deliver business value at the lowest price. It recommends best practices to build and operate cost-aware workloads that achieve business outcomes while minimizing costs and allowing your organization to maximize its return on investment.

Best practice: Configure cost allocation tags for SQS to organize and identify SQS for cost allocation

A well-defined tagging strategy plays a vital role in establishing accurate chargeback or showback models. By assigning appropriate tags to resources, such as SQS queues, you can precisely allocate costs to different teams or applications. This level of granularity ensures fair and transparent cost allocation, enabling better financial management and accountability.

In the inventory management example, tagging the SQS queue allows for specific cost tracking under the Inventory department, enabling a more accurate assessment of expenses. The following code snippet shows how to tag the SQS queue using AWS Could Development Kit (AWS CDK).

# Create the SQS queue with DLQ setting
queue = sqs.Queue(
    self,
    "InventoryUpdatesQueue",
    visibility_timeout=Duration.seconds(300),
)

Tags.of(queue).add("department", "inventory")

Best practice: Use long polling

SQS offers two methods for receiving messages from a queue: short polling and long polling. By default, queues use short polling, where the ReceiveMessage request queries a subset of servers to identify available messages. Even if the query found no messages, SQS sends the response right away.

In contrast, long polling queries all servers in the SQS infrastructure to check for available messages. SQS responds only after collecting at least one message, respecting the specified maximum. If no messages are immediately available, the request is held open until a message becomes available or the polling wait time expires. In such cases, an empty response is sent.

Short polling provides immediate responses, making it suitable for applications that require quick feedback or near-real-time processing. On the other hand, long polling is ideal when efficiency is prioritized over immediate feedback. It reduces API calls, minimizes network traffic, and improves resource utilization, leading to cost savings.

In the inventory management example, long polling enhances the efficiency of processing inventory updates. It collects and retrieves available inventory update messages in a batch of 10, reducing the frequency of API requests. This batching approach optimizes resource utilization, minimizes network traffic, and reduces excessive API consumption, resulting in cost savings. You can configure this behavior using batch size and batch window:

# Add the SQS queue as a trigger to the Lambda function
sqs_to_dynamodb_function.add_event_source_mapping(
    "MyQueueTrigger", event_source_arn=queue.queue_arn, batch_size=10
)

Best practice: Use batching

Batching messages together allows you to send or retrieve multiple messages in a single API call. This reduces the number of API requests required to process or retrieve messages compared to sending or retrieving messages individually. Since SQS pricing is based on the number of API requests, reducing the number of requests can lead to cost savings.

To send, receive, and delete messages, and to change the message visibility timeout for multiple messages with a single action, use Amazon SQS batch API actions. This also helps with transferring less data, effectively reducing the associated data transfer costs, especially if you have many messages.

In the context of the inventory management example, the CSV processing Lambda function groups 10 inventory records together in each API call, forming a batch. By doing so, the number of API requests is reduced by a factor of 10 compared to sending each record separately. This approach optimizes the utilization of API resources, streamlines message processing, and ultimately contributes to cost efficiency. Following is the code snippet from the CSV processing Lambda function showcasing the use of SendMessageBatch to send 10 messages with a single action.

# Parse the CSV records and send them to SQS as batch messages
csv_reader = csv.DictReader(csv_content.splitlines())
message_batch = []
for row in csv_reader:
    # Convert the row to JSON
    json_message = json.dumps(row)

    # Add the message to the batch
    message_batch.append(
        {"Id": str(len(message_batch) + 1), "MessageBody": json_message}
    )

    # Send the batch of messages when it reaches the maximum batch size (10 messages)
    if len(message_batch) == 10:
        sqs_client.send_message_batch(QueueUrl=queue_url, Entries=message_batch)
        message_batch = []
        print("Sent messages in batch")

Best practice: Use temporary queues

In case of short-lived, lightweight messaging with synchronous two-way communication, you can use temporary queues. The temporary queue makes it easy to create and delete many temporary messaging destinations without inflating your AWS bill. The key concept behind this is the virtual queue. Virtual queues let you multiplex many low-traffic queues onto a single SQS queue. Creating a virtual queue only instantiates a local buffer to hold messages for consumers as they arrive; there is no API call to SQS, and no costs associated with creating a virtual queue.

The inventory management example does not use temporary queues. However, in use cases that involve short-lived, lightweight messaging with synchronous two-way communication, adopting the best practice of using temporary queues and virtual queues can enhance the overall efficiency, reduce costs, and simplify the management of messaging destinations.

Sustainability Pillar

The Sustainability Pillar provides best practices to meet sustainability targets for your AWS workloads. It encompasses considerations related to energy efficiency and resource optimization.

Best practice: Use long polling

Besides its cost optimization benefits explained as part of the Cost Optimization Pillar, long polling also plays a crucial role in improving resource efficiency by reducing API requests, minimizing network traffic, and optimizing resource utilization.

By collecting and retrieving available messages in a batch, long polling reduces the frequency of API requests, resulting in improved resource utilization and minimized network traffic. By reducing excessive API consumption through long polling, you can effectively use resources. It collects and retrieves messages in batches, reducing excessive API consumption and unnecessary network traffic.

By reducing API calls, it optimizes data transfer and infrastructure operations. Additionally, long polling’s batching approach optimizes resource allocation, utilizing system resources more efficiently and improving energy efficiency. This enables the inventory management system to handle high message volumes effectively while operating in a cost-efficient and resource-efficient manner.

Conclusion

This blog post explores best practices for SQS using the Performance Efficiency Pillar, Cost Optimization Pillar, and Sustainability Pillar of the AWS Well-Architected Framework. We cover techniques such as batch processing, message batching, and scaling considerations. We also discuss important considerations, such as resource utilization, minimizing resource waste, and reducing cost.

This three-part blog post series covers a wide range of best practices, spanning the Operational Excellence, Security, Reliability, Performance Efficiency, Cost Optimization, and Sustainability Pillars of the AWS Well-Architected Framework. By following these guidelines and leveraging the power of the AWS Well-Architected Framework, you can build robust, secure, and efficient messaging systems using SQS.

For more serverless learning resources, visit Serverless Land.

Implementing AWS Well-Architected best practices for Amazon SQS – Part 2

Post Syndicated from Pascal Vogel original https://aws.amazon.com/blogs/compute/implementing-aws-well-architected-best-practices-for-amazon-sqs-part-2/

This blog is written by Chetan Makvana, Senior Solutions Architect and Hardik Vasa, Senior Solutions Architect.

This is the second part of a three-part blog post series that demonstrates implementing best practices for Amazon Simple Queue Service (Amazon SQS) using the AWS Well-Architected Framework.

This blog post covers best practices using the Security Pillar and Reliability Pillar of the AWS Well-Architected Framework. The inventory management example introduced in part 1 of the series will continue to serve as an example.

See also the other two parts of the series:

Security Pillar

The Security Pillar includes the ability to protect data, systems, and assets and to take advantage of cloud technologies to improve your security. This pillar recommends putting in place practices that influence security. Using these best practices, you can protect data while in-transit (as it travels to and from SQS) and at rest (while stored on disk in SQS), or control who can do what with SQS.

Best practice: Configure server-side encryption

If your application has a compliance requirement such as HIPAA, GDPR, or PCI-DSS mandating encryption at rest, if you are looking to improve data security to protect against unauthorized access, or if you are just looking for simplified key management for the messages sent to the SQS queue, you can leverage Server-Side Encryption (SSE) to protect the privacy and integrity of your data stored on SQS.

SQS and AWS Key Management Service (KMS) offer two options for configuring server-side encryption. SQS-managed encryptions keys (SSE-SQS) provide automatic encryption of messages stored in SQS queues using AWS-managed keys. This feature is enabled by default when you create a queue. If you choose to use your own AWS KMS keys to encrypt and decrypt messages stored in SQS, you can use the SSE-KMS feature.

Amazon SQS Encryption Settings

SSE-KMS provides greater control and flexibility over encryption keys, while SSE-SQS simplifies the process by managing the encryption keys for you. Both options help you protect sensitive data and comply with regulatory requirements by encrypting data at rest in SQS queues. Note that SSE-SQS only encrypts the message body and not the message attributes.

In the inventory management example introduced in part 1, an AWS Lambda function responsible for CSV processing sends incoming messages to an SQS queue when an inventory updates file is dropped into the Amazon Simple Storage Service (Amazon S3) bucket. SQS encrypts these messages in the queue using SQS-SSE. When a backend processing Lambda polls messages from the queue, the encrypted message is decrypted, and the function inserts inventory updates into Amazon DynamoDB.

The AWS Could Development Kit (AWS CDK) code sets SSE-SQS as the default encryption key type. However, the following AWS CDK code shows how to encrypt the queue with SSE-KMS.

# Create the SQS queue with DLQ setting
queue = sqs.Queue(
    self,
    "InventoryUpdatesQueue",
    visibility_timeout=Duration.seconds(300),
    encryption=sqs.QueueEncryption.KMS_MANAGED,
)

Best practice: Implement least-privilege access using access policy

For securing your resources in AWS, implementing least-privilege access is critical. This means granting users and services the minimum level of access required to perform their tasks. Least-privilege access provides better security, allows you to meet your compliance requirements, and offers accountability via a clear audit trail of who accessed what resources and when.

By implementing least-privilege access using access policies, you can help reduce the risk of security breaches and ensure that your resources are only accessed by authorized users and services. AWS Identity and Access Management (IAM) policies apply to users, groups, and roles, while resource-based policies apply to AWS resources such as SQS queues. To implement least-privilege access, it’s essential to start by defining what actions are required for each user or service to perform their tasks.

In the inventory management example, the CSV processing Lambda function doesn’t perform any other task beyond parsing the inventory updates file and sending the inventory records to the SQS queue for further processing. To ensure that the function has the permissions to send messages to the SQS queue, grant the SQS queue access to the IAM role that the Lambda function assumes. By granting the SQS queue access to the Lambda function’s IAM role, you establish a secure and controlled communication channel. The Lambda function can only interact with the SQS queue and doesn’t have unnecessary access or permissions that might compromise the system’s security.

# Create pre-processing Lambda function
csv_processing_to_sqs_function = _lambda.Function(
    self,
    "CSVProcessingToSQSFunction",
    runtime=_lambda.Runtime.PYTHON_3_8,
    code=_lambda.Code.from_asset("sqs_blog/lambda"),
    handler="CSVProcessingToSQSFunction.lambda_handler",
    role=role,
    tracing=Tracing.ACTIVE,
)

# Define the queue policy to allow messages from the Lambda function's role only
policy = iam.PolicyStatement(
    actions=["sqs:SendMessage"],
    effect=iam.Effect.ALLOW,
    principals=[iam.ArnPrincipal(role.role_arn)],
    resources=[queue.queue_arn],
)

queue.add_to_resource_policy(policy)

Best practice: Allow only encrypted connections over HTTPS using aws:SecureTransport

It is essential to have a secure and reliable method for transferring data between AWS services and on-premises environments or other external systems. With HTTPS, a network-based attacker cannot eavesdrop on network traffic or manipulate it, using an attack such as man-in-the-middle.

With SQS, you can choose to allow only encrypted connections over HTTPS using the aws:SecureTransport condition key in the queue policy. With this condition in place, any requests made over non-secure HTTP receive a 400 InvalidSecurity error from SQS.

In the inventory management example, the CSV processing Lambda function sends inventory updates to the SQS queue. To ensure secure data transfer, the Lambda function uses the HTTPS endpoint provided by SQS. This guarantees that the communication between the Lambda function and the SQS queue remains encrypted and resistant to potential security threats.

# Create an IAM policy statement allowing only HTTPS access to the queue
secure_transport_policy = iam.PolicyStatement(
    effect=iam.Effect.DENY,
    actions=["sqs:*"],
    resources=[queue.queue_arn],
    conditions={
        "Bool": {
            "aws:SecureTransport": "false",
        },
    },
)

Best practice: Use attribute-based access controls (ABAC)

Some use-cases require granular access control. For example, authorizing a user based on user roles, environment, department, or location. Additionally, dynamic authorization is required based on changing user attributes. In this case, you need an access control mechanism based on user attributes.

Attribute-based access controls (ABAC) is an authorization strategy that defines permissions based on tags attached to users and AWS resources. With ABAC, you can use tags to configure IAM access permissions and policies for your queues. ABAC hence enables you to scale your permission management easily. You can author a single permission policy in IAM using tags created for each business role, and no longer need to update the policy when adding new resources.

ABAC for SQS queues enables two key use cases:

  • Tag-based access control: use tags to control access to your SQS queues, including control plane and data plane API calls.
  • Tag-on-create: enforce tags at the time of creation of an SQS queues and deny the creation of SQS resources without tags.

Reliability Pillar

The Reliability Pillar encompasses the ability of a workload to perform its intended function correctly and consistently when it’s expected to. By leveraging the best practices outlined in this pillar, you can enhance the way you manage messages in SQS.

Best practice: Configure dead-letter queues

In a distributed system, when messages flow between sub-systems, there is a possibility that some messages may not be processed right away. This could be because of the message being corrupted or downstream processing being temporarily unavailable. In such situations, it is not ideal for the bad message to block other messages in the queue.

Dead Letter Queues (DLQs) in SQS can improve the reliability of your application by providing an additional layer of fault tolerance, simplifying debugging, providing a retry mechanism, and separating problematic messages from the main queue. By incorporating DLQs into your application architecture, you can build a more robust and reliable system that can handle errors and maintain high levels of performance and availability.

In the inventory management example, a DLQ plays a vital role in adding message resiliency and preventing situations where a single bad message blocks the processing of other messages. If the backend Lambda function fails after multiple attempts, the inventory update message is redirected to the DLQ. By inspecting these unconsumed messages, you can troubleshoot and redrive them to the primary queue or to custom destination using the DLQ redrive feature. You can also automate redrive by using a set of APIs programmatically. This ensures accurate inventory updates and prevents data loss.

The following AWS CDK code snippet shows how to create a DLQ for the source queue and sets up a DLQ policy to only allow messages from the source SQS queue. It is recommended not to set the max_receive_count value to 1, especially when using a Lambda function as the consumer, to avoid accumulating many messages in the DLQ.

# Create the Dead Letter Queue (DLQ)
dlq = sqs.Queue(self, "InventoryUpdatesDlq", visibility_timeout=Duration.seconds(300))

# Create the SQS queue with DLQ setting
queue = sqs.Queue(
    self,
    "InventoryUpdatesQueue",
    visibility_timeout=Duration.seconds(300),
    dead_letter_queue=sqs.DeadLetterQueue(
        max_receive_count=3,  # Number of retries before sending the message to the DLQ
        queue=dlq,
    ),
)
# Create an SQS queue policy to allow source queue to send messages to the DLQ
policy = iam.PolicyStatement(
    effect=iam.Effect.ALLOW,
    actions=["sqs:SendMessage"],
    resources=[dlq.queue_arn],
    conditions={"ArnEquals": {"aws:SourceArn": queue.queue_arn}},
)
queue.queue_policy = iam.PolicyDocument(statements=[policy])

Best practice: Process messages in a timely manner by configuring the right visibility timeout

Setting the appropriate visibility timeout is crucial for efficient message processing in SQS. The visibility timeout is the period during which SQS prevents other consumers from receiving and processing a message after it has been polled from the queue.

To determine the ideal visibility timeout for your application, consider your specific use case. If your application typically processes messages within a few seconds, set the visibility timeout to a few minutes. This ensures that multiple consumers don’t process the message simultaneously. If your application requires more time to process messages, consider breaking them down into smaller units or batching them to improve performance.

If a message fails to process and is returned to the queue, it will not be available for processing again until the visibility timeout period has elapsed. Increasing the visibility timeout will increase the overall latency of your application. Therefore, it’s important to balance the tradeoff between reducing the likelihood of message duplication and maintaining a responsive application.

In the inventory management example, setting the right visibility timeout helps the application fail fast and improve the message processing times. Since the Lambda function typically processes messages within milliseconds, a visibility timeout of 30 seconds is set in the following AWS CDK code snippet.

queue = sqs.Queue(
    self,
    " InventoryUpdatesQueue",
    visibility_timeout=Duration.seconds(30),
)

It is recommended to keep the SQS queue visibility timeout to at least six times the Lambda function timeout, plus the value of MaximumBatchingWindowInSeconds. This allows Lambda function to retry the messages if the invocation fails.

Conclusion

This blog post explores best practices for SQS using the Security Pillar and Reliability Pillar of the AWS Well-Architected Framework. We discuss various best practices and considerations to ensure the security of SQS. By following these best practices, you can create a robust and secure messaging system using SQS. We also highlight fault tolerance and processing a message in a timely manner as important aspects of building reliable applications using SQS.

The next part of this blog post series focuses on the Performance Efficiency Pillar, Cost Optimization Pillar, and Sustainability Pillar of the AWS Well-Architected Framework and explore best practices for SQS.

For more serverless learning resources, visit Serverless Land.

Implementing AWS Well-Architected best practices for Amazon SQS – Part 1

Post Syndicated from Pascal Vogel original https://aws.amazon.com/blogs/compute/implementing-aws-well-architected-best-practices-for-amazon-sqs-part-1/

This blog is written by Chetan Makvana, Senior Solutions Architect and Hardik Vasa, Senior Solutions Architect.

Amazon Simple Queue Service (Amazon SQS) is a fully managed message queuing service that makes it easy to decouple and scale microservices, distributed systems, and serverless applications. AWS customers have constantly discovered powerful new ways to build more scalable, elastic, and reliable applications using SQS. You can leverage SQS in a variety of use-cases requiring loose coupling and high performance at any level of throughput, while reducing cost by only paying for value and remaining confident that no message is lost. When building applications with Amazon SQS, it is important to follow architectural best practices.

To help you identify and implement these best practices, AWS provides the AWS Well-Architected Framework for designing and operating reliable, secure, efficient, cost-effective, and sustainable systems in the AWS Cloud. Built around six pillars—operational excellence, security, reliability, performance efficiency, cost optimization, and sustainability, AWS Well-Architected provides a consistent approach for customers and partners to evaluate architectures and implement scalable designs.

This three-part blog series covers each pillar of the AWS Well-Architected Framework to implement best practices for SQS. This blog post, part 1 of the series, discusses best practices using the Operational Excellence Pillar of the AWS Well-Architected Framework.

See also the other two parts of the series:

Solution overview

Solution architecture for Inventory Updates Process

This solution architecture shows an example of an inventory management system. The system leverages Amazon Simple Storage Service (Amazon S3), AWS Lambda, Amazon SQS, and Amazon DynamoDB to streamline inventory operations and ensure accurate inventory levels. The system handles frequent updates from multiple sources, such as suppliers, warehouses, and retail stores, which are received as CSV files.

These CSV files are then uploaded to an S3 bucket, consolidating and securing the inventory data for the inventory management system’s access. The system uses a Lambda function to read and parse the CSV file, extracting individual inventory update records. The backend Lambda function transforms each inventory update record into a message and sends it to an SQS queue. Another Lambda function continually polls the SQS queue for new messages. Upon receiving a message, it retrieves the inventory update details and updates the inventory levels in DynamoDB accordingly.

This ensures that the inventory quantities for each product are accurate and reflect the latest changes. This way, the inventory management system provides real-time visibility into inventory levels across different locations and suppliers, enabling the company to monitor product availability with precision. Find the example code for this solution in the GitHub repository.

This example is used throughout this blog series to highlight how SQS best practices can be implemented based on the AWS Well Architected Framework.

Operational Excellence Pillar

The Operational Excellence Pillar includes the ability to support development and run workloads effectively, gain insight into their operation, and continuously improve supporting processes and procedures to deliver business value. To achieve operational excellence, the pillar recommends best practices such as defining workload metrics and implementing transaction traceability. This enables organizations to gain valuable insights into their operations, identify potential issues, and optimize services accordingly to improve customer experience. Furthermore, understanding the health of an application is critical to ensuring that it is functioning as expected.

Best practice: Use infrastructure as code to deploy SQS

Infrastructure as Code (IaC) helps you model, provision, and manage your cloud resources. One of the primary advantages of IaC is that it simplifies infrastructure management. With IaC, you can quickly and easily replicate your environment to multiple AWS Regions with a single turnkey solution. This makes it easy to manage your infrastructure, regardless of where your resources are located. Additionally, IaC enables you to create, deploy, and maintain infrastructure in a programmatic, descriptive, and declarative way repeatably. This reduces errors caused by manual processes, such as creating resources in the AWS Management Console. With IaC, you can easily control and track changes in your infrastructure, which makes it easier to maintain and troubleshoot your systems.

For managing SQS resources, you can use different IaC tools like AWS Serverless Application Model (AWS SAM), AWS CloudFormation, or AWS Could Development Kit (AWS CDK). There are also third-party solutions for creating SQS resources, such as the Serverless Framework. AWS CDK is a popular choice because it allows you to provision AWS resources using familiar programming languages such as Python, Java, TypeScript, Go, JavaScript, and C#/.Net.

This blog series showcases the use of AWS CDK with Python to demonstrate best practices for working with SQS. For example, the following AWS CDK code creates a new SQS queue:

from aws_cdk import (
    Duration,
    Stack,
    aws_sqs as sqs,
)
from constructs import Construct


class SqsCdBlogStack(Stack):
    def __init__(self, scope: Construct, construct_id: str, **kwargs) -> None:
        super().__init__(scope, construct_id, **kwargs)

        # The code that defines your stack goes here

        # example resource
        queue = sqs.Queue(
            self,
            "InventoryUpdatesQueue",
            visibility_timeout=Duration.seconds(300),
        )

Best practice: Configure CloudWatch alarms for ApproximateAgeofOldestMessage

It is important to understand Amazon CloudWatch metrics and dimensions for SQS, to have a plan in place to assess its behavior, and to add custom metrics where necessary. Once you have a good understanding of the metrics, it is essential to identify the key metrics that are most relevant to your use case and set up appropriate alerts to monitor them.

One of the key metrics that SQS provides is the ApproximateAgeOfOldestMessage metric. By monitoring this metric, you can determine the age of the oldest message in the queue, and take appropriate action to ensure that messages are processed in a timely manner. To set up alerts for the ApproximateAgeOfOldestMessage metric, you can use CloudWatch alarms. You configure these alarms to issue alerts when messages remain in the queue for extended periods of time. You can use these alerts to act, for instance by scaling up consumers to process messages more quickly or investigating potential issues with message processing.

In the inventory management example, leveraging the ApproximateAgeOfOldestMessage metric provides valuable insights into the health and performance of the SQS queue. By monitoring this metric, you can detect processing delays, optimize performance, and ensure that inventory updates are processed within the desired timeframe. This ensures that your inventory levels remain accurate and up-to-date. The following code creates an alarm which is triggered if the oldest inventory updates request is in the queue for more than 30 seconds.

# Create a CloudWatch alarm for ApproximateAgeOfOldestMessage metric
alarm = cloudwatch.Alarm(
	self,
	"OldInventoryUpdatesAlarm",
	alarm_name="OldInventoryUpdatesAlarm",
	metric=queue.metric_approximate_age_of_oldest_message(),
	threshold=600,  # Specify your desired threshold value in seconds
	evaluation_periods=1,
	comparison_operator=cloudwatch.ComparisonOperator.GREATER_THAN_OR_EQUAL_TO_THRESHOLD,
)

Best practice: Add a tracing header while sending a message to the queue to provide distributed tracing capabilities for faster troubleshooting

By implementing distributed tracing, you can gain a clear understanding of the flow of messages in SQS queues, identify any bottlenecks or potential issues, and proactively react to any signals that indicate an unhealthy state. Tracing provides a wider continuous view of an application and helps to follow a user journey or transaction through the application.

AWS X-Ray is an example of a distributed tracing solution that integrates with Amazon SQS to trace messages that are passed through an SQS queue. When using the X-Ray SDK, SQS can propagate tracing headers to maintain trace continuity and enable tracking, analysis, and debugging throughout downstream services. SQS supports tracing headers through the Default HTTP header and the AWSTraceHeader System Attribute. AWSTraceHeader is available for use even when auto-instrumentation through the X-Ray SDK is not, for example, when building a tracing SDK for a new language. If you are using a Lambda downstream consumer, trace context propagation is automatic.

In the inventory management example, by utilizing distributed tracing with X-Ray for SQS, you can gain deep insights into the performance, behavior, and dependencies of the inventory management system. This visibility enables you to optimize performance, troubleshoot issues more effectively, and ensure the smooth and efficient operation of the system. The following code sets up a CSV processing Lambda function and a backend processing Lambda function with active tracing enabled. The Lambda function automatically receives the X-Ray TraceId from SQS.

# Create pre-processing Lambda function
csv_processing_to_sqs_function = _lambda.Function(
    self,
    "CSVProcessingToSQSFunction",
    runtime=_lambda.Runtime.PYTHON_3_8,
    code=_lambda.Code.from_asset("sqs_blog/lambda"),
    handler="CSVProcessingToSQSFunction.lambda_handler",
    role=role,
    tracing=Tracing.ACTIVE,  # Enable active tracing with X-Ray
)

# Create a post-processing Lambda function with the specified role
sqs_to_dynamodb_function = _lambda.Function(
    self,
    "SQSToDynamoDBFunction",
    runtime=_lambda.Runtime.PYTHON_3_8,
    code=_lambda.Code.from_asset("sqs_blog/lambda"),
    handler="SQSToDynamoDBFunction.lambda_handler",
    role=role,
    tracing=Tracing.ACTIVE,  # Enable active tracing with X-Ray
)

Conclusion

This blog post explores best practices for SQS with a focus on the Operational Excellence Pillar of the AWS Well-Architected Framework. We explore key considerations for ensuring the smooth operation and optimal performance of applications using SQS. Additionally, we explore the advantages of infrastructure as code in simplifying infrastructure management and showcase how AWS CDK can be used to provision and manage SQS resources.

The next part of this blog post series addresses the Security Pillar and Reliability Pillar of the AWS Well-Architected Framework and explores best practices for SQS.

For more serverless learning resources, visit Serverless Land.

AWS Week in Review – Automate DLQ Redrive for SQS, Lambda Supports Ruby 3.2, and More – June 12, 2023

Post Syndicated from Marcia Villalba original https://aws.amazon.com/blogs/aws/aws-week-in-review-automate-dlq-redrive-for-sqs-lambda-supports-ruby-3-2-and-more-june-12-2023/

Today I’m boarding a plane for Madrid. I will attend the AWS Summit Madrid this Thursday, and I will take Serverlesspresso with me. Serverlesspresso is a demo that we take to events, in where you can learn how to build event-driven architectures with serverless. If you are visiting an AWS Summit, most probably you will find one of our booths.

Serverlesspresso at Madrid

Last Week’s Launches
Here are some launches that got my attention during the previous week.

Amazon SQS – Customers were very excited when we announced the DLQ redrive for Amazon SQS as that feature helped them to easily redirect the failed messages. This week we added support for AWS SDK and CLI for this feature, allowing you to redrive the messages on the DLQ automatically, making it even easier to use this feature. You can read Seb’s blog post about this new feature to learn how to get started.

AWS Lambda – AWS Lambda now supports Ruby 3.2. Ruby 3.2 has many new improvements, for example, passing anonymous arguments to functions or having endless methods. Check out this blog post that goes in depth into each of the new features.

Amazon Fraud DetectorAmazon Fraud Detector supports event orchestration with Amazon EventBridge. This is a very important feature because now you can act on the different events that Fraud Detector emits, for example, send notifications to different stakeholders.

AWS Glue – This week, AWS Glue made two important announcements. First, it announced the general availability of AWS Glue for Ray, a new data integration engine option for AWS Glue. Ray is a popular new open-source compute framework that helps developers to scale their Python workloads. In addition, AWS Glue announced AWS Glue Data Quality, a new capability that automatically measures and monitors data lake and data pipeline quality.

Amazon Elastic Container Registry (Amazon ECR)AWS Signer and Amazon ECR announced a new feature that allows you to sign and verify container images. You can use Signer to validate that only container images you have approved are deployed in your Amazon Elastic Kubernetes Service (Amazon EKS) clusters.

Amazon QuickSightAmazon QuickSight now supports APIs to automate asset deployment, so you can replicate the same QuickSight assets in multiple Regions and account easily. You can read more on how to use those APIs in this blog post.

For a full list of AWS announcements, be sure to keep an eye on the What’s New at AWS page.

Other AWS News
Some other updates and news that you may have missed:

Upcoming AWS Events
Check your calendars and sign up for these AWS events:

  • AWS Silicon Innovation Day (June 21) – A one-day virtual event that focuses on AWS Silicon and how you can take advantage of AWS’s unique offerings. Learn more and register here.
  • AWS Global Summits – There are many summits going on right now around the world: Toronto (June 14), Madrid (June 15), and Milano (June 22).
  • AWS Community Day – Join a community-led conference run by AWS user group leaders in your region: Chicago (June 15), Manila (June 29–30), Chile (July 1), and Munich (September 14).
  • CDK Day CDK Day is happening again this year on September 29. The call for papers for this event is open, and this year we are also accepting talks in Spanish. Submit your talk here.

That’s all for this week. Check back next Monday for another Week in Review!

This post is part of our Week in Review series. Check back each week for a quick roundup of interesting news and announcements from AWS!

— Marcia

A New Set of APIs for Amazon SQS Dead-Letter Queue Redrive

Post Syndicated from Sébastien Stormacq original https://aws.amazon.com/blogs/aws/a-new-set-of-apis-for-amazon-sqs-dead-letter-queue-redrive/

Today, we launch a new set of APIs for Amazon Simple Queue Service (Amazon SQS). These new APIs allow you to manage dead-letter queue (DLQ) redrive programmatically. You can now use the AWS SDKs or the AWS Command Line Interface (AWS CLI) to programmatically move messages from the DLQ to their original queue, or to a custom queue destination, to attempt to process them again. A DLQ is a queue where Amazon SQS automatically moves messages that are not correctly processed by your consumer application.

To fully appreciate how this new API might help you, let’s have a quick look back at history.

Message queues are an integral part of modern application architectures. They allow developers to decouple services by allowing asynchronous and message-based communications between message producers and consumers. In most systems, messages are persisted in shared storage (the queue) until the consumer processes them. Message queues allow developers to build applications that are resilient to temporary service failure. They help prioritize message processing and scale their fleet of worker nodes that process the messages. Message queues are also popular in event-driven architectures.

Asynchronous message exchange is not new in application architectures. The concept of exchanging messages asynchronously between applications appeared in the 1960s and was first made popular when IBM launched TCAM for OS/360 in 1972. The general adoption came 20 years later with IBM MQ Series in 1993 (now IBM MQ) and when Sun Microsystems released Java Messaging Service (JMS) in 1998, a standard API for Java applications to interact with message queues.

AWS launched Amazon SQS on July 12, 2006. Amazon SQS is a highly scalable, reliable, and elastic queuing service that “just works.” As Werner wrote at the time: “We have chosen a concurrency model where the process working on a message automatically acquires a leased lock on that message; if the message is not deleted before the lease expires, it becomes available for processing again. Makes failure handling very simple.

On January 29, 2014, we introduced dead-letter queues (DLQ). DLQs help you avoid a message that failed to be processed from staying forever on top of the queue, possibly preventing other messages in the queue from processing. With DLQs, each queue has an associated property telling Amazon SQS how many times a message may be presented for processing (maxReceiveCount). Each message also has an associated receive counter (ReceiveCount). Each time a consumer application picks up a message for processing, the message receive count is incremented by 1. When ReceiveCount > maxReceiveCount, Amazon SQS moves the message to your designated DLQ for human analysis and debugging. You generally associate alarms with the DLQ to send notifications when such events happen. Typical reasons to move a message to the DLQ are because they are incorrectly formatted, there are bugs in the consumer application, or it takes too long to process the message.

At AWS re:Invent 2021, AWS announced dead-letter queue redrive on the Amazon SQS console. The redrive addresses the second part of the failed message lifecycle. It allows you to reinject the message in its original queue to attempt processing it again. After the consumer application is fixed and ready to consume the failed messages, you can redrive the messages from the DLQ back in the source queue or a customized queue destination. It just requires a couple of clicks on the console.

Today, we are adding APIs allowing you to write applications and scripts that handle the redrive programmatically. There is no longer a need to have a human clicking on the console. Using the API increases the scalability of your processes and reduces the risk of human error.

Let’s See It in Action
To try out this new API, I open a terminal for a command-line only demo. Before I get started, I make sure I have the latest version of the AWS CLI. On macOS I enter brew upgrade awscli.

I first create two queues. One is the dead-letter queue, and the other is my application queue:

# First, I create the dead-letter queue (notice the -dlq I choose to add at the end of the queue name)
➜ ~ aws sqs create-queue \
            --queue-name awsnewsblog-dlq                                            
{
    "QueueUrl": "https://sqs.us-east-2.amazonaws.com/012345678900/awsnewsblog-dlq"
}

# second, I retrieve the Arn of the queue I just created
➜  ~ aws sqs get-queue-attributes \
             --queue-url https://sqs.us-east-2.amazonaws.com/012345678900/awsnewsblog-dlq \
             --attribute-names QueueArn
{
    "Attributes": {
        "QueueArn": "arn:aws:sqs:us-east-2:012345678900:awsnewsblog-dlq"
    }
}

# Third, I create the application queue. I enter a redrive policy: post messages in the DLQ after three delivery attempts
➜  ~ aws sqs create-queue \
             --queue-name awsnewsblog \
             --attributes '{"RedrivePolicy": "{\"deadLetterTargetArn\":\"arn:aws:sqs:us-east-2:012345678900:awsnewsblog-dlq\",\"maxReceiveCount\":\"3\"}"}' 
{
    "QueueUrl": "https://sqs.us-east-2.amazonaws.com/012345678900/awsnewsblog"
}

Now that the two queues are ready, I post a message to the application queue:

➜ ~ aws sqs send-message \
            --queue-url https://sqs.us-east-2.amazonaws.com/012345678900/awsnewsblog \
            --message-body "Hello World"
{
"MD5OfMessageBody": "b10a8db164e0754105b7a99be72e3fe5",
"MessageId": "fdc26778-ce9a-4782-9e33-ae73877cfcb2"
}

Next, I consume the message, but I don’t delete it from the queue. This simulates a crash in the message consumer application. Message consumers are supposed to delete the message after successful processing. I set the maxReceivedCount property to 3 when I entered the redrivePolicy. I therefore repeat this operation three times to force Amazon SQS to move the message to the dead-letter queue after three delivery attempts. The default visibility timeout is 30 seconds, so I have to wait 30 seconds or more between the retries.

➜ ~ aws sqs receive-message \
            --queue-url https://sqs.us-east-2.amazonaws.com/012345678900/awsnewsblog
{
"Messages": [
{
"MessageId": "fdc26778-ce9a-4782-9e33-ae73877cfcb2",
"ReceiptHandle": "AQEBP8yOfgBlnjlkGXjyeLROiY7xg7cZ6Znq8Aoa0d3Ar4uvTLPrHZptNotNfKRK25xm+IU8ebD3kDwZ9lja6JYs/t1kBlwiNO6TBACN5srAb/WggQiAAkYl045Tx3CvsOypbJA3y8U+MyEOQRwIz6G85i7MnR8RgKTlhOzOZOVACXC4W8J9GADaQquFaS1wVeM9VDsOxds1hDZLL0j33PIAkIrG016LOQ4sAntH0DOlEKIWZjvZIQGdlRJS65PJu+I/Ka1UPHGiFt9f8m3SR+Y34/ttRWpQANlXQi5ByA47N8UfcpFXXB5L30cUmoDtKucPewsJNG2zRCteR0bQczMMAmOPujsKq70UGOT8X2gEv2LfhlY7+5n8z3yew8sdBjWhVSegrgj6Yzwoc4kXiMddMg==",
"MD5OfBody": "b10a8db164e0754105b7a99be72e3fe5",
"Body": "Hello World"
}
]
}

# wait 30 seconds,
# then repeat two times (for a total of three receive-message API calls)

After three processing attempts, the message is not in the queue anymore:

➜  ~ aws sqs receive-message \
             --queue-url  https://sqs.us-east-2.amazonaws.com/012345678900/awsnewsblog
{
    "Messages": []
}

The message has been moved to the dead-letter queue. I check the DLQ to confirm (notice the queue URL ending with -dlq):

➜  ~ aws sqs receive-message \
             --queue-url  https://sqs.us-east-2.amazonaws.com/012345678900/awsnewsblog-dlq
{
    "Messages": [
        {
            "MessageId": "fdc26778-ce9a-4782-9e33-ae73877cfcb2",
            "ReceiptHandle": "AQEBCLtBMoZYVMMq7fUGNHeCliqE3mFXnkuJ+nOXLK1++uoXWBG31nDejCpxElmiBZWfbcfGJrEdKj4P9HJdrQMYDbeSqB+u1ZlB7CYzQBiQps4SEG0biEoubwqjQbmDZlPrmkFsnYgLD98D1XYWk/Ik6Z2n/wxDo9ko9rbZ15izK5RFnbwveNy8dfc6ireqVB1EGbeGkHcweHGuoeKWXEab1ynZWhNqZsQgCR6pWRkgtn59lJcLv4cJ4UMewNzvt7tMHH69GvVjXdYDYvJJI2vj+6RHvcvSHWWhTNT+CuPEXguVNuNrSya8gho1fCnKpVwQre6HhMlLPjY4wvn/tXY7+5rmte9eXagCqLQXaENB2R7qWNVPiWRIJy8/cTf37NLYVzBom030DNJlH9EeceRhCQ==",
            "MD5OfBody": "b10a8db164e0754105b7a99be72e3fe5",
            "Body": "Hello World"
        }
    ]
}

Now that the setup is ready, let’s programmatically redrive the message to its original queue. Let’s assume I understand why the consumer didn’t correctly process the message and that I fixed the consumer application code. I use start-message-move-task on the DLQ to start the asynchronous redrive. There is an optional attribute (MaxNumberOfMessagesPerSecond) to control the velocity of the redrive:

➜ ~ aws sqs start-message-move-task \
            --source-arn arn:aws:sqs:us-east-2:012345678900:awsnewsblog-dlq
{
    "TaskHandle": "eyJ0YXNrSWQiOiI4ZGJmNjBiMy00MmUwLTQzYTYtYjg4Zi1iMTZjYWRjY2FkNmEiLCJzb3VyY2VBcm4iOiJhcm46YXdzOnNxczp1cy1lYXN0LTI6NDg2NjUyMDY2NjkzOmF3c25ld3NibG9nLWRscSJ9"
}

I can list and check status the of the move tasks I initiated with list-message-move-tasks or cancel a running task by calling the cancel-message-move-task API:

➜ ~ aws sqs list-message-move-tasks \
            --source-arn arn:aws:sqs:us-east-2:012345678900:awsnewsblog-dlq
{
    "Results": [
        {
            "Status": "COMPLETED",
            "SourceArn": "arn:aws:sqs:us-east-2:012345678900:awsnewsblog-dlq",
            "ApproximateNumberOfMessagesMoved": 1,
            "ApproximateNumberOfMessagesToMove": 1,
            "StartedTimestamp": 1684135792239
        }
    ]
}

Now my application can consume the message again from the application queue:

➜  ~ aws sqs receive-message \
             --queue-url  https://sqs.us-east-2.amazonaws.com/012345678900/awsnewsblog                                   
{
    "Messages": [
        {
            "MessageId": "a7ae83ca-cde4-48bf-b822-3d4bc1f4dcae",
            "ReceiptHandle": "AQEB9a+Dm2nvb3VUn9+46j9UsDidU/W6qFwJtXtNWTyfoSDOKT7h73e6ctT9RVZysEw3qqzJOx1cxblTTOSrYwwwoBA2qoJMGsqsrsRGGYojBvf9X8hqi8B8MHn9rTm8diJ2wT2b7WC+TDrx3zIvUeiSEkP+EhqyYOvOs7Q9aETR+Uz02kQxZ/cUJWsN4MMSXBejwW+c5ivv5uQtpfUrfZuCWa9B9O67Kj/q52clriPHpcqCCfJwFBSZkGTXYwTpnjxD4QM7DPS+xVeVfTyM7DsKCAOtpvFBmX5m4UNKT6TROgCnGxTRglUSMWQp8ufVxXiaUyM1dwqxYekM9uX/RCb01gEyCZHas4jeNRV5nUJlhBkkqPlw3i6w9Uuc2y9nH0Df8nH3g7KTXo4lv5Bl3ayh9w==",
            "MD5OfBody": "b10a8db164e0754105b7a99be72e3fe5",
            "Body": "Hello World"
        }
    ]
}

Availability
DLQ redrive APIs are available today in all commercial Regions where Amazon SQS is available.

Redriving the messages from the dead-letter queue to the source queue or a custom destination queue generates additional API calls billed based on existing pricing (starting at $0.40 per million API calls, after the first million, which is free every month). Amazon SQS batches the messages while redriving them from one queue to another. This makes moving messages from one queue to another a simple and low-cost option.

To learn more about DLQ and DLQ redrive, check our documentation.

Remember that we live in an asynchronous world—so should your applications. Get started today and write your first redrive application.

— seb

Extending a serverless, event-driven architecture to existing container workloads

Post Syndicated from James Beswick original https://aws.amazon.com/blogs/compute/extending-a-serverless-event-driven-architecture-to-existing-container-workloads/

This post is written by Dhiraj Mahapatro, Principal Specialist SA, and Sascha Moellering, Principal Specialist SA, and Emily Shea, WW Lead, Integration Services.

Many serverless services are a natural fit for event-driven architectures (EDA), as events invoke them and only run when there is an event to process. When building in the cloud, many services emit events by default and have built-in features for managing events. This combination allows customers to build event-driven architectures easier and faster than ever before.

The insurance claims processing sample application in this blog series uses event-driven architecture principles and serverless services like AWS LambdaAWS Step FunctionsAmazon API GatewayAmazon EventBridge, and Amazon SQS.

When building an event-driven architecture, it’s likely that you have existing services to integrate with the new architecture, ideally without needing to make significant refactoring changes to those services. As services communicate via events, extending applications to new and existing microservices is a key benefit of building with EDA. You can write those microservices in different programming languages or running on different compute options.

This blog post walks through a scenario of integrating an existing, containerized service (a settlement service) to the serverless, event-driven insurance claims processing application described in this blog post.

Overview of sample event-driven architecture

The sample application uses a front-end to sign up a new user and allow the user to upload images of their car and driver’s license. Once signed up, they can file a claim and upload images of their damaged car. Previously, it did not yet integrate with a settlement service for completing the claims and settlement process.

In this scenario, the settlement service is a brownfield application that runs Spring Boot 3 on Amazon ECS with AWS Fargate. AWS Fargate is a serverless, pay-as-you-go compute engine that lets you focus on building container applications without managing servers.

The Spring Boot application exposes a REST endpoint, which accepts a POST request. It applies settlement business logic and creates a settlement record in the database for a car insurance claim. Your goal is to make settlement work with the new EDA application that is designed for claims processing without re-architecting or rewriting. Customer, claims, fraud, document, and notification are the other domains that are shown as blue-colored boxes in the following diagram:

Reference architecture

Project structure

The application uses AWS Cloud Development Kit (CDK) to build the stack. With CDK, you get the flexibility to create modular and reusable constructs imperatively using your language of choice. The sample application uses TypeScript for CDK.

The following project structure enables you to build different bounded contexts. Event-driven architecture relies on the choreography of events between domains. The object oriented programming (OOP) concept of CDK helps provision the infrastructure to separate the domain concerns while loosely coupling them via events.

You break the higher level CDK constructs down to these corresponding domains:

Comparing domains

Application and infrastructure code are present in each domain. This project structure creates a seamless way to add new domains like settlement with its application and infrastructure code without affecting other areas of the business.

With the preceding structure, you can use the settlement-service.ts CDK construct inside claims-processing-stack.ts:

const settlementService = new SettlementService(this, "SettlementService", {
  bus,
});

The only information the SettlementService construct needs to work is the EventBridge custom event bus resource that is created in the claims-processing-stack.ts.

To run the sample application, follow the setup steps in the sample application’s README file.

Existing container workload

The settlement domain provides a REST service to the rest of the organization. A Docker containerized Spring Boot application runs on Amazon ECS with AWS Fargate. The following sequence diagram shows the synchronous request-response flow from an external REST client to the service:

Settlement service

  1. External REST client makes POST /settlement call via an HTTP API present in front of an internal Application Load Balancer (ALB).
  2. SettlementController.java delegates to SettlementService.java.
  3. SettlementService applies business logic and calls SettlementRepository for data persistence.
  4. SettlementRepository persists the item in the Settlement DynamoDB table.

A request to the HTTP API endpoint looks like:

curl --location <settlement-api-endpoint-from-cloudformation-output> \
--header 'Content-Type: application/json' \
--data '{
  "customerId": "06987bc1-1234-1234-1234-2637edab1e57",
  "claimId": "60ccfe05-1234-1234-1234-a4c1ee6fcc29",
  "color": "green",
  "damage": "bumper_dent"
}'

The response from the API call is:

API response

You can learn more here about optimizing Spring Boot applications on AWS Fargate.

Extending container workload for events

To integrate the settlement service, you must update the service to receive and emit events asynchronously. The core logic of the settlement service remains the same. When you file a claim, upload damaged car images, and the application detects no document fraud, the settlement domain subscribes to Fraud.Not.Detected event and applies its business logic. The settlement service emits an event back upon applying the business logic.

The following sequence diagram shows a new interface in settlement to work with EDA. The settlement service subscribes to events that a producer emits. Here, the event producer is the fraud service that puts an event in an EventBridge custom event bus.

Sequence diagram

  1. Producer emits Fraud.Not.Detected event to EventBridge custom event bus.
  2. EventBridge evaluates the rules provided by the settlement domain and sends the event payload to the target SQS queue.
  3. SubscriberService.java polls for new messages in the SQS queue.
  4. On message, it transforms the message body to an input object that is accepted by SettlementService.
  5. It then delegates the call to SettlementService, similar to how SettlementController works in the REST implementation.
  6. SettlementService applies business logic. The flow is like the REST use case from 7 to 10.
  7. On receiving the response from the SettlementService, the SubscriberService transforms the response to publish an event back to the event bus with the event type as Settlement.Finalized.

The rest of the architecture consumes this Settlement.Finalized event.

Using EventBridge schema registry and discovery

Schema enforces a contract between a producer and a consumer. A consumer expects the exact structure of the event payload every time an event arrives. EventBridge provides schema registry and discovery to maintain this contract. The consumer (the settlement service) can download the code bindings and use them in the source code.

Enable schema discovery in EventBridge before downloading the code bindings and using them in your repository. The code bindings provide a marshaller that unmarshals the incoming event from SQS queue to a plain old Java object (POJO) FraudNotDetected.java. You download the code bindings using the choice of your IDE. AWS Toolkit for IntelliJ makes it convenient to download and use them.

Download code bindings

The final architecture for the settlement service with REST and event-driven architecture looks like:

Final architecture

Transition to become fully event-driven

With the new capability to handle events, the Spring Boot application now supports both the REST endpoint and the event-driven architecture by running the same business logic through different interfaces. In this example scenario, as the event-driven architecture matures and the rest of the organization adopts it, the need for the POST endpoint to save a settlement may diminish. In the future, you can deprecate the endpoint and fully rely on polling messages from the SQS queue.

You start with using an ALB and Fargate service CDK ECS pattern:

const loadBalancedFargateService = new ecs_patterns.ApplicationLoadBalancedFargateService(
  this,
  "settlement-service",
  {
    cluster: cluster,
    taskImageOptions: {
      image: ecs.ContainerImage.fromDockerImageAsset(asset),
      environment: {
        "DYNAMODB_TABLE_NAME": this.table.tableName
      },
      containerPort: 8080,
      logDriver: new ecs.AwsLogDriver({
        streamPrefix: "settlement-service",
        mode: ecs.AwsLogDriverMode.NON_BLOCKING,
        logRetention: RetentionDays.FIVE_DAYS,
      })
    },
    memoryLimitMiB: 2048,
    cpu: 1024,
    publicLoadBalancer: true,
    desiredCount: 2,
    listenerPort: 8080
  });

To adapt to EDA, you update the resources to retrofit the SQS queue to receive messages and EventBridge to put events. Add new environment variables to the ApplicationLoadBalancerFargateService resource:

environment: {
  "SQS_ENDPOINT_URL": queue.queueUrl,
  "EVENTBUS_NAME": props.bus.eventBusName,
  "DYNAMODB_TABLE_NAME": this.table.tableName
}

Grant the Fargate task permission to put events in the custom event bus and consume messages from the SQS queue:

props.bus.grantPutEventsTo(loadBalancedFargateService.taskDefinition.taskRole);
queue.grantConsumeMessages(loadBalancedFargateService.taskDefinition.taskRole);

When you transition the settlement service to become fully event-driven, you do not need the HTTP API endpoint and ALB anymore, as SQS is the source of events.

A better alternative is to use QueueProcessingFargateService ECS pattern for the Fargate service. The pattern provides auto scaling based on the number of visible messages in the SQS queue, besides CPU utilization. In the following example, you can also add two capacity provider strategies while setting up the Fargate service: FARGATE_SPOT and FARGATE. This means, for every one task that is run using FARGATE, there are two tasks that use FARGATE_SPOT. This can help optimize cost.

const queueProcessingFargateService = new ecs_patterns.QueueProcessingFargateService(this, 'Service', {
  cluster,
  memoryLimitMiB: 1024,
  cpu: 512,
  queue: queue,
  image: ecs.ContainerImage.fromDockerImageAsset(asset),
  desiredTaskCount: 2,
  minScalingCapacity: 1,
  maxScalingCapacity: 5,
  maxHealthyPercent: 200,
  minHealthyPercent: 66,
  environment: {
    "SQS_ENDPOINT_URL": queueUrl,
    "EVENTBUS_NAME": props?.bus.eventBusName,
    "DYNAMODB_TABLE_NAME": tableName
  },
  capacityProviderStrategies: [
    {
      capacityProvider: 'FARGATE_SPOT',
      weight: 2,
    },
    {
      capacityProvider: 'FARGATE',
      weight: 1,
    },
  ],
});

This pattern abstracts the automatic scaling behavior of the Fargate service based on the queue depth.

Running the application

To test the application, follow How to use the Application after the initial setup. Once complete, you see that the browser receives a Settlement.Finalized event:

{
  "version": "0",
  "id": "e2a9c866-cb5b-728c-ce18-3b17477fa5ff",
  "detail-type": "Settlement.Finalized",
  "source": "settlement.service",
  "account": "123456789",
  "time": "2023-04-09T23:20:44Z",
  "region": "us-east-2",
  "resources": [],
  "detail": {
    "settlementId": "377d788b-9922-402a-a56c-c8460e34e36d",
    "customerId": "67cac76c-40b1-4d63-a8b5-ad20f6e2e6b9",
    "claimId": "b1192ba0-de7e-450f-ac13-991613c48041",
    "settlementMessage": "Based on our analysis on the damage of your car per claim id b1192ba0-de7e-450f-ac13-991613c48041, your out-of-pocket expense will be $100.00."
  }
}

Cleaning up

The stack creates a custom VPC and other related resources. Be sure to clean up resources after usage to avoid the ongoing cost of running these services. To clean up the infrastructure, follow the clean-up steps shown in the sample application.

Conclusion

The blog explains a way to integrate existing container workload running on AWS Fargate with a new event-driven architecture. You use EventBridge to decouple different services from each other that are built using different compute technologies, languages, and frameworks. Using AWS CDK, you gain the modularity of building services decoupled from each other.

This blog shows an evolutionary architecture that allows you to modernize existing container workloads with minimal changes that still give you the additional benefits of building with serverless and EDA on AWS.

The major difference between the event-driven approach and the REST approach is that you unblock the producer once it emits an event. The event producer from the settlement domain that subscribes to that event is loosely coupled. The business functionality remains intact, and no significant refactoring or re-architecting effort is required. With these agility gains, you may get to the market faster

The sample application shows the implementation details and steps to set up, run, and clean up the application. The app uses ECS Fargate for a domain service, but you do not limit it to just Fargate. You can also bring container-based applications running on Amazon EKS similarly to event-driven architecture.

Learn more about event-driven architecture on Serverless Land.

Serverless ICYMI Q1 2023

Post Syndicated from Julian Wood original https://aws.amazon.com/blogs/compute/serverless-icymi-q1-2023/

Welcome to the 21st edition of the AWS Serverless ICYMI (in case you missed it) quarterly recap. Every quarter, we share all the most recent product launches, feature enhancements, blog posts, webinars, live streams, and other interesting things that you might have missed!

ICYMI2023Q1

In case you missed our last ICYMI, check out what happened last quarter here.

Artificial intelligence (AI) technologies, ChatGPT, and DALL-E are creating significant interest in the industry at the moment. Find out how to integrate serverless services with ChatGPT and DALL-E to generate unique bedtime stories for children.

Example notification of a story hosted with Next.js and App Runner

Example notification of a story hosted with Next.js and App Runner

Serverless Land is a website maintained by the Serverless Developer Advocate team to help you build serverless applications and includes workshops, code examples, blogs, and videos. There is now enhanced search functionality so you can search across resources, patterns, and video content.

SLand-search

ServerlessLand search

AWS Lambda

AWS Lambda has improved how concurrency works with Amazon SQS. You can now control the maximum number of concurrent Lambda functions invoked.

The launch blog post explains the scaling behavior of Lambda using this architectural pattern, challenges this feature helps address, and a demo of maximum concurrency in action.

Maximum concurrency is set to 10 for the SQS queue.

Maximum concurrency is set to 10 for the SQS queue.

AWS Lambda Powertools is an open-source library to help you discover and incorporate serverless best practices more easily. Lambda Powertools for .NET is now generally available and currently focused on three observability features: distributed tracing (Tracer), structured logging (Logger), and asynchronous business and application metrics (Metrics). Powertools is also available for Python, Java, and Typescript/Node.js programming languages.

To learn more:

Lambda announced a new feature, runtime management controls, which provide more visibility and control over when Lambda applies runtime updates to your functions. The runtime controls are optional capabilities for advanced customers that require more control over their runtime changes. You can now specify a runtime management configuration for each function with three settings, Automatic (default), Function update, or manual.

There are three new Amazon CloudWatch metrics for asynchronous Lambda function invocations: AsyncEventsReceived, AsyncEventAge, and AsyncEventsDropped. You can track the asynchronous invocation requests sent to Lambda functions to monitor any delays in processing and take corrective actions if required. The launch blog post explains the new metrics and how to use them to troubleshoot issues.

Lambda now supports Amazon DocumentDB change streams as an event source. You can use Lambda functions to process new documents, track updates to existing documents, or log deleted documents. You can use any programming language that is supported by Lambda to write your functions.

There is a helpful blog post suggesting best practices for developing portable Lambda functions that allow you to port your code to containers if you later choose to.

AWS Step Functions

AWS Step Functions has expanded its AWS SDK integrations with support for 35 additional AWS services including Amazon EMR Serverless, AWS Clean Rooms, AWS IoT FleetWise, AWS IoT RoboRunner and 31 other AWS services. In addition, Step Functions also added support for 1000+ new API actions from new and existing AWS services such as Amazon DynamoDB and Amazon Athena. For the full list of added services, visit AWS SDK service integrations.

Amazon EventBridge

Amazon EventBridge has launched the AWS Controllers for Kubernetes (ACK) for EventBridge and Pipes . This allows you to manage EventBridge resources, such as event buses, rules, and pipes, using the Kubernetes API and resource model (custom resource definitions).

EventBridge event buses now also support enhanced integration with Service Quotas. Your quota increase requests for limits such as PutEvents transactions-per-second, number of rules, and invocations per second among others will be processed within one business day or faster, enabling you to respond quickly to changes in usage.

AWS SAM

The AWS Serverless Application Model (SAM) Command Line Interface (CLI) has added the sam list command. You can now show resources defined in your application, including the endpoints, methods, and stack outputs required to test your deployed application.

AWS SAM has a preview of sam build support for building and packaging serverless applications developed in Rust. You can use cargo-lambda in the AWS SAM CLI build workflow and AWS SAM Accelerate to iterate on your code changes rapidly in the cloud.

You can now use AWS SAM connectors as a source resource parameter. Previously, you could only define AWS SAM connectors as a AWS::Serverless::Connector resource. Now you can add the resource attribute on a connector’s source resource, which makes templates more readable and easier to update over time.

AWS SAM connectors now also support multiple destinations to simplify your permissions. You can now use a single connector between a single source resource and multiple destination resources.

In October 2022, AWS released OpenID Connect (OIDC) support for AWS SAM Pipelines. This improves your security posture by creating integrations that use short-lived credentials from your CI/CD provider. There is a new blog post on how to implement it.

Find out how best to build serverless Java applications with the AWS SAM CLI.

AWS App Runner

AWS App Runner now supports retrieving secrets and configuration data stored in AWS Secrets Manager and AWS Systems Manager (SSM) Parameter Store in an App Runner service as runtime environment variables.

AppRunner also now supports incoming requests based on HTTP 1.0 protocol, and has added service level concurrency, CPU and Memory utilization metrics.

Amazon S3

Amazon S3 now automatically applies default encryption to all new objects added to S3, at no additional cost and with no impact on performance.

You can now use an S3 Object Lambda Access Point alias as an origin for your Amazon CloudFront distribution to tailor or customize data to end users. For example, you can resize an image depending on the device that an end user is visiting from.

S3 has introduced Mountpoint for S3, a high performance open source file client that translates local file system API calls to S3 object API calls like GET and LIST.

S3 Multi-Region Access Points now support datasets that are replicated across multiple AWS accounts. They provide a single global endpoint for your multi-region applications, and dynamically route S3 requests based on policies that you define. This helps you to more easily implement multi-Region resilience, latency-based routing, and active-passive failover, even when data is stored in multiple accounts.

Amazon Kinesis

Amazon Kinesis Data Firehose now supports streaming data delivery to Elastic. This is an easier way to ingest streaming data to Elastic and consume the Elastic Stack (ELK Stack) solutions for enterprise search, observability, and security without having to manage applications or write code.

Amazon DynamoDB

Amazon DynamoDB now supports table deletion protection to protect your tables from accidental deletion when performing regular table management operations. You can set the deletion protection property for each table, which is set to disabled by default.

Amazon SNS

Amazon SNS now supports AWS X-Ray active tracing to visualize, analyze, and debug application performance. You can now view traces that flow through Amazon SNS topics to destination services, such as Amazon Simple Queue Service, Lambda, and Kinesis Data Firehose, in addition to traversing the application topology in Amazon CloudWatch ServiceLens.

SNS also now supports setting content-type request headers for HTTPS notifications so applications can receive their notifications in a more predictable format. Topic subscribers can create a DeliveryPolicy that specifies the content-type value that SNS assigns to their HTTPS notifications, such as application/json, application/xml, or text/plain.

EDA Visuals collection added to Serverless Land

The Serverless Developer Advocate team has extended Serverless Land and introduced EDA visuals. These are small bite sized visuals to help you understand concept and patterns about event-driven architectures. Find out about batch processing vs. event streaming, commands vs. events, message queues vs. event brokers, and point-to-point messaging. Discover bounded contexts, migrations, idempotency, claims, enrichment and more!

EDA-visuals

EDA Visuals

To learn more:

Serverless Repos Collection on Serverless Land

There is also a new section on Serverless Land containing helpful code repositories. You can search for code repos to use for examples, learning or building serverless applications. You can also filter by use-case, runtime, and level.

Serverless Repos Collection

Serverless Repos Collection

Serverless Blog Posts

January

Jan 12 – Introducing maximum concurrency of AWS Lambda functions when using Amazon SQS as an event source

Jan 20 – Processing geospatial IoT data with AWS IoT Core and the Amazon Location Service

Jan 23 – AWS Lambda: Resilience under-the-hood

Jan 24 – Introducing AWS Lambda runtime management controls

Jan 24 – Best practices for working with the Apache Velocity Template Language in Amazon API Gateway

February

Feb 6 – Previewing environments using containerized AWS Lambda functions

Feb 7 – Building ad-hoc consumers for event-driven architectures

Feb 9 – Implementing architectural patterns with Amazon EventBridge Pipes

Feb 9 – Securing CI/CD pipelines with AWS SAM Pipelines and OIDC

Feb 9 – Introducing new asynchronous invocation metrics for AWS Lambda

Feb 14 – Migrating to token-based authentication for iOS applications with Amazon SNS

Feb 15 – Implementing reactive progress tracking for AWS Step Functions

Feb 23 – Developing portable AWS Lambda functions

Feb 23 – Uploading large objects to Amazon S3 using multipart upload and transfer acceleration

Feb 28 – Introducing AWS Lambda Powertools for .NET

March

Mar 9 – Server-side rendering micro-frontends – UI composer and service discovery

Mar 9 – Building serverless Java applications with the AWS SAM CLI

Mar 10 – Managing sessions of anonymous users in WebSocket API-based applications

Mar 14 –
Implementing an event-driven serverless story generation application with ChatGPT and DALL-E

Videos

Serverless Office Hours – Tues 10AM PT

Weekly office hours live stream. In each session we talk about a specific topic or technology related to serverless and open it up to helping you with your real serverless challenges and issues. Ask us anything you want about serverless technologies and applications.

January

Jan 10 – Building .NET 7 high performance Lambda functions

Jan 17 – Amazon Managed Workflows for Apache Airflow at Scale

Jan 24 – Using Terraform with AWS SAM

Jan 31 – Preparing your serverless architectures for the big day

February

Feb 07- Visually design and build serverless applications

Feb 14 – Multi-tenant serverless SaaS

Feb 21 – Refactoring to Serverless

Feb 28 – EDA visually explained

March

Mar 07 – Lambda cookbook with Python

Mar 14 – Succeeding with serverless

Mar 21 – Lambda Powertools .NET

Mar 28 – Server-side rendering micro-frontends

FooBar Serverless YouTube channel

Marcia Villalba frequently publishes new videos on her popular serverless YouTube channel. You can view all of Marcia’s videos at https://www.youtube.com/c/FooBar_codes.

January

Jan 12 – Serverless Badge – A new certification to validate your Serverless Knowledge

Jan 19 – Step functions Distributed map – Run 10k parallel serverless executions!

Jan 26 – Step Functions Intrinsic Functions – Do simple data processing directly from the state machines!

February

Feb 02 – Unlock the Power of EventBridge Pipes: Integrate Across Platforms with Ease!

Feb 09 – Amazon EventBridge Pipes: Enrichment and filter of events Demo with AWS SAM

Feb 16 – AWS App Runner – Deploy your apps from GitHub to Cloud in Record Time

Feb 23 – AWS App Runner – Demo hosting a Node.js app in the cloud directly from GitHub (AWS CDK)

March

Mar 02 – What is Amazon DynamoDB? What are the most important concepts? What are the indexes?

Mar 09 – Choreography vs Orchestration: Which is Best for Your Distributed Application?

Mar 16 – DynamoDB Single Table Design: Simplify Your Code and Boost Performance with Table Design Strategies

Mar 23 – 8 Reasons You Should Choose DynamoDB for Your Next Project and How to Get Started

Sessions with SAM & Friends

SAMFiends

AWS SAM & Friends

Eric Johnson is exploring how developers are building serverless applications. We spend time talking about AWS SAM as well as others like AWS CDK, Terraform, Wing, and AMPT.

Feb 16 – What’s new with AWS SAM

Feb 23 – AWS SAM with AWS CDK

Mar 02 – AWS SAM and Terraform

Mar 10 – Live from ServerlessDays ANZ

Mar 16 – All about AMPT

Mar 23 – All about Wing

Mar 30 – SAM Accelerate deep dive

Still looking for more?

The Serverless landing page has more information. The Lambda resources page contains case studies, webinars, whitepapers, customer stories, reference architectures, and even more Getting Started tutorials.

You can also follow the Serverless Developer Advocacy team on Twitter to see the latest news, follow conversations, and interact with the team.

Invoking asynchronous external APIs with AWS Step Functions

Post Syndicated from Jorge Fonseca original https://aws.amazon.com/blogs/architecture/invoking-asynchronous-external-apis-with-aws-step-functions/

External vendor APIs can help organizations streamline operations, reduce costs, and provide better services to their customers. But many challenges exist in integrating with third-party services such as security, reliability, and cost.

Organizations must ensure their systems can handle performance issues or downtime. In some cases, calling an external API may have associated costs such as licensing fees. If a contract exists with the external API vendor to adhere to maximum Requests Per Second (RPS), the system needs to adapt accordingly.

In this blog post, we show you how to build an architecture to invoke an external vendor API using AWS Step Functions, with specific guidance on reliability.

This orchestration is applicable to any industry that relies on technology and data benefitting from external vendor API integration. Examples include e-commerce applications for online retailers integrating with third-party payment gateways, shipping carriers, or applications in the healthcare and banking sectors.

Invoking asynchronous external APIs overview

This solution outlines the use of AWS services to build an orchestrator controlling the invocation rate of third-party services that implement the service callback pattern to process long-running jobs. This architecture is also available in the AWS Reference Architecture Diagrams section of the AWS Architecture Center.

As in Figure 1, the architecture gives you the control to feed your calls to an external service according to its maximum RPS contract using Step Functions capabilities. Step Functions pauses main request workflows until you receive a callback from the external system indicating job completion.

Invoking Asynchronous External APIs architecture

Figure 1. Invoking Asynchronous External APIs architecture

Let’s explore each step.

  1. Set up Step Functions to handle the lifecycle of long-running requests to the third party. Inside the workflow, add a request step that pauses it using waitForTaskToken as a callback to continue. Set a timeout to throw a timeout error if a callback isn’t received.
  2. Send the task token and request payload to an Amazon Simple Queue Service (Amazon SQS) queue. Use Amazon CloudWatch to monitor its length. Consider adjusting the contract with the third-party service if the queue length grows beyond a soft limit determined on the maximum RPS with the third party.
  3. Use AWS Lambda to poll Amazon SQS and trigger an express Step Functions workflow. Control the invocation rate of Lambda using polling batch size, reserved concurrency, and maximum concurrency, discussed in more detail later in the blog.
  4. Optionally, add dynamic delay inside Lambda controlled by AWS AppConfig if the system still needs a lower invocation rate to comply with the contracted RPS.
  5. Step Functions invokes an Amazon API Gateway HTTP proxy API configured with rate limit to comply with the contracted RPS. API Gateway is a safeguard proxy to make sure your system is not breaking the RPS contract while dynamically adjusting the invocation rate parameters.
  6. Invoke the external third-party asynchronous service API sending the payload consumed from the requests queue and receiving the jobID from the service. Send failed requests to the Dead Letter Queue (DLQ) using Amazon SQS.
  7. Store the main workflow’s task token and jobID from the third-party service in an Amazon DynamoDB table. This is used as a mapping to correlate the jobID with the task token.
  8. When the external service completes, receive the completed jobID in a callback webhook endpoint implemented with API Gateway.
  9. Transform the external callbacks with API Gateway mapping templates, add the payload and jobID to an Amazon SQS queue, and respond immediately to the caller.
  10. Use Lambda to poll the callback Amazon SQS queue, then query the token stored. Use the token to unblock the waiting workflow by calling SendTaskSuccess and the callback DLQ to store failed messages.
  11. On the main workflow, pass the jobID to the next step and invoke a Step Functions processor to fetch the third-party results. Finally, process the external service’s results.

Controlling external API invocation rates

To comply with third-party RPS contracts, adopt a mechanism to control your system’s invocation rate. The rate of polling the messages from the request Amazon SQS (or step 3 in the architecture) directly impacts your invocation rate.

Different parameters can be used to control the invocation rate for Lambda with Amazon SQS as its trigger “event source,” such as:

  1. Batch size: The number of records to send to the function in each batch. For a standard queue, this can be up to 10,000 records. For a first-in, first-out (FIFO) queue, the maximum is 10. Using batch size on its own will not limit the invocation rate. It should be used in conjunction with other parameters such as reserved concurrency or maximum concurrency.
  2. Batch window: The maximum amount of time to gather records before invoking the function, in seconds. This applies only to standard queues.
  3. Maximum concurrency: Sets limits on the number of concurrent instances of the function that an Amazon SQS event source can invoke. Maximum concurrency is an event source-level setting.

Trigger configuration is shown in Figure 2.

Configuration parameters for triggering Lambda

Figure 2. Configuration parameters for triggering Lambda

Other Lambda configuration parameters can also be used to control the invocation rate, such as:

  1. Reserved concurrency: Guarantees the maximum number of concurrent instances for the function. When a function has reserved concurrency, no other function can use that concurrency. This can be used to limit and reduce the invocation rate.
  2. Provisioned concurrency: Initializes a requested number of execution environments so that they are prepared to respond immediately to your function’s invocations. Note that configuring provisioned concurrency incurs charges to your AWS account.

These additional Lambda configuration parameters are shown here in Figure 3.

Lambda concurrency configuration options - Reserved and Provisioned

Figure 3. Lambda concurrency configuration options – Reserved and Provisioned

Maximizing your external API architecture

During this architecture implementation, consider some use cases to ensure that you are building a mature orchestrator.

Let’s explore some examples:

  • If the external system fails to respond to the API request in step 8, a timeout exception will occur at step 1. A sensible timeout should be configured in the main state machine in step 1. The timeout value should consider the maximum response time of the external system.

The Error handling capabilities in Step Functions section of the AWS Step Functions Developer Guide provides the ability to implement your own logic for different error types. Configure timeout errors using the States.Timeout error state.

  • Dynamic delay inside the Lambda function—as mentioned in step 4—should only be used temporarily for burst traffic. If the external party has a very low RPS contract, consider other alternatives to introduce delay.

For example, Amazon EventBridge Scheduler can be used to trigger the Lambda function at regular intervals to consume the messages from Amazon SQS. This avoids costs for the idle/waiting state of your Lambda functions.
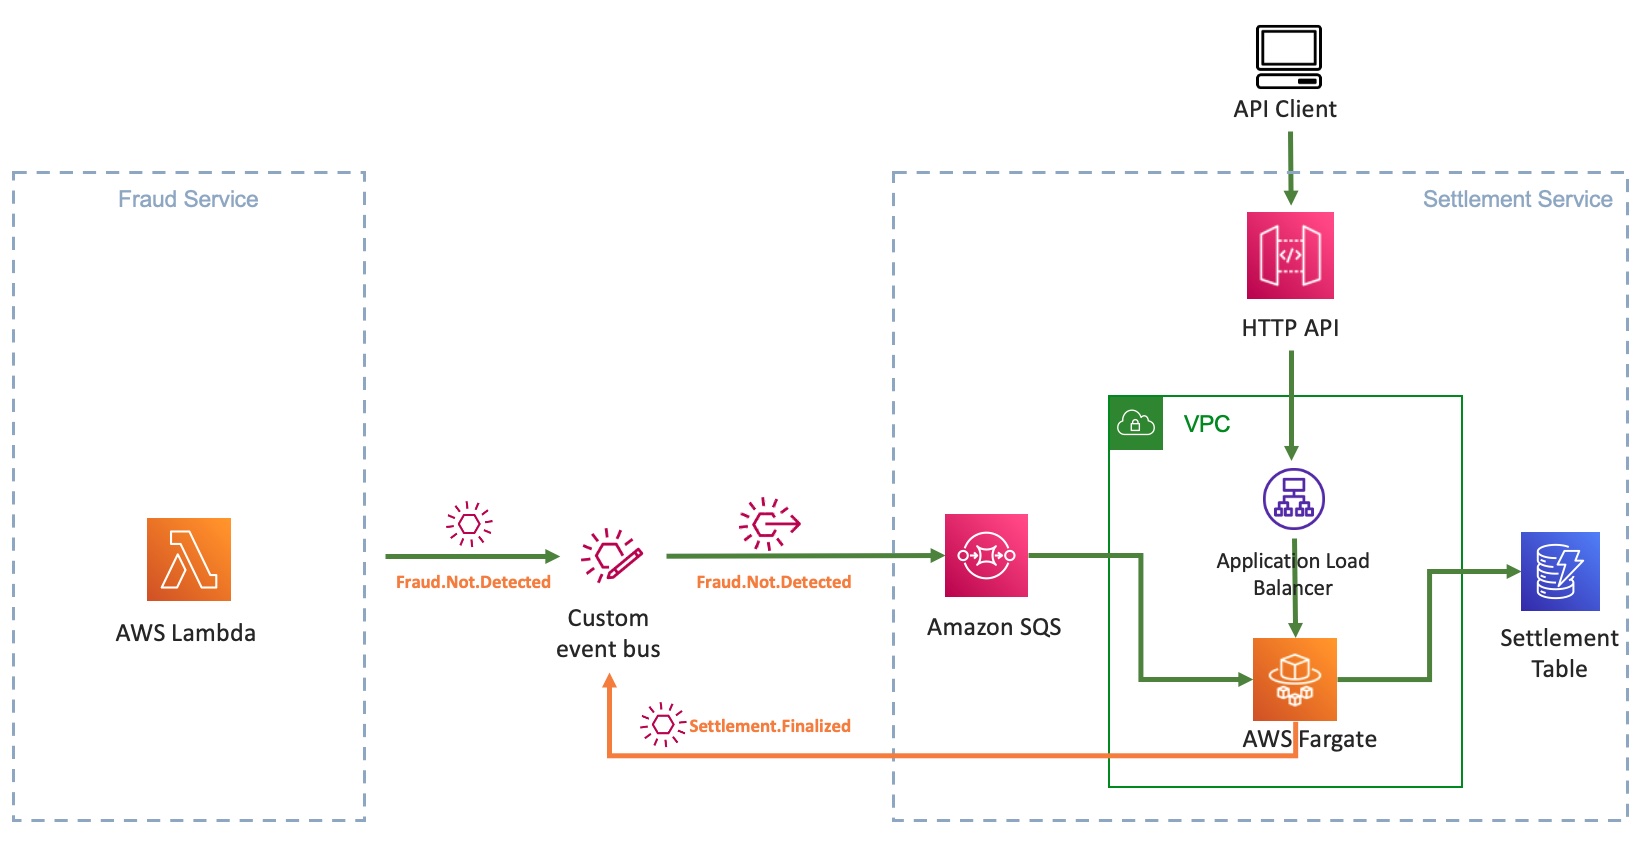
Conclusion

This blog post discusses how to build end-to-end orchestration to manage a request’s lifecycle, five different parameters to control invocation rate of third-party services, and throttle calls to external service API per maximum RPS contract.

We also consider use cases on using error handling capabilities in Step Functions and monitor systems with CloudWatch. In addition, this architecture adopts fully managed AWS Serverless services, removing the undifferentiated heavy lifting in building highly available, reliable, secure, and cost-effective systems in AWS.

Implementing architectural patterns with Amazon EventBridge Pipes

Post Syndicated from David Boyne original https://aws.amazon.com/blogs/compute/implementing-architectural-patterns-with-amazon-eventbridge-pipes/

This post is written by Dominik Richter (Solutions Architect)

Architectural patterns help you solve recurring challenges in software design. They are blueprints that have been used and tested many times. When you design distributed applications, enterprise integration patterns (EIP) help you integrate distributed components. For example, they describe how to integrate third-party services into your existing applications. But patterns are technology agnostic. They do not provide any guidance on how to implement them.
This post shows you how to use Amazon EventBridge Pipes to implement four common enterprise integration patterns (EIP) on AWS. This helps you to simplify your architectures. Pipes is a feature of Amazon EventBridge to connect your AWS resources. Using Pipes can reduce the complexity of your integrations. It can also reduce the amount of code you have to write and maintain.

Content filter pattern

The content filter pattern removes unwanted content from a message before forwarding it to a downstream system. Use cases for this pattern include reducing storage costs by removing unnecessary data or removing personally identifiable information (PII) for compliance purposes.

In the following example, the goal is to retain only non-PII data from “ORDER”-events. To achieve this, you must remove all events that aren’t “ORDER” events. In addition, you must remove any field in the “ORDER” events that contain PII.

While you can use this pattern with various sources and targets, the following architecture shows this pattern with Amazon Kinesis. EventBridge Pipes filtering discards unwanted events. EventBridge Pipes input transformers remove PII data from events that are forwarded to the second stream with longer retention.

Instead of using Pipes, you could connect the streams using an AWS Lambda function. This requires you to write and maintain code to read from and write to Kinesis. However, Pipes may be more cost effective than using a Lambda function.

Some situations require an enrichment function. For example, if your goal is to mask an attribute without removing it entirely. For example, you could replace the attribute “birthday” with an “age_group”-attribute.

In this case, if you use Pipes for integration, the Lambda function contains only your business logic. On the other hand, if you use Lambda for both integration and business logic, you do not pay for Pipes. At the same time, you add complexity to your Lambda function, which now contains integration code. This can increase its execution time and cost. Therefore, your priorities determine the best option and you should compare both approaches to make a decision.

To implement Pipes using the AWS Cloud Development Kit (AWS CDK), use the following source code. The full source code for all of the patterns that are described in this blog post can be found in the AWS samples GitHub repo.

const filterPipe = new pipes.CfnPipe(this, 'FilterPipe', {
  roleArn: pipeRole.roleArn,
  source: sourceStream.streamArn,
  target: targetStream.streamArn,
  sourceParameters: { filterCriteria: { filters: [{ pattern: '{"data" : {"event_type" : ["ORDER"] }}' }] }, kinesisStreamParameters: { startingPosition: 'LATEST' } },
  targetParameters: { inputTemplate: '{"event_type": <$.data.event_type>, "currency": <$.data.currency>, "sum": <$.data.sum>}', kinesisStreamParameters: { partitionKey: 'event_type' } },
});

To allow access to source and target, you must assign the correct permissions:

const pipeRole = new iam.Role(this, 'FilterPipeRole', { assumedBy: new iam.ServicePrincipal('pipes.amazonaws.com') });

sourceStream.grantRead(pipeRole);
targetStream.grantWrite(pipeRole);

Message translator pattern

In an event-driven architecture, event producers and consumers are independent of each other. Therefore, they may exchange events of different formats. To enable communication, the events must be translated. This is known as the message translator pattern. For example, an event may contain an address, but the consumer expects coordinates.

If a computation is required to translate messages, use the enrichment step. The following architecture diagram shows how to accomplish this enrichment via API destinations. In the example, you can call an existing geocoding service to resolve addresses to coordinates.

There may be cases where the translation is purely syntactical. For example, a field may have a different name or structure.

You can achieve these translations without enrichment by using input transformers.

Here is the source code for the pipe, including the role with the correct permissions:

const pipeRole = new iam.Role(this, 'MessageTranslatorRole', { assumedBy: new iam.ServicePrincipal('pipes.amazonaws.com'), inlinePolicies: { invokeApiDestinationPolicy } });

sourceQueue.grantConsumeMessages(pipeRole);
targetStepFunctionsWorkflow.grantStartExecution(pipeRole);

const messageTranslatorPipe = new pipes.CfnPipe(this, 'MessageTranslatorPipe', {
  roleArn: pipeRole.roleArn,
  source: sourceQueue.queueArn,
  target: targetStepFunctionsWorkflow.stateMachineArn,
  enrichment: enrichmentDestination.apiDestinationArn,
  sourceParameters: { sqsQueueParameters: { batchSize: 1 } },
});

Normalizer pattern

The normalizer pattern is similar to the message translator but there are different source components with different formats for events. The normalizer pattern routes each event type through its specific message translator so that downstream systems process messages with a consistent structure.

The example shows a system where different source systems store the name property differently. To process the messages differently based on their source, use an AWS Step Functions workflow. You can separate by event type and then have individual paths perform the unifying process. This diagram visualizes that you can call a Lambda function if needed. However, in basic cases like the preceding “name” example, you can modify the events using Amazon States Language (ASL).

In the example, you unify the events using Step Functions before putting them on your event bus. As is often the case with architectural choices, there are alternatives. Another approach is to introduce separate queues for each source system, connected by its own pipe containing only its unification actions.

This is the source code for the normalizer pattern using a Step Functions workflow as enrichment:

const pipeRole = new iam.Role(this, 'NormalizerRole', { assumedBy: new iam.ServicePrincipal('pipes.amazonaws.com') });

sourceQueue.grantConsumeMessages(pipeRole);
enrichmentWorkflow.grantStartSyncExecution(pipeRole);
normalizerTargetBus.grantPutEventsTo(pipeRole);

const normalizerPipe = new pipes.CfnPipe(this, 'NormalizerPipe', {
  roleArn: pipeRole.roleArn,
  source: sourceQueue.queueArn,
  target: normalizerTargetBus.eventBusArn,
  enrichment: enrichmentWorkflow.stateMachineArn,
  sourceParameters: { sqsQueueParameters: { batchSize: 1 } },
});

Claim check pattern

To reduce the size of the events in your event-driven application, you can temporarily remove attributes. This approach is known as the claim check pattern. You split a message into a reference (“claim check”) and the associated payload. Then, you store the payload in external storage and add only the claim check to events. When you process events, you retrieve relevant parts of the payload using the claim check. For example, you can retrieve a user’s name and birthday based on their userID.

The claim check pattern has two parts. First, when an event is received, you split it and store the payload elsewhere. Second, when the event is processed, you retrieve the relevant information. You can implement both aspects with a pipe.

In the first pipe, you use the enrichment to split the event, in the second to retrieve the payload. Below are several enrichment options, such as using an external API via API Destinations, or using Amazon DynamoDB via Lambda. Other enrichment options are Amazon API Gateway and Step Functions.

Using a pipe to split and retrieve messages has three advantages. First, you keep events concise as they move through the system. Second, you ensure that the event contains all relevant information when it is processed. Third, you encapsulate the complexity of splitting and retrieving within the pipe.

The following code implements a pipe for the claim check pattern using the CDK:

const pipeRole = new iam.Role(this, 'ClaimCheckRole', { assumedBy: new iam.ServicePrincipal('pipes.amazonaws.com') });

claimCheckLambda.grantInvoke(pipeRole);
sourceQueue.grantConsumeMessages(pipeRole);
targetWorkflow.grantStartExecution(pipeRole);

const claimCheckPipe = new pipes.CfnPipe(this, 'ClaimCheckPipe', {
  roleArn: pipeRole.roleArn,
  source: sourceQueue.queueArn,
  target: targetWorkflow.stateMachineArn,
  enrichment: claimCheckLambda.functionArn,
  sourceParameters: { sqsQueueParameters: { batchSize: 1 } },
  targetParameters: { stepFunctionStateMachineParameters: { invocationType: 'FIRE_AND_FORGET' } },
});

Conclusion

This blog post shows how you can implement four enterprise integration patterns with Amazon EventBridge Pipes. In many cases, this reduces the amount of code you have to write and maintain. It can also simplify your architectures and, in some scenarios, reduce costs.

You can find the source code for all the patterns on the AWS samples GitHub repo.

For more serverless learning resources, visit Serverless Land. To find more patterns, go directly to the Serverless Patterns Collection.

Adopt Recommendations and Monitor Predictive Scaling for Optimal Compute Capacity

Post Syndicated from Sheila Busser original https://aws.amazon.com/blogs/compute/evaluating-predictive-scaling-for-amazon-ec2-capacity-optimization/

This post is written by Ankur Sethi, Sr. Product Manager, EC2, and Kinnar Sen, Sr. Specialist Solution Architect, AWS Compute.

Amazon EC2 Auto Scaling helps customers optimize their Amazon EC2 capacity by dynamically responding to varying demand. Based on customer feedback, we enhanced the scaling experience with the launch of predictive scaling policies. Predictive scaling proactively adds EC2 instances to your Auto Scaling group in anticipation of demand spikes. This results in better availability and performance for your applications that have predictable demand patterns and long initialization times. We recently launched a couple of features designed to help you assess the value of predictive scaling – prescriptive recommendations on whether to use predictive scaling based on its potential availability and cost impact, and integration with Amazon CloudWatch to continuously monitor the accuracy of predictions. In this post, we discuss the features in detail and the steps that you can easily adopt to enjoy the benefits of predictive scaling.

Recap: Predictive Scaling

EC2 Auto Scaling helps customers maintain application availability by managing the capacity and health of the underlying cluster. Prior to predictive scaling, EC2 Auto Scaling offered dynamic scaling policies such as target tracking and step scaling. These dynamic scaling policies are configured with an Amazon CloudWatch metric that represents an application’s load. EC2 Auto Scaling constantly monitors this metric and responds according to your policies, thereby triggering the launch or termination of instances. Although it’s extremely effective and widely used, this model is reactive in nature, and for larger spikes, may lead to unfulfilled capacity momentarily as the cluster is scaling out. Customers mitigate this by adopting aggressive scale out and conservative scale in to manage the additional buffer of instances. However, sometimes applications take a long time to initialize or have a recurring pattern with a sudden spike of high demand. These can have an impact on the initial response of the system when it is scaling out. Customers asked for a proactive scaling mechanism that can scale capacity ahead of predictable spikes, and so we delivered predictive scaling.

Predictive scaling was launched to make the scaling action proactive as it anticipates the changes required in the compute demand and scales accordingly. The scaling action is determined by ensemble machine learning (ML) built with data from your Auto Scaling group’s scaling patterns, as well as billions of data points from our observations. Predictive scaling should be used for applications where demand changes rapidly but with a recurring pattern, instances require a long time to initialize, or where you’re manually invoking scheduled scaling for routine demand patterns. Predictive scaling not only forecasts capacity requirements based on historical usage, but also learns continuously, thereby making forecasts more accurate with time. Furthermore, predictive scaling policy is designed to only scale out and not scale in your Auto Scaling groups, eliminating the risk of ending with lesser capacity because of inexact predictions. You must use dynamic scaling policy, scheduled scaling, or your own custom mechanism for scale-ins. In case of exceptional demand spikes, this addition of dynamic scaling policy can also improve your application performance by bridging the gap between demand and predicted capacity.

What’s new with predictive scaling

Predictive scaling policies can be configured in a non-mutative ‘Forecast Only’ mode to evaluate the accuracy of forecasts. When you’re ready to start scaling, you can switch to the ‘Forecast and Scale’ mode. Now we prescriptively recommend whether your policy should be switched to ‘Forecast and Scale’ mode if it can potentially lead to better availability and lower costs, saving you the time and effort of doing such an evaluation manually. You can test different configurations by creating multiple predictive scaling policies in ‘Forecast Only’ mode, and choose the one that performs best in terms of availability and cost improvements.

Monitoring and observability are key elements of AWS Well Architected Framework. Now we also offer CloudWatch metrics for your predictive scaling policies so that that you can programmatically monitor your predictive scaling policy for demand pattern changes or prolonged periods of inaccurate predictions. This will enable you to monitor the key performance metrics and make it easier to adopt AWS Well-Architected best practices.

In the following sections, we deep dive into the details of these two features.

Recommendations for predictive scaling

Once you set up an Auto Scaling group with predictive scaling policy in Forecast Only mode as explained in this introduction to predictive scaling blog post , you can review the results of the forecast visually and adjust any parameters to more accurately reflect the behavior that you desire. Evaluating simply on the basis of visualization may not be very intuitive if the scaling patterns are erratic. Moreover, if you keep higher minimum capacities, then the graph may show a flat line for the actual capacity as your Auto Scaling group capacity is an outcome of existing scaling policy configurations and the minimum capacity that you configured. This makes it difficult to contemplate whether the lower capacity predicted by predictive scaling wouldn’t leave your Auto Scaling group under-scaled.

This new feature provides a prescriptive guidance to switch on predictive scaling in Forecast and Scale mode based on the factors of availability and cost savings. To determine the availability and cost savings, we compare the predictions against the actual capacity and the optimal, required capacity. This required capacity is inferred based on whether your instances were running at a higher or lower value than the target value for scaling metric that you defined as part of the predictive scaling policy configuration. For example, if an Auto Scaling group is running 10 instances at 20% CPU Utilization while the target defined in predictive scaling policy is 40%, then the instances are running under-utilized by 50% and the required capacity is assumed to be 5 instances (half of your current capacity). For an Auto Scaling group, based on the time range in which you’re interested (two weeks as default), we aggregate the cost saving and availability impact of predictive scaling. The availability impact measures for the amount of time that the actual metric value was higher than the target value that you defined to be optimal for each policy. Similarly, cost savings measures the aggregated savings based on the capacity utilization of the underlying Auto Scaling group for each defined policy. The final cost and availability will lead us to a recommendation based on:

  • If availability increases (or remains same) and cost reduces (or remains same), then switch on Forecast and Scale
  • If availability reduces, then disable predictive scaling
  • If availability increase comes at an increased cost, then the customer should take the call based on their cost-availability tradeoff threshold

This figure shows the console view of how the recommendations look like on the Auto Scaling console. For each policy we make prescriptive recommendation of whether to switch to Forecast And Scale mode along with whether doing so can lead to better availability and lower costFigure 1: Predictive Scaling Recommendations on EC2 Auto Scaling console

The preceding figure shows how the console reflects the recommendation for a predictive scaling policy. You get information on whether the policy can lead to higher availability and lower cost, which leads to a recommendation to switch to Forecast and Scale. To achieve this cost saving, you might have to lower your minimum capacity and aim for higher utilization in dynamic scaling policies.

To get the most value from this feature, we recommend that you create multiple predictive scaling policies in Forecast Only mode with different configurations, choosing different metrics and/or different target values. Target value is an important lever that changes how aggressive the capacity forecasts must be. A lower target value increases your capacity forecast resulting in better availability for your application. However, this also means more dollars to be spent on the Amazon EC2 cost. Similarly, a higher target value can leave you under-scaled while reactive scaling bridges the gap in just a few minutes. Separate estimates of cost and availability impact are provided for each of the predictive scaling policies. We recommend using a policy if either availability or cost are improved and the other variable improves or stays the same. As long as there is a predictable pattern, Auto Scaling enhanced with predictive scaling maintains high availability for your applications.

Continuous Monitoring of predictive scaling

Once you’re using a predictive scaling policy in Forecast and Scale mode based on the recommendation, you must monitor the predictive scaling policy for demand pattern changes or inaccurate predictions. We introduced two new CloudWatch Metrics for predictive scaling called ‘PredictiveScalingLoadForecast’ and ‘PredictiveScalingCapacityForecast’. Using CloudWatch mertic math feature, you can create a customized metric that measures the accuracy of predictions. For example, to monitor whether your policy is over or under-forecasting, you can publish separate metrics to measure the respective errors. In the following graphic, we show how the metric math expressions can be used to create a Mean Absolute Error for over-forecasting on the load forecasts. Because predictive scaling can only increase capacity, it is useful to alert when the policy is excessively over-forecasting to prevent unnecessary cost.This figure shows the CloudWatch graph of three metrics – the total CPU Utilization of the Auto Scaling group, the load forecast generated by predictive scaling, and the derived metric using metric math that measures error for over-forecastingFigure 2: Graphing an accuracy metric using metric math on CloudWatch

In the previous graph, the total CPU Utilization of the Auto Scaling group is represented by m1 metric in orange color while the predicted load by the policy is represented by m2 metric in green color. We used the following expression to get the ratio of over-forecasting error with respect to the actual value.

IF((m2-m1)>0, (m2-m1),0))/m1

Next, we will setup an alarm to automatically send notifications using Amazon Simple Notification Service (Amazon SNS). You can create similar accuracy monitoring for capacity forecasts, but remember that once the policy is in Forecast and Scale mode, it already starts influencing the actual capacity. Hence, putting alarms on load forecast accuracy might be more intuitive as load is generally independent of the capacity of an Auto Scaling group.

This figure shows creation of alarm when 10 out of 12 data points breach 0.02 threshold for the accuracy metricFigure 3: Creating a CloudWatch Alarm on the accuracy metric

In the above screenshot, we have set an alarm that triggers when our custom accuracy metric goes above 0.02 (20%) for 10 out of last 12 data points which translates to 10 hours of the last 12 hours. We prefer to alarm on a greater number of data points so that we get notified only when predictive scaling is consistently giving inaccurate results.

Conclusion

With these new features, you can make a more informed decision about whether predictive scaling is right for you and which configuration makes the most sense. We recommend that you start off with Forecast Only mode and switch over to Forecast and Scale based on the recommendations. Once in Forecast and Scale mode, predictive scaling starts taking proactive scaling actions so that your instances are launched and ready to contribute to the workload in advance of the predicted demand. Then continuously monitor the forecast to maintain high availability and cost optimization of your applications. You can also use the new predictive scaling metrics and CloudWatch features, such as metric math, alarms, and notifications, to monitor and take actions when predictions are off by a set threshold for prolonged periods.

Processing geospatial IoT data with AWS IoT Core and the Amazon Location Service

Post Syndicated from Marcia Villalba original https://aws.amazon.com/blogs/compute/processing-geospatial-iot-data-with-aws-iot-core-and-the-amazon-location-service/

This post is written by Swarna Kunnath (Cloud Application Architect), and Anand Komandooru (Sr. Cloud Application Architect).

This blog post shows how to republish messages that arrive from Internet of Things (IoT) devices across AWS accounts using a replatforming approach. A replatforming approach minimizes changes to the core application architecture, allowing an organization to reduce risk and meet business needs more quickly. In this post, you also learn how to track an IoT device’s location using the Amazon Location Service.

The example used in this post relates to an aviation company that has airplanes with line replacement unit devices or transponders. Transponders are IoT devices that send airplane geospatial data (location and altitude) to the AWS IoT Core service. The company’s airplane transponders send location data to the AWS IoT Core service provisioned in an existing AWS account (source account). The solution required manual intervention to track airplane location sent by the transponders.

They must rearchitect their application due to an internal reorganization event. As part of the rearchitecture approach, the business decides to enhance the application to process the transponder messages in another AWS account (destination account). In addition, the business needs full automation of the airplane’s location tracking process, to minimize the risk of the application changes, and to deliver the changes quickly.

Solution overview

The high-level solution republishes the IoT messages from the source account to the destination account using AWS IoT Core, Amazon SQS, AWS Lambda, and integrates the application with Amazon Location Service. IoT messages are replicated to an IoT topic in the destination account for downstream processing, minimizing changes to the original application architecture. Integration with Amazon Location Service automates the process of device location tracking and alert generation.

The AWS IoT platform allows you to connect your internet-enabled devices to the AWS Cloud via MQTT, HTTP, or WebSocket protocol. Once connected, the devices send data to the MQTT topics. Data ingested on MQTT topics is routed into AWS services (Amazon S3, SQS, Amazon DynamoDB, and Lambda) by configuring rules in the AWS IoT Rules Engine. The AWS IoT Rules Engine offers ways to define queries to format and filter messages published by these devices, and supports integration with several other AWS services as targets.

The Amazon Location Service lets you add geospatial data including capabilities such as maps, points of interest, geocoding, routing, geofences, and tracking. The tracker with geofence tracks the location of the device based on the geospatial data in the published IoT messages. Amazon Location Service generates enter and exit events and integrates with Amazon EventBridge and Amazon Simple Notification Service (Amazon SNS) to generate alerts based on defined filters in EventBridge rules.

The solution in this post delivers high availability, scalability, and cost efficiency by using serverless and managed services. The serverless services used by this solution also provide automatic scaling and built-in high availability. Integrating Amazon Location Service with AWS IoT and EventBridge helps to automate the auditing and processing of geospatial messages.

Solution architecture

These steps describe an end-to-end sequence of events:

  1. An IoT device (a transponder in an airplane) publishes a message to the AWS IoT Core service in the source account.
  2. The message arrives at an AWS IoT Core topic in the source account.
  3. AWS IoT Rules Engine receives the message and processes it, using IoT rules attached to the corresponding topic in the source account.
  4. An AWS IoT rule replicates the message to an SQS queue in the destination account.
  5. A Lambda function in the destination account polls the SQS queue and publishes received messages in batches to the destination account IoT topic.
  6. The Location action configured to the IoT rule sends the messages to Amazon Location Service tracker from the IoT topic.
  7. An Amazon Location tracker sends events when an IoT device enters or exits a linked geofence.
  8. EventBridge receives these events and, via the configured event rule, sends out SNS notifications for the configured devices.

Pre-requisites

This example has the following prerequisites:

  1. Access to the AWS services mentioned in this blog post within two AWS Accounts.
  2. A local install of AWS SAM CLI to build and deploy the sample code.

Solution walkthrough

To deploy this solution, first deploy IoT components via the AWS Serverless Application Model (AWS SAM), in the source and destination accounts. After, configure Amazon Location Service resources in the destination account. To learn more, visit the AWS SAM deployment documentation.

Deploying the code

Deploy the following AWS SAM templates in order:

To build and deploy the code, run:

sam build --template <TemplateName>.yaml
sam deploy --guided

Configuring a tracker

Amazon Location Trackers send device location updates that provide data to retrieve current and historical locations for devices.

Using Amazon Location Trackers and Amazon Location Geofences together, you can automatically evaluate the location updates from your IoT devices against your geofences to generate the geofence events. Actions could be taken to generate the alerts based on the areas of interest.

  1. Follow the instructions in the documentation to create the tracker resource from the AWS Management Console. Use this information for the new tracker:
    • Name: Enter a unique name that has a maximum of 100 characters. For example, FlightTracker.
    • Description: Enter an optional description. For example, Tracker for storing device positions.
  2. Configure a Location action to the destination IoT rule that receives messages from the destination IoT topic and publishes them in batches to the configured Tracker device (for example, FlightTracker). The parameters in the JSON data that is returned to the Location action can also be configured via substitution templates.

Geofence collection

Geofences contain points and vertices that form a closed boundary, which defines an area of interest. For example, flight origin and destination details. You can use tools, such as GeoJSON.io, to draw geofences and save the output as a GeoJSON file. Follow the instructions in the documentation to create the GeoJSON file and link it to the geofence collection.

  1. Create the geofence collection with a GeoJSON file and link it to the tracker you just created.
  2. Link the tracker to the geofence by following these instructions and start tracking the device’s location updates. You can link them together so that you automatically evaluate location updates against all your geofences. You can evaluate device positions against geofences on demand as well.

When device positions are evaluated against geofences, they generate events. For example, when a plane enters or exits a location specified in the geofence.

You can configure EventBridge with rules to react to these events. You can set up SNS to notify your clients when a specific tracker device location changes. Follow the instructions in the documentation on how to set up EventBridge rules to integrate with Amazon Location Service events.

Testing the solution

You can test the first part of the solution by sending an IoT message with location details in the JSON format from the source account and verify that the message arrives at the destination account SQS queue. Detailed instructions to publish a test message from the source account that includes location information (latitude and longitude) can be found here.

Messages from the destination account SQS queue are published to the Amazon Location Service Tracker. When the location in the test message matches the criteria provided in the geofence, Amazon Location Service generates an event. EventBridge has a rule configured that gets matched when an Amazon Location tracker event arrives, and the rule target is an SNS topic that sends an email or text message to the client.

Cleaning up

To avoid incurring future charges, delete the CloudFormation stacks, location tracker, and geofence collection created as part of the solution walk-through. Replace the resource identifiers in the following commands with the ID/name of the resources.

  1. Delete the SAM application stack:
    aws cloudformation delete-stack --stack-name <StackName>
    

    Refer to this documentation for further information.

  2. Delete the location tracker:
    aws location delete-tracker --tracker-name <TrackerName>
  3. Delete the geofence collection:
    aws location delete-geofence-collection --collection-name <GeoCollectionName>

Conclusion

This blog post shows how to create a serverless solution for cross account IoT message publishing and tracking device location updates using Amazon Location Service.

It describes the process of how to publish AWS IoT messages across multiple accounts. Integration with the Amazon Location Service shows how to track IoT device location updates and generate alerts, alleviating the need for manual device location tracking.

For more serverless learning resources, visit Serverless Land.