Post Syndicated from Rushabh Lokhande original https://aws.amazon.com/blogs/messaging-and-targeting/automate-marketing-campaigns-with-real-time-customer-data-using-amazon-pinpoint/
Amazon Pinpoint offers marketers and developers one customizable tool to deliver customer communications across channels, segments, and campaigns at scale. Amazon Pinpoint makes it easy to run targeted campaigns and drive customer communications across different channels: email, SMS, push notifications, in-app messaging, or custom channels. Amazon Pinpoint campaigns enables you define which users to target, determine which messages to send, schedule the best time to deliver the messages, and then track the results of your campaign.
In many cases, the customer data resides in a third-party system such as a CRM, Customer Data Platform, Point of Sales, database and data warehouse. This customer data represents a valuable asset for your organization. Your marketing team needs to leverage each piece of this data to elevate the customer experience.
In this blog post we will demonstrate how you can leverage users’ clickstream data stored in database to build user segments and launch campaigns using Amazon Pinpoint. Also, we will showcase the full architecture of the data pipeline including other AWS services such as Amazon RDS, AWS Data Migration Service, Amazon Kinesis and AWS Lambda.
Let us understand our case study with an example: a customer currently has digital touch points such as a Website and a Mobile App to collect the users’ clickstreams and behavioral data where they are storing them in a MySQL database. Marketing teams want to leverage the collected data to deliver a personalized experience by leveraging Amazon Pinpoint capabilities.
You can find below the detail of a specific use case covered by the proposed solution:
- All the clickstream and customer data are stored in MySQL DB
- Your marketing team wants to create a personalized Amazon Pinpoint campaigns based on the user status and experience. Ex:
- Customers who interested in specific offering to activate for them campaign based on their interest
- Communicate with the preferred language of the user
Please note that this use case is used to showcase the proposed solution capabilities. However, it is not limited to this specific use case since you can leverage any customer collected dimension/attribute to create specific campaign to achieve a specific marketing use case.
In this post, we provide a guided journey on how marketers can collect, segment, and activate audience segments in real-time to increase their agility in managing campaigns.
Overview of solution
The use case covered in this post, focuses on demonstrating the flexibility offered by Amazon Pinpoint in both inbound (Ingestion) and outbound (Activation) stream of customer data. For the inbound stream, Amazon Pinpoint gives you a variety of ways to import your customer data, including:
- CSV/JSON import from the AWS console
- API operation to create a single or multiple endpoints
- Programmatically create and execute import jobs
We will focus on building a real-time inbound stream of customer data available within an Amazon RDS MySQL database specifically. It is important to mention that similar approach can be implemented to ingest data from third-party systems if any.
For the outbound stream, activating customer data using Amazon Pinpoint can be achieved using the following two methods:
- Campaign: a campaign is a messaging initiative that engages a specific audience segment.
- Journey: a journey is a customized, multi-step engagement experience.
The result of customer data activation cannot be completed without specifying the targeted channel. A channel represents the platform through which you engage your audience segment with messages. For example, Amazon Pinpoint customers can optimize how they target notifications to prospective customers through LINE message and email. They can deliver notifications with more information on prospected customer’s product information such as sales, new products etc. to the appropriate audience.
Amazon Pinpoint supports the following channels:
- Push notifications
- SMS
- Voice
- In-app messages
In addition to these channels, you can also extend the capabilities to meet your specific use case by creating custom channels. You can use custom channels to send messages to your customers through any service that has an API including third-party services. For example, you can use custom channels to send messages through third-party services such as WhatsApp or Facebook Messenger. We will focus on developing an Amazon Pinpoint connector using custom channel to target your customers on third-party services through API.
Solution Architecture
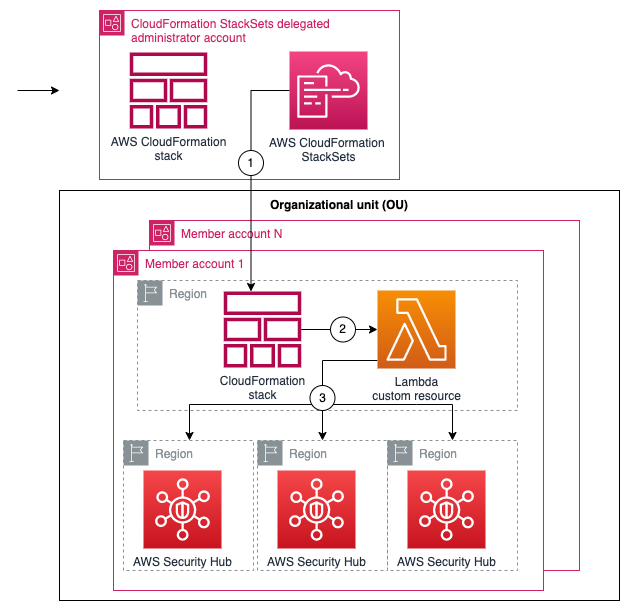
The below diagram illustrates the proposed architecture to address the use case. Moving from left to right:
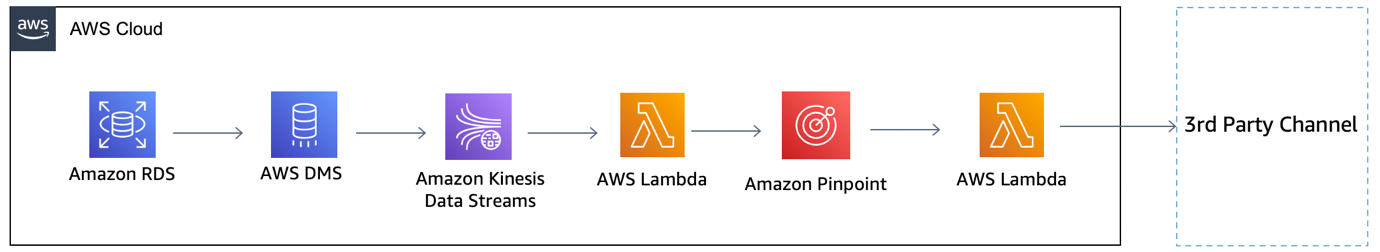
Fig 1: Architecture Diagram for the Solution
- Amazon RDS: This hosts customer database where you can have one or many tables contains customer data.
- AWS Data Migration Service (DMS): This acts as the glue between Amazon RDS MySQL and the downstream services by replicating any transformation that happens at the record level in the configured customer tables.
- Amazon Kinesis Data Streams: This is the destination endpoint for AWS DMS. It will carry all the transformed records for the next stage of the pipeline.
- AWS Lambda (inbound): The inbound AWS Lambda triggers the Kinesis Data Streams, process the mutated records, and ingest them in Amazon Pinpoint.
- Amazon Pinpoint: This act as the centralized place to define customer segments and launch campaigns.
- AWS Lambda (outbound): This act as the custom channel destination for the campaigns activated from Amazon Pinpoint.
To illustrate how to set up this architecture, we’ll walk you through the following steps:
- Deploying an AWS CDK stack to provision the following AWS Resources
- Validate the Deployment.
- Run a Sample Workflow – This workflow will run an AWS Glue PySpark job that uses a custom Python library, and an upgraded version of boto3.
- Cleaning up your resources.
Prerequisites
Make sure that you complete the following steps as prerequisites:
- Have an AWS account. For this post, you configure the required AWS resources using AWS CloudFormation. If you haven’t signed up, complete the following tasks:
- Create an account. For instructions, see Sign Up for AWS
- Create an AWS Identity and Access Management (IAM) role. For instructions, see Create IAM Role.
- Some of the AWS Services or service features are not available in all regions. Therefore, we suggest to deploy the solution architecture in one of the regions below:
- eu-west-1 (Ireland)
- us-east-1 (N. Virginia)
- Setup AWS account profile
- Have the following installed and configured on your machine:
- AWS Command Line Interface (AWS CLI), authenticated and configured
- Python 3.8+
- AWS CDK
- Git
- Update latest CDK version:
npm install -g aws-cdk@latest
The Solution
Launching your AWS CDK Stack
Step 1a: Open your device’s command line or Terminal.
Step1b: Checkout Git repository to a local directory on your device:
git clone https://github.com/aws-samples/amazon-pinpoint-realtime-campaign-optimization-example.gitStep 2: Change directories to the new directory code location:
cd amazon-pinpoint-realtime-campaign-optimization-exampleStep 3: Update your AWS account number and region:
- Edit config.py with your choice to tool or command line
- look for section “Account Setup” and update your account number and region

Fig 2: Configuring config.py for account-id and region
- look for section “VPC Parameters” and update your VPC and subnet info

Fig 3: Configuring config.py for VPC and subnet information


Step 4: Verify if you are in the directory where app.py file is located:
ls -ltr app.pyStep 5: Create a virtual environment:
macOS/Linux:
python3 -m venv .envWindows:
python -m venv .envStep 6: Activate the virtual environment after the init process completes and the virtual environment is created:
macOS/Linux:
source .env/bin/activateWindows:
.env\Scripts\activate.batStep 7: Install the required dependencies:
pip3 install -r requirements.txtStep 8: Bootstrap the cdk app using the following command:
cdk bootstrap aws://<AWS_ACCOUNTID>/<AWS_REGION>Replace the place holder AWS_ACCOUNTID and AWS_REGION with your AWS account ID and the region to be deployed.
This step provisions the initial resources, including an Amazon S3 bucket for storing files and IAM roles that grant permissions needed to perform deployments.
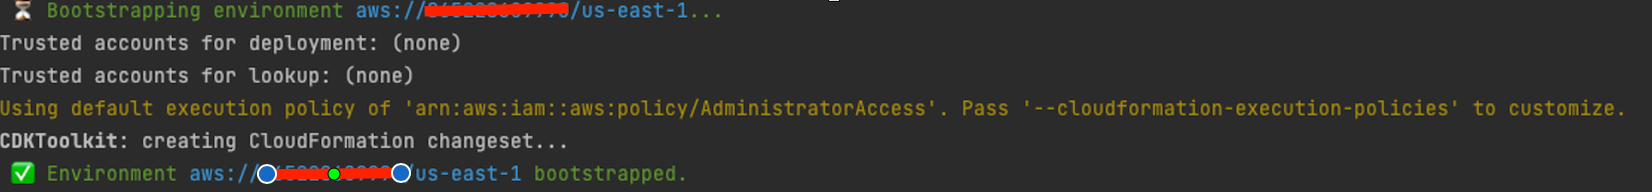
Fig 4: Bootstrapping CDK environment
Please note, if you have already bootstrapped the same account previously, you cannot bootstrap account, in such case skip this step or use a new AWS account.
Step 9: Make sure that your AWS profile is setup along with the region that you want to deploy as mentioned in the prerequisite. Synthesize the templates. AWS CDK apps use code to define the infrastructure, and when run they produce or “synthesize” a CloudFormation template for each stack defined in the application:
cdk synthesizeStep 10: Deploy the solution. By default, some actions that could potentially make security changes require approval. In this deployment, you’re creating an IAM role. The following command overrides the approval prompts, but if you would like to manually accept the prompts, then omit the –require-approval never flag:
cdk deploy "*" --require-approval neverWhile the AWS CDK deploys the CloudFormation stacks, you can follow the deployment progress in your terminal.
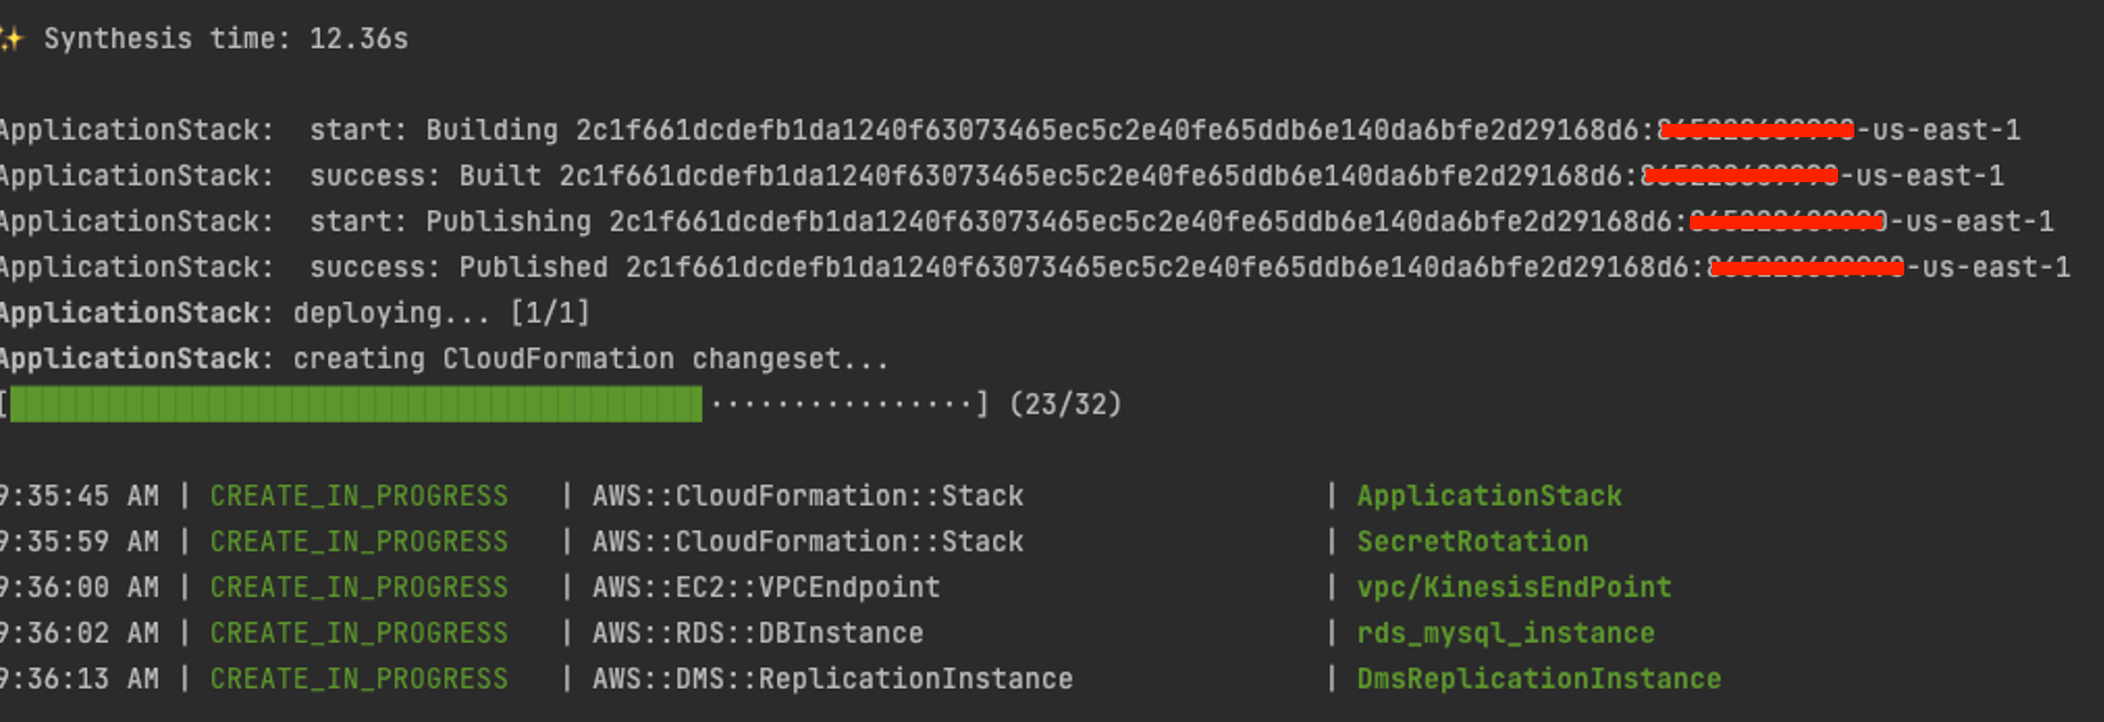
Fig 5: AWS CDK Deployment progress in terminal
Once the deployment is successful, you’ll see the successful status as follows:
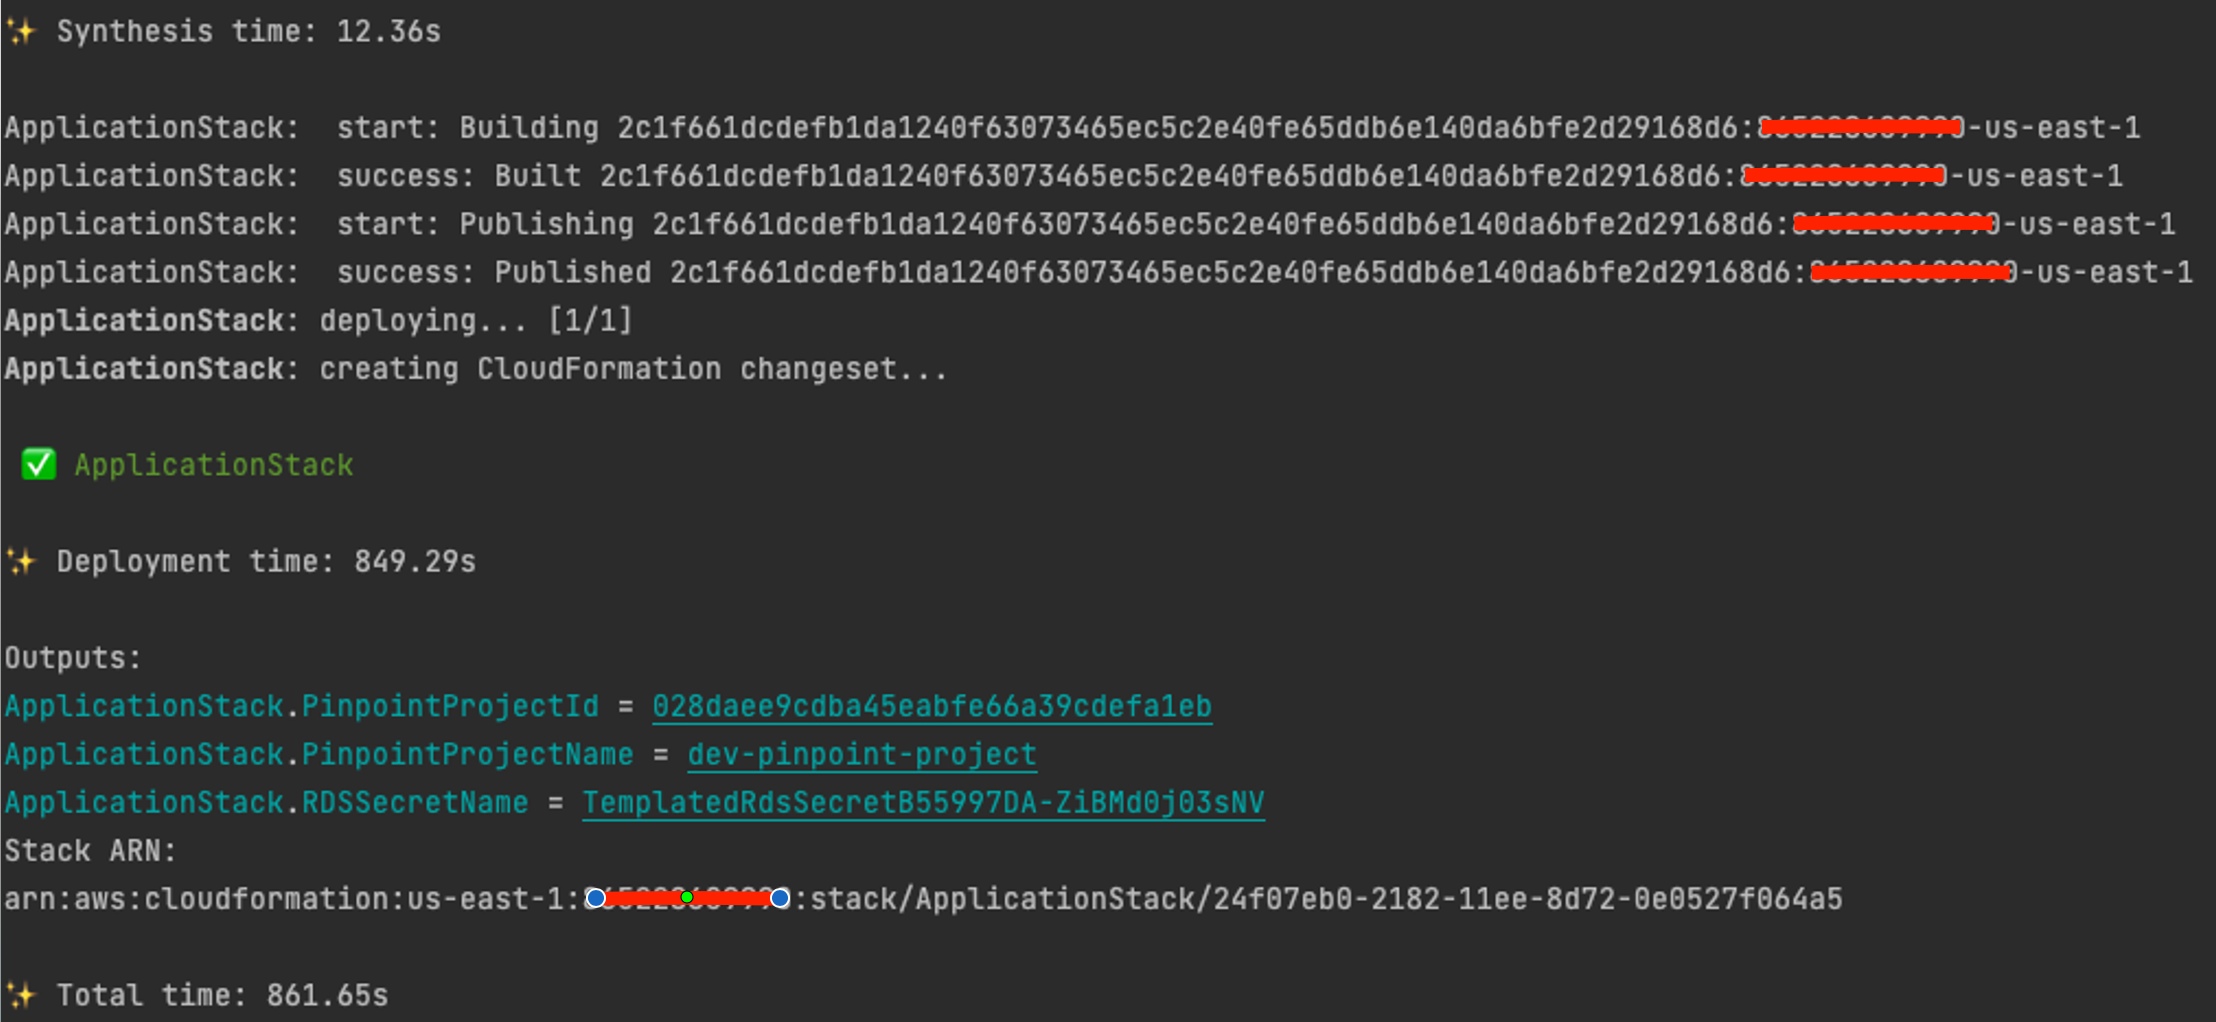
Fig 6: AWS CDK Deployment completion success
Step 11: Log in to the AWS Console, go to CloudFormation, and see the output of the ApplicationStack:
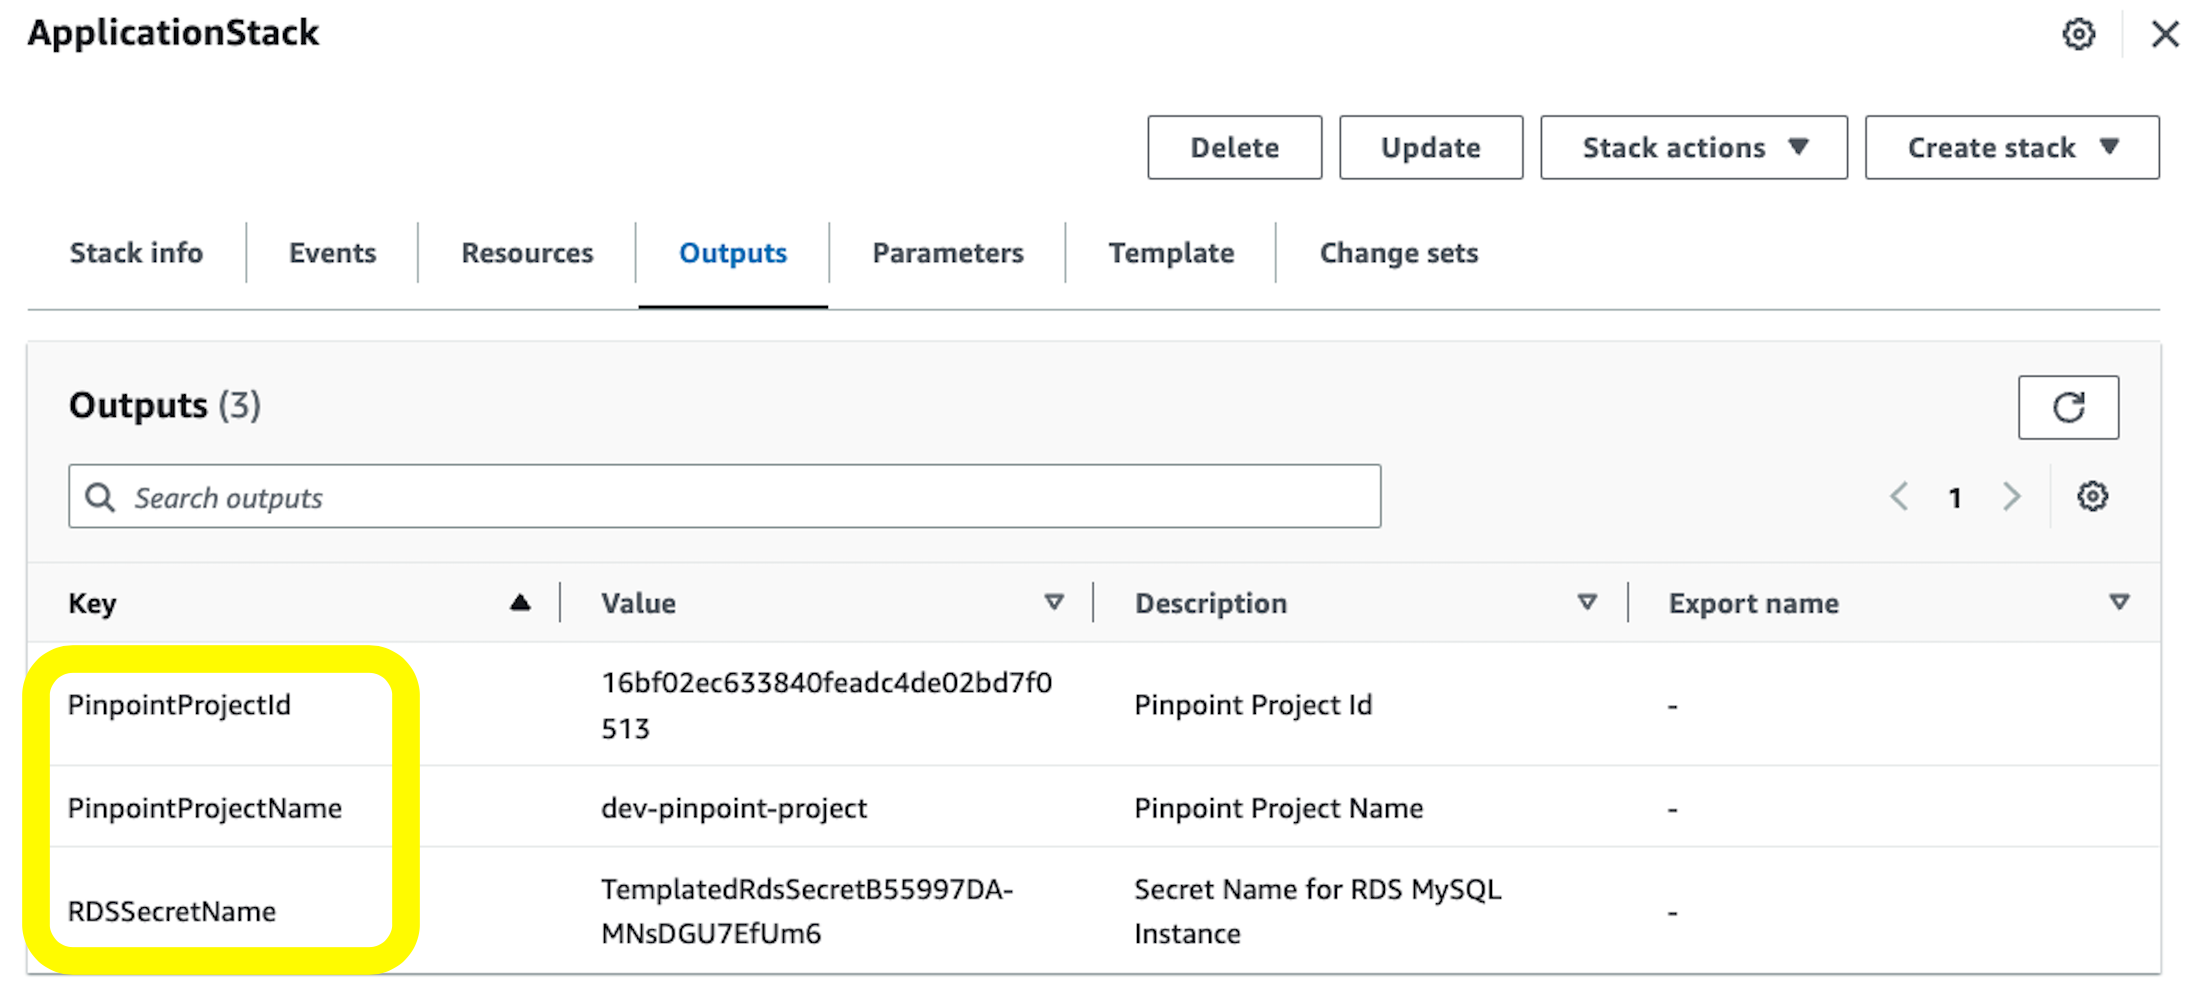
Fig 7: AWS CloudFormation stack output
Note the values of PinpointProjectId, PinpointProjectName, and RDSSecretName variables. We’ll use them in the next step to upload our artifacts
Testing The Solution
In this section we will create a full data flow using the below steps:
- Ingest data in the customer_tb table within the Amazon RDS MySQL DB instance
- Validate that AWS Data Migration Service created task is replicating the changes to the Amazon Kinesis Data Streams
- Validate that endpoints are created within Amazon Pinpoint
- Create Amazon Pinpoint Segment and Campaign and activate data to Webhook.site endpoint URL
Step 1: Connect to MySQL DB instance and create customer database
-
- Sign in to the AWS Management Console and open the AWS Cloud9 console at https://console.aws.amazon.com/cloud9
- Click Create environment
- Name: mysql-cloud9-01 (for example)
- Click Next
- Environment type: Create a new EC2 instance for environment (direct access)
- Instance type: t2.micro
- Timeout: 30 minutes
- Platform: Amazon Linux 2
- Network settings under VPC settings select the same VPC where the MySQL DB instance was created. (this is the same VPC and Subnet from step 3.3)
- Click Next
- Review and click Create environment
- Select the created AWS Cloud9 from the AWS Cloud9 console at https://console.aws.amazon.com/cloud9 and click Open in Cloud9. You will have access to AWS Cloud9 Linux shell.
- From Linux shell, update the operating system and :
sudo yum update -y - From Linux shell, update the operating system and :
sudo yum install -y mysql - To connect to the created MySQL RDS DB instance, use the below command in the AWS Cloud9 Linux shell:
mysql -h <<host>> -P 3308 --user=<<username>> --password=<<password>>
-
-
- To get values for dbInstanceIdentifier, username, and password
- Navigate to the AWS Secrets Manager service
- Open the secret with the name created by the CDK application
- Select ‘Reveal secret value’ and copy the respective values and replace in your command
- After you enter the password for the user, you should see output similar to the following.
-
Welcome to the MariaDB monitor.  Commands end with ; or \g.
Your MySQL connection id is 27
Server version: 8.0.32 Source distribution
Copyright (c) 2000, 2018, Oracle, MariaDB Corporation Ab and others.
Type 'help;' or '\h' for help. Type '\c' to clear the current input statement.
MySQL [(none)]>
- To get values for dbInstanceIdentifier, username, and password
-
Step 2: Ingest data in the customer_tb table within the Amazon RDS MySQL DB instance Once the connection to the MySQL DB instance established, using the same AWS Cloud9 Linux shell connected to the MySQL RDS DB execute following commands.
- Create database pinpoint-test-db:
CREATE DATABASE `pinpoint-test-db`; - Create table customer-tb:
Use `pinpoint-test-db`; CREATE TABLE `customer_tb` (`userid` int NOT NULL, `email` varchar(150) DEFAULT NULL, `language` varchar(45) DEFAULT NULL, `favourites` varchar(250) DEFAULT NULL, PRIMARY KEY (`userid`); - You can verify the schema using the below SQL command:
-
DESCRIBE `pinpoint-test-db`.customer_tb;
Fig 8: Verify schema for customer_db table
- Insert records in customer_tb table:
Use `pinpoint-test-db`; insert into customer_tb values (1,'[email protected]','english','football'); insert into customer_tb values (2,'[email protected]','english','basketball'); insert into customer_tb values (3,'[email protected]','french','football'); insert into customer_tb values (4,'[email protected]','french','football'); insert into customer_tb values (5,'[email protected]','french','basketball'); insert into customer_tb values (6,'[email protected]','french','football'); insert into customer_tb values (7,'[email protected]','french',null); insert into customer_tb values (8,'[email protected]','english','football'); insert into customer_tb values (9,'[email protected]','english','football'); insert into customer_tb values (10,'[email protected]','english',null);- Verify records in customer_tb table:
select * from `pinpoint-test-db`.`customer_tb`;
Fig 9: Verify data for customer_db table
Step 3: Validate that AWS Data Migration Service created task is replicating the changes to the Amazon Kinesis Data Streams
-
- Sign in to the AWS Management Console and open the AWS DMS console at https://console.aws.amazon.com/dms/v2
- From the navigation panel, choose Database migration tasks.
- Click on the created task created by CDK code ‘dmsreplicationtask-*’
- Start the replication task

Fig 10: Starting AWS DMS Replication Task
- Make sure that Status is Replication ongoing

Fig 11: AWS DMS Replication statistics
- Navigate to Table Statistics and make sure that the number of Inserts is equal to 10 and Load state is Table completed*
Fig 12: AWS DMS Replication statistics
Step 4: Validate that endpoints are created within Amazon Pinpoint
- Sign in to the AWS Management Console and open the Amazon Pinpoint console at https://console.aws.amazon.com/pinpoint/
- Click on Amazon Pinpoint Project Demo created by CDK stack “dev-pinpoint-project”
- From the left menu, click on Analytics and validate that the Active targetable endpoints are equal to 10 as shown below:

Fig 13: Amazon Pinpoint endpoint summary
Step 5: Create Amazon Pinpoint Segment and Campaign
Step 5.1: Create Amazon Pinpoint Segment
- Sign in to the AWS Management Console and open the Amazon Pinpoint console at https://console.aws.amazon.com/pinpoint/
- Click on Amazon Pinpoint Project Demo created by CDK stack “dev-pinpoint-project”
- from the left menu, click on Segments and click Create a segment
- create Segment using the below configurations:
- Name: English Speakers
- Under criteria:
- Attribute: Language
- Operator: Conatins
- Value: english

Fig 14: Amazon Pinpoint segment summary
- Click create segment
Step 5.2: Create Amazon Pinpoint Campaign
- from the left menu, click on Campaigns and click Create a campaign
- set the Campaign name to test campaign and select Custom option for Channel as shown below:

Fig 15: Amazon Pinpoint create campaign
- Click Next
- Select English Speakers from Segment as shown below and click Next:

Fig 16: Amazon Pinpoint segment
- Choose Lambda function channel type and select outbound lambda function with name pattern as ApplicationStack-lambdaoutboundfunction* from the dropdown as shown below:

Fig 17: Amazon Pinpoint message creation
- Click Next
- Choose At a specific time option and immediately to send the campaign as show below:

Fig 18: Amazon Pinpoint campaign scheduling
If you push more messages or records into Amazon RDS (from step 2.4), you will need to create a new campaign (from step 4.2) to process the new messages.
- Click Next, review the configuration and click Launch campaign.
- Navigate to dev-pinpoint-project and select the campaign created in previous step. You should see status as ‘Complete’

Fig 19: Amazon Pinpoint campaign processing status
- Navigate to dev-pinpoint-project dashboard and select your campaign in ‘Campaign metrics’ dashboard, you will see the statistics for the processing.

Fig 20: Amazon Pinpoint campaign metrics
Accomplishments
This is a quick summary of what we accomplished:
- Created an Amazon RDS MySQL DB instance and define customer_tb table schema
- Created an Amazon Kinesis Data Stream
- Replicated database changes from the Amazon RDS MySQL DB to Amazon Kinesis Data Stream
- Created an AWS Lambda function triggered by Amazon Kinesis Data Stream to ingest database records in Amazon Pinpoints as User endpoints using AWS SDK
- Created an Amazon Pinpoint Project, segment and campaign
- Created an AWS Lambda function as custom channel for Amazon Pinpoint campaign
- Tested end-to-end data flow from Amazon RDS MySQL DB instance to third party endpoint
Next Steps
You have now gained a good understanding of Amazon Pinpoint agnostic data flow but there are still many areas left for exploration. What this workshop hasn’t covered is the operation of other communication channels such as Email, SMS, Push notification and Voice outbound. You can enable the channels that are pertinent to your use case and send messages using campaigns or journeys.
Clean Up
Make sure that you clean up all of the other AWS resources that you created in the AWS CDK Stack deployment. You can delete these resources via the AWS CDK Destroy command as follows or the CloudFormation console.
To destroy the resources using AWS CDK, follow these steps:
- Follow Steps 1-5 from the ‘Launching your CDK Stack’ section.
- Destroy the app by executing the following command:
cdk destroySummary
In this post, you have now gained a good understanding of Amazon Pinpoint flexible real-time data flow. By implementing the steps detailed in this blog post, you can achieve a seamless integration of your customer data from Amazon RDS MySQL database to Amazon Pinpoint where you can leverage segments and campaigns to activate data using custom channels to third-party services via API. The demonstrated use case focuses on Amazon RDS MySQL database as a data source. However, there are still many areas left for exploration. What this post hasn’t covered is the operation of integrating customer data from other type of data sources such as MongoDB, Microsoft SQL Server, Google Cloud, etc. Also, other communication channels such as Email, SMS, Push notification and Voice outbound can be used in the activation layer. You can enable the channels that are pertinent to your use case and send messages using campaigns or journeys, and get a complete view of their customers across all touchpoints and can lead to less relevant marketing campaigns.
About the Authors
-

Bret Pontillo is a Senior Data Architect with AWS Professional Services Analytics Practice. He helps customers implement big data and analytics solutions. Outside of work, he enjoys spending time with family, traveling, and trying new food. 
Rushabh Lokhande is a Data & ML Engineer with AWS Professional Services Analytics Practice. He helps customers implement big data, machine learning, and analytics solutions. Outside of work, he enjoys spending time with family, reading, running, and golf. 
Ghandi Nader is a Senior Partner Solution Architect focusing on the Adtech and Martech industry. He helps customers and partners innovate and align with the market trends related to the industry. Outside of work, he enjoys spending time cycling and watching formula one.


 Gaurav Sharma is a Specialist Solutions Architect(Analytics) at Amazon Web Services (AWS), supporting US public sector customers on their cloud journey. Outside of work, Gaurav enjoys spending time with his family and reading books.
 Damon Cortesi is a Principal Developer Advocate with Amazon Web Services. He builds tools and content to help make the lives of data engineers easier. When not hard at work, he still builds data pipelines and splits logs in his spare time.
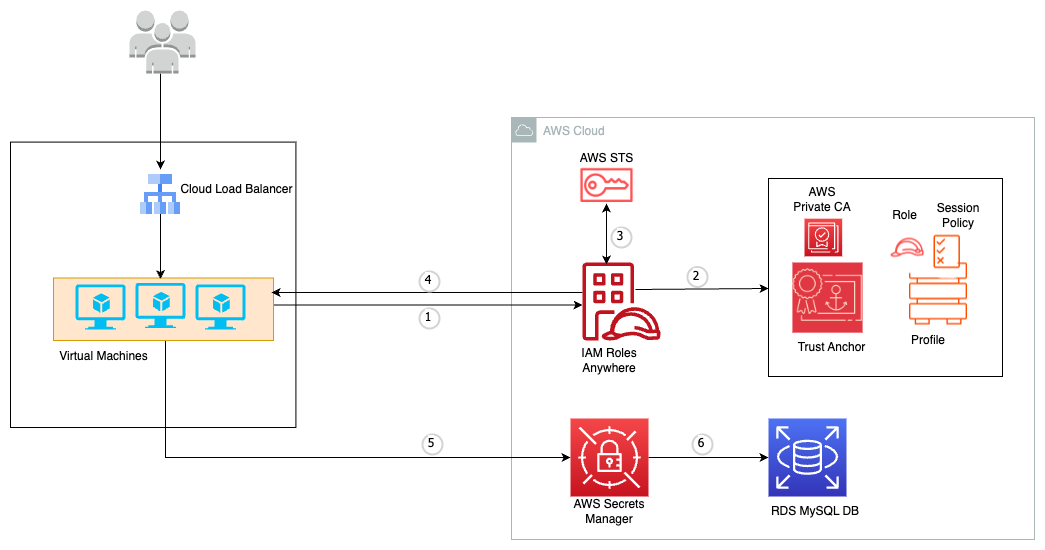


 Avijit Goswami is a Principal Solutions Architect at AWS specialized in data and analytics. He supports AWS strategic customers in building high-performing, secure, and scalable data lake solutions on AWS using AWS managed services and open-source solutions. Outside of his work, Avijit likes to travel, hike, watch sports, and listen to music.
 Rajarshi Sarkar is a Software Development Engineer at Amazon EMR/Athena. He works on cutting-edge features of Amazon EMR/Athena and is also involved in open-source projects such as Apache Iceberg and Trino. In his spare time, he likes to travel, watch movies, and hang out with friends.


 Navnit Shuklaserves as an AWS Specialist Solution Architect with a focus on Analytics. He possesses a strong enthusiasm for assisting clients in discovering valuable insights from their data. Through his expertise, he constructs innovative solutions that empower businesses to arrive at informed, data-driven choices. Notably, Navnit Shukla is the accomplished author of the book titled “Data Wrangling on AWS.
 Patrick Muller works as a Senior Data Lab Architect at AWS. His main responsibility is to assist customers in turning their ideas into a production-ready data product. In his free time, Patrick enjoys playing soccer, watching movies, and traveling.
 Amogh Gaikwad is a Senior Solutions Developer at Amazon Web Services. He helps global customers build and deploy AI/ML solutions on AWS. His work is mainly focused on computer vision, and natural language processing and helping customers optimize their AI/ML workloads for sustainability. Amogh has received his master’s in Computer Science specializing in Machine Learning.
 Sheela Sonone is a Senior Resident Architect at AWS. She helps AWS customers make informed choices and tradeoffs about accelerating their data, analytics, and AI/ML workloads and implementations. In her spare time, she enjoys spending time with her family – usually on tennis courts.


 Rohit Vashishtha is a Senior Analytics Specialist Solutions Architect at AWS based in Dallas, Texas. He has over 17 years of experience architecting, building, leading, and maintaining big data platforms. Rohit helps customers modernize their analytic workloads using the breadth of AWS services and ensures that customers get the best price/performance with utmost security and data governance.
 Harshida Patel is a Principal specialist SA with AWS.
 Nita Shah is an Analytics Specialist Solutions Architect at AWS based out of New York. She has been building data warehouse solutions for over 20 years and specializes in Amazon Redshift. She is focused on helping customers design and build enterprise-scale well-architected analytics and decision support platforms.
 Yanzhu Ji is a Product Manager in the Amazon Redshift team. She has experience in product vision and strategy in industry-leading data products and platforms. She has outstanding skill in building substantial software products using web development, system design, database, and distributed programming techniques. In her personal life, Yanzhu likes painting, photography, and playing tennis.


 RamC Venkatasamy is a Solutions Architect based in Bloomington, Illinois. He helps AWS Strategic customers transform their businesses in the cloud. With a fervent enthusiasm for Serverless, Event-Driven Architecture and GenAI.