As customers increasingly seek to harness the power of generative AI (GenAI) and machine learning to deliver cutting-edge applications, the need for a flexible, intuitive, and scalable development platform has never been greater. In this landscape, Streamlit has emerged as a standout tool, making it easy for developers to prototype, build, and deploy GenAI-powered apps with minimal friction. It is an open-source Python framework designed to simplify the development of custom web applications for data science, machine learning, and GenAI projects. With Streamlit, developers can quickly transform Python scripts into interactive dashboards, LLM-powered chatbots, and web apps, using just a few lines of code. Its unique combination of simplicity, interactivity, and speed is the perfect complement to the rapid advancements in AI.
When deploying Streamlit applications, customers often face the challenge of ensuring their applications are highly available and can scale to meet a variable amount of demand. To achieve these goals, customers are looking at serverless approaches to deploying their Streamlit apps. With a serverless application, you only pay for the resources required and do not want have to worry about managing servers or capacity planning.
In this post, we will walk you through deploying containerized, serverless Streamlit applications automatically via HashiCorp Terraform, an Infrastructure as Code (IaC) tool that enables users to define and provision infrastructure across cloud platforms.
Solution Overview
For this solution, we have the Streamlit app running on an Amazon Elastic Container Service (ECS) cluster across multiple availability zones (AZs), using AWS Fargate to manage the compute. Fargate is a serverless, pay-as-you-go compute engine that lets you focus on building apps without managing servers. Using Fargate helps reduce the undifferentiated heavy lifting that can come with building and maintaining web applications. It is also often desirable to use a Content Delivery Network (CDN) to ensure low latency for users globally by caching the content at edge locations closer to where the users are geographically located.
Let’s zoom in on the two architectures – the Streamlit App hosting architecture, and the Streamlit App deployment pipeline.
Streamlit app hosting
In the above architecture, the following flow applies:
Users access the Streamlit App using the public DNS endpoint for an Amazon CloudFront distribution.
Using an Internet Gateway (IGW), user requests are routed to a public-facing Application Load Balancer (ALB).
This ALB has target groups which map to ECS task nodes that are part of an ECS cluster running in two AZs (us-east-1a and us-east-1b in this example).
Fargate will automatically scale the underlying compute nodes in the ECS cluster based on the demand.
Streamlit app deployment pipeline
In the above architecture, the following flow applies:
User develops a local Streamlit App and defines the path of these assets in the module configuration, then runs terraform apply to generate a local .zip file comprised of the Streamlit App directory, and upload this to an Amazon S3 bucket (Streamlit Assets) with versioning enabled, which is configured to trigger the Streamlit CI/CD pipeline to run.
AWS CodePipeline (Streamlit CI/CD pipeline) begins running. The pipeline copies the .zip file from the Streamlit Assets S3 Bucket, stores the contents in a connected CodePipeline Artifacts S3 bucket, and passes the asset to the AWS CodeBuild project that is also part of the pipeline.
CodeBuild (Streamlit CodeBuild Project) configures a compute/build environment and fetches a Python Docker Image from a public Amazon ECR repository. CodeBuild uses Docker to build a new Streamlit App image based on what is defined in the Dockerfile within the .zip file, and pushes the new image to a private ECR repository. It tags the image with latest, an app_version (user-defined in Terraform), as well as the S3 Version ID of the .zip file and pushes the image to ECR.
ECS has a task definition that references the image in ECR based on the S3 Version ID tag which will always be a unique value, as it is generated whenever a new version of the file is created. This also serves as data lineage so versions of the Streamlit App .zip files in S3 can be linked to versions of the image stored in ECR. Once a new image is pushed to ECR (with a unique image tag), the task definition is updated and the ECS service begins a new deployment using the new version of the Streamlit App.
When a new image is pushed to ECR, the Terraform Module is configured to use the local-exec provisioner to run an AWS CLI command that creates a CloudFront invalidation. This enables users of the Streamlit app to use the new version without waiting for the time-to-live (TTL) of the cached file to expire on the edge locations (default is 24 hours). Both of these pipelines are built and packaged into a Terraform module that can be reused efficiently with only a few lines of code.
Both of these pipelines are built and packaged into a Terraform module that can be reused efficiently with only a few lines of code.
Prerequisites
This solution requires the following prerequisites:
An AWS account. If you don’t have an account, you can sign up for one.
Terraform v1.0.0 or newer installed.
python v3.8 or newer installed.
A Streamlit app. If you don’t have a Streamlit project already, you can download this app directory as a sample Streamlit app for this post and save it to a local folder.
Your folder structure will look something like this:
In the same folder where you have the your Streamlit app saved, in the above example in the terraform_streamlit_folder, you will create and initialize a new Terraform project.
In your preferred terminal, create a new file named main.tf by running the following command on Unix/Linux machines, or an equivalent command on Windows machines:
touch main.tf
Open up the main.tf file and add the following code to it:
module "serverless-streamlit-app" {
  source          = "aws-ia/serverless-streamlit-app/aws"
  app_name        = "streamlit-app"
  app_version     = "v1.1.0"
  path_to_app_dir = "./app" # Replace with path to your app
}
This code utilizes a module block with a source pointing to the Terraform module, and the appropriate input variables passed in. When Terraform encounters a module block, it loads and processes that module’s configuration files using the source. The Serverless Streamlit App Terraform module has many optional input variables. If you have existing resources, such as an existing VPC, subnets, and security groups that you’d like to reuse instead of deploying new ones, you can use the module’s input variables to reference your existing resources. However, in this post, we’re deploying all of the resources in the above architecture from scratch. Here, we simply define the source that references the module hosted in the Terraform Registry, provide an app_name that will be used as a prefix for naming your resources, the app_version that is used for tracking changes to your app, and the path_to_app_dir which is the path to the local directory where the assets for your Streamlit app are stored.
Save the file.
To initialize the Terraform working directory, run the following command in your terminal:
terraform init
The output will contain a successful message like the following:
"Terraform has been successfully initialized"
Output the CloudFront URL
To be able to easily access the Cloudfront URL of the deployed Streamlit application, you can add the URL as a Terraform output.
In your terminal, create a new file named outputs.tf by running the following command on Unix/Linux machines, or an equivalent command on Windows machines:
touch outputs.tf
Open up the outputs.tf file and add the following code to it:
output "streamlit_cloudfront_distribution_url" {
  value = module.serverless-streamlit-app.streamlit_cloudfront_distribution_url
}
Save the file. Now, your folder structure will look like:
Now you can use Terraform to deploy the resources defined in your main.tf file.
In your terminal, run the following command to apply to deploy the infrastructure. This includes the hosting for your Streamlit application using ECS and CloudFront, as well as the pipeline that is used to push updates.
terraform apply
When the apply command finishes running, you’ll see the Terraform outputs displayed in the terminal.
Navigate to the streamlit_cloudfront_distribution_url to see your Streamlit application that is hosted on AWS.
When you make changes to your Streamlit codebase, you can go ahead and re-run terraform apply to push your new changes to your cloud environment.
When updating the Streamlit codebase, the CodePipeline and CodeBuild processes kick off to automatically update your new changes, which get reflected on your Streamlit application. CodePipeline automates the entire software release process, managing stages like source retrieval, building, testing, and deployment. It integrates with AWS services and third-party tools (such as GitHub and Jenkins) to enhance automation, speed, and security. CodeBuild focuses on automating code compilation, testing, and packaging, supporting multiple languages and custom Docker environments, while integrating with CodePipeline for scalable, secure builds. With this CI/CD pipeline, when you make changes to your code, all you need to run is terraform apply to update your cloud environment. For an example buildspec, see the example in the repo.
You can find full examples of deploying the infrastructure with and without existing resources in the GitHub repository.
Clean up
When you no longer need the resources deployed in this post, you can clean up the resources by using the Terraform destroy command. Simply run terraform destroy . This will remove all of the resources you have deployed in this post with Terraform.
Conclusion
Building serverless Streamlit applications with Terraform on AWS offers a powerful combination of scalability, efficiency, and automation. As you continue to build and refine your Streamlit applications, Terraform’s flexibility ensures that your infrastructure can evolve seamlessly, supporting rapid innovation and agile development. With Streamlit and Terraform, you have the tools to create dynamic, serverless applications that scale effortlessly and operate reliably in the cloud.
As organizations increasingly adopt Amazon Q Developer, understanding how developers use it is essential. Diving into specific telemetry events and user-level data clarifies how users interact with Amazon Q Developer, offering insights into feature usage and developer behaviors. This granular view, accessible through logs, is vital for identifying trends, optimizing performance, and enhancing the overall developer experience. This blog is intended to give visibility to key telemetry events logged by Amazon Q Developer and how to explore this data to gain insights.
To help you get started, the following sections will walk through several practical examples that showcase how to extract meaningful insights from AWS CloudTrail. By reviewing the logs, organizations can track usage patterns, identify top users, and empower them to train and mentor other developers, ultimately fostering broader adoption and engagement across teams.
Although the examples here focus on Amazon Athena for querying logs, the methods can be adapted to integrate with other tools like Splunk or Datadog for further analysis. Through this exploration, readers will learn how to query the log data to understand better how Amazon Q Developer is used within your organization.
Solution Overview
This solution leverages Amazon Q Developer’s logs from the Integrated Development Environment (IDE) and terminal, captured in AWS CloudTrail. The logs will be queried directly using Amazon Athena from Amazon Simple Storage Service (Amazon S3) to analyze feature usage, such as in-line code suggestions, chat interactions, and security scanning events.
Analyzing Telemetry Events in Amazon Q Developer
Amazon Athena is used to query the CloudTrail logs directly to analyze this data. By utilizing Athena, queries can be run on existing CloudTrail records, making it simple to extract insights from the data in its current format.
Ensuring CloudTrail is set up to log the data events.
Navigate to the AWS CloudTrail Console.
Edit an Existing Trail:
If you have a trail, verify it is configured to log data events for Amazon CodeWhisperer.
Note: As of 4/30/24, CodeWhisperer has been renamed to Amazon Q Developer. All the functionality previously provided by CodeWhisperer is now part of Amazon Q Developer. However, for consistency, the original API names have been retained.
Click on your existing trail in CloudTrail. Find the Data Events section and click edit.
For CodeWhisperer:
Data event type: CodeWhisperer
Log selector template: Log all events
Save your changes.
Note your “Trail log location.” This S3 bucket will be used in our Athena setup.
If you don’t have an existing trail, follow the instructions in the AWS CloudTrail User Guide to set up a new trail.
Below is a screenshot of the data events addition:
Steps to Create an Athena Table from CloudTrail Logs: This step aims to turn CloudTrail events into a queryable Athena table.
1. Navigate to the AWS Management Console > Athena > Editor.
2. Click on the plus to create a query tab.
3. Run the following query to create a database and table. Note to update the location to your S3 bucket.
-- Step 1: Create a new database (if it doesn't exist)
CREATE DATABASE IF NOT EXISTS amazon_q_metrics;

-- Step 2: Create the external table explicitly within the new database
CREATE EXTERNAL TABLE amazon_q_metrics.cloudtrail_logs (

    userIdentity STRUCT<
        accountId: STRING,
        onBehalfOf: STRUCT<
            userId: STRING,
            identityStoreArn: STRING
        >
    >,
    eventTime STRING,
    eventSource STRING,
    eventName STRING,
    requestParameters STRING,
    requestId STRING,
    eventId STRING,
    resources ARRAY<STRUCT<
        arn: STRING,
        accountId: STRING,
        type: STRING
    >>,
    recipientAccountId STRING

)
ROW FORMAT SERDE 'org.apache.hive.hcatalog.data.JsonSerDe'
STORED AS INPUTFORMAT 'com.amazon.emr.cloudtrail.CloudTrailInputFormat'
OUTPUTFORMAT 'org.apache.hadoop.hive.ql.io.HiveIgnoreKeyTextOutputFormat'
LOCATION 's3://{Insert Bucket Name from CloudTrail}/'
TBLPROPERTIES ('classification'='cloudtrail');
4. Click Run
5. Run a quick query to view the data.
SELECT
    eventTime,
    userIdentity.onBehalfOf.userId AS user_id,
    eventName,
    requestParameters
FROM
    amazon_q_metrics.cloudtrail_logs AS logs
WHERE
    eventName = 'SendTelemetryEvent'
LIMIT 10;
In this section, the significance of the telemetry events captured in the requestParameters field will be explained. The query begins by displaying key fields and their data, offering insights into how users interact with various features of Amazon Q Developer.
Query Breakdown:
eventTime: This field captures the time the event was recorded, providing insights into when specific user interactions took place.
userIdentity.onBehalfOf.userId: This extracts the userId of the user. This is critical for attributing interactions to the correct user, which will be covered in more detail later in the blog.
eventName: The query is filtered on SendTelemetryEvent. Telemetry events are triggered when the user interacts with particular features or when a developer uses the service.
requestParameters: The requestParameters field is crucial because it holds the details of the telemetry events. This field contains a rich set of information depending on the type of interaction and feature the developer uses, which programming languages are used, completion types, or code modifications.
In the context of the SendTelemetryEvent, various telemetry events are captured in the requestParameters field of CloudTrail logs. These events provide insights into user interactions, overall usage, and the effectiveness of Amazon Q Developer’s suggestions. Here are the key telemetry events along with their descriptions:
UserTriggerDecisionEvent
Description: This event is triggered when a user interacts with a suggestion made by Amazon Q Developer. It captures whether the suggestion was accepted or rejected, along with relevant metadata.
Key Fields:
completionType: Whether the completion was a block or a line.
suggestionState: Whether the user accepted, rejected, or discarded the suggestion.
programmingLanguage: The programming language associated with the suggestion.
generatedLine: The number of lines generated by the suggestion.
CodeScanEvent
Description: This event is logged when a code scan is performed. It helps track the scope and result of the scan, providing insights into security and code quality checks.
Key Fields:
codeAnalysisScope: Whether the scan was performed at the file level or the project level.
programmingLanguage: The language being scanned.
CodeScanRemediationsEvent
Description: This event captures user interactions with Amazon Q Developer’s remediation suggestions, such as applying fixes or viewing issue details.
Key Fields:
CodeScanRemediationsEventType: The type of remediation action taken (e.g., viewing details or applying a fix).
includesFix: A boolean indicating whether the user applied a fix.
ChatAddMessageEvent
Description: This event is triggered when a new message is added to an ongoing chat conversation. It captures the user’s intent which refers to the purpose or goal the user is trying to achieve with the chat message. The intent can include various actions, such as suggesting alternate implementations of the code, applying common best practices, improving the quality or performance of the code.
Key Fields:
conversationId: The unique identifier for the conversation.
messageId: The unique identifier for the chat message.
userIntent: The user’s intent, such as improving code or explaining code.
programmingLanguage: The language related to the chat message.
ChatInteractWithMessageEvent
Description: This event captures when users interact with chat messages, such as copying code snippets, clicking links, or hovering over references.
Key Fields:
interactionType: The type of interaction (e.g., copy, hover, click).
interactionTarget: The target of the interaction (e.g., a code snippet or a link).
acceptedCharacterCount: The number of characters from the message that were accepted.
acceptedSnippetHasReference: A boolean indicating if the accepted snippet included a reference.
TerminalUserInteractionEvent
Description: This event logs user interactions with terminal commands or completions in the terminal environment.
Key Fields:
terminalUserInteractionEventType: The type of interaction (e.g., terminal translation or code completion).
isCompletionAccepted: A boolean indicating whether the completion was accepted by the user.
terminal: The terminal environment in which the interaction occurred.
shell: The shell used for the interaction (e.g., Bash, Zsh).
Telemetry events are key to understanding how users engage with Amazon Q Developer. They track interactions such as code completion, security scans, and chat-based suggestions. Analyzing the data in the requestParameters field helps reveal usage patterns and behaviors that offer valuable insights.
By exploring events such as UserTriggerDecisionEvent, ChatAddMessageEvent, TerminalUserInteractionEvent, and others in the schema, organizations can assess the effectiveness of Amazon Q Developer and identify areas for improvement.
Example Queries for Analyzing Developer Engagement
To gain deeper insights into how developers interact with Amazon Q Developer, the following queries can help analyze key telemetry data from CloudTrail logs. These queries track in-line code suggestions, chat interactions, and code-scanning activities. By running these queries, you can uncover valuable metrics such as the frequency of accepted suggestions, the types of chat interactions, and the programming languages most frequently scanned. This analysis helps paint a clear picture of developer engagement and usage patterns, guiding efforts to enhance productivity.
These four examples only cover a sample set of the available telemetry events, but they serve as a starting point for further exploration of Amazon Q Developer’s capabilities.
SELECT
    eventTime,
    userIdentity.onBehalfOf.userId AS user_id,
    eventName,
    json_extract_scalar(requestParameters, '$.telemetryEvent.userTriggerDecisionEvent.suggestionState') AS suggestionState,
    json_extract_scalar(requestParameters, '$.telemetryEvent.userTriggerDecisionEvent.completionType') AS completionType
FROM
    amazon_q_metrics.cloudtrail_logs
WHERE
    eventName = 'SendTelemetryEvent'
    AND json_extract(requestParameters, '$.telemetryEvent.userTriggerDecisionEvent') IS NOT NULL
    AND json_extract_scalar(requestParameters, '$.telemetryEvent.userTriggerDecisionEvent.suggestionState') = 'ACCEPT';
Use Case:This use case focuses on how developers interact with in-line code suggestions by analyzing accepted snippets. It helps identify which users are accepting suggestions, the type of snippets being accepted (blocks or lines), and the programming languages involved. Understanding these patterns can reveal how well Amazon Q Developer aligns with the developers’ expectations.
Query Explanation: The query retrieves the event time, user ID, event name, suggestion state (filtered to show only ACCEPT), and completion type. TotalGeneratedLinesBlockAccept and totalGeneratedLinesLineAccept or discarded suggestions are not included, but this gives an idea of the developers using the service for in-line code suggestions and the lines or blocks they have accepted. Additionally, the programming language field can be extracted to see which languages are used during these interactions.
Query 2: Analyzing Chat Interactions
SELECT
    userIdentity.onBehalfOf.userId AS userId,
    json_extract_scalar(requestParameters, '$.telemetryEvent.chatInteractWithMessageEvent.interactionType') AS interactionType,
    COUNT(*) AS eventCount
FROM
    amazon_q_metrics.cloudtrail_logs
WHERE
    eventName = 'SendTelemetryEvent'
    AND json_extract(requestParameters, '$.telemetryEvent.chatInteractWithMessageEvent') IS NOT NULL
GROUP BY
    userIdentity.onBehalfOf.userId,
    json_extract_scalar(requestParameters, '$.telemetryEvent.chatInteractWithMessageEvent.interactionType')
ORDER BY
    eventCount DESC;
Use Case: This use case looks at how developers use chat options like upvoting, downvoting, and copying code snippets. Understanding the chat usage patterns shows which interactions are most used and how developers engage with Amazon Q Developer chat. As an organization, this insight can help support other developers in successfully leveraging this feature.
Query Explanation: The query provides insights into chat interactions within Amazon Q Developer by retrieving user IDs, interaction types, and event counts. This query aggregates data based on the interactionType field within chatInteractWithMessageEvent, showcasing various user actions such as UPVOTE, DOWNVOTE, INSERT_AT_CURSOR, COPY_SNIPPET, COPY, CLICK_LINK, CLICK_BODY_LINK, CLICK_FOLLOW_UP, and HOVER_REFERENCE.
This analysis highlights how users engage with the chat feature and the interactions, offering a view of interaction patterns. By focusing on the interactionType field, you can better understand how developers interact with the chat feature of Amazon Q Developer.
Query 3: Analyzing Code Scanning Jobs Across Programming Languages
SELECT
    userIdentity.onBehalfOf.userId AS userId,
    json_extract_scalar(requestParameters, '$.telemetryEvent.codeScanEvent.programmingLanguage.languageName') AS programmingLanguage,
    COUNT(json_extract_scalar(requestParameters, '$.telemetryEvent.codeScanEvent.codeScanJobId')) AS jobCount
FROM
    amazon_q_metrics.cloudtrail_logs
WHERE
    eventName = 'SendTelemetryEvent'
    AND json_extract(requestParameters, '$.telemetryEvent.codeScanEvent') IS NOT NULL
GROUP BY
    userIdentity.onBehalfOf.userId,
    json_extract_scalar(requestParameters, '$.telemetryEvent.codeScanEvent.programmingLanguage.languageName')
ORDER BY
    jobCount DESC;
Use Case: Amazon Q Developer includes security scanning, and this section helps determine how the security scanning feature is being used across different users and programming languages within the organization. Understanding these trends provides valuable insights into which users actively perform security scans and the specific languages targeted for these scans.
Query Explanation: The query provides insights into the distribution of code scanning jobs across different programming languages in Amazon Q Developer. It retrieves user IDs and the count of code-scanning jobs by programming language. This analysis focuses on the CodeScanEvent, aggregating data to show the total number of jobs executed per language.
By summing up the number of code scanning jobs per programming language, this query helps to understand which languages are most frequently analyzed. It provides a view of how users are leveraging the code-scanning feature. This can be useful for identifying trends in language usage and optimizing code-scanning practices.
Query 4: Analyzing User Activity across features.
SELECT
    userIdentity.onBehalfOf.userId AS user_id,
    COUNT(DISTINCT CASE
        WHEN json_extract(requestParameters, '$.telemetryEvent.userTriggerDecisionEvent') IS NOT NULL
        THEN eventId END) AS inline_suggestions_count,
    COUNT(DISTINCT CASE
        WHEN json_extract(requestParameters, '$.telemetryEvent.chatInteractWithMessageEvent') IS NOT NULL
        THEN eventId END) AS chat_interactions_count,
    COUNT(DISTINCT CASE
        WHEN json_extract(requestParameters, '$.telemetryEvent.codeScanEvent') IS NOT NULL
        THEN eventId END) AS security_scans_count,
    COUNT(DISTINCT CASE
        WHEN json_extract(requestParameters, '$.telemetryEvent.terminalUserInteractionEvent') IS NOT NULL
        THEN eventId END) AS terminal_interactions_count
FROM
    amazon_q_metrics.cloudtrail_logs
WHERE
    eventName = 'SendTelemetryEvent'
GROUP BY
    userIdentity.onBehalfOf.userId
Use Case:This use case looks at how developers use Amazon Q Developer across different features: in-line code suggestions, chat interactions, security scans, and terminal interactions. By tracking usage, organizations can see overall engagement and identify areas where developers may need more support or training. This helps optimize the use of Amazon Q Developer and helps teams get the most out of the tool.
Query Explanation: Let’s take the other events from the prior queries and additional events to get more detail overall and tie it all together. This expanded query provides a comprehensive view of user activity within Amazon Q Developer by tracking the number of in-line code suggestions, chat interactions, security scans, and terminal interactions performed by each user. By analyzing these events, organizations can gain a better understanding of how developers are using these key features.
By summing up the interactions for each feature, this query helps identify which users are most active in each category, offering insights into usage patterns and areas where additional training or support may be needed.
Enhancing Metrics with Display Names and Usernames
The previous queries had userid as a field; however, many customers would prefer to see a user alias (such as username or display name). The following section illustrates enhancing these metrics by augmenting user IDs with display names and usernames from the AWS IAM Identity Center. This will provide more human-readable user names.
In this example, the export is run locally to enhance user metrics with IAM Identity Center for simplicity. This method works well for demonstrating how to access and work with the data, but it provides a static snapshot of the users at the time of export. In a production environment, an automated solution would be preferable to capture newly added users continuously. For the purposes of this blog, this straightforward approach is used to focus on data access.
To proceed, install Python 3.8+ and Boto3, and configure AWS credentials via the CLI. Then, run the following Python script locally to export the data:
import boto3, csv
# replace this with the region of your IDC instance
RegionName='us-east-1'
# client creation
idstoreclient = boto3.client('identitystore', RegionName)
ssoadminclient = boto3.client('sso-admin', RegionName)

Instances= (ssoadminclient.list_instances()).get('Instances')
InstanceARN=Instances[0].get('InstanceArn')
IdentityStoreId=Instances[0].get('IdentityStoreId')

# query
UserDigestList = []
ListUserResponse = idstoreclient.list_users(IdentityStoreId=IdentityStoreId)
UserDigestList.extend([[user['DisplayName'], user['UserName'], user['UserId']] for user in ListUserResponse['Users']])
NextToken = None
if 'NextToken' in ListUserResponse.keys(): NextToken = ListUserResponse['NextToken']
while NextToken is not None:
    ListUserResponse = idstoreclient.list_users(IdentityStoreId=IdentityStoreId, NextToken=NextToken)
    UserDigestList.extend([[user['DisplayName'], user['UserName'], user['UserId']] for user in ListUserResponse['Users']])
    if 'NextToken' in ListUserResponse.keys(): NextToken = ListUserResponse['NextToken']
    else: NextToken = None

# write the query results to IDCUserInfo.csv
with open('IDCUserInfo.csv', 'w') as CSVFile:
    CSVWriter = csv.writer(CSVFile, quoting=csv.QUOTE_ALL)
    HeaderRow = ['DisplayName', 'UserName', 'UserId']
    CSVWriter.writerow(HeaderRow)
    for UserRow in UserDigestList:
        CSVWriter.writerow(UserRow)
This script will query the IAM Identity Center for all users and write the results to a CSV file, including DisplayName, UserName, and UserId. After generating the CSV file, upload it to an S3 bucket. Please make note of this S3 location.
Steps to Create an Athena Table from the above CSV output: Create a table in Athena to join the existing table with the user details.
1. Navigate to the AWS Management Console > Athena > Editor.
2. Click on the plus to create a query tab.
3. Run the following query to create our table. Note to update the location to your S3 bucket.
CREATE EXTERNAL TABLE amazon_q_metrics.user_data (
    DisplayName STRING,
    UserName STRING,
    UserId STRING
)
ROW FORMAT SERDE 'org.apache.hadoop.hive.serde2.OpenCSVSerde'
WITH SERDEPROPERTIES (
   'separatorChar' = ',',
   'quoteChar'     = '"'
)
STORED AS TEXTFILE
LOCATION 's3://{Update to your S3 object location}/'  -- Path containing CSV file
TBLPROPERTIES ('skip.header.line.count'='1');
4. Click Run
5. Now, let’s run a quick query to verify the data in the new table.
SELECT * FROM amazon_q_metrics.user_data limit 10;
The first query creates an external table in Athena from user data stored in a CSV file in S3. The user_data table has three fields: DisplayName, UserName, and UserId. To specify the correct parsing of the CSV, separatorChar is specified as a comma and quoteChar as a double quote. Additionally, the TBLPROPERTIES (‘skip.header.line.count’=’1’) flag skips the header row in the CSV file, ensuring that column names aren’t treated as data.
The user_data table holds key details: DisplayName (full name), UserName (username), and UserId (unique identifier). This table will be joined with the cloudtrail_q_metrics table using the userId field from the onBehalfOf struct, enriching the interaction logs with human-readable user names and display names instead of user IDs.
In the previous analysis of in-line code suggestions, the focus was on retrieving key metrics related to user interactions with Amazon Q Developer. The query below follows a similar structure but now includes a join with the user_data table to enrich insights with additional user details such as DisplayName and Username.
To include a join with the user_data table in the query, it is necessary to define a shared key between the cloudtrail_logs_amazon_q and user_data tables. For this example, user_id will be used.
SELECT
    logs.eventTime,
    user_data.displayname,  -- Additional field from user_data table
    user_data.username,     -- Additional field from user_data table
    json_extract_scalar(logs.requestParameters, '$.telemetryEvent.userTriggerDecisionEvent.suggestionState') AS suggestionState,
    json_extract_scalar(logs.requestParameters, '$.telemetryEvent.userTriggerDecisionEvent.completionType') AS completionType
FROM
    amazon_q_metrics.cloudtrail_logs AS logs  -- Specified database for cloudtrail_logs
JOIN
    amazon_q_metrics.user_data  -- Specified database for user_data
ON
    logs.userIdentity.onBehalfOf.userId = user_data.userid
WHERE
    logs.eventName = 'SendTelemetryEvent'
    AND json_extract_scalar(logs.requestParameters, '$.telemetryEvent.userTriggerDecisionEvent.suggestionState') = 'ACCEPT';
This approach allows for a deeper analysis by integrating user-specific information with the telemetry data, helping you better understand how different user roles interact with the in-line suggestions and other features of Amazon Q Developer.
Cleanup
If you have been following along with this workflow, it is important to clean up the resources to avoid unnecessary charges. You can perform the cleanup by running the following query in the Amazon Athena console:
-- Step 1: Drop the tables
DROP TABLE IF EXISTS amazon_q_metrics.cloudtrail_logs;
DROP TABLE IF EXISTS amazon_q_metrics.user_data;

-- Step 2: Drop the database after the tables are removed
DROP DATABASE IF EXISTS amazon_q_metrics CASCADE;
This query removes both the cloudtrail_logs and user_data tables, followed by the amazon_q_metrics database.
Remove the S3 objects used to store the CloudTrail logs and user data by navigating to the S3 console, selecting the relevant buckets or objects, and choosing “Delete.”
If a new CloudTrail trail was created, consider deleting it to stop further logging. For instructions, see Deleting a Trail. If an existing trail was used, remove the CodeWhisperer data events to prevent continued logging of those events.
Conclusion
By tapping into Amazon Q Developer’s logging capabilities, organizations can unlock detailed insights that drive better decision-making and boost developer productivity. The ability to analyze user-level interactions provides a deeper understanding of how the service is used.
Now that you have these insights, the next step is leveraging them to drive improvements. For example, organizations can use this data to identify opportunities for Proof of Concepts (PoCs) and pilot programs that further demonstrate the value of Amazon Q Developer. By focusing on areas where engagement is high, you can support the most engaged developers as champions to advocate for the tool across the organization, driving broader adoption.
The true potential of these insights lies in the “art of the possible.” With the data provided, it is up to you to explore how to query or visualize it further. Whether you’re examining metrics for in-line code suggestions, interactions, or security scanning, this foundational analysis is just the beginning.
As Amazon Q Developer continues to evolve, staying updated with emerging telemetry events is crucial for maintaining visibility into the available metrics. You can do this by regularly visiting the official Amazon Q Developer documentation and the Amazon Q Developer’s Changelog to stay up-to-date latest information and insights.
Amazon CodeCatalyst is a unified service that streamlines the entire software development lifecycle, empowering teams to build, deliver, and scale applications on AWS.
DevSecOps is the practice of integrating security into all stages of software development. Rather than prioritizing features, it injects security into an earlier phase of the development process – baking it into design, coding, testing, deployment, and operations from the start. Extensive automation like policy checks, scanning, and more proactively uncovers risks.
Amazon Inspector Scan is a CodeCatalyst Action, a logical unit of work to be performed during a workflow run, which leverages software bill of materials (SBOM) generator (sbomgen) to produce a SBOM and ScanSbom to scan a provided CycloneDX 1.5 SBOM and report on any vulnerabilities discovered in that SBOM. An SBOM inventories third-party and open-source components in an application, documenting names, versions, licenses, dependencies, and more. It enables vital DevSecOps initiatives, such as checking an SBOM against CVE databases to rapidly identify vulnerable libraries needing remediation.
Introduction
This blog talks about the benefits of DevSecOps in general and the SBOM in particular. It provides a walkthrough of adding SBOM generation and scanning as a CodeCatalyst Action to an existing CodeCatalyst Workflow. A workflow is an automated procedure that describes how to build, test, and deploy your code as part of a CI/CD system. First, you will create a new Amazon CodeCatalyst project in the CodeCatalyst console. Next, you will modify the workflow to add the Amazon Inspector Scan action. Lastly, you will run the workflow and view the SBOM and vulnerabilities report.
An AWS Identity and Access Management (IAM) role (that will be added to the Amazon CodeCatalyst space later) to provide Amazon CodeCatalyst service permissions to build and deploy applications.
First, you will create a project using CodeCatalyst Blueprints. Blueprints setup a code repository with a working sample app, define cloud infrastructure and run pre-configured CI/CD workflows for your project.
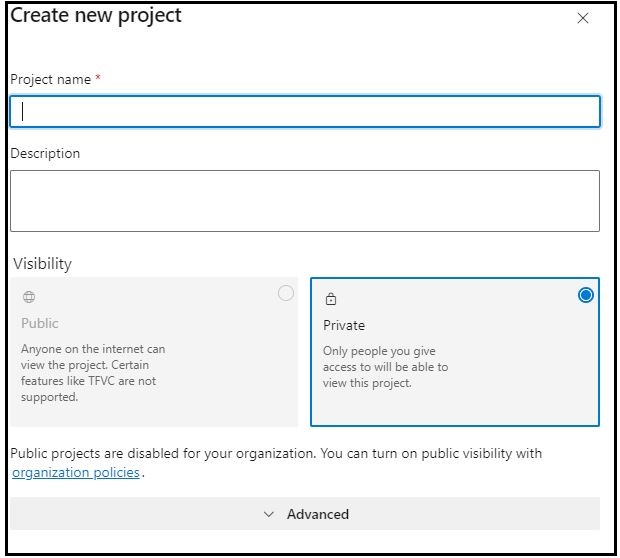
Create a project from a blueprint
Go to your space by clicking your space name in the CodeCatalyst console. From your space, click Create Project. Upon selecting Start with a blueprint, you will select the Single-page application blueprint and click Next as shown in figure 1.
You will then pick a suitable name for your project, for this post I will use SafeWebShip. Select the AWS IAM role associated with the space and account connection, then click on Create Project.
Next, you will take a look at the current workflow and add the Amazon Inspector Scan action to identify the packages and libraries that make up a software application and scan for vulnerabilities from the associated packages and libraries.
Review the current workflow
A workflow defines a series of steps, or actions, to take during a workflow run and can be assembled using YAML or a visual editor. Actions which require interaction with AWS resources like creation, modification, reading, and deletion occur in the customer’s AWS account, such as creating an Amazon Inspector task to scan an SBOM report.
Add SBOM generation and scanning to the workflow
To add the Amazon Inspector Scan action to the workflow:
Navigate to the CI/CD menu on the left side of your screen, and then click Workflows
Click on the onPushToMainPipeline workflow
Click the edit button to make changes to the workflow
Ensure the Visual tab is selected, then add a CodeCatalyst Action by clicking Actions at the top left of the screen
In the new Actions catalog pop-up, search Amazon Inspector Scan. Click the + at the bottom right of the action card as shown in figure 2
Figure 2 Amazon CodeCatalyst Actions Catalog
Click the Configuration tab of the action and rename the action to inspector_sbom by clicking the pencil under action name
Select the environment from the Environment dropdown, AWS account connection and the Role you created earlier in the pre-requisite
Scroll down to Path and ensure it is “./” which represents the root of the source repository. The tool will traverse all of the directories of the source repository for supported manifest files to scan
The Scan Source should be REPO. The action can scan directories or source repository and a container image. For the purpose of this blog, you will be scanning an existing source repository
The tool can be configured to run scanners that will inspect container images, packages, archive, directory, and binary scanners. For the purpose of this blog, you will be using javascript-nodejs scanner. You can skip the rest of the scanners. You can read the action’s documentation from the action’s catalog page for a full list of supported scanners
Scroll down to Severity Threshold, type medium to fail the action if a vulnerability of medium or greater is found
Skip Files determines the files to skip and should be public/ since you are scanning a public repository
Depth specifies the depth of directory traversal when generating the SBOM. You should pick Depth as 1 to scan all the files in the root directory of the public repository. Other inputs that are relevant to container images can be ignored as the source repository is only being scanned
The action produces two files, the SBOM in CycloneDX v1.5 format from sbomgen and the vulnerability report from ScanSbom. Click the Outputs tab of the action, under Artifacts click Add artifact
Name the Build artifact name as SBOM
Paste the Files produced by build with the followinginspector_sbom_report.json
Click Add artifact again
Name the Build artifact name as SBOM_VULNERABILITIES
Paste the Files produced by build with the following
inspector_scan_report.json
Figure 3 Amazon CodeCatalyst Workflow Screen
As a best practice, you don’t want to build your project unless it has passed the security scan.
Do the following:
From the visual diagram of the workflow, click the Build action
With new menu pop-up to the right, in the pre-loaded inputs tab, and under Depends on – optional, select the Add actions dropdown menu and select the inspector_sbom action
Click x next to the action name to leave the action input menu
Finally, in order to save our changes to the workflow do the following:
Click Validate
Once you see a banner at the top of the page that says the workflow definition is valid, click Commit then click Commit once more to publish the changes to the workflow.
Run the workflow and view artifacts
After committing your changes to the workflow. There should be a new workflow run automatically as the trigger to the workflow is a code push.
Currently, SBOM CycloneDX v1.5 is not supported via CodeCatalyst Reports. Therefore, the report can not be visualized under the Reports feature of Amazon CodeCatalyst. However, the SBOM in CycloneDX v1.5 and the scan report are provided as artifacts for you to download and are stored as part of a workflow run.
To access the reports, do the following:
Navigate to the CI/CD menu on the left side of your screen, and then click Workflows
Click on the onPushToMainPipeline workflow
The current view is the Latest state, Click Runs
When the workflow, or CI/CD pipeline, runs, it is referred to as a run. Runs that are in progress are under Active runs and Runs history contains all previous workflow runs. Click the Run ID under latest run
Once the workflow run page loads, click Artifacts
On the Artifacts page, you should notice SBOM, CycloneDX v1.5, and SBOM_VULNERABILITIES, scan of the SBOM for vulnerabilities as shown in figure 4. Both of these artifacts can be downloaded and viewed on your local machine
The SBOM report will be downloaded as inspector_sbom_report.json. In the SBOM report, all the components that make up the software application are available to view. Each listed component is identified by its name and version as shown in figure 5.
Figure 5 Amazon Inspector Scan SBOM Artifact
The scan of the SBOM report for vulnerabilities will be downloaded as inspector_scan_report.json. In the scan report example below, there are 41 medium vulnerabilities and 32 high vulnerabilities. Since the threshold was set to “medium,” the build failed so these vulnerabilities can be addressed.
The scan report details the vulnerabilities, links to the affected components, and contains information on the vulnerability like description and CVE reference identifier as shown in figure 6 and figure 7.
Figure 7 Amazon Inspector Scan Vulnerability Artifact continued
Clean Up
If you have been following along with building this workflow, you should delete the resources you deployed so you do not continue to incur charges.
First, delete the stack titled DevelopmentFrontendStack-* that has been deployed from the AWS CloudFormation console in the AWS account you associated when you launched the blueprint. Second, delete the project from CodeCatalyst by navigating to Project settings and clicking the Delete project button
Conclusion
In this blog, we demonstrated how you can integrate security practices into a development pipeline using Amazon CodeCatalyst and Amazon Inspector. You created a project from a blueprint that came pre-configured with a workflow. Next, you modified the workflow to add DevSecOps practices to the pipeline through SBOM generation and scanning. Finally, you ran the workflow and viewed the SBOM and vulnerabilities report. It is essential to secure application dependencies during modern software development. For improved software supply chain security, Amazon CodeCatalyst and Amazon Inspector connect effortlessly. Add this action to your existing or new workflows to improve code security. This is necessary in today’s circumstances to protect your software supply chain. Learn more about Amazon CodeCatalyst and get started today!
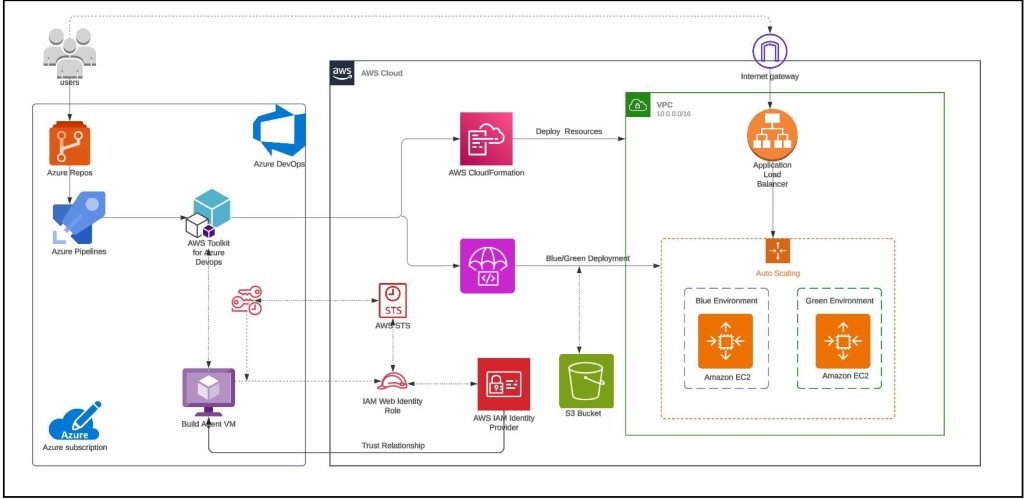
As organizations continue to embrace cloud-native development practices, the need for integrated security solutions that seamlessly fit into existing DevOps environments has become more pressing than ever. We recognize this critical need and have added new integration for InsightCloudSec (ICS) and Exposure Command with Azure DevOps for Infrastructure as code (IaC) tooling, empowering organizations to quickly and effectively safeguard their attack surfaces.
But first, let’s quickly refresh infrastructure as code functionality within ICS to remind us of how important it is and why this new integration will play a key role in your organization’s security posture. Shifting left in code security is more important than ever before and IaC is the impetus for organizations to move cloud security and compliance from being reactive (at runtime) to being preventative (during development). The key is integrating the right controls with the proper guidance directly into the CI/CD pipeline. This integration facilitates delivering secure and compliant cloud infrastructure from the start. Rapid7’s innovative IaC tool allows you to identify key insights and risks during the development process which allow you to protect and secure your attack surface before it’s visible. If you want to learn more about getting started with IaC you can check out this helpful guide.
Why DevSecOps is so important
In today’s fast-paced development environments, security cannot be an afterthought. The ability to integrate security checks directly into DevOps — commonly referred to as DevSecOps — workflows is crucial for minimizing vulnerabilities and reducing the risk of breaches.
Making security a shared responsibility between development, operations and security teams has a number of key benefits:
It enables developers to deliver better, more-secure code faster, and, therefore, cheaper.
It makes security a continuous activity, allowing for issues to be caught proactively before they reach production.
It stops an all-too-common dynamic where security teams are only being brought in at the end of the project process in a QA role.
Impact of the new integration
With cloud environments being dynamic and complex, it’s vital to have tools that can quickly scan repositories and return actionable insights with minimal disruption to the development process. This is where the integration between InsightCloudSec and Azure DevOps makes a significant impact. By embedding security directly into the CI/CD pipeline, organizations can ensure that their code is secure before it ever reaches production, thus safeguarding their entire attack surface more effectively
The integration of InsightCloudSec with Azure DevOps introduces a suite of new capabilities designed to enhance how organizations assess and respond to potential risks within their cloud environments.
Here’s how it transforms the security landscape:
Extend attack surface visibility Into the CI/CD pipeline: The integration is designed to maximize the protection of your cloud environment by continuously monitoring and assessing risks by shifting security controls to the left. By catching issues early, it significantly reduces the likelihood of security threats reaching production, thereby minimizing the potential attack surface.
Proactive repository scanning: With this integration, security scans are executed as a seamless part of the CI/CD pipeline. As soon as IaC templates are changed in version control systems, InsightCloudSec can automatically scan repositories, identifying vulnerabilities, misconfigurations, and compliance issues. This seamless execution ensures that security checks do not hinder development velocity, allowing teams to maintain their pace while ensuring security.
Frictionless risk assessment and remediation: Rapid7’s integration emphasizes ease of use, ensuring that security assessments and remediation steps are as frictionless as possible. Real-time alerts and detailed insights are provided directly within Azure DevOps, enabling teams to quickly understand and address risks without needing to navigate multiple tools. This streamlined approach not only speeds up the response time but also ensures that remediation efforts are effective and aligned with organizational security policies.
Improved collaboration between security and DevOps teams: Driving better integration between security tooling and the CI/CD pipeline helps break down the unfortunately all too common “us vs. them” mentality that can exist between development and security teams. By automating repeatable, time-consuming tasks, such as vulnerability scanning and compliance checks, teams can shift their focus away from manual, often reactive efforts, and towards proactive collaboration. This streamlined approach empowers developers to identify and remediate security issues early in the development process without slowing down delivery, while security professionals gain visibility into code changes in real-time. The result is a more cohesive, efficient workflow where both teams work together to address complex, impactful problems, rather than being bogged down by friction and misaligned priorities.
Integration benefits at-a-glance
The integration between Rapid7’s InsightCloudSec and Azure DevOps will help organizations using the Azure ecosystem of tools easily advance their cloud security programs by shifting left, offering organizations the tools they need to effectively safeguard their attack surfaces without slowing down their development processes. By doing so, organizations can proactively address risks before they become significant threats, leading to a more secure and resilient cloud environment.
Automated scans and seamless alerting within Azure DevOps reduce the time it takes to identify and remediate vulnerabilities, helping organizations maintain a rapid development cycle without sacrificing security. The integration also fosters improved collaboration between security and development teams, ensuring that security is a shared responsibility. With clear and actionable insights provided within the same environment developers use daily, security becomes an integral part of the DevOps workflow.
By delivering seamless, frictionless security assessments and remediation steps directly within the CI/CD pipeline, Rapid7 continues to empower organizations to build, deploy, and maintain secure cloud environments with confidence.
As organizations navigate the complexities of cloud security, this integration will be a vital asset in ensuring that their cloud environments remain secure, compliant, and resilient against ever-evolving threats. Be sure to stay tuned for more updates as we continue to invest in driving more seamless integration between security and development processes.
Many AWS customers run their mission-critical workloads across multiple AWS regions to serve geographically dispersed customer base, meet disaster recovery objectives or address local laws and regulations. Amazon CodeCatalyst is a unified software development service designed to streamline and accelerate the process of building and delivering applications on AWS. It is an all-in-one platform for managing your entire development lifecycle, from planning and collaboration to continuous integration, deployment, and scaling. Amazon CodeCatalyst aims to boost developer productivity, ensure consistency, and improve the overall software development experience on AWS. By leveraging Amazon CodeCatalyst for multi-region deployments, AWS customers can ensure high availability and disaster recovery and comply with various regulatory requirements, all while improving their development and deployment process.
In this post, we will walk you through a solution which allows you to easily control updates to applications that are deployed across multiple AWS regions using Amazon CodeCatalyst.
Architecture
In this post, we are going to consider a containerized application running on Amazon Elastic Container Service (Amazon ECS) deployed in two different regions us-east-1 and us-west-2. We will walk you through how to configure an Amazon CodeCatalyst workflow to perform the deployment in stages, limiting the deployment scope to one region at a time (Figure 1).
Figure 1: Amazon ECS Multi Region deployment
Here are the high-level steps in the multi-region deployment process.
The developer makes updates to the application code base and pushes the code changes to the source repository hosted in Amazon CodeCatalyst
This code push invokes an Amazon CodeCatalyst workflow for the multi-region deployment. In this example, the workflow deploys changes to containerized application running on Amazon ECS in two regions.
The deployment to different regions happens in stages. In Step 3, the updates get deployed to region 1. This staged approach allows for initial testing and validation in one AWS region before proceeding.
Once the deployment (and any associated validation steps) is completed successfully in region 1, the workflow proceeds with deployment to the second AWS region.
Limiting the scope of each individual deployment limits the potential impact on customers from failed production deployments and prevents a multi-region impact.
Prerequisites
You need access to an AWS account. If you don’t have one, you can create a new AWS account.
Follow Amazon ECS Multi-Region Workshop to deploy a simple containerized application across two different AWS regions. Clone the repository and then follow steps to deploy the foundation, data and backend stack. Note the outputs from workshop-backend-main & workshop-backend-secondary, we’ll use them later on in this post.
Follow the Amazon ECR user guide to create an Amazon Elastic Container Registry (Amazon ECR) repository named codecatalyst-ecs-image-repo.
Create an Amazon CodeCatalyst space, with an empty Amazon CodeCatalyst project named codecatalyst-ecs-project and an Amazon CodeCatalyst environment called codecatalyst-ecs-environment. Associate your AWS account to the CodeCatalyst space. Follow the Amazon CodeCatalyst tutorial to set these up.
An AWS Identity and Access Management (IAM) role in the Amazon CodeCatalyst space to provide Amazon CodeCatalyst service permissions to build and deploy applications. Note the name of this role as you’ll use it later in this post.
Create an Amazon CodeCatalyst source repository titled ecs-multi-region-repo following the instructions in the documentation.
Step 1: Create an Amazon CodeCatalyst Dev Environment
In this step, you will create an Amazon CodeCatalyst Dev Environment directly linked to your source repository ecs-multi-region-repo allowing you to work on your Amazon ECS Multi Region application code and configuration files.
Open Amazon CodeCatalyst and navigate to your project
In the left navigation pane, choose Code and then choose Source repositories
Choose the source repository ecs-multi-region-repo for the Amazon ECS multi-region application
Choose Create Dev Environment
Choose Visual Studio Code from the drop-down menu
In Create Dev Environment and open with Visual Studio Code page (Figure 2), choose Create to create a Visual Studio Code development environment
Figure 2: Create Dev Environment in Amazon CodeCatalyst
Choose Open in Visual Studio Code when prompted (Figure 3), this establishes a remote connection to Dev Environment from your local Visual Studio Code. Keep this window open as you will need it for Step 2
Figure 3: Open Dev Environment with Visual Studio Code
Step 2: Add Source files to Amazon CodeCatalyst source repository
In this step you will add the necessary source files source files to the Amazon CodeCatalyst repository you created in the pre-requisites, including the sample Amazon ECS multi-region application and the Amazon ECS task definition file.
Inside the Visual Studio Code IDE, choose Terminal in the top menu.
Select New Terminal or use an existing terminal window if you prefer.
Clone the Github project inside your project folder by running the below commands in the terminal.
You need to create an Amazon ECS task definition file for the sample application. Create a file named task.json inside the app folder. Paste the below contents into the task.json replacing placeholder <Account_ID> with your AWS Account ID and <ecsTaskExecutionRole> with your role from workshop-backend-main outputs.
Commit the changes to the Amazon CodeCatalyst repository by issuing the following commands inside the Visual Studio Code IDE terminal window. You will need to update the <your_email> and <your_name> with your email and name.
In this example, we are using a single task definition file (task.json) which Amazon CodeCatalyst will use to render task definitions in both regions. But, if your workload requires different task definition files across different regions (e.g. region specific resource requirements, compliance requirements, environment specific configurations etc), you can create multiple task definition files in Amazon CodeCatalyst repository and configure RenderAmazonECStaskdefinition action for each regions with different task definition files.
Step 3: Create Amazon CodeCatalyst Workflow for multi-region deployment
Amazon CodeCatalyst workflow is an automated procedure that describes how to build, test, and deploy your code as part of a continuous integration and continuous delivery (CI/CD) system. A workflow defines a series of steps, or actions, to be executed during a workflow run. You can group actions into action groups to keep your workflow organized and configure dependencies between different groups.
In the navigation pane, choose CI/CD, and then choose Workflows
Choose Create workflow. Select ecs-multi-region-repo from the Source repository dropdown
Choose main in the branch. Select Create (Figure 4). The workflow definition file appears in the Amazon CodeCatalyst console’s YAML editor
Figure 4: Create Workflow page in Amazon CodeCatalyst
In the YAML editor, you will replace the default content with the below provided workflow definition. Replace <Account_ID> with your AWS account ID.
Replace <EcsRegionNameMain>, <EcsClusterNameMain>, <EcsServiceNameMain>, <EcsRegionNameSecondary>, <EcsClusterNameSecondary>, <EcsServiceNameSecondary>. For values with “main” refer to output from workshop-backend-main, and values with “secondary” refer to output from workshop-backend-secondary.
Otherwise use your own Amazon ECS Region, Amazon ECS Cluster ARN, Amazon ECS Service Name values.
Replace <CodeCatalyst-Dev-Admin-Role> with the Role Name from the pre-requisite
Name: BuildAndDeployToECS
SchemaVersion: "1.0"

# Set automatic triggers on code push.
Triggers:
  - Type: Push
    Branches:
      - main

Actions:
  Build_application_Multi_Region:
        Identifier: aws/build@v1
        Inputs:
          Sources:
            - WorkflowSource
          Variables:
            - Name: region
              Value: <EcsRegionNameMain>
            - Name: registry
              Value: <Account_ID>.dkr.ecr.<EcsRegionNameMain>.amazonaws.com
            - Name: image
              Value: codecatalyst-ecs-image-repo
        Outputs:
          AutoDiscoverReports:
            Enabled: false
          Variables:
            - IMAGE
        Compute:
          Type: EC2
        Environment:
          Connections:
            - Role: <CodeCatalyst-Dev-Admin-Role>
              Name: "<Account_ID>"
          Name: codecatalyst-ecs-environment
        Configuration:
          Steps:
            - Run: export account=`aws sts get-caller-identity --output text | awk '{ print $1
                }'`
            - Run: aws ecr get-login-password --region ${region} | docker login --username AWS
                --password-stdin ${registry}
            - Run: docker build -t appimage app
            - Run: docker tag appimage ${registry}/${image}:${WorkflowSource.CommitId}
            - Run: docker push --all-tags ${registry}/${image}
            - Run: export IMAGE=${registry}/${image}:${WorkflowSource.CommitId}
  build-deploy-region-one:
    Actions:
      RenderAmazonECStaskdefinition_Region_One:
        Identifier: aws/ecs-render-task-definition@v1
        Configuration:
          image: ${Build_application_Multi_Region.IMAGE}
          container-name: web
          task-definition: app/task.json
        Outputs:
          Artifacts:
            - Name: TaskDefinitionOne
              Files:
                - task-definition*
        DependsOn:
          - Build_application_Multi_Region
        Inputs:
          Sources:
            - WorkflowSource
      DeploytoAmazonECS_Region_One:
        Identifier: aws/ecs-deploy@v1
        Configuration:
          task-definition: /artifacts/build-deploy-region-one@DeploytoAmazonECS_Region_One/TaskDefinitionOne/${RenderAmazonECStaskdefinition_Region_One.task-definition}
          service: <EcsServiceNameMain>
          cluster: <EcsClusterNameMain>
          region: <EcsRegionNameMain>
        Compute:
          Type: EC2
          Fleet: Linux.x86-64.Large
        Environment:
          Connections:
            - Role: <CodeCatalyst-Dev-Admin-Role>
              Name: "<Account_ID>"
          Name: codecatalyst-ecs-environment
        DependsOn:
          - RenderAmazonECStaskdefinition_Region_One
        Inputs:
          Artifacts:
            - TaskDefinitionOne
          Sources:
            - WorkflowSource
  build-deploy-region-two:
    DependsOn:
      - build-deploy-region-one
    Actions:
      RenderAmazonECSTaskDefinition_Region_Two:
        # Identifies the action. Do not modify this value.
        Identifier: aws/[email protected]
        # Defines the action's properties.
        Configuration:
          image: ${Build_application_Multi_Region.IMAGE}
          container-name: web
          task-definition: app/task.json
        Outputs:
          Artifacts:
            - Name: TaskDefinitionTwo
              Files:
                - task-definition*
        DependsOn:
          - Build_application_Multi_Region
        # Specifies the source and/or artifacts to pass to the action as input.
        Inputs:
          # Optional
          Sources:
            - WorkflowSource # This specifies that the action requires this Workflow as a source
      DeployToAmazonECS_Region_Two:
        Identifier: aws/[email protected] # Defines the action's properties.
        Configuration:
          task-definition: /artifacts/build-deploy-region-two@DeployToAmazonECS_Region_Two/TaskDefinitionTwo/${RenderAmazonECSTaskDefinition_Region_Two.task-definition}
          service: <EcsServiceNameSecondary>
          cluster: <EcsClusterNameSecondary>
          region: <EcsRegionNameSecondary>
        # Required; You can use an environment to access AWS resources.
        Environment:
          Connections:
            - Role: <CodeCatalyst-Dev-Admin-Role>
              Name: "<Account_ID>"
          Name: codecatalyst-ecs-environment
        DependsOn:
          - RenderAmazonECSTaskDefinition_Region_Two
        # Specifies the source and/or artifacts to pass to the action as input.
        Inputs:
          Artifacts:
            - TaskDefinitionTwo
          # Optional
          Sources:
            - WorkflowSource # This specifies that the action requires this Workflow as a source
Figure 5: Amazon CodeCatalyst Workflow Screen
The workflow above (Figure 5) does the following:
Whenever code changes are pushed to the repository, a Build action is invoked automatically. The Build action builds a container image and pushes the image to the Amazon Elastic Container Registry (Amazon ECR) repository in the primary region. In this example, we are storing the container image only within the primary region. If you are implementing multi-region for disaster recovery, enable cross-region replication on Amazon ECR to automatically replicate images to repositories in other regions. You will also need to update the task definition files to reference the Amazon ECR repository in the same region where the task will run
Once the Build stage is complete, the Amazon ECS task definition is updated with the new Amazon ECR repository image
The DeployToECS action then deploys the new image to Amazon ECS in the first region
Once the first action group execution succeeds, the Amazon CodeCatalyst workflow invokes second action group repeating the last two steps (Render Task Definition, Deploy) for the second region.
As you may have noticed, the build action is separated from the deployment actions in this example. This way, we are building the container image only once and deploying the same image across multiple regions. But, if you have specific build steps that are region-specific, you can include those actions in the region-specific action groups. This allows for customizations based on regional requirements while maintaining overall consistency.
To check the syntax and structure of your workflow definition:
Choose the Validate button. It should add a green banner with “The workflow definition is valid” at the top
Select Commit to add the workflow to the repository (Figure 6)
Figure 6: Commit workflow page in Amazon CodeCatalyst
The workflow file is stored in a ~/.codecatalyst/workflows/ folder in the root of your source repository. The file can have a .yml or .yaml extension.
Using the URL of the Application Load Balancer you noted from the pre-requisite from either of the two regions, add /healthcheck to load the health check page in your browser. You’ll to see the message in the health check page as shown in figure 7.
Figure 7: ECS Multi Region Application (US-West-1)
Step 4: Validate the setup
To validate the setup, you will make a small change to the Health check of the sample application.
Open Amazon CodeCatalyst dev environment (Visual Studio Code) that you created in Step 1.
Update your local copy of the repository. In the terminal run the below command
git pull
Inside the Visual Studio Code IDE, open app.py present inside the app folder.
Inside healthcheck() method, on line 13, update the string from ok to ok v1
Commit the changes to the repository using the below commands:
After the change is commit, the Amazon CodeCatalyst workflow should start running automatically. Once the Amazon CodeCatalyst workflow finishes execution, paste the Application Load Balancer URL for region and add /healthcheck to reach the check page. You will be able to see the updated message in the health check page as shown in figure 8 and 9.
Figure 8: ECS Multi Region Application (US-East-1)
Figure 9: ECS Multi Region Application (US-West-1)
Considerations for multi-region deployments
In this post, we considered a deployment scenario across two regions. Many organizations have workload running across many regions, serving customers across the globe. The Amazon CodeCatalyst workflow, that we created in this post, can be extended to more than two regions.
Amazon CodeCatalyst allows fine-grained control for progressive wave-based deployments across multiple regions. This is achieved by using multiple action groups and sequencing those action groups using dependencies in the Amazon CodeCatalyst workflow. For example, in the workflow discussed in Step 3, you defined two action groups build-deploy-region-oneand build-deploy-region-two. We setup build-deploy-region-two to depend on build-deploy-region-one using DependsOn: property, so that the deployment to the second region starts only after the completion of the first region. This approach allows for staggered deployments, mitigating risks by preventing issues in one AWS region from impacting others.
For workloads spanning multiple regions, the same staggering deployment approach can be extended with more action groups. Each action group can contain a list of regions to deploy to in parallel. Dependencies between action groups ensures the deployment happens sequentially. Below is a high-level architecture (Figure 10) of the setup of 3-stage deployment process for a workload running across 6 regions.
Figure 10: Staggered Deployment architecture
Cleanup
If you have been following along with the post, you should delete the resources you deployed so you do not continue to incur charges.
Manually delete Amazon CodeCatalyst dev environment, source repository and project from your CodeCatalyst Space.
In conclusion, we demonstrated how you can setup multi-region deployments for Amazon ECS workloads using Amazon CodeCatalyst workflows. We showed how to configure the Amazon CodeCatalyst workflow to deploy to one region at a time, allowing for validation before proceeding to additional regions. The pattern can be extended to more than two AWS regions using additional action groups and dependencies. This solution addresses key challenges in multi-region deployments like maintaining consistency while ensuring high availability. Learn more about multi region in AWS Multi-Region Fundamentals Whitepaper
Amazon CodeCatalyst is a unified software development service for development teams to quickly build, deliver and scale applications on AWS while adhering to organization-specific best practices. Developers can automate development tasks and innovate faster with generative AI capabilities, and spend less time setting up project tools, managing CI/CD pipelines, provisioning and configuring various development environments or coordinating with team members.
It can integrate with services like AWS CodeArtifact, which is a managed artifact repository service that lets you securely store, publish, and share software packages. In this blog post we will show you how to use Publish to AWS CodeArtifact action in a CodeCatalyst workflow to publish packages to AWS Code Artifact.
In Amazon CodeCatalyst, an action is the main building block of a workflow, and defines a logical unit of work to perform during a workflow run. Typically, a workflow includes multiple actions that run sequentially or in parallel depending on how you’ve configured them. Amazon CodeCatalyst provides a library of pre-built actions that you can use in your workflows, such as for building, testing, deploying applications, as well as the ability to create custom actions for specific tasks not covered by the pre-built options.
Following are the instructions on using Publish to AWS CodeArtifact action in Amazon CodeCatalyst workflow.
Prerequisites
To follow along with this walkthrough, you will need:
A domain and repository created in AWS CodeArtifact for publishing your package. See Create a repository.
An AWS account associated with your space and have the IAM role in that account that has permissions to publish our package to AWS Code Artifact. For more information about the role and role policy, see Creating a CodeCatalyst service role. Make sure that the role includes the following permissions policy:
In the trust policy, we have specified two AWS services in the Principal element. Service principals are defined by the service. The following service principals are defined for CodeCatalyst:
amazonaws.com – This service principal is used for a role that will grant CodeCatalyst access to AWS.
codecatalyst-runner.amazonaws.com – This service principal is used for a role that will grant CodeCatalyst access to AWS resources in deployments for CodeCatalyst workflows.
Walkthrough
In this example, we are going to publish a npm package to a CodeArtifact repository called ‘myapp-frontend in the domain ‘myapp-artifacts. Amazon CodeCatalyst is available in two regions at the moment i.e. Europe (Ireland) and US West (Oregon). We will use ‘us-west-2’ for all the resources in this walkthrough.
Here are the steps to create your workflow.
In the navigation pane, choose CI/CD, and then choose Workflows.
Choose Create workflow.
The workflow definition file appears in the CodeCatalyst console’s YAML editor.
To configure your workflow
You can configure your workflow in the Visual editor, or the YAML editor. Let’s start with the YAML editor and then switch to the visual editor.
Choose + Actions to see a list of workflow actions that you can add to your workflow.
In the Build action, choose + to add the action’s YAML to your workflow definition file. Your workflow now looks similar to the following. You can follow the below code by editing in YAML editor.
The following code shows the newly created workflow.
Name: CodeArtifactWorkflow
SchemaVersion: "1.0"

# Optional - Set automatic triggers.
Triggers:
  - Type: Push
    Branches:
      - main

# Required - Define action configurations.
Actions:
  Build:
    # Identifies the action. Do not modify this value.
    Identifier: aws/[email protected]
    # Specifies the source and/or artifacts to pass to the action as input.
    Inputs:
      # Optional
      Sources:
        - WorkflowSource # This specifies that the action requires this Workflow as a source
    Outputs:
      Artifacts:
        - Name: ARTIFACT
          Files:
            - "**/*"
    # Defines the action's properties.
    Configuration:
      # Required - Steps are sequential instructions that run shell commands
      Steps:
        - Run: cd integration/npm/npm-package-example-main
        - Run: npm pack
        - Run: ls
    Compute:
      Type: EC2
    Environment:
      Connections:
        - Role: CodeCatalystWorkflowDevelopmentRole-action-workshop
          Name: codecatalystconnection
      Name: action-builder
In this build action, we are using ‘npm pack’ command to create a compressed tarball (.tgz) file of our package’s source code and configuration files. We are creating an output artifact named ‘ARTIFACT’ and our files are in this directory integration/npm/npm-package-example-master.
Now, we are going to select publish-to-code-artifact action from the action’s dropdown list.
The following code shows the newly added action in the workflow file.
If you chose ‘Visual’ option to view the workflow definition file in the visual editor. This is going to look as shown in the image below. The fields in the visual editor let you configure the YAML properties shown in the YAML editor.
How the “Publish to AWS CodeArtifact” action works:
The “Publish to AWS CodeArtifact” action works as follows at runtime:
Checks if the PackageFormat, PackagePath, RepositoryName, DomainNameand AWSRegionis specified, validates the configuration, and configures AWS credentials based on the Environment, Connection, and Role specified.
Looks for package files to publish in the path configured in the PackagePathfield in the WorkflowSource If no source is configured in Sources, but an artifact is configured in Arifacts, then the action looks for the files in the configured artifact folder.
Publishes the package to AWS CodeArtifact.
Cleanup
If you have been following along with this workflow, you should delete the resources you deployed so that you do not continue to incur charges.
Delete the published package in AWS CodeArtifact by following these instructions.
Delete the repository in AWS CodeArtifact by following these instructions.
Delete the domain in AWS CodeArtifact by following these instructions.
For Amazon CodeCatalyst, if you created a new project for this tutorial, delete it. For instructions, see Deleting a project. Deleting the project also deletes the source repository and workflow.
Conclusion
In this post, we demonstrated how to use an Amazon CodeCatalyst workflow to publish packages to AWS CodeArtifact by utilizing the Publish to AWS CodeArtifact action. By following the steps outlined in this blog post, you can ensure that your packages are readily available for your projects while maintaining version control and security.
For further reading, see Working with actions in the CodeCatalyst documentation.
About the Authors
Muhammad Shahzad is a Solutions Architect at AWS. He is passionate about helping customers achieve success on their cloud journeys, enjoys designing solutions and helping them implement DevSecOps by explaining principles, creating automated solutions and integrating best practices in their journey to the cloud. Outside of work, Muhammad plays badminton regularly, enjoys various other sports, and has a passion for hiking scenic trails.
Alexander Schueren is a Senior Specialist Solutions Architect at AWS, dedicated to modernizing legacy applications and building event-driven serverless solutions. With a focus on simplifying complexity and bringing clarity to technical challenges, Alexander is on a mission to empower developers with the tools they need for success. As the maintainer of the open-source project “Powertools for AWS Lambda (TypeScript),” he is committed to driving innovation in serverless technologies. In his free time, Alexander channels his creativity through street photography, capturing decisive moments in the urban landscape.
“All code will become legacy”. This saying, widely recognized amongst software developers, highlights the reality of their day-to-day activities. While writing new code is an integral part of a developer’s role, a significant portion of their time is dedicated to refactoring and maintaining existing codebases.
Developers typically encounter numerous challenges when attempting to understand and work with existing codebases. One of the primary obstacles is the lack of proper code documentation. As projects evolve and developers come and go, the rationale behind design decisions and implementation details can become obscured, making it challenging for new team members to understand the intricacies of the codebase.
Another hurdle is the need to work with unfamiliar or legacy programming languages and frameworks. The rapid pace of technology advancements means that developers must constantly adapt to new tools and libraries, while also maintaining an understanding of older technologies that may still be in use.
Compounding these challenges is the inherent difficulty of understanding code written by others. Even with comprehensive documentation and adherence to best coding practices, the nuances of another developer’s thought process and design decisions can be challenging to decipher. This lack of familiarity can lead to increased risk of introducing bugs or breaking existing functionality during code modifications.
In a bid to address these challenges, organizations must explore innovative solutions that enhance code understanding and improve developer efficiency. By empowering developers with tools that streamline code maintenance and refactoring processes, organizations can unlock their potential for innovation and accelerate their ability to deliver high-quality software products to the market.
In this blog post, we explore how developers in organizations can leverage Amazon Q Developer to simplify the process of understanding and explaining code in order to boost productivity and efficiency.
Prerequisites
The following prerequisites are required to make use of Amazon Q Developer in your IDE:
Introduction to Amazon Q Developer as a solution for simplifying code comprehension
Amazon Q Developer is a generative AI-powered service that helps developers and IT professionals with all of their tasks across the software development lifecycle—from coding, testing, and upgrading, to troubleshooting, performing security scanning and fixes, optimizing AWS resources, and creating data engineering pipelines. Amazon Q Developer aims to simplify code comprehension for developers, making it easier to understand and navigate complex codebases. It leverages advanced machine learning and natural language processing techniques to provide intelligent code analysis and exploration capabilities.
Developers can ask questions about their codebase in natural language and receive concise, relevant answers. Amazon Q Developer can explain the purpose and functionality of code elements, identify dependencies, and provide insights into code structure and architecture. This can significantly reduce the time and effort required to onboard new team members, maintain legacy systems, or refactor existing code. This result in not just better code quality and consistency across teams and projects; Amazon Q Developer also helps developers unlock a new level of productivity and efficiency by allowing them to focus more on innovation.
Understanding Amazon Q Developer’s ability to provide natural language explanations of code
One of the most powerful uses of Amazon Q Developer is getting natural language explanations of code directly within your integrated development environment (IDE). This can be an invaluable tool when trying to understand legacy code, review code you haven’t touched in a while, or learn how certain programming patterns or algorithms work. Rather than spending so much time reviewing code line-by-line or searching for tutorials, you can leverage Amazon Q Developer to provide insightful explanations.
The process is simple – highlight the section of code you need explained in your IDE, then right-click and select “Explain” from the Amazon Q Developer menu. Amazon Q Developer’s advanced language model will analyze the highlighted code and generate a plain English explanation breaking down what the code is doing line-by-line.
Figure 1 – Selecting the relevant code by highlighting or right-clicking on it.
Figure 2 – Selecting “Explain” to get natural language explanation from Amazon Q Developer
Let’s take a look at an example. If you highlight a few lines of code that creates a reference to an S3 bucket, Amazon Q Developer generates a natural language explanation such as:
Figure 3 – Amazon Q Developer analyzes the selected code and provides an explanation of what the code does in natural language.
Amazon Q Developer continues providing clear explanations of how the code implementation works. This natural language explanation can provide much-needed context and clarity, especially for complex coding patterns. This allows you to quickly catch up on code you haven’t looked at in a while. It can also be an excellent learning tool when researching how certain algorithms or coding techniques work under the hood.
If any part of the explanation is unclear, you can ask Amazon Q Developer follow-up questions using natural language in the chat interface. Amazon Q Developer will use the conversation context and the code to provide clarifying responses to follow-up questions. You can continue the back-and-forth conversation until you fully comprehend the code functionality. Optionally, you can provide feedback to Amazon Q Developer on the quality of its code explanations to help improve the service.
The “Explain” functionality is just one of the ways Amazon Q Developer augments your coding workflow by providing generative AI-powered insights into your code on-demand, right within your familiar IDE environment.
Now let’s dive into more examples.
Example demonstrating how Amazon Q Developer breaks down complex code algorithms
In this example, let’s assume a developer is working on a coding project that involves path-finding, network optimization and latency. We will use Amazon Q Developer to review code that should find the shortest path tree from a single source node, by building a set of nodes that have minimum distance from the source. This is the popular Djikstra’s algorithm and can be complex for developers that are new to graph theory and its implementation.
The developer can use Amazon Q Developer to understand what the block of code is doing in simple terms.
Here’s the code implementing the algorithm:
Figure 4 – Python code in IDE implementing Djikstra’s Algorithm for path-finding.
Figure 5 – With Amazon Q Developer, you can Explain, Refactor, Fix or Optimize your code.
You can Right-click the highlighted code to open a context window. Choose Send to Amazon Q, then select Explain. Selecting the “Explain” option will prompt Amazon Q Developer to analyze the code and provide a natural language explanation of what the code does.
Figure 6 – Amazon Q Developer will analyze the selected code and provide an explanation of what the code does in natural language.
Amazon Q Developer opens a chat panel on the right within the IDE, where you see the result of choosing the “Explain” option. Amazon Q Developer has analyzed the highlighted code and provided a detailed, step-by-step explanation in the chat panel. This explanation breaks down the complex algorithm in plain, easy-to-understand language, helping the developer better comprehend the purpose and functionality of the code. You can follow-up by asking clarifying questions within the chat panel.
You can also Refactor your code with Amazon Q Developer in order to improve code readability or efficiency, among other improvements.
Here’s how:
Figure 7 – Using Amazon Q Developer to Refactor code.
Highlight the code in the IDE and Refactor the code by first right clicking and selecting “send to Amazon Q”. This allows Amazon Q Developer to analyze the code and suggest ways to improve its readability, efficiency, or other aspects of the implementation. The chat panel provides the developer with the recommended refactoring steps.
Figure 8 – Amazon Q Developer analyzes the selected code and provides an explanation of steps you can take to refactor your code in the chat panel.
In the image above, Amazon Q Developer has carefully reviewed the code and provided a step-by-step plan for the developer to follow in order to refactor the code, making it more concise, maintainable, and aligned with best practices. This collaborative approach between the developer and Amazon Q Developer enables the efficient creation of high-quality, optimized code.
Conclusion
Amazon Q Developer is a game-changer for developers looking to streamline their understanding of complex code segments. By offering natural language explanations within the IDE, Amazon Q Developer eliminates the need for time-consuming manual research or reliance on outdated documentation. Amazon Q Developer’s ability to break down intricate algorithms and unfamiliar syntax, as shown in the preceding examples, empowers developers to tackle even the most challenging codebases with confidence.
Whether you’re a seasoned developer or just starting, Amazon Q Developer is an invaluable tool that simplifies the coding process and makes the coding environment more accessible and easier to navigate. With its seamless integration and user-friendly interface, Amazon Q Developer is poised to become an essential companion for developers worldwide, enabling them to write better code, learn more efficiently, and ultimately, deliver superior software solutions.
This post demonstrates how Amazon Q Developer, a generative AI-powered assistant for software development, helps create Terraform templates. Terraform is an infrastructure as code (IaC) tool that provisions and manages infrastructure on AWS safely and predictably. When used in an integrated development environment (IDE), Amazon Q Developer assists with software development, including code generation, explanation, and improvements. This blog highlights the 5 most used cases to show how Amazon Q Developer can generate Terraform code snippets:
Secure Networking Deployment: Generate Terraform code snippet to create an Amazon Virtual Private Cloud (VPC) with subnets, route tables, and security groups.
Multi-Account CI/CD Pipelines with AWS CodePipeline: Generate Terraform code snippet for setting up continuous integration and continuous delivery (CI/CD) pipelines using AWS CodePipeline across multiple AWS accounts.
Event-Driven Architecture: Generate Terraform code snippet to set up an event-driven architecture using Amazon EventBridge, AWS Lambda, Amazon API Gateway, and other serverless services.
Machine Learning Workflows: Generate Terraform module for deploying machine learning workflows using AWS SageMaker.
Terraform Project Structure
First, you want to understand the best practices and requirements for setting up a multi-environment Terraform Infrastructure as Code (IaC) project. Following industry practices from the start is crucial to manage your multi-environment infrastructure and this is where Amazon Q will recommend a standard folder and file structure for organising Terraform templates and managing infrastructure deployments.
Amazon Q Developer recommended organising Terraform templates in separate folders for each environment, with sub-folders to group resources into modules. It provided best practices like version control, remote backend, and tagging for reusability and scalability. We can ask Amazon Q Developer to generate a sample example for better understanding.
You can see that the recommended folder structure includes a root project folder and sub-folders for environments and modules. The sub-folders manage multiple environments (like development, testing, production), reusable modules (like Virtual Private Cloud (VPC), Elastic Compute Cloud (EC2)) for various components and it demonstrates references to manage Terraform templates for individual environments and components. Let’s explore the top 5 most common use cases one by one.
Now, we can ask Amazon Q Developer to generate a Terraform template for building components like Virtual Private Cloud (VPC) and subnets. The Terraform code generated by Amazon Q Developer for a VPC, private subnet, and public subnet. It also added tags to each resource, following best practices. To leverage the suggested code snippet in your template, open the vpc.tf file and either insert it at the cursor or copy it into the file. Additionally, Amazon Q Developer created an Internet Gateway, Route Tables, and associated them with the VPC.
2. Multi-Account CI/CD Pipelines with AWS CodePipeline
Let’s discuss the second use case: a CI/CD (Continuous Integration/Continuous Deployment) pipeline using AWS CodePipeline to deploy Terraform code across multiple AWS accounts. Assume this is your first time working on this use case. Use Amazon Q Developer to understand the pipeline’s design stages and requirements for creating your pipeline across AWS accounts. I asked Amazon Q Developer about the pipeline stages and requirements to deploy across AWS accounts.
Amazon Q Developer provided all the main stages for the CI/CD (Continuous Integration/Continuous Deployment) pipeline:
Source stage pulls the Terraform code from the source code repository.
Plan stage includes linting, validation, or running terraform plan to view the Terraform plan before deploying the code.
Build stage performs additional testing for the infrastructure to ensure all components will be created successfully.
Deploy stage runs terraform apply.
Amazon Q Developer also provided all the requirements needed before creating the CI/CD pipeline. These requirements include terraform is installed in the pipeline environment, IAM roles that will be assumed by the pipeline stages to deploy the terraform code across different accounts, an Amazon S3 bucket to store the state of the terraform code, source code repository to store our terraform files, use parameters to store sensitive data like AWS accounts IDs and AWS CodePipeline to create our CI/CD pipeline.
You will use Amazon Q Developer now to generate the terraform code for the CI/CD pipeline based on stages design proposed by the services in the previous question.
We would like to highlight three things here:
1. Amazon Q Developer suggested all the stages for our Continuous Integration/Continuous Deployment (CI/CD) design:
Source Stage: this stage pulls the code from the source code repository.
Build Stage: this stage will validates the infrastructure code, run a Terraform plan stage, and can automate any review.
Deploy Stage: this stage deploys the terraform code to the target AWS account.
2. Amazon Q Developer generated the build stage before the plan and this is expected in any CI/CD pipeline. First, we start with building the artifacts, running any tests or validation steps. If this stage is passed successfully, it will then proceed to terraform plan. 3. Amazon’s Q Developer suggests deploying to separate stages for each target account, aligning with the best practice of using different AWS accounts for development, testing, and production environments. This reduces the blast radius and allows configuring a separate stage for each environment/account.
3. Event-Driven Architecture
For the next use case, we will start by asking Amazon Q Developer to explain Event-driven architecture. As shown below, Amazon Q Developer highlights the important aspects that we need to consider when designing event-driven architecture like:
An event that represents an actual change in the application state like S3 object upload.
The event source that produces the actual event like Amazon S3.
An event route that routes the event between source and target.
An event target that consumes the event like AWS Lambda function.
Assume you want to build a sample Event-driven architecture using Amazon SNS as a simple pub/sub. In order to build such architecture, we will need:
An Amazon SNS topic to publish events to an Amazon SQS queue subscriber.
An Amazon SQS queue which subscribe to SNS topic.
Asking Amazon Q Developer to create a terraform code for the above use case, it generated a code that can get us started in seconds. The code includes:
Create an SNS Topic and SQS queue
Subscribe SQS queue to SNS topic
AWS IAM policy to allow SNS to write to SQS
4. Container Orchestration (Amazon ECS Fargate)
Now to our next use case, we want to build an Amazon ECS cluster with Fargate. Before we start, we will ask Amazon Q Developer about Amazon ECS and the difference between using Amazon EC2 or Fargate option.
Amazon Q Developer not only provides details about Amazon ECS capabilities and well-defined description about the difference between Amazon EC2 and Fargate as compute options, and also a guide when to use what to help in decision making process.
Now, we will ask Amazon Q Developer to suggest a terraform code to create an Amazon ECS cluster with Fargate as the compute option.
Amazon Q Developer suggested the key resources in the Terraform code for the ECS cluster, the resources are:
An Amazon ECS Cluster.
A sample task definition for an Nginx container with all the required configuration for the container to run.
ECS service with Fargate as launch type for the container to run.
5. Secure Machine Learning Workflows
Now let us explore final use case on setting up Machine Learning workflow. Assuming I am new to ML on AWS, I will first try to understand the best practices and requirements for ML workflows. We can ask Amazon Q Developer to get the recommendations for the resources, security policies etc.
Amazon Q Developer provided recommendations to provision SageMaker resources in private VPC, implement authentication and authorization using AWS IAM, encrypt data at rest and in transit using AWS KMS and setup secure CI/CD. Once I get the recommendations, I can identify the resources which I need to build MLOps workflow.
Amazon Q Developer suggested resources such as a SageMaker Studio instance, model registry, endpoints, version control, CI/CD Pipeline, CloudWatch etc. for ML model building, training and deployment using SageMaker. Now I can start building Terraform templates to deploy these resources. To get the code recommendations, I can ask Amazon Q Developer to give a Terraform snippet for all these resources.
Conclusion
In this blog post, we showed you how to use Amazon Q Developer, a generative AI–powered assistant from AWS, in your IDE to quickly improve your development experience when using an infrastructure-as-code tool like Terraform to create your AWS infrastructure. However, we would like to highlight some important points:
Code Validation and Testing: Always thoroughly validate and test the Terraform code generated by Amazon Q Developer in a safe environment before deploying it to production. Automated code generation tools can sometimes produce code that may need adjustments based on your specific requirements and configurations.
Security Considerations: Ensure that all security practices are followed, such as least privilege principles for IAM roles, proper encryption methods for sensitive data, and continuous monitoring for security compliance.
Limitations of Amazon Q Developer: While Amazon Q Developer provides valuable assistance, it may not cover all edge cases or specific customizations needed for your infrastructure. Always review the generated code and modify it as necessary to fit your unique use cases.
Updates and Maintenance: Infrastructure and services on AWS are continuously evolving. Make sure to keep your Terraform code and the use of Amazon Q Developer updated with the latest best practices and AWS service changes.
Real-Time Assistance: Use Amazon Q Developer in your IDE to enhance generated code as it provides real-time recommendations based on your existing code and comments. The suggestions are based on your existing code and comments, which are in this case generated by Amazon Q Developer.
To get started with Amazon Q Developer for debugging today navigate to Amazon Q Developer in IDE and simply start asking questions about debugging. Additionally, explore Amazon Q Developer workshop for additional hands-on use cases.
For any inquiries or assistance with Amazon Q Developer, please reach out to your AWS account team.
Development teams adopt DevOps practices to increase the speed and quality of their software delivery. The DevOps Research and Assessment (DORA) metrics provide a popular method to measure progress towards that outcome. Using four key metrics, senior leaders can assess the current state of team maturity and address areas of optimization.
This blog post shows you how to make use of DORA metrics for your Amazon Web Services (AWS) environments. We share a sample solution which allows you to bootstrap automatic metric collection in your AWS accounts.
Benefits of collecting DORA metrics
DORA metrics offer insights into your development teams’ performance and capacity by measuring qualitative aspects of deployment speed and stability. They also indicate the teams’ ability to adapt by measuring the average time to recover from failure. This helps product owners in defining work priorities, establishing transparency on team maturity, and developing a realistic workload schedule. The metrics are appropriate for communication with senior leadership. They help commit leadership support to resolve systemic issues inhibiting team satisfaction and user experience.
Use case
This solution is applicable to the following use case:
Development teams have a multi-account AWS setup including a tooling account where the CI/CD tools are hosted, and an operations account for log aggregation and visualization.
Developers use GitHub code repositories and AWS CodePipeline to promote code changes across application environment accounts.
Service impairment resulting from system change is logged as OpsItem in AWS Systems Manager OpsCenter.
Overview of solution
The four key DORA metrics
The ‘four keys’ measure team performance and ability to react to problems:
Deployment Frequency measures the frequency of successful change releases in your production environment.
Lead Time For Changes measures the average time for committed code to reach production.
Change Failure Rate measures how often changes in production lead to service incidents/failures, and is complementary to Mean Time Between Failure.
Mean Time To Recovery measures the average time from service interruption to full recovery.
The first two metrics focus on deployment speed, while the other two indicate deployment stability (Figure 1). We recommend organizations to set their own goals (that is, DORA metric targets) based on service criticality and customer needs. For a discussion of prior DORA benchmark data and what it reveals about the performance of development teams, consult How DORA Metrics Can Measure and Improve Performance.
For example, the Change Failure Rate focuses on changes that impair the production system. Limiting the calculation to tags (such as hotfixes) on pull requests would exclude issues related to the build process. It’s important to match system change records that lead to actual impairments in production. Limiting the calculation to the number of failed deployments from the deployment pipeline only considers deployments that didn’t reach production. We use AWS Systems Manager OpsCenter as the system of records for change-related outages, rather than relying solely on data from CI/CD tools.
Similarly, Mean Time To Recovery measures the duration from a service impairment in production to a successful pipeline run. We encourage teams to track both pipeline status and recovery time, as frequent pipeline failure can indicate insufficient local testing and potential pipeline engineering issues.
Gathering DORA events
Our metric calculation process runs in four steps:
In the tooling account, we send events from CodePipeline to the default event bus of Amazon EventBridge.
Events are forwarded to custom event buses which process them according to the defined metrics and any filters we may have set up.
The custom event buses call AWS Lambda functions which forward metric data to Amazon CloudWatch. CloudWatch gives us an aggregated view of each of the metrics. From Amazon CloudWatch, you can send the metrics to another designated dashboard like Amazon Managed Grafana.
As part of the data collection, the Lambda function will also query GitHub for the relevant commit to calculate the lead time for changes metric. It will query AWS Systems Manager for OpsItem data for change failure rate and mean time to recovery metrics. You can create OpsItems manually as part of your change management process or configure CloudWatch alarms to create OpsItems automatically.
Figure 2 visualizes these steps. This setup can be replicated to a group of accounts of one or multiple teams.
Figure 2. DORA metric setup for AWS CodePipeline deployments
Walkthrough
Follow these steps to deploy the solution in your AWS accounts.
Prerequisites
For this walkthrough, you should have the following prerequisites:
AWS accounts for tooling, operations, and application environments
Before you start deploying or working with this code base, there are a few configurations you need to complete in the constants.py file in the cdk/ directory. Open the file in your IDE and update the following constants:
TOOLING_ACCOUNT_ID & TOOLING_ACCOUNT_REGION: These represent the AWS account ID and AWS region for AWS CodePipeline (that is, your tooling account).
OPS_ACCOUNT_ID & OPS_ACCOUNT_REGION: These are for your operations account (used for centralized log aggregation and dashboard).
TOOLING_CROSS_ACCOUNT_LAMBDA_ROLE: The IAM Role for cross-account access that allows AWS Lambda to post metrics from your tooling account to your operations account/Amazon CloudWatch dashboard.
DEFAULT_MAIN_BRANCH: This is the default branch in your code repository that’s used to deploy to your production application environment. It is set to “main” by default, as we assumed feature-driven development (GitFlow) on the main branch; update if you use a different naming convention.
APP_PROD_STAGE_NAME: This is the name of your production stage and set to “DeployPROD” by default. It’s reserved for teams with trunk-based development.
Setting up the environment
To set up your environment on MacOS and Linux:
Create a virtual environment:
$ python3 -m venv .venv
Activate the virtual environment: On MacOS and Linux:
$ source .venv/bin/activate
Alternatively, to set up your environment on Windows:
Create a virtual environment:
% .venv\Scripts\activate.bat
Install the required Python packages:
$ pip install -r requirements.txt
To configure the AWS Command Line Interface (AWS CLI):
Configure your user profile (for example, Ops for operations account, Tooling for tooling account). You can check user profile names in the credentials file.
Deploying the CloudFormation stacks
Switch directory
$ cd cdk
Bootstrap CDK
$ cdk bootstrap –-profile Ops
Synthesize the AWS CloudFormation template for this project:
$ cdk synth
To deploy a specific stack (see Figure 3 for an overview), specify the stack name and AWS account number(s) in the following command:
To launch the other stacks in the Operations account (including DoraOpsGitHubLogsStack, DoraOpsDeploymentFrequencyStack, DoraOpsLeadTimeForChangeStack, DoraOpsChangeFailureRateStack, DoraOpsMeanTimeToRestoreStack, DoraOpsMetricsDashboardStack):
$ cdk deploy DoraOps* --profile Ops
The following figure shows the resources you’ll launch with each CloudFormation stack. This includes six AWS CloudFormation stacks in operations account. The first stack sets up log integration for GitHub commit activity. Four stacks contain a Lambda function which creates one of the DORA metrics. The sixth stack creates the consolidated dashboard in Amazon CloudWatch.
Figure 3. Resources provisioned with this solution
Testing the deployment
To run the provided tests:
$ pytest
Understanding what you’ve built
Deployed resources in tooling account
The DoraToolingEventBridgeStack includes Amazon EventBridge rules with a target of the central event bus in the operations account, plus an AWS IAM role with cross-account access to put events in the operations account. The event pattern for invoking our EventBridge rules listens for deployment state changes in AWS CodePipeline:
{
  "detail-type": ["CodePipeline Pipeline Execution State Change"],
  "source": ["aws.codepipeline"]
}
Deployed resources in operations account
The Lambda function for Deployment Frequency tracks the number of successful deployments to production, and posts the metric data to Amazon CloudWatch. You can add a dimension with the repository name in Amazon CloudWatch to filter on particular repositories/teams.
The Lambda function for the Lead Time For Change metric calculates the duration from the first commit to successful deployment in production. This covers all factors contributing to lead time for changes, including code reviews, build, test, as well as the deployment itself.
The Lambda function for Change Failure Rate keeps track of the count of successful deployments and the count of system impairment records (OpsItems) in production. It publishes both as metrics to Amazon CloudWatch and the latter calculates the ratio, as shown in below example.
The Lambda function for Mean Time To Recovery keeps track of all deployments with status SUCCEEDED in production and whose repository branch name references an existing OpsItem ID. For every matching event, the function gets the creation time of the OpsItem record and posts the duration between OpsItem creation and successful re-deployment to the CloudWatch dashboard.
All Lambda functions publish metric data to Amazon CloudWatch using the PutMetricData API. The final calculation of the four keys is performed on the CloudWatch dashboard. The solution includes a simple CloudWatch dashboard so you can validate the end-to-end data flow and confirm that it has deployed successfully:
Cleaning up
Remember to delete example resources if you no longer need them to avoid incurring future costs.
Alternatively, go to the CloudFormation console in each AWS account, select the stacks related to DORA and click on Delete. Confirm that the status of all DORA stacks is DELETE_COMPLETE.
Conclusion
DORA metrics provide a popular method to measure the speed and stability of your deployments. The solution in this blog post helps you bootstrap automatic metric collection in your AWS accounts. The four keys help you gain consensus on team performance and provide data points to back improvement suggestions. We recommend using the solution to gain leadership support for systemic issues inhibiting team satisfaction and user experience. To learn more about developer productivity research, we encourage you to also review alternative frameworks including DevEx and SPACE.
Many organizations with workloads hosted on AWS leverage the advantage of AWS services like AWS CloudFormation, AWS CodeDeploy, and other AWS developer tools while integrating with their existing development workflows. These customers seek to maintain their preferred version control systems, such as GitHub, and continue using their established continuous integration and continuous deployment (CI/CD) pipelines from popular solutions, like Azure DevOps.
AWS Toolkit for Azure DevOps is an extension for Microsoft Azure DevOps and Microsoft Azure DevOps Server that makes it easy to manage and deploy applications using AWS. It provides tasks that enable integration with many AWS services. It can also run commands using the AWS Tools for Windows PowerShell module and the AWS Command Line Interface (AWS CLI).
Solution Overview
For this blog post, we use Azure Repos as version control. Our Continuous Integration/Continuous Deployment (CI/CD) pipeline is in Azure DevOps. We use AWS CloudFormation to deploy a sample web application and the required infrastructure in AWS. We then use the AWS CodeDeploy Blue/Green deployment method to deploy a newer version of the code to the sample web application running on Amazon EC2 instances in AWS.
For build agent, we have used self-hosted Linux agent running on Ubuntu virtual machine with a user-assigned managed identity in Azure. Azure DevOps customers opt for self-hosted agents when their requirements surpass the capabilities offered by Microsoft-hosted agents. Instead of storing and securing long-term credentials, the Azure Pipeline tasks get temporary credential information from AWS Security Token Service (AWS STS) through an OpenID Connect (OIDC) provider in AWS Identity and Access Management (IAM) to access AWS resources. Figure 1 shows the solution architecture that explains the setup. The sample application code and the CloudFormation template used in this example are available in this GitHub repository.
Figure 1 – Sample solution architecture
The solution architecture involves the following steps:
User pushes code to an Azure Repo that automatically runs an Azure DevOps Pipeline.
The pipeline agent acquires AWS STS provided temporary security credentials using OpenID Connect (OIDC) and assuming an IAM Role with the permissions. The IAM Role’s trust policy allows the Azure Pipelines OIDC Identity Provider to assume the role.
Pipeline tasks use the temporary credentials to invoke CloudFormation to provision resources defined in the template.
The subsequent pipeline task starts a CodeDeploy Blue/Green deployment
Note: You can also use Amazon EC2 Instances to run the self-hosted Azure DevOps agent. For build agents running on EC2 instances, the tasks can automatically get credential and region information from instance metadata associated with the Amazon EC2 instance. To use Amazon EC2 instance metadata credentials, the instance must have started with an instance profile that references a role that grants permissions to the task. This allows the role to make calls to AWS on your behalf. For more information, see Using an IAM role to grant permissions to applications running on Amazon EC2 instances.
Note: Skip Step 3 through Step 6 if you are running the Azure DevOps agent on Amazon EC2 Instances
Step 3: Register a new application in Azure
In the Azure portal, select Microsoft Entra ID.
Select App registrations.
Choose New registration.
Enter a name for your application and then select an option in Supported account types (in this example, we chose Accounts in this Organization directory only). Leave the other options as is. Then choose Register.
Figure 3 – Register an application in Microsoft Entra ID.
Step 4: Configure the application ID URI
In the Azure portal, select Microsoft Entra ID.
Select App registrations.
On the App registrations page, select All applications and choose the newly registered application.
On the newly registered application’s overview page, choose Application ID URI and then select Add.
On the Edit application ID URI page, enter the value of the URI, which looks like urn://<name of the application> or api://<name of the application>.
You will use the application ID URI as the audience in the identity provider (idP) section of AWS.
For Provider URL, enter https://sts.windows.net/<Microsoft Entra Tenant ID>. Replace <Microsoft Entra Tenant ID> with your Tenant ID from Azure. This allows only identities from your Azure tenant to access your AWS resources.
For Audience use the application ID URI from enterprise application configured in Step 4.
Figure 4 – Configure OpenID Connect provider in AWS.
Step 6: Create an IAM Web Identity Role and associate it with the IdP established in Step 5. Select the specific audience that was created previously. Ensure you grant the desired permissions to this role and keep the principle of least privilege in mind when associating the IAM policy with the IAM Role.
In the navigation pane, choose Identity providers, and then select the provider you created in Step 5.
Click on Assign Role and select ‘Create a new role’.
Select Web identity and chose the Audience from the drop down as depicted in Figure 5.
Figure 5 – Create an IAM Web Identity Role in AWS.
Click on Next and choose one or more policies to attach to your new role.
Click on Next.
Enter a role name and validate the trust policy to make sure that only the intended identities assume the role, provide an audience (aud) as the condition in the role trust policy for this IAM role.
Step 7: Install Azure Pipeline agent on the Ubuntu VM.
In this example, we used the following commands to install the latest version of the agent on the VM: Note: 3.241.0 is the current agent version as of publication. Configure and run the agent as per Self-hosted Linux agents instructions.
mkdir myagent && cd myagent
wget https://vstsagentpackage.azureedge.net/agent/3.241.0/vsts-agent-linux-arm64-3.241.0.tar.gz
tar zxvf vsts-agent-linux-arm64-3.241.0.tar.gz
Note: 3.241.0 is the current agent version as of publication.
Step 8: Validate if the agent is installed correctly and shows as online.
Sign in to your organization (https://dev.azure.com/{yourorganization}).
Choose Azure DevOps, Organization settings.
Choose Agent pools.
Select the pool on the right side of the page and then click Agents.
Figure 6- Self-hosted agent installed on Ubuntu VM in Azure
Step 9: Create new Azure Pipelines by following the Create your first pipeline instructions. In this example, we have defined three pipeline tasks as below within the Azure Pipeline.
Bash Script: Task 1 runs a bash script to establish connectivity with AWS that allows authentication through a service principal in Microsoft Entra ID to get temporary credentials using AssumeRoleWithWebIdentity. Note: This task is not required if you use Amazon EC2 Instances to run a self-hosted Azure DevOps agent.
- task: Bash@3
  inputs:
    targetType: 'inline'
    script: |
      AUDIENCE="<replace with application ID URI configured in step 4>"
      ROLE_ARN="<replace with IAM Role ARN created in step 6>"
      access_token=$(curl "http://169.254.169.254/metadata/identity/oauth2/token?api-version=2018-02-01&resource=${AUDIENCE}" -H "Metadata:true" -s| jq -r '.access_token')
      credentials=$(aws sts assume-role-with-web-identity --role-arn ${ROLE_ARN} --web-identity-token ${access_token} --role-session-name AWSAssumeRole | jq '.Credentials' | jq '.Version=1')
      AccessKeyId=$(echo "$credentials" | jq -r '.AccessKeyId')
      SecretAccessKey=$(echo "$credentials" | jq -r '.SecretAccessKey')
      SessionToken=$(echo "$credentials" | jq -r '.SessionToken')
      echo "##vso[task.setvariable variable=AWS.AccessKeyID]$AccessKeyId"
      echo "##vso[task.setvariable variable=AWS.SecretAccessKey]$SecretAccessKey"
      echo "##vso[task.setvariable variable=AWS.SessionToken]$SessionToken"
We have specified no long-term AWS credentials to be used by the tasks in the build agent environment. The tasks are fetching temporary credentials from the named variables in our build- AWS.AccessKeyID, AWS.SecretAccessKey, and AWS.SessionToken.
The IAM authentication and authorization process is as follows:
Azure VM gets an Azure access token from the user assigned managed identity and sends it to AWS STS to retrieve temporary security credentials.
An IAM role created with a valid Azure tenant audience and subject validates that it sourced the claim from a trusted entity and sends temporary security credentials to the requesting Azure VM.
Azure VM accesses AWS resources using the AWS STS provided temporary security credentials.
AWS CloudFormation Create/Update Stack: Task 2 creates a new AWS CloudFormation stack or updates the stack if it exists. In the example below, we deployed a new CloudFormation stack to provision AWS resources using a template file named deploy-app-to-aws.yml:
AWS CodeDeploy Application Deployment: Task 3 deploys an application to Amazon EC2 instance(s) using AWS CodeDeploy. The below example Azure DevOps pipeline task deploys to a CodeDeploy application named ‘aws-toolkit-for-azure-devops‘ and a CodeDeploy deployment group named ‘my-sample-bg-deployment-group‘ in the US East 1 (N. Virginia) region. It took the deployment package from the Azure DevOps pipeline workspace, uploaded to an S3 bucket, and any existing file with the same name is overwritten.
Expanding on the Inputs used in the pipeline tasks:
regionName: The AWS region where the CloudFormation stack will be created or updated.
stackName: This parameter specifies the name of the CloudFormation stack. Here, it’s set to ‘aws-sample-app‘.
templateSource: This parameter specifies the source of the CloudFormation template. Here, it’s set to ‘file‘, which means the template is a local file.
templateFile: This parameter specifies the path to the CloudFormation template file.
applicationName: This parameter specifies the name of the CodeDeploy application to be used for deployment.
deploymentGroupName: This parameter specifies the name of the CodeDeploy deployment group to which the application will be deployed.
deploymentRevisionSource: Specifies the source of the revision to be deployed. Here, it’s set to ‘workspace‘, which means the task will create or use an existing zip archive in the location specified to Revision Bundle, upload the archive to an S3 bucket and supply the key of the S3 object to CodeDeploy as the revision source.
bucketName: This parameter specifies the name of the S3 bucket where the deployment package will be uploaded.
fileExistsBehavior: This parameter specifies the behavior- how AWS CodeDeploy should handle files that already exist in a deployment target location. Here, it’s set to ‘OVERWRITE‘, which means it will overwrite the existing file with the new source file.
To use “S3” as deploymentRevisionSource, you may define your task as below:
trigger:
  branches:
    include:
    - main
stages:
- stage: __default
  jobs:
  - job: Job
    steps:
    - task: AWSShellScript@1
      inputs:
        regionName: 'us-east-1'
        scriptType: 'inline'
        inlineScript: |
          zip -r  $(Build.BuildNumber).zip .
          aws s3 cp $(Build.BuildNumber).zip s3://<Replace with your S3 bucket name>/
    - task: CodeDeployDeployApplication@1
      inputs:
        regionName: 'us-east-1'
        applicationName: 'aws-toolkit-for-azure-devops'
        deploymentGroupName: 'my-sample-bg-deployment-group'
        deploymentRevisionSource: 's3'
        bucketName: '<Replace with your S3 bucket name>'
        bundleKey: $(Build.BuildNumber).zip
Step 10: Run and validate the pipeline.
The pipeline will run automatically when a change is pushed to main branch. From the pipeline run summary you can view the status of your run, both while it is running and when it is complete. Refer View and manage your pipelines for more details.
Navigate to your Azure Devops project (https://dev.azure.com/{yourorganization}/{yourproject}).
Select Pipelines from the left-hand menu to go to the pipelines landing page.
Choose Recent to view recently run pipelines (the default view).
Select a pipeline to manage that pipeline and view the runs.
Choose Runs and choose a job to see the steps for that job.
Upon successful completion of the pipeline execution, you can validate the deployment status in the CodeDeploy console. In this example, the successful CodeDeploy deployment looks like:
Figure 7: CodeDeploy Deployment details in AWS console
You can also validate the website URL in a browser to confirm if it’s working as expected. After completing the pipeline execution, hit the website URL on a browser to check if it’s working.
On the CloudFormation stack ‘aws-sample-app‘ Outputs tab, look for the WebsiteURL key and click on the URL.
For a successful deployment, it will open a default page similar to Figure 8 below.
Figure 8: Sample application home page
Cleanup
After you have tested and verified your pipeline, remove all resources created for this example to avoid incurring any unintended expenses.
In this blog post, we showed how to leverage the AWS Toolkit for Azure DevOps extension to deploy resources to your AWS account from Azure DevOps and perform a Blue/Green deployment using AWS CodeDeploy. We explored obtaining temporary credentials in AWS Identity and Access Management (IAM) by leveraging the AWS Security Token Service (AWS STS) with Azure managed identities and Azure App Registration. This approach enhances security by eliminating the need to store long-term credentials, adhering to best practices for credential management. For customers looking to host their code on GitHub and deploy to AWS, they can leverage GitHub Actions with AWS CodeBuild’s support for managed GitHub Action runners. This integration potentially helps to reduce costs and simplifying the operational overhead associated with CI/CD processes.
Building with AWS requires you to interact with and manipulate your AWS resources, whether it’s to manage infrastructure, deploy applications, or troubleshoot issues and many AWS customers use AWS Cloud9 to do so today. However, developers want the ability to work with AWS resources within their own Integrated Development Environment (IDE) because it allows them to streamline their workflows and leverage familiar tools. Other customers still want the security and flexibility of working with their resources in the AWS Management Console, but with quicker access and portability across different pages. In this blog, we will discuss two solutions, the AWS IDE Toolkits and AWS CloudShell, and why you may want to migrate from AWS Cloud9 to one of these solutions.
Overview
The AWS IDE Toolkits are a set of open-source plugins that integrate AWS services directly into popular IDEs like Visual Studio Code, IntelliJ, and PyCharm. With these toolkits, you can manage AWS resources, deploy applications, and debug code without leaving your familiar development environment. Key features of the AWS IDE Toolkits include seamless access to AWS services, resource exploration and management, local debugging capabilities, and integration with AWS deployment tools like AWS CloudFormation and AWS SAM. The AWS IDE Toolkits saves you the hassle of deploying and managing an AWS Cloud9 EC2 instance in your account and allows you to interact with AWS services in the context of your IDE’s source code.
AWS CloudShell is a browser-based shell available directly in the AWS Management Console that provides a pre-authenticated and pre-configured environment for running interacting with AWS resources. AWS CLI is pre-installed in the AWS CloudShell environment, eliminating the need for you to install and configure the AWS CLI locally, making it easier to interact with AWS resources from anywhere. You can use AWS CloudShell to check or adjust a configuration file, make a quick fix to a production environment, or even experiment with new AWS services or features. Best of all, usage of AWS CloudShell is free. CloudShell’s accessibility from anywhere in the AWS Management Console makes it an ideal alternative when you want to interact with AWS resources via the command line over the web because you have limitations doing so on your local desktop.
Getting started
If you’re interested in leveraging the AWS IDE Toolkits, the onboarding process is straightforward. In many popular IDE’s like Visual Studio Code, you can simply install the AWS Toolkits extension in the IDE’s extension marketplace and authenticate with your AWS credentials to begin taking advantage of all of the AWS Toolkits features. For more detailed information about installation, you can see the onboarding steps for each supported IDE. To begin using AWS CloudShell, simply click the CloudShell icon in the AWS Management Console and follow the prompts to launch your shell environment. CloudShell leverages the credentials from your AWS Management Console sessions to provide a pre-authenticated shell environment. You can also explore detailed user guides and sample use cases to help you get familiar with the tool.
Figure 1: Click on the AWS CloudShell icon
Summary
Both the AWS IDE Toolkits and AWS CloudShell offer powerful capabilities for interacting with AWS resources. Whether you prefer working within your local IDE or a web-based terminal directly in the AWS Management Console, these solutions provide a seamless and efficient way to manage your AWS infrastructure and applications. Take the time to explore these options and see how they can enhance your development workflows. Finally, don’t forget to delete your AWS Cloud9 EC2 instances once you migrate to avoid incurring unnecessary future costs.
In this post, we guide you through five common components of efficient code debugging. We also show you how Amazon Q Developer can significantly reduce the time and effort required to manually identify and fix errors across numerous lines of code. With Amazon Q Developer on your side, you can focus on other aspects of software development, such as design and innovation. This leads to faster development cycles and more frequent releases, as you as a software developer can allocate less time to debugging and more time to building new features and functionality.
Debugging is a crucial part of the software development process. It involves identifying and fixing errors or bugs in the code to ensure that it runs smoothly and efficiently in the production environment. Traditionally, debugging has been a time-consuming and labor-intensive process, requiring developers to manually search through lines of code to investigate and subsequently fix errors. With Amazon Q Developer, a generative AI–powered assistant that helps you learn, plan, create, deploy, and securely manage applications faster, the debugging process becomes more efficient and streamlined. This enables you to easily understand the code, detect anomalies, fix issues and even automatically generate the test cases for your application code.
Let’s consider the following code example, which utilizes Amazon Bedrock, Amazon Polly, and Amazon Simple Storage Service (Amazon S3) to generate a speech explanation of a given prompt. A prompt is the message sent to a model in order to generate a response. It constructs a JSON payload with the prompt (for example – “explain black holes to 8th graders”) and configuration for the Claude model, and invokes the model via the Bedrock Runtime API. Amazon Polly converts the Large Language Model (LLM) response into an audio output format which is then uploaded to an Amazon S3 bucket location:
The first step in debugging your code is to understand what the code is doing. Very often you have to build upon code from others. Amazon Q Developer comes with an inbuilt feature that allows it to quickly explain the selected code and identify the main components and functions. This feature utilizes natural language processing (NLP) and summarization capability of LLMs, making your code easy to understand, and helping you identify potential issues. To gain deeper insights into your codebase, simply select your code, right-click and select ‘Send to Amazon Q’ option from menu. Finally, click on “Explain” option.
Amazon Q Developer generates an explanation of the code, highlighting the key components and functions. You can then use this summary to quickly identify potential issues and minimize your debugging efforts. It demonstrates how Amazon Q Developer accepts your code as input and the summarizes it for you. It explains the code in a natural language, which can help developers understand and debug the code.
If you have any follow-up question regarding the given explanation, you can also ask Amazon Q Developer for more in-depth review of a specific task. With respect to the code context, Amazon Q Developer automatically understands the existing code functionality and provides more insights. We ask Amazon Q Developer to explain how the Amazon Polly service is being used for synthesizing in the sample code snippet. It provides detailed step-by-step clarification from the retrieval to the upload process. Using this approach, you can ask any clarifying questions similar to asking a colleague to help you better understand a topic.
2. Amplify debugging with Logs
The sample code is deficient in terms of support for debugging including proper exception handling mechanisms. This makes it difficult to identify and handle issues during the execution or runtime of the application, further causing delays in the overall development process. You can instruct Amazon Q Developer to add a new code block for debugging your application against potential failures. Amazon Q Developer analyzes the existing code and then recommends to add a new code snippet to include printing and logging of debug messages and exception handling. It embeds ‘try-except’ blocks to catch potential exceptions that may occur. You use the recommended code after reviewing and modifying it. For example, you need to update the variable REPLACE_WITH_YOUR_BUCKET_NAME with your actual Amazon S3 bucket name.
With Amazon Q, you seamlessly enhance your codebase by selecting specific code segments and providing them as prompts. This enables you to explore suggestions for incorporating the required exception handling mechanisms or strategic logging statements.
Logs are an essential tool for debugging your application code. They allow you to track the execution of your code and identify where errors are occurring. With Amazon Q Developer, you can view and analyze log data from your application, and identify issues and errors that may not be immediately apparent from the code. It demonstrates that the given code does not have the logging statements embedded.
You can provide a prompt to Amazon Q Developer in the chat window asking it to write a code to enable logging and add log statements. This will automatically add logging statements wherever needed. It is useful to log inputs, outputs, and errors when making API calls or invoking models. You may copy the entire recommended code to the clipboard, review it, and then modify as needed. For example, you can decide which logging level you want to use, INFO or DEBUG.
3. Anomaly Detection
Another powerful use case for Amazon Q Developer is anomaly detection in your application code. Amazon Q Developer uses machine learning algorithms to identify unusual patterns in your code and highlight potential issues. It can detect issues that may be difficult to detect, such as an array out of bounds, infinite loops, or concurrency issues. For demonstration purposes, we intentionally introduce a simple anomaly in the code. We ask Amazon Q Developer to detect the anomaly in the code when attempting to generate text from the response. A simple prompt about detecting anomalies in the given code generates a useful output. It is able to detect the anomaly in the ‘response_body’ dictionary. Additionally, Amazon Q Developer recommends best practices to check the status code and handle the errors with a code snippet.
With code anomaly detection at your fingertips, you can promptly identify issues that may be impacting the application’s performance or user experience.
4. Automated Bug Fixing
After conducting all the necessary analysis, you can use Amazon Q Developer to fix bugs and issues in the code. Amazon Q Developer’s automated bug-fixing feature saves you hours you would otherwise spend on debugging and testing the code without its help. Starting with the code example which has an anomaly, you can identify and fix the code issue by simply selecting the code and sending it to Amazon Q Developer to apply fixes.
Amazon Q Developer identifies and suggests various ways to fix common issues in your code, such as syntax errors, logical errors, and performance issues. It can also recommend optimizations and improvements to your code, helping you to deliver a better user experience and improve your application’s performance.
5. Automated Test Case Generation
Testing is an integral part of code development and debugging. Running high quality test cases improve the quality of the code. With Amazon Q Developer, you can automatically generate the test cases quickly and easily. Amazon Q Developer uses its Large Language Model core to generate test cases based on your code, identifying potential issues and ensuring that your code is comprehensive and reliable.
With automated test case generation, you save time and effort while testing your code, ensuring that it is robust and reliable. A natural language prompt is sent to Amazon Q Developer to suggest test cases for given application code. You can notice that Amazon Q Developer provides a list of possible test cases that can aid in debugging and generating further test cases.
After receiving suggestions for test cases, you can also ask Amazon Q Developer to generate code snippet for some or all of the identified test cases.
Conclusion:
Amazon Q Developer revolutionizes the debugging process for developers by leveraging advanced and natural language understanding and generative AI capabilities. From explaining and summarizing code to detecting anomalies, implementing automatic bug fixes, and generating test cases, Amazon Q Developer streamlines common aspects of debugging. Developers can now spend less time manually hunting for errors and more time innovating and building features. By harnessing the power of Amazon Q, organizations can accelerate development cycles, improve code quality, and deliver superior software experiences to their customers.
To get started with Amazon Q Developer for debugging today navigate to Amazon Q Developer in IDE and simply start asking questions about debugging. Additionally, explore Amazon Q Developer workshop for additional hands-on use cases.
For any inquiries or assistance with Amazon Q Developer, please reach out to your AWS account team.
Many organizations have critical legacy Java applications that are increasingly difficult to maintain. Modernizing these applications is a necessary, daunting, and risky task that takes the focus off of creating new value or features. This includes undocumented code, outdated frameworks and libraries, security vulnerabilities, a lack of logging and error handling, and a lack of input validation. Amazon Q Developer simplifies and accelerates the modernization of existing Java applications. It can analyze code to highlight areas for potential improvements, assist with resolving technical debt, suggest code optimizations, and facilitate the transition to current frameworks and libraries.
This blog post explores how to modernize legacy Java applications using Amazon Q Developer. We will take an example of Unicorn Store API, a Java application with Java 8 running on Amazon Elastic Compute Cloud (Amazon EC2). First, we will upgrade the underlying runtime from Java 8 to Java 17 and other common dependencies, including Spring. Then, we will reduce technical debt within the code by improving modularity and logging. Finally, we will redeploy this application in a container image using a modern computing option, AWS Fargate.
The Unicorn Store API provides CRUD operations to manage Unicorn records in a database. It is built with Maven.
You will follow the below steps to modernize this application and bring it to Fargate using Amazon Q Developer.
Upgrade the application to Java 17 to leverage the latest features.
Reduce existing technical debt in the codebase.
Make the application cloud native and deploy it to AWS.
Outdated applications require increased effort to maintain security and stability. As a developer, you must continually relearn framework changes and optimizations that others have discovered in previous upgrades. The effort required to maintain the application makes it difficult to balance necessary updates with adding new features.
With Amazon Q Developer agent for code transformation, you can keep applications updated and supported in just a few steps. This removes vulnerabilities from unsupported versions, improves performance, and frees up time to focus on adding new features. Amazon Q Developer agent for code transformation accelerates application maintenance, upgrades, and migration in minutes. It enables developers to remove much of the undifferentiated work out of the tedious task of maintaining, upgrading and migrating existing application workloads, saving up to days’ or months’ worth of the undifferentiated work involved in moving from older language versions.
Let’s upgrade our Unicorn Store API from Java 8 to Java 17 using Amazon Q Developer agent for code transformation to leverage the latest features and optimization. In IntelliJ IDE, you enter /transform in the Amazon Q chat panel and provide the necessary details for Amazon Q Developer to start upgrading the project.
Amazon Q Developer agent for code transformation automatically analyzes the existing code, generates a transformation plan, and completes the transformation tasks suggested by the plan. While doing so, it upgrades popular libraries and frameworks to a version compatible with Java 17, including Spring, Spring Boot, JUnit, JakartaEE, Mockito, Hibernate, and Log4j to their latest available major versions. It also updates deprecated code components according to Java 17 recommendations. To start with the Amazon Q Developer agent for code transformation capability, you can read and follow the steps at Upgrade language versions with Amazon Q Developer agent for Code Transformation.
Once complete, you can review the transformed code, complete with build and test results, before accepting the changes.
Reduce technical debt in the codebase
Technical debt accumulates in any codebase over time. Some technical debt may be unavoidable to meet deadlines, but must be tracked and prioritized to pay back later. If left unmanaged, compounding technical debt will make development slower and expensive. Reducing technical debt should be an ongoing team effort, but often falls behind other priorities. Amazon Q Developer streamlines modernizing legacy Java code by identifying and remediating technical debt. Amazon Q Developer reduces the time and resources it takes to analyze the code by providing a list of issues that contribute to technical debt in a codebase. This makes it easy for software development teams to prioritize technical debt items and make informed decisions about which technical debt to address first.
Let’s find the list of technical debt in our Unicorn Store API. In IntelliJ IDE, use Send to Prompt option to send the highlighted code to the Amazon Q chat panel and prompt to provide a list of all technical debt. Amazon Q Developer lists all technical debt in detail.
Once you identify the technical debt, the next step is to gradually remediate them. Amazon Q Developer reduces the time it takes to implement the code to remediate the technical debt. As a developer, you can interact with Amazon Q Developer agent for software development within your IDE to get help with code suggestions for a specific task that you are trying to accomplish. It uses the code in whole project as context and provides an implementation plan that includes code updates it plans to make across all the files in the project. You can review the plan, and once you are satisfied with the plan, you can ask Amazon Q Developer to generate the code based on the proposed plan. This saves developers’ effort compared to manual updates.
For the technical debt identified for Unicorn Store API in the above step, let’s use Amazon Q Developer to address the missing logging technical debt. In IntelliJ IDE, enter /dev in the Amazon Q chat panel with the details on the logging technical debt. Amazon Q Developer generates an implementation plan and code to add logging based on the full project context. To get started with Amazon Q Developer agent for software development, you can refer to the steps at Develop software with the Amazon Q Developer agent for software development.
Modernizing legacy Java code requires continuous refactoring to incrementally enhance quality and avoid accumulating technical debt over time. Amazon Q Developer simplifies this iterative process through its Refactor capability. Amazon Q Developer provides a refactored version of the selected code, alongside explanations of each change and its coding benefit. It helps you to understand the changes by explaining each change and the benefit of making the change in the existing code. You can read further about this capability at Explain and update code with Amazon Q Developer.
Let’s leverage this feature to refine methods in the UnicornController class in our Unicorn Store API project. Amazon Q Developer furnishes the updated code with better code readability or efficiency, among other improvements, for you to review.
Make the application cloud native and deploy to AWS
The final step in the modernization journey is to make the application cloud-native and deploy to AWS. Cloud native is the software approach of building, deploying, and managing modern applications in cloud computing environments. These cloud native technologies support fast and frequent changes to applications without impacting service delivery, providing adopters with an innovative, competitive advantage. Let’s see how Amazon Q Developer can assist in making our Unicorn Store API project cloud native.
In IntelliJ IDE, open the Amazon Q Chat, and prompt Amazon Q Developer to provide a recommended approach to make the project cloud native and deploy to AWS.
Let’s ask Amazon Q Developer to implement the steps outlined in the previous chat conversation. First, ask Amazon Q Developer to create a docker file to containerize the application. The containerization process streamlines application development by decoupling the software from the underlying hardware and other dependencies. This approach enhances speed, efficiency, and security by isolating different components within the containerized environment.
Having successfully developed a container-based application, let’s leverage Amazon Q Developer’s capabilities to generate an AWS CloudFormation template. This template will enable us to deploy the required resources to AWS using Infrastructure as Code (IaC). IaC allows us to programmatically provision and manage our computing infrastructure, eliminating the need for manual processes and configurations. Manual infrastructure management can be time-consuming and error-prone, especially when dealing with large-scale applications.
To facilitate the creation of the CloudFormation template, let’s revisit the suggestions from our previous conversation and compile a list of the resources that need to be provisioned in AWS. Once you have this list, you can ask Amazon Q Developer to generate the CloudFormation template based on these resource requirements.
Amazon Q Developer can generate the CloudFormation template with all the required resources as outlined in the steps to deploy the container in AWS in a secure, reliable, and scalable manner.
Now that we have the CloudFormation template, once CloudFormation is deployed, let’s push the local docker image of our Unicorn Store API to Amazon ECR and start the Fargate tasks required to run the application in AWS.
In this way, you can use Amazon Q Developer to make your application cloud native by designing the steps to deploy to the cloud, helping migrate your application to container-based solution and even writes Infrastructure as code scripts to deploy your application to AWS.
Conclusion
Amazon Q Developer empowers developers to simplify and accelerate the modernization of legacy Java applications. By leveraging Amazon Q Developer, developers can bring outdated applications up to current frameworks and deploy them to AWS in a cloud-native architecture. This streamlines the process, reducing the effort, risk, and maintenance required. Developers save significant time and resources, which can now be used to focus on building new features and enhancing modernized applications rather than managing technical debt.
To learn more about Amazon Q Developer, see the following resources:
Amazon CodeCatalyst is a unified software development and delivery service. It enables software development teams to quickly and easily plan, develop, collaborate on, build, and deliver applications on Amazon Web Services (AWS), reducing friction throughout the development lifecycle.
The GitHub, GitLab.com, and Bitbucket Cloud repositories extension for CodeCatalyst simplifies managing your development workflow. The extension allows you to view and manage external repositories directly within CodeCatalyst. Additionally, you can store and manage workflow definition files alongside your code in external repositories while also creating, reading, updating, and deleting files in linked repositories from CodeCatalyst dev environments. The extension also triggers CodeCatalyst workflow runs automatically upon code pushes and when pull requests are opened, merged, or closed. Furthermore, it allows you to directly utilize source files from linked repositories and execute actions within CodeCatalyst workflows, eliminating the need to switch platforms and maximizing efficiency.
But there’s more: starting today, you can create a CodeCatalyst project in a GitHub, GitLab.com, or Bitbucket Cloud repository from a blueprint, you can add a blueprint to an existing code base in a repository on any of those three systems, and you can also create custom blueprints stored in your external repositories hosted on GitHub, GitLab.com, or Bitbucket Cloud.
CodeCatalyst blueprints help to speed up your developments. These pre-built templates provide a source repository, sample code, continuous integration and delivery (CI/CD) workflows, and integrated issue tracking to get you started quickly. Blueprints automatically update with best practices, keeping your code modern. IT leaders can create custom blueprints to standardize development for your team, specifying technology, access controls, deployment, and testing methods. And now, you can use blueprints even if your code resides in GitHub, GitLab.com, or Bitbucket Cloud.
Link your CodeCatalyst space with a git repository hosting service Getting started using any of these three source code repository providers is easy. As a CodeCatalyst space administrator, I select the space where I want to configure the extensions. Then, I select Settings, and in the Installed extensions section, I select Configure to link my CodeCatalyst space with my GitHub, GitLab.com, or Bitbucket Cloud account.
This is a one-time operation for each CodeCatalyst space, but you might want to connect your space to multiple source providers’ accounts.
When using GitHub, I also have to link my personal CodeCatalyst user to my GitHub user. Under my personal menu on the top right side of the screen, I select My settings. Then, I navigate down to the Personal connections section. I select Create and follow the instructions to authenticate on GitHub and link my two identities.
This is a one-time operation for each user in the CodeCatalyst space. This is only required when you’re using GitHub with blueprints.
Create a project from a blueprint and host it on GitHub, GitLab.com, and Bitbucket Cloud Let’s show you how to create a project in an external repository from a blueprint and later add other blueprints to this project. You can use any of the three git hosting providers supported by CodeCatalyst. In this demo, I chose to use GitHub.
Let’s imagine I want to create a new project to implement an API. I start from a blueprint that implements an API with Python and the AWS Serverless Application Model (AWS SAM). The blueprint also creates a CI workflow and an issue management system. I want my project code to be hosted on GitHub. It allows me to directly use source files from my repository in GitHub and execute actions within CodeCatalyst workflows, eliminating the need to switch platforms.
I start by selecting Create project on my CodeCatalyst space page. I select Start with a blueprint and select the CodeCatalyst blueprint or Space blueprint I want to use. Then, I select Next.
I enter a name for my project. I open the Advanced section, and I select GitHub as Repository provider and my GitHub account. You can configure additional connections to GitHub by selecting Connect a GitHub account.
The rest of the configuration depends on the selected blueprint. In this case, I chose the language version, the AWS account to deploy the project to, the name of the AWS Lambda function, and the name of the AWS CloudFormation stack.
After the project is created, I navigate to my GitHub account, and I can see that a new repository has been created. It contains the code and resources from the blueprint.
I can now add a blueprint to an existing project in an external source code repository. Now that my backend API project has been created, I want to add a web application to my project.
I navigate to the Blueprints section in the left-side menu, and I select the orange Add blueprint button on the top-right part of the screen.
I select the Single-page application blueprint and select Next.
On the next screen, I make sure to select my GitHub connection, as I did when I created the project. I also fill in the required information for this specific template. On the right side of the screen, I review the proposed changes.
When CodeCatalyst finishes installing the new blueprint, I can see a second repository on GitHub.
Single or multiple repository strategies When organizing code, you can choose between a single large repository, like a toolbox overflowing with everything, or splitting it into smaller, specialized ones for better organization. Single repositories simplify dependency management for tightly linked projects but can become messy at scale. Multiple repositories offer cleaner organization and improved security but require planning to manage dependencies between separate projects.
In the example I showed before, the blueprint I selected proposed to apply the second blueprint as a separate repository in GitHub. Depending on the blueprint you selected, the blueprint may propose that you create a separate repository or merge the new code in an existing repository. In the latter case, the blueprint will submit a pull request for you to merge into your repository.
Region and availability This new GitHub integration is available at no additional cost in the two AWS Regions where Amazon CodeCatalyst is available, US West (Oregon) and Europe (Ireland) at the time of publication.
In this blog post you’ll learn how to use a new feature in AWS CodeDeploy to deploy your application one Availability Zone (AZ) at a time to help increase the operational resilience or your services through improved fault isolation.
Introducing change to a system can be a time of risk. Even the most advanced CI/CD systems with comprehensive testing and phased deployments can still promote a bad change into production. A common approach to reduce this risk is using fractional deployments and closely monitoring critical metrics like availability and latency to gauge a deployment’s success. If the deployment shows signs of failure, the CI/CD system initiates an
This blog post will show you how to leverage CodeDeploy zonal deployments as part of a holistic AZ independent (AZI) architecture strategy, both patterns that many AWS service teams follow. With this feature, you no longer need to distinguish between infrastructure or deployment failures in order to respond to the event. You can use the same observability tools and recovery techniques for both, which allows you to contain the scope of impact to a single AZ and mitigate the impact more quickly and with less complexity. First, let’s define what an AZI architecture is so we can understand how this feature in CodeDeploy supports it.
Availability Zone independence
Fault isolation is an architectural pattern that limits the scope of impact of failures by creating independent fault containers that don’t share fate. It also allows you to quickly recover from failures by shifting traffic or resources away from the impaired fault container. AWS provides a number of different fault isolation boundaries, but the ones most people are familiar with are AZs and Regions. When you build multi-AZ architectures, you can design your application to implement AZI that uses the fault boundary provided by AZs to keep the interaction of resources isolated to their respective AZ (to the greatest extent possible).
An Availability Zone independent (AZI) architecture implemented by disabling cross-zone load balancing and using an independent database read replica per AZ. Only database writes have to cross an AZ boundary.
The result is that the impacts from an impairment in one AZ don’t cascade to resources in other AZs, making the operation of your application in one AZ independent from events in the others. You should also monitor the health of each AZ independently, for example by looking at per-AZ load balancer HTTPCode_Target_5XX_Count metrics, or by sending synthetic requests to the load balancer nodes in each AZ and recording availability and latency metrics for each. When an event occurs that impacts your availability or latency in a single AZ, you can use capabilities like Amazon Route 53 Application Recovery Controller zonal shift to shift traffic away from that AZ to quickly mitigate impact, often in single-digit minutes.
Using zonal shift to move traffic away from the AZ experiencing a service impairment
Traditional deployment strategy challenges
During an event, SRE, engineering, or operations teams can spend a lot of time trying to figure out if the source of impact is an infrastructure problem or related to a failed deployment. Then, based on the identified cause, they may take different mitigation actions. Thus, precious time is spent investigating the source of impact and deciding on the appropriate mitigation plan.
When the cause is due to a failed deployment, traditionally rollbacks are used to mitigate the problem. But rollbacks, even when automated, take time to complete. For example, let’s say your deployment batches take 5 minutes to complete, you deploy in 10% batches, and you’re halfway through a deployment to 100 instances when the rollback is initiated. This means it’s going to take at least 25 minutes to finish the rollback (5 batches, each taking 5 minutes to re-deploy to). And it’s entirely possible during that time that instances where the new software was deployed continue to pass health checks, but result in errors being returned to your customers. In the worst case, if all instances had been deployed to, this event could last for almost an hour with customers being impacted during the entire rollback process. In some cases, deployments can’t be rolled back and have to be rolled forward, meaning a new, updated version needs to be deployed to fix the previous deployment. Writing the code for the new deployment and testing it adds to the recovery time of your system and can be error prone.
Additionally, if your unit of deployment includes multiple AZs, then your potential scope of impact from a failed deployment isn’t predictably bounded. For example, if your CodeDeploy deployment groups target Amazon Elastic Compute Cloud (Amazon EC2) instances based on tags or an Amazon EC2 Auto Scaling group that spans multiple AZs, then you could see impact across the whole Region, even if you’re using fractional deployments. There’s not a smaller fault container that helps consistently limit the scope of impact to a predictable size.
Let’s look at how we can overcome these two challenges by using zonal deployments with CodeDeploy.
Zonal deployments with AWS CodeDeploy
One of the best practices we follow at AWS, described in My CI/CD pipeline is my release captain, is performing fractional deployments aligned to intended fault isolation boundaries, like individual hosts, cells, AZs, and Regions. When we release a change, the deployment is separated into waves, which represent fault containers (like Regions) that are deployed to in parallel, and those are further separated into stages. Within a single Region, the deployment starts with a one-box environment, representing a single host, then moves on to fractional batches (like 10% at a time) inside a single AZ, waits for a period of bake time, moves on to the next AZ, and so on until we’ve completed rolling out the change.
Deployment stages aligned to intended fault isolation boundaries within a single deployment wave for one Region
By aligning each stage to an expected fault isolation boundary, we create well-defined fault containers that provide an understood and bounded scope of impact in the case that something goes wrong with a deployment. You can take advantage of this same deployment strategy in your own applications by using zonal deployments in CodeDeploy. To utilize this capability, you need to define a custom deployment configuration shown below.
Creating a zonal deployment configuration that deploys to 10% of the EC2 instances in each AZ at a time, one AZ at a time
This configuration defines a few important properties. First, it enables the zonal configuration, which ensures deployments will be phased one AZ at a time. In this case, updates will be deployed to batches of 10% of the instances in each AZ (see the minimum number of healthy instances per Availability Zone for more details on configuring this setting). Second, it defines a monitor duration, which is the bake time where the effects of the changes are observed before moving on to the next AZ. This ensures sufficient use of the new software to discover any potential bugs or problems before moving on. The value in this example is defined as 900 seconds, or 15 minutes. You should ensure this value is longer than the time it takes for your alarms to trigger. For example, if you are using an M of N alarm for availability and/or latency, that is using 3 data points out of 5 with 1-minute intervals, you need to make sure your bake time is set to greater than 600 seconds, otherwise, you might move on to the next AZ before your alarm has a chance to mark the deployment as unsuccessful. Finally, I’ve also defined a first zone monitor duration. This overrides the “monitor duration” for the first AZ being deployed to. This is useful since the first AZ is acting as our canary or one-box environment and we may want to wait additional time to be really confident the deployment is successful before moving on to the second AZ.
If your service is deployed behind a load balancer with cross-zone load balancing disabled (which is important to achieve AZI), carefully consider your batch size. The load balancer evenly splits traffic across AZs regardless of how many healthy hosts are in each AZ. Ensure your batch size is small enough that the temporary reduction in capacity during each batch doesn’t overwhelm the remaining instances in the same AZ. You can use the CodeDeploy minimum healthy hosts per AZ option to ensure there are enough healthy hosts in the AZ during a deployment batch or Elastic Load Balancing (ELB)target group minimum healthy target count with DNS failover to shift traffic away from the AZ if too few targets are present.
Recovering from a failed zonal deployment.
When a failure occurs, the highest priority is mitigating the impact, not fixing the root cause. While an automated rollback can help achieve both for a failed deployment, using a zonal shift can improve your recovery time. Let’s take a simple dashboard like the following figure. The top graph shows your availability as perceived by customers through using the regional endpoint of your load balancer like https://load-balancer-name-and-id.elb.us-east-1.amazonaws.com. The graphs below it show the measured availability from Amazon CloudWatch Syntheticscanaries that test the load balancer endpoints in each AZ using endpoints like https://us-east-1a.load-balancer-name-and-id.elb.us-east-1.amazonaws.com.
Dashboard showing impact in one AZ that affects the availability of the service
We can see that something starts impacting resources in AZ1 at 10:38 causing an availability drop. As we would expect, this impact is also seen by customers, shown in the top graph, but it’s unclear what the underlying cause of the availability drop is. Using the approach described in this post, it turns out that it doesn’t matter. Within a few minutes, at 10:41 the CloudWatch composite alarm monitoring the health of AZ1 transitions to the ALARM state and invokes a Lambda function that reads the alarm’s definition to get the AZ ID and ALB ARN involved, and initiates the zonal shift. It’s important that the alarm logic only reacts when a single AZ is impacted, if there was impact in more than one AZ, we would need to treat this as a Regional issue.
After a failed deployment to AZ1, an automatically initiated zonal shift quickly mitigates the customer impact
Then, after a few more minutes, at 10:44, we can see availability from the customer perspective has gone back up to 100% by shifting traffic away from AZ1.
The impact of the failed deployment is mitigated by shifting traffic away from AZ1
It turns out the cause of impact in this case was a failed deployment, and we can see that our synthetic canaries still see the failure while the deployment is rolling back, but we’ve achieved our primary goal of quickly removing the impact to the customer experience. From the start of impact to mitigation, 6 minutes elapsed, which was significantly faster than waiting for the deployment to completely rollback. After the rollback is complete, at 10:58, 20 minutes after the start of the event, we can see the alarm transition back to the OK state and availability return to normal in AZ1, meaning we can end the zonal shift and return to normal operation.
After the deployment rollback is complete, the availability in AZ1 recovers and the zonal shift can be ended
Conclusion
Performing zonal deployments helps improve the effectiveness of AZI architectures. Aligning your deployments to your intended fault isolation boundaries, in this case AZs, creates a predictable scope of impact and helps prevents cascading failures. This in turn allows you to use a common set of observability and mitigation tools for both single-AZ infrastructure events and failed deployments, which can mitigate the impact faster than automated rollbacks. Additionally, by removing the ambiguity on selecting a recovery strategy for operators, it further reduces recovery time and complexity. Learn more about zonal deployments in AWS CodeDeploy here.
As a builder, AWS CloudFormation provides a reliable way for you to model, provision, and manage AWS and third-party resources by treating infrastructure as code. First-time and experienced users of CloudFormation can often encounter some challenges when it comes to development of templates and stacks. CloudFormation offers a vast library of over 1,250 resource types covering AWS services, and supports numerous features and functionalities in both the construction of a template, as well as the deployment of a stack using that template. The broad array of options at one’s disposal provides a broad landscape to navigate.
In 2023, AWS introduced a new generative AI-powered assistant, Amazon Q. Amazon Q is the most capable generative AI-powered assistant for accelerating software development and leveraging companies’ internal data. Amazon Q Developer can answer questions about AWS architecture, best practices, documentation, support, and more. When used in an integrated development environment (IDE), Amazon Q Developer additionally provides software development assistance, including code explanation, code generation, and code improvements such as debugging and optimization.
In this blog post, we will show you five ways Amazon Q Developer can help you work with CloudFormation for template code generation, querying CloudFormation resource requirements, explaining existing template code, understanding deployment options and issues, and querying CloudFormation documentation.
Amazon Q can be interacted with in different ways. The first way is native integration within the AWS Console. When logged into the console, you will see a “Q” logo. Click on it to open a chat window, and then you can begin asking questions to Amazon Q without any setup.
The foundational element of any CloudFormation stack begins with a template that describes your infrastructure as code, in either a JSON or YML format. The anatomy of what comprises a stack can be found here. Creating a template requires knowledge of the template format, as well as the proper structure of each CloudFormation resource that you include in the ‘Resources’ section.
With Amazon Q, you can generate a template from natural language without having to look up the particular definition of each resource.
Figure 1: Template code Generation using Amazon Q
In Figure 1 above, I asked Amazon Q if it could provide me with a CloudFormation template with Lambda code in python to list all EBS volumes in a region. It generated sample code that provides the minimum template I would need to create it. It also added the IAM role needed to execute the Lambda code. Finally, it included documentation links that can be reference for further usage.
With a single message to Amazon Q, I am off and running in seconds, ready to deploy my first CloudFormation stack.
Another area where Q can help if you are already familiar with the structure of a resource, is by informing you of resource properties and their significance.
In the next use case, I encountered an issue with my template where certain properties were missing that are required for the resource. With Amazon Q, I can quickly understand the required property, and what it defines for my resource.
Figure 2: Stack Events & Q information on Required Parameters
Since the CloudFormation Events tab indicated that the error was a missing resource property, I asked Amazon Q to help me understand why the property was required, and what it defines. Now, without having to dig through documentation, I can make sure that my template code includes DefaultCacheBehavior and what that will define for my resource.
3. Explaining Existing Template Code
A benefit of Amazon CloudFormation and Infrastructure as Code is that templates allow developers to share and distribute both snippets and entire stacks as pre-defined JSON or YML files. Template reusability can help with the development of new systems, or the augmentation of existing ones – without needing to do any of the template development yourself.
In this example, I have borrowed a template snippet from the AWS documentation for a DynamoDB table. I have copied and pasted this template into my IDE.
In my IDE, I have integrated Amazon Q. As shown in Figure 3, I can highlight a specified section of my template code, and then ask Amazon Q to explain what it is doing for us.
Figure 3: Explaining CloudFormation code by Amazon Q
After asking Amazon Q to ‘Explain selected code’, I am given a detailed description of my highlighted template snippet. Q tells me that this is an Auto Scaling policy for a DynamoDB Table write capacity. It informs me what resource type it is (AWS::ApplicationAutoScaling::ScalingPolicy), and also describes what the function of that resource is, in the context of my DynamoDB Table. Next, it gives me detailed bullet points explaining all of the parameters of the resource definition, and how that impacts my table as well. It then concludes with a summary of the highlighted code that is easily digestible and understandable to the reader, and even offers to provide more information if needed.
In just one simple question to Amazon Q, I have quickly gone from copy and pasting existing code to now understanding its usage and functionality.
4. Understanding Deployment Issues
Sometimes developers may encounter issues when creating, updating or deleting CloudFormation stacks. When you come across errors with your AWS CloudFormation stack, you can ask Amazon Q to help you find the source of the problems.
Figure 4: Reasoning stack failures by Amazon Q
Amazon Q answered why my CloudFormation stack failed to deploy and gave me different ways to check and fix the issues before trying again.
Sometimes developers need to query CloudFormation documentation and functionality to build templates for their use case. Amazon Q can help with these requests straight from IDE. One such example is where developers ask Amazon Q to explain how to make sure my database is not deleted when a CloudFormation stack is deleted. In Figure 5, Amazon Q recommends few ways to make sure the RDS database is not deleted.
Figure 5: Query Amazon Q for CloudFormation documentation
Sometimes developers need deploy the CloudFormation stack across regions and accounts which can be achieved by using StackSets. In the following example, I asked it for help to understand this feature.
Figure 6: Query Amazon Q for CloudFormation StackSets functionality
It is also possible to ask Amazon Q for help with the prompts themselves. In the example below, I ask it to provide some hints on what kinds of questions I could ask about CloudFormation.
Figure 7: CloudFormation functionality prompts
In the example below, I ask one of those questions to dive into stack dependencies.
Figure 8: CloudFormation stack dependencies
Conclusion
Utilizing Amazon Q allows developers and builders to be more efficient. As a builder you can use Amazon Q in your IDE to create CloudFormation templates and improve existing CloudFormation templates. If you have inherited an existing CloudFormation template, you can use Amazon Q to understand it. Reducing template and stack development time is one exciting way that Amazon Q and Generative AI are enabling customers to move faster.
Many customers use Amazon Elastic Container Service (ECS) for running their mission critical container-based applications on AWS. These customers are looking for safe deployment of application and infrastructure changes with minimal downtime, leveraging AWS CodeDeploy and AWS CloudFormation. AWS CloudFormation natively supports performing Blue/Green deployments on ECS using a CodeDeploy Blue/Green hook, but this feature comes with some additional considerations that are outlined here; one of them is the inability to use CloudFormation nested stacks, and another is the inability to update application and infrastructure changes in a single deployment. For these reasons, some customers may not be able to use the CloudFormation-based Blue/Green deployment capability for ECS. Additionally, some customers require more control over their Blue/Green deployment process and would therefore like CodeDeploy-based deployments to be performed outside of CloudFormation.
In this post, we will show you how to address these challenges by leveraging AWS CodeBuild and AWS CodePipeline to automate the configuration of CodeDeploy for performing Blue/Green deployments on ECS. We will also show how you can deploy both infrastructure and application changes through a single CodePipeline for your applications running on ECS.
The solution presented in this post is appropriate if you are using CloudFormation for your application infrastructure deployment. For AWS CDK applications, please refer to this post that walks through how you can enable Blue/Green deployments on ECS using CDK pipelines.
Reference Architecture
The diagram below shows a reference CICD pipeline for orchestrating a Blue/Green deployment for an ECS application. In this reference architecture, we assume that you are deploying both infrastructure and application changes through the same pipeline.
Figure 1: CICD Pipeline for performing Blue/Green deployment to an application running on ECS Fargate Cluster
The pipeline consists of the following stages:
Source: In the source stage, CodePipeline pulls the code from the source repository, such as AWS CodeCommit or GitHub, and stages the changes in S3.
Build: In the build stage, you use CodeBuild to package CloudFormation templates, perform static analysis for the application code as well as the application infrastructure templates, run unit tests, build the application code, and generate and publish the application container image to ECR. These steps can be performed using a series of CodeBuild steps as described in the reference pipeline above.
Deploy Infrastructure: In the deploy stage, you leverage CodePipeline’s CloudFormation deploy action to deploy or update the application infrastructure. In this stage, the entire application infrastructure is set up using CloudFormation nested stacks. This includes the components required to perform Blue/Green deployments on ECS using CodeDeploy, such as the ECS Cluster, ECS Service, Task definition, Application Load Balancer (ALB) listeners, target groups, CodeDeploy application, deployment group, and others.
Deploy Application: In the deploy application stage, you use the CodePipeline ECS-to-CodeDeploy action to deploy your application changes using CodeDeploy’s blue/green deployment capability. By leveraging CodeDeploy, you can automate the blue/green deployment workflow for your applications running on ECS, including testing of your application after deployment and automated rollbacks in case of failed deployments. CodeDeploy also offers different ways to switch traffic for your application during a blue/green deployment by supporting Linear, Canary, and All-at-once traffic shifting options. More information on CodeDeploy’s Blue/Green deployment workflow for ECS can be found here
Considerations
Some considerations that you may need to account for when implementing the above reference pipeline
1. Creating the CodeDeploy deployment group using CloudFormation For performing Blue/Green deployments using CodeDeploy on ECS, CloudFormation currently does not support creating the CodeDeploy components directly as these components are created and managed by CloudFormation through the AWS::CodeDeploy::BlueGreen hook. To work around this, you can leverage a CloudFormation custom resource implemented through an AWS Lambda function, to create the CodeDeploy Deployment group with the required configuration. A reference implementation of a CloudFormation custom resource lambda can be found in our solution’s reference implementation here.
2. Generating the required code deploy artifacts (appspec.yml and taskdef.json) For leveraging the CodeDeployToECS action in CodePipeline, there are two input files (appspec.yml and taskdef.json) that are needed. These files/artifacts are used by CodePipeline to create a CodeDeploy deployment that performs Blue/Green deployment on your ECS cluster. The AppSpec file specifies an Amazon ECS task definition for the deployment, a container name and port mapping used to route traffic, and the Lambda functions that run after deployment lifecycle hooks. The container name must be a container in your Amazon ECS task definition. For more information on these, see Working with application revisions for CodeDeploy. The taskdef.json is used by CodePipeline to dynamically generate a new revision of the task definition with the updated application container image in ECR. This is an optional capability supported by the CodeDeployToECS action where it can automatically replace a place holder value (for example IMAGE1_NAME) for ImageUri in the taskdef.json with the Uri of the updated container Image. In the reference solution we do not use this capability as our taskdef.json contains the latest ImageUri that we plan to deploy. To create this taskdef.json, you can leverage CodeBuild to dynamically build the taskdef.json from the latest task definition ARN. Below are sample CodeBuild buildspec commands that creates the taskdef.json from ECS task definition
To generate the appspec.yml, you can leverage a python or shell script and a placeholder appspec.yml in your source repository to dynamically generate the updated appspec.yml file. For example, the below code snippet updates the placeholder values in an appspec.yml to generate an updated appspec.yml that is used in the deploy stage. In this example, we set the values of AfterAllowTestTraffic hook, the Container name, Container port values from task definition and Hooks Lambda ARN that is passed as input to the script.
In the above scenario, the existing task definition is used to build the appspec.yml. You can also specify one of more CodeDeploy lambda based hooks in the appspec.yml to perform variety of automated tests as part of your deployment.
3. Updates to the ECS task definition To perform Blue/Green deployments on your ECS cluster using CodeDeploy, the deployment controller on the ECS Service needs to be set to CodeDeploy. With this configuration, any time there is an update to the task definition on the ECS service (such as when building new application image), the update results in a failure. This essentially causes CloudFormation updates to the application infrastructure to fail when new application changes are deployed. To avoid this, you can implement a CloudFormation based custom resource that obtains the previous version of task definition. This prevents CloudFormation from updating the ECS Service with new task definition when the application container image is updated and ultimately from failing the stack update. Updates to ECS Services for new task revisions are performed using the CodeDeploy deployment as outlined in #2 above. Using this mechanism, you can update the application infrastructure along with changes to the application code using a single pipeline while also leveraging CodeDeploy Blue/Green deployment.
4. Passing configuration between different stages of the pipeline To create an automated pipeline that builds your infrastructure and performs a blue/green deployment for your application, you will need the ability to pass configuration between different stages of your pipeline. For example, when you want to create the taskdef.json and appspec.yml as mentioned in step #2, you need the ARN of the existing task definition and ARN of the CodeDeploy hook Lambda. These components are created in different stages within your pipeline. To facilitate this, you can leverage CodePipeline’s variables and namespaces. For example, in the CodePipeline stage below, we set the value of TASKDEF_ARN and HOOKS_LAMBDA_ARN environment variables by fetching those values from a different stage in the same pipeline where we create those components. An alternate option is to use AWS System Manager Parameter Store to store and retrieve that information. Additional information about CodePipeline’s variables and how to use them can be found in our documentation here.
As part of this post we have provided a reference solution that performs a Blue/Green deployment for a sample Java based application running on ECS Fargate using CodePipeline and CodeDeploy. The reference implementation provides CloudFormation templates to create the necessary CodeDeploy components, including custom resources for Blue/Green deployment on Amazon ECS, as well as the application infrastructure using nested stacks. The solution also provides a reference CodePipeline implementation that fully orchestrates the application build, test and blue/green deployment. In the solution we also demonstrate how you can orchestrate Blue/Green deployment using Linear, Canary, and All-at-once traffic shifting patterns. You can download the reference implementation from here. You can further customize this solution by building your own CodeDeploy lifecycle hooks and run additional configuration and validation tasks as per you application needs. We also recommend that you look at our Deployment Pipeline Reference Architecture (DPRA) and enhance your delivery pipelines by including additional stages and actions that meet your needs.
Conclusion:
In this post we walked through how you can automate Blue/Green deployment of your ECS based application leveraging AWS CodePipeline, AWS CodeDeploy and AWS CloudFormation nested stacks. We reviewed what you need to consider for automating Blue/Green deployment for your application running on your ECS cluster using CodePipeline and CodeDeploy and how you can address those challenges with some scripting and CloudFormation Lambda based custom resource. We hope that this helps you in configuring Blue/Green deployments on your ECS based application using CodePipeline and CodeDeploy.
The CloudFormation Linter, cfn-lint, is a powerful tool designed to enhance the development process of AWS CloudFormation templates. It serves as a static analysis tool that checks CloudFormation templates for potential errors and best practices, ensuring that your infrastructure as code adheres to AWS best practices and standards. With its comprehensive rule set and customizable configuration options, cfn-lint provides developers with valuable insights into their CloudFormation templates, helping to streamline the deployment process, improve code quality, and optimize AWS resource utilization.
What’s Changing?
With cfn-lint v1, we are introducing a set of major enhancements that involve breaking changes. This upgrade is particularly significant as it converts from using the CloudFormation spec to using CloudFormation registry resource provider schemas. This change is aimed at improving the overall performance, stability, and compatibility of cfn-lint, ensuring a more seamless and efficient experience for our users.
Key Features of cfn-lint v1
CloudFormation Registry Resource Provider Schemas: The migration to registry schemas brings a more robust and standardized approach to validating CloudFormation templates, offering improved accuracy in linting. We use additional data sources like the AWS pricing API and botocore (the foundation to the AWS CLI and AWS SDK for Python (Boto3)) to improve the schemas and increase the accuracy of our validation. We extend the schemas with additional keywords and logic to extend validation from the schemas.
Rule Simplification: for this upgrade, we rewrote over 100 rules. Where possible, we rewrote rules to leverage JSON schema validation, which allows us to use common logic across rules. The result is that we now return more common error messages across our rules.
Region Support: cfn-lint supports validation of resource types across regions. v1 expands this validation to check resource properties across all unique schemas for the resource type.
Transition Guidelines
To facilitate a seamless transition, we advise following these steps:
Review Templates
While we aim to preserve backward compatibility, we recommend reviewing your CloudFormation templates to ensure they align with the latest version. This step helps preempt any potential issues in your pipeline or deployment processes. If necessary, you can enforce pinning to cfn-lint v0 by running pip install --upgrade "cfn-lint<1"
Handling cfn-lint configurations
Throughout the process of rewriting rules, we’ve restructured some of the logic. Consequently, if you’ve been ignoring a specific rule, it’s possible that the logic associated with it has shifted to a new rule. As you transition to v1, you may need to adjust your template ignore rules configuration accordingly. Here is a subset of some of the changes with a focus on some of the more significant changes.
In v0, rule E3002 validated valid resource property names but it also validated object and array type checks. In v1 all type checks are now in E3012.
In v0, rule E3017 validated that when a property had a certain value other properties may be required. This validation has been rewritten into individual rules. This should allow more flexibility in ignoring and configuring rules.
In v0, rule E2522 validated when at least one of a list of properties is required. That logic has been moved to rule E3015.
In v0, rule E2523 validated when only one property from a list is required. That logic has been moved to rule E3014.
Adapting extensions to cfn-lint
If you’ve extended cfn-lint with custom rules or utilized it as a library, be aware that there have been some API changes. It’s advisable to thoroughly test your rules and packages to ensure consistency as you upgrade to v1.
Upgrade to cfn-lint v1
Upon the release of the new version, we highly recommend upgrading to cfn-lint v1 to capitalize on its enriched features and improvements. You can upgrade using pip by running pip install --upgrade cfn-lint.
Stay Updated
Keep yourself informed by monitoring our communication channels for announcements, release notes, and any additional information pertinent to cfn-lint v1. You can follow us on Discord. cfn-lint is an open source solution so you can submit issues on GitHub or follow our v1 discussion on GitHub.
Dependencies
cfn-lint v1 uses Python optional dependencies to reduce the amount of dependencies we install for standard usage. If you want to leverage features like graph, or output formats junit and sarif, you will have to change your install commands.
pip install cfn-lint[graph] – will include pydot to create graphs of resource dependencies using --build-graph
pip install cfn-lint[junit] – will include the packages to output JUnit using --output junit
pip install cfn-lint[sarif] – will include the packages to output SARIF using --output sarif
cfn-lint v0 support
We will continue to update and support cfn-lint v0 until early 2025. This includes regular releases to new CloudFormation spec files. We will only add new features into v1.
Thank You for Your Continued Support
We appreciate your continued trust and support as we work to enhance cfn-lint. Our team is committed to providing you with the best possible experience, and we believe that cfn-lint v1 will elevate your CloudFormation template development process.
If you have any questions or concerns, please don’t hesitate to reach out on our GitHub page.
AWS CodeBuild now supports managed self-hosted GitHub Action runners, allowing you to build powerful CI/CD capabilities right beside your code and quickly implement a build, test and deploy pipeline. Last year AWS announced that customers can define their GitHub Actions steps within any phase of a CodeBuild buildspec file but with a self-hosted runner, jobs execute from GitHub Actions on GitHub.com to a system you deploy and manage.
For customers managing their self-hosted runners on their own infrastructure, CodeBuild can now provide a secure, scalable and lower latency solution. In addition, CodeBuild managed self-hosted GitHub Action runners bring features, such as:
Available compute platforms including AWS Lambda, Windows, Linux, Linux GPU-enhanced and AWS Graviton Processors (Arm-based instances).
With the compute options available, customers can now run tests on hardware and operating system combinations that closely match production and reduce manual operational tasks by shifting the management of the runners to AWS.
In this blog, I will explore how AWS managed GitHub Action self-hosted runners work by building and deploying an application to AWS using GitHub Actions.
Architecture overview
The architecture of what I’ll be building can be seen below:
The architecture above shows how a developer pushes code changes to GitHub. This triggers CodeBuild to detect the update. CodeBuild then runs the defined GitHub Action Workflow, which builds and deploys it to AWS Lambda.
Step 1. Build a AWS Lambda Function
I’ll start with a simple application to demonstrate how to build and deploy an application on AWS via a Managed Self-Hosted GitHub Actions runner. We’ve written before about why AWS is the best place to run Rust, Amazon CTO Werner Vogels has been an outspoken advocate for exploring energy-efficient programming languages like Rust and AWS have great guides on using Rust to build on AWS such as:
From the above cloned repository, install Cargo Lambda:For macOS & Linux:
brew tap cargo-lambda/cargo-lambda
brew install cargo-lambda
Windows users can follow the guide to see all the ways that you can install Cargo Lambda in your system.
Use Cargo lambda to create a new project
cargo lambda new new-lambda-project && cd new-lambda-project
It’s now possible to explore the project, in this case I am using JetBrains RustRover with Amazon Q Developer installed to increase my productivity while working on the application:
Figure 3. JetBrains RustRover with Amazon Q Developer
I will create a new CodeBuild project as per the documentation to connect CodeBuild to our GitHub repository and correctly configure a webhook to trigger the GitHub Actions.
For Repository, choose Repository in my GitHub account.
For Repository URL, enter https://github.com/user-name/repository-name.
In Primary source webhook events:
For Webhook – optional, select Rebuild every time a code change is pushed to this repository.
For Event type, select WORKFLOW_JOB_QUEUED. Once this is enabled, builds will only be triggered by GitHub Actions workflow jobs events.
Figure 4. WORKFLOW_JOB_QUEUED Event Type
In Environment:
Choose a supported Environment image and Compute. Note that you have the option to override the image and instance settings by using a label in your GitHub Actions workflow YAML.
In Buildspec:
Note that your Buildspec will be ignored. Instead, CodeBuild will override it to use commands that will setup the self-hosted runner. This project’s primary responsibility is to set up a self-hosted runner in CodeBuild to run GitHub Actions workflow jobs.
Continue with the remaining default options and select Create build project.
CodeBuild Service Role Permissions
In order for the CodeBuild service role to be able to successfully create and deploy a Lambda function, the service role will require the necessary permissions. The Service role can be seen when editing the CodeBuild project:
Note that I do not need to manage IAM permissions outside of our AWS Account, for example GitHub does not need to know about our AWS permissions.
Step 3. Create a GitHub Action Workflow
GitHub Actions is a continuous integration and continuous deliver (CI/CD) platform that provides automation through building, testing and deploying applications. In this section we will create a GitHub Action Workflow to build and deploy our Lambda.
Navigate back to our GitHub project create a workflow within the .github/workflows directory, the Simple Workflow is a good starting point:
Figure 6. Create a Simple Workflow
Update the Job to include the tooling required to build our Rust Lambda function, the details can be found in the GitHub Actions section. Our workflow file should now look like this:
The above GitHub Actions Workflow currently runs on GitHub; However, I now want to make two further changes:
Define an AWS CodeBuild runner
Define Build and Deploy Lambda steps
Define an AWS CodeBuild runner
A GitHub Actions workflow is made up of one or more jobs, each job runs in a runner environment specified by runs-on. The value for runs-on to specify CodeBuild as a runner takes the format:
I will update the <CodeBuildProjectName> to the CodeBuild project name that was entered in Step2, e.g. “GitHubActionsDemo”.
When configuring CodeBuild as a runner environment, BuildSpecs are ignored. In order to define the specification of our build environments it is possible to pass in variables including:
When I commit changes to the workflow to the main branch it will trigger the GitHub Action.
Step 4. Testing our GitHub Action Workflow.
The GitHub Action is currently triggered on all push and pull requests to main branch:
Figure 7. Trigger a build
Note that GitHub is where the CI/CD process is being driven, the build logs are available in GitHub as the job is running:
Figure 8. GitHub Action Logs
As the build progresses through the deployment step, the details of the Lambda function deployed are shown:
Figure 9. Deployment ARN
Navigating back to the AWS Console, the deployed Lambda Function can be seen:
Figure 10. Lambda Deployed
And finally, opening the CodeBuild console, it’s possible to observe the status of the Managed GitHub Actions Runner, the build number and also the duration:
Figure 11. Lambda Deployed via Managed Self-Hosted GitHub Action runner
Clean Up
To avoid incurring future charges:
Delete the Lambda created via the deployment in Step 4.
Delete the CodeBuild Project created in Step 2.
Conclusion
As I’ve shown in this blog, setting up GitHub Actions Workflows that run on AWS is now even easier to allow CodeBuild projects to receive GitHub Actions workflow job events and run them on CodeBuild ephemeral hosts. AWS customers can take advantage of natively integrating with AWS and providing security and convenience through features such as defining service role permissions with AWS IAM or passing credentials as environment variables to build jobs with AWS Secrets Manager.
Being able to use CodeBuild’s reserved capacity allows you to provision a fleet of CodeBuild hosts that persist your build environment. These hosts remain available to receive subsequent build requests, which reduces build start-up latencies but also make it possible to compile your software within your VPC and access resources such as Amazon Relational Database Service, Amazon ElastiCache, or any service endpoints that are only reachable from within a specific VPC.
CodeBuild-hosted GitHub Actions runners are supported in all CodeBuild regions and customers managing their CI/CD processes via GitHub Actions can use the compute platforms CodeBuild offers, including Lambda, Windows, Linux, Linux GPU-enhanced and Arm-based instances powered by AWS Graviton Processors.
Amazon CodeCatalyst is a modern software development service that empowers teams to deliver software on AWS easily and quickly. Amazon CodeCatalyst provides one place where you can plan, code, and build, test, and deploy your container applications with continuous integration/continuous delivery (CI/CD) tools.
CodeCatalyst recently announced the teams feature, which simplifies management of space and project access. Enterprises can now use this feature to organize CodeCatalyst space members into teams using single sign-on (SSO) with IAM Identity Center. You can also assign SSO groups to a team, to centralize your CodeCatalyst user management. CodeCatalyst space admins can create teams made up any members of the space and assign them to unique roles per project, such as read-only or contributor.
Introduction:
In this post, we will demonstrate how enterprises can enable access to CodeCatalyst with their workforce identities configured in AWS IAM Identity Center, and also easily manage which team members have access to CodeCatalyst spaces and projects. With AWS IAM Identity Center, you can connect a self-managed directory in Active Directory (AD) or a directory in AWS Managed Microsoft AD by using AWS Directory Service. You can also connect other external identity providers (IdPs) like Okta or OneLogin to authenticate identities from the IdPs through the Security Assertion Markup Language (SAML) 2.0 standard. This enables your users to sign in to the AWS access portal with their corporate credentials.
Pre-requisites:
To get started with CodeCatalyst, you need the following prerequisites. Please review them and ensure you have completed all steps before proceeding:
1. Set up an CodeCatalyst space. To join a space, you will need to either:
Create an Amazon CodeCatalyst space that supports identity federation. If you are creating the space, you will need to specify an AWS account ID for billing and provisioning of resources. If you have not created an AWS account, follow the AWS documentation to create one
2. Create an AWS Identity and Access Management (IAM) role. Amazon CodeCatalyst will need an IAM role to have permissions to deploy the infrastructure to your AWS account. Follow the documentation for steps how to create an IAM role via the Amazon CodeCatalyst console.
3. Once the above steps are completed, you can go ahead and create projects in the space using the available blueprints or custom blueprints.
Walkthrough:
The emphasis of this post, will be on how to manage IAM identity center (SSO) groups with CodeCatalyst teams. At the end of the post, our workflow will look like the one below:
Figure 2: Architectural Diagram
For the purpose of this walkthrough, I have used an external identity provider Okta to federate with AWS IAM Identity Center to manage access to CodeCatalyst.
Figure 3: Okta Groups from Admin Console
You can also see the same Groups are synced with the IAM Identity Center instance from the figure below. Please note Groups and member management must be done only via external identity providers.
Figure 4: IAM Identity Center Groups created via SCIM synch
Now, if you go to your Okta apps and click on ‘AWS IAM Identity Center’, the AWS account ID and CodeCatalyst space that you created as part of prerequisites should be automatically configured for you via single sign-on. Developers and Administrators of the space can easily login using this integration.
Figure 5: CodeCatalyst Space via SSO
Once you are in the CodeCatalyst space, you can organize CodeCatalyst space members into teams, and configure the default roles for them. You can choose one of the three roles from the list of space roles available in CodeCatalyst that you want to assign to the team. The role will be inherited by all members of the team:
Space administrator – The Space administrator role is the most powerful role in Amazon CodeCatalyst. Only assign the Space administrator role to users who need to administer every aspect of a space, because this role has all permissions in CodeCatalyst. For details, see Space administrator role.
Power user – The Power user role is the second-most powerful role in Amazon CodeCatalyst spaces, but it has no access to projects in a space. It is designed for users who need to be able to create projects in a space and help manage the users and resources for the space. For details, see Power user role.
Limited access – It is the role automatically assigned to users when they accept an invitation to a project in a space. It provides the limited permissions they need to work within the space that contains that project. For details, see Limited access role.
In this example here, if I go into the ‘space-admin’ team, I can view the SSO group associated with it through IAM Identity Center.
Figure 7: SSO Group association with Teams
You can now use these teams from the CodeCatalyst space to help manage users and permissions for the projects in that space. There are four project roles available in CodeCatalyst:
Project administrator — The Project administrator role is the most powerful role in an Amazon CodeCatalyst project. Only assign this role to users who need to administer every aspect of a project, including editing project settings, managing project permissions, and deleting projects. For details, see Project administrator role.
Contributor — The Contributor role is intended for the majority of members in an Amazon CodeCatalyst project. Assign this role to users who need to be able to work with code, workflows, issues, and actions in a project. For details, see Contributor role.
Reviewer — The Reviewer role is intended for users who need to be able to interact with resources in a project, such as pull requests and issues, but not create and merge code, create workflows, or start or stop workflow runs in an Amazon CodeCatalyst project. For details, see Reviewer role.
Read only — The Read only role is intended for users who need to view the resources and status of resources but not interact with them or contribute directly to the project. Users with this role cannot create resources in CodeCatalyst, but they can view them and copy them, such as cloning repositories and downloading attachments to issues to a local computer. For details, see Read only role.
For the purpose of this demonstration, I have created projects from the default blueprints (I chose the modern three-tier web application blueprint) and assigned Teams to it with specific roles. You can also create a project using a default blueprint in CodeCatalyst space if you don’t already have an existing project.
Figure 8: Teams in Project Settings
You can also view the roles assigned to each of the teams in the CodeCatalyst Space settings.
Figure 9: Project roles in Space settings
Clean up your Environment:
If you have been following along with this workflow, you should delete the resources you deployed so you do not continue to incur charges. First, delete the two stacks that CDK deployed using the AWS CloudFormation console in the AWS account you associated when you launched the blueprint. If you had launched the Modern three-tier web application just like I did, these stacks will have names like mysfitsXXXXXWebStack and mysfitsXXXXXAppStack. Second, delete the project from CodeCatalyst by navigating to Project settings and choosing Delete project.
Conclusion:
In this post, you learned how to add Teams to a CodeCatalyst space and projects using SSO Groups. I used Okta for my external identity provider to connect with IAM Identity Center, but you can use your Organizations idP or any other IDP that supports SAML. You also learned how easy it is to maintain SSO group members in the CodeCatalyst space by assigning the necessary roles and restricting access when not necessary.
About the Authors:
The collective thoughts of the interwebz
Manage Consent
To provide the best experiences, we use technologies like cookies to store and/or access device information. Consenting to these technologies will allow us to process data such as browsing behavior or unique IDs on this site. Not consenting or withdrawing consent, may adversely affect certain features and functions.
Functional
Always active
The technical storage or access is strictly necessary for the legitimate purpose of enabling the use of a specific service explicitly requested by the subscriber or user, or for the sole purpose of carrying out the transmission of a communication over an electronic communications network.
Preferences
The technical storage or access is necessary for the legitimate purpose of storing preferences that are not requested by the subscriber or user.
Statistics
The technical storage or access that is used exclusively for statistical purposes.The technical storage or access that is used exclusively for anonymous statistical purposes. Without a subpoena, voluntary compliance on the part of your Internet Service Provider, or additional records from a third party, information stored or retrieved for this purpose alone cannot usually be used to identify you.
Marketing
The technical storage or access is required to create user profiles to send advertising, or to track the user on a website or across several websites for similar marketing purposes.


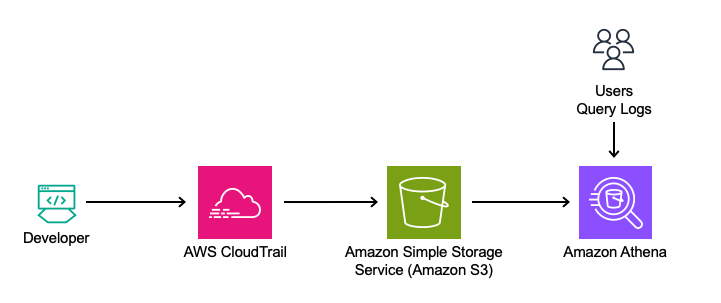
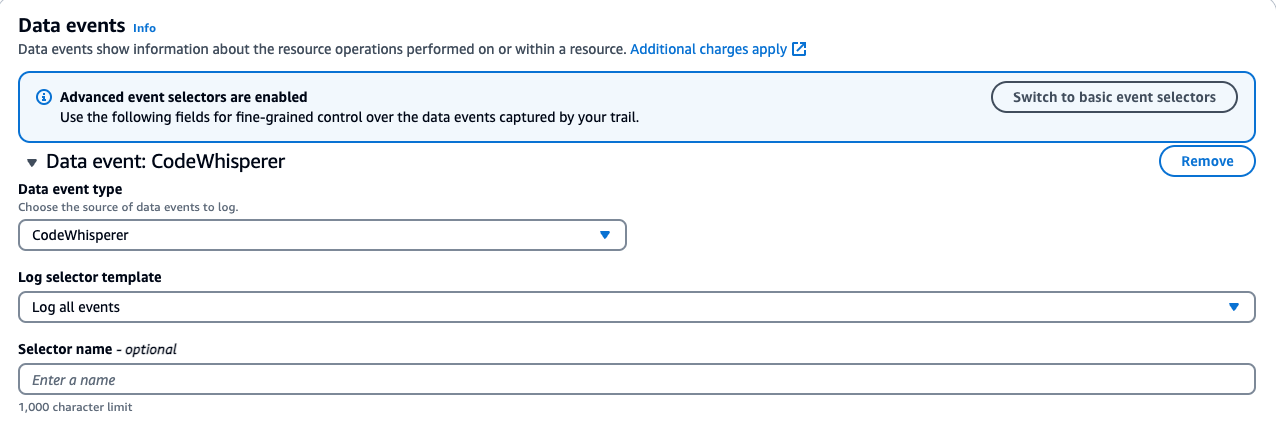


 Alexander Schueren is a Senior Specialist Solutions Architect at AWS, dedicated to modernizing legacy applications and building event-driven serverless solutions. With a focus on simplifying complexity and bringing clarity to technical challenges, Alexander is on a mission to empower developers with the tools they need for success. As the maintainer of the open-source project “Powertools for AWS Lambda (TypeScript),” he is committed to driving innovation in serverless technologies. In his free time, Alexander channels his creativity through street photography, capturing decisive moments in the urban landscape.