At AWS, security is the top priority, and today we’re excited to share work we’ve been doing towards our goal to make AWS the safest place to run any workload. In earlier posts on this blog, we shared details of our internal active defense systems, like MadPot (global honeypots), Mithra (domain graph neural network), and Sonaris (network mitigations). We’re still inventing new ways to improve the effectiveness of threat intelligence and automated response to detect and help prevent attacks. Today we’ll share advancements in active defense related to malware, software vulnerabilities, and AWS resource misconfigurations. Like the other posts we linked to, these are constantly improving capabilities that our customers get just for being on the AWS network. We’ll discuss these topics in more depth at re:inforce 2025 during Innovation Talk SEC302.
Stopping malware from spreading
Financially motivated threat actors try to gain access to a wide array of networked assets. The more resources they control, the more places they can hide, and the longer they can profit from their abusive operations. As such, threat actor malware often contains modules to scan for new targets, replicate binaries over the network, and then repeat. If left unchecked, such rapidly spreading behavior can lead to network congestion, service availability loss, and data destruction. We want to help prevent this behavior to the greatest degree possible.
One effective strategy we employ is identifying the threat actor’s key infrastructure where malware is centrally controlled. We use a variety of techniques to identify, verify, track, and disrupt threat infrastructure. Using network traffic logs, honeypot interactions, and malware samples from an array of sensor positions, we mitigate botnets, abusive proxies, and peer-to-peer malware. Over the past 12 months, AWS helped prevent over 4 million malware infection attempts across 315 thousand distinct Amazon Elastic Compute Cloud (Amazon EC2) instances. By protecting workloads from these malware infections, we not only protect our network and our customers, but also the broader internet from further malware expansion.
Advancements in threat hunting and mitigating software vulnerabilities
At Amazon, we’re proud to support software vulnerability research with programs for bug bounty, vulnerability disclosure, and open source contribution. We’ve also become a more active participant in the CVE process by becoming a CVE Numbering Authority (CNA) for the software and services provided by Amazon. Thanks to the public CVE database, we see vulnerability research accelerating as reported CVEs have grown by 21 percent year-over-year since 2013, with over 40 thousand CVEs published in 2024. This virtuous cycle of finding and resolving vulnerabilities improves cyber security over time, but AWS sees threat actors searching for unresolved vulnerabilities to gain unauthorized access to resources.
We’ve expanded MadPot and Sonaris to identify and stop a broader range of malicious vulnerability scanning and exploitation activity, protecting every AWS customer from vulnerability exposure. We’ve added hundreds of new detections and MadPot service emulations to identify real attacks. As we’ve expanded our visibility, we’ve continued blocking hundreds of millions of CVE exploit attempts daily across the AWS network.
As we’ve made these active defense systems better at stopping CVE exploit attacks, the total number of attacks has gone down by over 55 percent in the last 12 months, as shown in Figure 1. There are many factors outside our control in this observation, but we’re happy to see fewer CVE exploit attacks. This trend coincides with the detection, regionalization, latency, and guardrail improvements we’ve made in 2025. No system can block everything, so fewer exploit attempts mean less risk across a wide range of workloads.
Figure 1: Chart showing the decrease in global malicious vulnerability exploit attempts
This work to identify known exploits in the wild directly benefits users of vulnerability intelligence in Amazon Inspector, which provides an Amazon Inspector score for customers to prioritize where to spend security hardening resources. This includes the most recent date of observed exploitation attempts, the MITRE ATT&CK techniques associated with the exploit activity, and the industries targeted.
Protecting architectures built on AWS
AWS actively defends compute and network resources for our customers; we also defend the distinct AWS-native resources that customers rely on. AWS access key credentials are a critical resource that allow access to customer accounts. The AWS Identity and Access Management best practices share proven techniques for customers to keep their credentials from being abused. Through active defense, we do even more to help customers who haven’t yet adopted these best practices.
Each day, AWS helps prevent an average of 167 million malicious scanning connections seeking unintentionally exposed AWS access key pairs. In case access keys are discovered through other means, we’ve expanded our protection of customer-managed IAM credentials. When our threat intelligence analytics show that a customer-managed credential is known by a threat actor, we put mitigations in place to restrict access to highly privileged operations. We also send customized notifications to help customers identify how the credential was exposed. These efforts are paying off for our customers every day; the following response is a good example of what we hear regularly:
This is a key that we already rotated a few weeks ago based on another alarm from you. It turned out that the new rotated key happened to be in your second alarm to us. So it meant that the app that the key was linked to was still leaking it.
So on Monday we sat down with the dev team, found where the app was leaking some secrets from, we patched it, I rotated all the exposed secrets (it was more than the IAM key) and we plugged in the extra security in the app.
So thanks again for those alerts, they are very precious. – AWS Customer
In a specific case of threat activity in November and December of 2024, customers reported ransomware activity against their objects in Amazon Simple Storage Service (Amazon S3) storage. We saw that these ransom threats were highly correlated with exposed customer-managed IAM keys. We applied quarantines to the exposed keys, taking care to make sure that normal customer operations could continue safely. We re-sent our proactive notifications to customers about keys that were likely exposed, because the risk of an attack was elevated. During this period, we worked together with customers to deactivate over 30 thousand exposed credentials. Since this threat activity began, AWS has helped prevent over 943 million malicious attempts to encrypt customer Amazon S3 objects.
These credential exposure detections flow into Amazon GuardDuty Extended Threat Detection, simplifying threat detection and response operations for modern cloud environments.
Better together
The approach AWS takes to active defense shows how security can be improved by layering protections across the infrastructure stack and using threat intelligence to drive risk reduction. By building active defense into our services at no extra cost, AWS helps our customers stay protected from a wide range of threats.
While we continue to constantly improve our protections for our customers, some of our work is by nature probabilistic, because we never see inside customer workloads. We don’t apply active defense in situations where the detection is ambiguous, because that might impact our customers’ production systems. To stay secure, customers should never let down their own defenses. AWS security services like AWS Identity and Access Management (IAM), AWS Shield Advanced, AWS WAF, AWS Network Firewall, Amazon GuardDuty, and Amazon Inspector provide prevention, detection, and response that customers can configure for their unique needs. The good news is that by working together, we’re making the internet safer for everyone.
If you have feedback about this post, submit comments in the Comments section below.
Today, Amazon Web Service (AWS) introduces the Security Champion Knowledge Path on AWS Skill Builder, featuring training and a digital badge. The Security Champion Knowledge path is a comprehensive educational framework designed to empower developers and software engineers with essential AWS cloud security knowledge and best practices. The structured learning path enables development teams to accelerate their delivery while maintaining robust security standards in cloud environments, addressing customers’ need for a structured curriculum to develop and validate security expertise across their organizations.
A new era of security education
The AWS Security Champion Knowledge Path complements the existing AWS security training offerings, providing a structured, self-paced journey to security expertise. Hart Rossman, Vice President of Global Services Security at AWS, emphasizes the program’s significance: “Security in the cloud isn’t a destination; it’s an ongoing journey. The AWS Security Champion Knowledge Path equips our customers with the tools and knowledge to navigate this journey confidently, fostering a culture where security is woven into every aspect of cloud operations.”
Designed for a diverse audience including software developers, solutions architects, technical leaders, and cloud practitioners, the training plan covers a wide range of topics that are critical for a strong security posture in the cloud. This AWS security learning journey begins with essential fundamentals and progressively builds toward advanced concepts across a well-structured curriculum. Starting with AWS Security Fundamentals and the AWS Shared Responsibility Model, learners establish core principles before diving into AWS Identity and Access Management (IAM), including detailed troubleshooting scenarios. The curriculum advances to critical security elements such as encryption and comprehensive threat modeling through the AWS Builders Workshop. Security governance and auditing form the next tier, followed by practical implementations of monitoring, alerting, and network infrastructure best practices. The learning path then covers specialized areas including web-facing workload protection, network control, and incident response procedures. The knowledge path culminates with deep dives into container security and core security concepts through AWS SimuLearn, providing hands-on experience with real-world scenarios. This carefully orchestrated progression helps facilitate a thorough understanding of AWS security principles while maintaining a practical, implementation-focused approach.
What is a Security Champion?
A Security Champion is a bridge between security teams and development teams, promoting security best practices and making sure that security is embedded into every stage of the development lifecycle. However, Security Champion isn’t just a role—it’s a mindset. In today’s distributed and agile cloud environments, having Security Champions across different teams provides a competitive advantage for releasing products quickly and securely.
This distributed ownership of security brings numerous benefits: faster development cycles because teams can address security requirements proactively, reduced security incidents through early detection, and improved collaboration between security and development teams. Most importantly, it creates a culture of security where every team member understands their role in protecting the organization’s assets and data.
By becoming a Security Champion, you’ll gain valuable expertise, earn recognized credentials, and develop leadership skills that can accelerate your career growth. Most importantly, you’ll be empowered to make meaningful contributions to your organization’s security posture by promoting best practices, identifying potential vulnerabilities early in the development cycle, and fostering collaboration between teams—ultimately helping your organization deliver products that are both innovative and secure.
How can I become an AWS Security Champion?
Security enthusiasts can enroll into the AWS Security Champion Knowledge Badge Readiness Path on AWS Skill Builder and complete the assessment successfully to earn the AWS Security Champion digital badge available on Credly.
AWS Security Champion training is a self-paced, hands-on, and interactive approach to upskilling on security concepts. As a participant, you’re introduced to security best practices, performing basic audits, planning for governance at scale, incident response concepts and more. You can engage with real-world scenarios through hands-on labs, interactive game-based learning, gain access to AWS sandbox environments, and conduct practical security assessments. This applied learning helps make sure that knowledge isn’t just acquired, but truly internalized and ready for immediate application.
“The AWS Security Champion Knowledge Path represents a significant milestone in democratizing security expertise. We’ve designed this program to transform how organizations approach security training, making it accessible, practical, and immediately applicable. This isn’t just about learning security concepts—it’s about creating a culture where security becomes second nature to every team member.” – Jenni Troutman, Training and Certification Director at AWS
Recognition and community
Upon successfully completing the assessment in this training path, participants earn the prestigious AWS Security Champion knowledge badge in Credly to showcase their accomplishment, such as on LinkedIn, and join a growing community of security professionals. This recognition not only validates individual expertise but also signals an organization’s commitment to security excellence, and helps organizations identify qualified security champions within their team.
Getting started
To begin your journey to becoming an AWS Security Champion, log in or create an account with AWS Skill Builder and enroll in the Security Champion Knowledge Badge Readiness Path. The training plan is available through flexible pricing options, including individual subscriptions at $29 per month and team subscriptions at $449 per month with enterprise volume pricing available.
Rossman concludes, “The AWS Security Champion Knowledge Path represents a paradigm shift in how organizations approach security education. It’s about creating a shared language of security across teams, enabling faster, more secure development cycles, and ultimately, delivering better outcomes for our customers.”
Ready to elevate your organization’s security capabilities? Visit AWS Skill Builder to enroll and start your journey towards becoming an AWS Security Champion. For enterprise inquiries, reach out to your AWS account team.
Stay tuned to the AWS Security Blog for more updates on AWS Security services, features, and best practices. Together, we’re building a more secure cloud for all.
If you have feedback about this post, submit comments in the Comments section below.
Customers often tell me that they want a simpler path to meet the compliance and industry regulatory mandates they have in their geographic regions. In our deep engagements with partners and customers, we have learned that one of the greatest challenges for customers is the translation of security and compliance requirements into distinct technical controls. At Amazon Web Services (AWS), security is our top priority, and we understand that protecting your data in a world with changing regulations, technology, and risks takes teamwork. As we’ve said, security is foundational to sovereignty.
AWS helps organizations to develop and evolve security, identity, and compliance into key business enablers; that’s why we’re committed to working with national cyber authorities and regulators to help define and establish how their compliance standards can be translated into security best practices in the cloud. We’re responding to customer requests to create locally tailored approaches aligned to their own regional standards and guidance as established by in-region authorities.
Architectural best practice, locally tailored
Since its launch in 2022, Landing Zone Accelerator on AWS has been instrumental in helping thousands of customers deploy cloud foundations that align with multiple global compliance frameworks and AWS best practices, including the Baseline Informatiebeveiliging Overheid (BIO) in the Netherlands, and the Esquema Nacional de Seguridad (ENS) in Spain. AWS is committed to expanding our regional implementations to help customers meet specific national and regional standards and digital sovereignty goals.
In March, I was proud to share the news of the cooperation agreement between the Federal Office for Information Security (BSI) and AWS, where AWS committed to help advance digital sovereignty and cybersecurity best practices and standards in Germany and across the European Union. With that in mind, I’m excited to share that our next regional implementation of Landing Zone Accelerator on AWS will support customers with workloads in Germany. The C5-ready Landing Zone Accelerator is designed to help customers meet their Cloud Computing Compliance Criteria Catalogue (C5) compliance objectives in the cloud. This will be available to our customers in Q3-2025, and at launch, our regional implementations will also be available in AWS European Sovereign Cloud.
For many customers in Germany, adherence to C5 is a requirement, and this is evidenced through a compliance assessment by an authorized assessor. Preparing for this assessment is critical for a successful outcome and is why AWS has partnered with AWS Global Security & Compliance (GSCA) Partner Schellman to provide the assessor insight as to how the C5-ready Landing Zone Accelerator can accelerate and simplify the path to C5 adoption for AWS customers.
AWS Partner Schellman: Proven Track Record in C5 Assessments
As one of the few firms with deep expertise and experience in C5 assessments, Schellman has completed several dozen evaluations across a wide range of clients—from agile startups to global enterprises. This diverse portfolio underscores Schellman’s capabilities, deep technical expertise, and unwavering commitment to security assurance.
“Our team has seen firsthand how the C5 standard fosters transparency and builds trust in cloud services. We’re proud to support our clients not just in understanding C5, but in strategically leveraging it to improve security and competitiveness on a global scale.” Jeff Schiess, Managing Director, Schellman
Lowering the Barrier to Entry – Schellman recognizes that achieving C5 compliance can sometimes be intimidating, particularly for organizations new to the framework. To that end, Schellman has performed an assessment against the foundational infrastructure provided by LZA on AWS, designed to simplify the C5 journey. The LZA provides preconfigured infrastructure templates and security baselines that significantly reduce the complexity of establishing C5-compliant cloud environments.
“With the Landing Zone Accelerator, organizations can build on a C5-ready foundation right from the start. It’s a practical, scalable solution for companies that might otherwise find the C5 standard overwhelming.” Kristen Wilbur, Principal, Schellman
Sovereign by design
Landing Zone Accelerator on AWS automatically implements hundreds of security capabilities that map to control requirements across geographic compliance frameworks. This saves customers hundreds of hours in planning and implementing secure networking and account configurations by providing them with a foundation based on the AWS Well-Architected Security Pillar and AWS security best practices. Meeting compliance requirements, having verifiable access controls and data transfer restrictions, independence and choice over the technology stack, and surviving large-scale disruptions are some of the key capabilities that customers require of a sovereign-by-design workload. However, for many customers, translating regulatory requirements into a set of discrete technical controls and applying them consistently across one or more AWS accounts and AWS Regions can be time-intensive and challenging.
We provide customers and partners with detailed guidance on how to configure Landing Zone Accelerator on AWS in accordance with their local security and compliance requirements, including digital sovereignty requirements. This includes control mapping to local regulations or policies that shows customers how controls implemented in a landing zone are mapped to the specific requirements, calling out where customers are required to do more to meet these as part of our shared responsibility model—this includes organizational policies and procedures where customers must implement additional controls within their application or workload to meet local requirements.
Control over the location of your data
Landing Zone Accelerator on AWS provides customers with a choice of configurable preventative, detective, and proactive controls to help customers meet their data residency, security, and compliance objectives, whether you’re a public sector customer wanting to keep data in a single Region or navigating the complex needs of multi-national organizations with operations subject to differing digital sovereignty requirements.
Verifiable control over data access
Landing Zone Accelerator on AWS goes beyond just provisioning a secure, multi-account environment. It establishes a well-structured, multi-account architecture using AWS Organizations. This logically isolates workloads, management functions, and security controls into dedicated organizational units (OUs). This not only enhances security and operational efficiency, but also helps customers to enforce consistent data residency, access management, and compliance policies across their entire cloud footprint. These powerful guardrails empower customers to quickly harness the innovative potential of cloud technologies, whilst delivering business value from an established security and compliance baseline.
By providing this automated approach, AWS empowers organizations to rapidly deploy cloud environments tailored to their specific local requirements in days instead of weeks; with robust security, compliance, and operational guardrails in place from the outset. Landing Zone Accelerator on AWS is designed to simplify the path to cloud adoption and compliance for organizations, particularly those in regulated industries or with sovereignty requirements. This approach marks a shift from the previous heavy lift required for organizations to migrate workloads to the cloud while meeting their needs.
Partners at the core
There is a lot of complexity involved with navigating the evolving digital sovereignty landscape—but you don’t have to do it alone. Our AWS Digital Sovereignty Competency connects customers with trusted partners with demonstrated expertise to advise and architect for their customers’ digital sovereignty needs while taking advantage of the full potential of the AWS Cloud. As part of the competency, AWS is supporting partners to navigate customer challenges across four pillars: data residency, data protection, access control, and survivability.
Customers have told me about how challenging it can be to architect to address their sovereignty needs, often requiring manual iteration and longer time to value. Using Landing Zone Accelerator on AWS is one of the ways AWS and AWS Partners can work together to address customers’ sovereignty needs with a repeatable approach that helps our customers and partners move faster. I’m excited by how regional implementations of Landing Zone Accelerator on AWS is helping AWS Sovereignty Partners, such as Atos and SVA, to move faster without compromise.
“Compliance with regulations like C5 is essential for customers in the public sector and regulated industries, who prioritize digital sovereignty, and this is central to our Cloud for Clinics initiative with AWS in the German Healthcare market. The availability of the C5 LZA significantly reduces the technical complexity, giving us a common technical platform to build on reducing time to market. Atos is driving the operational rollout and expanding the scope of compliance mappings to further streamline customer compliance. At the same time, we are incorporating essential managed services like SOC/SIEM which we believe will make compliant cloud adoption easier to drive innovation by the Public Sector, Healthcare institutions or customers in regulated industries like Financial Services and Utilities.” Boris Hecker, Managing Director, ATOS Germany
“Compliance with BSI C5 criteria for customers from the public sector and regulated industries is a basic requirement for the use of public cloud services. Implementing the regulations is often complex, time-consuming and resource-intensive. For this reason, customers are looking for solutions that they can tailor to the specific requirements of their industry; while ensuring they meet compliance standards. SVA supports customers in maintaining the balance between innovation and compliance with customized, C5-certified, managed services. We rely on solutions such as the Landing Zone Accelerator on AWS to reconcile the use of market-leading public cloud infrastructure with regulatory requirements.” Patrick Glawe, Hyperscaler Lead at SVA
Email communication remains a critical component of business operations and customer engagement. As the digital landscape evolves, major mailbox providers continually update their policies to enhance security and user experience. This blog will explore the changes implemented by Microsoft for bulk senders trying to reach Outlook.com (supporting Hotmail.com, live.com consumer domain addresses). This follows the Google & Yahoo! bulk sender requirements changes in February of 2024. Microsoft is implementing the enforcement of sender requirements for bulk email senders, particularly those sending over 5,000 messages daily, starting May 5, 2025. These requirements focus on improving email authentication and trust. This will ensure Outlook and Hotmail recipients are receiving messages that are authenticated and from who they claim to be from. These measures will help reduce spoofing, phishing, and spam, and safeguarding individuals and businesses relying on email.
This blog will discuss what these changes mean for you, and how Amazon Simple Email Service (Amazon SES) can help you maintain compliance and optimize your email sending practices.
Background
In February 2024, Google and Yahoo implemented new requirements for bulk email senders, building upon industry efforts to combat spam and improve email deliverability. These changes aligned with Google’s 2024 bulk sender requirements initiative, signaling a unified approach among major mailbox providers to enhance the privacy and compliance in email.
What does this mean for customers and email senders?
Requirement for From and Reply-to addresses to be deliverable
Why These Changes Matter?
These new requirements serve several crucial purposes:
Enhances trust in your sending domain: Validates that the sender is who they are claiming to be. Enhances trust by delivering messages that are authenticated and aligned with the bulk sender requirements.
Improved Deliverability: Ensuring legitimate emails reach the recipients who have subscribed to sender’s messages.
Industry Standardization: Aligning sender requirements across major email providers
Best Practices for Compliance
To adhere to these new requirements and optimize your email sending practices, consider the following best practices:
1. Implement Strong Authentication
Configure SPF: SPF (Sender Policy Framework) is an email authentication standard that’s designed to prevent email spoofing. Domain owners use SPF to tell email providers which servers are allowed to send email from their domains. Follow setup instructions to authenticate your email with SPF. Must pass SPF for sending domain.
Configure “custom MAIL FROM“, which is how senders can ensure that the SPF-authenticated domain is aligned with the From header domain’s DMARC policy.
Enable DKIM signing: DomainKeys Identified Mail (DKIM) is an email security standard. It is designed to ensure that an email that claims to have come from a specific domain, was indeed authorized by the owner of that domain. It uses public-key cryptography to sign an email with a private key. Recipient servers use a public key, published to a domain’s DNS to verify that parts of the email have not been modified during the transit. Follow these set up instructions to authenticate email with DKIM in SES. Must pass to validate email integrity and authenticity.
Verify your domain with Easy DKIM. If currently using email identities, you have to move to domain
If you utilize email identities only, you will default all authentication to amazonses.com. That will not align with your friendly from address which will not satisfy the bulk sender requirements. This means that when you send email to mailbox providers, your messages will be rejected because you do not have proper authentication on your emails. To satisfy the bulk sender requirements, you must use domain verified identities which ensure that you have ownership of or permission to use the sending domain. That will allow SES to sign the outgoing emails with a DKIM signature that aligns with the friendly from domain.
Set up DMARC with an appropriate policy: Domain-based Message Authentication, Reporting and Conformance (DMARC) is an email authentication protocol that uses SPF and DKIM to detect email spoofing and phishing. To comply with DMARC, messages must be authenticated through either SPF or DKIM. Ideally, when both are used with DMARC, you’ll be ensuring the highest level of protection possible for your email sending.
Value of the TXT record contains the DMARC policy that applies to your domain.
In this example, the policy tells email providers to do the following:
At least p=none should be implemented.
2. Optimize Email Content
Clearly identify yourself as the sender: Use a recognizable “From” name and email address that accurately represents your brand or organization. For example, use “[email protected]” instead of a generic or misleading address.
Implement user friendly unsubscribe mechanisms: Include a visible, easy-to-use unsubscribe link in every email, typically in the header. Ensure the unsubscribe process is simple and honors requests promptly, ideally within 24-48 hours. Visit this guide on how Amazon SES helps you do that.
Subject line aligns with content: Avoid deceptive subject lines that don’t match the email content.
Clearly identify commercial content: If your email is promotional, make it obvious. Use clear language in the subject line and body that indicates the nature of the email, such as “Special Offer” or “Newsletter.”
Include a valid physical address: Add your company’s physical mailing address in the email footer. This is not only a legal requirement in many jurisdictions but builds trust with recipients.
Verify URLS in the emails: Verify that links in the emails you send work and are not misleading to the reader/subscriber. Be transparent with URLs/links in the email content.
3. Monitor and Maintain
Monitor bounces: A bounce typically indicates why a message was not delivered. The SMTP response in the bounce message will have details on why the message was bounced. For example: if it is missing authentication records (fix: include authentication records for the domain – quick fix) versus an IP or domain reputation bounce reason (this maybe a longer term fix).
Track both hard bounces (permanent delivery failures) and soft bounces (temporary issues). High bounce rates can indicate list quality problems or delivery issues. Visit this blog to set up notifications for bounces & complaints. Virtual Deliverability Manager (VDM) is an Amazon SES feature that helps you enhance email deliverability. It helps increasing inbox deliverability and email conversions, by providing insights into your sending and delivery data. VDM advices on how to fix the issues that are negatively affecting your delivery success rate and reputation.
Track complaint rates: Regularly monitor the number of spam complaints your emails receive with a goal of keeping the complaint rate under 0.2%. Not all mailbox providers have complaint feedback loop data, so use aggregate data from the mailbox providers that do, such as Hotmail and Yahoo. Email providers that don’t provide complaint feedback loops, such as Gmail may have alternative dashboards or tools available like Google Postmaster tools.
Perform regular authentication checks: Periodically verify that your SPF, DKIM, and DMARC records are correctly set up and functioning. Alternative to manual DNS checks, Amazon SES has a feature in Virtual Deliverability Manager that performs authentication checks for your sending identities.
Maintain list hygiene: Regularly clean your email list by removing inactive subscribers, correcting typos in email addresses, and honoring unsubscribe requests. This helps improve deliverability and engagement rates.
How Amazon SES Helps
Amazon SES provides a robust set of features to help you meet these new requirements and optimize your email sending practices:
The new bulk sender requirements from Microsoft and Yahoo represent an important step towards a more secure and reliable email ecosystem. By leveraging Amazon SES’s powerful features and following industry best practices, you can maintain compliance, improve deliverability, and enhance the overall effectiveness of your email communications.
Amazon SES is committed to helping you navigate these changes and optimize your email sending practices. For the most up-to-date guidance and support, please consult SES’s documentation or contact Amazon SES support.
Coding agents powered by large language models have shown impressive capabilities in software engineering tasks, but evaluating their performance across diverse programming languages and real-world scenarios remains challenging. This led to a recent explosion in benchmark creation to assess the coding effectiveness of said systems in controlled environments. In particular, SWE-Bench which measures the performance of systems in the context of GitHub issues has spurred the development of capable coding agents resulting in over 50 leaderboard submissions, thereby becoming the de-facto standard for coding agent benchmarking. Despite its significant impact as a pioneering benchmark, SWE-Bench, and in particular its “verified” subset, also shows some limitations. It contains only Python repositories, the majority of tasks are bug fixes, and at over 45% of all tasks, the Django repository is significantly over-represented.
Today, Amazon introduces SWE-PolyBench, the first industry benchmark to evaluate AI coding agents’ ability to navigate and understand complex codebases, introducing rich metrics to advance AI performance in real-world scenarios. SWE-PolyBench contains over 2,000 curated issues in four languages. In addition, it contains a stratified subset of 500 issues (SWE-PolyBench500) for the purpose of rapid experimentation. SWE-PolyBench evaluates the performance of AI coding agents through a comprehensive set of metrics: pass rates across different programming languages and task complexity levels, along with precision and recall measurements for code/file context identification. These evaluation metrics can help the community address challenges in understanding how well AI coding agents can navigate through and comprehend complex codebases
Below, we describe the key features, characteristics, and the creation process of our dataset alongside the new evaluation metrics, and performance of open source agents from our experiments.
Extensive Dataset: 2110 instances from 21 repositories ranging from web frameworks to code editors and ML tools, on the same scale as SWE-Bench full with more repository.
Task Variety: Includes bug fixes, feature requests, and code refactoring.
Faster Experimentation: SWE-PolyBench500 is a stratified subset for efficient experimentation.
Leaderboard: A leaderboard with a rich set of metrics for transparent benchmarking.
Building a comprehensive dataset
The creation of SWE-PolyBench involved a data collection and filtering process designed to ensure the quality and relevance of the benchmark tasks. SWE-Bench, a benchmark for Python code generation, evaluates agents on real-world programming tasks by utilizing GitHub issues and their corresponding code and test modifications. We extended the SWE-Bench data acquisition pipeline to support 3 additional languages besides Python and used it to gather and process coding challenges from real-world repositories as shown in Figure 1.
Figure 1: Overview of the SWE-PolyBench data generation pipeline, illustrating the process of collecting, filtering, and validating coding tasks.
The data acquisition pipeline collects pull requests (PRs) that close issues from popular repositories across Java, JavaScript, TypeScript, and Python. These PRs undergo filtering and are set up in containerized environments for consistent test execution. The process categorizes tests as fail-to-pass (F2P) or pass-to-pass (P2P) based on their outcomes before and after patch application. Only PRs with at least one F2P test are included in the final dataset, ensuring that each task represents a meaningful coding challenge. This streamlined approach results in a dataset that closely mimics real-world coding scenarios, providing a robust foundation for evaluating AI coding assistants.
Dataset characteristics
When constructing SWE-PolyBench, we aimed to collect GitHub issues that represent diverse programming scenarios: issues involving modifications across multiple code files and spanning different task categories (such as bug fixes, feature requests, and refactoring). Tables 1 and 2 provide descriptive statistics on the composition and complexity of SWE-PolyBench full (PB) and SWE-PolyBench500 (PB500). To offer a point of reference, we compare these statistics with those of SWE-Bench (SWE) and SWE-Bench verified (SWEv). Tasks in SWE-PolyBench require on average more files to be modified and more nodes to be changed, which indicates that they have higher complexity and are closer to tasks in real-world projects. The distribution of tasks is also more diverse, in particular for SWE-PolyBench500.
New evaluation metrics
To comprehensively evaluate AI coding assistants, SWE-Polybench introduces multiple new metrics in addition to the pass rate. The pass rate is the proportion of tasks successfully solved as measured by the generated patch passing all relevant tests. It is the primary metric for assessing coding agent performance, but it doesn’t provide a complete picture of an agent’s capabilities. In particular, it doesn’t give much information on an agent’s ability to navigate and understand complex code repositories. SWE-PolyBench introduces a new set of metrics based on Concrete Syntax Tree (CST) node analysis and the established file-level localization metric:
File-level Localization: assesses the agent’s ability to identify the correct files that need to be modified within a repository. Let us assume that we would need to modify file.py to solve our problem. If our coding agent implements a change in any other file, it would receive a file retrieval score of 0.
CST Node-level Retrieval: evaluates the agent’s ability to identify specific code structures that require changes. It uses the Concrete Syntax Tree (CST) representation of the code to measure how accurately the agent can locate the exact functions or classes that need modification.
Figure 2: Illustration of CST node changes.
In Figure 2, we see a change in class node A materialized by a change in its initialization function on the left path starting from the file node. In contrast to the first change, the change in class B is considered a function node change as it doesn’t impact class construction.
Let us assume the change that would solve our problem is the change in the __init__ function. If our coding agent implements the change in my_func, it receives both a class and function node retrieval score of 0.
By combining pass rate assessment with both file-level and CST node-level retrieval metrics, SWE-PolyBench offers a detailed evaluation of AI coding assistants’ capabilities in real-world scenarios. This approach provides deeper insights into how well agents navigate and comprehend complex codebases, going beyond simple task completion to assess their understanding of code structure and organization.
Performance of open-source coding agents
Key Findings
Language Proficiency: Python is the strongest language for all agents, likely due to its prevalence in training data and existing benchmarks.
Complexity Challenges: Performance degrades as task complexity increases, particularly when modifications to 3 or more files are required.
Task Specialization: Different agents show strengths in various task categories (bug fixes, feature requests, refactoring).
Context Importance: The informativeness of problem statements impacts success rates across all agents (refer to Figure 5 of the appendix paper for details about this analysis).
Many existing open-source agents are designed primarily for Python. Adapting them to work for all four languages of SWE-PolyBench required adjusting test execution commands, modifying parsing mechanisms, and adapting containerization strategies for each language. We adapted and evaluated three open-source agents on SWE-PolyBench. The aforementioned adjustments are reflected by the added “-PB” suffix to the original agent names.
Figure 3: Performance of coding agents across programming languages and task complexities, highlighting strengths and areas for improvement.
Figure 3 provides a visual representation of agent performance across different dimensions:
Language Proficiency: The left side of the chart shows that all three agents perform best in Python, with significantly lower pass rates in other languages. This highlights the current bias towards Python in many coding agents and their underlying large language models.
Task Complexity: The right side of the chart illustrates how performance degrades as task complexity increases. Agents show higher pass rates for tasks involving single class or function changes, but struggle with tasks requiring modifications to multiple classes or functions and in instances where both class and function changes are required.
This comprehensive view of agent performance underscores the value of SWE-PolyBench in identifying specific strengths and weaknesses of different coding assistants, paving the way for targeted improvements in future iterations.
In addition to these insights, the evaluation revealed interesting patterns across different task categories as shown in Table 2. The performance data across bug fixes, feature requests, and refactoring tasks reveals varying strengths among AI coding assistants. The performance on bug fixing tasks is relatively consistent. There is more variability between different agents and between multiple runs of a given agent for feature request tasks and refactoring tasks.
Join the SWE-PolyBench community
SWE-PolyBench and its evaluation framework are publicly available. This open approach invites the global developer community to build upon this work and advance the field of AI-assisted software engineering. As coding agents continue to evolve, benchmarks like SWE-PolyBench play a crucial role in ensuring they can meet the diverse needs of real-world software development across multiple programming languages and task types.
Explore SWE-PolyBench today and contribute to the future of AI-powered software engineering!
Wicked6 Cyber Games 2025 brought hundreds of women together worldwide from March 28–30. This dynamic virtual competition, sponsored by Amazon Web Services (AWS), helped attendees tackle real-world cybersecurity challenges through e-sports experiences. With 72 hours of women talking about cybersecurity, 11 cybersecurity games, and an attack and defense tournament streamed live, the weekend-long event highlighted the value of immersive learning while investing in the next generation of cybersecurity leaders.
Now in its sixth year, Wicked6 has established itself as more than just a competition—it’s become a cornerstone in building a collaborative security community. The Women’s Society of Cyberjutsu, a national 501(c)(3) nonprofit that promotes training, mentoring, and advancement of women and girls in cybersecurity careers, has co-hosted the event since its inception. This year’s theme was leveling up, and the virtual format enabled unprecedented global participation with 31 speakers and over 500 participants of all skill levels from 48 countries.
Keynotes and sessions
The event kicked off with an upbeat introduction from Wicked6 emcee Kristin Demoranville, founder and CEO of AnzenSage, Jessica Gulick, Executive Director of Wicked6 and founder of Cyber Esports Foundation, and Mari Galloway, CEO of Women’s Society of Cyberjutsu. The trio emphasized the importance of programs such as Wicked6 that provide women with space and opportunities to learn and grow, strengthen our confidence, and celebrate each other’s contributions to the cybersecurity community.
Keynotes featuring speakers from Africa, Australia, Japan, Saudi Arabia, and the US resonated with the multinational participants. Topics ranged from hacking and protecting AI in the age of large language models (LLMs) to drawing inspiration from science fiction novels, with an eye toward boosting skills.
In his introduction to keynote speaker Anna Collard, SVP of Content Strategy and Evangelist at KnowBe4 Africa, Hart Rossman, Global Security Services Vice President at AWS, noted the positive impact of time invested by Wicked6 participants and supporters. He pointed out that the opportunity the event provides to build relationships and practice both soft skills and technical skills is a great example of what it means to build strong security culture.
“At AWS, we recognize that security is a team sport. It’s about building community and raising the bar together, so we can overcome determined adversaries and make all of our customers, colleagues, and communities safer.” —Hart Rossman, Global Security Services Vice President at AWS
Technical sessions included a presentation focused on safeguarding Amazon Simple Storage Service (Amazon S3) buckets by two AWS women in security, Customer Incident Response Team (CIRT) Responder Jennifer Paz and Worldwide Specialist Security Solutions Architect Shahna Campbell. Paz and Campbell detailed an unusual increase of data encryption events in S3 buckets that used an encryption method known as server-side encryption using client-provided keys (SSE-C). This activity, which was recently detected by the AWS CIRT team and its automated security monitoring systems, has been attributed to malicious actors who obtained valid customer credentials and were using them to re-encrypt objects. Paz and Campbell demonstrated how collective security awareness and best practices can help prevent unauthorized access to S3 buckets and protect against ransomware events that abuse stolen credentials. Details of their investigation and prescriptive guidance for helping to prevent unintended encryption of Amazon S3 objects are available in a related AWS Security Blog post.
Gamified learning
A security-focused AWS Jam was integrated into Wicked6 for a unique, gamified learning experience. With AWS Jam, individuals and teams compete to solve a series of technical challenges in a lab-based cloud infrastructure that enhances practical understanding of AWS services and best practices. Additionally, Wicked6 participants had access to 11 different cybergame services, including Hack The Box, Haiku, InspireTech, and MetaCTF, fostering a collaborative learning environment where security practitioners at all levels could grow together.
An AWS GameDay during the event also focused on enhancing cloud security skills. Led by AWS ProServe Security and AWS Support experts Jonas Buecker, Hicham Terkiba, and Makendran Gunasekaran, the games focused on network security (including network log inspections), identity and access management (IAM) policies, and using application security techniques and AWS Web Application Firewall (AWS WAF) to help prevent SQL injections. One participant enthusiastically commented, “This was an amazing opportunity to practice hands-on AWS security learning,” underscoring the unique value of the experience.
Investing in tomorrow’s security leaders
AWS partnered to donate event tickets to South Africa’s MiDO Academy, which aims to create pathways out of poverty and meaningful employment opportunities for young people, while alleviating the pressures felt by business owners to upskill and integrate new cybersecurity talent. Dale Simons, CEO of MiDO Academy said, “The sponsored tickets from AWS didn’t just provide access to training—they gave our students entry into a global security community. Our young women now see themselves as part of a larger security mission, understanding that their contributions to cybersecurity can have worldwide impact.”
By combining technical challenges with mentorship and collaboration, Wicked6 helped participants work together to upskill and address tomorrow’s challenges. Gulick highlighted the event’s impact, stating “Wicked6 2025 was a success. Each year, women from all over the world join us for speakers, games, and networking. By learning to play cybersecurity games, these women can leverage games to learn new tech skills throughout their careers.”
No matter your role—whether you’re a seasoned professional or just starting your cybersecurity journey—continuous learning is key.
“It’s important as women and as cybersecurity professionals not to get comfortable with the status quo. Leveling up means stepping out of our comfort zones and doing things that scare us. Going to networking events, actively talking with people, connecting with people on LinkedIn, getting educated to improve skills, and putting ourselves out there. Wicked6 is the perfect place to do that this year and in the years to come!” —Mari Galloway, CEO of Women’s Society of Cyberjutsu
Pursuing the path to success
As cyber threats continue to evolve, AWS remains committed to strengthening global security culture through initiatives that promote active participation and partnership. This year’s Wicked6 Cyber Games exemplified how the security community can encourage and support future leaders with collaborative learning experiences and foster a more resilient and adaptable workforce.
If you have feedback about this blog post, submit comments in the Comments section below. You can also start a new thread on the AWS Security, Identity, and Compliance re:Post to get answers from the community.
Software engineering stands at an inflection point. While previous technological shifts enhanced what developers could build, AI is fundamentally changing how we build. Amazon Q has driven a shift in how developers at Amazon approach software development. At re:Invent 2024, our breakout session Unleashing generative AI: Amazon’s journey with Amazon Q Developer (DOP214) shared insights from Amazon’s internal journey that reveal not just tactical benefits, but our strategic reimagining of the software development process itself. In the months since our talk, the capabilities of this technology have only accelerated in sophistication and reliability. Our hope is that these learnings can inform the approaches organizations are taking to adopt AI, through guidance on scaling implementation, measuring impact and considerations around meaningful data, and best practices every step of the way. For all of us, this is just the beginning of what is looking to be a very exciting journey as AI becomes not only an active assistant in our day-to-day innovation, but starts to become a peer and companion as AI agents take on full tasks.
Rethinking our mental models: The Productivity Paradox
For too long, we’ve approached software development optimization through the lens of industrial-age thinking – treating code like widgets on an assembly line. This mental model has led organizations to chase simplified metrics like lines of code or story points, missing the true nature of software development as knowledge work.
Our experience at Amazon has shown that the real opportunity isn’t just about making current processes faster – it’s about changing how developers interact with code, documentation, and knowledge. In the 2024 Stack Overflow Developer Survey, 53% of respondents agreed that waiting on answers disrupts their workflow, even if they know where to go find those answers. Similarly, 30% of respondents said knowledge silos impact their productivity ten times or more per week.
In 2024, to solve this problem for Amazon developers, we ingested our internal Amazon knowledge repository consisting of millions of documents into Amazon Q Business so our developers could get answers based on information spread across those repositories. By simply asking Amazon Q their questions in existing tooling instead of manually searching or needing to ask an expert, we reduced the time Amazon developers spent waiting for technical answers by over 450k hours and reduced the interruptions to “flow state” of existing team members.
Today’s developers face a striking paradox: while they’re equipped with more powerful tools than ever, we know that across the industry, developers can spend only 1-2 hours daily writing code. The rest is consumed by what we call “toil” – necessary but undifferentiated work that scales linearly with software complexity. This represents not just a productivity challenge, but a strategic liability for organizations trying to accelerate innovation.
Amazon’s scale has provided unique insights into the transformative potential of AI in software engineering. Using AI for software transformations tied tightly into our internal development tools, we didn’t just save 4,500 developer years of effort – we unlocked new possibilities for large-scale technical modernization that previously seemed impractical. This experience revealed something profound: AI isn’t just making existing processes more efficient; it’s making previously impossible tasks feasible. For instance, our ability to automatically handle complex dependency updates across thousands of services has fundamentally changed how we think about technical debt and system modernization. Over the coming years as these AI agents become increasingly capable and autonomous, we will get increasingly bold with the types of modernization work we ask them to perform, ensuring reliability by complementing them with other agentic capabilities such as correctness validation, testing, and even advanced anomaly detection and production system operations.
The evolution of developer cognition
Perhaps the most fascinating insight from our journey has been observing how AI is changing the way developers think about and solve problems. The traditional model of a developer working in isolation, relying solely on their own knowledge and documentation, is evolving into a more collaborative model where AI serves as an intelligent thinking partner. We’ve seen this manifest in unexpected ways. Developers report that having AI tools available changes not just how they write code, but how they approach problem-solving itself. The ability to rapidly explore multiple approaches or instantly access contextual knowledge has enabled more creative and experimental development practices.
In particular, we are seeing seasoned developers playing with new-to-them programming languages and coding techniques that previously would not have been worthwhile due to ramp time. One developer reported cutting their typical three-week ramp-up time for learning a new programming language down to just one week using Q Developer. This significant reduction in a developer’s initial time investment allows creativity with more suitable programming languages for nuanced project requirements, or jumping into work with unfamiliar and complex systems, without sacrificing code quality. For example, with our recently launched Amazon Q Developer Agentic CLI, another internal developer was able to work with an unfamiliar codebase to build and implement a non-trivial feature within 2 days using Rust, a programming language they didn’t know, stating, “If I’d done this ‘the old fashioned way,’ I would estimate it would have taken me 5-6 weeks due to language and codebase ramp up time. More realistically, I wouldn’t have done it at all, because I don’t have that kind of time to devote.”
As we look to the future, we see several emerging frontiers that will further transform software engineering. The rise of AI agents capable of handling increasingly complex development tasks is shifting the developer’s role from implementation to orchestration. We’re moving toward a model where developers spend more time defining what needs to be built and validating approaches, rather than handling every implementation detail. System architecture, traditionally considered too nuanced for automation, is emerging as a new frontier for AI assistance. Application security reviews or software testing, frequent bottlenecks to software release due to specialist bandwidth, will increasingly be accelerated by AI agents amplifying the capacity of those specialists. While we’re just beginning to explore this space, early experiments suggest AI could help architects evaluate trade-offs and identify potential issues in complex systems more effectively than ever before.
Strategic implications for organizations
We believe the most successful organizations will be those that view AI not just as a tool for automation, but as a catalyst for transforming how they approach software development entirely. The real strategic advantage will come from reimagining software development processes and culture to fully leverage AI’s capabilities. This includes rethinking traditional metrics, redefining developer productivity, and creating space and cultural change for teams to experiment with new ways of working. Amazon Q represents a new class of development tools that augment developer capabilities in fundamental ways, beyond just writing code more efficiently. Organizations that understand and embrace this transformation will be best positioned to lead in the next era of software innovation.
To learn more about Amazon Q Developer and explore innovative ways of accelerating software development refer to the Q Developer documentation. Individual users can get started with Q Developer in the AWS Console, CLI, or in their IDE on the perpetual Free Tier. And remember: give yourself and your team “Permission to Play!” We’re at the heart of a technological revolution; as technologists this a moment where we get to immerse ourselves in the unknown and learn and be curious!
Increasing developer productivity has been a persistent challenge for senior leaders over the past decades. With the rise of generative artificial intelligence (AI), a new wave of innovation is transforming how software teams work. Generative AI tools like Amazon Q Developer are emerging as game-changers, supporting developers across the entire software development lifecycle. But how are large-scale organizations successfully adopting this AI-assisted approach? This document shares good practices I have discovered through working with enterprise customers navigating this technological transformation.
A common misperception still is that a developer is more productive when they write code faster. But a median developer spends less than one hour per day writing code, as a study conducted by software.com in 2022 shows. This makes clear that there are other aspects to consider when it comes to building an application and running it in production. Generative AI tools for developers, such as Amazon Q Developer, started as coding companions that provided inline completions. As the technology evolved, Amazon Q Developer is now able to support developers across the entire software development life cycle.
The Change Challenge
Generative AI offers new and interesting ways for developers to solve challenges and to support them in their daily work. But taking advantage of those opportunities takes some time. It introduces a noticeable change to their familiar ways of working and therefore it is much about forming a new habit. This, according to science, usually takes a minimum of two months. Teams need the space and permission to play with this new approach and to find out what works best for them. Expecting them to adopt a new way of working while expecting the same (or higher) level of output at the same time will only lead to teams falling back to what they know works. For customers that successfully have adopted Amazon Q Developer I have seen them reducing the delivery expectations to give space to learn, and having required teams to share learnings in return.
Additionally, as in any other large change project there is a significant cultural aspect to consider. If people feel intrinsically convinced by the value and benefits of an AI-supported approach to software engineering they will use it. “Simply ordering from above” will not help making an adoption successful. But building community, experimenting, learning, and sharing successes will. “Culture eats strategy for breakfast”, as the management visionary Peter Drucker said.
Keeping that in mind it is clear that there is no one-size-fits-all prescriptive way of successfully introducing generative AI tools for developers in your organization. It very much depends on your individual culture, goals, challenges, people, skills, and technology stack for example. However, there are a number of principles and good practices that work well with several of our large-scale customers who have successfully adopted Amazon Q Developer.
Best Practices for Successful Adoption
The following illustration describes the change management cycle and recommended activities for adopting AI-assisted software development.
Figure 1. The change management cycle
1. Secure Top-Down Commitment
Secure executive buy-in for adopting AI-assisted software development because this is a powerful sign for the organization. It helps to remove roadblocks and to promote successes across the organization. An executive sponsor links the adoption of AI-assisted software development to the strategic goals of the organization, will help resolving prioritization and capacity conflicts. Invite the sponsor to a kick-off meeting. Include them for the discussion of goals and success criteria, and keep them updated on progress, success stories, and challenges.
2. Become Clear on Goals and Success Criteria
Simply rolling out Generative AI tools to a large developer base won’t be enough. You need to be clear what you expect from such an adoption for your organization, for your developers, and for your business. It is important for you to understand your organization’s pain points from a developer experience perspective and how they affect your development productivity. These likely differ between different personas, like Software Developers and DevOps Engineers. For example, are your applications lacking test coverage or is your code lacking documentation, which creates a maintenance burden, and makes it difficult to onboard new developers? Is handling legacy code risky and time-consuming so that you avoid necessary upgrades because of the complexity and effort? Is troubleshooting applications locally or in production eating up your developers’ time? Or are you facing challenges caused by hard-to-find security issues in the code? What is it that you want to achieve by introducing an AI-assisted development approach, and why?
3. Establish Ownership
Adopting a new approach like the use of generative AI in software development at scale leads to many change management and coordination tasks. Those are related to getting access to the tool, enablement for new users, budget planning, measuring success and creating transparency on problems, creating momentum and making sure the adoption sustains, amongst others. Therefore, introducing a Customer Champion as a leader who coordinates the business and technology related aspects of the adoption is a common approach. They will connect the strategic goals of the organization with the tactical activities necessary for the implementation. If your adoption is spanning multiple different business units with larger developer bases consider establishing this role for each of them, forming a team that collaborates across your whole organization. Key responsibilities of the Customer Champion are to bring the right people together to successfully work on the adoption, to create transparency on status, and to address impediments early on.
4. Introduce Metrics
Once you have gained clarity on the specific pain points and goals for your organization, the next step is to determine the appropriate metrics to measure the success of your efforts. For example, you can measure the impact of using Amazon Q Developer on onboarding new developers by tracking the time to first commit against a previously established baseline average. Comparing the time it takes to complete certain tasks – like writing and integrating code, fixing bugs, setting up or upgrading environments, the time it takes to build a new feature, or by comparing sprint velocity before and after the introduction of Amazon Q Developer will give you further indications. But keep in mind that there is ambiguity in these metrics because they are impacted by different factors.
Focusing on developer experience and productivity, monitor the development of your established measurement framework, like DORA, SPACE, or GSM. SPACE in particular, with its “Satisfaction & Well-Being” dimension, pays close attention to how software developers perceive their work and how satisfied they are with their own productivity. Tools like Amazon Q Developer have shown a positive effect here, as for example a McKinsey study shows. They help to free developers from tasks that are perceived as toil, like repetitive and boring grunt work that doesn’t necessarily bring business value. To measure this impact on perceived productivity, customers sometimes design simple surveys, asking developers questions like “in percentage, how would you estimate the impact of using Amazon Q Developer on your productivity” or “on a scale from 1-5, how is Amazon Q Developer impacting the satisfaction with your day-to-day work?”
As a last dimension, understanding the general usage of Amazon Q Developer across your organization is important. Monitor the number active subscriptions, accepted code recommendations, or the number of executed security scans from the Amazon Q Developer dashboard. That way you will get an understanding for the acceptance of the tool in your developer base. Correlate this information with the success metrics you defined.
5. Start Small
When “rolling out” an AI-assisted software development approach, keep the technology adoption lifecycle and Everett Roger’s bell curve in mind. It describes that adoption of a new technology usually starts with a few “innovators”, followed by a small fraction of “early adopters”. Only if those early groups demonstrate convincing success, the majority of users will follow the adoption. To settle on this model will help you making the adoption of AI-assisted development successful in your organization.
Start small. Identify your tech innovators, or champions, who are enthusiastic to support the introduction of Amazon Q Developer and to advocate the approach in your organization. With them, build a team or a Center of Excellence (COE) that will help with identifying early adopters across your development teams, building technical and enablement foundations for onboarding users, creating roll-out plans, and evangelizing and sustaining the adoption. The champions will act as a bridge between your adoption program team and your users. They can provide insights and feedback on the adoption and come up with recommendations.
6. Create Momentum
Now that you have your foundations in place it is time to create momentum and onboard your early adopters to Amazon Q Developer. Start with a communication plan to raise awareness, to share updates and success stories, and to collect feedback from the users. You will need to create training material covering organization-specific resources (how to get access, for example, or which communication channels and contact points exist), user guides, tutorials, and pointers to relevant documentation and online resources. Consider creating your own prompt library, documenting prompts for Amazon Q Developer that your users find particularly helpful. There are community projects like promptz.dev that can deliver inspiration. Especially for new users this will have a lot of value for getting up to speed.
Consider how to integrate learning pathways with your organization’s learning platform moving forward. These should include the company-specific experience and knowledge you collect. In addition, it might be helpful to integrate external offers, like classroom trainings or workshop formats offered by AWS.
Hands-on technical enablement workshops will help your early adopters jumpstarting their experience. AWS offers multiple formats that can be tailored to your individual context. These include service deep-dives with Amazon Q Developer specialists, Immersion Days and hackathon support for teams to hands-on experience the tool in a guided, interactive format, or joined proof-of-value engagements. Your AWS account team will provide you more information.
7. Sustain and Scale Adoption
At that point you will have established Amazon Q Developer among an initial segment of your developer base. However, keeping Roger’s adoption curve in mind the largest part of the adoption still lies ahead of you. To facilitate the it across your whole organization, focus on delivering enablement workshops for the teams to be onboarded. These will be led by your champions and incorporate your organization-specific practices and knowledge.
To sustain the adoption, make sure the existing user base stays active. Continue offering exchange and support, collecting feedback, updating your enablement material, sharing updates on the latest developments for Amazon Q Developer, and reviewing your metrics. Create visibility across your organization for the accomplishments and positive experiences. Let user talk about the impact Amazon Q Developer has on their work. This will help building momentum. Nurture community building around your users of AI-assisted development.
Establish regular office hours with your champions for providing support and enablement to your users of Amazon Q Developer. This will facilitate the continuous gathering of feedback to improve documentation and enablement materials, collect and promote success stories, and validate the adoption approach. Additionally, establish a consistent communications and reporting cadence to keep all relevant stakeholders informed of key metrics, updates, feedback, and success stories. This ensures the alignment of the adoption of AI-assisted development with your strategic goals and expectations.
8. Inspect and Adapt
In addition, keep reflecting on the goals and metrics you came up with from a strategic perspective. Are they developing in the right direction? Are your pain points still the same? Should you move your focus to different aspects of the software development life cycle? And how might new capabilities of Amazon Q Developer support your goals?
Conclusion
By following the outlined approach, large organizations can successfully navigate the challenges of adopting Amazon Q Developer. The approach addresses technical, cultural, and organizational aspects of the adoption, increasing the likelihood of realizing the full potential of AI-assisted development across the enterprise.
If you are looking for advice or support during your adoption journey, your AWS Account Team will connect you with experts on Amazon Q Developer, provide you information on training and enablement, and support you with setting up a successful rollout program for your organization. To learn more about how Amazon Q Developer’s capabilities support the whole software development lifecycle, visit the product page or have a look at the documentation.
About the Author
Rene-Martin Tudyka is a Senior Customer Solutions Manager at AWS and provides guidance and support for enterprise customers on their cloud maturity journey. He has a long background in developing highly performant IT organizations and in successful large-scale cloud adoption.
dacadoo is a global Swiss-based technology company that develops solutions for digital health engagement and health risk quantification. Their products include a software-as-a-service (SaaS)-based digital health engagement platform that uses behavioral science, AI, and gamification to help end users improve their health outcomes.
To transform a virtual machine–based API service into a globally redundant, scalable health score and risk calculation solution dacadoo chose Amazon Web Services (AWS) technology. The service handles highly sensitive health data from a global customer base and must comply with regional regulations.
The result is a cost reduction of 78% and an infrastructure maintenance effort of less than an hour per year , allowing dacadoo to deliver and operate more AWS infrastructure without scaling its site reliability engineering (SRE) team, thanks to a high level of automation and an agile mindset.
In this post, we walk you step-by-step through dacadoo’s journey of embracing managed services, highlighting their architectural decisions as we go.
Background
The solution architecture went through a three-stage journey:
Incubation – Single virtual machine on premises with disaster recovery (DR) in Switzerland
Global and scalable – Multiple global Kubernetes clusters
Operational excellence – Fully serverless and geo-redundant on AWS
Stage 1: Incubation with a virtual machine
After years of scientific research and development, the service was launched, running on a single on-premises virtual machine that used hypervisor technology to provide disaster recovery (DR). However, it had no high availability (HA) capability and it required manual recovery.
The application serving the API requests and the NoSQL database were both running on the same host. Software deployment and operating system maintenance were performed manually using Secure Shell (SSH)—a typical low-automation setup that also included downtime.
The following architecture diagram shows a virtual machine encompassing the monolithic application and its database.
Challenges
A single virtual machine was quick to set up and inexpensive to operate, but it had considerable shortcomings. The health API was only available in Switzerland, infrastructure maintenance was performed manually, and software deployment was handled manually. Additionally, database backups were done using virtual machine snapshots, uptime monitoring only, and testing was conducted on the developer workstation.
Stage 2: Global and scalable with Kubernetes
At that time, dacadoo made a strategic decision to heavily invest in Kubernetes for managing containerized workloads on a global scale. As part of this technology rollout, the health score and risk service were migrated to Kubernetes.
Due to the geographically distributed customer base and low latency requirements, three Kubernetes clusters were deployed, one on each continent. The NoSQL database was hosted in proximity to the workload to reduce service latency and keep the migration effort low.
To reduce the operational maintenance, the NoSQL database was integrated as a SaaS offering, and monitoring was centralized using Datadog.
All cloud infrastructure was provisioned exclusively with Terraform, covering the Kubernetes cluster, NoSQL database , and integration with GitLab and Datadog.
dacadoo containerized the API service and used Gitlab continuous integration and continuous deployment (CI/CD) pipelines to deploy multiple environments and clusters on a global hyperscaler.
In retrospect, this was a typical replatform modernization project from virtual machine to Kubernetes, with a high level of automation and a SaaS-first approach.
The following diagram is the architecture for the container solution with managed NoSQL database.
Challenges
The service faced several challenges, including increased costs from deploying three regional Kubernetes clusters across three environments, resulting in 27 cluster nodes and additional expenses from managing NoSQL database SaaS instances for each cluster. The complexity of CI/CD pipelines for multi-environment multi-cluster deployments added to the difficulty. Significant operational effort was required to keep infrastructure and Kubernetes components up to date.
Stage 3: Operational excellence with serverless
The Kubernetes-based architecture met the requirements, but some features in the dacadoo API service backlog needed to fit better with the application architecture at the time.
This was the right moment to take a holistic view of the infrastructure and software architecture and refactor the solution according to the latest AWS technologies and best practices, the next frontier for dacadoo’s engineering team.
Solution requirements
Requirements for the solution refactoring were as follows:
Keep the functionality of the API unmodified
Constrain data processing to a region of choice for compliance with local data protection laws
Avoid weekly patch cycles by exclusively using managed serverless services
Reduce costs by choosing services with a pay-as-you-go billing model
Delegate authentication to a dedicated service
Use an established web framework with an extensive ecosystem
Refactoring the apps
The API service has two components: a developer portal and the health score and risk calculations API. The database is only required for API keys, algorithm parameters, quotas, and usage statistics. Health data is processed regionally by the compute layer but not persisted, opening the door for a distributed database: Amazon DynamoDB global tables is the perfect fit for the solution. Writes are distributed to all connected Regions, whereas reads are local, providing low latency for complying with dacadoo service level agreements (SLAs).
The developer portal is a web UI with API documentation and API key management features. AWS Lambda is a great fit because it scales automatically and has a pay-per-request billing model.
The health and risk API uses algorithms implemented in the C programming language for short bursting, compute-intense simulations. These calls are wrapped by a REST API using the Python FastAPI framework. These characteristics make AWS Lambda a great fit.
Serverless architecture
HTTP requests are routed to the Lambda functions using Amazon API Gateway with AWS WAF for protection from malicious requests and attacks. Static assets are served from an Amazon Simple Storage Service (Amazon S3) bucket through API Gateway. The additional features of Amazon CloudFront aren’t required, and Amazon S3 reduces the complexity.
Amazon Route 53 provides a powerful feature known as latency-based routing, which allows it to direct DNS queries to the endpoint that offers the lowest latency for the requester.
This feature provides Regional high availability for API users without data processing location requirements. Alternatively, the user can call specific Regional endpoints to make sure requests are processed in the desired Region.
API authorization is HTTP header-based and is performed in the application with data stored in Amazon DynamoDB.
The following diagram is the architecture for a geo-redundant fully serverless solution.
With a dacadoo SRE team proficient in Python, they opted for Pulumi for its advanced features such as programming language flow control constructs, powerful configuration capabilities, and multi-cloud support.
For continuous integration, GitLab CI compiles the algorithm library, tests the FastAPI applications and packages everything. The application deployment is just an update of the AWS Lambda, a simple and reliable workflow.
Summary
The solution evolved from a managed infrastructure setup, where the customer held most of the responsibility, to an AWS managed service architecture.
Infrastructure provisioning evolved from manual, error-prone processes to powerful code-driven workflows in Pulumi. The SRE needed to enhance their software engineering skills to adopt Pulumi, transitioning from configuration-based approaches to designing and maintaining an infrastructure code base using object-oriented Python. This was part of dacadoo’s investment in the SRE team and broader modernization efforts. The serverless architecture enabled a GitOps engineering culture focused on productivity.
The transformation maximized scalability and availability while reducing costs and operational effort:
Virtual machine
Scalability: Low
Availability: Best effort
Infrastructure costs: Low
Maintenance effort: High
Kubernetes
Scalability: High
Availability: 99.95%
Infrastructure costs: High
Maintenance effort: Medium
Serverless
Scalability: Very high
Availability: 99.999% (with failover to another AWS Region)
Infrastructure costs: Low
Maintenance effort: Very low
The global redundancy elevates availability to an impressive 99.999% while keeping the costs low.
Conclusion
Migrating from a virtual machine to Kubernetes and ultimately to AWS Lambda demonstrates the progression of cloud engineering toward enhanced efficiency and scalability.
Each step in this journey reduced the complexity of managing resources while increasing flexibility and automation. Transitioning dacadoo’s API service to a fully serverless, geo-redundant architecture not only advanced the platform but also upskilled engineers, maintained a lean SRE team, and kept infrastructure costs low. Get started with your own AWS serverless solution.
At AWS re:Invent 2024, we announced the next generation of Amazon SageMaker, the center for all your data, analytics, and AI. Amazon SageMaker brings together widely adopted AWS machine learning (ML) and analytics capabilities and addresses the challenges of harnessing organizational data for analytics and AI through unified access to tools and data with governance built in. It enables teams to securely find, prepare, and collaborate on data assets and build analytics and AI applications through a single experience, accelerating the path from data to value.
At the core of the next generation of Amazon SageMaker is Amazon SageMaker Unified Studio, a single data and AI development environment where you can find and access your organization’s data and act on it using the best tool for the job across virtually any use case. We are excited to announce the general availability of SageMaker Unified Studio.
In this post, we explore the benefits of SageMaker Unified Studio and how to get started.
Benefits of SageMaker Unified Studio
SageMaker Unified Studio brings together the functionality and tools from existing AWS Analytics and AI/ML services, including Amazon EMR, AWS Glue, Amazon Athena, Amazon Redshift, Amazon Bedrock, and Amazon SageMaker AI. From within the unified studio, you can discover data and AI assets from across your organization, then work together in projects to securely build and share analytics and AI artifacts, including data, models, and generative AI applications. Governance features including fine-grained access control are built into SageMaker Unified Studio using Amazon SageMaker Catalog to help you meet enterprise security requirements across your entire data estate.
Unified access to your data is provided by Amazon SageMaker Lakehouse, a unified, open, and secure data lakehouse built on Apache Iceberg open standards. Whether your data is stored in Amazon Simple Storage Service (Amazon S3) data lakes, Redshift data warehouses, or third-party and federated data sources, you can access it from one place and use it with Iceberg-compatible engines and tools. In addition, SageMaker Lakehouse now integrates with Amazon S3 Tables, the first cloud object store with native Apache Iceberg support, so you can use SageMaker Lakehouse to create, query, and process S3 Tables efficiently using various analytics engines in SageMaker Unified Studio as well as Iceberg-compatible engines like Apache Spark and PyIceberg.
Capabilities from Amazon Bedrock are now generally available in SageMaker Unified Studio, allowing you to rapidly prototype, customize, and share generative AI applications in a governed environment. Users have an intuitive interface to access high-performing foundation models (FMs) in Amazon Bedrock, including the Amazon Nova model series, and the ability to create Agents, Flows, Knowledge Bases, and Guardrails with a few clicks.
Amazon Q Developer, the most capable generative AI assistant for software development, can be used within SageMaker Unified Studio to streamline tasks across the data and AI development lifecycle, including code authoring, SQL generation, data discovery, and troubleshooting.
A new integrated way of working
The general availability of SageMaker Unified Studio represents another meaningful step in our journey to offer our customers a streamlined way to work with their data, whether for analytics or AI. Many of our customers have told us that you are building data-driven applications to guide business decisions, improve agility, and drive innovation, but that these applications are complex to build because they require collaboration across teams and the integration of data and tools. Not only is it time consuming for users to learn multiple development experiences, but because data, code, and other development artifacts are stored separately, it is challenging for users to understand how they interact with each other and to use them cohesively. Configuring and governing access is also a cumbersome manual process. To overcome these hurdles, many organizations are building bespoke integrations between services, tools, and homegrown access management systems. However, what you need is the flexibility to adopt the best services for your use case while empowering your data teams with a unified development experience.
“When we build data-driven applications for our customers, we want a unified platform where the technologies work together in an integrated way. Amazon SageMaker Unified Studio streamlines our solution delivery processes through comprehensive analytics capabilities, a unified studio experience, and a lakehouse that integrates data management across data warehouses and data lakes. Amazon SageMaker Unified Studio reduces the time-to-value for our customers’ data projects by up to 40%, helping us with our mission to accelerate our customers’ digital transformation journey.”
—Akihiro Suzue, Head of Solutions Sector, NTT DATA; Yuji Shono, Senior Manager, Apps & Data Technology Department, NTT DATA; Yuki Saito, Manager, Digital Success Solutions Division, NTT DATA
Millions of organizations trust AWS and utilize our comprehensive set of purpose-built analytics, AI/ML, and generative AI capabilities to power data-driven applications without compromising on performance, scale, or cost. Our goal for the next generation of Amazon SageMaker, including SageMaker Unified Studio, is to make data and AI workers more productive by providing access to all your data and tools in a single development environment.
Building from a single data and AI development environment
Let’s explore a common business challenge: increasing revenue through better lead generation. Consider an organization implementing an intelligent digital assistant on their website to engage with customers—a process that traditionally requires multiple tools and data sources. With SageMaker Unified Studio, this entire process can now be carried out within a single data and AI development environment.
First, the data team uses the generative AI playground within SageMaker Unified Studio to quickly evaluate and select the best model for their customer interactions. They then create a project to house the tools and resources necessary for their use case and use Amazon Bedrock within the project to build and deploy a sophisticated virtual assistant that quickly begins qualifying leads through their website.
To identify the most promising opportunities, the team develops a segmentation strategy. The data engineer asks Amazon Q Developer to identify datasets that contain lead data and uses zero-ETL integrations to bring the data into SageMaker Lakehouse. The data analyst then discovers it and creates a comprehensive view of their market. They use the SQL query editor to build out marketing segments, which they then write back to SageMaker Lakehouse, where they are available to other team members.
Finally, the data scientist accesses the same dataset, which they use to train and deploy an automated lead scoring model using tools available from SageMaker AI. During the model development phase, they use Amazon Q Developer’s inline code authoring and troubleshooting capabilities to efficiently write error free-code in their JupyterLab notebook. The final model provides sales teams with the highest-value opportunities, which they can visualize in a business intelligence dashboard and take action on immediately.
Reducing time-to-value in a unified environment
What is remarkable about this example is that entire process happens in one integrated environment. Without SageMaker Unified Studio, the team would have had to work with multiple data sources, tools, and services, spending time learning multiple development environments, creating resources shares, and manually configuring access controls. The data engineer and data analyst would have worked in various data warehouses, data lakes, and analytics tools, the data scientist would have worked in an ML studio and notebook environment, and the application builder in a generative AI tool. Now, they’re able to build and collaborate with their data and tools available in one experience, dramatically reducing time-to-value.
That’s why we’re so excited about the next generation of Amazon SageMaker and the general availability of SageMaker Unified Studio. We believe that by putting everything you need for analytics and AI in one place, you can solve complex end-to-end problems more efficiently and get to innovative outcomes faster than ever before.
G2 Krishnamoorthy is VP of Analytics, leading AWS data lake services, data integration, Amazon OpenSearch Service, and Amazon QuickSight. Prior to his current role, G2 built and ran the Analytics and ML Platform at Facebook/Meta, and built various parts of the SQL Server database, Azure Analytics, and Azure ML at Microsoft.
Rahul Pathak is VP of Relational Database Engines, leading Amazon Aurora, Amazon Redshift, and Amazon QLDB. Prior to his current role, he was VP of Analytics at AWS, where he worked across the entire AWS database portfolio. He has co-founded two companies, one focused on digital media analytics and the other on IP-geolocation.
Data sharing has become a crucial aspect of driving innovation, contributing to growth, and fostering collaboration across industries. According to this Gartner study, organizations promoting data sharing outperform their peers on most business value metrics. A straightforward data access and sharing mechanism is crucial for enabling effective data sharing across an organization. There are challenges such as complexity in managing cross-account permissions and difficulty in discovering the right data across accounts that organizations face when trying to share data products across AWS accounts. Amazon DataZone is a fully managed data management service that customers can use to catalog, discover, share, and govern data stored across Amazon Web Services (AWS).
In this post, we will cover how you can use Amazon DataZone to facilitate data collaboration between AWS accounts.
Solution overview
This solution provides a streamlined way to enable cross-account data collaboration using Amazon DataZone domain association while maintaining security and governance. This post describes the process of using the business data catalog resource of Amazon DataZone to publish data assets so they’re discoverable by other accounts. After they’ve been published, you can query the published assets from another AWS account using analytical tools such as Amazon Athena and the Amazon Redshift query editor, as shown in the following figure.
In this solution (as shown in the preceding figure), the AWS account that contains the data assets is referred to as the producer account. The AWS account that needs to access or use the data from the producer account is referred to as the consumer account. The Amazon DataZone domain is created and managed within the producer account and then the consumer account is associated with that domain.
As part of Amazon DataZone domain association, Amazon DataZone uses AWS Resource Access Manager (AWS RAM) to share the resource. When the producer and consumer AWS accounts are in the same organization within AWS Organizations, the domain association happens automatically. If the producer and consumer AWS accounts are in different organizations, AWS RAM sends an invitation to the consumer AWS account to accept or reject the resource grant.
This solution presents three Amazon DataZone user personas as:
Data administrators: Account owners in both producer and consumer AWS accounts. The data administrators are responsible for creating Amazon DataZone domains, configuring domain associations, and accepting domain associations within the Amazon DataZone domain.
Data publishers: Users in producer AWS accounts. The data publishers are responsible for creating Amazon DataZone publish projects and environments, producing and publishing data assets, and accepting subscription requests.
Data subscribers: Users in consumer AWS accounts. The data subscribers are responsible for creating Amazon DataZone subscribe projects and environments, searching for and subscribing to data assets, and querying the data and deriving insights.
Prerequisites
To follow along with the instructions, you will need:
Two AWS accounts, one serving as producer and other account serving as consumer. Create new AWS accounts if necessary.
A secret in AWS Secrets Manager storing the master user credentials for the Amazon Redshift cluster or workgroup in the producer and consumer AWS accounts.
The data administrators are responsible for creating secrets.
The data producers and consumers can obtain the Amazon Resource Name (ARN) of the secrets from the data administrators during the environment or environment profile creation steps.
Amazon DataZone uses Amazon Redshift Datashares to share data across clusters and accounts. There are specific requirements and limitations for using Amazon Redshift datashares.
Data sharing is supported only for provisioned ra3 cluster types (ra3.16xlarge, ra3.4xlarge, and ra3.xlplus) and Amazon Redshift Serverless.
Walkthrough:
The following are the high level steps to configure cross-account access. We’ve provided step-by-step instructions in the following sections.
Create an Amazon DataZone domain in the producer account. The data administrator creates an Amazon DataZone domain.
Request Amazon DataZone domain association from the producer account to the consumer account.
Accept the domain association request in the consumer account. The data administrator accepts the domain association.
Add data users to the Amazon DataZone domain.
Create the necessary publish project for AWS Glue and Amazon Redshift in the producer account.
Create AWS Glue and Amazon Redshift environments to publish the data assets in the producer account.
Create and run a data source for AWS Glue and Amazon Redshift to publish assets into the business catalog.
Create subscribe projects for AWS Glue and Amazon Redshift.
Create AWS Glue and Amazon Redshift environment profiles and environments in the subscribe project
Subscribe to AWS Glue and Amazon Redshift tables. Consume the data using Athena and Amazon redshift editors. This step is performed by the data subscriber.
Create the Amazon DataZone domain in the producer account
Amazon DataZone domains serve as high-level organizational units for assets, users, and projects, facilitating cross-team and cross-account collaboration. This step focusses on creating the Amazon DataZone domain in the producer account.
Create an Amazon DataZone domain titled Demo_cross_account_domain using the instructions at create domains.
On the Create domain screen, select Quick setup checkbox to automate several configuration steps, saving time and reducing the potential for setup errors. Quick setup enables two default blueprints and creates the default environment profiles for the data lake and data warehouse default blueprints.
Request Amazon DataZone domain association from the producer account to the consumer account
To associate the Amazon DataZone domain with the consumer account, the producer account requests a domain association. This involves providing necessary information about the consumer account and granting appropriate permissions for data access and management.
Sign in to the Amazon DataZone console of the producer account using the data administrator credentials.
Navigate to the domain detail page, and then scroll down and select the Associated Accounts tab.
Enter the consumer account IDs that you want to request association. Choose Add another account if you want to add more than one account. When you’re satisfied with the list of account IDs, choose Request association.
Use the latest (AWS RAM DataZonePortalReadWrite policy when requesting the account association. This policy allows users in the consumer account to execute Amazon DataZone APIs and to use the data portal interface.
Accept an account association request from an Amazon DataZone domain
This step focuses on accepting the account association request from the Amazon DataZone domain in the consumer account. This allows the consumer account to be linked with the Amazon DataZone domain to enable data sharing and collaboration between the producer and consumer accounts.
Sign in to the consumer account and go to the Amazon DataZone console in the same AWS Region as the domain. On the Amazon DataZone home page, choose View requests.
Select the name of the inviting Amazon DataZone domain and choose Review request.
Choose Accept association, you should see the Demo_cross_account_domain state as associated in the Associated domains screen
Choose the domain for which you want to enable an environment blueprint.
From the Blueprints list, choose either the DefaultDataLake blueprint
On the Permissions and resources page, for enabling the DefaultDataLake blueprint, for Glue Manage Access role, specify a new role that grants Amazon DataZone authorization to ingest and manage access to tables in AWS Glue and AWS Lake Formation.
Repeat steps 4 to 6 to enable the DefaultDataWarehouse blueprint by choosing DefaultDataWarehouse instead of DefaultDataLake
Add data users to the Amazon DataZone domain
To grant access to the Amazon DataZone data portal from the console for data publisher and data Subscriber IAM users, use the following steps to add them in the User Management section of the Amazon DataZone domain. See Manage users in the Amazon DataZone console for additional details.
Select the Amazon DataZone domain and, in the User management section,chooseAddand selectAdd IAM users.
On the Add users page, choose Current account and add the user ARN of the data producer and choose Add users.
Next chooseAssociated account, and enter the data subscriber user’s ARN and add the user by choosing Add users.
Create the publish project for AWS Glue and Amazon Redshift
This step focuses on creating the publish project for AWS Glue and Amazon Redshift in the producer account. The project will be used to publish data from your data sources to the appropriate AWS services.
Select View domains and select the demo_cross_account_domain.
Choose the Open data portal link and sign in to the data portal.
Choose Create New Project and create a project named Glue_Publish_Project for publishing AWS Glue data assets and create the project under demo_cross_account_domain.
Create another project named Redshift_Publish_Project for publishing Amazon Redshift data assets, also under the demo_cross_account_domain.
Create AWS Glue and Amazon Redshift environments to publish the data assets
In this step, you set up AWS Glue and Amazon Redshift environments in the producer account to share data assets. The required infrastructure, such as the AWS Glue Data Catalog and Redshift cluster for storing data, should already be in place. After setup, this will allow the consumer account to access and use the shared data assets. See Create a new environment for detailed instructions on creating a new environment.
Create the AWS Glue environment and a new AWS Glue table
In the same Amazon DataZone domain demo_cross_account_domain, choose Browse Project and select the Glue_Publish_Project and create Glue_Publish_Environment using the default DataLakeProfile.
Leave the producer_glue_db_name, consumer_glue_db_name and Workgroup_name blank.
Choose Create Environment and wait for the process to complete.
After the environment is created, browse the list of available projects and choose Glue_publish_project.
Next, navigate to the Glue_Publish_Environment, and under Analytics tools, choose Amazon Athena to open the Athena query editor
Choose Open Athena and make sure that Glue_Publish_Environment is selected in the Amazon DataZone environment dropdown at the upper right and that in Data on the left, glue_publish_environment_pub_db is selected as the Database.
Create a new AWS Glue table for publishing to Amazon DataZone. Paste the following create table as select (CTAS) query script in the Query window and run it to create a new table named mkt_sls_table. The script creates a table with sample marketing and sales data.
CREATE TABLE mkt_sls_table AS
SELECT 146776932 AS ord_num, 23 AS sales_qty_sld, 23.4 AS wholesale_cost, 45.0 as lst_pr, 43.0 as sell_pr, 2.0 as disnt, 12 as ship_mode,13 as warehouse_id, 23 as item_id, 34 as ctlg_page, 232 as ship_cust_id, 4556 as bill_cust_id
UNION ALL SELECT 46776931, 24, 24.4, 46, 44, 1, 14, 15, 24, 35, 222, 4551
UNION ALL SELECT 46777394, 42, 43.4, 60, 50, 10, 30, 20, 27, 43, 241, 4565
UNION ALL SELECT 46777831, 33, 40.4, 51, 46, 15, 16, 26, 33, 40, 234, 4563
UNION ALL SELECT 46779160, 29, 26.4, 50, 61, 8, 31, 15, 36, 40, 242, 4562
UNION ALL SELECT 46778595, 43, 28.4, 49, 47, 7, 28, 22, 27, 43, 224, 4555
UNION ALL SELECT 46779482, 34, 33.4, 64, 44, 10, 17, 27, 43, 52, 222, 4556
UNION ALL SELECT 46779650, 39, 37.4, 51, 62, 13, 31, 25, 31, 52, 224, 4551
UNION ALL SELECT 46780524, 33, 40.4, 60, 53, 18, 32, 31, 31, 39, 232, 4563
UNION ALL SELECT 46780634, 39, 35.4, 46, 44, 16, 33, 19, 31, 52, 242, 4557
UNION ALL SELECT 46781887, 24, 30.4, 54, 62, 13, 18, 29, 24, 52, 223, 4561
Go to the Tables and Views section and verify that the mkt_sls_table table was successfully created.
Create the Amazon Redshift publish environment and a new Redshift table
Staying in the same Amazon DataZone domain demo_cross_account_domain, choose Browse Project, to create an Amazon Redshift publish environment, select the Redshift_Publish_Project and create Redshift_Publish_Environment using the default data warehouse profile.
To configure environment parameters, enter the name of your Amazon Redshift cluster or workgroup, specify the database name and enter the AWS Secrets Manager secret ARN for the Redshift cluster or workgroup. You need to make sure that the secret in Secrets Manager includes the following tags. These tags help Amazon DataZone implement proper access control so that only authorized users within the correct Amazon DataZone project and domain can access the Amazon Redshift resource:
For Amazon Redshift cluster: DataZone.rs.cluster: <cluster_name:database name>
For Amazon Redshift Serverless workgroup: DataZone.rs.workgroup: <workgroup_name:database_name>
AmazonDataZoneProject:<projectID>
AmazonDataZoneDomain: <domainID>For more information for creating redshift database user secret in secret manager, see Storing database credentials in AWS Secrets Manager.
Note that the database user you provide in Secrets Manager must have superuser permissions. Data publishers should work with the data administrator to get the details of the Redshift cluster or workgroup, database name, and secret ARN.
The schema is optional.
Choose Create Environment and wait for the process to complete.
Verify that the environment is created successfully without errors.
Browse the list of available projects and select Redshift_publish_project. Navigate to Redshift_publish_environment.
Under Analytics tools, choose Amazon Redshift to open the Amazon Redshift query editor.
Select the Redshift cluster that you want to connect, choose Save and then choose Create Connection using temporary credentials with your IAM identity.
Create a new Redshift table. You can use the CTAS query to create a new table named rs_sls_tbl. Use the provided CTAS script, which creates a table with sample sales data in the datazone_env_redshift_publish_environment schema.
CREATE TABLE "datazone_env_redshift_publish_environment"."rs_sls_tbl" AS
SELECT 146776932 AS ord_num, 23 AS sales_qty_sld, 23.4 AS wholesale_cost, 45.0 as lst_pr, 43.0 as sell_pr, 2.0 as disnt, 12 as ship_mode,13 as warehouse_id, 23 as item_id, 34 as ctlg_page, 232 as ship_cust_id, 4556 as bill_cust_id
UNION ALL SELECT 46776931, 24, 24.4, 46, 44, 1, 14, 15, 24, 35, 222, 4551
UNION ALL SELECT 46777394, 42, 43.4, 60, 50, 10, 30, 20, 27, 43, 241, 4565
UNION ALL SELECT 46777831, 33, 40.4, 51, 46, 15, 16, 26, 33, 40, 234, 4563
UNION ALL SELECT 46779160, 29, 26.4, 50, 61, 8, 31, 15, 36, 40, 242, 4562
UNION ALL SELECT 46778595, 43, 28.4, 49, 47, 7, 28, 22, 27, 43, 224, 4555
UNION ALL SELECT 46779482, 34, 33.4, 64, 44, 10, 17, 27, 43, 52, 222, 4556
UNION ALL SELECT 46779650, 39, 37.4, 51, 62, 13, 31, 25, 31, 52, 224, 4551
UNION ALL SELECT 46780524, 33, 40.4, 60, 53, 18, 32, 31, 31, 39, 232, 4563
UNION ALL SELECT 46780634, 39, 35.4, 46, 44, 16, 33, 19, 31, 52, 242, 4557
UNION ALL SELECT 46781887, 24, 30.4, 54, 62, 13, 18, 29, 24, 52, 223, 4561
Make sure that the rs_sls_tbl table is successfully created.
Publish assets into the common business catalog
In this step, you create and run the Amazon DataZone data sources for AWS Glue and Amazon Redshift. You will then publish the data assets from these data sources.
The Amazon DataZone data sources allow you to connect to various data sources, including databases, data warehouses, and data lakes, and ingest metadata into Amazon DataZone. By creating and running these data sources, you can make your data available for analysis, transformation, and sharing within your organization.
After the data sources are set up, you can publish the data assets from these sources to make them accessible to other users and applications. This process involves mapping the data assets to the appropriate business terms and metadata, making sure that the data is properly described and categorized.
Add an AWS Glue data source to publish the new AWS Glue table.
Choose Select project from the top navigation pane and select the Glue_Publish_Project that you want to add the data source to.
Select the Glue_Publish_Environment.
Choose Create data source. Enter glue-publish-datasource as the name.
Under Data source type, choose AWS Glue.
Under Select an environment, select Glue_Publish_Environment.
Under Data selection, select the AWS Glue database glue_publish_environment_pub_db, enter your table selection criteria as “*“, and then and choose Next.
Leave all other setting as default and choose Next.
For Run Preference, select Run on demand to ingest metadata from the specified AWS Glue tables into Amazon DataZone.
Review and choose Create.
After the data source has been created choose Run. The mkt_sls_table will be listed in the inventory and available to publish.
Select the mkt_sls_table table and review the metadata that was generated. Choose Accept All if you’re satisfied with the metadata.
Choose Publish Asset and the mkt_sls_tabletable will be published to the business data catalog, making it discoverable and understandable across your organization.
Add an Amazon Redshift data source to publish the new Amazon Redshift table.
Choose Select project from the top navigation pane and select the Redshift_Publish_Project that you want to add the data source to.
Choose the Redshift_Publish_Environment.
Choose Create data source. Enter rs-publish-datasource as the name.
Under Data source type, select Amazon Redshift.
Under Select an environment, select Redshift_Publish_Environment.
Under Redshift Credentials, enter the Redshift cluster and secret details provided by the data administrator.
Under Data Selection, select the database dev and schema datazone_env_redshift_publish_environment.
Keep other setting as default and choose Next.
For Run Preference, select Run on Demand.
Choose Save. After the data source is created, choose Run. The data source runs and the rs_sls_tblwill be listed in the inventory and available to publish.
Select the rs_sls_tbl table and review the metadata that was generated. Choose Accept All if you are satisfied with the metadata.
Choose Publish Asset and the rs_sls_tabletable will be published to the business data catalog.
Create subscribe projects for AWS Glue and Amazon Redshift
In this step, you create the projects for subscribing to AWS Glue and Amazon Redshift data assets within your Amazon DataZone domain.
Sign in to the Amazon DataZone console as a data subscriber IAM user using the consumer account.
Choose Associated domains and select the demo_cross_account_domain.
Select the Open data portal link and sign in to the data portal.
Choose Create New Project and create a project named Glue_Subscribe_Project for subscribing to the AWS Glue data assets.
Create another project named Redshift_Subscribe_Project for subscribing to the Redshift data assets.
Create AWS Glue and Amazon Redshift environment profiles
In this step, you will set up the environment profiles and environments for AWS Glue and Amazon Redshift in your Amazon DataZone projects. This will allow you to connect and interact with resources across AWS accounts.
The purpose of environment profiles in Amazon DataZone is to streamline the process of environment creation. By using environment profiles, you can preconfigure essential placement information such as AWS account and AWS Region. In this solution, you will configure environment profiles with placement information pointing to your consumer account.
You will also create an Amazon DataZone environment from the profiles you are about to create. This will provision the necessary resources in the consumer account and establish the connections between the Amazon DataZone domain and the consumer account. After the environments are created, you can work with AWS Glue and Amazon Redshift assets seamlessly across different AWS accounts within your Amazon DataZone ecosystem.
Create an AWS Glue profile and environment
Stay signed in the consumer account’s Amazon DataZone console as a data subscriber IAM, select the Environments tab and then choose Create environment profile.
Configure the fields as follows:
Name: Enter glue_subscribe-env-profile.
Owner: The project where the profile is being created is selected by default in this field. Verify that it’s Glue_Subscribe_Project.
Blueprint: Select Default Data Lake.
AWS account parameters: Enter the consumer AWS account number and select the Region.
Authorized projects: Select All projects.
Publishing: Select Publish from any database.
Choose Create Environment Profile.
On the Create environment page, enter the following:
Name: Enter glue_subscribe_environment.
Verify that the Environment profile is set to glue_subscribe-env-profile.
(Optional) Parameters: Enter the Producer glue db name, Consumer glue db name, and Workgroup name.
Choose Create environment.
It takes a few minutes for the environment to be created. Verify that the environment creation is successful without any errors.
Create a Redshift environment profile and environment
Staying in the consumer account’s Amazon DataZone management console as a data subscriber IAM user, navigate to the Redshift_Subscribe_Project you created previously.
Select the Environments tab and then choose Create environment profile.
Configure the fields as follows:
Name: Enter redshift_subscribe-env-profile.
Owner: Verify that Project is set to Redshift_Subscribe_Project.
Blueprint: Select Default Data Warehouse.
Parameter set: Select Enter my own.
AWS account parameters: Enter the consumer AWS account number and select the Region.
Parameters: Select either Amazon Redshift Cluster or Amazon Redshift Serverless in the consumer account.
AWS Secret ARN: Enter the AWS Secrets Manager secret ARN for the Redshift cluster or workgroup. You need to make sure that the secret in Secrets Manager includes the following tags. These tags help Amazon DataZone implement proper access control so that only authorized users within the correct Amazon DataZone project and domain can access the Amazon Redshift resource.
Note that the database user you provide in AWS Secrets Manager must have superuser permissions. Data publishers should work with the data administrator to get the details of the Redshift cluster or workgroup, database name, and secret ARN.
Redshift cluster name: Enter the name of the Amazon Redshift cluster or Amazon Redshift Serverless workgroup.
Database name: Enter the name of the database within the selected Amazon Redshift cluster or Amazon Redshift Serverless workgroup
Authorized projects: Select All projects.
Publishing: Select Publish any schema.
Choose Create environment profile.
Create an environment from this profile: Create an environment from this profile:
Name: Enter redshift_subscribe_environment.
Verify that the Environment profile is set to redshift_subscribe-env-profile.
Choose Create Environment.
It takes a few minutes for the environment to be created. Verify that the environment creation is successful without any errors.
Subscribe to the AWS Glue and Redshift tables
In this step, you will subscribe AWS Glue and Amazon redshift tables published by the data producer.
Subscribe to the AWS Glue table
Sign in to the Amazon DataZone console of the consumer account using the data subscriber credentials and navigate to the Glue_Subscribe_project you created previously.
Search for the Market Sales Table in the Search bar.
Select the Market Sales Table and choose Subscribe.
In the Subscribe pop-up window, provide the following information:
Project: Enter the name of the project that you want to subscribe to the asset. By default this will be Glue_Subscribe_Project.
Enter a justification for your subscription request.
Choose Subscribe.
Switch to the data publisher role to approve the subscription request, then back to data subscriber after choosing Approve.
Select the Glue_subscribe_project and choose Subscribed Assets. Verify that the Market Sales Table is added to your environment.
Navigate to the Amazon Athena query editor using the link in the project’s home page.
Choose OPEN AMAZON ATHENA.
You will now be automatically routed to the Athena console, make sure that the Amazon DataZone Environment is set to glue_subscribe_environment.
For Database, select glue_subscribe_environment_sub_db.
You should see the mkt_sls_table in the Tables list. Preview the table by choosing the three-dot menu next to the table name and selecting Preview Table
Review the table preview results. You will be able to see all the sales related data from the mkt_sls_table
Subscribe to the Redshift table
Stay signed in to the Amazon DataZone management console as the data subscriber, Choose Select project from the top navigation pane and select the Redshift_Subscribe_project.
Search for Sales Table in the search bar, and select the Sales Table.
In the Subscribe pop-up window, provide the following information:
Project: Enter the name of the project that you want to subscribe to the asset. By default this will be Redshift_Subscribe_Project.
Enter a justification for your subscription request.
Choose Subscribe.
Switch back to the data publisher who is the producer of the Market Sales Table choose Approve.
After the subscription request is approved, switch back to data subscriber.
Select the Redshift_subscribe_project and choose Subscribed Assets. After the Sales Table is added to your environment, you can query the data in the table.
Select the Amazon Redshift link in the right side panel of the project home page and navigate to the Amazon Redshift query editor.
Select Open Amazon Redshift and the Redshift query editor v2 will open in a new tab.
In the query editor, right-click your Amazon DataZone environment’s Amazon Redshift cluster and select Create a connection.
Select Temporary credentials using your IAM identity for authentication.
If that authentication method isn’t available, open Account settings by choosing the gear icon in the bottom left corner, choose Authenticate with IAM credentials and choose Save.
Enter the name of the Amazon DataZone environment’s database to create the connection.
Choose Create connection.
You can now view the Redshift table rs_sls_tbl in the datazone_env_redshift_subscribe_environment.
Execute the following query to make sure the data is accessible
SELECT * FROM "dev"."datazone_env_redshift_subscribe_environment"."rs_sls_tbl";
You will be able to preview the rs_sls_tbl which will show the sale data from the table.
Clean up
To avoid unnecessary future charges, follow these steps:
Organizations often face significant challenges when trying to share data products across multiple AWS accounts. These challenges stem from the complexity of configuring proper cross-account access permissions and roles while maintaining robust data governance and security controls.
You can use the solution described in the post to publish and consume data across AWS accounts and make sure that reliable access and consistent data governance is in place. By combining the power of AWS Glue and Amazon Redshift, you can unlock valuable insights and accelerate your data-driven decision-making processes.
In this post, you followed a step-by-step guide to set up cross-account data sharing using Amazon DataZone domain association. You learned how to publish data assets from a producer account. You also learned how to subscribe to and query the published assets from a consumer account. You can optionally use AWS Lake Formation access monitoring to view permissions and data access activities. AWS Lake Formation uses AWS CloudTrail for historical analysis and CloudTrail retains logs for 90 days by default.
Now that you’re familiar with the elements involved in cross-account data sharing using Amazon DataZone and your choice of analytical tool, you’re ready to try it with multiple accounts.
About the Authors
Arun Pradeep Selvaraj is a Senior Solutions Architect at AWS. Arun is passionate about working with his customers and stakeholders on digital transformations and innovation in the cloud while continuing to learn, build and reinvent. He is creative, fast-paced, deeply customer-obsessed, and uses the working backwards process to build modern architectures to help customers solve their unique challenges. Connect with him on LinkedIn.
Piyush Mattoo is a Senior Solution Architect for the Financial Services Data Provider segment at Amazon Web Services. He’s a software technology leader with over a decade of experience building scalable and distributed software systems to enable business value through the use of technology. He has an educational background in Computer Science with a master’s degree in computer and information science from University of Massachusetts. He is based out of Southern California and current interests include camping and nature walks.
Mani Yamaraja is a Senior Customer Solutions Manager for Financial Services Data Provider segment at Amazon Web Services. He has over a decade long experience working with financial services customers enabling their digital transformation journey. Mani adopts a customer centric approach and provides technology solutions working backwards from customer’s business goals. He is passionate about the financial services industry and helps the customers accelerate their cloud based transformation using the proven mechanisms of AWS.
Generative AI applications often involve a combination of various services and features—such as Amazon Bedrock and large language models (LLMs)—to generate content and to access potentially confidential data. This combination requires strong identity and access management controls and is special in the sense that those controls need to be applied on various levels. In this blog post, you will review the scenarios and approaches where you can apply least privilege access to applications using Amazon Bedrock. To fully benefit from the guidance in this post, you need an understanding of AWS APIs, AWS Identity and Access Management (IAM) policies, and AWS security services.
Let’s start by defining the principle of least privilege (PoLP): The PoLP is a security concept that advises granting the minimal level of access—or permissions—necessary for users, programs, or systems to perform their tasks. The main idea is that the fewer permissions an entity has, the lower the risk of malicious or accidental damage. Applying the PoLP to your use of AWS serves two purposes:
Security: By limiting access, you reduce the potential impact of a security incident. If a user or service has minimal permissions, the scope for any damage can be significantly reduced.
Operational simplicity: Managing permissions can become complex if not properly managed and maintained. Applying the PoLP to your access controls early helps keep configurations as manageable as possible. Finally, there are regulatory frameworks that require separation of duty between roles and a documented strategy for access controls, which can be achieved in part by adhering to the PoLP.
Amazon Bedrock is a fully managed AWS service that makes high-performing foundation models (FMs) available through a single unified API. You use Amazon Bedrock through AWS APIs, which expose actions for the control plane and administration such as the configuration of Amazon Bedrock Guardrails and Amazon Bedrock Agents, in addition to data plane functional actions such as inference.
Generally, the path to using Amazon Bedrock for a production workload includes the following stages:
Model selection: Decide on the required features (Retrieval Augmented Generation (RAG), fine-tuning, and so on), evaluate and select a model, and approve a EULA if necessary.
Model adaptation: Prompt engineering, integration of Amazon Bedrock into the application, and addition of model customization if desired.
Model testing: Validate and test the solution.
Model operation: Deploy the solution and make it available. Monitor and operate the solution.
In the following sections, we go through each phase and outline how you can apply the PoLP.
Model selection
In this phase, you choose the features and models that are needed to fulfill your requirements and define how you will apply the PoLP. These can include, for example, model customization, Retrieval Augmented Generation (RAG) or the use of agents.
Security should be integrated into the design so that the defined controls can be implemented during the development phase. One approach to define the necessary security controls is threat modeling. Doing this exercise early in the process will simplify the upcoming phases. The results can be used later to decide on the required guardrails, potential changes to the architecture, and test cases.
In this phase, you will also decide how the solution should be deployed. Customers typically operate in a multi-account setup; therefore, the selection of target organizational units (OUs) and accounts is required. We recommend creating a new OU for generative AI applications. For details, see the deep-dive chapter on generative AI in the AWS Security Reference Architecture. We will talk later about service control policies (SCPs) and how they can be used to restrict permissions. The generative AI OU is a good place to enforce those guardrails.
Amazon Bedrock provides access to a variety of high-performing FMs from leading AI companies such as AI21 Labs, Anthropic, Cohere, Meta, Mistral AI, Stability AI, and Amazon. In this stage, you need to choose the models that you’ll use and approve them. With a third-party FM, approval might include accepting a EULA. You can limit identities and the models that they can subscribe to in order to follow compliance with EULAs that have been reviewed by your legal department. The following is an example of an SCP that allows account operators to enable all Anthropic FMs and a single Meta Llama FM.
While this approach works well if you’re only allowlisting actions, you might have highly privileged users that already have broad access to AWS Marketplace APIs. In such a case, you can follow a deny all except a few approach. Such a policy, using the same models as before, would look like the following example:
In this phase, the solution is built—that is, code is written. This is mostly identical to traditional software development, however there are some areas specific to generative AI, such as prompt engineering, prompt guardrails, model monitoring, and agent design. In this post, we focus solely on the identity and access management aspects.
Adaptation is the phase where the detailed permission sets are created. Data perimeters can be used as a conceptual tool to define and implement guardrails. Because data perimeters are typically coarse grained, they aren’t sufficient to achieve the goal of the PoLP. However, in combination with fine-grained policies, they support a defense-in-depth approach. The following data perimeters exist:
Identity: Only trusted identities are allowed in my network, only trusted identities can access my resources.
Resource: My identities can access only trusted resources, only trusted resources can be accessed from my network.
Network: My identities can access resources only from expected networks, my resources can only be accessed from expected networks.
For applications that use Amazon Bedrock, you can use a virtual private cloud (VPC) network construct with Amazon Virtual Private Cloud (Amazon VPC) to host them. Doing so means that you can then use AWS PrivateLink to create VPC endpoints for both data and control plane APIs. Using PrivateLink to create endpoints, it’s possible to provide access to Amazon Bedrock for VPC-bound compute resources (such as Amazon Elastic Compute Cloud (Amazon EC2), or AWS Lambda) without the need for an internet gateway. In other words, you can deploy these resources entirely in private subnets. By using resource-based policies on these endpoints, you can restrict the principals, actions, resources, and conditions related to making API calls.
Let’s assume you have a VPC with an EC2 instance running in a private subnet hosting an application that uses Amazon Bedrock model invocations and have created an interface VPC endpoint to connect to the Amazon Bedrock data plane. The EC2 instance is configured to use an instance profile using the <rolename> IAM role and needs to be able to invoke a single Anthropic’s Claude Instant FM through an Amazon Bedrock InvokeModel API call. You can apply the PoLP to the containing VPC, and thus the EC2 instance, with a custom policy on the Amazon Bedrock interface VPC endpoint. To use the following policy in your own account, replace the default interface VPC endpoint policy with the following example, replacing <rolename> with the role you want to allow and <account-id> with your 12-digit account number.
You can define the allowed models that can be used in Amazon Bedrock directly in the policy. However, if you have multiple applications that use Amazon Bedrock, you might have to update multiple policies when a new model is allowed to be used. To complement the data perimeter approach, you can add an SCP to limit the models that can be used for inference. Because Amazon Bedrock is using a simple API (InvokeModel and Converse) for inference, a condition element in an IAM policy can be used to deny the use of unapproved models. Note that while the two policies (the SCP and the VPC endpoint policy) look similar, they work differently: VPC endpoint policies are enforced provided that the network path through PrivateLink is enforced; SCPs are applied to principals within the account or OU they’re attached to. Be extra careful if the calling identity resides outside of your account, because only the VPC endpoint policy will apply.
For example, imagine that you wanted to block the invocation of all Anthropic FMs across your organizations within AWS Organizations, in all AWS Regions. The following SCP example applied to the OUs or AWS accounts in scope would achieve that outcome:
A solution built on Amazon Bedrock might include model customization. The common denominator of the different customization approaches is that they include data, which is assumed to be confidential and thus in-scope for applying the PoLP. Here, we take a scenario where data is stored in Amazon S3 and can be encrypted using a customer managed AWS Key Management Service (AWS KMS) key.
Measures can be taken on multiple levels, as conceptualized in data perimeters: network, identity, and resource. Amazon Bedrock model customization uses service roles, which allows you to apply fine-grained and least-privilege access end-to-end. These service roles will be assumed by the Amazon Bedrock service principal, so that it can execute actions on your behalf. To allow the Amazon Bedrock service principal to assume the role in your account, you need to attach a trust policy to the role.
Let’s imagine that you’re running an Amazon Bedrock customization job in the us-east-1 (N. Virginia) Region. Using the following trust policy example will allow only the Amazon Bedrock service principal to assume your role.
Make sure to replace <account-id> in the preceding example trust policy with your own 12-digit account number. The policy contains a condition that provides cross-service confused deputy prevention by adding the aws:SourceAccount condition. The confused deputy problem is a situation where an entity that doesn’t have permission to perform an action can coerce a more privileged entity to perform the action. In AWS, cross-service impersonation can result in the confused deputy problem. Cross-service impersonation can occur when one service (the calling service) calls another service (the called service). AWS provides tools to help you protect your data for all services with service principals that have been given access to resources in your account. Both the aws:SourceArn and aws:SourceAccount global condition context keys in the role’s trust policy limit the permissions that Amazon Bedrock gives another service (in the preceding case, to the customization job) to the resource. aws:SourceArn is the more restrictive approach here, because it defines the specific source of the assume request, and not just the AWS account.
You should provide only the permissions that are required to fulfill the model customization task. For example, imagine that you want to limit access to your training data, the validation data bucket, and the output bucket (where Amazon Bedrock will deliver output metrics). The following policy, attached to that same service role, provides only those permissions. Replace the <training-bucket> placeholder with the bucket name that contains your training data, <validation-bucket> with your validation bucket, and <output-bucket> with the bucket where you want to store metrics.
Complementing this approach, we recommend using a VPC for the model customization job to restrict access to the training data. Technically, this again involves a VPC endpoint resource policy because the network is using interface VPC endpoints to access your S3 bucket. This allows you to define another network control, specifically an S3 bucket policy that only allows access through a specific VPC endpoint. So, for the situation where you want to limit access for the customization job itself, you can apply a bucket policy such as the following example, replacing <training-bucket> with the bucket name that contains your training data, and <vpce-id> with the ID of the VPC endpoint that resides in your VPC:
In addition, you would restrict the principals that can access your VPC endpoint and the actions they’re allowed to take in Amazon S3. For simplicity, we’re omitting an example policy here because it’s very similar to the one we have in the Amazon Bedrock invocation section earlier in this post.
If you need to enforce encryption in Amazon S3 using a customer managed AWS KMS key (SSE-KMS), you will need to do the following:
Update the bucket policy with a statement denying unencrypted content being uploaded.
Update the KMS key policy to allow the service role to decrypt and describe the key.
The next policy example should be added to the bucket policy and demonstrates how to deny unencrypted objects being added to an S3 bucket. Again, replace <training-bucket> with the name of the S3 bucket that contains your training data:
Finally, in the KMS key policy, you need a statement similar to the following to allow the Amazon Bedrock service role access to the KMS key. Replace <account-id> with your 12-digit account number and <bedrock-service-role> with the role you created, which will be assumed by the Amazon Bedrock service principal. Make sure to only give the required access to decrypt data with the KMS key to the IAM role:
Amazon Bedrock can also encrypt a customized model with a customer managed KMS key. Amazon Bedrock uses KMS key grants to encrypt the customized model and to decrypt it later when you deploy it for inference. Therefore, you need to grant the same IAM role permissions to create KMS key grants in the KMS key policy. The KMS key you use for this purpose is typically different than the one you used to encrypt the training data to allow fine-grained permissions on both keys.
So, let’s imagine that you want to use two different roles to encrypt and decrypt the customized models. To allow the role that executes the model customization job to use your KMS key, you need to add the following policy statements to the KMS key policy, replacing <account-id> with your 12-digit account number, <region> with the Region where you run Amazon Bedrock, <bedrock-model-customization-role> with the role name you use to run the model customization job, and <invocation-role> with the name of the role you use for inference.
By using KMS key grants, you can revoke the permissions you granted to the service role after the customization job is done, thus reducing the permissions to least privilege. Also, Amazon Bedrock uses secondary KMS key grants for model encryption, which means that they’re automatically retired as soon as the operation that Amazon Bedrock performs on behalf of the customer is completed. The Encryption of model customization jobs and artifacts describes in more detail how grants are used.
To completement these IAM policy guardrails, you can add network controls to reduce the scope of the permissions of the process. Because we focus on IAM policies in this post, we won’t go into details here but only mention how the process works.
When you start a model customization job, a model training job is triggered within the model deployment account. The training job takes a base model from its S3 bucket, then connects to the S3 bucket that holds the customization training data to start the customization. This can be done through your VPC, where you specify a VPC configuration such as subnets and security groups, and the training job places an elastic network interface (ENI) into that VPC as specified. A request to the S3 bucket to read the training data now adheres to whatever routing rules are present in the VPC for that ENI. The VPC routing and security group attached to the ENI can be used to limit networking access to the model customization job.
Amazon Bedrock Agents
Amazon Bedrock Agents offers the capability to build and configure autonomous agents for applications. You can find more information about Amazon Bedrock Agents in Automate tasks in your application using AI agents.
Using an Amazon Bedrock agent also provides certain security properties that are applied to an inference task. For example, at the time of writing, there is no IAM condition key for the bedrock:InvokeModel API to require an Amazon Bedrock guardrail being attached to that same call. However, you can require that inferences are invoked through a call to an agent that has specific Amazon Bedrock guardrails configured.
Let’s say that you want to create a role that explicitly is only allowed to invoke Amazon Bedrock models through a specific Amazon Bedrock agent. The following IAM principal permissions policy example implies that the Amazon Bedrock agent specified has approved Amazon Bedrock guardrails configured. Again replace <region>, <account-id>, <bedrock-agent-id>, and <bedrock-agent-alias-id> with the values of your Amazon Bedrock agent.
Provided that the Amazon Bedrock agent is configured by a systems administrator or operator with an approved Amazon Bedrock guardrail, the principal with the preceding policy attached to it will be able to invoke it with a prompt, and won’t directly invoke an Amazon Bedrock model. This strategy for making sure that Amazon Bedrock guardrails are applied to all Amazon Bedrock invocations is currently not possible with the bedrock:InvokeModel and bedrock:InvokeModelWithResponseStream APIs, because they don’t have a condition key to match an Amazon Bedrock guardrail to. In addition, denying bedrock:InvokeModel and bedrock:InvokeModelWithResponseStream also denies the Converse APIs and StartAsyncInvoke APIs, so there’s no need to add these separately to the Deny statement.
Because this strategy verifies the use of specific Amazon Bedrock guardrails, you can also use it for the enforcement of specific prompts, IAM service roles, knowledge bases, prompt and completion content restrictions, KMS keys, and FMs in inference invocations. For this approach to be effective, you need to also limit the principals that can create and update Amazon Bedrock agent configurations. Again, this can be restricted using an IAM policy, which is attached to only specific principals.
The following is an example IAM policy statement that gives an attached IAM principal the ability to update the configuration of a specific Amazon Bedrock agent, replacing <region>, <account-id>, and <agent-id> with the Region, account and identifier, and agent identifier that you’re using. If you want this to apply to all agents, replace <agent-id> with an asterisk (*).
Where agents aren’t suitable, users or applications performing inference against the Amazon Bedrock models will need permissions to call the bedrock:InvokeModel, bedrock:InvokeModelWithResponseStream, or bedrock:CreateModelInvocationJob actions. In these cases, it can be desirable to limit the target models, following an allowlisting approach. Also, such permissions would only be attached to roles or applications that need to use them.
The following is an example of such a policy that restricts invocation to Anthropic’s Claude Instant.
You can include detective or reactive controls using Amazon CloudWatch EventBridge rules to detect model invocations that don’t use appropriate Amazon Bedrock guardrails, but that’s outside the scope of this post.
Model testing
Testing is the last step before the solution is deployed. Types of tests include unit tests, integration tests, user acceptance tests, penetration testing, and more. In this phase, you can again verify that the permissions that were assigned are indeed least privilege.
Especially in functional tests where data is involved, it’s important to consider that the data used for testing might be confidential. This is typically true when no synthetic test data is generated for the testing process. Controls to restrict access to the data and logs that are produced and might contain pieces of this data need to be the same as you will apply in a production environment. That you are only testing the solution doesn’t automatically mean that data access controls aren’t needed.
As discussed earlier in this post, controls are activated not only on identities, but also on the network and on resources. All of these should be validated and their effectiveness confirmed in this phase. Tests include but aren’t limited to:
Validate that you can only perform allowed actions in Amazon Bedrock through VPC endpoints, and that actions that don’t use VPC endpoints are blocked.
Validate the effectiveness of the resource policies on VPC endpoints by making sure that they can only be used by authenticated and authorized principals.
When using knowledge bases, validate that only the Amazon Bedrock service principal can access them.
When using Amazon Bedrock guardrails, evaluate their effectiveness. Because of the nature of generative AI applications, the diversity in input and output data can be big. Therefore, make sure to test guardrails with a reasonably large number of prompts.
If model invocation logging is activated, validate that logs are correctly written and protected with IAM permissions and encryption.
Validate that only the required personnel can access these logs, because they might contain sensitive data. Consider automatically sanitizing and forwarding them to a new CloudWatch log group.
Validate that all relevant Amazon Bedrock API calls are being properly logged in AWS CloudTrail, and that you can effectively monitor and alert on any suspicious activity.
Make sure that sensitive information—such as prompts and responses—isn’t being stored in the CloudTrail logs or in any trace output.
The threat modelling that you have potentially created in the design phase can provide valuable inputs that you can use for security-related test cases.
Model operation
In this phase, the solution is finally deployed into production. Operators need Amazon Bedrock control plane permissions to provision and manage Amazon Bedrock resources such as agents, guardrails, prompt libraries, and knowledge bases. They should only get the control plane permissions to provision and manage the Amazon Bedrock features that are being used. These same operators should have access to invoke or configure the Amazon Bedrock service features or their resources (Amazon Bedrock Agents, Amazon Bedrock Guardrails, and prompt libraries) only through an authorized pipeline. This immutable infrastructure approach restricts human users from creating situations or configurations that would otherwise allow unapproved access to the data plane, untracked changes to the control plane, or potentially disruptive updates to your application.
Alternatively, to reduce the assigned permissions to the absolute minimum, automated deployments using pipelines and pipeline roles can be used. This will not only provide versioned infrastructure but also adheres to PoLP by not providing access to human identities.
After deployment, the solution is live and being accessed by real users. At this point, topics such as monitoring, logging, and incident response become relevant. While Amazon Bedrock by default doesn’t store inference or response data, it’s recommended that you activate logging of those elements to constantly verify the accuracy of your generative AI application.
By using this solution, you reduce access to a minimum in the following areas:
Logged prompts and responses
Data available through knowledge bases, RAG, or similar sources
The ability to change the infrastructure
Use multiple, dedicated, least privileged roles for each task. This helps reduce the permissions scope to a minimum. Also, because least privilege enforces using a specific role for a specific task, it reduces the risk of unintended changes by requiring the assumption of a specific role.
By following the AWS Security Reference Architecture, security monitoring data is consolidated in a central security account. This allows a comprehensive, central overview of the security posture of your infrastructure.
Logging sensitive information
An important operational aspect is logging potentially sensitive data that’s sent to or received from the LLM. While Amazon Bedrock doesn’t store prompts or responses, you can use model invocation logging to collect invocation logs, model input data, and model output data for all invocations in your AWS account used in Amazon Bedrock. Model invocation logging isn’t enabled by default. After it’s enabled, prompts, completions, or both for all invocations of all approved models are then logged to the configured log destination. Valid log destinations for prompt and completion logs are Amazon S3 and CloudWatch. When writing logs to these destinations, they can optionally be encrypted using a supplied KMS key.
The contents of these logs might contain sensitive information in the prompt provided by the user or the reply generated by the model. As such, access to these logs should be restricted to personnel and machine processes that require and are authorized to access this classification of data. There are strategies such as using Amazon Macie on the Amazon S3 logs and CloudWatch Logs data protection capabilities to detect, monitor, and redact this sensitive information from logs, but that’s outside the scope of this post.
Even with Amazon Bedrock guardrails in place, the contents of these logs contain the pre-guardrailed user input, and so you must assume that these prompt and completion logs contain sensitive information. In this case, best practice is to encrypt log data with a KMS key, apply a data protection policy to the log group, and define at least three IAM roles:
BasicCompletionLogReviewer: An IAM role whose sole purpose is to access and review the redacted version of these logs.
SensitiveDataCompletionLogReviewer: A restricted IAM role whose sole purpose is to access and review the unredacted version of these logs.
CompletionLogAdmin: A restricted IAM role whose sole purpose is to create, view, and delete data protection policies that can send audit findings to Amazon S3 and CloudWatch destinations.
To allow reading log events in a specific log group, use a policy such as the following and attach it to the BasicCompletionLogReviewer role, replacing <region>, <account-id>, <log-group-name>, and <alias-name> with values that match your CloudWatch log group and the KMS key that encrypts it.
With an active data protection policy in place, the preceding policy won’t allow access to the unredacted version of these logs. To allow access to the unredacted versions to the SensitiveDataCompletionLogReviewer role, you need to add an additional action, replacing <region>, <account-id>, <log-group-name>, and <alias-name> with values that match your CloudWatch log group and the KMS key that encrypts it.
The policy for the CompletionLogAdmin role requires different permissions; the following sample policy allows a user to create, view, and delete data protection policies that can send audit findings to all three types of audit destinations. It doesn’t permit the user to view unmasked data. This policy will look like the following example, replacing <delivery-stream-id>, <bucket-name>, <log-group-name>, and <alias-name> with the values that match your setup. Note that this includes a statement that explicitly denies the attached role access to decrypt the logs with the configured KMS key, aligning with the PoLP:
This approach helps to avoid inadvertent access to or exposure of this sensitive data source and upholds the PoLP by separating duties.
Review IAM permissions on a periodic basis
Managing permissions is an ongoing effort because requirements and functionality change over time. Therefore, we recommend regularly reviewing the assigned permissions and verifying that they aren’t overly permissive. For example, if you have a Lambda function that makes API calls to Amazon Bedrock, and changes are made to that function that require additional permissions (perhaps the use of a new model), then it’s acceptable to update the policy attached to the IAM role that the function uses. It’s not always obvious that permissions for using the earlier model are still needed in the same policy; or permissions might be widened unnecessarily to include all models. When applying the PoLP, it’s important that policies be tested at the time they’re deployed to make sure that they meet the exact application needs and no more, but also that the presumed needs are reviewed periodically.
Using AWS IAM Access Analyzer, you can review and simulate proposed changes to IAM policies to ensure their suitability for a given application or function. You can also use IAM Access Analyzer to review unused permissions over time. This gives system operators an opportunity to inspect and then inform the removal of unused permissions in policies used with Amazon Bedrock applications. Remember that some permissions are dormant and ready for periodic use, such as incident response, recovery and other rare use cases, so your review shouldn’t assume that an unused permission is unnecessary, but an opportunity to review the need for the permission.
Finally, align monitoring of new Amazon Bedrock APIs with your IAM strategy. Especially when using denylisting approaches, it’s important to consider that services will announce new APIs, capabilities, and FMs over time. An example for this was the announcement of the new Converse API. This API provides functionality similar to Invoke, but in a consistent and thus simpler way. Considering such changes is therefore an integral part of your regular policy review processes.
Strong identity and access management is a journey, not a one-time action.
Conclusion
In this post, we have demonstrated some ways that you can apply the principle of least privilege (PoLP) to large language model (LLM)-based applications that use Amazon Bedrock. We have discussed the security considerations of each phase of the development lifecycle and provided examples that you can use as a starting point to implement your own PoLP strategy. It’s important that security doesn’t start late in the process; think about risks and the required actions as early as possible to make sure that your strategy is effective when your application goes live.
Finally, remember that the field of generative AI is moving quickly. We believe that it has the potential to transform virtually every customer experience. From a security perspective, this means that the threat landscape will change and evolve over time. Make sure to constantly adapt to new risks; evaluate and integrate them into your PoLP strategy.
Your AWS account team and specialists are happy to assist you on this journey.
If you have feedback about this post, submit comments in the Comments section below. If you have questions about this post, contact AWS Support.
Customers demand organizations to anticipate and seamlessly fulfill their needs, engaging them with personalized content when, where, and how they prefer. They yearn for context-sensitive, dynamic interactions with nuanced conversations across all communication channels. Organizations are under growing pressure to modernize customer experience workflows to drive loyalty and improve operational efficiency. Leveraging the latest advancements in Generative AI (GenAI), such as hyper-personalization and Agentic AI, presents new challenges. Organizations require a scalable, reusable architecture to integrate GenAI into their customer engagement systems without a complete system overhaul, amid disparate solutions they currently operate.
This blog post explores how to build an AI-powered modern communications hub using open-source GitHub samples that integrate SMS/MMS and WhatsApp services with GenAI capabilities. Organizations can create innovative AI-powered customer experiences with a quick proof-of-concept without disrupting existing systems.
In combination with Vector Databases and Retrieval Augmented Generation (RAG), GenAI makes it possible to reorganize knowledge into a single system and query from a single user interface through natural language conversation with a chatbot or virtual assistant. Funneling customer communications through a multi-channel communications hub linked with GenAI capabilities helps unify customer engagement mechanisms and streamlines the creation of rich customer experiences. Customers meet AI agents and Q&A bots on the communication channel that is convenient to self-serve their needs. Organizations can build communications-channel-agnostic customer experiences while collecting channel engagement event and conversational data into a centralized data store for real-time insights, ad-hoc queries, analytics, and ML training.
Solution overview
In the core of the solution is the Modern Communications Hub that connects digital communication channels with key GenAI services, like Amazon Bedrock and Amazon Q, along with AWS ML, database, storage, and serverless computing services.AWS End User Messaging and Amazon SES provide API level access to digital communication channels, offering secure, scalable, high-performance, and cost-effective services for enterprise applications to exchange SMS/MMS, WhatsApp, push and voice notifications, and email with customers.
A collection of open-source sample code, published in the AWS-samples GitHub repository, illustrates how to facilitate generative conversations on SMS/MMS and WhatsApp channels. This will be extended to include email services. Two key components form the foundation of the GenAI Integration Samples: the Multi-channel Chat with AI Agents and Q&A Bots and the Engagement Database and Analytics for End User Messaging and SES. We will simply refer to these as the Conversation Processor and Engagement Database in the solution diagram.
The Conversation Processor receives customer messages via AWS End User Messaging and Amazon Simple Email Service (SES), stores the conversation details, and invokes the relevant Amazon Bedrock Agent. Amazon Bedrock Agents use Large Language Models (LLMs) and knowledge bases to analyze tasks, break them into actionable steps, execute those steps or search the knowledge base, observe outcomes, and iteratively refine their approach until completing the task along with a response. Alternatively, the Conversation Processor can function as a Q&A bot in which case it uses Amazon Bedrock Knowledge Bases along with its RAG feature to generate an LLM answer and send back on the same channel as the customer’s message.
The Engagement Database collects and combines customer engagement data and conversational logs from across communication channels, storing the information in a centralized data lake on Amazon S3. By converting the data into a common, canonical format, the solution simplifies querying and analysis of these inbound events. A Lambda Transformer function leverages Apache Velocity Templates to transform the incoming JSON data, enabling real-time insights.
The raw event data stored in the Amazon S3 data lake can then be fed into other AWS services for further processing. For example, the data can flow into Amazon Connect Customer Data Profiles or Amazon SageMaker to support machine learning model training. Data analysts can use Amazon Athena to issue direct queries for detailed ad-hoc reporting, or to send the data to Amazon QuickSight for advanced visualizations and natural language querying capabilities through Amazon Q in QuickSight.
Amazon Bedrock provides core GenAI capabilities such as LLMs, Knowledge Bases, Retrieval Augmented Generation (RAG), AI agents, and Guardrails, to understand customer asks, determine what action to take, and what to communicate back. Amazon Bedrock Knowledge Bases provide organization specific business knowledge and reasoning, while Amazon Bedrock Agents automate multistep tasks by seamlessly connecting with company systems, APIs, and data sources.
Prerequisites
The following prerequisites are necessary to build your modern communications hub:
An AWS account. Sign up for an AWS account at AWS website if you don’t have one.
AWS End User Messaging Configuration: You’ll need to configure the necessary origination identity in the AWS End User Messagingservice to deliver messages via SMS or WhatsApp. If configuring SMS, a registered and active SMS Origination Phone Number must be provisioned in AWS End User Messaging SMS. (Within the United States, use 10DLC or Toll-Free Numbers (TFNs). If configuring WhatsApp, an active number that has been registered with Meta/WhatsApp should be provisioned in AWS End User Messaging Social.
Amazon Bedrock models: Bedrock Anthropic Claude 3.0 Sonnet and Titan Text Embeddings V2 enabled in your region. Note that these are the default models used by the solution, however, you are free to experiment with different models.
Docker Installed and Running – This is used locally to package resources for deployment.
Node (> v18) and NPM (> v8.19) installed and configured on your computer
AWS CDK (v2) installed and configured on your computer.
Deploy the Conversation Processor and Engagement Database
Deploy the following two solutions. While not required, it is best to deploy them in this order, as outputs from the Engagement Database can be used in the Multi-Channel Chat example:
Each solution contains detailed instructions to deploy the required services using the AWS Cloud Development Kit (CDK). The first Engagement Database solution will create an Amazon Data Firehose stream that can be used as an input to the second Multi-Channel Chat application so that data can be stored and queried in the Engagement Database.
Multi-Channel Chat with AI Agents and Q&A Bot Data Sources This solution demonstrates how users can interact with three different knowledge sources. You may not need all of three, however this should serve as a good example to build the right knowledge source for your particular use-case:
Build your Knowledge Bases on Amazon Bedrock using Amazon S3. By default, the solution will create Knowledge Bases using an Amazon S3 Bucket as the data source. This solution allows you to upload documents to an Amazon S3 bucket to populate the knowledge base.
NOTE: The starter project creates an S3 bucket to store the documents used for the Bedrock Knowledge Base. Please consider using Amazon Macie to assist in the discovery of potentially sensitive data in S3 buckets. Amazon Macie can be enabled on a free trial for 30 days, up to 150GB per account.
Amazon Bedrock Agents: Optionally enable your users to chat with an Amazon Bedrock Agents. Agents have the added benefit of supporting knowledge bases for answering questions and walking users through collecting the information needed to automate a task such as making a reservation. Sample agents are available in the Amazon Bedrock Agent Samples repository. Note that you will need to have an Amazon Bedrock Agent created in your region prior to deploying the solution.
Conclusion
A Modern Communications Hub, loosely coupled with core Generative AI services, will establish a composable foundation to build communication-channel-agnostic customer experiences on. Build one by leveraging the GenAI Integration Samples, Conversation Processor and Engagement Database, combining with the secure, scalable, high-performance, and cost-effective digital communication services by AWS End User Messaging and Amazon SES. This will provide a single point of conversational access to knowledge bases and agentic AI capabilities on Amazon Bedrock. Start experimenting with AI-powered customer experience innovations with a quick proof-of-concept that won’t interfere with your present customer engagement setup.
If you’d like to skip directly to the detailed mapping between the CISA guidance and AWS security controls and best practices, visit our Github page.
Implementing CISA’s enhanced visibility and hardening guidance for communications infrastructure
In response to recent cybersecurity incidents attributed to actors from the People’s Republic of China, a number of cybersecurity agencies led by the U.S. Cybersecurity and Infrastructure Security Agency (CISA) have jointly released comprehensive guidance for securing communications infrastructure. As communications service providers (CSPs) migrate their workloads to the cloud, they must take steps to implement these security measures effectively in cloud environments.
This blog post describes how CSPs can use Amazon Web Services (AWS) capabilities to implement this guidance while benefiting from the advantages of the cloud.
The guidance focuses on two key domains:
Strengthening visibility: Enabling security teams to monitor, detect, and respond to potential threats through comprehensive visibility into digital assets
Hardening systems and devices: Implementing robust security controls and configurations to minimize vulnerabilities and help prevent unauthorized access
Overview of fundamental cloud concepts
Before exploring the specific guidance in this post, it’s important to understand how security recommendations apply differently to public cloud environments than to private infrastructure. A common tendency in the telecommunications industry is to treat public clouds as merely scaled-up versions of private clouds. This can result in a misunderstanding of security capabilities and underutilization of cloud-native security features of the public cloud.
The fundamental difference lies in how public clouds are architected—specifically for multi-tenancy, with strong tenant isolation as a cornerstone of their design. In AWS, virtual resources are isolated by default and require explicit configuration to interconnect. For example, when you create a virtual private cloud (VPC) with Amazon VPC, this logically isolated network does not permit inbound or outbound traffic until specific routes and ports are deliberately configured. Similarly, Amazon Simple Storage Service (Amazon S3) buckets are private by default, requiring explicit configuration to grant access. This isolation extends to the core of our virtualization infrastructure through the AWS Nitro System, which provides unprecedented workload isolation—even AWS operators with the highest privileges have no technical access to customer workloads. Furthermore, data moving between Nitro System based virtual machines or across our global backbone network is automatically encrypted, providing additional layers of protection beyond customer-implemented encryption.
This secure-by-design and secure-by-default philosophy permeates throughout AWS service design and operations. It isn’t merely a design choice—it’s a business imperative driven by the critical need for operational resilience and customer trust in the public cloud model. Our commitment to principles of this sort is reflected in our participation as a signatory to CISA’s Secure by Design Pledge.
When AWS customers operate in the public cloud, understanding the shared responsibility model is paramount. This model clearly delineates security responsibilities: AWS is responsible for security of the cloud, while customers are responsible for security in the cloud. This division of responsibilities significantly reduces your operational burden, because AWS assumes responsibility for securing everything about and inside the cloud services it provides, all the way down to the physical protection of data centers. As a result, you can concentrate your security resources where they matter most—protecting your applications and workloads—while AWS handles the undifferentiated heavy lifting of infrastructure security.
This shared responsibility model becomes even more advantageous when considering the economies of scale inherent to public cloud operations. The massive scale of AWS allows us to invest more in securing the foundations than a single enterprise could achieve independently, creating a security multiplier effect that benefits all customers. A compelling example of this scale advantage is our comprehensive threat intelligence program, which deploys honeypot sensors throughout our global network. These sensors observe more than 100 million potential threat interactions and probes daily. Using artificial intelligence and machine learning (AI/ML), we analyze this information and take swift, often automated actions to mitigate threats. In the first half of 2023 alone, this program enabled us to dismantle the sources of approximately 230,000 Layer 7 distributed denial of service (DDoS) events. We also provide this intelligence to customers through services like Amazon GuardDuty, extending the benefits of our scale to our customers.
The scale of AWS operations not only enables exemplary threat intelligence, but also necessitates extensive automation of our security operations. Several routine tasks, such as feature and patch deployments and configuration updates, are fully automated through deployment pipelines. Automation has the added benefit of taking humans out of the loop, thereby decreasing opportunities for mistakes.
Our scale also facilitates our comprehensive compliance with security standards across multiple industries and jurisdictions. Our global presence and diverse customer base necessitate adherence to the most stringent security requirements worldwide. Through the AWS Compliance Program, we’ve achieved 143 security standards and compliance certifications, ranging from ISO standards for cloud security and privacy to industry-specific regulations in finance and healthcare, as well as government security programs. This includes independent verification of our claims on the isolation properties of our Nitro System virtualization infrastructure. Consequently, you benefit from this scale-driven compliance, gaining access to a secure, certified infrastructure that implements state-of-the-art security systems.
These are a few reasons why, in a blog post titled Why cloud first is not a security problem, the UK’s National Cyber Security Centre concluded that “using the cloud securely should be your primary concern – not the underlying security of the public cloud.”
Private clouds, on the other hand, are typically within the control of a single organization and are single-tenanted, offering relatively weak workload isolation. Virtual resources in private clouds usually default to being interconnected upon creation, and so require explicit steps to increase isolation. Manual operations, with their opportunities for mistakes as well as potential involvement of threat actors, are often still a large part of private cloud workflows. Rarely do they undergo the level of security scrutiny that public clouds are routinely subjected to. These, and other differences, mean that security risks in each offering are inherently different, so correspondingly distinct security controls and solution architectures are needed to mitigate these risks.
Implementing hardening guidance with AWS
Your cloud resources and data are contained in an AWS account. An account acts as an identity and access management isolation boundary. When you need to share resources and data between two accounts, you must explicitly allow this access. This reduces the risk of lateral movement between accounts.
Designing your AWS environment correctly lays a strong foundation that can help you meet the CISA cybersecurity guidance. AWS Control Tower, working with AWS Organizations, enables you to establish a well-architected, multi-account environment based on security best practices.
For detailed guidance on creating a secure landing zone for telecom workloads, refer to our comprehensive blog post on this topic.
We’ve analyzed the recommendations in CISA’s guidance and grouped them into six categories across the two key domains. Refer to the GitHub page linked at the bottom of this post, which has further detailed guidance on the relevant AWS services that can assist your implementation of each individual security measure in the guidance.
Logging and monitoring
The guidance in this category emphasizes the importance of increasing visibility to understand network activity, which is essential for detecting anomalies and responding to incidents. Key security controls include the following: have a robust asset management capability, enable logging at various levels, centralize logging, protect the logging and monitoring infrastructure, and use security tools to detect anomalies and incidents.
Enhanced visibility is an inherent advantage of the public cloud model, particularly in AWS. This transparency is not just a bolted-on feature, but a fundamental necessity driven by the API-centric, pay-as-you-go business model. To accurately bill customers, AWS has built comprehensive tracking and logging capabilities into its core architecture. As a result, AWS provides robust tools that allow you to capture, centralize, and monitor logs across every layer of your network workload. This level of visibility extends far beyond what’s typically achievable in traditional infrastructure, offering you unprecedented insight into your IT assets and user activities.
Another key guidance is this area is to centralize security-related logging while isolating the logging infrastructure from other production environments. You can implement this guidance in AWS by using Amazon Security Lake together with OpenSearch implemented in separate accounts, with access restricted to just the security organization. Alternatively, this solution provides a best-practice implementation of creating collection and ingestion pipelines to allow for centralization and inspection of log sources across your AWS workloads without the use of Security Lake.
Configuration and change management
The guidance in this category emphasizes the centralization, security, and protection of configurations. It highlights the importance of detecting and providing alerts for unauthorized modifications, auditing configurations for compliance, and a change management process that automates routine changes to minimize unintended drift.
In AWS, you can implement infrastructure and configuration as code, which allows for central storage of configuration in repositories, tracking changes through version control, and implementing changes through approved change management processes. You can use code repositories and continuous integration and continuous delivery (CI/CD) pipelines to automate the implementation of these configurations, helping you increase deployment speed, maintain consistency, simplify management, and implement a rigorous and auditable change control process.
Regardless of how infrastructure is deployed and managed, you can use the AWS Config service to automatically track the current state and history of a wide set of configuration information across more than 100 AWS services and hundreds of their resource types. You can also write custom AWS Config rules to take automatic actions whenever sensitive resources are modified, or take advantage of more than 400 AWS managed rules in AWS Config that send alerts or create automatic remediations when critical resources change state.
Identity and access management
The guidance in this category emphasizes the importance of active account and permissions management, use of phishing-resistant authentication methods, implementing least privilege through role-based access controls, managing emergency access, and limiting sessions.
Authentication and authorization, which are critical components of access control, are managed through AWS Identity and Access Management (IAM), AWS IAM Identity Center, and AWS Organizations. AWS provides you with capabilities to manage permissions at scale across identities, resources, and services, including mandating the use of multi-factor authentication (MFA) for logins. Furthermore, these capabilities support customers adhering to the principle of least privilege by encouraging time-bound, session-based credential management by using AWS Security Token Service (AWS STS).
The guidance in this category emphasizes segmenting workloads and networks to limit the potential for lateral movement and exposure to the internet, monitoring and regulating traffic flows by using policies, and securing unused ports.
You can achieve network micro-segmentation, a critical aspect of modern security architecture, through VPCs and subnets. You can, for example, segregate internet-facing components of your application from those that don’t require such access by placing them in separate VPCs and enabling internet access only on the VPC that requires it. You can control traffic flows within and between segments by using a variety of network services—routing tables, internet gateways, transit gateways, and firewall services, to name a few. This segmentation minimizes your risk from unauthorized activity that originates from the internet and limits the potential for lateral movement in the event of a breach.
To implement the guidance regarding out-of-band management, you can architect your network connections to separate management traffic from network signaling traffic by using subnets—for example, a single EC2 instance can have multiple elastic network interfaces (ENIs) attached to different subnets or even different VPCs: one that permits only management traffic and another that permits only signaling traffic.
Strong cryptography to encrypt data at rest and in traffic
The guidance in this category emphasizes using strong cipher suites, secure versions of encryption protocols, and PKI-based certificates to protect data at rest and in transit.
Encryption, a cornerstone of data protection, is comprehensively addressed in AWS offerings. API endpoints of AWS services support TLS 1.3 (and a minimum of TLS 1.2) with secure standards-based cipher suites, encryption keys, and advanced security features like HKDF (HMAC-based extract-and-expand key derivation function) for added security. AWS services that manage customer secrets sent over the wire also support post-quantum cryptography. For example, AWS Key Management Service (AWS KMS), AWS Certificate Manager, and AWS Secrets Manager support a hybrid post-quantum key exchange option for the TLS network encryption protocol. In its use of the Border Gateway Protocol (BGP), AWS uses Resource Public Key Infrastructure (RPKI) and Route Origin Authorization (ROA) to protect the Amazon IP address space and routes from misconfigurations and hijacking.
You can also use AWS cryptographic services such as AWS KMS, AWS CloudHSM, and AWS Certificate Manager to help secure your data in transit and at rest. Keys that you create in AWS KMS are protected by FIPS 140-2 Level 3 validated hardware security modules (HSMs), and there is no mechanism for anyone, including AWS service operators, to view, access, or export plaintext key material.
AWS Secrets Manager helps you securely manage, retrieve, and rotate database credentials, application credentials, OAuth tokens, API keys, and other secrets throughout their lifecycles. For more details on AWS cryptography solutions and best practices, refer to Encryption best practices for AWS services.
Vulnerability management
This guidance emphasizes minimizing exploitation risks through proper lifecycle management, regular patching, and elimination of insecure protocols. AWS helps address these requirements through both shared responsibility and innovative architectural approaches.
Under the shared responsibility model, AWS manages the security of underlying infrastructure. This includes maintaining up-to-date systems and services, disabling insecure protocols and unused ports, and providing Security Bulletins for timely vulnerability notifications. AWS services are supported through contractually defined terms, so that you don’t need to worry about end-of-life infrastructure components.
For your applications, AWS enables a transformative approach to vulnerability management through ephemeral resources and immutable infrastructure. Instead of maintaining long-lived instances that require continuous patching, you can maintain a single, hardened, and frequently updated Amazon Machine Image (AMI) as your golden image. When updates are needed, rather than patching running instances, you simply deploy new instances with your application code installed from an updated AMI. Similar approaches also apply to container-based workloads. Workloads based on AWS Lambda reduce your patching responsibility even further, because only the code that contains your business logic (and any supporting layers you have chosen) needs to be updated—AWS patches the underlying hypervisors, operating systems, and containers automatically. This approach enables you to keep your systems in a known, secure state while reducing both the threat surface and operational overhead. You can further enhance security by using AWS networking features like security groups to disable insecure protocols, such as enforcing HTTPS rather than HTTP.
Conclusion
The comprehensive guidance from cybersecurity agencies provides a crucial framework for securing telecommunications infrastructure. As demonstrated throughout this post, AWS offers a robust set of native services and capabilities that align with the recommendations from CISA and allied governments. From enhanced visibility through logging and monitoring, to strong identity management, network segmentation, encryption, and vulnerability management, AWS provides the tools you need to implement these security controls effectively while maintaining operational efficiency. The shared responsibility model, combined with AWS continuous innovation in security, enables telecommunications companies to build and maintain resilient, secure cloud environments.
In part 1 of this blog series, we walked through the risks associated with using sensitive data as part of your generative AI application. This overview provided a baseline of the challenges of using sensitive data with a non-deterministic large language model (LLM) and how to mitigate these challenges with Amazon Bedrock Agents. The next question that might come to mind is where and how to use sensitive data across LLM training, fine-tuning, vector databases, agents, and tooling. In this blog post, we build on part 1 with a more detailed discussion about data governance. Then, knowing the data governance baseline, we walk through how to use sensitive data across different data sources with the correct data authorization model. Lastly, we talk about how to implement data authorization mechanisms as part of a generative AI application that uses Retrieval Augmented Generation (RAG) as part of the architecture.
Data governance with LLMs
In this section, we’ll look into data governance as part of the overall data security landscape in more detail than we did in part 1. Many traditional workloads rely upon structured data stores, such as relational databases, for their data source. In contrast, one of the main benefits when you build a generative AI application is the ability to gain insight from massive amounts of both structured (schema-based) and unstructured data, including logs, documents, warehouse data, and other data sources. In the past, access to the unstructured data was limited to specific applications where authorization was granted to specific principals. In this type of architecture, a frontend application makes a decision whether to authorize the user’s access to the data and then uses a single AWS Identity and Access Management (IAM) role to the backend data source, providing access to the data in an object store, data warehouse, or other location. Access to the application incorporates authorization decisions to permit or deny access to the data or a subset of data. AWS has implemented access patterns tied to principal identity, including AWS trusted identity propagation and Amazon Simple Storage Service (Amazon S3) access grants.
Managing data access for generative AI applications presents challenges when you’re interested in using multiple data sources as part of the application, due to a lack of visibility into what data exists in what location and whether there is sensitive data as part of the data source. With data stored across locations, departments, and systems, many customers don’t know what data they have within each data source. And if you don’t know what data you have, it’s difficult to determine authorization policies to govern access to this data with generative AI applications, or whether the data source should be part of the generative AI application to begin with. From a data governance perspective, you need to look across four different pillars of the process: data visibility, access control, quality assurance, and ownership. Do the data sources include customer data? Is it internal data? Is it a combination of both? Do you need to remove certain objects or documents from the data source to align to the business goals of the application you’re building? Who should be authorized to access that data if you have different authorization levels within generative AI applications? AWS provides services in this area, including AWS Glue, Amazon DataZone, and AWS Lake Formation, to govern data to use with generative AI applications. Having a grasp on data governance is a critical prerequisite to implementing the data authorization capabilities we discuss in this post.
With that, how do you securely integrate sensitive data into your generative AI applications? Let’s walk through the different locations where sensitive data can exist: LLM training and fine-tuning, vector databases, tools, and agents.
LLM training and fine-tuning
The first location where sensitive data might reside within a generative AI application is in the LLM itself. The majority of foundation models (FMs) and LLMs are built and developed by third-party organizations, including Anthropic, Cohere, Meta, and other model providers. In these models, LLMs are becoming increasingly large, training on trillions of data points across both regular data and synthetic data created by other LLMs. However, most model providers today do not disclose the data sources used by the models because of privacy and proprietary reasons. FMs developed by third-party organizations are not trained on your private data, but if you are a large enterprise, you might train your own LLMs using sensitive data, licensed data, and public data for your use cases, or you might fine-tune existing models with additional data. This allows you to choose which data to include in training the model.
However, and as mentioned in part 1, LLMs do not make data authorization decisions, which causes challenges with granting access to different groups of principals. It is your application that will decide whether a given principal should be authorized to invoke the model. In addition, if you need to remove data from the LLM, the only way to remove training or fine-tuned data today is to retrain the model without that data. Although fine-tuning and prompt engineering can influence the completions the LLM returns, training data or fine-tuned data can be returned to whomever has access to query the model. Therefore, if you choose to fine-tune an existing model, carefully consider what data you use during training. Proprietary data that is included in training can be accessible to users who perform inference using that model. You should carefully evaluate training data to remove personally identifiable information (PII) or data that requires additional authorization above that which is required to access the model itself.
It’s important to note that there are LLM guardrails that support responsible AI mechanisms. For example, Amazon Bedrock Guardrails implementations remove certain content from prompts and completions. However, guardrails are non-deterministic and focus on filtering out harmful content, denied topics, word filters, or PII data from prompts and completions.
Important: You should not rely on responsible AI mechanisms such as guardrails or built-in model safety mechanisms for your data security, because they do not use identity as a signal as part of the filtering.
Retrieval-Augmented Generation (RAG)
The second location where sensitive data sits in generative AI applications is in vector databases. RAG implementations provide generative AI applications with access to contextual information from your organization’s private data sources to deliver relevant, accurate, and customized responses from LLMs. RAG allows you to add additional context to a prompt that is sent to an LLM and does not require you to train or fine-tune a model with your own data. When you use RAG as part of the generative AI application, you query the vector database to find documents or chunks of information similar to the principal’s prompt. Data that is returned from the vector database will be sent to the model with the original prompt as additional context for the request. For AWS services, we implement RAG using Amazon Bedrock Knowledge Bases and Amazon Q Connectors.
Figure 1 shows the RAG runtime execution flow with vector databases and models. When a user queries the application, the query is turned into embeddings that the vector database uses to find documents that are similar to the query. These documents or chunks are sent to the LLM to augment the original query from the user, so that the LLM can generate a response.
Figure 1: RAG runtime execution flow
In order to implement strong data authorization with RAG, you need to authorize the data before sending the additional content as part of the prompt to the LLM. This can be implemented at the generative AI application or the vector database. With RAG, you build your own authorization workflow within your application and perform authorization at different granularity levels. If you authorize the access to the vector database itself, then you allow a user with access to the application access to documents within the vector database. Therefore, for example, if you have two departments (such as finance and HR), you can create two vector databases, one for finance and one for HR. Principals who have the finance entitlement will be allowed access to the finance vector store, but not the one for HR, and vice versa.
What if you want to shift authorization granularity into the vector database itself? In a different deployment, if the vector database includes documents for separate groups of principals in the vector database, the API call to the vector database must include information on the group membership for the principal making the request. For example, if HR employees have access to certain documents within the vector database, the generative AI application or vector database must authorize whether the principal has access to the data that is returned. You can implement document-level filtering in Amazon Bedrock Knowledge Bases by using the retrievalConfiguration metadata field as part of the API call. As shown in the example in the next section, with metadata filtering, you add metadata key/value pairs that the vector database uses to filter the results that are returned, similar to group membership. Because the metadata filter is part of the API request and not the prompt, threat actors cannot use prompt injections to get access to data they are not authorized to access—authorization is tied to the principal’s identity that is passed to the frontend application and the metadata filters that are passed to the RAG implementation.
In order to build secure RAG implementations, it’s important that you use the correct authorization and data governance implementation. The data sent to the LLM should include only data the principal is authorized to have access to. LLM and guardrail features are probabilistic, and therefore they should not be used to make data authorization decisions.
Tools
A third pattern used by generative AI applications to interface with sensitive data is function or tool calling. With tools, the LLM doesn’t directly call the tool. Rather, when you send a request to an LLM, you also supply a definition for one or more tools that help the LLM generate a response. If the LLM determines it needs the tool to generate a response for the message, the LLM responds with a request for the application to call the tool. It also includes the input parameters to pass to the tool. Then, in the generative AI application, the application calls the tool on the LLM’s behalf, for example an API, an AWS Lambda function, or other software. The application continues the conversation with the LLM by providing the output from the tool as part of the prompt, and then the LLM generates a response based on the new data. This runtime execution flow is shown in Figure 2.
Figure 2: Tools runtime execution flow
Although the LLM decides whether a tool is required, the application code must perform security checks on the parameters passed back by the LLM and make authorization decisions on what tools can be called, what permissions the tool should have, and what actions can be taken. Traditional security mechanisms still apply. For example, tools should be sandboxed so that the side effects of running the tool will not affect future invocations. In addition, parameters generated by the LLM for use by the tool should be sanitized before they are passed into the tool to help avoid potential privilege escalation or remote code execution issues (for more information, see the OWASP top 10 for LLM, Improper Output Handling).
As with the other generative AI patterns mentioned earlier, the application also makes the tool authorization decisions. Similar to RAG implementations, the generative AI application decides on the appropriate authorization implementation, including application-level authorization, group-level authorization, or user-level authorization, or passes that decision to the tool through the use of an identity token, which was part of the discussion of agents in the part 1 post. With these capabilities, you can use multiple types of data sets (sensitive data, public data) in a function call implementation. However, as with authorization decisions with APIs today, authorization decisions in generative AI applications should be made based on the identity of the principal that is accessing the generative AI application and validated as part of every call to the tool. As mentioned previously, you should not allow the LLM to decide which authorization level a principal should have access to, because this can lead to excess agency (for more information, see the OWASP Top 10 for LLM Applications, Excess Agency).
Agents
The fourth pattern that we spoke about at length in the previous post is the use of agents. Here, we’ll discuss how to make use of multiple different data sources with agents. An agent helps principals complete multi-step actions based on principal input and data provided to the model. Agents, including Amazon Bedrock Agents, orchestrate between LLMs, data sources (RAG), software applications (tools), and principal conversations. With an agent, you choose an LLM that the agent invokes to interpret prompt input and subsequent prompts in its orchestration process, including generating follow-up steps. You configure the agent with actions, which might include eliciting clarification from the end user through additional questions, function calling for API operations, or RAG to augment the query with extra relevant context from knowledge bases. These actions are used during the orchestration process, which might take multiple steps, in order to answer the end user’s original query. These components are gathered to construct base prompts for the agent to perform orchestration until the principal request is complete, as shown in Figure 3.
Figure 3: Agent runtime execution flow
For agents and the use of external data sources, there are some additional considerations beyond the data authorization decisions we discussed earlier. First, in order to use the right data authorization context, identity information needs to be passed to the agent as part of the generative AI API call to the agent. With Amazon Bedrock Agents, this is done by using session attributes for tools and metadata filtering for vector databases. You use these attributes as part of calling different data sources within the agent configuration.
Second, the goal of using agents is to perform a task for the principal. Unlike RAG, these tasks may include making API calls to change data or take actions on behalf of the end user (principal). This differs from other data sources discussed previously, where the implementation for data access was data retrieval. With agents, the goal is to have the autonomous orchestration perform API actions, including the add, update, and delete categories of the function. You should take additional care when deciding the authorization you give principals as part of the execution flow of the agent. One option to consider when using agents is adding validation steps. This provides the principal (user) with validation steps for the work the agent performed before the agent changes data or makes calls to APIs to perform actions with data.
Now that we’ve discussed where and how to use data with generative AI applications, let’s walk through an example with a RAG implementation.
Data filtering and authorization with RAG
Let’s say you’re an enterprise that is interested in using a generative AI application for internal groups to retrieve information about policies and historical information. For this implementation, a single Amazon S3 data source for the vector database, which includes documents for both the Finance department and the HR department, is used as part of a RAG implementation. For our simplified example, users are interested in knowing what SECRET_KEY they need to use for their work. Each department has separate SECRET_KEY values that only users who are part of the respective groups have access to. The S3 bucket is the source of the Amazon Bedrock knowledge base, which the generative AI application uses as part of the implementation. This is shown in Figure 4.
Figure 4: Architecture overview with Finance and HR users accessing a generative AI application
Without any data authorization implemented, when an HR user queries the generative AI application, the Amazon Bedrock knowledge base will return the following results when using the Retrieve API call. (The Retrieve API call allows you to call the Amazon Bedrock knowledge base and have the results sent back to the generative AI application, in comparison to the RetrieveAndGenerate API call, which sends the results along with the prompt to the LLM without the generative AI application seeing the results from the knowledge base call until after the LLM responds to the prompt.)
As shown, the SECRET_KEY for both the Finance department (FinanceBOT) and the HR department (HRBOT) are returned from the knowledge base, sourced from the respective prefixes in S3. However, to follow company policy, the Finance department and HR department do not want users outside the department to gain access to information within the S3 buckets that they are not authorized to view, including PII data for employees, unreleased financial data, internal HR policies, and other information that is only for users within each department. How would you go about implementing this restriction using the proper data authorization as described here?
There are two options for the solution. First, you could create two separate vector stores, one for Finance and one for HR. When a Finance user accesses the generative AI application, the application will only request data from the Finance vector store, because the user does not have authorization to the HR vector store. When an HR user accesses the generative AI application, it’s the opposite, with the application only allowing access to the HR vector store.
The second option is using a common vector store, where you might have common data for both departments in addition to sensitive data for the use of specific groups. Metadata filtering provides the generative AI application with a way to filter out context from the vector store at the vector store itself. When you add metadata as a *.metadata.json file that’s associated with an S3 object, you can apply filters within the Amazon Bedrock API call to filter out data that is returned by the knowledge base. For example, you can add metadata to both objects (hr.txt and finance.txt) within S3, by adding a hr.txt.metdata.json file and finance.txt.metadata.json file within the S3 bucket. When the vector database indexes from the S3 bucket, it will pull the metadata from the S3 bucket to allow you to filter on the metadata associated with the respective file. An example of the hr.txt.metadata.json file is shown following, along with the vectorSearchConfiguration filter that is used alongside the Retrieve API.
With both of these metadata files in place, you will reindex the knowledge base to associate the metadata with each file. When you call the knowledge base with the filter as part of the API call, you get the following response:
As you can see, you only receive the chunks from the HR folder, because only the hr.txt object has the "group' : "HR" metadata applied to the objects. Due to this, the generative AI application can pass these chunks along with your prompt to the LLM for the user to receive the SECRET_KEY. You can find more information on metadata filtering in the blog post Amazon Bedrock Knowledge Bases now supports metadata filtering to improve retrieval accuracy.
Regardless of how you assign metadata to objects within the data source, the filter used with the API call is applied after the data authorization decision is made by the generative AI application. When a user logs in to the generative AI application, the application authenticates the user to identify who the user is and what department the user is in through the use of OpenID Connect (OIDC) or OAuth2, depending on the application. This step is required if you want your generative AI application to have strong authorization policies. After the generative AI application authenticates the user, it will authorize the user and apply the filters that are required when making API calls to the Amazon Bedrock knowledge base. It’s worth repeating that it’s the application that makes the data authorization decision, and the resulting API call to the knowledge base is post-authorization. By passing metadata through a secure side channel within the API and not the prompt, this practice helps to prevent threat actors and unintended users from gaining access to data they aren’t authorized to access.
Conclusion
Implementing the correct data authorization mechanisms is a foundational step that is required when you use sensitive data as part of generative AI applications. Depending on where the data sits as part of the generative AI application, you will need to use different implementations of data authorization, and there isn’t a one-size-fits-all solution. In this post, we walked through how to use sensitive data across these different data sources with the correct data authorization model. Then, we discussed how to implement data authorization mechanisms as part of a generative AI application and RAG by using metadata filtering. For additional information on generative AI security, take a look at other blog posts in the AWS Security Blog Channel and AWS blog posts covering generative AI.
If you have feedback about this post, submit comments in the Comments section below. If you have questions about this post, contact AWS Support.
In the piece, we spotlight the AWS Security Guardians program and how it helps security enable your business, not slow it down. Through the program, teams are provided tools, resources, and guidance to help address security concerns at every step of development. This enables developers to make the right decisions and embed security deeper in their solutions. Using our approach with their Security Champions initiative, the Commonwealth Bank of Australia shared how the program has helped transform their company culture and give ownership of services and security directly to their teams.
AWS and the Commonwealth Bank sought to understand how they could foster a culture where employees not only understand security, but care about it. They both needed a way to support new technology innovation while reducing security remediation work. This challenge offered both companies an opportunity to try something new with their Security Champions programs, enabling security expertise to be distributed across their respective organizations, which created a scalable solution with measurable results.
Read the full article on the BBC website to discover how AWS and our customers are creating a better environment for our teams, colleagues, customers, and communities.
If you have feedback about this post, submit comments in the Comments section below. If you have questions about this post, contact AWS Support.
Well, it’s been another historic year! We’ve watched in awe as the use of real-world generative AI has changed the tech landscape, and while we at the Architecture Blog happily participated, we also made every effort to stay true to our channel’s original scope, and your readership this last year has proven that decision was the right one.
AI/ML carries itself in the top posts this year, but we’re also happy to see that foundational topics like resiliency and cost optimization are still of great interest to our audience.
(By the way, if you were hoping for more AI/ML content, head on over to our sister channel, the AWS Machine Learning Blog!).
Without further ado, here are our top posts from 2024!
In keeping with Let’s Architect! series, we have our first of three favorites for the year. This set of resources helps you apply Well-Architected standards in practice.
As I said, Let’s Architect! has a winning series, and they’ve got a finger on the pulse of the tech world. This post about machine learning showcases some of the most exciting things happening at AWS.
Figure 3. Let’s Architect
If you’re more interested in generative AI, you can also take a look at another post from 2024: Let’s Architect! GenAI
Preparedness is another common theme in this year’s favorites. Michael, John, and Saurabh are well-versed in multi-Region architecture, and they’re here to share some strategies to contain failure impact.
Figure 4. When the application experiences an impairment using S3 resources in the primary Region, it fails over to use an S3 bucket in the secondary Region.
Let’s talk cost optimization. This post about a three-tier architecture that relies on the AWS Free Tier is a must-read for anyone looking for tips to help them avoid unnecessary costs (and that’s everyone).
Figure 5. Example of a three-tier architecture on AWS
As usual, Haleh & team are pros at making sure the Well-Architected Framework is current and relevant. Take a look at the enhanced and expanded guidance in all six pillars.
One more winning post from Luca, Federica, Vittorio, and Zamira! This collection of developer resources includes new ideas in AWS Lambda, Amazon Q Developer, and Amazon DynamoDB.
Frugality AND Well-Architected? What a winning combo! This post, inspired by the 2023 re:Invent keynote, outlines the seven laws of Frugal Architecture.
And finally, our number one post of the year! Amit and Luiz showcase a customer solution with real-world applications that builds on the guidelines of other posts in this list! Well done!
Figure 10. The Pilot Light scenario for a 3-tier application that has application servers and a database deployed in two Regions
Thank you!
As always, thanks to our contributors for their dedication and desire to share, and to you, our readers! We would be nothing with you. Literally.
For other top post lists, see our Top 10 and Top 5 posts from previous years.
Securing an event of the magnitude of AWS re:Invent—the Amazon Web Services annual conference in Las Vegas—is no small feat. The most recent event, in December, operated on the scale of a small city, spanning seven venues over twelve miles and nearly seven million square feet across the bustling Las Vegas Strip.
Keeping all 60,000 in-person attendees, 400,000 online participants, and their data secure requires a sophisticated blend of physical and logical security measures—a challenge that we’ve addressed by building an integrated security strategy that brings both sides together. We used every resource available to us, including drones, K9 units, our network security teams, and much more, to help protect every person attending the event and their data.
Figure 1: The re:Invent Command Post
Security is a team sport
At Amazon, our physical security and information security (logical) teams work together to secure our customers, employees, and infrastructure across our diverse range of businesses at scale against a wide range of threats. At large events such as re:Invent, this integrated approach allows us to protect the many aspects of our event—from our attendees, to our on-site computers and servers, to our Wi-Fi network and its users—as comprehensively as possible.
Amazon doesn’t work alone, either. Our event security teams coordinate with Las Vegas Metropolitan Police and over 40 different agencies, including counterterrorism, bomb squad personnel, and first responders.
Figure 2: K9 units – valued members of our onsite security team
These teams are co-located in the Command Post—the nerve center of our security operations. Here, physical and logical security converge as nearly every element of our security footprint comes together, and we monitor the event for threats in real-time. This includes our event security management teams, our intelligence team, and our CCTV camera operators, alongside local law enforcement and emergency management services. As an added layer of protection, we also operate a dedicated Wireless Security Operations Center (WiSOC) in close coordination with our main Command Post, which serves as the primary hub for our wireless and cybersecurity teams.
Fostering open dialogue and information-sharing is critical for effective collaboration to secure re:Invent. And as the threat landscape continues to evolve, organizations must prioritize closing the gap between physical and logical security. Not only is this integrated approach the key to effectively securing a city-sized event such as re:Invent, but it also helps us protect our customers, employees, and company every day.
City-scale security
We deploy a number of integrated security measures at re:Invent to protect our physical and digital assets. When it comes to physical security, the primary concern is, of course, human safety. At re:Invent, we deploy thousands of security personnel, including guards, K9 units, and first responders to help respond to and assist with any issues, such as medical events, fires, theft, or overcrowding. We have CCTV cameras stationed in high-traffic areas and implement strict access control measures, including walkthrough screening detectors at entry points and a robust credentialing system, to create a safe and secure environment for our attendees.
We also have help from drones. The automated, high-flying craft provide a bird’s eye view at re:Play—the culminating concert at the Las Vegas Festival Grounds—and help coordinate responses to issues. Using AWS cloud solutions, live footage is streamed directly to our onsite security teams to monitor crowd flow.
Figure 3: A security team member showcases a drone used to help secure re:Play
We’re also focused on the security of our network, which in turn protects its users—our attendees. Our wireless and cybersecurity teams work to identify anomalous activity across our network, including signs of spoofing—a tactic where actors set up look-a-like Wi-Fi networks in an attempt to lure attendees to connect to their network instead of ours.
Amazon also secures the presentations given by re:Invent’s cloud computing and AI experts, executives, and engineers. To have confidence in sharing their insights, speakers must know that their talks run on secure, uninterrupted channels streaming to hundreds of thousands of viewers around the world. Our re:Invent mobile app is built with security in mind, too, so attendees have a safe place to manage events and in-conference needs.
Our integrated approach to security is made possible by the AWS Cloud, which helps us support the different components of our security operation and share critical information rapidly. Whether we’re facing a logical security threat, physical security concern, or a wellness incident, our success hinges on our response time—and running our operations in the AWS Cloud enables us to move quickly.
Amazon will continue investing in and strengthening our unified approach to help make sure that, no matter the vector of the threat, our teams will have a cohesive, unified response. We’re proud to be a leader in this space and hope our learnings can help others enhance their own security resilience, both inside and outside of events.
Establishing and maintaining an effective security and governance posture has never been more important for enterprises. This post explains how you, as a security administrator, can use Amazon Web Services (AWS) to enforce resource configurations in a manner that is designed to be secure, scalable, and primarily focused on feature gating.
In this context, feature gating means that newly supported AWS features and configurations can’t be used unless you explicitly approve them. With feature gating, you maintain control over your AWS environment when new services and capabilities are introduced.
This blog post demonstrates a unique approach to giving users, such as DevOps teams, controlled flexibility within safe boundaries by allowing resource provisioning that uses only approved configurations. This approach also accommodates configurations that will be supported in future versions of the resource, keeping them restricted until explicitly approved, as shown in Figure 1.
Figure 1: Restrict resource provisioning to approved configurations only
Apply your resource configuration enforcement
As shown in Figure 2, our solution for resource configuration enforcement (RCFGE) uses AWS CloudFormation Hooks. By using Hooks, you can run custom logic during the provisioning of resources. These are proactive controls because you inspect and enforce resource configurations before the resource is created, updated, or deleted.
Your Hook will only be effective if CloudFormation supports the AWS resources that you are using and if you implement a service control policy (SCP) that helps prevent users from provisioning resources outside of CloudFormation.
Figure 2: How CloudFormation Hooks work
The flow shown in Figure 2 consists of the following five steps:
DevSecOps registers and configures a CloudFormation Hook in the account.
DevOps specifies a CloudFormation template that defines the required resources and configurations.
CloudFormation creates a new stack resource, starting the provisioning process based on the template.
The Hook is triggered before provisioning for each resource that’s defined in the template, and runs custom validation logic.
If the validation checks pass, CloudFormation proceeds with provisioning; if not, the process is terminated.
Make your solution scalable
To achieve scalable operations, you should implement a reusable and generic Hook that targets all supported CloudFormation resource types. This Hook enforces resource configuration by loading resource specification files from an external object storage, such as an Amazon Simple Storage Service (Amazon S3) bucket.
These specification files define validation rules in a declarative language. Using this approach, you can add and remove resource configuration validation rules by editing the declarative files. When you externalize custom logic as decoupled validation rules from the Hook, DevSecOps personnel can manage these rules at scale without affecting your infrastructure.
Figure 3: Externalize custom logic as validation rule files in an S3 bucket
Figure 3 shows how the solution has been revised to support this approach. Steps 1–3 are the same as in the flow shown in Figure 2:
DevSecOps registers and configures a CloudFormation Hook in the account.
DevOps specifies a CloudFormation template that defines the required resources and configurations.
CloudFormation creates a new stack resource, starting the provisioning process based on the template.
The Hook is triggered before provisioning for each resource that’s defined in the template.
The Hook loads the relevant resource specification file from the S3 bucket and executes the validation rules against the current resource in the CloudFormation template.
If the validation checks pass, CloudFormation proceeds with provisioning; if not, the process is terminated.
You need to configure the Hook schema and the Hook configuration schema to evaluate the configurations of all supported resources across your AWS accounts before changes are provisioned. This setup should cover create, update, and delete operations so that the Hook can help prevent non-approved configurations across stacks.
By using AWS CloudFormation Guard, you can externalize validation rules from the Hook, as described in Extend your pre-commit hooks with AWS CloudFormation Guard. Guard is an open source, general purpose, policy-as-code (PaC) evaluation tool that validates CloudFormation templates against custom rules to help you stay aligned with your organizational policies. For example, the CT.S3.PR.1 rule specification demonstrates a Guard rule that requires an S3 bucket to have its settings configured to block public access. These validation rules apply to currently supported AWS resource configurations and features, but they don’t restrict potential future properties.
Boost your solution with feature gating
Your risk model might lead you to look for mechanisms that further restrict the AWS resource configurations that you allow in your environments. As you will see, the proposed solution restricts authorized workforce users so that they can use new configurations only if you enable them. The proposed approach uses feature gating because it continues to enforce your configurations even when AWS adds new options for your resources.
Guard aims to validate required constraints; but to meet the feature gating objective, you should implement validation rules that check whether resource configurations fulfill structural constraints described by the restricted version of CloudFormation resource schemas. These schemas help you confine the possible resource configurations that can be provisioned in your environment no matter what new configurations AWS introduces.
Figure 4: Enforce resource configuration with restricted resource schema templates
Figure 4 shows an updated version of the same flow where validation rules are implemented by using restricted resource schema templates, which are stored in an S3 bucket. These templates are based on the original CloudFormation resource schemas, representing a snapshot of these schemas at a specific point in time. Steps 1–4 are the same as in the flow shown in Figure 3:
DevSecOps registers and configures a CloudFormation Hook in the account.
DevOps specifies a CloudFormation template that defines the required resources and configurations.
CloudFormation creates a new stack resource, starting the provisioning process based on the template.
The Hook is triggered before provisioning for each resource that’s defined in the template.
The Hook loads the relevant restricted resource schema template file from the S3 bucket and uses it to execute schema validation against the current resource in the CloudFormation template.
If the validation checks pass, CloudFormation proceeds with provisioning; if not, the process is terminated.
A restricted resource schema template is a subset of its corresponding original CloudFormation resource schema. It includes additional constraints that limit certain properties to specific values and patterns or exclude certain properties entirely. Furthermore, these templates contain placeholders that you fill in with runtime values, such as the account ID, which your Hook provides as part of the Hook context.
As shown in Figure 5, the flow within the RCFGE CloudFormation Hook involves the following steps:
The CloudFormation Hook is invoked with the Hook context and the resource’s configuration JSON object.
The Hook loads the restricted resource schema template from the S3 bucket and substitutes placeholders with the Hook context runtime values, producing a valid JSON schema.
The Hook validates the stack’s resource configuration JSON object against the schema. If it returns OperationStatus.SUCCESS, then CloudFormation proceeds with the provisioning process. If it returns OperationStatus.FAILED, then CloudFormation terminates the provisioning process.
If a restricted resource schema template for a CloudFormation resource type isn’t found in the S3 bucket, the schema validation step fails by default.
Sample excerpt of a restricted schema template for an S3 bucket resource
The following is an excerpt from a restricted schema template for an S3 bucket. At runtime, your Hook processes this template, substituting the placeholders with relevant values from the Hook context. In this example, the Hook replaces the <accountID> placeholder in the topic’s pattern with the actual account ID. The resulting JSON schema disallows additional properties beyond those defined by the schema and restricts the Amazon Simple Notification Service (Amazon SNS) topics that can be used for event notifications.
Note: In the code samples that follow, we’ve omitted some code for brevity—we’ve indicated these omissions with three periods: ...
CloudFormation template for an S3 bucket that adheres to the restricted schema
Let’s assume that your account ID is 111122223333. The account ID is propagated to the Hook through the Hook context.
The following is an excerpt from a CloudFormation template that aligns with the restricted schema for an S3 bucket instantiated from the template shown previously. As a result, your Hook allows the corresponding CloudFormation stack to proceed.
CloudFormation template for an S3 bucket that diverges from the restricted schema (example 1)
The following is an excerpt from a CloudFormation template that doesn’t align with the restricted schema for an S3 bucket instantiated from the template shown previously because it attempts to configure the Amazon SNS topic for the notification configuration, which uses an Amazon Resource Name (ARN) of another account. As a result, your Hook causes the corresponding CloudFormation stack to fail.
CloudFormation template for an S3 bucket that diverges from the restricted schema (example 2)
The following is an excerpt from a CloudFormation template that doesn’t align with the restricted schema for an S3 bucket instantiated from the template shown previously. This time, it violates your feature gating objective by attempting to use a new, imaginary feature of an S3 bucket that isn’t approved for use by your restricted schema for an S3 bucket. As a result, your Hook causes the corresponding CloudFormation stack to fail.
If a security control itself isn’t protected adequately, it becomes a weak link in the security chain. For example, a surveillance camera (a physical security control) that isn’t securely mounted can be removed, rendering it useless. This principle also applies to your RCFGE solution.
Next, we will show you how to isolate management activities to a dedicated account and use SCPs as preventative controls.
Isolate RCFGE management in a dedicated account
Organizing your AWS environment by using multiple accounts is a best practice because it enhances security, simplifies management, and allows for better resource isolation and cost tracking. Isolating the operation and management of your RCFGE solution in its own dedicated account is essential for securing the solution’s resources.
With AWS CloudFormation StackSets, you can deploy and manage RCFGE stacks across multiple accounts and AWS Regions from a single central administrator account. This provides consistent and scalable infrastructure while maintaining centralized governance. With this functionality, you can deploy the RCFGE resources to existing accounts and automatically include new accounts as you add them to your organization, simplifying RCFGE management and providing uniformity across your environments. For more information, see Deploy CloudFormation Hooks to an Organization with service-managed StackSets.
Figure 6 shows how to extend that idea so that you can operate the RCFGE solution at scale while maintaining isolation and the separation of duties. The solution operates across three key account types:
Management account –use this account to create your organization and designate the CloudFormation StackSets delegated administrator account.
Delegated administrator account – this account serves as the centralized management point for the RCFGE solution. It contains a continuous integration and continuous delivery (CI/CD) pipeline that provisions RCFGE resources across the organization by using CloudFormation StackSets with service managed permissions. The account hosts a centralized S3 bucket that stores the RCFGE restricted resource schema templates. The security engineering team uses this account to submit Hook code and restricted resource schema template changes, which trigger the CI/CD pipeline.
Member accounts – each member account contains an RCFGE StackSet instance and an AWS Identity and Access Management (IAM) role for provisioning RCFGE resources. It also includes a CloudFormation Hook and an IAM role that allows the Hook to access the centralized S3 bucket with RCFGE restricted resource schema templates.
Figure 6: Securely operate the RCFGE solution
Let’s explore how the RCFGE solution architecture enforces resource configuration step by step, as shown in Figure 7.
Figure 7: CloudFormation stack deployment flow with RCFGE validation and enforcement
DevOps initiates the deployment by specifying a CloudFormation template that defines the resources and configurations needed.
CloudFormation creates a new stack resource, initiating the resource provisioning process based on the provided template.
The RCFGE CloudFormation Hook is triggered for each resource defined in the CloudFormation template.
The Hook loads the corresponding restricted resource schema template from the S3 bucket.
The Hook validates a resource configuration:
The Hook processes the restricted resource schema template to create a JSON schema.
It uses this JSON schema to validate the current resource in the CloudFormation template.
If the resource is invalid according to the schema, the provisioning process is terminated.
If the current resource passes validation, CloudFormation proceeds with the resource provisioning process by creating and configuring the resources as specified in the template.
Use SCPs as preventive controls for your organization to help protect RCFGE
The following SCP excerpt accomplishes three objectives:
Implements a statement (see AllowedListActions) to explicitly specify the access that is allowed while other access is implicitly blocked.
Implements control objectives to help prevent changes to resources set up by the RCFGE solution (see ProtectRCFGEResources and ProtectStackSetExecutionRole).
Makes sure that AWS resource provisioning does not occur outside of CloudFormation (see ProvisionResourcesViaCloudFormationOnly).
In this SCP excerpt, the ProvisionResourcesViaCloudFormationOnly statement restricts CloudFormation stacks to being managed only through forward access sessions (FAS) in AWS IAM.
The ProvisionResourcesViaCloudFormationOnly statement explicitly prohibits direct create, update, and delete actions for all supported resources used in your environment. If needed, split this statement into multiple parts so you don’t exceed SCP size limits, while providing comprehensive coverage of your resources to make sure that they are provisioned and managed only through CloudFormation.
The ProtectStackSetExecutionRole statement in this example assumes that CloudFormation trusted access is activated with AWS Organizations, which is required by StackSets to deploy across accounts and Regions by using service managed permissions.
To allow the Hook to retrieve the necessary restricted resource schema templates, member accounts must be able to access the S3 bucket that contains the RCFGE templates. The following code sample shows the bucket policy for the S3 bucket that contains the RCFGE templates.
As shown in the following code sample, the RCFGEHookExecutionRole IAM role in member accounts has a policy that grants read-only access to the RCFGE templates that are stored in an S3 bucket in the RCFGE delegated administrator account, where 555555555555 represents the account ID.
In the following code sample, the RCFGEHookExecutionRole IAM role in member accounts has a trust policy that allows it to be assumed only by the relevant CloudFormation service principals, where 444455556666 represents the account ID of the member account.
Define baseline configuration for RCFGE and continuous monitoring with AWS Config
Defense in depth is an effective strategy because if one line of defense fails, additional layers are in place to help stop threats at subsequent points. With AWS Config, you can capture the configuration of RCFGE resources over time. You can set up AWS Config custom rules to automatically assess the compliance of your RCFGE resources against predefined policies. For example, you can use an AWS Config custom rule to make sure that the RCFGE Hook hasn’t been altered or removed.
Conclusion
In this post, you learned how to use CloudFormation Hooks to create a resource configuration enforcement (RCFGE) solution on AWS that is designed to be secure and scalable and that supports feature gating. Using this approach, you, as a security administrator, can maintain strict control over resource configurations and feature adoption across your AWS environments. The solution provides a balanced approach to governance, so that DevOps teams have the flexibility to work within approved boundaries while making sure that new AWS features are only accessible after explicit approval.
If you have feedback about this post, submit comments in the Comments section. For questions, start a new thread on the CloudFormation re:Post or contact AWS Support.
As organizations increasingly use generative AI to streamline processes, enhance efficiency, and gain a competitive edge in today’s fast-paced business environment, they seek mechanisms for measuring and monitoring their use of AI services.
To help you navigate the process of adopting generative AI technologies and proactively measure your generative AI implementation, AWS developed the AWS Audit Manager generative AI best practices framework. This framework provides a structured approach to evaluating and adopting generative AI technologies and addresses important aspects such as strategy alignment, governance, risk assessment, and security and operational best practices. You can use the framework within AWS Audit Manager as you implement generative AI workloads, to measure and monitor existing workloads through Audit Manager capabilities such as automated evidence collection and customized assessment reports.
In this blog post, we’ll cover the AWS Audit Manager generative AI best practices framework and how it can help you during your generative AI journey. We’ll highlight key considerations to prioritize when deploying generative AI workloads, and discuss how the framework can facilitate auditing and compliance with generative AI-specific controls using Audit Manager.
Starting the generative AI Journey
An important consideration in preparing for the introduction of generative AI in your organization is the need to align your risk management strategies with robust mitigation measures. Examples of potential risks include the following:
Data quality, reliability, and bias: Poor source-data quality used to train models might lead to inconsistent, inaccurate, or biased outputs, which can have significant financial and regulatory impact for organizations. For example, a language model trained on biased data might generate text that reinforces harmful stereotypes or propagates misinformation. Similarly, training AI on biased product reviews or ratings might lead to product suggestions that don’t accurately reflect product quality or user preferences.
Model explainability and transparency: The opaque nature of many generative AI models makes it challenging to understand how they arrive at specific outputs or decisions. For example, if a model is used to generate creative content, such as stories or learning materials, it could be difficult to understand why certain outputs are generated, including potential biases or inappropriate content.
Data privacy and security: Generative AI models are trained on vast amounts of data, which might inadvertently include sensitive or personal information. For example, a model trained to generate text could potentially produce sentences that contain personal details from its training data.
AWS empowers organizations to use this technology responsibly while helping them to align with best practices. As part of enabling organizations to create a comprehensive risk management strategy for generative AI systems, AWS has built the AWS Audit Manager generative AI best practices framework which is mapped to Amazon Bedrock and Amazon SageMaker in AWS Audit Manager.
Amazon Bedrock is a managed service that enables you to create, manage, and scale machine learning (ML) and AI services while facilitating adherence to security and defined compliance requirements. Amazon SageMaker is a fully managed ML service that can build, train, and deploy ML models for extended use cases that require deep customization and model fine-tuning.
You can use this framework to facilitate your auditing and compliance requirements by taking advantage of controls for more responsible, ethical, and effective deployment of generative AI models.
The framework is organized into four pillars, as follows:
Data Governance: Data is the foundation of generative AI models, and the quality and diversity of the training data can significantly impact the model’s performance and output. The Data Governance pillar focuses on facilitating data management practices such as data sourcing, data quality, data privacy, and data bias.
Model Development: This pillar focuses on the responsible development and testing of generative AI models and covers aspects such as model architecture selection, model training, and model evaluation.
Model Deployment: This pillar addresses the challenges associated with deploying generative AI models in production environments and covers aspects such as model deployment strategies, infrastructure considerations, and access controls.
Monitoring & Oversight: This pillar focuses on the ongoing monitoring and governance of generative AI models in production environments and addresses aspects such as model performance monitoring and incident response planning.
You can also use Amazon Bedrock Guardrails to provide an additional level of control on top of the protections built into foundation models (FMs) to help deliver relevant and safe user experiences that align with your organization’s policies and principles.
Each organization’s generative AI journey is unique, influenced by factors such as industry-specific regulations, risk appetite, and scale of generative AI deployment. By integrating the framework with Amazon Bedrock or Amazon SageMaker, you can customize the controls to your organization’s unique needs, aligning your generative AI deployments with your specific risk management strategies. This customization is especially valuable for highly regulated sectors, such as the financial sector.
For example, you can map the risk of inaccurate outputs to controls related to data quality and model validation. Similarly, you can map data security risks to controls related to access management and encryption.
Let’s consider an example that uses a subset of these risks to understand how you could perform this mapping. A financial services firm decides to use generative AI models to develop a chatbot capable of understanding complex customer inquiries and providing accurate and tailored responses for their customer portal. Although chatbots can greatly enhance customer experiences and operational efficiency, they also introduce risks that you need to understand and measure, so that you can develop a corresponding mitigation strategy.
An auditor within the internal audit function of the financial organization would like to use the AWS Audit Manager generative AI best practices framework to assess compliance with the following sample of risks associated with the application:
Responsible: Validating that the chatbot adheres to ethical principles, such as fairness and transparency, and avoids perpetuating biases or discrimination against certain customer segments.
Accurate: Verifying the reliability and accuracy of the chatbot’s responses, particularly when handling sensitive financial information or providing advice on complex financial products.
Secure: Protecting the integrity and security of the data being used to train the generative AI model from unauthorized access and validating that sensitive customer data is segregated from data used for training.
Example mapping
We’ve provided an example mapping here that illustrates how you can use the framework within Audit Manager to develop a risk management strategy. Based on your individual control objectives and organizational requirements, you can further customize controls, and evidence collection can be automated or manually defined. The example mapping is as follows:
Responsible: Implement mechanisms for AI model monitoring and explainability to detect and mitigate potential biases or unfair outcomes.
RESPAI3.8: Document Risks and Tolerances: Define, document, and implement specific controls to address identified risks and organizational risk tolerances.
RESPAI3.9: Develop AI RACI: Define organizational roles and responsibilities, lines of communication, and ownership of controls to address identified risks. Ensure that this mapping, measuring, and managing of generative AI risks is clear to individuals and teams throughout the organization.
RESPAI3.13: Continuous Risk Monitoring: Periodically perform retrospectives and review policies and procedures to determine if new risks should be considered, and if current risks are addressed based on AI performance, incidents, and user feedback.
RESPAI3.15: Ethical Guidelines: Develop and adhere to ethical guidelines for the deployment and usage of generative AI models.
Accurate: Implement robust data quality checks, model validation processes, and ongoing monitoring to ensure the accuracy and reliability of the generative AI chatbot’s outputs.
ACCUAI3.4: Regular Audits: Conduct periodic reviews to assess the model’s accuracy over time, especially after system updates or when integrating new data sources.
ACCUAI3.6: Source Verification: Ensure that the data source is reputable, reliable, and the data is of high quality.
ACCUAI3.14: Quality Data Sourcing: The accuracy of generative AI largely depends on the quality of its training data. Ensure that the data is representative, comprehensive, and free from biases or errors.
Secure: Implement robust access controls, data encryption, and security monitoring measures to protect the generative AI chatbot system and training data.
SECAI3.2: Data Encryption In Transit: Implement end-to-end encryption for the input and output data of the AI models to minimum industry standards.
SECAI3.3: Data Encryption At Rest: Implement data encryption at rest for data that’s stored to train the AI models, and for the metadata that’s produced by AI models.
Note: This is an example of a control that can be configured with automated evidence collection using AWS Config as the underlying data source, or further customized with additional data sources according to the scope of the control.
SECAI3.7: Least Privilege: Document, implement, and enforce least privileged principles when granting access to generative AI systems.
SECAI3.8: Periodic Reviews: Document, implement, and enforce periodic reviews of users’ access to generative AI systems.
Note: This is an example of a control that can be configured with manual evidence collection based on the specific policies and procedures defined by each organization.
SECAI3.15: Access Logging: Require and enable mechanisms that allow users to request access to generative AI models. Ensure that access requests are properly logged, reviewed, and approved.
Conclusion
It’s important for institutions, especially those in highly regulated sectors, to proactively address new developments that relate to generative AI. Using the AWS Audit Manager generative AI best practices framework as part of a comprehensive risk management strategy can help you stay ahead of the curve and embrace an agile and responsible approach to generative AI.
The guidance provided by the framework, together with the capabilities of Audit Manager, Amazon Bedrock and SageMaker can help you establish secure and controlled environments for generative AI implementation, automate evidence collection and risk assessments, and monitor and mitigate potential risks. By embracing the potential of generative AI while adhering to best practices, you can position your organization at the forefront of innovation while maintaining the trust and confidence of stakeholders and customers.
If you have feedback about this post, submit comments in the Comments section below. If you have questions about this post, contact AWS Support.
The collective thoughts of the interwebz
Manage Consent
To provide the best experiences, we use technologies like cookies to store and/or access device information. Consenting to these technologies will allow us to process data such as browsing behavior or unique IDs on this site. Not consenting or withdrawing consent, may adversely affect certain features and functions.
Functional
Always active
The technical storage or access is strictly necessary for the legitimate purpose of enabling the use of a specific service explicitly requested by the subscriber or user, or for the sole purpose of carrying out the transmission of a communication over an electronic communications network.
Preferences
The technical storage or access is necessary for the legitimate purpose of storing preferences that are not requested by the subscriber or user.
Statistics
The technical storage or access that is used exclusively for statistical purposes.The technical storage or access that is used exclusively for anonymous statistical purposes. Without a subpoena, voluntary compliance on the part of your Internet Service Provider, or additional records from a third party, information stored or retrieved for this purpose alone cannot usually be used to identify you.
Marketing
The technical storage or access is required to create user profiles to send advertising, or to track the user on a website or across several websites for similar marketing purposes.


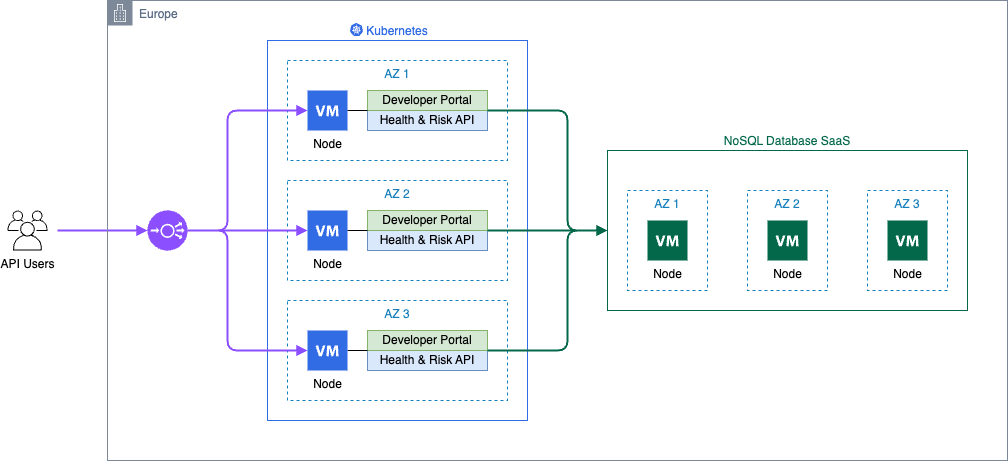


 G2 Krishnamoorthy is VP of Analytics, leading AWS data lake services, data integration, Amazon OpenSearch Service, and Amazon QuickSight. Prior to his current role, G2 built and ran the Analytics and ML Platform at Facebook/Meta, and built various parts of the SQL Server database, Azure Analytics, and Azure ML at Microsoft.
 Rahul Pathak is VP of Relational Database Engines, leading Amazon Aurora, Amazon Redshift, and Amazon QLDB. Prior to his current role, he was VP of Analytics at AWS, where he worked across the entire AWS database portfolio. He has co-founded two companies, one focused on digital media analytics and the other on IP-geolocation.


