Tag Archives: Containers

How to detect security issues in Amazon EKS clusters using Amazon GuardDuty – Part 1

Post Syndicated from Marshall Jones original https://aws.amazon.com/blogs/security/how-to-detect-security-issues-in-amazon-eks-clusters-using-amazon-guardduty-part-1/

In this two-part blog post, we’ll discuss how to detect and investigate security issues in an Amazon Elastic Kubernetes Service (Amazon EKS) cluster with Amazon GuardDuty and Amazon Detective.

Amazon Elastic Kubernetes Service (Amazon EKS) is a managed service that you can use to run and scale container workloads by using Kubernetes in the AWS Cloud, which can help increase the speed of deployment and portability of modern applications. Amazon EKS provides secure, managed Kubernetes clusters on the AWS control plane by default. Kubernetes configurations such as pod security policies, runtime security, and network policies and configurations are specific for your organization’s use-case and securing them adequately would be a customer’s responsibility within AWS’ shared responsibility model.

Amazon GuardDuty can help you continuously monitor and detect suspicious activity related to AWS resources in your account. GuardDuty for EKS protection is a feature that you can enable within your accounts. When this feature is enabled, GuardDuty can help detect potentially unauthorized EKS activity resulting from misconfiguration of the control plane nodes or application.

In this post, we’ll walk through the events leading up to a real-world security issue that occurred due to EKS cluster misconfiguration, discuss how those misconfigurations could be used by a malicious actor, and how Amazon GuardDuty monitors and identifies suspicious activity throughout the EKS security event. In part 2 of the post, we’ll cover Amazon Detective investigation capabilities, possible remediation techniques, and preventative controls for EKS cluster related security issues.

Prerequisites

You must have AWS GuardDuty enabled in your AWS account in order to monitor and generate findings associated with an EKS cluster related security issue in your environment.

EKS security issue walkthrough

Before jumping into the security issue, it is important to understand how the AWS shared responsibility model applies to the Amazon EKS managed service. AWS is responsible for the EKS managed Kubernetes control plane and the infrastructure to deliver EKS in a secure and reliable manner. You have the ability to configure EKS and how it interacts with other applications and services, where you are responsible for making sure that secure configurations are being used.

The following scenario is based on a real-world observed event, where a malicious actor used Kubernetes compromise tactics and techniques to expose and access an EKS cluster. We use this example to show how you can use AWS security services to identify and investigate each step of this security event. For a security event in your own environment, the order of operations and the investigative and remediation techniques used might be different. The scenario is broken down into the following phases and associated MITRE ATT&CK tactics:

  • Phase 1 – EKS cluster misconfiguration
  • Phase 2 (Discovery) – Discovery of vulnerable EKS clusters
  • Phase 3 (Initial Access) – Credential access to obtain Kubernetes secrets
  • Phase 4 (Persistence) – Impact to persist unauthorized access to the cluster
  • Phase 5 (Impact) – Impact to manipulate resources for unauthorized activity

Phase 1 – EKS cluster misconfiguration

By default, when you provision an EKS cluster, the API cluster endpoint is set to public, meaning that it can be accessed from the internet. Despite being accessible from the internet, the endpoint is still considered secure because it requires all API requests to be authenticated by AWS Identity and Access Management (IAM) and then authorized by Kubernetes role-based access control (RBAC). Also, the entity (user or role) that creates the EKS cluster is automatically granted system:masters permissions, which allows the entity to modify the EKS cluster’s RBAC configuration.

This example scenario starts with a developer who has access to administer EKS clusters in an AWS account. The developer wants to work from their home network and doesn’t want to connect to their enterprise VPN for IAM role federation. They configure an EKS cluster API without setting up the proper authentication and authorization components. Instead, the developer grants explicit access to the system:anonymous user in the cluster’s RBAC configuration. (Alternatively, an unauthorized RBAC configuration could be introduced into your environment after a developer unknowingly installs a malicious helm chart from the internet without reviewing or inspecting it first.)

In Kubernetes anonymous requests, unauthenticated and unrejected HTTP requests are treated as anonymous access and are identified as a system:anonymous user belonging to a system:unauthenticated group. This means that any entity on the internet can access the cluster and make API requests that are permitted by the role. There aren’t many legitimate use cases for this type of activity, because it’s considered a best practice to use RBAC instead. Anonymous requests are primarily used for setting up health endpoints and custom authentication.

By monitoring EKS audit logs, GuardDuty identifies this activity and generates the finding Policy:Kubernetes/AnonymousAccessGranted, as shown in Figure 1. This finding informs you that a user on your Kubernetes cluster successfully created a ClusterRoleBinding or RoleBinding to bind the user system:anonymous to a role. This action enables unauthenticated access to the API operations permitted by the role.

Figure 1: Example GuardDuty finding for Kubernetes anonymous access granted

Figure 1: Example GuardDuty finding for Kubernetes anonymous access granted

Phase 2 (Discovery) – Discovery of vulnerable EKS clusters

Port scanning is a method that malicious actors use to determine if resources are publicly exposed, with open ports and known vulnerabilities. As an increasing number of open-source tools allows users to search for endpoints connected to the internet, finding these endpoints has become even easier. Security teams can use these open-source tools to their advantage by proactively scanning for and identifying externally exposed resources in their organization.

This brings us to the discovery phase of our misconfigured EKS cluster. The discovery phase is defined by MITRE as follows: “Discovery consists of techniques an adversary may use to gain knowledge about the system and internal network. These techniques help adversaries observe the environment and orient themselves before deciding how to act.”

By granting system:anonymous access to the EKS cluster in our example, the developer allowed requests from any public unauthenticated source. This can result in external web crawlers probing the cluster API, which can often happen within seconds of the system:anonymous access being granted. GuardDuty identifies this activity and generates the finding Discovery:Kubernetes/SuccessfulAnonymousAccess, as shown in Figure 2. This finding informs you that an API operation to discover resources in a cluster was successfully invoked by the system:anonymous user. Remember, all API calls made by system:anonymous are unauthenticated, in addition to /healthz and /version calls that are always unauthenticated regardless of the user identity, and any entity can make use of this user within the EKS cluster.

In the screenshot, under the Action section in the finding details, you can see that the anonymous user made a get request to “/”. This is a generic request that is not specific to a Kubernetes cluster, which may indicate that the crawler is not specifically targeting Kubernetes clusters. You can further see that the Status code is 200, indicating that the request was successful. If this activity is malicious, then the actor is now aware that there is an exposed resource.

Figure 2: Example GuardDuty finding for Kubernetes successful anonymous access

Figure 2: Example GuardDuty finding for Kubernetes successful anonymous access

Phase 3 (Initial Access) – Credential access to obtain Kubernetes secrets

Next, in this phase, you might start observing more targeted API calls for establishing initial access from unauthorized users. MITRE defines initial access as “techniques that use various entry vectors to gain their initial foothold within a network. Techniques used to gain a foothold include targeted spearphishing and exploiting weaknesses on public-facing web servers. Footholds gained through initial access may allow for continued access, like valid accounts and use of external remote services, or may be limited-use due to changing passwords.”

In our example, the malicious actor has established initial access for the EKS cluster which is evident in the next GuardDuty finding, CredentialAccess:Kubernetes/SuccessfulAnonymousAccess, as shown in Figure 3. This finding informs you that an API call to access credentials or secrets was successfully invoked by the system:anonymous user. The observed API call is commonly associated with the credential access tactic where an adversary is attempting to collect passwords, usernames, and access keys for a Kubernetes cluster.

You can see that in this GuardDuty finding, in the Action section, the Request uri is targeted at a Kubernetes cluster, specifically /api/v1/namespaces/kube-system/secrets. This request seems to be targeting the secrets management capabilities that are built into Kubernetes. You can find more information about this secrets management capability in the Kubernetes documentation.

Figure 3: Example GuardDuty finding for Kubernetes successful credential access from anonymous user

Figure 3: Example GuardDuty finding for Kubernetes successful credential access from anonymous user

Phase 4 (Persistence) – Impact to persist unauthorized access to the cluster

The next phase of this scenario is likely to be an impact in the EKS cluster to enable persistence by the malicious actor. MITRE defines impact as “techniques that adversaries use to disrupt availability or compromise integrity by manipulating business and operational processes.” Following the MITRE definitions, “Persistence consists of techniques that adversaries use to keep access to systems across restarts, changed credentials, and other interruptions that could cut off their access. Techniques used for persistence include any access, action, or configuration changes that let them maintain their foothold on systems, such as replacing or hijacking legitimate code or adding startup code.”

In the GuardDuty finding Impact:Kubernetes/SuccessfulAnonymousAccess, shown in Figure 4, you can see the Kubernetes user details and Action sections that indicate that a successful Kubernetes API call was made to create a ClusterRoleBinding by the system:anonymous username. This finding informs you that a write API operation to tamper with resources was successfully invoked by the system:anonymous user. The observed API call is commonly associated with the impact stage of an attack, when an adversary is tampering with resources in your cluster. This activity shows that the system:anonymous user has now created their own role to enable persistent access the EKS cluster. If the user is malicious, they can now access the cluster even if access is removed in the RBAC configuration for the system:anonymous user.

Figure 4 Example GuardDuty finding for Kubernetes successful credential change by anonymous user

Figure 4 Example GuardDuty finding for Kubernetes successful credential change by anonymous user

Phase 5 (Impact) – Impact to manipulate resources for unauthorized activity

The fifth phase of this scenario is where the unauthorized user is likely to focus on impact techniques in order to use the access for malicious purpose. MITRE says of the impact phase: “Techniques used for impact can include destroying or tampering with data. In some cases, business processes can look fine, but may have been altered to benefit the adversaries’ goals. These techniques might be used by adversaries to follow through on their end goal or to provide cover for a confidentiality breach.” Typically, once a malicious actor has access into a system, they will introduce malware to the system to manipulate the compromised resource and possibly also other resources.

With the introduction of GuardDuty Malware Protection, when an Amazon Elastic Compute Cloud (Amazon EC2) or container-related GuardDuty finding that indicates potentially suspicious activity is generated, an agentless scan on the volumes will initiate and detect the presence of malware. Existing GuardDuty customers need to enable Malware Protection, and for new customers this feature is on by default when they enable GuardDuty for the first time. Malware Protection comes with a 30-day free trial for both existing and new GuardDuty customers. You can see a list of findings that initiates a malware scan in the GuardDuty User Guide.

In this example, the malicious actor now uses access to the cluster to perform unauthorized cryptocurrency mining. GuardDuty monitors the DNS requests from the EC2 instances used to host the EKS cluster. This allows GuardDuty to identify a DNS request made to a domain name associated with a cryptocurrency mining pool, and generate the finding CryptoCurrency:EC2/BitcoinTool.B!DNS, as shown in Figure 5.

Figure 5: Example GuardDuty finding for EC2 instance querying bitcoin domain name

Figure 5: Example GuardDuty finding for EC2 instance querying bitcoin domain name

Because this is an EC2 related GuardDuty finding and GuardDuty Malware Protection is enabled in the account, GuardDuty then conducts an agentless scan on the volumes of the EC2 instance to detect malware. If the scan results in a successful detection of one or more malicious files, another GuardDuty finding for Execution:EC2/MaliciousFile is generated, as shown in Figure 6.

Figure 6: Example GuardDuty finding for detection of a malicious file on EC2

Figure 6: Example GuardDuty finding for detection of a malicious file on EC2

The first GuardDuty finding detects crypto mining activity, while the proceeding malware protection finding provides context on the malware associated with this activity. This context is very valuable for the incident response process.

Conclusion

In this post, we walked you through each of the five phases where we outlined how an initial misconfiguration could result in a malicious actor gaining control of EKS resources within an AWS account and how GuardDuty is able to continually monitor and detect the progression of the security event. As previously stated, this is just one example where a misconfiguration in an EKS cluster could result in a security event.

Now that you have a good understanding of GuardDuty capabilities to continuously monitor and detect EKS security events, you will need to establish processes and procedures to enable your security team to investigate these events. You can enable Amazon Detective to help accelerate your security team’s mean time to respond (MTTR) by providing an efficient mechanism to analyze, investigate, and identify the root cause of security events. Follow along in part 2 of this series, How to investigate and take action on an Amazon EKS cluster related security issue with Amazon Detective, where we’ll cover techniques you can use with Amazon Detective to identify impacted EKS resources in your AWS account, possible remediation actions to take on the cluster, and preventative controls you can implement.

If you have feedback about this post, submit comments in the Comments section below. If you have questions about this post, start a thread on Amazon GuardDuty re:Post.

Want more AWS Security news? Follow us on Twitter.
Author

Marshall Jones

Marshall is a worldwide senior security specialist solutions architect at AWS. His background is in AWS consulting and security architecture, focused on a variety of security domains including edge, threat detection, and compliance. Today, he helps enterprise customers adopt and operationalize AWS security services to increase security effectiveness and reduce risk.

Jonathan Nguyen

Jonathan Nguyen

Jonathan is a shared delivery team senior security consultant at AWS. His background is in AWS security, with a focus on threat detection and incident response. He helps enterprise customers develop a comprehensive AWS security strategy, deploy security solutions at scale, and train customers on AWS security best practices.

Manuel Martinez Arizmendi

Manuel Martinez Arizmendi

Manuel works a Security Engineer at Amazon Detective providing new security investigation capabilities to AWS customers. Based on Boston,MA and originally from Madrid, Spain, when he’s not at work, he enjoys playing and watching soccer, playing videogames, and hanging out with his friends.

Use Amazon Inspector to manage your build and deploy pipelines for containerized applications

Post Syndicated from Scott Ward original https://aws.amazon.com/blogs/security/use-amazon-inspector-to-manage-your-build-and-deploy-pipelines-for-containerized-applications/

Amazon Inspector is an automated vulnerability management service that continually scans Amazon Web Services (AWS) workloads for software vulnerabilities and unintended network exposure. Amazon Inspector currently supports vulnerability reporting for Amazon Elastic Compute Cloud (Amazon EC2) instances and container images stored in Amazon Elastic Container Registry (Amazon ECR).

With the emergence of Docker in 2013, container technology has quickly moved from the experimentation phase into a viable production tool. Many customers are using containers to modernize their existing applications or as the foundations for new applications or services that they build. In this blog post, we’ll explore the process that Amazon Inspector takes to scan container images. We’ll also show how you can integrate Amazon Inspector into your containerized application build and deployment pipeline, and control pipeline steps based on the results of an Amazon Inspector container image scan.

Solution overview and walkthrough

The solution outlined in this post covers a deployment pipeline modeled in AWS CodePipeline. The source for the pipeline is AWS CodeCommit, and the build of the container image is performed by AWS CodeBuild. The solution uses a collection of AWS Lambda functions and an Amazon DynamoDB table to evaluate the container image status and make an automated decision about deploying the container image. Finally, the pipeline has a deploy stage that will deploy the container image into an Amazon Elastic Container Service (Amazon ECS) cluster. In this section, I’ll outline the key components of the solution and how they work. In the following section, Deploy the solution, I’ll walk you through how to actually implement the solution.

Although this solution uses AWS continuous integration and continuous delivery (CI/CD) services such as CodePipeline and CodeBuild, you can also build similar capabilities by using third-party CI/CD solutions. In addition to CodeCommit, other third-party code repositories such as GitHub or Amazon Simple Storage Service (Amazon S3) can be substituted in as a source for the pipeline.

Solution architecture

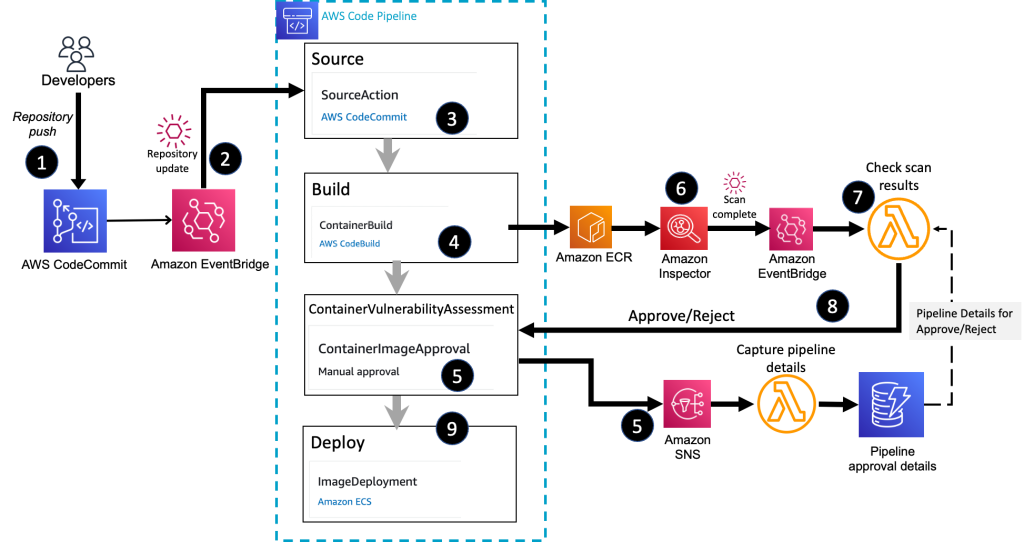
Figure 1 shows the high-level architecture of the solution, which integrates Amazon Inspector into a container build and deploy pipeline.

Figure 1: Overall container build and deploy architecture

Figure 1: Overall container build and deploy architecture

The high-level workflow is as follows:

  1. You commit the image definition to a CodeCommit repository.
  2. An Amazon EventBridge rule detects the repository commit and initiates the container pipeline.
  3. The source stage of the pipeline pulls the image definition and build instructions from the CodeCommit repository.
  4. The build stage of the pipeline creates the container image and stores the final image in Amazon ECR.
  5. The ContainerVulnerabilityAssessment stage sends out a request for approval by using an Amazon Simple Notification Service (Amazon SNS) topic. A Lambda function associated with the topic stores the details about the container image and the active pipeline, which will be needed in order to send a response back to the pipeline stage.
  6. Amazon Inspector scans the Amazon ECR image for vulnerabilities.
  7. The Lambda function receives the Amazon Inspector scan summary message, through EventBridge, and makes a decision on allowing the image to be deployed. The function retrieves the pipeline approval details so that the approve or reject message is sent to the correct active pipeline stage.
  8. The Lambda function submits an Approved or Rejected status to the deployment pipeline.
  9. CodePipeline deploys the container image to an Amazon ECS cluster and completes the pipeline successfully if an approval is received. The pipeline status is set to Failed if the image is rejected.

Container image build stage

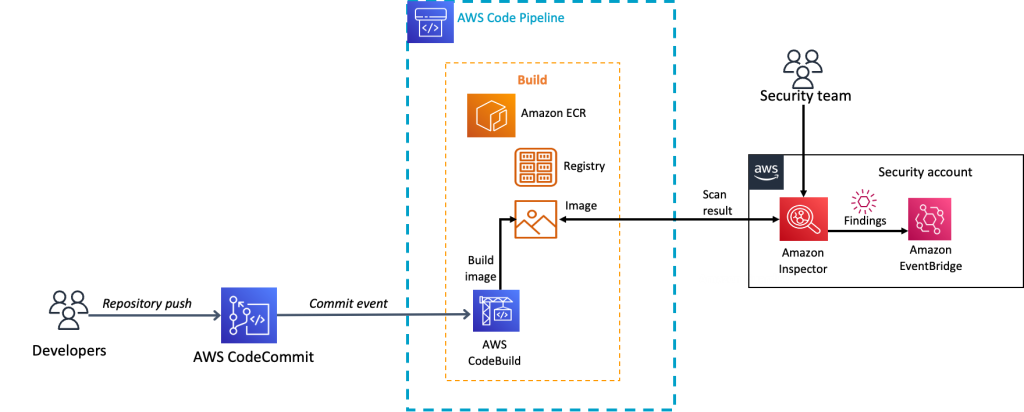
Let’s now review the build stage of the pipeline that is associated with the Amazon Inspector container solution. When a new commit is made to the CodeCommit repository, an EventBridge rule, which is configured to look for updates to the CodeCommit repository, initiates the CodePipeline source action. The source action then collects files from the source repository and makes them available to the rest of the pipeline stages. The pipeline then moves to the build stage.

In the build stage, CodeBuild extracts the Dockerfile that holds the container definition and the buildspec.yaml file that contains the overall build instructions. CodeBuild creates the final container image and then pushes the container image to the designated Amazon ECR repository. As part of the build, the image digest of the container image is stored as a variable in the build stage so that it can be used by later stages in the pipeline. Additionally, the build process writes the name of the container URI, and the name of the Amazon ECS task that the container should be associated with, to a file named imagedefinitions.json. This file is stored as an artifact of the build and will be referenced during the deploy phase of the pipeline.

Now that the image is stored in an Amazon ECR repository, Amazon Inspector scanning begins to check the image for vulnerabilities.

The details of the build stage are shown in Figure 2.

Figure 2: The container build stage

Figure 2: The container build stage

Container image approval stage

After the build stage is completed, the ContainerVulnerabilityAssessment stage begins. This stage is lightweight and consists of one stage action that is focused on waiting for an Approved or Rejected message for the container image that was created in the build stage. The ContainerVulnerabilityAssessment stage is configured to send an approval request message to an SNS topic. As part of the approval request message, the container image digest, from the build stage, will be included in the comments section of the message. The image digest is needed so that approval for the correct container image can be submitted later. Figure 3 shows the comments section of the approval action where the container image digest is referenced.

Figure 3: Container image digest reference in approval action configuration

Figure 3: Container image digest reference in approval action configuration

The SNS topic that the pipeline approval message is sent to is configured to invoke a Lambda function. The purpose of this Lambda function is to pull key details from the SNS message. Details retrieved from the SNS message include the pipeline name and stage, stage approval token, and the container image digest. The pipeline name, stage, and approval token are needed so that an approved or rejected response can be sent to the correct pipeline. The container image digest is the unique identifier for the container image and is needed so that it can be associated with the correct active pipeline. This information is stored in a DynamoDB table so that it can be referenced later when the step that assesses the result of an Amazon Inspector scan submits an approved or rejected decision for the container image. Figure 4 illustrates the flow from the approval stage through storing the pipeline approval data in DynamoDB.

Figure 4: Flow to capture container image approval details

Figure 4: Flow to capture container image approval details

This approval action will remain in a pending status until it receives an Approved or Rejected message or the timeout limit of seven days is reached. The seven-day timeout for approvals is the default for CodePipeline and cannot be changed. If no response is received in seven days, the stage and pipeline will complete with a Failed status.

Amazon Inspector and container scanning

When the container image is pushed to Amazon ECR, Amazon Inspector scans it for vulnerabilities.

In order to show how you can use the findings from an Amazon Inspector container scan in a build and deploy pipeline, let’s first review the workflow that occurs when Amazon Inspector scans a container image located in Amazon ECR.

Figure 5: Image push, scan, and notification workflow

Figure 5: Image push, scan, and notification workflow

The workflow diagram in Figure 5 outlines the steps that happen after an image is pushed to Amazon ECR all the way to messaging that the image has been successfully scanned and what the final scan results are. The steps in this workflow are as follows:

  1. The final container image is pushed to Amazon ECR by an individual or as part of a build.
  2. Amazon ECR sends a message indicating that a new image has been pushed.
  3. The message about the new image is received by Amazon Inspector.
  4. Amazon Inspector pulls a copy of the container image from Amazon ECR and performs a vulnerability scan.
  5. When Amazon Inspector is done scanning the image, a message summarizing the severity of vulnerabilities that were identified during the container image scan is sent to Amazon EventBridge. You can create EventBridge rules that match the vulnerability summary message to route the message onto a target for notifications or to enable further action to be taken.

Here’s a sample EventBridge pattern that matches the scan summary message from Amazon Inspector.

{
  "detail-type": ["Inspector2 Scan"],
  "source": ["aws.inspector2"]
}

This entire workflow, from ingesting the initial image to sending out the status on the Amazon Inspector scan, is fully managed. You just focus on how you want to use the Amazon Inspector scan status message to govern the approval and deployment of your container image.

The following is a sample of what the Amazon Inspector vulnerability summary message looks like. Note, in bold, the container image Amazon Resource Name (ARN), image repository ARN, message detail type, image digest, and the vulnerability summary.

{
    "version": "0",
    "id": "bf67fc08-f522-f598-6946-8e7b372ba426",
    "detail-type": "Inspector2 Scan",
    "source": "aws.inspector2",
    "account": "<account id>",
    "time": "2022-05-25T16:08:17Z",
    "region": "us-east-2",
    "resources":
    [
        "arn:aws:ecr:us-east-2:<account id>:repository/vuln-images/vulhub/rsync"
    ],
    "detail":
    {
        "scan-status": "INITIAL_SCAN_COMPLETE",
        "repository-name": "arn:aws:ecr:us-east-2:<account id>:repository/vuln-images/vulhub/rsync",
        "finding-severity-counts": { "CRITICAL": 3, "HIGH": 16, "MEDIUM": 4, "TOTAL": 24 },
        "image-digest": "sha256:21ae0e3b7b7xxxx",
        "image-tags":
        [
            "latest"
        ]
    }
}

Processing Amazon Inspector scan results

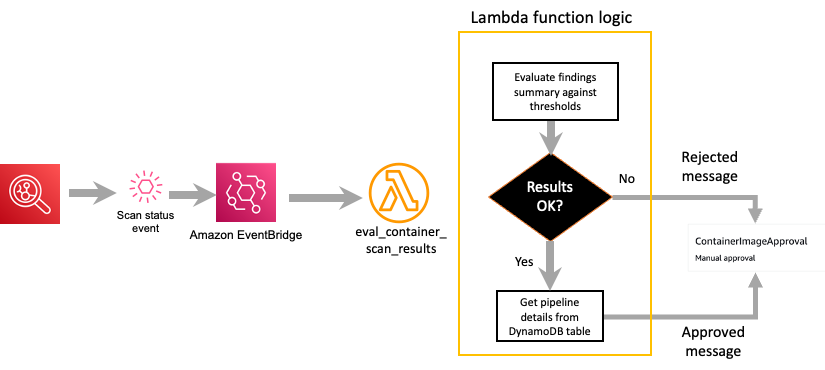
After Amazon Inspector sends out the scan status event, a Lambda function receives and processes that event. This function needs to consume the Amazon Inspector scan status message and make a decision about whether the image can be deployed.

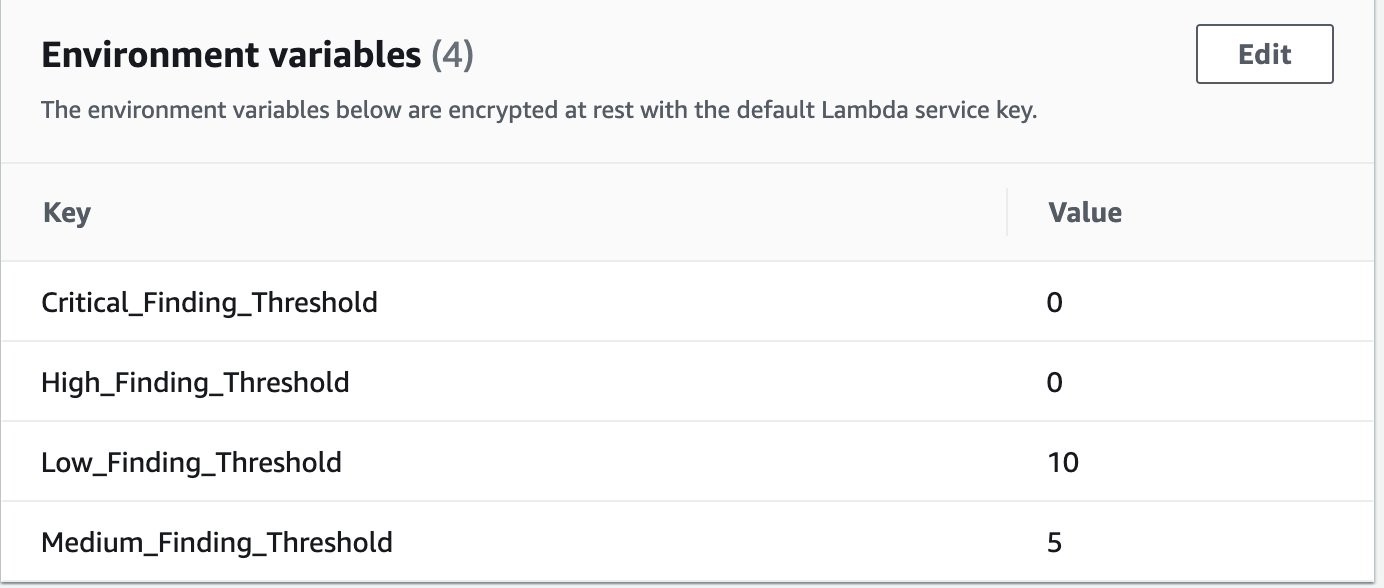
The eval_container_scan_results Lambda function serves two purposes: The first is to extract the findings from the Amazon Inspector scan message that invoked the Lambda function. The second is to evaluate the findings based on thresholds that are defined as parameters in the Lambda function definition. Based on the threshold evaluation, the container image will be flagged as either Approved or Rejected. Figure 6 shows examples of thresholds that are defined for different Amazon Inspector vulnerability severities, as part of the Lambda function.

Figure 6: Vulnerability thresholds defined in Lambda environment variables

Figure 6: Vulnerability thresholds defined in Lambda environment variables

Based on the container vulnerability image results, the Lambda function determines whether the image should be approved or rejected for deployment. The function will retrieve the details about the current pipeline that the image is associated with from the DynamoDB table that was populated by the image approval action in the pipeline. After the details about the pipeline are retrieved, an Approved or Rejected message is sent to the pipeline approval action. If the status is Approved, the pipeline continues to the deploy stage, which will deploy the container image into the defined environment for that pipeline stage. If the status is Rejected, the pipeline status is set to Rejected and the pipeline will end.

Figure 7 highlights the key steps that occur within the Lambda function that evaluates the Amazon Inspector scan status message.

Figure 7: Amazon Inspector scan results decision

Figure 7: Amazon Inspector scan results decision

Image deployment stage

If the container image is approved, the final image is deployed to an Amazon ECS cluster. The deploy stage of the pipeline is configured with Amazon ECS as the action provider. The deploy action contains the name of the Amazon ECS cluster and stage that the container image should be deployed to. The image definition file (imagedefinitions.json) that was created in the build stage is also listed in the deploy configuration. When the deploy stage runs, it will create a revision to the existing Amazon ECS task definition. This task definition contains the name of the Amazon ECR image that has been approved for deployment. The task definition is then deployed to the Amazon ECS cluster and service.

Deploy the solution

Now that you have an understanding of how the container pipeline solution works, you can deploy the solution to your own AWS account. This section will walk you through the steps to deploy the container approval pipeline, and show you how to verify that each of the key steps is working.

Step 1: Activate Amazon Inspector in your AWS account

The sample solution provided by this blog post requires that you activate Amazon Inspector in your AWS account. If this service is not activated in your account, learn more about the free trial and pricing for this service, and follow the steps in Getting started with Amazon Inspector to set up the service and start monitoring your account.

Step 2: Deploy the AWS CloudFormation template

For this next step, make sure you deploy the template within the AWS account and AWS Region where you want to test this solution.

To deploy the CloudFormation stack

  1. Choose the following Launch Stack button to launch a CloudFormation stack in your account. Use the AWS Management Console navigation bar to choose the region you want to deploy the stack in.

    Select this image to open a link that starts building the CloudFormation stack

  2. Review the stack name and the parameters for the template. The parameters are pre-populated with the necessary values, and there is no need to change them.
  3. Scroll to the bottom of the Quick create stack screen and select the checkbox next to I acknowledge that AWS CloudFormation might create IAM resources.
  4. Choose Create stack. The deployment of this CloudFormation stack will take 3–5 minutes.

After the CloudFormation stack has deployed successfully, you can proceed to reviewing and interacting with the deployed solution.

Step 3: Review the container pipeline and supporting resources

The CloudFormation stack is designed to deploy a collection of resources that will be used for an initial container build. When the CodePipeline resource is created, it will automatically pull the assets from the CodeCommit repository and start the pipeline for the container image.

To review the pipeline and resources

  1. In the CodePipeline console, navigate to the Region that the stack was deployed in.
  2. Choose the pipeline named ContainerBuildDeployPipeline to show the full pipeline details.
  3. Review the Source and Build stage, which will show a status of Succeeded.
  4. Review the ContainerVulnerabilityAssessment stage, which will show as failed with a Rejected status in the Manual Approval step.

    Figure 8 shows the full completed pipeline.

    Figure 8: Rejected container pipeline

    Figure 8: Rejected container pipeline

  5. Choose the Details link in the Manual Approval stage to reveal the reasons for the rejection. An example review summary is shown in Figure 9.
    Figure 9: Container pipeline approval rejection

    Figure 9: Container pipeline approval rejection

Review findings in Amazon Inspector (Optional)

You can use the Amazon Inspector console to see the full findings detail for this container image, if needed.

To view the findings in Amazon Inspector

  1. In the Amazon Inspector console, under Findings, choose By repository.
  2. From the list of repositories, choose the inspector-blog-images repository.
  3. Choose the Image tag link to bring up a list of the individual vulnerabilities that were found within the container image. Figure 10 shows an example of the vulnerabilities list in the findings details.
    Figure 10: Container image findings in Amazon Inspector

    Figure 10: Container image findings in Amazon Inspector

Step 4: Adjust the Amazon ECS desired count for the cluster service

Up to this point, you’ve deployed a pipeline to build and validate the container image, and you’ve seen an example of how the pipeline handles a container image that did not meet the defined vulnerability thresholds. Now you’ll deploy a new container image that will pass a vulnerability assessment and complete the pipeline.

The Amazon ECS service that the CloudFormation template deploys is initially created with the number of desired tasks set to 0. In order to allow the container pipeline to successfully deploy a container, you need to update the desired tasks value.

To adjust the task count in Amazon ECS (console)

  1. In the Amazon ECS console, choose the link for the cluster, in this case InspectorBlogCluster.
  2. On the Services tab, choose the link for the service named InspectorBlogService.
  3. Choose the Update button. On the Configure service page, set Number of tasks to 1.
  4. Choose Skip to review, and then choose Update Service.

To adjust the task count in Amazon ECS (AWS CLI)

Alternatively, you can run the following AWS CLI command to update the desired task count to 1. In order to run this command, you need the ARN of the Amazon ECS cluster, which you can retrieve from the Output tab of the CloudFormation stack that you created. You can run this command from the command line of an environment of your choosing, or by using AWS CloudShell. Make sure to replace <Cluster ARN> with your own value.

$ aws ecs update-service --cluster <Cluster ARN> --service InspectorBlogService --desired-count 1

Step 5: Build and deploy a new container image

Deploying a new container image will involve pushing an updated Dockerfile to the ContainerComponentsRepo repository in CodeCommit. With CodeCommit you can interact by using standard Git commands from a command line prompt, and there are multiple approaches that you can take to connect to the AWS CodeCommit repository from the command line. For this post, in order to simplify the interactions with CodeCommit, you will be shown how to add an updated file directly through the CodeCommit console.

To add an updated Dockerfile to CodeCommit

  1. In the CodeCommit console, choose the repository named ContainerComponentsRepo.
  2. In the screen listing the repository files, choose the Dockerfile file link and choose Edit.
  3. In the Edit a file form, overwrite the existing file contents with the following command:
    FROM public.ecr.aws/amazonlinux/amazonlinux:latest
  4. In the Commit changes to main section, fill in the following fields.
    1. Author name: your name
    2. Email address: your email
    3. Commit message: ‘Updated Dockerfile’

    Figure 11 shows what the completed form should look like.

    Figure 11: Complete CodeCommit entry for an updated Dockerfile

    Figure 11: Complete CodeCommit entry for an updated Dockerfile

  5. Choose Commit changes to save the new Dockerfile.

This update to the Dockerfile will immediately invoke a new instance of the container pipeline, where the updated container image will be pulled and evaluated by Amazon Inspector.

Step 6: Verify the container image approval and deployment

With a new pipeline initiated through the push of the updated Dockerfile, you can now review the overall pipeline to see that the container image was approved and deployed.

To see the full details in CodePipeline

  1. In the CodePipeline console, choose the container-build-deploy pipeline. You should see the container pipeline in an active status. In about five minutes, you should see the ContainerVulnerabilityAssessment stage move to completed with an Approved status, and the deploy stage should show a Succeeded status.
  2. To confirm that the final image was deployed to the Amazon ECS cluster, from the Deploy stage, choose Details. This will open a new browser tab for the Amazon ECS service.
  3. In the Amazon ECS console, choose the Tasks tab. You should see a task with Last status showing RUNNING. This is confirmation that the image was successfully approved and deployed through the container pipeline. Figure 12 shows where the task definition and status are located.
    Figure 12: Task status after deploying the container image

    Figure 12: Task status after deploying the container image

  4. Choose the task definition to bring up the latest task definition revision, which was created by the deploy stage of the container pipeline.
  5. Scroll down in the task definition screen to the Container definitions section. Note that the task is tied to the image you deployed, providing further verification that the approved container image was successfully deployed. Figure 13 shows where the container definition can be found and what you should expect to see.
    Figure 13: Container associated with revised task definition

    Figure 13: Container associated with revised task definition

Clean up the solution

When you’re finished deploying and testing the solution, use the following steps to remove the solution stack from your account.

To delete images from the Amazon ECR repository

  1. In the Amazon ECR console, navigate to the AWS account and Region where you deployed the solution.
  2. Choose the link for the repository named inspector-blog-images.
  3. Delete all of the images that are listed in the repository.

To delete objects in the CodePipeline artifact bucket

  1. In the Amazon S3 console in your AWS account, locate the bucket whose name starts with blog-base-setup-codepipelineartifactstorebucket.
  2. Delete the ContainerBuildDeploy folder that is in the bucket.

To delete the CloudFormation stack

  • In the CloudFormation console, delete the CloudFormation stack that was created to perform the steps in this post.

Conclusion

This post describes a solution that allows you to build your container images, have the images scanned for vulnerabilities by Amazon Inspector, and use the output from Amazon Inspector to determine whether the image should be allowed to be deployed into your environments.

This solution represents a pipeline with very simple build and deploy stages. Your pipeline will vary and may consist of multiple test stages and deployment stages for multiple environments. Additionally, the logic you use to determine whether a container image should be deployed may be different. The contents of this blog post are intended to help serve as a foundation that you can build on as you decide how to use Amazon Inspector for container vulnerability scanning. Feel free to use this guidance, and the example we provided, to extend the solution into your specific deployment pipeline.

 
If you have questions, contact AWS Support, or start a new thread on the AWS re:Post Amazon Inspector Forum. If you have feedback about this post, submit comments in the Comments section below.

Want more AWS Security news? Follow us on Twitter.
Scott Ward

Scott Ward

Scott is a Principal Solutions Architect with the External Security Services (ESS) product team and has been with Amazon for over 20 years. Scott provides technical guidance to customers on how to use security services to protect their AWS environments. Past roles included technical lead for the AWS security partner segment and member of the technical team for Amazon.com’s global financial systems.

How to use new Amazon GuardDuty EKS Protection findings

Post Syndicated from Marshall Jones original https://aws.amazon.com/blogs/security/how-to-use-new-amazon-guardduty-eks-protection-findings/

If you run container workloads that use Amazon Elastic Kubernetes Service (Amazon EKS), Amazon GuardDuty now has added support that will help you better protect these workloads from potential threats. Amazon GuardDuty EKS Protection can help detect threats related to user and application activity that is captured in Kubernetes audit logs. Newly-added Kubernetes threat detections include Amazon EKS clusters that are accessed by known malicious actors or from Tor nodes, API operations performed by anonymous users that might indicate a misconfiguration, and misconfigurations that can result in unauthorized access to Amazon EKS clusters. By using machine learning (ML) models, GuardDuty can identify patterns consistent with privilege-escalation techniques, such as a suspicious launch of a container with root-level access to the underlying Amazon Elastic Compute Cloud (Amazon EC2) host. In this post, we give you an overview of the new GuardDuty EKS Protection feature; show you examples of new finding details; and help you understand, operationalize, and respond to these new findings.

Amazon GuardDuty is an automated threat detection service that continuously monitors for suspicious activity and potentially unauthorized behavior to help protect your AWS accounts, Amazon EC2 workloads, data stored in Amazon Simple Storage Service (S3), and now Amazon EKS workloads.

If you are already a GuardDuty customer, you can enable GuardDuty EKS Protection and efficiently navigate the console to begin to use this feature. Your delegated administrator accounts can enable this for existing member accounts and determine if new AWS accounts in an organization will be automatically enrolled. If you are new to GuardDuty, the EKS Protection feature is included as part of the service’s 30-day trial period. As part of the 30-day trial period, you can take full advantage of this new feature and gain insight into your Amazon EKS workloads.

Overview of GuardDuty EKS Protection

GuardDuty EKS Protection enables GuardDuty to detect suspicious activities and potential compromises of your EKS clusters by analyzing Kubernetes audit logs. Kubernetes audit logs provide a security relevant, chronological set of records documenting the sequence of events from individual users, administrators, or system components that have affected your cluster. Audit logs can help answer questions such as: What happened? When did it happen? Who initiated it? GuardDuty EKS Protection analyzes Kubernetes audit logs from your Amazon EKS clusters, both new and existing, without the need to configure EKS control plane logging in your environment. GuardDuty collects these Kubernetes audit logs in addition to AWS CloudTrail, Amazon Virtual Private Cloud (Amazon VPC) flow logs, DNS queries, and Amazon S3 data events. GuardDuty EKS Protection performs analysis and looks for suspicious activity without the need for agents or adding resource constraints to your environment.

To detect threats using Kubernetes audit logs, GuardDuty uses a combination of machine learning, anomaly detection, and integrated threat intelligence to identify and prioritize potential threats. These findings primarily align to five root causes including compromised container images, configuration issues, Kubernetes user compromise, pod compromise, and node compromise. An example of a configuration issue is granting unnecessary privileges to the anonymous user by misconfiguring role-based access control (RBAC), which may inadvertently allow anonymous and unauthenticated calls to the Kubernetes API. A Kubernetes user compromise example could be a bad actor using stolen credentials to deploy containers with insecure settings, to use for a variety of activities from command and control to crypto-mining.

After a threat is detected, GuardDuty generates a security finding that includes container details such as the pod ID, container image ID, and tags associated with the Amazon EKS cluster. These finding details assist you with understanding the root cause which you can use to identify basic steps to remediate findings specific to EKS clusters. For example, your response to a finding or group of findings associated with a compromised Kubernetes user might begin with revoking access. For more information, see Remediating Kubernetes security issues discovered by GuardDuty in the Amazon GuardDuty User Guide.

Understanding new GuardDuty EKS Protection findings

As adversaries continue to become more sophisticated, it becomes even more important for you to align to a common framework to understand the tactics, techniques, and procedures (TTPs) behind an individual event. GuardDuty aligns findings using the MITRE ATT&CK framework, which is a globally-accessible knowledge base of adversary tactics and techniques based on real-world observations. GuardDuty findings have a specific finding format that helps you understand details of each finding. If you examine the ThreatPurpose portion in the GuardDuty EKS Protection finding types, you see there are finding types associated with various MITRE ATT&CK tactics, including CredentialAccess, DefenseEvasion, Discovery, Impact, Persistence, and PrivilegeEscalation. This can help you identify and understand the type of activity associated with a finding.

For example, look at two different finding types that seem similar: Impact:Kubernetes/SuccessfulAnonymousAccess and Discovery:Kubernetes/SuccessfulAnonymousAccess. You can see the difference is the ThreatPurpose at the beginning. They are both involved with successful anonymous access, and the difference is the intent of the activity associated with each finding. GuardDuty has determined based on the API or request URI invoked, that in this example, the activity seen on one finding aligns with the Impact tactic whereas the other finding aligns with the Discovery tactic

With GuardDuty EKS Protection, you now have an additional mechanism to gain insight into your EKS clusters across your accounts to look for suspicious activity. You can be alerted to Kubernetes-specific suspicious activity including: allowing administrator access to the default service account, exposing a Kubernetes dashboard, and launching a container with sensitive host paths. With this new feature, GuardDuty is also able to extend support for finding types that you might already be familiar with that also apply to Amazon EKS workloads. These finding types include calls to a Kubernetes cluster API from a Tor node, or calls to a Kubernetes cluster from a known malicious IP address, which can indicate that there are interactions with your Kubernetes clusters from sources that are commonly associated with malicious actors.

Responding to GuardDuty EKS Protection findings

This section gives an overview of three new GuardDuty EKS Protection findings, how to prevent them, and how to investigate and respond if they happen in your environment. The patterns shown can also act as a guide for how to prevent, investigate, and respond to other GuardDuty EKS Protection findings.

Discovery:Kubernetes/SuccessfulAnonymousAccess

Finding documentation: Discovery:Kubernetes/SuccessfulAnonymousAccess

Severity: Medium

Overview: This finding (as shown in Figure 1) informs you that an API operation was successfully invoked by the system:anonymous user. API calls made by system:anonymous are unauthenticated. The observed API is commonly associated with the discovery stage of an attack when an adversary is gathering information on your Kubernetes cluster. This activity indicates that anonymous or unauthenticated access is permitted on the API action reported in the finding, and may be permitted on other actions. These API calls are possible because of a misconfiguration of the system:anonymous user or system:unauthenticated group.

Preventative measures: AWS recommends that you disable unnecessary anonymous authentication. For instructions, see Review and revoke unnecessary anonymous access in the Amazon EKS Best Practices Guides. It is important to note that Kubernetes versions older than 1.14 granted system:discovery and system:basic-user roles to system:anonymous user by default, and these permissions remain in place after updating unless you explicitly change them.

How to remediate: To respond to this finding, it is important to first identify the details of the activity, for example what cluster is involved? Who is the owner of this cluster? This information will assist you with the remediation steps that follow, to review and revoke unnecessary permissions, and also help you determine a root cause.
 

Figure 1: GuardDuty Console showing Discovery:Kubernetes/SuccessfulAnonymousAccess finding type

Figure 1: GuardDuty Console showing Discovery:Kubernetes/SuccessfulAnonymousAccess finding type

Remediation step 1: Examine permissions

The first step is to examine the permissions that have been granted to the system:anonymous user, and determine what permissions are needed. To accomplish this, you need to first understand what permissions the system:anonymous user has. You can use an rbac-lookup tool to list the Kubernetes roles and cluster roles bound to users, service accounts, and groups. An alternative method can be found at this GitHub page.

./rbac-lookup | grep -P 'system:(anonymous)|(unauthenticated)'
system:anonymous               cluster-wide        ClusterRole/system:discovery
system:unauthenticated         cluster-wide        ClusterRole/system:discovery
system:unauthenticated         cluster-wide        ClusterRole/system:public-info-viewer

Remediation step 2: Disassociate groups

Next, you disassociate the system:unauthenticated group from system:discovery and system:basic-user ClusterRoles, which you do by editing the ClusterRoleBinding. Make sure to not remove system:unauthenticated from the system:public-info-viewer cluster role binding, because that will prevent the Network Load Balancer from performing health checks against the API server. For more information, see Network Load Balancer in the AWS Load Balancer Controller Guide and Identity and Access Management in Amazon EKS Best Practices Guide.

To disassociate the appropriate groups

  1. Run the command kubectl edit clusterrolebindings system:discovery. This command will open the current definition of system:discovery ClusterRoleBinding in your editor as shown in the sample .yaml configuration file:
    # Please edit the object below. Lines beginning with a '#' will be ignored,
    # and an empty file will abort the edit. If an error occurs while saving this # file will be reopened with the relevant failures.
    #
    apiVersion: rbac.authorization.k8s.io/v1
    kind: ClusterRoleBinding
    metadata:
      annotations:
        rbac.authorization.kubernetes.io/autoupdate: "true"
      creationTimestamp: "2021-06-17T20:50:49Z"
      labels:
        kubernetes.io/bootstrapping: rbac-defaults
      name: system:discovery
      resourceVersion: "24502985"
      selfLink: /apis/rbac.authorization.k8s.io/v1/clusterrolebindings/system%3Adiscovery
      uid: b7936268-5043-431a-a0e1-171a423abeb6
    roleRef:
      apiGroup: rbac.authorization.k8s.io
      kind: ClusterRole
      name: system:discovery
    subjects:
    - apiGroup: rbac.authorization.k8s.io
      kind: Group
      name: system:authenticated
    - apiGroup: rbac.authorization.k8s.io
      kind: Group
      name: system:unauthenticated
    

  2. Delete the entry for system:unauthenticated group, which is highlighted in bold in the subjects section.
  3. Repeat the same steps for system:basic-user ClusterRoleBinding.

If there is no reason that the system:anonymous user should be used in your environment, AWS recommends that you set up automatic response and remediation steps 1-3. For more information about the system:anonymous user, see Identity and Access Management in Amazon EKS Best Practices Guide.

PrivilegeEscalation:Kubernetes/PrivilegedContainer

Finding documentation: PrivilegeEscalation:Kubernetes/PrivilegedContainer

Severity: Medium

Overview: This finding (as shown in Figure 2) informs you that a privileged container was launched on your Kubernetes cluster using an image that has never before been used to launch privileged containers in your cluster. A privileged container has root level access on the host. Adversaries commonly launch privileged containers to perform privilege escalation to gain access and compromise the underlying host.

Preventative measures: Create and enforce policy-as-code (PAC) or Pod Security Standards (PSS) that require that pods be created as non-privileged. For more information, see Pod Security in the in Amazon EKS Best Practices Guide.

How to remediate: To respond to this finding, it is important to first identify the details of the activity and begin to answer questions that will help determine what happened. For example, what pod or workload was launched? Who was the user that launched this pod or workload? What cluster is involved?
 

Figure 2: GuardDuty Console showing PrivilegeEscalation:Kubernetes/PrivilegedContainer finding type

Figure 2: GuardDuty Console showing PrivilegeEscalation:Kubernetes/PrivilegedContainer finding type

If this privileged container launch is unexpected, the credentials of the user identity used to launch the container may be compromised. You should then focus on remediating and reviewing access to your cluster, and remediating the user. To do this, follow the procedure in the Remediating a compromised Kubernetes user section of this post. Next, you should identify compromised pods using the procedure in the Identifying and remediating compromised pods section of this post.

If you know what specific circumstances a privileged container can be deployed in your environment, for example only in a specific namespace, it is likely you can automatically remediate any GuardDuty EKS Protection finding associated with a privileged container in any other namespace. For more information about automated response activities, see Incident response and forensics in the Amazon EKS Best Practices Guide.

Persistence:Kubernetes/ContainerWithSensitiveMount

Finding documentation: Persistence:Kubernetes/ContainerWithSensitiveMount

Severity: Medium

Overview: This finding (as shown in Figure 3) informs you that a container was launched with a configuration that included a sensitive host path with write access in the volumeMounts section. This makes the sensitive host path accessible and writable from inside the container. This technique is commonly used by adversaries to gain access to the host’s filesystem.

Preventative Measures: Create and enforce policy-as-code (PAC) or Pod Security Standards (PSS) that use the allowedHostPaths control to only allow required host paths for use in volumes and preferably with read-only access. For more information, see Pod Security in the Amazon EKS Best Practices Guide.

How to remediate: To respond to this finding, it is important to first identify the details of the activity and begin to answer questions that will help determine what happened. For example, what pod or workload was launched? Who was the user that launched this pod or workload? What cluster is involved?
 

Figure 3: GuardDuty Console showing Persistence:Kubernetes/ContainerWithSensitiveMount finding type

Figure 3: GuardDuty Console showing Persistence:Kubernetes/ContainerWithSensitiveMount finding type

If the container launched is unexpected, the credentials of the user identity used to launch the container may be compromised. You should then focus on remediating and reviewing access to your cluster and remediating the user. To do this, follow the procedure in the next section, Remediating a compromised Kubernetes user.

If you can determine what containers should and should not be launched with writable hostPath mounts, then you can create automatic response and remediation for this use case. For example, you might want to revoke temporary security credentials assigned to the pod or worker node. For more information about revoking temporary security credentials and other response and remediation actions, see Incident response and forensics in the Amazon EKS Best Practices Guide.

Remediating a compromised Kubernetes user

If the compromised user has privileges to read secrets of one or more namespaces, rotate all of the affected secrets. For more information about the different types of secrets, see Secrets in the Kubernetes documentation. If the user has write privileges, AWS recommends auditing all changes made by the user in question. You can accomplish this by querying audit logs, if you have enabled EKS control plane logging on your EKS cluster. If you do not currently have logging enabled, follow the instructions for Enabling and disabling control plane logs in the Amazon EKS User Guide. Amazon EKS stores these control plane logs in Amazon CloudWatch Logs in your account. You can use CloudWatch Logs Insights to list all the mutating changes that the compromised user has made.

Remediation step 1: Identify the user

All actions performed on a Kubernetes cluster has an associated identity. GuardDuty EKS Protection findings report details of the Kubernetes user identity that the malicious actor may have compromised. You can find details of the user identity in the GuardDuty console under the Kubernetes user details section in the finding details, or in the finding JSON under the resources.eksClusterDetails.kubernetesDetails.kubernetesUserDetails section. These user details include username, UID, and groups that the user belongs to.

Remediation step 2: Identify changes

  1. Identify the changes made by the attacker associated with the compromised user identity by using the code example below to query CloudWatch Logs Insights, replacing the placeholders with your values.
    fields @timestamp, @message
    | filter user.username == <username> 
    | filter verb == "create" or verb == "update" or verb == "patch"
    | filter responseStatus.code >= 200 and responseStatus.code <= 300
    | filter @timestamp >= <approximate start time of the attack in epoch milliseconds>

    For example:

    fields @timestamp, @message
    | filter user.username == "kubernetes-admin" 
    | filter verb == "create" or verb == "update" or verb == "patch"
    | filter responseStatus.code >= 200 and responseStatus.code <= 300
    | filter @timestamp >= 1628279482312
    

  2. An EKS cluster can have multiple types of user identities, for example the kubernetes-admin user, aws-auth ConfigMap defined user, and so on. You will need to take actions appropriate for the user type to properly revoke its access. For more information, see Remediating compromised Kubernetes users in the Amazon GuardDuty User Guide.
  3. (Optional) If the compromised user identity had extensive privileges and you determine that the attacker made extensive changes to the cluster, you should consider isolating the pod, followed by creating a new clean cluster and redeploying your applications to the new cluster. For instructions to isolate and redeploy EKS pods, see Isolate the Pod by creating a Network Policy that denies all ingress and egress traffic to the pod in the Amazon EKS Best Practices Guide.

Identifying and remediating compromised pods

If a GuardDuty EKS Protection finding is caused by activity related to a specific pod, the value of the finding JSON resource.kubernetesDetails.kubernetesWorkloadDetails.type field is pod. The finding includes the name of the pod and namespace in the resource.kubernetesDetails.kubernetesWorkloadDetails.name and resource.kubernetesDetails.kubernetesWorkloadDetails.namespace fields, which uniquely identify the pod.

In other cases, such as when a service account or a Kubernetes workload name is in the resource.kubernetesDetails.kubernetesUserDetails, you can follow the instructions in the Sample incident response plan to identify compromised pods using different pieces of information available in the GuardDuty EKS Protection findings.

After you have identified compromised pods, to remediate, use the instructions to isolate the pods, rotate the credentials, and gather data for forensic analysis in Isolate the Pod by creating a Network Policy that denies all ingress and egress traffic to the pod in the Amazon EKS Best Practices Guide.

Conclusion

In this post, you learned the details of the new Amazon GuardDuty EKS Protection feature, and Kubernetes audit logs, and you saw examples for how to understand, operationalize, and respond to these new findings. You can enable this feature through the GuardDuty Console or APIs to start monitoring your Amazon EKS clusters today. If you have created Amazon EventBridge Rules to send findings from GuardDuty to a target, then ensure that your rules are configured to deliver these newly added findings.

AWS is committed to continually improving GuardDuty, to make it more efficient for you to operate securely in AWS. At AWS, customer feedback drives change, so we encourage you to continue providing feedback. If you have feedback about this post, submit comments in the Comments section below. If you have questions about this post, start a new thread on AWS re:Post or contact AWS Support.

Want more AWS Security how-to content, news, and feature announcements? Follow us on Twitter.

Author

Marshall Jones

Marshall is a worldwide security specialist solutions architect at AWS. His background is in AWS consulting and security architecture, focused on a variety of security domains including edge, threat detection, and compliance. Today, he helps enterprise customers adopt and operationalize AWS security services to increase security effectiveness and reduce risk.

Docker Container Monitoring With Zabbix

Post Syndicated from Dmitry Lambert original https://blog.zabbix.com/docker-container-monitoring-with-zabbix/20175/

In this blog post, I will cover Docker container monitoring with Zabbix. We will use the official Docker by Zabbix agent 2 template to make things as simple as possible. The template download link and configuration steps can be found on the Zabbix Integrations page. If you require a visual guide, I invite you to check out my video covering this topic.

Importing the official Docker template

Importing the Docker by Zabbix agent 2 template

Since we will be using the official Docker by Zabbix agent 2 template, first, we need to make sure that the template is actually available in our Zabbix instance. The template is available for Zabbix versions 5.0, 5.4, and 6.0. If you cannot find this template under Configuration – Templates, chances are that you haven’t imported it into your environment after upgrading Zabbix to one of the aforementioned versions. Remember that Zabbix does not modify or import any templates during the upgrade process, so we will have to import the template manually. If that is so, simply download the template from the official Zabbix git page (or use the link in the introduction) and import it into your Zabbix instance by using the Import button in the Configuration – Templates section.

Installing and configuring Zabbix agent 2

Before we get started with configuring our host, we first have to install Zabbix agent 2 and configure it according to the template guidelines. Follow the steps in the download section of the Zabbix website and install the zabbix-agent2 package. Feel free to use any other agent deployment methods if you want to (like compiling the agent from the source files)

Installing Zabbix agent2 from packages takes just a few simple steps:

Install the Zabbix repository package:

rpm -Uvh https://repo.zabbix.com/zabbix/6.0/rhel/8/x86_64/zabbix-release-6.0-1.el8.noarch.rpm

Install the Zabbix agent 2 package:

dnf install zabbix-agent2

Configure the Server parameter by populating it with your Zabbix server/proxy address

vi /etc/zabbix/zabbix_agent2.conf
### Option: Server
# List of comma delimited IP addresses, optionally in CIDR notation, or DNS names of Zabbix servers and Zabbix proxies.
# Incoming connections will be accepted only from the hosts listed here.
# If IPv6 support is enabled then '127.0.0.1', '::127.0.0.1', '::ffff:127.0.0.1' are treated equally
# and '::/0' will allow any IPv4 or IPv6 address.
# '0.0.0.0/0' can be used to allow any IPv4 address.
# Example: Server=127.0.0.1,192.168.1.0/24,::1,2001:db8::/32,zabbix.example.com
#
# Mandatory: yes, if StartAgents is not explicitly set to 0
# Default:
# Server=

Server=192.168.50.49

Plugin specific Zabbix agent 2 configuration

Zabbix agent 2 provides plugin-specific configuration parameters. Mostly these are optional parameters related to a specific plugin. You can find the full list of plugin-specific configuration parameters in the Zabbix documentation. In the newer versions of Zabbix agent 2, the plugin-specific parameters are defined in separate plugin configuration files, located in /etc/zabbix/zabbix_agent2.d/plugins.d/, while in older versions, they are defined directly in the zabbix_agent2.conf file.

For the Zabbix agent 2 Docker plugin, we have to provide the Docker daemon unix-socket location. This can be done by specifying the following plugin parameter:

### Option: Plugins.Docker.Endpoint
# Docker API endpoint.
#
# Mandatory: no
# Default: unix:///var/run/docker.sock
# Plugins.Docker.Endpoint=unix:///var/run/docker.sock

The default socket location will be correct for your Docker environment – in that case, you can leave the configuration file as-is.

Once we have made the necessary changes in the Zabbix agent 2 configuration files, start and enable the agent:

systemctl enable zabbix-agent2 --now

Check if the Zabbix agent2 is running:

tail -f /var/log/zabbix/zabbix_agent2.log

Before we move on to Zabbix frontend, I would like to point your attention to the Docker socket file permission – the zabbix user needs to have access to the Docker socket file. The zabbix user should be added to the docker group to resolve the following error messages.

[Docker] cannot fetch data: Get http://1.28/info: dial unix /var/run/docker.sock: connect: permission denied
ZBX_NOTSUPPORTED: Cannot fetch data.

You can add the zabbix user to the Docker group by executing the following command:

usermod -aG docker zabbix

Configuring the docker host

Configuring the host representing our Docker environment

After importing the template, we have to create a host which will represent our Docker instance. Give the host a name and assign it to a Host group – I will assign it to the Linux servers host group. Assign the Docker by Zabbix agent 2 template to the host. Since the template uses Zabbix agent 2 to collect the metrics, we also have to add an agent interface on this host. The address of the interface should point to the machine running your Docker containers. Finish up the host configuration by clicking the Add button.

Docker by Zabbix agent 2 template

Regular docker template items

The template contains a set of regular items for the general Docker instance metrics, such as the number of available images, Docker architecture information, the total number of containers, and more.

Docker tempalte Low-level discovery rules

On top of that, the template also gathers container and image-specific information by using low-level discovery rules.

Once Zabbix discovers your containers and images, these low-level discovery rules will then be used to create items, triggers, and graphs from prototypes for each of your containers and images. This way, we can monitor container or image-specific metrics, such as container memory, network information, container status, and more.

Docker templates Low-level discovery item prototypes

Verifying the host and template configuration

To verify that the agent and the host are configured correctly, we can use Zabbix get command-line tool and try to poll our agent. If you haven’t installed Zabbix get, do so on your Zabbix server or Zabbix proxy host:

dnf install zabbix-get

Now we can use zabbix-get to verify that our agent can obtain the Docker-related metrics. Execute the following command:

zabbix_get -s docker-host -k docker.info

Use the -s parameter to specify your agent host’s host name or IP address. The -k parameter specifies the item key for which we wish to obtain the metrics by polling the agent with Zabbix get.

zabbix_get -s 192.168.50.141 -k docker.info

{"Id":"SJYT:SATE:7XZE:7GEC:XFUD:KZO5:NYFI:L7M5:4RGO:P2KX:QJFD:TAVY","Containers":2,"ContainersRunning":2,"ContainersPaused":0,"ContainersStopped":0,"Images":2,"Driver":"overlay2","MemoryLimit":true,"SwapLimit":true,"KernelMemory":true,"KernelMemoryTCP":true,"CpuCfsPeriod":true,"CpuCfsQuota":true,"CPUShares":true,"CPUSet":true,"PidsLimit":true,"IPv4Forwarding":true,"BridgeNfIptables":true,"BridgeNfIP6tables":true,"Debug":false,"NFd":39,"OomKillDisable":true,"NGoroutines":43,"LoggingDriver":"json-file","CgroupDriver":"cgroupfs","NEventsListener":0,"KernelVersion":"5.4.17-2136.300.7.el8uek.x86_64","OperatingSystem":"Oracle Linux Server 8.5","OSVersion":"8.5","OSType":"linux","Architecture":"x86_64","IndexServerAddress":"https://index.docker.io/v1/","NCPU":1,"MemTotal":1776848896,"DockerRootDir":"/var/lib/docker","Name":"localhost.localdomain","ExperimentalBuild":false,"ServerVersion":"20.10.14","ClusterStore":"","ClusterAdvertise":"","DefaultRuntime":"runc","LiveRestoreEnabled":false,"InitBinary":"docker-init","SecurityOptions":["name=seccomp,profile=default"],"Warnings":null}

In addition, we can also use the low-level discovery key – docker.containers.discovery[false] to check the result of the low-level discovery.

zabbix_get -s 192.168.50.141 -k docker.containers.discovery[false]

[{"{#ID}":"a1ad32f5ee680937806bba62a1aa37909a8a6663d8d3268db01edb1ac66a49e2","{#NAME}":"/apache-server"},{"{#ID}":"120d59f3c8b416aaeeba50378dee7ae1eb89cb7ffc6cc75afdfedb9bc8cae12e","{#NAME}":"/mysql-server"}]

We can see that Zabbix will discover and start monitoring two containers – apache-server and mysql-server. Any agent low-level discovery rule or item can be checked with Zabbix get.

Docker template in action

Discovered items on our Docker host

Now that we have configured our agent and host, applied the Docker template, and verified that everything is working, we should be able to see the discovered entities in the frontend.

Collected Docker container metrics

In addition, our metrics should have also started coming in. We can check the Latest data section and verify that they are indeed getting collected.

Macros inherited from the Docker template

Lastly, we have a few additional options for further modifying the template and the results of our low-level discovery. If you open the Macros section of your host and select Inherited and host macros, you will notice that there are 4 macros inherited from the Docker template. These macros are responsible for filtering in/out the discovered containers and images. Feel free to modify these values if you wish to filter in/out the discovery of these entities as per your requirements.

Notice that the container discovery item also has one parameter, which is defined as false on the template:

  • docker.containers.discovery[false] – Discover only running containers
  • docker.containers.discovery[true] – Discover all containers, no matter their state.

And that’s it! We successfully imported the template, installed and configured Zabbix agent 2, created a host, and applied the Docker template. Finally – our Zabbix instance is now monitoring our Docker environment! If you have any other questions or comments, feel free to leave a response in the comments section of this post.


The post Docker Container Monitoring With Zabbix appeared first on Zabbix Blog.

Let’s Architect! Architecting microservices with containers

Post Syndicated from Luca Mezzalira original https://aws.amazon.com/blogs/architecture/lets-architect-architecting-microservices-with-containers/

Microservices structure an application as a set of independently deployable services. They speed up software development and allow architects to quickly update systems to adhere to changing business requirements.

According to best practices, the different services should be loosely coupled, organized around business capabilities, independently deployable, and owned by a single team. If applied correctly, there are multiple advantages to using microservices. However, working with microservices can also bring challenges. In this edition of Let’s Architect!, we explore the advantages, mental models, and challenges deriving from microservices with containers.

Application integration patterns for microservices

As Tim Bray said in his time with AWS, “If your application is cloud native, large scale, or distributed, and doesn’t include a messaging component, that’s probably a bug.”

This video evaluates several design patterns based on messaging and shows you how to implement them in your workloads to achieve the full capabilities of microservices. You’ll learn some fundamental application integration patterns and some of the benefits that asynchronous messaging can have over REST APIs for communication between microservices.

The scatter-gather pattern scales parallel processing across nodes and aggregates the results in a queue

The scatter-gather pattern scales parallel processing across nodes and aggregates the results in a queue

Distributed monitoring

Customers often cite monitoring as one of the main challenges while working with containers. Monitoring collects operational data as logs, metrics, events, and traces to identify and respond to issues quickly and minimize disruptions.

This whitepaper covers cross-service challenges in microservices, including service discovery, distributed monitoring, and auditing. You’ll learn about the role of DNS and service meshes in interservice communication and discovery and the tools available for monitoring your clusters that run containers and for logging.

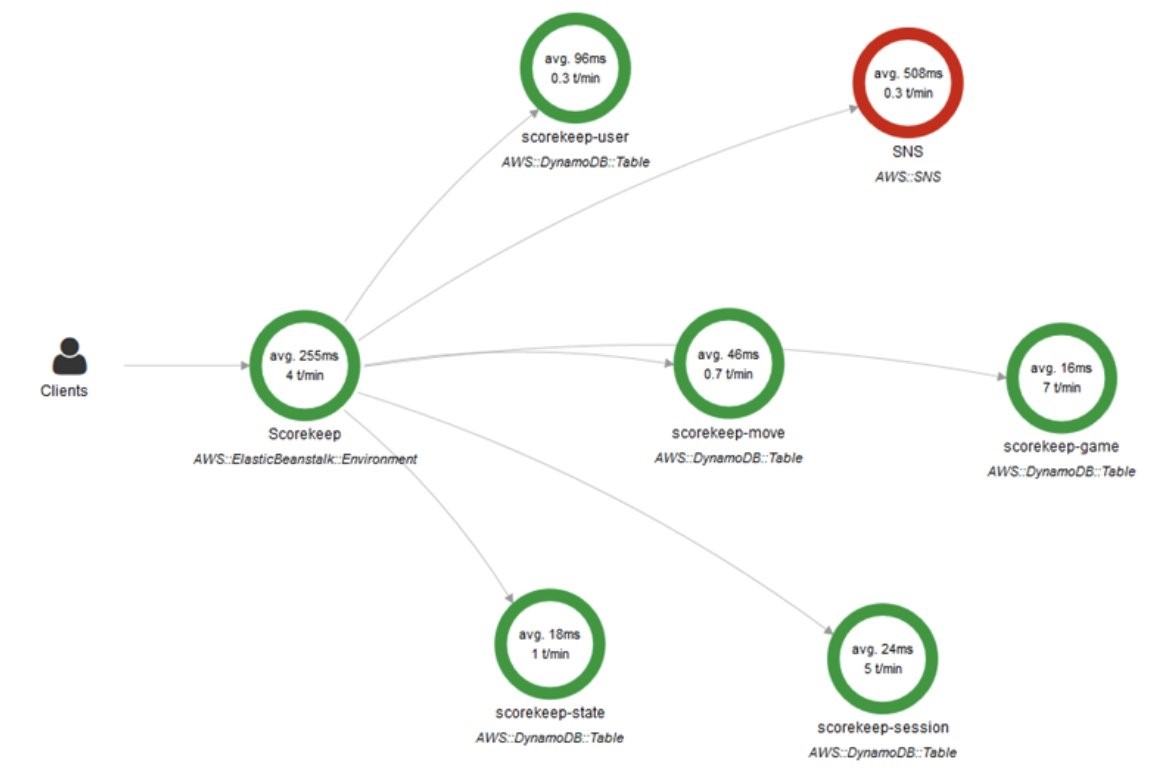
This view from AWS X-Ray shows how a request can be tracked across different services. This is implemented by taking advantage of correlation IDs

This view from AWS X-Ray shows how a request can be tracked across different services. This is implemented by taking advantage of correlation IDs

Create a pipeline with canary deployments for Amazon ECS using AWS App Mesh

When architects deploy a new version of an application, they want to test it on a set of users before routing all the traffic to the new version. This is known as a “canary deployment.” A canary deployment can automatically switch traffic back to the old version if some inconsistencies are detected. This decreases the impact of the bug(s) introduced in the new release. For microservices, this is helpful when testing a complex distributed system because you can send a percentage of traffic to newer versions in a controlled manner.

A service mesh provides application-level networking so your services can communicate with each other across multiple types of compute infrastructure. This blog post shows how to use AWS App Mesh to implement a canary deployment strategy using AWS Step Functions for orchestrating the different steps during testing and AWS Code Pipeline for continuous delivery of each microservice.

An overview of the architecture used to create the pipeline and perform the canary deployments

An overview of the architecture used to create the pipeline and perform the canary deployments

Running microservices in Amazon EKS with AWS App Mesh and Kong

Distributed architectures bring up several questions. How do we expose our APIs towards client-side applications? How do our microservices communicate?

This blog post answers these questions with a solution that uses Amazon Elastic Kubernetes Service (Amazon EKS) in conjunction with AWS App Mesh. This solution helps you manage the security and discoverability of microservices, and Kong protects your service mesh and runs side by side with your application services.

The Kong for Kubernetes architecture can be implemented using Amazon EKS and AWS App Mesh

The Kong for Kubernetes architecture can be implemented using Amazon EKS and AWS App Mesh

See you next time!

See you in a couple of weeks when we discuss open source technologies on AWS!

Looking for more architecture content? AWS Architecture Center provides reference architecture diagrams, vetted architecture solutions, Well-Architected best practices, patterns, icons, and more!

Other posts in this series

Using Amazon Aurora Global Database for Low Latency without Application Changes

Post Syndicated from Roneel Kumar original https://aws.amazon.com/blogs/architecture/using-amazon-aurora-global-database-for-low-latency-without-application-changes/

Deploying global applications has many challenges, especially when accessing a database to build custom pages for end users. One example is an application using AWS Lambda@Edge. Two main challenges include performance and availability.

This blog explains how you can optimally deploy a global application with fast response times and without application changes.

The Amazon Aurora Global Database enables a single database cluster to span multiple AWS Regions by asynchronously replicating your data within subsecond timing. This provides fast, low-latency local reads in each Region. It also enables disaster recovery from Region-wide outages using multi-Region writer failover. These capabilities minimize the recovery time objective (RTO) of cluster failure, thus reducing data loss during failure. You will then be able to achieve your recovery point objective (RPO).

However, there are some implementation challenges. Most applications are designed to connect to a single hostname with atomic, consistent, isolated, and durable (ACID) consistency. But Global Aurora clusters provide reader hostname endpoints in each Region. In the primary Region, there are two endpoints, one for writes, and one for reads. To achieve strong  data consistency, a global application requires the ability to:

  • Choose the optimal reader endpoints
  • Change writer endpoints on a database failover
  • Intelligently select the reader with the most up-to-date, freshest data

These capabilities typically require additional development.

The Heimdall Proxy coupled with Amazon Route 53 allows edge-based applications to access the Aurora Global Database seamlessly, without  application changes. Features include automated Read/Write split with ACID compliance and edge results caching.

Figure 1. Heimdall Proxy architecture

Figure 1. Heimdall Proxy architecture

The architecture in Figure 1 shows Aurora Global Databases primary Region in AP-SOUTHEAST-2, and secondary Regions in AP-SOUTH-1 and US-WEST-2. The Heimdall Proxy uses latency-based routing to determine the closest Reader Instance for read traffic, and redirects all write traffic to the Writer Instance. The Heimdall Configuration stores the Amazon Resource Name (ARN) of the global cluster. It automatically detects failover and cross-Region on the cluster, and directs traffic accordingly.

With an Aurora Global Database, there are two approaches to failover:

  • Managed planned failover. To relocate your primary database cluster to one of the secondary Regions in your Aurora global database, see Managed planned failovers with Amazon Aurora Global Database. With this feature, RPO is 0 (no data loss) and it synchronizes secondary DB clusters with the primary before making any other changes. RTO for this automated process is typically less than that of the manual failover.
  • Manual unplanned failover. To recover from an unplanned outage, you can manually perform a cross-Region failover to one of the secondaries in your Aurora Global Database. The RTO for this manual process depends on how quickly you can manually recover an Aurora global database from an unplanned outage. The RPO is typically measured in seconds, but this is dependent on the Aurora storage replication lag across the network at the time of the failure.

The Heimdall Proxy automatically detects Amazon Relational Database Service (RDS) / Amazon Aurora configuration changes based on the ARN of the Aurora Global cluster. Therefore, both managed planned and manual unplanned failovers are supported.

Solution benefits for global applications

Implementing the Heimdall Proxy has many benefits for global applications:

  1. An Aurora Global Database has a primary DB cluster in one Region and up to five secondary DB clusters in different Regions. But the Heimdall Proxy deployment does not have this limitation. This allows for a larger number of endpoints to be globally deployed. Combined with Amazon Route 53 latency-based routing, new connections have a shorter establishment time. They can use connection pooling to connect to the database, which reduces overall connection latency.
  2. SQL results are cached to the application for faster response times.
  3. The proxy intelligently routes non-cached queries. When safe to do so, the closest (lowest latency) reader will be used. When not safe to access the reader, the query will be routed to the global writer. Proxy nodes globally synchronize their state to ensure that volatile tables are locked to provide ACID compliance.

For more information on configuring the Heimdall Proxy and Amazon Route 53 for a global database, read the Heimdall Proxy for Aurora Global Database Solution Guide.

Download a free trial from the AWS Marketplace.

Resources:

Heimdall Data, based in the San Francisco Bay Area, is an AWS Advanced ISV partner. They have AWS Service Ready designations for Amazon RDS and Amazon Redshift. Heimdall Data offers a database proxy that offloads SQL improving database scale. Deployment does not require code changes.

Amazon Elastic Kubernetes Service Adds IPv6 Networking

Post Syndicated from Sébastien Stormacq original https://aws.amazon.com/blogs/aws/amazon-elastic-kubernetes-service-adds-ipv6-networking/

Starting today, you can deploy applications that use IPv6 address space on Amazon Elastic Kubernetes Service (EKS).

Many of our customers are standardizing Kubernetes as their compute infrastructure platform for cloud and on-premises applications. Amazon EKS makes it easy to deploy containerized workloads. It provides highly available clusters and automates tasks such as patching, node provisioning, and updates.

Kubernetes uses a flat networking model that requires each pod to receive an IP address. This simplified approach enables low-friction porting of applications from virtual machines to containers but requires a significant number of IP addresses that many private VPC IPv4 networks are not equipped to handle. Some cluster administrators work around this IPv4 space limitation by installing container network plugins (CNI) that virtualize IP addresses a layer above the VPC, but this architecture limits an administrator’s ability to effectively observe and troubleshoot applications and has a negative impact on network performance at scale. Further, to communicate with internet services outside the VPC, traffic from IPv4 pods is routed through multiple network hops before reaching its destination, which adds latency and puts a strain on network engineering teams who need to maintain complex routing setups.

To avoid IP address exhaustion, minimize latency at scale, and simplify routing configuration, the solution is to use IPv6 address space.

IPv6 is not new. In 1996, I bought my first book on “IPng, Internet Protocol Next Generation”, as it was called 25 years ago. It provides a 64-bit address space, allowing 3.4 x 10^38 possible IP addresses for our devices, servers, or containers. We could assign an IPv6 address to every atom on the surface of the planet and still have enough addresses left to do another 100-plus Earths.

IPng Internet protocol Next Generation bookThere are a few advantages to using Amazon EKS clusters with an IPv6 network. First, you can run more pods on one single host or subnet without the risk of exhausting all available IPv4 addresses available in your VPC. Second, it allows for lower-latency communications with other IPv6 services, running on-premises, on AWS, or on the internet, by avoiding an extra NAT hop. Third, it relieves network engineers of the burden of maintaining complex routing configurations.

Kubernetes cluster administrators can focus on migrating and scaling applications without spending efforts working around IPv4 limits. Finally, pod networking is configured so that the pods can communicate with IPv4-based applications outside the cluster, allowing you to adopt the benefits of IPv6 on Amazon EKS without requiring that all dependent services deployed across your organization are first migrated to IPv6.

As usual, I built a short demo to show you how it works.

How It Works
Before I get started, I create an IPv6 VPC. I use this CDK script to create an IPv6-enabled VPC in a few minutes (thank you Angus Lees for the code). Just install CDK v2 (npm install -g aws-cdk@next) and deploy the stack (cdk bootstrap && cdk deploy).

When the VPC with IPv6 is created, I use the console to configure auto-assignment of IPv6 addresses to resources deployed in the public subnets (I do this for each public subnet).

auto assign IPv6 addresses in subnet

I take note of the subnet IDs created by the CDK script above (they are listed in the output of the script) and define a couple of variables I’ll use throughout the demo. I also create a cluster IAM role and a node IAM role, as described in the Amazon EKS documentation. When you already have clusters deployed, these two roles exist already.

I open a Terminal and type:


CLUSTER_ROLE_ARN="arn:aws:iam::0123456789:role/EKSClusterRole"
NODE_ROLE_ARN="arn:aws:iam::0123456789:role/EKSNodeRole"
SUBNET1="subnet-06000a8"
SUBNET2="subnet-03000cc"
CLUSTER_NAME="AWSNewsBlog"
KEYPAIR_NAME="my-key-pair-name"

Next, I create an Amazon EKS IPv6 cluster. In a terminal, I type:


aws eks create-cluster --cli-input-json "{
\"name\": \"${CLUSTER_NAME}\",
\"version\": \"1.21\",
\"roleArn\": \"${CLUSTER_ROLE_ARN}\",
\"resourcesVpcConfig\": {
\"subnetIds\": [
    \"${SUBNET1}\", \"${SUBNET2}\"
],
\"endpointPublicAccess\": true,
\"endpointPrivateAccess\": true
},
\"kubernetesNetworkConfig\": {
    \"ipFamily\": \"ipv6\"
}
}"

{
    "cluster": {
        "name": "AWSNewsBlog",
        "arn": "arn:aws:eks:us-west-2:486652066693:cluster/AWSNewsBlog",
        "createdAt": "2021-11-02T17:29:32.989000+01:00",
        "version": "1.21",

...redacted for brevity...

        "status": "CREATING",
        "certificateAuthority": {},
        "platformVersion": "eks.4",
        "tags": {}
    }
}

I use the describe-cluster while waiting for the cluster to be created. When the cluster is ready, it has "status" : "ACTIVE"

aws eks describe-cluster --name "${CLUSTER_NAME}"

Then I create a node group:

aws eks create-nodegroup                       \
        --cluster-name ${CLUSTER_NAME}         \
        --nodegroup-name AWSNewsBlog-nodegroup \
        --node-role ${NODE_ROLE_ARN}           \
        --subnets "${SUBNET1}" "${SUBNET2}"    \
        --remote-access ec2SshKey=${KEYPAIR_NAME}
		
{
    "nodegroup": {
        "nodegroupName": "AWSNewsBlog-nodegroup",
        "nodegroupArn": "arn:aws:eks:us-west-2:0123456789:nodegroup/AWSNewsBlog/AWSNewsBlog-nodegroup/3ebe70c7-6c45-d498-6d42-4001f70e7833",
        "clusterName": "AWSNewsBlog",
        "version": "1.21",
        "releaseVersion": "1.21.4-20211101",

        "status": "CREATING",
        "capacityType": "ON_DEMAND",

... redacted for brevity ...

}		

Once the node group is created, I see two EC2 instances in the console. I use the AWS Command Line Interface (CLI) to verify that the instances received an IPv6 address:

aws ec2 describe-instances --query "Reservations[].Instances[? State.Name == 'running' ][].NetworkInterfaces[].Ipv6Addresses" --output text 

2600:1f13:812:0000:0000:0000:0000:71eb
2600:1f13:812:0000:0000:0000:0000:3c07

I use the kubectl command to verify the cluster from a Kubernetes point of view.

kubectl get nodes -o wide

NAME                                       STATUS   ROLES    AGE     VERSION               INTERNAL-IP                              EXTERNAL-IP    OS-IMAGE         KERNEL-VERSION                CONTAINER-RUNTIME
ip-10-0-0-108.us-west-2.compute.internal   Ready    <none>   2d13h   v1.21.4-eks-033ce7e   2600:1f13:812:0000:0000:0000:0000:2263   18.0.0.205   Amazon Linux 2   5.4.149-73.259.amzn2.x86_64   docker://20.10.7
ip-10-0-1-217.us-west-2.compute.internal   Ready    <none>   2d13h   v1.21.4-eks-033ce7e   2600:1f13:812:0000:0000:0000:0000:7f3e   52.0.0.122   Amazon Linux 2   5.4.149-73.259.amzn2.x86_64   docker://20.10.7

Then I deploy a Pod. I follow these steps in the EKS documentation. It deploys a sample nginx web server.

kubectl create namespace aws-news-blog
namespace/aws-news-blog created

# sample-service.yml is available at https://docs.aws.amazon.com/eks/latest/userguide/sample-deployment.html
kubectl apply -f  sample-service.yml 
service/my-service created
deployment.apps/my-deployment created

kubectl get pods -n aws-news-blog -o wide
NAME                             READY   STATUS    RESTARTS   AGE   IP                           NODE                                       NOMINATED NODE   READINESS GATES
my-deployment-5dd5dfd6b9-7rllg   1/1     Running   0          17m   2600:0000:0000:0000:405b::2   ip-10-0-1-217.us-west-2.compute.internal   <none>           <none>
my-deployment-5dd5dfd6b9-h6mrt   1/1     Running   0          17m   2600:0000:0000:0000:46f9::    ip-10-0-0-108.us-west-2.compute.internal   <none>           <none>
my-deployment-5dd5dfd6b9-mrkfv   1/1     Running   0          17m   2600:0000:0000:0000:46f9::1   ip-10-0-0-108.us-west-2.compute.internal   <none>           <none>

I take note of the IPv6 address of my pods, and try to connect it from my laptop. As my awesome service provider doesn’t provide me with an IPv6 at home yet, the connection fails. This is expected as the pods do not have an IPv4 address at all. Notice the -g option telling curl to not consider : in the IP address as the separator for the port number and -6 to tell curl to connect through IPv6 only (required when you provide curl with a DNS hostname).

curl -g -6 http://\[2600:0000:0000:35000000:46f9::1\]
curl: (7) Couldn't connect to server

To test IPv6 connectivity, I start a dual stack (IPv4 and IPv6) EC2 instance in the same VPC as the cluster. I SSH connect to the instance and try the curl command again. I see I receive the default HTML page served by nginx. IPv6 connectivity to the pod works!

curl -g -6 http://\[2600:0000:0000:35000000:46f9::1\]
<!DOCTYPE html>
<html>
<head>
<title>Welcome to nginx!</title>

... redacted for brevity ...

<p><em>Thank you for using nginx.</em></p>
</body>
</html>

If it does not work for you, verify the security group for the cluster EC2 nodes and be sure it has a rule allowing incoming connections on port TCP 80 from ::/0.

A Few Things to Remember
Before I wrap up, I’d like to answer some frequent questions received from customers who have already experimented with this new capability:

Pricing and Availability
IPv6 support for your Amazon Elastic Kubernetes Service (EKS) cluster is available today in all AWS Regions where Amazon EKS is available, at no additional cost.

Go try it out and build your first IPv6 cluster today.

— seb

Continuous runtime security monitoring with AWS Security Hub and Falco

Post Syndicated from Rajarshi Das original https://aws.amazon.com/blogs/security/continuous-runtime-security-monitoring-with-aws-security-hub-and-falco/

Customers want a single and comprehensive view of the security posture of their workloads. Runtime security event monitoring is important to building secure, operationally excellent, and reliable workloads, especially in environments that run containers and container orchestration platforms. In this blog post, we show you how to use services such as AWS Security Hub and Falco, a Cloud Native Computing Foundation project, to build a continuous runtime security monitoring solution.

With the solution in place, you can collect runtime security findings from multiple AWS accounts running one or more workloads on AWS container orchestration platforms, such as Amazon Elastic Kubernetes Service (Amazon EKS) or Amazon Elastic Container Service (Amazon ECS). The solution collates the findings across those accounts into a designated account where you can view the security posture across accounts and workloads.


Solution overview

Security Hub collects security findings from other AWS services using a standardized AWS Security Findings Format (ASFF). Falco provides the ability to detect security events at runtime for containers. Partner integrations like Falco are also available on Security Hub and use ASFF. Security Hub provides a custom integrations feature using ASFF to enable collection and aggregation of findings that are generated by custom security products.

The solution in this blog post uses AWS FireLens, Amazon CloudWatch Logs, and AWS Lambda to enrich logs from Falco and populate Security Hub.

Figure : Architecture diagram of continuous runtime security monitoring

Figure 1: Architecture diagram of continuous runtime security monitoring

Here’s how the solution works, as shown in Figure 1:

  1. An AWS account is running a workload on Amazon EKS.
    1. Runtime security events detected by Falco for that workload are sent to CloudWatch logs using AWS FireLens.
    2. CloudWatch logs act as the source for FireLens and a trigger for the Lambda function in the next step.
    3. The Lambda function transforms the logs into the ASFF. These findings can now be imported into Security Hub.
    4. The Security Hub instance that is running in the same account as the workload running on Amazon EKS stores and processes the findings provided by Lambda and provides the security posture to users of the account. This instance also acts as a member account for Security Hub.
  2. Another AWS account is running a workload on Amazon ECS.
    1. Runtime security events detected by Falco for that workload are sent to CloudWatch logs using AWS FireLens.
    2. CloudWatch logs acts as the source for FireLens and a trigger for the Lambda function in the next step.
    3. The Lambda function transforms the logs into the ASFF. These findings can now be imported into Security Hub.
    4. The Security Hub instance that is running in the same account as the workload running on Amazon ECS stores and processes the findings provided by Lambda and provides the security posture to users of the account. This instance also acts as another member account for Security Hub.
  3. The designated Security Hub administrator account combines the findings generated by the two member accounts, and then provides a comprehensive view of security alerts and security posture across AWS accounts. If your workloads span multiple regions, Security Hub supports aggregating findings across Regions.


Prerequisites

For this walkthrough, you should have the following in place:

  1. Three AWS accounts.

    Note: We recommend three accounts so you can experience Security Hub’s support for a multi-account setup. However, you can use a single AWS account instead to host the Amazon ECS and Amazon EKS workloads, and send findings to Security Hub in the same account. If you are using a single account, skip the following account specific-guidance. If you are integrated with AWS Organizations, the designated Security Hub administrator account will automatically have access to the member accounts.

  2. Security Hub set up with an administrator account on one account.
  3. Security Hub set up with member accounts on two accounts: one account to host the Amazon EKS workload, and one account to host the Amazon ECS workload.
  4. Falco set up on the Amazon EKS and Amazon ECS clusters, with logs routed to CloudWatch Logs using FireLens. For instructions on how to do this, see:

    Important: Take note of the names of the CloudWatch Logs groups, as you will need them in the next section.

  5. AWS Cloud Development Kit (CDK) installed on the member accounts to deploy the solution that provides the custom integration between Falco and Security Hub.


Deploying the solution

In this section, you will learn how to deploy the solution and enable the CloudWatch Logs group. Enabling the CloudWatch Logs group is the trigger for running the Lambda function in both member accounts.

To deploy this solution in your own account

  1. Clone the aws-securityhub-falco-ecs-eks-integration GitHub repository by running the following command.
    $git clone https://github.com/aws-samples/aws-securityhub-falco-ecs-eks-integration
  2. Follow the instructions in the README file provided on GitHub to build and deploy the solution. Make sure that you deploy the solution to the accounts hosting the Amazon EKS and Amazon ECS clusters.
  3. Navigate to the AWS Lambda console and confirm that you see the newly created Lambda function. You will use this function in the next section.
Figure : Lambda function for Falco integration with Security Hub

Figure 2: Lambda function for Falco integration with Security Hub

To enable the CloudWatch Logs group

  1. In the AWS Management Console, select the Lambda function shown in Figure 2—AwsSecurityhubFalcoEcsEksln-lambdafunction—and then, on the Function overview screen, select + Add trigger.
  2. On the Add trigger screen, provide the following information and then select Add, as shown in Figure 3.
    • Trigger configuration – From the drop-down, select CloudWatch logs.
    • Log group – Choose the Log group you noted in Step 4 of the Prerequisites. In our setup, the log group for the Amazon ECS and Amazon EKS clusters, deployed in separate AWS accounts, was set with the same value (falco).
    • Filter name – Provide a name for the filter. In our example, we used the name falco.
    • Filter pattern – optional – Leave this field blank.
    Figure 3: Lambda function trigger - CloudWatch Log group

    Figure 3: Lambda function trigger – CloudWatch Log group

  3. Repeat these steps (as applicable) to set up the trigger for the Lambda function deployed in other accounts.


Testing the deployment

Now that you’ve deployed the solution, you will verify that it’s working.

With the default rules, Falco generates alerts for activities such as:

  • An attempt to write to a file below the /etc folder. The /etc folder contains important system configuration files.
  • An attempt to open a sensitive file (such as /etc/shadow) for reading.

To test your deployment, you will attempt to perform these activities to generate Falco alerts that are reported as Security Hub findings in the same account. Then you will review the findings.

To test the deployment in member account 1

  1. Run the following commands to trigger an alert in member account 1, which is running an Amazon EKS cluster. Replace <container_name> with your own value.
    kubectl exec -it <container_name> /bin/bash
    touch /etc/5
    cat /etc/shadow > /dev/null
  2. To see the list of findings, log in to your Security Hub admin account and navigate to Security Hub > Findings. As shown in Figure 4, you will see the alerts generated by Falco, including the Falco-generated title, and the instance where the alert was triggered.

    Figure 4: Findings in Security Hub

    Figure 4: Findings in Security Hub

  3. To see more detail about a finding, check the box next to the finding. Figure 5 shows some of the details for the finding Read sensitive file untrusted.
    Figure 5: Sensitive file read finding - detail view

    Figure 5: Sensitive file read finding – detail view

    Figure 6 shows the Resources section of this finding, that includes the instance ID of the Amazon EKS cluster node. In our example this is the Amazon Elastic Compute Cloud (Amazon EC2) instance.

    Figure 6: Resource Detail in Security Hub finding

To test the deployment in member account 2

  1. Run the following commands to trigger a Falco alert in member account 2, which is running an Amazon ECS cluster. Replace <<container_id> with your own value.
    docker exec -it <container_id> bash
    touch /etc/5
    cat /etc/shadow > /dev/null
  2. As in the preceding example with member account 1, to view the findings related to this alert, navigate to your Security Hub admin account and select Findings.

To view the collated findings from both member accounts in Security Hub

  1. In the designated Security Hub administrator account, navigate to Security Hub > Findings. The findings from both member accounts are collated in the designated Security Hub administrator account. You can use this centralized account to view the security posture across accounts and workloads. Figure 7 shows two findings, one from each member account, viewable in the Single Pane of Glass administrator account.

    Figure 7: Write below /etc findings in a single view

    Figure 7: Write below /etc findings in a single view

  2. To see more information and a link to the corresponding member account where the finding was generated, check the box next to the finding. Figure 8 shows the account detail associated with a specific finding in member account 1.
    Figure 8: Write under /etc detail view in Security Hub admin account

    Figure 8: Write under /etc detail view in Security Hub admin account

    By centralizing and enriching the findings from Falco, you can take action more quickly or perform automated remediation on the impacted resources.


Cleaning up

To clean up this demo:

  1. Delete the CloudWatch Logs trigger from the Lambda functions that were created in the section To enable the CloudWatch Logs group.
  2. Delete the Lambda functions by deleting the CloudFormation stack, created in the section To deploy this solution in your own account.
  3. Delete the Amazon EKS and Amazon ECS clusters created as part of the Prerequisites.


Conclusion

In this post, you learned how to achieve multi-account continuous runtime security monitoring for container-based workloads running on Amazon EKS and Amazon ECS. This is achieved by creating a custom integration between Falco and Security Hub.

You can extend this solution in a number of ways. For example:

  • You can forward findings across accounts using a single source to security information and event management (SIEM) tools such as Splunk.
  • You can perform automated remediation activities based on the findings generated, using Lambda.

To learn more about managing a centralized Security Hub administrator account, see Managing administrator and member accounts. To learn more about working with ASFF, see AWS Security Finding Format (ASFF) in the documentation. To learn more about the Falco engine and rule structure, see the Falco documentation.

If you have feedback about this post, submit comments in the Comments section below.

Want more AWS Security news? Follow us on Twitter.

Rajarshi Das

Rajarshi Das

Rajarshi is a Solutions Architect at Amazon Web Services. He focuses on helping Public Sector customers accelerate their security and compliance certifications and authorizations by architecting secure and scalable solutions. Rajarshi holds 4 AWS certifications including AWS Certified Solutions Architect – Professional and AWS Certified Security – Specialist.

Author

Adam Cerini

Adam is a Senior Solutions Architect with Amazon Web Services. He focuses on helping Public Sector customers architect scalable, secure, and cost effective systems. Adam holds 5 AWS certifications including AWS Certified Solutions Architect – Professional and AWS Certified Security – Specialist.

Modernize your Penetration Testing Architecture on AWS Fargate

Post Syndicated from Conor Walsh original https://aws.amazon.com/blogs/architecture/modernize-your-penetration-testing-architecture-on-aws-fargate/

Organizations in all industries are innovating their application stack through modernization. Developers have found that modular architecture patterns, serverless operational models, and agile development processes provide great benefits. They offer faster innovation, reduced risk, and reduction in total cost of ownership.

Security organizations must evolve and innovate as well. But security practitioners often find themselves stuck between using powerful yet inflexible open-source tools with little support, and monolithic software with expensive and restrictive licenses.

This post describes how you can use modern cloud technologies to build a scalable penetration testing platform, with no infrastructure to manage.

The penetration testing monolith

AWS operates under the shared responsibility model, where AWS is responsible for the security of the cloud, and the customer is responsible for securing workloads in the cloud. This includes validating the security of your internal and external attack surface. Following the AWS penetration testing policy, customers can run tests against their AWS accounts, except for denial of service (DoS).

A legacy model commonly involves a central server for running a scanning application among the team. The server must be powerful enough for peak load and likely runs 24/7. Common licensing for scanner software is capped on the number of targets you can scan. This model does not scale, and incurs cost when no assessments are being performed.

Penetration testers must constantly reinvent their toolkit. Many one-off tools or scripts are built during engagements when encountering a unique problem. These tools and their environments are often customized, making standardization between machines and software difficult. Building, maintaining, and testing UI/UX and platform compatibility can be expensive and difficult to scale. This often leads to these tools being discarded and the value lost when the analyst moves on to the next engagement. Later, other analysts may run into the same scenario and need to rebuild the tool all over again, resulting in duplicated effort.

Network security scanning using modern cloud infrastructure

By using modern cloud container technologies, we can redesign this monolithic architecture to one that scales to meet increased demand, yet incurs no cost when idle. Containerization provides flexibility and secure isolation.

Figure 1. Overview of the serverless security scanning architecture

Figure 1. Overview of the serverless security scanning architecture

Scanning task flow

This workflow is based on the architecture shown in Figure 1:

  1. User authenticates to Amazon Cognito with their organization’s SSO.
  2. User makes authorized request to Amazon API Gateway.
  3. Request is forwarded to an AWS Lambda function that pulls configuration from Amazon Simple Storage Service (S3).
  4. Lambda function validates parameters, incorporates them into the task definition, and calls Amazon Elastic Container Service (ECS).
  5. ECS orchestrates worker nodes using AWS Fargate compute engine and initiates task.
  6. ECS asynchronously returns the task configuration to Lambda, which sanitizes sensitive data and sends response through API Gateway.
  7. The ECS task launches one or more containers, which run the tool.
  8. Scan results are stored in the ephemeral storage provided by Fargate.
  9. Final container in the ECS task copies the scan report to S3.

Now we’ll describe the different components of the architecture shown in Figure 1. Start by packaging one’s favorite tool into a container, and publish it to Amazon Elastic Container Registry (ECR). ECR provides your containers additional layers of security assurance with built-in dependency vulnerability scans.

AWS Fargate is a serverless compute engine powering Amazon ECS to orchestrate container tasks. Fargate scales up capacity to support the current load, and scales down once complete to reduce cost. By default, Fargate offers 20 GB of ephemeral storage to each ECS task for shared storage between containers as volume mounts.

Task input and output can be processed with custom code running on the serverless computing service AWS Lambda. For multi-stage Lambda functionality, you can use AWS Step Functions.

Amazon API Gateway can forward incoming requests to these Lambda functions. API Gateway provides serverless REST endpoints to handle requests processed by Lambda functions. Amazon Cognito authorizes users through API Gateway or your organization’s single-sign on (SSO) provider.

The final step of the ECS task can upload any resulting files to an Amazon S3 bucket. Amazon S3 offers industry-leading scalability, data availability, security, and performance with integration into other AWS services. This means that the results of your data can be consumed by other AWS services for processing, analytics, machine learning, and security controls.

Amazon CloudWatch Events are used to build an event-based workflow. The S3 upload initiates a CloudWatch Event, which can then invoke a Lambda function to process the file, or launch another ECS task.

This solution is completely serverless. It will scale on demand, yet cost nothing when not in use. This architecture can support anything that can be run in a container, regardless of tool function.

Network Mapper workflow

Figure 2. Network Mapper scanner task workflow

Figure 2. Network Mapper scanner task workflow

The example in Figure 2 was based on using a tool called Network Mapper, or Nmap. However, a variety of tools can be used, including nslookup/dig, Selenium, Nikto, recon-ng, SpiderFoot, Greenbone Vulnerability Manager (GVM), or OWASP ZAP. You can use anything that runs in a container! With some additional work, findings could be fed into AWS security services like AWS Security Hub, or Amazon GuardDuty. You can also use AWS Partner Network services like Splunk and Datadog, or open source frameworks like Metasploit and DefectDojo. The flexibility to add additional applications that integrate with AWS services means that this architecture can be easily deployed into a variety of AWS environments.

Remember, installation and use of software not included in an AWS-supported Amazon Machine Image (AMI) or container, falls into the customer side of the shared responsibility model. Make sure to do your due diligence in securing any software you decide to use in this or any workload. To reduce blast radius, run this in an isolated account and only provide least privilege access to targets.

Conclusion

In this blog post, we showed how to run a penetration testing workload on a modern platform, powered with serverless, and container-based services. Amazon API Gateway is the entry point for your architecture, which calls on AWS Lambda. Lambda builds a task definition to launch a fully orchestrated, on-demand container workload using AWS Fargate and Amazon ECS. The final stage of the ECS task copies the results of the scan to Amazon S3. This can be accessed by security analysts or other downstream containers, tools, or services.

We encourage you to go build this architecture in your own environment, and begin conducting your own tests! Construct your Nmap container and store it in Amazon ECR or use securecodebox/nmap, a Docker container built for the Open Web Application Security Project® (OWASP) SecureCodeBox project. Make sure to spend time securing this workload, especially when using open-source software you’re not familiar with. Now go get scanning!

New – AWS Marketplace for Containers Anywhere to Deploy Your Kubernetes Cluster in Any Environment

Post Syndicated from Channy Yun original https://aws.amazon.com/blogs/aws/new-aws-marketplace-for-containers-anywhere-to-deploy-your-kubernetes-cluster-in-any-environment/

More than 300,000 customers use AWS Marketplace today to find, subscribe to, and deploy third-party software packaged as Amazon Machine Images (AMIs), software-as-a-service (SaaS), and containers. Customers can find and subscribe containerized third-party applications from AWS Marketplace and deploy them in Amazon Elastic Container Service (Amazon ECS) and Amazon Elastic Kubernetes Service (Amazon EKS).

Many customers that run Kubernetes applications on AWS want to deploy them on-premises due to constraints, such as latency and data governance requirements. Also, once they have deployed the Kubernetes application, they need additional tools to govern the application through license tracking, billing, and upgrades.

Today, we announce AWS Marketplace for Containers Anywhere, a set of capabilities that allows AWS customers to find, subscribe to, and deploy third-party Kubernetes applications from AWS Marketplace on any Kubernetes cluster in any environment. This capability makes the AWS Marketplace more useful for customers who run containerized workloads.

With this launch, you can deploy third party Kubernetes applications to on-premises environments using Amazon EKS Anywhere or any customer self-managed Kubernetes cluster in on-premises environments or in Amazon Elastic Compute Cloud (Amazon EC2), enabling you to use a single catalog to find container images regardless of where they eventually plan to deploy.

With AWS Marketplace for Containers Anywhere, you can get the same benefits as any other products in AWS Marketplace, including consolidated billing, flexible payment options, and lower pricing for long-term contracts. You can find vetted, security-scanned, third-party Kubernetes applications, manage upgrades with a few clicks, and track all licenses and bills. You can migrate applications between any environment without purchasing duplicate licenses. After you have subscribed to an application using this feature, you can migrate your Kubernetes applications to AWS by deploying the independent software vendor (ISV) provided Helm charts onto their Kubernetes clusters on AWS without changing their licenses.

Getting Started with AWS Marketplace for Containers Anywhere
You can get started by visiting AWS Marketplace. Easily search in Delivery methods in all products, then filter Helm Chart in the catalog to find Kubernetes-based applications that they can deploy on AWS and on premises.

If you chose to subscribe to your favorite product, you would select Continue to Subscribe.

Once you accept the seller’s end user license agreement (EULA), select Create Contract and Continue to Configuration.

You can configure the software deployment using the dropdowns. Once Fulfillment option and Software Version are selected, choose Continue to Launch.

To deploy on Amazon EKS, you have the option to deploy the application on a new EKS cluster or copy and paste commands into existing clusters. You can also deploy into self-managed Kubernetes in EC2 by clicking on the self-managed Kubernetes option in the supported services.

To deploy on-premises or in EC2, you can select EKS Anywhere and then take an additional step to request a license token on the AWS Marketplace launch page. You will then use commands provided by AWS Marketplace to download container images, Helm charts from the AWS Marketplace Elastic Container Registry (ECR), the service account creation, and the token to apply IAM Roles for Service Accounts on your EKS cluster.

To upgrade or renew your existing software licenses, you can go to the AWS Marketplace website for a self-service upgrade or renewal experience. You can also negotiate a private offer directly with ISVs to upgrade and renew the application. After you subscribe to the new offer, the license is automatically updated in AWS License Manager. You can view all the licenses you have purchased from AWS Marketplace using AWS License Manager, including the application capabilities you’re entitled to and the expiration date.

Launch Partners of AWS Marketplace for Containers Anywhere
Here is the list of our launch partners to support an on-premises deployment option. Try them out today!

  • D2iQ delivers the leading independent platform for enterprise-grade Kubernetes implementations at scale and across environments, including cloud, hybrid, edge, and air-gapped.
  • HAProxy Technologies offers widely used software load balancers to deliver websites and applications with the utmost performance, observability, and security at any scale and in any environment.
  • Isovalent builds open-source software and enterprise solutions such as Cilium and eBPF solving networking, security, and observability needs for modern cloud-native infrastructure.
  • JFrog‘s “liquid software” mission is to power the world’s software updates through the seamless, secure flow of binaries from developers to the edge.
  • Kasten by Veeam provides Kasten K10, a data management platform purpose-built for Kubernetes, an easy-to-use, scalable, and secure system for backup and recovery, disaster recovery, and application mobility.
  • Nirmata, the creator of Kyverno, provides open source and enterprise solutions for policy-based security and automation of production Kubernetes workloads and clusters.
  • Palo Alto Networks, the global cybersecurity leader, is shaping the cloud-centric future with technology that is transforming the way people and organizations operate.
  • Prosimo‘s SaaS combines cloud networking, performance, security, AI powered observability and cost management to reduce enterprise cloud deployment complexity and risk.
  • Solodev is an enterprise CMS and digital ecosystem for building custom cloud apps, from content to crypto. Get access to DevOps, training, and 24/7 support—powered by AWS.
  • Trilio, a leader in cloud-native data protection for Kubernetes, OpenStack, and Red Hat Virtualization environments, offers solutions for backup and recovery, migration, and application mobility.

If you are interested in offering your Kubernetes application on AWS Marketplace, register and modify your product to integrate with AWS License Manager APIs using the provided AWS SDK. Integrating with AWS License Manager will allow the application to check licenses procured through AWS Marketplace.

Next, you would create a new container product on AWS Marketplace with a contract offer by submitting details of the listing, including the product information, license options, and pricing. The details would be reviewed, approved, and published by AWS Marketplace Technical Account Managers. You would then submit the new container image to AWS Marketplace ECR and add it to a newly created container product through the self-service Marketplace Management Portal. All container images are scanned for Common Vulnerabilities and Exposures (CVEs).

Finally, the product listing and container images would be published and accessible by customers on AWS Marketplace’s customer website. To learn more details about creating container products on AWS Marketplace, visit Getting started as a seller and Container-based products in the AWS documentation.

Available Now
The feature of AWS Marketplace for Containers Anywhere is available now in all Regions that support AWS Marketplace. You can start using the feature directly from the product of launch partners.

Give it a try, and please send us feedback either in the AWS forum for AWS Marketplace or through your usual AWS support contacts.

Channy

New – AWS Proton Supports Terraform and Git Repositories to Manage Templates

Post Syndicated from Marcia Villalba original https://aws.amazon.com/blogs/aws/new-aws-proton-supports-terraform-and-git-repositories-to-manage-templates/

Today we are announcing the launch of two features for AWS Proton. First, the most requested one in the AWS Proton open roadmap, to define and provision infrastructure using Terraform. Second, the capability to manage AWS Proton templates directly from Git repositories.

AWS Proton is a fully managed application delivery service for containers and serverless applications, announced during reinvent 2020. AWS Proton aims to help infrastructure teams automate and manage their infrastructure without impacting developer productivity. It allows developers to get the templates they need to deliver their applications without the need to involve the platform team.

When using AWS Proton, the infrastructure team needs to define the environment and the service templates. Learn more about the templates.

Template Sync
This new feature in AWS Proton enables the platform team to push, update, and publish templates directly from their Git repositories. Now when you create a new service or environment template, you can specify a remote Git repository containing the templates. AWS Proton will automatically sync those templates and make them available for use. When there are changes to the Git repository, AWS Proton will take care of the updates.

Create enviroment template

One important advantage of using repositories and syncing the templates is that it simplifies the process of the administrators for uploading, updating, and registering the templates. This process, when done manually, can be error-prone and inconvenient. Now you can automate the process of authoring and updating the templates. Also, you can add more validations using pull requests and track the changes to the templates.

Template sync allows collaboration between the platform team and the developers. By having all the templates in a Git repository, all the collaboration tooling available in platforms like GitHub becomes available to everybody. Now developers can see all the templates, and when they want to improve them, they can just create a pull request with the changes. In addition, tools like bug trackers and features requests can be used to manage the templates.

Configuring the Repository Link
To get started using template sync, you need to give AWS Proton permissions to access your repositories. For that, you need to create a link between AWS Proton and your repository.

To do this, first create a new source connection for your GitHub account. Then you need to create a new repository link from the AWS Proton. Go to the Repositories option in the side bar. Then in the Link new repository screen, use the GitHub connection that you just created and specify a repository name.

Create new link repository

AWS Proton supports Terraform
Until now, AWS CloudFormation was the only infrastructure as code (IaC) engine available in AWS Proton. Now you can define service and environment templates based on infrastructure defined using Terraform and through a pull-request-based mechanism, use Terraform to provision and keep your infrastructure updated.

Platforms teams author their IaC templates in HCL, the Terraform language, and then provision the infrastructure using Terraform Open Source. AWS Proton renders the ready-to-provision Terraform module and makes a pull request to your infrastructure repository, from where you can plan and apply the changes.

This operation is asynchronous, as AWS Proton is not the one managing the provision of infrastructure. Therefore it is important that in the process of provisioning the infrastructure, there is a step that notifies AWS Proton of the status of the deployment.

I want to show you a demo on how you can set up an environment using Terraform. For that, you will use GitHub actions to provision the Terraform infrastructure in your AWS account.

To get started with Terraform templates, first, configure the repository link as it was described before. Then you need to create a new role to give permissions to GitHub actions to perform some activities in your AWS account. You can find the AWS CloudFormation template for this role here.

Create an empty GitHub repository and create a folder .github/workflows/. Create a file called terraform.yml. In that file, you need to define the GitHub actions to plan and apply the infrastructure changes. Copy the template from the terraform example file.

This template configures your AWS credentials, configures Terraform, plans the whole infrastructure, and applies the changes in the infrastructure using Terraform, and then notifies AWS Proton on the status of this process.

In addition, you need to modify the file env_config.json, which is located inside that folder. In that file, you need to add the configuration for the environment you plan to create. You can append new environments to the JSON file. In the example, the environment is called tf-test. The role is the role you created previously, and the region is the region where you want to deploy this infrastructure. Look at the example file.

{
    “tf-test”: {
        “role”: “arn:aws:iam::123456789:role/TerraformGitHubActionsRole”,
        “region”: “us-west-2”
    }
}

For this example, you upload the Terraform project to Amazon S3. See an example of a Terraform project.

Now it is time to create a new environment template in AWS Proton. You can follow the instructions in the console.

When your environment template is ready, create a new environment using the template you just created. When configuring the environment, select Provision through pull request and then configure the repository with the correct parameters.

Configure new enviromentNow, in the Environment details, you can see the Deployment status to be In progress. This will stay like this until the GitHub action finishes.

Environment details

If you go to your repository, you should see a new pull request. Next to the pull request name, you will see a red cross, yellow dot, or green check. That icon depends on the status of the GitHub action. If you have a yellow dot, wait for it to turn red or green. If there is an error, you need to see what is going on inside the logs of the GitHub action.

If you see a green check on the pull request, it means that the GitHub actions has completed, and the pull request can be merged. After the pull request is merged, the infrastructure is provisioned. Go back to the Environment Details page. After a while, and once your infrastructure is provisioned, which can take some minutes depending on your template, you should see that the Deployment Status is Successful.

Github pull request

By the end of this demo, you have provisioned your infrastructure using AWS Proton to handle the environment templates and GitHub actions, and Terraform Open Source to provision the infrastructure in your AWS account.

Availability
Terraform support is available in public preview mode.

These new features are available in the regions where AWS Proton is available: US East (Ohio), US East (N. Virginia), US West (Oregon), Asia Pacific (Tokyo), and Europe (Ireland).

To learn more about these features, visit the AWS Proton service page.

Marcia

Migrate your Applications to Containers at Scale

Post Syndicated from John O'Donnell original https://aws.amazon.com/blogs/architecture/migrate-your-applications-to-containers-at-scale/

AWS App2Container is a command line tool that you can install on a server to automate the containerization of applications. This simplifies the process of migrating a single server to containers. But if you have a fleet of servers, the process of migrating all of them could be quite time-consuming. In this situation, you can automate the process using App2Container. You’ll then be able to leverage configuration management tools such as Chef, Ansible, or AWS Systems Manager. In this blog, we will illustrate an architecture to scale out App2Container, using AWS Systems Manager.

Why migrate to containers?

Organizations can move to secure, low-touch services with Containers on AWS. A container is a lightweight, standalone collection of software that includes everything needed to run an application. This can include code, runtime, system tools, system libraries, and settings. Containers provide logical isolation and will always run the same, regardless of the host environment.

If you are running a .NET application hosted on Windows Internet Information Server (IIS), when it reaches end of life (EOL) you have two options. Either migrate entire server platforms, or re-host websites on other hosting platforms. Both options require manual effort and are often too complex to implement for legacy workloads. Once workloads have been migrated, you must still perform costly ongoing patching and maintenance.

Modernize with AWS App2Container

Containers can be used for these legacy workloads via AWS App2Container. AWS App2Container is a command line interface (CLI) tool for modernizing .NET and Java applications into containerized applications. App2Container analyzes and builds an inventory of all applications running in virtual machines, on-premises, or in the cloud. App2Container reduces the need to migrate the entire server OS, and moves only the specific workloads needed.

After you select the application you want to containerize, App2Container does the following:

  • Packages the application artifact and identified dependencies into container images
  • Configures the network ports
  • Generates the infrastructure, Amazon Elastic Container Service (ECS) tasks, and Kubernetes pod definitions

App2Container has a specific set of steps and requirements you must follow to create container images:

  1. Create an Amazon Simple Storage Service (S3) bucket to store your artifacts generated from each server.
  2. Create an AWS Identity and Access Management (IAM) user that has access to the Amazon S3 buckets and a designated Amazon Elastic Container Registry (ECR).
  3. Deploy a worker node as an Amazon Elastic Compute Cloud (Amazon EC2) instance. This will include a compatible operating system, which will take the artifacts and convert them into containers.
  4. Install the App2Container agent on each server that you want to migrate.
  5. Run a set of commands on each server for each application that you want to convert into a container.
  6. Run the commands on your worker node to perform the containerization and deployment.

Following, we will introduce a way to automate App2Container to reduce the time needed to deploy and scale this functionality throughout your environment.

Scaling App2Container

AWS App2Container streamlines the process of containerizing applications on a single server. For each server you must install the App2Container agent, initialize it, run an inventory, and run an analysis. But you can save time when containerizing a fleet of machines by automation, using AWS Systems Manager. AWS Systems Manager enables you to create documents with a set of command line steps that can be applied to one or more servers.

App2Container also supports setting up a worker node that can consume the output of the App2Container analysis step. This can be deployed to the new containerized version of the applications. This allows you to follow the security best practice of least privilege. Only the worker node will have permissions to deploy containerized applications. The migrating servers will need permissions to write the analysis output into an S3 bucket.

Separate the App2Container process into two parts to use the worker node.

  • Analysis. This runs on the target server we are migrating. The results are output into S3.
  • Deployment. This runs on the worker node. It pushes the container image to Amazon ECR. It can deploy a running container to either Amazon ECS or Amazon Elastic Kubernetes Service (EKS).
Figure 1. App2Container scaling architecture overview

Figure 1. App2Container scaling architecture overview

Architectural walkthrough

As you can see in Figure 1, we need to set up an Amazon EC2 instance as the worker node, an S3 bucket for the analysis output, and two AWS Systems Manager documents. The first document is run on the target server. It will install App2Container and run the analysis steps. The second document is run on the worker node and handles the deployment of the container image.
The AWS Systems Manager targets one or many hosts, enabling you to run the analysis step in parallel for multiple servers. Results and artifacts such as files or .Net assembly code, are sent to the preconfigured Amazon S3 bucket for processing as shown in Figure 2.

Figure 2. Container migration target servers

Figure 2. Container migration target servers

After the artifacts have been generated, a second document can be run against the worker node. This scans all files in the Amazon S3 bucket, and workloads are automatically containerized. The resulting images are pushed to Amazon ECR, as shown in Figure 3.

Figure 3. Container migration conversion

Figure 3. Container migration conversion

When this process is completed, you can then choose how to deploy these images, using Amazon ECS and/or Amazon EKS. Once the images and deployments are tested and the migration is completed, target servers and migration factory resources can be safely decommissioned.

This architecture demonstrates an automated approach to containerizing .NET web applications. AWS Systems Manager is used for discovery, package creation, and posting to an Amazon S3 bucket. An EC2 instance converts the package into a container so it is ready to use. The final step is to push the converted container to a scalable container repository (Amazon ECR). This way it can easily be integrated into our container platforms (ECS and EKS).

Summary

This solution offers many benefits to migrating legacy .Net based websites directly to containers. This proposed architecture is powered by AWS App2Container and automates the tooling on many targets in a secure manner. It is important to keep in mind that every customer portfolio and application requirements are unique. Therefore, it’s essential to validate and review any migration plans with business and application owners. With the right planning, engagement, and implementation, you should have a smooth and rapid journey to AWS Containers.

If you have any questions, post your thoughts in the comments section.

For further reading:

Generating DevOps Guru Proactive Insights for Amazon ECS

Post Syndicated from Trishanka Saikia original https://aws.amazon.com/blogs/devops/generate-devops-guru-proactive-insights-in-ecs-using-container-insights/

Monitoring is fundamental to operating an application in production, since we can only operate what we can measure and alert on. As an application evolves, or the environment grows more complex, it becomes increasingly challenging to maintain monitoring thresholds for each component, and to validate that they’re still set to an effective value. We not only want monitoring alarms to trigger when needed, but also want to minimize false positives.

Amazon DevOps Guru is an AWS service that helps you effectively monitor your application by ingesting vended metrics from Amazon CloudWatch. It learns your application’s behavior over time and then detects anomalies. Based on these anomalies, it generates insights by first combining the detected anomalies with suspected related events from AWS CloudTrail, and then providing the information to you in a simple, ready-to-use dashboard when you start investigating potential issues. Amazon DevOpsGuru makes use of the CloudWatch Containers Insights to detect issues around resource exhaustion for Amazon ECS or Amazon EKS applications. This helps in proactively detecting issues like memory leaks in your applications before they impact your users, and also provides guidance as to what the probable root-causes and resolutions might be.

This post will demonstrate how to simulate a memory leak in a container running in Amazon ECS, and have it generate a proactive insight in Amazon DevOps Guru.

Solution Overview

The following diagram shows the environment we’ll use for our scenario. The container “brickwall-maker” is preconfigured as to how quickly to allocate memory, and we have built this container image and published it to our public Amazon ECR repository. Optionally, you can build and host the docker image in your own private repository as described in step 2 & 3.

After creating the container image, we’ll utilize an AWS CloudFormation template to create an ECS Cluster and an ECS Service called “Test” with a desired count of two. This will create two tasks using our “brickwall-maker” container image. The stack will also enable Container Insights for the ECS Cluster. Then, we will enable resource coverage for this CloudFormation stack in Amazon DevOpsGuru in order to start our resource analysis.

Architecture Diagram showing the service “Test” using the container “brickwall-maker” with a desired count of two. The two ECS Task’s vended metrics are then processed by CloudWatch Container Insights. Both, CloudWatch Container Insights and CloudTrail, are ingested by Amazon DevOps Guru which then makes detected insights available to the user. [Image: DevOpsGuruBlog1.png]V1: DevOpsGuruBlog1.drawio (https://api.quip-amazon.com/2/blob/fbe9AAT37Ge/LdkTqbmlZ8uNj7A44pZbnw?name=DevOpsGuruBlog1.drawio&s=cVbmAWsXnynz) V2: DevOpsGuruBlog1.drawio (https://api.quip-amazon.com/2/blob/fbe9AAT37Ge/SvsNTJLEJOHHBls_kV7EwA?name=DevOpsGuruBlog1.drawio&s=cVbmAWsXnynz) V3: DevOpsGuruBlog1.drawio (https://api.quip-amazon.com/2/blob/fbe9AAT37Ge/DqKTxtQvmOLrzM3KcF_oTg?name=DevOpsGuruBlog1.drawio&s=cVbmAWsXnynz)

Source provided on GitHub:

  • DevOpsGuru.yaml
  • EnableDevOpsGuruForCfnStack.yaml
  • Docker container source

Steps:

1. Create your IDE environment

In the AWS Cloud9 console, click Create environment, give your environment a Name, and click Next step. On the Environment settings page, change the instance type to t3.small, and click Next step. On the Review page, make sure that the Name and Instance type are set as intended, and click Create environment. The environment creation will take a few minutes. After that, the AWS Cloud9 IDE will open, and you can continue working in the terminal tab displayed in the bottom pane of the IDE.

Install the following prerequisite packages, and ensure that you have docker installed:

sudo yum install -y docker
sudo service docker start 
docker --version
Clone the git repository in order to download the required CloudFormation templates and code:

git clone https://github.com/aws-samples/amazon-devopsguru-brickwall-maker

Change to the directory that contains the cloned repository

cd amazon-devopsguru-brickwall-maker

2. Optional : Create ECR private repository

If you want to build your own container image and host it in your own private ECR repository, create a new repository with the following command and then follow the steps to prepare your own image:

aws ecr create-repository —repository-name brickwall-maker

3. Optional: Prepare Docker Image

Authenticate to Amazon Elastic Container Registry (ECR) in the target region

aws ecr get-login-password --region ap-northeast-1 | \
    docker login --username AWS --password-stdin \
    123456789012.dkr.ecr.ap-northeast-1.amazonaws.com

In the above command, as well as in the following shown below, make sure that you replace 123456789012 with your own account ID.

Build brickwall-maker Docker container:

docker build -t brickwall-maker .

Tag the Docker container to prepare it to be pushed to ECR:

docker tag brickwall-maker:latest 123456789012.dkr.ecr.ap-northeast-1.amazonaws.com/brickwall-maker:latest

Push the built Docker container to ECR

docker push 123456789012.dkr.ecr.ap-northeast-1.amazonaws.com/brickwall-maker:latest

4. Launch the CloudFormation template to deploy your ECS infrastructure

To deploy your ECS infrastructure, run the following command (replace your own private ECR URL or use our public URL) in the ParameterValue) to launch the CloudFormation template :

aws cloudformation create-stack --stack-name myECS-Stack \
--template-body file://DevOpsGuru.yaml \
--capabilities CAPABILITY_IAM CAPABILITY_NAMED_IAM \
--parameters ParameterKey=ImageUrl,ParameterValue=public.ecr.aws/p8v8e7e5/myartifacts:brickwallv1

5. Enable DevOps Guru to monitor the ECS Application

Run the following command to enable DevOps Guru for monitoring your ECS application:

aws cloudformation create-stack \
--stack-name EnableDevOpsGuruForCfnStack \
--template-body file://EnableDevOpsGuruForCfnStack.yaml \
--parameters ParameterKey=CfnStackNames,ParameterValue=myECS-Stack

6. Wait for base-lining of resources

This step lets DevOps Guru complete the baselining of the resources and benchmark the normal behavior. For this particular scenario, we recommend waiting two days before any insights are triggered.

Unlike other monitoring tools, the DevOps Guru dashboard would not present any counters or graphs. In the meantime, you can utilize CloudWatch Container Insights to monitor the cluster-level, task-level, and service-level metrics in ECS.

7. View Container Insights metrics

  • Open the CloudWatch console.
  • In the navigation pane, choose Container Insights.
  • Use the drop-down boxes near the top to select ECS Services as the resource type to view, then select DevOps Guru as the resource to monitor.
  • The performance monitoring view will show you graphs for several metrics, including “Memory Utilization”, which you can watch increasing from here. In addition, it will show the list of tasks in the lower “Task performance” pane showing the “Avg CPU” and “Avg memory” metrics for the individual tasks.

8. Review DevOps Guru insights

When DevOps Guru detects an anomaly, it generates a proactive insight with the relevant information needed to investigate the anomaly, and it will list it in the DevOps Guru Dashboard.

You can view the insights by clicking on the number of insights displayed in the dashboard. In our case, we expect insights to be shown in the “proactive insights” category on the dashboard.

Once you have opened the insight, you will see that the insight view is divided into the following sections:

  • Insight Overview with a basic description of the anomaly. In this case, stating that Memory Utilization is approaching limit with details of the stack that is being affected by the anomaly.
  • Anomalous metrics consisting of related graphs and a timeline of the predicted impact time in the future.
  • Relevant events with contextual information, such as changes or updates made to the CloudFormation stack’s resources in the region.
  • Recommendations to mitigate the issue. As seen in the following screenshot, it recommends troubleshooting High CPU or Memory Utilization in ECS along with a link to the necessary documentation.

The following screenshot illustrates an example insight detail page from DevOps Guru

 An example of an ECS Service’s Memory Utilization approaching a limit of 100%. The metric graph shows the anomaly starting two days ago at about 22:00 with memory utilization increasing steadily until the anomaly was reported today at 18:08. The graph also shows a forecast of the memory utilization with a predicted impact of reaching 100% the next day at about 22:00.

Potentially related events on a timeline and below them a list of recommendations. Two deployment events are shown without further details on a timeline. The recommendations table links to one document on how to troubleshoot high CPU or memory utilization in Amazon ECS.

Conclusion

This post describes how DevOps Guru continuously monitors resources in a particular region in your AWS account, as well as proactively helps identify problems around resource exhaustion such as running out of memory, in advance. This helps IT operators take preventative actions even before a problem presents itself, thereby preventing downtime.

Cleaning up

After walking through this post, you should clean up and un-provision the resources in order to avoid incurring any further charges.

  1. To un-provision the CloudFormation stacks, on the AWS CloudFormation console, choose Stacks. Select the stack name, and choose Delete.
  2. Delete the AWS Cloud9 environment.
  3. Delete the ECR repository.

About the authors

Trishanka Saikia

Trishanka Saikia is a Technical Account Manager for AWS. She is also a DevOps enthusiast and works with AWS customers to design, deploy, and manage their AWS workloads/architectures.

Gerhard Poul

Gerhard Poul is a Senior Solutions Architect at Amazon Web Services based in Vienna, Austria. Gerhard works with customers in Austria to enable them with best practices in their cloud journey. He is passionate about infrastructure as code and how cloud technologies can improve IT operations.

Offloading SQL for Amazon RDS using the Heimdall Proxy

Post Syndicated from Antony Prasad Thevaraj original https://aws.amazon.com/blogs/architecture/offloading-sql-for-amazon-rds-using-the-heimdall-proxy/

Getting the maximum scale from your database often requires fine-tuning the application. This can increase time and incur cost – effort that could be used towards other strategic initiatives. The Heimdall Proxy was designed to intelligently manage SQL connections to help you get the most out of your database.

In this blog post, we demonstrate two SQL offload features offered by this proxy:

  1. Automated query caching
  2. Read/Write split for improved database scale

By leveraging the solution shown in Figure 1, you can save on development costs and accelerate the onboarding of applications into production.

Figure 1. Heimdall Proxy distributed, auto-scaling architecture

Figure 1. Heimdall Proxy distributed, auto-scaling architecture

Why query caching?

For ecommerce websites with high read calls and infrequent data changes, query caching can drastically improve your Amazon Relational Database Sevice (RDS) scale. You can use Amazon ElastiCache to serve results. Retrieving data from cache has a shorter access time, which reduces latency and improves I/O operations.

It can take developers considerable effort to create, maintain, and adjust TTLs for cache subsystems. The proxy technology covered in this article has features that allow for automated results caching in grid-caching chosen by the user, without code changes. What makes this solution unique is the distributed, scalable architecture. As your traffic grows, scaling is supported by simply adding proxies. Multiple proxies work together as a cohesive unit for caching and invalidation.

View video: Heimdall Data: Query Caching Without Code Changes

Why Read/Write splitting?

It can be fairly straightforward to configure a primary and read replica instance on the AWS Management Console. But it may be challenging for the developer to implement such a scale-out architecture.

Some of the issues they might encounter include:

  • Replication lag. A query read-after-write may result in data inconsistency due to replication lag. Many applications require strong consistency.
  • DNS dependencies. Due to the DNS cache, many connections can be routed to a single replica, creating uneven load distribution across replicas.
  • Network latency. When deploying Amazon RDS globally using the Amazon Aurora Global Database, it’s difficult to determine how the application intelligently chooses the optimal reader.

The Heimdall Proxy streamlines the ability to elastically scale out read-heavy database workloads. The Read/Write splitting supports:

  • ACID compliance. Determines the replication lag and know when it is safe to access a database table, ensuring data consistency.
  • Database load balancing. Tracks the status of each DB instance for its health and evenly distribute connections without relying on DNS.
  • Intelligent routing. Chooses the optimal reader to access based on the lowest latency to create local-like response times. Check out our Aurora Global Database blog.

View video: Heimdall Data: Scale-Out Amazon RDS with Strong Consistency

Customer use case: Tornado

Hayden Cacace, Director of Engineering at Tornado

Tornado is a modern web and mobile brokerage that empowers anyone who aspires to become a better investor.

Our engineering team was tasked to upgrade our backend such that it could handle a massive surge in traffic. With a 3-month timeline, we decided to use read replicas to reduce the load on the main database instance.

First, we migrated from Amazon RDS for PostgreSQL to Aurora for Postgres since it provided better data replication speed. But we still faced a problem – the amount of time it would take to update server code to use the read replicas would be significant. We wanted the team to stay focused on user-facing enhancements rather than server refactoring.

Enter the Heimdall Proxy: We evaluated a handful of options for a database proxy that could automatically do Read/Write splits for us with no code changes, and it became clear that Heimdall was our best option. It had the Read/Write splitting “out of the box” with zero application changes required. And it also came with database query caching built-in (integrated with Amazon ElastiCache), which promised to take additional load off the database.

Before the Tornado launch date, our load testing showed the new system handling several times more load than we were able to previously. We were using a primary Aurora Postgres instance and read replicas behind the Heimdall proxy. When the Tornado launch date arrived, the system performed well, with some background jobs averaging around a 50% hit rate on the Heimdall cache. This has really helped reduce the database load and improve the runtime of those jobs.

Using this solution, we now have a data architecture with additional room to scale. This allows us to continue to focus on enhancing the product for all our customers.

Download a free trial from the AWS Marketplace.

Resources

Heimdall Data, based in the San Francisco Bay Area, is an AWS Advanced Tier ISV partner. They have Amazon Service Ready designations for Amazon RDS and Amazon Redshift. Heimdall Data offers a database proxy that offloads SQL improving database scale. Deployment does not require code changes. For other proxy options, consider the Amazon RDS Proxy, PgBouncer, PgPool-II, or ProxySQL.

Simulated location data with Amazon Location Service

Post Syndicated from Aaron Sempf original https://aws.amazon.com/blogs/devops/simulated-location-data-with-amazon-location-service/

Modern location-based applications require the processing and storage of real-world assets in real-time. The recent release of Amazon Location Service and its Tracker feature makes it possible to quickly and easily build these applications on the AWS platform. Tracking real-world assets is important, but at some point when working with Location Services you will need to demo or test location-based applications without real-world assets.

Applications that track real-world assets are difficult to test and demo in a realistic setting, and it can be hard to get your hands on large amounts of real-world location data. Furthermore, not every company or individual in the early stages of developing a tracking application has access to a large fleet of test vehicles from which to derive this data.

Location data can also be considered highly sensitive, because it can be easily de-anonymized to identify individuals and movement patterns. Therefore, only a few openly accessible datasets exist and are unlikely to exhibit the characteristics required for your particular use-case.

To overcome this problem, the location-based services community has developed multiple openly available location data simulators. This blog will demonstrate how to connect one of those simulators to Amazon Location Service Tracker to test and demo your location-based services on AWS.

Walk-through

Part 1: Create a tracker in Amazon Location Service

This walkthrough will demonstrate how to get started setting up simulated data into your tracker.

Amazon location Service console
Step 1: Navigate to Amazon Location Service in the AWS Console and select “Trackers“.

Step 2: On the “Trackers” screen click the orange “Create tracker“ button.

Select Create Tracker

Create a Tracker form

Step 3: On the “Create tracker” screen, name your tracker and make sure to reply “Yes” to the question asking you if you will only use simulated or sample data. This allows you to use the free-tier of the service.

Next, click “Create tracker” to create you tracker.

Confirm create tracker

Done. You’ve created a tracker. Note the “Name” of your tracker.

Generate trips with the SharedStreets Trip-simulator

A common option for simulating trip data is the shared-steets/trip-simulator project.

SharedStreets maintains an open-source project on GitHub – it is a probabilistic, multi-agent GPS trajectory simulator. It even creates realistic noise, and thus can be used for testing algorithms that must work under real-world conditions. Of course, the generated data is fake, so privacy is not a concern.

The trip-simulator generates files with a single GPS measurement per line. To playback those files to the Amazon Location Service Tracker, you must use a tool to parse the file; extract the GPS measurements, time measurements, and device IDs of the simulated vehicles; and send them to the tracker at the right time.

Before you start working with the playback program, the trip-simulator requires a map to simulate realistic trips. Therefore, you must download a part of OpenStreetMap (OSM). Using GeoFabrik you can download extracts at the size of states or selected cities based on the area within which you want to simulate your data.

This blog will demonstrate how to simulate a small fleet of cars in the greater Munich area. The example will be written for OS-X, but it generalizes to Linux operating systems. If you have a Windows operating system, I recommend using Windows Subsystem for Linux (WSL). Alternatively, you can run this from a Cloud9 IDE in your AWS account.

Step 1: Download the Oberbayern region from download.geofabrik.de

Prerequisites:

curl https://download.geofabrik.de/europe/germany/bayern/oberbayern-latest.osm.pbf -o oberbayern-latest.osm.pbf

Step 2: Install osmium-tool

Prerequisites:

brew install osmium-tool

Step 3: Extract Munich from the Oberbayern map

osmium extract -b "11.5137,48.1830,11.6489,48.0891" oberbayern-latest.osm.pbf -o ./munich.osm.pbf -s "complete_ways" --overwrite

Step 4: Pre-process the OSM map for the vehicle routing

Prerequisites:

docker run -t -v $(pwd):/data osrm/osrm-backend:v5.25.0 osrm-extract -p /opt/car.lua /data/munich.osm.pbf
docker run -t -v $(pwd):/data osrm/osrm-backend:v5.25.0 osrm-contract /data/munich.osrm

Step 5: Install the trip-simulator

Prerequisites:

npm install -g trip-simulator

Step 6: Run a 10 car, 30 minute car simulation

trip-simulator \
  --config car \
  --pbf munich.osm.pbf \
  --graph munich.osrm \
  --agents 10 \
  --start 1563122921000 \
  --seconds 1800 \
  --traces ./traces.json \
  --probes ./probes.json \
  --changes ./changes.json \
  --trips ./trips.json

The probes.json file is the file containing the GPS probes we will playback to Amazon Location Service.

Part 2: Playback trips to Amazon Location Service

Now that you have simulated trips in the probes.json file, you can play them back in the tracker created earlier. For this, you must write only a few lines of Python code. The following steps have been neatly separated into a series of functions that yield an iterator.

Prerequisites:

Step 1: Load the probes.json file and yield each line

import json
import time
import datetime
import boto3

def iter_probes_file(probes_file_name="probes.json"):
    """Iterates a file line by line and yields each individual line."""
    with open(probes_file_name) as probes_file:
        while True:
            line = probes_file.readline()
            if not line:
                break
            yield line

Step 2: Parse the probe on each line
To process the probes, you parse the JSON on each line and extract the data relevant for the playback. Note that the coordinates order is longitude, latitude in the probes.json file. This is the same order that the Location Service expects.

def parse_probes_trip_simulator(probes_iter):
    """Parses a file witch contains JSON document, one per line.
    Each line contains exactly one GPS probe. Example:
    {"properties":{"id":"RQQ-7869","time":1563123002000,"status":"idling"},"geometry":{"type":"Point","coordinates":[-86.73903753135207,36.20418779626351]}}
    The function returns the tuple (id,time,status,coordinates=(lon,lat))
    """
    for line in probes_iter:
        probe = json.loads(line)
        props = probe["properties"]
        geometry = probe["geometry"]
        yield props["id"], props["time"], props["status"], geometry["coordinates"]

Step 3: Update probe record time

The probes represent historical data. Therefore, when you playback you will need to normalize the probes recorded time to sync with the time you send the request in order to achieve the effect of vehicles moving in real-time.

This example is a single threaded playback. If the simulated playback lags behind the probe data timing, then you will be provided a warning through the code detecting the lag and outputting a warning.

The SharedStreets trip-simulator generates one probe per second. This frequency is too high for most applications, and in real-world applications you will often see frequencies of 15 to 60 seconds or even less. You must decide if you want to add another iterator for sub-sampling the data.

def update_probe_record_time(probes_iter):
    """
    Modify all timestamps to be relative to the time this function was called.
    I.e. all timestamps will be equally spaced from each other but in the future.
    """
    new_simulation_start_time_utc_ms = datetime.datetime.now().timestamp() * 1000
    simulation_start_time_ms = None
    time_delta_recording_ms = None
    for i, (_id, time_ms, status, coordinates) in enumerate(probes_iter):
        if time_delta_recording_ms is None:
            time_delta_recording_ms = new_simulation_start_time_utc_ms - time_ms
            simulation_start_time_ms = time_ms
        simulation_lag_sec = (
            (
                datetime.datetime.now().timestamp() * 1000
                - new_simulation_start_time_utc_ms
            )
            - (simulation_start_time_ms - time_ms)
        ) / 1000
        if simulation_lag_sec > 2.0 and i % 10 == 0:
            print(f"Playback lags behind by {simulation_lag_sec} seconds.")
        time_ms += time_delta_recording_ms
        yield _id, time_ms, status, coordinates

Step 4: Playback probes
In this step, pack the probes into small batches and introduce the timing element into the simulation playback. The reason for placing them in batches is explained below in step 6.

def sleep(time_elapsed_in_batch_sec, last_sleep_time_sec):
    sleep_time = max(
        0.0,
        time_elapsed_in_batch_sec
        - (datetime.datetime.now().timestamp() - last_sleep_time_sec),
    )
    time.sleep(sleep_time)
    if sleep_time > 0.0:
        last_sleep_time_sec = datetime.datetime.now().timestamp()
    return last_sleep_time_sec


def playback_probes(
    probes_iter,
    batch_size=10,
    batch_window_size_sec=2.0,
):
    """
    Replays the probes in live mode.
    The function assumes, that the probes returned by probes_iter are sorted
    in ascending order with respect to the probe timestamp.
    It will either yield batches of size 10 or smaller batches if the timeout is reached.
    """
    last_probe_record_time_sec = None
    time_elapsed_in_batch_sec = 0
    last_sleep_time_sec = datetime.datetime.now().timestamp()
    batch = []
    # Creates two second windows and puts all the probes falling into
    # those windows into a batch. If the max. batch size is reached it will yield early.
    for _id, time_ms, status, coordinates in probes_iter:
        probe_record_time_sec = time_ms / 1000
        if last_probe_record_time_sec is None:
            last_probe_record_time_sec = probe_record_time_sec
        time_to_next_probe_sec = probe_record_time_sec - last_probe_record_time_sec
        if (time_elapsed_in_batch_sec + time_to_next_probe_sec) > batch_window_size_sec:
            last_sleep_time_sec = sleep(time_elapsed_in_batch_sec, last_sleep_time_sec)
            yield batch
            batch = []
            time_elapsed_in_batch_sec = 0
        time_elapsed_in_batch_sec += time_to_next_probe_sec
        batch.append((_id, time_ms, status, coordinates))
        if len(batch) == batch_size:
            last_sleep_time_sec = sleep(time_elapsed_in_batch_sec, last_sleep_time_sec)
            yield batch
            batch = []
            time_elapsed_in_batch_sec = 0
        last_probe_record_time_sec = probe_record_time_sec
    if len(batch) > 0:
        last_sleep_time_sec = sleep(time_elapsed_in_batch_sec, last_sleep_time_sec)
        yield batch

Step 5: Create the updates for the tracker

LOCAL_TIMEZONE = (
    datetime.datetime.now(datetime.timezone(datetime.timedelta(0))).astimezone().tzinfo
)

def convert_to_tracker_updates(probes_batch_iter):
    """
    Converts batches of probes in the format (id,time_ms,state,coordinates=(lon,lat))
    into batches ready for upload to the tracker.
    """
    for batch in probes_batch_iter:
        updates = []
        for _id, time_ms, _, coordinates in batch:
            # The boto3 location service client expects a datetime object for sample time
            dt = datetime.datetime.fromtimestamp(time_ms / 1000, LOCAL_TIMEZONE)
            updates.append({"DeviceId": _id, "Position": coordinates, "SampleTime": dt})
        yield updates

Step 6: Send the updates to the tracker
In the update_tracker function, you use the batch_update_device_position function of the Amazon Location Service Tracker API. This lets you send batches of up to 10 location updates to the tracker in one request. Batching updates is much more cost-effective than sending one-by-one. You pay for each call to batch_update_device_position. Therefore, batching can lead to a 10x cost reduction.

def update_tracker(batch_iter, location_client, tracker_name):
    """
    Reads tracker updates from an iterator and uploads them to the tracker.
    """
    for update in batch_iter:
        response = location_client.batch_update_device_position(
            TrackerName=tracker_name, Updates=update
        )
        if "Errors" in response and response["Errors"]:
            for error in response["Errors"]:
                print(error["Error"]["Message"])

Step 7: Putting it all together
The follow code is the main section that glues every part together. When using this, make sure to replace the variables probes_file_name and tracker_name with the actual probes file location and the name of the tracker created earlier.

if __name__ == "__main__":
    location_client = boto3.client("location")
    probes_file_name = "probes.json"
    tracker_name = "my-tracker"
    iterator = iter_probes_file(probes_file_name)
    iterator = parse_probes_trip_simulator(iterator)
    iterator = update_probe_record_time(iterator)
    iterator = playback_probes(iterator)
    iterator = convert_to_tracker_updates(iterator)
    update_tracker(
        iterator, location_client=location_client, tracker_name=tracker_name
    )

Paste all of the code listed in steps 1 to 7 into a file called trip_playback.py, then execute

python3 trip_playback.py

This will start the playback process.

Step 8: (Optional) Tracking a device’s position updates
Once the playback is running, verify that the updates are actually written to the tracker repeatedly querying the tracker for updates for a single device. Here, you will use the get_device_position function of the Amazon Location Service Tracker API to receive the last known device position.

import boto3
import time

def get_last_vehicle_position_from_tracker(
    device_id, tracker_name="your-tracker", client=boto3.client("location")
):
    response = client.get_device_position(DeviceId=device_id, TrackerName=tracker_name)
    if response["ResponseMetadata"]["HTTPStatusCode"] != 200:
        print(str(response))
    else:
        lon = response["Position"][0]
        lat = response["Position"][1]
        return lon, lat, response["SampleTime"]
        
if __name__ == "__main__":   
    device_id = "my-device"     
    tracker_name = "my-tracker"
    while True:
        lon, lat, sample_time = get_last_vehicle_position_from_tracker(
            device_id=device_id, tracker_name=tracker_name
        )
        print(f"{lon}, {lat}, {sample_time}")
        time.sleep(10)

In the example above, you must replace the tracker_name with the name of the tracker created earlier and the device_id with the ID of one of the simulation vehicles. You can find the vehicle IDs in the probes.json file created by the SharedStreets trip-simulator. If you run the above code, then you should see the following output.

location probes data

AWS IoT Device Simulator

As an alternative, if you are familiar with AWS IoT, AWS has its own vehicle simulator that is part of the IoT Device Simulator solution. It lets you simulate a vehicle fleet moving on a road network. This has been described here. The simulator sends the location data to an Amazon IoT endpoint. The Amazon Location Service Developer Guide shows how to write and set-up a Lambda function to connect the IoT topic to the tracker.

The AWS IoT Device Simulator has a GUI and is a good choice for simulating a small number of vehicles. The drawback is that only a few trips are pre-packaged with the simulator and changing them is somewhat complicated. The SharedStreets Trip-simulator has much more flexibility, allowing simulations of fleets made up of a larger number of vehicles, but it has no GUI for controlling the playback or simulation.

Cleanup

You’ve created a Location Service Tracker resource. It does not incur any charges if it isn’t used. If you want to delete it, you can do so on the Amazon Location Service Tracker console.

Conclusion

This blog showed you how to use an open-source project and open-source data to generate simulated trips, as well as how to play those trips back to the Amazon Location Service Tracker. Furthermore, you have access to the AWS IoT Device Simulator, which can also be used for simulating vehicles.

Give it a try and tell us how you test your location-based applications in the comments.

About the authors

Florian Seidel

Florian is a Solutions Architect in the EMEA Automotive Team at AWS. He has worked on location based services in the automotive industry for the last three years and has many years of experience in software engineering and software architecture.

Aaron Sempf

Aaron is a Senior Partner Solutions Architect, in the Global Systems Integrators team. When not working with AWS GSI partners, he can be found coding prototypes for autonomous robots, IoT devices, and distributed solutions.

Use Amazon ECS Fargate Spot with CircleCI to deploy and manage applications in a cost-effective way

Post Syndicated from Pritam Pal original https://aws.amazon.com/blogs/devops/deploy-apps-cost-effective-way-with-ecs-fargate-spot-and-circleci/

This post is written by Pritam Pal, Sr EC2 Spot Specialist SA & Dan Kelly, Sr EC2 Spot GTM Specialist

Customers are using Amazon Web Services (AWS) to build CI/CD pipelines and follow DevOps best practices in order to deliver products rapidly and reliably. AWS services simplify infrastructure provisioning and management, application code deployment, software release processes automation, and application and infrastructure performance monitoring. Builders are taking advantage of low-cost, scalable compute with Amazon EC2 Spot Instances, as well as AWS Fargate Spot to build, deploy, and manage microservices or container-based workloads at a discounted price.

Amazon EC2 Spot Instances let you take advantage of unused Amazon Elastic Compute Cloud (Amazon EC2) capacity at steep discounts as compared to on-demand pricing. Fargate Spot is an AWS Fargate capability that can run interruption-tolerant Amazon Elastic Container Service (Amazon ECS) tasks at up to a 70% discount off the Fargate price. Since tasks can still be interrupted, only fault tolerant applications are suitable for Fargate Spot. However, for flexible workloads that can be interrupted, this feature enables significant cost savings over on-demand pricing.

CircleCI provides continuous integration and delivery for any platform, as well as your own infrastructure. CircleCI can automatically trigger low-cost, serverless tasks with AWS Fargate Spot in Amazon ECS. Moreover, CircleCI Orbs are reusable packages of CircleCI configuration that help automate repeated processes, accelerate project setup, and ease third-party tool integration. Currently, over 1,100 organizations are utilizing the CircleCI Amazon ECS Orb to power/run 250,000+ jobs per month.

Customers are utilizing Fargate Spot for a wide variety of workloads, such as Monte Carlo simulations and genomic processing. In this blog, I utilize a python code with the Tensorflow library that can run as a container image in order to train a simple linear model. It runs the training steps in a loop on a data batch and periodically writes checkpoints to S3. If there is a Fargate Spot interruption, then it restores the checkpoint from S3 (when a new Fargate Instance occurs) and continues training. We will deploy this on AWS ECS Fargate Spot for low-cost, serverless task deployment utilizing CircleCI.

Concepts

Before looking at the solution, let’s revisit some of the concepts we’ll be using.

Capacity Providers: Capacity providers let you manage computing capacity for Amazon ECS containers. This allows the application to define its requirements for how it utilizes the capacity. With capacity providers, you can define flexible rules for how containerized workloads run on different compute capacity types and manage the capacity scaling. Furthermore, capacity providers improve the availability, scalability, and cost of running tasks and services on Amazon ECS. In order to run tasks, the default capacity provider strategy will be utilized, or an alternative strategy can be specified if required.

AWS Fargate and AWS Fargate Spot capacity providers don’t need to be created. They are available to all accounts and only need to be associated with a cluster for utilization. When a new cluster is created via the Amazon ECS console, along with the Networking-only cluster template, the FARGATE and FARGATE_SPOT capacity providers are automatically associated with the new cluster.

CircleCI Orbs: Orbs are reusable CircleCI configuration packages that help automate repeated processes, accelerate project setup, and ease third-party tool integration. Orbs can be found in the developer hub on the CircleCI orb registry. Each orb listing has usage examples that can be referenced. Moreover, each orb includes a library of documented components that can be utilized within your config for more advanced purposes. Since the 2.0.0 release, the AWS ECS Orb supports the capacity provider strategy parameter for running tasks allowing you to efficiently run any ECS task against your new or existing clusters via Fargate Spot capacity providers.

Solution overview

Fargate Spot helps cost-optimize services that can handle interruptions like Containerized workloads, CI/CD, or Web services behind a load balancer. When Fargate Spot needs to interrupt a running task, it sends a SIGTERM signal. It is best practice to build applications capable of responding to the signal and shut down gracefully.

This walkthrough will utilize a capacity provider strategy leveraging Fargate and Fargate Spot, which mitigates risk if multiple Fargate Spot tasks get terminated simultaneously. If you’re unfamiliar with Fargate Spot, capacity providers, or capacity provider strategies, read our previous blog about Fargate Spot best practices here.

Prerequisites

Our walkthrough will utilize the following services:

  • GitHub as a code repository
  • AWS Fargate/Fargate Spot for running your containers as ECS tasks
  • CircleCI for demonstrating a CI/CD pipeline. We will utilize CircleCI Cloud Free version, which allows 2,500 free credits/week and can run 1 job at a time.

We will run a Job with CircleCI ECS Orb in order to deploy 4 ECS Tasks on Fargate and Fargate Spot. You should have the following prerequisites:

  1. An AWS account
  2. A GitHub account

Walkthrough

Step 1: Create AWS Keys for Circle CI to utilize.

Head to AWS IAM console, create a new user, i.e., circleci, and select only the Programmatic access checkbox. On the set permission page, select Attach existing policies directly. For the sake of simplicity, we added a managed policy AmazonECS_FullAccess to this user. However, for production workloads, employ a further least-privilege access model. Download the access key file, which will be utilized to connect to CircleCI in the next steps.

Step 2: Create an ECS Cluster, Task definition, and ECS Service

2.1 Open the Amazon ECS console

2.2 From the navigation bar, select the Region to use

2.3 In the navigation pane, choose Clusters

2.4 On the Clusters page, choose Create Cluster

2.5 Create a Networking only Cluster ( Powered by AWS Fargate)

Amazon ECS Create Cluster

This option lets you launch a cluster in your existing VPC to utilize for Fargate tasks. The FARGATE and FARGATE_SPOT capacity providers are automatically associated with the cluster.

2.6 Click on Update Cluster to define a default capacity provider strategy for the cluster, then add FARGATE and FARGATE_SPOT capacity providers each with a weight of 1. This ensures Tasks are divided equally among Capacity providers. Define other ratios for splitting your tasks between Fargate and Fargate Spot tasks, i.e., 1:1, 1:2, or 3:1.

ECS Update Cluster Capacity Providers

2.7 Here we will create a Task Definition by using the Fargate launch type, give it a name, and specify the task Memory and CPU needed to run the task. Feel free to utilize any Fargate task definition. You can use your own code, add the code in a container, or host the container in Docker hub or Amazon ECR. Provide a name and image URI that we copied in the previous step and specify the port mappings. Click Add and then click Create.

We are also showing an example of a python code using the Tensorflow library that can run as a container image in order to train a simple linear model. It runs the training steps in a loop on a batch of data, and it periodically writes checkpoints to S3. Please find the complete code here. Utilize a Dockerfile to create a container from the code.

Sample Docker file to create a container image from the code mentioned above.

FROM ubuntu:18.04
WORKDIR /app
COPY . /app
RUN pip install -r requirements.txt EXPOSE 5000 CMD python tensorflow_checkpoint.py

Below is the Code Snippet we are using for Tensorflow to Train and Checkpoint a Training Job.


def train_and_checkpoint(net, manager):
  ckpt.restore(manager.latest_checkpoint).expect_partial()
  if manager.latest_checkpoint:
    print("Restored from {}".format(manager.latest_checkpoint))
  else:
    print("Initializing from scratch.")
  for _ in range(5000):
    example = next(iterator)
    loss = train_step(net, example, opt)
    ckpt.step.assign_add(1)
    if int(ckpt.step) % 10 == 0:
        save_path = manager.save()
        list_of_files = glob.glob('tf_ckpts/*.index')
        latest_file = max(list_of_files, key=os.path.getctime)
        upload_file(latest_file, 'pythontfckpt', object_name=None)
        list_of_files = glob.glob('tf_ckpts/*.data*')
        latest_file = max(list_of_files, key=os.path.getctime)
        upload_file(latest_file, 'pythontfckpt', object_name=None)
        upload_file('tf_ckpts/checkpoint', 'pythontfckpt', object_name=None)

2.8 Next, we will create an ECS Service, which will be used to fetch Cluster information while running the job from CircleCI. In the ECS console, navigate to your Cluster, From Services tab, then click create. Create an ECS service by choosing Cluster default strategy from the Capacity provider strategy dropdown. For the Task Definition field, choose webapp-fargate-task, which is the one we created earlier, enter a service name, set the number of tasks to zero at this point, and then leave everything else as default. Click Next step, select an existing VPC and two or more Subnets, keep everything else default, and create the service.

Step 3: GitHub and CircleCI Configuration

Create a GitHub repository, i.e., circleci-fargate-spot, and then create a .circleci folder and a config file config.yml. If you’re unfamiliar with GitHub or adding a repository, check the user guide here.

For this project, the config.yml file contains the following lines of code that configure and run your deployments.

version: '2.1'
orbs:
  aws-ecs: circleci/[email protected]
  aws-cli: circleci/[email protected]
  orb-tools: circleci/[email protected]
  shellcheck: circleci/[email protected]
  jq: circleci/[email protected]

jobs:  

  test-fargatespot:
      docker:
        - image: cimg/base:stable
      steps:
        - aws-cli/setup
        - jq/install
        - run:
            name: Get cluster info
            command: |
              SERVICES_OBJ=$(aws ecs describe-services --cluster "${ECS_CLUSTER_NAME}" --services "${ECS_SERVICE_NAME}")
              VPC_CONF_OBJ=$(echo $SERVICES_OBJ | jq '.services[].networkConfiguration.awsvpcConfiguration')
              SUBNET_ONE=$(echo "$VPC_CONF_OBJ" |  jq '.subnets[0]')
              SUBNET_TWO=$(echo "$VPC_CONF_OBJ" |  jq '.subnets[1]')
              SECURITY_GROUP_IDS=$(echo "$VPC_CONF_OBJ" |  jq '.securityGroups[0]')
              CLUSTER_NAME=$(echo "$SERVICES_OBJ" |  jq '.services[].clusterArn')
              echo "export SUBNET_ONE=$SUBNET_ONE" >> $BASH_ENV
              echo "export SUBNET_TWO=$SUBNET_TWO" >> $BASH_ENV
              echo "export SECURITY_GROUP_IDS=$SECURITY_GROUP_IDS" >> $BASH_ENV=$SECURITY_GROUP_IDS=$SECURITY_GROUP_IDS" >> $BASH_ENV" >> $BASH_ENV
              echo "export CLUSTER_NAME=$CLUSTER_NAME" >> $BASH_ENV
        - run:
            name: Associate cluster
            command: |
              aws ecs put-cluster-capacity-providers \
                --cluster "${ECS_CLUSTER_NAME}" \
                --capacity-providers FARGATE FARGATE_SPOT  \
                --default-capacity-provider-strategy capacityProvider=FARGATE,weight=1 capacityProvider=FARGATE_SPOT,weight=1\                --region ${AWS_DEFAULT_REGION}
        - aws-ecs/run-task:
              cluster: $CLUSTER_NAME
              capacity-provider-strategy: capacityProvider=FARGATE,weight=1 capacityProvider=FARGATE_SPOT,weight=1
              launch-type: ""
              task-definition: webapp-fargate-task
              subnet-ids: '$SUBNET_ONE, $SUBNET_TWO'
              security-group-ids: $SECURITY_GROUP_IDS
              assign-public-ip : ENABLED
              count: 4

workflows:
  run-task:
    jobs:
      - test-fargatespot

Now, Create a CircleCI account. Choose Login with GitHub. Once you’re logged in from the CircleCI dashboard, click Add Project and add the project circleci-fargate-spot from the list shown.

When working with CircleCI Orbs, you will need the config.yml file and environment variables under Project Settings.

The config file utilizes CircleCI version 2.1 and various Orbs, i.e., AWS-ECS, AWS-CLI, and JQ.  We will use a job test-fargatespot, which uses a Docker image, and we will setup the environment. In config.yml we are using the jq tool to parse JSON and fetch the ECS cluster information like VPC config, Subnets, and Security Groups needed to run an ECS task. As we are utilizing the capacity-provider-strategy, we will set the launch type parameter to an empty string.

In order to run a task, we will demonstrate how to override the default Capacity Provider strategy with Fargate & Fargate Spot, both with a weight of 1, and to divide tasks equally among Fargate & Fargate Spot. In our example, we are running 4 tasks, so 2 should run on Fargate and 2 on Fargate Spot.

Parameters like ECS_SERVICE_NAME, ECS_CLUSTER_NAME and other AWS access specific details are added securely under Project Settings and can be utilized by other jobs running within the project.

Add the following environment variables under Project Settings

    • AWS_ACCESS_KEY_ID – From Step 1
    • AWS_SECRET_ACCESS_KEY – From Step 1
    • AWS_DEFAULT_REGION – i.e. : – us-west-2
    • ECS_CLUSTER_NAME – From Step 2
    • ECS_SERVICE_NAME – From Step 2
    • SECURITY_GROUP_IDS – Security Group that will be used to run the task

Circle CI Environment Variables


Step 4: Run Job

Now in the CircleCI console, navigate to your project, choose the branch, and click Edit Config to verify that config.xml is correctly populated. Check for the ribbon at the bottom. A green ribbon means that the config file is valid and ready to run. Click Commit & Run from the top-right menu.

Click build Status to check its progress as it runs.

CircleCI Project Dashboard


A successful build should look like the one below. Expand each section to see the output.


CircleCI Job Configuration

Return to the ECS console, go to the Tasks Tab, and check that 4 new tasks are running. Click each task for the Capacity provider details. Two tasks should have run with FARGATE_SPOT as a Capacity provider, and two should have run with FARGATE.

Congratulations!

You have successfully deployed ECS tasks utilizing CircleCI on AWS Fargate and Fargate Spot. If you have used any sample web applications, then please use the public IP address to see the page. If you have used the sample code that we provided, then you should see Tensorflow training jobs running on Fargate instances. If there is a Fargate Spot interruption, then it restores the checkpoint from S3 when a new Fargate Instance comes up and continues training.

Cleaning up

In order to avoid incurring future charges, delete the resources utilized in the walkthrough. Go to the ECS console and Task tab.

  • Delete any running Tasks.
  • Delete ECS cluster.
  • Delete the circleci user from IAM console.

Cost analysis in Cost Explorer

In order to demonstrate a cost breakdown between the tasks running on Fargate and Fargate Spot, we left the tasks running for a day. Then, we utilized Cost Explorer with the following filters and groups in order discover the savings by running Fargate Spot.

Apply a filter on Service for ECS on the right-side filter, set Group by to Usage Type, and change the time period to the specific day.

Cost analysis in Cost Explorer

The cost breakdown demonstrates how Fargate Spot usage (indicated by “SpotUsage”) was significantly less expensive than non-Spot Fargate usage. Current Fargate Spot Pricing can be found here.

Conclusion

In this blog post, we have demonstrated how to utilize CircleCI to deploy and manage ECS tasks and run applications in a cost-effective serverless approach by using Fargate Spot.

Author bio

Pritam is a Sr. Specialist Solutions Architect on the EC2 Spot team. For the last 15 years, he evangelized DevOps and Cloud adoption across industries and verticals. He likes to deep dive and find solutions to everyday problems.
Dan is a Sr. Spot GTM Specialist on the EC2 Spot Team. He works closely with Amazon Partners to ensure that their customers can optimize and modernize their compute with EC2 Spot.


How to authenticate private container registries using AWS Batch

Post Syndicated from Ben Peven original https://aws.amazon.com/blogs/compute/how-to-authenticate-private-container-registries-using-aws-batch/

This post was contributed by Clayton Thomas, Solutions Architect, AWS WW Public Sector SLG Govtech.

Many AWS Batch users choose to store and consume their AWS Batch job container images on AWS using Amazon Elastic Container Registries (ECR). AWS Batch and Amazon Elastic Container Service (ECS) natively support pulling from Amazon ECR without any extra steps required. For those users that choose to store their container images on other container registries or Docker Hub, often times they are not publicly exposed and require authentication to pull these images. Third-party repositories may throttle the number of requests, which impedes the ability to run workloads and self-managed repositories require heavy tuning to offer the scale that Amazon ECS provides. This makes Amazon ECS the preferred solution to run workloads on AWS Batch.

While Amazon ECS allows you to configure repositoryCredentials in task definitions containing private registry credentials, AWS Batch does not expose this option in AWS Batch job definitions. AWS Batch does not provide the ability to use private registries by default but you can allow that by configuring the Amazon ECS agent in a few steps.

This post shows how to configure an AWS Batch EC2 compute environment and the Amazon ECS agent to pull your private container images from private container registries. This gives you the flexibility to use your own private and public container registries with AWS Batch.

Overview

The solution uses AWS Secrets Manager to securely store your private container registry credentials, which are retrieved on startup of the AWS Batch compute environment. This ensures that your credentials are securely managed and accessed using IAM roles and are not persisted or stored in AWS Batch job definitions or EC2 user data. The Amazon ECS agent is then configured upon startup to pull these credentials from AWS Secrets Manager. Note that this solution only supports Amazon EC2 based AWS Batch compute environments, thus AWS Fargate cannot use this solution.

High-level diagram showing event flow

Figure 1: High-level diagram showing event flow

  1. AWS Batch uses an Amazon EC2 Compute Environment powered by Amazon ECS. This compute environment uses a custom EC2 Launch Template to configure the Amazon ECS agent to include credentials for pulling images from private registries.
  2. An EC2 User Data script is run upon EC2 instance startup that retrieves registry credentials from AWS Secrets Manager. The EC2 instance authenticates with AWS Secrets Manager using its configured IAM instance profile, which grants temporary IAM credentials.
  3. AWS Batch jobs can be submitted using private images that require authentication with configured credentials.

Prerequisites

For this walkthrough, you should have the following prerequisites:

  1. An AWS account
  2. An Amazon Virtual Private Cloud with private and public subnets. If you do not have a VPC, this tutorial can be followed. The AWS Batch compute environment must have connectivity to the container registry.
  3. A container registry containing a private image. This example uses Docker Hub and assumes you have created a private repository
  4. Registry credentials and/or an access token to authenticate with the container registry or Docker Hub.
  5. A VPC Security Group allowing the AWS Batch compute environment egress connectivity to the container registry.

A CloudFormation template is provided to simplify setting up this example. The CloudFormation template and provided EC2 user data script can be viewed here on GitHub.

The CloudFormation template will create the following resources:

  1. Necessary IAM roles for AWS Batch
  2. AWS Secrets Manager secret containing container registry credentials
  3. AWS Batch managed compute environment and job queue
  4. EC2 Launch Configuration with user data script

Click the Launch Stack button to get started:

Launch Stack

Launch the CloudFormation stack

After clicking the Launch stack button above, click Next to be presented with the following screen:

Figure 2: CloudFormation stack parameters

Figure 2: CloudFormation stack parameters

Fill in the required parameters as follows:

  1. Stack Name: Give your stack a unique name.
  2. Password: Your container registry password or Docker Hub access token. Note that both user name and password are masked and will not appear in any CF logs or output. Additionally, they are securely stored in an AWS Secrets Manager secret created by CloudFormation.
  3. RegistryUrl: If not using Docker Hub, specify the URL of the private container registry.
  4. User name: Your container registry user name.
  5. SecurityGroupIDs: Select your previously created security group to assign to the example Batch compute environment.
  6. SubnetIDs: To assign to the example Batch compute environment, select one or more VPC subnet IDs.

After entering these parameters, you can click through next twice and create the stack, which will take a few minutes to complete. Note that you must acknowledge that the template creates IAM resources on the review page before submitting.

Finally, you will be presented with a list of created AWS resources once the stack deployment finishes as shown in Figure 3 if you would like to dig deeper.

Figure 3: CloudFormation created resources

Figure 3: CloudFormation created resources

User data script contained within launch template

AWS Batch allows you to customize the compute environment in a variety of ways such as specifying an EC2 key pair, custom AMI, or an EC2 user data script. This is done by specifying an EC2 launch template before creating the Batch compute environment. For more information on Batch launch template support, see here.

Let’s take a closer look at how the Amazon ECS agent is configured upon compute environment startup to use your registry credentials.

MIME-Version: 1.0
Content-Type: multipart/mixed; boundary="==MYBOUNDARY=="

--==MYBOUNDARY==
Content-Type: text/cloud-config; charset="us-ascii"

packages:
- jq
- aws-cli

runcmd:
- /usr/bin/aws configure set region $(curl http://169.254.169.254/latest/meta-data/placement/region)
- export SECRET_STRING=$(/usr/bin/aws secretsmanager get-secret-value --secret-id your_secrets_manager_secret_id | jq -r '.SecretString')
- export USERNAME=$(echo $SECRET_STRING | jq -r '.username')
- export PASSWORD=$(echo $SECRET_STRING | jq -r '.password')
- export REGISTRY_URL=$(echo $SECRET_STRING | jq -r '.registry_url')
- echo $PASSWORD | docker login --username $USERNAME --password-stdin $REGISTRY_URL
- export AUTH=$(cat ~/.docker/config.json | jq -c .auths)
- echo 'ECS_ENGINE_AUTH_TYPE=dockercfg' >> /etc/ecs/ecs.config
- echo "ECS_ENGINE_AUTH_DATA=$AUTH" >> /etc/ecs/ecs.config

--==MYBOUNDARY==--

This example script uses and installs a few tools including the AWS CLI and the open-source tool jq to retrieve and parse the previously created Secrets Manager secret. These packages are installed using the cloud-config user data type, which is part of the cloud-init packages functionality. If using the provided CloudFormation template, this script will be dynamically rendered to reference the created secret, but note that you must specify the correct Secrets Manager secret id if not using the template.

After performing a Docker login, the generated Auth JSON object is captured and passed to the Amazon ECS agent configuration to be used on AWS Batch jobs that require private images. For an explanation of Amazon ECS agent configuration options including available Amazon ECS engine Auth types, see here. This example script can be extended or customized to fit your needs but must adhere to requirements for Batch launch template user data scripts, including being in MIME multi-part archive format.

It’s worth noting that the AWS CLI automatically grabs temporary IAM credentials from the associated IAM instance profile the CloudFormation stack created in order to retrieve the Secret Manager secret values. This example assumes you created the AWS Secrets Manager secret with the default AWS managed KMS key for Secrets Manager. However, if you choose to encrypt your secret with a customer managed KMS key, make sure to specify kms:Decrypt IAM permissions for the Batch compute environment IAM role.

Submitting the AWS Batch job

Now let’s try an example Batch job that uses a private container image by creating a Batch job definition and submitting a Batch job:

  1. Open the AWS Batch console
  2. Navigate to the Job Definition page
  3. Click create
  4. Provide a unique Name for the job definition
  5. Select the EC2 platform
  6. Specify your private container image located in the Image field
  7. Click create

Figure 4: Batch job definition

Now you can submit an AWS Batch job that uses this job definition:

  1. Click on the Jobs page
  2. Click Submit New Job
  3. Provide a Name for the job
  4. Select the previously created job definition
  5. Select the Batch Job Queue created by the CloudFormation stack
  6. Click Submit
Submitting a new Batch job

Figure 5: Submitting a new Batch job

After submitting the AWS Batch job, it will take a few minutes for the AWS Batch Compute Environment to create resources for scheduling the job. Once that is done, you should see a SUCCEEDED status by viewing the job and filtering by AWS Batch job queue shown in Figure 6.

Figure 6: AWS Batch job succeeded

Figure 6: AWS Batch job succeeded

Cleaning up

To clean up the example resources, click delete for the created CloudFormation stack in the CloudFormation Console.

Conclusion

In this blog, you deployed a customized AWS Batch managed compute environment that was configured to allow pulling private container images in a secure manner. As I’ve shown, AWS Batch gives you the flexibility to use both private and public container registries. I encourage you to continue to explore the many options available natively on AWS for hosting and pulling container images. Amazon ECR or the recently launched Amazon ECR public repositories (for a deeper dive, see this blog announcement) both provide a seamless experience for container workloads running on AWS.

Using AWS CodePipeline for deploying container images to AWS Lambda Functions

Post Syndicated from Kirankumar Chandrashekar original https://aws.amazon.com/blogs/devops/using-aws-codepipeline-for-deploying-container-images-to-aws-lambda-functions/

AWS Lambda launched support for packaging and deploying functions as container images at re:Invent 2020. In the post working with Lambda layers and extensions in container images, we demonstrated packaging Lambda Functions with layers while using container images. This post will teach you to use AWS CodePipeline to deploy docker images for microservices architecture involving multiple Lambda Functions and a common layer utilized as a separate container image. Lambda functions packaged as container images do not support adding Lambda layers to the function configuration. Alternatively, we can use a container image as a common layer while building other container images along with Lambda Functions shown in this post. Packaging Lambda functions as container images enables familiar tooling and larger deployment limits.

Here are some advantages of using container images for Lambda:

  • Easier dependency management and application building with container
    • Install native operating system packages
    • Install language-compatible dependencies
  • Consistent tool set for containers and Lambda-based applications
    • Utilize the same container registry to store application artifacts (Amazon ECR, Docker Hub)
    • Utilize the same build and pipeline tools to deploy
    • Tools that can inspect Dockerfile work the same
  • Deploy large applications with AWS-provided or third-party images up to 10 GB
    • Include larger application dependencies that previously were impossible

When using container images with Lambda, CodePipeline automatically detects code changes in the source repository in AWS CodeCommit, then passes the artifact to the build server like AWS CodeBuild and pushes the container images to ECR, which is then deployed to Lambda functions.

Architecture diagram


DevOps Architecture

Lambda-docker-images-DevOps-Architecture

Application Architecture

lambda-docker-image-microservices-app

In the above architecture diagram, two architectures are combined, namely 1, DevOps Architecture and 2, Microservices Application Architecture. DevOps architecture demonstrates the use of AWS Developer services such as AWS CodeCommit, AWS CodePipeline, AWS CodeBuild along with Amazon Elastic Container Repository (ECR) and AWS CloudFormation. These are used to support Continuous Integration and Continuous Deployment/Delivery (CI/CD) for both infrastructure and application code. Microservices Application architecture demonstrates how various AWS Lambda Functions that are part of microservices utilize container images for application code. This post will focus on performing CI/CD for Lambda functions utilizing container containers. The application code used in here is a simpler version taken from Serverless DataLake Framework (SDLF). For more information, refer to the AWS Samples GitHub repository for SDLF here.

DevOps workflow

There are two CodePipelines: one for building and pushing the common layer docker image to Amazon ECR, and another for building and pushing the docker images for all the Lambda Functions within the microservices architecture to Amazon ECR, as well as deploying the microservices architecture involving Lambda Functions via CloudFormation. Common layer container image functions as a common layer in all other Lambda Function container images, therefore its code is maintained in a separate CodeCommit repository used as a source stage for a CodePipeline. Common layer CodePipeline takes the code from the CodeCommit repository and passes the artifact to a CodeBuild project that builds the container image and pushes it to an Amazon ECR repository. This common layer ECR repository functions as a source in addition to the CodeCommit repository holding the code for all other Lambda Functions and resources involved in the microservices architecture CodePipeline.

Due to all or the majority of the Lambda Functions in the microservices architecture requiring the common layer container image as a layer, any change made to it should invoke the microservices architecture CodePipeline that builds the container images for all Lambda Functions. Moreover, a CodeCommit repository holding the code for every resource in the microservices architecture is another source to that CodePipeline to get invoked. This has two sources, because the container images in the microservices architecture should be built for changes in the common layer container image as well as for the code changes made and pushed to the CodeCommit repository.

Below is the sample dockerfile that uses the common layer container image as a layer:

ARG ECR_COMMON_DATALAKE_REPO_URL
FROM ${ECR_COMMON_DATALAKE_REPO_URL}:latest AS layer
FROM public.ecr.aws/lambda/python:3.8
# Layer Code
WORKDIR /opt
COPY --from=layer /opt/ .
# Function Code
WORKDIR /var/task
COPY src/lambda_function.py .
CMD ["lambda_function.lambda_handler"]

where the argument ECR_COMMON_DATALAKE_REPO_URL should resolve to the ECR url for common layer container image, which is provided to the --build-args along with docker build command. For example:

export ECR_COMMON_DATALAKE_REPO_URL="0123456789.dkr.ecr.us-east-2.amazonaws.com/dev-routing-lambda"
docker build --build-arg ECR_COMMON_DATALAKE_REPO_URL=$ECR_COMMON_DATALAKE_REPO_URL .

Deploying a Sample

  • Step1: Clone the repository Codepipeline-lambda-docker-images to your workstation. If using the zip file, then unzip the file to a local directory.
    • git clone https://github.com/aws-samples/codepipeline-lambda-docker-images.git
  • Step 2: Change the directory to the cloned directory or extracted directory. The local code repository structure should appear as follows:
    • cd codepipeline-lambda-docker-images

code-repository-structure

  • Step 3: Deploy the CloudFormation stack used in the template file CodePipelineTemplate/codepipeline.yaml to your AWS account. This deploys the resources required for DevOps architecture involving AWS CodePipelines for common layer code and microservices architecture code. Deploy CloudFormation stacks using the AWS console by following the documentation here, providing the name for the stack (for example datalake-infra-resources) and passing the parameters while navigating the console. Furthermore, use the AWS CLI to deploy a CloudFormation stack by following the documentation here.
  • Step 4: When the CloudFormation Stack deployment completes, navigate to the AWS CloudFormation console and to the Outputs section of the deployed stack, then note the CodeCommit repository urls. Three CodeCommit repo urls are available in the CloudFormation stack outputs section for each CodeCommit repository. Choose one of them based on the way you want to access it. Refer to the following documentation Setting up for AWS CodeCommit. I will be using the git-remote-codecommit (grc) method throughout this post for CodeCommit access.
  • Step 5: Clone the CodeCommit repositories and add code:
      • Common Layer CodeCommit repository: Take the value of the Output for the key oCommonLayerCodeCommitHttpsGrcRepoUrl from datalake-infra-resources CloudFormation Stack Outputs section which looks like below:

    commonlayercodeoutput

      • Clone the repository:
        • git clone codecommit::us-east-2://dev-CommonLayerCode
      • Change the directory to dev-CommonLayerCode
        • cd dev-CommonLayerCode
      •  Add contents to the cloned repository from the source code downloaded in Step 1. Copy the code from the CommonLayerCode directory and the repo contents should appear as follows:

    common-layer-repository

      • Create the main branch and push to the remote repository
        git checkout -b main
        git add ./
        git commit -m "Initial Commit"
        git push -u origin main
      • Application CodeCommit repository: Take the value of the Output for the key oAppCodeCommitHttpsGrcRepoUrl from datalake-infra-resources CloudFormation Stack Outputs section which looks like below:

    appcodeoutput

      • Clone the repository:
        • git clone codecommit::us-east-2://dev-AppCode
      • Change the directory to dev-CommonLayerCode
        • cd dev-AppCode
      • Add contents to the cloned repository from the source code downloaded in Step 1. Copy the code from the ApplicationCode directory and the repo contents should appear as follows from the root:

    app-layer-repository

    • Create the main branch and push to the remote repository
      git checkout -b main
      git add ./
      git commit -m "Initial Commit"
      git push -u origin main

What happens now?

  • Now the Common Layer CodePipeline goes to the InProgress state and invokes the Common Layer CodeBuild project that builds the docker image and pushes it to the Common Layer Amazon ECR repository. The image tag utilized for the container image is the value resolved for the environment variable available in the AWS CodeBuild project CODEBUILD_RESOLVED_SOURCE_VERSION. This is the CodeCommit git Commit Id in this case.
    For example, if the CommitId in CodeCommit is f1769c87, then the pushed docker image will have this tag along with latest
  • buildspec.yaml files appears as follows:
    version: 0.2
    phases:
      install:
        runtime-versions:
          docker: 19
      pre_build:
        commands:
          - echo Logging in to Amazon ECR...
          - aws --version
          - $(aws ecr get-login --region $AWS_DEFAULT_REGION --no-include-email)
          - REPOSITORY_URI=$ECR_COMMON_DATALAKE_REPO_URL
          - COMMIT_HASH=$(echo $CODEBUILD_RESOLVED_SOURCE_VERSION | cut -c 1-7)
          - IMAGE_TAG=${COMMIT_HASH:=latest}
      build:
        commands:
          - echo Build started on `date`
          - echo Building the Docker image...          
          - docker build -t $REPOSITORY_URI:latest .
          - docker tag $REPOSITORY_URI:latest $REPOSITORY_URI:$IMAGE_TAG
      post_build:
        commands:
          - echo Build completed on `date`
          - echo Pushing the Docker images...
          - docker push $REPOSITORY_URI:latest
          - docker push $REPOSITORY_URI:$IMAGE_TAG
  • Now the microservices architecture CodePipeline goes to the InProgress state and invokes all of the application image builder CodeBuild project that builds the docker images and pushes them to the Amazon ECR repository.
    • To improve the performance, every docker image is built in parallel within the codebuild project. The buildspec.yaml executes the build.sh script. This has the logic to build docker images required for each Lambda Function part of the microservices architecture. The docker images used for this sample architecture took approximately 4 to 5 minutes when the docker images were built serially. After switching to parallel building, it took approximately 40 to 50 seconds.
    • buildspec.yaml files appear as follows:
      version: 0.2
      phases:
        install:
          runtime-versions:
            docker: 19
          commands:
            - uname -a
            - set -e
            - chmod +x ./build.sh
            - ./build.sh
      artifacts:
        files:
          - cfn/**/*
        name: builds/$CODEBUILD_BUILD_NUMBER/cfn-artifacts
    • build.sh file appears as follows:
      #!/bin/bash
      set -eu
      set -o pipefail
      
      RESOURCE_PREFIX="${RESOURCE_PREFIX:=stg}"
      AWS_DEFAULT_REGION="${AWS_DEFAULT_REGION:=us-east-1}"
      ACCOUNT_ID=$(aws sts get-caller-identity --query Account --output text 2>&1)
      ECR_COMMON_DATALAKE_REPO_URL="${ECR_COMMON_DATALAKE_REPO_URL:=$ACCOUNT_ID.dkr.ecr.$AWS_DEFAULT_REGION.amazonaws.com\/$RESOURCE_PREFIX-common-datalake-library}"
      pids=()
      pids1=()
      
      PROFILE='new-profile'
      aws configure --profile $PROFILE set credential_source EcsContainer
      
      aws --version
      $(aws ecr get-login --region $AWS_DEFAULT_REGION --no-include-email)
      COMMIT_HASH=$(echo $CODEBUILD_RESOLVED_SOURCE_VERSION | cut -c 1-7)
      BUILD_TAG=build-$(echo $CODEBUILD_BUILD_ID | awk -F":" '{print $2}')
      IMAGE_TAG=${BUILD_TAG:=COMMIT_HASH:=latest}
      
      cd dockerfiles;
      mkdir ../logs
      function pwait() {
          while [ $(jobs -p | wc -l) -ge $1 ]; do
              sleep 1
          done
      }
      
      function build_dockerfiles() {
          if [ -d $1 ]; then
              directory=$1
              cd $directory
              echo $directory
              echo "---------------------------------------------------------------------------------"
              echo "Start creating docker image for $directory..."
              echo "---------------------------------------------------------------------------------"
                  REPOSITORY_URI=$ACCOUNT_ID.dkr.ecr.$AWS_DEFAULT_REGION.amazonaws.com/$RESOURCE_PREFIX-$directory
                  docker build --build-arg ECR_COMMON_DATALAKE_REPO_URL=$ECR_COMMON_DATALAKE_REPO_URL . -t $REPOSITORY_URI:latest -t $REPOSITORY_URI:$IMAGE_TAG -t $REPOSITORY_URI:$COMMIT_HASH
                  echo Build completed on `date`
                  echo Pushing the Docker images...
                  docker push $REPOSITORY_URI
              cd ../
              echo "---------------------------------------------------------------------------------"
              echo "End creating docker image for $directory..."
              echo "---------------------------------------------------------------------------------"
          fi
      }
      
      for directory in *; do 
         echo "------Started processing code in $directory directory-----"
         build_dockerfiles $directory 2>&1 1>../logs/$directory-logs.log | tee -a ../logs/$directory-logs.log &
         pids+=($!)
         pwait 20
      done
      
      for pid in "${pids[@]}"; do
        wait "$pid"
      done
      
      cd ../cfn/
      function build_cfnpackages() {
          if [ -d ${directory} ]; then
              directory=$1
              cd $directory
              echo $directory
              echo "---------------------------------------------------------------------------------"
              echo "Start packaging cloudformation package for $directory..."
              echo "---------------------------------------------------------------------------------"
              aws cloudformation package --profile $PROFILE --template-file template.yaml --s3-bucket $S3_BUCKET --output-template-file packaged-template.yaml
              echo "Replace the parameter 'pEcrImageTag' value with the latest built tag"
              echo $(jq --arg Image_Tag "$IMAGE_TAG" '.Parameters |= . + {"pEcrImageTag":$Image_Tag}' parameters.json) > parameters.json
              cat parameters.json
              ls -al
              cd ../
              echo "---------------------------------------------------------------------------------"
              echo "End packaging cloudformation package for $directory..."
              echo "---------------------------------------------------------------------------------"
          fi
      }
      
      for directory in *; do
          echo "------Started processing code in $directory directory-----"
          build_cfnpackages $directory 2>&1 1>../logs/$directory-logs.log | tee -a ../logs/$directory-logs.log &
          pids1+=($!)
          pwait 20
      done
      
      for pid in "${pids1[@]}"; do
        wait "$pid"
      done
      
      cd ../logs/
      ls -al
      for f in *; do
        printf '%s\n' "$f"
        paste /dev/null - < "$f"
      done
      
      cd ../
      

The function build_dockerfiles() loops through each directory within the dockerfiles directory and runs the docker build command in order to build the docker image. The name for the docker image and then the ECR repository is determined by the directory name in which the DockerFile is used from. For example, if the DockerFile directory is routing-lambda and the environment variables take the below values,

ACCOUNT_ID=0123456789
AWS_DEFAULT_REGION=us-east-2
RESOURCE_PREFIX=dev
directory=routing-lambda
REPOSITORY_URI=$ACCOUNT_ID.dkr.ecr.$AWS_DEFAULT_REGION.amazonaws.com/$RESOURCE_PREFIX-$directory

Then REPOSITORY_URI becomes 0123456789.dkr.ecr.us-east-2.amazonaws.com/dev-routing-lambda
And the docker image is pushed to this resolved REPOSITORY_URI. Similarly, docker images for all other directories are built and pushed to Amazon ECR.

Important Note: The ECR repository names match the directory names where the DockerFiles exist and was already created as part of the CloudFormation template codepipeline.yaml that was deployed in step 3. In order to add more Lambda Functions to the microservices architecture, make sure that the ECR repository name added to the new repository in the codepipeline.yaml template matches the directory name within the AppCode repository dockerfiles directory.

Every docker image is built in parallel in order to save time. Each runs as a separate operating system process and is pushed to the Amazon ECR repository. This also controls the number of processes that could run in parallel by setting a value for the variable pwait within the loop. For example, if pwait 20, then the maximum number of parallel processes is 20 at a given time. The image tag for all docker images used for Lambda Functions is constructed via the CodeBuild BuildId, which is available via environment variable $CODEBUILD_BUILD_ID, in order to ensure that a new image gets a new tag. This is required for CloudFormation to detect changes and update Lambda Functions with the new container image tag.

Once every docker image is built and pushed to Amazon ECR in the CodeBuild project, it builds every CloudFormation package by uploading all local artifacts to Amazon S3 via AWS Cloudformation package CLI command for the templates available in its own directory within the cfn directory. Moreover, it updates every parameters.json file for each directory with the ECR image tag to the parameter value pEcrImageTag. This is required for CloudFormation to detect changes and update the Lambda Function with the new image tag.

After this, the CodeBuild project will output the packaged CloudFormation templates and parameters files as an artifact to AWS CodePipeline so that it can be deployed via AWS CloudFormation in further stages. This is done by first creating a ChangeSet and then deploying it at the next stage.

Testing the microservices architecture

As stated above, the sample application utilized for microservices architecture involving multiple Lambda Functions is a modified version of the Serverless Data Lake Framework. The microservices architecture CodePipeline deployed every AWS resource required to run the SDLF application via AWS CloudFormation stages. As part of SDLF, it also deployed a set of DynamoDB tables required for the applications to run. I utilized the meteorites sample for this, thereby the DynamoDb tables should be added with the necessary data for the application to run for this sample.

Utilize the AWS console to write data to the AWS DynamoDb Table. For more information, refer to this documentation. The sample json files are in the utils/DynamoDbConfig/ directory.

1. Add the record below to the octagon-Pipelines-dev DynamoDB table:

{
"description": "Main Pipeline to Ingest Data",
"ingestion_frequency": "WEEKLY",
"last_execution_date": "2020-03-11",
"last_execution_duration_in_seconds": 4.761,
"last_execution_id": "5445249c-a097-447a-a957-f54f446adfd2",
"last_execution_status": "COMPLETED",
"last_execution_timestamp": "2020-03-11T02:34:23.683Z",
"last_updated_timestamp": "2020-03-11T02:34:23.683Z",
"modules": [
{
"name": "pandas",
"version": "0.24.2"
},
{
"name": "Python",
"version": "3.7"
}
],
"name": "engineering-main-pre-stage",
"owner": "Yuri Gagarin",
"owner_contact": "y.gagarin@",
"status": "ACTIVE",
"tags": [
{
"key": "org",
"value": "VOSTOK"
}
],
"type": "INGESTION",
"version": 127
}

2. Add the record below to the octagon-Pipelines-dev DynamoDB table:

{
"description": "Main Pipeline to Merge Data",
"ingestion_frequency": "WEEKLY",
"last_execution_date": "2020-03-11",
"last_execution_duration_in_seconds": 570.559,
"last_execution_id": "0bb30d20-ace8-4cb2-a9aa-694ad018694f",
"last_execution_status": "COMPLETED",
"last_execution_timestamp": "2020-03-11T02:44:36.069Z",
"last_updated_timestamp": "2020-03-11T02:44:36.069Z",
"modules": [
{
"name": "PySpark",
"version": "1.0"
}
],
"name": "engineering-main-post-stage",
"owner": "Neil Armstrong",
"owner_contact": "n.armstrong@",
"status": "ACTIVE",
"tags": [
{
"key": "org",
"value": "NASA"
}
],
"type": "TRANSFORM",
"version": 4
}

3. Add the record below to the octagon-Datsets-dev DynamoDB table:

{
"classification": "Orange",
"description": "Meteorites Name, Location and Classification",
"frequency": "DAILY",
"max_items_process": 250,
"min_items_process": 1,
"name": "engineering-meteorites",
"owner": "NASA",
"owner_contact": "[email protected]",
"pipeline": "main",
"tags": [
{
"key": "cost",
"value": "meteorites division"
}
],
"transforms": {
"stage_a_transform": "light_transform_blueprint",
"stage_b_transform": "heavy_transform_blueprint"
},
"type": "TRANSACTIONAL",
"version": 1
}


If you want to create these samples using AWS CLI, please refer to this documentation.

Record 1:

aws dynamodb put-item --table-name octagon-Pipelines-dev --item '{"description":{"S":"Main Pipeline to Merge Data"},"ingestion_frequency":{"S":"WEEKLY"},"last_execution_date":{"S":"2021-03-16"},"last_execution_duration_in_seconds":{"N":"930.097"},"last_execution_id":{"S":"e23b7dae-8e83-4982-9f97-5784a9831a14"},"last_execution_status":{"S":"COMPLETED"},"last_execution_timestamp":{"S":"2021-03-16T04:31:16.968Z"},"last_updated_timestamp":{"S":"2021-03-16T04:31:16.968Z"},"modules":{"L":[{"M":{"name":{"S":"PySpark"},"version":{"S":"1.0"}}}]},"name":{"S":"engineering-main-post-stage"},"owner":{"S":"Neil Armstrong"},"owner_contact":{"S":"n.armstrong@"},"status":{"S":"ACTIVE"},"tags":{"L":[{"M":{"key":{"S":"org"},"value":{"S":"NASA"}}}]},"type":{"S":"TRANSFORM"},"version":{"N":"8"}}'

Record 2:

aws dynamodb put-item --table-name octagon-Pipelines-dev --item '{"description":{"S":"Main Pipeline to Ingest Data"},"ingestion_frequency":{"S":"WEEKLY"},"last_execution_date":{"S":"2021-03-28"},"last_execution_duration_in_seconds":{"N":"1.75"},"last_execution_id":{"S":"7e0e04e7-b05e-41a6-8ced-829d47866a6a"},"last_execution_status":{"S":"COMPLETED"},"last_execution_timestamp":{"S":"2021-03-28T20:23:06.031Z"},"last_updated_timestamp":{"S":"2021-03-28T20:23:06.031Z"},"modules":{"L":[{"M":{"name":{"S":"pandas"},"version":{"S":"0.24.2"}}},{"M":{"name":{"S":"Python"},"version":{"S":"3.7"}}}]},"name":{"S":"engineering-main-pre-stage"},"owner":{"S":"Yuri Gagarin"},"owner_contact":{"S":"y.gagarin@"},"status":{"S":"ACTIVE"},"tags":{"L":[{"M":{"key":{"S":"org"},"value":{"S":"VOSTOK"}}}]},"type":{"S":"INGESTION"},"version":{"N":"238"}}'

Record 3:

aws dynamodb put-item --table-name octagon-Pipelines-dev --item '{"description":{"S":"Main Pipeline to Ingest Data"},"ingestion_frequency":{"S":"WEEKLY"},"last_execution_date":{"S":"2021-03-28"},"last_execution_duration_in_seconds":{"N":"1.75"},"last_execution_id":{"S":"7e0e04e7-b05e-41a6-8ced-829d47866a6a"},"last_execution_status":{"S":"COMPLETED"},"last_execution_timestamp":{"S":"2021-03-28T20:23:06.031Z"},"last_updated_timestamp":{"S":"2021-03-28T20:23:06.031Z"},"modules":{"L":[{"M":{"name":{"S":"pandas"},"version":{"S":"0.24.2"}}},{"M":{"name":{"S":"Python"},"version":{"S":"3.7"}}}]},"name":{"S":"engineering-main-pre-stage"},"owner":{"S":"Yuri Gagarin"},"owner_contact":{"S":"y.gagarin@"},"status":{"S":"ACTIVE"},"tags":{"L":[{"M":{"key":{"S":"org"},"value":{"S":"VOSTOK"}}}]},"type":{"S":"INGESTION"},"version":{"N":"238"}}'

Now upload the sample json files to the raw s3 bucket. The raw S3 bucket name can be obtained in the output of the common-cloudformation stack deployed as part of the microservices architecture CodePipeline. Navigate to the CloudFormation console in the region where the CodePipeline was deployed and locate the stack with the name common-cloudformation, navigate to the Outputs section, and then note the output bucket name with the key oCentralBucket. Navigate to the Amazon S3 Bucket console and locate the bucket for oCentralBucket, create two path directories named engineering/meteorites, and upload every sample json file to this directory. Meteorites sample json files are available in the utils/meteorites-test-json-files directory of the previously cloned repository. Wait a few minutes and then navigate to the stage bucket noted from the common-cloudformation stack output name oStageBucket. You can see json files converted into csv in pre-stage/engineering/meteorites folder in S3. Wait a few more minutes and then navigate to the post-stage/engineering/meteorites folder in the oStageBucket to see the csv files converted to parquet format.


Cleanup

Navigate to the AWS CloudFormation console, note the S3 bucket names from the common-cloudformation stack outputs, and empty the S3 buckets. Refer to Emptying the Bucket for more information.

Delete the CloudFormation stacks in the following order:
1. Common-Cloudformation
2. stagea
3. stageb
4. sdlf-engineering-meteorites
Then delete the infrastructure CloudFormation stack datalake-infra-resources deployed using the codepipeline.yaml template. Refer to the following documentation to delete CloudFormation Stacks: Deleting a stack on the AWS CloudFormation console or Deleting a stack using AWS CLI.


Conclusion

This method lets us use CI/CD via CodePipeline, CodeCommit, and CodeBuild, along with other AWS services, to automatically deploy container images to Lambda Functions that are part of the microservices architecture. Furthermore, we can build a common layer that is equivalent to the Lambda layer that could be built independently via its own CodePipeline, and then build the container image and push to Amazon ECR. Then, the common layer container image Amazon ECR functions as a source along with its own CodeCommit repository which holds the code for the microservices architecture CodePipeline. Having two sources for microservices architecture codepipeline lets us build every docker image. This is due to a change made to the common layer docker image that is referred to in other docker images, and another source that holds the code for other microservices including Lambda Function.


About the Author

kirankumar.jpeg Kirankumar Chandrashekar is a Sr.DevOps consultant at AWS Professional Services. He focuses on leading customers in architecting DevOps technologies. Kirankumar is passionate about DevOps, Infrastructure as Code, and solving complex customer issues. He enjoys music, as well as cooking and traveling.


Access token security for microservice APIs on Amazon EKS

Post Syndicated from Timothy James Power original https://aws.amazon.com/blogs/security/access-token-security-for-microservice-apis-on-amazon-eks/

In this blog post, I demonstrate how to implement service-to-service authorization using OAuth 2.0 access tokens for microservice APIs hosted on Amazon Elastic Kubernetes Service (Amazon EKS). A common use case for OAuth 2.0 access tokens is to facilitate user authorization to a public facing application. Access tokens can also be used to identify and authorize programmatic access to services with a system identity instead of a user identity. In service-to-service authorization, OAuth 2.0 access tokens can be used to help protect your microservice API for the entire development lifecycle and for every application layer. AWS Well Architected recommends that you validate security at all layers, and by incorporating access tokens validated by the microservice, you can minimize the potential impact if your application gateway allows unintended access. The solution sample application in this post includes access token security at the outset. Access tokens are validated in unit tests, local deployment, and remote cluster deployment on Amazon EKS. Amazon Cognito is used as the OAuth 2.0 token issuer.

Benefits of using access token security with microservice APIs

Some of the reasons you should consider using access token security with microservices include the following:

  • Access tokens provide production grade security for microservices in non-production environments, and are designed to ensure consistent authentication and authorization and protect the application developer from changes to security controls at a cluster level.
  • They enable service-to-service applications to identify the caller and their permissions.
  • Access tokens are short-lived credentials that expire, which makes them preferable to traditional API gateway long-lived API keys.
  • You get better system integration with a web or mobile interface, or application gateway, when you include token validation in the microservice at the outset.

Overview of solution

In the solution described in this post, the sample microservice API is deployed to Amazon EKS, with an Application Load Balancer (ALB) for incoming traffic. Figure 1 shows the application architecture on Amazon Web Services (AWS).

Figure 1: Application architecture

Figure 1: Application architecture

The application client shown in Figure 1 represents a service-to-service workflow on Amazon EKS, and shows the following three steps:

  1. The application client requests an access token from the Amazon Cognito user pool token endpoint.
  2. The access token is forwarded to the ALB endpoint over HTTPS when requesting the microservice API, in the bearer token authorization header. The ALB is configured to use IP Classless Inter-Domain Routing (CIDR) range filtering.
  3. The microservice deployed to Amazon EKS validates the access token using JSON Web Key Sets (JWKS), and enforces the authorization claims.

Walkthrough

The walkthrough in this post has the following steps:

  1. Amazon EKS cluster setup
  2. Amazon Cognito configuration
  3. Microservice OAuth 2.0 integration
  4. Unit test the access token claims
  5. Deployment of microservice on Amazon EKS
  6. Integration tests for local and remote deployments

Prerequisites

For this walkthrough, you should have the following prerequisites in place:

Set up

Amazon EKS is the target for your microservices deployment in the sample application. Use the following steps to create an EKS cluster. If you already have an EKS cluster, you can skip to the next section: To set up the AWS Load Balancer Controller. The following example creates an EKS cluster in the Asia Pacific (Singapore) ap-southeast-1 AWS Region. Be sure to update the Region to use your value.

To create an EKS cluster with eksctl

  1. In your Unix editor, create a file named eks-cluster-config.yaml, with the following cluster configuration:
    apiVersion: eksctl.io/v1alpha5
    kind: ClusterConfig
    
    metadata:
      name: token-demo
      region: <ap-southeast-1>
      version: '1.20'
    
    iam:
      withOIDC: true
    managedNodeGroups:
      - name: ng0
        minSize: 1
        maxSize: 3
        desiredCapacity: 2
        labels: {role: mngworker}
    
        iam:
          withAddonPolicies:
            albIngress: true
            cloudWatch: true
    
    cloudWatch:
      clusterLogging:
        enableTypes: ["*"]
    

  2. Create the cluster by using the following eksctl command:
    eksctl create cluster -f eks-cluster-config.yaml
    

    Allow 10–15 minutes for the EKS control plane and managed nodes creation. eksctl will automatically add the cluster details in your kubeconfig for use with kubectl.

    Validate your cluster node status as “ready” with the following command

    kubectl get nodes
    

  3. Create the demo namespace to host the sample application by using the following command:
    kubectl create namespace demo
    

With the EKS cluster now up and running, there is one final setup step. The ALB for inbound HTTPS traffic is created by the AWS Load Balancer Controller directly from the EKS cluster using a Kubernetes Ingress resource.

To set up the AWS Load Balancer Controller

  1. Follow the installation steps to deploy the AWS Load Balancer Controller to Amazon EKS.
  2. For your domain host (in this case, gateway.example.com) create a public certificate using Amazon Certificate Manager (ACM) that will be used for HTTPS.
  3. An Ingress resource defines the ALB configuration. You customize the ALB by using annotations. Create a file named alb.yml, and add resource definition as follows, replacing the inbound IP CIDR with your values:
    apiVersion: networking.k8s.io/v1
    kind: Ingress
    metadata:
      name: alb-ingress
      namespace: demo
      annotations:
        kubernetes.io/ingress.class: alb
        alb.ingress.kubernetes.io/scheme: internet-facing
        alb.ingress.kubernetes.io/target-type: ip
        alb.ingress.kubernetes.io/listen-ports: '[{"HTTPS":443}]'
        alb.ingress.kubernetes.io/inbound-cidrs: <xxx.xxx.xxx.xxx>/n
      labels:
        app: alb-ingress
    spec:
      rules:
        - host: <gateway.example.com>
          http:
            paths:
              - path: /api/demo/*
                pathType: Prefix
                backend:
                  service:
                    name: demo-api
                    port:
                      number: 8080
    

  4. Deploy the Ingress resource with kubectl to create the ALB by using the following command:
    kubectl apply -f alb.yml
    

    After a few moments, you should see the ALB move from status provisioning to active, with an auto-generated public DNS name.

  5. Validate the ALB DNS name and the ALB is in active status by using the following command:
    kubectl -n demo describe ingress alb-ingress
    

  6. To alias your host, in this case gateway.example.com with the ALB, create a Route 53 alias record. The remote API is now accessible using your Route 53 alias, for example: https://gateway.example.com/api/demo/*

The ALB that you created will only allow incoming HTTPS traffic on port 443, and restricts incoming traffic to known source IP addresses. If you want to share the ALB across multiple microservices, you can add the alb.ingress.kubernetes.io/group.name annotation. To help protect the application from common exploits, you should add an annotation to bind AWS Web Application Firewall (WAFv2) ACLs, including rate-limiting options for the microservice.

Configure the Amazon Cognito user pool

To manage the OAuth 2.0 client credential flow, you create an Amazon Cognito user pool. Use the following procedure to create the Amazon Cognito user pool in the console.

To create an Amazon Cognito user pool

  1. Log in to the Amazon Cognito console.
  2. Choose Manage User Pools.
  3. In the top-right corner of the page, choose Create a user pool.
  4. Provide a name for your user pool, and choose Review defaults to save the name.
  5. Review the user pool information and make any necessary changes. Scroll down and choose Create pool.
  6. Note down your created Pool Id, because you will need this for the microservice configuration.

Next, to simulate the client in subsequent tests, you will create three app clients: one for read permission, one for write permission, and one for the microservice.

To create Amazon Cognito app clients

  1. In the left navigation pane, under General settings, choose App clients.
  2. On the right pane, choose Add an app client.
  3. Enter the App client name as readClient.
  4. Leave all other options unchanged.
  5. Choose Create app client to save.
  6. Choose Add another app client, and add an app client with the name writeClient, then repeat step 5 to save.
  7. Choose Add another app client, and add an app client with the name microService. Clear Generate Client Secret, as this isn’t required for the microservice. Leave all other options unchanged. Repeat step 5 to save.
  8. Note down the App client id created for the microService app client, because you will need it to configure the microservice.

You now have three app clients: readClient, writeClient, and microService.

With the read and write clients created, the next step is to create the permission scope (role), which will be subsequently assigned.

To create read and write permission scopes (roles) for use with the app clients

  1. In the left navigation pane, under App integration, choose Resource servers.
  2. On the right pane, choose Add a resource server.
  3. Enter the name Gateway for the resource server.
  4. For the Identifier enter your host name, in this case https://gateway.example.com.Figure 2 shows the resource identifier and custom scopes for read and write role permission.

    Figure 2: Resource identifier and custom scopes

    Figure 2: Resource identifier and custom scopes

  5. In the first row under Scopes, for Name enter demo.read, and for Description enter Demo Read role.
  6. In the second row under Scopes, for Name enter demo.write, and for Description enter Demo Write role.
  7. Choose Save changes.

You have now completed configuring the custom role scopes that will be bound to the app clients. To complete the app client configuration, you will now bind the role scopes and configure the OAuth2.0 flow.

To configure app clients for client credential flow

  1. In the left navigation pane, under App Integration, select App client settings.
  2. On the right pane, the first of three app clients will be visible.
  3. Scroll to the readClient app client and make the following selections:
    • For Enabled Identity Providers, select Cognito User Pool.
    • Under OAuth 2.0, for Allowed OAuth Flows, select Client credentials.
    • Under OAuth 2.0, under Allowed Custom Scopes, select the demo.read scope.
    • Leave all other options blank.
  4. Scroll to the writeClient app client and make the following selections:
    • For Enabled Identity Providers, select Cognito User Pool.
    • Under OAuth 2.0, for Allowed OAuth Flows, select Client credentials.
    • Under OAuth 2.0, under Allowed Custom Scopes, select the demo.write scope.
    • Leave all other options blank.
  5. Scroll to the microService app client and make the following selections:
    • For Enabled Identity Providers, select Cognito User Pool.
    • Under OAuth 2.0, for Allowed OAuth Flows, select Client credentials.
    • Under OAuth 2.0, under Allowed Custom Scopes, select the demo.read scope.
    • Leave all other options blank.

Figure 3 shows the app client configured with the client credentials flow and custom scope—all other options remain blank

Figure 3: App client configuration

Figure 3: App client configuration

Your Amazon Cognito configuration is now complete. Next you will integrate the microservice with OAuth 2.0.

Microservice OAuth 2.0 integration

For the server-side microservice, you will use Quarkus with Kotlin. Quarkus is a cloud-native microservice framework with strong Kubernetes and AWS integration, for the Java Virtual Machine (JVM) and GraalVM. GraalVM native-image can be used to create native executables, for fast startup and low memory usage, which is important for microservice applications.

To create the microservice quick start project

  1. Open the Quarkus quick-start website code.quarkus.io.
  2. On the top left, you can modify the Group, Artifact and Build Tool to your preference, or accept the defaults.
  3. In the Pick your extensions search box, select each of the following extensions:
    • RESTEasy JAX-RS
    • RESTEasy Jackson
    • Kubernetes
    • Container Image Jib
    • OpenID Connect
  4. Choose Generate your application to download your application as a .zip file.

Quarkus permits low-code integration with an identity provider such as Amazon Cognito, and is configured by the project application.properties file.

To configure application properties to use the Amazon Cognito IDP

  1. Edit the application.properties file in your quick start project:
    src/main/resources/application.properties
    

  2. Add the following properties, replacing the variables with your values. Use the cognito-pool-id and microservice App client id that you noted down when creating these Amazon Cognito resources in the previous sections, along with your Region.
    quarkus.oidc.auth-server-url= https://cognito-idp.<region>.amazonaws.com/<cognito-pool-id>
    quarkus.oidc.client-id=<microService App client id>
    quarkus.oidc.roles.role-claim-path=scope
    

  3. Save and close your application.properties file.

The Kotlin code sample that follows verifies the authenticated principle by using the @Authenticated annotation filter, which performs JSON Web Key Set (JWKS) token validation. The JWKS details are cached, adding nominal latency to the application performance.

The access token claims are auto-filtered by the @RolesAllowed annotation for the custom scopes, read and write. The protected methods are illustrations of a microservice API and how to integrate this with one to two lines of code.

import io.quarkus.security.Authenticated
import javax.annotation.security.RolesAllowed
import javax.enterprise.context.RequestScoped
import javax.ws.rs.*

@Authenticated
@RequestScoped
@Path("/api/demo")
class DemoResource {

    @GET
    @Path("protectedRole/{name}")
    @RolesAllowed("https://gateway.example.com/demo.read")
    fun protectedRole(@PathParam(value = "name") name: String) = mapOf("protectedAPI" to "true", "paramName" to name)
    

    @POST
    @Path("protectedUpload")
    @RolesAllowed("https://gateway.example.com/demo.write")
    fun protectedDataUpload(values: Map<String, String>) = "Received: $values"

}

Unit test the access token claims

For the unit tests you will test three scenarios: unauthorized, forbidden, and ok. The @TestSecurity annotation injects an access token with the specified role claim using the Quarkus test security library. To include access token security in your unit test only requires one line of code, the @TestSecurity annotation, which is a strong reason to include access token security validation upfront in your development. The unit test code in the following example maps to the protectedRole method for the microservice via the uri /api/demo/protectedRole, with an additional path parameter sample-username to be returned by the method for confirmation.

import io.quarkus.test.junit.QuarkusTest
import io.quarkus.test.security.TestSecurity
import io.restassured.RestAssured
import io.restassured.http.ContentType
import org.junit.jupiter.api.Test

@QuarkusTest
class DemoResourceTest {

    @Test
    fun testNoAccessToken() {
        RestAssured.given()
            .`when`().get("/api/demo/protectedRole/sample-username")
            .then()
            .statusCode(401)
    }

    @Test
    @TestSecurity(user = "writeClient", roles = [ "https://gateway.example.com/demo.write" ])
    fun testIncorrectRole() {
        RestAssured.given()
            .`when`().get("/api/demo/protectedRole/sample-username")
            .then()
            .statusCode(403)
    }

    @Test
    @TestSecurity(user = "readClient", roles = [ "https://gateway.example.com/demo.read" ])
    fun testProtecedRole() {
        RestAssured.given()
            .`when`().get("/api/demo/protectedRole/sample-username")
            .then()
            .statusCode(200)
            .contentType(ContentType.JSON)
    }

}

Deploy the microservice on Amazon EKS

Deploying the microservice to Amazon EKS is the same as deploying to any upstream Kubernetes-compliant installation. You declare your application resources in a manifest file, and you deploy a container image of your application to your container registry. You can do this in a similar low-code manner with the Quarkus Kubernetes extension, which automatically generates the Kubernetes deployment and service resources at build time. The Quarkus Container Image Jib extension to automatically build the container image and deploys the container image to Amazon Elastic Container Registry (ECR), without the need for a Dockerfile.

Amazon ECR setup

Your microservice container image created during the build process will be published to Amazon Elastic Container Registry (Amazon ECR) in the same Region as the target Amazon EKS cluster deployment. Container images are stored in a repository in Amazon ECR, and in the following example uses a convention for the repository name of project name and microservice name. The first command that follows creates the Amazon ECR repository to host the microservice container image, and the second command obtains login credentials to publish the container image to Amazon ECR.

To set up the application for Amazon ECR integration

  1. In the AWS CLI, create an Amazon ECR repository by using the following command. Replace the project name variable with your parent project name, and replace the microservice name with the microservice name.
    aws ecr create-repository --repository-name <project-name>/<microservice-name>  --region <region>
    

  2. Obtain an ECR authorization token, by using your IAM principal with the following command. Replace the variables with your values for the AWS account ID and Region.
    aws ecr get-login-password --region <region> | docker login --username AWS --password-stdin <aws-account-id>.dkr.ecr.<region>.amazonaws.com
    

Configure the application properties to use Amazon ECR

To update the application properties with the ECR repository details

  1. Edit the application.properties file in your Quarkus project:
    src/main/resources/application.properties
    

  2. Add the following properties, replacing the variables with your values, for the AWS account ID and Region.
    quarkus.container-image.group=<microservice-name>
    quarkus.container-image.registry=<aws-account-id>.dkr.ecr.<region>.amazonaws.com
    quarkus.container-image.build=true
    quarkus.container-image.push=true
    

  3. Save and close your application.properties.
  4. Re-build your application

After the application re-build, you should now have a container image deployed to Amazon ECR in your region with the following name [project-group]/[project-name]. The Quarkus build will give an error if the push to Amazon ECR failed.

Now, you can deploy your application to Amazon EKS, with kubectl from the following build path:

kubectl apply -f build/kubernetes/kubernetes.yml

Integration tests for local and remote deployments

The following environment assumes a Unix shell: either MacOS, Linux, or Windows Subsystem for Linux (WSL 2).

How to obtain the access token from the token endpoint

Obtain the access token for the application client by using the Amazon Cognito OAuth 2.0 token endpoint, and export an environment variable for re-use. Replace the variables with your Amazon Cognito pool name, and AWS Region respectively.

export TOKEN_ENDPOINT=https://<pool-name>.auth.<region>.amazoncognito.com/token

To generate the client credentials in the required format, you need the Base64 representation of the app client client-id:client-secret. There are many tools online to help you generate a Base64 encoded string. Export the following environment variables, to avoid hard-coding in configuration or scripts.

export CLIENT_CREDENTIALS_READ=Base64(client-id:client-secret)
export CLIENT_CREDENTIALS_WRITE=Base64(client-id:client-secret)

You can use curl to post to the token endpoint, and obtain an access token for the read and write app client respectively. You can pass grant_type=client_credentials and the custom scopes as appropriate. If you pass an incorrect scope, you will receive an invalid_grant error. The Unix jq tool extracts the access token from the JSON string. If you do not have the jq tool installed, you can use your relevant package manager (such as apt-get, yum, or brew), to install using sudo [package manager] install jq.

The following shell commands obtain the access token associated with the read or write scope. The client credentials are used to authorize the generation of the access token. An environment variable stores the read or write access token for future use. Update the scope URL to your host, in this case gateway.example.com.

export access_token_read=$(curl -s -X POST --location "$TOKEN_ENDPOINT" \
     -H "Authorization: Basic $CLIENT_CREDENTIALS_READ" \
     -H "Content-Type: application/x-www-form-urlencoded" \
     -d "grant_type=client_credentials&scope=https://<gateway.example.com>/demo.read" \
| jq --raw-output '.access_token')

export access_token_write=$(curl -s -X POST --location "$TOKEN_ENDPOINT" \
     -H "Authorization: Basic $CLIENT_CREDENTIALS_WRITE" \
     -H "Content-Type: application/x-www-form-urlencoded" \
     -d "grant_type=client_credentials&scope=https://<gateway.example.com>/demo.write" \ 
| jq --raw-output '.access_token')

If the curl commands are successful, you should see the access tokens in the environment variables by using the following echo commands:

echo $access_token_read
echo $access_token_write

For more information or troubleshooting, see TOKEN Endpoint in the Amazon Cognito Developer Guide.

Test scope with automation script

Now that you have saved the read and write access tokens, you can test the API. The endpoint can be local or on a remote cluster. The process is the same, all that changes is the target URL. The simplicity of toggling the target URL between local and remote is one of the reasons why access token security can be integrated into the full development lifecycle.

To perform integration tests in bulk, use a shell script that validates the response code. The example script that follows validates the API call under three test scenarios, the same as the unit tests:

  1. If no valid access token is passed: 401 (unauthorized) response is expected.
  2. A valid access token is passed, but with an incorrect role claim: 403 (forbidden) response is expected.
  3. A valid access token and valid role-claim is passed: 200 (ok) response with content-type of application/json expected.

Name the following script, demo-api.sh. For each API method in the microservice, you duplicate these three tests, but for the sake of brevity in this post, I’m only showing you one API method here, protectedRole.

#!/bin/bash

HOST="http://localhost:8080"
if [ "_$1" != "_" ]; then
  HOST="$1"
fi

validate_response() {
  typeset http_response="$1"
  typeset expected_rc="$2"

  http_status=$(echo "$http_response" | awk 'BEGIN { FS = "!" }; { print $2 }')
  if [ $http_status -ne $expected_rc ]; then
    echo "Failed: Status code $http_status"
    exit 1
  elif [ $http_status -eq 200 ]; then
      echo "  Output: $http_response"
  fi
}

echo "Test 401-unauthorized: Protected /api/demo/protectedRole/{name}"
http_response=$(
  curl --silent -w "!%{http_code}!%{content_type}" \
    -X GET --location "$HOST/api/demo/protectedRole/sample-username" \
    -H "Cache-Control: no-cache" \
    -H "Accept: text/plain"
)
validate_response "$http_response" 401

echo "Test 403-forbidden: Protected /api/demo/protectedRole/{name}"
http_response=$(
  curl --silent -w "!%{http_code}!%{content_type}" \
    -X GET --location "$HOST/api/demo/protectedRole/sample-username" \
    -H "Accept: application/json" \
    -H "Cache-Control: no-cache" \
    -H "Content-Type: application/json" \
    -H "Authorization: Bearer $access_token_write"
)
validate_response "$http_response" 403

echo "Test 200-ok: Protected /api/demo/protectedRole/{name}"
http_response=$(
  curl --silent -w "!%{http_code}!%{content_type}" \
    -X GET --location "$HOST/api/demo/protectedRole/sample-username" \
    -H "Accept: application/json" \
    -H "Cache-Control: no-cache" \
    -H "Content-Type: application/json" \
    -H "Authorization: Bearer $access_token_read"
)
validate_response "$http_response" 200

Test the microservice API against the access token claims

Run the script for a local host deployment on http://localhost:8080, and on the remote EKS cluster, in this case https://gateway.example.com.

If everything works as expected, you will have demonstrated the same test process for local and remote deployments of your microservice. Another advantage of creating a security test automation process like the one demonstrated, is that you can also include it as part of your continuous integration/continuous delivery (CI/CD) test automation.

The test automation script accepts the microservice host URL as a parameter (the default is local), referencing the stored access tokens from the environment variables. Upon error, the script will exit with the error code. To test the remote EKS cluster, use the following command, with your host URL, in this case gateway.example.com.

./demo-api.sh https://<gateway.example.com>

Expected output:

Test 401-unauthorized: No access token for /api/demo/protectedRole/{name}
Test 403-forbidden: Incorrect role/custom-scope for /api/demo/protectedRole/{name}
Test 200-ok: Correct role for /api/demo/protectedRole/{name}
  Output: {"protectedAPI":"true","paramName":"sample-username"}!200!application/json

Best practices for a well architected production service-to-service client

For elevated security in alignment with AWS Well Architected, it is recommend to use AWS Secrets Manager to hold the client credentials. Separating your credentials from the application permits credential rotation without the requirement to release a new version of the application or modify environment variables used by the service. Access to secrets must be tightly controlled because the secrets contain extremely sensitive information. Secrets Manager uses AWS Identity and Access Management (IAM) to secure access to the secrets. By using the permissions capabilities of IAM permissions policies, you can control which users or services have access to your secrets. Secrets Manager uses envelope encryption with AWS KMS customer master keys (CMKs) and data key to protect each secret value. When you create a secret, you can choose any symmetric customer managed CMK in the AWS account and Region, or you can use the AWS managed CMK for Secrets Manager aws/secretsmanager.

Access tokens can be configured on Amazon Cognito to expire in as little as 5 minutes or as long as 24 hours. To avoid unnecessary calls to the token endpoint, the application client should cache the access token and refresh close to expiry. In the Quarkus framework used for the microservice, this can be automatically performed for a client service by adding the quarkus-oidc-client extension to the application.

Cleaning up

To avoid incurring future charges, delete all the resources created.

Conclusion

This post has focused on the last line of defense, the microservice, and the importance of a layered security approach throughout the development lifecycle. Access token security should be validated both at the application gateway and microservice for end-to-end API protection.

As an additional layer of security at the application gateway, you should consider using Amazon API Gateway, and the inbuilt JWT authorizer to perform the same API access token validation for public facing APIs. For more advanced business-to-business solutions, Amazon API Gateway provides integrated mutual TLS authentication.

To learn more about protecting information, systems, and assets that use Amazon EKS, see the Amazon EKS Best Practices Guide for Security.

If you have feedback about this post, submit comments in the Comments section below. If you have questions about this post, start a new thread on the Amazon Cognito forum or contact AWS Support.

Want more AWS Security how-to content, news, and feature announcements? Follow us on Twitter.

Author

Timothy James Power

Timothy is a Senior Solutions Architect Manager, leading the Accenture AWS Business Group in APAC and Japan. He has a keen interest in software development, spanning 20+ years, primarily in financial services. Tim is a passionate sportsperson, and loves spending time on the water, in between playing with his young children.