Tag Archives: Containers

AWS Week in Review – Amazon Security Lake Now GA, New Actions on AWS Fault Injection Simulator, and More – June 5, 2023

Post Syndicated from Veliswa Boya original https://aws.amazon.com/blogs/aws/aws-week-in-review-amazon-security-lake-now-ga-new-actions-on-aws-fault-injection-simulator-and-more-june-5-2023/

Last Wednesday, I traveled to Cape Town to speak at the .Net Developer User Group. My colleague Francois Bouteruche also gave a talk but joined virtually. I enjoyed my time there—what an amazing community! Join the group in order to learn about upcoming events.

Now onto the AWS updates from last week. There was a lot of news related to AWS, and I have compiled a few announcements you need to know. Let’s get started!

Last Week’s Launches
Here are a few launches from last week that you might have missed:

Amazon Security Lake is now Generally Available – This service automatically centralizes security data from AWS environments, SaaS providers, on-premises environments, and cloud sources into a purpose-built data lake stored in your account, making it easier to analyze security data, gain a more comprehensive understanding of security across your entire organization, and improve the protection of your workloads, applications, and data. Read more in Channy’s post announcing the preview of Security Lake.

New AWS Direct Connect Location in Santiago, Chile – The AWS Direct Connect service lets you create a dedicated network connection to AWS. With this service, you can build hybrid networks by linking your AWS and on-premises networks to build applications that span environments without compromising performance. Last week we announced the opening of a new AWS Direct Connect location in Santiago, Chile. This new Santiago location offers dedicated 1 Gbps and 10 Gbps connections, with MACsec encryption available for 10 Gbps. For more information on over 115 Direct Connect locations worldwide, visit the locations section of the Direct Connect product detail pages.

New actions on AWS Fault Injection Simulator for Amazon EKS and Amazon ECS – Had it not been for Adrian Hornsby’s LinkedIn post I would have missed this announcement. We announced the expanded support of AWS Fault Injection Simulator (FIS) for Amazon Elastic Kubernetes Service (EKS) and Amazon Elastic Container Service (ECS). This expanded support adds additional AWS FIS actions for Amazon EKS and Amazon ECS. Learn more about Amazon ECS task actions here, and Amazon EKS pod actions here.

Other AWS News
A few more news items and blog posts you might have missed:

Autodesk Uses Sagemaker to Improve Observability – One of our customers, Autodesk, used AWS services including Amazon Sagemaker, Amazon Kinesis, and Amazon API Gateway to build a platform that enables development and deployment of near-real time personalization experiments by modeling and responding to user behavior data. All this delivered a dynamic, personalized experience for Autodesk’s customers. Read more about the story at AWS Customer Stories.

AWS DMS Serverless – We announced AWS DMS Serverless which lets you automatically provision and scale capacity for migration and data replication. Donnie wrote about this announcement here.

For AWS open-source news and updates, check out the latest newsletter curated by my colleague Ricardo Sueiras to bring you the most recent updates on open-source projects, posts, events, and more.

For a full list of AWS announcements, be sure to keep an eye on the What’s New at AWS page.

Upcoming AWS Events
We have the following upcoming events. These give you the opportunity to meet with other tech enthusiasts and learn:

AWS Silicon Innovation Day (June 21) – A one-day virtual event that will allow you to understand AWS Silicon and how you can use AWS’s unique silicon offerings to innovate. Learn more and register here.

AWS Global Summits – Sign up for the AWS Summit closest to where you live: London (June 7), Washington, DC (June 7–8), Toronto (June 14).

AWS Community Days – Join these community-led conferences where event logistics and content are planned, sourced, and delivered by community leaders: Chicago, Illinois (June 15), and Chile (July 1).

And with that, I end my very first Week in Review post, and this was such fun to write. Come back next Monday for another Week in Review!

Veliswa x

This post is part of our Week in Review series. Check back each week for a quick roundup of interesting news and announcements from AWS!

Let’s Architect! Designing serverless solutions

Post Syndicated from Luca Mezzalira original https://aws.amazon.com/blogs/architecture/lets-architect-designing-serverless-solutions/

During his re:Invent 2022 keynote, Werner Vogels, AWS Vice President and Chief Technology Officer, emphasized the asynchronous nature of our world and the challenges associated with incorporating asynchronicity into our architectures. AWS serverless services can help users concentrate on the asynchronous aspects of their workloads, easing the execution of event-driven architectures and enabling the adoption of effective integration patterns for communication both within and beyond a bounded context.

In this edition of Let’s Architect!, we offer an in-depth exploration of the architecture of serverless AWS services, such as AWS Lambda. We also present a new workshop centered on design patterns employing serverless AWS services, which ultimately delivers valuable insights on implementing event-driven architectures within systems.

A closer look at AWS Lambda

This video is the perfect companion for those seeking to learn and master a Lambda architecture, empowering you to effectively leverage its capabilities in your workloads.

With the knowledge gained from this video, you will be well-equipped to design your functions’ code in a highly optimized manner, ensuring efficient performance and resource utilization. Furthermore, a comprehensive understanding of Lambda functions can help identify and apply the most suitable approach to cloud workloads, resulting in an agile and robust cloud infrastructure that meets a project’s unique requirements.

Take me to this video!

Discover how AWS Lambda functions work under the hood

Discover how AWS Lambda functions work under the hood

Implementing an event-driven serverless story generation application with ChatGPT and DALL-E

This example of an event-driven serverless architecture showcases the power of leveraging AWS services and AI technologies to develop innovative solutions. Built upon a foundation of serverless services, including Amazon EventBridge, Amazon DynamoDB, Lambda, Amazon Simple Storage Service, and managed artificial intelligence (AI ) services like Amazon Polly, this architecture demonstrates the seamless capacity to create daily stories with a scheduled launch. By utilizing EventBridge scheduler, an Lambda function is initiated every night to generate new content. The integration of AI services, like ChatGPT and DALL-E, further elevates the solution, as their compatibility with the serverless model enables efficient and dynamic content creation. This case serves as a testament to the potential of combining event-driven serverless architectures, with cutting-edge AI technologies for inventive and impactful applications.

Take me to this Compute Blog post!

How to build an event-driven architecture with serverless AWS services integrating ChatGPT and DALL-E

How to build an event-driven architecture with serverless AWS services integrating ChatGPT and DALL-E

AWS Workshop Studio: Serverless Patterns

The AWS Serverless Patterns workshop offers a comprehensive learning experience to enhance your understanding of architectural patterns applicable to serverless projects. Throughout the workshop, participants will delve into various patterns, such as synchronous and asynchronous implementations, tailored to meet the demands of modern serverless applications. This hands-on approach ensures a production-ready understanding, encompassing crucial topics like testing serverless workloads, establishing automation pipelines, and more. Take this workshop to elevate your serverless architecture knowledge!

Take me to the serverless workshop!

The high-level architecture of the workshops modules

The high-level architecture of the workshops modules

Building Serverlesspresso: Creating event-driven architectures

Serverlesspresso is an event-driven, serverless workload that uses EventBridge and AWS Step Functions to coordinate events across microservices and support thousands of orders per day. This comprehensive session delves into design considerations, development processes, and valuable lessons learned from creating a production-ready solution. Discover practical patterns and extensibility options that contribute to a robust, scalable, and cost-effective application. Gain insights into combining EventBridge and Step Functions to address complex architectural challenges in larger applications.

Take me to this video!

How to leverage AWS Step Functions for orchestrating your workflows

How to leverage AWS Step Functions for orchestrating your workflows

See you next time!

Thanks for joining our conversation on serverless solutions! We’ll see you next time when we talk about AWS microservices.

Can’t get enough of the Let’s Architect! series? Visit the Let’s Architect! page of the AWS Architecture Blog!

Extending a serverless, event-driven architecture to existing container workloads

Post Syndicated from James Beswick original https://aws.amazon.com/blogs/compute/extending-a-serverless-event-driven-architecture-to-existing-container-workloads/

This post is written by Dhiraj Mahapatro, Principal Specialist SA, and Sascha Moellering, Principal Specialist SA, and Emily Shea, WW Lead, Integration Services.

Many serverless services are a natural fit for event-driven architectures (EDA), as events invoke them and only run when there is an event to process. When building in the cloud, many services emit events by default and have built-in features for managing events. This combination allows customers to build event-driven architectures easier and faster than ever before.

The insurance claims processing sample application in this blog series uses event-driven architecture principles and serverless services like AWS LambdaAWS Step FunctionsAmazon API GatewayAmazon EventBridge, and Amazon SQS.

When building an event-driven architecture, it’s likely that you have existing services to integrate with the new architecture, ideally without needing to make significant refactoring changes to those services. As services communicate via events, extending applications to new and existing microservices is a key benefit of building with EDA. You can write those microservices in different programming languages or running on different compute options.

This blog post walks through a scenario of integrating an existing, containerized service (a settlement service) to the serverless, event-driven insurance claims processing application described in this blog post.

Overview of sample event-driven architecture

The sample application uses a front-end to sign up a new user and allow the user to upload images of their car and driver’s license. Once signed up, they can file a claim and upload images of their damaged car. Previously, it did not yet integrate with a settlement service for completing the claims and settlement process.

In this scenario, the settlement service is a brownfield application that runs Spring Boot 3 on Amazon ECS with AWS Fargate. AWS Fargate is a serverless, pay-as-you-go compute engine that lets you focus on building container applications without managing servers.

The Spring Boot application exposes a REST endpoint, which accepts a POST request. It applies settlement business logic and creates a settlement record in the database for a car insurance claim. Your goal is to make settlement work with the new EDA application that is designed for claims processing without re-architecting or rewriting. Customer, claims, fraud, document, and notification are the other domains that are shown as blue-colored boxes in the following diagram:

Reference architecture

Project structure

The application uses AWS Cloud Development Kit (CDK) to build the stack. With CDK, you get the flexibility to create modular and reusable constructs imperatively using your language of choice. The sample application uses TypeScript for CDK.

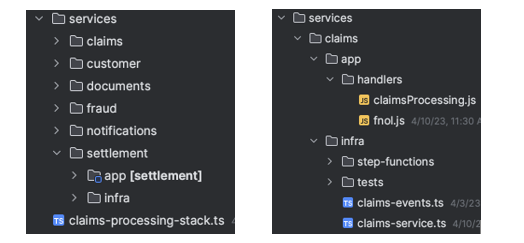
The following project structure enables you to build different bounded contexts. Event-driven architecture relies on the choreography of events between domains. The object oriented programming (OOP) concept of CDK helps provision the infrastructure to separate the domain concerns while loosely coupling them via events.

You break the higher level CDK constructs down to these corresponding domains:

Comparing domains

Application and infrastructure code are present in each domain. This project structure creates a seamless way to add new domains like settlement with its application and infrastructure code without affecting other areas of the business.

With the preceding structure, you can use the settlement-service.ts CDK construct inside claims-processing-stack.ts:

const settlementService = new SettlementService(this, "SettlementService", {
  bus,
});

The only information the SettlementService construct needs to work is the EventBridge custom event bus resource that is created in the claims-processing-stack.ts.

To run the sample application, follow the setup steps in the sample application’s README file.

Existing container workload

The settlement domain provides a REST service to the rest of the organization. A Docker containerized Spring Boot application runs on Amazon ECS with AWS Fargate. The following sequence diagram shows the synchronous request-response flow from an external REST client to the service:

Settlement service

  1. External REST client makes POST /settlement call via an HTTP API present in front of an internal Application Load Balancer (ALB).
  2. SettlementController.java delegates to SettlementService.java.
  3. SettlementService applies business logic and calls SettlementRepository for data persistence.
  4. SettlementRepository persists the item in the Settlement DynamoDB table.

A request to the HTTP API endpoint looks like:

curl --location <settlement-api-endpoint-from-cloudformation-output> \
--header 'Content-Type: application/json' \
--data '{
  "customerId": "06987bc1-1234-1234-1234-2637edab1e57",
  "claimId": "60ccfe05-1234-1234-1234-a4c1ee6fcc29",
  "color": "green",
  "damage": "bumper_dent"
}'

The response from the API call is:

API response

You can learn more here about optimizing Spring Boot applications on AWS Fargate.

Extending container workload for events

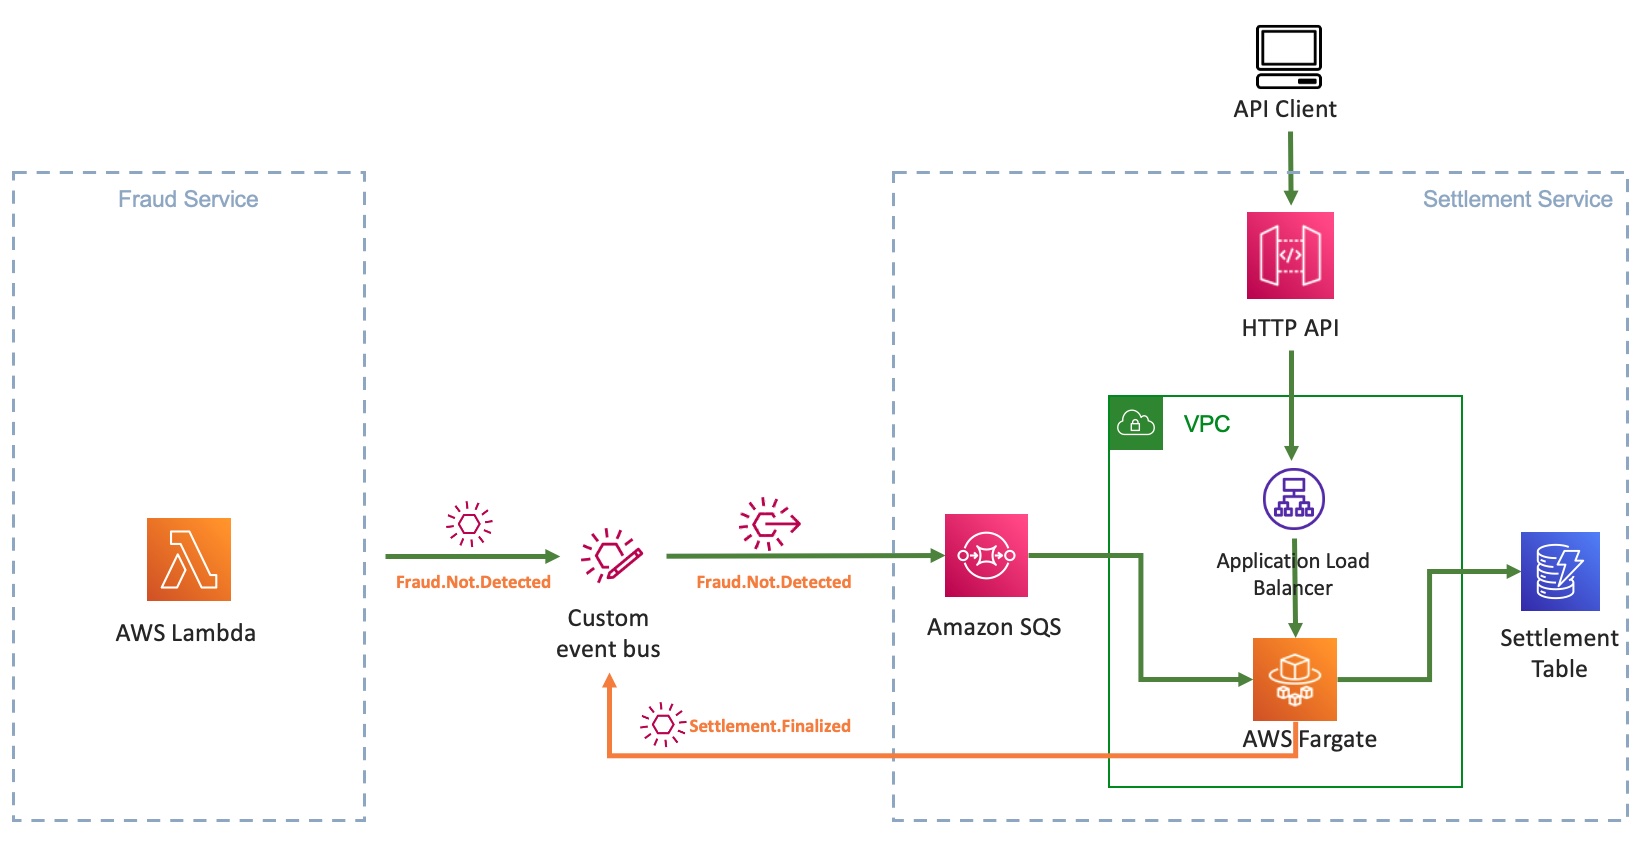
To integrate the settlement service, you must update the service to receive and emit events asynchronously. The core logic of the settlement service remains the same. When you file a claim, upload damaged car images, and the application detects no document fraud, the settlement domain subscribes to Fraud.Not.Detected event and applies its business logic. The settlement service emits an event back upon applying the business logic.

The following sequence diagram shows a new interface in settlement to work with EDA. The settlement service subscribes to events that a producer emits. Here, the event producer is the fraud service that puts an event in an EventBridge custom event bus.

Sequence diagram

  1. Producer emits Fraud.Not.Detected event to EventBridge custom event bus.
  2. EventBridge evaluates the rules provided by the settlement domain and sends the event payload to the target SQS queue.
  3. SubscriberService.java polls for new messages in the SQS queue.
  4. On message, it transforms the message body to an input object that is accepted by SettlementService.
  5. It then delegates the call to SettlementService, similar to how SettlementController works in the REST implementation.
  6. SettlementService applies business logic. The flow is like the REST use case from 7 to 10.
  7. On receiving the response from the SettlementService, the SubscriberService transforms the response to publish an event back to the event bus with the event type as Settlement.Finalized.

The rest of the architecture consumes this Settlement.Finalized event.

Using EventBridge schema registry and discovery

Schema enforces a contract between a producer and a consumer. A consumer expects the exact structure of the event payload every time an event arrives. EventBridge provides schema registry and discovery to maintain this contract. The consumer (the settlement service) can download the code bindings and use them in the source code.

Enable schema discovery in EventBridge before downloading the code bindings and using them in your repository. The code bindings provide a marshaller that unmarshals the incoming event from SQS queue to a plain old Java object (POJO) FraudNotDetected.java. You download the code bindings using the choice of your IDE. AWS Toolkit for IntelliJ makes it convenient to download and use them.

Download code bindings

The final architecture for the settlement service with REST and event-driven architecture looks like:

Final architecture

Transition to become fully event-driven

With the new capability to handle events, the Spring Boot application now supports both the REST endpoint and the event-driven architecture by running the same business logic through different interfaces. In this example scenario, as the event-driven architecture matures and the rest of the organization adopts it, the need for the POST endpoint to save a settlement may diminish. In the future, you can deprecate the endpoint and fully rely on polling messages from the SQS queue.

You start with using an ALB and Fargate service CDK ECS pattern:

const loadBalancedFargateService = new ecs_patterns.ApplicationLoadBalancedFargateService(
  this,
  "settlement-service",
  {
    cluster: cluster,
    taskImageOptions: {
      image: ecs.ContainerImage.fromDockerImageAsset(asset),
      environment: {
        "DYNAMODB_TABLE_NAME": this.table.tableName
      },
      containerPort: 8080,
      logDriver: new ecs.AwsLogDriver({
        streamPrefix: "settlement-service",
        mode: ecs.AwsLogDriverMode.NON_BLOCKING,
        logRetention: RetentionDays.FIVE_DAYS,
      })
    },
    memoryLimitMiB: 2048,
    cpu: 1024,
    publicLoadBalancer: true,
    desiredCount: 2,
    listenerPort: 8080
  });

To adapt to EDA, you update the resources to retrofit the SQS queue to receive messages and EventBridge to put events. Add new environment variables to the ApplicationLoadBalancerFargateService resource:

environment: {
  "SQS_ENDPOINT_URL": queue.queueUrl,
  "EVENTBUS_NAME": props.bus.eventBusName,
  "DYNAMODB_TABLE_NAME": this.table.tableName
}

Grant the Fargate task permission to put events in the custom event bus and consume messages from the SQS queue:

props.bus.grantPutEventsTo(loadBalancedFargateService.taskDefinition.taskRole);
queue.grantConsumeMessages(loadBalancedFargateService.taskDefinition.taskRole);

When you transition the settlement service to become fully event-driven, you do not need the HTTP API endpoint and ALB anymore, as SQS is the source of events.

A better alternative is to use QueueProcessingFargateService ECS pattern for the Fargate service. The pattern provides auto scaling based on the number of visible messages in the SQS queue, besides CPU utilization. In the following example, you can also add two capacity provider strategies while setting up the Fargate service: FARGATE_SPOT and FARGATE. This means, for every one task that is run using FARGATE, there are two tasks that use FARGATE_SPOT. This can help optimize cost.

const queueProcessingFargateService = new ecs_patterns.QueueProcessingFargateService(this, 'Service', {
  cluster,
  memoryLimitMiB: 1024,
  cpu: 512,
  queue: queue,
  image: ecs.ContainerImage.fromDockerImageAsset(asset),
  desiredTaskCount: 2,
  minScalingCapacity: 1,
  maxScalingCapacity: 5,
  maxHealthyPercent: 200,
  minHealthyPercent: 66,
  environment: {
    "SQS_ENDPOINT_URL": queueUrl,
    "EVENTBUS_NAME": props?.bus.eventBusName,
    "DYNAMODB_TABLE_NAME": tableName
  },
  capacityProviderStrategies: [
    {
      capacityProvider: 'FARGATE_SPOT',
      weight: 2,
    },
    {
      capacityProvider: 'FARGATE',
      weight: 1,
    },
  ],
});

This pattern abstracts the automatic scaling behavior of the Fargate service based on the queue depth.

Running the application

To test the application, follow How to use the Application after the initial setup. Once complete, you see that the browser receives a Settlement.Finalized event:

{
  "version": "0",
  "id": "e2a9c866-cb5b-728c-ce18-3b17477fa5ff",
  "detail-type": "Settlement.Finalized",
  "source": "settlement.service",
  "account": "123456789",
  "time": "2023-04-09T23:20:44Z",
  "region": "us-east-2",
  "resources": [],
  "detail": {
    "settlementId": "377d788b-9922-402a-a56c-c8460e34e36d",
    "customerId": "67cac76c-40b1-4d63-a8b5-ad20f6e2e6b9",
    "claimId": "b1192ba0-de7e-450f-ac13-991613c48041",
    "settlementMessage": "Based on our analysis on the damage of your car per claim id b1192ba0-de7e-450f-ac13-991613c48041, your out-of-pocket expense will be $100.00."
  }
}

Cleaning up

The stack creates a custom VPC and other related resources. Be sure to clean up resources after usage to avoid the ongoing cost of running these services. To clean up the infrastructure, follow the clean-up steps shown in the sample application.

Conclusion

The blog explains a way to integrate existing container workload running on AWS Fargate with a new event-driven architecture. You use EventBridge to decouple different services from each other that are built using different compute technologies, languages, and frameworks. Using AWS CDK, you gain the modularity of building services decoupled from each other.

This blog shows an evolutionary architecture that allows you to modernize existing container workloads with minimal changes that still give you the additional benefits of building with serverless and EDA on AWS.

The major difference between the event-driven approach and the REST approach is that you unblock the producer once it emits an event. The event producer from the settlement domain that subscribes to that event is loosely coupled. The business functionality remains intact, and no significant refactoring or re-architecting effort is required. With these agility gains, you may get to the market faster

The sample application shows the implementation details and steps to set up, run, and clean up the application. The app uses ECS Fargate for a domain service, but you do not limit it to just Fargate. You can also bring container-based applications running on Amazon EKS similarly to event-driven architecture.

Learn more about event-driven architecture on Serverless Land.

Let’s Architect! Getting started with containers

Post Syndicated from Luca Mezzalira original https://aws.amazon.com/blogs/architecture/lets-architect-getting-started-with-containers/

Most of AWS customers building cloud-native applications or modernizing applications choose containers to run their microservices applications to accelerate innovation and time to market while lowering their total cost of ownership (TCO). Using containers in AWS comes with other benefits, such as increased portability, scalability, and flexibility.

The combination of containers technologies and AWS services also provides features such as load balancing, auto scaling, and service discovery, making it easier to deploy and manage applications at scale.

In this edition of Let’s Architect! we share useful resources to help you to get started with containers on AWS.

Container Build Lens

This whitepaper describes the Container Build Lens for the AWS Well-Architected Framework. It helps customers review and improve their cloud-based architectures and better understand the business impact of their design decisions. The document describes general design principles for containers, as well as specific best practices and implementation guidance using the Six Pillars of the Well-Architected Framework.

Take me to explore the Containers Build Lens!

Follow Containers Build Lens Best practices to architect your containers-based workloads

Follow Containers Build Lens Best practices to architect your containers-based workloads.

EKS Workshop

The EKS Workshop is a useful resource to familiarize yourself with Amazon Elastic Kubernetes Service (Amazon EKS) by practicing on real use-cases. It is built to help users learn about Amazon EKS features and integrations with popular open-source projects. The workshop is abstracted into high-level learning modules, including Networking, Security, DevOps Automation, and more. These are further broken down into standalone labs focusing on a particular feature, tool, or use case.

Once you’re done experimenting with EKS Workshop, start building your environments with Amazon EKS Blueprints, a collection of Infrastructure as Code (IaC) modules that helps you configure and deploy consistent, batteries-included Amazon EKS clusters across accounts and regions following AWS best practices. Amazon EKS Blueprints are available in both Terraform and CDK.

Take me to this workshop!

The workshop is abstracted into high-level learning modules, including Networking, Security, DevOps Automation, and more.

The workshop is abstracted into high-level learning modules, including Networking, Security, DevOps Automation, and more.

Architecting for resiliency on AWS App Runner

Learn how to architect an highly available and resilient application using AWS App Runner. With App Runner, you can start with just the source code of your application or a container image. The complexity of running containerized applications is abstracted away, including the cloud resources needed for running your web application or API. App Runner manages load balancers, TLS certificates, auto scaling, logs, metrics, teachability and more, so you can focus on implementing your business logic in a highly scalable and elastic environment.

Take me to this blog post!

A high-level architecture for an available and resilient application with AWS App Runner.

A high-level architecture for an available and resilient application with AWS App Runner

Securing Kubernetes: How to address Kubernetes attack vectors

As part of designing any modern system on AWS, it is necessary to think about the security implications and what can affect your security posture. This session introduces the fundamentals of the Kubernetes architecture and common attack vectors. It also includes security controls provided by Amazon EKS and suggestions on how to address them. With these strategies, you can learn how to reduce risk for your Kubernetes-based workloads.

Take me to this video!

Some common attack vectors that need addressing with Kubernetes

Some common attack vectors that need addressing with Kubernetes

See you next time!

Thanks for exploring architecture tools and resources with us!

Next time we’ll talk about serverless.

To find all the posts from this series, check out the Let’s Architect! page of the AWS Architecture Blog.

Let’s Architect! Streamlining business with migration and modernization

Post Syndicated from Luca Mezzalira original https://aws.amazon.com/blogs/architecture/lets-architect-streamlining-business-with-migration-and-modernization/

Many customers migrate their systems to Amazon Web Services (AWS) to increase their competitive edge and drive business value. To maximize the benefits of a cloud migration, companies tend to move their applications in conjunction with modernization initiatives. These joined efforts help your applications gain more agility, scalability, and resilience. Modernizing the portfolio of workloads with AWS means that you can re-platform, refactor, or replace these workloads by using containers, serverless technologies, purpose-built data stores, and software automation. These functionalities allow you to benefit from the best of the AWS agility and total cost optimization (TCO) benefits.

In this edition of Let’s Architect! we share hands-on activities, customer stories, and tips and tricks to migrate and modernize your applications with AWS.

Migrating to the cloud: What is the cost of doing nothing?

Would you think that small companies always migrate faster than large enterprises? Actually, cloud migration speed doesn’t necessarily depend on the size of the business! Company size is not a clear indicator of migration and modernization success, but a shift of culture and mindset is essential for successful company evolution.

When it comes to migration, the cost of doing nothing is not just financial: Businesses can also expect a slower pace of innovation and a higher security burden. This video analyzes the financial benefits of migration and shares mental models for approaching an AWS cloud migration, and Marriott team members explain how they planned their migration and the lessons learned along the way.

Take me to this re:Invent 2022 video!

Benefits of an early migration start

Benefits of an early migration start

Modernization pathways for a legacy .NET Framework monolithic application on AWS

Organizations aim to deliver the best technological solutions based on customer needs. At any stage in their cloud adoption journey, businesses often end up managing and building monolithic applications. Let’s explore a migration path for a monolithic .NET Framework application to a modern microservices-based stack on AWS, and discuss AWS tools to break the monolith into microservices and containerize applications.

Cost optimization is another key factor for modernizing your workloads and solutions include moving to Linux-based systems or using open-source database engines. This Migrate and Modernize enterprise workloads with AWS video walks you through the process of migrating and modernizing enterprise workloads with AWS.

Take me to this blog post with more detail!

A modernized microservices-based rearchitecture

A modernized microservices-based rearchitecture

Implementing a serverless-first strategy in an enterprise

Organizations of all sizes want to benefit from the agility, cost savings, and developer experience that serverless architectures can provide on AWS. For large enterprises, the return on investment (ROI) can be massive, but overcoming architecture inertia while ensuring security best practices and governance stay in place is a hurdle that many struggle with. In this lightning talk, learn how your organization can implement a serverless-first strategy to overcome these obstacles. Delta Air Lines shares the story of making serverless-first a reality as part of their AWS journey.

Take me to this video

Benefits of serverless

Benefits of serverless

Application Migration with AWS

This workshop shows you how to migrate and modernize a fictional application to the AWS Cloud by:

  1. Performing a database migration
  2. Migrating and modernizing your web server using different migration strategies (for example, breaking down the monolith into containers)
  3. Teaching you how to improve Operation excellence, Security, Performance efficiency, and Cost optimization of the deployed architecture by following these pillars of the AWS Well-Architected Framework.

Take me to this workshop!

Different migration strategies for web servers

Different migration strategies for web servers

See you next time!

Thanks for exploring architecture tools and resources with us!

Next time we’ll talk about distributed systems with containers.

To find all the posts from this series, check out the Let’s Architect! page of the AWS Architecture Blog.

Amazon Linux 2023, a Cloud-Optimized Linux Distribution with Long-Term Support

Post Syndicated from Sébastien Stormacq original https://aws.amazon.com/blogs/aws/amazon-linux-2023-a-cloud-optimized-linux-distribution-with-long-term-support/

I am excited to announce the general availability of Amazon Linux 2023 (AL2023). AWS has provided you with a cloud-optimized Linux distribution since 2010. This is the third generation of our Amazon Linux distributions.

Every generation of Amazon Linux distribution is secured, optimized for the cloud, and receives long-term AWS support. We built Amazon Linux 2023 on these principles, and we go even further. Deploying your workloads on Amazon Linux 2023 gives you three major benefits: a high-security standard, a predictable lifecycle, and a consistent update experience.

Let’s look at security first. Amazon Linux 2023 includes preconfigured security policies that make it easy for you to implement common industry guidelines. You can configure these policies at launch time or run time.

For example, you can configure the system crypto policy to enforce system-wide usage of a specific set of cipher suites, TLS versions, or acceptable parameters in certificates and key exchanges. Also, the Linux kernel has many hardening features enabled by default.

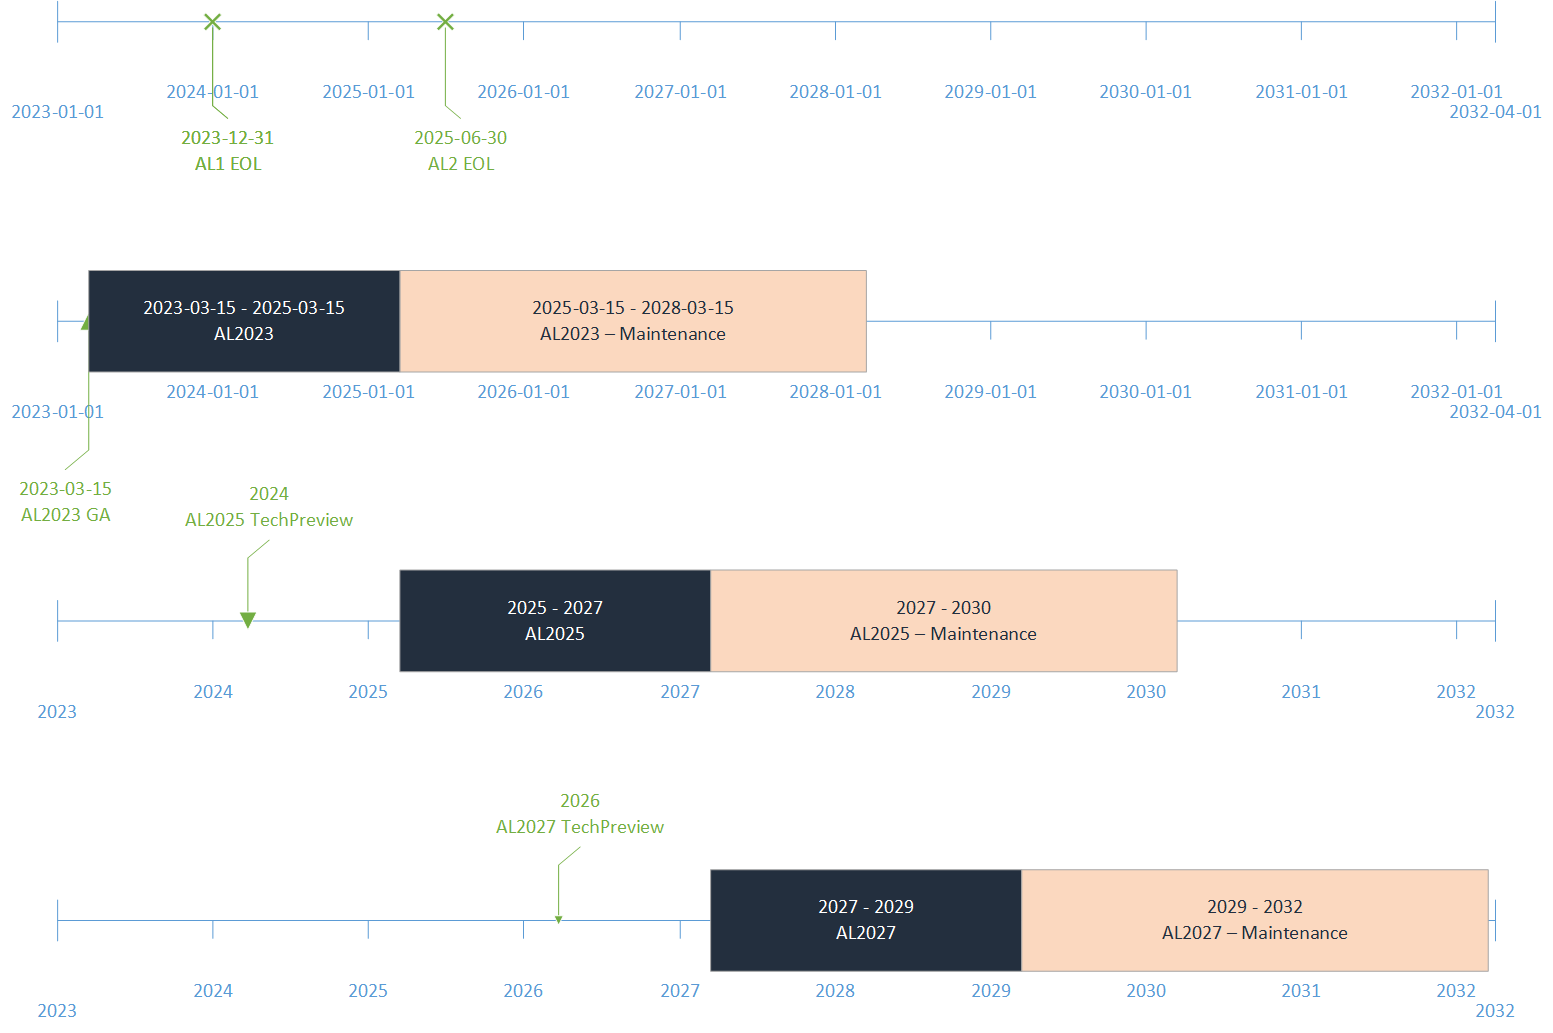
Amazon Linux 2023 makes it easier to plan and manage the operating system lifecycle. New Amazon Linux major versions will be available every two years. Major releases include new features and improvements in security and performance across the stack. The improvements might include major changes to the kernel, toolchain, GLib C, OpenSSL, and any other system libraries and utilities.

During those two years, a major release will receive an update every three months. These updates include security updates, bug fixes, and new features and packages. Each minor version is a cumulative list of updates that includes security and bug fixes in addition to new features and packages. These releases might include the latest language runtimes such as Python or Java. They might also include other popular software packages such as Ansible and Docker. In addition to these quarterly updates, security updates will be provided as soon as they are available.

Each major version, including 2023, will come with five years of long-term support. After the initial two-year period, each major version enters a three-year maintenance period. During the maintenance period, it will continue to receive security bug fixes and patches as soon as they are available. This support commitment gives you the stability you need to manage long project lifecycles.

The following diagram illustrates the lifecycle of Amazon Linux distributions:

Last—and this policy is by far my favorite—Amazon Linux provides you with deterministic updates through versioned repositories, a flexible and consistent update mechanism. The distribution locks to a specific version of the Amazon Linux package repository, giving you control over how and when you absorb updates. By default, and in contrast with Amazon Linux 2, a dnf update command will not update your installed packages (dnf is the successor to yum). This helps to ensure that you are using the same package versions across your fleet. All Amazon Elastic Compute Cloud (Amazon EC2) instances launched from an Amazon Machine Image (AMI) will have the same version of packages. Deterministic updates also promote usage of immutable infrastructure, where no infrastructure is updated after deployment. When an update is required, you update your infrastructure as code scripts and redeploy a new infrastructure. Of course, if you really want to update your distribution in place, you can point dnf to an updated package repository and update your machine as you do today. But did I tell you this is not a good practice for production workloads? I’ll share more technical details later in this blog post.

How to Get Started
Getting started with Amazon Linux 2023 is no different than with other Linux distributions. You can use the EC2 run-instances API, the AWS Command Line Interface (AWS CLI), or the AWS Management Console, and one of the four Amazon Linux 2023 AMIs that we provide. We support two machine architectures (x86_64 and Arm) and two sizes (standard and minimal). Minimal AMIs contain the most basic tools and utilities to start the OS. The standard version comes with the most commonly used applications and tools installed.

To retrieve the latest AMI ID for a specific Region, you can use AWS Systems Manager get-parameter API and query the /aws/service/ami-amazon-linux-latest/<alias> parameter.

Be sure to replace <alias> with one of the four aliases available:

  • For arm64 architecture (standard AMI): al2023-ami-kernel-default-arm64
  • For arm64 architecture (minimal AMI): al2023-ami-minimal-kernel-default-arm64
  • For x86_64 architecture (standard AMI): al2023-ami-kernel-default-x86_64
  • For x86_64 architecture (minimal AMI): al2023-ami-minimal-kernel-default-x86_64

For example, to search for the latest Arm64 full distribution AMI ID, I open a terminal and enter:

~ aws ssm get-parameters --region us-east-2 --names /aws/service/ami-amazon-linux-latest/al2023-ami-kernel-default-arm64
{
    "Parameters": [
        {
            "Name": "/aws/service/ami-amazon-linux-latest/al2023-ami-kernel-default-arm64",
            "Type": "String",
            "Value": "ami-02f9b41a7af31dded",
            "Version": 1,
            "LastModifiedDate": "2023-02-24T22:54:56.940000+01:00",
            "ARN": "arn:aws:ssm:us-east-2::parameter/aws/service/ami-amazon-linux-latest/al2023-ami-kernel-default-arm64",
            "DataType": "text"
        }
    ],
    "InvalidParameters": []
}

To launch an instance, I use the run-instances API. Notice how I use Systems Manager resolution to dynamically lookup the AMI ID from the CLI.

➜ aws ec2 run-instances                                                                            \
       --image-id resolve:ssm:/aws/service/ami-amazon-linux-latest/al2023-ami-kernel-default-arm64  \
       --key-name my_ssh_key_name                                                                   \
       --instance-type c6g.medium                                                                   \
       --region us-east-2 
{
    "Groups": [],
    "Instances": [
        {
          "AmiLaunchIndex": 0,
          "ImageId": "ami-02f9b41a7af31dded",
          "InstanceId": "i-0740fe8e23f903bd2",
          "InstanceType": "c6g.medium",
          "KeyName": "my_ssh_key_name",
          "LaunchTime": "2023-02-28T14:12:34+00:00",

...(redacted for brevity)
}

When the instance is launched, and if the associated security group allows SSH (TCP 22) connections, I can connect to the machine:

~ ssh [email protected]
Warning: Permanently added '3.145.19.213' (ED25519) to the list of known hosts.
   ,     #_
   ~\_  ####_        Amazon Linux 2023
  ~~  \_#####\       Preview
  ~~     \###|
  ~~       \#/ ___   https://aws.amazon.com/linux/amazon-linux-2023
   ~~       V~' '->
    ~~~         /
      ~~._.   _/
         _/ _/
       _/m/'
Last login: Tue Feb 28 14:14:44 2023 from 81.49.148.9
[ec2-user@ip-172-31-9-76 ~]$ uname -a
Linux ip-172-31-9-76.us-east-2.compute.internal 6.1.12-19.43.amzn2023.aarch64 #1 SMP Thu Feb 23 23:37:18 UTC 2023 aarch64 aarch64 aarch64 GNU/Linux

We also distribute Amazon Linux 2023 as Docker images. The Amazon Linux 2023 container image is built from the same software components that are included in the Amazon Linux 2023 AMI. The container image is available for use in any environment as a base image for Docker workloads. If you’re using Amazon Linux for applications in EC2, you can containerize your applications with the Amazon Linux container image.

These images are available from Amazon Elastic Container Registry (Amazon ECR) and from Docker Hub. Here is a quick demo to start a Docker container using Amazon Linux 2023 from Elastic Container Registry.

$ aws ecr-public get-login-password --region us-east-1 | docker login --username AWS --password-stdin public.ecr.aws
Login Succeeded
~ docker run --rm -it public.ecr.aws/amazonlinux/amazonlinux:2023 /bin/bash
Unable to find image 'public.ecr.aws/amazonlinux/amazonlinux:2023' locally
2023: Pulling from amazonlinux/amazonlinux
b4265814d5cf: Pull complete 
Digest: sha256:bbd7a578cff9d2aeaaedf75eb66d99176311b8e3930c0430a22e0a2d6c47d823
Status: Downloaded newer image for public.ecr.aws/amazonlinux/amazonlinux:2023
bash-5.2# uname -a 
Linux 9d5b45e9f895 5.15.49-linuxkit #1 SMP PREEMPT Tue Sep 13 07:51:32 UTC 2022 aarch64 aarch64 aarch64 GNU/Linux
bash-5.2# exit 

When pulling from Docker Hub, you can use this command to pull the image: docker pull amazonlinux:2023.

What Are the Main Differences Compared to Amazon Linux 2?
Amazon Linux 2023 has some differences compared to Amazon Linux 2. The documentation explains these differences in detail. The two differences I would like to focus on are dnf and the package management policies.

AL2023 comes with Fedora’s dnf, the successor to yum. But don’t worry, dnf provides similar commands as yum to search, install, or remove packages. Where you used to run the commands yum list or yum install httpd, you may now run dnf list or dnf install httpd. For convenience, we create a symlink for /usr/bin/yum, so you can run your scripts unmodified.

$ which yum
/usr/bin/yum
$ ls -al /usr/bin/yum
lrwxrwxrwx. 1 root root 5 Jun 19 18:06 /usr/bin/yum -> dnf-3

The biggest difference, in my opinion, is the deterministic updates through versioned repositories. By default, the software repository is locked to the AMI version. This means that a dnf update command will not return any new packages to install. Versioned repositories give you the assurance that all machines started from the same AMI ID are identical. Your infrastructure will not deviate from the baseline.

$ sudo dnf update 
Last metadata expiration check: 0:14:10 ago on Tue Feb 28 14:12:50 2023.
Dependencies resolved.
Nothing to do.
Complete!

Yes, but what if you want to update a machine? You have two options to update an existing machine. The cleanest one for your production environment is to create duplicate infrastructure based on new AMIs. As I mentioned earlier, we publish updates for every security fix and a consolidated update every three months for two years after the initial release. Each update is provided as a set of AMIs and their corresponding software repository.

For smaller infrastructure, such as test or development machines, you might choose to update the operating system or individual packages in place as well. This is a three-step process:

  • first, list the available updated software repositories;
  • second, point dnf to a specific software repository;
  • and third, update your packages.

To show you how it works, I purposely launched an EC2 instance with an “old” version of Amazon Linux 2023 from February 2023. I first run dnf check-release-update to list the available updated software repositories.

$ dnf check-release-update
WARNING:
  A newer release of "Amazon Linux" is available.

  Available Versions:

  Version 2023.0.20230308:
    Run the following command to upgrade to 2023.0.20230308:

      dnf upgrade --releasever=2023.0.20230308

    Release notes:
     https://docs.aws.amazon.com/linux/al2023/release-notes/relnotes.html

Then, I might either update the full distribution using dnf upgrade --releasever=2023.0.20230308 or point dnf to the updated repository to select individual packages.

$ dnf check-update --releasever=2023.0.20230308

Amazon Linux 2023 repository                                                    28 MB/s |  11 MB     00:00
Amazon Linux 2023 Kernel Livepatch repository                                  1.2 kB/s | 243  B     00:00

amazon-linux-repo-s3.noarch                          2023.0.20230308-0.amzn2023                amazonlinux
binutils.aarch64                                     2.39-6.amzn2023.0.5                       amazonlinux
ca-certificates.noarch                               2023.2.60-1.0.amzn2023.0.1                amazonlinux
(redacted for brevity)
util-linux-core.aarch64 2.37.4-1.amzn2022.0.1 amazonlinux

Finally, I might run a dnf update <package_name> command to update a specific package.

This might look like overkill for a simple machine, but when managing enterprise infrastructure or large-scale fleets of instances, this facilitates the management of your fleet by ensuring that all instances run the same version of software packages. It also means that the AMI ID is now something that you can fully run through your CI/CD pipelines for deployment and that you have a way to roll AMI versions forward and backward according to your schedule.

Where is Fedora?
When looking for a base to serve as a starting point for Amazon Linux 2023, Fedora was the best choice. We found that Fedora’s core tenets (Freedom, Friends, Features, First) resonate well with our vision for Amazon Linux. However, Amazon Linux focuses on a long-term, stable OS for the cloud, which is a notable different release cycle and lifecycle than Fedora. Amazon Linux 2023 provides updated versions of open-source software, a larger variety of packages, and frequent releases.

Amazon Linux 2023 isn’t directly comparable to any specific Fedora release. The Amazon Linux 2023 GA version includes components from Fedora 34, 35, and 36. Some of the components are the same as the components in Fedora, and some are modified. Other components more closely resemble the components in CentOS Stream 9 or were developed independently. The Amazon Linux kernel, on its side, is sourced from the long-term support options that are on kernel.org, chosen independently from the kernel provided by Fedora.

Like every good citizen in the open-source community, we give back and contribute our changes to upstream distributions and sources for the benefit of the entire community. Amazon Linux 2023 itself is open source. The source code for all RPM packages that are used to build the binaries that we ship are available through the SRPM yum repository (sudo dnf install -y 'dnf-command(download)' && dnf download --source bash)

One More Thing: Amazon EBS Gp3 Volumes
Amazon Linux 2023 AMIs use gp3 volumes by default.

Gp3 is the latest generation general-purpose solid-state drive (SSD) volume for Amazon Elastic Block Store (Amazon EBS). Gp3 provides 20 percent lower storage costs compared to gp2. Gp3 volumes deliver a baseline performance of 3,000 IOPS and 125MB/s at any volume size. What I particularly like about gp3 volumes is that I can now provision performance independently of capacity. When using gp3 volumes, I can now increase IOPS and throughput without incurring charges for extra capacity that I don’t actually need.

With the availability of gp3-backed AL2023 AMIs, this is the first time a gp3-backed Amazon Linux AMI is available. Gp3-backed AMIs have been a common customer request since gp3 was launched in 2020. It is now available by default.

Price and Availability
Amazon Linux 2023 is provided at no additional charge. Standard Amazon EC2 and AWS charges apply for running EC2 instances and other services. This distribution includes full support for five years. When deploying on AWS, our support engineers will provide technical support according to the terms and conditions of your AWS Support plan. AMIs are available in all AWS Regions.

Amazon Linux is the most used Linux distribution on AWS, with hundreds of thousands of customers using Amazon Linux 2. Dozens of Independent Software Vendors (ISVs) and hardware partners are supporting Amazon Linux 2023 today. You can adopt this new version with the confidence that the partner tools you rely on are likely to be supported. We are excited about this release, which brings you an even higher level of security, a predictable release lifecycle, and a consistent update experience.

Now go build and deploy your workload on Amazon Linux 2023 today.

— seb

Developing portable AWS Lambda functions

Post Syndicated from Pascal Vogel original https://aws.amazon.com/blogs/compute/developing-portable-aws-lambda-functions/

This blog post is written by Uri Segev, Principal Serverless Specialist Solutions Architect

When developing new applications or modernizing existing ones, you might face a dilemma: which compute technology to use? A serverless compute service such as AWS Lambda or maybe containers? Often, serverless can be the better approach thanks to automatic scaling, built-in high availability, and a pay-for-use billing model. However, you may hesitate to choose serverless for reasons such as:

  • Perceived higher cost or difficulty in estimating cost
  • It is a paradigm shift, which requires learning to bridge the knowledge gap
  • Misconceptions about Lambda capabilities and use cases
  • Concern that using Lambda will result in lock-in
  • Existing investments in non-serverless platforms and tooling

This blog post suggests best practices for developing portable Lambda functions that allow you to easily port your code to containers if you later choose to. By doing so, you can avoid lock-in and try out the serverless approach in a risk-free way.

Each section of this blog post describes what you need to consider when writing portable code and the steps needed to migrate this code from Lambda to containers, if you later choose to do so.

Best practices for portable Lambda functions

Separate business logic and Lambda handler

Lambda functions are event-driven in nature. When a specific event happens, it invokes the Lambda function by calling its handler method. The handler method receives an event object which contains information regarding the reason for the function invocation. Once the function execution completes, it returns from the handler method. Whatever is returned from the handler is the function’s return value.

To write portable code, we recommend using the handler method only as an interface between the Lambda runtime (event object) and the business logic. Using Hexagonal architecture terminology, the handler should be a driving adapter making calls into the port, which is the interface exposed by the business logic The handler should extract all required information from the event object and then call a separate method that implements the business logic.

When that method returns, the handler constructs the result in the format expected by the function invoker and returns it. We also recommend splitting the handler code and the business logic code into separate files. Should you choose to migrate to containers later, you simply migrate your business logic code files with no additional changes.

The following pseudocode shows a Lambda handler that extracts information from the event object and calls the business logic. Once the business logic is done, the handler places the response in the function’s return value:

import business_logic

# The Lambda handler extracts needed information from the event
# object and invokes the business logic
handler(event, context) {
  # Extract needed information from event object payload = event[‘payload’]

  # Invoke business logic
  result = do_some_logic(payload)
  
  # Construct result for API Gateway
  return {
    statusCode: 200,
	body: result
  }
}

The following pseudocode shows the business logic. It’s located in a separate file and is unaware that it is being invoked from a Lambda function. It is pure logic.

# This is the business logic. It knows nothing about who invokes it.
do_some_logic(data) {
result = "This is my result."
  return result
}

This approach also makes it easier to run unit tests on the business logic without the need to construct event objects and to invoke the Lambda handler.

If you migrate to containers later, you include the business logic files in your container with new interface code as described in the following section.

Event source integration

One benefit of Lambda functions is the event source integration. For instance, if you integrate Lambda with Amazon Simple Queue Service (Amazon SQS), the Lambda service will take care of polling the queue, invoking the Lambda function and deleting the messages from the queue when done. By using this integration, you need to write less boilerplate code. You can focus only on implementing business logic and not the integration with the event source.

The following pseudocode shows how the Lambda handler looks like for an SQS event source:

import business_logic

handler(event, context) {
  entries = []
  # Iterate over all the messages in the event object
  for message in event[‘Records’] {
    # Call the business logic to process a single message
    success = handle_message(message)

    # Start building the response
    if Not success {
      entries.append({
      'itemIdentifier': message['messageId']
      })
    }
  }

  # Notify Lambda about failed items.
  if (let(entries) > 0) {
    return {
      'batchItemFailures': entries
    }
  }
}

As you can see in the previous code, the Lambda function has almost no knowledge that it is being invoked from SQS. There are no SQS API calls. It only knows the structure of the event object, which is specific to SQS.

When moving to a container, the integration responsibility moves from the Lambda service to you, the developer. There are different event sources in AWS, and each of them will require a different approach for consuming events and invoking business logic. For example, if the event source is Amazon API Gateway, your application will need to create an HTTP server that listens on an HTTP port and waits for incoming requests in order to invoke the business logic.

If the event source is Amazon Kinesis Data Streams, your application will need to run a poller that reads records from the shards, keep track of processed records, handle the case of a change in the number of shards in the stream, retry on errors, and more. Regardless of the event source, if you follow the previous recommendations, you will not need to change anything in the business logic code.

The following pseudocode shows how the integration with SQS will look like in a container. Note that you will lose some features such as batching, filtering, and, of course, automatic scaling.

import aws_sdk
import business_logic

QUEUE_URL = os.environ['QUEUE_URL']
BATCH_SIZE = os.environ.get('BATCH_SIZE', 1)
sqs_client = aws_sdk.client('sqs')

main() {
  # Infinite loop to poll for messages from SQS
  while True {

    # Receive a batch of messages from the queue
    response = sqs_client.receive_message(
      QueueUrl = QUEUE_URL,
      MaxNumberOfMessages = BATCH_SIZE,
      WaitTimeSeconds = 20 )

    # Loop over the messages in the batch
    entries = []
    i = 1
    for message in response.get('Messages',[]) {
      # Process a single message
      success = handle_message(message)

      # Append the message handle to an array that is later
      # used to delete processed messages
      if success {
        entries.append(
          {
            'Id': f'index{i}',
            'ReceiptHandle': message['receiptHandle']
          }
        )
        i += 1
      }
    }

    # Delete all the processed messages
    if (len(entries) > 0) {
      sqs_client.delete_message_batch(
        QueueUrl = QUEUE_URL,
        Entries = entries
      )
    }
  }
}

Another point to consider here is Lambda destinations. If your function is invoked asynchronously and you configured a destination for your function, you will need to include that in the interface code. It will need to catch any business logic error and, based on that, invoke the right destination.

Package functions as containers

Lambda supports packaging functions as .zip files and container images. To develop portable code, we recommend using container images as your default packaging method. Even though you package the function as a container image, you can’t run it on other container platforms such as Amazon Elastic Container Service (Amazon ECS) or Amazon Elastic Kubernetes Service (EKS). However, by packaging it this way, the migration to containers later will be easier as you are already using the same tools and you already created a Dockerfile that will require minimal changes.

An example Dockerfile for Lambda looks like this:

FROM public.ecr.aws/lambda/python:3.9
COPY *.py requirements.txt ./
RUN python3.9 -m pip install -r requirements.txt -t .
CMD ["app.lambda_handler"]

If you move to containers later, you will need to change the Dockerfile to use a different base image and adapt the CMD line that defines how to start the application. This is in addition to the code changes described in the previous section.

The corresponding Dockerfile for the container will look like this:

FROM python:3.9
COPY *.py requirements.txt ./
RUN python3.9 -m pip install -r requirements.txt -t .
CMD ["python", "./app.py"]

The deployment pipeline also needs to change as we deploy to a different target. However, building the artifacts remains the same.

Single invocation per instance

Lambda functions run in their own isolated runtime environment. Each environment handles a single request at a time which works great for Lambda. However, if you migrate your application to containers, you will likely invoke the business logic from multiple threads in a single process at the same time.

This section discusses aspects of moving from a single invocation to multiple concurrent invocations within the same process.

Static variables

Static variables are those that are instantiated once and then reused across multiple invocations. Examples of such variables are database connections or configuration information.

For function optimization, and specifically for reducing cold starts and the duration of warm function invocations, we recommend initializing all static variables outside the function handler and storing them in global variables so that further invocations will reuse them.

We recommend using an initialization function that you write as part of the business logic module and that you invoke from outside the handler. This function saves information in global variables that the business logic code reuses across invocations.

The following pseudocode shows the Lambda function:

import business_logic

# Call the initialization code
initialize()

handler(event, context) {
  ...
  # Call the business logic
  ...
}

And the business logic code will look like this:

# Global variables used to store static data
var config

initialize() {
  config = read_Config()
}

do_some_logic(data) {
  # Do something with config object
  ...
}

The same also applies to containers. You will usually initialize static variables when the process starts and not for every single request. When moving to containers, all you need to do is call the initialization function before starting the main application loop.

import business_logic

# Call the initialization code
initialize()

main() {
  while True {
    ...
    # Call the business logic
    ...
  }
}

As you can see, there are no changes in the business logic code.

Database connections

As Lambda functions share nothing between the runtime environments, unlike containers they can’t rely on connection pools when connecting to a relational database. For this reason, we created Amazon RDS Proxy, which acts as a centralized connection pool used by many functions.

To write portable Lambda functions, we recommend using a connection pool object with a single connection. Your business logic code will always ask for a connection from the pool when making a database request. You will still need to use RDS Proxy.

If you later move to containers, you can increase the number of connections in the pool to a larger number with no further changes and the application will scale without overwhelming the database.

File system

Lambda functions come with a writable /tmp folder in the size of 512 MB to 10 GB. As each function instance runs in an isolated runtime environment, developers usually use fixed file names for files stored in that folder. If you run the same business logic code in a container in multiple threads, the different threads will overwrite the files created by others.

We recommended using unique file names in each invocation. Append a UUID or another random number to the file name. Delete the files once you are done with them to avoid running out of space.

If you move your code to containers later, there is nothing to do.

Portable web applications

If you develop a web application, there is another way to achieve portability. You can use the AWS Lambda Web Adapter project to host a web app inside a Lambda function. This way you can develop a web application with familiar frameworks (e.g., Express.js, Next.js, Flask, Spring Boot, Laravel, or anything that uses HTTP 1.1/1.0), and run it on Lambda. If you package your web application as a container, the same Docker image can run on Lambda (using the web adapter) and containers.

Porting from containers to Lambda

This blog post demonstrates how to develop portable Lambda functions you can easily port to containers. Taking these recommendations into consideration can also help develop portable code in general, which allows you to port containers to Lambda functions.

Some things to consider:

  • Separate the business logic from the interface code in the container. The interface code should interact with the event sources and invoke the business logic.
  • As Lambda functions only have a /tmp writable folder, replicate this in your containers (even though you could write to different locations).

Conclusion

This blog post suggests best practices for developing Lambda functions that allow you to gain the benefits of a serverless approach without risking lock-in.

By following these best practices for separating business logic from Lambda handlers, packaging functions as containers, handling Lambda’s single invocation per instance, and more, you can develop portable Lambda functions. As a consequence, you will be able to port your code from Lambda to containers with minimal effort if you choose to move to containers later.

Refer to these best practices and code samples to ease the adoption of a serverless approach when developing your next application.

For more serverless learning resources, visit Serverless Land.

How to run AWS CloudHSM workloads in container environments

Post Syndicated from Derek Tumulak original https://aws.amazon.com/blogs/security/how-to-run-aws-cloudhsm-workloads-on-docker-containers/

January 25, 2023: We updated this post to reflect the fact that CloudHSM SDK3 does not support serverless environments and we strongly recommend deploying SDK5.


AWS CloudHSM provides hardware security modules (HSMs) in the AWS Cloud. With CloudHSM, you can generate and use your own encryption keys in the AWS Cloud, and manage your keys by using FIPS 140-2 Level 3 validated HSMs. Your HSMs are part of a CloudHSM cluster. CloudHSM automatically manages synchronization, high availability, and failover within a cluster.

CloudHSM is part of the AWS Cryptography suite of services, which also includes AWS Key Management Service (AWS KMS), AWS Secrets Manager, and AWS Private Certificate Authority (AWS Private CA). AWS KMS, Secrets Manager, and AWS Private CA are fully managed services that are convenient to use and integrate. You’ll generally use CloudHSM only if your workload requires single-tenant HSMs under your own control, or if you need cryptographic algorithms or interfaces that aren’t available in the fully managed alternatives.

CloudHSM offers several options for you to connect your application to your HSMs, including PKCS#11, Java Cryptography Extensions (JCE), OpenSSL Dynamic Engine, or Microsoft Cryptography API: Next Generation (CNG). Regardless of which library you choose, you’ll use the CloudHSM client to connect to HSMs in your cluster.

In this blog post, I’ll show you how to use Docker to develop, deploy, and run applications by using the CloudHSM SDK, and how to manage and orchestrate workloads by using tools and services like Amazon Elastic Container Service (Amazon ECS), Kubernetes, Amazon Elastic Kubernetes Service (Amazon EKS), and Jenkins.

Solution overview

This solution demonstrates how to create a Docker container that uses the CloudHSM JCE SDK to generate a key and use it to encrypt and decrypt data.

Note: In this example, you must manually enter the crypto user (CU) credentials as environment variables when you run the container. For production workloads, you’ll need to consider how to secure and automate the handling and distribution of these credentials. You should work with your security or compliance officer to ensure that you’re using an appropriate method of securing HSM login credentials. For more information on securing credentials, see AWS Secrets Manager.

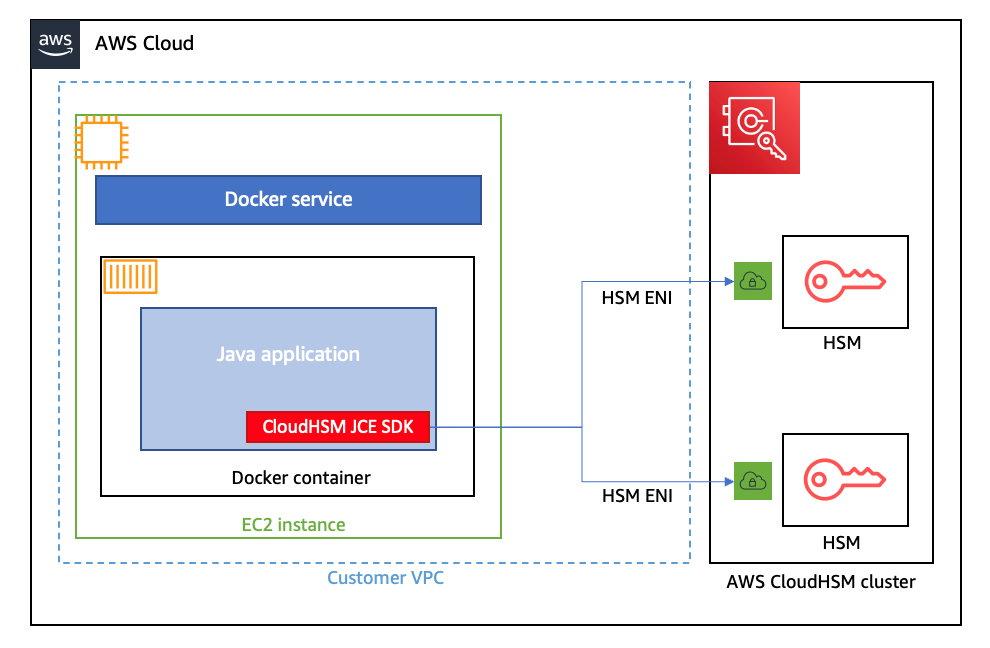
Figure 1 shows the solution architecture. The Java application, running in a Docker container, integrates with JCE and communicates with CloudHSM instances in a CloudHSM cluster through HSM elastic network interfaces (ENIs). The Docker container runs in an EC2 instance, and access to the HSM ENIs is controlled with a security group.

Figure 1: Architecture diagram

Figure 1: Architecture diagram

Prerequisites

To implement this solution, you need to have working knowledge of the following items:

  • CloudHSM
  • Docker 20.10.17 – used at the time of this post
  • Java 8 or Java 11 – supported at the time of this post
  • Maven 3.05 – used at the time of this post

Here’s what you’ll need to follow along with my example:

  1. An active CloudHSM cluster with at least one active HSM instance. You can follow the CloudHSM getting started guide to create, initialize, and activate a CloudHSM cluster.

    Note: For a production cluster, you should have at least two active HSM instances spread across Availability Zones in the Region.

  2. An Amazon Linux 2 EC2 instance in the same virtual private cloud (VPC) in which you created your CloudHSM cluster. The Amazon Elastic Compute Cloud (Amazon EC2) instance must have the CloudHSM cluster security group attached—this security group is automatically created during the cluster initialization and is used to control network access to the HSMs. To learn about attaching security groups to allow EC2 instances to connect to your HSMs, see Create a cluster in the AWS CloudHSM User Guide.
  3. A CloudHSM crypto user (CU) account. You can create a CU by following the steps in the topic Managing HSM users in AWS CloudHSM in the AWS CloudHSM User Guide.

Solution details

In this section, I’ll walk you through how to download, configure, compile, and run a solution in Docker.

To set up Docker and run the application that encrypts and decrypts data with a key in AWS CloudHSM

  1. On your Amazon Linux EC2 instance, install Docker by running the following command.

    # sudo yum -y install docker

  2. Start the docker service.

    # sudo service docker start

  3. Create a new directory and move to it. In my example, I use a directory named cloudhsm_container. You’ll use the new directory to configure the Docker image.

    # mkdir cloudhsm_container
    # cd cloudhsm_container

  4. Copy the CloudHSM cluster’s trust anchor certificate (customerCA.crt) to the directory that you just created. You can find the trust anchor certificate on a working CloudHSM client instance under the path /opt/cloudhsm/etc/customerCA.crt. The certificate is created during initialization of the CloudHSM cluster and is required to connect to the CloudHSM cluster. This enables our application to validate that the certificate presented by the CloudHSM cluster was signed by our trust anchor certificate.
  5. In your new directory (cloudhsm_container), create a new file with the name run_sample.sh that includes the following contents. The script runs the Java class that is used to generate an Advanced Encryption Standard (AES) key to encrypt and decrypt your data.
    #! /bin/bash
    
    # start application
    echo -e "\n* Entering AES GCM encrypt/decrypt sample in Docker ... \n"
    
    java -ea -jar target/assembly/aesgcm-runner.jar -method environment
    
    echo -e "\n* Exiting AES GCM encrypt/decrypt sample in Docker ... \n"

  6. In the new directory, create another new file and name it Dockerfile (with no extension). This file will specify that the Docker image is built with the following components:
    • The CloudHSM client package.
    • The CloudHSM Java JCE package.
    • OpenJDK 1.8 (Java 8). This is needed to compile and run the Java classes and JAR files.
    • Maven, a build automation tool that is needed to assist with building the Java classes and JAR files.
    • The AWS CloudHSM Java JCE samples that will be downloaded and built as part of the solution.
  7. Cut and paste the following contents into Dockerfile.

    Note: You will need to customize your Dockerfile, as follows:

    • Make sure to specify the SDK version to replace the one specified in the pom.xml file in the sample code. As of the writing of this post, the most current version is 5.7.0. To find the SDK version, follow the steps in the topic Check your client SDK version. For more information, see the Building section in the README file for the Cloud HSM JCE examples.
    • Make sure to update the HSM_IP line with the IP of an HSM in your CloudHSM cluster. You can get your HSM IPs from the CloudHSM console, or by running the describe-clusters AWS CLI command.
      	# Use the amazon linux image
      	FROM amazonlinux:2
      
      	# Pass HSM IP address as a build argument
      	ARG HSM_IP
      
      	# Install CloudHSM client
      	RUN yum install -y https://s3.amazonaws.com/cloudhsmv2-software/CloudHsmClient/EL7/cloudhsm-jce-latest.el7.x86_64.rpm
      
      	# Install Java, Maven, wget, unzip and ncurses-compat-libs
      	RUN yum install -y java maven wget unzip ncurses-compat-libs
              
      	# Create a work dir
      	WORKDIR /app
              
      	# Download sample code
      	RUN wget https://github.com/aws-samples/aws-cloudhsm-jce-examples/archive/refs/heads/sdk5.zip
              
      	# unzip sample code
      	RUN unzip sdk5.zip
             
      	# Change to the create directory
      	WORKDIR aws-cloudhsm-jce-examples-sdk5
      
      # Build JAR files using the installed CloudHSM JCE Provider version
      RUN export CLOUDHSM_CLIENT_VERSION=`rpm -qi cloudhsm-jce | awk -F': ' '/Version/ {print $2}'` \
              && mvn validate -DcloudhsmVersion=$CLOUDHSM_CLIENT_VERSION \
              && mvn clean package -DcloudhsmVersion=$CLOUDHSM_CLIENT_VERSION
              
        # Configure cloudhsm-client
        COPY customerCA.crt /opt/cloudhsm/etc/
        RUN /opt/cloudhsm/bin/configure-jce -a $HSM_IP
             
        # Copy the run_sample.sh script
        COPY run_sample.sh .
              
        # Run the script
        CMD ["bash","run_sample.sh"]

  8. Now you’re ready to build the Docker image. Run the following command, with the name jce_sample. This command will let you use the Dockerfile that you created in step 6 to create the image.

    # sudo docker build --build-arg HSM_IP=”<your HSM IP address>” -t jce_sample .

  9. To run a Docker container from the Docker image that you just created, run the following command. Make sure to replace the user and password with your actual CU username and password. (If you need help setting up your CU credentials, see prerequisite 3. For more information on how to provide CU credentials to the AWS CloudHSM Java JCE Library, see Providing credentials to the JCE provider in the CloudHSM User Guide).

    # sudo docker run --env HSM_USER=<user> --env HSM_PASSWORD=<password> jce_sample

    If successful, the output should look like this:

    	* Entering AES GCM encrypt/decrypt sample in Docker ... 
    
    	737F92D1B7346267D329C16E
    	Successful decryption
    
    	* Exiting AES GCM encrypt/decrypt sample in Docker ...

Conclusion

This solution provides an example of how to run CloudHSM client workloads in Docker containers. You can use the solution as a reference to implement your cryptographic application in a way that benefits from the high availability and load balancing built in to CloudHSM without compromising the flexibility that Docker provides for developing, deploying, and running applications.

If you have comments about this post, submit them in the Comments section below.

Want more AWS Security how-to content, news, and feature announcements? Follow us on Twitter.

Derek Tumulak

Derek Tumulak

Derek joined AWS in May 2021 as a Principal Product Manager. He is a data protection and cybersecurity expert who is enthusiastic about assisting customers with a wide range of sophisticated use cases.

Monitoring Kubernetes with Zabbix

Post Syndicated from Michaela DeForest original https://blog.zabbix.com/monitoring-kubernetes-with-zabbix/25055/

There are many options available for monitoring Kubernetes and cloud-native applications. In this multi-part blog series, we’ll explore how to use Zabbix to monitor a Kubernetes cluster and understand the metrics generated within Zabbix. We’ll also learn how to exploit Prometheus endpoints exposed by applications to monitor application-specific metrics.

Want to see Kubernetes monitoring in action? Watch the step-by-step Zabbix Kubernetes monitoring configuration and deployment guide.

Why Choose Zabbix to Monitor Kubernetes?

Before choosing Zabbix as a Kubernetes monitoring tool, we asked ourselves, “why would we choose to use Zabbix rather than Prometheus, Grafana, and alertmanager?” After all, they have become the standard monitoring tools in the cloud ecosystem. We decided that our minimum criteria for Zabbix would be that it was just as effective as Prometheus for monitoring both Kubernetes and cloud-native applications.

Through our discovery process, we concluded that Zabbix meets (and exceeds) this minimum requirement. Zabbix provides similar metrics and triggers as Prometheus, alert manager, and Grafana for Kubernetes, as they both use the same backend tools to do this. However, Zabbix can do this in one product while still maintaining flexibility and allowing you to monitor pretty much anything you can write code to collect. Regarding application monitoring, Zabbix can transform Prometheus metrics fed to it by Prometheus exporters and endpoints. In addition, because Zabbix can make calls to any HTTP endpoint, it can monitor applications that do not have a dedicated Prometheus endpoint, unlike Prometheus.

The Zabbix Helm Chart

Zabbix monitors Kubernetes by collecting metrics exposed via the Kubernetes API and kube-state-metrics. The components necessary to monitor a cluster are installed within the cluster using this helm chart provided by Zabbix. The helm chart includes the Zabbix agent installed as a daemon set and is used to monitor local resources and applications on each node. A Zabbix proxy is also installed to collect monitoring data and transfer it to the external Zabbix server.

Only the Zabbix proxy needs access to the Zabbix server, while the agents can send data to the proxy installed in the same namespace as each agent. A cluster role allows Zabbix to access resources in the cluster via the Kubernetes API. While the cluster role could be modified to restrict privileges given to Zabbix, this will result in some items becoming unsupported. We recommend keeping this the same if you want to get the most out of Kubernetes monitoring with Zabbix.

The Zabbix helm chart installs the kube-state-metrics project as a dependency. You may already be familiar with this project under the Kubernetes organization, which generates Prometheus format metrics based on the current state of the Kubernetes resources. In addition, if you have experience using Prometheus to monitor a cluster, you may already have this installed. If that is the case, you can point to this deployment rather than installing another one.

In this tutorial, we will install kube-state-metrics via the Zabbix helm chart.

For more information on skipping this step, refer to the values file in the Zabbix Kubernetes helm chart.

Installing the Zabbix Helm Chart

Now that we’ve explained how the Zabbix helm chart works, let’s go ahead and install it. In this example, we will assume that you have a running Zabbix 6.0 (or higher) instance that is reachable from the cluster you wish to monitor. I am running a 6.0 instance in a different cluster than the one we want to monitor. The server is reachable via the DNS name mdeforest.zabbix.atsgroup.io with a non-standard port of 31103.

We will start by installing the latest Zabbix helm chart. I recommend visiting zabbix.com/integrations/kubernetes to get any sources that may be referred to in this tutorial. There you will find a link to the Zabbix helm chart and templates. For the most part, we will follow the steps outlined in the readme.


Using a terminal window, I am going to make sure the active cluster is set to the cluster that I want to monitor:

kubectl config use-context <cluster context name>

I’m then going to add the Zabbix chart repo to my local helm repository:

helm repo add zabbix-chart-6.0 https://cdn.zabbix.com/zabbix/integrations/kubernetes-helm/6.0/

If you’re running Zabbix 6.2 or newer, change the references to 6.0 in this command to 6.2.

Depending on your circumstances, you will need to set a few values for the installation. In most cases, you only need to set a few environment variables for the Zabbix agent and the proxy. The complete list of values and environment variables is available in the helm chart repo, alongside the agent and proxy images on Docker Hub.

In this case, I’m setting the passive server environment variable for the agent to allow any IP to connect. For the proxy, I am setting the server host accessible from the proxy alongside the non-standard port. I’ve also set here some variables related to cache size. These variables may depend on your cluster size, so you may need to play around with them to find the correct values.

Now that I have the values file ready, I’m ready to install the chart. So, we’ll use the following command. Of course, the chart path might vary depending on what version of the chart you’re using.

helm install -f </path/to/values/file> [-n <namespace>] zabbix zabbix-chart-6.0/zabbix-helm-chart

You can also optionally add a namespace. You must wait until everything is running, so I’ll check just that with the following:

watch kubectl get pods

Now that everything is installed, we’re ready to set up hosts in Zabbix that will be associated with the cluster. The last step before we have all the information we need is to obtain the token created via the service account installed with the helm chart. We’ll get this by running the next command, which is the name of the service account that was created:

kubectl get secret -o jsonpath={.data.token} zabbix service-account | base64 -d

This will get the secret created for the service account and grab just the token from that, which is passed to the base64 utility to decode it. Be sure to copy that value somewhere because you’ll need it for later.

You’ll also need the Kubernetes API endpoint. In most cases, you’ll use the proxy installed rather than the server directly or a proxy outside the cluster. If this is the case, you can use the service DNS for the API. We should be able to reach it by pointing to https://kubernetes.default.svc.cluster.local:443/api.

If this is not the case, you can use the output from the command:

kubectl cluster-info

Now, let’s head over to the Zabbix UI. All the templates we need are shipped in Zabbix 6. If for some reason, you can’t find them, they are available for download and import by visiting the integrations page that I pointed out earlier on the Zabbix site.

Adding the Proxy

We will add our proxy by heading to Administration -> Proxies:

  1. Click Create Proxy. Because this is an active proxy by default, we only need to specify the proxy name. If you didn’t make any changes to the helm chart, this should default to zabbix-proxy. If you’d like to name this differently, you can change the environment variable zbx_hostname for the proxy in the helm chart. We’re going to leave it as the default for now. You’re going to enter this name and then click “Add.” After a few minutes, you’ll start to see that it says that the proxy has been seen.
  2. Create a Host Group to put hosts related to Kubernetes. For this example, let’s create one, which we’ll call Kubernetes.
  3. Head to the host page under configuration and click Create Host. The first host will collect metrics related to monitoring Kubernetes nodes, and we’ll discover nodes and create new hosts using Zabbix low-level discovery.
  4. Give this host the name Kubernetes Nodes. We’ll also assign this host to the Kubernetes host group we created and attach the template Kubernetes nodes by HTTP.
  5. Change the line “Monitored by proxy” to the proxy created earlier, called zabbix-proxy.
  6. Click the Macros tab and select “Inherited and host macros.” You should be able to see all the macros that may be set to influence what is monitored in your cluster. In this case, we need to change the first two macros. The first, {KUBE.API.ENDPOINT.URL}, should be set to the Kubernetes API endpoint. In our case, we can set it to what I mentioned earlier: default.svc.cluster.local:443/api. Next, the token should be set to the previously retrieved value from the command line.
  7. lick Add. After a few minutes, you should start seeing data on the latest data page and new hosts on the host page representing each node.

Creating an Additional Host

Now let’s create another host that will represent the metrics available via the Kubernetes API and the kube-state-metrics endpoint.

  1. Click Create Host again, name this host Kubernetes Cluster State, and add it to the Kubernetes group again.
  2. Let’s also attach the Kubernetes Cluster State template by HTTP. Again, we’re going to choose the proxy that we created earlier.
  3. In the Macro section, change the kube.api.url to the same thing we used before, but this time leave off the /api at the end. Simply: default.svc.cluster.local:443. Be sure to set the token as we did before.
  4. Assuming nothing else was changed in the installation of the helm chart, we can now add that host.

After a few minutes, you should receive metrics related to the cluster state, including hosts representing the kubelet on each node.

What’s Next?

Now you’re all set to start monitoring your Kubernetes cluster in Zabbix! Give it a try, and let us know your thoughts in the comments.

In the next blog post, we’ll look at what you can do with your newly monitored cluster and how to get the most out of it.

If you’d like help with any of this, ATS has advanced monitoring, orchestration, and automation skills to make this process a snap. Set up a 15-minute with our team to go through any questions you have.

About the Author

Michaela DeForest is a Platform Engineer for The ATS Group.  She is a Zabbix Certified Specialist on Zabbix 6.0 with additional areas of expertise, including Terraform, Amazon Web Services (AWS), Ansible, and Kubernetes, to name a few.  As ATS’s resident authority in DevOps, Michaela is critical in delivering cutting-edge solutions that help businesses improve efficiency, reduce errors, and achieve a faster ROI.

About ATS Group: The ATS Group provides a fully inclusive set of technology services and tools designed to innovate and transform IT.  Their systems integration, business resiliency, cloud enablement, infrastructure intelligence, and managed services help businesses of all sizes “get IT done.” With over 20 years in business, ATS has become the trusted advisor to nearly 500 customers across multiple industries.  They have built their reputation around honesty, integrity, and technical expertise unrivaled by the competition.

How to investigate and take action on security issues in Amazon EKS clusters with Amazon Detective – Part 2

Post Syndicated from Marshall Jones original https://aws.amazon.com/blogs/security/how-to-investigate-and-take-action-on-security-issues-in-amazon-eks-clusters-with-amazon-detective-part-2/

In part 1 of this of this two-part series, How to detect security issues in Amazon EKS cluster using Amazon GuardDuty, we walked through a real-world observed security issue in an Amazon Elastic Kubernetes Service (Amazon EKS) cluster and saw how Amazon GuardDuty detected each phase by following MITRE ATT&CK tactics.

In this blog post, we’ll walk you through investigative techniques to use with Amazon Detective, paired with the GuardDuty EKS and malware findings from the security issue. After we have identified impacted resources through our investigation, we’ll provide example remediation tactics and preventative controls to address and help prevent security issues in EKS clusters.

Amazon Detective can help you investigate security issues and related resources in your account. Detective provides EKS coverage that you can enable within your accounts. When this coverage is enabled, Detective can help investigate and remediate potentially unauthorized EKS activity that results from misconfiguration of the control plane nodes or application. Although GuardDuty is not a prerequisite to enable Detective, it is recommended that you enable GuardDuty to enhance the visualization capabilities in Detective with GuardDuty findings.

Prerequisites

You must have the following services enabled in your AWS account to generate and investigate findings associated with EKS security events in a similar manner as outlined in this blog. If you do not have GuardDuty enabled, you can still investigate with Detective, but in a limited capacity.

Investigate with Amazon Detective

In the five phases we walked through in part 1, we discussed GuardDuty findings and MITRE ATT&CK tactics that can help you detect and understand each phase of the unauthorized activity, from the initial misconfiguration to the impact on our application when the EKS cluster is used for crypto mining.

The next recommended step is to investigate the EKS cluster and any associated resources. Amazon Detective can help you to investigate whether there was any other related unauthorized activity in the environment. We will walk through Detective capabilities for visualizing and gathering important information to effectively respond to the security issue. If you’re interested in creating detailed incident response playbooks for your security team to follow in your own environment, refer to these sample AWS incident response playbooks.

Depending on your scenario, there are various resources you can use to start your investigation, such as Security Hub findings, GuardDuty findings, related Kubernetes subjects, or an AWS account’s AWS CloudTrail activity. For our walkthrough, we’ll start our investigation from the GuardDuty finding and use the EKS cluster resource to pivot to the Detective console, as shown in Figure 7. Although we initially focus on the EKS cluster, you could start from any entities that are supported in the Detective behavior graph structure in the Amazon Detective User Guide. For example, we could start directly with the Kubernetes subject system:anonymous and find activity associated with the anonymous user.

Figure 7: Example Detective popup from GuardDuty finding for EKS cluster

Figure 7: Example Detective popup from GuardDuty finding for EKS cluster

We’ll now go over the information that you would need to gather from Detective in order to investigate the example security issue.

To investigate EKS cluster findings with Detective

  1. In the GuardDuty console, navigate to an individual finding and hover over Investigate with Detective. Choose one of the specific resources to start. In the image below, we selected the EKS cluster resource to investigate with Detective. You will need to gather some preliminary information about the IAM roles associated with the EKS cluster.
    • Questions: When was the cluster created? What IAM role created the cluster? What IAM role is assigned to the cluster?
    • Why it matters: If you are an incident responder, these details can potentially help you identify the owner of the cluster and help you determine what IAM principals are involved.
    • What next: Start looking into each IAM principal’s activity, as seen in CloudTrail, to investigate whether the IAM entity itself is potentially compromised or what other resources may have been impacted.
    Figure 8: Detective summary page for EKS cluster metadata details

    Figure 8: Detective summary page for EKS cluster metadata details

  2. Next, on the EKS cluster overview page, you can see the container details associated with the cluster.
    • Question: What are some of the other container details for the cluster? Does anything look out of the ordinary? Is it using a public image? Is it missing a network policy?
    • Why it matters: Based on the architecture related to this cluster, you might be able to use this information to determine whether there are unauthorized containers. The contents of unauthorized containers will depend on your organization but typically consist of public images or unauthorized RBAC, pod security policies, or network policy configurations. It’s important to keep in mind that when you look at data in Detective, the scope time is very important. When you pivot from a GuardDuty finding, the scope time will be set to the first time the GuardDuty finding was seen to the last time the finding was seen. The container details reflect the containers that were running during the selected scope time. Changing the scope time might change the containers that are listed in the table shown in Figure 9.
    • What next: Information found on this page can help to highlight unauthorized resources or configurations that will need to be remediated. You will also need to look at how these resources were initially created and if there are missing guardrails that should have been created during the provisioning of the cluster.
    Figure 9: Detective summary page for EKS container metadata details

    Figure 9: Detective summary page for EKS container metadata details

  3. Finally, you will see associated security findings with this specific EKS cluster, similar to Figure 10, at the bottom of the EKS cluster overview page in Detective.
    • Question: Are there any other security findings associated with this cluster that I previously was not aware of?
    • Why it matters: In our example scenario, we walked through the findings that were initially detected and the events that unfolded from those findings. After further investigation, you might see other findings that were not part of the original investigation. This can occur if your security team is only investigating specific findings or severity values. The finding for PrivilegeEscalation:Kubernetes/PrivilegedContainer informs you that a privileged container was launched on your Kubernetes cluster by using an image that has never before been used to launch privileged containers in your cluster. A privileged container has root level access to the host. The other finding, Persistence:Kubernetes/ContainerWithSensitiveMount, informs you that a container was launched with a configuration that included a sensitive host path with write access in the volumeMounts section. This makes the sensitive host path accessible and writable from inside the container. Any finding associated to the suspicious or compromised cluster is valuable because it provides additional insight into what the unauthorized entity was trying to accomplish after the initial detection.
    • What next: With Detective, you might want to continue your investigation by selecting each of these findings and reviewing all details related to the finding. Depending on the findings, you could bring in additional team members to help investigate further. For this example, we will move on to the next step.
    Figure 10: Example Detective summary of security findings associated with the EKS cluster

    Figure 10: Example Detective summary of security findings associated with the EKS cluster

  4. Shift from the EKS cluster overview section to the Kubernetes API activity section, similar to Figure 11 below. This will give you the opportunity to dig into the API activity associated with this cluster.
    1. Question: What other Kubernetes API activity was attempted from the cluster? Which API calls were successful? Which API calls failed? What was the unauthorized user trying to do?
    2. Why it matters: It’s important to determine which actions were successfully invoked by the unauthorized user so that appropriate remediation actions can be taken. You can look at trends of successful and failed API calls, and can even search by Subject, IP address, or Kubernetes API call.
    3. What next: You might want to look at all cluster role binding from days before the first GuardDuty finding was seen to determine if there was any other suspicious activity you should be investigating regarding the cluster.
    Figure 11: Example Detective summary page for Kubernetes API activity on the EKS cluster

    Figure 11: Example Detective summary page for Kubernetes API activity on the EKS cluster

  5. Next, you will want to look at the Newly observed Kubernetes API calls section, similar to Figure 12 below.
    • Question: What are some of the more recent Kubernetes API calls? What are they trying to access right now and are they successful? Do I need to start taking action for other resources outside of EKS?
    • Why it matters: This data shows Kubernetes subjects who were observed issuing API calls to this cluster for the first time during our scope time. Detective provides you this information by keeping a baseline of the activity associated with supported AWS resources. This can help you more quickly determine whether activity might be suspicious and worth looking into. In our example, we used the search functionality to look at API calls associated with the built-in Kubernetes secrets management. A common way to start your search is to see if an unauthorized user has successfully accessed any secrets, which can help you determine what information you might want to search in the overall API call volume section discussed in step 4.
    • What next: If the unauthorized user has successfully accessed any secret, those secrets should be marked as compromised, and they should be rotated immediately.
    Figure 12: Example Detective summary for newly observed Kubernetes API calls from the EKS cluster

    Figure 12: Example Detective summary for newly observed Kubernetes API calls from the EKS cluster

  6. You can also consider the following question when you look at the Newly observed Kubernetes API calls section.
    • Question: Has the IP address associated with the finding been communicating with any other resources in our environment, and if so, what are the details of that communication?
    • Why it matters: To answer this question, you can use Detective’s search functionality and the ability to use wild cards to search for IP addresses with the same first three octets. Also note that you can use CIDR notation to search, as well. Based on the results in the example in Figure 13, you can see that there are a number of related IP addresses associated with the environment. With this information, you now can look at the traffic associated with these different IPs and what resources they were communicating with.
    Figure 13: Example Detective results page from a query against IP addresses associated with the EKS cluster

    Figure 13: Example Detective results page from a query against IP addresses associated with the EKS cluster

  7. You can select one of the IP addresses in the search results to get more information related to it, similar to Figure 14 below.
    1. Question: What was the first time an IP address was observed in the environment? When was the last time it was observed?
    2. Why it matters: You can use this information to start isolating where unauthorized activity is coming from and what actions are being taken. You can also start creating a time series of unauthorized activity and scope.
    3. What next: You can repeat some of the previous investigation steps for each IP address, like looking at the different tabs to review New behavior, Resource interaction, and Kubernetes activity.
    Figure 14: Example Detective results page for specific IP address and associated metadata details

    Figure 14: Example Detective results page for specific IP address and associated metadata details

In summary, we began our investigation with a GuardDuty finding about an anonymous API request that was successful in using system:anonymous on one of our EKS clusters. We then used Detective to investigate and visualize activity associated with that EKS cluster, such as volume of successful or unsuccessful API requests, where and when those actions were attempted and other security findings associated with the resource. Once we have completed the investigation, we can confirm scope and impact of the security event and start moving towards taking action.

Remediation techniques for Amazon EKS

In this section, we will focus on how to remediate the security issue in our example. Your actions will vary based on your organization and the resources affected. It’s important to note that these actions will impact the EKS cluster and associated workloads, and should accordingly be performed by or coordinated with the cluster operator.

Before you take action on the EKS cluster, you will need to preserve forensic artifacts and evidence for the impacted EKS resources. The order of operations for these actions matters, because you want to get all the data from forensic artifacts in order to determine the overall impact to the resources affected. If you quarantine resources before you capture forensic artifacts, there is a risk that running processes will be interrupted or that the malware attempts to destroy resources that are valuable to a forensics investigation, to cover its tracks.

To preserve forensic evidence

  1. Enable termination protection on the impacted worker node and change the shutdown behavior to Stop.
  2. Label the offending pod or node with a label indicating that it is part of an active investigation.
  3. Cordon the worker node.
  4. Capture both volatile (temporary memory) and non-volatile (Amazon EBS snapshots) artifacts on the worker node.

Now that you have the forensic evidence, you can start to quarantine your EKS resources to restrict unauthorized network communication. The main objective is to prevent the affected EKS pods from communicating with internal resources or exfiltrating data externally.

To quarantine EKS resources

  1. Isolate the pod by creating a network policy that denies ingress and egress traffic to the pod.
  2. Attach a security group to the host and remove inbound and outbound rules. Take this action if you believe the underlying host has been compromised.

    Depending on existing inbound and outbound rules on the security group, the connections will either be tracked or untracked. Applying an isolation security group will drop untracked connections. For tracked connections, new connections with the host will not be allowed from the isolation security group, but existing tracked connections will not be interrupted.

    Important: This action will affect all containers running on the host.

  3. Attach a deny rule for the EKS resources in a network access control list (network ACL). Because network ACLs are stateless firewalls, all connections will be interrupted, whether they are tracked or untracked connections.

    Important: This action will affect all subnets using the network ACL and all resources within those subnets.

At this point, the affected EKS resources are quarantined, but the cluster is still configured to allow anonymous, unauthenticated access. You will need to remove all unauthorized permissions that were created or added.

To remove unauthorized permissions

  1. Update the RBAC configuration to remove system:anonymous access.
  2. Revoke temporary security credentials that are assigned to the pod or worker node, if necessary. You can also remove the IAM role associated with the EKS resources.

    Note: Removing IAM policies or attaching IAM policies to restrict permissions will affect the resources that are using the IAM role.

  3. Remove any unauthorized ClusterRoleBinding created by the system:anonymous user.
  4. Redeploy the compromised pod or workload resource.

The actions taken so far primarily target the EKS resource, but based on our Detective investigation, there are other actions you might need to take. Because secrets were involved that could be used outside of the EKS cluster, those secrets will need to be rotated wherever they are referenced. Detective will also suggest additional areas where you can investigate and remediate additional unauthorized activity in your AWS account.

It is important that your team go through game days or run-throughs for investigating and responding to different scenarios in order to make sure the team is prepared. You can run through the EKS security workshop to get your security team more familiar with remediation for EKS.

For more information about responding to EKS cluster related security issues, refer to GuardDuty EKS remediation in the GuardDuty User Guide and the EKS Best Practices Guide.

Preventative controls for EKS

This section covers several preventative controls that you can use to protect EKS clusters.

How can I prevent external access to the EKS cluster?

To help prevent external access to your EKS clusters, limit the exposure of your API server. You can achieve that in two ways:

  1. Set the API server endpoint access to Private. This will effectively forbid anyone outside of the VPC to send Kubernetes API requests to your EKS cluster.
  2. Set an IP address allow list for the EKS cluster public access endpoint.

How can I prevent giving admin access to the EKS cluster?

To help prevent an EKS cluster user from granting any type of access to anonymous or unauthenticated users, you can set up a ValidatingAdmissionWebhook. This is a special type of Kubernetes admission controller that can be configured in the Kubernetes API. (To learn how to build serverless admission webhooks, see the blog post Building serverless admission webhooks for Kubernetes with AWS SAM.)

The ValidatingAdmissionWebhook will deny a Kubernetes API request that matches all of the following checks:

  1. The request is creating or modifying a ClusterRoleBinding or RoleBinding.
  2. The subjects section contains either of the following:
    • The user system:anonymous
    • The group system:unauthenticated

How can I prevent malicious images from being deployed?

Now that you have set controls to prevent external access to the EKS cluster and prevent granting access to anonymous users, you can focus on preventing the deployment of potentially malicious images.

Malicious container images can have different origins, including:

  1. Images stored in public or unauthorized registries
  2. Images replacing the ones that are stored in authorized registries
  3. Authorized images that contain software with existing or newly discovered vulnerabilities

You can address these sources of malicious images by doing the following:

  1. Use admission controllers to verify that images meet your organization’s requirements, including for the image origin. You can also refer to this this blog post to implement a solution with a webhook and admission controllers.
  2. Enable tag immutability in your registry, a control that prevents an actor from maliciously replacing container images without changing the image’s tags. Additionally, you can enable an AWS Config rule to check tag immutability
  3. Configure another ValidatingAdmissionWebhook that will only accept images if they meet all of the following criteria.
    1. Images that come from approved registries.
    2. Images that pass the vulnerability scan during deployment time.
    3. Images that are signed by a trusted party. Amazon Elastic Container Registry (Amazon ECR) is working on a product enhancement to store image signatures. Currently, you can use an open-source cosign tool to verify and store image signatures.

      Note: These criteria can vary based on your use case and internal security and compliance standards.

The above controls will help prevent the deployment of a vulnerable, unauthorized, or potentially malicious container image.

How can I prevent lateral movement inside the cluster?

To prevent lateral movement inside the cluster, it is recommended to use network policies, as follows:

  • Enforce Kubernetes network policies to enforce ingress and egress controls within the cluster. You can implement these policies by following the steps in the Securing your cluster with network policies EKS workshop.

It’s important to note that you could use security groups for the same purpose, but pod security groups should only be used if the cluster is compromised and when you want to control the traffic between a pod and a resource that resides in the VPC, not inter-pod traffic.

In this section, we’ve reviewed different preventative controls that could have helped mitigate our example security incident. With the first preventative control, we could have prevented external actors from connecting to the API server. The second control could have prevented granting access to anonymous users. The third control could have prevented the deployment of an unauthorized or vulnerable container image. Finally, the fourth control could have helped limit the impact of the deployed vulnerable images to only the pods where the images were deployed, making it harder to laterally move to other pods in the cluster.

Conclusion

In this post, we walked you through how to investigate an EKS cluster related security issue with Amazon Detective. We also provided some recommended remediation and preventative controls to put in place for the EKS cluster specific security issues. When pairing GuardDuty’s ability for continuous threat detection and monitoring with Detective’s organization and visualization capabilities, you enable your security team to conduct faster and more effective investigation. By providing the security team the ability quickly view an organized set of data associated with security events within your AWS account, you reduce the overall Mean Time to Respond (MTTR).

Now that you understand the investigative capabilities with Detective, it’s time to try things out! It is important that you provide a mechanism for your security team to practice detection, investigation, and remediation techniques using security incident response simulations. By periodically running simulations, your security team will be prepared to quickly respond to possible security events. You can find more detailed incident response playbooks that can assist you in preparing for events in your environment, see these sample AWS incident response playbooks.

If you have feedback about this post, submit comments in the Comments section below. If you have questions about this post, start a thread on Amazon GuardDuty re:Post.

Want more AWS Security news? Follow us on Twitter.

Author

Marshall Jones

Marshall is a worldwide senior security specialist solutions architect at AWS. His background is in AWS consulting and security architecture, focused on a variety of security domains including edge, threat detection, and compliance. Today, he helps enterprise customers adopt and operationalize AWS security services to increase security effectiveness and reduce risk.

Jonathan Nguyen

Jonathan Nguyen

Jonathan is a shared delivery team senior security consultant at AWS. His background is in AWS security, with a focus on threat detection and incident response. He helps enterprise customers develop a comprehensive AWS security strategy, deploy security solutions at scale, and train customers on AWS security best practices.

Manuel Martinez Arizmendi

Manuel Martinez Arizmendi

Manuel works a Security Engineer at Amazon Detective providing new security investigation capabilities to AWS customers. Based on Boston,MA and originally from Madrid, Spain, when he’s not at work, he enjoys playing and watching soccer, playing videogames, and hanging out with his friends.

Journey to adopt Cloud-Native DevOps platform Series #1: OfferUp modernized DevOps platform with Amazon EKS and Flagger to accelerate time to market

Post Syndicated from Purna Sanyal original https://aws.amazon.com/blogs/devops/journey-to-adopt-cloud-native-devops-platform-series-1-offerup-modernized-devops-platform-with-amazon-eks-and-flagger-to-accelerate-time-to-market/

In this two part series, we discuss the challenges faced by OfferUp, a Digital Native customer, to meet business growth and time-to-market. Their journey involved modernizing their existing DevOps platform, from the traditional monolith virtual machine (VM) based architecture to modern containerized architecture and running cloud-native applications for secured progressive delivery to accelerate time to market. This series will provide strategies, architecture patterns, and technical steps you can adopt to become more agile and innovative like OfferUp has.

OfferUp engineers were using the homegrown DevOps platform to build and release new services on the marketplace platform. In this first post, we discuss the key challenges encountered by OfferUp engineers with the existing DevOps platform, as well as how OfferUp modernized its DevOps platform with Amazon Elastic Kubernetes Service (Amazon EKS) and Flagger, automating production releases with progressive delivery techniques for faster time-to-market with new products and services. Amazon EKS is a managed container service to run and scale Kubernetes applications in the cloud or on-premises.

Previous DevOps architecture

OfferUp is a leading online and mobile customer to customer (C2C) marketplace where users can both buy and sell goods on the platform. Users can browse and purchase products from a broad range of categories, including furniture, clothing, sports equipment, toys, and many more. As a mobile-first company, OfferUp puts a great deal of emphasis on in-person communication between buyers and sellers.

OfferUp built a home grown, self-managed DevOps platform. This platform used a set of manual processes and third-party applications that allows both developers and operations engineers to build and deploy code to a production environment. The DevOps pipeline included topic areas such as source code control, continuous integration/continuous delivery (CI/CD), microservices, as well as development and test Methodologies. The following diagram depicts the previous architecture of OfferUp’s DevOps platform, which was self-managed on Amazon Elastic Compute Cloud (Amazon EC2).

Figure 1: Previous DevOps architecture of OfferUp

OfferUp used GitHub for code repositories. Once the source code was committed in the code repository, Jenkins pulled the source code from code repositories on a scheduled or on-demand basis and built Amazon Machine Images (AMI). The built image was deployed in production by a  custom built deployment tool, Vanaheim, which supports one-box canary deployment and full roll-out deployment strategies. The DevOps engineers used to manually create a deployment job in the Vanaheim portal and then manually monitor the test success rate and service metrics to detect any impact from the deployment. Once the success rate was reached, a full production roll out was performed from the Vanaheim portal.

Key challenges with previous DevOps pipeline

In 2020, OfferUp experienced significant transaction volume growth on its Marketplace platform with the increase of its user base. With OfferUp’s acquisition of LetGo in 2020, there was a need to build a scalable DevOps platform to support future integration and organic growth. The previous DevOps platform, designed and deployed over seven years ago, had reached the limits of its scalability, and could no longer keep up with the platform’s growth. The previous architecture was expensive to run and had a complex infrastructure that made it difficult to upgrade and add new features.

The following key factors drove the push for modernization:

  • Manual verification was required to check if the code was correctly deployed in one of the servers in production, and if the deployment was right in one server, then it was rolled out to other production servers. Full Rollout to production wasn’t automated due to frequent failures requiring manual rollbacks.
  • The previous platform required a longer deployment time (1–2 hours) due to the authoritative batch process, which sometimes caused delays in releasing and testing of new features.
  • The self-managed nature of the Jenkins and Vanaheim clusters was consuming far too much engineering time. Most of the institutional knowledge of this legacy platform was lost over the years and it didn’t align with OfferUp’s philosophy of small DevOps engineering teams. Innovation had stalled partly due to the difficulty of simultaneously upgrading the DevOps platform and releasing new features.

DevOps platform automation with Flagger and Gloo Ingress Controller on Amazon EKS

A key requirement for the next-generation system was that the new architecture would reduce the operational burden on engineering teams, deployment lifecycle, and total cost of ownership. OfferUp evaluated multiple managed container orchestration platforms for its DevOps Platform. It finally selected Amazon EKS for high availability, reducing the average time to deploy a change to the stack from hours to just a few minutes and reducing the complexity in managing and upgrading the Kubernetes cluster. On the Amazon EKS platform, OfferUp uses Flagger, a progressive delivery tool that automates the release process for applications running on Kubernetes. Flagger implements several deployment strategies (Canary releases, A/B testing, and Blue/Green mirroring) using the Gloo Edge ingress controller for traffic routing. Datadog is used as an observability service for monitoring the health of the deployments and effectively managing the canary to progressive delivery. For release analysis, Flagger runs a query on Datadog logs and uses Slack for alerting and notifications. The cloud native technology components of the architecture are described as follows:

Kubernetes and Amazon EKS – Kubernetes is an open-source system for automating the deployment, scaling, and management of containerized applications. Kubernetes is a graduate project in the CNCF. Amazon EKS is a fully-managed, certified Kubernetes conformant service that simplifies the process of building, securing, operating, and maintaining Kubernetes clusters on AWS. Amazon EKS integrates with core AWS services, such as Amazon CloudWatch, Auto Scaling Groups, and AWS Identity and Access Management (IAM) to provide a seamless experience for monitoring, scaling, and load balancing your containerized applications.

Helm – Helm manage Kubernetes applications. Helm Charts define, install, and upgrade even the most complex Kubernetes application. Charts are easy to create, version, share, and publish. If Kubernetes were an operating system, then Helm would be the package manager. Helm is a graduate project in the CNCF and is maintained by the Helm community.

Flagger – Flagger is a progressive delivery tool that automates the release process for applications running on Kubernetes. Flagger implements a control loop that gradually shifts traffic to the canary while measuring key performance indicators such as HTTP requests success rate, requests average duration, and pods health. Based on the set thresholds, a canary is either promoted or aborted and its analysis is pushed to a Slack channel. Flagger became a CNCF project – part of the Flux family of GitOps tools.

Gloo EdgeGloo Edge is a feature-rich, Kubernetes-native ingress controller. Gloo Edge is exceptional in its function-level routing; its support for legacy apps, microservices, and serverless; its discovery capabilities; and its tight integration with leading open-source projects. Gloo Edge is uniquely designed to support hybrid applications, in which multiple technologies, architectures, protocols, and clouds can coexist.

Observability platformDatadog’s integrations with Kubernetes, Docker, and AWS will let you track the full range of Amazon EKS metrics, as well as logs and performance data from your cluster and applications. Datadog gives you comprehensive coverage of your dynamic infrastructure and applications with features like auto discovery to track services across containers, sophisticated graphing, and alerting options.

Modernized DevOps architecture

In the new architecture, OfferUp uses Github as a version control tool and Github actions as their CI/CD tool. On every Pull request, tests are run, artifacts are built and stored in the JFrog Artifactory, and docker Images are stored in the Amazon Elastic Container Registry (Amazon ECR). Separate deployment pipelines are triggered based on the environment (dev, staging, and production) of choice. Flagger detects any changes in the version of the application and gradually shifts production traffic to the canary. It measures the requests success rate and average response duration metrics from Datadog to decide full rollout in production. For an application deployment, a canary promotion can be defined using Flagger’s custom resource. Flagger rolls back the deployment when the success rate falls below the defined desired success rate metrics.

Figure 2: Modernized DevOps architecture of OfferUp

With the modernized DevOps platform, OfferUp moved from monolithic to microservice architecture where  front-end applications and GraphQL runs on the Amazon EKS cluster. The production cluster runs 110 services and 650+ pods on 60 nodes. The cluster scales up to 100 nodes with Amazon Auto Scaling group based on the traffic pattern. On the networking front, the cluster has a private endpoint and uses both VPC CNI plugin, and the CoreDNS add-on. There are four Amazon EKS clusters, one each for the production, test, utility, and the staging environments. OfferUp has a plan to explore Karpenter open-source autoscaling project, and it will move new applications to the Amazon EKS cluster, allowing the total node counts to scale up to 200.

Benefits of modernized architecture

The new architecture helped OfferUp make  automated decisions to deploy new releases and improve the time to market while reducing unplanned production downtime

  • Faster deployments and Quicker rollbacks – The new architecture reduces the Service Deployment time from one hour down to five minutes, and automates rollback time to five minutes from the manual rollback time of one hour.
  • Automate deployment of new releases – The lack of canary deployment processes in the previous architecture required OfferUp engineers to manually intervene to validate the deployment status, which led to administrative overhead and production outages. The canary deployments take care of the traffic shifting by automatically measuring the requests’ success rate and latency metrics from Datadog and subsequently release the service to production. Deployments are automatically rolled back when the success rate falls below the defined success rate metric thresholds.
  • Simplified Configuration – Configuration has been simplified drastically and integrated within the CI/CD pipeline in the new architecture, thereby reducing configuration complexity, eliminating manual processes, and saving Developers time.
  • More time to Focus on Innovation – With fully automated progressive delivery, the developers no longer need to spend time testing and releasing source code in production. Similarly, migrating from a Self-managed DevOps platform to the Managed Amazon EKS services lowered the DevOps platform’s infrastructure management burden on the engineering team. This helps developers spend more time focusing on building and testing new features and innovations.
  • Cost reduction – Moving from self-managed Amazon EC2-based architecture to the Amazon EKS cluster reduced the cost of operations through shared nodes and improved pod density. The previous architecture was using 200 nodes of Amazon EC2 instances. The same workload was moved to a 50 nodes Amazon EKS cluster. Furthermore, custom applications (Vanaheim and Jenkins) were retired, further reducing the costs.

Conclusion

In this post, you see how OfferUp embarked on the journey to modernize its DevOps platform to support its growth and developers’ velocity. The key factors that drove the modernization decisions were the ability to scale the platform to support the automated testing of features in production, the faster release of new features, cost reduction, and to facilitate future innovation. The modernized DevOps platform on Amazon EKS also decreased the ongoing operational support burden for engineers, and the scalability of the design opens up a lot of headroom for growth.

We encourage you to look into modernizing your existing CI/CD pipeline on Amazon EKS with the Flagger progressive delivery mechanism. Amazon EKS removes the undifferentiated heavy lifting of managing and updating the Kubernetes cluster. Managed node groups automate the provisioning and lifecycle management of worker nodes in an Amazon EKS cluster, which greatly simplifies operational activities, such as new Kubernetes version deployments.

In the next part of the series, you’ll discover how to implement Flagger and Gloo Edge Ingress Controller on Amazon EKS to automate the release process for applications running on Kubernetes.

Further Reading

Journey to adopt Cloud-Native DevOps platform Series #2: Progressive delivery on Amazon EKS with Flagger and Gloo Edge Ingress Controller

About the authors:

Purna Sanyal

Purna Sanyal is a technology enthusiast and an architect at AWS, helping digital native customers solve their business problems with successful adoption of cloud native architecture. He provides technical thought leadership, architecture guidance, and conducts PoCs to enable customers’ digital transformation. He is also passionate about building innovative solutions around Kubernetes, database, analytics, and machine learning.

Alan Liu

Alan Liu is Sr Director of Engineering at OfferUp. He is a technology enthusiast and he worked across a wide variety of industry. He is highly effective, adaptable, scalable, experienced leader with a proven record.

New – Amazon ECS Service Connect Enabling Easy Communication Between Microservices

Post Syndicated from Channy Yun original https://aws.amazon.com/blogs/aws/new-amazon-ecs-service-connect-enabling-easy-communication-between-microservices/

Microservices architectures are a well-known software development approach to make applications composed of small independent services that communicate over well-defined application programming interfaces (APIs). Customers faced challenges when they started breaking down their monolith applications into microservices, as it required specialized networking knowledge to communicate internally with other microservices.

Amazon Elastic Container Services (Amazon ECS) customers have several solutions for service-to-service, but each one comes with some challenges and complications: 1) Elastic Load Balancing (ELB) needs to carefully plan for configuring infrastructure for high availability and incur additional infrastructure cost. 2) Using Amazon ECS Service Discovery often requires developers to write custom application code for collecting traffic metrics and for making network calls resilient. 3) Service mesh solutions such as AWS App Mesh run outside of Amazon ECS despite having advanced traffic monitoring and routing features between services.

Today, we are announcing the general availability of Amazon ECS Service Connect, a new capability that simplifies building and operating resilient distributed applications. ECS Service Connect provides an easy network setup and seamless service communication deployed across multiple ECS clusters and virtual private clouds (VPCs). You can add a layer of resilience to your ECS service communication and get traffic insights with no changes to your application code.

With ECS Service Connect, you can refer and connect to your services by logical names using a namespace provided by AWS Cloud Map and automatically distribute traffic between ECS tasks without deploying and configuring load balancers. You can set some safe defaults for traffic resilience, such as health checking, automatic retries for 503 errors, and connection draining, for each of your ECS services. Additionally, the Amazon ECS console provides easy-to-use dashboards with real-time network traffic metrics for operational convenience and simplified debugging.

Getting Started with Amazon ECS Service Connect
To get started with the ECS Service Connect, you can specify a namespace as part of creating an ECS cluster or create one in the Cloud Map. A namespace represents a way to structure your services and can span across multiple ECS clusters residing in different VPCs. All ECS services that belong to a specific namespace can communicate with existing services in the namespaces, provided existing network-level connectivity.

You can also see a list of Cloud Map namespaces in Namespaces in the left navigation pane of the Amazon ECS console. When you select a namespace, it shows a list of services with the same namespace from two different ECS clusters with database services (db-mysql, db-redis) and backend services (webui, appserver).

When you create an ECS cluster, you can select one of the namespaces in the Default namespaces of the Networking setting. ECS Service Connect is enabled for all new ECS services running in both AWS Fargate and Amazon EC2 instances. To enable all existing services, you would need to redeploy with either a new version of ECS-optimized Amazon Machine Image (AMI), or with a new Fargate Agent that supports ECS Service Connect.

Or, you can simply create a cluster via AWS Command Line Interface (AWS CLI) with serviceConnect parameter and a default Cloud Map namespace name for service discovery purposes.

$ aws ecs create-cluster
     --cluster "svc-cluster-2"
     --serviceConnect {
       "defaultNamespace": "svc-namespace"
}

This command will create an ECS cluster with the namespace on AWS’s behalf. If you would like to use an already existing Cloud Map namespace, you can simply pass the name of the existing namespace here.

Next, let’s create a service with a task definition and expose your web user-interface server using ECS Service Connect.

$ aws ecs create-service
--cluster "svc-cluster-2"
--service-name "webui"
--task-definition "webui-svc-cluster"
--serviceConnect {
  "enabled": true,
  "namespace": "svc-namespace",
  "services":
   [
      {
         "portName": "webui-port",
         "discoveryName": "webui-svc",
         "clientAliases": [
           {
              "port": 80, // *Required *//
              "dnsName": "webui-svc-domain" // * Optional *//
            }
        }
     ]
   ]
}

In this command, portName represents a reference to the container port, and clientAliases assigns the port number and DNS name, overriding the discovery name that is used in the endpoint. Each service has an endpoint URL that contains the protocol, a DNS name, and the port. You can select the protocol and port name in the task definition or the ECS service configuration. For example, an endpoint could be http://webui:80, grpc://appserver:8080, or http://db-redis:8888.

In the ECS console, you can see this configuration of ECS Service Connect for the webui service in the svc-cluster-2 cluster.

As you can see, you can run the same workloads across different clusters with the same clientAlias and namespace name for high availability. ECS Service Connect will intelligently load balance the traffic to the ECS tasks. To connect to services running in different ECS clusters, you need to specify the same namespace name for all your ECS services that need to talk to each other. ECS Service Connect will make your services discoverable to all other services in the same namespace.

Improving Service Resilience with Observability Data
You can collect traffic metrics with ECS Service Connect observability capabilities. By default, for each ECS service, you can see the number of healthy and unhealthy endpoints, along with inbound and outbound traffic volume.

ECS Service Connect supports HTTP/1, HTTP/2, gRPC, and TCP protocols. So, you can collect the number of requests, number of HTTP errors, and average call latency. For gRPC and TCP, you can see the total number of active connections. All of these metrics are pushed to Amazon CloudWatch or other AWS analytics services via custom log routing

In the Advanced menu, you can publish ECS Service Connect Agent logs for help in debugging in case of issues.

These metrics are only visible in the original interface of the CloudWatch console. When you use the CloudWatch console, switch to the original interface to see the additional metric dimensions of “discovery name” and “target discovery name” under the ECS grouping.

The default settings provide you with a starting point for building resilient applications, and you can fine-tune parameters to limit the impact of failures, latency spikes, and network fluctuations on your application behavior using AWS Management Console or dedicated ECS APIs.

Now Available
Amazon ECS Service Connect is available in all commercial Regions, except China, where Amazon ECS is available. ECS Service Connect is fully supported in AWS CloudFormation, AWS CDK, AWS Copilot, and AWS Proton for infrastructure provisioning, code deployments, and monitoring of your services. To learn more, see the Amazon ECS Service Connect Developer Guide.

My colleagues, Hemanth AVS, Senior Container Specialist SA, and Satya Vajrapu, Senior DevOps Consultant, prepared a hands-on workshop to demonstrate an example of the ECS Service Connect. Join CON303 Networking, service mesh, and service discovery with Amazon ECS when you attend AWS re:Invent 2022.

Give it a try, and please send feedback to AWS re:Post for Amazon ECS or through your usual AWS support contacts.

Channy

How to detect security issues in Amazon EKS clusters using Amazon GuardDuty – Part 1

Post Syndicated from Marshall Jones original https://aws.amazon.com/blogs/security/how-to-detect-security-issues-in-amazon-eks-clusters-using-amazon-guardduty-part-1/

In this two-part blog post, we’ll discuss how to detect and investigate security issues in an Amazon Elastic Kubernetes Service (Amazon EKS) cluster with Amazon GuardDuty and Amazon Detective.

Amazon Elastic Kubernetes Service (Amazon EKS) is a managed service that you can use to run and scale container workloads by using Kubernetes in the AWS Cloud, which can help increase the speed of deployment and portability of modern applications. Amazon EKS provides secure, managed Kubernetes clusters on the AWS control plane by default. Kubernetes configurations such as pod security policies, runtime security, and network policies and configurations are specific for your organization’s use-case and securing them adequately would be a customer’s responsibility within AWS’ shared responsibility model.

Amazon GuardDuty can help you continuously monitor and detect suspicious activity related to AWS resources in your account. GuardDuty for EKS protection is a feature that you can enable within your accounts. When this feature is enabled, GuardDuty can help detect potentially unauthorized EKS activity resulting from misconfiguration of the control plane nodes or application.

In this post, we’ll walk through the events leading up to a real-world security issue that occurred due to EKS cluster misconfiguration, discuss how those misconfigurations could be used by a malicious actor, and how Amazon GuardDuty monitors and identifies suspicious activity throughout the EKS security event. In part 2 of the post, we’ll cover Amazon Detective investigation capabilities, possible remediation techniques, and preventative controls for EKS cluster related security issues.

Prerequisites

You must have AWS GuardDuty enabled in your AWS account in order to monitor and generate findings associated with an EKS cluster related security issue in your environment.

EKS security issue walkthrough

Before jumping into the security issue, it is important to understand how the AWS shared responsibility model applies to the Amazon EKS managed service. AWS is responsible for the EKS managed Kubernetes control plane and the infrastructure to deliver EKS in a secure and reliable manner. You have the ability to configure EKS and how it interacts with other applications and services, where you are responsible for making sure that secure configurations are being used.

The following scenario is based on a real-world observed event, where a malicious actor used Kubernetes compromise tactics and techniques to expose and access an EKS cluster. We use this example to show how you can use AWS security services to identify and investigate each step of this security event. For a security event in your own environment, the order of operations and the investigative and remediation techniques used might be different. The scenario is broken down into the following phases and associated MITRE ATT&CK tactics:

  • Phase 1 – EKS cluster misconfiguration
  • Phase 2 (Discovery) – Discovery of vulnerable EKS clusters
  • Phase 3 (Initial Access) – Credential access to obtain Kubernetes secrets
  • Phase 4 (Persistence) – Impact to persist unauthorized access to the cluster
  • Phase 5 (Impact) – Impact to manipulate resources for unauthorized activity

Phase 1 – EKS cluster misconfiguration

By default, when you provision an EKS cluster, the API cluster endpoint is set to public, meaning that it can be accessed from the internet. Despite being accessible from the internet, the endpoint is still considered secure because it requires all API requests to be authenticated by AWS Identity and Access Management (IAM) and then authorized by Kubernetes role-based access control (RBAC). Also, the entity (user or role) that creates the EKS cluster is automatically granted system:masters permissions, which allows the entity to modify the EKS cluster’s RBAC configuration.

This example scenario starts with a developer who has access to administer EKS clusters in an AWS account. The developer wants to work from their home network and doesn’t want to connect to their enterprise VPN for IAM role federation. They configure an EKS cluster API without setting up the proper authentication and authorization components. Instead, the developer grants explicit access to the system:anonymous user in the cluster’s RBAC configuration. (Alternatively, an unauthorized RBAC configuration could be introduced into your environment after a developer unknowingly installs a malicious helm chart from the internet without reviewing or inspecting it first.)

In Kubernetes anonymous requests, unauthenticated and unrejected HTTP requests are treated as anonymous access and are identified as a system:anonymous user belonging to a system:unauthenticated group. This means that any entity on the internet can access the cluster and make API requests that are permitted by the role. There aren’t many legitimate use cases for this type of activity, because it’s considered a best practice to use RBAC instead. Anonymous requests are primarily used for setting up health endpoints and custom authentication.

By monitoring EKS audit logs, GuardDuty identifies this activity and generates the finding Policy:Kubernetes/AnonymousAccessGranted, as shown in Figure 1. This finding informs you that a user on your Kubernetes cluster successfully created a ClusterRoleBinding or RoleBinding to bind the user system:anonymous to a role. This action enables unauthenticated access to the API operations permitted by the role.

Figure 1: Example GuardDuty finding for Kubernetes anonymous access granted

Figure 1: Example GuardDuty finding for Kubernetes anonymous access granted

Phase 2 (Discovery) – Discovery of vulnerable EKS clusters

Port scanning is a method that malicious actors use to determine if resources are publicly exposed, with open ports and known vulnerabilities. As an increasing number of open-source tools allows users to search for endpoints connected to the internet, finding these endpoints has become even easier. Security teams can use these open-source tools to their advantage by proactively scanning for and identifying externally exposed resources in their organization.

This brings us to the discovery phase of our misconfigured EKS cluster. The discovery phase is defined by MITRE as follows: “Discovery consists of techniques an adversary may use to gain knowledge about the system and internal network. These techniques help adversaries observe the environment and orient themselves before deciding how to act.”

By granting system:anonymous access to the EKS cluster in our example, the developer allowed requests from any public unauthenticated source. This can result in external web crawlers probing the cluster API, which can often happen within seconds of the system:anonymous access being granted. GuardDuty identifies this activity and generates the finding Discovery:Kubernetes/SuccessfulAnonymousAccess, as shown in Figure 2. This finding informs you that an API operation to discover resources in a cluster was successfully invoked by the system:anonymous user. Remember, all API calls made by system:anonymous are unauthenticated, in addition to /healthz and /version calls that are always unauthenticated regardless of the user identity, and any entity can make use of this user within the EKS cluster.

In the screenshot, under the Action section in the finding details, you can see that the anonymous user made a get request to “/”. This is a generic request that is not specific to a Kubernetes cluster, which may indicate that the crawler is not specifically targeting Kubernetes clusters. You can further see that the Status code is 200, indicating that the request was successful. If this activity is malicious, then the actor is now aware that there is an exposed resource.

Figure 2: Example GuardDuty finding for Kubernetes successful anonymous access

Figure 2: Example GuardDuty finding for Kubernetes successful anonymous access

Phase 3 (Initial Access) – Credential access to obtain Kubernetes secrets

Next, in this phase, you might start observing more targeted API calls for establishing initial access from unauthorized users. MITRE defines initial access as “techniques that use various entry vectors to gain their initial foothold within a network. Techniques used to gain a foothold include targeted spearphishing and exploiting weaknesses on public-facing web servers. Footholds gained through initial access may allow for continued access, like valid accounts and use of external remote services, or may be limited-use due to changing passwords.”

In our example, the malicious actor has established initial access for the EKS cluster which is evident in the next GuardDuty finding, CredentialAccess:Kubernetes/SuccessfulAnonymousAccess, as shown in Figure 3. This finding informs you that an API call to access credentials or secrets was successfully invoked by the system:anonymous user. The observed API call is commonly associated with the credential access tactic where an adversary is attempting to collect passwords, usernames, and access keys for a Kubernetes cluster.

You can see that in this GuardDuty finding, in the Action section, the Request uri is targeted at a Kubernetes cluster, specifically /api/v1/namespaces/kube-system/secrets. This request seems to be targeting the secrets management capabilities that are built into Kubernetes. You can find more information about this secrets management capability in the Kubernetes documentation.

Figure 3: Example GuardDuty finding for Kubernetes successful credential access from anonymous user

Figure 3: Example GuardDuty finding for Kubernetes successful credential access from anonymous user

Phase 4 (Persistence) – Impact to persist unauthorized access to the cluster

The next phase of this scenario is likely to be an impact in the EKS cluster to enable persistence by the malicious actor. MITRE defines impact as “techniques that adversaries use to disrupt availability or compromise integrity by manipulating business and operational processes.” Following the MITRE definitions, “Persistence consists of techniques that adversaries use to keep access to systems across restarts, changed credentials, and other interruptions that could cut off their access. Techniques used for persistence include any access, action, or configuration changes that let them maintain their foothold on systems, such as replacing or hijacking legitimate code or adding startup code.”

In the GuardDuty finding Impact:Kubernetes/SuccessfulAnonymousAccess, shown in Figure 4, you can see the Kubernetes user details and Action sections that indicate that a successful Kubernetes API call was made to create a ClusterRoleBinding by the system:anonymous username. This finding informs you that a write API operation to tamper with resources was successfully invoked by the system:anonymous user. The observed API call is commonly associated with the impact stage of an attack, when an adversary is tampering with resources in your cluster. This activity shows that the system:anonymous user has now created their own role to enable persistent access the EKS cluster. If the user is malicious, they can now access the cluster even if access is removed in the RBAC configuration for the system:anonymous user.

Figure 4 Example GuardDuty finding for Kubernetes successful credential change by anonymous user

Figure 4 Example GuardDuty finding for Kubernetes successful credential change by anonymous user

Phase 5 (Impact) – Impact to manipulate resources for unauthorized activity

The fifth phase of this scenario is where the unauthorized user is likely to focus on impact techniques in order to use the access for malicious purpose. MITRE says of the impact phase: “Techniques used for impact can include destroying or tampering with data. In some cases, business processes can look fine, but may have been altered to benefit the adversaries’ goals. These techniques might be used by adversaries to follow through on their end goal or to provide cover for a confidentiality breach.” Typically, once a malicious actor has access into a system, they will introduce malware to the system to manipulate the compromised resource and possibly also other resources.

With the introduction of GuardDuty Malware Protection, when an Amazon Elastic Compute Cloud (Amazon EC2) or container-related GuardDuty finding that indicates potentially suspicious activity is generated, an agentless scan on the volumes will initiate and detect the presence of malware. Existing GuardDuty customers need to enable Malware Protection, and for new customers this feature is on by default when they enable GuardDuty for the first time. Malware Protection comes with a 30-day free trial for both existing and new GuardDuty customers. You can see a list of findings that initiates a malware scan in the GuardDuty User Guide.

In this example, the malicious actor now uses access to the cluster to perform unauthorized cryptocurrency mining. GuardDuty monitors the DNS requests from the EC2 instances used to host the EKS cluster. This allows GuardDuty to identify a DNS request made to a domain name associated with a cryptocurrency mining pool, and generate the finding CryptoCurrency:EC2/BitcoinTool.B!DNS, as shown in Figure 5.

Figure 5: Example GuardDuty finding for EC2 instance querying bitcoin domain name

Figure 5: Example GuardDuty finding for EC2 instance querying bitcoin domain name

Because this is an EC2 related GuardDuty finding and GuardDuty Malware Protection is enabled in the account, GuardDuty then conducts an agentless scan on the volumes of the EC2 instance to detect malware. If the scan results in a successful detection of one or more malicious files, another GuardDuty finding for Execution:EC2/MaliciousFile is generated, as shown in Figure 6.

Figure 6: Example GuardDuty finding for detection of a malicious file on EC2

Figure 6: Example GuardDuty finding for detection of a malicious file on EC2

The first GuardDuty finding detects crypto mining activity, while the proceeding malware protection finding provides context on the malware associated with this activity. This context is very valuable for the incident response process.

Conclusion

In this post, we walked you through each of the five phases where we outlined how an initial misconfiguration could result in a malicious actor gaining control of EKS resources within an AWS account and how GuardDuty is able to continually monitor and detect the progression of the security event. As previously stated, this is just one example where a misconfiguration in an EKS cluster could result in a security event.

Now that you have a good understanding of GuardDuty capabilities to continuously monitor and detect EKS security events, you will need to establish processes and procedures to enable your security team to investigate these events. You can enable Amazon Detective to help accelerate your security team’s mean time to respond (MTTR) by providing an efficient mechanism to analyze, investigate, and identify the root cause of security events. Follow along in part 2 of this series, How to investigate and take action on an Amazon EKS cluster related security issue with Amazon Detective, where we’ll cover techniques you can use with Amazon Detective to identify impacted EKS resources in your AWS account, possible remediation actions to take on the cluster, and preventative controls you can implement.

If you have feedback about this post, submit comments in the Comments section below. If you have questions about this post, start a thread on Amazon GuardDuty re:Post.

Want more AWS Security news? Follow us on Twitter.

Author

Marshall Jones

Marshall is a worldwide senior security specialist solutions architect at AWS. His background is in AWS consulting and security architecture, focused on a variety of security domains including edge, threat detection, and compliance. Today, he helps enterprise customers adopt and operationalize AWS security services to increase security effectiveness and reduce risk.

Jonathan Nguyen

Jonathan Nguyen

Jonathan is a shared delivery team senior security consultant at AWS. His background is in AWS security, with a focus on threat detection and incident response. He helps enterprise customers develop a comprehensive AWS security strategy, deploy security solutions at scale, and train customers on AWS security best practices.

Manuel Martinez Arizmendi

Manuel Martinez Arizmendi

Manuel works a Security Engineer at Amazon Detective providing new security investigation capabilities to AWS customers. Based on Boston,MA and originally from Madrid, Spain, when he’s not at work, he enjoys playing and watching soccer, playing videogames, and hanging out with his friends.

Use Amazon Inspector to manage your build and deploy pipelines for containerized applications

Post Syndicated from Scott Ward original https://aws.amazon.com/blogs/security/use-amazon-inspector-to-manage-your-build-and-deploy-pipelines-for-containerized-applications/

Amazon Inspector is an automated vulnerability management service that continually scans Amazon Web Services (AWS) workloads for software vulnerabilities and unintended network exposure. Amazon Inspector currently supports vulnerability reporting for Amazon Elastic Compute Cloud (Amazon EC2) instances and container images stored in Amazon Elastic Container Registry (Amazon ECR).

With the emergence of Docker in 2013, container technology has quickly moved from the experimentation phase into a viable production tool. Many customers are using containers to modernize their existing applications or as the foundations for new applications or services that they build. In this blog post, we’ll explore the process that Amazon Inspector takes to scan container images. We’ll also show how you can integrate Amazon Inspector into your containerized application build and deployment pipeline, and control pipeline steps based on the results of an Amazon Inspector container image scan.

Solution overview and walkthrough

The solution outlined in this post covers a deployment pipeline modeled in AWS CodePipeline. The source for the pipeline is AWS CodeCommit, and the build of the container image is performed by AWS CodeBuild. The solution uses a collection of AWS Lambda functions and an Amazon DynamoDB table to evaluate the container image status and make an automated decision about deploying the container image. Finally, the pipeline has a deploy stage that will deploy the container image into an Amazon Elastic Container Service (Amazon ECS) cluster. In this section, I’ll outline the key components of the solution and how they work. In the following section, Deploy the solution, I’ll walk you through how to actually implement the solution.

Although this solution uses AWS continuous integration and continuous delivery (CI/CD) services such as CodePipeline and CodeBuild, you can also build similar capabilities by using third-party CI/CD solutions. In addition to CodeCommit, other third-party code repositories such as GitHub or Amazon Simple Storage Service (Amazon S3) can be substituted in as a source for the pipeline.

Solution architecture

Figure 1 shows the high-level architecture of the solution, which integrates Amazon Inspector into a container build and deploy pipeline.

Figure 1: Overall container build and deploy architecture

Figure 1: Overall container build and deploy architecture

The high-level workflow is as follows:

  1. You commit the image definition to a CodeCommit repository.
  2. An Amazon EventBridge rule detects the repository commit and initiates the container pipeline.
  3. The source stage of the pipeline pulls the image definition and build instructions from the CodeCommit repository.
  4. The build stage of the pipeline creates the container image and stores the final image in Amazon ECR.
  5. The ContainerVulnerabilityAssessment stage sends out a request for approval by using an Amazon Simple Notification Service (Amazon SNS) topic. A Lambda function associated with the topic stores the details about the container image and the active pipeline, which will be needed in order to send a response back to the pipeline stage.
  6. Amazon Inspector scans the Amazon ECR image for vulnerabilities.
  7. The Lambda function receives the Amazon Inspector scan summary message, through EventBridge, and makes a decision on allowing the image to be deployed. The function retrieves the pipeline approval details so that the approve or reject message is sent to the correct active pipeline stage.
  8. The Lambda function submits an Approved or Rejected status to the deployment pipeline.
  9. CodePipeline deploys the container image to an Amazon ECS cluster and completes the pipeline successfully if an approval is received. The pipeline status is set to Failed if the image is rejected.

Container image build stage

Let’s now review the build stage of the pipeline that is associated with the Amazon Inspector container solution. When a new commit is made to the CodeCommit repository, an EventBridge rule, which is configured to look for updates to the CodeCommit repository, initiates the CodePipeline source action. The source action then collects files from the source repository and makes them available to the rest of the pipeline stages. The pipeline then moves to the build stage.

In the build stage, CodeBuild extracts the Dockerfile that holds the container definition and the buildspec.yaml file that contains the overall build instructions. CodeBuild creates the final container image and then pushes the container image to the designated Amazon ECR repository. As part of the build, the image digest of the container image is stored as a variable in the build stage so that it can be used by later stages in the pipeline. Additionally, the build process writes the name of the container URI, and the name of the Amazon ECS task that the container should be associated with, to a file named imagedefinitions.json. This file is stored as an artifact of the build and will be referenced during the deploy phase of the pipeline.

Now that the image is stored in an Amazon ECR repository, Amazon Inspector scanning begins to check the image for vulnerabilities.

The details of the build stage are shown in Figure 2.

Figure 2: The container build stage

Figure 2: The container build stage

Container image approval stage

After the build stage is completed, the ContainerVulnerabilityAssessment stage begins. This stage is lightweight and consists of one stage action that is focused on waiting for an Approved or Rejected message for the container image that was created in the build stage. The ContainerVulnerabilityAssessment stage is configured to send an approval request message to an SNS topic. As part of the approval request message, the container image digest, from the build stage, will be included in the comments section of the message. The image digest is needed so that approval for the correct container image can be submitted later. Figure 3 shows the comments section of the approval action where the container image digest is referenced.

Figure 3: Container image digest reference in approval action configuration

Figure 3: Container image digest reference in approval action configuration

The SNS topic that the pipeline approval message is sent to is configured to invoke a Lambda function. The purpose of this Lambda function is to pull key details from the SNS message. Details retrieved from the SNS message include the pipeline name and stage, stage approval token, and the container image digest. The pipeline name, stage, and approval token are needed so that an approved or rejected response can be sent to the correct pipeline. The container image digest is the unique identifier for the container image and is needed so that it can be associated with the correct active pipeline. This information is stored in a DynamoDB table so that it can be referenced later when the step that assesses the result of an Amazon Inspector scan submits an approved or rejected decision for the container image. Figure 4 illustrates the flow from the approval stage through storing the pipeline approval data in DynamoDB.

Figure 4: Flow to capture container image approval details

Figure 4: Flow to capture container image approval details

This approval action will remain in a pending status until it receives an Approved or Rejected message or the timeout limit of seven days is reached. The seven-day timeout for approvals is the default for CodePipeline and cannot be changed. If no response is received in seven days, the stage and pipeline will complete with a Failed status.

Amazon Inspector and container scanning

When the container image is pushed to Amazon ECR, Amazon Inspector scans it for vulnerabilities.

In order to show how you can use the findings from an Amazon Inspector container scan in a build and deploy pipeline, let’s first review the workflow that occurs when Amazon Inspector scans a container image located in Amazon ECR.

Figure 5: Image push, scan, and notification workflow

Figure 5: Image push, scan, and notification workflow

The workflow diagram in Figure 5 outlines the steps that happen after an image is pushed to Amazon ECR all the way to messaging that the image has been successfully scanned and what the final scan results are. The steps in this workflow are as follows:

  1. The final container image is pushed to Amazon ECR by an individual or as part of a build.
  2. Amazon ECR sends a message indicating that a new image has been pushed.
  3. The message about the new image is received by Amazon Inspector.
  4. Amazon Inspector pulls a copy of the container image from Amazon ECR and performs a vulnerability scan.
  5. When Amazon Inspector is done scanning the image, a message summarizing the severity of vulnerabilities that were identified during the container image scan is sent to Amazon EventBridge. You can create EventBridge rules that match the vulnerability summary message to route the message onto a target for notifications or to enable further action to be taken.

Here’s a sample EventBridge pattern that matches the scan summary message from Amazon Inspector.

{
  "detail-type": ["Inspector2 Scan"],
  "source": ["aws.inspector2"]
}

This entire workflow, from ingesting the initial image to sending out the status on the Amazon Inspector scan, is fully managed. You just focus on how you want to use the Amazon Inspector scan status message to govern the approval and deployment of your container image.

The following is a sample of what the Amazon Inspector vulnerability summary message looks like. Note, in bold, the container image Amazon Resource Name (ARN), image repository ARN, message detail type, image digest, and the vulnerability summary.

{
    "version": "0",
    "id": "bf67fc08-f522-f598-6946-8e7b372ba426",
    "detail-type": "Inspector2 Scan",
    "source": "aws.inspector2",
    "account": "<account id>",
    "time": "2022-05-25T16:08:17Z",
    "region": "us-east-2",
    "resources":
    [
        "arn:aws:ecr:us-east-2:<account id>:repository/vuln-images/vulhub/rsync"
    ],
    "detail":
    {
        "scan-status": "INITIAL_SCAN_COMPLETE",
        "repository-name": "arn:aws:ecr:us-east-2:<account id>:repository/vuln-images/vulhub/rsync",
        "finding-severity-counts": { "CRITICAL": 3, "HIGH": 16, "MEDIUM": 4, "TOTAL": 24 },
        "image-digest": "sha256:21ae0e3b7b7xxxx",
        "image-tags":
        [
            "latest"
        ]
    }
}

Processing Amazon Inspector scan results

After Amazon Inspector sends out the scan status event, a Lambda function receives and processes that event. This function needs to consume the Amazon Inspector scan status message and make a decision about whether the image can be deployed.

The eval_container_scan_results Lambda function serves two purposes: The first is to extract the findings from the Amazon Inspector scan message that invoked the Lambda function. The second is to evaluate the findings based on thresholds that are defined as parameters in the Lambda function definition. Based on the threshold evaluation, the container image will be flagged as either Approved or Rejected. Figure 6 shows examples of thresholds that are defined for different Amazon Inspector vulnerability severities, as part of the Lambda function.

Figure 6: Vulnerability thresholds defined in Lambda environment variables

Figure 6: Vulnerability thresholds defined in Lambda environment variables

Based on the container vulnerability image results, the Lambda function determines whether the image should be approved or rejected for deployment. The function will retrieve the details about the current pipeline that the image is associated with from the DynamoDB table that was populated by the image approval action in the pipeline. After the details about the pipeline are retrieved, an Approved or Rejected message is sent to the pipeline approval action. If the status is Approved, the pipeline continues to the deploy stage, which will deploy the container image into the defined environment for that pipeline stage. If the status is Rejected, the pipeline status is set to Rejected and the pipeline will end.

Figure 7 highlights the key steps that occur within the Lambda function that evaluates the Amazon Inspector scan status message.

Figure 7: Amazon Inspector scan results decision

Figure 7: Amazon Inspector scan results decision

Image deployment stage

If the container image is approved, the final image is deployed to an Amazon ECS cluster. The deploy stage of the pipeline is configured with Amazon ECS as the action provider. The deploy action contains the name of the Amazon ECS cluster and stage that the container image should be deployed to. The image definition file (imagedefinitions.json) that was created in the build stage is also listed in the deploy configuration. When the deploy stage runs, it will create a revision to the existing Amazon ECS task definition. This task definition contains the name of the Amazon ECR image that has been approved for deployment. The task definition is then deployed to the Amazon ECS cluster and service.

Deploy the solution

Now that you have an understanding of how the container pipeline solution works, you can deploy the solution to your own AWS account. This section will walk you through the steps to deploy the container approval pipeline, and show you how to verify that each of the key steps is working.

Step 1: Activate Amazon Inspector in your AWS account

The sample solution provided by this blog post requires that you activate Amazon Inspector in your AWS account. If this service is not activated in your account, learn more about the free trial and pricing for this service, and follow the steps in Getting started with Amazon Inspector to set up the service and start monitoring your account.

Step 2: Deploy the AWS CloudFormation template

For this next step, make sure you deploy the template within the AWS account and AWS Region where you want to test this solution.

To deploy the CloudFormation stack

  1. Choose the following Launch Stack button to launch a CloudFormation stack in your account. Use the AWS Management Console navigation bar to choose the region you want to deploy the stack in.

    Select this image to open a link that starts building the CloudFormation stack

  2. Review the stack name and the parameters for the template. The parameters are pre-populated with the necessary values, and there is no need to change them.
  3. Scroll to the bottom of the Quick create stack screen and select the checkbox next to I acknowledge that AWS CloudFormation might create IAM resources.
  4. Choose Create stack. The deployment of this CloudFormation stack will take 3–5 minutes.

After the CloudFormation stack has deployed successfully, you can proceed to reviewing and interacting with the deployed solution.

Step 3: Review the container pipeline and supporting resources

The CloudFormation stack is designed to deploy a collection of resources that will be used for an initial container build. When the CodePipeline resource is created, it will automatically pull the assets from the CodeCommit repository and start the pipeline for the container image.

To review the pipeline and resources

  1. In the CodePipeline console, navigate to the Region that the stack was deployed in.
  2. Choose the pipeline named ContainerBuildDeployPipeline to show the full pipeline details.
  3. Review the Source and Build stage, which will show a status of Succeeded.
  4. Review the ContainerVulnerabilityAssessment stage, which will show as failed with a Rejected status in the Manual Approval step.

    Figure 8 shows the full completed pipeline.

    Figure 8: Rejected container pipeline

    Figure 8: Rejected container pipeline

  5. Choose the Details link in the Manual Approval stage to reveal the reasons for the rejection. An example review summary is shown in Figure 9.
    Figure 9: Container pipeline approval rejection

    Figure 9: Container pipeline approval rejection

Review findings in Amazon Inspector (Optional)

You can use the Amazon Inspector console to see the full findings detail for this container image, if needed.

To view the findings in Amazon Inspector

  1. In the Amazon Inspector console, under Findings, choose By repository.
  2. From the list of repositories, choose the inspector-blog-images repository.
  3. Choose the Image tag link to bring up a list of the individual vulnerabilities that were found within the container image. Figure 10 shows an example of the vulnerabilities list in the findings details.
    Figure 10: Container image findings in Amazon Inspector

    Figure 10: Container image findings in Amazon Inspector

Step 4: Adjust the Amazon ECS desired count for the cluster service

Up to this point, you’ve deployed a pipeline to build and validate the container image, and you’ve seen an example of how the pipeline handles a container image that did not meet the defined vulnerability thresholds. Now you’ll deploy a new container image that will pass a vulnerability assessment and complete the pipeline.

The Amazon ECS service that the CloudFormation template deploys is initially created with the number of desired tasks set to 0. In order to allow the container pipeline to successfully deploy a container, you need to update the desired tasks value.

To adjust the task count in Amazon ECS (console)

  1. In the Amazon ECS console, choose the link for the cluster, in this case InspectorBlogCluster.
  2. On the Services tab, choose the link for the service named InspectorBlogService.
  3. Choose the Update button. On the Configure service page, set Number of tasks to 1.
  4. Choose Skip to review, and then choose Update Service.

To adjust the task count in Amazon ECS (AWS CLI)

Alternatively, you can run the following AWS CLI command to update the desired task count to 1. In order to run this command, you need the ARN of the Amazon ECS cluster, which you can retrieve from the Output tab of the CloudFormation stack that you created. You can run this command from the command line of an environment of your choosing, or by using AWS CloudShell. Make sure to replace <Cluster ARN> with your own value.

$ aws ecs update-service --cluster <Cluster ARN> --service InspectorBlogService --desired-count 1

Step 5: Build and deploy a new container image

Deploying a new container image will involve pushing an updated Dockerfile to the ContainerComponentsRepo repository in CodeCommit. With CodeCommit you can interact by using standard Git commands from a command line prompt, and there are multiple approaches that you can take to connect to the AWS CodeCommit repository from the command line. For this post, in order to simplify the interactions with CodeCommit, you will be shown how to add an updated file directly through the CodeCommit console.

To add an updated Dockerfile to CodeCommit

  1. In the CodeCommit console, choose the repository named ContainerComponentsRepo.
  2. In the screen listing the repository files, choose the Dockerfile file link and choose Edit.
  3. In the Edit a file form, overwrite the existing file contents with the following command:
    FROM public.ecr.aws/amazonlinux/amazonlinux:latest
  4. In the Commit changes to main section, fill in the following fields.
    1. Author name: your name
    2. Email address: your email
    3. Commit message: ‘Updated Dockerfile’

    Figure 11 shows what the completed form should look like.

    Figure 11: Complete CodeCommit entry for an updated Dockerfile

    Figure 11: Complete CodeCommit entry for an updated Dockerfile

  5. Choose Commit changes to save the new Dockerfile.

This update to the Dockerfile will immediately invoke a new instance of the container pipeline, where the updated container image will be pulled and evaluated by Amazon Inspector.

Step 6: Verify the container image approval and deployment

With a new pipeline initiated through the push of the updated Dockerfile, you can now review the overall pipeline to see that the container image was approved and deployed.

To see the full details in CodePipeline

  1. In the CodePipeline console, choose the container-build-deploy pipeline. You should see the container pipeline in an active status. In about five minutes, you should see the ContainerVulnerabilityAssessment stage move to completed with an Approved status, and the deploy stage should show a Succeeded status.
  2. To confirm that the final image was deployed to the Amazon ECS cluster, from the Deploy stage, choose Details. This will open a new browser tab for the Amazon ECS service.
  3. In the Amazon ECS console, choose the Tasks tab. You should see a task with Last status showing RUNNING. This is confirmation that the image was successfully approved and deployed through the container pipeline. Figure 12 shows where the task definition and status are located.
    Figure 12: Task status after deploying the container image

    Figure 12: Task status after deploying the container image

  4. Choose the task definition to bring up the latest task definition revision, which was created by the deploy stage of the container pipeline.
  5. Scroll down in the task definition screen to the Container definitions section. Note that the task is tied to the image you deployed, providing further verification that the approved container image was successfully deployed. Figure 13 shows where the container definition can be found and what you should expect to see.
    Figure 13: Container associated with revised task definition

    Figure 13: Container associated with revised task definition

Clean up the solution

When you’re finished deploying and testing the solution, use the following steps to remove the solution stack from your account.

To delete images from the Amazon ECR repository

  1. In the Amazon ECR console, navigate to the AWS account and Region where you deployed the solution.
  2. Choose the link for the repository named inspector-blog-images.
  3. Delete all of the images that are listed in the repository.

To delete objects in the CodePipeline artifact bucket

  1. In the Amazon S3 console in your AWS account, locate the bucket whose name starts with blog-base-setup-codepipelineartifactstorebucket.
  2. Delete the ContainerBuildDeploy folder that is in the bucket.

To delete the CloudFormation stack

  • In the CloudFormation console, delete the CloudFormation stack that was created to perform the steps in this post.

Conclusion

This post describes a solution that allows you to build your container images, have the images scanned for vulnerabilities by Amazon Inspector, and use the output from Amazon Inspector to determine whether the image should be allowed to be deployed into your environments.

This solution represents a pipeline with very simple build and deploy stages. Your pipeline will vary and may consist of multiple test stages and deployment stages for multiple environments. Additionally, the logic you use to determine whether a container image should be deployed may be different. The contents of this blog post are intended to help serve as a foundation that you can build on as you decide how to use Amazon Inspector for container vulnerability scanning. Feel free to use this guidance, and the example we provided, to extend the solution into your specific deployment pipeline.

 
If you have questions, contact AWS Support, or start a new thread on the AWS re:Post Amazon Inspector Forum. If you have feedback about this post, submit comments in the Comments section below.

Want more AWS Security news? Follow us on Twitter.

Scott Ward

Scott Ward

Scott is a Principal Solutions Architect with the External Security Services (ESS) product team and has been with Amazon for over 20 years. Scott provides technical guidance to customers on how to use security services to protect their AWS environments. Past roles included technical lead for the AWS security partner segment and member of the technical team for Amazon.com’s global financial systems.

How to use new Amazon GuardDuty EKS Protection findings

Post Syndicated from Marshall Jones original https://aws.amazon.com/blogs/security/how-to-use-new-amazon-guardduty-eks-protection-findings/

If you run container workloads that use Amazon Elastic Kubernetes Service (Amazon EKS), Amazon GuardDuty now has added support that will help you better protect these workloads from potential threats. Amazon GuardDuty EKS Protection can help detect threats related to user and application activity that is captured in Kubernetes audit logs. Newly-added Kubernetes threat detections include Amazon EKS clusters that are accessed by known malicious actors or from Tor nodes, API operations performed by anonymous users that might indicate a misconfiguration, and misconfigurations that can result in unauthorized access to Amazon EKS clusters. By using machine learning (ML) models, GuardDuty can identify patterns consistent with privilege-escalation techniques, such as a suspicious launch of a container with root-level access to the underlying Amazon Elastic Compute Cloud (Amazon EC2) host. In this post, we give you an overview of the new GuardDuty EKS Protection feature; show you examples of new finding details; and help you understand, operationalize, and respond to these new findings.

Amazon GuardDuty is an automated threat detection service that continuously monitors for suspicious activity and potentially unauthorized behavior to help protect your AWS accounts, Amazon EC2 workloads, data stored in Amazon Simple Storage Service (S3), and now Amazon EKS workloads.

If you are already a GuardDuty customer, you can enable GuardDuty EKS Protection and efficiently navigate the console to begin to use this feature. Your delegated administrator accounts can enable this for existing member accounts and determine if new AWS accounts in an organization will be automatically enrolled. If you are new to GuardDuty, the EKS Protection feature is included as part of the service’s 30-day trial period. As part of the 30-day trial period, you can take full advantage of this new feature and gain insight into your Amazon EKS workloads.

Overview of GuardDuty EKS Protection

GuardDuty EKS Protection enables GuardDuty to detect suspicious activities and potential compromises of your EKS clusters by analyzing Kubernetes audit logs. Kubernetes audit logs provide a security relevant, chronological set of records documenting the sequence of events from individual users, administrators, or system components that have affected your cluster. Audit logs can help answer questions such as: What happened? When did it happen? Who initiated it? GuardDuty EKS Protection analyzes Kubernetes audit logs from your Amazon EKS clusters, both new and existing, without the need to configure EKS control plane logging in your environment. GuardDuty collects these Kubernetes audit logs in addition to AWS CloudTrail, Amazon Virtual Private Cloud (Amazon VPC) flow logs, DNS queries, and Amazon S3 data events. GuardDuty EKS Protection performs analysis and looks for suspicious activity without the need for agents or adding resource constraints to your environment.

To detect threats using Kubernetes audit logs, GuardDuty uses a combination of machine learning, anomaly detection, and integrated threat intelligence to identify and prioritize potential threats. These findings primarily align to five root causes including compromised container images, configuration issues, Kubernetes user compromise, pod compromise, and node compromise. An example of a configuration issue is granting unnecessary privileges to the anonymous user by misconfiguring role-based access control (RBAC), which may inadvertently allow anonymous and unauthenticated calls to the Kubernetes API. A Kubernetes user compromise example could be a bad actor using stolen credentials to deploy containers with insecure settings, to use for a variety of activities from command and control to crypto-mining.

After a threat is detected, GuardDuty generates a security finding that includes container details such as the pod ID, container image ID, and tags associated with the Amazon EKS cluster. These finding details assist you with understanding the root cause which you can use to identify basic steps to remediate findings specific to EKS clusters. For example, your response to a finding or group of findings associated with a compromised Kubernetes user might begin with revoking access. For more information, see Remediating Kubernetes security issues discovered by GuardDuty in the Amazon GuardDuty User Guide.

Understanding new GuardDuty EKS Protection findings

As adversaries continue to become more sophisticated, it becomes even more important for you to align to a common framework to understand the tactics, techniques, and procedures (TTPs) behind an individual event. GuardDuty aligns findings using the MITRE ATT&CK framework, which is a globally-accessible knowledge base of adversary tactics and techniques based on real-world observations. GuardDuty findings have a specific finding format that helps you understand details of each finding. If you examine the ThreatPurpose portion in the GuardDuty EKS Protection finding types, you see there are finding types associated with various MITRE ATT&CK tactics, including CredentialAccess, DefenseEvasion, Discovery, Impact, Persistence, and PrivilegeEscalation. This can help you identify and understand the type of activity associated with a finding.

For example, look at two different finding types that seem similar: Impact:Kubernetes/SuccessfulAnonymousAccess and Discovery:Kubernetes/SuccessfulAnonymousAccess. You can see the difference is the ThreatPurpose at the beginning. They are both involved with successful anonymous access, and the difference is the intent of the activity associated with each finding. GuardDuty has determined based on the API or request URI invoked, that in this example, the activity seen on one finding aligns with the Impact tactic whereas the other finding aligns with the Discovery tactic

With GuardDuty EKS Protection, you now have an additional mechanism to gain insight into your EKS clusters across your accounts to look for suspicious activity. You can be alerted to Kubernetes-specific suspicious activity including: allowing administrator access to the default service account, exposing a Kubernetes dashboard, and launching a container with sensitive host paths. With this new feature, GuardDuty is also able to extend support for finding types that you might already be familiar with that also apply to Amazon EKS workloads. These finding types include calls to a Kubernetes cluster API from a Tor node, or calls to a Kubernetes cluster from a known malicious IP address, which can indicate that there are interactions with your Kubernetes clusters from sources that are commonly associated with malicious actors.

Responding to GuardDuty EKS Protection findings

This section gives an overview of three new GuardDuty EKS Protection findings, how to prevent them, and how to investigate and respond if they happen in your environment. The patterns shown can also act as a guide for how to prevent, investigate, and respond to other GuardDuty EKS Protection findings.

Discovery:Kubernetes/SuccessfulAnonymousAccess

Finding documentation: Discovery:Kubernetes/SuccessfulAnonymousAccess

Severity: Medium

Overview: This finding (as shown in Figure 1) informs you that an API operation was successfully invoked by the system:anonymous user. API calls made by system:anonymous are unauthenticated. The observed API is commonly associated with the discovery stage of an attack when an adversary is gathering information on your Kubernetes cluster. This activity indicates that anonymous or unauthenticated access is permitted on the API action reported in the finding, and may be permitted on other actions. These API calls are possible because of a misconfiguration of the system:anonymous user or system:unauthenticated group.

Preventative measures: AWS recommends that you disable unnecessary anonymous authentication. For instructions, see Review and revoke unnecessary anonymous access in the Amazon EKS Best Practices Guides. It is important to note that Kubernetes versions older than 1.14 granted system:discovery and system:basic-user roles to system:anonymous user by default, and these permissions remain in place after updating unless you explicitly change them.

How to remediate: To respond to this finding, it is important to first identify the details of the activity, for example what cluster is involved? Who is the owner of this cluster? This information will assist you with the remediation steps that follow, to review and revoke unnecessary permissions, and also help you determine a root cause.
 

Figure 1: GuardDuty Console showing Discovery:Kubernetes/SuccessfulAnonymousAccess finding type

Figure 1: GuardDuty Console showing Discovery:Kubernetes/SuccessfulAnonymousAccess finding type

Remediation step 1: Examine permissions

The first step is to examine the permissions that have been granted to the system:anonymous user, and determine what permissions are needed. To accomplish this, you need to first understand what permissions the system:anonymous user has. You can use an rbac-lookup tool to list the Kubernetes roles and cluster roles bound to users, service accounts, and groups. An alternative method can be found at this GitHub page.

./rbac-lookup | grep -P 'system:(anonymous)|(unauthenticated)'
system:anonymous               cluster-wide        ClusterRole/system:discovery
system:unauthenticated         cluster-wide        ClusterRole/system:discovery
system:unauthenticated         cluster-wide        ClusterRole/system:public-info-viewer

Remediation step 2: Disassociate groups

Next, you disassociate the system:unauthenticated group from system:discovery and system:basic-user ClusterRoles, which you do by editing the ClusterRoleBinding. Make sure to not remove system:unauthenticated from the system:public-info-viewer cluster role binding, because that will prevent the Network Load Balancer from performing health checks against the API server. For more information, see Network Load Balancer in the AWS Load Balancer Controller Guide and Identity and Access Management in Amazon EKS Best Practices Guide.

To disassociate the appropriate groups

  1. Run the command kubectl edit clusterrolebindings system:discovery. This command will open the current definition of system:discovery ClusterRoleBinding in your editor as shown in the sample .yaml configuration file:
    # Please edit the object below. Lines beginning with a '#' will be ignored,
    # and an empty file will abort the edit. If an error occurs while saving this # file will be reopened with the relevant failures.
    #
    apiVersion: rbac.authorization.k8s.io/v1
    kind: ClusterRoleBinding
    metadata:
      annotations:
        rbac.authorization.kubernetes.io/autoupdate: "true"
      creationTimestamp: "2021-06-17T20:50:49Z"
      labels:
        kubernetes.io/bootstrapping: rbac-defaults
      name: system:discovery
      resourceVersion: "24502985"
      selfLink: /apis/rbac.authorization.k8s.io/v1/clusterrolebindings/system%3Adiscovery
      uid: b7936268-5043-431a-a0e1-171a423abeb6
    roleRef:
      apiGroup: rbac.authorization.k8s.io
      kind: ClusterRole
      name: system:discovery
    subjects:
    - apiGroup: rbac.authorization.k8s.io
      kind: Group
      name: system:authenticated
    - apiGroup: rbac.authorization.k8s.io
      kind: Group
      name: system:unauthenticated
    

  2. Delete the entry for system:unauthenticated group, which is highlighted in bold in the subjects section.
  3. Repeat the same steps for system:basic-user ClusterRoleBinding.

If there is no reason that the system:anonymous user should be used in your environment, AWS recommends that you set up automatic response and remediation steps 1-3. For more information about the system:anonymous user, see Identity and Access Management in Amazon EKS Best Practices Guide.

PrivilegeEscalation:Kubernetes/PrivilegedContainer

Finding documentation: PrivilegeEscalation:Kubernetes/PrivilegedContainer

Severity: Medium

Overview: This finding (as shown in Figure 2) informs you that a privileged container was launched on your Kubernetes cluster using an image that has never before been used to launch privileged containers in your cluster. A privileged container has root level access on the host. Adversaries commonly launch privileged containers to perform privilege escalation to gain access and compromise the underlying host.

Preventative measures: Create and enforce policy-as-code (PAC) or Pod Security Standards (PSS) that require that pods be created as non-privileged. For more information, see Pod Security in the in Amazon EKS Best Practices Guide.

How to remediate: To respond to this finding, it is important to first identify the details of the activity and begin to answer questions that will help determine what happened. For example, what pod or workload was launched? Who was the user that launched this pod or workload? What cluster is involved?
 

Figure 2: GuardDuty Console showing PrivilegeEscalation:Kubernetes/PrivilegedContainer finding type

Figure 2: GuardDuty Console showing PrivilegeEscalation:Kubernetes/PrivilegedContainer finding type

If this privileged container launch is unexpected, the credentials of the user identity used to launch the container may be compromised. You should then focus on remediating and reviewing access to your cluster, and remediating the user. To do this, follow the procedure in the Remediating a compromised Kubernetes user section of this post. Next, you should identify compromised pods using the procedure in the Identifying and remediating compromised pods section of this post.

If you know what specific circumstances a privileged container can be deployed in your environment, for example only in a specific namespace, it is likely you can automatically remediate any GuardDuty EKS Protection finding associated with a privileged container in any other namespace. For more information about automated response activities, see Incident response and forensics in the Amazon EKS Best Practices Guide.

Persistence:Kubernetes/ContainerWithSensitiveMount

Finding documentation: Persistence:Kubernetes/ContainerWithSensitiveMount

Severity: Medium

Overview: This finding (as shown in Figure 3) informs you that a container was launched with a configuration that included a sensitive host path with write access in the volumeMounts section. This makes the sensitive host path accessible and writable from inside the container. This technique is commonly used by adversaries to gain access to the host’s filesystem.

Preventative Measures: Create and enforce policy-as-code (PAC) or Pod Security Standards (PSS) that use the allowedHostPaths control to only allow required host paths for use in volumes and preferably with read-only access. For more information, see Pod Security in the Amazon EKS Best Practices Guide.

How to remediate: To respond to this finding, it is important to first identify the details of the activity and begin to answer questions that will help determine what happened. For example, what pod or workload was launched? Who was the user that launched this pod or workload? What cluster is involved?
 

Figure 3: GuardDuty Console showing Persistence:Kubernetes/ContainerWithSensitiveMount finding type

Figure 3: GuardDuty Console showing Persistence:Kubernetes/ContainerWithSensitiveMount finding type

If the container launched is unexpected, the credentials of the user identity used to launch the container may be compromised. You should then focus on remediating and reviewing access to your cluster and remediating the user. To do this, follow the procedure in the next section, Remediating a compromised Kubernetes user.

If you can determine what containers should and should not be launched with writable hostPath mounts, then you can create automatic response and remediation for this use case. For example, you might want to revoke temporary security credentials assigned to the pod or worker node. For more information about revoking temporary security credentials and other response and remediation actions, see Incident response and forensics in the Amazon EKS Best Practices Guide.

Remediating a compromised Kubernetes user

If the compromised user has privileges to read secrets of one or more namespaces, rotate all of the affected secrets. For more information about the different types of secrets, see Secrets in the Kubernetes documentation. If the user has write privileges, AWS recommends auditing all changes made by the user in question. You can accomplish this by querying audit logs, if you have enabled EKS control plane logging on your EKS cluster. If you do not currently have logging enabled, follow the instructions for Enabling and disabling control plane logs in the Amazon EKS User Guide. Amazon EKS stores these control plane logs in Amazon CloudWatch Logs in your account. You can use CloudWatch Logs Insights to list all the mutating changes that the compromised user has made.

Remediation step 1: Identify the user

All actions performed on a Kubernetes cluster has an associated identity. GuardDuty EKS Protection findings report details of the Kubernetes user identity that the malicious actor may have compromised. You can find details of the user identity in the GuardDuty console under the Kubernetes user details section in the finding details, or in the finding JSON under the resources.eksClusterDetails.kubernetesDetails.kubernetesUserDetails section. These user details include username, UID, and groups that the user belongs to.

Remediation step 2: Identify changes

  1. Identify the changes made by the attacker associated with the compromised user identity by using the code example below to query CloudWatch Logs Insights, replacing the placeholders with your values.
    fields @timestamp, @message
    | filter user.username == <username> 
    | filter verb == "create" or verb == "update" or verb == "patch"
    | filter responseStatus.code >= 200 and responseStatus.code <= 300
    | filter @timestamp >= <approximate start time of the attack in epoch milliseconds>

    For example:

    fields @timestamp, @message
    | filter user.username == "kubernetes-admin" 
    | filter verb == "create" or verb == "update" or verb == "patch"
    | filter responseStatus.code >= 200 and responseStatus.code <= 300
    | filter @timestamp >= 1628279482312
    

  2. An EKS cluster can have multiple types of user identities, for example the kubernetes-admin user, aws-auth ConfigMap defined user, and so on. You will need to take actions appropriate for the user type to properly revoke its access. For more information, see Remediating compromised Kubernetes users in the Amazon GuardDuty User Guide.
  3. (Optional) If the compromised user identity had extensive privileges and you determine that the attacker made extensive changes to the cluster, you should consider isolating the pod, followed by creating a new clean cluster and redeploying your applications to the new cluster. For instructions to isolate and redeploy EKS pods, see Isolate the Pod by creating a Network Policy that denies all ingress and egress traffic to the pod in the Amazon EKS Best Practices Guide.

Identifying and remediating compromised pods

If a GuardDuty EKS Protection finding is caused by activity related to a specific pod, the value of the finding JSON resource.kubernetesDetails.kubernetesWorkloadDetails.type field is pod. The finding includes the name of the pod and namespace in the resource.kubernetesDetails.kubernetesWorkloadDetails.name and resource.kubernetesDetails.kubernetesWorkloadDetails.namespace fields, which uniquely identify the pod.

In other cases, such as when a service account or a Kubernetes workload name is in the resource.kubernetesDetails.kubernetesUserDetails, you can follow the instructions in the Sample incident response plan to identify compromised pods using different pieces of information available in the GuardDuty EKS Protection findings.

After you have identified compromised pods, to remediate, use the instructions to isolate the pods, rotate the credentials, and gather data for forensic analysis in Isolate the Pod by creating a Network Policy that denies all ingress and egress traffic to the pod in the Amazon EKS Best Practices Guide.

Conclusion

In this post, you learned the details of the new Amazon GuardDuty EKS Protection feature, and Kubernetes audit logs, and you saw examples for how to understand, operationalize, and respond to these new findings. You can enable this feature through the GuardDuty Console or APIs to start monitoring your Amazon EKS clusters today. If you have created Amazon EventBridge Rules to send findings from GuardDuty to a target, then ensure that your rules are configured to deliver these newly added findings.

AWS is committed to continually improving GuardDuty, to make it more efficient for you to operate securely in AWS. At AWS, customer feedback drives change, so we encourage you to continue providing feedback. If you have feedback about this post, submit comments in the Comments section below. If you have questions about this post, start a new thread on AWS re:Post or contact AWS Support.

Want more AWS Security how-to content, news, and feature announcements? Follow us on Twitter.

Author

Marshall Jones

Marshall is a worldwide security specialist solutions architect at AWS. His background is in AWS consulting and security architecture, focused on a variety of security domains including edge, threat detection, and compliance. Today, he helps enterprise customers adopt and operationalize AWS security services to increase security effectiveness and reduce risk.

Docker Container Monitoring With Zabbix

Post Syndicated from Dmitry Lambert original https://blog.zabbix.com/docker-container-monitoring-with-zabbix/20175/

In this blog post, I will cover Docker container monitoring with Zabbix. We will use the official Docker by Zabbix agent 2 template to make things as simple as possible. The template download link and configuration steps can be found on the Zabbix Integrations page. If you require a visual guide, I invite you to check out my video covering this topic.

Importing the official Docker template

Importing the Docker by Zabbix agent 2 template

Since we will be using the official Docker by Zabbix agent 2 template, first, we need to make sure that the template is actually available in our Zabbix instance. The template is available for Zabbix versions 5.0, 5.4, and 6.0. If you cannot find this template under Configuration – Templates, chances are that you haven’t imported it into your environment after upgrading Zabbix to one of the aforementioned versions. Remember that Zabbix does not modify or import any templates during the upgrade process, so we will have to import the template manually. If that is so, simply download the template from the official Zabbix git page (or use the link in the introduction) and import it into your Zabbix instance by using the Import button in the Configuration – Templates section.

Installing and configuring Zabbix agent 2

Before we get started with configuring our host, we first have to install Zabbix agent 2 and configure it according to the template guidelines. Follow the steps in the download section of the Zabbix website and install the zabbix-agent2 package. Feel free to use any other agent deployment methods if you want to (like compiling the agent from the source files)

Installing Zabbix agent2 from packages takes just a few simple steps:

Install the Zabbix repository package:

rpm -Uvh https://repo.zabbix.com/zabbix/6.0/rhel/8/x86_64/zabbix-release-6.0-1.el8.noarch.rpm

Install the Zabbix agent 2 package:

dnf install zabbix-agent2

Configure the Server parameter by populating it with your Zabbix server/proxy address

vi /etc/zabbix/zabbix_agent2.conf
### Option: Server
# List of comma delimited IP addresses, optionally in CIDR notation, or DNS names of Zabbix servers and Zabbix proxies.
# Incoming connections will be accepted only from the hosts listed here.
# If IPv6 support is enabled then '127.0.0.1', '::127.0.0.1', '::ffff:127.0.0.1' are treated equally
# and '::/0' will allow any IPv4 or IPv6 address.
# '0.0.0.0/0' can be used to allow any IPv4 address.
# Example: Server=127.0.0.1,192.168.1.0/24,::1,2001:db8::/32,zabbix.example.com
#
# Mandatory: yes, if StartAgents is not explicitly set to 0
# Default:
# Server=

Server=192.168.50.49

Plugin specific Zabbix agent 2 configuration

Zabbix agent 2 provides plugin-specific configuration parameters. Mostly these are optional parameters related to a specific plugin. You can find the full list of plugin-specific configuration parameters in the Zabbix documentation. In the newer versions of Zabbix agent 2, the plugin-specific parameters are defined in separate plugin configuration files, located in /etc/zabbix/zabbix_agent2.d/plugins.d/, while in older versions, they are defined directly in the zabbix_agent2.conf file.

For the Zabbix agent 2 Docker plugin, we have to provide the Docker daemon unix-socket location. This can be done by specifying the following plugin parameter:

### Option: Plugins.Docker.Endpoint
# Docker API endpoint.
#
# Mandatory: no
# Default: unix:///var/run/docker.sock
# Plugins.Docker.Endpoint=unix:///var/run/docker.sock

The default socket location will be correct for your Docker environment – in that case, you can leave the configuration file as-is.

Once we have made the necessary changes in the Zabbix agent 2 configuration files, start and enable the agent:

systemctl enable zabbix-agent2 --now

Check if the Zabbix agent2 is running:

tail -f /var/log/zabbix/zabbix_agent2.log

Before we move on to Zabbix frontend, I would like to point your attention to the Docker socket file permission – the zabbix user needs to have access to the Docker socket file. The zabbix user should be added to the docker group to resolve the following error messages.

[Docker] cannot fetch data: Get http://1.28/info: dial unix /var/run/docker.sock: connect: permission denied
ZBX_NOTSUPPORTED: Cannot fetch data.

You can add the zabbix user to the Docker group by executing the following command:

usermod -aG docker zabbix

Configuring the docker host

Configuring the host representing our Docker environment

After importing the template, we have to create a host which will represent our Docker instance. Give the host a name and assign it to a Host group – I will assign it to the Linux servers host group. Assign the Docker by Zabbix agent 2 template to the host. Since the template uses Zabbix agent 2 to collect the metrics, we also have to add an agent interface on this host. The address of the interface should point to the machine running your Docker containers. Finish up the host configuration by clicking the Add button.

Docker by Zabbix agent 2 template

Regular docker template items

The template contains a set of regular items for the general Docker instance metrics, such as the number of available images, Docker architecture information, the total number of containers, and more.

Docker tempalte Low-level discovery rules

On top of that, the template also gathers container and image-specific information by using low-level discovery rules.

Once Zabbix discovers your containers and images, these low-level discovery rules will then be used to create items, triggers, and graphs from prototypes for each of your containers and images. This way, we can monitor container or image-specific metrics, such as container memory, network information, container status, and more.

Docker templates Low-level discovery item prototypes

Verifying the host and template configuration

To verify that the agent and the host are configured correctly, we can use Zabbix get command-line tool and try to poll our agent. If you haven’t installed Zabbix get, do so on your Zabbix server or Zabbix proxy host:

dnf install zabbix-get

Now we can use zabbix-get to verify that our agent can obtain the Docker-related metrics. Execute the following command:

zabbix_get -s docker-host -k docker.info

Use the -s parameter to specify your agent host’s host name or IP address. The -k parameter specifies the item key for which we wish to obtain the metrics by polling the agent with Zabbix get.

zabbix_get -s 192.168.50.141 -k docker.info

{"Id":"SJYT:SATE:7XZE:7GEC:XFUD:KZO5:NYFI:L7M5:4RGO:P2KX:QJFD:TAVY","Containers":2,"ContainersRunning":2,"ContainersPaused":0,"ContainersStopped":0,"Images":2,"Driver":"overlay2","MemoryLimit":true,"SwapLimit":true,"KernelMemory":true,"KernelMemoryTCP":true,"CpuCfsPeriod":true,"CpuCfsQuota":true,"CPUShares":true,"CPUSet":true,"PidsLimit":true,"IPv4Forwarding":true,"BridgeNfIptables":true,"BridgeNfIP6tables":true,"Debug":false,"NFd":39,"OomKillDisable":true,"NGoroutines":43,"LoggingDriver":"json-file","CgroupDriver":"cgroupfs","NEventsListener":0,"KernelVersion":"5.4.17-2136.300.7.el8uek.x86_64","OperatingSystem":"Oracle Linux Server 8.5","OSVersion":"8.5","OSType":"linux","Architecture":"x86_64","IndexServerAddress":"https://index.docker.io/v1/","NCPU":1,"MemTotal":1776848896,"DockerRootDir":"/var/lib/docker","Name":"localhost.localdomain","ExperimentalBuild":false,"ServerVersion":"20.10.14","ClusterStore":"","ClusterAdvertise":"","DefaultRuntime":"runc","LiveRestoreEnabled":false,"InitBinary":"docker-init","SecurityOptions":["name=seccomp,profile=default"],"Warnings":null}

In addition, we can also use the low-level discovery key – docker.containers.discovery[false] to check the result of the low-level discovery.

zabbix_get -s 192.168.50.141 -k docker.containers.discovery[false]

[{"{#ID}":"a1ad32f5ee680937806bba62a1aa37909a8a6663d8d3268db01edb1ac66a49e2","{#NAME}":"/apache-server"},{"{#ID}":"120d59f3c8b416aaeeba50378dee7ae1eb89cb7ffc6cc75afdfedb9bc8cae12e","{#NAME}":"/mysql-server"}]

We can see that Zabbix will discover and start monitoring two containers – apache-server and mysql-server. Any agent low-level discovery rule or item can be checked with Zabbix get.

Docker template in action

Discovered items on our Docker host

Now that we have configured our agent and host, applied the Docker template, and verified that everything is working, we should be able to see the discovered entities in the frontend.

Collected Docker container metrics

In addition, our metrics should have also started coming in. We can check the Latest data section and verify that they are indeed getting collected.

Macros inherited from the Docker template

Lastly, we have a few additional options for further modifying the template and the results of our low-level discovery. If you open the Macros section of your host and select Inherited and host macros, you will notice that there are 4 macros inherited from the Docker template. These macros are responsible for filtering in/out the discovered containers and images. Feel free to modify these values if you wish to filter in/out the discovery of these entities as per your requirements.

Notice that the container discovery item also has one parameter, which is defined as false on the template:

  • docker.containers.discovery[false] – Discover only running containers
  • docker.containers.discovery[true] – Discover all containers, no matter their state.

And that’s it! We successfully imported the template, installed and configured Zabbix agent 2, created a host, and applied the Docker template. Finally – our Zabbix instance is now monitoring our Docker environment! If you have any other questions or comments, feel free to leave a response in the comments section of this post.


The post Docker Container Monitoring With Zabbix appeared first on Zabbix Blog.

Let’s Architect! Architecting microservices with containers

Post Syndicated from Luca Mezzalira original https://aws.amazon.com/blogs/architecture/lets-architect-architecting-microservices-with-containers/

Microservices structure an application as a set of independently deployable services. They speed up software development and allow architects to quickly update systems to adhere to changing business requirements.

According to best practices, the different services should be loosely coupled, organized around business capabilities, independently deployable, and owned by a single team. If applied correctly, there are multiple advantages to using microservices. However, working with microservices can also bring challenges. In this edition of Let’s Architect!, we explore the advantages, mental models, and challenges deriving from microservices with containers.

Application integration patterns for microservices

As Tim Bray said in his time with AWS, “If your application is cloud native, large scale, or distributed, and doesn’t include a messaging component, that’s probably a bug.”

This video evaluates several design patterns based on messaging and shows you how to implement them in your workloads to achieve the full capabilities of microservices. You’ll learn some fundamental application integration patterns and some of the benefits that asynchronous messaging can have over REST APIs for communication between microservices.

The scatter-gather pattern scales parallel processing across nodes and aggregates the results in a queue

The scatter-gather pattern scales parallel processing across nodes and aggregates the results in a queue

Distributed monitoring

Customers often cite monitoring as one of the main challenges while working with containers. Monitoring collects operational data as logs, metrics, events, and traces to identify and respond to issues quickly and minimize disruptions.

This whitepaper covers cross-service challenges in microservices, including service discovery, distributed monitoring, and auditing. You’ll learn about the role of DNS and service meshes in interservice communication and discovery and the tools available for monitoring your clusters that run containers and for logging.

This view from AWS X-Ray shows how a request can be tracked across different services. This is implemented by taking advantage of correlation IDs

This view from AWS X-Ray shows how a request can be tracked across different services. This is implemented by taking advantage of correlation IDs

Create a pipeline with canary deployments for Amazon ECS using AWS App Mesh

When architects deploy a new version of an application, they want to test it on a set of users before routing all the traffic to the new version. This is known as a “canary deployment.” A canary deployment can automatically switch traffic back to the old version if some inconsistencies are detected. This decreases the impact of the bug(s) introduced in the new release. For microservices, this is helpful when testing a complex distributed system because you can send a percentage of traffic to newer versions in a controlled manner.

A service mesh provides application-level networking so your services can communicate with each other across multiple types of compute infrastructure. This blog post shows how to use AWS App Mesh to implement a canary deployment strategy using AWS Step Functions for orchestrating the different steps during testing and AWS Code Pipeline for continuous delivery of each microservice.

An overview of the architecture used to create the pipeline and perform the canary deployments

An overview of the architecture used to create the pipeline and perform the canary deployments

Running microservices in Amazon EKS with AWS App Mesh and Kong

Distributed architectures bring up several questions. How do we expose our APIs towards client-side applications? How do our microservices communicate?

This blog post answers these questions with a solution that uses Amazon Elastic Kubernetes Service (Amazon EKS) in conjunction with AWS App Mesh. This solution helps you manage the security and discoverability of microservices, and Kong protects your service mesh and runs side by side with your application services.

The Kong for Kubernetes architecture can be implemented using Amazon EKS and AWS App Mesh

The Kong for Kubernetes architecture can be implemented using Amazon EKS and AWS App Mesh

See you next time!

See you in a couple of weeks when we discuss open source technologies on AWS!

Looking for more architecture content? AWS Architecture Center provides reference architecture diagrams, vetted architecture solutions, Well-Architected best practices, patterns, icons, and more!

Other posts in this series

Using Amazon Aurora Global Database for Low Latency without Application Changes

Post Syndicated from Roneel Kumar original https://aws.amazon.com/blogs/architecture/using-amazon-aurora-global-database-for-low-latency-without-application-changes/

Deploying global applications has many challenges, especially when accessing a database to build custom pages for end users. One example is an application using AWS Lambda@Edge. Two main challenges include performance and availability.

This blog explains how you can optimally deploy a global application with fast response times and without application changes.

The Amazon Aurora Global Database enables a single database cluster to span multiple AWS Regions by asynchronously replicating your data within subsecond timing. This provides fast, low-latency local reads in each Region. It also enables disaster recovery from Region-wide outages using multi-Region writer failover. These capabilities minimize the recovery time objective (RTO) of cluster failure, thus reducing data loss during failure. You will then be able to achieve your recovery point objective (RPO).

However, there are some implementation challenges. Most applications are designed to connect to a single hostname with atomic, consistent, isolated, and durable (ACID) consistency. But Global Aurora clusters provide reader hostname endpoints in each Region. In the primary Region, there are two endpoints, one for writes, and one for reads. To achieve strong  data consistency, a global application requires the ability to:

  • Choose the optimal reader endpoints
  • Change writer endpoints on a database failover
  • Intelligently select the reader with the most up-to-date, freshest data

These capabilities typically require additional development.

The Heimdall Proxy coupled with Amazon Route 53 allows edge-based applications to access the Aurora Global Database seamlessly, without  application changes. Features include automated Read/Write split with ACID compliance and edge results caching.

Figure 1. Heimdall Proxy architecture

Figure 1. Heimdall Proxy architecture

The architecture in Figure 1 shows Aurora Global Databases primary Region in AP-SOUTHEAST-2, and secondary Regions in AP-SOUTH-1 and US-WEST-2. The Heimdall Proxy uses latency-based routing to determine the closest Reader Instance for read traffic, and redirects all write traffic to the Writer Instance. The Heimdall Configuration stores the Amazon Resource Name (ARN) of the global cluster. It automatically detects failover and cross-Region on the cluster, and directs traffic accordingly.

With an Aurora Global Database, there are two approaches to failover:

  • Managed planned failover. To relocate your primary database cluster to one of the secondary Regions in your Aurora global database, see Managed planned failovers with Amazon Aurora Global Database. With this feature, RPO is 0 (no data loss) and it synchronizes secondary DB clusters with the primary before making any other changes. RTO for this automated process is typically less than that of the manual failover.
  • Manual unplanned failover. To recover from an unplanned outage, you can manually perform a cross-Region failover to one of the secondaries in your Aurora Global Database. The RTO for this manual process depends on how quickly you can manually recover an Aurora global database from an unplanned outage. The RPO is typically measured in seconds, but this is dependent on the Aurora storage replication lag across the network at the time of the failure.

The Heimdall Proxy automatically detects Amazon Relational Database Service (RDS) / Amazon Aurora configuration changes based on the ARN of the Aurora Global cluster. Therefore, both managed planned and manual unplanned failovers are supported.

Solution benefits for global applications

Implementing the Heimdall Proxy has many benefits for global applications:

  1. An Aurora Global Database has a primary DB cluster in one Region and up to five secondary DB clusters in different Regions. But the Heimdall Proxy deployment does not have this limitation. This allows for a larger number of endpoints to be globally deployed. Combined with Amazon Route 53 latency-based routing, new connections have a shorter establishment time. They can use connection pooling to connect to the database, which reduces overall connection latency.
  2. SQL results are cached to the application for faster response times.
  3. The proxy intelligently routes non-cached queries. When safe to do so, the closest (lowest latency) reader will be used. When not safe to access the reader, the query will be routed to the global writer. Proxy nodes globally synchronize their state to ensure that volatile tables are locked to provide ACID compliance.

For more information on configuring the Heimdall Proxy and Amazon Route 53 for a global database, read the Heimdall Proxy for Aurora Global Database Solution Guide.

Download a free trial from the AWS Marketplace.

Resources:

Heimdall Data, based in the San Francisco Bay Area, is an AWS Advanced ISV partner. They have AWS Service Ready designations for Amazon RDS and Amazon Redshift. Heimdall Data offers a database proxy that offloads SQL improving database scale. Deployment does not require code changes.

Amazon Elastic Kubernetes Service Adds IPv6 Networking

Post Syndicated from Sébastien Stormacq original https://aws.amazon.com/blogs/aws/amazon-elastic-kubernetes-service-adds-ipv6-networking/

Starting today, you can deploy applications that use IPv6 address space on Amazon Elastic Kubernetes Service (EKS).

Many of our customers are standardizing Kubernetes as their compute infrastructure platform for cloud and on-premises applications. Amazon EKS makes it easy to deploy containerized workloads. It provides highly available clusters and automates tasks such as patching, node provisioning, and updates.

Kubernetes uses a flat networking model that requires each pod to receive an IP address. This simplified approach enables low-friction porting of applications from virtual machines to containers but requires a significant number of IP addresses that many private VPC IPv4 networks are not equipped to handle. Some cluster administrators work around this IPv4 space limitation by installing container network plugins (CNI) that virtualize IP addresses a layer above the VPC, but this architecture limits an administrator’s ability to effectively observe and troubleshoot applications and has a negative impact on network performance at scale. Further, to communicate with internet services outside the VPC, traffic from IPv4 pods is routed through multiple network hops before reaching its destination, which adds latency and puts a strain on network engineering teams who need to maintain complex routing setups.

To avoid IP address exhaustion, minimize latency at scale, and simplify routing configuration, the solution is to use IPv6 address space.

IPv6 is not new. In 1996, I bought my first book on “IPng, Internet Protocol Next Generation”, as it was called 25 years ago. It provides a 64-bit address space, allowing 3.4 x 10^38 possible IP addresses for our devices, servers, or containers. We could assign an IPv6 address to every atom on the surface of the planet and still have enough addresses left to do another 100-plus Earths.

IPng Internet protocol Next Generation bookThere are a few advantages to using Amazon EKS clusters with an IPv6 network. First, you can run more pods on one single host or subnet without the risk of exhausting all available IPv4 addresses available in your VPC. Second, it allows for lower-latency communications with other IPv6 services, running on-premises, on AWS, or on the internet, by avoiding an extra NAT hop. Third, it relieves network engineers of the burden of maintaining complex routing configurations.

Kubernetes cluster administrators can focus on migrating and scaling applications without spending efforts working around IPv4 limits. Finally, pod networking is configured so that the pods can communicate with IPv4-based applications outside the cluster, allowing you to adopt the benefits of IPv6 on Amazon EKS without requiring that all dependent services deployed across your organization are first migrated to IPv6.

As usual, I built a short demo to show you how it works.

How It Works
Before I get started, I create an IPv6 VPC. I use this CDK script to create an IPv6-enabled VPC in a few minutes (thank you Angus Lees for the code). Just install CDK v2 (npm install -g aws-cdk@next) and deploy the stack (cdk bootstrap && cdk deploy).

When the VPC with IPv6 is created, I use the console to configure auto-assignment of IPv6 addresses to resources deployed in the public subnets (I do this for each public subnet).

auto assign IPv6 addresses in subnet

I take note of the subnet IDs created by the CDK script above (they are listed in the output of the script) and define a couple of variables I’ll use throughout the demo. I also create a cluster IAM role and a node IAM role, as described in the Amazon EKS documentation. When you already have clusters deployed, these two roles exist already.

I open a Terminal and type:


CLUSTER_ROLE_ARN="arn:aws:iam::0123456789:role/EKSClusterRole"
NODE_ROLE_ARN="arn:aws:iam::0123456789:role/EKSNodeRole"
SUBNET1="subnet-06000a8"
SUBNET2="subnet-03000cc"
CLUSTER_NAME="AWSNewsBlog"
KEYPAIR_NAME="my-key-pair-name"

Next, I create an Amazon EKS IPv6 cluster. In a terminal, I type:


aws eks create-cluster --cli-input-json "{
\"name\": \"${CLUSTER_NAME}\",
\"version\": \"1.21\",
\"roleArn\": \"${CLUSTER_ROLE_ARN}\",
\"resourcesVpcConfig\": {
\"subnetIds\": [
    \"${SUBNET1}\", \"${SUBNET2}\"
],
\"endpointPublicAccess\": true,
\"endpointPrivateAccess\": true
},
\"kubernetesNetworkConfig\": {
    \"ipFamily\": \"ipv6\"
}
}"

{
    "cluster": {
        "name": "AWSNewsBlog",
        "arn": "arn:aws:eks:us-west-2:486652066693:cluster/AWSNewsBlog",
        "createdAt": "2021-11-02T17:29:32.989000+01:00",
        "version": "1.21",

...redacted for brevity...

        "status": "CREATING",
        "certificateAuthority": {},
        "platformVersion": "eks.4",
        "tags": {}
    }
}

I use the describe-cluster while waiting for the cluster to be created. When the cluster is ready, it has "status" : "ACTIVE"

aws eks describe-cluster --name "${CLUSTER_NAME}"

Then I create a node group:

aws eks create-nodegroup                       \
        --cluster-name ${CLUSTER_NAME}         \
        --nodegroup-name AWSNewsBlog-nodegroup \
        --node-role ${NODE_ROLE_ARN}           \
        --subnets "${SUBNET1}" "${SUBNET2}"    \
        --remote-access ec2SshKey=${KEYPAIR_NAME}
		
{
    "nodegroup": {
        "nodegroupName": "AWSNewsBlog-nodegroup",
        "nodegroupArn": "arn:aws:eks:us-west-2:0123456789:nodegroup/AWSNewsBlog/AWSNewsBlog-nodegroup/3ebe70c7-6c45-d498-6d42-4001f70e7833",
        "clusterName": "AWSNewsBlog",
        "version": "1.21",
        "releaseVersion": "1.21.4-20211101",

        "status": "CREATING",
        "capacityType": "ON_DEMAND",

... redacted for brevity ...

}		

Once the node group is created, I see two EC2 instances in the console. I use the AWS Command Line Interface (CLI) to verify that the instances received an IPv6 address:

aws ec2 describe-instances --query "Reservations[].Instances[? State.Name == 'running' ][].NetworkInterfaces[].Ipv6Addresses" --output text 

2600:1f13:812:0000:0000:0000:0000:71eb
2600:1f13:812:0000:0000:0000:0000:3c07

I use the kubectl command to verify the cluster from a Kubernetes point of view.

kubectl get nodes -o wide

NAME                                       STATUS   ROLES    AGE     VERSION               INTERNAL-IP                              EXTERNAL-IP    OS-IMAGE         KERNEL-VERSION                CONTAINER-RUNTIME
ip-10-0-0-108.us-west-2.compute.internal   Ready    <none>   2d13h   v1.21.4-eks-033ce7e   2600:1f13:812:0000:0000:0000:0000:2263   18.0.0.205   Amazon Linux 2   5.4.149-73.259.amzn2.x86_64   docker://20.10.7
ip-10-0-1-217.us-west-2.compute.internal   Ready    <none>   2d13h   v1.21.4-eks-033ce7e   2600:1f13:812:0000:0000:0000:0000:7f3e   52.0.0.122   Amazon Linux 2   5.4.149-73.259.amzn2.x86_64   docker://20.10.7

Then I deploy a Pod. I follow these steps in the EKS documentation. It deploys a sample nginx web server.

kubectl create namespace aws-news-blog
namespace/aws-news-blog created

# sample-service.yml is available at https://docs.aws.amazon.com/eks/latest/userguide/sample-deployment.html
kubectl apply -f  sample-service.yml 
service/my-service created
deployment.apps/my-deployment created

kubectl get pods -n aws-news-blog -o wide
NAME                             READY   STATUS    RESTARTS   AGE   IP                           NODE                                       NOMINATED NODE   READINESS GATES
my-deployment-5dd5dfd6b9-7rllg   1/1     Running   0          17m   2600:0000:0000:0000:405b::2   ip-10-0-1-217.us-west-2.compute.internal   <none>           <none>
my-deployment-5dd5dfd6b9-h6mrt   1/1     Running   0          17m   2600:0000:0000:0000:46f9::    ip-10-0-0-108.us-west-2.compute.internal   <none>           <none>
my-deployment-5dd5dfd6b9-mrkfv   1/1     Running   0          17m   2600:0000:0000:0000:46f9::1   ip-10-0-0-108.us-west-2.compute.internal   <none>           <none>

I take note of the IPv6 address of my pods, and try to connect it from my laptop. As my awesome service provider doesn’t provide me with an IPv6 at home yet, the connection fails. This is expected as the pods do not have an IPv4 address at all. Notice the -g option telling curl to not consider : in the IP address as the separator for the port number and -6 to tell curl to connect through IPv6 only (required when you provide curl with a DNS hostname).

curl -g -6 http://\[2600:0000:0000:35000000:46f9::1\]
curl: (7) Couldn't connect to server

To test IPv6 connectivity, I start a dual stack (IPv4 and IPv6) EC2 instance in the same VPC as the cluster. I SSH connect to the instance and try the curl command again. I see I receive the default HTML page served by nginx. IPv6 connectivity to the pod works!

curl -g -6 http://\[2600:0000:0000:35000000:46f9::1\]
<!DOCTYPE html>
<html>
<head>
<title>Welcome to nginx!</title>

... redacted for brevity ...

<p><em>Thank you for using nginx.</em></p>
</body>
</html>

If it does not work for you, verify the security group for the cluster EC2 nodes and be sure it has a rule allowing incoming connections on port TCP 80 from ::/0.

A Few Things to Remember
Before I wrap up, I’d like to answer some frequent questions received from customers who have already experimented with this new capability:

Pricing and Availability
IPv6 support for your Amazon Elastic Kubernetes Service (EKS) cluster is available today in all AWS Regions where Amazon EKS is available, at no additional cost.

Go try it out and build your first IPv6 cluster today.

— seb

Continuous runtime security monitoring with AWS Security Hub and Falco

Post Syndicated from Rajarshi Das original https://aws.amazon.com/blogs/security/continuous-runtime-security-monitoring-with-aws-security-hub-and-falco/

Customers want a single and comprehensive view of the security posture of their workloads. Runtime security event monitoring is important to building secure, operationally excellent, and reliable workloads, especially in environments that run containers and container orchestration platforms. In this blog post, we show you how to use services such as AWS Security Hub and Falco, a Cloud Native Computing Foundation project, to build a continuous runtime security monitoring solution.

With the solution in place, you can collect runtime security findings from multiple AWS accounts running one or more workloads on AWS container orchestration platforms, such as Amazon Elastic Kubernetes Service (Amazon EKS) or Amazon Elastic Container Service (Amazon ECS). The solution collates the findings across those accounts into a designated account where you can view the security posture across accounts and workloads.


Solution overview

Security Hub collects security findings from other AWS services using a standardized AWS Security Findings Format (ASFF). Falco provides the ability to detect security events at runtime for containers. Partner integrations like Falco are also available on Security Hub and use ASFF. Security Hub provides a custom integrations feature using ASFF to enable collection and aggregation of findings that are generated by custom security products.

The solution in this blog post uses AWS FireLens, Amazon CloudWatch Logs, and AWS Lambda to enrich logs from Falco and populate Security Hub.

Figure : Architecture diagram of continuous runtime security monitoring

Figure 1: Architecture diagram of continuous runtime security monitoring

Here’s how the solution works, as shown in Figure 1:

  1. An AWS account is running a workload on Amazon EKS.
    1. Runtime security events detected by Falco for that workload are sent to CloudWatch logs using AWS FireLens.
    2. CloudWatch logs act as the source for FireLens and a trigger for the Lambda function in the next step.
    3. The Lambda function transforms the logs into the ASFF. These findings can now be imported into Security Hub.
    4. The Security Hub instance that is running in the same account as the workload running on Amazon EKS stores and processes the findings provided by Lambda and provides the security posture to users of the account. This instance also acts as a member account for Security Hub.
  2. Another AWS account is running a workload on Amazon ECS.
    1. Runtime security events detected by Falco for that workload are sent to CloudWatch logs using AWS FireLens.
    2. CloudWatch logs acts as the source for FireLens and a trigger for the Lambda function in the next step.
    3. The Lambda function transforms the logs into the ASFF. These findings can now be imported into Security Hub.
    4. The Security Hub instance that is running in the same account as the workload running on Amazon ECS stores and processes the findings provided by Lambda and provides the security posture to users of the account. This instance also acts as another member account for Security Hub.
  3. The designated Security Hub administrator account combines the findings generated by the two member accounts, and then provides a comprehensive view of security alerts and security posture across AWS accounts. If your workloads span multiple regions, Security Hub supports aggregating findings across Regions.


Prerequisites

For this walkthrough, you should have the following in place:

  1. Three AWS accounts.

    Note: We recommend three accounts so you can experience Security Hub’s support for a multi-account setup. However, you can use a single AWS account instead to host the Amazon ECS and Amazon EKS workloads, and send findings to Security Hub in the same account. If you are using a single account, skip the following account specific-guidance. If you are integrated with AWS Organizations, the designated Security Hub administrator account will automatically have access to the member accounts.

  2. Security Hub set up with an administrator account on one account.
  3. Security Hub set up with member accounts on two accounts: one account to host the Amazon EKS workload, and one account to host the Amazon ECS workload.
  4. Falco set up on the Amazon EKS and Amazon ECS clusters, with logs routed to CloudWatch Logs using FireLens. For instructions on how to do this, see:

    Important: Take note of the names of the CloudWatch Logs groups, as you will need them in the next section.

  5. AWS Cloud Development Kit (CDK) installed on the member accounts to deploy the solution that provides the custom integration between Falco and Security Hub.


Deploying the solution

In this section, you will learn how to deploy the solution and enable the CloudWatch Logs group. Enabling the CloudWatch Logs group is the trigger for running the Lambda function in both member accounts.

To deploy this solution in your own account

  1. Clone the aws-securityhub-falco-ecs-eks-integration GitHub repository by running the following command.
    $git clone https://github.com/aws-samples/aws-securityhub-falco-ecs-eks-integration
  2. Follow the instructions in the README file provided on GitHub to build and deploy the solution. Make sure that you deploy the solution to the accounts hosting the Amazon EKS and Amazon ECS clusters.
  3. Navigate to the AWS Lambda console and confirm that you see the newly created Lambda function. You will use this function in the next section.
Figure : Lambda function for Falco integration with Security Hub

Figure 2: Lambda function for Falco integration with Security Hub

To enable the CloudWatch Logs group

  1. In the AWS Management Console, select the Lambda function shown in Figure 2—AwsSecurityhubFalcoEcsEksln-lambdafunction—and then, on the Function overview screen, select + Add trigger.
  2. On the Add trigger screen, provide the following information and then select Add, as shown in Figure 3.
    • Trigger configuration – From the drop-down, select CloudWatch logs.
    • Log group – Choose the Log group you noted in Step 4 of the Prerequisites. In our setup, the log group for the Amazon ECS and Amazon EKS clusters, deployed in separate AWS accounts, was set with the same value (falco).
    • Filter name – Provide a name for the filter. In our example, we used the name falco.
    • Filter pattern – optional – Leave this field blank.
    Figure 3: Lambda function trigger - CloudWatch Log group

    Figure 3: Lambda function trigger – CloudWatch Log group

  3. Repeat these steps (as applicable) to set up the trigger for the Lambda function deployed in other accounts.


Testing the deployment

Now that you’ve deployed the solution, you will verify that it’s working.

With the default rules, Falco generates alerts for activities such as:

  • An attempt to write to a file below the /etc folder. The /etc folder contains important system configuration files.
  • An attempt to open a sensitive file (such as /etc/shadow) for reading.

To test your deployment, you will attempt to perform these activities to generate Falco alerts that are reported as Security Hub findings in the same account. Then you will review the findings.

To test the deployment in member account 1

  1. Run the following commands to trigger an alert in member account 1, which is running an Amazon EKS cluster. Replace <container_name> with your own value.
    kubectl exec -it <container_name> /bin/bash
    touch /etc/5
    cat /etc/shadow > /dev/null
  2. To see the list of findings, log in to your Security Hub admin account and navigate to Security Hub > Findings. As shown in Figure 4, you will see the alerts generated by Falco, including the Falco-generated title, and the instance where the alert was triggered.

    Figure 4: Findings in Security Hub

    Figure 4: Findings in Security Hub

  3. To see more detail about a finding, check the box next to the finding. Figure 5 shows some of the details for the finding Read sensitive file untrusted.
    Figure 5: Sensitive file read finding - detail view

    Figure 5: Sensitive file read finding – detail view

    Figure 6 shows the Resources section of this finding, that includes the instance ID of the Amazon EKS cluster node. In our example this is the Amazon Elastic Compute Cloud (Amazon EC2) instance.

    Figure 6: Resource Detail in Security Hub finding

To test the deployment in member account 2

  1. Run the following commands to trigger a Falco alert in member account 2, which is running an Amazon ECS cluster. Replace <<container_id> with your own value.
    docker exec -it <container_id> bash
    touch /etc/5
    cat /etc/shadow > /dev/null
  2. As in the preceding example with member account 1, to view the findings related to this alert, navigate to your Security Hub admin account and select Findings.

To view the collated findings from both member accounts in Security Hub

  1. In the designated Security Hub administrator account, navigate to Security Hub > Findings. The findings from both member accounts are collated in the designated Security Hub administrator account. You can use this centralized account to view the security posture across accounts and workloads. Figure 7 shows two findings, one from each member account, viewable in the Single Pane of Glass administrator account.

    Figure 7: Write below /etc findings in a single view

    Figure 7: Write below /etc findings in a single view

  2. To see more information and a link to the corresponding member account where the finding was generated, check the box next to the finding. Figure 8 shows the account detail associated with a specific finding in member account 1.
    Figure 8: Write under /etc detail view in Security Hub admin account

    Figure 8: Write under /etc detail view in Security Hub admin account

    By centralizing and enriching the findings from Falco, you can take action more quickly or perform automated remediation on the impacted resources.


Cleaning up

To clean up this demo:

  1. Delete the CloudWatch Logs trigger from the Lambda functions that were created in the section To enable the CloudWatch Logs group.
  2. Delete the Lambda functions by deleting the CloudFormation stack, created in the section To deploy this solution in your own account.
  3. Delete the Amazon EKS and Amazon ECS clusters created as part of the Prerequisites.


Conclusion

In this post, you learned how to achieve multi-account continuous runtime security monitoring for container-based workloads running on Amazon EKS and Amazon ECS. This is achieved by creating a custom integration between Falco and Security Hub.

You can extend this solution in a number of ways. For example:

  • You can forward findings across accounts using a single source to security information and event management (SIEM) tools such as Splunk.
  • You can perform automated remediation activities based on the findings generated, using Lambda.

To learn more about managing a centralized Security Hub administrator account, see Managing administrator and member accounts. To learn more about working with ASFF, see AWS Security Finding Format (ASFF) in the documentation. To learn more about the Falco engine and rule structure, see the Falco documentation.

If you have feedback about this post, submit comments in the Comments section below.

Want more AWS Security news? Follow us on Twitter.

Rajarshi Das

Rajarshi Das

Rajarshi is a Solutions Architect at Amazon Web Services. He focuses on helping Public Sector customers accelerate their security and compliance certifications and authorizations by architecting secure and scalable solutions. Rajarshi holds 4 AWS certifications including AWS Certified Solutions Architect – Professional and AWS Certified Security – Specialist.

Author

Adam Cerini

Adam is a Senior Solutions Architect with Amazon Web Services. He focuses on helping Public Sector customers architect scalable, secure, and cost effective systems. Adam holds 5 AWS certifications including AWS Certified Solutions Architect – Professional and AWS Certified Security – Specialist.