Post Syndicated from Debu Panda original https://aws.amazon.com/blogs/big-data/use-the-amazon-redshift-data-api-to-interact-with-amazon-redshift-serverless/
Amazon Redshift is a fast, scalable, secure, and fully managed cloud data warehouse that makes it simple and cost-effective to analyze all your data using standard SQL and your existing ETL (extract, transform, and load), business intelligence (BI), and reporting tools. Tens of thousands of customers use Amazon Redshift to process exabytes of data per day and power analytics workloads such as BI, predictive analytics, and real-time streaming analytics. Amazon Redshift Serverless makes it convenient for you to run and scale analytics without having to provision and manage data warehouses. With Redshift Serverless, data analysts, developers, and data scientists can now use Amazon Redshift to get insights from data in seconds by loading data into and querying records from the data warehouse.
As a data engineer or application developer, for some use cases, you want to interact with the Redshift Serverless data warehouse to load or query data with a simple API endpoint without having to manage persistent connections. With the Amazon Redshift Data API, you can interact with Redshift Serverless without having to configure JDBC or ODBC. This makes it easier and more secure to work with Redshift Serverless and opens up new use cases.
This post explains how to use the Data API with Redshift Serverless from the AWS Command Line Interface (AWS CLI) and Python. If you want to use the Data API with Amazon Redshift clusters, refer to Using the Amazon Redshift Data API to interact with Amazon Redshift clusters.
Introducing the Data API
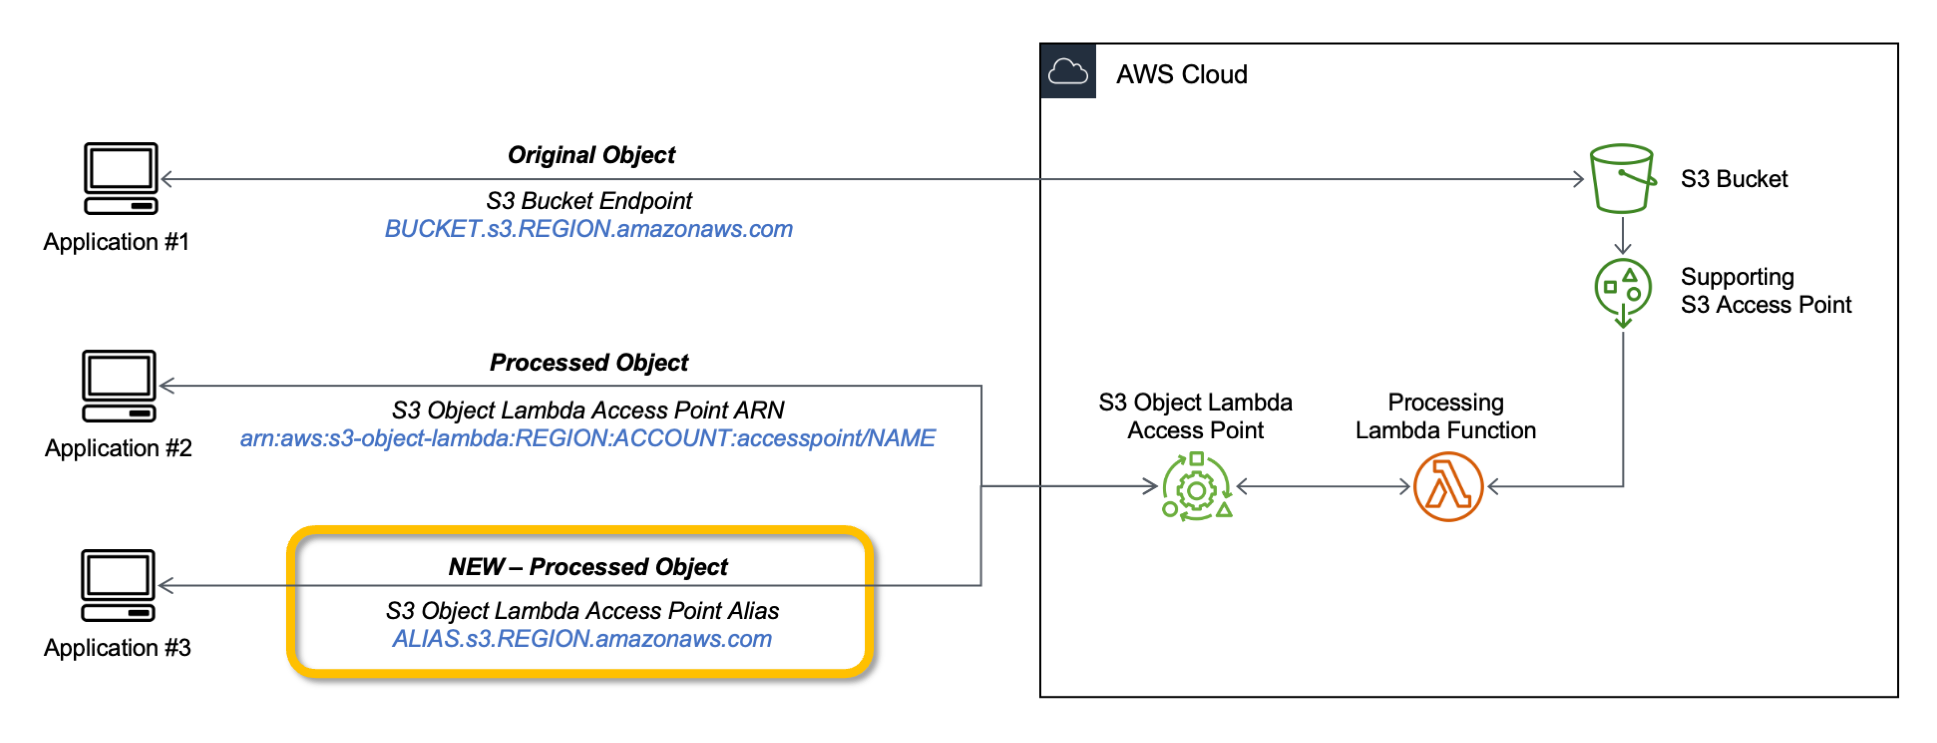
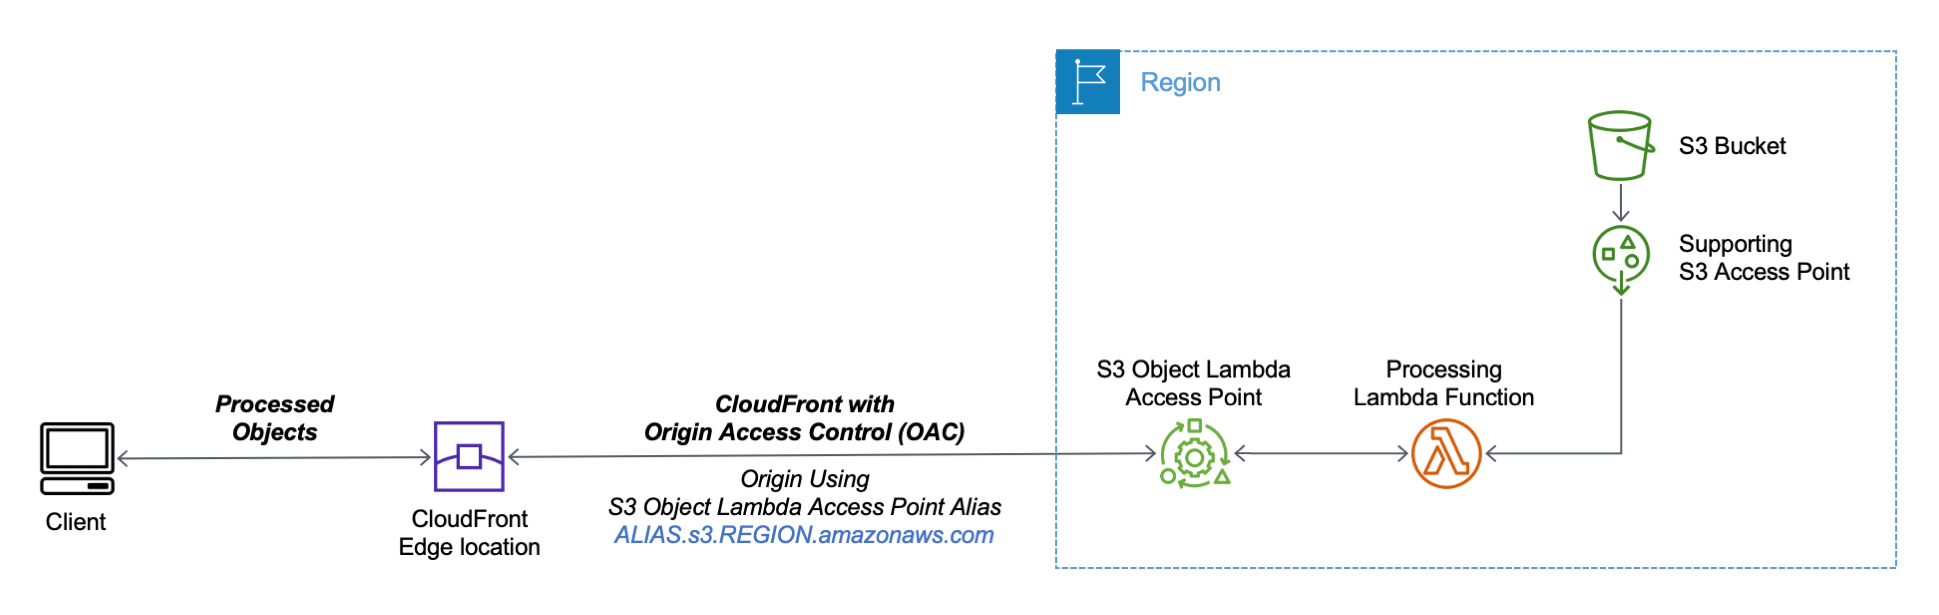
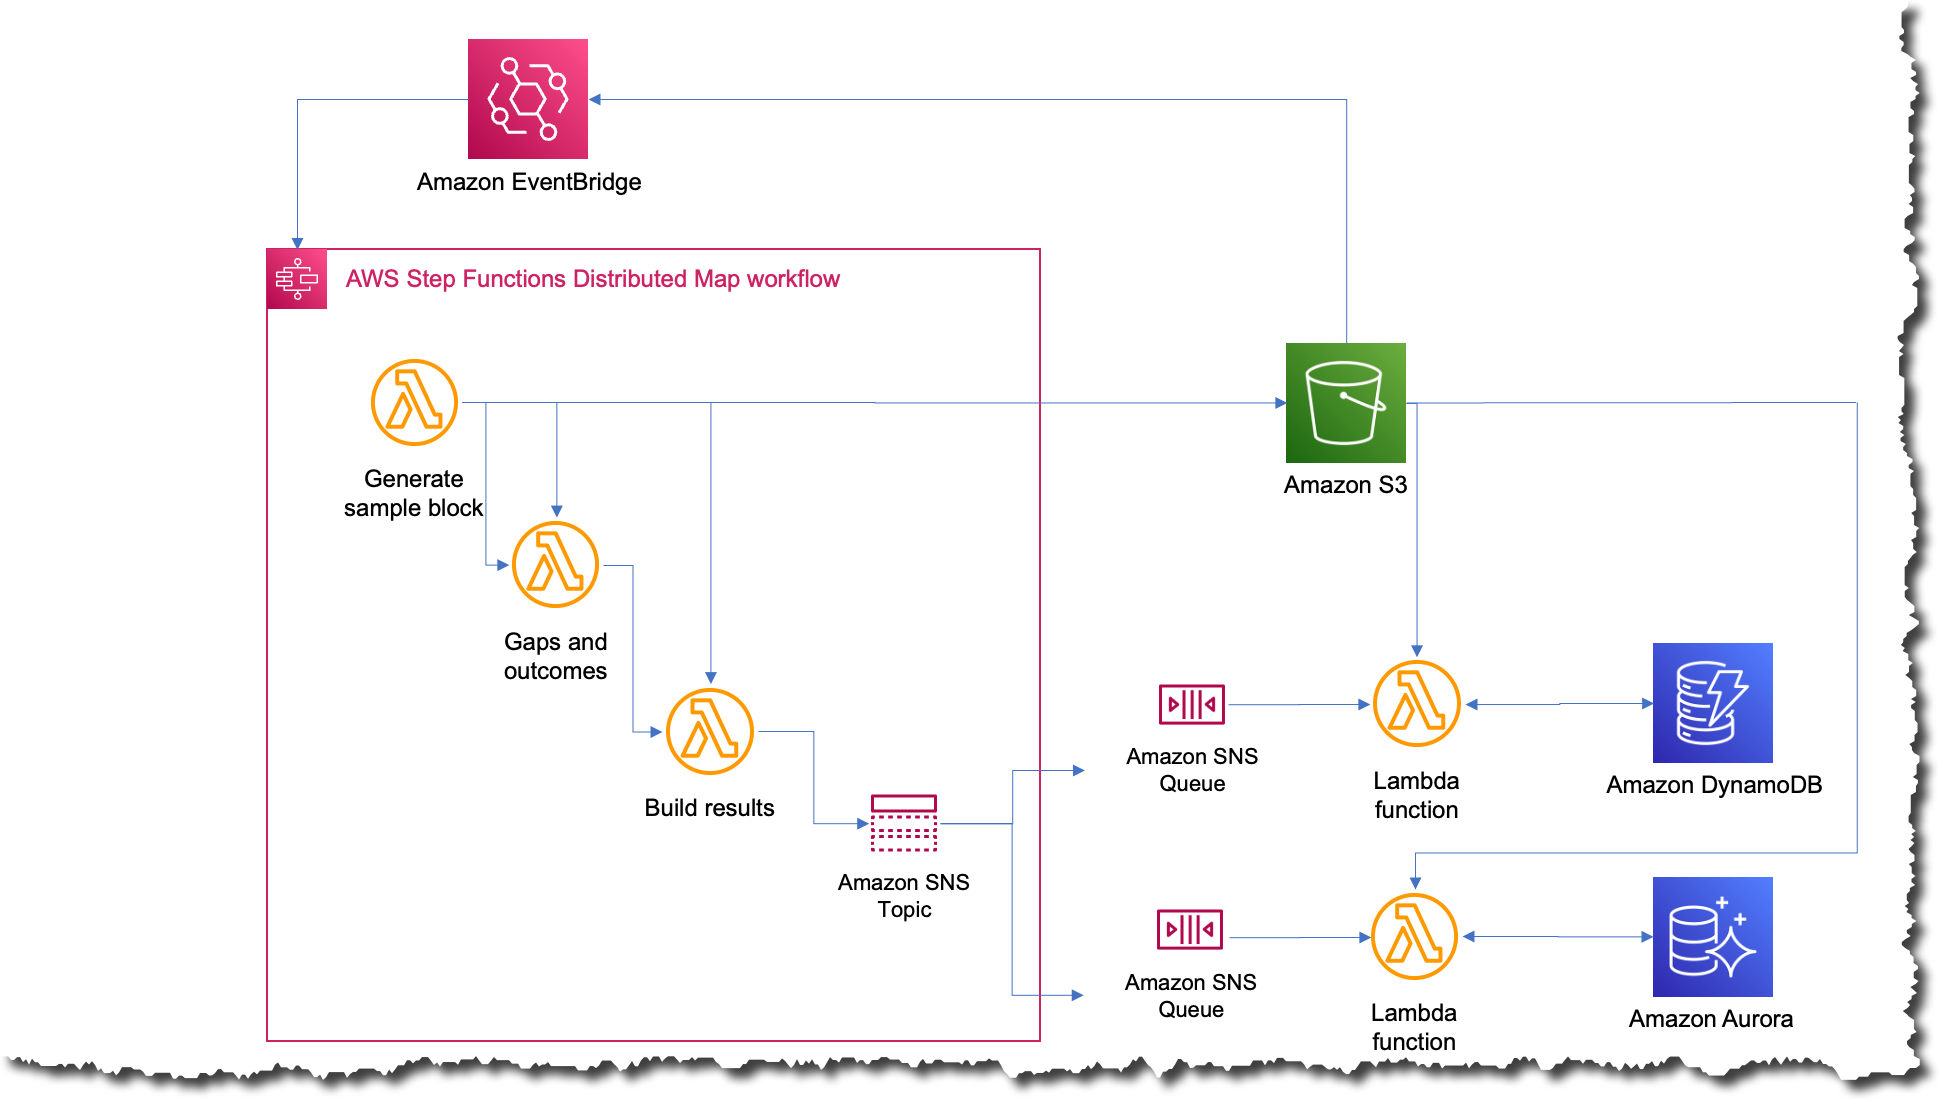
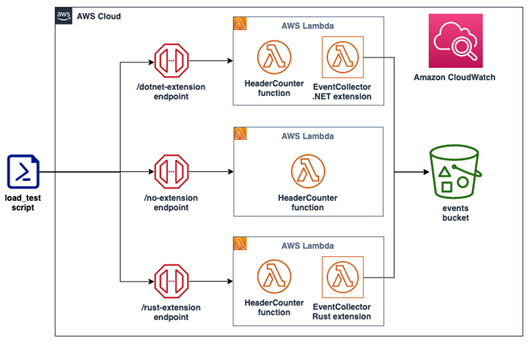
The Data API enables you to seamlessly access data from Redshift Serverless with all types of traditional, cloud-native, and containerized serverless web service-based applications and event-driven applications.
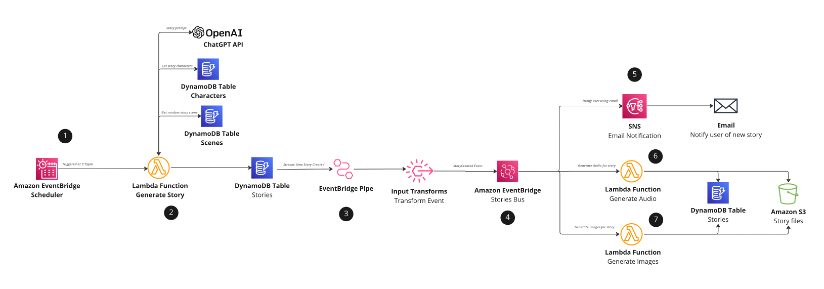
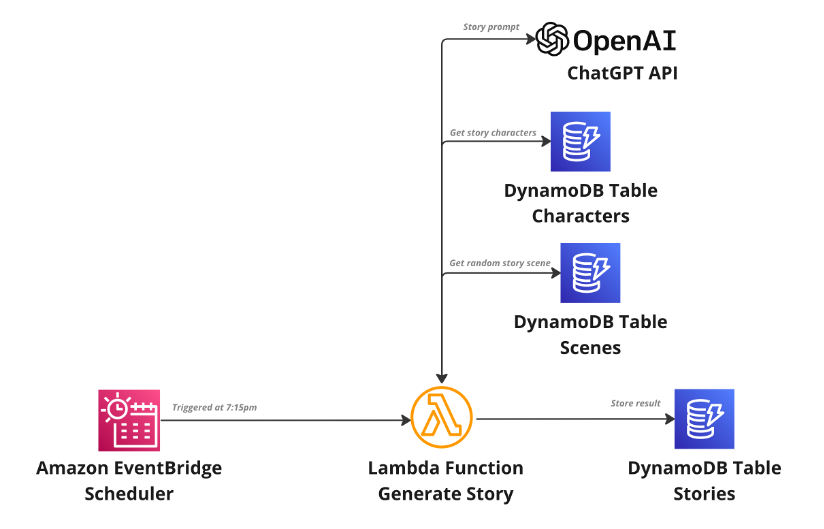
The following diagram illustrates this architecture.

The Data API simplifies data access, ingest, and egress from programming languages and platforms supported by the AWS SDK such as Python, Go, Java, Node.js, PHP, Ruby, and C++.
The Data API simplifies access to Amazon Redshift by eliminating the need for configuring drivers and managing database connections. Instead, you can run SQL commands to Redshift Serverless by simply calling a secured API endpoint provided by the Data API. The Data API takes care of managing database connections and buffering data. The Data API is asynchronous, so you can retrieve your results later. Your query results are stored for 24 hours. The Data API federates AWS Identity and Access Management (IAM) credentials so you can use identity providers like Okta or Azure Active Directory or database credentials stored in Secrets Manager without passing database credentials in API calls.
For customers using AWS Lambda, the Data API provides a secure way to access your database without the additional overhead for Lambda functions to be launched in an Amazon VPC. Integration with the AWS SDK provides a programmatic interface to run SQL statements and retrieve results asynchronously.
Relevant use cases
The Data API is not a replacement for JDBC and ODBC drivers, and is suitable for use cases where you don’t need a persistent connection to a serverless data warehouse. It’s applicable in the following use cases:
- Accessing Amazon Redshift from custom applications with any programming language supported by the AWS SDK. This enables you to integrate web service-based applications to access data from Amazon Redshift using an API to run SQL statements. For example, you can run SQL from JavaScript.
- Building a serverless data processing workflow.
- Designing asynchronous web dashboards because the Data API lets you run long-running queries without having to wait for them to complete.
- Running your query one time and retrieving the results multiple times without having to run the query again within 24 hours.
- Building your ETL pipelines with AWS Step Functions, Lambda, and stored procedures.
- Having simplified access to Amazon Redshift from Amazon SageMaker and Jupyter notebooks.
- Building event-driven applications with Amazon EventBridge and Lambda.
- Scheduling SQL scripts to simplify data load, unload, and refresh of materialized views.
The Data API GitHub repository provides examples for different use cases for both Redshift Serverless and provisioned clusters.
Create a Redshift Serverless workgroup
If you haven’t already created a Redshift Serverless data warehouse, or want to create a new one, refer to the Getting Started Guide. This guide walks you through the steps of creating a namespace and workgroup with their names as default. Also, ensure that you have created an IAM role and make sure that the IAM role you attach to your Redshift Serverless namespace has AmazonS3ReadOnlyAccess permission. You can use the AWS Management Console to create an IAM role and assign Amazon Simple Storage Service (Amazon S3) privileges (refer to Loading in data from Amazon S3). In this post, we create a table and load data using the COPY command.
Prerequisites for using the Data API
You must be authorized to access the Data API. Amazon Redshift provides the RedshiftDataFullAccess managed policy, which offers full access to Data API. This policy also allows access to Redshift Serverless workgroups, Secrets Manager, and API operations needed to authenticate and access a Redshift Serverless workgroup by using IAM credentials.
You can also create your own IAM policy that allows access to specific resources by starting with RedshiftDataFullAccess as a template.
The Data API allows you to access your database either using your IAM credentials or secrets stored in Secrets Manager. In this post, we use IAM credentials.
When you federate your IAM credentials to connect with Amazon Redshift, it automatically creates a database user for the IAM user that is being used. It uses the GetCredentials API to get temporary database credentials. If you want to provide specific database privileges to your users with this API, you can use an IAM role with the tag name RedshiftDBRoles with a list of roles separated by colons. For example, if you want to assign database roles such as sales and analyst, you can have a value sales:analyst assigned to RedshiftDBRoles.
Use the Data API from the AWS CLI
You can use the Data API from the AWS CLI to interact with the Redshift Serverless workgroup and namespace. For instructions on configuring the AWS CLI, see Setting up the AWS CLI. The Amazon Redshift Serverless CLI (aws redshift-serverless) is a part of AWS CLI that lets you manage Amazon Redshift workgroups and namespaces, such as creating, deleting, setting usage limits, tagging resource, and more. The Data API provides a command line interface to the AWS CLI (aws redshift-data) that allows you to interact with the databases in Redshift Serverless.
You can invoke help using the following command:
The following table shows you the different commands available with the Data API CLI.
| Command |
Description |
list-databases |
Lists the databases in a workgroup. |
list-schemas |
Lists the schemas in a database. You can filter this by a matching schema pattern. |
list-tables |
Lists the tables in a database. You can filter the tables list by a schema name pattern, a matching table name pattern, or a combination of both. |
describe-table |
Describes the detailed information about a table including column metadata. |
execute-statement |
Runs a SQL statement, which can be SELECT, DML, DDL, COPY, or UNLOAD. |
batch-execute-statement |
Runs multiple SQL statements in a batch as a part of single transaction. The statements can be SELECT, DML, DDL, COPY, or UNLOAD. |
cancel-statement |
Cancels a running query. To be canceled, a query must not be in the FINISHED or FAILED state. |
describe-statement |
Describes the details of a specific SQL statement run. The information includes when the query started, when it finished, the number of rows processed, and the SQL statement. |
list-statements |
Lists the SQL statements in the last 24 hours. By default, only finished statements are shown. |
get-statement-result |
Fetches the temporarily cached result of the query. The result set contains the complete result set and the column metadata. You can paginate through a set of records to retrieve the entire result as needed. |
If you want to get help on a specific command, run the following command:
aws redshift-data list-tables help
Now we look at how you can use these commands.
List databases
Most organizations use a single database in their Amazon Redshift workgroup. You can use the following command to list the databases in your Serverless endpoint. This operation requires you to connect to a database and therefore requires database credentials.
aws redshift-data list-databases --database dev --workgroup-name default
List schemas
Similar to listing databases, you can list your schemas by using the list-schemas command:
aws redshift-data list-schemas --database dev --workgroup-name default
If you have several schemas that match demo (demo, demo2, demo3, and so on), you can optionally provide a pattern to filter your results matching to that pattern:
aws redshift-data list-schemas --database dev --workgroup-name default --schema-pattern "demo%"
List tables
The Data API provides a simple command, list-tables, to list tables in your database. You might have thousands of tables in a schema; the Data API lets you paginate your result set or filter the table list by providing filter conditions.
You can search across your schema with table-pattern; for example, you can filter the table list by a table name prefix across all your schemas in the database or filter your tables list in a specific schema pattern by using schema-pattern.
The following is a code example that uses both:
aws redshift-data list-tables --database dev --workgroup-name default --schema-pattern "demo%" --table-pattern “orders%”
Run SQL commands
You can run SELECT, DML, DDL, COPY, or UNLOAD commands for Amazon Redshift with the Data API. You can optionally specify the –with-event option if you want to send an event to EventBridge after the query run, then the Data API will send the event with queryId and final run status.
Create a schema
Let’s use the Data API to see how you can create a schema. The following command lets you create a schema in your database. You don’t have to run this SQL if you have pre-created the schema. You have to specify –-sql to specify your SQL commands.
aws redshift-data execute-statement --database dev --workgroup-name default \
--sql "CREATE SCHEMA demo;"
The following shows an example output of execute-statement:
{
    "CreatedAt": "2023-04-07T17:14:43.038000+00:00",
    "Database": "dev",
    "DbUser": "IAMR:Admin",
    "Id": "8e4e5af3-9af9-4567-8e70-7849515b3a79",
    "WorkgroupName": "default"
}
We discuss later in this post how you can check the status of a SQL that you ran with execute-statement.
Create a table
You can use the following command to create a table with the CLI:
aws redshift-data execute-statement --database dev --workgroup-name default  \
   --sql "CREATE TABLE demo.green_201601( \
  vendorid                VARCHAR(4), \
  pickup_datetime         TIMESTAMP, \
  dropoff_datetime        TIMESTAMP, \
  store_and_fwd_flag      VARCHAR(1), \
  ratecode                INT, \
  pickup_longitude        FLOAT4, \
  pickup_latitude         FLOAT4, \
  dropoff_longitude       FLOAT4, \
  dropoff_latitude        FLOAT4, \
  passenger_count         INT, \
  trip_distance           FLOAT4, \
  fare_amount             FLOAT4, \
  extra                   FLOAT4, \
  mta_tax                 FLOAT4, \
  tip_amount              FLOAT4, \
  tolls_amount            FLOAT4, \
  ehail_fee               FLOAT4, \
  improvement_surcharge   FLOAT4, \
  total_amount            FLOAT4, \
  payment_type            VARCHAR(4),\
  trip_type               VARCHAR(4));"
Load sample data
The COPY command lets you load bulk data into your table in Amazon Redshift. You can use the following command to load data into the table we created earlier:
aws redshift-data execute-statement --database dev --workgroup-name default --sql "COPY demo.green_201601 \
FROM 's3://us-west-2.serverless-analytics/NYC-Pub/green/green_tripdata_2016-01' \
IAM_ROLE default \
DATEFORMAT 'auto' \
IGNOREHEADER 1 \
DELIMITER ',' \
IGNOREBLANKLINES \
REGION 'us-west-2';"
Retrieve data
The following query uses the table we created earlier:
aws redshift-data execute-statement --database dev --workgroup-name default --sql "SELECT ratecode,  \
COUNT(*) FROM demo.green_201601 WHERE \
trip_distance > 5 GROUP BY 1 ORDER BY 1;"
The following shows an example output:
{
    "CreatedAt": "2023-04-07T17:25:16.030000+00:00",
    "Database": "dev",
    "DbUser": "IAMR:Admin",
    "Id": "cae88c08-0bb4-4279-8845-d5a8fefafade",
    "WorkgroupName": "default"
}
You can fetch results using the statement ID that you receive as an output of execute-statement.
Check the status of a statement
You can check the status of your statement by using describe-statement. The output for describe-statement provides additional details such as PID, query duration, number of rows in and size of the result set, and the query ID given by Amazon Redshift. You have to specify the statement ID that you get when you run the execute-statement command. See the following command:
aws redshift-data describe-statement --id cae88c08-0bb4-4279-8845-d5a8fefafade \
The following is an example output:
{
     "CreatedAt": "2023-04-07T17:27:15.937000+00:00",
     "Duration": 2602410468,
     "HasResultSet": true,
     "Id": "cae88c08-0bb4-4279-8845-d5a8fefafade",
     "QueryString": " SELECT ratecode, COUNT(*) FROM
     demo.green_201601 WHERE
     trip_distance > 5 GROUP BY 1 ORDER BY 1;",
     "RedshiftPid": 1073815670,
     "WorkgroupName": "default",
     "UpdatedAt": "2023-04-07T17:27:18.539000+00:00"
}
The status of a statement can be STARTED, FINISHED, ABORTED, or FAILED.
Run SQL statements with parameters
You can run SQL statements with parameters. The following example uses two named parameters in the SQL that is specified using a name-value pair:
aws redshift-data execute-statement --database dev --workgroup-name default --sql "select sellerid,sum(pricepaid) totalsales from sales where eventid >= :eventid and sellerid > :selrid group by sellerid" --parameters "[{\"name\": \"selrid\", \"value\": \"100\"},{\"name\": \"eventid\", \"value\": \"100\"}]"
The describe-statement returns QueryParameters along with QueryString.
You can map the name-value pair in the parameters list to one or more parameters in the SQL text, and the name-value parameter can be in random order. You can’t specify a NULL value or zero-length value as a parameter.
Cancel a running statement
If your query is still running, you can use cancel-statement to cancel a SQL query. See the following command:
aws redshift-data cancel-statement --id 39a0de2f-e85e-45ff-a0d7-cd074c348120
Fetch results from your query
You can fetch the query results by using get-statement-result. The query result is stored for 24 hours. See the following command:
aws redshift-data get-statement-result --id 7b61da88-1b11-4ade-956a-21085a29118d
The output of the result contains metadata such as the number of records fetched, column metadata, and a token for pagination.
Run multiple SQL statements
You can run multiple SELECT, DML, DDL, COPY, or UNLOAD commands for Amazon Redshift in a single transaction with the Data API. The batch-execute-statement enables you to create tables and run multiple COPY commands or create temporary tables as part of your reporting system and run queries on that temporary table. See the following code:
aws redshift-data batch-execute-statement --database dev --workgroup-name default \
--sqls "create temporary table mysales \
(firstname, lastname, total_quantity ) as \
SELECT firstname, lastname, total_quantity \
FROM   (SELECT buyerid, sum(qtysold) total_quantity \
        FROM  sales  \
        GROUP BY buyerid \
        ORDER BY total_quantity desc limit 10) Q, users \
WHERE Q.buyerid = userid \
ORDER BY Q.total_quantity desc;" "select * from mysales limit 100;"
The describe-statement for a multi-statement query shows the status of all sub-statements:
{
{
"CreatedAt": "2023-04-10T14:01:11.257000-07:00",
"Duration": 30564173,
"HasResultSet": true,
"Id": "23d99d7f-fd13-4686-92c8-e2c279715c21",
"RedshiftPid": 1073922185,
"RedshiftQueryId": 0,
"ResultRows": -1,
"ResultSize": -1,
"Status": "FINISHED",
"SubStatements": [
{
"CreatedAt": "2023-04-10T14:01:11.357000-07:00",
"Duration": 12779028,
"HasResultSet": false,
"Id": "23d99d7f-fd13-4686-92c8-e2c279715c21:1",
"QueryString": "create temporary table mysales (firstname, lastname,
total_quantity ) as \nSELECT firstname, lastname, total_quantity \nFROM (SELECT
buyerid, sum(qtysold) total_quantity\nFROM sales\nGROUP BY
buyerid\nORDER BY total_quantity desc limit 10) Q, users\nWHERE Q.buyerid =
userid\nORDER BY Q.total_quantity desc;",
"RedshiftQueryId": 0,
"ResultRows": 0,
"ResultSize": 0,
"Status": "FINISHED",
"UpdatedAt": "2023-04-10T14:01:11.807000-07:00"
},
{
"CreatedAt": "2023-04-10T14:01:11.357000-07:00",
"Duration": 17785145,
"HasResultSet": true,
"Id": "23d99d7f-fd13-4686-92c8-e2c279715c21:2",
"QueryString": ""select *\nfrom mysales limit 100;",
"RedshiftQueryId": 0,
"ResultRows": 40,
"ResultSize": 1276,
"Status": "FINISHED",
"UpdatedAt": "2023-04-10T14:01:11.911000-07:00"
}
],
"UpdatedAt": "2023-04-10T14:01:11.970000-07:00",
"WorkgroupName": "default"
}
In the preceding example, we had two SQL statements and therefore the output includes the ID for the SQL statements as 23d99d7f-fd13-4686-92c8-e2c279715c21:1 and 23d99d7f-fd13-4686-92c8-e2c279715c21:2. Each sub-statement of a batch SQL statement has a status, and the status of the batch statement is updated with the status of the last sub-statement. For example, if the last statement has status FAILED, then the status of the batch statement shows as FAILED.
You can fetch query results for each statement separately. In our example, the first statement is a SQL statement to create a temporary table, so there are no results to retrieve for the first statement. You can retrieve the result set for the second statement by providing the statement ID for the sub-statement:
aws redshift-data get-statement-result --id 23d99d7f-fd13-4686-92c8-e2c279715c21:2
Use the Data API with Secrets Manager
The Data API allows you to use database credentials stored in Secrets Manager. You can create a secret type as Other type of secret and then specify username and password. Note you can’t choose an Amazon Redshift cluster because Redshift Serverless is different than a cluster.

Let’s assume that you created a secret key for your credentials as defaultWG. You can use the secret-arn parameter to pass your secret key as follows:
aws redshift-data list-tables --database dev --workgroup-name default --secret-arn defaultWG --region us-west-1
Export the data
Amazon Redshift allows you to export from database tables to a set of files in an S3 bucket by using the UNLOAD command with a SELECT statement. You can unload data in either text or Parquet format. The following command shows you an example of how to use the data lake export with the Data API:
aws redshift-data execute-statement --database dev --workgroup-name default --sql "unload ('select * from demo.green_201601') to '<your-S3-bucket>' iam_role '<your-iam-role>'; "
You can use batch-execute-statement if you want to use multiple statements with UNLOAD or combine UNLOAD with other SQL statements.
Use the Data API from the AWS SDK
You can use the Data API in any of the programming languages supported by the AWS SDK. For this post, we use the AWS SDK for Python (Boto3) as an example to illustrate the capabilities of the Data API.
We first import the Boto3 package and establish a session:
import botocore.session as bc
import boto3

def get_client(service, endpoint=None, region="us-west-2"):
    session = bc.get_session()
    s = boto3.Session(botocore_session=session, region_name=region)
    if endpoint:
        return s.client(service, endpoint_url=endpoint)
    return s.client(service)
Get a client object
You can create a client object from the boto3.Session object and using RedshiftData:
rsd = get_client('redshift-data')
If you don’t want to create a session, your client is as simple as the following code:
import boto3
client = boto3.client('redshift-data')
Run a statement
The following example code uses the Secrets Manager key to run a statement. For this post, we use the table we created earlier. You can use DDL, DML, COPY, and UNLOAD in the SQL parameter:
resp = rsd.execute_statement(
    WorkgroupName ="default",
Database = "dev",
Sql = "SELECT ratecode, COUNT(*) totalrides FROM demo.green_201601 WHERE trip_distance > 5 GROUP BY 1 ORDER BY 1;"
)
As we discussed earlier, running a query is asynchronous; running a statement returns an ExecuteStatementOutput, which includes the statement ID.
If you want to publish an event to EventBridge when the statement is complete, you can use the additional parameter WithEvent set to true:
resp = rsd.execute_statement(
    Database="dev",
    WorkgroupName="default",
    Sql="SELECT ratecode, COUNT(*) totalrides FROM demo.green_201601 WHERE trip_distance > 5 GROUP BY 1 ORDER BY 1;",
WithEvent=True
)
Describe a statement
You can use describe_statement to find the status of the query and number of records retrieved:
id=resp['Id']
desc = rsd.describe_statement(Id=id)
if desc["Status"] == "FINISHED":
    print(desc["ResultRows"])
Fetch results from your query
You can use get_statement_result to retrieve results for your query if your query is complete:
if desc and desc["ResultRows"]  > 0:
    result = rsd.get_statement_result(Id=qid)
The get_statement_result command returns a JSON object that includes metadata for the result and the actual result set. You might need to process the data to format the result if you want to display it in a user-friendly format.
Fetch and format results
For this post, we demonstrate how to format the results with the Pandas framework. The post_process function processes the metadata and results to populate a DataFrame. The query function retrieves the result from a database in an Amazon Redshift cluster. See the following code:
import pandas as pd

def post_process(meta, records):
    columns = [k["name"] for k in meta]
    rows = []
    for r in records:
        tmp = []
        for c in r:
            tmp.append(c[list(c.keys())[0]])
        rows.append(tmp)
    return pd.DataFrame(rows, columns=columns)

def query(sql, workgroup="default ", database="dev"):
    resp = rsd.execute_statement(
        Database=database,
        WorkgroupName=workgroup,
        Sql=sql
    )
    qid = resp["Id"]
    print(qid)
    desc = None
    while True:
        desc = rsd.describe_statement(Id=qid)
        if desc["Status"] == "FINISHED" or desc["Status"] == "FAILED":
            break
    	print(desc["ResultRows"])
    if desc and desc["ResultRows"]  > 0:
        result = rsd.get_statement_result(Id=qid)
        rows, meta = result["Records"], result["ColumnMetadata"]
        return post_process(meta, rows)

pf=query("select * from demo.customer_activity limit 100;")
print(pf)
In this post, we demonstrated using the Data API with Python with Redshift Serverless. However, you can use the Data API with other programming languages supported by the AWS SDK. You can read how Roche democratized access to Amazon Redshift data using the Data API with Google Sheets. You can also address this type of use case with Redshift Serverless.
Best practices
We recommend the following best practices when using the Data API:
- Federate your IAM credentials to the database to connect with Amazon Redshift. Redshift Serverless allows users to get temporary database credentials with
GetCredentials. Redshift Serverless scopes the access to the specific IAM user and the database user is automatically created.
- Use a custom policy to provide fine-grained access to the Data API in the production environment if you don’t want your users to use temporary credentials. You have to use Secrets Manager to manage your credentials in such use cases.
- Don’t retrieve a large amount of data from your client and use the UNLOAD command to export the query results to Amazon S3. You’re limited to retrieving only 100 MB of data with the Data API.
- Don’t forget to retrieve your results within 24 hours; results are stored only for 24 hours.
Conclusion
In this post, we introduced how to use the Data API with Redshift Serverless. We also demonstrated how to use the Data API from the Amazon Redshift CLI and Python using the AWS SDK. Additionally, we discussed best practices for using the Data API.
To learn more, refer to Using the Amazon Redshift Data API or visit the Data API GitHub repository for code examples.
About the authors
 Debu Panda is a Senior Manager, Product Management at AWS, is an industry leader in analytics, application platform, and database technologies, and has more than 25 years of experience in the IT world. Debu has published numerous articles on analytics, enterprise Java, and databases and has presented at multiple conferences such as re:Invent, Oracle Open World, and Java One. He is lead author of the EJB 3 in Action (Manning Publications 2007, 2014) and Middleware Management (Packt).
Fei Peng is a Software Dev Engineer working in the Amazon Redshift team.


 Fei Peng is a Software Dev Engineer working in the Amazon Redshift team.


 Utkarsh Agarwal is a Cloud Support Engineer in the Support Engineering team at Amazon Web Services. He specializes in Amazon OpenSearch Service. He provides guidance and technical assistance to customers thus enabling them to build scalable, highly available and secure solutions in AWS Cloud. In his free time, he enjoys watching movies, TV series and of course cricket! Lately, he his also attempting to master the art of cooking in his free time – The taste buds are excited, but the kitchen might disagree.
 Ravi Bhatane is a software engineer with Amazon OpenSearch Serverless Service. He is passionate about security, distributed systems, and building scalable services. When he’s not coding, Ravi enjoys photography and exploring new hiking trails with his friends.
 Prashant Agrawal is a Sr. Search Specialist Solutions Architect with Amazon OpenSearch Service. He works closely with customers to help them migrate their workloads to the cloud and helps existing customers fine-tune their clusters to achieve better performance and save on cost. Before joining AWS, he helped various customers use OpenSearch and Elasticsearch for their search and log analytics use cases. When not working, you can find him traveling and exploring new places. In short, he likes doing Eat → Travel → Repeat.


 Sandeep Bajwa is a Sr. Analytics Specialist based out of Northern Virginia, specialized in the design and implementation of analytics and data lake solutions.